
effects of green supply chain adoption on - JKUAT Repository ...
194
EFFECTS OF GREEN SUPPLY CHAIN ADOPTION ON SUPPLY CHAIN PERFORMANCE OF AGRI- MANUFACTURING FIRMS IN RWANDA DESIRE NIMPANO DOCTORAL OF PHILOSOPHY (Business Administration) JOMO KENYATTA UNIVERSITY OF AGRICULTURE AND TECHNOLOGY 2021
-
Upload
khangminh22 -
Category
Documents
-
view
4 -
download
0
Transcript of effects of green supply chain adoption on - JKUAT Repository ...

EFFECTS OF GREEN SUPPLY CHAIN ADOPTION ON
SUPPLY CHAIN PERFORMANCE OF AGRI-
MANUFACTURING FIRMS IN RWANDA
DESIRE NIMPANO
DOCTORAL OF PHILOSOPHY
(Business Administration)
JOMO KENYATTA UNIVERSITY OF
AGRICULTURE AND TECHNOLOGY
2021

Effects of Green Supply Chain Adoption on the Performance of Agri-
manufacturing Firms in Rwanda
Desire Nimpano
A Thesis Submitted in Partial Fulfilment for the Requirement of the
Degree of Doctor of Philosophy in Business Administration
(Procurement and Supply Chain Management) of the Jomo Kenyatta
University of Agriculture and Technology
2021

ii
DECLARATION
This thesis is my original work and has not been presented for a degree in any other
University
Signature.............................................................. Date...................................................
Desire Nimpano
This thesis has been submitted for examination with our approval as University
supervisors.
Signature.............................................................. Date...................................................
Dr. Noor Shalle, PhD
JKUAT, Kenya
Signature.............................................................. Date...................................................
Dr. Patrick M. MULYUNGI, PhD
JKUAT, Kenya

iii
DEDICATION
This Thesis is dedicated to all my family members for their support.

iv
ACKNOWLEDGEMENT
First and foremost, I would like to thank my supervisors Dr, Patrick M. Mulyungi, PhD
and Dr. Noor Ismail for being my supervisors and mentors at Jomo Kenyatta University
of Agriculture and Technology. Without their constructive criticisms and
recommendations, this thesis would not have been possible. I acknowledge the staff of
the College of Human Resource Development at the Jomo Kenyatta University of
Agriculture and Technology for their support and assistance. I also thank Dr. Gashumba
James, the Vice Chancellor of Rwanda Polytechnic and Mr Rob van de Gevel for their
technical and financial support. Special thanks to other persons who in one way or
another contributed to the final realization of the general dream.

v
TABLE OF CONTENTS
DECLARATION ............................................................................................................. II
DEDICATION ............................................................................................................... III
ACKNOWLEDGEMENT ............................................................................................ IV
TABLE OF CONTENTS ................................................................................................ V
LIST OF TABLES ....................................................................................................... XV
LIST OF FIGURES ................................................................................................ XVIII
LIST OF APPENDICES ........................................................................................... XIX
LIST OF ACRONYMS AND ABBREVIATIONS ................................................... XX
DEFINITION OF OPERATIONAL TERMS ........................................................ XXII
ABSTRACT ............................................................................................................. XXIII
CHAPTER ONE .............................................................................................................. 1
INTRODUCTION ............................................................................................................ 1
1.1 Background of the Study .......................................................................................... 1
1.1.1 Global Perspective of Green Supply Chain Management Practices on the
performance ..................................................................................................... 3
1.1.2 Regional Perspective of Green Supply Chain Adoption on Supply Chain
Performance .................................................................................................... 4

vi
1.1.3 Local Perspective of Green Supply Chain Adoption on Supply Chain
Performance .................................................................................................... 5
1.1.4 Components of an Agri-supply chain ............................................................... 7
1.1.5 Agriculture policy orientation in Rwanda ......................................................... 8
1.1.6 Agriculture and agribusiness in Rwanda........................................................... 8
1.1.7 GSCM in Agri-Manufacturing Firms in Rwanda ............................................. 9
1.2 Statement of the Problem ....................................................................................... 12
1.3 Objectives of the Study .......................................................................................... 13
1.3.1 General objectives ........................................................................................... 13
1.3.2 Specific Objectives.......................................................................................... 13
1.4 Research Hypotheses ............................................................................................. 14
1.5 Justification of the Study ........................................................................................ 14
1.5.1 To management of Agri-Manufacturing Companies ...................................... 15
1.5.2 To Investors ..................................................................................................... 15
1.5.3 To Government ............................................................................................... 15
1.5.4 Policy Makers ................................................................................................. 16
1.5.5 Researchers and Academicians ....................................................................... 16

vii
1.6 Scope of the Study ................................................................................................. 16
1.7 Limitation of the Study .......................................................................................... 16
CHAPTER TWO ........................................................................................................... 18
LITERATURE REVIEW .............................................................................................. 18
2.1 Introduction ............................................................................................................ 18
2.2 Theoretical Literature Review................................................................................ 18
2.2.1 Resource-Based View ..................................................................................... 18
2.2.2 Natural-Resource-Based View ........................................................................ 20
2.2.3 Resource Dependence Theory ........................................................................ 23
2.2.4 Institutional Theory ......................................................................................... 25
2.2.5 Stakeholder Theory ......................................................................................... 27
2.2.6 Transaction Cost Economics ........................................................................... 28
2.2.7 Complexity Theory ......................................................................................... 30
2.3 Conceptual Framework .......................................................................................... 32
2.3.1 Internal environment management .................................................................. 34
2.3.2 Green purchase ................................................................................................ 34
2.3.3 Eco design practices ........................................................................................ 35

viii
2.3.4 Institutional Pressure ....................................................................................... 39
2.3.5 Investment recovery ........................................................................................ 40
2.3.6 Supply chain performance............................................................................... 42
2.4 Empirical review .................................................................................................... 44
2.4.1 Internal Environment Management and Supply Chain Performance ............. 44
2.4.2 Green purchase and Supply Chain Performance ............................................. 46
2.4.3 Eco design practices and Supply Chain Performance ..................................... 47
2.4.4 Investment recovery and Supply Chain Performance ..................................... 48
2.4.5 Institutional Pressures and Supply Chain Performance .................................. 49
2.4.6 Critique of existing literature .......................................................................... 51
2.5 Research gaps ......................................................................................................... 53
2.6. Summary of Literature Review ............................................................................. 54
CHAPTER THREE ....................................................................................................... 55
RESEARCH METHODOLOGY ................................................................................. 55
3.1 Introduction ............................................................................................................ 55
3.2 Research Design ..................................................................................................... 55
3.3 Philosophical Foundation of the Study .................................................................. 56

ix
3.4 Target Population ................................................................................................... 56
3.5 Sampling Frame ..................................................................................................... 57
3.6 Sampling Design and Procedures........................................................................... 57
3.6.1 Sampling Design ............................................................................................. 57
3.6.1 Sample Size ..................................................................................................... 58
3.7 Data Type and Data Collection Procedure ............................................................. 59
3.7.1 Sources and Types of Data .............................................................................. 59
3.7.2 Data Collection Procedure and Instrument ..................................................... 60
3.8 Validity and Reliability of Research Instrument .................................................... 61
3.8.1Validity of Study Instrument ............................................................................ 61
3.8.2 Reliability of Study Instrument ....................................................................... 63
3.9 Data Analysis and Presentation .............................................................................. 64
3.9.1 Model Specification ........................................................................................ 65
3.9.2 Hypothesis Testing .......................................................................................... 67
3.9.3 Underlying Assumptions of Multiple Regression Model ............................... 67

x
CHAPTER FOUR .......................................................................................................... 69
RESEARCH FINDINGS AND DISCUSSIONS .......................................................... 69
4.1 Introduction ............................................................................................................ 69
4.2 Data preparation and Screening ............................................................................. 69
4.2.1 Response Rate ................................................................................................. 69
4.2.2 Missing Values Analysis ................................................................................. 70
4.2.3Analysis of Outliers ......................................................................................... 71
4.2.4 Reliability analysis .......................................................................................... 72
4.3 Sample Characteristics ........................................................................................... 73
4.3.1 Firm years of operation ................................................................................... 73
4.3.2 Firm size .......................................................................................................... 74
4.4 Descriptive Statistics for Study Constructs ............................................................ 75
4.4.1 Internal Environment Management................................................................. 75
4.4.2 Green Purchasing ............................................................................................ 77
4.4.3 Eco Design ...................................................................................................... 78
4.4.4 Investment Recovery ....................................................................................... 80
4.4.5 Institutional Pressure ....................................................................................... 81

xi
4.4.6 Supply chain performance............................................................................... 83
4.5 Factor analysis ........................................................................................................ 84
4.5.1 Internal environment management .................................................................. 84
4.5.2 Green Purchasing ............................................................................................ 86
4.5.3 Eco design ....................................................................................................... 87
4.5.4 Investment Recovery ....................................................................................... 89
4.5.5 Institutional Pressure ....................................................................................... 90
4.5.6 Supply Chain Performance ............................................................................. 92
4.6 Data transformation and scoring ............................................................................ 93
4.7 Assumption of regression model ............................................................................ 93
4.7.1 Linearity .......................................................................................................... 93
4.7.2 Normality ........................................................................................................ 94
4.7.3 Homoscedasticity ............................................................................................ 95
4.7.4 Test of Multicollinearity ................................................................................. 96
4.8 Correlation analysis ................................................................................................ 96
4.9 Hypothesis Testing ................................................................................................. 97
4.9.1 Effect of Internal Environment Management on Supply Chain Performance 98

xii
4.9.2 Effect of Green Purchase on Supply Chain Performance ............................. 100
4.9.3 Effect of Eco Design on Supply Chain Performance .................................... 102
4.9.4 Effect of Investment Recovery on Supply Chain Performance .................... 103
4.10 Overall multiple regression ................................................................................ 105
4.10.1 Model Summary .......................................................................................... 105
4.10.2 ANOVA Model ........................................................................................... 106
4.10.3 Coefficients of Estimate .............................................................................. 106
4.11 Hierarchical regression model............................................................................ 108
4.12 Supply chain and Agri-manufacturing in Rwanda ............................................. 118
4.12.1 Limiting post-harvest losses at the earliest point in the supply chain. ........ 119
4.12.2 Supply chain versus quality compliance and products safety in Rwanda ... 119
4.12.3 Ensuring quicker movement of produce along the supply chain. ............... 120
4.12.4 Traceability of Agri-products for increased trust in the brand .................... 121
4.12.5 Other factors which affect supply chain of agricultural products in Rwanda.
..................................................................................................................... 121

xiii
CHAPTER FIVE .......................................................................................................... 122
SUMMARY OF FINDINGS, CONCLUSION AND RECOMMENDATIONS ..... 122
5.1 Introduction .......................................................................................................... 122
5.2 Summary of the Findings ..................................................................................... 122
5.2.1 Internal environment management ................................................................ 122
5.2.2 Green purchasing .......................................................................................... 122
5.2.3 Eco design ..................................................................................................... 123
5.2.4 Investment Recovery ..................................................................................... 123
5.2.5 Institutional Pressure ..................................................................................... 123
5.2.6 Supply chain performance............................................................................. 124
5.2.7 Moderated effect of institutional pressures on the relationship between green
supply chain and supply chain performance ............................................... 124
5.3 Conclusion ........................................................................................................... 125
5.3.1 Internal Environmental Management ............................................................ 125
5.3.2 Green Purchasing and Supply Chain Performance ....................................... 125
5.3.3 Eco-Design and Supply Chain Performance ................................................. 126
5.3.4 Investment Recovery and Supply Chain Performance.................................. 126

xiv
5.3.5 Institutional Pressure and Supply Chain Performance .................................. 126
5.4 Recommendations ................................................................................................ 127
5.4.1 Internal Environmental Management and Supply Chain Performance......... 127
5.4.2 Green Purchasing and Supply Chain Performance ....................................... 127
5.4.3 Eco-Design and Supply Chain Performance ................................................. 127
5.4.4 Investment Recovery and Supply Chain Performance.................................. 128
5.4.5 Institutional Pressure and Supply Chain Performance .................................. 128
5.5 Further Research Recommendations.................................................................... 128
REFERENCES ............................................................................................................. 130
APPENDICES .............................................................................................................. 154

xv
LIST OF TABLES
Table 3.1: Sample Size per category ............................................................................... 59
Table 4.1: Response Rate of Questionnaires ................................................................... 70
Table 4.2: Distribution of the Number of Missing Values on Cases .............................. 71
Table 4.3: Distribution of the Number of missing Values by Variables ......................... 71
Table 4.4: Reliability analysis ......................................................................................... 73
Table 4.5: Firm Years of Operation ................................................................................ 74
Table 4.6: Firm Size ........................................................................................................ 74
Table 4.7: Internal Environment Management Distribution ........................................... 76
Table 4.8: Green Purchasing distribution ........................................................................ 78
Table 4.9: Eco Design Distribution ................................................................................. 80
Table 4.10: Investment Recovery distribution ................................................................ 81
Table 4.11: Institutional Pressure distribution ................................................................ 82
Table 4.12: Supply Chain Performance distribution ....................................................... 84
Table 4.13: Internal Environment Management ............................................................. 85
Table 4.14: Green Purchasing ......................................................................................... 86
Table 4.15: Eco Design ................................................................................................... 88

xvi
Table 4.16: Investment Recovery.................................................................................... 89
Table 4.17: Institutional Pressure .................................................................................... 91
Table 4.18: Supply Chain Performance .......................................................................... 92
Table 4.19: Data Transformation and Scoring ................................................................ 93
Table 4.20: Linearity ....................................................................................................... 94
Table 4.21: Normality ..................................................................................................... 95
Table 4.22: Homoscedasticity ......................................................................................... 95
Table 4.23: Test of Multicollinearity .............................................................................. 96
Table 4.24: Correlation Analysis .................................................................................... 97
Table 4.25: Model Summary ........................................................................................... 99
Table 4.26: ANOVA ..................................................................................................... 100
Table 4.27: Coefficients Table ...................................................................................... 100
Table 4.28: Model Summary ......................................................................................... 101
Table 4.29: ANOVA ..................................................................................................... 101
Table 4.30: Coefficients ................................................................................................ 102
Table 4.31: Model Summary ......................................................................................... 103
Table 4.32: ANOVAa .................................................................................................... 103

xvii
Table 4.33: Coefficientsa ............................................................................................... 103
Table 4.34: Model Summary ......................................................................................... 104
Table 4.35: ANOVA ..................................................................................................... 104
Table 4.36: Coefficients’ ............................................................................................... 105
Table 4.37: Model Summary ......................................................................................... 105
Table 4.38: ANOVA Model .......................................................................................... 106
Table 4.39: Coefficients of Estimate ............................................................................. 107
Table 4.40: Hierarchical regression model ................................................................... 110
Table 4.41: Summary of the Study Results ................................................................... 118

xviii
LIST OF FIGURES
Figure 2.1: Conceptual Framework ................................................................................ 33
Figure 4.1: Moderation of Institutional Pressure on the Relationship between internal
Environment Management and Supply Chain Performance ....................... 115
Figure 4.2: Moderation of Institutional Pressure on the Relationship between Eco
design and Supply Chain Performance. ...................................................... 116
Figure 4.3: Moderation of Institutional Pressure on the Relationship between Investment
Recovery and Supply Chain Performance. ................................................. 117

xix
LIST OF APPENDICES
Appendix I: Questionnaire ............................................................................................ 154
Appendix II: Agro-Processing Firms in Rwanda ......................................................... 159

xx
LIST OF ACRONYMS AND ABBREVIATIONS
CAS Complex Adaptive Systems
CIC Climate Innovation Centre
CT Complexity Thinking
EM Environmental Management
EOL End-Of-Life
EU European Union
EVA Economic Value Added
GDP Gross Domestic Product
GSCM Green Supply Chain Management
MVA Manufacturing Value Added
NISR National Institute of Statistics Rwanda
NRBV Natural-Resource-Based View
RBV Resource Based View
RDT Resource dependence theory
REMA Rwanda Environment Management Authority
RRECPC Rwanda Resource Efficient and Cleaner Production Centre

xxi
SA Systems Approach
SCM Supply Chain Management
SEZ Special Economic Zone
SSCM Sustainable Supply Chain Management
TCE Transaction cost economics
WBCSD World Business Council for Sustainable Development

xxii
DEFINITION OF OPERATIONAL TERMS
Eco-design Refers to manufacturers design products that minimize consumption
of materials and energy, that facilitate the reuse, recycle, and
recovery of component materials and parts, and that avoid or reduce
the use of hazardous products within the manufacturing process
(Green at al., 2012).
External
environmental
management
Refers to cooperation with customers requires working with
customers to design cleaner production processes that produce
environmentally sustainable products with green packaging (Green
at al., 2012).
Internal
environmental
management
is the practice of developing green supply chain management as a
strategic organizational imperative through commitment and
support of the imperative from senior and mid-level managers
(Green at al., 2012)?
Investment
Recovery (IR)
Refers to an organization’s strategic use of reverse logistics
recycling, redeployment, reselling and similar techniques to derive
greater value from materials and products (Kumar & Chandrakar,
2012).
Supply Chain The movement of materials as they flow from their source to the
end customer. Supply Chain includes purchasing, manufacturing,
warehousing, transportation, customer service, demand planning,
supply planning and Supply Chain management. It is made up of the
people, activities, information, and resources involved in moving a
product from its supplier to customer (Chen & Labadi, 2015).

xxiii
ABSTRACT
Green supply chain has been a major component of competitive strategy to enhance
organizational productivity and profitability as well as metric measure, however
performance pertaining to green supply chain and supply chain performance among
Agri-Manufacturing firms in Rwanda has not received adequate attention from
researchers or practitioners today. Thus, the general objectives determined effects of
green supply chain adoption on supply chain performance: survey of Agri-
Manufacturing Firms in Rwanda. The study was guided by the following objectives; to
determine the effect of internal environment management practices on supply chain
performance, to assess the effect of green purchase on supply chain performance, to
ascertain the effect of eco-design practices has no significant effect on supply chain
performance , to establish the effect of investment recovery on supply chain
performance and to determine the moderating effect of institutional pressures on the
relationship between green supply chain and supply chain performance among Agri-
Manufacturing Firms in Rwanda. The study was informed by Resource-Based View,
Natural-Resource-Based View, Resource, Dependence Theory, Institutional Theory and
Stakeholder Theory. This study employed both cross-sectional and explanatory research
design and is in line with positivism approach. The target population was 567; including
Operations Manager, Chief Supply Chain Officer, Logistics Specialist, Supply
Technician, IT Technician, Production Technician, Returns Specialist. Procurement
specialist in supply chain department from 67 Agri-Manufacturing Firms. Stratified and
simple random sampling was used to select a sample of 226. This study collected both
secondary and primary data, but mainly primary data using a structured questionnaire.
Data analysis was performed with the aid of SPSS version 22.0 using both descriptive
and inferential statistics. Hypothesis 1 to 4 was tested using multiple regression model,
while hypothesis 5 was tested using hierarchical regression. Findings showed that
internal environmental management, green purchasing, eco-design results and
investment recovery positively and significantly influences supply chain performance. In
addition, institutional pressure significantly moderates the relationship between internal
environment management, green purchasing, eco-design results and investment recovery
and supply chain performance. It is therefore important for both the senior managers and
mid – level managers to be committed and supportive of GSCM. Also, firms need to
make an initiative towards identifying a recycling system for used and defective
products. Therefore, managers need to ensure that the raw materials acquired from
suppliers can be recyclable, reusable, and re-manufactured. As such, the firms need to
ensure that the environmental impacts of the product’s life cycle are understood before
even engaging in manufacturing decisions.

1
CHAPTER ONE
INTRODUCTION
This chapter marks the beginning of this thesis and it includes the background of the
study, which focuses on the global, regional, and local perspectives of Green Supply
Chain Management and its effect on Supply chain Performance. In this chapter, the
statement of problem under investigation is presented, objective of the study,
significance and scope of the study and definition of terms. This chapter has been
targeted to help the reader to understand and get the rhythm of the subject matter of the
thesis.
1.1 Background of the Study
Green supply chain refers to the idea of integrating sustainable environmental processes
into the traditional supply chain. This can include processes such as supplier selection
and purchasing material, product design, product manufacturing and assembling,
distribution and end-of-life management (Kumar & Chandrakar, 2012). Recent scholarly
works have investigated different definitions and conceptualizations of green supply
chain management and its implications on business processes and the environment
moving into the future (Setyadi, 2019). The consensus is that it involves innovations that
ensure a company’s purchasing and production units is sustainable and promotes the
wellness of its employees, consumers, and the environment (Sung Rha, 2010).
Rwanda has prioritized investments in production, value addition and agro-processing to
create quality jobs through sectoral linkages as articulated in the crop intensification
programme. Enhance agricultural production and profitability by promoting irrigation,
increased use of fertilizers, mechanisation of agricultural practices, and securing of
access to high-value markets for smallholder farmers (NISR, 2019).

2
In National GDP Accounts (2018), within manufacturing, food processing increased by
19 percent mainly due to an increase of 32 percent in the processing of cereals and 6
percent in the processing of tea, coffee, and sugar. This is linked with the green
initiatives because the current market requires the green processes in manufacturing
products. The Aug 2018 workshop presented emissions reduced of 22,437tons of Carbon
dioxide equivalent from 14,697tons in 2017 and water use reductions of 44,195m3 from
32,180m3 in 2016. The number of best green production practices implemented by
companies was increased to 274 from 220 in 2016 whereas number of new green
technologies adopted increased to 47 from 39 in 2016. The number of companies in the
Special Economic Zone implementing green production practices increased to 17 from
10 in 2016 (Ministry of Environment, 2018).
Green supply chain management involves all strategies aimed at making business
processes more conscious to the needs and conservation of the environment and involves
improving product design, production, and delivery of products to ensure little wastage
of resources. It also considers the lifespan of products to create a closed loop that
involves recycling. The strategy of GSCM entails reverse logistics, green procurement,
green operations, green designs, waste management and green manufacturing (Azevedo
et al., 2011).
Before green supply chain, environmental considerations did not feature in the research
of early manufacturers because industrial pollution was relatively low due to the few
industries at the time and there was an abundance of raw materials relative to their
demand. The concept under greening is to sustainably extract resources from the
environment, either in mining or in agricultural production while reducing pollution by
managing the byproducts, e-packaging, and recycling (Zhu et al., 2013). The procedures
entail the whole chain which involves creating and adopting practices known as Green
Supply Chain Management.

3
GSM is now growing trend among many businesses because of its proven ability to
improve the sustainability and practicality of a business’s strategy development (Wagner
& Bode, 2016). Moreover, GSM production-oriented policies have evolved over time
and embrace a monitoring at all levels within the supply chain to ensure that
environmental protection is considered (Ellis, 2019). Indeed, many firms have
increasingly adopted practices aimed at addressing environmental issues in their supply
chains. The preponderance of extant literature suggests that the implementation of green
supply chain management practices (GSCM) has a positive effect on both environmental
performance (Geng et al., 2017; Sadia et al., 2019) and operating cost performance
(Schmidt et al., 2017). Other studies suggest managers face significant challenges to
realizing fully the benefits of GSCM practices (Kirchoff et al., 2016), perhaps resulting
from a host of possible barriers to their implementation (Goyal et al., 2017).
1.1.1 Global Perspective of Green Supply Chain Management Practices on the
performance
Global enterprises must maintain a high level of flexibility in their structures and
processes if they are to attain their set goals and objectives with the least number of
resources and on time. In highly developed Nations like Germany for example,
companies are working towards creating closed loop systems as part of their initiatives
to make their supply chains greener (Seuring, 2014). Their focus lies in the materials
used in development and the design process to ensure the perpetuity of the business and
the reduction of overall waste. Streamlining their functions from their purchasing of raw
materials up till the delivery of finished goods to the final consumers and coming up
with sufficient systems to track all the information and materials generated and used in
the entire process is seen as a major source of competitiveness (Zhu & Sarkis, 2013).
Similarly, in the United States, many companies are embracing and advocating for green
processes (for example, green packaging, green purchasing, green production, and green
manufacturing) because of the cost savings hence improving supply chain performance

4
(Seuring, 2014). All these strategies are carried out together with those aimed at
increasing productivity and boost revenues and profits because they can only implement
environmentally conscious practices if they have the funds to invest (Toke et al., 2012).
Examining how GSCM is practiced by UK food retail SMEs and how that impacts on
the performance outcome is essential because in the UK approximately 99% businesses
fall under SMEs (Ward & Rhodes, 2014). In addition, the recent horse meat scandal in
the UK has triggered a massive corporate storm throughout the SC of every company,
food supply networks, to make SCs more transparent and more visible to achieve
consumers’ confidence and to avoid reputational damage (Touboulic & Walker, 2015).
In other developed economies like China, increasing consumer awareness of the
breakdown of the environment brought about by increased industrial activity fueled the
advancement of GSCM (Zhu & Sarkis, 2013). While in Thailand, green design and
green manufacturing had positive and significant effects on the agri-firms
(Kamolkittiwong & Phruksaphanrat, 2015). Moreover, in In Jordan, Al Khattab et al.
(2015) found a positive relationship between GSCP (green purchasing, cooperation with
customers on GSC practices, inventory recovery, green information systems, green
production, and green design) and green performance.
1.1.2 Regional Perspective of Green Supply Chain Adoption on Supply Chain
Performance
The adoption of green supply chain management in Africa has been shown to improve
supply chain performance (Economic Commission for Africa, 2010). In Nigeria, for
example Ofori (2010) confirmed that GSM is positively related to environmental
performance through green innovation, while in Kenya involvement of supply chain
suppliers in green practices enhances performance of manufacturing firms (Nixon, 2011;
Nderitu & Ngugi, 2014; Carter et al, 2018). In the relatively developed economy of
South Africa, reverse logistics and legislation and regulation, positively and significantly

5
predicted environmental performance. In turn, environmental performance positively
and significantly predicted supply chain performance (Epoh, & Mafini, (2018).
1.1.3 Local Perspective of Green Supply Chain Adoption on Supply Chain
Performance
A baseline established in 2005 guides the development of green economy in Rwanda
with the country having to make changes to its strategies while maintaining the focus on
their long-term sustainability goals. The goal of the plan is to ensure the country has a
low carbon footprint throughout the period of development and at the time when it
attains its desired level of economic performance and industrialization (Government of
Rwanda, 2011). Rwanda’s current position about green initiatives for Agri-
manufacturing firms makes it a great example of sustainable development and growth in
the continent (Government of Rwanda, 2011).
Rwanda’s mission to maintain a clean and healthy environment has been going since
2008 when it banned the use of non-biodegradable plastic bags and packaging materials.
To date, Rwandans use only bags made from paper, cloth, banana leaves and papyrus,
among other biodegradable materials. It has made a difference. The plastic-bag ban has
earned the country a reputation as one of the cleanest countries in Africa. In 2008,
Rwanda’s capital, Kigali, was declared one of the cleanest cities in Africa by UN
Habitat. It also created opportunities for entrepreneurs who invested in alternative
packaging materials (cloths, papers, banana leaves and papyrus). As a fast-growing
nation, Rwanda can bypass old technologies and environmentally destructive
development and build an economy that can withstand a changing climate and that
provides prosperity for generations to come (World Economic Forum, 2016).
Rwanda has initiated green Development which focuses on empowering people to adopt
practices that enhance social cohesion, economic prosperity, and environmental
integrity. All three dimensions are equally important, so offsets in one dimension can

6
also adversely affect the other two. In practice this is seldom the case. In practice, the
economic dimension will be more prominent, in detriment of the social and (lastly) the
environmental. The way we manage the economy and political and social institutions
has critical impacts on the environment, while environmental quality and sustainability,
in turn, and are vital for the performance of the economy and social well-being (REMA,
2014).
Agro-processing in Rwanda is a flourishing sector that contributes up to a third of
Rwanda’s GDP. This sector is a major source of employment and income, thus
providing access to food and other necessities to large groups of the population. Rwanda
has suitable agro-climatic conditions that allow the production of a broad range of
diverse agricultural commodities suitable for processing. The sector has seen the
adoption of improved and validated food processing technologies, enforcement of good
quality standards, hygiene and regulatory instruments which have assisted local agro-
processing industries to compete favourably in the international marketplace. The agro-
processing sector consists of processing locally available raw materials to produce
products such as wine, beer, soft drinks, flour, rice, cheese, honey, cooking oil, among
others. There is an increasing diversification to new innovative products such as Stevia
and essential oils which have increased the agro-processing export base. Rwanda is
among the largest Pyrethrum exporters globally; the pyrethrum flower is used worldwide
to produce a natural insecticide that controls pests and plant diseases (RDB, 2020).
In general, all agro-processing activities use a certain number of materials. This does not
necessarily mean that these materials are used efficiently. Often, in fact, the final
product contains only a low percentage of the original raw materials and the rest is
waste. Important materials include biomass (animal feed, food, and forestry). However,
most agro-processing requires energy for transformation of raw materials to finished
products. There are several challenges about energy use. Firstly, electricity is not
available in many rural areas where agricultural production takes place, requiring that
agro-processing activities be located away from source of raw materials. Even where
7
there is electricity, the supply is rather erratic and occasioned by frequent power-cuts.
Existing agro-processing plants must either use standby diesel engines or stop their
production frequently (MINICOM, 2014).
1.1.4 Components of an Agri-supply chain
Agribusiness, supply chain management (SCM) implies managing the relationships
between the businesses responsible for the efficient production and supply of products
from the farm level to the consumers to meet consumers’ requirements reliably in terms
of quantity, quality, and price. In practice, this often includes the management of both
horizontal and vertical alliances and the relationships and processes between firms.
Agri-supply chains are economic systems which distribute benefits and apportion risks
among participants. Thus, supply chains enforce internal mechanisms and develop chain
wide incentives for assuring the timely performance of production and delivery
commitments. They are linked and interconnected by virtue of shared information and
reciprocal scheduling, product quality assurances and transaction volume commitments.
Process linkages add value to agricultural products and require individual participants to
coordinate their activities as a continuous improvement process. Costs incurred in one
link in the chain are determined in significant measure by actions taken or not taken at
other links in the chain. Extensive pre-planning and co-ordination are required up and
down the entire chain to affect key control processes such as forecasting, purchase
scheduling, production and processing programming, sales promotion, and new market
and product launches etc (Ganesh et al., 2017).
Following are the components of an organised agri-supply chain: (1) Procurement or
sourcing, (2) Logistic management, composed of; (a) Transportation, (b) Material
management, (c) On the premise of supplying mostly from production not stock, (d)
Warehousing, (e) Logistics Network modelling, (3) Organizational management,
composed of; (a) Contracting, (b) Strategic alliances and partnerships, (c) Vertical
integration; (i) Long term storage, (ii) Packaging technology, (iii) Cold chain

8
management, (iv) Energy efficient transport, (v) Quality and safety, (4) Application of
Efficient Consumer Response (ECR) System, composed of; (a) Electronic scanning of
price and product at the point of sale, (b) Streamline the entire distribution chain
(Ganesh et al., 2017).
1.1.5 Agriculture policy orientation in Rwanda
The vision as stated in the revised National Agriculture Policy (NAP, 2018) is to have a
nation that enjoys food security, nutritional health, and sustainable agricultural growth
from a productive, green, and market-led agriculture sector. The mission of the sector is
to “ensure food and nutrition security of Rwandans by using modern agribusiness
technologies, professionalizing farmers in terms of production, commercialization of the
outputs and then creating a competitive agriculture sector”. To fulfil the National
Agriculture policy (NAP, 2018), the Ministry of Agriculture and Animal Resources
(MINAGRI) has developed its fourth Strategy Plan for Agriculture Transformation
(PSTA 4) to promote the growth of the agriculture sector in partnership with the private
sector.
1.1.6 Agriculture and agribusiness in Rwanda
Agriculture and agribusiness remain the backbone of the Rwandan economy and
continue to be a key catalyst for growth and poverty reduction. Over the period of
EDPRS1, the sector grew at 5.4 %, sustained by higher-than-expected expansion of food
production, attributed to scaled-up public investments such as the crop-intensification
programme (CIP). During the same period, the agriculture sector contributed 32-34
percent of GDP and 27 percent of total growth. In the recent past, there was significant
expansion of interventions which drove productivity gains, including successful land
consolidation, increased areas under irrigation and protected land against soil erosion.
Access to important services including agricultural financing and proximity extension
services was improved, and farmers are now more likely to use specific crops according

9
to agro-climatic zones. There has also been an increase in the use of inputs, including
agrochemicals and improved seeds. Distribution of livestock through programs such as
Girinka has expanded the animal resource sector. Since the implementation of the crop
intensification programme (CIP), yields have grown significantly. Post-harvest
infrastructure investments and subsidized transport has improved product quality and
market accessibility. As a result of these interventions, production of maize, wheat, roots
and tubers, soybeans, rice, and cassava as well as meat, milk and horticulture products
rose to the ambitious national levels predicted in EDPRS-I (NISR, 2018).
However, agriculture remains on the threshold of subsistence since many rural
households’ farm plots are too small to support commercial production under present
productive systems and agro-processing remains underdeveloped. But the overall goal
under EDPRS 2 is to move Rwandan agriculture from a largely subsistence to a
modernized, nationally integrated and knowledge intensive sector with more emphasis
on diversification, agro-processing, productivity-enhancement, and capacity
development (NISR, 2019).
The manufacturing of food products constitutes 20.5% of economic activities in
Rwanda. The leading activities within the food subsectors are manufacturing of
beverages and other related food products (5.5%), processing and preserving of meat
(3.8%), the processing of grain flour in mills (3.3%), manufacturing of bakery products
(3.6%), and manufacturing of dairy products (2.5%). Activities of production of coffee
products (0.3%), manufacturing of starches and starch products (0.3%), and
manufacturing of prepared animal feeds 0.3% have the least representation (MINICOM,
2014).
1.1.7 GSCM in Agri-Manufacturing Firms in Rwanda
The Rwandan economy is agricultural dominated but with rising industrial growth. The
country’s economic performance grew to $5.5 billion nine years ago (a per capita of
$5404). The Rwandan economy is predominantly agricultural with punctuations of low-

10
value service industries with subsistence farming being the largest contributor to the
country’s GDP at 31% (MINECOFIN, 2011). Agri-manufacturing mainly deals with the
conversion of agricultural products with the major products being food, beverages and
tobacco products accounting for almost 3 quarters of the output from manufacturing in
2012, the food products manufacturing, and processing industry say a close to double
growth that saw its share rise to 44%. The increased manufacturing output has
encouraged exports in the country which experienced an increase of 1000% in the 12-
year period ending in 2012 (AfDB, 2014).
Talking about Green Supply Chain, Bralirwa incorporated the use of energy and water in
an efficient way as green brewer, green packaging which aims at addressing the
footprint of CO2 in its packaging. Bralirwa has also a policy to manage and measure
packaging materials in CO2 performance. Programs are being put in place to improve
CO2 performance of packaging materials. Green cooling: the cooling equipment is the
most environmentally friendly, securing minimum energy use and lowest carbon
footprint. Green distribution which aims at addressing the footprint of the distribution of
our products through, they include increased distribution efficiency; increased fuel
efficiency (Bralirwa, 2017).
To promote Green Supply Chain in the industrial sector, Rwanda instituted the Rwanda
Cleaner Production Centre that was tasked with advocating for greener practices. The
agency focuses on improving the efficient use of resources through the development of
closed-loop structures that reduce wastage and encourage the reuse and repurposing of
materials and labour. The use of environmentally safe materials and reducing the
discharge of harmful wastes and by-products into the environment is key to ensuring
environmental sustainability. The firm’s activities have helped many companies to
improve the sustainability of their processes by employing the funding they get from
UNIDO to transform manufacturing processes to be greener (MINECOFIN, 2011).

11
Most of agro-processing firms’ use of alternative clean energy, energy efficiency, Clean
Development Mechanism projects are prioritized. Vehicle are checked for vehicle gas
emission, import of relatively new vehicles is priority (REMA, 2014). The country’s
50-year plan that ends in 2050 strategizes how to bring the country into an age of high
industrialization and a mature financial services sector that should create hundreds of
thousands of jobs and support millions more. The strategic plan anchors its plans on the
already low carbon footprint that the country’s predominantly agro-processing
manufacturing industry produces to encourage innovations in green processing. The
innovations should also encourage the improvement of domestic energy consumption by
increasing the effectiveness of appliances which increases the country’s overall
environmentally friendly strategy (Government of Rwanda, 2011).
The economy in Rwanda has little differentiation relative to other economies in the
region. It currently consists of food and beverages, tobacco, textiles and clothing, wood,
paper and printing, chemicals, rubber and plastics, non-metal minerals and furniture.
Manufacturing mainly deals with the conversion of agricultural products (agro-
processing) with the major products being food, beverages and tobacco products
accounting for almost 3 quarters of the output from manufacturing in 2012. While all the
areas mentioned above experienced growth in the periods between 2000 and 2012, the
food products manufacturing, and processing industry say a close to double growth that
saw its share rise to 44%. The increased manufacturing output has encouraged exports in
the country which experienced an increase of 1000% in the 12-year period ending in
2012. However, despite the increase in the country’s export markets, it still pales when
compared to those in the region because of its main subsistence form of production. That
is to say that most production is aimed at catering to the local market (AfDB, 2014).
In this research, the researcher will compare the results with the observations made by
other researchers for developed and developing countries and provide managerial
implications for the government and manufacturers as to what steps need to be taken to
generate awareness towards environmental sustainability and facilitate the adoption of

12
GSCM practices among Rwandan firms to a greater extent. This research was analyzing
different aspect of interaction of Green Supply Chain with the agro-processing firms in
Rwanda. The research concluded this research by indicating directions for future
research on GSCM/SSCM.
1.2 Statement of the Problem
Increased industrial actions take a heavy toll on the environment (Pratten & Mashat,
2009). As such, it is imperative that the country takes measures to mitigate any
adversities that might result and, therefore, enhance environmental responsibility in
business practices (Byron, 2015; Rahman, 2013). This creates the need for companies to
adopt GSCM (World Business Council for Sustainable Development, 2012).
An ensample is Kitabi Tea Factory which started in 1969. It had the capacity of
producing 2,400 tons of black tea per year in 2015 with a projected production of 4,800
tons of black tea in 2019. To ensure sustainable energy sources, the Factory dedicated
45% of its land to eucalyptus plantations that are available for exploitation. In addition
to this, Kitabi has also benefited from RECPC’s initiative to resource efficient and
cleaner production training and application of best practices such as: Installation shed
for scraps in the factory. Scraps are reused for scaffolds making for general repairs and
maintenance; Lagging fully done in all steam lines; Installation of boiler economizer to
recover lost heat from chimney; Improvement of the lighting system with each machine
being provided with its own lighting or reducing the height of lamps; Factory wide water
saving program to reduce wastage; and Awareness creation on power saving techniques
and the partial covering of the firewood shed requiring an initial investment of 9,020
USD, saving up to 28,657 USD in less than 6 months (REMA, 2015).
In 2017 Bralirwa Ltd continued to reduce its climate impact throughout the value chain,
bringing several sustainability initiatives under one goal to reduce our carbon footprint,
5% decrease in average water consumption in brewery compared to 2016; 16% cut in

13
CO2 emissions compared to 2016, all these changes are due to the Green Supply Chain
initiatives (Bralirwa, 2017). In 2017, Bralirwa Ltd’s overall financial performance
improved substantially compared to 2016 despite the challenging business environment.
(Government of Rwanda, 2011).
Ikirezi Natural Product, a factory located in Kirehe District produce essential oil through
steam distillation and extraction of geranium. The factory uses a combination of diesel
and wood for heating purposes. Ikirezi has an industry standard smoke control system
that limits/reduces the amount of CO2 released to the environment. Ikirezi was
producing 250 to 400 tons of geraniums per year in 2015 with projections of producing
1,000 tons of geraniums in 2020. (REMA, 2015).
There were not enough data on green supply chain and its relationship to the supply
chain performance for agro-processing in Rwanda and this was considered as a gap in
the literature. So, it is in this gap the current study is fitting.
1.3 Objectives of the Study
1.3.1 General objectives
The general objective was to determine effects of green supply chain adoption on supply
chain performance of agro-manufacturing firms in Rwanda.
1.3.2 Specific Objectives
The study was guided by the following objectives.
1) To determine the effect of Internal Environment Management on supply chain
performance of agro-Manufacturing Firms in Rwanda
2) To assess the effect of green purchase on supply chain performance among agro-
Manufacturing Firms in Rwanda

14
3) To ascertain the effect of eco design practices has no significant effect on supply
chain performance among agro-Manufacturing Firms in Rwanda
4) To establish the effect of investment recovery on supply chain performance
among agro-Manufacturing Firms in Rwanda
5) To determine the moderating effect of institutional pressures on the relationship
between green supply chain and supply chain performance among agro-
Manufacturing Firms in Rwanda
1.4 Research Hypotheses
H01: There is no significant effect of internal environment management
practices on supply chain performance among Agri-Manufacturing Firms
in Rwanda
H02: There is no significant effect of green purchase on supply chain
performance among Agri-Manufacturing Firms in Rwanda
H03: There is no significant effect of eco design on supply chain performance
among Agri-Manufacturing Firms in Rwanda
H04: There is no significant effect of investment recovery on supply chain
performance among Agri-Manufacturing Firms in Rwanda
H05: There is no significant moderating effect of institutional pressures on the
relationship between green supply chain and supply chain performance
among Agri-Manufacturing Firms in Rwanda.
1.5 Justification of the Study
The study was significant to the following parties.

15
1.5.1 To management of Agri-Manufacturing Companies
This study is going to recognize the challenges that are faced in implementation of green
supply chain management approaches by the Agri-Manufacturing Companies in
Rwanda. The management of the Agri-Manufacturing Companies should increase their
knowledge on how to increase the value to their stakeholders by adopting the
appropriate green supply chain management practice that improves supply chain
performance.
1.5.2 To Investors
New investors will make use of the study to verify critical aspects relating to the
environmental responsible Agri-Manufacturing Companies. The information to be
gathered from the study was of essence to the investor’s as a guiding principle to
understand the dynamics and operations related to the Agri-Manufacturing Companies.
The study was a source of information to the investors to understand the effect of green
supply chain management practice on supply chain performance and therefore elect
managements who have knowledge on green supply chain management practice.
1.5.3 To Government
The information can help the government to develop frameworks on enhancing the
adoption of relevant green supply chain management practice, therefore, ensuring higher
levels of environment sustainability. Higher levels of green supply chain management
practice translate into better use of ecofriendly supply chain activities. In addition to
enhancing the effectiveness of its own programs, the government can improve its policy
development by using the information it generates to form objective baselines rather
than relying on the results of private developers which are often biased.

16
1.5.4 Policy Makers
The policy maker can know how well to incorporate the sector and how effectively to
ensure its full participation. The study will provide information for policy makers that
was relevant for ensuring that adoption of green supply chain management practice is
well-regulated. The study helps the policy makers in formulating policies that
contributes to the growth and development of supply chain performance which as a
result improves the economic development of the country.
1.5.5 Researchers and Academicians
Researchers and academicians will use the data to expose further on the study topic. The
study data and information obtained was to explore further the topic for more
understanding. This was used for referencing on the topic and guide interested persons
on the same for details and deliberations.
1.6 Scope of the Study
The content scope of the study was to only determine effects of green supply chain
adoption on supply chain performance: survey of Agri-Manufacturing Firms in Rwanda.
Further the study assessed the moderating effect of institutional pressures. The study
only focused on four practices of GSCM which includes internal environment
management practices, green procurement practices, eco design practices, investment
recovery and institutional pressures. In geographical scope the study was only survey
Agri-Manufacturing Firms in Rwanda. On time scope, the study was conducted within
the estimated budget and for between May 2019- January 2021.
1.7 Limitation of the Study
This study expands our knowledge effects of green supply chain adoption on supply
chain performance of Agri-Manufacturing Firms in Rwanda. Though this study has

17
fulfilled its aim and objectives, there are several areas for additional studies and
empirical research, given the limitations of the research.
On a geographical dimension, this study was primarily limited to Agri-Manufacturing
Firms in Rwanda. Therefore, it may not be appropriate to generalize to the whole
population of the SMEs in this country or any other country. For this reason, further
empirical investigations in different regions and countries are needed.
The methodology that has been chosen to achieve the research objectives was limited to
questionnaires. As such, future research could build on this study by examining green
supply chain adoption in different sectors and industries in both a qualitative and
quantitative way. Future studies could use the same basic hypotheses but implement the
study in terms of a longitudinal rather than a cross- sectional design. Finally, only a
single research methodological approach was employed and future research through
interviews could be undertaken to triangulate.
Given that Agri-Manufacturing Firms are pervasive in all economies this will call for a
careful selection of samples that can help provide a representative picture of green
supply chain adoption. Also, a replication of this research on different industries in
different geographical regions would provide data for comparison.
Lastly, this study used subjective measures as opposed to objective measures to assess
supply chain performance. Nonetheless, several studies have reported that there exists a
strong association between subjective and objective measures.

18
CHAPTER TWO
LITERATURE REVIEW
2.1 Introduction
The aim of this chapter is to gain considerable insight into earlier literature and
comprehend the theories that underlie this study. It outlines the theoretical review,
conceptual framework, empirical review, and critique of the existing literature relevant
to the study, summary, and research gaps.
2.2 Theoretical Literature Review
The major hypothetical points of view of this investigation incorporate the resource-
based view, characteristic asset-based view, asset reliance hypothesis, institutional
hypothesis, partners' hypothesis, and exchange cost financial matters hypothesis. These
speculations give a sound hypothetical focal point to comprehend the potential impact of
GSCM rehearses on the ecological, operational, and consequently monetary and
advertising execution of the firm.
2.2.1 Resource-Based View
Zegarra (2016), point out, the sources of sustainable competitive advantage are found in
the effects of each process of the organization and therefore must be sought both in the
organization and in the interaction of the environment. The traditional literature has
sufficient methodological proposals that unequivocally identify these internal and
external factors and propose comprehensive designs for exploration (Mweru et al.,
2015). This study will consider the structure and stages proposed by these authors to
advance an analysis of organizational performance from the perspective of RBV claims.
Resource Based View (RBV) contends that supported upper hand and enhanced

19
authoritative execution might be acknowledged by abusing assets that are profitable,
uncommon, incompletely imitable, and non-substitutable (Volberda & Karali, 2015).
Kozlenkova, Samaha and Palmatier (2014) defined capabilities as a special kind of
resource, specifically an organizationally non-transferable resource whose purpose was
to progress the productivity of the other resources possessed by the organization. In fact,
it is recommended that resources, which are tangible assets, intangible assets, and
capabilities, maintain the potential to provide firms with a sustainable competitive
advantage. Assets that have a physical form are tangible assets include both fixed assets,
such as machinery, buildings, land, real estate, vehicles, equipment, and precious metals
and current assets, such as inventory and currencies. Intangible assets include both
nonphysical resources, such as patents, trademarks, copyrights, goodwill, brand
recognition, and computer programs that have a value to the firm and finance assets,
including such items as accounts receivable, bonds and stocks. In this respect,
capabilities are used to engage the resources within the firm, such as implicit processes
to transfer knowledge within the firm (Akroush, 2010).
Resources may be considered as inputs that enable firms to carry out its activities.
Internal resources and capabilities determine strategic choices made by firms while
competing in its external business environment. According to RBV, not all the resources
of firm will be strategic resources. Competitive advantage occurs only when there is a
situation of resource heterogeneity (different resources across firms) and resource
immobility (Madhani, 2010).
A firm “is more than an administrative unit; it is also a collection of productive
resources the disposal of which between different uses and over time is determined by
administrative decision”. Thus, firms are heterogeneous from the resource-based
perspective. A distinctive competencies perspective provided the next input into the
resource-based view. The distinctive competency is an action that a firm can perform
better than competitors and that allows achieving higher efficiency and effectiveness

20
compared to rivals (Borch & Solesvik, 2015). Thus, it has been admitted by distinctive
competency scholars that the sources of competitive advantage are internal in the firm.
Distinctive and superior competencies in functional areas (management, marketing,
production design, and others) are positively associated with performance.
The resource-based view claims that the sources of sustained competitive advantage of
the firm are inside the firm, namely that are the businesses have unique and valuable
resources and capabilities that are rare, hard to imitate, imperfectly substitutable, and
mobile, and may attain and keep competitive advantage (Solesvik, 2017). The resource-
based motives are often crucial for a firm’s decisions to join collaborative relationships.
Hart (2015) asserts that a standout amongst the most critical drivers of new asset and
ability improvement for firms is the limitations and difficulties presented by the
common habitat. Practically all associations are at a point where their business activities
affect somehow on the common habitat. RBV with regards to ecological responsibility
necessitates that organizations utilize vital assets and capacities to make exceptional and
hard to emulate rehearses that can bring down the impact of the company's tasks on the
regular habitat (Hart, 2015). Resource based view will be used in the study to test the
resource management during green production and the internal environmental
management. This theory supports the variable internal environment management.
2.2.2 Natural-Resource-Based View
This is the key theory on which this investigation was founded. The hypothesis is an
expansion of RBV, and it sets that a firm can assemble supported upper hand dependent
on its connection with the normal or biophysical condition (Dowell, 2011). According to
NRBV, pollution prevention technologies involve much tacit knowledge through skill
development and “green” teams (Yang et al., 2015)
As indicated by RBV, if an asset or heap of assets is to bear the cost of a firm upper
hand, at that point it must be profitable, non-substitutable, uncommon, and supreme. The

21
nutural resource-based view (NRBV) contends that three attributes are viewed as critical
for an asset or heap of assets to be key (Shi et al., 2012). To start with, the asset or heap
of assets must be explicit to a firm. Second, the asset or heap of assets ought to be
causally vague or unsaid. This suggests the asset is individuals based and hard to see
practically speaking since individuals or groups secure information through continued
learning by doing and clean it as they acquire understanding. At long last, the asset or
heap of assets ought to be socially intricate (Foo et al, 2018). The vast industrial
development and economic globalization have brought considerable environmental
concerns over the last five decades such as pollution, climate change, natural resources
depletion, and environmental degradation. The adoption of GSCM practices can assist
organizations to reduce their environmental impact through reducing waste, conserving
resources, minimizing energy and water usage, etc. Much has been written about the
adoption of GSCM in developed countries such as practices, drivers, effects on
performance. Organizational responses to these concerns have grown beyond internal
operations to cover the entire supply chain, and thus organizations at all levels of the
supply chain are contemplating the adoption of different sustainable initiatives and
practices. This has led to the development of the terms Sustainable Supply Chain
Management (SSCM) and Green Supply Chain Management (GSCM) (Shi et al., 2012).
Along these lines, they learn by doing as well as refine their aptitudes as they gain more
involvement. The representatives additionally work in groups to achieve this goal. The
decentralized and implied nature of this fitness makes it difficult to see by and by and,
consequently, hard to impersonate rapidly (Shi et al., 2012). Subsequently, the firm is
managed the open door for supported upper hand through a one-of-a-kind causally
vague asset. Green obtainment, naturally mindful structure, green appropriation and turn
around coordination make socially complex assets since these exercises rely on an
extensive system of individuals or groups occupied with composed activity which
couple of people, assuming any, have adequate broadness of learning to execute (Shi et
al., 2012).
22
These exercises require foundation of agreement among providers, clients, and other
production network individuals and in this manner includes numerous groups and
associations. To achieve the objective of community oriented green production network,
the firm should ceaselessly facilitate their tasks and associations in attempted these
exercises (Shi et al., 2012). This it can do through defining ecological objectives
mutually, shared natural arranging, and participating to lessen contamination. This
requires simple correspondence and exchange of data crosswise over capacities,
divisions, and authoritative limits. The exercise in careful control among production
network individuals to guarantee that the execution of these exercises is upgraded
without hurting the indigenous habitat is a socially mind-boggling asset which can make
an open door for supported upper hand for the firm (Shi et al., 2012).
According to Handfield and Nichols (2012), “SCM is an integrated management system
of supply chain organizations and activities through cooperative organizational
relationships, business processes, and high levels of information sharing systems that
provide member organizations a sustainable competitive advantage”. GSCM is whereby
the organization uses inputs into its production process that are environmentally friendly
with the aim of reducing environmental impact. Green manufacturing enables the
organization to have a competitive advantage since they will incur lower raw material
costs, higher production efficiency and improved corporate image (Ninlaw et al., 2010).
The supply chain network’s environmental impact should not only consider suppliers,
distributors, and consumers, but also the transportation between the supplier and the
consumer, along with the environmental effects of research and development,
production, and storage; in effect all sources that make up the overall stream of waste
and pollution.
Similarly, Zhu et al. (2013) identify the scope of GSCM practices ranging from “green
purchasing to integrated life-cycle management of supply chains flowing from supplier,
through to manufacturer, customer, and closing the loop with reverse logistics”. Such a
holistic value chain approach is also reflected in Zsidisin and Siferd’s (2010) definition:

23
“green supply chain management is the set of supply chain management policies held,
actions taken, and relationships formed in response to concerns related to the natural
environment with regard to the design, acquisition, production, distribution, use, reuse
and disposal of the firm’s goods and services”. Although there are several research
studies that have attempted to link NRBV theory with GSCM to explain a firm’s
competitive position and performance improvement, there are still questions that remain.
Essentially, it is still unclear as to how the specific types of GSCM practices would
translate into a firm’s strategic resources that in turn leads to competitive advantage and
performance improvement (Shi & Koh, 2012). The variable supports green purchasing
variable.
2.2.3 Resource Dependence Theory
Since its publication, resource dependence theory (RDT) has become one of the most
influential theories in organizational theory and strategic management. RDT
characterizes the corporation as an open system, dependent on contingencies in the
external environment. Though Resource Dependence’s influence has spread to several
disparate fields beyond management (Davis and Cobb, 2010), focuses on scholarly work
published in management journals and related fields such as strategy and economic
sociology which collectively comprise the core Resource Dependence literature. To
understand the behaviour of an organization you must understand the context of that
behaviour that is, the ecology of the organization.” RDT recognizes the influence of
external factors on organizational behaviour and, although constrained by their context,
managers can act to reduce environmental uncertainty and dependence. Central to these
actions is the concept of power, which is the control over vital resources (Hillman et al.,
2009).
Resource dependence theory (RDT) is concerned with the resources available in the
environment external to the focal firm and in the custody of other companies (Hollos et
al., 2012). Companies holding those resources try to continue their grip to maintain their

24
authority and dominance while the companies in need of them try to find alternate
resources or new sources to minimize their dependence (Sheu, 2014). RDT can guide the
management of companies on how to minimize their dependence concerning the most
critical and scarce resources specifically related to greening of overall production
process (Wolf, 2014). Customers and suppliers are identified as the most critical
resources that should be managed in addition to the physical resources such as raw
materials, labor, or capital (Hillman et al., 2009; Lai et al., 2015). RDT lens can be used
to understand and explain GSCM practices and their adaptation (Sarkis et al., 2011) for
dependence on external resources and the direct or indirect influence of the stakeholder
on the focal organization (Wolf, 2014). For example, governments or regulatory bodies
can enforce a ban on the use of certain raw materials to protect the environment, or
suppliers can minimize the delivery of highly sought-after materials or increase their
prices.
Customers with high demanding power can ask for strict compliance to environmental
standards or compulsion to obtain certain certifications. Pressure groups, e.g., vibrant
media or NGOs, can indirectly influence a focal firm to stop doing business with certain
suppliers or customers when such clients are not complying with environmental
standards as in the case of Greenpeace and Nestle (Wolf, 2014; Liu et al., 2015).
All together for GSCM practices to be executed effectively all through the entire
production network, cooperation with providers, clients and other store network
accomplices is incredibly pivotal (Zhu, Geng & Lai, 2010). Resource dependency theory
is based on the principle that an organization, such as a business firm, must engage in
transactions with other actors and organizations in its environment to acquire resources.
Although such transactions may be advantageous, they may also create dependencies
that are not. Resources that the organization needs may be scarce, not always readily
obtainable, or under the control of uncooperative actors (Archibald, 2017). In the
meantime, clients may assist providers with understanding the related issues, for
example, potential upper hand and the criteria utilized for assessment and rating. RDT

25
along these lines gives hypothetical grapple to the job of natural joint efforts with
production network accomplices (a GSCM practice) as an approach to abuse integral
capacities to accomplish upper hand and thus enhanced authoritative execution. This
variable supported the eco design practices.
2.2.4 Institutional Theory
The institutional theory sets that endeavours grasp certain procedures to pick up
authenticity or acknowledgment inside society (Zhu & Sarkis, 2007). The hypothesis
investigates the impact on a firm by outside weights. Organizational decisions are based
upon a set pattern of cultural values, norms, and behaviours under the influence of an
external environment (Gualandris & Kalchschmidt, 2014). When all organizations
within the same industry adopt a similar kind of institutionalized practices and decision-
making approaches, it depicts an attempt by them to legitimize themselves (Williams et
al., 2009). Institutional theory is used to understand different types of external factors
that force any organization to initiate or adopt any new practice (De Grosbois, 2016).
Institutional theory highlights three kinds of isomorphic pressures, where coercive
pressures are a set of formal or informal pressures from influential organizations on
which the focal firm is dependent due to specific resources, abiding by the law, or even
societal expectations (Sarkis et al., 2010).
These pressures can take the form of invitations by industrial bodies to join them to
acquire benefits, or a source of fear to become banned/fined for non-compliance of
specific government laws or regulations (Yang, 2017, Sarkis et al., 2010). Normative
pressures are a result of certain norms and standards formalized by the environment
from a cultural expectation of that environment. Different groups can be the source of
normative pressures including educational institutions inculcating cognitive behavior;
professionals from industry groups and associations; nongovernment organizations
(NGO) having an interest in a particular industry; and the public. Suppliers and
customers are also one of the core components of these pressures (Zhu et al., 2013, Shu

26
et al., 2017). Mimetic pressures play their role in driving organizations to avoid
uncertainty and risk by copying or replicating the processes or structure of other
successful institutions. In the event of any significant change in the external environment
that creates a threat to their existence, organizations look for role models that they
believe were successful in facing those external challenges to try to modify themselves
according to those model organizations (Williams et al., 2009).
The manufacturing sector around the globe is facing immense pressure from different
quarters to adopt and implement GSCM practices (Shu et al., 2017). Pressures being
exerted by the above-mentioned stakeholders have made it compulsory for
manufacturers to prove themselves as a legitimate company by adopting GSCM
practices (Gualandris & Kalchschmidt, 2014).
Regulating weights are advanced by outer partners who have personal stake in the firm
(Zhu & Sarkis, 2007). These partners incorporate clients, social gatherings, investors,
and providers. Firms that respect these weights are seen to be progressively real. Sarkis
et al. (2011) distinguish the client as the center regulating weight to makers to execute
GSCM rehearses. Natural and local gatherings draw the general population's
consideration on the negative ecological impacts of firms' tasks by driving dissents and
blacklists. Worker's organizations additionally put weight on these organizations to
guarantee the security of their association individuals from damage that may result from
ecological mishaps. Zhu and Sarkis (2007) contend that institutional weights may make
firms participate in proactive natural practices, for example, GSCM. Firms that respect
these weights are seen to be increasingly authentic and are probably going to increase
upper hand and consequently enhanced hierarchical execution (Zhu & Sarkis, 2007;
Darnall et al., 2008). This variable supported the institutional pressures variable.

27
2.2.5 Stakeholder Theory
Stakeholder theory perceives the way that other than investors, there are different people
or gatherings who the association is committed to and who are probably going to be
specifically impacted by the moves made by it or have an unequivocal authoritative
association with it (Mainardes et al., 2011). The partners incorporate clients, overall
population, providers, representatives, and money related organizations. These partners
determine what they anticipate from the association, encounter the impacts of relating
with it, evaluate the outcomes acquired and act as per these appraisals, solidifying their
association with the association or something else. The activities of companies affect
both internal and external parties. Corporate social responsibility can be understood as
the responsibility for a business to meet the expectations of its various stakeholders.
Firms can ensure their long-term survival and preserve their license to operate by
considering the broad network of actors into their strategy (Park-Poaps & Rees, 2010).
Kit (2010) conducted a descriptive study on financial aspects involved in SCM of rural
entrepreneurship and advocated that financing SCM implies establishing link between
financial institutions and all stakeholders in supply chain management. The author
suggested that providing finance to facilitate flow of products and establishing
relationships among different stakeholders of supply chain should immensely contribute
to boost the efficiency of SCM practices. Solér, et al. (2010) analysed the Swedish food
SCM practices and found that consumers perceive information about the environment
relating to food SCM distinctly and this distinct perception is affected by their location
in the supply chain in relation to other stakeholders.
From a key point, firms that embrace GSCM rehearses observe these activities to be a
wellspring of upper hand, particularly, if the company's essential partners esteem such
natural activities. There is proof connecting these to GSCM rehearses which is
considered to have business esteem (Jaegler & Sarkis, 2014; Foerstl et al., 2010). The
management of material, information, and capital flows as well as cooperation among

28
companies along the supply chain while taking goals from all three dimensions of
sustainable development, i.e., economic, environmental, and social, into account, which
are derived from customer and stakeholder requirements (Seuring & Müller, 2008).
Stakeholder theory supported the variable institutional pressures.
2.2.6 Transaction Cost Economics
Transaction cost economics (TCE) contends that a firm will develop if it can direct its
activities in house cost adequately with respect to getting the administrations from the
market. Modes of governance and organisational action in buyer-supplier relationships
to implement social and green practices. The impact of transaction costs on the adoption
and diffusion of sustainability practices across a Supply Chain (Vachon & Klassen,
2006). Sarkis et al. (2011) characterize exchange costs as the expenses past that of an
item or administration required to trade the item or administration between at least two
elements.
Transaction cost economics (TCE) is flexibly applied, for example, to explore the link
between buyer-supplier relationship stability (Lai et al., 2014); and with multi-objective
minimization green supply chain risk. TCE can help explore mutual transactional
relationships among multiple entities in a circular economy system. For example,
enterprises exchange their wastes, by-products, and energy for second use in eco-
industrial parks or regional networks. Transactional costs exist among these enterprises.
Evaluation and minimization of transaction cost among inter-enterprises within eco-
industrial parks can help optimize circular economy networks. Investing in assets (asset
specificity) may allow for greater relationship building between members in a circular
economy context, how “strong” the relationships are in an eco-industrial park and
network settings, and where whole industrial parks can invest in specific assets to form
networks (Liu et al, 2018).

29
Information asymmetries exist for circular economy actors and their stakeholders
including governments, non-governmental organizations, and consumers. Material
availability and flows, by products, and their costs, have similar information asymmetry
and power issues as GSCM material flows. Examining and dealing with information
asymmetries among actors and stakeholders within the circular economy context require
exploration (Liu et al, 2018).
The central studies of TCE, by often discussing the suppliers’ decision to buy or produce
internally, relate naturally with the SCM. Chicksand et al. (2012) highlighted the
potential of using TCE to investigate the SCM. In 2008, Williamson (2008), the most
prominent theoretician of TCE, published an article highlighting the potential of the use
of TCE in SCM and proposing some research agendas seeking to integrate the two
concepts. The trend identified by Chicksand et al. (2012) is replicated in GSCM and
environmental purchasing, but in a more significant manner, as very few studies use
TCE to investigate such phenomena (Carter & Easton, 2011; Sarkis et al., 2011;
Appolloni, Sun, Jia & Li, 2014). Toubolic and Walker (2015), in a literature review
about sustainable supply chain covering the period between 1995 and 2013, found out
only 14 papers that use TCE to ground their analysis. For the same period, Appolloni et
al. (2014) identified only two papers using TCE as theoretical lens to analyse
environmental purchasing. There is a trend in most of the papers of not using any
theoretical lenses. Thus, lack research both empirically and theoretically grounded in
order both to test and build theory (Apolloni et al., 2014; Toubolic & Walker, 2015).
On the off chance that clients and providers pull back, the exchange costs are probably
going to increment particularly in situations where the firm has put resources into
exchange explicit resources. The potential for selfish conduct is likewise fundamentally
expanded. On the off chance that then again, the firm actualizes GSCM rehearses, these
expenses are enormously decreased bringing about expanded authoritative execution.
Transaction cost economy theory supported the variable investment recovery.

30
2.2.7 Complexity Theory
GSCM is a complex system with forward and reverse material flows involving product
recalls, remanufacturing, and safe disposal procedures (Hallam and Contreras, 2016).
Vertical integration involving collaboration with suppliers and customers aids the
effective flow in the closed loop. Therefore, GSCM can be used as a vital tool in the
context of a circular economy for the sustainable use of resources (Mangla et al., 2018).
Such complex processes call for the development of a special theory to study its
behaviour. GSCM can be viewed as a system with subsystems and processes aiming to
minimize environmental impact. Koh et al. (2012) suggest that the entire GSCM system
must understand the co-benefits, but simultaneously disregard suboptimal solutions.
Systems thinking and systems theory allow practitioners to study the complete system
rather than individual elements separately. It enables the investigation of all element
linkages in the system and manages the system functioning in a more comprehensive
fashion (Koh et al., 2016). This situation is particularly evident for external GSCM
practices on activities, such as providing design specification to suppliers involving
environmental requirements, auditing suppliers’ environmental management systems,
cooperating with customers for eco-design, and handling product returns from customers
(Sarkis et al., 2011)
The GSCM implementation difficulties can be intensified by the complexities associated
with broader organizational complexities such as size and relationships (Vachon &
Klassen, 2006), or specific activities such as product return, recycling, remanufacturing,
balancing as well as the roles of production and consumption in the supply chain.
Although their work focused on a linear relationship from an extraction to disposal,
some loops were incorporated into the evaluation and there were concerns about the
possibility of integrating ‘residuals’ back into the system. Interestingly, not only were
solid and water pollution waste included in the discussion, but warnings of global
climate change due to carbon and other greenhouse gas emissions was also prevalent in

31
the argumentation on evaluating the roles of inter-organizational relation- ships. Further
refinement of the industrial metabolism and material flow balance ideas occurred
throughout the 1970s (Sarkis et al., 2011).
The execution of GSCM includes various individual gatherings working in the
framework. This circumstance is especially obvious for outer GSCM rehearses on
exercises, for example, giving plan particular to providers including natural
prerequisites, evaluating providers' ecological administration frameworks, collaborating
with clients for eco-structure, and taking care of item comes back from customers.
GSCM usage challenges can be strengthened by the complexities related with more
extensive hierarchical complexities, for example, size and connections (Vachon &
Klassen, 2006), or explicit exercises, for example, item return, reusing, remanufacturing,
investigation, and quality checking. These complexities innate in shutting the circle for a
store network have been perceived in past examinations (Guide & Wassenhove, 2009;
Matos & Hall, 2007). Because of the limited levelheadedness of individual gatherings,
the execution result of a GSCM action cannot be precisely anticipated without knowing
the real commitments by other included gatherings in the framework.
There was exacerbated complexities for executing GSCM if the more extensive
ecological, financial, administrative, social, and political elements are considered with a
bigger number of gatherings associating with others. At the point when a mind-boggling
framework grows with an expanding number of communicating gatherings, or
frameworks, it ends up hard to derive the practices and gauge the collaboration results of
the framework. For dealing with a provider framework, Choi, and Krause (2006)
distinguished supply base multifaceted nature as a key zone of administrative thought
which is conceptualized in three measurements: 1) the quantity of providers in the
supply base, 2) the level of separation among these providers, and 3) the dimension of
between connections among the providers. They allude to multifaceted nature as how the
individuals from a framework (e.g., providers in a base) are differed and connect with
each other. Through understanding the intricacy of a framework, matters identifying

32
with the exchange costs, supply hazard, provider responsiveness, and provider
advancement in a supply base can be better overseen (Choi & Krause, 2006). This
thought has likewise been connected to informal community hypothesis (SNT) and its
suggestions to GSCM (Miao & Xi, 2007). Complex versatile frameworks have been
utilized to likewise clarify the development and the executives of eco-mechanical parks
(Shi et al., 2010)
One ramifications of multifaceted nature hypothesis for GSCM are that a few exercises,
e.g., client collaboration for item returns, include a dynamic system of connections in the
framework. Provider incorporation in item advancement (e.g., for eco-structure in
GSCM) will likewise decide execution in item development and quality in a framework
(Koufteros et al., 2007; Vachon & Klassen, 2006). It is the association among the
included gatherings that considers the sharing of information and formation of
significance. In doing as such, it will help diminish the vulnerability that emerges from
actualizing the GSCM exercises and guide the working of the framework. This theory
supported the complexity of supply chain adoption on performance of agri-
manufacturing firms in Rwanda.
2.3 Conceptual Framework
The reasonable structure gives an outline of the sorts of the exploration factors which
assume a job in the examination. In this exploration there are two sorts of factors: the
autonomous factors which are additionally alluded to as control factors manage all
hypotheses and practices identified with Green Supply Chain appropriation among them
are inward green supply reception, clients green supply selection, providers green supply
reception (Green et al., 2010). Then again there are needy factors additionally called
estimation variable are for the most part identified with Supply Chain Performance and
among them in this examination more accentuation was put on operational execution,
monetary execution, and natural execution. This speculative relationship is reflected in
Figure 2.1 below.

33
Figure 2.1: Conceptual Framework
H05
H01
H02
H03
H04
Institutional Pressures
Rules &
Regulations
Competitiveness on
the market
Internal environment
management
Commitment to GSCM
Support for GSCM
Green purchase
Cooperation with
suppliers
Supplier environmental
friendly
Suppliers’ ISO14000
certification
Eco design practices
Green packaging
Green rebelling
Green products
Investment recovery
Recovery (sale) of
excess inventories
Sale of scrap
Sale of excess capital
equipment
Supply chain
performance
Delivery on time
Low defaults
Product meet
client expectation
High quality
levels
High service
levels

34
2.3.1 Internal environment management
Interior ecological administration is the act of creating green inventory network the
board as a vital authoritative basic through responsibility and support of the basic from
senior and mid-level chiefs (Green et al, 2010). Internal environment management
contains support and encouragement from senior managers. Internal management is a
key critical success factor for enterprises to adopt green practices. Pressure employees
bring about, encouragement and support from environmental protection motivate senior
management. Meanwhile, the perception of environmental risks involved could bring
positive change in adoption of green practices (Luthra, Garg & Haleem, 2016, Yusuf et
al., 2013).
The integrating of the imperative GSCM practices into the overall strategy of the firms
is necessary to ensure a successful implementation of GSCM practices. Firms can start
implementing GSCM practices into their operations such as green purchasing,
collaboration with customers and suppliers, eco design and investment recovery (Green,
2012). The internal environmental practices require full commitment and support from
top management and middle-level management. Top management needs to be fully
committed with the GSCM practices to ensure environmental excellence. In addition,
top management needs to identify the importance of environmental problems along a
supply chain and supports the initial assessment by taking a full responsibility for the
environmental monitoring efforts (Chin, et al., 2015).
2.3.2 Green purchase
Green obtaining centers on coordinating with providers to develop items that are
ecologically feasible (Green et al., 2010). Green sourcing means sourcing or purchasing
materials and components which have such enviable ecofriendly characteristics as
reusability, recyclability and nonuse of hazardous/dangerous chemicals (Eltayeb et al.,
2011). With more and more concerns on environmental protection, procurement

35
professionals have been motivated to reconsider their existing sourcing, purchasing
strategy and their impact on environmental sustainability Govindan et al., 2015). The
role of ecofriendly purchasing is the involvement of recycling and remanufacturing. The
green sourcing supporting waste reduction enhances recycling and remanufacturing and
other activities in supply chain. Zailani et al. (2015) highlighted that ecofriendly
purchasing has positive relationship with firms’ operational and environmental
performance. Yang et al. (2010) ascertain that green purchasing was categorized into
five main facets: design operation management, supply chain management,
environmental authentication, ecological, and external environmental management.
They confirmed that green purchasing improved to the overall firms’ performance (Chen
et al., 2012). The adoption of green purchasing in supply chain and business operations
is a reliable tool in mitigating waste, air, and water pollution.
2.3.3 Eco design practices
Luthra et al. (2016) highlighted that 80% impacts on environment from product and
process related could be controlled with the adoption of ecological design in supply
chain management. Ecological design incorporates many ideas such like using cleaner
technology processes, green raw material, and components (Eltayeb et al., 2011). Green
design of products reduces ecological impacts of products during their life (Luthra et al.,
2016). In addition, green design of products also supports reusing, recycling, and
remanufacturing of products, which not only helps firms to improve their environmental
performance but also provide opportunity to reduce their costs (Khan & Dong, 2017).
Design for Environment (DfE) or Eco-design refers to environmental design of a
product and/or a process. It focuses on reducing (preventing) the environmental effects
of a product before it is produced, distributed, and used. DfE examines the disassembly
of products at the end-of-life and reveals the associated cost benefits and environmental
impact of revision, reuse, and recycling Harrison (Harrison & Hoek, 2011). DfE has its
origins in the concepts of concurrent engineering and design for manufacturability and

36
assembly (DFMA). Concurrent engineering, also defined as simultaneous engineering, is
the practice by management and operations of designing products and processes by
multi-functional teams throughout a product’s life cycle from idea generation, design,
development, manufacturing, service, maintenance, and disposal. Closely related to this
principle is Design for Manufacture and Assembly (DFMA), where DFMA is defined
the process of proactively designing products to 1) optimize all the manufacturing
functions: fabrication, assembly, test, procurement, shipping, delivery, service, and
repair, and 2) assure the best cost, quality, reliability, regulatory compliance, safety,
time-to-market, and customer satisfaction. The major goals of these programs are to
simplify product designs so that they could be made inexpensively over the full
product’s life cycle, but also considered the other elements of product and process
control. The DfE process usually entails five major steps: 1) Assess environmental
impacts, 2) Research the market, 3) Run an ideas workshop (brainstorm), or ideas
generation, 4) Select design strategies, 5) Design the product.
Previous work of Eco-designs was clearly considered the technical improvements to
reduce the environmental cost by their products and processes. The improvements
become possible when factors of designs externally control of producers, relationship of
suppliers and customers, government authorities and recyclers, include important GSCM
practice. Eco-designs success demands cooperation’s of cross functional between intra-
organizational units for both outside partners and inside company throughout the supply
Malaysia management. Previous studies of US overall support the product and GSCM
(Melander, 2017). Studies like Hanim et al. (2012), further support eco-designs link with
GSCM practice into the Environmental Protection programs which give the green supply
chains as core aspect of their designs for especially in their environment programs.
Eco-design practices are important aspects to reach the. Sustainability goals can be
considered design requirements such as: reduced use of energy, materials, packaging,
and transportation; reduction of waste and emitted pollutants, reduction of hazardous
materials and substances in the manufacturing process, improvement of waste handling

37
protocols or techniques, recycle and reuse, utilization of greener technologies and
materials, etc. to mention some (Ghazilla et al., 2015; Zhu & Geng, 2013). Eco-design
offers different benefits and opportunities to companies, not only environmentally but
also from the economic and social perspectives (Borchardt et al., 2011). Moreover, the
implementation of eco-design methodologies might promote the application of
Environmental Management Systems (EMS). As external drivers, environmental data
can be used for communication-to-user and marketing purposes while increasing the
presence of environment as a decision-making criterion during purchase (Sanyé-
Mengual et al., 2014).
Eco-design was applied to different types of products and several guides were developed
not only for the methodology but also for specific sectors: urban furniture (e.g.,
streetlight, bin, and bench), household products (e.g., appliances). Furthermore, the
implementation of eco-design in different product sectors were also analyzed in the
literature through case studies, such as wooden products (González-García et al., 2011a,
2012a, 2012b, 2012c, 2013), lighting sector (Casamayor & Su, 2013), automotive (Alves
et al., 2010, packaging (Almeida et al. 2010).
The enormous increment out there an item goes before achieving the client, rather than
privately created products, is most likely the primary negative impact on condition. In
spite of the fact that these are the results of winning financial choices, streamlining the
load as well as the volume of the item and its bundle assumes an imperative job in
decreasing both ecological effect and cost because of transportation Eco-structure
necessitates that makers plan items that limit utilization of materials and vitality, that
encourage the reuse, reuse, and recuperation of segment materials and parts, and that
stay away from or diminish the utilization of risky items inside the assembling process
(Green et al, 2010)
The greater part of the ecological impact of any item or material is 'bolted' into the item
at the plan phase of an item, when materials and procedures are chosen and item natural
38
execution is to a great extent decided (Lewis & Gretsakis, 2001). Spearheading firms
have discovered that creation item returns gainful depends on great item structure
(Krikke et al., 2004). It has been contended that for successful item stewardship and turn
around coordinations rehearses, eco-structure (which would incorporate plan for
dismantling, structure for reusing, and structure for other invert coordinations rehearses)
is fundamental (van Hoek, 1999). Therefore, eco-structure or Design for Environment
(DfE) is an imperative and rising GSCM practice to enhance organizations' CLSC.
Eco-plan rehearses best fit inside van Nunen and Zuidwijk's (2004) item viewpoint,
which concerns sorts of item arranged connections that happen in CLSC. In our
depiction here, eco-plan is intended to address item usefulness while at the same time
limiting life-cycle ecological effects. The accomplishment of eco-plan requires interior
cross-useful participation inside the organization and the outer collaboration with
different accomplices all through the store network. Early eco-plan work concentrated
principally on specialized enhancements to items and procedures to relieve ecological
expenses. Acknowledgment that progressively significant upgrades are conceivable just
when configuration factors outside of the immediate control of makers, incorporating
associations with providers, buyers, recyclers, and administrative experts, are
incorporated for eco-plan to end up a vital GSCM practice (Benito & Benito, 2005).
The achievement of eco-structure requires interior cross utilitarian collaboration among
intra-authoritative units inside an organization as participation with outside accomplices
all through the production network. Concentrates in the US bolster this position
particularly for item configuration based joining of providers into the green production
network to meet the explicit inventory network natural structure necessities. To
additionally bolster eco-design’s fundamental linkage to GSCM practice, the U.S.
Ecological Protection Agency’s program has green supply chains as a center part of their
structure for the earth programs. Chinese associations are additionally subject to eco-
plan necessities in their job as production network accomplices, particularly given the
weight for worldwide administrative consistence (Kumar & Chandrakar, 2012).

39
2.3.4 Institutional Pressure
In fact, businesses are operated in several interrelated pressures from different parties
such as shareholder, society, governments, customer, market, and business organization
when respond to environmental matters such as conserving materials, reduced water, and
energy use. Recent years have seen an increasing role of institutional pressure in the
fields of OM and SCM (Kauppi, 2013). Institutional pressure suggests that external
forces motivate firms to undertake similar strategic actions. Under institutional pressure,
firms are not only profit-seeking entities, but also recognize the importance of achieving
social legitimacy. Institutional pressure has two main forms, an economic variant and
asocial variant. The manufacturing sector around the globe is facing immense pressure
from different quarters to adopt and implement GSCM practices (Chu et al., 2017).
Pressures being exerted by the above-mentioned stakeholders have made it compulsory
for manufacturers to prove themselves as a legitimate company by adopting GSCM
practices (Gualandris & Kalchschmidt, 2014).
The mechanisms identified are coercive, mimetic, and normative, which lead to wards
institutional isomorphism). The coercive mechanism consists of formal or informal
pressures created on firms by other firms on which they are dependent and by
expectations from the society (Kauppi, 2013). As shown by Liu et al. (2010),
government offices are the undeniable factor that impact the reception of green practices
by associations through the implementation of standards and controls. For example, to
diminish contamination to the earth, associations are required to utilize contamination
control innovations and report their contamination emanations to demonstrate their
effect on nature. Inability to do as such may make these associations confront legitimate
authorizations which influence the business advance unfavorably. The dread of
legitimate authorizations is considered as the primary purpose behind associations to
proactively advance green practices (Zhu, Sarkis & Lai, 2013).

40
Besides, the ecological conduct of sending out organizations may likewise be affected
by the coercive weight from remote enactments. The ecological arrangement and
controls of the legislature are basic determinants as firms need to adjust with these
prerequisites (Schrettle et al., 2014). In one study Wong et al. (2012) studied the
moderation effect of environmental management and green operations on manufacturing
firm performance.
However, we further extend this research from an institutional theory perspective.
Institutional pressure drives organizations to adopt environmental management
initiatives; for example, Wu et al. (2012) studied the impact of GSCM drivers on GSCM
practices under the moderation effect of institutional pressures, with reference to
Taiwan's textile industry. Hence, we submit that institutional pressures have a
moderation effect on the impact of SRM and TQM on environmental performance.
However, one can argue that there are reasons why institutional pressure is not regarded
as a mediating variable. Very often researchers get confused between moderating,
mediating and controllable variables. However, a proper understanding and critical
review further helps to resolve the conflicts. Similarly, in our case we have enough
literature which supports the moderation role of institutional pressure.
2.3.5 Investment recovery
Venture recuperation requires the clearance of overabundance inventories, scrap and
utilized materials, and abundance capital hardware (Green et al, 2010). Effective and
efficient control of the purchasing and handling of materials can significantly reduce
waste generation. Inventory control is meant to minimize costs and appropriate planning
will help minimize the number of materials and products that are lost due to a variety of
inventory reasons including obsolescence, spoilage and losing products. There are issues
with managing the control and various lean principles (JIT and lean manufacturing
philosophies) may help to manage in these environments Ming-Kuei (2014) more
effectively. Material remaining after the product has expired will require disposal.

41
Companies should store materials in a locked space and limit access to a few designated
employees. By controlling access to raw materials, operators will ensure that containers
are completely empty before new containers are opened.
Management should establish standard operating procedures for inventory control and
purchasing, working with suppliers to take back empty or off-spec containers. Inventory
appears throughout the supply chain, including inside an organization and through the
logistics network. Efficient inventory planning and management does not only help to
decrease solid wastes, but also decrease air emissions such as greenhouse gas emissions.
Information technology in inventory management plays a crucial role in improving
control of the inventory and maintaining a greater positive environmental influence. This
issue relates to the discussion on having appropriate enterprise resource planning
systems. In fact, it has been found that for organizations that there is a correlation
between those organizations that have lessened inventory and good environmental
performance Al Khattab and Fraij (2011).
IR alludes to an association's vital utilization of turn around coordination reusing,
redeployment, exchanging and comparable systems to get more prominent incentive
from materials and items (Kumar & Chandrakar, 2012). IR looks to transform surplus
resources into income by moving inactive resources, lessening storage room, and
sending inert advantages for other corporate areas to abstain from acquiring extra
hardware or materials. Out-of-benefit hardware, abundance stock or crude materials,
waste and process side-effects and wrecked offices are incorporated into these non-
working resources.
Investment recovery (IR) is used as an important aspect of organizational strategic use of
redeployment, reselling, and recycling and other use full similar techniques to extract
greater value from materials and products by organization. IR is also unique technique to
generate revenue by selling useless assets, for reducing storage, space and deploying idle
assets from other corporate locations to avoid extra purchasing additional requirement of

42
equipment for materials and processes (Atmadja & Saputra, 2018). Investment recovery
also provides the facilities of non-working assets (Fragouli & Yankson, 2015).
Investment recovery (IR) is both environmental and economically beneficial practices
for organization and society. Galbraith (2015) stated in his study that 70% at least every
sales of dollar generate by investment recovery become surplus and it is possible if
industries are as diverse as well. Use full practice of IR are as the reverse logistics
practices such as recycling, reuse, remanufacturing and other like reclamation (Pandian
& Abdul-Kander, 2017). In Malaysia, investment recovery (IR) not specific much
attention such as in other developed countries like US and Germany, reasons are less
waste management policies in Malaysia and same lack of closed-loop systems
infrastructure (Callaway, 2017). The government of Malaysia changed their focus from
resources of subsides into some important resources such as coal and natural gas, for the
sack of renewal of new seek of interest in IR practices.
2.3.6 Supply chain performance
Many researchers tend to show growing interest in examining the contribution of
suppliers in the improvements of the buying firms. While only a few studies have clearly
proved that social capital has a meaningful influence on environmental performance,
Mitra and Datta (2014) showed that supplier collaboration has a positive effect on
environmental performance, specifically toward green product design and logistics.
We believe that a shared vision of environmental achievements between the buyer and
supplier firms will naturally have a positive influence on environmental performance.
Essentially, the cognitive social capital accumulated by GSCM will bring improvements
for environmental performance. Structural social capital represented by frequent
communication, information sharing, and joint activities will lead to knowledge transfer,
which can assist in discussing and finding solutions for achieving environmental
capability and performance. Long-term and trust-based relationships, namely relational

43
social capital, can increase the commitment between the two parties and provide
incentives to improve environmental capabilities. Overall, strong relationship-based
interaction, sharing of information, communication and trust will enable development of
new solutions for various environmental challenges (Parmigiani, 2011). Thus, this brings
great improvements to environmental performances.
Operational performance is concerned with the financial impact of a firm’s GSCM
practices. Regarding operational performance, several studies have been supportive of
the theory that social capital acts as a strong driving force for improvements. Cognitive
capital allows buyers and suppliers to share vision, combine each other’s thinking
processes, and seek resource integration. This alliance of goals aiming for a synergistic
effect tends to reduce the chance of conflicts and enhance joint returns for both parties,
increasing the willingness of both parties to mutually improve operational and strategic
performance (Carey, 2011).
Structural social capital, which acts as a channel for communication and information
sharing, generates better goal setting, planning, and problem solving, which can improve
performances of both the buyer and supplier. Interactions, including technical
exchanges, are factors that can positively influence supply chain performance. Several
studies have provided evidence that relational social capital has significant effects on the
improvement of quality, cost, flexibility, and productivity performance. Dyer and Singh
explain that relational social capital reduces opportunistic behavior and monitoring
costs, which is the main reason for operational improvement. (Chu et al., 2017). In
general, social capital, accumulated by frequent communication, timely information
sharing, shared problem solving and good relationships, provide opportunities to
improve operational performance.

44
2.4 Empirical review
2.4.1 Internal Environment Management and Supply Chain Performance
Internal organizational supply chain activities are related to traditional production and
operations management topics of an organization. Also, stress the need to examine
internal factors (IF) as well as external environmental factors driving green logistics is
highly recommended. Within an organization, pressure from employees, leadership from
environmentally committed management and perception of possible environmental risk
might all contribute to changes in environmental practices in organizations (Harrison,
2011).
It is difficult to define which of this range within an organization influences GSCM
initiatives and their relative success. There is consensus within the literature that internal
environmental management is a key to improving enterprises’ performance (Hanna et
al., 2011). It is well known that senior managers’ support is necessary and, often, a key
driver for successful adoption and implementation of most innovations, technology,
programs, and activities. To ensure complete environmental excellence, top management
must be totally committed (Al Khattab, 2012).
In a research done by Laari et al. (2016) found that manufacturers with strong internal
GSCM practices combined with arm's length environmental monitoring of suppliers are
likely to perform well in environmental issues. If a firm seeks to improve financial
performance, it needs to form more collaborative relationships with customers to
achieve environmental goals. In the same way, the study conducted by Sharma et al.
(2017), concluded that internal environmental management, environmental design, and
regulatory pressure are ranked as the top three performance indicators. The sensitivity
analysis has also been performed to see the effect of weightage on the final ranking of
performance indicators. This is one of the first studies that suggest the performance
indicators for implementation of green supply chain management in agro industry.

45
The results from data analysis showed that both of green human resource management
and green supply chain management practices have a positive effect to sustainable
performance in a joint manner. In fact, the results revealed that green human resource
management practices have a direct effect on the sustainable performance, with the
green supply chain management practices mediating this effect. In particular, internal
green supply chain management practices positively mediate between green human
resources management practices and sustainable performance, whereas external green
supply chain management practices mediate only the relationship between GHRM
bundle practices and environmental dimension of sustainable performance, thus
suggesting absence of awareness among manufacturers regarding the effectiveness of
this type of GSCM practices for an improved economic and social dimensions of
sustainable performance, and calling for more attention from green training programs
(Zaid et al., 2018) .
Lakshmimeera and Palanisamy (2013) merged a paper on a Conceptual Framework on
Green Supply Chain Management rehearses for Indian Manufacturing industry. They
reason that inner natural administration can enhance aggressiveness and ecological
execution prompting manageability. Chien (2014), clarify the impacts of inner
ecological administration on authoritative feasible execution and found that Green
Supply Chain Management polished by Taiwan Electrical and Electronic producers and
will decidedly influence the financial, natural, and social exhibitions.
A study done by Khan and Qianli (2017) investigated the impact of five determinants of
the green supply chain practices on organizational performance in the context of
Pakistan manufacturing firms. A sample of 218 firms was collected from the
manufacturing industry. The green supply chain practices were measured through five
independent variables including green manufacturing, green purchasing, green
information systems, cooperation with customers, and eco-design. By using exploratory
factor and simultaneous regression analysis, the results indicate that except green
purchasing, rests of the four independent variables have been found statistically

46
significant to predict organizational performance. However, the eco-design of green
practices followed by green information systems has revealed the greatest impact on
organizational performance. Another valuable result is that green purchasing is an
important antecedent of firm’s economic performance in the US manufacturing firms
(Green et al. 2012), although not significantly related to organizational performance in
our study.
2.4.2 Green purchase and Supply Chain Performance
Diab et al., (2014) tried the effect of Green Supply Chain Management Practices on
Organizational execution and their examination dependent on Jordanian Nutrition
Industries and chose six organizations represented considerable authority in sustenance
industry. Consequences of the investigation appeared there was an effect on green buy
on authoritative execution which are natural execution, budgetary execution, and
operational execution. According to Govindan et al. (2013), the practices with the main
driving power are just-in-time (lean practice), flexible transportation (resilient practice)
and environmentally friendly packaging (green practice). Customer satisfaction is the
performance measure with strong dependence and weak driving power; that is, it is
strongly influenced by the other researched variables but does not affect them. Muma et
al., (2014) examine the impact of Green Supply Chain Management on natural
Performance among tea preparing firms in Kericho County. Considering the Findings,
consider affirm that there is a positive connection between Green obtaining, and turn
around coordinations and natural execution.
Al Khattb et al., (2015) tried the effect of the green inventory network the board on
natural based promoting execution. Their chose five Jordan organizations and
disseminated 125 surveys. It has demonstrated that Green Supply chain the executives
such Green Purchasing, influenced the ecological promoting execution. Chiu and Hsieh
(2016) tried the green store network rehearses in Taiwan Restaurant and firm
exhibitions. GSCM practices and firm exhibitions are interceding with green ability and

47
their exploration presumed that Green Practices in eateries in Taiwan indirectly affect
firm execution through green capacity and featured that if it is a higher degree it will add
to the authoritative execution.
2.4.3 Eco design practices and Supply Chain Performance
Chin et al. (2015) talked about applied models which are identified with Relational
View. The GSCM rehearses are conceptualized with Green acquirement, Green
assembling, green dissemination, and green coordination. The manageability execution
is estimated through Economic, Environmental and Social execution with the directing
impact of Environmental Collaboration including trust, devotion, and reasonableness in
arrangement, responsibility. An embedded case study involving four companies, two
manufacturers and two suppliers was carried out using in-depth interviews. It enabled to
depict particularities of how these companies deal with sustainable aspects of design in
their respective business. Critical issues identified as obstacles for eco-design
implementation in these industries were: control of both, productive process, and
product durability; product distribution; rational use of space for transportation and
storage (Sellitto et al., 2017).
Mohamad and Koilpillai (2018) contemplate relationship of Green store network the
board rehearses and hierarchical execution and chose ISO affirmed organizations in
Malaysia. The investigation demonstrates that every green practice is not trailed by the
organizations the accessible assets and abilities are differ towards that GSCM usage.
Rao (2012) contends that GSCM practices ought to incorporate working cooperatively
with providers on green item plans, holding mindfulness courses, helping providers
build up their own ecological projects, etc. To green the production network, from the
viewpoint of professionals, organizations need to incorporate the thoughts of green
buying all out quality administration as far as representative strengthening, client center,
ceaseless enhancement and zero waste, life cycle examination and natural advertising (Ji
et al., 2016). The initial framework was proposed based on the review of the literature

48
associated with environmentally sustainability supply chain management, Industrial
Ecology, and Industrial Symbiosis. The initial framework is improved by corroborating
the case study company's experience, a large UK distributor. Different hierarchies in
waste management have also been considered when developing the framework (Leigh &
Li, 2015). Rao (2012) called attention to that the green inventory network the executives
exercises incorporate the association itself the green exercises and parts providers.
Green Supply Chain Management into the outside condition the executives and interior
ecological administration (Rao, 2012). Duty of senior chiefs is amazingly helpful for the
execution and reception stages for GSCM, on the grounds that without such upper
administration responsibility most projects will undoubtedly fizzle. All GSCM rehearses
are integrative and require cross-practical collaboration as opposed to just being focused
to a solitary capacity or division. They proposed that green acquiring, and eco-plan are
two rising methodologies and organizations should concentrate on the inbound or early
parts of the item store network. Transportation strategy can help stakeholders realize
certain transportation goals with less resource consumption and pollution emission.
Association's the usage of green store network the executives rehearses, and the
association's ecological execution and financial execution have the positive relations
(Zhu & Sarkis, 2004).
2.4.4 Investment recovery and Supply Chain Performance
Investment recovery shows that there is significant impact of the investment recovery on
the environmental-based marketing performance. Commitment in venture recuperation
exercises makes a decrease in transfer costs through reusing and fixing things and an
expansion in incomes through the closeout of remanufactured and reused products
(Eltayeb et al., 2011). On the other hand, venture recuperation exercises may require
one-of-a-kind capacities that vary among firms to imply an extra speculation cost. While
speculation recuperation exercises manage the finish of production network squander,

49
green buying exercises manage the aversion of waste toward the start of the store
network.
Proprietor/chiefs must guarantee that the crude materials gained from providers can be
recyclable, reusable and remanufacture empowered (Rao & Holt, 2005). This outcomes
in a cost decrease for materials bought and bring down charges for waste treatment and
release. Squander from crude materials can be changed over into an attractive state or be
utilized amid the make of new items; be that as it may, this relies upon client request.
Both green buying and speculation recuperation rehearses are related with eco-plan
rehearses (see Zhu et al., 2010).
2.4.5 Institutional Pressures and Supply Chain Performance
Zhu et al. (2013) contemplated 396 producers in China and uncovered that coercive
weights have driven the makers to embrace inside green production network the
executives rehearse. This by implication influenced their financial execution. Moreover,
Zhang et al. (2014), in their examination out and about cargo transportation industry in
Nanjing, China, found that one of the primary driving components of green
coordinations rehearses for truck armadas is coercive weight.
Zhu et al. (2013) found that in China, mimetic weight drives producers to embrace green
production network the executives rehearse that in a roundabout way influence the
monetary execution of the organizations. Liu et al. (2010) likewise revealed that
mimetic weight has a huge beneficial outcome on corporate ecological administration in
China, making the Chinese organizations have a higher affectability towards the market
factor. Along these lines, as per institutional hypothesis, mimetic weight could likewise
turn into a solid driver for the selection of green activities and thusly enhance
authoritative execution.
Zhu et al. (2013) uncovered that standardizing weight drives the Chinese producers to
receive inward green production network the executive’s practices and this by

50
implication influence their monetary execution. Additionally, Zhang et al. (2014),
reviewed the street cargo transportation industry in Nanjing, China, and found that one
of the principles driving components of green coordinations rehearses for truck armadas
is standardizing weight. Henceforth, considering the institutional hypothesis, regulating
weight could be a key determinant for the appropriation of green activities and in this
way, to improve hierarchical execution. Wongthongchai and Saenchaiyathon (2019)
found that the relationships exist among isomorphism institutional pressure, top
management support, GSCM practices, and performance. The isomorphism institutional
pressure for environmental concern has driven Thailand manufacturers to implement
GSCM practices. The results suggest that GSCM practices do significantly affect
performance by improved environmental practices. The isomorphism institutional
pressure related to GSCM practices. Though top management may require increased
environmental investment, it can be a resource for firms to gain economic benefit.
Further, top management brings collaboration with customers and suppliers which can
indirectly increase performance through environmental improvement.
A study done by Khan and Qianli (2017) investigated the impact of five determinants of
the green supply chain practices on organizational performance in the context of
Pakistan manufacturing firms. A sample of 218 firms was collected from the
manufacturing industry. The green supply chain practices were measured through five
independent variables including green manufacturing, green purchasing, green
information systems, cooperation with customers, and eco-design. By using exploratory
factor and simultaneous regression analysis, the results indicate that except green
purchasing, rests of the four independent variables have been found statistically
significant to predict organizational performance. However, the eco-design of green
practices followed by green information systems has revealed the greatest impact on
organizational performance. Therefore, the managers of the manufacturing firms should
not only implement eco-design in their supply chain but also concentrate on proper
monitoring and implementation of green information systems to increase their firms’
performance. A main contribution of this research from theoretical side is that it is

51
possible to notice a negative effect of “green purchasing” towards organizational
performance particularly in the scenario of Pakistan manufacturing industry. Another
valuable result is that green purchasing is an important antecedent of firm’s economic
performance in the US manufacturing firms (Green et al. 2012), although not
significantly related to organizational performance in our study. In addition, we also
discussed research limitations, areas for future research, and implications for
practitioners.
2.4.6 Critique of existing literature
Green production network rehearses (GSCPs) ordinarily include venture recuperation,
natural structure, green acquiring, client participation and interior ecological
administration (Chien & Shih, 2014). The quantity of studies utilizing GSCP selection as
a free factor and execution as a needy variable is less than those that utilization outer
inspirations as the autonomous variable and reception as the reliant variable. Green
supply chain management (GSCM) has in recent years been a subject of much debate
among academia and practitioners. Increased environmental consciousness has triggered
one of the greatest revolutions in human thought, uniting the entire world in a fight
against the emissions which are produced during economic activities. Manufacturing and
transportation activities are indicted as major reasons behind environmental degradation.
While there is a rich body of literature on GSCM practices, the research on GSCM
theory building is scant. One of the few studies which have used case methodology to
build theory is the seminal work of Pagell and Wu (2009), who attempted to build a
complete theory of methodology to build a complete theory of sustainable supply chain
management using multiple cases. Ketokivi and Choi (2014) have argued in their works
that in recent years there has been a significant rise in case study methodology in the
operations management field. However, most of such studies still lacks rigour in case
research. Barratt et al. (2011) argued in their research that the use of theory can lead to
better conclusions in terms of theoretical framework and insights.

52
Besides, among these investigations, the factors contrast, the discoveries are conflicting
and, notwithstanding the significance of green practices in supply chains to creating
nations, the minimum created nations are not spoken to. There is an absence of
consistency in the factors used to quantify the two practices and execution. Most
examinations on the connection between explicit GSCPs (inner natural administration,
green buying, eco-structure, speculation recuperation and client collaboration) and
execution results center around possibly one, a few GSCPs as opposed to every one of
the five practices. Execution factors in investigations of GSCP appropriation and
execution incorporate the accompanying factors, either independently or in blend:
ecological execution; money related execution (monetary advantages); financial costs;
operational execution; focused execution; social execution; showcase execution; and
immaterial execution (see Eltayeb et al., 2011; Kim et al., 2011; Yang et al., 2013).
Among the discoveries on the connections among GSCPs and execution, there is little
understanding or clarification of the clashing outcomes. For example, a few
investigations discover positive connections among training and execution (Green et al.,
2012), some negative connections but then others discover no relationship
(Laosirihongthong et al., 2013). A conceivable purpose behind these irregularities, aside
from strategy contemplations, is the distinction in settings in which the exploration is
directed, for example, national controls and industry type and market.
Appropriation of GSCP is particularly significant in creating countries where
contamination is increasingly extreme and prompts sick wellbeing, passing and
handicaps of many individuals every year (Oluwasola, 2014). Destitution, absence of
interest in current innovation, frail ecological enactment and industrialisation
consolidate to cause high contamination levels in creating nations (Oluwasola, 2014).
Industrialisation in creating nations is a high need given the requirement for basic
change from little scale horticulture to assembling to achieve comprehensive and expert
poor development (Oluwasola, 2014). For instance, apparently China would not have
accomplished its great financial development and advancement had it been worried

53
about contamination in its underlying phases of improvement (Oluwasola, 2014). The
development in research on GSCPs is dominating in creating countries, for example,
China and other Asian nations; be that as it may, a large portion of these countries are
well while in transit to improvement (Malviya & Kant, 2015). The minimum created
countries such Rwanda have not been liable to inquire about.
When discussing the relationship between GSCM practices and performance (Vanalle et
al., 2017). Every country has its own cultural, legal, ethical, political, and work behavior
issues, which can add some new dimensions into the investigation of institutional
pressures, practice implementation, and performance outcomes (Geng et al., 2017,
Vanalle et al., 2017, Sarkis, 2012). GSCM is in its evolving stage in developing
countries, and there is a dearth of empirical research related to environmental practices
and their relationship with performance (Liu et al., 2015, Seuring & Gold, 2013). To
develop a generalized theory of GSCM and to provide more specific guiding principles
for policymakers and executives, it is sine qua non to conduct GSCM research in
developing countries and strengthen the contextual dimension (Vanalle et al., 2017, Liu
et al., 2015, Jabbour, Frascareli & Jabbour, 2015). Thus, overall, there is a need for a
conceptually and theoretically rich contextual study that uncovers the rationale for
GSCM practices and the impact of GSCM practices on economic and environmental
performance.
2.5 Research gaps
The writing audits have explained in subtleties the GSCM rehearses just as the different
investigations done in the region of GSCM. Advantages of buying in to the GSCM
rehearses are additionally referenced. They show that there is a positive connection
between GSCM practices and execution of firms for example store network execution,
monetary and natural execution. An examination done by Rha (2010) concentrated on
assembling firms where he prescribes inquire about on the equivalent ought to be done
and different practices ought to be incorporated and furthermore in various firms. The

54
writing audit through speculations clarifies the connections between GSCM rehearses
and the firms‟ execution. They additionally depict different advantages a firm gain by
buying in to GSCM. Absence of generally acknowledged structure on what to consider
and what not to consider in operational execution is one more test. It has likewise
unmistakably shown that there is an absence of one-way or all-around satisfactory
system on the GSCM rehearses. Therefore, associations receive distinctive practices that
suit their authoritative needs. In such manner, the GSCM practices and its effect on
execution of a firm are resolved. The writing audit gives us learning of the GSCM
practices and its suggestions on execution of firms. The inquiry we inquired as to
whether there were changes in operational execution in the agro-manufacturing in
Rwanda if GSCM rehearses are received? Were ecological and financial advantages
related with the GSCM rehearses pertinent for our situation?
2.6. Summary of Literature Review
Among the many academic articles, there is still a notable gap in this research study that
has been undertaken to date in the context of financial risk management which will help
firm to improve on financial performance. This study therefore aims at investigating and
widening their scope on the impact of green supply chain to the supply chain
performance of Agri-manufacturing firms. The study will provide scholars with useful
information on how to avert the exposure in their research. It will also be of use to
supply chain managers who have the responsibility of adopting and implement GSCM.
To this end most research on the impact of GSCM on supply chain performance has
focused on the exposure of multinational companies and most of the focus has been
other manufacturing institutions. This chapter has discussed theories relating to GSCM
and supply chain performance, presented a diagrammatical and empirical relationship
between GSCM practices and supply chain performance.

55
CHAPTER THREE
RESEARCH METHODOLOGY
3.1 Introduction
This chapter describes the research methodology as follows; study area, philosophical
foundation, research design, target population, sampling procedures used to get the
appropriate sample size, data type and collection procedure, reliability and validity,
measurements of variables, data analysis, limitations of study and ethical considerations.
3.2 Research Design
This study employed both cross-sectional and explanatory research design as it seeks to
describe and establish associations among key study variables, namely, effect of green
supply chain adoption on supply chain performance of Agri-Manufacturing firms in
Rwanda. The study used a cross-sectional survey as data was collected at a given point
in time (Creswell, 2014). The design is suitable where the study seeks to describe and
portray characteristics of a phenomenon. It also enables the study to profile the sample
of a population by collecting accurate information (Houghton et al., 2013). Cross-
sectional survey is appropriate for the study in that the data collected from HODs during
one period can be generalized to the whole population. Additionally, cross-sectional
studies have been found to be robust for effects of relationships studies (Yan et al.,
2019). The study adopted explanatory design since it uses theories and hypothesis to
account for the forces that caused a certain phenomenon to occur (Cooper & Schindler,
2011).
The design is also considered appropriate for the study as it allowed the survey to be
carried out in the natural settings and permitted the study to employ probability samples.
This allowed for statistical inferences to be made to the broader populations and permit
generalizations of findings to real-life situations, thereby increasing the external validity

56
of the study (Hubbard, Haig & Parsa, 2019). The probability sample minimizes bias and
enhances reliability of data. Additionally, the design allowed use of questionnaires and
thus use of inferential statistics in establishing the significant relationships between the
variables (Devid & Muthini, 2019).
3.3 Philosophical Foundation of the Study
This study is in line with positivism approach, which seeks to use existing theory to
deduce and formulate variables, assume hypotheses that are tested and established
wholly, in part, or otherwise refuted leading to further development of theory to be
tested with future research. Pearlson and Saunders (2013) affirms that through
positivism the study is concerned with proofs and not impressions that could be studied
empirically. The positivist paradigm emphasizes that genuine and factual occurrences
could be studied and observed scientifically and empirically (Aliyu et al., 2014). The
scientific approach to research consists of the familiar process of proposing hypotheses
as explanations of phenomena and then collecting data to scientifically test the
hypotheses. Therefore, the study derived variable, constructs and formulated hypotheses
based on existing theories of logistic capabilities and then statistically verify through
rational investigation and analysis.
3.4 Target Population
The target population was the employees from 67 agri-manufacturing firms in the
department of supply chain management (REMA, 2018). The target population for a
survey is the entire set of units for which the survey data are to be used to make
inferences. Thus, the target population defines those units for which the findings of the
survey are meant to generalize. Establishing study objectives is the first step in
designing a survey. Defining the target population should be the second step. Target
populations must be specifically defined, as the definition determines whether sampled
cases are eligible or ineligible for the survey. The geographic and temporal
57
characteristics of the target population need to be delineated, as well as types of units
being included. In some instances, the target population is restricted to exclude
population members that are difficult or impossible to interview (Lavrakas, 2010). The
employees in agro-processing firms in Rwanda are over twenty thousand. This invoked
the use of representative population, where 536 people from 8 branches of supply chain
department were used to make a population of 536 people from which the sample size
was calculated.
3.5 Sampling Frame
A sample frame consists of a list of items from which a sample is to be drawn. The
sampling frame consisted of the entire employees in supply chain department of the
Agri-manufacturing firms in Rwanda as shown in table 3.1. A representative sample was
selected from the sampling frame.
3.6 Sampling Design and Procedures
The procedure of sampling comprises using a portion of a population to make inferences
about the whole population (Zikmund et al., 2010).
3.6.1 Sampling Design
The sample was drawn from the agri- manufacturing sector in Rwanda. A list of all agri-
manufacturing firms was obtained from the Rwanda Standard Board (2018), see
sampling frame Appendix III. Cluster sampling combined with simple random sampling
technique was used to select sampled respondents from the representative population of
567 employees from 67 in Rwanda. The employees were divided into clusters-based
employee cadre. Each employee was assigned a unique identifying number and simple
random sampling was used to select the firm in each cluster. This method of sampling
gives each unit in the population a known chance of selection.

58
Probability sampling was used for this study. Probability samples keep sampling error
low and generally offer a sample which can be seen to be representative. This is an
appropriate way to draw a sample from a small population (Zikmund et al., 2010). Once
the firms were selected, employees from supply chain department were picked, to be
included in the study the respondent would be among 8 branches of supply chain
department.
3.6.1 Sample Size
The sample size determines the statistical accuracy of the findings. Sample size is a
function of change in the population parameters under study and the estimation of the
quality that is needed by the study. The sample size of this study was computed based on
the following formula as proposed by Gall et al. (2014):
]25.0[)]1([
25.022
2
XZNXd
XNZn
=
]25.096.1[)1536(05.0[
25.096.15362
2
XX
XX
=226
Were.
n = sample size
N= total population size (known or estimated)
d= precision level (usually .05 or.10)
z= number of standard deviation units of the sampling distribution corresponding to the
desired sample size
To determine the number of employees per category, the study applied cluster and
simple random sampling proportionate to the cluster size as indicated in Table 3.1
below. According to Meysamie et al. (2014) calculations, a sample population of 67
firms results in 226 as respondents.

59
Table 3.1: Sample Size per category
Employee category Population sample size
Operations Manager 67 28
Chief Supply Chain Officer 67 28
Logistics Specialist 67 28
Supply Technician 67 28
IT Technician 67 28
Production Technician 67 30
Returns Specialist 67 28
Procurement specialist 67 28
Total 536 226
3.7 Data Type and Data Collection Procedure
This study collected both secondary and primary data, but mainly primary data using a
structured questionnaire.
3.7.1 Sources and Types of Data
Primary data was collected using a structured questionnaire whereby three
questionnaires was given to each of the sampled manufacturing firms to generate
qualitative data, to achieve the study objectives. The questionnaire in each firm was
answered by employees in supply chain department. In the absence of any of the stated
employees, similarly senior managers in the firm were sampled. Questionnaires was sent
to all sampled employees, who deal directly with supply chain management activities
daily and can develop relationships strategic decision on supply chain performance.
These employees were knowledgeable key informants, since they are the direct entities
in most cases responsible for supply chain performance.
The choice of the several employees was informed by Marolt et al. (2020) and Fain et
al. (2019), who suggested that it is more beneficial to collect data from multiple intra-
60
organizational respondents. Further, Ketokivi (2019) recommend that when using
subjective measures of performance, data be collected from multiple respondents. This is
a practice that is intended to improve validity and reliability. Secondary data was
obtained from the Rwanda Manufacturing Association or firm website Web page or the
NISR.
3.7.2 Data Collection Procedure and Instrument
The researcher obtained a research approval authorization letter from University
facilitate acquisition of permission to carry out the studies. Then the researcher,
proceeded to the country trade Officer in respective countries to seek the consent to
conduct the research. Once the permission is granted, the researcher was arranged to
visit each of the randomly selected firms for familiarization purposes and to seek
permission from the management concerning the intended of data collection within their
firm. Respondents were informed about the purpose of study and were assured of
confidentiality of their responses. The researcher then trained research assistant and
supervisors during actual data collection where questionnaire was distributed to the
selected respondents. The instructions on how to fill the questionnaires was carefully
explained to the respondents. Sufficient time was allowed for them to respond to the
instruments accurately. After responding to the questionnaires, the researchers had then
collected them for data analysis and thanked the respondents.
The employees understanding of the questionnaire tool, items and terminology was
assessed during the pilot study. A drop-off and pick-up technique were employed to
enhance the response rate (Allred and Ross-Davis, 2011). Prior to dropping off the
questionnaires, the manufacturing firms were contacted requesting them to participate.
The questionnaire was sent with a cover letter explaining its importance and stating that
the responses were confidential.

61
After introducing the study and giving the questionnaires, the employees was allowed a
maximum of three days to fill up before the completed questionnaires was picked up by
a research assistant. During the collection of the questionnaires, a note was sent to thank
participants and at the same time encouraging those that had not responded. A follow
update was agreed upon (Zhang, 2015). Respondents was asked to rate their firm in
comparison with their competitors in the same industry over the last three years on each
measure of performance. Firm performance was measured using the following
dimensions: customer satisfaction, customer retention and sales growth.
3.8 Validity and Reliability of Research Instrument
Validity is attained by aligning the content of the questionnaire with the research
objectives (Van Tonde and Ehlers, 2011). Validity test must produce information that is
not only relevant but also free from systematic errors.
3.8.1Validity of Study Instrument
Validity refers to the accuracy of a measurement instrument and to the extent to which
the instrument measures what it is intended to measure (Zikmund et al., 2010). It also
refers to the extent to which a specific measure is free from systematic and random
errors (Patrescu, 2017). There are two types of validity, including internal and external
(Van Tonde & Ehlers, 2011). External validity refers to the extent to which the results of
the study could be generalized to other research settings and other samples. In this study,
to ensure external validity, the results were generalized to other Agri-Manufacturing
firms’ settings and other emerging economies. Additionally, the following kinds of
internal validity were ensured, namely, content and construct validity.
Content validity refers to the extent to which a research instrument adequately covers the
constructs under study. Content validity was ensured in various ways to include First,
content validity was achieved by seeking opinion of experts (study supervisors). As far
as construct validity is concerned, Treiblmaier and Filzmose (2011) asserts that it is the

62
extent to which a measurement instrument is grounded in theory. This means that the
instrument must have existing conceptual or theoretical bases in the literature. In this
study, construct validity was assured by deriving dimensions of financial management,
financial innovation, and firm performance from existing literature.
Consequently, the questionnaire tool adopted was aligned with the research objectives.
Further, essential adjustments were made to the questionnaire based on feedback
obtained from the pilot study. Similarly, a large sample size was used to boost the
accuracy of the results. Treiblmaier and Filzmose (2011) further postulates that other
aspects of construct validity are convergent and discriminant validity. This was ensured
through Exploratory Factor Analysis (EFA). Dikko (2016) posits that factor analysis
basically involve four stages as follows; First, preparation of correlation matrix which is
the number in main distance of matrix called communality. Second, factor extraction
which is getting the main factors that have caused changes in the proposed variable. This
may be done through commonly used methods like the Principal Component Analysis
(PCA), maximum likelihood, principal axis factoring and least Square, among others.
This study used PCA as the extraction method.
Third, the selection and rotation of factors. Factor loading for each item in the factor
matrix which shows the amount of correlation each item has is analysed through PCA,
used together with variance maximization (varimax) rotation and Kaizer normalization.
This brings out easy interpretation as only components with Eigen values greater than 1
are extracted and renamed accordingly as recommended by Hair et al. (2010).
Finally, a statistical test of sampling adequacy using by Kaiser-Meyer-Olkin (KMO) was
used to indicate the proportion of variance in the variables that might be caused by the
underlying factors. The value of 1.0 is regarded as useful for factor analysis.
Consequently, Bartlett’s tests of Sphericity were used to check the hypothesis which
states that the correlation matrix is an identity matrix. If the variables are unrelated then
it is an indication that they are unsuitable for structure detection. Accordingly, Hair et al.

63
(2012) recommends that values of less than 0.05 indicate that the data is good for factor
analysis.
3.8.2 Reliability of Study Instrument
Reliability is a pointer of a measures’ internal consistency (Zikmund, 2010). Before
commencement of the main field work, filtering of the measurement scales started with
computing reliability coefficient (Cronbach’s alphas) in accordance with Du Plessis
(2010) recommendations. The questionnaires were pilot tested amongst the respondents
in selected firms. These Agri-Manufacturing firms and employees was considered to
possess characteristics like the ones in actual survey. However, respondents from pilot-
tested firms were not part of the study as this would have introduced assessment biases.
Connelly (2011) recommends that a pilot study sample should be 10% of the projected
sample for research. Equally, similar recommendations are by Cooper and Schilder
(2011); Creswell (2014).
Therefore, pilot test for this study consisted of 2 Agri-Manufacturing firms a randomly
selected. The responses from 10 employees in each of the 2 Agri-Manufacturing firms
was coded, summed, and entered in the SPSS and a Cronbach alpha (α) coefficient test
of reliability was calculated based on a threshold of at least 0.7 as recommended by Hair
et al. (2006). To determining the reliability of the study constructs, the Cronbach's alpha
test was conducted on all the scales, using a 0.70 cut-off point which is recommended as
commonly acceptable (DeVellis, 2012). The reliability statistics for the questionnaire are
presented in Table 4.30. The closer the Cronbach's alpha is to 1, the higher the internal
consistency reliability (Sekaran & Bougie, 2010).
The rationale for the assessment is that the individual items in each scale should all be
measuring the same construct and thus be highly inter-correlated. A questionnaire with a
good internal consistency should have high alpha coefficients (Hair et al., 2010). The

64
study results indicated that the minimum required Alpha values of 0.70 was exceeded in
all the cases, signifying that the instrument used was reliable.
3.9 Data Analysis and Presentation
Data analysis was performed with the aid of SPSS version 22.0 (Hayes & Montoya,
2017) using both descriptive and inferential statistics. Descriptive analysis was done for
comparison of means, frequency distribution, standard deviation, skewness, and Kurtosis
values and are discussed as follows.
Initial, normality of the study variables was assessed using skewness and Kurtosis
values. The range of -1.96 to 1.96 for skewness and -3 to 3 Kurtosis as suggested by
Ghasemi and Zahediasl (2012) was used to detect the existence of skewness and
Kurtosis, respectively. Missing value analysis was conducted as recommended by
Tabachnik and Fidell (2013). Equally, both cases of outliers (univariate and
multivariate) were dealt with as recommended by Tabachnik and Fidell (2013).
Distances of cases from the centroid of remaining cases created at the intersection of
means of all variables were used to inspect multivariate outliers. Consequently,
Mahalanobis Distances was calculated using IBM SPSS Regression by evoking
Mahalanobis D2 values. A case was therefore deemed a multivariate outlier if p-value
related with Mahalanobis chi-square value was below 0.001.
Scale reliability and validity was assessed using Cronbach’s coefficient alpha and factor
analysis. To test the linear relationship and usability of variables in regression analysis,
correlation analysis was done using Pearson’s Product Moment Correlation (PPMC).
We used the Harmon’s factor test to examine whether common methods variance in the
predictor and outcome variables inflates the empirical relationship among variables
(Podsakoff et al., 2012).

65
3.9.1 Model Specification
Model 1and 2 specified below sought to establish effect of control variables and direct
effects of GSCM dimensions variables against supply chain performance, respectively.
......................0 Cy ………………………………………...… Model 1
................55443322110 xxxxxCFP …………. Model 2
Where:
Y is dependent variable (Agri-Manufacturing firm’s supply chain performance)
X1 is independent variable # 1 (internal environment management)
X2 is independent variable # 2 (green purchase)
X3 is independent variable # 3 (eco design practices)
X4 is independent variable # 4 (investment recovery)
C is control variable.
β0 is a constant
ε is Error term (random variation due to other unmeasured factors).
Moderation Test
To perform mediated hierarchical regression, each dependent variable underwent a
series of steps to determine if mediation existed and if that mediation was partial or full.
Research by Hair et al. (2010), was applied. The steps are as follows: 1. The control
variables (C) was entered into the model as block one, then the independent variables
(X) were entered into the model as block two and regressed on the dependent variables
(Y). 2. The control variables (C) was entered into the model as block one, then the
mediator variable (Z) was entered into the model as block two and regressed on the

66
dependent variable (Y). 3. The control variables (C) was entered into the model as block
one, then the independent variables (X) were entered into the model as block two and
regressed on the mediator variable (Z). 4. If steps 1–3 produced significant models,
control variables (C) were entered into the model as block one, then the mediator
variable (Z) was entered into the model as block two, and then the independent variables
(X) was entered into the model as block three and regressed on the dependent variable
(Y). If a significant model for step four resulted, partial mediation existed, whereas, if a
non-significant model resulted, full mediation existed.
Further, the third sub-hypotheses of the fifth hypothesis sought to establish the
moderating effects of institutional pressures on specific GSCM techniques -
performance relationship. That is, would show the effect of institutional pressures
strengthen or weaken the relationship between GSCM techniques and firm performance
in an intensely financial innovation than in a less competitive one.
The hypotheses were tested using moderated regression analysis to establish the extent
that the moderator variable affects the relationship between the specific GSCM and
performance. The moderator effect was examined using regression analysis procedures
as outlined by Tingley et al. (2014); Aiken and Karazsia et al. (2014). The moderating
effect of institutional pressures on firm performance relationship respectively, was
consequently assessed using the following models.
............................................Model 3
....................... Model 4
.... Model
5

67
Where: -
Y is dependent variable (firm performance)
Y is dependent variable (Agri-Manufacturing firm’s supply chain performance)
X1 is independent variable # 1 (internal environment management)
X2 is independent variable # 2 (green purchase)
X3 is independent variable # 3 (eco design practices)
X4 is independent variable # 4 (investment recovery)
M is moderating variable (institutional pressures)
β0 is a constant
ε is Error term (unexplained variation due to other unmeasured factors).
3.9.2 Hypothesis Testing
Multiple regression analysis is used to predict the value of dependable variable based on
the value of two or more independent variables. The study hypotheses were therefore
tested using multiple regression analysis where the significant level was set at 0.05. The
null hypotheses were either rejected at p<0.05 level, otherwise fail to reject at p>0.05
level.
3.9.3 Underlying Assumptions of Multiple Regression Model
A regression model is a mathematical representation of what and how independent
variables are related to the dependent variables. All regression models have assumptions,
and violation of these assumptions can lead to unreliable results. The following
assumptions that underline multiple regression model of analysis was assessed:
i. Normality is the assumption that the scores on a continuous variable are
normally distributed about the mean, (Silverman, 2016). Normality of

68
independent variables was tested using mathematical methods. The
normality of distribution was inspected using the degree of Skewness and
kurtosis of variables. Similarly, the normality of distribution was also
checked by use of Kolmogorov-Smirnov test.
ii. Linearity refers to the degree to which the change in the dependent
variable is related to change in the independent variables (Hair et al.,
2010). Linearity between the dependent variable and each independent
variable was tested using PPMC. The goal was to assess the strength of
linear relationships among variables.
iii. Homoscedasticity refers to the assumption that dependent variable
exhibits similar amounts of variance across the range of values for
independent variable around the regression line, meaning they have equal
spread. The Levene’s statistic for equality of variances would be used to
test for the assumption of homoscedasticity.
iv. Multi-Collinearity refers to the presence of high correlations between
independent variables (Ali et al., 2013). In this study, multi-collinearity
was assessed by means of tolerance and Variance Inflation Factor (VIF)
values. Normally, a tolerance value of below 0.10 or a VIF value greater
than 10 reveals serious multi-Collinearity problem (Leech et al., 2011).
Tolerance indicates the amount of variability of the independent variable
not explained by other independent variables, whereas VIF is the inverse
of tolerance statistic.
v. No autocorrelation – linear regression analysis requires that there be little
or no autocorrelation in the data. Autocorrelation occurs when the
residuals are not independent from each other. This study used Durbin-
Watson test to check for autocorrelation.

69
CHAPTER FOUR
RESEARCH FINDINGS AND DISCUSSIONS
4.1 Introduction
The study employed different statistical techniques aided by SPSS to determine effects
of green supply chain adoption on supply chain performance: survey of Agri-
Manufacturing Firms in Rwanda. This chapter describes the data analysis, presentation,
and interpretation of the findings. The findings relate to the objectives that guided the
study. The chapter begins with the bio data, results on the objectives, then explains
factor analysis and reliability techniques adopted by the study, correlation, and
regression analysis. Factor analysis was adopted to reduce the number factors under each
research variable and retain the indicators capable of explaining effects of green supply
chain adoption on supply chain performance: survey of Agri-Manufacturing Firms in
Rwanda. Reliability analysis was carried out using Cronbach alpha which is a coefficient
of reliability that gives an unbiased estimate of data generalizability.
4.2 Data preparation and Screening
The survey was first screened for response rates and missing values. It was necessary to
establish whether the response rate was sufficient to allow for generalizations of the
study.
4.2.1 Response Rate
Response rate also known as completion rate in survey research refers to the number of
respondents who answered the survey divided by the sample size. Babbie (2007) posits
that a survey response rate is viewed as an important indicator of survey quality and it is
presumed that a higher response rate ensures more accurate survey results. The study
distributed 226 questionnaires to the respondents. Out of which 220 questionnaires from

70
226 were returned. However, of the 220 returned, a total of 212 were reasonably and
adequately completed representing approximately 93.8% response rate (Table 4.1). This
response rate falls within the confines of a large sample (n ≥ 30). Additionally, the
response rate was deemed satisfactory as suggested by Fowler (1993) who recommends
75% as a rule of the thumb for minimum responses. Further, regarding the works of
Jaworski and Kohli, (1993); Prasad et al. (2001), this response rate is considered
satisfactory and is comparable to research on similar topics in marketing.
Table 4.1: Response Rate of Questionnaires
Responses No. Percentages
Administered questionnaires 226 100%
Returned 220 97.3%
Unusable questionnaires 8 0.04%
Usable questionnaires 212 93.8%
.
4.2.2 Missing Values Analysis
Studies have shown that missing values are a common occurrence in social research
(Hayes, 2012). As noted by Fichman et al. (2005), missing values can seriously affect
results of statistical analysis. Consequently, the study attempted to eliminate or reduce
missing values right from the field. The research assistants personally delivered each
questionnaire to firm managers. Thereafter, a time and date to return and collect the
questionnaire was agreed upon. To ensure that the questionnaire was completed, a
follow-up phone call was made prior to the second visit. In case the completed
questionnaire was still not available, a second visit was arranged to encourage
participation. Personalized thank-you notes were delivered when the questionnaires were
collected. Missing values were evaluated with respect to both cases and variables.

71
Initially, missing values were evaluated with respect to cases and their distribution as
shown in Table 4.2. Most cases had non-missing (96.4%) values and 3.5% had missing
values.
Table 4.2: Distribution of the Number of Missing Values on Cases
Number of missing values Number of cases Percentage
0 212 96.4
1 5 2.2
2 1 0.4
3 2 0.9
Total 220 100.0
Thereafter, missing values were assessed with respect to variables. Table 4.3 shows the
number of missing values by variables. 55 variables did not have missing values while 7
had only minimal missing values. Specifically, 3 variables had one missing value and 4
variables had one missing value. These were deemed useable and missing data were
replaced with mean substitution before further analysis was conducted (Tabachnick &
Fidell, 2013).
Table 4.3: Distribution of the Number of missing Values by Variables
Number of missing values Number of variables
0 55
1 3
2 4
4.2.3Analysis of Outliers
An outlier is a point that is far from observing other observations. Outlier may be due to
variation in the measurement and can perhaps show an experimental error (Churchill Jr.
& Iacobucci, 2004). The latter is sometimes excluded from the data set. There is high
tendency of outliers in any random distribution, but they are often indicative either of

72
measurement error or that the population suffers hard-tail distribution. Scrutinizing
outliers is an important step because skipping initial examination of outliers can distort
statistical tests if there happens to be problematic outliers (Hair et al., 2010). It distorts
statistics and may lead to results that do not generalize to certain sample except one with
the same type of outliers (Tabachnick & Fidell, 2013).
In line with the recommendation of Tabachnick and Fidell (2013) this study used
Mahalanobis D2 measure to identify and deal with multivariate outliers. Additionally,
handling multivariate outliers would take care of univariate outliers. However, treating
univariate outliers would not necessarily take care of multivariate outliers (Hairet al.,
2010). Hence, Mahalanobis D2 were calculated using linear regression methods in SPSS,
followed by the computation of the Chi-square value. Given that 4 items were used, 3
represent the degree of freedom in the Chi-square table with p < 0.001, (Tabachnick &
Fidell, 2013). This means that any case with a probability Mahalanobis D2 value of less
than 0.001 is a multivariate outlier and should be removed. Therefore, cases with a value
of less than 0.001 were excluded from further analysis.
4.2.4 Reliability analysis
Reliability analysis was done with the use of Cronbach’s Alpha which measures the
internal consistency by establishing whether certain items within a scale measure the
same construct. Nunnally (1978) recommends that instruments used in research should
have reliability of 0.70 and above, thus forming the study’s benchmark. Cronbach Alpha
was established for every objective which formed a scale. The table below shows that
Institutional Pressure had the highest reliability (α=0.837), followed by Eco Design
(α=0.762), Green Purchasing(α=0.741), supply chain performance (α=0.717) and
internal environment management (α=0.655). Other than internal environment
management, the other scales were reliable as their reliability values exceeded the
prescribed threshold of 0.7.

73
Table 4.4: Reliability analysis
Cronbach's
Alpha
Cronbach's Alpha Based
on Standardized Items
N of
Items
Internal environment
management 0.655 0.701 8
Green Purchasing 0.741 0.73 9
Eco Design 0.762 0.756 10
Investment Recovery 0.772 0.774 7
Institutional Pressure 0.837 0.84 10
Supply chain adoption on the
performance of agri-
manufacturing firms 0.717 0.76 8
4.3 Sample Characteristics
4.3.1 Firm years of operation
Table 4.5 illustrates the results on firm age. From the results, 32.7% (70) of the
respondents noted that the firms have been in operation for a period ranging a year to 3
years, 27.6% (59) for 4 to 7 years, 24.3% (52) for over 15 years and 7.5% (16) for 8 to
11 years. On average, most of the firms have been in operation for a period ranging from
a year to seven years. As a result, the firms are likely to have better supply chain
performance because they are more experienced and enjoy the benefits of “learning by
doing” (Coad et al., 2013; Vassilakis, 2008).

74
Table 4.5: Firm Years of Operation
Frequency Percent
1-3 years 70 32.7
4-7 years 59 27.6
8-11 years 16 7.5
12-15 years 17 7.9
Over 15 years 52 24.3
Total 214 100
4.3.2 Firm size
Firm size was measured by assessing the number of employees in the firms as shown in
table 4.6. From the results, 63.1% (135) of the respondents noted that their firm has
between 1 to 100 employees, 21% (45) between 101 to 200 employees, 9.8% (21)
between 201 to 300 employees while 6.1% (13) of the respondents stated that their firm
has between 301 to 400 employees. Generally, most of the firms are small as evidenced
by employees ranging from 1 to 100.Since the firms are small, it could be that they lack
the market power possessed by large firms in charging higher prices thereby earning
more profits. They could also lack stronger negotiating power that provides larger firms
more favourable financing conditions.
Table 4.6: Firm Size
No of employees Frequency Percent
1-100 135 63.1
101-200 45 21
201-300 21 9.8
301-400 13 6.1
Total 214 100

75
4.4 Descriptive Statistics for Study Constructs
Respondents were asked to provide information regarding their level of agreement to
items concerning internal environment management, green purchasing, eco-design,
investment recovery, institutional pressure, and supply chain performance.
4.4.1 Internal Environment Management
The study deemed it important to establish the effect of internal environment
management practices on supply chain performance among Agri-Manufacturing Firms
in Rwanda. Table 4.7 highlights the results. Basing on the results, the firm senior
managers are committed to GSCM (Mean = 4.51, SD = 0.551). In that way, top
management support is a step further towards ensuring that there is commitment to
GSCM. Other than that, there is also support for GSCM from the mid – level managers
(mean = 3.94, SD = 0.882).
Besides, the firm has teams responsible for environmental improvements (mean = 4.05,
SD = 0.732). The implication is that there is special dedication to environmental
improvement by the firms which is key in ensuring the attainment of superior green
supply chain management.
Moreover, the firm has total quality environmental management (mean = 4.24, SD =
0.799). On the same note, there is ISO 14001 certification for complying with
environmental compliance and auditing programs (mean = 4.00, SD = 0.884). The
results suggest that the firms in question comply with the quality standards pertaining
environmental management.
In addition, the firm supports environmental regulations (mean = 4.04, SD = 0.561). The
only challenge is that there is no emphasis on Eco labeling of products (mean = 2.56, SD
= 1.409). This is an area that needs urgent attention if supply chain performance is to be
enhanced.

76
Table 4.7: Internal Environment Management Distribution
Statement Mean
Std.
Deviation Skewness Kurtosis
The firm senior managers are committed to
GSCM 4.51 0.551 -0.704 0.58
The firm mid-level managers support for
GSCM 3.94 0.882 -0.828 1.165
The firm has teams responsible for
environmental improvements 4.05 0.732 -0.73 1.758
The firm has total quality environmental
management
4.24 0.799 -1.257 2.323
The firm has ISO 14001 certification for
complying with environmental compliance
and auditing programs 4.00 0.884 -0.308 -1.027
The firm has environmental management
systems 3.92 0.936 -0.61 -0.283
the firm emphasizes for Eco-labeling of
Products 2.56 1.409 0.266 -1.388
The firm support for environment
regulations
4.04 0.561 -0.709 1.165
Internal environment management 3.8777 0.48356 -0.868 2.17
Overall, the findings on internal environment management summed up to a mean of
Neutral=3.8777, standard deviation of 0.48356, skewness of -0.868 and kurtosis of 2.17.
The implication is that the respondents were agreeable on most of the items on internal
environment management. There was also less variations in the responses as indicated
by the standard deviation. The extant literature has also indicated that programs
encompassing GSCM and CLSC practices are not for the faint hearted hence the need
for top management support for successful implementation (Matthews, 2014; Seitz and
Peatty, 2014). Similarly, the literature has indicated that the top management must be
fully committed if progress is to be realized in environmental management. As well,
support from the mid – level managers are key in the implementation of environmental
practices (Carter et al., 2018; Bon et al., 2011).

77
4.4.2 Green Purchasing
Table 4.8 highlights the results on Green Purchasing. The study established that the
firms provide design specifications to suppliers that include environmental requirements
for purchased items (mean = 3.78, SD = 0.914) with mean of 3.78 implying that a higher
proportion of the respondents agreed to the statement. Consequently, the firms ensure
that the supply chain partners adhere to environmental requirements for the specific
products that they supply. Besides, the firm cooperates with its suppliers for
environmental objectives through sharing ideas most of the interviewees agreed to the
statement at (mean = 3.74, SD = 1.099).
Moreover, across the variables higher proportion of respondents agreeing to the
statement at means ranging from 3.5 - 3.9 firm does audit on environmental suppliers’
internal management (mean = 3.86, SD = 0.875) and it ensures that it only deals with
suppliers with ISO1400 certification (mean = 3.64, SD = 0.924). Furthermore, the firm
cooperates with customers for both cleaner production (mean = 3.62, SD = 0.862) and
green packaging (mean = 3.49, SD = 0.949).
To sum up, the results on Green Purchasing summed up to a mean of 3.8629 implying
that most of the respondents agreed with Green Purchasingand a standard deviation of
0.50137, Skewness 0.337 and kurtosis 0. 191. The implication is that the respondents
agreed on most items on green purchasing. As well, there were less variations in the
responses as indicated by the standard deviation. The study findings are in line with that
of Diab et al., (2014) which tested the effect of green Purchasing on organizational
performance and established that green purchase had an influence on organizational
performance, which are environmental performance, financial performance, and
operational performance.

78
Table 4.8: Green Purchasing distribution
Statement Mean
Std.
Deviation Skewness Kurtosis
The firm provide design specification to
suppliers that include environmental
requirements for purchased item 3.78 0.914 -0.323 -0.511
The firm cooperate with its suppliers for
environmental objectives through sharing
ideas 3.74 1.099 -0.239 -1.293
The firm does audit on environmental for
suppliers’ internal management 3.86 0.875 0.08 -1.097
The deals with Suppliers’ with ISO1400
certification 3.64 0.924 -0.396 0.051
The firm cooperate with customers for
cleaner production 3.62 0.862 -0.396 -0.233
The firm cooperate with customers for
green packaging 3.49 0.949 -0.157 -0.438
Green Purchasing 3.8629 0.50137 0.337 0.191
4.4.3 Eco Design
As part of the objectives, the study sought to ascertain the effect of eco design practices
on supply chain performance among Agri-Manufacturing Firms in Rwanda. Table 4.9
illustrates the findings. Across the eco design practices, variables had higher proportion
of respondents agreeing to the statement at means ranging from 3.2±1.31 – 4.01±0.94.
Evidently the firm designs its products for reduced consumption of material/energy
(mean = 3.84, SD = 0.72). On the same note, the firm designs its products for reuse,
recycle and recovery of material (mean = 3.74, SD = 0.91).

79
Moreover, the firm designs its products to avoid or reduce use of hazardous products
(mean = 3.97, SD = 0.84). Similarly, the firm designs its products for support regulation
(mean = 3.74, SD = 1.04). However, it is undefined whether the firm designs products
that weigh the least capacity for decreased time taken and the energy during
transportation (mean = 3.17, SD = 1.31).
Furthermore, the firm designs its products in such a way that they are easy to set up by
the users and at the same time energy saving (mean = 3.76, SD = 0.96). Finally, the firm
design usability of part particularly for extend using products, repair easy and increase
efficiency (mean = 4.01, SD = 0.94). In general, the findings on Eco Design summed up
to a mean of 3.86, standard deviation of 0.56, skewness 0.28 and kurtosis -0.6.

80
Table 4.9: Eco Design Distribution
Statement Mean
Std.
Deviation Skewness Kurtosis
The firm design its products for reduced
consumption of material/energy 3.84 0.72 -0.3 -0
The firm design its products for reuse, recycle,
recovery of material, component parts 3.74 0.91 -0.1 -0.9
The firm design its products to avoid or
reduce use of hazardous of products and/or
their manufacturing process 3.97 0.84 -0.9 1.54
The firm design its product for support
regulation 3.74 1.04 -0.4 -0.9
The firm design its products that weight and
the least capacity for decrease taking time, the
area stores, and the energy between the
transportation leas 3.17 1.31 -0.2 -1.1
The firm design it is the products to be easy
set up for the users in the most energy saving
way 3.76 0.96 0.05 -1.3
The firm design usability of part particularly
for extend using products, repair easy and
increase efficiency 4.01 0.94 -0.9 0.56
Eco Design 3.86 0.56 0.28 -0.6
4.4.4 Investment Recovery
This section of the analysis highlights the results on Investment Recovery. The findings
are as presented in table 4.10. Across the investment recovery variables had most of the
respondents agreeing to the statement at means ranging from 3.43±1.11 – 3.80±0.98. It
is evident from the results that the firm sales its excess inventories/ materials (mean =
3.71, SD = 1.223). Also, the firm sales its scrap and used materials (mean = 3.68, SD =
1.439). Excess capital equipment is also sold (mean = 3.43, SD = 1.11).
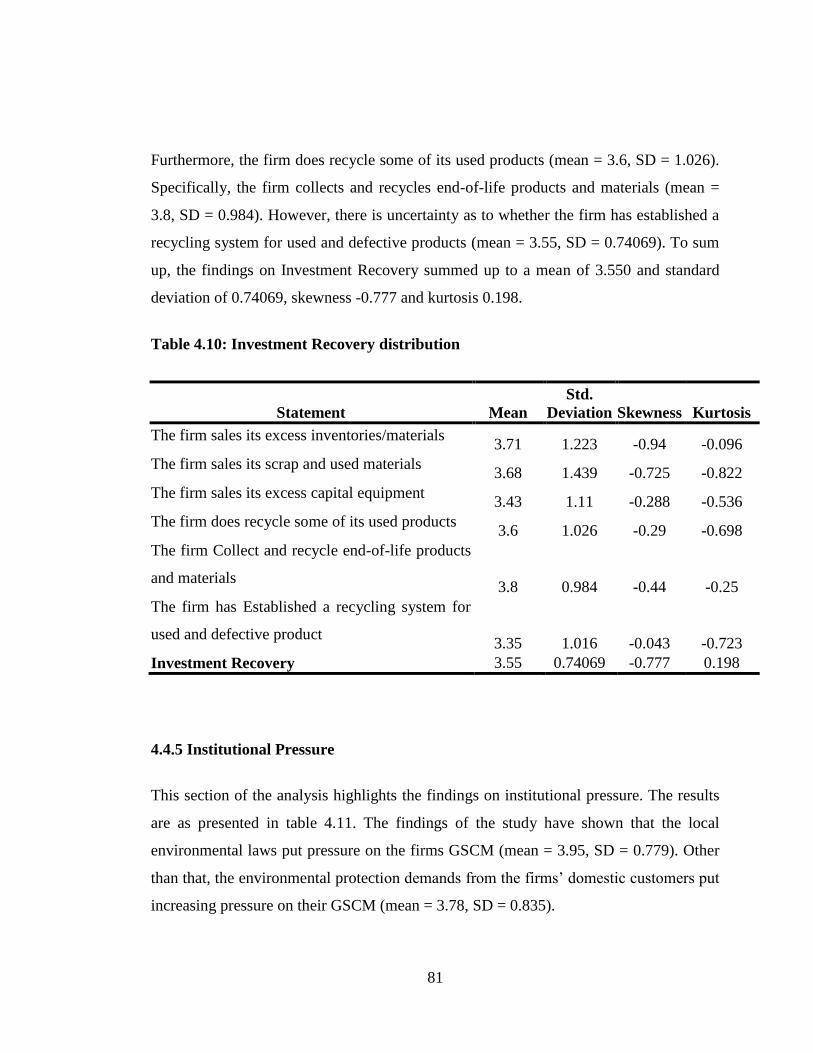
81
Furthermore, the firm does recycle some of its used products (mean = 3.6, SD = 1.026).
Specifically, the firm collects and recycles end-of-life products and materials (mean =
3.8, SD = 0.984). However, there is uncertainty as to whether the firm has established a
recycling system for used and defective products (mean = 3.55, SD = 0.74069). To sum
up, the findings on Investment Recovery summed up to a mean of 3.550 and standard
deviation of 0.74069, skewness -0.777 and kurtosis 0.198.
Table 4.10: Investment Recovery distribution
Statement Mean
Std.
Deviation Skewness Kurtosis
The firm sales its excess inventories/materials 3.71 1.223 -0.94 -0.096
The firm sales its scrap and used materials 3.68 1.439 -0.725 -0.822
The firm sales its excess capital equipment 3.43 1.11 -0.288 -0.536
The firm does recycle some of its used products 3.6 1.026 -0.29 -0.698
The firm Collect and recycle end-of-life products
and materials 3.8 0.984 -0.44 -0.25
The firm has Established a recycling system for
used and defective product 3.35 1.016 -0.043 -0.723
Investment Recovery 3.55 0.74069 -0.777 0.198
4.4.5 Institutional Pressure
This section of the analysis highlights the findings on institutional pressure. The results
are as presented in table 4.11. The findings of the study have shown that the local
environmental laws put pressure on the firms GSCM (mean = 3.95, SD = 0.779). Other
than that, the environmental protection demands from the firms’ domestic customers put
increasing pressure on their GSCM (mean = 3.78, SD = 0.835).

82
Table 4.11: Institutional Pressure distribution
Statement Mean
Std.
Deviation Skewness Kurtosis
Local environmental laws put pressure on
our GSCM. 3.95 0.779 -0.496 0.365
The environmental protection demands
from our domestic customers put
increasing pressure on our GSCM. 3.78 0.835 -0.806 0.509
The increase of environmental awareness
of the society boosts pressure on our
GSCM. 3.77 0.965 -0.822 0.671
The collaboration in environment with
our suppliers boosts pressure on our
GSCM. 3.76 0.732 -0.162 0.222
The improvements in developing green
products of our suppliers boost pressure
on our GSCM. 3.5 1.007 -0.458 -0.004
The improvements in products green
packaging of our suppliers boost pressure
on our GSCM. 3.72 0.913 -0.379 -0.051
The green strategy of the manufacturers
who produce the same products as we
boost pressure on our GSCM 3.08 1.134 -0.207 -0.551
The green strategy of the manufacturers
who produce the substitute products as
we boost pressure on our GSCM. 3.35 1.316 -0.26 -1.033
The requirements of green development
from the industry association boost
pressure on our GSCM. 4.13 0.78 -0.872 0.779
Institutional Pressure 3.72 0.594 0.122 0.281
Furthermore, the increase of environmental awareness of the society boosts pressure on
the firms’ GSCM (mean = 3.77, SD = 0.965). Also, the collaboration in the environment
with the suppliers boost pressure on GSCM (mean = 3.5, SD = 1.007). In addition, the
pressure on GSCM is boosted by improvements in developing green products by

83
suppliers (mean = 3.5, SD = 1.007), improvements in products green packaging of the
firms’ suppliers (mean = 3.72, SD = 0.913) and the requirements of green development
from the industry association (mean = 4.13, SD = 0.78).
However, there is doubt whether the green strategy of the manufacturers who produce
the same products as the firms boost pressure on GSCM (mean = 3.08, SD = 1.134).
Similarly, it is uncertain if the green strategy of the manufacturers who produce the
substitute products as the firm boost pressure on their GSCM (mean = 3.35, SD =
1.316). Generally, the results on Institutional Pressure summed up to a mean of 3.715,
standard deviation of 0.59476, skewness 0.122 and kurtosis 0.281.
4.4.6 Supply chain performance
This section of the analysis highlights the results on supply chain performance. Basing
on the findings in table 4.12, the firms can customize product to meet specific customer
demand (mean = 4.03, SD = 0.779). Besides, the firm has customer responsiveness
flexibility (mean = 4.18, SD = 0.816). Moreover, the firm has low percentage of defects
(mean = 4.05, SD = 0.624) and high percentage of finished goods in transit (mean =
4.05, SD = 0.804). However, there is no efficiency of purchase order cycle time (mean =
1.07, SD = 0.259). Generally, the findings on supply chain performance summed up to a
mean of 3.6878, standard deviation of 0.42973, skewness -0.736 and kurtosis 1.007.

84
Table 4.12: Supply Chain Performance distribution
Statement Mean
Std.
Deviation Skewness Kurtosis
The ability to customize product to meet
specific customer demand 4.03 0.779 -0.94 1.093
The firm has customer responsiveness
flexibility 4.18 0.816 -0.433 -1.117
The firm has low percentage of defects 4.05 0.624 -0.168 0.046
The firm has high percentage of finished
goods in transit 4.05 0.804 -0.33 -0.455
There is efficiency of purchase order
cycle time 1.07 0.259 3.33 9.14
Supply chain performance 3.6878 0.42973 -0.736 1.007
4.5 Factor analysis
To assess the construct validity, items were examined by principal components
extraction with varimax rotation. The Kaiser Meyer- Olkin (KMO) measure of sampling
adequacy was used to compare the magnitude of the observed correlations coefficients
and that of partial coefficient correlations. KMO values below 0.5 do not permit the use
of factor analysis. The factor loading for internal environment management, green
purchasing, eco design, investment recovery, institutional pressure and supply chain
performance are as shown below.
4.5.1 Internal environment management
Factor analysis for internal environment management was conducted to ensure that all
the constructs used are valid and reliable before proceeding for further analysis. The
study requested that all loading less than 0 and more than 1 be suppressed in the output,
hence providing blank spaces for many of the loadings. All internal environment

85
management factors notably, the firm senior managers are committed to GSCM, the firm
mid-level managers support for GSCM, the firm has teams responsible for
environmental improvements, the firm has total quality environmental management, the
firm has ISO 14001 certification for complying with environmental compliance and
auditing programs, the firm has environmental management systems and the firm
emphasizes on Eco-labelling of Products were retained for further data analysis.
Additionally, the first factor accounted for 26.004% of the total variance, the second
factor 49.978% of the total variance and the third factor 66.971% of the total variance.
Sampling adequacy was tested using the Kaiser- Meyer- Olkin Measure (KMO measure)
of sampling adequacy. As evidenced in table 4.13, KMO was smaller than 1, and
Bartlett’s Test was significant.
Table 4.13: Internal Environment Management
1 2 3
The firm senior managers are committed to GSCM 0.811
The firm mid-level managers support for GSCM 0.579
The firm has teams responsible for environmental improvements 0.889
The firm has total quality environmental management
0.755
The firm has ISO 14001 certification for complying with
environmental compliance and auditing programs
0.594
The firm has environmental management systems
0.519
the firm emphasizes for Eco-labeling of Products
0.886
Rotation Sums of Squared Loadings
Total 2.08 1.918 1.359
% of Variance 26.004 23.974 16.993
Cumulative % 26.004 49.978 66.971
KMO and Bartlett's Test
Kaiser-Meyer-Olkin Measure of Sampling Adequacy. 0.55
Bartlett's Test of Sphericity
Approx.
Chi-
Square 779.578
Df 28
Sig. 0.000
Extraction Method: Principal Component Analysis.
Rotation Method: Varimax with Kaiser Normalization.

86
4.5.2 Green Purchasing
Factors with factor loadings of above 0.5 are excellent and should be retained for further
data analysis. Green purchasing items namely the firm provide design specification to
suppliers that include environmental requirements for purchased item, the firm cooperate
with its suppliers for environmental objectives through sharing ideas, the firm does
auditing on environmental for suppliers’ internal management, the firm deals with
Suppliers’ with ISO1400 certification, the firm cooperate with customers for cleaner
production and the firm cooperates with customers for green packaging were retained
for further data analysis. Moreover, the first factor accounted for 26.004% of the total
variance, the second factor 49.978% of the total variance and the third factor 66.971% of
the total variance. Sampling adequacy was tested using the Kaiser- Meyer- Olkin
Measure (KMO measure) of sampling adequacy. As evidenced in table 4.14, KMO was
greater than 0.5, and Bartlett’s Test was significant.
Table 4.14: Green Purchasing
Statement 1 2 3
The firm provide design specification to suppliers that include
environmental requirements for purchased item
0.604
The firm cooperate with its suppliers for environmental
objectives through sharing ideas
0.789
The does auditing on environmental for suppliers’ internal
management 0.839
The deals with Suppliers’ with ISO1400 certification 0.617
The firm cooperate with customers for cleaner production
0.846
The firm cooperate with customers for green packaging
0.901
Rotation Sums of Squared Loadings
Total 2.08 1.918 1.359
% of Variance 26.004 23.974 16.993
Cumulative % 26.004 49.978 66.971
KMO and Bartlett's Test
Kaiser-Meyer-Olkin Measure of Sampling Adequacy. 0.64
Bartlett's Test of Sphericity
Approx.
Chi-Square 1453.442
Df 45
Sig. 0.000
Extraction Method: Principal Component Analysis.
Rotation Method: Varimax with Kaiser Normalization.

87
4.5.3 Eco design
Factor analysis was conducted to make sure that the items belong to the same construct.
Table 4.15 illustrates the factor analysis for adaptive capacity. As shown in the table,
there were no exceptions, as all variables scored above the threshold of 0.5. The criterion
for communality was fulfilled by eco design items notably, the firm design its products
for reduced consumption of material/energy, the firm design its products for reuse,
recycle, recovery of material, component parts, the firm design its products to avoid or
reduce use of hazardous of products and/or their manufacturing process, the firm design
its product for support regulation, the firm design its products that weight and the least
capacity for decrease taking time, the area stores, and the energy between the
transportation leas, the firm design it’s the products to be easy set up for the users in the
most energy saving way and the firm design usability of part particularly for extend
using products, repair easy and increase efficiency were retained for further analysis.
Additionally, the first factor accounted for 25.236% of the total variance and the second
factor 46.74% of the total variance and the third factor 66.489. The KMO Measure is an
index for comparing the magnitude of the observed correlation coefficients to the
magnitude of the partial correlation coefficients. As shown in table 4.18, KMO was
greater than 0.5, and Bartlett’s Test was significant.

88
Table 4.15: Eco Design
Statement 1 2 3
The firm design its products for reduced consumption of
material/energy 0.718
The firm design its products for reuse, recycle, recovery of
material, component parts 0.818
The firm design its products to avoid or reduce use of
hazardous of products and/or their manufacturing process 0.638
The firm design its product for support regulation 0.771
The firm design its products that weight and the least capacity
for decrease taking time, the area stores, and the energy
between the transportation leas 0.914
The firm design it is the products to be easy set up for the
users in the most energy saving way
0.718
The firm design usability of part particularly for extend using
products, repair easy and increase efficiency
0.762
Rotation Sums of Squared Loadings
Total 2.271 1.935 1.777
% of Variance 25.236 21.504 19.749
Cumulative % 25.236 46.74 66.489
KMO and Bartlett's Test
Kaiser-Meyer-Olkin Measure of Sampling Adequacy. 0.577
Bartlett's Test of Sphericity
Approx.
Chi-
Square 1239.043
Df 36
Sig. 0.000
Extraction Method: Principal Component Analysis.
Rotation Method: Varimax with Kaiser Normalization.

89
4.5.4 Investment Recovery
Table 4.16 shows that the factor loadings results were above 0.5. This implies that all the
factors were retained for further analysis. All Investment Recovery items namely, the
firm sales its excess inventories/materials, the firm sales its scrap and used materials, the
firm sales its excess capital equipment, the firm does recycle some of its used products,
the firm Collect and recycle end-of-life products and materials, the firm has established
a recycling system for used and defective product were later used for further analysis. To
sum up, the first factor accounted for 38.077% of the total variance and the second factor
accounted for 64.509% of the total variance. The Kaiser-Meyer-Olkin Measure value
(0.658) was above 0.5 hence acceptable. Also, the Bartlett’s Test was significant.
Table 4.16: Investment Recovery
Statement 1 2
The firm sales its excess inventories/materials 0.806
The firm sales its scrap and used materials 0.818
The firm sales its excess capital equipment 0.759
The firm does recycle some of its used products 0.547 0.536
The firm Collect and recycle end-of-life products and materials 0.556
The firm has Established a recycling system for used and
defective product 0.664
Total Variance Explained: Rotation Sums of Squared Loadings
Total 2.665 1.85
% of Variance 38.077 26.432
Cumulative % 38.077 64.509
KMO and Bartlett's Test
Kaiser-Meyer-Olkin Measure of Sampling Adequacy. 0.658
Bartlett's Test of Sphericity
Approx. Chi-
Square 966.747
df 21
Sig. 0.000
Extraction Method: Principal Component Analysis.
Rotation Method: Varimax with Kaiser Normalization.

90
4.5.5 Institutional Pressure
Factors with factor loadings of above 0.5 are excellent and should be retained for further
data analysis. Institutional Pressure items namely, local environmental laws put pressure
on our GSCM, the environmental protection demands from our domestic customers put
increasing pressure on our GSCM, the increase of environmental awareness of the
society boosts pressure on our GSCM, the collaboration in environment with our
suppliers boosts pressure on our GSCM, the improvements in developing green products
of our suppliers boost pressure on our GSCM, the improvements in products green
packaging of our suppliers boost pressure on our GSCM, the green strategy of the
manufacturers who produce the same products as us boost pressure on our GSCM, the
green strategy of the manufacturers who produce the substitute products as us boost
pressure on our GSCM and the requirements of green development from the industry
association boost pressure on our GSCM were retained for further data analysis.

91
Table 4.17: Institutional Pressure
Statement 1 2 3
Local environmental laws put pressure on our GSCM. 0.744
The environmental protection demands from our domestic
customers put increasing pressure on our GSCM. 0.588
The increase of environmental awareness of the society boosts
pressure on our GSCM. 0.635
The collaboration in environment with our suppliers boosts
pressure on our GSCM. 0.849
The improvements in developing green products of our suppliers
boost pressure on our GSCM. 0.783
The improvements in products green packaging of our suppliers
boost pressure on our GSCM. 0.697
The green strategy of the manufacturers who produce the same
products as we boost pressure on our GSCM 0.788
The green strategy of the manufacturers who produce the substitute
products as we boost pressure on our GSCM.
0.859
The requirements of green development from the industry
association boost pressure on our GSCM.
0.696
Total Variance Explained: Rotation Sums of Squared Loadings
Total 3.044 2.246 1.768
% of Variance 30.439 22.463 17.677
Cumulative % 30.439 52.902 70.579
KMO and Bartlett's Test
Kaiser-Meyer-Olkin Measure of Sampling Adequacy. 0.671
Bartlett's Test of Sphericity
Appro
x. Chi-
Square 1629.768
df 36
Sig. 0
Extraction Method: Principal Component Analysis.
Rotation Method: Varimax with Kaiser Normalization.
Additionally, the first factor accounted for 30.439% of the total variance; the second
factor accounted for 52.902% of the total variance and the third factor 70.579% of the
total variance. Sampling adequacy was tested using the Kaiser- Meyer- Olkin Measure
(KMO measure) of sampling adequacy. As evidenced in table 4.20, KMO was greater
than 0.5, and Bartlett’s Test was significant.

92
4.5.6 Supply Chain Performance
Factors with factor loadings of above 0.5 are excellent and should be retained for further
data analysis. Supply chain performance items namely, the ability to customize product
to meet specific customer demand, the firm has customer responsiveness flexibility, the
firm has low percentage of defects, the firm has high percentage of finished goods in
transit and there is efficiency of purchase order cycle time were retained for further data
analysis. Additionally, the first factor accounted for 33.906% of the total variance, the
second factor accounted for 48.7% of the total variance and the third factor 60.926% of
the total variance. Sampling adequacy was tested using the Kaiser- Meyer- Olkin
Measure (KMO measure) of sampling adequacy. As evidenced in table 4.18, KMO was
greater than 0.5, and Bartlett’s Test was significant.
Table 4.18: Supply Chain Performance
Statement 1 2 3
The ability to customize product to meet specific
customer demand 0.73
The firm has customer responsiveness flexibility 0.766
The firm has low percentage of defects 0.858
The firm has high percentage of finished goods in
transit 0.837
There is efficiency of purchase order cycle time
0.837
Rotation Sums of Squared Loadings
Total 3.391 1.479 1.223
% of Variance 33.906 14.794 12.226
Cumulative % 33.906 48.7 60.926
KMO and Bartlett's Test
Kaiser-Meyer-Olkin Measure of Sampling Adequacy. 0.685
Bartlett's Test of Sphericity
Approx. Chi-
Square
1337.20
5
Df 45
Sig. 0.000
Extraction Method: Principal Component Analysis.
Rotation Method: Varimax with Kaiser Normalization.

93
4.6 Data transformation and scoring
Table 4.19 highlights the results on data transformation and scoring. Basing on the
results, supply chain performance had the highest numerical mean (mean = 3.6706)
while Investment Recovery the lowest mean (mean = 3.3756). The results imply that the
manufacturing firms have exhibited a degree of satisfaction concerning factors such as
customization of products and low percentage of defects. Further, Skewness and
Kurtosis values were used to test for normality distribution. From the results, the values
of Skewness and kurtosis revealed that the data was normally distributed where the
values were well below the threshold of +/- 10.
Table 4.19: Data Transformation and Scoring
N Min Max Mean
Std.
Deviation Skewness
Internal environment
management 21 1.13 4.88 3.6286 0.73328 -1.027
Eco Design 376 1.5 5 3.5661 0.81687 -0.606
Green Purchasing 376 1.44 5 3.573 0.78943 -0.745
Investment Recovery 376 1.57 4.86 3.3756 0.76558 -0.455
Institutional Pressure 376 1.23 4.8 3.5638 0.66658 -1.507
Supply chain
performance 376 2 5 3.6706 0.59429 -0.548
4.7 Assumption of regression model
The following assumption was tested: linearity, normality, homoscedasticity, and
multicollinearity as shown below.
4.7.1 Linearity
Hair et al. (2010) argue that linearity is an assumption of all multivariate techniques
based on co-relational measures of association, including regression, multiple
regression, and factor analysis. Therefore, it is crucial to test the relationship of the
variables to identify any departure that may impact the correlation. The result in table
4.20 showed that all the variables are linear with each other. Based on the ANOVA

94
output table, value Sig. Deviation from Linearity of >0.05, it can be concluded that there
is a linear relationship between the variables of green supply chain adoption on the
performance of Agri-manufacturing firms
Table 4.20: Linearity
Sum of
Squares df
Mean
Square F Sig.
supply chain performance *
internal environment
management
(Combined) 72.494 22 3.295 19.404 0.5
Linearity 61.987 1 61.987 365.00 0.432
supply chain performance *
Eco Design
(Combined) 84.622 28 3.022 21.93 0.670
Linearity 63.809 1 63.809 463.03 0.124
supply chain performance *
Green Purchasing
(Combined) 80.147 22 3.643 24.59 0.432
Linearity 60.181 1 60.181 406.23 0.321
supply chain performance *
Investment Recovery
(Combined) 65.264 28 2.331 12.04 0.456
Linearity 38.17 1 38.17 197.16 0.237
supply chain performance *
Institutional Pressure
(Combined) 105.306 124 0.849 7.86 0.334
Linearity 74.994 1 74.994 693.68 0.345
4.7.2 Normality
The normality is fundamental assumption in multivariate analysis (Tabachnick & Fidell,
2007; Hair et al., 2010). The main assumption in normality is that the data distribution in
each item and in all linear combination of items is normally distributed (Tabachnick and
Fidell, 2007; Hair et al., 2010). To identify the shape of distribution, Kolmogorov-
Smirnov was used (Shapiro & Wilk, 1965) which were calculated foreach variable. The
results from these tests revealed (Table 4.21) that all the variables were not significant,
which meets the assumptions of normality.

95
Table 4.21: Normality
Kolmogorov-Smirnova Shapiro-Wilk
Statistic df Sig. Statistic Df Sig.
Internal environment
management 0.171 376 0.145 0.873 376 0.200*
Eco Design 0.271 376 0.111 0.902 376 0.132
Green Purchasing 0.213 376 0.123 0.915 376 0.093
Investment Recovery 0.207 376 0.131 0.871 376 0.115
Institutional Pressure 0.181 376 0.102 0.91 376 0.073
Supply chain performance 0.142 376 .200* 0.97 376 0.786
* This is a lower bound of the true significance.
a Lilliefors Significance Correction
4.7.3 Homoscedasticity
The Levenne Statistic for equality of variances was used to test for the assumption of
homoscedasticity. In this regard, the study hypothesized that the variance of each sub-
group was the same. The desired result for non-violation of homoscedasticity was
therefore to reject this hypothesis. Table 4.22 shows that testing at the 0.05 level of
significance; none of the Levenne statistics was significant. The assumption of
homoscedasticity was not violated.
Table 4.22: Homoscedasticity
Test of Homogeneity of Variances
Levene Statistic df1 df2 Sig.
Internal environment
management 1.324 3 372 0.266
Eco Design 2.27 3 372 0.08
Green Purchasing 1.098 3 372 0.35
Investment Recovery 10.032 3 372 0.66
Institutional Pressure 1.49 3 372 0.217
Supply chain performance 1.077 3 372 0.359

96
4.7.4 Test of Multicollinearity
Multicollinearity means that two or more of the independent variables are highly
correlated and this situation can have damaging effects on the results of multiple
regressions. High multicollinearity is signaled when inter-correlation among the
independents is above 0.9 (Hair et al., 2006 as cited by Saunders et al. 2009),
0.8(Garson, 2013), 0.7 (Sekaran & Bougie, 2010), or when high R-squared and
significant F tests of the model occur in combination with non-significant t-tests of
coefficients. From the results in table 4.23, there was no multicollinearity. In addition,
VIF<10 is acceptable and a threshold of “10" as the maximum level of VIF (Hair et al.,
1995).
Table 4.23: Test of Multicollinearity
Correlations Collinearity Statistics
Zero-order Tolerance VIF
Internal environment management 0.684 0.224 4.473
Eco Design 0.694 0.168 5.951
Green Purchasing 0.674 0.209 4.795
Investment Recovery 0.537 0.422 2.37
Institutional Pressure 0.752 0.165 6.047
a Dependent Variable: supply chain performance
4.8 Correlation analysis
Correlation coefficients are the statistical method utilized to explore the six variables:
supply chain performance, internal environment management, Eco Design, Green
Purchasing, Investment Recovery, Institutional Pressure and Supply Chain performance.
A Pearson correlation analysis was conducted to investigate whether there is relationship
between the dependent variable (Supply Chain performance) and the independent
variables, l supply chain performance, internal environment management, Eco Design,
Green Purchasing, Investment Recovery, Institutional Pressure. The analysis revealed

97
that there was a positive relationship between the dependent variable and all the
independent variables. The results of the correlation analysis are presented in Table 4.24.
There was a positive statistically significant correlation between internal environment
management and supply chain performance at, r = 0.684, P < 0.01. The correlation
between Eco Design and supply chain performance was also significant, r = 0.694, P <
0.01. Moreover, the correlation between Green Purchasing and supply chain
performance was significantly positive at r = 0.674, P < 0.01. In addition, there was a
positive statistically significant correlation between investment recovery and supply
chain performance at r = 0.537, P < 0.01. Also, the correlation between institutional
pressure and supply chain performance had a negative statistically significant correlation
at r = 0.752, P < 0.01. The test was at 95% level of significance.
Table 4.24: Correlation Analysis
Supply chain
performance
Internal
environment
management
Eco
Design
Green
Purchasing
Investment
Recovery
Institutional
Pressure
Supply chain
performance 1
Internal
environment
management .684** 1
Eco Design .694** .551** 1
Green Purchasing .674** .600** .641** 1
Investment
Recovery .537** .604** .679** .518** 1
Institutional
Pressure -.752** .636** .546** .437** .709** 1
** Correlation is significant at the 0.01 level (2-tailed).
4.9 Hypothesis Testing
Regression is one of the pertinent and commonly used statistical method in research. It
provides a platform for which causal-effect relationships among variables of interest in
the study are examined. Hence, it provides a method for quantifying the effect of
changes in the response variable because of change in predictor variables (Darlington &

98
Hayes, 2016; Mills & Tosic, 2011; Hair et al., 2010). Therefore, regression analysis was
performed to test the model fit and to establish the predictive power of the models in the
response variable. Although there are quite number of methods of regression such as
forced entry, hierarchical method, and stepwise methods (Field, 2009), the present study
used the hierarchical regression model since it indicates precisely what happens to the
regression model as different predictor variables are introduced. Thus, enabled the
researcher to systematically acknowledge the contribution of each independent variable
in explaining the predictive power of the model.
Tests for moderation was done based on the works of Barron and Kenny (1986); Aiken
and West (1991); Jose (2008) to examine the moderating effect of institutional pressure
in the link Internal environment management, Eco Design, Green Purchasing,
Investment Recovery, and supply chain performance among Agri-Manufacturing Firms
in Rwanda. Nevertheless, according to Jose (2008), the interaction effects of both
moderators were plotted on a Mod Graph so as depict its influence on the dependent
variable (supply chain performance among Agri-Manufacturing Firms in Rwanda). This
section presents the results for control effects, direct effects and eventually the
interaction effects of the variables in the study.
4.9.1 Effect of Internal Environment Management on Supply Chain Performance
H01: There is no significant effect of internal environment management practices on
supply chain performance among Agri-Manufacturing Firms in Rwanda
Table 4.25 illustrates that the model summary of multiple regression model, the results
showed that internal environment management practices explained 57.8 percent
variation of supply chain performance. This showed that considering internal
environment management practices, there is a probability of predicting supply chain
performance by 57.8% (Adjusted R squared =0.578).

99
The first hypothesis of the study stated that there is no significant effect of internal
environment management practices on supply chain performance among Agri-
manufacturing firms in Rwanda. However, findings in table 4.26 further showed that
internal environment management practices had significant ANAOVA table value
basing on F = 66.147 (p-value = 0.000 which is less than α = 0.05) thus we reject the null
hypothesis and conclude that internal environment management practices have a
significant effect on supply chain performance.
Table 4.27 suggests that there is up to 0.624-unit increase in supply chain performance
for each unit increase in internal environment management practices. Also, the effect of
internal environment management practices is more than the effect attributed to the
error, this is indicated by the t-test value = 11.640.
Consistent with the results, Lakshmimeera and Palanisamy (2013) posited that internal
environmental management is key in enhancing competitiveness and environmental
performance which in turn lead to sustainability. Similarly, Yeung et al. (2003)
confirmed that senior management confidence is the most influential factor for the
development of quality management system.
Table 4.25: Model Summary
Model R R Square Adjusted R Square Std. Error of the
Estimate
1 .780a .609 .587 .597
a. Predictors: (Constant), Effect of Internal Environment Management

100
Table 4.26: ANOVA
Model Sum of Squares df Mean Square F Sig.
1 Regression 9.922 1 9.922 66.147 .000b
Residual 32.036 213 .150
Total 41.958 214
a. Dependent Variable: Supply Chain Performance
b. Effect of Internal Environment Management
Table 4.27: Coefficients Table
Unstandardized
Coefficients Standardized Coefficients
B
Std.
Error Beta t Sig.
(Constant) 1.836 0.164
11.179 0.000
Internal environment management 0.503 0.043 0.624 11.640 0.000
a Dependent Variable: Supply Chain Performance
4.9.2 Effect of Green Purchase on Supply Chain Performance
H02: There is no significant effect of green purchase on supply chain performance
among Agri-Manufacturing Firms in Rwanda
The second hypothesis stated that green purchase has no significant effect on supply
chain performance among Agri-Manufacturing Firms in Rwanda. Table 4.28 results
showed that green purchase explained 61.9% percent variation of supply chain
performance. This showed that considering green purchase, there is a probability of
predicting supply chain performance by 61.9% % (adjusted R squared =61.9%).

101
Nonetheless, table 4.29 study findings showed that green purchase has a positive and
significant effect on supply chain performance basing on F= 16.42 (p-value = 0.025
which is less than α = 0.05) implying green purchase has a significant effect on supply
chain performance among Agri-Manufacturing Firms in Rwanda. The null hypothesis is
therefore rejected.
Furthermore, table 4.30 the effect of green purchase was stated by the t-test value =
11.303 which implies that the standard error associated with the parameter is less than
the effect of the parameter and the green purchase was statistically significant with p
value 0.000 <0.05 (level of significance). In corroboration with the findings, the study
by Muma et al., (2014) established that there is a positive relationship between Green
purchasing, and reverse logistics and environmental performance. On the same note, Al
Khattb et al. (2015) proved that Green Supply chain management such Green
Purchasing, affected the environmental marketing performance.
Table 4.28: Model Summary
Model R R Square Adjusted R Square
Std. Error of
the Estimate
1 .782a .720 .619 .931
a. Predictors: (Constant), Green Purchase
Table 4.29: ANOVA
Model
Sum of
Squares df Mean Square F Sig.
1 Regression 5.841 1 5.841 16.42 .025b
Residual 75.449 213 0.354
Total 81.290 214
a. Dependent Variable: Supply Chain Performance
b. Predictors: (Constant), Green Purchase

102
Table 4.30: Coefficients
Model
Unstandardized Coefficients
Standardized
Coefficients
t Sig. B Std. Error Beta
1 (Constant) 2.008 0.154 13.029 0.000
Green purchase 0.468 0.041 0.613 11.303 0.000
a. Dependent Variable: Supply Chain Performance
4.9.3 Effect of Eco Design on Supply Chain Performance
H03: There is no significant effect of eco design on supply chain performance among
Agri-Manufacturing Firms in Rwanda
The third hypothesis of the study stated that eco design has no significant effect on
supply chain performance among Agri-Manufacturing Firms in Rwanda.
Table 4.31 showed that considering eco design, there is a probability of predicting
supply chain performance by 74.6% (Adjusted R squared =0.746).
ANOVA table on table 4.32 study findings in the table indicated that the above
discussed coefficient of determination was significant as evidence of F ratio of 33.168
with p value 0.023 <0.05 (level of significance) implying that we reject the null
hypothesis stating that eco design has no significant effect on supply chain performance.
However, the study findings showed that eco design had coefficients of estimate which
was significant basing on β3= 0.59 (p-value = 0.000 which is less than α = 0.05)
Furthermore, the effect of eco design was stated by the t-test value = 10.64 which
implies that the standard error associated with the parameter is more than the effect of
the parameter. Consistent with the findings, Rao (2012) elucidated that GSCM practices
should include working collaboratively with suppliers on green product designs, holding

103
awareness seminars together with assisting suppliers to establish their own
environmental programs. The results are also in tally with that of Krikke et al., (2004)
which established that pioneering firms have learned that making product returns
profitable is dependent on the product design.
Table 4.31: Model Summary
Model R R Square
Adjusted
R Square Std. Error of the Estimate
1 .873a .813 .746 .892
a. Predictors: (Constant), Eco design
Table 4.32: ANOVAa
Model
Sum of
Squares df Mean Square F Sig.
1 Regression 11.012 1 11.012 33.168 .023b
Residual 70.819 213 .332
Total 81.832 214
a. Dependent Variable: Supply Chain Performance
b. Predictors: (Constant), Eco design
Table 4.33: Coefficientsa
Model
Unstandardized Coefficients
Standardized
Coefficients
t Sig. B Std. Error Beta
1 (Constant) 1.97 0.17 11.85 0.00
Eco design 0.47 0.04 0.59 10.64 0.00
a. Dependent Variable: Supply Chain Performance
4.9.4 Effect of Investment Recovery on Supply Chain Performance
H04: There is no significant effect of investment recovery on supply chain performance
among Agri-Manufacturing Firms in Rwanda

104
The fourth hypothesis of the study stated that investment recovery has no significant
effect on supply chain performance among Agri-Manufacturing Firms in Rwanda. Table
4.34 model summary indicates that investment recovery had 81.3 percent variation of
supply chain performance. This showed that considering investment recovery, there is a
probability of predicting supply chain performance by 81.3% (R squared =0.813). Study
findings in the table 4.35 indicated that there was significant evidence of F ratio of 73.48
with p value 0.000 <0.05 (level of significance).
Table 4.36 indicates that investment recovery has a positive and significant effect on
supply chain performance basing on β4 = 0.555 (p-value = 0.000 which is less than α =
0.05) thus we fail to accept the hypothesis and conclude that investment recovery has a
significant effect on supply chain performance. This suggests that there is up to 0.555-
unit increase in supply chain performance, for each unit increase in investment recovery.
The effect of investment recovery is more than the effect attributed to the error; this is
indicated by the t-test value = 9.726.
Table 4.34: Model Summary
Model R R Square Adjusted R Square
Std. Error of
the Estimate
1 .927a .878 .813 .648
a. Predictors: (Constant), investment recovery
Table 4.35: ANOVA
Model
Sum of
Squares df Mean Square F Sig.
1 Regression 13.300 1 13.300 73.48 .000b
Residual 38.658 213 .181
Total 81.958 214
a. Dependent Variable: Supply Chain Performance
b. Predictors: (Constant), investment recovery

105
Table 4.36: Coefficients’
Model
Unstandardized
Coefficients
Standardized
Coefficients t Sig.
B
Std.
Error Beta
1 (Constant) 2.209 0.158 13.962 0.000
investment recovery 0.435 0.045 0.555 9.726 0.000
a. Dependent Variable: Supply Chain Performance
4.10 Overall multiple regression
4.10.1 Model Summary
Table 4.37 illustrates the model summary of multiple regression model, the results
showed that all the four predictors (investment recovery, Eco design, internal
environment management and green purchase) explained 46 percent variation of supply
chain performance. This showed that considering the four study independent variables,
there is a probability of predicting supply chain performance by 46% (R squared =0.46).
Table 4.37: Model Summary
R R Square Adjusted R Square
Std. Error of the
Estimate Durbin-Watson
0.68 0.46 0.45 0.42 2.15
Predictors: (Constant), Investment Recovery, Eco Design, Internal Environment Management,
Green Purchase
Dependent Variable: SCP

106
4.10.2 ANOVA Model
Study findings in table 4.38 indicated that the above discussed coefficient of
determination was significant as evidence of F ratio of 45.246 with p value 0.000 <0.05
(level of significance)
Table 4.38: ANOVA Model
Sum of
Squares Df
Mean
Square F Sig.
Regression 32.503 4 8.126 45.246 .000b
Residual 37.534 209 0.18
Total 70.036 213
a Dependent Variable: SCP
b Predictors: (Constant), investment recovery, eco design, internal environment management,
green purchase
4.10.3 Coefficients of Estimate
Findings showed that internal environment management had coefficients of estimate
which was significant basing on β1 = 0.262 (p-value = 0.004 which is less than α = 0.05).
It was therefore concluded that internal environment management had a significant
effect on supply chain performance. This suggested that there was up to 0.262 unit
increase in supply chain performance for each unit increase in internal environment
management. The effect of internal environment management was twice the effect
attributed to the error; this was indicated by the t-test value = 2.945.
Research findings showed that green purchase =had coefficients of estimate which was
significant basing on β2= 0.107 (p-value = 0.296 which was more than α = 0.05) hence
green purchase had no effect on supply chain performance. Furthermore, the effect of
green purchase was stated by the t-test value = 1.047 which implied that the standard
error associated with the parameter was less than the effect of the parameter.

107
Findings showed that eco design had coefficients of estimate which was significant
basing on β3 = 0.189 (p-value = 0.000 which is less than α = 0.05) implying that eco
design has significant effect on supply chain performance. This indicated that for each
unit increase in eco design, there was up to 0.189 units increase in supply chain
performance. The effect of eco design was stated by the t-test value = 2.112 which
indicated that the effect of eco design was twice that of the error associated with it.
Finally, investment recovery had coefficients of estimate which was significant basing
on β4 = 0.223 (p-value = 0.002 which is less than α = 0.05). It was therefore concluded
that investment recovery had a significant effect on supply chain performance. This
suggested that there was up to 0.223 unit increase in supply chain performance for each
unit increase in investment recovery. The effect of investment recovery was thrice the
effect attributed to the error; this was indicated by the t-test value = 3.168.
Table 4.39: Coefficients of Estimate
Unstandardized
Coefficients
Standardized
Coefficients
B Std. Error Beta T Sig.
(Constant) 1.469 0.171
8.581 0.000
Internal environment
management 0.211 0.072 0.262 2.945 0.004
Green purchase 0.082 0.078 0.107 1.047 0.296
Eco design 0.151 0.071 0.189 2.112 0.036
Investment recovery 0.174 0.055 0.223 3.168 0.002
a Dependent Variable: SCP

108
4.11 Hierarchical regression model
The moderating effects were tested in a series of hierarchical blocks. Initially, the
independent variables were standardized to z-scores to reduce the effects of multi-
collinearity and simplify interpretations. Then a cross-product of z-scores of the
moderator with each independent variable was then computed. In model I the
independent variables were entered. These included internal environment management,
green purchasing, eco-design, and investment recovery. In model II institutional pressure
which is the moderator was entered. In model four to six the interaction terms (internal
environment management* institutional pressure), (green purchasing * institutional
pressure), (eco-design* institutional pressure) and (investment recovery* institutional
pressure) were hierarchically entered.
None of the control variables significantly affected supply chain performance. All the
independent variables significantly affected supply chain performance. Table
4.40presents results on the moderating effect of institutional pressure. Hypothesis five
(a) postulated that there is no significant moderating effect of institutional pressure on
relationship between internal environment management and supply chain performance.
It can be seen from the table that institutional pressure significantly moderates the
relationship between internal environment management and supply chain performance
(β= 0.008; ρ < 0.05).
Hypothesis 5 (b) presumed that there is no significant moderating effect of institutional
pressure on the relationship between green purchasing and supply chain performance.
As can be read from the table, institutional pressure had a negative and significant
moderating effect on the relationship between green purchasing and supply chain
performance (β= -0.09; ρ < 0.05).
Hypothesis five (c) showed that there was no moderating effect of institutional pressure
on the relationship between eco-design and supply chain performance. As can be seen

109
from the table, institutional pressure had a negative and significant moderating effect on
the relationship between eco-design and supply chain performance (β= -0.83; ρ < 0.05).
Hypothesis five (d) posited that there was no moderating effect of institutional pressure
on the relationship between investment recovery and supply chain performance. From
the table, institutional pressure had a positive and significant moderating effect on the
relationship between investment recovery and supply chain performance (β= 0.83; ρ <
0.05).
The hierarchical multiple regression results also revealed an increase in R-square with
the addition of the blocks of variables. For instance, the controls contributed to an R-
square change of 59.6%. With the addition of the direct variables (internal environment
management, green purchasing, eco-design, and investment recovery), the R-square
increased to 60.7%. With the moderator (institutional pressure) it increased to 62.4%
meaning that the moderator did contribute to the variance explained on supply chain
performance by the controls and the direct effects. This implied that the interaction did
not contribute to the variance of supply chain performance.

110
Table 4.40: Hierarchical regression model
Model 1 Model 2 Model 3 Model 4 Model 6 Model 7
B
Std.
Error
B
Std.
Error
B
Std.
Error
B
Std.
Error
B
Std.
Error
B
Std. Error
(Constant)
0.00
(0.04)
0.00
0.04
0.00
0.04
0.02
0.04
0.01
0.04
0.01
0.04
Zscore (IEM)
0.17
(0.057) *
0.15
0.057*
0.77
0.196**
0.72
0.196**
0.27
0.305*
0.43
0.31
Zscore (GP)
0.19
0.072*
0.16
0.072**
0.15
0.071*
0.17
0.071*
0.15
0.071*
0.18
0.072*
Zscore (ED)
0.24
0.081*
0.21
0.081*
0.18
0.08*
0.18
0.079*
0.69
0.279**
0.95
0.303*
Zscore (IR)
0.28
0.068**
0.22
0.072*
0.18
0.071*
0.17
0.071*
0.17
0.07*
-0.28
0.22
Zscore (IP)
0.16
0.065*
0.70
0.175*
0.67
0.174*
0.74
0.177**
0.65
0.181*
Zscore (IEM_IP)
0.98
0.298*
-0.90
0.298*
-0.21
0.47
-0.47
0.48
Zscore (GP_IP)
0.09
0.041
0.07
0.04
0.09
0.042*
Zscore (ED_IP)
0.83
0.434*
1.29
0.482**
Zscore (IR_IP)
0.83
0.385*
model’s summary statistics
R 0.772 0.779 0.790 0.795 0.799 0.804
R Square 0.596 0.607 0.624 0.633 0.638 0.646
Adjusted R Square 0.589 0.598 0.614 0.622 0.626 0.632
Change Statistics
R Square Change 0.596 0.011 0.017 0.000 0.006 0.007
F Change 86.3 6.3 10.8 5.4 3.6 4.6
df1 4.0 1.0 1.0 1.0 1.0 1.0
df2 234.0 233.0 232.0 231.0 230.0 229.0
Sig. F Change 0.0 0.0 0.0 0.0 0.1 0.0
a Dependent Variable: Zscore (supply chain performance)

111
From the hierarchical regression beta coefficients, the following regression equation was
obtained for predicting the relationships of the study variables as suggested in Chapter 3
of this study.
The general analytical model for the direct relationship was represented as follows:
Where:
Y= Supply chain performance
X1= Internal environment management
X2= Green purchasing
X3= Eco design
X4= Investment recovery
Specifically, the hierarchical regressions models were as follows.
1.) The equation for model one had all the direct effect variables (internal environment
management, green purchasing, eco-design, and investment recovery) significant. Hence
the equation for model 1 was:
.............................Model
Where:
Y= Supply chain performance and X1, X2, X3 and X4 were internal environment
management, green purchasing, eco-design, and investment recovery respectively and E2

112
is the error term associated with this model. Control variables were not included in the
equation because of their insignificance.
2.) Model two had the inclusion of the moderating variable institutional pressure, which
was significant to the direct variables, which were internal environment management,
green purchasing, eco-design, and investment recovery. However, just like in model two
the control variables were not added in the equation because of their insignificant nature.
Hence, the equation for model three was:
..........Model 2
Where:
Y= Supply chain performance
X1, X2, X3 and X4 are internal environment management, green purchasing, eco-design,
and investment recovery, respectively.
M is the moderator institutional pressure.
is the error term associated with this model?
3.) Model 4 had the inclusion of first interaction variables internal environment
management multiplied by institutional pressure. Hence the equation for model four
was:
..........Model 3
Where Y, X1, X2, X3, X4, X5 are internal environment management, green purchasing, eco-
design and investment recovery and institutional pressure.

113
is the interaction between internal environment management and institutional
pressure.
4) Model 4 had the inclusion of second interaction variables green purchasing
multiplied by institutional pressure; however, the model was not significant. Hence the
equation for model four was:
..........
Model 4
Where Y, X1, X2, X3, X4, X5 are internal environment management, green purchasing, eco-
design and investment recovery and institutional pressure.
is the interaction between green purchasing and institutional pressure.
5) Model 5 had the inclusion of third interaction variables eco-design multiplied by
institutional pressure. Hence the equation for model four was:
....
.....Model 5
Where Y, X1, X2, X3, X4, X5 are internal environment management, green purchasing, eco-
design and investment recovery and institutional pressure.
is the interaction between eco-design and institutional pressure.
6) Model 6 had the inclusion of third interaction variables eco-design multiplied by
institutional pressure. Hence the equation for model four was:
.........Model 6

114
Where Y, X1, X2, X3, X4, X5 are internal environment management, green purchasing, eco-
design and investment recovery and institutional pressure.
is the interaction between eco-design and institutional pressure.
To better understand the nature of the interaction between institutional pressure and
green supply chain and supply chain performance, the moderated results are presented
on a moderation graph as suggested by Aiken & West (1991) who proposed that it is
insufficient to conclude that there is interaction without probing the nature of that
interaction at different levels of the moderator. The moderation effects of institutional
pressure on the relationship between green supply chain and supply chain performance
was determined using the graphical method.

115
Figure 4.1: Moderation of Institutional Pressure on the Relationship between
internal Environment Management and Supply Chain Performance
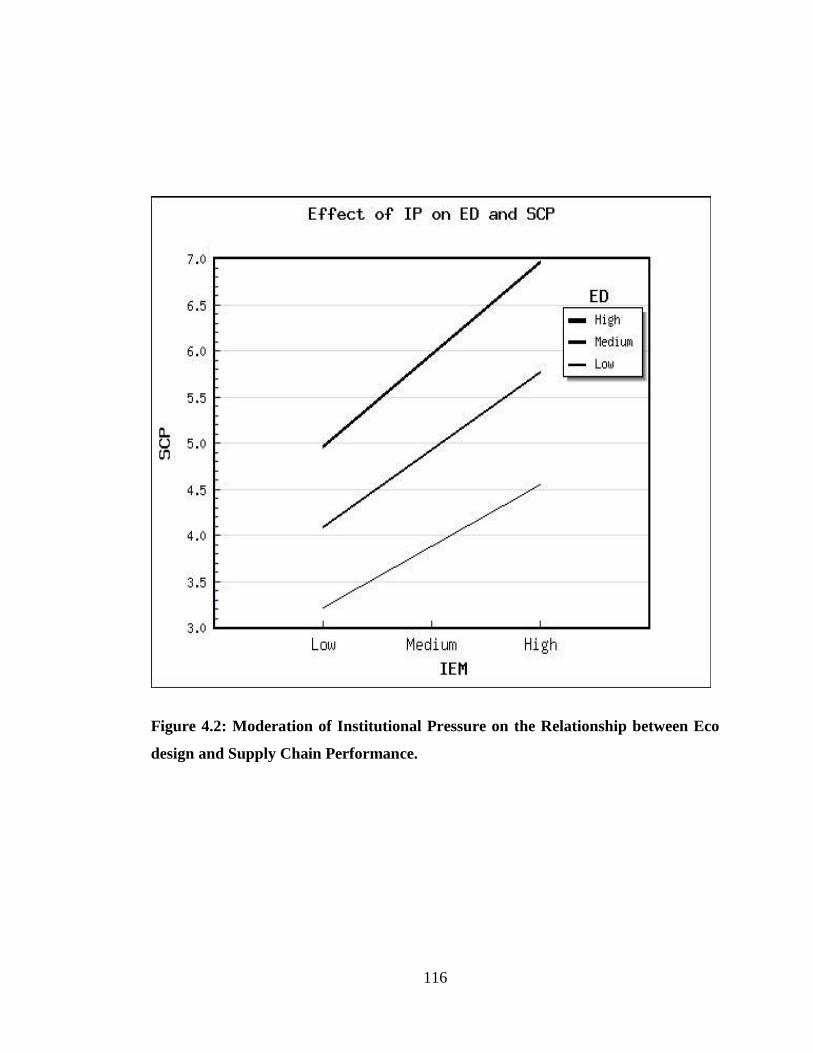
116
Figure 4.2: Moderation of Institutional Pressure on the Relationship between Eco
design and Supply Chain Performance.

117
Figure 4.3: Moderation of Institutional Pressure on the Relationship between
Investment Recovery and Supply Chain Performance.

118
Table 4.41: Summary of the Study Results
Hypotheses p – Values Decision
Hypothesis Ho1: There is no significant effect of internal
environment management practices on supply chain performance
among Agri-Manufacturing Firms in Rwanda 0.020 Reject
Hypothesis Ho2: There is no significant effect of green purchase on
supply chain performance among Agri-Manufacturing Firms in
Rwanda 0.013 Reject
Hypothesis Ho3: There is no significant effect of eco design on
supply chain performance among Agri-Manufacturing Firms in
Rwanda 0.021 Reject
Hypothesis Ho4: There is no significant effect of investment
recovery on supply chain performance among Agri-Manufacturing
Firms in Rwanda 0.932 Reject
Hypothesis Ho5a: There was no significant moderating effect of
institutional pressure on relationship between internal environment
management and supply chain performance
0.048
Reject
Hypothesis Ho5b: There was no significant moderating effect of
institutional pressure on relationship between green purchasing and
supply chain performance 0.034
Reject
Hypothesis Ho5c: There was no significant moderating effect of
eco design on relationship between internal environment
management and supply chain performance 0.021 Reject
Hypothesis Ho5d: There was no significant moderating effect of
institutional pressure on relationship between investment recovery
and supply chain performance 0.039 Reject
4.12 Supply chain and Agri-manufacturing in Rwanda
The agri-products supply chain has been and remains intricate with its complex network
of stakeholders who cater to diverse segments within the agri-ecosystem. Among them,
actors involved in supply chain (sourcing and procuring) for agri-commodities play an
indispensable role in connecting farming communities with food processing companies
around the world and ensure that the best quality raw materials reach the manufacturing
units to produce the finest agri- products. The complexities in the supply chain do come
with a fair share of challenges. Let us look at five major ones that affect Rwandan agri-
business operators, and how agricultural technology is helping agribusinesses overcome
them.

119
4.12.1 Limiting post-harvest losses at the earliest point in the supply chain.
One of the biggest questions that procuring companies in Rwanda face at the time of
harvest is whether the harvested products they receive will be of the quality they expect
and the quantity they were assured. It is a known fact that agriculture is extremely
climate-sensitive, and numerous factors can affect the cultivation of crops at different
growth stages. Unpredictable and unfavourable weather conditions, pest infestations,
crop diseases, and a change in soil conditions are only some of the factors that can
severely impact agricultural productivity. We can discuss what farming communities
could do to overcome this challenge although these factors are out of man’s control. In
Rwanda like any other developing country, the adoption of an agri-technology platform
is inarguably the most effective way to enhance agricultural productivity and efficiency
of the field staff by digitising the various field operations and constantly improving
farming practices based on the ground-truth intelligence that provide actionable insights.
As a result, farming companies in Rwanda can provide procuring companies with a
near-accurate estimate of the harvest quantity and quality, and monitor the cultivation
closely to ensure the result is as close as possible to the agreed figures. Procuring
companies can also remotely monitor the growth and the health of the crop from time to
time through satellite monitoring. Subsequently, this prevents the procuring companies
from incurring heavy losses after the purchase has been made. However, unfortunately
the level of technology in agri-business is still very low despite the efforts Rwandan
government has put in this section.
4.12.2 Supply chain versus quality compliance and products safety in Rwanda
Local markets in Rwanda protect the interests of their consumers by way of strict import
regulations on the quality of the agri-food product. Each country has its own
specifications, and exporting organizations strive to comply with them to get the
clearance for trade. While at one end it empowers the consumers to know about the
product they consume in much detail, at the other end it enables food producers to

120
establish a rapport with the consumer through the transparency of processes. What
Rwandan agri-stakeholders can do to provide high levels of transparency to add value
further to their business products is discussed here below. Rwanda Agri-manufacturing
Companies that procure agri-commodities from one region to export it to another can
establish a system that allows farming companies to monitor crop cultivation and ensure
that farming practices adhere to the compliance stipulated for trade. Digital farm
management systems such as CropIn’s enable the field staff to capture farm data for
each activity, which can be extracted as customized reports to provide evidence of
compliance with import/export regulations along with vital information from lab reports
and quality control processes. The infusion of technology to achieve transparency and
traceability in the cultivation process has empowered organizations involved in
procuring and exporting to proceed with the process without any setbacks or delays.
4.12.3 Ensuring quicker movement of produce along the supply chain.
According to The ‘State of Food and Agriculture’ (SOFA) 2019 report states that we
lose a significant 14% of the world’s food between harvest and retail sales, and logistics
is a critical loss point in addition to various others. An organised system for logistics is
highly critical to ensure the perishable commodities such as fresh fruits and vegetables,
remains as fresh as possible until it reaches the consumer, particularly if it has not been
locally produced. IN Rwanda, it was observed that lack of clear communication between
the producers and the procuring companies can impede the commodity’s movement and
lead to considerable post-harvest losses. Cloud-based networks should enable
organizations to overcome this challenge by providing a reliable multi-stakeholder
platform for clear communication between the different parties involved. Future in
Rwanda are to set up technologies such as satellite monitoring also allow the procuring
party to monitor the growth of the harvest remotely and arrive at a near-accurate harvest
date, which further facilitates them to plan the logistics more effectively. These digital
systems will offer a wide array of services to suit each user’s requirement and allow
close monitoring of the commodity’s movement from end to end. Also, the direct link

121
between the interested parties eliminates the need for a middle-man, thus making the
process more cost- and time-efficient.
4.12.4 Traceability of Agri-products for increased trust in the brand
Many food products are widely popular only for the ingredients they use, sourced from
regions known for them. Big brands that cater to consumers around the world need to
keep a sharp eye on the supply chain to ensure they provide only the choicest
products. Farm-to-fork traceability is an important factor in establishing the origin of a
food ingredient and is being perceived by the end-consumers as a benchmark of quality
and food safety. Supply chain organisations, being an indispensable player in the agri
supply chain, can leverage state-of-the-art digital tools to track all the processes involved
in the cultivation of the agri-commodity, and utilise this intelligence to further
strengthen the supply chain and earn the trust and loyalty of the end-consumers.
4.12.5 Other factors which affect supply chain of agricultural products in Rwanda.
It was observed that their big disconnection between suppliers and consumers of
products due to limited information sharing and poor marketing strategies. It was also
observed that some factors are related to limited or poor production of raw materials
(Agricultural commodities) expected to be transformed or processed by factories. This
ends up in have few commodities which cannot satisfy the consumers. In some areas
also, there is an issue of high cost of transports or absence of feeder roads, which results
in high prices of commodities. On the other hand, lack of advanced technologies for
mass production, limited access to fertilizers, most of farmers are not educated and use
traditional methods, subsistence farming. A combination of all these factors causes poor
production of agri-commodities and hence agri-manufacturing firms struggle to have
enough raw commodities for their factories and as results, the supply chain will be not
be effective and there will be shortage of some products on the market.

122
CHAPTER FIVE
SUMMARY OF FINDINGS, CONCLUSION AND RECOMMENDATIONS
5.1 Introduction
The chapter covers the summary of major findings, conclusion based on the findings and
the recommendations.
5.2 Summary of the Findings
5.2.1 Internal environment management
The findings on internal environment management indicated that both the senior
managers and mid-level managers are committed to GSCM. There is also a team tasked
with environmental improvements. Besides that, the manufacturing firms have total
quality environmental management and ISO 14001 certification for environmental
compliance and auditing programs. As well, the manufacturing firms supports
environmental regulation though there has been no emphasis on eco-labeling.
5.2.2 Green purchasing
Regarding green purchasing, the study established that the manufacturing firms provides
design specifications to suppliers that include environmental requirements for purchased
items. Also, the manufacturing firms cooperates with its suppliers for environmental
objectives through sharing ideas. Furthermore, the manufacturing firms does audit on
environmental suppliers’ internal management and it ensures that it only deals with
suppliers with ISO1400 certification. As well, the manufacturing firms cooperates with
customers for both cleaner production and green packaging.

123
5.2.3 Eco design
The results on eco design revealed that the manufacturing firms designs its products for
reduced consumption of material/energy. Besides, the manufacturing firms designs its
products for reuse, recycle and recovery of material. Moreover, the manufacturing firms
designs its products to avoid or reduce use of hazardous products. Similarly, the
manufacturing firms designs its products for support regulation. However, it is
undefined whether the firm designs products that weigh the least capacity for decreased
time taken and the energy during transportation. Further, the manufacturing firms
designs its products in such a way that they are easy to set up by the users and at the
same time energy saving. As well, the manufacturing firms design usability of part
particularly for extend using products, repair easy and increase efficiency.
5.2.4 Investment Recovery
With reference to investment recovery, the findings revealed that the manufacturing
firms’ sales its excess inventories/ materials. It also sales its scrap, used materials and
excess capital equipment. Further, the manufacturing firms recycles some of its used
products together with collecting and recycling end-of-life products and materials. It was
however not fully established if the manufacturing firms have established a recycling
system for used and defective products.
5.2.5 Institutional Pressure
In relation to institutional pressure, the study established that the local environmental
laws put pressure on the firms GSC. Also, the environmental protection demands from
the firms’ domestic customers put increasing pressure on their GSCM. Similarly,
increase of environmental awareness of the society, collaboration in the environment
with suppliers, improvements in developing green products by suppliers, improvements
in products green packaging of the firms’ suppliers and the requirements of green
development from the industry association boosts pressure on the firms’ GSCM.
124
However, there is doubt whether the green strategy of the manufacturers who produce
the same products as the firms boost pressure on GSCM. Similarly, it is uncertain if the
green strategy of the manufacturers who produce the substitute products as the firm
boost pressure on their GSCM.
5.2.6 Supply chain performance
The results on supply chain performance indicated that the manufacturing firms could
customize product to meet specific customer demand. Besides, the manufacturing firms
have customer responsiveness flexibility. Moreover, the manufacturing firms have low
percentage of defects and high percentage of finished goods in transit. However, there is
no efficiency of purchase order cycle time.
5.2.7 Moderated effect of institutional pressures on the relationship between green
supply chain and supply chain performance
Basing on the findings in chapter four, institutional pressure significantly moderates the
relationship between internal environment management and supply chain performance.
The implication is that environmental regulation induces the top management to adopt
environmentally friendly practices in the manufacturing process. In so doing, the supply
chain performance is improved. In tally with the results, the study shows that regulatory
requirements have a significant effect on organizational green approaches and
consequently both profitability and growth. In a similar vein, it is established that the
main driving factors of green logistics practices for truck fleets in is coercive pressure.
Furthermore, institutional pressure had a negative and significant moderating effect on
the relationship between green purchasing and supply chain performance. The results
suggest than increased institutional pressure weaken the relationship between green
purchasing and supply chain performance. As such, regulations are deleterious to the
relationship between supply chain partners that is effective in increasing supply chain
125
performance. Similarly, institutional pressure had a negative and significant moderating
effect on the relationship between eco-design and supply chain performance.
Finally, institutional pressure had a positive and significant moderating effect on the
relationship between investment recovery and supply chain performance. The results
suggest that environmental laws and environmental protection demands induces
manufacturing firms to adopt best practices in recycling, reusing as well as sale of idle
assets which in turn improves the supply chain performance. The reason for this is that
there is no wastage and at the same time there is adherence to green supply chain. In
conformity with the findings, the study established that government agencies are the
obvious factor that influence adoption of green practices by organizations through
enforcement of rules and regulation.
5.3 Conclusion
5.3.1 Internal Environmental Management
In conclusion, internal environmental management positively and significantly
influences supply chain performance. The implication is that support from the top
management is extremely essential in the implementation as well as the adoption of
green supply chain management. Without the presence of senior managers, GSCM is
bound to fail. Not only do the senior management enhance GSCM but they also enhance
the relationships among the supply chain management practices and natural
environment. Therefore, for manufacturing firms to exhibit superior supply chain
performance, the commitment and support from both the mid – level and senior-level
management is crucial.
5.3.2 Green Purchasing and Supply Chain Performance
Also, green purchasing which entails cooperating with suppliers for the purpose of
developing products that are environmentally sustainable had a positive and significant

126
influence on supply chain performance. The results suggest that the attainment of GSCM
is a collaborative effort between the firm and its supply chain partners in aspects such as
sharing ideas on environmental objectives and ensuring that there is cleaner production
and green packaging. It is therefore easier for the manufacturing firms to audit its
suppliers and choose one that complies with ISO1400 certification since there is close
interaction in the supply chain.
5.3.3 Eco-Design and Supply Chain Performance
Furthermore, eco-design results in the improvement of supply chain performance once
manufacturers design products that minimize consumption of materials and energy and
at the same time facilitate the reuse and recycle of component materials. In fact, the
study has shown that the manufacturing firms have been able to integrate environmental
aspects into the product design process while taking into consideration the flow of the
product in the supply chain. Consequently, eco-design by the manufacturing firms has
led to improved supply chain performance.
5.3.4 Investment Recovery and Supply Chain Performance
In addition, investment recovery has also been found to have a positive and significant
effect on supply chain performance. The reason for this is that used materials and
defective products that are likely to be deleterious to the environment are put into better
use by recycling or even reusing such products. In such a way, the manufacturing firms
can earn revenue from the sale of idle assets and save on cost by reusing material.
5.3.5 Institutional Pressure and Supply Chain Performance
The study findings on moderation effect concludes that under high levels of institutional
pressure, internal environmental management, eco design and investment recovery
increase supply chain performance of agro processing firms in Rwanda. It was inferred
that this institutional pressure mostly comes from the environmental protection demands

127
from domestic customers, increase of environmental awareness of the society,
collaboration in environment with suppliers and local environmental laws.
5.4 Recommendations
5.4.1 Internal Environmental Management and Supply Chain Performance
Basing on the study findings, internal environmental management is key in the
attainment of improved supply chain performance by manufacturing firms. It is therefore
important for both the senior managers and mid – level managers to be committed and
supportive of GSCM. Besides that, there is need for the firm to have total quality
environmental management and ISO 14001 for environmental compliance. As well,
having a team within the firm that is tasked with environmental improvements will go a
long way in enhancing supply chain performance.
5.4.2 Green Purchasing and Supply Chain Performance
Since green purchasing enhances supply chain performance, it is recommended or
manufacturing firms to exert pressure on their suppliers for better environmental
performance. Specifically, the firms need to provide design specifications to suppliers
that include environmental requirements for purchased items. Besides, there is need for
the firms to do auditing on environmental suppliers’ internal management and ensure
that it cooperates with customers for both cleaner production and green packaging.
5.4.3 Eco-Design and Supply Chain Performance
In addition, eco-design has been found to improve supply chain performance of
manufacturing firms. As such, the firms need to ensure that the environmental impacts
of the product’s life cycle are understood before even engaging in manufacturing
decisions. Moreover, the firm needs to design its products for reuse, recycle and
recovery of material. As well, is it utmost necessary for the manufacturing firms to

128
design products that are easy to set up by the users and are at the same time energy
saving.
5.4.4 Investment Recovery and Supply Chain Performance
Undoubtedly, investment recovery has a positive and significant influence on supply
chain performance. Therefore, managers need to ensure that the raw materials acquired
from suppliers can be recyclable, reusable, and remanufactured (Rao and Holt, 2005).
Also, firms need to make an initiative towards identifying a recycling system for used
and defective products. Other than that, it is important for firms to sell their excess
capital equipment and inventories to enhance supply chain performance.
5.4.5 Institutional Pressure and Supply Chain Performance
Based on the study findings that institutional pressure moderates the relationship
between internal environmental management, green purchasing, eco-design and
investment recovery and supply chain performance. Therefore, government should
ensure there are strict Local environmental laws. In addition, customer should demand
for environmental protection product. Moreover, there need to increase of environmental
awareness of the society and collaboration in environment with our suppliers. There is
need for improvements in developing green products of suppliers and products green
packaging of suppliers.
5.5 Further Research Recommendations
This study expands our knowledge on effects of green supply chain adoption on supply
chain performance: survey of Agri-Manufacturing Firms in Rwanda. Though this study
has fulfilled its aim and objectives, and there are several areas for additional studies and
empirical research, given the limitations of the research.

129
On a geographical dimension, this study was primarily limited to Agri-Manufacturing
Firms in Rwanda. Therefore, it may not be appropriate to generalize to the whole
population of firms in Rwanda or any other country. For this reason, further empirical
investigations in different regions and countries are needed.
The methodology that has been chosen to achieve the research objectives was limited to
questionnaires. As such, future research could build on this study by examining effects
of green supply chain performance in different sectors and industries in both a
qualitative and quantitative way. Also, a replication of this research on different
industries would provide data for comparison.

130
REFERENCES
AfDB. (2014). Eastern Africa’s Manufacturing Sector-Rwanda Country Report.
Retrieved from https://www.afdb.org/fileadmin/uploads/afdb/Documents/
Publications/RWANDA_manufacturing_COUNTRY_report.pdf.
Agro processing sector / Official Rwanda Export Website. Rwanda Development Board.
(2020). Retrieved from http://rdb.rw/export/export/products-directory/ agro-
processing-sector/.
Akroush, M. N., & Al-Mohammad, S. M. (2010). The effect of marketing knowledge
management on organizational performance: An empirical investigation of the
telecommunications organizations in Jordan. International journal of emerging
markets, 5(1), 38-77.
Al Khattab, S. (2012). Marketing Strategic Alliances: The Hotel Sector in Jordan.
International Journal of Business and Management, 7, 222-232.
Al Khattab, S. & Fraij, F. (2011). Assessing Students’ Satisfaction with Quality of
Service of Students Information System. Management and Marketing Journal,
9, 111-225.
Al Khattab, S., Abu-Rumman, A. & Massad, M. (2015). The Impact of the Green
Supply Chain Management on Environmental-Based Marketing Performance.
Journal of Service Science and Management, 8, 588-597.
Ali, A. Y. S., Ali, A. A., & Adan, A. A. (2013). Working conditions and employees’
productivity in manufacturing companies in sub-Saharan African context: Case
of Somalia. Educational Research International, 2(2), 67-78.
Ali, S. S., Kaur, R., Ersöz, F., Lotero, L., & Weber, G. W. (2019). Evaluation of the
effectiveness of green practices in manufacturing sector using CHAID
analysis. Journal of Remanufacturing, 9(1), 3-27.

131
Aliyu, A., Bello, M. U., Kasim, R., & Martin, D. (2014). Positivist and Non-Positivist
Paradigm in Social Science Research: Conflicting Paradigms or Perfect
Partners? Journal of Management and Sustainability, 4(3), 79-95.
Allred, S. B., & Ross-Davis, A. (2011). The drop-off and pick-up method: An approach
to reduce nonresponse bias in natural resource surveys. Small-Scale Forestry,
10(3), 305-318.
Amoroso, D. L. (2018). Predicting brand loyalty by measuring the strength of consumer
habit. Diverse Methods in Customer Relationship Marketing and Management,
256-276.
Appolloni, A., Sun, H., Jia, F., & Li, X. (2014). Green procurement in the private sector:
A state of the art review between 1996 and 2013. Journal of Cleaner
Production, 85, 122-133.
Archibald, M.E. (2017). Resource dependency theory. Retrieved from
https://www.britannica.com/topic/resource-dependency-theory. Encyclopædia
Britannica, inc.
Atmadja, A., & Saputra, K. (2018). The influence of village conflict, village apparatus
ability, village facilitator competency and commitment of local government on
the success of budget management. Academy of Accounting and Financial
Studies Journal, 22(1), 850-871.
Azevedo, S. G., Carvalho, H., & Cruz Machado, V. (2011). The influence of green
practices on supply chain performance: a case study approach. Transportation
Research Part E: Logistics and Transportation Review, 47(6), 850-871.
Barratt, M., Choi, T. Y., & Li, M. (2011). Qualitative case studies in operations
management: trends, research outcomes, and future research implications.
Journal of Operations Management, 29(4), 329-342.

132
Bhyrovabhotla, N. (2012). Resource Dependency Theory: Renaissance and Extensions:
A Conceptual Basis. Electronic Journal. Retrieved from: https://ssrn.com/
abstract=2015273
Borch, O. J., & Solesvik, M. (2015). Innovation on the Open Sea: Examining
Competence Transfer and Open Innovation in the Design of Offshore Vessels.
Technology Innovation Management Review, 5(9), 17−22.
Borchardt, M., Wendt, M.H., Pereira, G.M, & Sellitto, M.A. (2011). Redesign of a
component based on eco-design practices: environmental impact and cost
reduction achievements. Journal Cleaner of Production, 19(1), 49-57.
Callaway, S. K. (2017). How the Principles of the Sharing Economy Can Improve
Organizational Performance of the US Public School System. International
Journal of Public Policy and Administration Research, 4(1), 1-11.
Carey, S., Lawson, B., & Krause, D.R. (2011). Social capital configuration, legal bonds
and performance in buyer-Supplier relationships. Journal of Operations
Management, 29, 277-288
Carter, C. R., & Easton, P. L. (2011). Sustainable supply chain management: Evolution
and future directions. International Journal of Physical Distribution &
Logistics Management, 41(1), 46-62.
Chakravarthy, B., (1997). A new strategy framework for coping with turbulence. Sloan
Management Review, 38(4), 69-82.
Chen, C.C, Shih, H.S, Shyur, H.J, & Wu K.S. (2012). A business strategy selection of
green supply chain management via an analytic network process. Computers &
Mathematics with Applications, 64(8), 2544-2557

133
Chen, J.Z. (2009). Material flow and circular economy. Systems Research and
Behavioural Science. 26(2), 269-278.
Chicksand, D., Watson, G., Walker, H., Radnor, Z., & Johnston, R. (2012). Theoretical
perspectives in purchasing and supply chain management: An analysis of the
literature. Supply Chain Management: An International Journal, 17(4), 454-
472.
Chien, M. K., & Shih, L. H. (2014). An empirical study of the implementation of green
supply chain management practices in the electrical and electronic industry and
their relation to organizational performances. International Journal of
Environmental Science and Technology, 4(3), 383-394.
Chien, M. K., & Shih, L. H. (2014). An empirical study of the implementation of green
supply chain management practices in the electrical and electronic industry and
their relation to organizational performances. International Journal of
Environmental Science and Technology, 4(3), 383-394.
Chin, T., Tat, H., Sulaiman, Z., & Muhamad, Z, S. (2015). Green Supply Chain
Management Practices and Sustainability Performance. Advanced Science
Letters, 21(5), 1359-1362.
Chiu, J., & Hsieh, C. (2016). The Impact of Restaurants’ Green Supply Chain Practices
on Firm Performance. Sustainability, 8(1), 42.
Choi, T.Y., & Krause, D.R. (2006). The supply base and its complexity: implications for
transaction costs, risks, responsiveness, and innovation. Journal of Operations
Management, 24(5), 637-652.

134
Chu, S., Yang, H., Lee, M., & Park, S. (2017). The Impact of Institutional Pressures on
Green Supply Chain Management and Firm Performance: Top Management
Roles and Social Capital. Sustainability, 9(5), 764.
Chu, S. H., Yang, H., Lee, M., & Park, S. (2017). The impact of institutional pressures
on green supply chain management and firm performance: Top management
roles and social capital. Sustainability, 9(5), 764.
Connelly, L. M. (2011). Cronbach's alpha. Medsurg nursing, 20(1), 45-47.
Cooper, A. C., Gascon, F. Sexton, D. & Kasarda, J. (2012). Entrepreneurs, processes of
founding and new-firm performance in the state of the art of entrepreneurship,
(eds.), Boston: PWS-Kent.
Cooper, D. R. & Schindler, P. S. (2011). Business Research Methods. (11th ed.) New
York: McGraw-Hill.
Cooper, D., & Schinlder, P. (2011). Business research method. New York: McGrow-Hill
Higher Education.
Creswell, J., Codlin, A. J., Andre, E., Micek, M. A., Bedru, A., Carter, E. J., & Brouwer,
M. (2014). Results from early programmatic implementation of Xpert
MTB/RIF testing in nine countries. BMC infectious diseases, 14(1), 2.
Cruz, J.M. (2009). The impact of corporate social responsibility in supply chain
management: multicriteria decision-making approach. Decision Support
Systems. 48(1), 224-236.
Cruz, J.M. & Matsypura, D. (2009), “Supply chain networks with corporate social
responsibility through integrated environmental decision-making”,
International Journal of Production Research. 47(3), 621-648.
David, R. A., & Muthini, J. N. (2019). Influence of green supply chain management
practices on procurement performance of private health institutions in Kenya: A
case of Aga Khan Hospital Kisumu. The Strategic Journal of Business &
Change Management, 6(2), 1378-1396.

135
Davis G. F. & Cobb J. A. (2010). Resource Dependence Theory: Past and Future.
Oxford: Oxford Biography.
De Grosbois, D. (2016). Corporate social responsibility reporting in the cruise tourism
industry: A performance evaluation using a new institutional theory based
model. Journal of Sustainable Tourism. 24, 245-269.
DeVellis, R. F. (2012). Factor Analysis. Scale development: Theory and applications,
(Vol. 26). New Jersey: Sage publications.
Diab, S., AL-Bourini, F & Abu-Rumman, A. (2014). The Impact of Green Supply Chain
Management Practices on Organizational Performance: A Study of Jordanian
Food Industries. Journal of Management and Sustainability, 5(1), 149.
Dikko, M. (2016). Establishing Construct Validity and Reliability: Pilot Testing of a
Qualitative Interview for Research in Takaful (Islamic Insurance). Qualitative
Report, 21(3), 521 - 528.
Du Plessis, L. (2010). The relationship between perceived talent management practices,
perceived organizational support (POS), perceived supervisor support (PSS)
and intention to quit amongst Generation Y employees in the recruitment sector
Unpublished PhD dissertation, Pretoria: University of Pretoria.
Ellis, J. (2019). Crisis, Resilience, and the Time of Law. Canadian Journal of Law &
Jurisprudence. 32, 305-320.
Eltayeb, T., Zailani, S., & Ramayah, T. (2011). Green supply chain initiatives among
certified companies in Malaysia and environmental sustainability: Investigating
the outcomes. Resources, Conservation and Recycling, 55(5), 495-506.
Eltayeb, T.K., Zailani, S. & Ramayah, T. (2011). Green Supply Chain Initiatives among
Certified Companies in Malaysia and Environmental Sustainability:
Investigating the Outcomes. Resources, Conservation and Recycling, 55, 495-
506.

136
Epoh, L., & Mafini, C. (2018). Green supply chain management in small and medium
enterprises: Further empirical thoughts from South Africa. Journal of Transport
and Supply Chain Management, 12(1), 12.
Fain, J. S., Van Tongelen, A., Loriot, A., & De Smet, C. (2019). Epigenetic Coactivation
of MAGEA6 and CT-GABRA3 Defines Orientation of a Segmental
Duplication in the Human X Chromosome. Cytogenetic and genome research,
159(1), 12-18.
Biruta, V. (2016). Five ways Rwanda is leading on green growth. In World Economic
Forum. Retrieved from: https://www. weforum. org/agenda/2016/05/5-
waysrwanda-is-leading-on-green-growth.
Foo, P.Y., Lee, V.H., Tan, G.W.H., & Ooi, K.B. (2018). A gateway to realizing
sustainability performance via green supply chain management practices: A
PLS–ANN approach. Expert Systems with Applications. 107, 1-14.
Fragouli, E. & Yankson, J.K. (2015). The Role of Strategic Planning on the
Management of Organizational Change. Financial Risk and Management
Reviews, 1(2), 68-87.
Galbraith, J. K. (2015). The new industrial state. Princeton: Princeton University Press.
Gall, M. D., Gall, J. P., & Borg, W. R. (2014). Applying educational research: How to
read, do, and use research to solve problems of practice. New Delhi: Pearson
Higher Education.
Ganesh Kumar, C., Murugaiyan, P., & Madanmohan, G. (2017). Agri-food supply chain
management: literature review. Intelligent Information Management, 9, 68-96.
Geng, R.; Mansouri, S.A. & Aktas, E. (2017). The relationship between green supply
chain management and performance: A meta-analysis of empirical evidences in
Asian emerging economies. International Journal of Production Economy, 183,
245–258.

137
Ghasemi, A., & Zahediasl, S. (2012). Normality tests for statistical analysis: a guide for
non-statisticians. International journal of endocrinology and metabolism, 10(2),
486.
Ghazilla, R.A.R., Sakundarini, N., Abdul-Rashid, S.H., Ayub, N.S., Olugu, E.U. &
Musa, S.N. (2015). Drivers and Barriers Analysis for Green Manufacturing
Practices in Malaysian SMEs: A Preliminary Findings. Procedia CIRP, 26,
658-663.
González-García, S., Garcia L.R., Estévez, J., Pascual, R., Moreira, M.T., Gabarrell, X.,
Rieradevall, J., & Feijoo, G. (2012). Environmental Assessment and
Improvement Alternatives of a Ventilated Wooden Wall from LCA and DfE
Perspective. The International Journal of Life Cycle Assessment, 17(4), 432-
443.
González-García, S., García L.R., Moreira, M.T., Gabarrell, X., Rieradevall, J., Feijoo,
G., & Murphy, R.J. (2012). Eco-innovation of a Wooden Childhood Furniture
Set: An Example of Environmental Solutions in the Wood Sector. Science Total
Environment, 426, 318-26.
González-García, S., García, L.R., Buyo, P., Pascual, R.C., Gabarrell, X., Rieradevall, J.,
Moreira, M.T., & Feijoo, G. (2012). Eco-innovation of a Wooden Based
Modular Social Playground: Application of LCA and DfE Methodologies.
Journal of Cleaner Production, 27, 21-31.
González-García, S., Gasol, C. M., Lozano, R. G., Moreira, M. T., Gabarrell, X., i Pons,
J. R., & Feijoo, G. (2011). Assessing the global warming potential of wooden
products from the furniture sector to improve their ecodesign. Science of the
Total Environment, 410, 16-25.
González-García, S., Salinas-Mañas, L., García, L.R., Gabarrell, X., Rieradevall, J.,
Feijoo, G., & Moreira, M.T. (2013). The application of eco-design

138
methodology in SMEs run according to lean management: the case of a
furniture publishing company. Environmental Engineering Management
Journal, 13(12), 2977 - 2988.
González-García, S., Silva, F.J., Moreira, M.T., Castilla, P.R., García, L.R., Gabarrell,
X., & Government of Rwanda. (2011). Green Growth and Climate Resilience
National Strategy for Climate Change and Low Carbon Development. Kigali:
Government of Rwanda.
Govindan, K, Khodaverdi R, Vafadarnikjoo A. (2015). Intuitionistic fuzzy based
DEMATEL method for developing green practices and performances in a green
supply chain. Expert Systems with Applications, 42(20), 7207-7220
Govindan, K., Azevedo, S., Carvalho, H., & Cruz-Machado, V. (2013). Lean, green and
resilient practices influence on supply chain performance: interpretive structural
modeling approach. International Journal of Environmental Science and
Technology, 12(1), 15-34.
Green K. W., Zelbst, P. J., Meacham, J., & Bhadauria, V. S. (2012). Green supply chain
management practices: impact on performance. Supply Chain Management: An
International Journal, 17(3), 290-305.
Gualandris, J., & Kalchschmidt, M. (2014) Customer pressure and innovativeness: Their
role in sustainable supply chain management. Journal of Purchase and Supply
Management. 20, 92-103.
Guide, V.D R., & Wassenhove, L.N.V. (2009). The evolution of closed-loop supply
chain research. Operations Research, 57(1), 10–18.
Hair, J. F., Ringle, C. M., & Sarstedt, M. (2012). Partial least squares: the better
approach to structural equation modeling?. Long Range Planning, 45(5-6), 312-
319.

139
Hallam, C. & Contreras, C. (2016). Integrating lean and green management.
Management Decision, 54(9), 2157-2187.
Handfield, R.B. & Nichols, E.L. (2012). Supply Chain Redesign: Transforming Supply
Chains into Integrated Value Systems. Upper Saddle River, NJ: Financial
Times Prentice Hall.
Hanna, J.B., Hazen, B.T. & Cegielski, C. (2011). Diffusion of Green Supply Chain
Management Examining Perceived Quality of Green Reverse Logistics. The
International Journal of Logistics Management, 22, 373-389.
Harrison, A., & Hoek, R. (2011). Logistics management and strategy. Harlow, England:
Pearson/Financial Times Prentice Hall.
Harrison, V. (2011). Logistic Management and Strategy: Competing through the Supply
Chain. London: Prentice Hall.
Hayes, A. F., & Montoya, A. K. (2017). A tutorial on testing, visualizing, and probing
an interaction involving a multicategorical variable in linear regression
analysis. Communication Methods and Measures, 11(1), 1-30.
Hillman, A., Withers, M. & Collins, B. (2009). Resource Dependence Theory: A
Review. Journal of Management. 35(3), 383-396.
Hollos, D., Blome, C., & Foerstl, K. (2012). Does sustainable supplier co-operation
affect performance? Examining implications for the triple bottom line.
International Journal of Production Research. 50, 2968-2986.
Houghton, C., Casey, D., Shaw, D., & Murphy, K. (2013). Rigour in qualitative case-
study research. Nurse researcher, 20(4), 12–17.
Hubbard, R., Haig, B., & Parsa, R. (2019). The Limited Role of Formal Statistical
Inference in Scientific Inference. The American Statistician, 73(1), 91-98.

140
Jabbour, A., Frascareli, F., & Jabbour, C. (2015). Green supply chain management and
firms’ performance: Understanding potential relationships and the role of green
sourcing and some other green practices. Resources, Conservation and
Recycling, 104, 366-374.
Jaegler, A., & Sarkis, J. (2014). The Theory and Practice of Sustainable Supply Chains.
Supply Chain Forum: An International Journal, 15(1), 2-5.
Ji, X., Wu, J., & Zhu, Q. (2016). Eco-design of transportation in sustainable supply
chain management: A DEA-like method. Transportation Research Part D:
Transport and Environment, 48, 451–459.
Kankanit, K., & Busba, P. (2015). The Influence of Green Supply Chain Management
on Business Performance of Electronic Industry in Thailand. , International
Journal of Management and Applied Science (IJMAS), 1(11), 54-59.
Karazsia, B. T., Berlin, K. S., Armstrong, B., Janicke, D. M., & Darling, K. E. (2014).
Integrating mediation and moderation to advance theory development and
testing. Journal of pediatric psychology, 39(2), 163-173.
Kaur, J., Sidhu, R., Awasthi, A., Chauhan, S., & Goyal, S. (2017). A DEMATEL based
approach for investigating barriers in green supply chain management in
Canadian manufacturing firms”, International Journal of Production Research,
56(1-2), 312-332.
Ketchen Jr. D. J., & Hult, G. T. M. (2007). Bridging organization theory and supply
chain management: The case of best value supply chains. Journal of Operations
Management. 25(2), 573-580.
Ketokivi, M. (2019). Avoiding bias and fallacy in survey research: A behavioural
multilevel approach. Journal of Operations Management, 65(4), 380-402.

141
Ketokivi, M., & Choi, T. (2014). Renaissance of case research as a scientific method.
Journal of Operations Management, 32(5), 232-240.
Khan, S., & Qianli, D. (2017). Impact of green supply chain management practices on
firms’ performance: an empirical study from the perspective of Pakistan.
Environmental Science and Pollution Research, 24(20), 16829-16844.
Kim, J.H., Youn, S. and Roh, J.J. (2011). Green supply chain management orientation
and firm performance: evidence from South Korea. International Journal of
Services and Operations Management, 8(3), 283-304
Kirchoff, J. & Omar, A. & Fugate, B. (2015). A Behavioral Theory of Sustainable
Supply Chain Management Decision Making in Non-Exemplar Firms. Journal
of Supply Chain Management. 52(1), 41-65.
Kit, I. (2010). Value Chain Finance beyond Microfinance for Rural Entrepreneurs.
Nairobi: Royal Tropical Institute, Amsterdam, and International Institute of
Rural Reconstruction.
Koh, S.C.L., Gunasekaran, A. & Tseng, C.S. (2012). Cross-tier ripple and indirect
effects of directives WEEE and RoHS on greening a supply chain.
International Journal of Production Economics, 140(1), 305-317.
Koh, S.C.L., Morris, J., Ebrahimi, S.M. & Obayi, R. (2016). Integrated resource
efficiency: Measurement and management. International Journal of Operations
and Production Management, 36(11), 1576-1600.
Koufteros, X.A., Cheng, T.C.E., & Lai, K.H. (2007). Black-box and grey-box supplier
integration in product development: antecedents, consequences and the
moderating role of firm size. Journal of Operations Management, 25(4), 847–
870.

142
Kozlenkova, I.V., Samaha, S.A., & Palmatier, R.W. (2014). Resource-based theory in
marketing. Journal of the Academy of Marketing Science, 42(1), 1–21.
Krause, D. R., Vachon, S. & Klassen, R. D. (2009). Special topic forum on sustainable
supply chain management: Introduction and reflections on the role of
purchasing management. Journal of Supply Chain Management. 45(4), 18-25.
Kumar, R., & Chandrakar, R., (2012). Evaluation and Measurement of Performance of
GSCM in Chhattisgarh Manufacturing Industries (INDIA). International
Journal of Application or Innovation in Engineering & Management, 2(6), 240-
249.
Laari, S., Töyli, J., Solakivi, T., & Ojala, L. (2016). Firm performance and customer-
driven green supply chain management. Journal of Cleaner Production, 112,
1960-1970.
Lai, K., Wong, C.W., & Lam, J.S.L. (2015). Sharing environmental management
information with supply chain partners and the performance contingencies on
environmental munificence. International Journal Production Economy, 164,
445-453.
Lai, K.H., Wong, C.W.Y. & Lun, Y.H.V. (2014). The role of customer integration in
extended producer responsibility: a study of Chinese export manufacturers”,
International Journal of Production Economics. 147(1), 284-293.
Lakshmimeera, B.L. & Palanisamy, C. (2013). A Conceptual Framework on Green
Supply Chain Management Practices. Industrial Engineering Letters, 3(10), 42-
52.
Lavrakas, P. (2010). Target Population. Encyclopedia of Survey research
methods. Reference Reviews. 24(10, 26-27.

143
Leech, N. L., & Onwuegbuzie, A. J. (2011). Beyond constant comparison qualitative
data analysis: Using NVivo. School Psychology Quarterly, 26(1), 70.
Leigh, M., & Li, X. (2015). Industrial ecology, industrial symbiosis and supply chain
environmental sustainability: a case study of a large UK distributor. Journal of
Cleaner Production, 106, 632-643.
Liu, J., Feng, Y., Zhu, Q., & Sarkis J. (2018). Green supply chain management and the
circular economy: Reviewing theory for advancement of both fields.
International Journal of Physical Distribution & Logistics Management, 2017-
2049.
Luthra S, Garg D, & Haleem A. (2016). The impacts of critical success factors for
implementing green supply chain management towards sustainability: An
empirical investigation of Indian automobile industry. Journal of Cleaner
Production, 121, 142-158.
Madhani, P., M. (2010) Resource Based View (RBV) of Competitive Advantages:
Importance, Issues and Implications. Journal of Indian Management Research
and Practices, 1(2), 2-12.
Malviya, R.K. & Kant, R. (2015). Green supply chain management (GSCM): A
structured literature review and research implications. Benchmarking: An
International Journal, 22(7), 1360-1394.
Mangla, S.K., Luthra, S., Mishra, N., Singh, A., Rana, N.P., Dora, M. & Dwivedi, Y.
(2018). Barriers to effective circular supply chain management in a developing
country context. Production Planning and Control, 29(6), 551-569.
Markley, M., & Davis, L. (2007). Exploring future competitive advantage through
sustainable supply chains. International Journal of Physical Distribution &
Logistics Management, 37(9), 763-774.

144
Marolt, M., Zimmermann, H. D., Žnidaršič, A., & Pucihar, A. (2020). Exploring Social
Customer Relationship Management Adoption in Micro, Small and Medium-
Sized Enterprises. Journal of theoretical and applied electronic commerce
research, 15(2), 38-58.
Matos, S., & Hall, J. (2007). Integrating sustainable development in the supply chain:
the case of life cycle assessment in oil and gas and agricultural biotechnology.
Journal of Operations Management, 25(6), 1083–1102.
Meysamie, A., Taee, F., Mohammadi-Vajari, M., Yoosefi-Khanghah, S., Emamzadeh-
Fard, S., & Abbassi, M. (2014). Sample size calculation on web, can we rely on
the results? Journal of Medical Statistics and Informatics, 2(1), 3.
Miao, X., & Xi, B. (2007). CAS-based social network analysis for collaborative
management in the green supply chain network system. International Journal
of Networking and Virtual Organisations 4(4), 446–458.
MINECOFIN. (2011). Budget Framework Paper (2010/11-2012/13). Kigali:
MINECOFIN.
Ming-Kuei, C. (2014). Influences of Green Supply Chain Management Practices on
Organizational Sustainable Performance. International Journal of
Environmental Monitoring and Protection, 1, 12-23.
MINICOM. (2014). Industrial Master Plan for the Agro-Processing Subsector (2014 -
2020) (p. 46). Kigali: MINICOM.
Ministry of Environment, (2017). Evaluation of the Green Growth and Climate
Resilience Strategy (GGCRS) Implementation. Kigali: Ministry of Environment,
p.39.
Mohamad, M., & Koilpillai, C. (2018). The Influence of Green Supply Chain Practices
towards Environmental Development: The Malaysian ISO14001 Certified

145
Manufacturing Companies Perspective. Journal of Southeast Asian Research,
2018, 1-10.
Muma, B. O., & Nyambega, E. K. (2014). Green Supply Chain. International Journal of
Economics, Finance and Management Science, 270-276
Mweru, C. & Maina, T. (2015). Features of Resource Based View Theory: An Effective
Strategy in Outsourcing. International Journal of Management and Commerce
Innovations, 3, 215-218.
Nderitu, K. M & Ngugi, K. (2014). Effects of Green Procurement Practices on an
Organization Performance in Manufacturing Industry: Case Study of East
African Breweries Limited. European Journal of Business Management, 2(1),
341-352.
Ninlawan, C., Seskan, P., Tossapol, K. & Pilada, W. (2010). The implementation of
Green Supply Chain Management Practices in Electronics industry.
NISR, (2018). Gross Domestic Product Second Quarter 2018. Kigali: National Institute
of Statistics.
NISR, (2019). Rwanda Seasonal Agriculture Survey 2017. Kigali: National Institute of
Statistics.
Nixon, R. (2006). Slow Violence, Gender, and the Environmentalism of the Poor.
Journal of Commonwealth and Postcolonial Studies. 13. 14-37.
Nunes, B., Bennett, D., Shaw, D., & Theodorakopoulos, N. (2012). Philosophy, Theory
and Practice of Green Operations Management. In Khalil T, Hosni Y and Hung
SC (Eds) Managing Technology-Service Convergences in the Post-
Industrialized Society, Proceedings of 21st International Conference of the

146
International Association for Management of Technology, IAMOT/National
Tsing Hua University, Hsinchu, Taiwan..
Ofori, G. (2010) Greening the construction supply chain in Singapore. European
Journal of Purchasing and Supply Management, 6, 195-206.
Oluwasola, O. (2020). Environmental Pollution is Inevitable in Developing Countries.
Retrieved from: http://breakingenergy.com/2014/09/23/environmental-
pollution-is-inevitable-in-developing-countries/
Pagell, M., & Wu, Z. (2009). Building a more complete theory of sustainable supply
chain management using case studies of 10 exemplars. Journal of supply chain
management, 45(2), 37-56.
Pandian, G. R. S., & Abdul-Kader, W. (2017). Performance evaluation of reverse
logistics enterprise–an agent-based simulation approach. International Journal
of Sustainable Engineering, 10(6), 384-398.
Park-Poaps, H. & Rees, K. (2010). Stakeholder Forces of Socially Responsible Supply
Chain Management Orientation. Journal of Business Ethics. 92(2), 305-322.
Pearlson, K. E., & Saunders, C. S. (2013). Managing and using information systems: a
strategic approach. Hoboken, NJ: John Wiley & Sons.
Petrescu, M. (2013). Marketing research using single-item indicators in structural
equation models. Journal of Marketing Analytics, 1(2), 99-117.
Podsakoff, P. M., MacKenzie, S. B., & Podsakoff, N. P. (2012). Sources of method bias
in social science research and recommendations on how to control it. Annual
review of psychology, 63, 539-569.
Prigogine, L., (1984). Order out of Chaos., New York: Random House.

147
Pullman, M., Maloni, M., & Carter, C. (2009). Food For Thought: Social Versus
Environmental Sustainability Practices And Performance Outcomes. Journal of
Supply Chain Management, 45(4), 38-54.
Rao, P. (2012). Greening the supply chain: a new initiative in South East Asia.
International Journal of Operation and Production Management, 22(6), 632-
655.
REMA, (2014). Training Manual on Environment and Climate Change for
Environmental Organizations. Kigali: REMA, p.10.
REMA. (2015). Sector Specific Guidelines For Mainstreaming Climate Change In The
Manufacturing Industry Sector In Rwanda. Rwanda: REMA.
REMA. (2017). Evaluation of the Green Growth and Climate Resilience Strategy
(GGCRS) Implementation (p. 39). Kigali: REMA.
Rha, J.S. (2010). The Impact of Green Supply Chain Practices on Supply Chain
Performance. Unpublished MA, University of Nebraska at Lincoln Available at
http://digitalcommons.unl.edn/businessdiss/l 1
Rieradevall, J., González-García, S., Silva, F. J., Moreira, M. T. Pascual, R. C., Lozano,
R. G., Gabarrell, X., ... & Feijoo, G. (2011). Combined application of LCA and
eco-design for the sustainable production of wood boxes for wine bottles
storage. The International Journal of Life Cycle Assessment, 16(3), 224-237.
Rodes, C. & Ward, M. (2014). Small businesses and the UK economy. Standard Note:
SN/EP/6078. Office for National Statistics.
Rwanda Standards Board. (2012). Rwanda skills survey 2012. Manufacturing sector
report. Kigali: RSB.

148
Sanyé-Mengual, E., Lozano, R., Farreny, R., Oliver-Solà, J., Gasol, C., & Rieradevall, J.
(2014). Introduction to the Eco-Design Methodology and the Role of Product
Carbon Footprint. Assessment of Carbon Footprint in Different Industrial
Sectors, 1, 1-24.
Sarkis, J. (2012). A boundaries and flows perspective of green supply chain
management. Supply Chain Management International Journal, 17, 202-216.
Sarkis, J., Gonzalez-Torre, P., & Adenso-Diaz, B. (2010). Stakeholder pressure and the
adoption of environmental practices: The mediating effect of training. Journal
of Operations Management. 28, 163-176.
Sarkis, J., Zhu, Q., & Lai, K. (2011). An organizational theoretic review of green supply
chain management literature. International Journal of Production Economy,
130, 1–15.
Schmidt, C. G., Foerstl, K., & Schaltenbrand, B. (2017). The supply chain position
paradox: green practices and firm performance. Journal of supply chain
management, 53(1), 3-25.
Schrettle, S., Hinz, A., Scherrer -Rathje, M., & Friedli, T. (2014). Turning sustainability
into action: Explaining firms' sustainability efforts and their impact on firm
performance. International Journal of Production Economics, 147, 73-84.
Sekaran, U., & Bougie, R. (2010). Research for Business-A Skill Building Approach.
The Journal of Social Sciences Research, Special, (4), 44-49.
Sellitto, M., Luchese, J., Bauer, J., Saueressig, G., & Viegas, C. (2017). Ecodesign
Practices in a Furniture Industrial Cluster of Southern Brazil: From Incipient
Practices to Improvement. Journal of Environmental Assessment Policy And
Management, 19(01), 1750001.

149
Setyadi, A., (2019). Does green supply chain integration contribute towards sustainable
performance? Uncertain Supply Chain Management, pp.121-132.
Seuring, S. & Müller, M. (2008). From a literature review to a conceptual framework for
sustainable supply chain management. Journal of Cleaner Production. 16(15),
1699-1710.
Seuring, S. (2014). Industrial ecology, life cycles, and supply chains: differences and
interrelations. Business Strategy and the Environment 13(5), 306–319
Sezen, B., & Çankaya, S. Y. (2018). Green supply chain management theory and
practices. In Operations and Service Management: Concepts, Methodologies,
Tools, and Applications (pp. 118-141). IGI Global.
Sharma, V., Chandna, P., & Bhardwaj, A. (2017). Green supply chain management
related performance indicators in agro industry: A review. Journal Of Cleaner
Production, 141, 1194-1208.
Shi, H., Chertow, M., & Song, Y. (2010). Developing country experience with eco-
industrial parks: A case study of the Tianjin Economic-Technological Develop-
ment Area in China. Journal of Cleaner Production 18(3), 191–199.
Shi, V. G., Koh, S. L., Baldwin, J., & Cucchiella, F. (2012). Natural resource based
green supply chain management. Supply Chain Management: An International
Journal, 17(1), 54-67.
Silverman, D. (Ed.). (2016). Qualitative research. London: Sage.
Solér, C., Bergström, K. & Shanahan, H. (2010) Green Supply Chains and the Missing
Link between Environmental Information and Practice. Business Strategy and
the Environment, 19, 14-25.

150
Solesvik, M. (2017b). The Triple Helix Model for Regional Development and
Innovation: Context of Nordic Countries. Forum Scientiae Oeconomia, 5(4), 5-
21.
Tabachnik, B. G., & Fidell, S. L. (2013). Multicollinearity and singularity. Using
multivariate statistics. Boston: Pearson Education Inc, 2(013), 88-91.
Tingley, D., Yamamoto, T., Hirose, K., Keele, L., & Imai, K. (2014). Mediation: R
package for causal mediation analysis. Journal of Statistical Software, 59(5), 1-
38.
Toke, L., Gupta, R.C. & Dandekar, M. (2012). An empirical study of green supply chain
management in Indian perspective. International Journal of Applied Sciences
and Engineering Research. 1, 372-383.
Touboulic, Anne & Walker, Helen. (2015). Theories in sustainable supply chain
management: A structured literature review. International Journal of Physical
Distribution & Logistics Management. 45, 10.
Treiblmaier, H., & Filzmoser, P. (2011). Benefits from using continuous rating scales in
online survey research. ICIS 2011 Proceedings. 1. Retrieved from:
https://aisel.aisnet.org/icis2011/proceedings/researchmethods/1
United Nations Economic Commission for Africa. (2010). Promoting High-Level
Sustainable Growth To Reduce Unemployment In Africa. Addis Ababa:
UNECA.
Van Hoek, R.I. (2012). Case studies of greening the automotive supply chain through
technology and operations. International Journal of Technology Management.
23(1), 89-112.
Van Tonder, E., & Ehlers, L. (2011). Factors threatening the survival of independent
financial advisers in their organisational life cycle: an exploratory study. South
African Journal of Economic and Management Sciences, 14(2), 155-169.
151
Vanalle, R.M.; Ganga, G.M.D.; Godinho Filho, M. & Lucato, W.C. (2017). Green
supply chain management: An investigation of pressures, practices, and
performance within the Brazilian automotive supply chain. Journal of Clean
Production, 151, 250–259.
Volberda, H., & Karali, E. (2015). Reframing the Compositional Capability: A
Resource-Based View on ‘A Composition-Based View of Firm Growth’.
Management and Organization Review, 11(3), 419-426.
Wagner, S. M., & Bode, C. (2016). An empirical investigation into supply chain
vulnerability. Journal of Purchasing & Supply Management, 12, 301-312.
Wolf, J. (2014). The relationship between sustainable supply chain management,
stakeholder pressure and corporate sustainability performance. Journal of
Business Ethics. 119, 317-328.
Yan, P., Yao, L., Li, H., Zhang, M., Xun, Y., & Li, M. (2019). The methodological
quality of robotic surgical meta-analyses needed to be improved: a cross-
sectional study. Journal of Clinical Epidemiology, 109, 20-29.
Yang, C., Lu, C., Haider, J., & Marlow, P. (2013). The effect of green supply chain
management on green performance and firm competitiveness in the context of
container shipping in Taiwan. Transportation Research Part E: Logistics and
Transportation Review, 55, 55-73.
Yang, C.L., Lin, S.P., Chan, Y.H., & Sheu, C. (2010). Mediated effect of environmental
management on manufacturing competitiveness: An empirical study.
International Journal of Production Economics, 123(1), 210-220.
Yang, C. S. (2017). An analysis of institutional pressures, green supply chain
management, and green performance in the container shipping

152
context. Transportation Research Part D: Transport and Environment, 61, 246-
260.
Yang, J., Han, Q., Zhou, J., & Yuan, C. (2015). The influence of environmental
management practices and supply chain integration on technological innovation
performance Evidence from China’s manufacturing industry. Sustainability,
7(11), 15342-15361.
Yusuf, Y.Y, Gunasekaran, A., Musa, A., EI-Berishy, N.M, Abubakar, T., & Ambursa,
H.M. (2013). The UK oil and gas supply chains: An empirical analysis of
adoption of sustainable measures and performance outcomes. International
Journal of Production Economics, 146(2), 501-514
Zaid, A., Jaaron, A., & Talib Bon, A. (2018). The impact of green human resource
management and green supply chain management practices on sustainable
performance: An empirical study. Journal of Cleaner Production, 204, 965-
979.
Zailani, S, Govindan, K, Iranmanesh, M, Shaharudin, M.R, & Chong, Y.S. (2015).
Green innovation adoption in automotive supply chain: The Malaysian case.
Journal of Cleaner Production, 108, 1115-1122
Zhang, Y., Sun, Y., & Xie, B. (2015). Quality of health information for consumers on
the web: a systematic review of indicators, criteria, tools, and evaluation results.
Journal of the Association for Information Science and Technology, 66(10),
2071-2084.
Zhu, Q. & Geng Y. (2013). Drivers and barriers of extended supply chain practices for
energy saving and emission reduction among Chinese manufacturers. Journal
of Clean Production, 40, 6-12.

153
Zhu, Q., Geng, Y. & Lai, K. (2010). Circular economy practices among Chinese
manufacturers varying in environmental-oriented supply chain cooperation and
the performance implications. Journal of Environmental Management, 91(6),
1324-1331.
Zhu, Q., Sarkis, J., & Lai, K. (2013). Institutional-based antecedents and performance
outcomes of internal and external green supply chain management practices.
Journal of Purchasing and Supply Management, 19(2), 106-117.
Zhu, Q., Sarkis, J., & Lai, K. H. (2013). Examining the effects of green supply chain
management practices and their mediations on performance improvements.
International Journal of Production Research. 50(5), 1377-1394.
Zhu, Q., Sarkis, J., & Lai, K. H. (2013). Examining the effects of green supply chain
management practices and their mediations on performance improvements.
International Journal of Production Research, 50(5), 1377-1394.
Zikmund, W. G., Babin, B. J., Carr, J. C., & Griffin, M. (2010). Business research
methods. (8th ed.). Mason, HO: Cengage Learning
Zsidisin, G.A. & Siferd, S.P. (2010). Environmental purchasing: a framework for theory
development. European Journal of Purchasing & Supply Management, 7(1),
61-73.

154
APPENDICES
Appendix I. Questionnaire
Dear Respondent,
RE: REQUEST TO FILL THE ATTACHED QUESTIONNAIRE
I am PHD student of JKUAT pursuing a doctorate course in the School of Business and
Economic. I am currently on research work and would like to request your assistance to
fill the attached questionnaire. The questionnaire has been designed to gather
information on the “EFFECTS OF GREEN SUPPLY CHAIN ADOPTION ON THE
PERFORMANCE OF AGRI-MANUFACTURING FIRMS IN RWANDA”, The
information you will present was entirely for academic and learning purposes and was
treated with utmost confidentiality.
Thank you.
SECTION A: DEMOGRAPHIC INFORMATION
In this section the study would like you to provide some background information about
yourself.
Kindly tick ( ) appropriately where necessary.
How many employees does the firm have ……?
How many years has the firm been in operation………………………?

155
SECTION B: INTERNAL ENVIRONMENT MANAGEMENT PRACTICES
In this section the study is interested in your view about internal environment
management practices. Read each of the statements carefully and tick the appropriate
choice.
Key SA- Strongly Agree, A- Agree, N- Neutral, D- Disagrees, SD – Strongly Disagree
INTERNAL ENVIRONMENT MANAGEMENT
PRACTICES SA A N D SD
IEM1 The firm senior managers are committed to GSCM
IEM2 The firm mid-level managers support for GSCM
IEM3 The firm has teams responsible for environmental
improvements
IEM4 The firm has total quality environmental management
IEM5 The firm has ISO 14001 certification for complying with
environmental compliance and auditing programs
IEM6 The firm has environmental management systems
IEM7 The firm emphasizes for Eco-labeling of Products
IEM8 The firm support for environment regulations
SECTION C: GREEN PURCHASING
In this section the study is interested in your view about External environment
management practices. Read each of the statements carefully and tick the appropriate
choice.
Key: SA- Strongly Agree, A- Agree, N- Neutral, D- Disagrees, SD – Strongly Disagree
Green purchasing SA A N D SD
GP1 The firm provide design specification to suppliers that include
environmental requirements for purchased item
GP2 The firm cooperate with its suppliers for environmental
objectives through sharing ideas
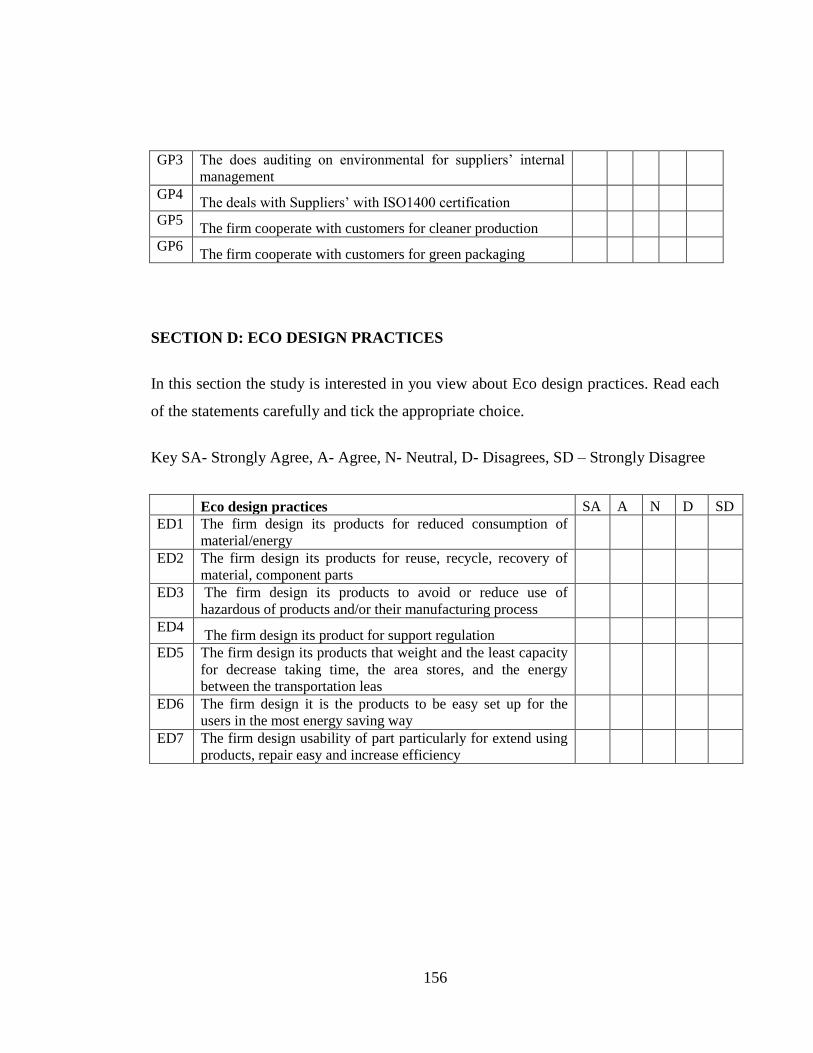
156
GP3 The does auditing on environmental for suppliers’ internal
management
GP4 The deals with Suppliers’ with ISO1400 certification
GP5 The firm cooperate with customers for cleaner production
GP6 The firm cooperate with customers for green packaging
SECTION D: ECO DESIGN PRACTICES
In this section the study is interested in you view about Eco design practices. Read each
of the statements carefully and tick the appropriate choice.
Key SA- Strongly Agree, A- Agree, N- Neutral, D- Disagrees, SD – Strongly Disagree
Eco design practices SA A N D SD
ED1 The firm design its products for reduced consumption of
material/energy
ED2 The firm design its products for reuse, recycle, recovery of
material, component parts
ED3 The firm design its products to avoid or reduce use of
hazardous of products and/or their manufacturing process
ED4 The firm design its product for support regulation
ED5 The firm design its products that weight and the least capacity
for decrease taking time, the area stores, and the energy
between the transportation leas
ED6 The firm design it is the products to be easy set up for the
users in the most energy saving way
ED7 The firm design usability of part particularly for extend using
products, repair easy and increase efficiency

157
SECTION E: INVESTMENT RECOVERY
In this section the study is interested in your view about Investment Recovery. Read
each of the statements carefully and tick the appropriate choice.
Key SA- Strongly Agree, A- Agree, N- Neutral, D- Disagrees, SD – Strongly Disagree
Investment Recovery SA A N D SD
IR1 The firm sales its excess inventories/materials
IR2 The firm sales its scrap and used materials
IR3 The firm sales its excess capital equipment
IR4 The firm does recycle some of its used products
IR5 The firm Collect and recycle end-of-life products and
materials
IR6 The firm has Established a recycling system for used and
defective product
SECTION F: INSTITUTIONAL PRESSURE
IP1 Local environmental laws put pressure on our GSCM.
IP2 The environmental protection demands from our domestic
customers put increasing pressure on our GSCM.
IP3 The increase of environmental awareness of the society boosts
pressure on our GSCM.
IP4 The collaboration in environment with our suppliers boosts
pressure on our GSCM.
IP5 The improvements in developing green products of our
suppliers boost pressure on our GSCM.
IP6 The improvements in products green packaging of our suppliers
boost pressure on our GSCM.
IP7 The green strategy of the manufacturers who produce the same
products as we boost pressure on our GSCM
IP8 The green strategy of the manufacturers who produce the
substitute products as we boost pressure on our GSCM.
IP9 The requirements of green development from the industry
association boost pressure on our GSCM.

158
SECTION G: SUPPLY CHAIN PERFORMANCE
In this section the study is interested in your view about supply chain performance. Read
each of the statements carefully and tick the appropriate choice.
Key SA- Strongly Agree, A- Agree, N- Neutral, D- Disagrees, SD – Strongly Disagree
supply chain performance SA A N D SD
SCP1 The ability to customize product to meet specific
customer demand
SCP2 The firm has customer responsiveness flexibility
SCP3 The firm has low percentage of defects
SCP4 The firm has high percentage of finished goods in
transit
SCP5 There is efficiency of purchase order cycle time
SECTION I: Supply Chain and Agribusiness in RWANDA
1. What do you suggest as a proper way of supply chain handling using green
practices in agribusiness industry in Rwanda?
2. Where do you see the weakness in incorporating green practices in supply chain
in agribusiness industry in Rwanda?
THANK YOU.

159
Appendix II: Agro-Processing Firms in Rwanda
S/N COMPANY PRODUCT/ BRAND LOCATION CONTACT
1. ABDC Honey Nyarugenge
District
Tel:(+250)788 355 616
E-mail: [email protected]
2. ADMA International Ltd Biscuits Gasabo
District
Tel:(+250)788 307 171
E-mail: [email protected]
3. AFRICA IMPROVED
FOODS Ltd.
SUPER CEREAL PLUS; NOOTRI TOTO; NOOTRI
MAMA; NOOTRI FAMILY; SHISHA KIBONDO
Gasabo
District
Tel:(+250) 788 389 517
E-mail: [email protected]
4. AGAHEBUZO DRINKINGS Ltd Ikaze iwacu Banana Based Alcoholic Beverage; Isonga
Banana Based Alcoholic Beverage
Gasabo
District
Tel:(+250) 788 536 434
E-mail: [email protected]
5. AGASHINGURACUMU Umunara urwagwa
Mucyurabohoro Butunda
Izimano Inkangaza
Rwamagana
District
Tel:(+250) 788 505196
Email: [email protected]
6. AGROPY Ltd Tuuza Natural Spray
Biretirepel insect killer
Pyrethrum EWC+
Musanze
District
Tel:(+250)788 384 846
E-mail: [email protected]
7. AKANYAMUNEZA Ltd Akanyamuneza Banana Based Alcoholic
Beverage
Nyanza
District
Tel:(+250) 788 751286
Email: [email protected]
8. BAKHRESA Grain Milling
Rwanda Ltd
Azam Special Bakers Flour; Azam Cake Flour; Azam
White Gold Flour; Azam Biscuit Flour; Azam Ngano
Bora Plus Flour; Azam Atta Flour; Azam Brown Flour;
Gasabo
District
Tel:(+250) 788 381 498
E-mail: [email protected]

160
Azam Pattent Flour; Azam Home Baking Flour
9. BLESSED DAIRIES Ltd Fermented Milk; Unsalted Butter.
Mozzarella Cheese; Strawberry Flavoured Yoghurt;
Vanilla Flavoured Yoghurt; Pineapple Flavoured
Yoghurt
Plain Yoghurt; Fresh Cream
Gicumbi
District
Tel:(+250)788 652 783
E-mail: [email protected]
10. BRALIRWA Ltd Primus Beer; Amstel Beer; Legend Beer
Mütziig Beer; Turbo King beer; Coke
Coke Zero; Sprite; Fanta Fiesta; Fanta Citron; Fanta
Orange; Stoney Tangawizi; Vital’o Eau Gazeuse
Rubavu &
Kicukiro
Districts
Tel:(+250) 252 587 200
E-mail: [email protected]
11. BURERA DAIRY Ltd Burera Fermented milk; Burera Processed cheese Burera
District
Tel:(+250)788 302 613
E-mail: [email protected]
12. CAFERWA Ltd Tora Roasted coffee beans.
Tora Roasted ground coffee
Nyarugenge
District
Tel:(+250) 788 562 663
E-mail:info @caferwa.com
13. CARMEL SAINTE
THERESE DE JESUS
La Carmela Delice Mango Wine
La Carmela Delice Strawberry
La Carmela Delice Jackfruit Wine
La Carmela Delice Gooseberries
La Carmela Delice Banana Wine
La Carmela Delice Grape Wine
Nyarugenge
District
Tel:(+250) 782 172 025
E-mail: [email protected]

161
14. CENTRE CANA Vin de Maracuja
Vin d’Ananas
Vin de Banane
Rusizi
District
Tel:(+250) 785 813 602
E-mail: [email protected]
15. CETRAF Ltd
Musanze Wine No.1 (Ginger
flavoured wine)
Musanze Banana Based
Alcoholic Beverage
Musanze
District
Tel:(+250)788 854 098
E-mail: [email protected]
16. COOPEDUSH Ltd Passion Nectar
Passion Squash
Karongi
District
Tel:(+250)788 606 564
E-mail: [email protected]
17. COPROVIBA Ibanga Banana Based Alcoholic Beverage Ngoma
Distcrict
Tel:(+250) 787 520 216
E-mail: [email protected]
18. CRYSTAL INDUSTRIES
Ltd.
Crystal Citrus Flavoured Drink
Crystal Orange Flavoured Drink
Crystal Cola Flavoured Drink
Crystal Apple Flavoured Drink
Bugesera
District
Tel:(+250)788 300 017
E-mail: [email protected]
19. DUSANGIRE
PRODUCTION Ltd
Amahumbezi Urwagwa
Agasembuye Inkangaza
Bugesera
District
Tel:(+250) 788 853 089
E-mail: [email protected]
20. EAST AFRICAN FOODS &
BEVERAGES Ltd
Joy Strawberry FlavouredYoghurt
Joy Natural/Plain Yoghurt; Joy Vanilla Flavoured Ice
Cream; Joy Strawberry Flavoured Ice cream; Joy
Kicukiro
District
Tel:(+250) 726 445 335
E-mail: eastafricanfoods

162
Chocolate Flavoured Ice Cream; Joy Mango Flavoured
Ice Cream
@gmail.com
21. EMMERI Ltd
Iwacu-Inkangaza
Intango-Butunda
Umutako Urwagwa Rusanzwe
Gasabo
District
Tel:(+250) 787 195 126
E-mail: mukacatheline10
@gmail.com
22. FARM FRESH FOOD
COMPANY LTD
Farm Fresh Mixed Beans
Farm Fresh High Iron Beans
Gasabo
District
Tel:(+250)781 285 042
E-mail: [email protected]
23. FROMAGERIE LA
LUMIERE
Ikimuri Gouda Cheese (Non-coloured) Musanze
District
Tel:(+250)788305430
E-mail: [email protected]
24. FUMBWE MULTI
SECTORIAL FARM (FMSF) Ltd
Indatwa Fermented Milk
Indatwa Vanilla Yoghurt
Indatwa Strawberry Yoghurt
Indatwa Fresh Cream
Rwamagana
District
Tel:(+250) 788 304 525
E-mail: indatwadairyfarm
@yahoo.com
25. GABI Ltd FHIA Banana Based Alcoholic beverage Gisagara
District
Tel:(+250)788 522 592
E-mail: [email protected]
26. GISHWATI FARMS Ltd
Gishwati Farms fermented milk.
Gishwati Farms Strawberry Flavoured
Gishwati Farms Gouda Cheese
Gishwati Farms Mozzarella Cheese
Rulindo
District
Tel:(+250) 788 465 258
E-mail:
27. GLOBAL TRADING IMPEX SERENA NICE CREAM Mango Flavored Kicukiro Tel:(+250) 788 300 979

163
Ltd
SERENA NICE CREAM Strawberry
SERENA NICE CREAM Passion fruit Flavored;
SERENA NICE CREAM Coffee taste Flavored;
SERENA NICE CREAM Chocolate taste; SERENA
NICE CREAM Vanilla taste Flavored
District
E-mail: [email protected]
28. GREEN FOOD LTD
Imena Fermented milk
Imena Strawberry Yoghurt
Imena Vanilla Yoghurt
Gasabo
District
Tel:(+250) 788 306 441
E-mail: [email protected]
29. GREEN HARVEST
PRODUCTS Ltd
Sabana Ketchup
Sabana Classic Chili Sauce
Sabana Gold Chili Sauce
Kicukiro
District
Tel:(+250) 786 483 539
E-mail: [email protected]
30. HOLLANDA FAIR
FOODS Ltd
Winnaz Potato Crisps Musanze
District
Tel:(+250)789 055 892
E-mail: [email protected]
31. IHURIRO UBWIZA BWA
NYUNGWE
Ubuzima Honey Nyamagabe
District
Tel:(+250) 788 846 664
E-mail: [email protected]
32. INDAKEMWA Ltd. Indakemwa Urwagwa rw’Ibitoki (Butun
da)
Kicukiro
District
Tel:(+250)788 532 355
E-mail: [email protected]
33. INEZA AYURVEDIC Ltd Meraneza Ginger Flavoured Wine Musanze
District
Tel:(+250) 784 863 030
E-mail: [email protected]
34. INGABO DAIRY Ltd
Strawberry Flavoured Yoghurt; Vanilla Flavoured
Yoghurt; Gouda cheese; Unsalted butter
Nyabihu
District
Tel:(+250) 788 730 063
E-mail: [email protected]

164
35. INSTITUT ATHOLIQUE
DE KABGAYI
Banana Juice of Kabgayi
Butunda of Kabgayi
Muhanga
District
Tel:(+250)788 478 500
E-mail: [email protected]
36. INYAMAMARE Ltd Inyamamare Banana Based
Alcoholic Beverage
Gisagara
District
Tel:(+250) 785056215
E-mail: [email protected]
37. INYANGE INDUSTRIES
Ltd
Inyange UHT Milk; Inyange UHT Low-Fat Milk;
Inyange Ikivuguto Cultured Milk; Inyange Strawberry
yoghurt.
Inyange Vanilla yoghurt; Inyange Butter
Inyange Orange based soft Drink; Inyange Mango based
soft drink; Inyange Strawberry based soft drink.
Inyange fruit cocktail soft drink.
Inyange Pineapple juice, Inyange Apple; juice, Inyange
Orange juice; Inyange Passion fruit nectar; Inyange
Mango nectar
Gasabo
District
Tel:(+250) 788 161 900
E-mail: info
@inyangeindustries.com
38. IPFG Ltd
Komezubuzima Composite Flour
Komezubuzima Roasted Soybean Flour
Nyamagabe
District
Tel:(+250)785 762 446
E-mail: [email protected]
39. IRUZU COMPANY Ltd 1000 Hills Whisky
1000 Hills Vodka
1000 Hills Gin
1000 Hills Rum
Kicukiro
District
Tel: (+250) 788 313 399
Email: [email protected]

165
40. KABUYE SUGAR WORKS Ltd. Kabuye Brown Sugar Gasabo
District
Tel:(+250)
E-mail: [email protected]
41. KIGALI FARMS Ltd
Button Mushroom
Crimini Mushroom
Portobello Mushroom
Musanze
District
Tel:(+250) 786 592 815
E-mail: [email protected]
42. MASAKA CREAMERY Ltd
Masaka Farms Strawberry Yoghurt
Masaka Farms Vanilla Yoghurt
Bonjour Strawberry Fruit Yoghurt
Bonjour Vanilla Flavoured Yoghurt
Masaka Farms Plain Yoghurt
Gasabo
District
Tel:(+250)789 911 244
E-mail: [email protected]
43. MIG Nyungwe
Highland Honey
Nyamagabe
District
Tel:(+250) 789 892 748
E-mail: [email protected]
44. MIKOANI TRADERS td. Azania special baking flour premium
Azania home baking powder flour
Azania super flour
Gasabo
District
Tel:(+250)783 813 559
E-mail: [email protected]
45. MUHANGA FOOD
PROCESSING
INDUSTRIES Ltd
TUNGUMUBIRI
Composite flour
Muhanga
District
Tel:(+250)788 530 710
E-mail: [email protected]
46. MUKAMIRA DAIRY Ltd Pasteurized Milk Nyabihu Tel:(+250) 788 125 007

166
Fermented (Cultured) Milk (Ikivuguto) District E-mail: [email protected]
47. NORELGA MACADAMIA
RWANDA
UTAMU Roasted Peanuts
UTAMU Peanuts Butter
Wihangire macadamia roasted nuts
Kicukiro
District
Tel:(+250)788 561 860
E-mail: [email protected]
48. NSHILI KIVU TEA
FACTORY LTD
Black Tea (CTC Black Tea) Nyaruguru
District
Tel:(+250)788 308776
E-mail: [email protected]
49. NYANZA MILK
INDUSTRIES Ltd
Fermented Milk
Strawberry yoghurt
Mixed Fruit flavor yoghurt
Nyanza
District
Tel:(+250) 788 754 842
E-mail: [email protected]
50. PEMBE FLOUR MILLS
RWANDA
Pembe Home Baking Flour
Pembe Special Bakers Flour
Pembe Special Andazi Flour
Gicumbi
District
Tel:(+250) 788 307 072
E-mail: [email protected]
51. RWANDA FARMERS
COFFEE COMPANY Ltd
Gorilla Roasted Coffee Beans Kicukiro
District
Tel:(+250) 788 635 676
E-mail: [email protected]
52. RWANDA NUT
COMPANY Ltd
The Hills Roasted Macadamia Kicukiro
District
Tel:(+250) 787 888 767
E-mail: momoko.harada@organic-
solutions.jp
53. RWANDA TEA PACKERS Ltd
Black Loose Tea
Black Tea bags
Green Loose Tea
Kicukiro
District
Tel:(+250)788 302 537
E-mail: [email protected]
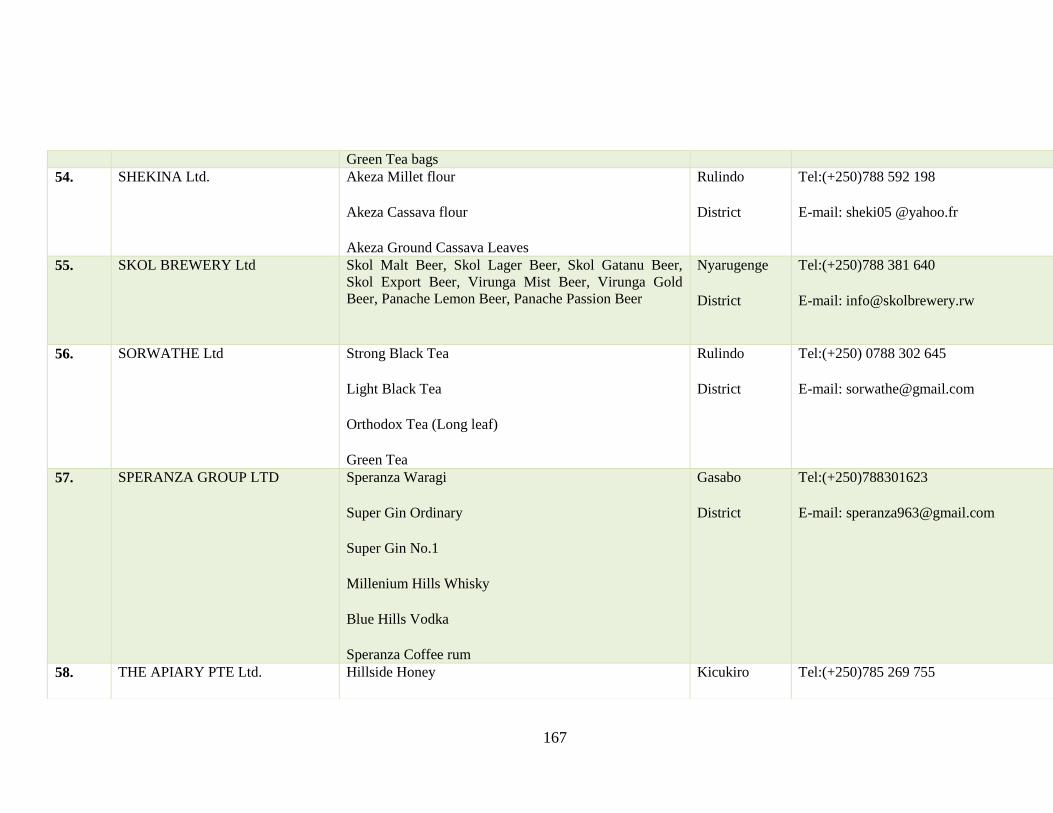
167
Green Tea bags
54. SHEKINA Ltd.
Akeza Millet flour
Akeza Cassava flour
Akeza Ground Cassava Leaves
Rulindo
District
Tel:(+250)788 592 198
E-mail: sheki05 @yahoo.fr
55. SKOL BREWERY Ltd
Skol Malt Beer, Skol Lager Beer, Skol Gatanu Beer,
Skol Export Beer, Virunga Mist Beer, Virunga Gold
Beer, Panache Lemon Beer, Panache Passion Beer
Nyarugenge
District
Tel:(+250)788 381 640
E-mail: [email protected]
56. SORWATHE Ltd
Strong Black Tea
Light Black Tea
Orthodox Tea (Long leaf)
Green Tea
Rulindo
District
Tel:(+250) 0788 302 645
E-mail: [email protected]
57. SPERANZA GROUP LTD
Speranza Waragi
Super Gin Ordinary
Super Gin No.1
Millenium Hills Whisky
Blue Hills Vodka
Speranza Coffee rum
Gasabo
District
Tel:(+250)788301623
E-mail: [email protected]
58. THE APIARY PTE Ltd. Hillside Honey Kicukiro Tel:(+250)785 269 755

168
59. TUZAMURANE
COOPERATIVE
Akagera Dried
pieneapples
Kirehe
District
Tel:(+250) 788 613 618
E-mail: [email protected]
60. UMURAGE ENTERPRISE Ltd
Heritage (Ginger flavoured wine)
Umurage Banana and Pineapple drink
(Banana Based Alcoholic Beverage)
Musanze
District
Tel:(+250) 786 308 709
E-mail: [email protected]
61. UNICOAPIGI Ibengeza Honey Rubavu
District
Tel:(+250) 788 804 604
E-mail: [email protected]
62. UNICOOPAV Virunga Honey Burera
District
Tel:(+250)784 113 940
E-mail: [email protected]
63. URUGO WOMEN’S
OPPORTUNITY CENTER
Urugo Vanilla Yoghurt
Urugo Strawberry Yoghurt
Kayonza
District
Tel:(+250)788 350 577
E-mail: [email protected]
64. URWIBUTSO
ENTERPRISE
Ayera Pasteurized milk, Ayera Fermented milk,
Akaryoshye Strawberry Yoghurt, Akarusho Banana
Based Alcoholic Beverage, Agashya Strawberry Squash,
Agashya Passion Fruit Squash, Agashya Pineapple
Squash, Agashya Strawberry Based Soft
Agashya Passion Based Soft Drink
Agashya Pineapple Based Soft, Akandi packed mineral
water, Pain Coupé.
Pain Sanduich, Pain Croissant
Rulindo
District

169
Pain Français, Akarabo Wheat flour biscuit, Akarusho
dry white wine
Akarusho Sweet Red Wine, Akarusho Dry red Wine,
Akarusho Sweet white Wine, Akacu Hot Ketchup,
Akacu Ketchup, Akiwacu Strawberry Jam
Akarabo Golden Power biscuit
65. VOICE OF CALLING Ubuki bw’iwacu I Rwanda Kicukiro
District
Tel:(+250)788 408 383
E-mail: [email protected]
66. ZAMURA FEEDS Ltd
Broiler Starter Feeds
Broiler Finisher Feeds
Layer Feeds Pullet grower
feeds
Dairy Cattle feeds
Musanze
District
Tel:(+250)788 318 870
E-mail: [email protected]
67. ZIRAKAMWA MEZA
NYANZA DAIRY Ltd
Natural
Fermented Milk
Strawberry
Delight Yoghurt
Vanilla Delight
Yoghurt
Nyanza
District
Tel:(+250)788520606
E-mail: [email protected]

170
Based on RSB, 2019