Innovation Case Studies - World Wildlife Fund
104
Innovative solutions for low-carbon business. Innovation Case Studies WWF Climate Savers
-
Upload
khangminh22 -
Category
Documents
-
view
2 -
download
0
Transcript of Innovation Case Studies - World Wildlife Fund
Innovative solutions for low-carbon business.
InnovationCase Studies
WWF Climate Savers


I am pleased to introduce the WWF Climate Savers Innovation Reports, which reveal how world-leading companies are taking imaginative, effective steps to make major cuts in their CO2 emissions.
Innovation is central to successful business. No successful company rests on its laurels – the need to move forward demands new ideas and new approaches, and this is exactly what the Climate Savers companies have demonstrated.
The innovations they have developed range from creative ideas in renewable energy generation to management initiatives designed to motivate and fully involve staff; and from adaptation of business models to cutting back travel through the use of leading edge telepresence solutions. All in all the Climate Savers companies have driven forward the emission-reduction agenda with vigour and determination.
We are entering the new low carbon economy. The WWF Climate Savers companies are leading the way through their inventiveness and their positive, forward-looking action on CO2 reduction.
WWF is committed to working with companies that are determined to make exceptional cuts in their emissions. This is what the Climate Savers programme is about. It is part of WWF’s global mission to stop the degradation of our planet’s natural environment, and to build a future in which humans live in harmony with nature.
Reducing carbon emissions is good for the planet. But crucially, it is also good for business, as the Reports show. Reducing emissions can deliver cost savings, and positive return on investment, as well as reputational gain.
All the Climate Savers companies have already made significant steps in reducing their emissions. The Innovation Reports bear witness to their continuing work - the process of sustainability never stands still. And neither does competition - being a Climate Savers partner strengthens a company’s competitive position for the future.
We believe these Reports will inspire others to follow where the Climate Savers companies are leading - to success in the new, clean economy.
Oliver Rapf
HeadClimate Business Engagement UnitWWF International
page 3
Introduction
page 4
Content
Fairmont Hotels & Resorts stretching the targets for climate action at landmark hotels.The Fairmont Hotels & Resorts case focuses on actions taken by Fairmont during the full restoration of The Savoy in London and the building of the new Fairmont Pittsburgh in the United States. It shows the feasibility of stretching targets for lowering CO2 emissions from hotel operations.
page 13 - 20
Developing IT solutions for reducing travel-related CO2 emissions: HP Halo collaboration solutions.HP’s search for IT solutions to reduce travel-related CO2 emissions has driven the development of innovative video collaboration solutions. By developing solutions that create a life-like virtual meeting experience, the company is contributing to the removal of technological and mindset barriers to the substitution of business travel by virtual collaboration.
page 21 - 30
Lafarge’s C-O-Tool: Supporting CO2 mitigation decision-making.By improving internal CO2 data management and putting in place a user-friendly tool for monitoring, analysis and simulation of mitigation alternatives, Lafarge facilitated decision-making processes and strengthened the autonomy of operational managers in implementing CO2 reduction projects.
page 43 - 50
Reaching a point of no return: How Elopak rolls out CO2 reduction initiatives.Elopak committed to reduce its CO2 emissions by 15% within a tight time frame of three years. This ambitious target pushed the company to adopt an innovative roll out approach, including the active participation of Elopak’s CEO in efforts to build internal buy-in, incorporation of a carbon strategy as part of the marketing mix and integration of climate targets into the normal management cycle and reporting systems.
page 7 - 12
What does it take to get projects off the ground? Johnson & Johnson capital relief funding for CO2 reduction projects.Johnson & Johnson’s capital relief funding for CO2 reduction projects has attracted the interest of managers in many companies within different industries. They are eager to learn how the corporation has eliminated budgeting barriers and allowed 80 climate friendly energy projects to take off in less than five years.
page 31 - 41

page 5
Developing an innovative business model: Novo Nordisk and Dong Energy driving the market for renewable energy in Denmark.Novo Nordisk’s search for cost-effective solutions to reduce CO2 emissions had driven the development of a new business model which expanded the commercial basis of renewable energy in Denmark.
page 59 - 68
Breaking down alignment barriers: Tetra Pak pulls together allies to reach climate goals.Tetra Pak efforts to align market companies, manufacturing sites and suppliers with its climate goals had required significant organizational change. By empowering shop floor teams to initiate and explore new approaches on energy efficiency along the supply chain, the company had created a structure that allows organic innovation to take place.
page 85 - 94
Removing barriers to innovation: Xanterra Parks & Resorts gaining scale in on-site solar power generation. Xanterra Parks & Resorts’ focused strategy of bringing on-site renewable energy generation to the next level required not only significant dedicated resources, but also singular efforts to break down skeptical mindsets and risk-related barriers to innovation. By active learning from an almost terminated project, the company was able to build one of the largest privately-owned solar photovoltaic systems in the US.
page 95 - 101
Sagawa Express delivers on climate change innovations for the transport industry.Sagawa Express (Sagawa) is taking the express route to leadership in climate change innovation in the transport industry by aiming to introduce 7,000 compressed natural gas (CNG) trucks into its fleet by 2012. Despite major challenges, such as limited infrastructure to support fueling and the higher price of CNG, Sagawa is adamant that such climate change related initiatives are a crucial element of their business.
page 69 - 76
Nokia Siemens Networks: Connecting Business growth and emissions reductions.With a portfolio of projects Nokia Siemens Networks committed to a plan to reduce its CO2 footprint by an estimated 2 million tons per year compared to 2007. These projects included decreased energy consumption in its buildings and increased purchasing of renewable energy, as well as increased energy efficiency of its base stations, which would also deliver social benefits – greater access to communications, energy and economic development.
page 51 - 58
Lowering CO2 emmissions from products: Sony’s eco-innovation for televisions.To reduce CO2 emitted in the use of its products, Sony has started to focus on improving the energy efficiency of televisions. By combining sophisticated technological improvements with simple features that make it easy for customers to save energy, Sony achieved a sustained reduction in the carbon footprint of its televisions.
page 77 - 84


Elopak committed to reduce its CO2 emissions by 15% within a tight time frame of three years. This ambitious target pushed the company to adopt an innovative roll out approach, including the active participation of Elopak’s CEO in efforts to build internal buy-in, incorporation of a carbon strategy as part of the marketing mix and integration of climate targets into the normal management cycle and reporting systems.
Climate InnovationCase Study
page 7
OSLO, NORWAY. NOVEMBER, 21 2008. Niels Petter Wright, president and CEO of Elopak, was discussing company targets for CO2 reduction in a meeting attended by the majority of Elopak’s Norwegian employees. It was the first meeting of a series that took the CEO on a tour through 20 different sites worldwide.
Background
Elopak was founded in 1957. It is a privately held company owned by the Ferd Group, one of the largest privately owned industrial groups in Norway, and is one of the leading suppliers of liquid food packaging. In 2008, Elopak employed 3,000 staff, distributed more than 12 billion carton packages and achieved a turnover of approximately €600 million.
In the autumn of 2007 Elopak teamed up with WWF Norway to take bigger steps in reducing its CO2 emissions. In March 2009 it became a Climate Savers company. Climate Savers was founded in 1998 by WWF as a platform to enable companies to join forces in committing to more ambitious reductions in their greenhouse gas emissions and to transform the industry’s more customary incremental and/or passive approach toward climate change action.
Moving Climate Change Up on the Business Agenda
When Wright – previously Elopak’s chief financial officer – was appointed president and CEO in May 2007, environmental issues were already high on the company’s business agenda. However, it was very focused on recycling and compliance, lacking a comprehensive approach to addressing climate change.
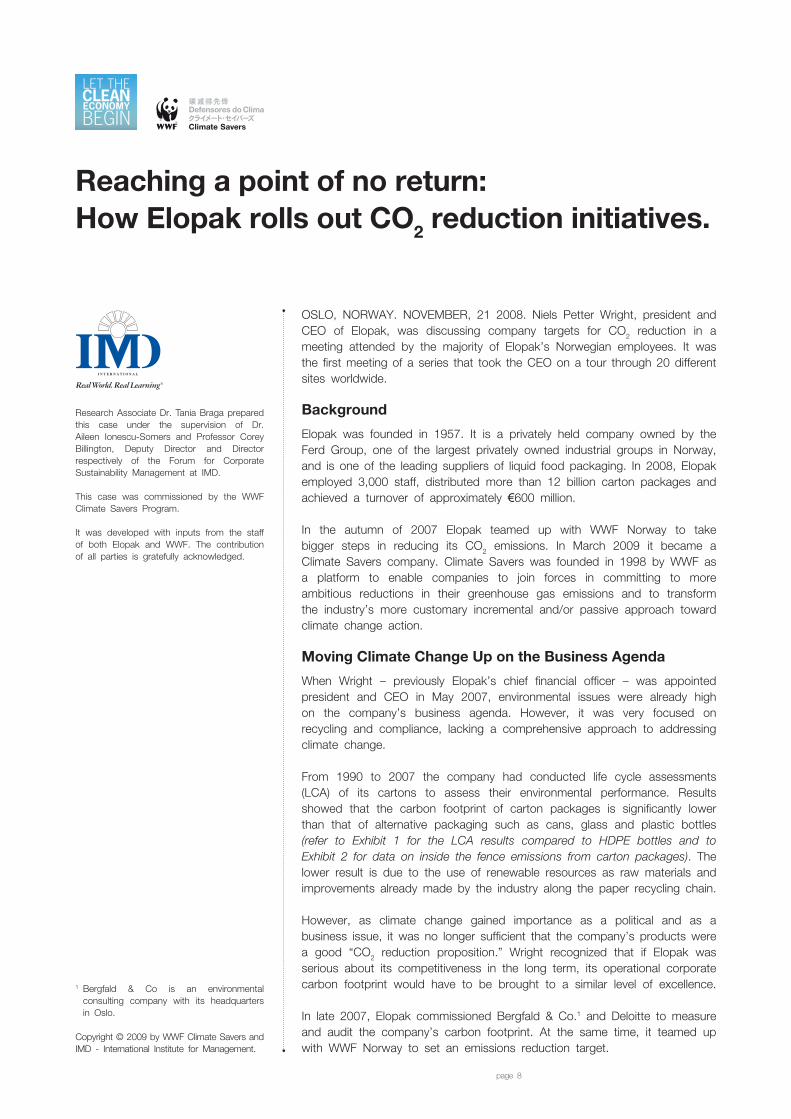
From 1990 to 2007 the company had conducted life cycle assessments (LCA) of its cartons to assess their environmental performance. Results showed that the carbon footprint of carton packages is significantly lower than that of alternative packaging such as cans, glass and plastic bottles (refer to Exhibit 1 for the LCA results compared to HDPE bottles and to Exhibit 2 for data on inside the fence emissions from carton packages). The lower result is due to the use of renewable resources as raw materials and improvements already made by the industry along the paper recycling chain. However, as climate change gained importance as a political and as a business issue, it was no longer sufficient that the company’s products were a good “CO2 reduction proposition.” Wright recognized that if Elopak was serious about its competitiveness in the long term, its operational corporate carbon footprint would have to be brought to a similar level of excellence.
In late 2007, Elopak commissioned Bergfald & Co.1 and Deloitte to measure and audit the company’s carbon footprint. At the same time, it teamed up with WWF Norway to set an emissions reduction target.
Research Associate Dr. Tania Braga prepared this case under the supervision of Dr. Aileen Ionescu-Somers and Professor Corey Billington, Deputy Director and Director respectively of the Forum for Corporate Sustainability Management at IMD.
This case was commissioned by the WWF Climate Savers Program.
It was developed with inputs from the staff of both Elopak and WWF. The contribution of all parties is gratefully acknowledged.
page 8
Reaching a point of no return: How Elopak rolls out CO2 reduction initiatives.
Copyright © 2009 by WWF Climate Savers and IMD - International Institute for Management.
1 Bergfald & Co is an environmental consulting company with its headquarters in Oslo.

In the first half of 2008 the company gathered emissions data from 70 production plants and market units worldwide. The data was used to assess Elopak’s corporate carbon footprint2 – 93,000 tons of CO2 equivalent for the year 2008 – and the specific carbon footprint of each business unit. Since the results showed that over two-thirds of corporate emissions came from the raw material for coating and converting cartons, Elopak’s CO2 reduction program focused on energy efficiency improvement during these two production steps.
The carbon footprint analysis also showed that business units significantly differed from each other, meaning that very specific operational targets needed to be set for each unit.
In March 2009, Elopak publicly stated its commitment as a Climate Savers company. The target agreed upon with WWF was ambitious, 15% of absolute reduction from 2008 levels by 2011. The time frame for achieving the target was also ambitious – three years – and would require extensive and strong buy-in from the entire company.
Ensuring Internal Buy-in
Elopak’s efforts to ensure internal buy-in started before the company publicly announced its CO2 reduction target. The first challenge was to break down skepticism within the top management team by showing a clear business case and by removing the decision from the sphere of personal conviction. Wright commented:
Some of our executives showed skepticism by asking me why we were committing to such a stretch target. Whether they believed or not in the relevance of the target was, after all, just their personal belief. I saw no valid reasons for Elopak to set itself a lower target – 15% was the target to which the world at large needed to commit in order to get back to levels which are consistent with a maximum of 2°C increase in global temperature. So, I helped them understand the business logic behind it: reducing CO2 emissions means reducing energy consumption and cutting costs; reducing CO2 means aligning with some of our clients that are leading the way on the issue in their own industry. It is, as a matter-of-fact, good for business.
Once the management team was on board, the company launched the “Green Challenge”, a global internal campaign aimed at giving Elopak staff the information, motivation and attitudes required for the successful roll out of CO2 reduction initiatives.
The very heart of the “Green Challenge” was the physical presence of the CEO on production and market sites, communicating the importance of the project and personally brainstorming with employees – both blue and white collar – on solutions. Traveling around from time to time to meet managers and shop floor employees, giving them information and listening to their concerns and ideas was already part of Wright’s management style. The innovative aspect of the “Green Challenge” was to do it in a systematic way. Wright visited all Elopak sites and the item that was first and foremost on the agenda was the company’s efforts to reduce CO2 emissions.
Each “Green Challenge” meeting consisted of a motivational talk given by the CEO – or by another top executive in his absence, the formal announcement of the local green challenge champions,3 and a half-day workshop in which
page 9
2 Includes the following emissions from all production and marked units: all direct emissions, such as combustion in boilers, furnaces and all transport of goods (scope 1 in GHG Protocol); all indirect emissions from the generation of electricity consumed (scope 2 in GHG Protocol); indirect emissions from business air travel (part of scope 3 in GHG Protocol).
3 Green challenge champions were appointed before the meeting and prepared for the occasion. They knew what their business unit’s CO2 emissions were and took the time to think about what it would mean for their unit to reduce those emissions.

ideas to reduce emissions were discussed and solutions prioritized. The solutions designed at the workshops were mainly ideas on “how to run customary processes in a smarter way,”4 that is, incremental innovations with a short payback period. The financial feasibility of projects was key to speeding up implementation.
Rolling Out
To achieve effective and timely roll out, Elopak’s CO2 reduction strategy was to create a “point of no return,” supported by a twofold mainstreaming approach: positioning it as part of the marketing mix and integrating it into the normal management cycle and reporting systems.
Elopak’s public commitment to reduce emissions was incorporated in its regular relationships with customers. The company took an active role in discussing the issue with them and searching for possible joint actions. Wright highlighted that it gave the company added impetus to actually achieve its targets as it had no other option than to live up to expectations:
We have an obligation to achieve our target, because we went to our customers saying: “We’re going to reduce our emissions by 15%; so what are you doing on your side, Mr. Customer?” Not achieving our target would be like falling down a steep hill; we could potentially get badly injured.
Starting from early 2009, monthly reporting on environmental performance became mandatory for all business units,5 transforming a “soft green issue” into “hard numbers.” Line managers received a mandate to deliver on CO2 emissions reduction and to provide regular measures and reporting as they always did with accounting and financial data. Managers had to comment on the development of action plans, suggest improvements and adjust them when needed. In this way, the loop was tied into actual reporting and normal management systems.
Putting line managers at the very center of CO2 reduction efforts and making it part of the “day-to-day business” were, according to Wright, the most innovative aspects of Elopak’s strategy:
Some companies give the mandate of seeking solutions for carbon footprint reduction to an environmental officer, a health and safety officer or a communications officer. I do not believe they will succeed with this kind of approach. The only way to get traction on an issue like this is to make sure that line managers, those with profit responsibilities, deliver action everyday.
Moreover, top managers also took a large share of responsibility since emissions were consolidated on a regular basis and each member of the executive committee had to deliver on a specific CO2 target. Those targets were to be incorporated into the bonus system in a progressive way starting at end of 2009.
Going beyond the Incremental Path?
By October 2009, the company had achieved 5% CO2 reduction, and progress toward the ambitious target was materializing. However, the action plan designed during the “Green Challenge” mainly focused on incremental improvements in energy consumption. Thus, questions arose regarding the feasibility of keeping the same level of emission reduction in the future once the “low-hanging fruits” have been collected. Incremental improvements would eventually lead to increasingly smaller returns and limited capacity to
page 10
5 At the beginning of 2009 each business unit started to report quarterly on five parameters – energy consumption, waste management, water usage, emissions from freight and travel, and emissions of volatile organic compounds arising from the dyes and chemicals used in the production process.

support the “point of no return” approach, meaning that a mid- to long-term carbon strategy would require more complex solutions, with a higher payback period.
The challenge ahead of Elopak is to make sure that the mainstreaming strategy it has put in place is robust enough to support the future development of a low carbon business model for the company.
page 11
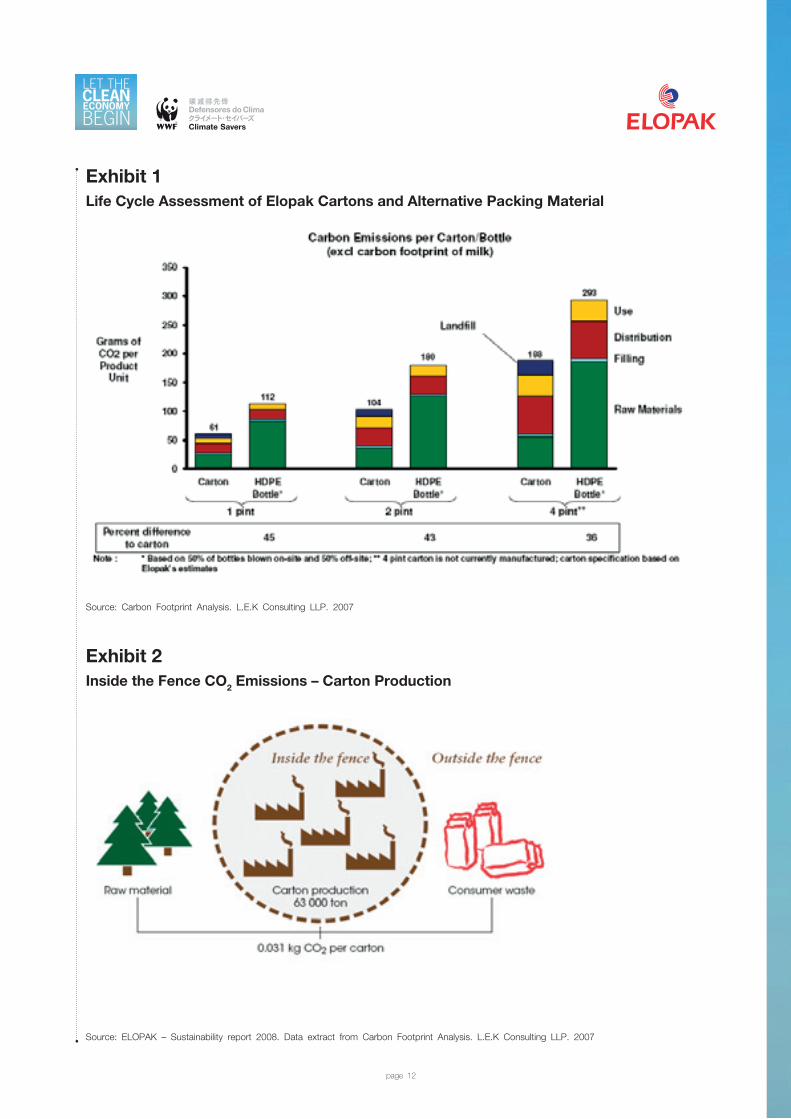
Exhibit 1Life Cycle Assessment of Elopak Cartons and Alternative Packing Material
page 12
Source: Carbon Footprint Analysis. L.E.K Consulting LLP. 2007
Exhibit 2Inside the Fence CO2 Emissions – Carton Production
Source: ELOPAK – Sustainability report 2008. Data extract from Carbon Footprint Analysis. L.E.K Consulting LLP. 2007

The Fairmont Hotels & Resorts case focuses on actions taken by Fairmont during the full restoration of The Savoy in London and the building of the new Fairmont Pittsburgh in the United States. It shows the feasibility of stretching targets for lowering CO2 emissions from hotel operations.
Climate InnovationCase Study
page 13
London, UK. August 6, 2009. Debra Patterson, Savoy’s Environmental Ambassador, gazed up at the entrance of the hotel. The Savoy had opened its doors exactly 120 years earlier, entering history as London’s very first luxury hotel. It is now the ambition to make The Savoy the most luxurious and environmentally responsible hotel in London. A carbon footprint reduction programme is at the very heart of The Savoy’s environmental ambitions.
Meanwhile, in Pittsburgh, U.S. Leonard Czarnecki, General Manager of Fairmont Pittsburgh, reviewed plans for the opening of a luxury hotel in the heart of downtown Pittsburgh, due to open on March 29, 2010. The hotel building had followed very strict sustainable design and construction guidelines, with an ambition to become the first Fairmont hotel to achieve Leadership in Energy and Environmental Design (LEED); anticipating Gold level Certification from the U.S. Green Building Council.
Background
Fairmont Hotels & Resorts, a leading luxury global hotel brand, was created in 1907 with the opening of the Fairmont San Francisco. It is owned by Fairmont Raffles Hotels International, a company operating worldwide under the Raffles, Fairmont and Swissôtel brands.
A leader in the global hospitality industry, Fairmont Hotels & Resorts is a collection of owned and managed luxury hotels, including iconic landmarks such as The Savoy in London, The Plaza in New York, the Fairmont Le Château Frontenac in Québec City and Kenya’s Fairmont Mount Kenya Safari Club. As of October 2009 Fairmont managed 56 diverse resorts and urban destinations across 16 countries, with plans to develop over 25 new properties in the coming years, and employed 30,000 staff.
WWF and Fairmont have worked closely together since the partnership announcement in January 2008, to create a comprehensive strategy for reducing operational emissions, thereby becoming a member of WWF’s global Climate Savers program. Climate Savers was founded in 1998 by WWF as a platform to enable companies to join forces in committing to more ambitious reductions in their greenhouse gas emissions and to transform the industry’s more customary incremental and/or passive approach towards climate change action.
Stretching the targets for climate action
Fairmont was the first global hotel brand to join WWF’s Climate Savers program. The hotel brand was already recognized as an industry leader in sustainable management (refer to Exhibit 1 for a list of environmental awards owned by Fairmont Hotels & Resorts), but lack a comprehensive approach to address climate change. Sarah Dayboll – Manager, Environmental Affairs for Fairmont Raffles Hotels International – explained:
Research Associate Dr. Tania Braga prepared this case under the supervision of Dr. Aileen Ionescu-Somers and Professor Corey Billington, Deputy Director and Director respectively of the Forum for Corporate Sustainability Management at IMD.
This case was commissioned by the WWF Climate Savers Program.
It was developed with inputs from the staff of both Fairmont Hotels & Resorts and WWF. The contribution of all parties is gratefully acknowledged.
page 14
Fairmont Hotels & Resorts stretching the targets for climate action at landmark hotels.
Copyright © 2009 by WWF Climate Savers and IMD - International Institute for Management.
We entered into a partnership with WWF to join their prestigious Climate Savers program, in an effort to tackle Climate Change. The Climate Savers program has allowed us to conceptualize what our emissions are, where they come from and how to reduce them. The program has forced us to take a serious look at our operations, and find ways to streamline energy efficiencies, through strategic planning, thus enabling us to reach our target for 2013. The Climate Savers program pushes you that extra step – to reach beyond your limits – which at one point your organization may have thought was not possible. By being part of the Climate Savers program, we have received validation of our actions, demonstrating we as a company are on the right track to reducing our emissions and supporting a clean economy as we look to expand our operations. It gives us the credential to take ambitious action in the climate change area, as people look at the Climate Savers program and immediately recognize that a respected NGO is supporting companies such as Fairmont, and are standing behind our efforts.
Fairmont’s commitment as a WWF Climate Savers company is to reduce CO2 corporate wide emissions by 20% of its 2006 levels by 2013. As of early 2009, the company’s emissions were at 375,766 metric tonnes of CO2-equivalent per year, corresponding to 0.055 metric tonnes of CO2 emissions per guest night. Fairmont’s approach is to achieve emission reductions by improving energy efficiency in its properties and increasing the use of renewable energy supply. The company has also committed to sharing best practices with other organizations and to work to increase guest and employee engagement in reducing its overall carbon footprint.
The new climate strategy was integrated within the company’s Green Partnership Program, adopted back in 1990, as the company-wide stewardship program aiming at minimizing operational environmental impacts1. Energy efficiency standards were issued for each property and the company has implemented a new Energy and Carbon Management Program, which provides individual Fairmont properties and staff with a framework to track, monitor and reduce their carbon emissions on a consistent and measurable basis.
The company also started a process to identify strategic measures to ensure aligning all properties with the corporate climate goals, having completed a number of energy demand reduction projects across its portfolio.
At first, getting staff engagement to roll out the projects across the different properties was a challenging task. Employees were being asked to incorporate new aspects to their day to day operations and they had to evolve their skills to address new demands. For example, engineering and operation teams had to develop new competencies and put in place a proper logistic in order to improve data collection and energy use monitoring. Fairmont’s first step to address those challenges was to offer training and information to key staff. However, Fairmont managers knew that training and information alone would not ensure extensive buy in.
The company approach to increase internal buy in consisted of awareness building and efforts to strength autonomy and accountability for results. Fairmont extensively communicated company objectives, shared information regarding the climate impact of the company’s portfolio and informed on benefits from reducing the overall corporate footprint to the internal audience, as a mean to increase staff awareness. Autonomy was strengthened by allowing each property to take ownership in developing strategies to reduce their emissions. By benchmarking and publishing results from individual properties, Fairmont aimed at creating friendly competition among properties and fostering a sense of pride in their accomplishments.
page 15
1 Fairmont is committed to responsible tourism and its award-winning Green Partnership program has been a key element in positioning the brand as an industry leader in sustainable hotel management. Under the innovative leadership of hotel-based Green Teams, Fairmont employees help protect the habitat, resources and culture of the places where they operate.

Learning acceleration was pursued through best practices sharing, by showcasing success stories from their portfolio with the potential to demonstrate the types of innovation and the level of achievement the company was aiming for. The renovation of The Savoy in London, England and the efforts to achieve gold LEED certification level at the Fairmont Pittsburgh, in the United States, were of particular note for replication within the industry and internal benchmark.
The Savoy’s restoration
The Savoy, a landmark hotel in the West End of London managed by Fairmont, closed its doors in December 2007 for a large scale restoration program costing over 100 million pounds sterling2. Embedded in this complex program of restoration is an ambitious target to reduce energy consumption by at least 40%.
The Savoy had entered Fairmont Hotels portfolio of managed hotels in 2005 and joined the Fairmont’s Green Partnership Programme. In order to implement the programme, a cross-disciplinary group of five staff members – from accountancy, purchasing, public relations, food & beverage and housekeeping - had formed the Savoy’s ‘Green Team’, the first of its kind in a five-star hotel in London. It conducted departmental audits, set up a monitoring process to measure environmental performance, compared environmental policies of suppliers and contractors and launched a programme to roll out environmental projects and practices.
Because the Hotel would be completely closed during the major restoration, this presented a perfect opportunity to embark on a major carbon footprint reduction action that would not have been feasible if the hotel had been operating. Reflecting the position taken by Fairmont at an international level, The Savoy aimed to show that “it is not just new buildings that can be green”3.
A leading energy management consulting firm – Evolve Energy – has been brought on board during the closure to implement a carbon emissions reduction system. The aim was to reduce the hotel carbon footprint and save on operating costs whilst at the same time offering a more luxurious experience to guests. Among those solutions was the replacement of heating and cooling systems with high efficiency ones and the installation of intelligent energy building controls.
The combined heat and power plant4 was retrofitted and became the primary hotel boiler. The system was designed to run 17 hours a day, 7 days a week, heating the building and water and generating energy as a by-product, reducing the hotel reliance on the energy grid by approximately 50%. In addition, heat from all kitchen appliances will be reclaimed and used to pre-heat domestic hot water.
The automated energy management system includes smart metering and 24-hour energy consumption monitoring and targeting for public areas and guest rooms. Smart guestroom thermostats in all rooms and suites were designed to control lighting and room temperature based on occupancy load and outside temperature, and also to use natural ventilation to regulate temperature inside the room. In the long-term, emissions will be permanently reduced by 3,000 tons of CO2 a year, the equivalent of removing 850 vehicles from London’s roads.
page 16
2 The restoration included the upgrading of all the 268 guest rooms, restored in either the Edwardian-style or given a fresh interpretation of the art deco style, with the new addition of a Royal Suite. Also included are all of the Savoy’s public areas, with the opening of the Beaufort Bar, a champagne bar adjoining the Thames Foyer, which sees the reinstatement of a glass domed ceiling.
3 The Savoy. “Green Future for The Savoy” press release.
4 Is a natural gas driven internal combustion engine which produces heat in the form of hot water which is used to heat the domestic hot water and the building. The internal combustion engine drives a 500kw electrical generator which provides the base load for the hotel’s electrical demand.
The Savoy also planned to turn its food waste into renewable energy in a partnership with the recycling management group, PDM. Waste from food preparation and plate scrapings will be sorted and taken to PDM’s organic biomass-to-energy renewable power plant. When the hotel reopens the waste, collected daily, will generate enough energy to power at least 15% of its guest rooms.
Patterson explained that personal commitment from a dedicated group of colleagues, combined with a clear mandate from the company was instrumental in changing mindsets:
It was about embracing a new culture as part of our daily operations. It was about recognising that we needed to be environmental stewards, that The Savoy’s operations have a direct impact on the environment; therefore our actions play an important role. The Savoy is addressing climate care through investing in a carbon reduction strategy to become more energy efficient.
The Fairmont Pittsburgh
The Fairmont Pittsburgh will host 185 guest rooms and approximately one thousand square meters of meeting space, a full service restaurant and bar and a 560 square meters’ health club when fully operating. The 10-storey hotel is affixed at the top of a 23 story mixed-use building complex5 constructed by the Financial Services Group of PNC6, the Three PNC Plaza, which construction began in August 2006 and was schedule to be concluded in Spring 2010. The whole building complex is designed and constructed with the aim of establishing the building as one of the largest environmentally friendly mixed-used buildings in the United States, throughout its full building lifecycle7.
Czarnecki explained that the entire hotel concept, from design and construction to operation, was anchored on a commitment to develop an environmentally friendly hotel:
The actual site of the building is a brownfield development8 in the very heart of the city. Priority was given to the use of recycled, local and renewable materials when choosing construction and finishing materials. Energy use reduction and indoor environmental quality were key concerns of the developers. The hotel is equipped with leading edge energy management automated systems, aiming at using the least amount of energy in the most efficient way. All guest rooms and public areas are equipped with smart thermostats. Outside fresh air is delivered to 100% of the hotel spaces. The use of daylight is maximal and provided for large amounts of natural light to guest rooms using floor to ceiling and wall to wall glass windows. An innovative ‘green housekeeping’ roadmap was designed, providing guidelines on everything - from the selection of cleaning material (which should combine effectiveness in cleaning while both ensuring a safe environment for guests and cleaning staff and environmental friendliness) to environmental education programs for staff.
Fairmont’s ambitious goals for operational hospitality sustainability combined with PNC’s green building commitments9 was a winning combination and both parties felt that they could aim for the gold level LEED certification.
LEED is an internationally recognized voluntary, consensus-based standard for design, construction, and operation of high performance green buildings. LEED certifies sustainability performance of buildings in five categories: sustainable site development, water savings, energy efficiency, materials selection and indoor environmental quality. The rating system adopted by LEED offers four certification levels – certified, silver, gold and
page 17
5 The Three PNC Plaza is a 23-storey 72 thousand square meter structure that includes 30 thousand square meters of office space, the Fairmont Pittsburgh hotel and a 10-storey, 30-unit luxury condominium.
6 The PNC Financial Services Group is a large diversified financial services organization, operating within the sectors of retail and business banking, wealth management, asset management and global fund services.
7 The full building lifecycle comprises design and construction, operations and maintenance, tenant fit out, and significant retrofit.
8 Brownfield development is a term used to describe the revitalization of all types of contaminated land to productive economic and/or green space use.
9 PNC was the first major U.S. bank to apply green building standards to all new branches. As of mid 2009, with 43 building certified by LEED, PNC is the company with more certified green buildings in the world.
platinum – corresponding to the number of credits accrued in the five categories (refer to Exhibit 2 for LEED certification points system summary). Fairmont and PNC’s ambition to go for the stretch goal of LEED Gold certification10 had so far only been achieved by 3 hotels11. Czarnecki commented that working closely with PNC made it easy as PNC’s unequalled experience allowed them to quickly overcome technical obstacles and demonstrate that building according to LEED standards could be cost neutral. He explained
We had a clear mandate from Fairmont to go as far as possible with pursuing our environmental and climate goals, but getting significant internal buy-in within our team was not a given. We had to help everyone understand the different levels of benefits that came from what we were doing. The primary benefit of “doing the right thing” and creating an environmentally, climate responsible and beautiful hotel, was to reduce the long term impact the hotel would have on the environment. The secondary benefit was aligning their own values and beliefs with their daily work and the tertiary benefit of making the first LEED certified Fairmont hotel happen.
Planning ahead
As Fairmont expands its operations – through portfolio diversification and regional expansion to Europe, Asia, Africa and the Middle East – the major challenge will be to ensure the alignment of new properties with the corporate climate goals and the smooth roll out their Energy and Carbon Management program. How will the implications of the diversification strategy on the profile of this home-grown North American hotel chain affect its energy efficiency policy?
page 18
10 As of September 2007, one single hotel achieved the platinum level certification, three achieved gold level, seven achieved silver level and six achieved ‘certified’ level.
11 The three gold level certified hotels are: CityFlats Hotel - Charter House Holdings (Michigan, US); Montage Hotel Beverly Hills (California, US); Hotel Carlton San Francisco (California, US).
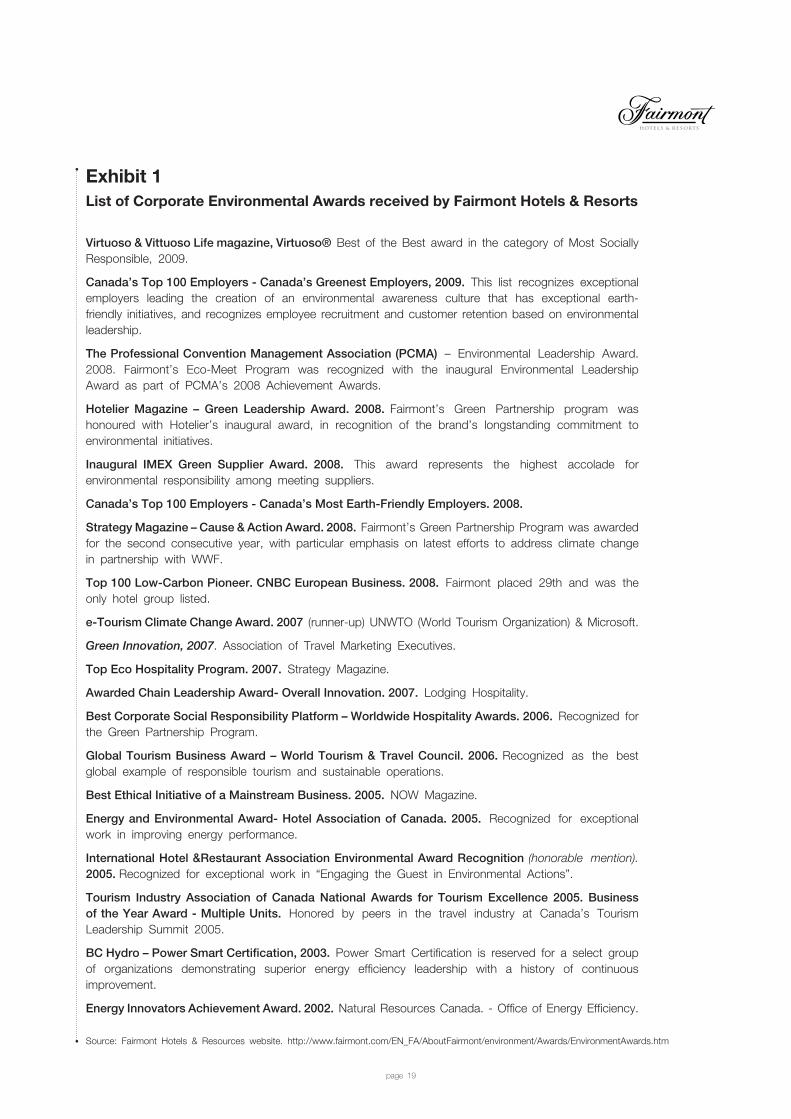
Exhibit 1List of Corporate Environmental Awards received by Fairmont Hotels & Resorts
page 19
Source: Fairmont Hotels & Resources website. http://www.fairmont.com/EN_FA/AboutFairmont/environment/Awards/EnvironmentAwards.htm
Virtuoso & Vittuoso Life magazine, Virtuoso® Best of the Best award in the category of Most Socially Responsible, 2009.
Canada’s Top 100 Employers - Canada’s Greenest Employers, 2009. This list recognizes exceptional employers leading the creation of an environmental awareness culture that has exceptional earth-friendly initiatives, and recognizes employee recruitment and customer retention based on environmental leadership.
The Professional Convention Management Association (PCMA) – Environmental Leadership Award. 2008. Fairmont’s Eco-Meet Program was recognized with the inaugural Environmental Leadership Award as part of PCMA’s 2008 Achievement Awards.
Hotelier Magazine – Green Leadership Award. 2008. Fairmont’s Green Partnership program was honoured with Hotelier’s inaugural award, in recognition of the brand’s longstanding commitment to environmental initiatives.
Inaugural IMEX Green Supplier Award. 2008. This award represents the highest accolade for environmental responsibility among meeting suppliers.
Canada’s Top 100 Employers - Canada’s Most Earth-Friendly Employers. 2008.
Strategy Magazine – Cause & Action Award. 2008. Fairmont’s Green Partnership Program was awarded for the second consecutive year, with particular emphasis on latest efforts to address climate change in partnership with WWF.
Top 100 Low-Carbon Pioneer. CNBC European Business. 2008. Fairmont placed 29th and was the only hotel group listed.
e-Tourism Climate Change Award. 2007 (runner-up) UNWTO (World Tourism Organization) & Microsoft.
Green Innovation, 2007. Association of Travel Marketing Executives.
Top Eco Hospitality Program. 2007. Strategy Magazine.
Awarded Chain Leadership Award- Overall Innovation. 2007. Lodging Hospitality.
Best Corporate Social Responsibility Platform – Worldwide Hospitality Awards. 2006. Recognized for the Green Partnership Program.
Global Tourism Business Award – World Tourism & Travel Council. 2006. Recognized as the best global example of responsible tourism and sustainable operations.
Best Ethical Initiative of a Mainstream Business. 2005. NOW Magazine.
Energy and Environmental Award- Hotel Association of Canada. 2005. Recognized for exceptional work in improving energy performance.
International Hotel &Restaurant Association Environmental Award Recognition (honorable mention). 2005. Recognized for exceptional work in “Engaging the Guest in Environmental Actions”.
Tourism Industry Association of Canada National Awards for Tourism Excellence 2005. Business of the Year Award - Multiple Units. Honored by peers in the travel industry at Canada’s Tourism Leadership Summit 2005.
BC Hydro – Power Smart Certification, 2003. Power Smart Certification is reserved for a select group of organizations demonstrating superior energy efficiency leadership with a history of continuous improvement.
Energy Innovators Achievement Award. 2002. Natural Resources Canada. - Office of Energy Efficiency.

Exhibit 2LEED Certification Points
page 20
Source: http://www.usgbc.org/DisplayPage.aspx?CMSPageID=1991

HP’s search for IT solutions to reduce travel-related CO2 emissions has driven the development of innovative video collaboration solutions. By developing solutions that create a life-like virtual meeting experience, the company is contributing to the removal of technological and mindset barriers to the substitution of business travel by virtual collaboration.
Climate Innovation
Case Study
page 21
PALO ALTO, UNITED STATES. OCTOBER 2009. Pierre Delforge, environmental sustainability program manager at HP, was reviewing the latest data on the impact of HP’s Halo video collaboration solutions on the reduction of business travel. Some business units at HP had reduced business travel by roughly 43% by using HP Halo. Between October 2007 and September 2009, the solution had allowed HP and its customers to reduce over 104,000 tons of CO2-equivalent.
However, he was aware that telepresence solutions were still a niche market and the growth of video collaboration use was still far lower than that of business air travel. Barriers such as the lack of strategic impetus within organizations distorted perceptions about the effectiveness of video collaboration, and misalignment of user incentives still hampered potential large-scale use.
Background
Founded in 1939, HP has become a leading provider of computing and imaging solutions and services. One of the largest technology companies in the world, it was ranked number 32 on the Global Fortune 500 list in 2008 with revenues of $118 billion. The company employs over 300,000 staff in more than 170 countries.
In early 2008, HP formally joined the WWF Climate Savers program. WWF Climate Savers was founded in 1998 by WWF as a platform to enable companies to join forces in committing to more ambitious reductions in their greenhouse gas emissions and to transform the industry’s more customary incremental and/or passive approach toward climate change action. HP’s Climate Savers’ goal represented a reduction of 6 million tons of CO2-equivalent below 2005 levels by 2010 in its own products and operations. In addition, the company committed to helping its customers reduce CO2 emissions by 3 million tons through travel avoidance solutions, print management technology and reuse/recycling programs.
Setting Targets to Reduce CO2 Emissions
HP had already started measuring and reporting on CO2 emissions in 2005 (refer to Exhibit 1 for HP climate and energy data). In 2006 it developed a multi-faceted climate and energy strategy (refer to Exhibit 2). Delforge explained the company’s approach to tackle climate change:
We started with our operations and the reduction of the carbon footprint of all offices and office buildings, data centers and manufacturing facilities. Then we looked at our supply-chain and worked with suppliers to reduce the footprint that is embedded in our products and supplies. Next, we helped our customers to reduce their footprint by improving the energy efficiency by using our products and solutions. Finally, we have been developing new products and solutions that contribute to reducing carbon emissions throughout the global economy.
IMD Research Associate Dr. Tania Braga prepared this case under the supervision of Dr. Aileen Ionescu-Somers and Professor Corey Billington, Deputy Director and Director respectively of the Forum for Corporate Sustainability Management at IMD.
This case was commissioned by the WWF Climate Savers Program.
It was developed with inputs from the staff of both Hewlett Packard and WWF. The contribution of all parties is gratefully acknowledged.
page 22
Developing IT solutions for reducing travel-related CO2 emissions: HP Halo collaboration solutions.
Copyright © 2009 by WWF Climate Savers and IMD - International Institute for Management.
In August 2006 the company set a target to reduce CO2 emissions to 16% below 2005 levels by the end of 2010. In October 2007 it raised the bar, making a public commitment to reduce combined emissions from HP products and operations by 25%.
In September 2009, HP announced that it had already exceeded its CO2
reduction goal of 6 million tons.1 Furthermore, it made a public commitment to reduce its global greenhouse gas (GHG) emissions to 20% below 2005 levels by 2013 and to reduce energy consumption and associated emissions of all HP products to 40% below 2005 levels by the end of 2011.
Developing Solutions for a Low Carbon Economy
HP considered the development of products and solutions for a low carbon economy to be the strategic area with the most potential, since:
Ultimately, the goal is making the world lighter, in other words, “dematerialization.” Information technology can help replace energy-intensive and carbon-heavy methods – whether that’s basic materials, or business processes, or entire business models.2
There are three types of IT solutions to reduce the carbon footprint of the economy: 1) solutions to help reduce energy intensity and carbon footprint, such as large-scale sensor networks to optimize energy and resource use in buildings, logistics and industrial processes; 2) solutions that help to substitute carbon-intensive processes with low carbon ones, such as substituting virtual solutions for physical travel and transport, or eCommerce, eBanking and online entertainment replacing traditional physical economic processes; and 3) solutions that enable low-carbon economy management, such as carbon trading platforms and software for monitoring and reporting of carbon emissions.
HP and WWF developed a comprehensive global assessment of strategic opportunities for IT solutions to accelerate the reduction of CO2 emissions.3 Results showed that while the IT industry is only responsible for approximately 2% of global emissions, the potential of IT applications to help other sectors – such as buildings, transport/communication, commerce/services and industrial production – to reduce their own emissions can be as high as 15% of global emissions (refer to Exhibit 3 for an overview of the potential for emissions reduction from IT solutions in five key economic sectors).
Reducing travel-related emissions in general, and those generated by air travel in particular, will significantly facilitate the transition to a low carbon economy, not only because emissions from air travel are rapidly growing but also because it can have a “cascade effect” on global emissions, since travel is a core feature of the economic and social development pattern driving up carbon emissions. HP saw in the development of audio, video and web conferencing technologies an opportunity to contribute to the reduction of travel-related emissions globally while growing new business and reducing its own traveling costs.
HP Halo Video Collaboration Solutions
HP Halo Video Collaboration Solutions were created with the aim of taking virtual collaboration to the next level, by allowing a more immersive, reliable and user-friendly experience, and consequently reducing the need for business travel.
page 23
1 Between 2005 and 2008 HP reduced GHG emissions by over 4 million metric tons through product innovations and operational efficiencies, and by 1.9 million metric tons through product recovery, telepresence and managed print services.
2 Quote from Shane Robison, executive vice president and chief strategy and technology officer at HP. In: Changing the Energy Equation. Executive Viewpoint. Available at http://www.hp.com/hpinfo/execteam/bios/pdf/SR_Energy_execview_072809.pdf
3 Dennis Pamlin. “The potential global CO2 reductions from ICT use.” WWF Sweden, 2008.
Developing the HP Halo Collaboration Studio
The development of HP Halo started in 2003, through a joint development initiative with DreamWorks.4 DreamWorks executives were looking for a solution to speed animation production processes5 and reduce time and money spent on air travel between company sites. They first tried using standard videoconferencing systems. However, the quality and reliability of standard systems were very low; time lapses in voice and image, an artificial feeling of “talking into a system with a tiny camera attached” and recurring technical problems convinced the animation company to search for a partner to develop a new virtual conferencing system which would emulate a face-to-face meeting as much as possible.
When DreamWorks approached HP to join forces and research resources together to develop the solution, HP executives not only saw an opportunity to tap into new markets but also to push its climate strategy further. The HP Halo Collaboration Studio was developed through a very close R&D collaboration. DreamWorks focused on studio design, from layout to lighting and camera placement, building on their own experience with virtual environments to create a virtual meeting experience allowing participants to interact among themselves instead of with technology.6 HP’s focus was on technological improvements to allow real-time communication,7 create superior quality sound and image, eliminate the intimidating untidy heap of wires, cameras and monitors commonly associated with older setups and to make the whole system hassle-free by removing technical distractions.8 Dedicated attention was given during the design process to the energy efficiency of the system.9
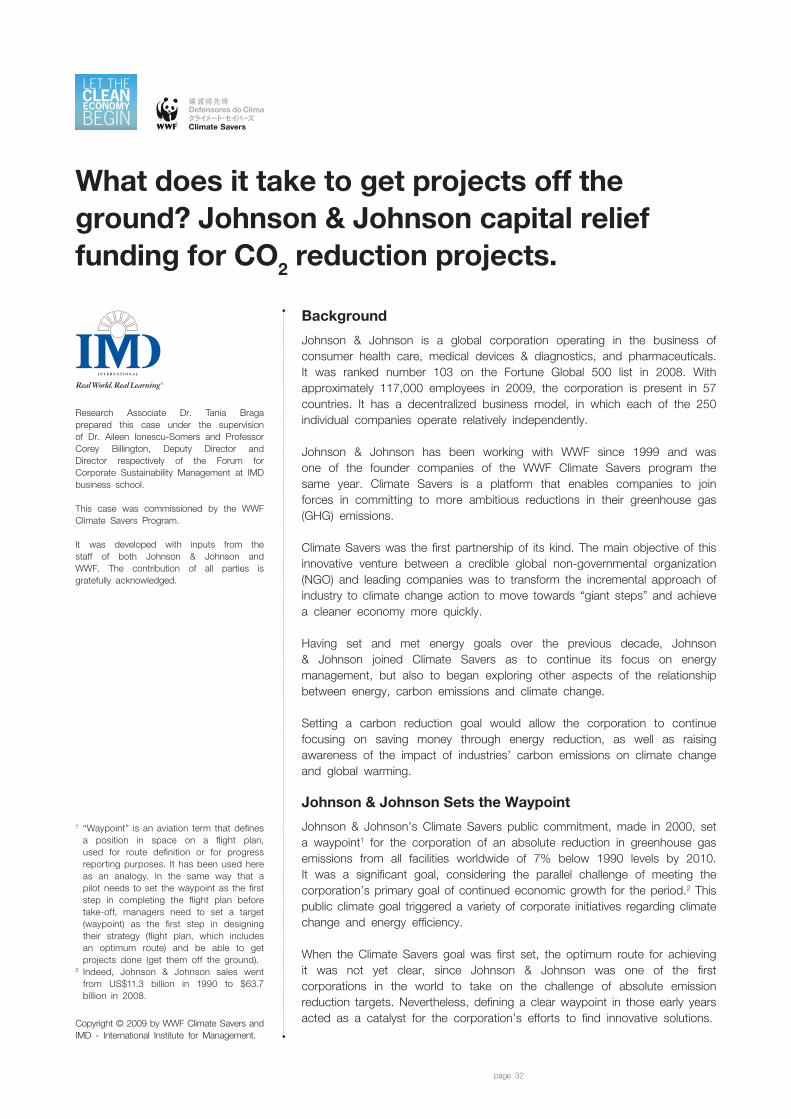
By summer 2004 all DreamWorks production sites were equipped with an HP Halo Collaboration Studio. The studios have high quality acoustics and are equipped with high-definition conference displays to show life-size images of participants, high magnification document cameras capable of zooming in on objects on a table, for example – thus revealing fine details – and collaboration monitors that allow participants to share documents and play full-motion video directly from their notebooks. The studio design in neutral colors, identical at each endpoint, gives participants the visual feeling of being in the same room (refer to Exhibit 4 for a Halo studio picture). By using HP Halo, DreamWorks has achieved its objective of speeding up production processes and launching two animated movies in one year. Senior executives have reduced their international travel, on average, from one trip every three weeks to one trip every three months and their northern–southern California trips by up to 80%. Ed Leonard, chief technology officer at DreamWorks, commented:11
HP Halo has fundamentally changed how DreamWorks does business – transforming the way teams collaborate, while cutting travel time and costs. Studio executives will tell you that it’s like the difference between using a typewriter and a computer.
Marketing HP Halo Video Collaboration Solutions
In parallel with Halo studio installations at DreamWorks sites, HP realized that it could market the solution as “a response to business globalization.” In December 2005 it launched Halo worldwide, describing its value proposition as a combination of strategic business value, cost reduction and environmental benefits. Darren T. Podrabsky, HP Halo’s marketing manager, explained:
page 24
4 DreamWorks was created in 1994 by Steven Spielberg, Jeffrey Katzenberg and David Geffen to produce computer-generated animation movies. In 2008, the company generated revenues of $141.5 million and had a net income of $27.5 million.
5 The company’s ambition was to release two animation films per year, instead of the industry norm of one film every 18 to 36 months.
6 DreamWorks worked with sociologists and virtual environment experts to figure out what room shape and design would most effectively support group conversation and allow participants to read each other’s body language.
7 Data, sound and image are delivered with no signal lapses by a proprietary dedicated high-bandwidth fibber optic network line, the Halo Video Exchange Network (HVEN).
8 The studios were configured to be walk-in ready. HP provides a 24-hour, 7-day technical concierge service and a monthly service program of maintenance and technology update.
9 Plasma displays go into standby mode and lighting automatically shuts off when the room is not in use, resulting in a 40% reduction in energy in standby mode compared to normal operating mode.
10 DreamWorks mainly attribute this achievement to the use of video collaboration.
11 Quote reproduced from HP’s customer case study “DreamWorks Animation SKG case study.” Available at http://h20338.www2.hp.com/enterpr ise/us/en/halo/resource-library.html
Senior managers spend countless hours traveling around the world. It has a high cost, not only in dollars spent on air tickets and accommodation bills; but also in reduced productivity, as a result of tiredness, jet lag and wasted working hours inside airports and airplanes. And it all comes with a high carbon footprint attached. By using telepresence solutions, executives can develop stronger working relationships, speed the decision-making process, get products to market faster and enjoy a better work/life balance as they spend less time traveling and more time with family and friends.
A major marketing challenge for HP was to create a clear differentiation between telepresence and traditional videoconferencing systems, which were commonly perceived as poor and unreliable. Another imperative was to reduce emotional blocks and concerns about privacy, security and confidentiality. The HP Halo marketing and communication strategy was tailored to address those issues. HP Halo was originally launched in two configurations, with a fully managed service package12 and applications. The high-end solution – the HP Halo Collaboration Studio13 – is an actual telepresence studio, with the original configuration and design developed in the partnership with DreamWorks. The room solution – the HP Halo Collaboration Meeting Room14 – is a cheaper alternative, allowing for set-up flexibility and adapted for installation in existing conference room space.
Additional marketing and sales measures were put in place, such as the assignment of a dedicated sales team, technical and delivery personnel and showcasing of the solution at Customer Briefing Centers worldwide. Dedicated leasing and lifecycle asset management services were provided by HP Financial Services to reduce cost barriers impeding adoption of the new solution.
In 2007 HP expanded Halo’s portfolio with the launch of HP Halo Gateway. The aim was to enable customers to make better use of the teleconferencing systems they had already invested in and to sort out the technical problems related to the interconnection between the different systems. It enabled customers using teleconferencing products from other companies to have access to HP Halo-managed services and enabled them to host their endpoints directly on the private, dedicated HVEN network.15
In 2008, after committing to Climate Savers, and with the aim of creating conditions for large-scale use of video conferencing, HP further expanded the Halo portfolio. It launched smaller configurations of Halo endpoints with two or four seats, the Halo Collaboration Center16, suitable for installation in an executive office or small conference room. These were less expensive and simplified products, targeting smaller teams and individuals.
In June 2009 HP Halo Webcasting was added to the Halo suite – a solution that turned an HP Halo studio into an in-house TV studio17 and enabled direct broadcasting from any HP Halo endpoint to desktops or PCs.
Walking the Talk
In parallel with marketing efforts to build Halo’s client base and expand the portfolio, HP has installed the solutions at its own premises around the world with the aim of reducing business travel and related costs and emissions. The average use of Halo endpoints at HP is 150 hours/month, but for some locations it is as high as 250 hours/month. In this way, each studio averages
page 25
12 It included remote diagnostics and calibration, ongoing service and repair, 24-7 concierge service (technical assistance), a dedicated collaboration channel and the technology refresh service.
13 The HP Halo Collaboration Studio is installed inside a designated, tailor-made space and fits up to 6 participants (the configuration can be expanded to 12 participants in a two-row configuration).
14 The HP Halo Collaboration Meeting Room also seats up to 6 participants and is engineered for installation within an existing conference room space, requiring no build out or site-preparation.
15 Halo Video Exchange Network Data, is the proprietary dedicated high-bandwidth fiber optic network line of Halo.
16 Halo Collaboration Center is configured with one broadcast-quality camera and two plasma screen monitors (one of them being a high-definition screen for data sharing), while the Halo studio and meeting room are configured with three broadcast-quality cameras and lenses and four plasma screen monitors (including a high-definition screen for data sharing).
17 The solution offers webcast planning, scripting, video production, editing and distribution.
nearly 240 tons of net CO2-equivalent savings per year. Anecdotally, some business teams have found Halo to be an effective substitute for travel, to the extent that they no longer travel.
Detailed internal studies have indicated a payback period for the systems installed at HP sites of approximately one year. HP’s human resources department, which uses HP Halo mainly for preliminary job interviews, has estimated savings in travel costs of $300,000 per year. One HP manufacturing team engaged in transferring a product line from the US to Singapore managed to accelerate the process by using Halo and completed the transfer in half the usual time, while saving approximately $1 million in travel costs.
The intellectual property sector at HP’s legal department conducted a hiring campaign of patent attorneys around the globe between February and September 2009. The department’s hiring goals were aggressive and travel budget and hiring time were limited. Curtis Rose, HP director of patents, ran the full interview process using HP Halo. Hiring prospects were invited to the nearest HP facility hosting a Halo endpoint and interviewed by a couple of members of the patent development team (located in Spain, France and in two different US states – Washington and Oregon). Rose hired 14 patent attorneys in this way. He commented:
There are not that many patent attorneys in the world, so hiring as many as we did was a significant challenge. We went into this with some trepidation, since we were not sure how using HP Halo would work compared to face-to-face interviews, since we use a lot of non-verbal clues for picking good people. But it really worked well and we are happy with all the people we hired. Without HP Halo, we would not have been able to interview as many candidates as we did. We were able to cast a wider net. Also, HP Halo allowed us to “win plus points” with the candidates since it gave us the chance to demonstrate our technology. After all, we were dealing with highly technical attorneys. HP Halo’s creation of almost-real-world presence is very impressive and helped sell HP as a great place for them to work.
Reducing Customers’ Business Travel and Emissions
HP estimated that if a company using HP Halo for meetings eliminated 200 round trips in one year between London and New York, it would avoid emissions of over 280 tons of CO2, equivalent to taking 18,000 cars off the roads in the US for a day. A study from 2006 concluded that videoconferencing had the potential to save between 5.59 and 33.53 million tons of CO2 emissions annually in Europe18.
Nokia19 has credited HP Halo’s global video collaboration as a key factor in reducing its 2008 air travel-related CO2 emissions by about 22% compared with 2007 levels. During the second quarter of 2008 alone, Nokia used HP Halo for a total of 8,000 hours.
Similarly, the HP Halo studios installed at Diageo20 were operating an average of 16 hours per day as of August 2009, showing a substantial increase in usage in comparison with previous videoconferencing facilities. Diageo estimates a payback period20 of two years, considering the full cost of buying the solution and covering the ongoing connection fees.
page 26
18 D. Pamlin and K. Szomolányi, Saving the climate @ the speed of light: First roadmap for reduced CO2 emissions in the EU and beyond, ETNO and WWF, 2006.
19 Nokia is the world’s number one manufacturer of mobile devices by market share. In 2008 it employed 128,000 staff around the world and achieved net sales of €50 billion.
20 Diageo plc is a beverage company with offices in 80 countries and operations in approximately 180 markets. The company’s brands include Baileys Original Irish Cream liqueur, Guinness, Johnnie Walker Scotch whisky and Smirnoff vodka.
21 The estimated payback period of the system differs from one company to another, depending on the intensity of use of the system and on the actual costs of the avoided travels. Thus, a company avoiding travels from Singapore to Madrid would have a lower payback period than companies avoiding trips from London to Madrid.
Barriers Impeding Large-scale Use of Video Collaboration Solutions
Despite the technological improvements leading to the highly satisfactory collaboration experience delivered by telepresence solutions, the substitution of business meetings for video collaboration as a result of these developments has been significantly lower than predicted by past forecasts.
The demand for video collaboration is still not exploited to the full, because of the remaining barriers to large-scale use: concerns about the effectiveness of the technology, limited access to bandwidth and equipment, weak vendor incentives to push large-scale use, misalignment of user incentives, lack of strategic impetus in many organizations and poor information about the business benefits of virtual collaboration.
In the second half of 2009, HP supported WWF efforts to identify mechanisms supporting large-scale substitution of business travel for virtual collaboration22. The results of the study suggested the development of a global “open access” network for data, video and audio transmission. Such networks would be financed by, among others, innovative carbon offset arrangements.
page 27
22 P. James and D. Pamlin. Virtual meetings and climate innovation in the 21st Century: Can offsetting CO2 emissions from flights by investing in videoconferencing be a way to support transformative change? WWF, 2009.
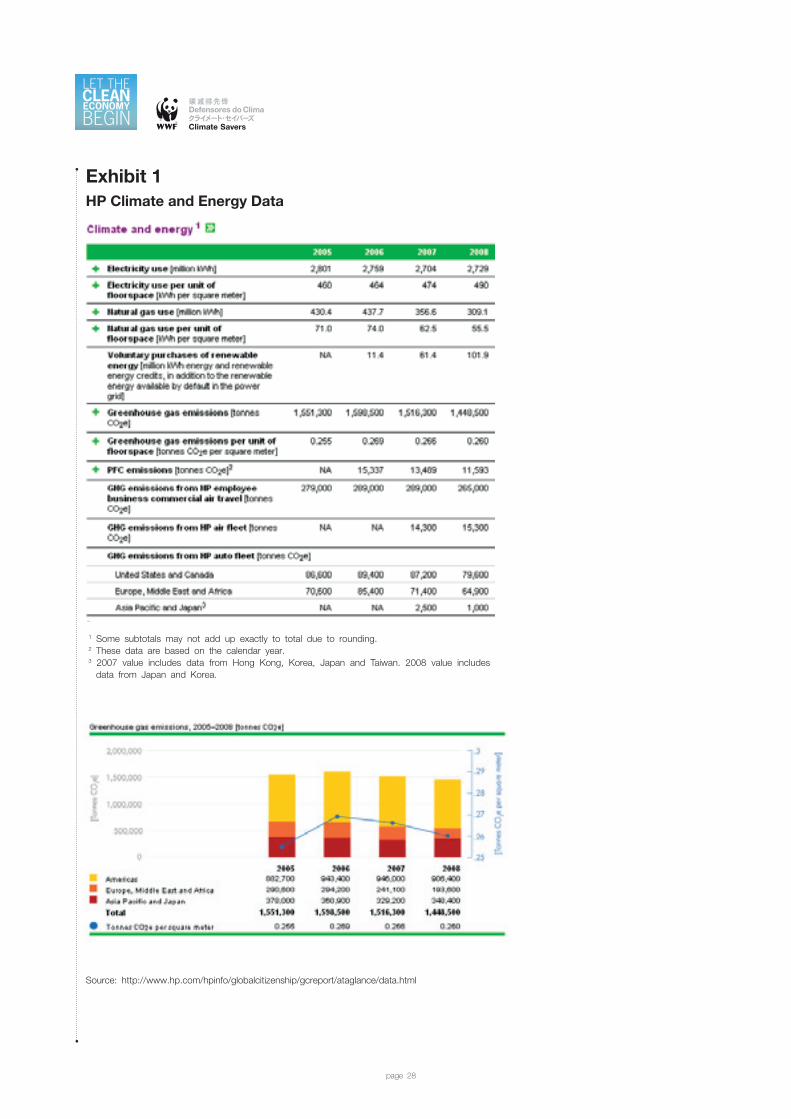
Exhibit 1HP Climate and Energy Data
page 28
Source: http://www.hp.com/hpinfo/globalcitizenship/gcreport/ataglance/data.html
1 Some subtotals may not add up exactly to total due to rounding.2 These data are based on the calendar year.3 2007 value includes data from Hong Kong, Korea, Japan and Taiwan. 2008 value includes data from Japan and Korea.
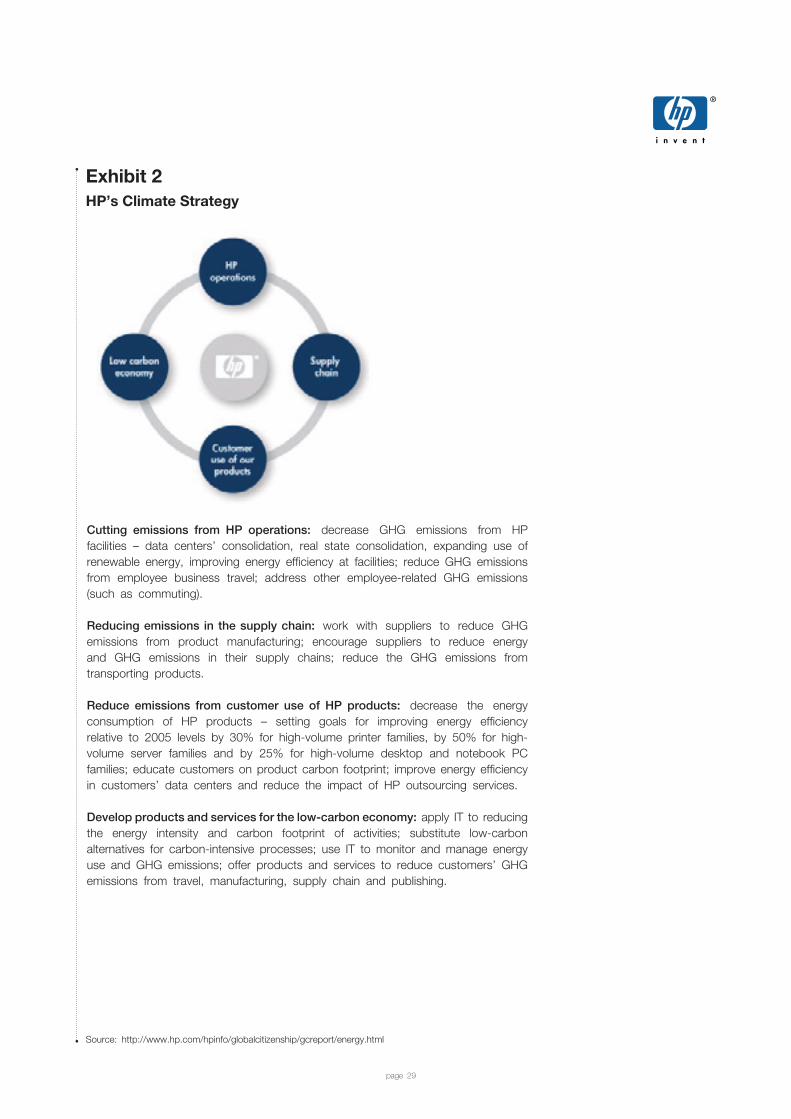
Exhibit 2HP’s Climate Strategy
page 29
Source: http://www.hp.com/hpinfo/globalcitizenship/gcreport/energy.html
Cutting emissions from HP operations: decrease GHG emissions from HP facilities – data centers’ consolidation, real state consolidation, expanding use of renewable energy, improving energy efficiency at facilities; reduce GHG emissions from employee business travel; address other employee-related GHG emissions (such as commuting).
Reducing emissions in the supply chain: work with suppliers to reduce GHG emissions from product manufacturing; encourage suppliers to reduce energy and GHG emissions in their supply chains; reduce the GHG emissions from transporting products.
Reduce emissions from customer use of HP products: decrease the energy consumption of HP products – setting goals for improving energy efficiency relative to 2005 levels by 30% for high-volume printer families, by 50% for high-volume server families and by 25% for high-volume desktop and notebook PC families; educate customers on product carbon footprint; improve energy efficiency in customers’ data centers and reduce the impact of HP outsourcing services.
Develop products and services for the low-carbon economy: apply IT to reducing the energy intensity and carbon footprint of activities; substitute low-carbon alternatives for carbon-intensive processes; use IT to monitor and manage energy use and GHG emissions; offer products and services to reduce customers’ GHG emissions from travel, manufacturing, supply chain and publishing.
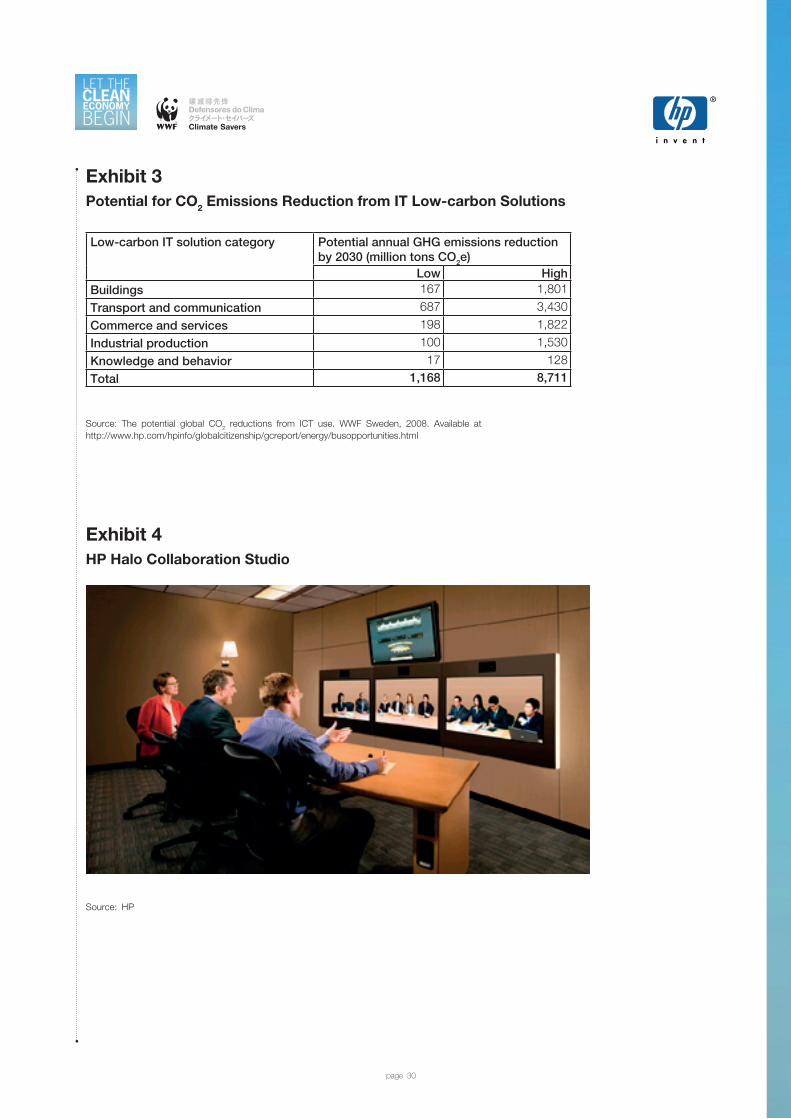
Exhibit 3Potential for CO2 Emissions Reduction from IT Low-carbon Solutions
page 30
Source: HP
Source: The potential global CO2 reductions from ICT use. WWF Sweden, 2008. Available at http://www.hp.com/hpinfo/globalcitizenship/gcreport/energy/busopportunities.html
Low-carbon IT solution category Potential annual GHG emissions reduction by 2030 (million tons CO2e)
Low HighBuildings 167 1,801
Transport and communication 687 3,430
Commerce and services 198 1,822
Industrial production 100 1,530
Knowledge and behavior 17 128
Total 1,168 8,711
Exhibit 4HP Halo Collaboration Studio

Johnson & Johnson’s capital relief funding for CO2 reduction projects has attracted the interest of managers in many companies within different industries. They are eager to learn how the corporation has eliminated budgeting barriers and allowed 80 climate friendly energy projects to take off in less than five years.
Climate Innovation
Case Study
page 31
Background
Johnson & Johnson is a global corporation operating in the business of consumer health care, medical devices & diagnostics, and pharmaceuticals. It was ranked number 103 on the Fortune Global 500 list in 2008. With approximately 117,000 employees in 2009, the corporation is present in 57 countries. It has a decentralized business model, in which each of the 250 individual companies operate relatively independently.
Johnson & Johnson has been working with WWF since 1999 and was one of the founder companies of the WWF Climate Savers program the same year. Climate Savers is a platform that enables companies to join forces in committing to more ambitious reductions in their greenhouse gas (GHG) emissions.
Climate Savers was the first partnership of its kind. The main objective of this innovative venture between a credible global non-governmental organization (NGO) and leading companies was to transform the incremental approach of industry to climate change action to move towards “giant steps” and achieve a cleaner economy more quickly.
Having set and met energy goals over the previous decade, Johnson & Johnson joined Climate Savers as to continue its focus on energy management, but also to began exploring other aspects of the relationship between energy, carbon emissions and climate change.
Setting a carbon reduction goal would allow the corporation to continue focusing on saving money through energy reduction, as well as raising awareness of the impact of industries’ carbon emissions on climate change and global warming.
Johnson & Johnson Sets the Waypoint
Johnson & Johnson’s Climate Savers public commitment, made in 2000, set a waypoint1 for the corporation of an absolute reduction in greenhouse gas emissions from all facilities worldwide of 7% below 1990 levels by 2010. It was a significant goal, considering the parallel challenge of meeting the corporation’s primary goal of continued economic growth for the period.2 This public climate goal triggered a variety of corporate initiatives regarding climate change and energy efficiency.
When the Climate Savers goal was first set, the optimum route for achieving it was not yet clear, since Johnson & Johnson was one of the first corporations in the world to take on the challenge of absolute emission reduction targets. Nevertheless, defining a clear waypoint in those early years acted as a catalyst for the corporation’s efforts to find innovative solutions.
Research Associate Dr. Tania Braga prepared this case under the supervision of Dr. Aileen Ionescu-Somers and Professor Corey Billington, Deputy Director and Director respectively of the Forum for Corporate Sustainability Management at IMD business school.
This case was commissioned by the WWF Climate Savers Program.
It was developed with inputs from the staff of both Johnson & Johnson and WWF. The contribution of all parties is gratefully acknowledged.
page 32
What does it take to get projects off the ground? Johnson & Johnson capital relief funding for CO2 reduction projects.
Copyright © 2009 by WWF Climate Savers and IMD - International Institute for Management.
1 “Waypoint” is an aviation term that defines a position in space on a flight plan, used for route definition or for progress reporting purposes. It has been used here as an analogy. In the same way that a pilot needs to set the waypoint as the first step in completing the flight plan before take-off, managers need to set a target (waypoint) as the first step in designing their strategy (flight plan, which includes an optimum route) and be able to get projects done (get them off the ground).
2 Indeed, Johnson & Johnson sales went from US$11.3 billion in 1990 to $63.7 billion in 2008.
In April 2003 Johnson & Johnson issued a Climate Friendly Energy Policy (refer to Exhibit 1). The worldwide policy was clear about the mandate; it was the responsibility of each company and each business unit to meet the emissions reduction target. A five-pronged pathway was outlined consisting of: energy efficiency improvements; cogeneration; on-site renewable energy production; renewable electricity purchases; and carbon trading and sequestration.
It was highly unusual for Johnson & Johnson, as a decentralized corporation, to issue worldwide policies. Without the policy, however, it would have been difficult to mobilize the entire company towards reaching such an ambitious new target. The clear mandate prevented the need for long discussions about whether Johnson & Johnson should or should not pursue the target. Moreover, it made it clear that whether the company or business unit was located in the US, China, Europe or anywhere else in the world, the target was the same.
The Challenge of Picking Up Ground Speed
Even with a clear mandate and strategy in place and strong buy-in from its top management, Johnson & Johnson faced significant challenges in carrying projects out at the required scale and speed.
This was not a straightforward proposition, as it would require significant capital investment. The managers piloting the initiative forecasted a capital spend of around $200 million on relevant projects between 2003 and 2010. The board gave the green light to this capital investment. However, in 2004 – a year after the policy was issued – a review of progress found that projects were not taking off at the scale and speed which would be needed to reach the corporate goals.
Johnson & Johnson faced some significant “teething problems.” The climate goal was well accepted throughout the corporation, but when it came to actually allocating large amounts of capital to fund projects, things did not move as fast as expected. Johnson & Johnson companies operate fairly autonomously when it comes to capital investments and have their own capital budgets. Because they had budget limitations, companies had to prioritize the projects they would implement and, therefore, internal competition for funding was tough for energy projects. When energy managers at companies put forward capital energy and CO2 reduction projects, they were often challenged by their management. The resistance came from the fact that if such projects were to be implemented, it could only be at the expense of other projects,, such as marketing and product innovation projects, which often had higher expected return rates. The initial resistance to CO2
reduction projects came mainly from finance managers at the sites. It was not surprising, since their job is to prioritize projects based on their internal rates of return.
Such budgeting obstacles are commonly experienced by companies in a vast array of industries. Financially viable projects do not take off because managers cannot access funding for them. Because of competing priorities, there is a constant struggle for approval and funding for projects – such as CO2 reduction projects – that require longer than usual payback times. These obstacles were slowing down the implementation of Johnson & Johnson’s Climate Friendly Energy Policy.
page 33

The problem was brought to the attention of the corporate environmental steering committee, which was chaired by the company’s chief financial officer. He understood the need to have a system in place that would eliminate the internal competition for capital funds that was preventing the execution of economically viable energy projects. A mandate to find a solution was given to corporate finance and the energy management group.
Getting Ready for Take-off
A coordinated system linking finance, engineering and operations was put in place to allow business units to spend up to a total of $40 million in capital per year on CO2 reduction projects.
The corporate entity of Johnson & Johnson uses the term “capital relief” to describe the funds made available through this process. Dennis Canavan, senior director of global energy at Johnson & Johnson, explained:
The corporate group cannot pay directly for the projects because of accounting rules. If we implement a project at a site, we have to account for it and depreciate it at that specific site. So, we provide capital spending relief for projects approved by the corporate CO2 Reduction Committee. The system works as follows. The corporate group increases the capital budget of the site by the amount required to do the approved energy project. For example, if a company were carrying out a $5 million energy project, we would increase their capital budget by an equivalent amount in order to fund the project.
To qualify for capital relief, projects were required to meet two key criteria. The first was that the project had to be financially viable and had to meet a minimum goal of 15% internal rate of return. (Refer to Exhibit 2 for a project summary form.) However, the capital relief funding allowed some degree of flexibility to approve projects with clear and definable additional benefits (other than direct cost savings), for which return rates between 10% and 15% would be acceptable.3
The second key criterion was that only projects that led to a significant reduction in greenhouse gas emissions could qualify. Initially, this was not easily quantified. However, as projects were developed, it was possible to calculate the ratio of the capital cost of the project to the annual reduction in CO2 emissions in metric tons. As the portfolio of projects grew, a benchmark ratio of about $1,000 per ton emerged. Going forward, projects that met this benchmark were deemed to meet the “significant reduction in GHG” requirement, while those that cost more per ton were further scrutinized. One notable exception to the rule was solar photovoltaic panel projects. They were more costly per ton of CO2 reduction, but were still pursued due to the considerable environmental benefits. As additional criteria, the capital relief funding excluded small projects and new construction. Eligible projects had to cost at least $500,000;companies were expected to fund smaller projects from their existing budgets. New construction projects were expected to include energy efficiency technologies and consider renewable energy sources as an integral part of the project, and these had to be included in the project cost.
The application process included the presentation of technical and financial information in a standardized format (thus facilitating comparison between projects), analysis of the project’s return potential (carried out with the involvement of finance managers from the company/business unit) and a review/recommendation by the company or business unit in question.
page 34
3 For example, a cogeneration project with a 12% or 13% return on investment could qualify for capital relief funding as it would give the added benefits of emergency back-up power to the site, thus improving energy security.
A corporate committee composed of engineering, finance and energy managers was responsible for reviewing, prioritizing and approving qualified projects.
Following the announcement of the funding scheme, business units and companies almost immediately applied for a total of 55 projects, half of which were approved in the first year. Canavan commented that projects came fast because viable projects already existed when the scheme was launched. This confirmed the assumption that good opportunities had already been identified by business units, but had not taken off because of the budgeting barriers. Canavan explained what enabled the capital relief system to have a quick and smooth take off:
The company or business unit no longer had to substitute other projects for viable energy projects based on purely financial criteria. Managers carried out other capital projects as well as CO2 reduction projects. Moreover, the combination of low risk and reasonable financial returns made energy projects very attractive. We were not installing questionable or high risk technology, but familiar technology, such as more efficient boilers and chillers, cogeneration and solar power. The approved projects would provide paybacks within an acceptable time frame; they also had tangible and quantifiable benefits such as reduced operating costs long term, increased energy security and reliability to support manufacturing operations and reduced emissions that would enable us to meet our environmental goals, which are not usually taken into consideration in traditional comparisons based merely on project financial return.
Reaching Cruising Altitude
By 2007, Johnson & Johnson had exceeded its Climate Savers goal and reduced emissions by 12% compared with 1990 levels. Moreover, in the same period, company sales had increased by over 400% (refer to Exhibit 3 for data on CO2 emissions and sales from 1990 to 2007).
Climate Savers played the role of catalyst in Johnson & Johnson’s journey to come up with the innovative capital funding scheme. The corporation did not work directly with WWF to set up the funding program, but the initiative was driven by efforts to meet the goal it set itself as a Climate Savers company. By December 2007 the funding scheme had provided $86 million of capital relief for 49 projects with an average rate of return of 16.3% and reductions of 88,500 tons of CO2 emissions.4
For the first three years the system worked well and Johnson & Johnson was approaching its goal of allocating $40 million of capital relief per year. Projects arrived on a regular basis. The key to success was the decisive support of the corporate financial group combined with the ability of the operating groups at the company/business unit level to initiate and develop innovative projects.
By taking the steps it did, corporate finance had sent a clear message to local finance managers that CO2 reduction was both a priority and a long-term commitment. In this way, local finance managers were instructed not to expect projects to have a two- or three-year payback time, but rather to accept that although payback time was longer, projects not only provided good returns but also supported corporate climate goals. Establishing a limit of 15% of internal return made it easier for local finance managers to make decisions. It was very important that finance executives at the corporate level got the word out to their financial counterparts around the world that these projects were to be supported.
page 35
4 This figure refers to CO2 reductions achieved if all approved projects were fully operational. Out of the 49 projects, 31 were fully operational as of December 2007.

By giving companies and business units the mandate to come up with their own projects and by requiring the projects to be reviewed and recommended by the business unit itself, the corporate entity had sent a clear message to local managers that their autonomy was valued.
On the one hand, viable CO2 projects would not have happened without corporate capital relief. On the other hand, projects only happened because they were driven from the company/business unit side. Corporate managers are not close enough to company sites to have hands-on knowledge of opportunities for energy and emission reductions. Local managers know the shop floor. They are close to the day-to-day operations of the plant, familiar with the technical aspects and the costs involved, and can clearly assess the payback time and come up with solid projects. Moreover, the capital relief scheme had a positive effect on the professional development of managers at business units/companies. Alexandre Falleiros, Brazil-based regional director of engineering for the Americas in Johnson & Johnson’s consumer business, gives an example:
Engineers in our team see the capital relief funding option as an opportunity to come up with new projects. They are now eagerly looking for opportunities to innovate in the energy area because barriers to get the projects funded have been removed. They are proud of adding sustainability to their own expertise area. Furthermore, working on projects in this area became a parameter for self-fulfilment.
Avoiding In-flight Diversions
In 2008, however, the spending for the capital relief program dropped significantly, from $38.3 million in 2007 to $12.3 million. (Refer to Exhibit 4 for actual capital relief annual spending from 2005 to 2008.) This was partly due to the fact that the more accessible “low-hanging fruit” projects had already been carried out, and identifying new projects was more challenging. But another important factor was the state of the economy.
When the world economy started contracting in 2008, there was pressure on companies around the world to reduce spending and capital investments across the board. Companies within Johnson & Johnson were not immune to such pressures. Although the capital relief program was ongoing, some push-back took place. As expected, some local finance managers were receiving mixed signals. On the one hand they were expected to spend less money, and on the other hand they were still being encouraged to implement energy projects requiring capital investments. One thing was sure, significantly fewer projects were submitted in 2008.
It seemed like the turbulent economic context might cause Johnson & Johnson to have an in-flight diversion on its CO2 reduction journey. Were projects being put on hold due to the company’s general focus on reducing costs? Was it a question of managerial time and resources being fully devoted to survival? Or was it that communication around these issues was simply not clear?
In early 2009, the long-term commitment to the program was confirmed by Johnson & Johnson’s chief financial officer in a letter that was published on the corporate intranet encouraging local finance managers to continue to use the capital relief scheme and to go on giving full support to energy projects that met the defined criteria. As a result, the level of applications was re-
page 36
established and 19 new projects were approved for funding in the first three quarters of 2009. Canavan commented:
The support we got from our CFO was key to getting back on track. In 2009 we approved 19 new projects, including five new solar projects. Capital spending in 2009 is expected to be just over $40 million.
By October 2009, the capital relief program had approved a total of 80 projects, representing a total savings of 129,000 tons of CO2 per year. Together, the approved projects represent $187 million of capital relief with an average rate of return of 18.6%. (Refer to Exhibit 5 for information on approved projects by type.) As stated in its Annual Sustainability Report 2008, Johnson & Johnson’s preferred route on the journey to lower its carbon footprint is the reduction of energy usage and thus the reduction of carbon emissions. However, as business has grown, the company has increased its facility base with energy-intensive research and development laboratories and biopharmaceutical manufacturing plants. Despite the implementation of many projects, this growth has made the 2010 CO2 reduction goal very challenging, and required the use of all of the strategies originally envisaged, including a heavy reliance on the purchase of renewable power and carbon offsets. (Refer to Exhibit 6 for data.) Unquestionably, capital funding has successfully contributed to the reduction of Johnson & Johnson corporate CO2 emissions. The main question now is how to identify an even better route to help the company achieve its targets while taking account of its growth strategy.
page 37
13 Press-release: “Lafarge and WWF International renew their partnership for another four years.” Issued 4 September 2009..
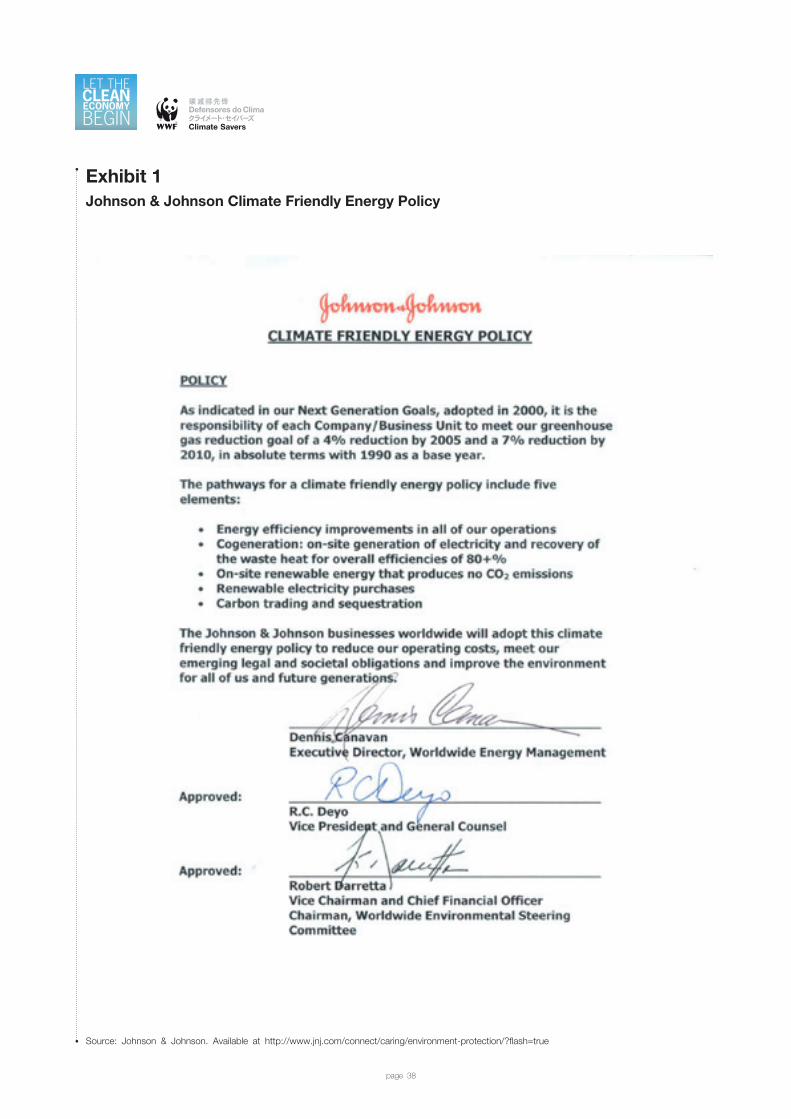
Exhibit 1Johnson & Johnson Climate Friendly Energy Policy
page 38
Source: Johnson & Johnson. Available at http://www.jnj.com/connect/caring/environment-protection/?flash=true

Exhibit 2Johnson & Johnson CO2 Reduction Projects Summary Form
page 39
Instructions for the "Project Summary" WorksheetAll field titles and labels are shaded in green Financial data should be input in U.S. dollars using the most recently All fields requiring input are shaded in grey available currency exchange rate. CO2 data should be input in metric tonsAll fields with an automatic calculation are shaded in blue as calculated using the emissions factors provided in this workbook.
NOTE: one metric ton equals 1000 kilograms
CO2 REDUCTION PROJECTS
Corporate Worldwide Next Generation GoalJohnson & Johnson has committed to reduce Carbon Dioxide (CO2) Emissions 7% by 2010, relative to the base year of 1990. Only stationary emissions related to operation of our facilities are included in this goal (direct emissions from on-site fuel use and indirect emissions from purchased electricity).
The purpose of this CO2 Reduction Project Summary Form is to collect information regarding potential projects from all J&J affiliates worldwide in a standardized and comparable fashion. The CO2 Reduction Committee will review, prioritize and fund projects according to the data contained herein.
In analyzing the potential project, you should work in partnership with local finance personnel to use standard J&J methodologies for calculating financial metrics (cash flows, IRR, etc). All financial data should be input in U.S. dollars using the most recently available currency exchange rate. It will be very useful to have your site's CO2
Reduction Pathway close while inputting some of this information.
To achieve these goals, J&J Corporate will fund US $40M per year for CO2 reduction projects between now and the year 2010, providing capital spending relief for projects approved by the CO2 Reduction Committee. Projects submitted to the Committee for review should require capital spending in excess of US $500.000, have good financial returns and result in meaningful CO2 reductions. Project expenses and depreciation costs will be funded at the operating company level. Projects with a minimum IRR of 15% are recommended, but those with an IRR down to 10% will be considered if there is a significant CO2 return and other benefits.
CO2 Reduction Project Summary Form
CompanyOperating Group
AddressCity
StateCountry
2008 2009 2010 2011 2012 Total (2005-2012)Appropriation Capital [US$] $0
Appropriation Expense [US$] $0Total Project Cost [US$] $0 $0 $0 $0 $0 $0
CO2 Reduction [tons CO2] 0
Capital Cost/CO2 Reduction [US$ / tons CO2] #DIV/0!Internal Rate of Return (IRR)
2008 2009 2010 2011 2012 Total (2005-2010)Electricity Usage Savings [kWh] 0
Fuel Usage Savings 0Fuel Type
Electricity Unit Cost [US$ per kWh] #DIV/0!Fuel Unit Cost [US$ per unit] #DIV/0!
Electricity Cost Savings [US$] $0 $0 $0 $0 $0 $0Fuel Cost Savings [US$] $0 $0 $0 $0 $0 $0
Total Energy Cost Savings [US$] $0 $0 $0 $0 $0 $0
Comments
Start DateCompletion Date
Project Life [years]
CO2 Reduction Project Summary
Project TypeDescription
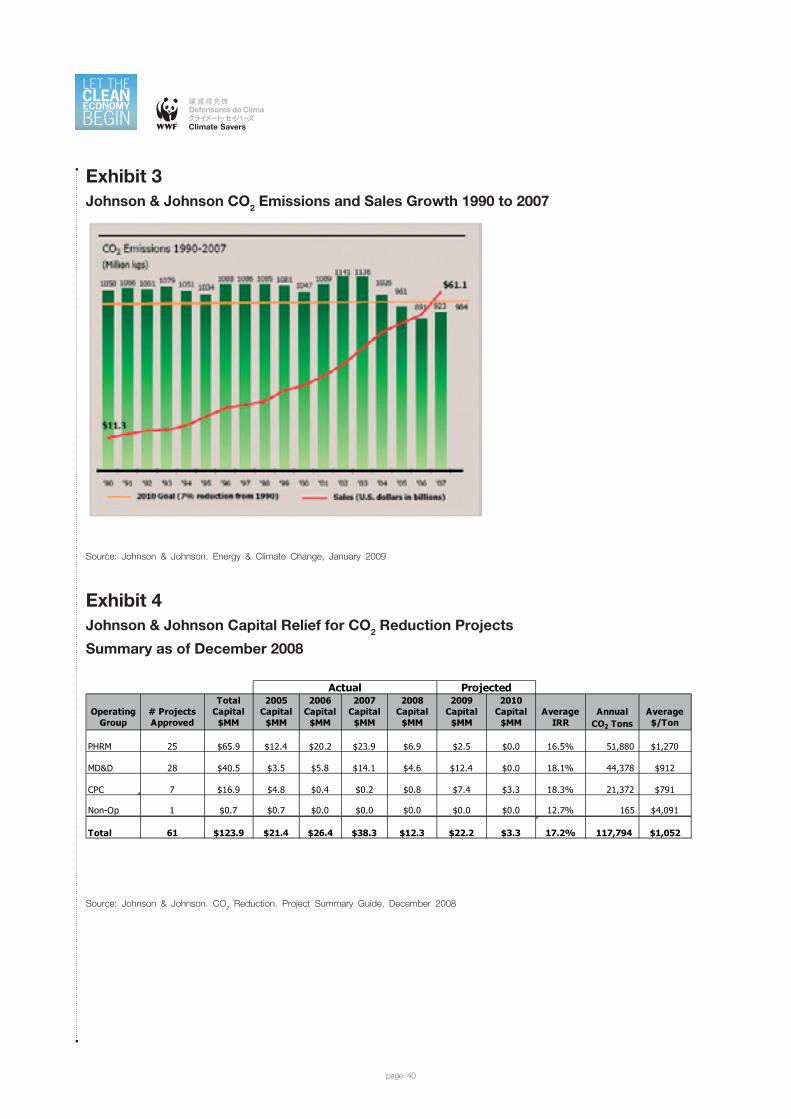
Exhibit 3Johnson & Johnson CO2 Emissions and Sales Growth 1990 to 2007
page 40
Source: Johnson & Johnson. Energy & Climate Change, January 2009
Exhibit 4Johnson & Johnson Capital Relief for CO2 Reduction Projects
Summary as of December 2008
Source: Johnson & Johnson. CO2 Reduction. Project Summary Guide, December 2008
Operating Group
# Projects Approved
Total Capital
$MM
2005 Capital
$MM
2006 Capital
$MM
2007 Capital
$MM
2008 Capital
$MM
2009 Capital
$MM
2010 Capital
$MMAverage
IRRAnnual
CO2 TonsAverage $/Ton
PHRM 25 $65.9 $12.4 $20.2 $23.9 $6.9 $2.5 $0.0 16.5% 51,880 $1,270
MD&D 28 $40.5 $3.5 $5.8 $14.1 $4.6 $12.4 $0.0 18.1% 44,378 $912
CPC 7 $16.9 $4.8 $0.4 $0.2 $0.8 $7.4 $3.3 18.3% 21,372 $791
Non-Op 1 $0.7 $0.7 $0.0 $0.0 $0.0 $0.0 $0.0 12.7% 165 $4,091
Total 61 $123.9 $21.4 $26.4 $38.3 $12.3 $22.2 $3.3 17.2% 117,794 $1,052
ProjectedActual
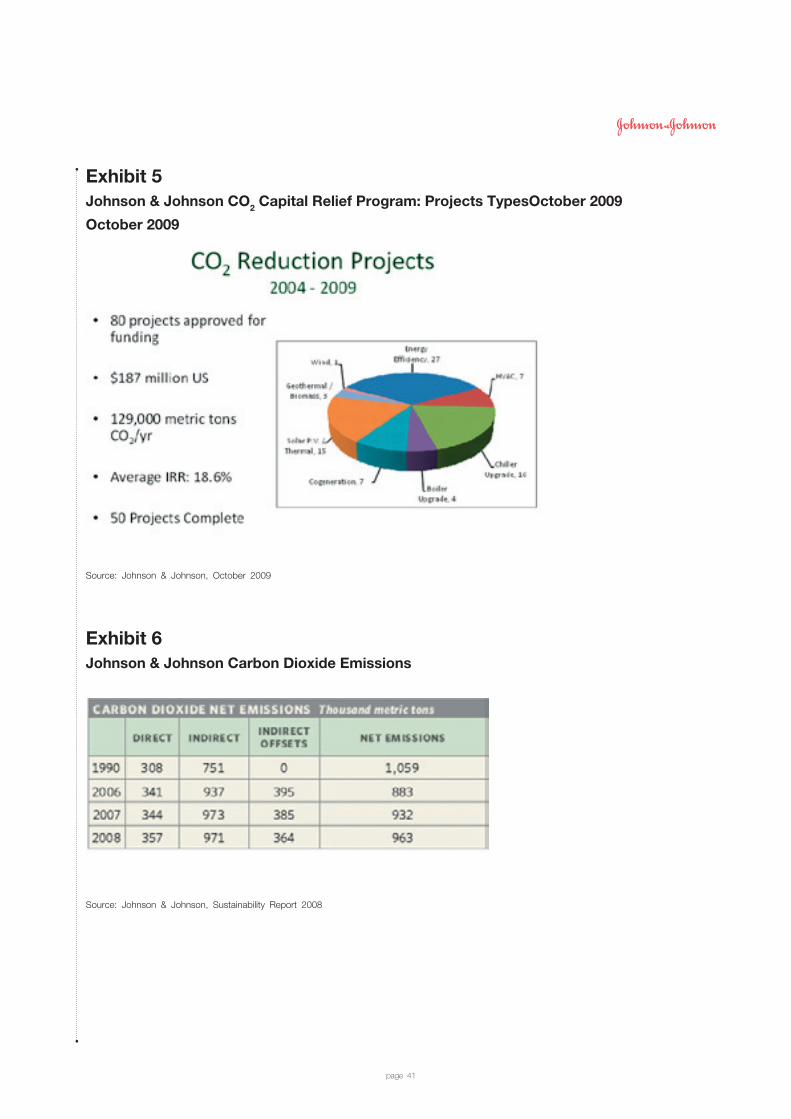
Exhibit 5Johnson & Johnson CO2 Capital Relief Program: Projects TypesOctober 2009
October 2009
page 41
Source: Johnson & Johnson, October 2009
Exhibit 6Johnson & Johnson Carbon Dioxide Emissions
Source: Johnson & Johnson, Sustainability Report 2008

Exhibit 3Images of the Flexi Base Station
page 42
Source: Nokia Siemens Networks
The new Flexi base station The old base station

By improving internal CO2 data management and putting in place a user-friendly tool for monitoring, analysis and simulation of mitigation alternatives, Lafarge facilitated decision-making processes and strengthened the autonomy of operational managers in implementing CO2 reduction projects.
Climate Innovation
Case Study
page 43
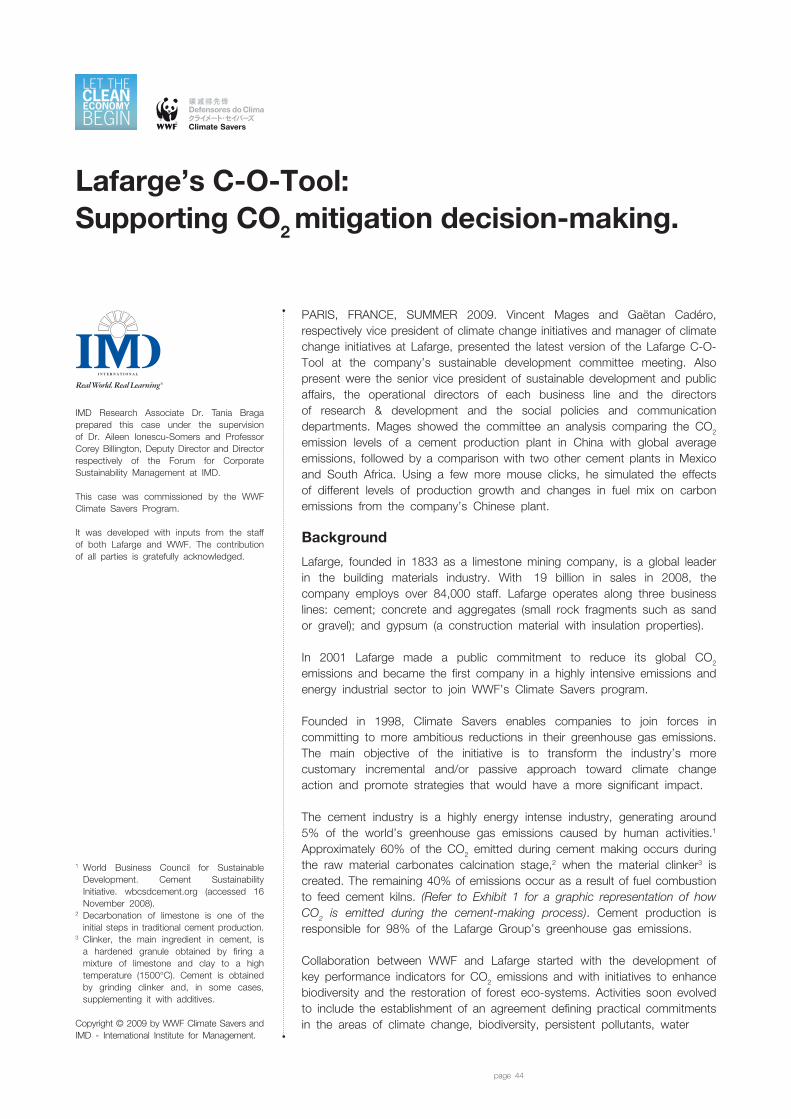
PARIS, FRANCE, SUMMER 2009. Vincent Mages and Gaëtan Cadéro, respectively vice president of climate change initiatives and manager of climate change initiatives at Lafarge, presented the latest version of the Lafarge C-O-Tool at the company’s sustainable development committee meeting. Also present were the senior vice president of sustainable development and public affairs, the operational directors of each business line and the directors of research & development and the social policies and communication departments. Mages showed the committee an analysis comparing the CO2 emission levels of a cement production plant in China with global average emissions, followed by a comparison with two other cement plants in Mexico and South Africa. Using a few more mouse clicks, he simulated the effects of different levels of production growth and changes in fuel mix on carbon emissions from the company’s Chinese plant.
Background
Lafarge, founded in 1833 as a limestone mining company, is a global leader in the building materials industry. With €19 billion in sales in 2008, the company employs over 84,000 staff. Lafarge operates along three business lines: cement; concrete and aggregates (small rock fragments such as sand or gravel); and gypsum (a construction material with insulation properties).
In 2001 Lafarge made a public commitment to reduce its global CO2 emissions and became the first company in a highly intensive emissions and energy industrial sector to join WWF’s Climate Savers program.
Founded in 1998, Climate Savers enables companies to join forces in committing to more ambitious reductions in their greenhouse gas emissions. The main objective of the initiative is to transform the industry’s more customary incremental and/or passive approach toward climate change action and promote strategies that would have a more significant impact.
The cement industry is a highly energy intense industry, generating around 5% of the world’s greenhouse gas emissions caused by human activities.1 Approximately 60% of the CO2 emitted during cement making occurs during the raw material carbonates calcination stage,2 when the material clinker3 is created. The remaining 40% of emissions occur as a result of fuel combustion to feed cement kilns. (Refer to Exhibit 1 for a graphic representation of how CO2 is emitted during the cement-making process). Cement production is responsible for 98% of the Lafarge Group’s greenhouse gas emissions.
Collaboration between WWF and Lafarge started with the development of key performance indicators for CO2 emissions and with initiatives to enhance biodiversity and the restoration of forest eco-systems. Activities soon evolved to include the establishment of an agreement defining practical commitments in the areas of climate change, biodiversity, persistent pollutants, water
IMD Research Associate Dr. Tania Braga prepared this case under the supervision of Dr. Aileen Ionescu-Somers and Professor Corey Billington, Deputy Director and Director respectively of the Forum for Corporate Sustainability Management at IMD.
This case was commissioned by the WWF Climate Savers Program.
It was developed with inputs from the staff of both Lafarge and WWF. The contribution of all parties is gratefully acknowledged.
page 44
Lafarge’s C-O-Tool: Supporting CO2 mitigation decision-making.
Copyright © 2009 by WWF Climate Savers and IMD - International Institute for Management.
1 World Business Council for Sustainable Development. Cement Sustainability Initiative. wbcsdcement.org (accessed 16 November 2008).
2 Decarbonation of limestone is one of the initial steps in traditional cement production.
3 Clinker, the main ingredient in cement, is a hardened granule obtained by firing a mixture of limestone and clay to a high temperature (1500°C). Cement is obtained by grinding clinker and, in some cases, supplementing it with additives.
consumption and sustainable construction for all companies within Lafarge group.
Lafarge’s commitment is to reduce emissions in relation to 1990 levels by 10% in absolute terms in industrialized countries and by 20% net – per ton of cement produced – worldwide, by 2010, through a variety of strategies developed in conjunction with Climate Savers. (Refer to Exhibit 2 for Lafarge emissions and reduction targets).
Mitigating CO2 Emissions
Lafarge and WWF jointly identified a list of areas where ambitious incremental improvements in cement production would substantially reduce CO2 emissions.
• Increased energy efficiency of production processes and reduction in overall energy consumption;
• Modernization of production plants and constant improvement of industrial processes;4
• Use of alternative fuels5 and renewable energy sources;
• Use of industrial waste to manufacture cement.6
To ensure internal support for CO2 reduction goals, Lafarge cascaded the mitigation execution mandate down to operations management at the production plant level. Business units and production plants have total autonomy in determining how to achieve plant-specific CO2 reduction goals. They are supported by technical centers, which drive internal know-how and best practices. CO2 reduction goals were further incorporated into each manager’s personal objectives. Achievements in this area are part of the evaluation and reward processes through strategies like the awarding of bonuses.
In addition, Lafarge committed to invest in research focused on:
• Accelerating carbon emission reduction through modification of the chemical composition of clinker so as to produce less CO2;
• Optimization of the composition of concrete;
• Improvement of recycling processes. (refer to Exhibit 3 for R&D expenditures7 on carbon mitigation and to Exhibit 4 for reduction in clinker ratio).
The life cycle of buildings – design, construction, operation and demolition – accounts for approximately 40% of energy consumption and 30% of CO2 emissions.8 Therefore, another important aspect of Lafarge’s CO2 mitigation strategy is to help to reduce the overall carbon footprint of buildings by working with a variety of stakeholders9 to promote sustainable construction products and systems along the construction chain and to produce a roadmap towards zero net energy buildings.10
The Challenge of Monitoring and Analyzing CO2 Data
With approximately 166 cement production sites in more than 79 countries, the capacity to effectively manage, consolidate and distribute data on CO2 emissions was paramount to the achievement of Lafarge’s mitigation goals. Decision-makers at business units and at the corporate level required timely and relevant data at a variety of break-down levels.
page 45
4 Includes constructing a new plant with the best available technologies and upgrading old cement plants.
5 Examples of alternative fuel sources: rice husks in the Philippines; coffee pods in Uganda; shells from palm oil nuts in Malaysia; plastics, solvents and old tires in Germany and Chile; animal food waste in Austria. In 2008 alternative fuels accounted for 10.7% of fuel use across all business lines.
6 For example, certain cement additives, particularly slag, fly ash and pozzolan, can partially replace clinker, which reduces CO2 emissions per ton of cement.
7 In 2008, Lafarge invested €170 million in research and development, the equivalent of 1% of the Group’s sales.
8 United Nations Environmental Program (UNEP). “Buildings and Climate Change: Industry call toaction.”http://www.unepsbci.org/SBCIRessources/Repor tsStudies/documents/UNEP_SBCI_Buildings_and_C l imate_Change_ _ Indus t r y_Ca l l _ to_Action_/UNEP_SBCI_Call_to_action_final.pdf (accessed 16 November 2009.)
9 Lafarge participates in a variety of collective initiatives around sustainable building such as the Energy Efficiency in Building project, the Building Energy Foundation, Sustainable Building and Construction Initiative, the “Fondation Bâtiment Energie” and the All Sustainable Construction Partnerships. The company also develops collaborative projects with renowned architects such as Jacques Ferrier (Hypergreen project) and Marc Mimram (Living infrastructure).
10 Zero net energy buildings produce as much energy as they consume
Producing good quality information that could be easily synthesized to support decision-making was not an easy task. In 2000 Lafarge began to use a basic tool to calculate, monitor and report CO2 emissions. However, the tool had limited functionalities and although it adequately met general reporting requirements for the Group, it was not aligned with the operational needs of individual business units.
Mages and his team knew that implementing mitigation measures beyond the “low hanging fruit” and effectively translating mitigation goals into operational decisions would increase internal demand for sophisticated CO2 data management. Moreover, external stakeholder pressure in terms of carbon disclosure was mounting. Cadéro, the climate change initiatives manager, explained:
Our team had anticipated future climate change challenges for our company: More carbon regulation implies higher financial incentives to mitigate CO2 emissions and also higher expectations with regard to carbon transparency from investors and stakeholders.
Lafarge’s main focus was to help operational people make CO2 mitigation decisions in a fast, informed and consistent manner. The climate change team carried out market research for an analytical CO2 tool that fit the needs of the company and concluded that the market was not mature enough to offer an efficient tailor-made solution. They opted for in-house development of a tool that suited their needs.
Lafarge’s C-O-Tool
Lafarge’s C-O-Tool is an Excel-based tool providing a user-friendly interface to help operational decision-making with regard to CO2 mitigation. The alpha release was developed in 2008 through an iterative process with the users. The beta release became operational on May 2009.
Even though Lafarge’s climate change team had the competencies to develop a tool in terms of both the programming and knowledge of CO2 challenges and related operational issues, they faced significant challenges. Developing the tool was time intensive and had to be done in addition to their regular responsibilities. Taking the time to develop the tool was a major challenge, particularly since it was during a very busy period, leading up to the Copenhagen climate change summit and with the new EU regulations for the carbon trade market just coming into play.
From a technical standpoint, defining a mathematical model that linked CO2 emissions with particular operational levers required a detailed understanding of the specific contribution of each lever to emissions in a non-linear context. Four levers were included in the model: C/K ratio (cement to clinker ratio)11, cement additives12 and clinker moves; heat consumption and fuel mix. Ensuring tool user-friendliness was another challenging task, since what was needed was a “one size fits four” design that could be used by different levels of management: technical specialists, operational managers, top managers, and the climate change corporate team. The tool was accompanied by a video tutorial explaining how to run analyses and carry out benchmarking and simulation exercises and how different users could make the most of these capabilities.
page 46
11 The decarbonation phase of clinker production is the most emission-intensive phase of cement production. Thus, the higher the C/K, the lower the emission ratio per ton of cement.
12 Cementitious materials or cement additives, are minerals added during the last phase of the cement production process. The use of cement additives reduces CO2 emissions because a) they automatically reduce the proportion of clinker and b) they are produced from industrial waste which would otherwise have been discarded.

Lafarge’s C-O-Tool was designed with three main functionalities (refer to Exhibit 5 for a print view of Lafarge’s C-O-Tool):
1. Monitoring: To provide a detailed breakdown of emissions, thus supporting a full overview of current emissions at different levels (plant, business unit, country, regional, global) and understand the levers that lead to CO2 reductions. 2. Benchmarking: To support easy and intuitive comparisons between the different Lafarge plants and business units. For example, a manager in Germany could compare the CO2 performance of his plant with other plants in Germany, China or France and with the European or worldwide average. 3. Forecasting/simulation: To allow for the simulation of the effects of alternative carbon reduction actions and identify the full potential for CO2 reduction in a given business unit. For example, a plant manager can simulate the effect of a production process optimization on CO2 emissions and the knock-on effect of selected key production levers on CO2 reduction. Or, plant managers can forecast the effect on CO2 emissions of, for example, specific increases on the C/K ratio levels, cement production growth or biomass rate increase in the fuel mix.
Cadéro explained that implementation of the C-O-Tool was less challenging than its design:
The tool was well received internally. First of all, it didn’t require any extra work by managers and, crucially, it is user-friendly. Users don’t actually need to enter data, as we manage and populate the database for them. Managers simply “play with the data” using only a few mouse clicks. Secondly, the tool suits both operational and business requirements, providing solutions to a real business problem. CO2 emissions are a key issue for Lafarge; everyone is aware of that.
Christophe Nicoli, senior vice president, cementitious projects & C/K projects, commented:
The tool gives a highly visual snapshot of all the levers that lead to CO2 performance and it also clearly shows the specific impact of each lever, which greatly facilitates priority setting in the decision making process.
However, the tool does not yet have a financial interface with options for cost/benefit simulations or pay-back time forecasts. Cadéro explained that while this had been the subject of long discussions with users, owing to the high level of complexity require for financial functionality, the development team decided not to include it in the alpha and beta releases.
New Challenges Ahead?
By the end of 2008, Lafarge had reduced its emissions to 12.5% below its 1990 levels in absolute terms in developed countries and by 18.4% per tonne of cement produced globally. This represented a total mitigation of over 23 million tonnes of CO2 equivalents per year.
Lafarge continues to assess its potential for making more giant steps that will have real impact on climate change. Jim Leape, Director General of WWF International, suggested a way forward:13
The challenge ahead for Lafarge is to extend its efforts to its entire group notably in emerging economies (Brazil, China, and India) where demand for construction materials is growing rapidly. Through this partnership, we expect Lafarge to take a leadership role in moving the entire cement sector, as well as other energy-intensive industries, towards a sustainable economy.
page 47
13 Press-release: “Lafarge and WWF International renew their partnership for another four years.” Issued 4 September 2009..
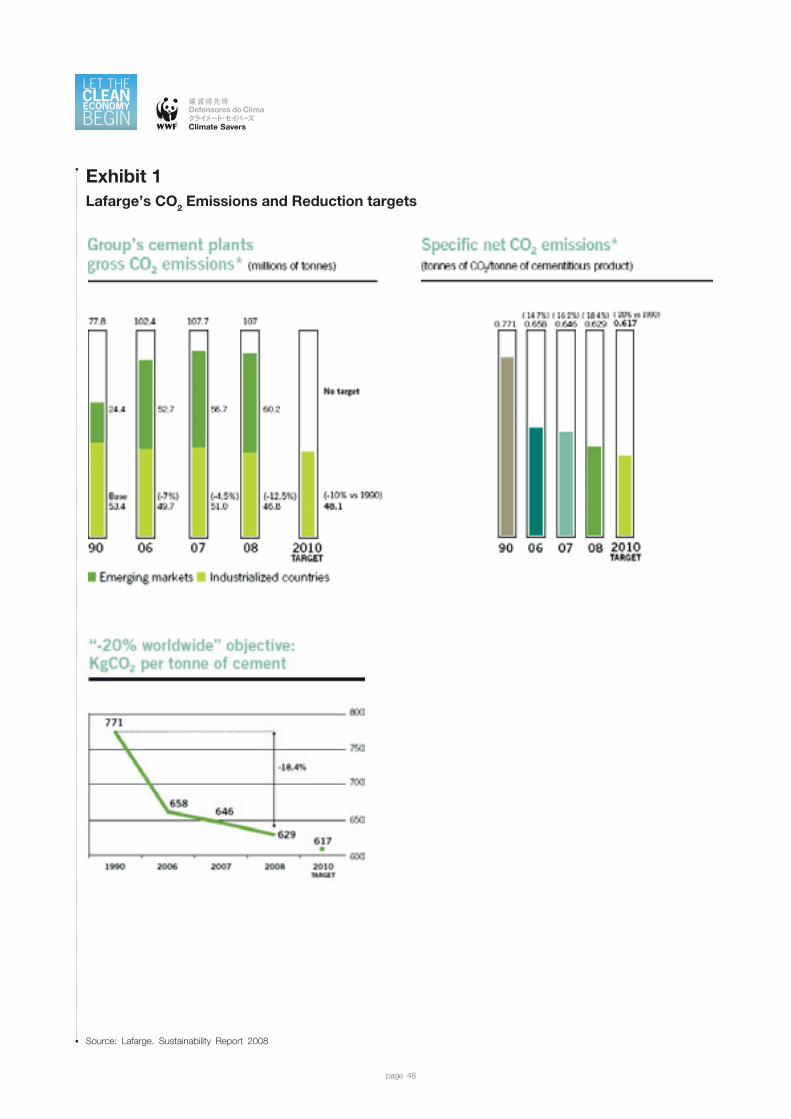
Exhibit 1Lafarge’s CO2 Emissions and Reduction targets
page 48
Source: Lafarge. Sustainability Report 2008
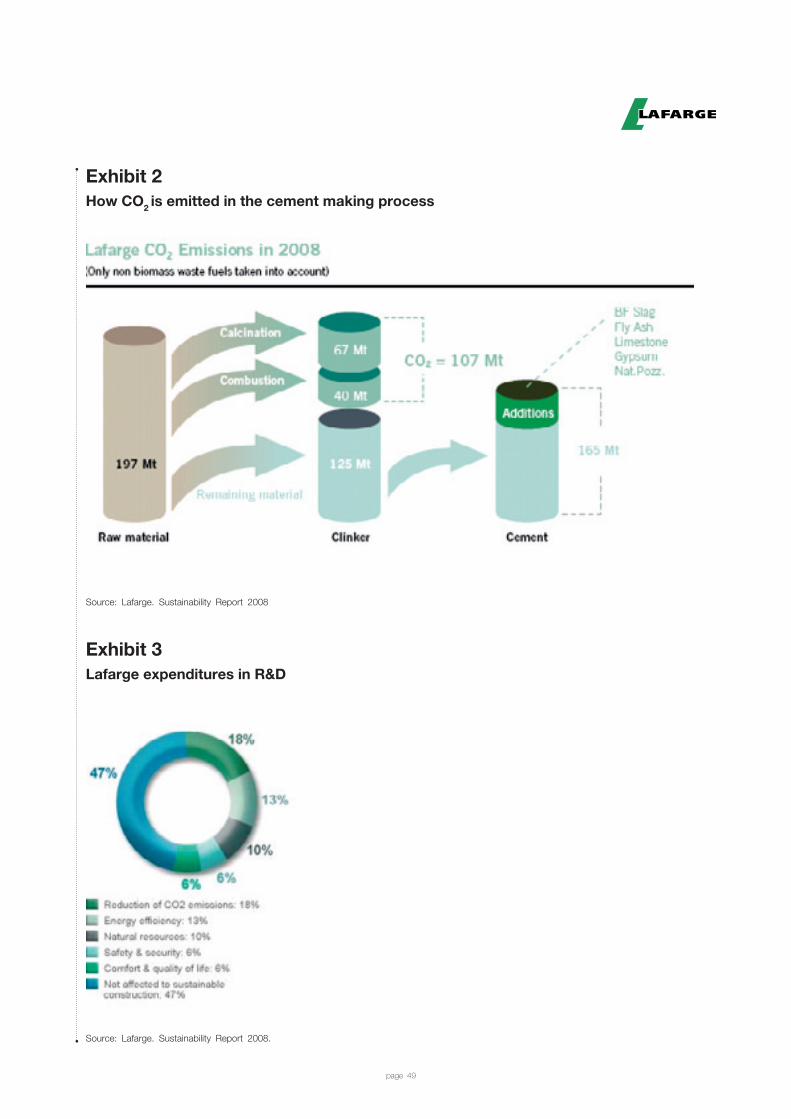
Exhibit 2How CO2 is emitted in the cement making process
page 49
Source: Lafarge. Sustainability Report 2008
Exhibit 3Lafarge expenditures in R&D
Source: Lafarge. Sustainability Report 2008.
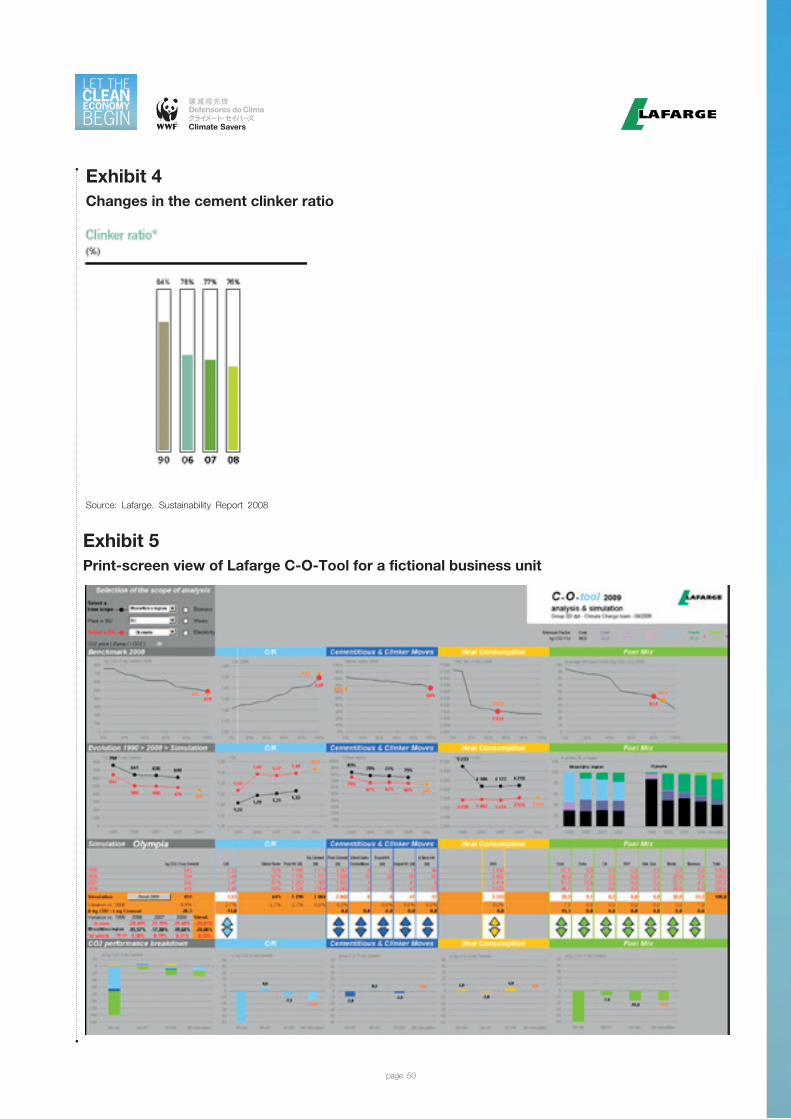
Exhibit 4Changes in the cement clinker ratio
page 50
Source: Lafarge. Sustainability Report 2008
Exhibit 5Print-screen view of Lafarge C-O-Tool for a fictional business unit
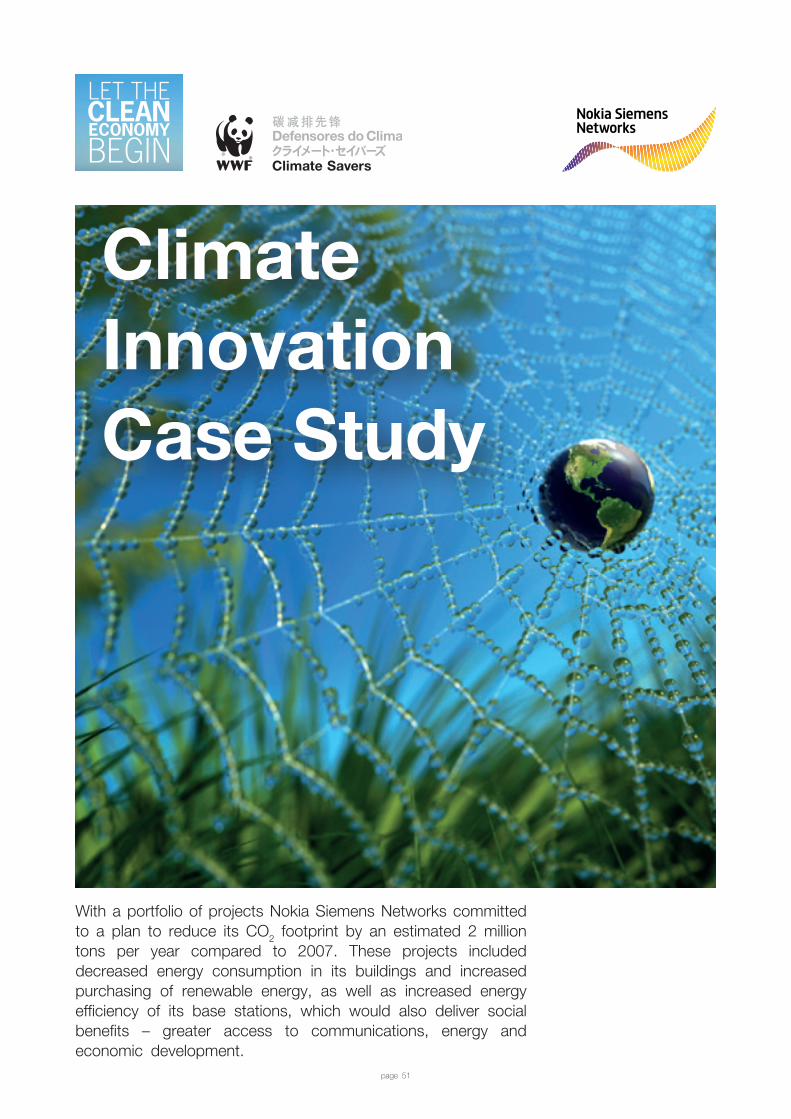
With a portfolio of projects Nokia Siemens Networks committed to a plan to reduce its CO2 footprint by an estimated 2 million tons per year compared to 2007. These projects included decreased energy consumption in its buildings and increased purchasing of renewable energy, as well as increased energy efficiency of its base stations, which would also deliver social benefits – greater access to communications, energy and economic development.
Climate InnovationCase Study
page 51
ESPOO, FINLAND. OCTOBER 2005. The R&D team at Nokia Siemens Networks had done it. A year before, they had received an assignment to transform base station technology to make it smaller, lighter and more convenient. Today, the team was celebrating the product’s launch. They were proud of how well they had exceeded their energy efficiency goals. Their work would create savings of €30 million in energy costs and 145,000 tons in CO2 footprint for its customers per year. The technology was made 90% from recyclable materials and it was 80% smaller.
Background
Nokia Siemens Networks is a 50-50 joint venture between Nokia’s Network Business Group and Siemens Communications. It provides wireless and fixed network infrastructure and communications and network service platforms, as well as professional services to operators and service providers. Established in April 2007, Nokia Siemens Networks is one of the top three telecommunications equipment suppliers in the world. It made €15.3 billion in sales in 2008 with more than 600 operator customers in 150 countries, and systems serving over 1.5 billion subscribers. It has around 60,000 employees
In January 2008 the company partnered with WWF International to work on training workshops, global web campaigns and other environmental awareness activities. A few months later, WWF invited the company to join WWF Climate Savers.
WWF Climate Savers was founded in 1998 by WWF as a platform to enable companies to join forces in committing to more ambitious reductions in their greenhouse gas emissions and to transform the industry’s more customary incremental and/or passive approach toward climate change action.
Nokia Siemens Networks was attracted by the value proposition of Climate Savers – approaching climate change as a driver of business activity and as an opportunity to create new business for a low-carbon economy – and joined the initiative in June 2008.
Setting Targets for CO2 Reduction
Nokia Siemens Networks’ CO2 footprint came mainly from the consumption of electricity required to run its mobile infrastructure products. Mobile infrastructure had experienced ever-increasing energy demands since 2003, as the internet and mobile phones spread rapidly to developing countries.
The company has been recognized as being active in addressing climate change issues.1 In this regard, it is working on its products, in addition to building energy efficiency into its buildings by improving lighting, heating and energy sources. It is also implementing various staff programs like its “greenest car policy in Finland” (refer to Exhibit 1) and promoting virtual
IMD Research Associate Darren Willman prepared this case under the supervision of Dr. Aileen Ionescu-Somers and Professor Corey Billington, Deputy Director and Director respectively of the Forum for Corporate Sustainability Management at IMD.
This case was commissioned by the WWF Climate Savers Program
It was developed with inputs from the staff of both Nokia Siemens Networks and WWF. The contribution of all parties is gratefully acknowledged.
page 52
Nokia Siemens Networks: Connecting Business growth and emissions reductions.
Copyright © 2009 by WWF Climate Savers and IMD - International Institute for Management.
1 Fitchard, Kevin. “Nokia Siemens Greens up Its Radio Gear.”Penton Insight, November 21, 2007

ESPOO, FINLAND. OCTOBER 2005. The R&D team at Nokia Siemens Networks had done it. A year before, they had received an assignment to transform base station technology to make it smaller, lighter and more convenient. Today, the team was celebrating the product’s launch. They were proud of how well they had exceeded their energy efficiency goals. Their work would create savings of €30 million in energy costs and 145,000 tons in CO2 footprint for its customers per year. The technology was made 90% from recyclable materials and it was 80% smaller.
Background
Nokia Siemens Networks is a 50-50 joint venture between Nokia’s Network Business Group and Siemens Communications. It provides wireless and fixed network infrastructure and communications and network service platforms, as well as professional services to operators and service providers. Established in April 2007, Nokia Siemens Networks is one of the top three telecommunications equipment suppliers in the world. It made €15.3 billion in sales in 2008 with more than 600 operator customers in 150 countries, and systems serving over 1.5 billion subscribers. It has around 60,000 employees
In January 2008 the company partnered with WWF International to work on training workshops, global web campaigns and other environmental awareness activities. A few months later, WWF invited the company to join WWF Climate Savers.
WWF Climate Savers was founded in 1998 by WWF as a platform to enable companies to join forces in committing to more ambitious reductions in their greenhouse gas emissions and to transform the industry’s more customary incremental and/or passive approach toward climate change action.
Nokia Siemens Networks was attracted by the value proposition of Climate Savers – approaching climate change as a driver of business activity and as an opportunity to create new business for a low-carbon economy – and joined the initiative in June 2008.
Setting Targets for CO2 Reduction
Nokia Siemens Networks’ CO2 footprint came mainly from the consumption of electricity required to run its mobile infrastructure products. Mobile infrastructure had experienced ever-increasing energy demands since 2003, as the internet and mobile phones spread rapidly to developing countries.
The company has been recognized as being active in addressing climate change issues.1 In this regard, it is working on its products, in addition to building energy efficiency into its buildings by improving lighting, heating and energy sources. It is also implementing various staff programs like its “greenest car policy in Finland” (refer to Exhibit 1) and promoting virtual
IMD Research Associate Darren Willman prepared this case under the supervision of Dr. Aileen Ionescu-Somers and Professor Corey Billington, Deputy Director and Director respectively of the Forum for Corporate Sustainability Management at IMD.
This case was commissioned by the WWF Climate Savers Program
It was developed with inputs from the staff of both Nokia Siemens Networks and WWF. The contribution of all parties is gratefully acknowledged.
page 53
Nokia Siemens Networks: Connecting Business growth and emissions reductions.
Copyright © 2009 by WWF Climate Savers and IMD - International Institute for Management.
1 Fitchard, Kevin. “Nokia Siemens Greens up Its Radio Gear.”Penton Insight, November 21, 2007

conferencing. Its total greenhouse gas (GHG) emissions from facilities in 2008 amounted to 216,936 tonnes of CO2-equivalent (refer to Exhibit 2). This is equivalent to about 331,000 business class return flights from Helsinki to London. Obviously the amount of GHG emissions is much higher when the use of the company’s products is factored in.
The way Nokia Siemens Networks approached the WWF Climate Savers partnership was to set specific targets for the products with the biggest CO2 footprints and for internal business operations instead of establishing a single emissions reduction target. Its ambition was to have specific and integrated targets, which were therefore more meaningful to the business, using 2007 CO2 emissions as the baseline. Three major targets were set:
• Improve the energy efficiency of its GSM/EDGE and WCDMA/HSPA base station products by up to 40% by 2012.2
• Decrease the energy consumption of office buildings by 6% by 2012.
• Increase the use of renewable energy in company operations to 50% of total energy use by the end of 2010.
It was anticipated that meeting these targets would result in an annual decrease in the company’s CO2 footprint of 2 million tons.
Focusing on Energy Efficient Base Stations
A base station is a wireless communications unit installed at a fixed location to enable the functioning of mobile phones, wireless internet and other gadgets using communications technologies like GSM, WCDMA and WiFi. The base station receives and decrypts signals, and also encrypts and transmits signals to facilitate communication. It is managed by another piece of equipment, a controller which allocates the channels, receives measurements and other functions.
Base stations are placed high on buildings, towers or hills to ensure good coverage. They are also large, heavy and difficult to maneuver. Despite their durability, they are often upgraded or replaced to keep pace with fast-improving technology. For mobile operators they are expensive to run, since they are energy intensive. Anne Larilahti, Nokia Siemens Networks’ head of environmentally sustainable business, pointed out:
For a typical mobile operator in developed markets you are looking at up to 10% of the network’s operational expenditure going on energy. And if we go to developing markets it is 15% to 30%.
Developing the Flexi Base Station
In late 2004 a team of engineers in R&D were challenged to transform the typical base station into a smaller, lighter and more convenient unit.
The four main aims of the new technology were to: • Minimize the number of base station sites
• Minimize the need for air-conditioning to cool the sites
• Use the latest base station technology
• Deploy software features that optimize the use of radio access for wireless communications.
page 54
2 GSM is a popular mobile telecommunications standard and EDGE is an enhanced version of GSM. WCDMA is an interface found in mobile telecommunications networks and HSPA is a mobile telephony protocol that enhances WCDMA.
The R&D team in charge of the project developed a solution that completely changed the form of the base station, making it portable and hence more manageable. Along with this change in form, a number of other benefits had come, including energy efficiency. Nokia Siemens Networks applied the Design for Environment process (DfE) to generate and track environmental product requirements. The aim of DfE is to ensure that environmental items are taken into consideration through a product’s entire life cycle: from raw materials to end of life. For the Flexi base station, R&D looked closely at the use, remarking and reuse of the materials, and the energy efficiency of the product. At the product review process, these requirements were measured against the prototype design and the final product. The product was launched in October 2005, with a new model following in 2006 and a third one, the Flexi Multiradio base station, released in February 2009. Nokia Siemens Networks wanted to keep itself and its product as innovative as possible.
The New Base Station: Smaller, Durable, Energy Efficient and Cost Effective
The Flexi base station’s key benefit for customers was its size: 80% smaller than the norm. It was redesigned from being a bulky cabinet to the size of carry-on airline baggage (refer to Exhibit 3 for images of base stations). This meant 80% less material and 80% less resource consumption and CO2
footprint. Over 90% of the materials used were recyclable.
The reduced size was a substantial factor in facilitating the deployment of the station. Now that it could be hand-carried, cranes and other heavy building equipment were no longer necessary for installation, thus further reducing the overall energy burden. In addition, a technician no longer had to travel to the site to install new features and functionalities – this was arranged centrally at the press of a button. Car journeys to locations for maintenance became minimal. Mobile operators no longer had to purchase new base stations when the existing technology was outdated; base stations now had a longer life cycle, further reducing resource consumption and CO2 footprint.
The new Flexi Multiradio base station consumes only 790 watts, the equivalent of a coffee maker. The typical 2005 base station consumed 4,100 watts. This was an extremely interesting proposition for mobile operators, which in the last few years had been forced to shift priorities from growing revenues per user and increasing the number of subscribers to managing a rising energy cost. For a typical Western European operator with 10 to 15 million subscribers, running its base stations requires 290 gigawatt hours of electricity a year, at a cost of €30 million (US$45 million). If such an operator used the Flexi Multiradio base station, the annual energy saving would be the equivalent of 145,000 tons of CO2 footprint. The Challenge of Marketing the Flexi Base Station
The new base station fulfilled all of the objectives put to R&D and gained recognition as a technological breakthrough. In 2009 the CTIA E-Tech Awards hailed it as the Greenest Network Innovation.3 At the Global Mobile Awards, it was rewarded with the Best Network Technology Advance, and Nokia was commended for its Outstanding Environmental Contribution.4 The
page 55
3 “International CTIA WIRELESS 2009® Announces E-Tech Award Winners.” CTIA, April 2, 2009. <http://www.ctia.org/media/press/body.cfm/prid/1815>(accessed November 24, 2009).
4 “Global Mobile Awards 2009 – Winners.” GSMA Global Mobile Awards 2009. <http://www.globalmobileawards.com/awards/winners_archive.shtml> (accessed November 24, 2009).
Sustainable Energy Europe Awards saw the Flexi Multiradio base station nominated for the Market Transformation award.
Yet even though the Flexi base station was a breakthrough technology, marketers found that mobile operators were initially reluctant to pursue it. New sales were limited by the normal life cycle of products already installed since companies waited until existing assets were no longer effective before installing new technologies. Thus, from an environmental perspective, the full impact of energy efficiencies from Nokia Siemens Networks’ new product would not be felt worldwide until after at least one life cycle with older products, estimated to be 10 years. Larilahti commented:
The fact is that operators already have operational equipment at their sites. There is no business case to change equipment they bought only two or three years ago. The environmental perspective is not strong enough to go against that.
This was not the case for developing markets and remote areas of developed countries, so the company focused marketing efforts in those areas. A focus on remote areas of developed countries, such as the mountains in Italy, and on developing markets where new infrastructure was being developed, meant that Nokia Siemens Networks was providing new locations with access to communications technologies for the first time.
Going for Developing Markets
The Flexi base station is Nokia Siemens Networks’ first major offering for developing markets. Its low energy consumption means it does not depend on the electricity grid, since it can run on diesel or renewable energy generators. This facilitates the deployment of mobile networks in rural areas, thus having a positive impact on the economic development of those communities. Further social benefits arise when base stations built close to villages also allow the villagers to charge their mobile phones and car batteries that store the energy they use in their homes. The company has also set up partnerships with major solar and wind power companies to provide a turnkey solution to mobile operators.
For Telenor Pakistan this was an ideal solution, as chief technology officer Khalid Shahzad explained:
Expanding into rural areas is a challenge, as there is no access to the electricity grid to supply power to base stations. Traditional alternatives, such as diesel generators are neither environmentally friendly nor cost-efficient. Nokia Siemens Networks not only offers a clean substitute, but will also reduce the cost of running these sites – allowing us to offer affordable communications to users in rural Pakistan.5
GSMA (an industry association representing the interests of the worldwide mobile communications industry) forecast that some 118,000 renewable off-grid base stations would be built in developing markets by 2012. If the operators choose renewable energy instead of diesel energy for power generation, this would result in a saving of up to 2.5 billion liters of diesel.
However, Nokia Siemens Networks recognizes that there are challenges in meeting this goal, since many operators still adopt a short-term financial perspective for their infrastructure, preferring diesel generators to run the base station because they are cheaper to buy than renewable energy generators. But this does not take into account the complicated logistics for
page 56
5 “Telenor Pakistan Opts for Solar Power to Extend Services to Rural Customers.” Nokia Siemens Networks Press Release, November 4, 2009. < http://www.nokiasiemensnetworks.com/press/press-re leases/te lenor-pakistan-opts-solar-power-extend-services-rural-customers > (accessed November 24, 2009).

delivering the diesel to the sites or the cost of the fuel itself. As an example, Nigerian operator Zain estimates that it is burns 350 liters of diesel every minute to run its network. Theft of fuel is also a problem.
In response, the company points out that the renewable option becomes a financially better solution within two to four years. This is because there is almost no operational expenditure – solar and wind technologies are virtually maintenance free after installation.
One example is a small base station in India that was put up three years ago. Nokia Siemens Networks established it to run on renewable energy but with diesel back-up just in case. Since operations began, the diesel back-up has been used only 5% of the time, and this would be even less except the engine needs to run periodically to keep it in working order.
So far Nokia Siemens Networks has deployed more than 400 base stations running on renewable energy in 25 countries in Asia-Pacific, China, Europe, the Middle East, Africa and Latin America. This relatively small number is believed to be due to a lack of trust in renewable energy and inefficient old base stations. But the company has recently seen a changing mindset, as Larilahti explained:
When operators were sending us requests and asking us to bid, we were lucky if we got a dozen. Now, some of the deals are in thousands.
Major Lessons and Next Steps
Reflecting on the journey, Larilahti extracted two major lessons. Her first and most important lesson:
It is not only about incremental change, sometimes it pays to blow out the whole thing and look for completely new ways of doing things. It’s very easy to get stuck on incremental change, the easy and safe way of approaching things.
Nokia Siemens Networks has learned and seen the benefits of transformational innovation and change. Being bold and staying committed to the new Flexi base station has led to the opening of new markets, a market position as an innovator, and huge advantages in terms of energy efficiency – the linchpin in the company’s response to climate change. Energy efficiency was the route it took to respond to the climate change issue. Lahrilahti outlined her second lesson:
Also, the whole energy and climate change discussion, as depressing as it can be, is inspiring because it is opening up so many opportunities for corporations, completely new industries will be formed. We need to take it from that perspective, rather than only looking at how much more difficult it is going to make things.
page 57

Exhibit 1About Nokia Siemens Networks’ “Greenest Car Policy in Finland”
page 58
Source: WWF Climate Savers partner fact sheet on Nokia Siemens Networks
Exhibit 2Summary Results on Energy and Emissions Indicators, 2007 and 2008
Source: Nokia Siemens Networks Corporate Responsibility Report 2008
Nokia Siemens Networks has what it calls ‘the greenest car policy in Finland’, which encourages employees to choose cars with lower emissions: the policy includes monetary incentives that encourage employees to choose more environmentally friendly vehicles. The maximum emission limit is 240g/ km, and below emissions of 170g/km the company portion of the leasing fee starts increasing. For example, when an employee chooses a car with very low emissions (130g/km or below) the company share of the leasing fee doubles. The company service fleet is part of the green car policy: the target is to reduce the emission level of new cars in the service fleet to 120g/km in 2010.
Novo Nordisk’s search for cost-effective solutions to reduce CO2 emissions had driven the development of a new business model which expanded the commercial basis of renewable energy in Denmark.
Climate Innovation
Case Study
page 59
ESBJERG, DENMARK. SEPTEMBER 17, 2009. Jan Hoff, Corporate Vice President of Global Support in Product Supply at Novo Nordisk, felt honored and proud as Crown Prince Frederik of Denmark was inaugurating Horns Rev II. Located in the North Sea and owned by Dong Energy, Horns Rev II is the world’s largest offshore wind farm.
Novo Nordisk had played a crucial role in developing the business model innovation that had allowed Dong Energy to form the commercial base that contributed to finance the construction and operation of Horns Rev II. Hoff had championed the Novo Nordisk team that had worked alongside Dong Energy executives on the design of the innovative climate partnership. Background
Novo Nordisk is a focused healthcare company headquartered in Denmark. A world leader in diabetes care, the company was created in 1989 through a merger between two Danish companies – Novo Industri A/S and Nordisk Gentofte A/S. As of December 2008, Novo Nordisk had over 27,000 employees in 81 countries and production facilities in six countries. The company’s response to climate change was kicked off in 2003 as a result of internal discussions and a dialogue with WWF. It is based on reducing dependence on carbon-based fuel and showing leadership in this respect.
In January 2006 Novo Nordisk became the tenth company to join the WWF Climate Savers initiative. Climate Savers was founded in 1998 by WWF as a platform to enable companies to join forces in committing to more ambitious reductions in their greenhouse gas emissions. At that time Climate Savers was the first partnership of its kind. The main objective of the initiative was to transform the industry’s more customary incremental and/or passive approach toward climate change action.
By the end of 2008, Novo Nordisk had begun to reap rewards from its Climate Savers efforts, as energy-related emissions went from 236,000 tons of CO2-equivalent in 2007 to 215,000 tons in 2008 (refer to Exhibit 1 for data on energy use and CO2 emissions from 2004 to 2008).
Being pushed towards innovation
In its Climate Savers agreement with WWF, Novo Nordisk committed to reduce emissions from global production sites by 10% by 2014 (in absolute terms compared with 2004 emissions). Hoff qualified the target as bold. It meant that production and business growth would have to be decoupled from growth in energy consumption and would represent a reduction of 65% when taking projected production capacity growth into consideration (refer to Exhibit 2 for data on projected reduction of emissions). Moreover, the
Research Associate Dr. Tania Braga prepared this case under the supervision of Dr. Aileen Ionescu-Somers and Professor Corey Billington, Deputy Director and Director respectively of the Forum for Corporate Sustainability Management at IMD as a basis for learning rather than to illustrate either effective or ineffective handling of a business situation.
This case was commissioned by the WWF Climate Savers Program.
It was developed with inputs from the staff of both Novo Nordisk and WWF. The contribution of all parties is gratefully acknowledged.
page 60
Developing an innovative business model: Novo Nordisk and Dong Energy driving the market for renewable energy in Denmark.
Copyright © 2009 by WWF Climate Savers and IMD - International Institute for Management.
company’s approach to setting the target was fundamentally different from that of most other industry players. He explained:
Companies usually set emission reductions targets based on the following process. They first calculate their current emissions and evaluate how many tons of CO2-equivalent they would be able to cut through well-known measures, mostly incremental improvements. Then, in light of the business growth targets, they calculate a feasible and reasonable emission reduction target. Our process was exactly the opposite and turned out to be very ambitious. We started by agreeing with WWF on a meaningful target based on its potential to impact the concentration of greenhouse gases in the atmosphere. Then, we decided to make it happen; even if, at the time, we were unsure of how to achieve this ambitious goal. We then sought incremental improvements against the target and radical innovative solutions to achieve the target. By being daring, we forced ourselves to innovate!
After setting the target, Novo Nordisk began to seek opportunities to improve productivity in its industrial facilities, reduce energy consumption and increase renewable energy use. Focusing on the Danish production sites made a lot of sense since 85% of the company’s CO2 direct emissions comes from the production of insulin – a highly energy-intensive process - which takes place only in Denmark.
The incremental path to reduce emissions was delegated to a global project manager and a network of thirty energy stewards placed throughout the company’s production sites. While the company had been working with energy management prior to the Climate Savers agreement, this new set-up was a significant strengthening of energy management in the company, including training of the energy stewards and the inclusion of CO2 reduction targets in the company’s Balanced Scorecard. The energy saving team was responsible for identifying opportunities in production sites – mainly in ventilation and cooling systems – and, through relatively simple facility management optimization, ensuring their successful exploitation. However, although results from incremental advances were substantial,1 achieving ambitious targets would call for more radical innovation. In its quest to fully power Danish production sites with renewable electricity by 2014, Novo Nordisk first investigated the opportunity of building their own wind farm, which turned out not to be financially feasible. It was Novo Nordisk’s company motto “our focus is our strength” that showed the way forward. Hoff explained:
Our expertise is on diabetes care and biopharmaceuticals. To create real change in the energy area, we had to team up with someone with the right expertise. We needed to bring new brain power to the table.
Novo Nordisk sought a partnership with an energy company which would ensure the provision of certified additional renewable energy to the grid and fit in with the company’s ambition to help driving the market for renewable energy in Denmark.
An Innovative Business Model
A world leader in the construction and operation of offshore wind turbines, Dong Energy was one of the leading energy groups in Northern Europe. With its cutting-edge technological expertise on wind power generation, the company’s ambition was to triple its renewable energy capacity by 2020. However, to ensure financial leverage for long-term investments
page 61
1 Novo Nordisk Annual Report 2008, reports that nearly a quarter of the energy-savings achieved in 2008 came from projects which required no upfront investment. It also reports that half of the completed projects were expected to have a pay-back time of one year, while two thirds of the remaining projects were expected to have a pay-back time of three years.

in renewable energy, Dong Energy needed a sustained commercial base (refer to Exhibit 3 for further information on Dong Energy’s efforts on renewable energy).
Furthermore, in early 2006, Dong Energy had set itself the objective to put its expertise on energy efficiency to the service of its residential and industrial customers in order to save 144 million kWh a year in the following two years. This was part of an agreement between the Danish Parliament and power and gas companies aiming at reducing Danish energy consumption outside the transport sector2. Novo Nordisk executives saw a perfect opportunity to collaborate with Dong Energy to establish a partnership responding to the challenges of both companies. Together they sought for an innovative business model to boost the identification of energy savings in Novo Nordisk industrial plants and use the resultant financial benefits to buy renewable energy from Dong Energy that was additional to the grid.
Even though the two companies had a strong business case for action and a fertile ground for understanding, structuring a business model that would back up Dong Energy’s heavy capital investments on renewables would prove challenging. Hoff commented:
We had a common view on what we wanted to achieve, but we had to spend a lot of energy and creative power to find out exactly how to do it. The strong shared vision was what kept us together when negotiations became challenging. Partnerships always involve complex negotiations on how to reasonably split costs and benefits. Our partnership was no exception. Moreover, it was a long-lasting partnership, as we were committing to each other all the way to 2020. It took a while before everyone was comfortable with the terms of our collaboration.
The partnership agreement between Novo Nordisk and Dong Energy was signed in May 2007 (refer to Exhibit 4 for a graphic representation of the partnership mechanism). So how did the process work? First, Dong Energy lent its expertise in energy efficiency to Novo Nordisk, by offering technical advice and consulting services. Dong came up with customized solutions which integrated energy consumption audit, efficiency improvements and servicing, and maintenance of energy installations. Once the solutions had been implemented, Novo Nordisk earmarked all financial savings for purchasing renewable energy from the new wind farm Horns Rev II. In this way, Novo Nordisk devised a cost-neutral way of achieving significant reductions in CO2 emissions, since the premium price of green electricity would be financed through energy savings. At the same time, Dong Energy devised a long-term mechanism that would contribute to financing the capital requirements of bringing additional renewable energy to the grid and expanding the commercial basis of renewable energy in Denmark. Hoff explained that Novo Nordisk would very likely purchase about a third of the total energy produced by the Horns Rev II offshore wind farm (refer to Exhibit 5 for information on Horns Rev II). He added that the significant reductions achieved in energy consumption through the implementation of Dong Energy solutions in the first two years of the partnership should enable Novo Nordisk to attain its goal of fully powering Danish facilities with green energy a few years ahead of schedule.
page 62
2 Dong energy was directly responsible for 27% of the overall reduction target agreed between the Parliament and energy companies.
Leadership Demonstration
A year and a half after entering the partnership with Novo Nordisk, Dong Energy had entered into 13 similar partnerships with other companies following the same business model. The company worked with each company in a customized way, assisting them in realizing energy savings of up to 10% on an average basis. All the partners earmarked these energy savings to purchasing renewable energy from Horns Rev II (refer to Exhibit 6 for a description of the partnerships from Dong Energy’s point of view).
In May 2009, Allan Schefte, vice president of Business to Business activities at Dong Energy, announced to the Danish newspaper “Berlingske Tidende” that he was expecting up to 100 new partnerships in Northern Europe within the next five years.
Dong Energy’s success in replicating the partnership model with other companies endorsed the leadership dimension of Novo Nordisk’s climate strategy. Hoff commented:
We found a cost-effective way of reducing our emissions. But we are aware that it is not enough, as our own emissions are just a drop in the ocean. We want to be a leader in the transition to a low carbon economy. However, being a leader is only possible if others follow. Our partnership with Dong Energy has had a snowball effect. With other companies joining DONG Energy in similar partnerships, we are achieving scale.
page 63

Exhibit 1Novo Nordisk’s CO2 Emissions (2004 to 2008)
page 64
Source: Novo Nordisk Annual Report 2008.
Exhibit 2Novo Nordisk’s Projected CO2 Emissions (2004 to 2014)
Source: Novo Nordisk. cLEAN® - Novo Nordisk’s LEAN program.
Note: cLEAN is Novo Nordisk’s program aimed at optimising production. The program has a positive impact on energy efficiency by decreasing energy consumption per unit produced. The cLEAN program was launched prior to the Climate Savers agreement. Thus, the business as usual curve in Novo Nordisk’s Climate Savers agreement is the middle curve - ‘with cLEAN(R) - without climate strategy’

Exhibit 3Dong Energy’s Efforts on Renewable Energy Generation
page 65
Source: Dong Energy A/S. Annual Report 2008
Dong Energy is headquartered in Denmark. It is one of the leading energy groups in Northern Europe, procuring, producing, distributing and trading energy and related products. In December 2008, the company had approximately 5,500 employees and revenues of €8 billion.
In 2008, renewable energy sources accounted for 14% of the company’s power generation and for 61% of the company investments. Dong Energy had set the long-term objective for energy production to be carried out with zero CO2 emissions while maintaining high levels of supply security.
According to company sources, as of December 2008, half of the world’s existing offshore wind turbine capacity had been built by Dong. The company inaugurated the largest wind farm in the world in September 2009. When fully operational it will have a capacity of 209 MW, which is equivalent to the power consumption of 200,000 households.
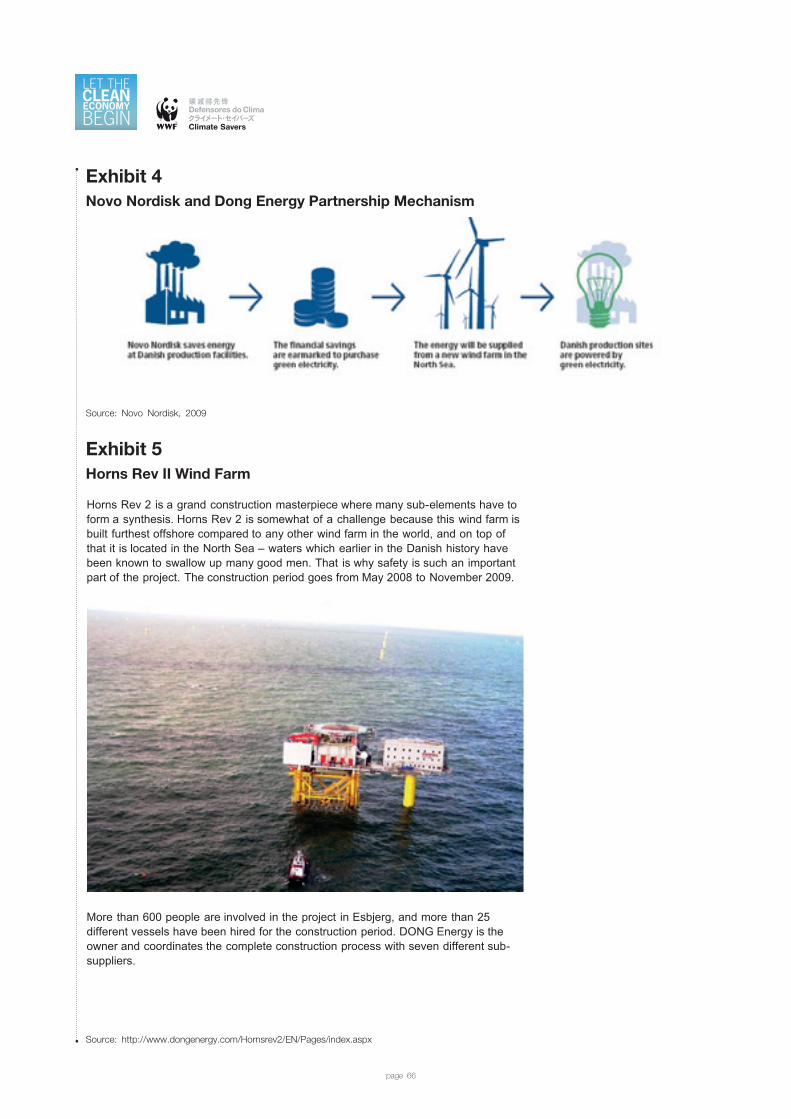
Exhibit 4Novo Nordisk and Dong Energy Partnership Mechanism
page 66
Source: Novo Nordisk, 2009
Exhibit 5Horns Rev II Wind Farm
About the Project
http://www.dongenergy.com/Hornsrev2/EN/about_horns_rev_2/About_the_Project/Pages/about_the_project.aspx[25-11-2009 11:03:05]
DONG Energy A/S Kraftværksvej 53 Skærbæk 7000 Fredericia T 99 55 11 11 [email protected] - - - -
About the Project Environment Time Schedule History
Home Sitemap All DONG Energy sites Dansk
News About Horns Rev 2 Images Contact Us About DONG Energy
Horns Rev 2 is a grand construction masterpiece where many sub-elements have toform a synthesis. Horns Rev 2 is somewhat of a challenge because this wind farm isbuilt furthest offshore compared to any other wind farm in the world, and on top ofthat it is located in the North Sea – waters which earlier in the Danish history havebeen known to swallow up many good men. That is why safety is such an importantpart of the project. The construction period goes from May 2008 to November 2009.
More than 600 people are involved in the project in Esbjerg, and more than 25different vessels have been hired for the construction period. DONG Energy is theowner and coordinates the complete construction process with seven different sub-suppliers.
The water depth is 9-17 metres and the average wind speed is just below 10 m/s.The average wave height is 1.5 metres – ie 3 metres from bottom to top.
The construction site during theconstruction phase
The construction site in Esbjerg comprises inspection,office, personnel and sanitary facilities as well as toolsand storage room for suppliers and quay and harbourfacilities, etc.
The first turbine at Horns Rev 2 waserected on 19 March 2009
In the press release, Connie Hedegaard, Denmark’sMinister of Climate and Energy, says:
“It is good news for the entire Danish population thatthe turbines at Horns Rev 2 now start spinning. HornsRev 2 is an important step towards the government’slong-term ambition to become independent of fossilfuels”.
Watch TV2's feature on Horns Rev 2 here (inDanish).
About the ProjectFoundationsTurbinesCablesAccomodation platformProject SuppliersPartners Who Buy electricity fromHorns Rev 2The People Behind Horns Rev 2Film about the construction ofHorns Rev 2
Print | Enlarge text
Search
Source: http://www.dongenergy.com/Hornsrev2/EN/Pages/index.aspx
Exhibit 6Description of the Partnerships from Dong Energy’s Point of View
page 67
37
EnErgy MarkEts rEsEarch & DEvElopMEnt risk ManagEMEnt EMployEEs EnvironMEnt anD safEty corporatE govErnancEsales & DisTriBuTion
Zoom
the climate challenge is on the agen-
da everywhere – at the un, in the Eu,
in the Danish parliament, in the busi-
ness community and in private homes.
the climate debate and the need for
action here and now create an ideal
platform for growth and innovation.
Dong Energy has successfully entered
into climate partnerships with busi-
nesses, housing associations and local
authorities that see potential in the
new challenges. such partnerships are
individual and tailored to each cus-
tomer’s needs. the recurring theme is
that financial savings achieved by
means of specific energy reduction
measures finance a climate strategy
based on renewable energy. partner-
ships enable our customers to react
proactively to the business-critical cli-
mate challenges facing them while at
the same time establishing a responsi-
ble climate profile benefiting the com-
pany’s reputation and surroundings.
We entered into our first climate part-
nership in 2007, with novo nordisk,
and by the end of 2008 we had entered
into a total of 13 partnerships. in June
2008, we entered into our largest part-
nership to date, with novozymes. the
aim is to make novozymes in Denmark
co2 neutral in terms of power as early
as 2012. as an element of the partner-
ship, novozymes will significantly re-
duce its energy consumption and con-
tinuously convert the savings into
power purchases from the coming, new
offshore wind farm horns rev 2.
in august, Dong Energy entered into
a partnership with the Municipality of
fredericia. as one of the exciting ele-
ments of the partnership, the possibili-
ties of introducing natural and biogas
as fuel in, for example, city buses are
being explored. the aim is to reduce
emissions of environmentally harmful
particles and nitrogen.
in December, we entered into a cli-
mate partnership with the tivoli gar-
dens in copenhagen under which all
energy must emanate from wind power
from as early as 2010. the partnership
acts as a stimulus to an increased sup-
ply of wind power to the market, as ti-
voli will have its own turbine at
avedøre power station.
a partnership was also entered into
with kMD in 2008. the aim of this part-
nership is to reduce direct energy con-
sumption by at least 10% by the end of
2010. the municipalities of albertslund,
ballerup and kalundborg and the hous-
ing association Dab also entered into
climate partnerships with us in 2008.
partnErships– because the climate is the greatest challenge of our time
Source: Dong Energy Annual Report, 2008.

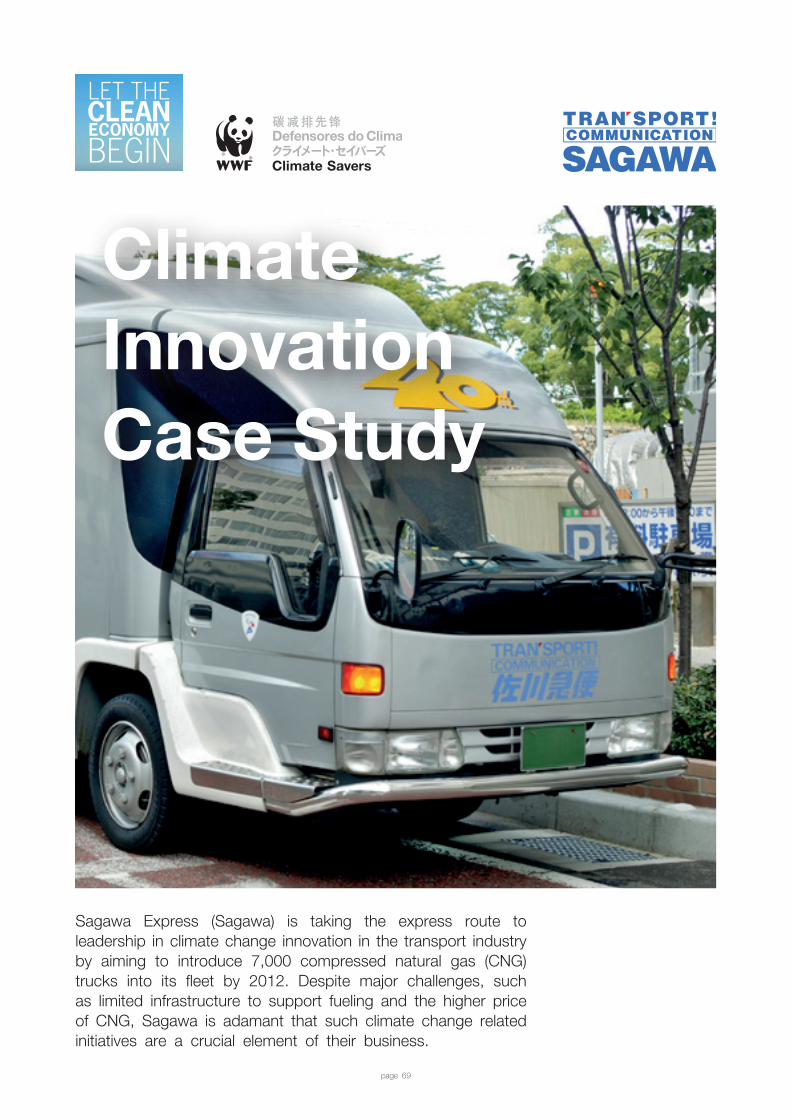
Sagawa Express (Sagawa) is taking the express route to leadership in climate change innovation in the transport industry by aiming to introduce 7,000 compressed natural gas (CNG) trucks into its fleet by 2012. Despite major challenges, such as limited infrastructure to support fueling and the higher price of CNG, Sagawa is adamant that such climate change related initiatives are a crucial element of their business.
Climate InnovationCase Study
page 69

Background
Founded in 1957, Sagawa is a major logistics service company based in Japan with operations throughout East Asia. It specializes in door-to-door delivery and other services connected with delivery and distribution. It is the second largest transport and logistics company in Japan, with over JPY 11 billion in capital and annual sales of JPY 800 billion. In Japan, Sagawa’s 36,000 staff operate 25,000 vehicles across 343 offices.
Sagawa had previously initiated programs and campaigns to encourage and reinforce environmentally sustainable driving, installed eco cargo compartments and improved the distribution and service center processes. In May 2003, it continued its environmental leadership by joining the WWF Climate Savers program.
WWF Climate Savers was founded in 1998 by WWF as a platform to enable companies to join forces in committing to more ambitious reductions in its greenhouse gas emissions and to transforming their industries’ more customary incremental and/or passive approaches toward climate change action.
Sagawa’s Climate Change Strategy
Back in 2004, Sagawa introduced its management slogan, “First choice for everyone.” The goal was to build corporate value and sustainable business development for the long-term. In achieving this, the company had three objectives: (1) determining the scope of the business; (2) establishing firm foundations for business operations; and (3) meeting corporate responsibility.
The third objective, meeting corporate responsibility, was mainly focused on environmental management. Its first recognition as an environmental leader was in June 1998, when it was awarded the “Environmental Agency Director’s Award for Efforts to Prevent Global Warming” by the Eco Project Promotion Committee.1 This was for a company campaign that trained drivers in eco-friendly driving practices, such as resisting the tendency to leave vehicles idling, avoiding sudden braking, decelerating slowly and accelerating patiently. This had already saved 10 million liters of fuel per year and JPY 1 billion in reduced fuel costs.
It then won another award2 before becoming the first company from the transport sector to join Climate Savers in May 2003. It set a goal to reduce overall 2002 levels of CO2 emissions arising from business activities by 6% by 2012. Instead of targets based on eco-efficiency or energy units, Sagawa aimed for net reductions.3 The company’s sustainability report in 2006 stated:
In order to prevent the air pollution attributed to exhaust gases – and global warming – we seek to promote greater transport efficiencies, the adoption of low-
IMD Research Associate Darren Willman prepared this case under the supervision of Dr. Aileen Ionescu-Somers and Professor Corey Billington, Deputy Director and Director respectively of the Forum for Corporate Sustainability Management at IMD.
This case was commissioned by the WWF Climate Savers Program.
It was developed with inputs from the staff of both Sagawa Express and WWF. The contribution of all parties is gratefully acknowledged.
page 70
Sagawa Express delivers on climate change innovations for the transport industry.
Copyright © 2009 by WWF Climate Savers and IMD - International Institute for Management.
1 SG Holdings. “Group history” SG Holdings. <ht tp : / /www.sg-h ldgs.co. jp/eng l i sh/company/enkaku.html>. (accessed 25 November 2009).
2 December 2002, “Minister’s Award for Global Warming Prevention Activity” from the Ministry of Environment.
3 Setting up net, or absolute, reduction targets is required by WWF for a company to join its Climate Savers program.
emission vehicles and the practice of eco-safe driving. And we seek continuous improvement in our efforts to conserve the environment.4
Efficiency in existing processes has led to CO2 reductions. By streamlining processes in the company’s Hub Centers, it has been able to achieve greater loading ratios on its trucks. Hub Centers gather freight and parcels, and sort them by destination – an improvement on a previously unstructured process. This has been supported by utilizing its distribution centers and simplifying its workflow. Distribution centers manage the full distribution process all under the one roof, from acceptance to picking, packaging and shipping. Before, each process had been managed by a different center, with trucks transporting the products from one place to the next. Both have led to the elimination of unnecessary transport, with fewer trucks leaving the centers loaded with more to deliver.
The approach Sagawa has taken also involves diversifying away from trucks and vehicles. Sagawa began working towards a modal shift (from road to rail transport) in 2004. One “Super Rail Cargo” trip carries the equivalent of 56 ten-ton trucks, a return trip saving of 14,000 CO2 tons. Sagawa is increasingly incorporating bicycle and trolley delivery, by establishing non-vehicle service centers to manage deliveries in congested urban areas. As of March 2009, there were 221 non-vehicle service centers.
Sagawa also sought opportunities to make its trucks and vehicles more efficient. Since these modes of transport were fundamental to the business, Sagawa had to ensure that it operated high performance vehicles. It was important to balance productivity with environmental management to ensure overall sustainability.
Small delivery vehicles were also fitted with “Eco Compartments,” a durable, safe and recyclable cargo compartment. A cargo compartment is the back of the delivery vehicle, which holds the deliveries and goods. These were to be fitted on all future delivery vehicles.
With all the established campaigns, events and processes to reduce the CO2 emissions of the company, it was a challenge for WWF Japan to take Sagawa to a new height in environmental leadership through the partnership. After much deliberation, it became clear that it was time to push efficiency within the core business and through the company’s vehicles.
Reducing CO2 in Trucks and Vehicles
Prior to joining WWF Climate Savers, Sagawa had flirted with the idea of transitioning to CNG trucks. In the early 1990s it had begun to study lower polluting vehicles and their efficiency. Efficiency was defined in terms of CO2, nitrogen oxide (NOx) and particulate matter (PM). It trialed hybrids, methanol vehicles and CNG, concluding that CNG was the best (refer to Exhibit 2, for comparisons of fueled trucks).
Sagawa’s target of reducing 2002 emissions by 6%, combined with WWF Climate Savers’s encouragement, drove it to give a green light to the fleet transition program. The logic was clear; Sagawa’s target translates into 344,600 tons, but if Sagawa was to continue using only diesel trucks, CO2 was estimated to actually rise to 393,500 tons (refer to Exhibit 1, for data on reduction action and targets). The program was to introduce 7,000 CNG fueled trucks to the fleet that would help achieve its emission target by 2012.
page 71
4 SG Holdings Group, Sustainability Report 2006.
Almost immediately after they began introducing the CNG trucks, the company faced setbacks due to infrastructure constraints. Mr Kinya Hiyama, manager of environmental preservation promotion section of the general affairs department, explained:
In Japan, there are very limited numbers of CNG filling stations. Japan’s lack of fuel-supply infrastructure is posing an impediment to our introduction plan. Actually, we still suffer from it.
As CNG filling stations were rare in Japan, Sagawa had to take on the initiative of building them themselves. It established its first station in Tokyo in 1999 before it was truly serious about the fleet transition program, and since then it has expanded to 23 stations nationwide (as of August 2009).
The other major obstacle it faced was the greater expense of a CNG truck compared to a diesel truck. Sagawa’s collective and inclusive decision-making processes allowed it to find the right solutions. Hiyama clarified:
Sagawa usually takes an approach where every party exhaustively clarifies the potential problems and issues to offset potential risks brought by the new initiatives. By repeating both a top down approach from the management and a bottom up approach from each department, we can eventually take the best measures for change.
Sagawa received some financial support from public sources, but the company’s view is that the internal determination to pursue this strategy was the most decisive factor in successfully reaching its established goals. Consequently, Sagawa will continue to build fuel stations and add CNG vehicles if subsidies are abolished. Hiyama explained:
In some cases, cost problems can be resolved through the provision of public support such as subsidies. However, we firmly believe that whenever we take measures, we have a strong corporate will to pursue those measures even in the face of adversity such as abolishment of subsidies.
As business performance can often fluctuate depending on social criteria these days, Sagawa considers it highly important to collect key information about environmental policies. We need to survive the rough seas by being proactive depending on the situation.
As of August 2009, Sagawa had 4,306 CNG trucks in its fleet. This represents more than 25% of the total number of CNG-run trucks in the whole of Japan (refer to Exhibit 3, for the background and plan for CNG truck introduction at Sagawa).
More Changes Are InspiredParticipation in the Climate Savers program encouraged Sagawa to initiate a pioneering activity.5
In February 2008, Sagawa launched the “Hikyaku Express with CO2 emission credits” parcel delivery service. Offsets would go under the Kyoto mechanism (refer to Exhibit 4). Sagawa charges a premium to customers who wish to use the service, with Sagawa adding an extra incentive by matching the payment, essentially doubling the offset credit. In September 2008 Sagawa began managing the offsets for other transport services and entered into a partnership with the mail order business Senshukai.
page 72
5 Interview, comment made by interviewer from WWF Japan.
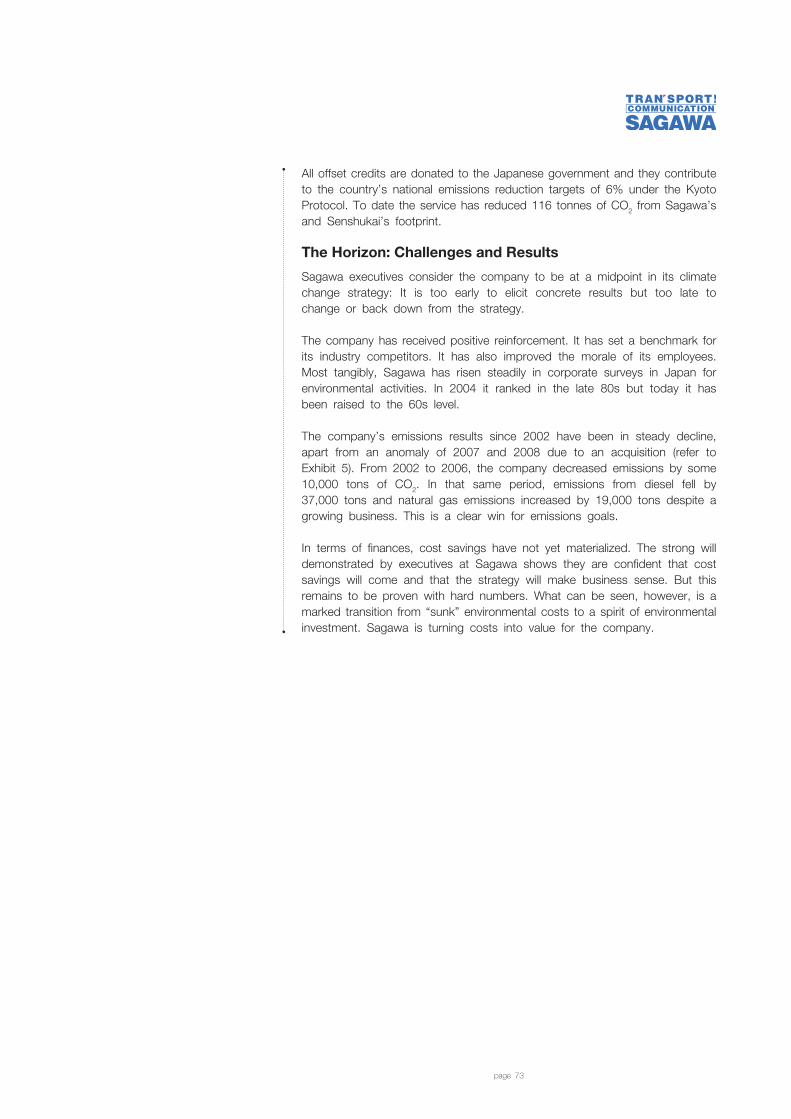
All offset credits are donated to the Japanese government and they contribute to the country’s national emissions reduction targets of 6% under the Kyoto Protocol. To date the service has reduced 116 tonnes of CO2 from Sagawa’s and Senshukai’s footprint.
The Horizon: Challenges and Results
Sagawa executives consider the company to be at a midpoint in its climate change strategy: It is too early to elicit concrete results but too late to change or back down from the strategy.
The company has received positive reinforcement. It has set a benchmark for its industry competitors. It has also improved the morale of its employees. Most tangibly, Sagawa has risen steadily in corporate surveys in Japan for environmental activities. In 2004 it ranked in the late 80s but today it has been raised to the 60s level.
The company’s emissions results since 2002 have been in steady decline, apart from an anomaly of 2007 and 2008 due to an acquisition (refer to Exhibit 5). From 2002 to 2006, the company decreased emissions by some 10,000 tons of CO2. In that same period, emissions from diesel fell by 37,000 tons and natural gas emissions increased by 19,000 tons despite a growing business. This is a clear win for emissions goals.
In terms of finances, cost savings have not yet materialized. The strong will demonstrated by executives at Sagawa shows they are confident that cost savings will come and that the strategy will make business sense. But this remains to be proven with hard numbers. What can be seen, however, is a marked transition from “sunk” environmental costs to a spirit of environmental investment. Sagawa is turning costs into value for the company.
page 73

Exhibit 1Reduction Action and Target
page 74
Source: SG Holdings Sustainability Report 2008
Exhibit 2Comparison of Fueled Trucks
Source: SG Holdings Sustainability Report 2008
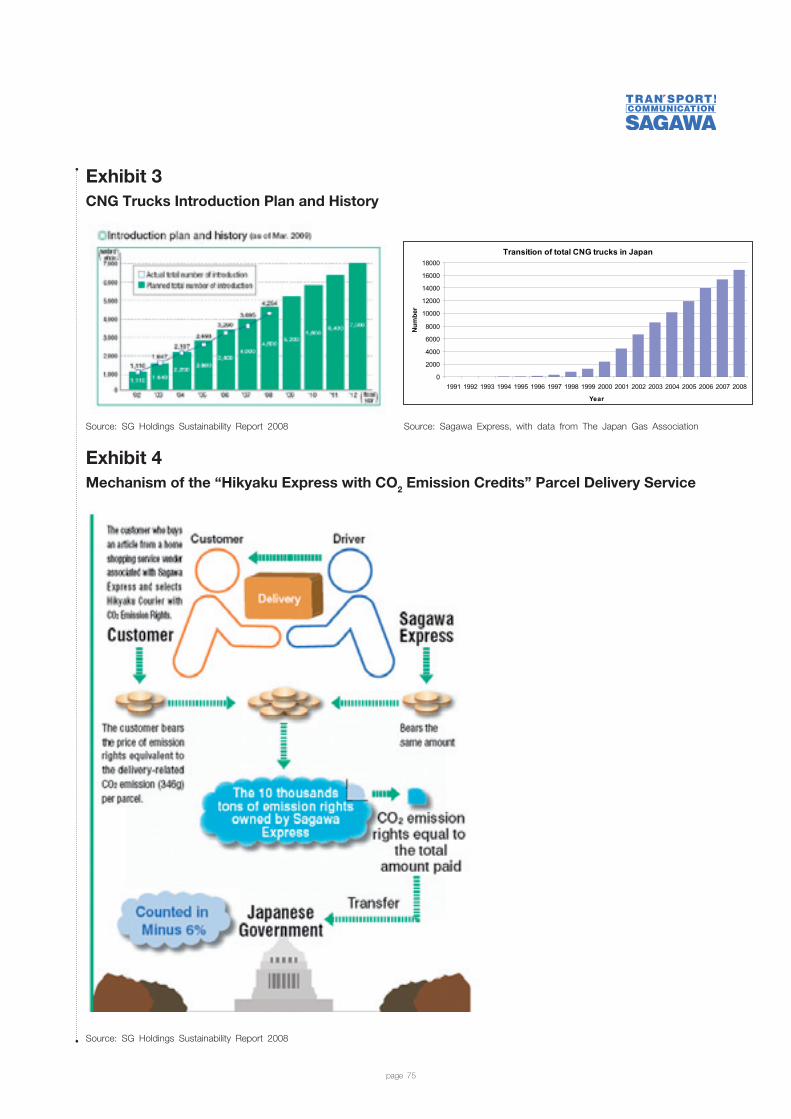
Exhibit 3CNG Trucks Introduction Plan and History
page 75
Exhibit 4Mechanism of the “Hikyaku Express with CO2 Emission Credits” Parcel Delivery Service
Source: SG Holdings Sustainability Report 2008
Transition of total CNG trucks in Japan
0
2000
4000
6000
8000
10000
12000
14000
16000
18000
1991 1992 1993 1994 1995 1996 1997 1998 1999 2000 2001 2002 2003 2004 2005 2006 2007 2008
Year
Num
ber
Source: SG Holdings Sustainability Report 2008 Source: Sagawa Express, with data from The Japan Gas Association
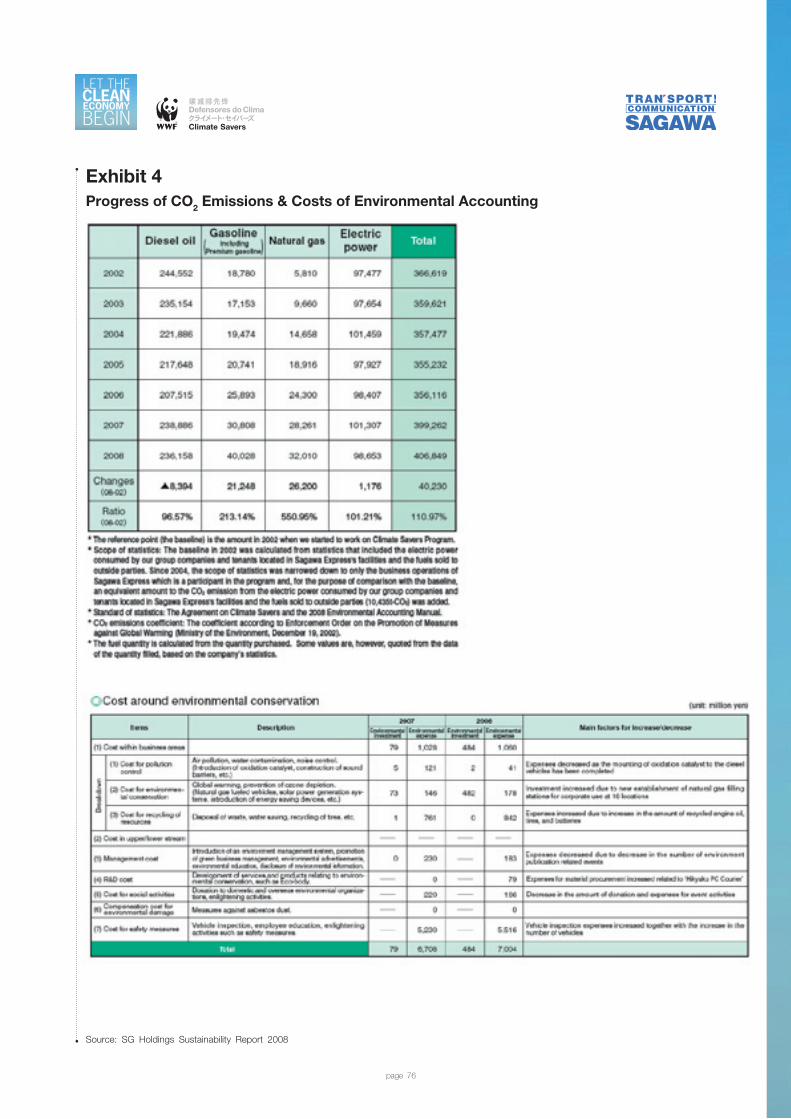
Exhibit 4Progress of CO2 Emissions & Costs of Environmental Accounting
page 76
Source: SG Holdings Sustainability Report 2008

To reduce CO2 emitted in the use of its products, Sony has started to focus on improving the energy efficiency of televisions. By combining sophisticated technological improvements with simple features that make it easy for customers to save energy, Sony achieved a sustained reduction in the carbon footprint of its televisions.
Climate InnovationCase Study
page 77

TOKYO, JAPAN, January 2009. Hidemi Tomita, general manager of the corporate social responsibility department at Sony Corporation, reviewed a press release related to the energy efficiency of the BRAVIA VE5 series. The company was about to launch the new model of television at the Consumer Electronics Show, the largest consumer electronics trade show in the United States. Innovative features that allowed the BRAVIA VE5 to reduce CO2 emissions by more than 40% when compared to conventional LCD televisions were receiving increased attention from the specialized media.
Background
Founded in 1946 in Tokyo, Sony Corporation employs over 171,000 staff worldwide. In 2008 the company had sales of 7,730 billion yen (€58 billion) and was ranked number 75 in the Global Fortune 500. A leading provider of networked consumer electronics and entertainment, Sony’s main products are audio and video systems, television, information and communications equipment, semiconductors and electronic components.
Sony began to set itself environmental targets in 1993. In 2006 as part of its regular review of corporate environmental targets, the company consulted with several environmental NGOs. This initial dialogue contributed positively to the company’s review process and led to a commitment to strengthen engagement with stakeholders.
In July 2006, Sony joined WWF’s Climate Savers. Climate Savers was founded in 1998 by WWF as a platform to enable companies to join forces in committing to more ambitious reductions in their greenhouse gas emissions and to transform the industry’s more customary incremental and/or passive approach toward climate change action.
Sony Signs on to CO2 Emissions Reduction
Sony engaged in a more in-depth dialogue with WWF to set ambitious targets and design a comprehensive strategy to achieve them. Tomita explained the reasons for signing on with Climate Savers:
To join the Climate Savers initiative, a company has to commit to ambitious CO2 reduction targets in absolute terms. We get added value from having an ambitious target, set up jointly with a respected NGO and audited by a third party.
As a Climate Saver company, the corporate commitment of Sony is to cut absolute CO2 emissions at its production sites, covering manufacturing facilities and offices, by 7% by fiscal 2010 (in absolute terms compared with fiscal 2000 emissions). The company is also committed to decreasing the energy consumption of its major products by setting specific targets for each one.
Sony’s approach to emission reduction at sites is mainly focused on:
IMD Research Associate Dr. Tania Braga prepared this case under the supervision of Dr. Aileen Ionescu-Somers and Professor Corey Billington, Deputy Director and Director respectively of the Forum for Corporate Sustainability Management at IMD.
This case was commissioned by the WWF Climate Savers Program.
It was developed with inputs from the staff of both Sony and WWF. The contribution of all parties is gratefully acknowledged.
page 78
Lowering CO2 emmissions from products: Sony’s eco-innovation for televisions.
Copyright © 2009 by WWF Climate Savers and IMD - International Institute for Management.
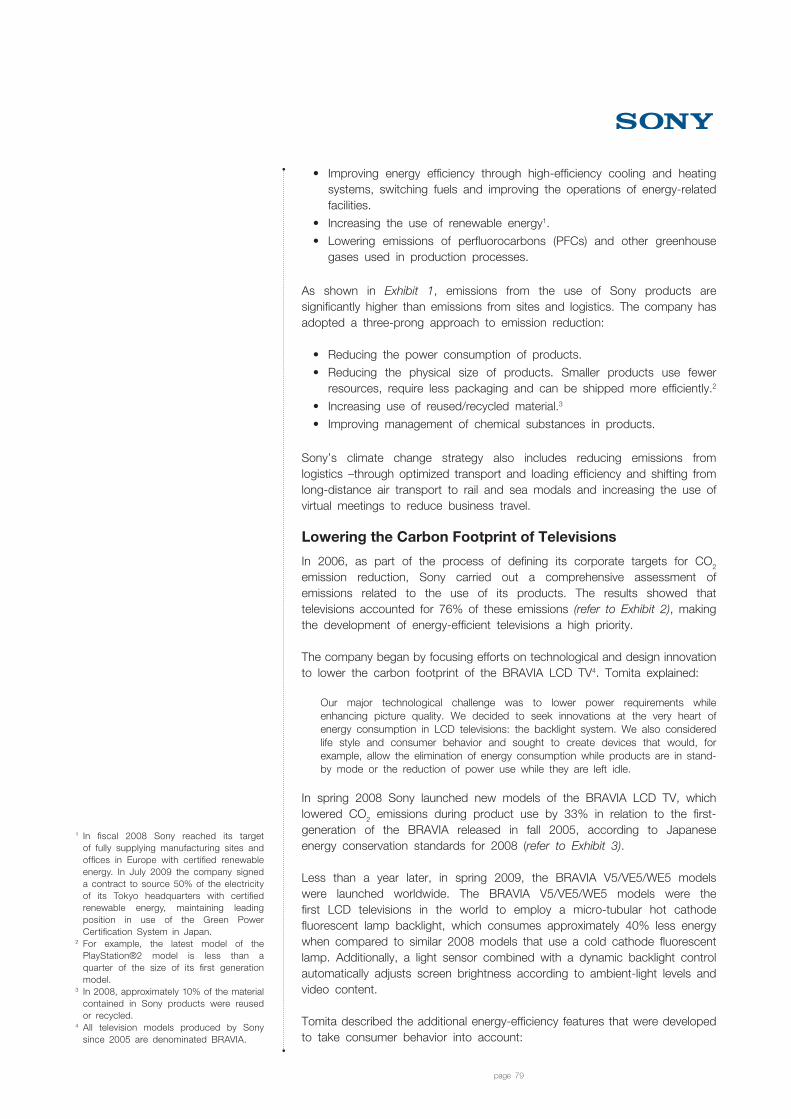
• Improving energy efficiency through high-efficiency cooling and heating systems, switching fuels and improving the operations of energy-related facilities.
• Increasing the use of renewable energy1.
• Lowering emissions of perfluorocarbons (PFCs) and other greenhouse gases used in production processes.
As shown in Exhibit 1, emissions from the use of Sony products are significantly higher than emissions from sites and logistics. The company has adopted a three-prong approach to emission reduction:
• Reducing the power consumption of products.
• Reducing the physical size of products. Smaller products use fewer resources, require less packaging and can be shipped more efficiently.2
• Increasing use of reused/recycled material.3
• Improving management of chemical substances in products.
Sony’s climate change strategy also includes reducing emissions from logistics –through optimized transport and loading efficiency and shifting from long-distance air transport to rail and sea modals and increasing the use of virtual meetings to reduce business travel.
Lowering the Carbon Footprint of Televisions
In 2006, as part of the process of defining its corporate targets for CO2
emission reduction, Sony carried out a comprehensive assessment of emissions related to the use of its products. The results showed that televisions accounted for 76% of these emissions (refer to Exhibit 2), making the development of energy-efficient televisions a high priority.
The company began by focusing efforts on technological and design innovation to lower the carbon footprint of the BRAVIA LCD TV4. Tomita explained:
Our major technological challenge was to lower power requirements while enhancing picture quality. We decided to seek innovations at the very heart of energy consumption in LCD televisions: the backlight system. We also considered life style and consumer behavior and sought to create devices that would, for example, allow the elimination of energy consumption while products are in stand-by mode or the reduction of power use while they are left idle.
In spring 2008 Sony launched new models of the BRAVIA LCD TV, which lowered CO2 emissions during product use by 33% in relation to the first-generation of the BRAVIA released in fall 2005, according to Japanese energy conservation standards for 2008 (refer to Exhibit 3).
Less than a year later, in spring 2009, the BRAVIA V5/VE5/WE5 models were launched worldwide. The BRAVIA V5/VE5/WE5 models were the first LCD televisions in the world to employ a micro-tubular hot cathode fluorescent lamp backlight, which consumes approximately 40% less energy when compared to similar 2008 models that use a cold cathode fluorescent lamp. Additionally, a light sensor combined with a dynamic backlight control automatically adjusts screen brightness according to ambient-light levels and video content.
Tomita described the additional energy-efficiency features that were developed to take consumer behavior into account:
page 79
1 In fiscal 2008 Sony reached its target of fully supplying manufacturing sites and offices in Europe with certified renewable energy. In July 2009 the company signed a contract to source 50% of the electricity of its Tokyo headquarters with certified renewable energy, maintaining leading position in use of the Green Power Certification System in Japan.
2 For example, the latest model of the PlayStation®2 model is less than a quarter of the size of its first generation model.
3 In 2008, approximately 10% of the material contained in Sony products were reused or recycled.
4 All television models produced by Sony since 2005 are denominated BRAVIA.
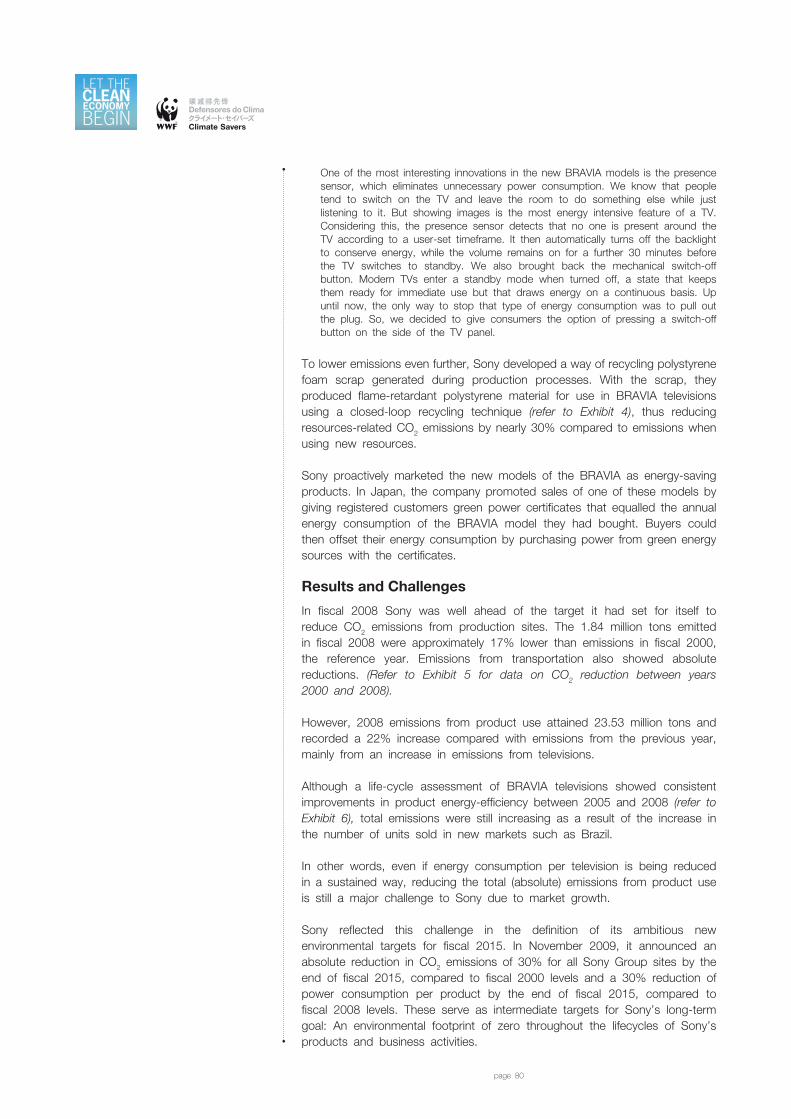
One of the most interesting innovations in the new BRAVIA models is the presence sensor, which eliminates unnecessary power consumption. We know that people tend to switch on the TV and leave the room to do something else while just listening to it. But showing images is the most energy intensive feature of a TV. Considering this, the presence sensor detects that no one is present around the TV according to a user-set timeframe. It then automatically turns off the backlight to conserve energy, while the volume remains on for a further 30 minutes before the TV switches to standby. We also brought back the mechanical switch-off button. Modern TVs enter a standby mode when turned off, a state that keeps them ready for immediate use but that draws energy on a continuous basis. Up until now, the only way to stop that type of energy consumption was to pull out the plug. So, we decided to give consumers the option of pressing a switch-off button on the side of the TV panel.
To lower emissions even further, Sony developed a way of recycling polystyrene foam scrap generated during production processes. With the scrap, they produced flame-retardant polystyrene material for use in BRAVIA televisions using a closed-loop recycling technique (refer to Exhibit 4), thus reducing resources-related CO2 emissions by nearly 30% compared to emissions when using new resources.
Sony proactively marketed the new models of the BRAVIA as energy-saving products. In Japan, the company promoted sales of one of these models by giving registered customers green power certificates that equalled the annual energy consumption of the BRAVIA model they had bought. Buyers could then offset their energy consumption by purchasing power from green energy sources with the certificates.
Results and Challenges
In fiscal 2008 Sony was well ahead of the target it had set for itself to reduce CO2 emissions from production sites. The 1.84 million tons emitted in fiscal 2008 were approximately 17% lower than emissions in fiscal 2000, the reference year. Emissions from transportation also showed absolute reductions. (Refer to Exhibit 5 for data on CO2 reduction between years 2000 and 2008).
However, 2008 emissions from product use attained 23.53 million tons and recorded a 22% increase compared with emissions from the previous year, mainly from an increase in emissions from televisions.
Although a life-cycle assessment of BRAVIA televisions showed consistent improvements in product energy-efficiency between 2005 and 2008 (refer to Exhibit 6), total emissions were still increasing as a result of the increase in the number of units sold in new markets such as Brazil.
In other words, even if energy consumption per television is being reduced in a sustained way, reducing the total (absolute) emissions from product use is still a major challenge to Sony due to market growth.
Sony reflected this challenge in the definition of its ambitious new environmental targets for fiscal 2015. In November 2009, it announced an absolute reduction in CO2 emissions of 30% for all Sony Group sites by the end of fiscal 2015, compared to fiscal 2000 levels and a 30% reduction of power consumption per product by the end of fiscal 2015, compared to fiscal 2008 levels. These serve as intermediate targets for Sony’s long-term goal: An environmental footprint of zero throughout the lifecycles of Sony’s products and business activities.
page 80
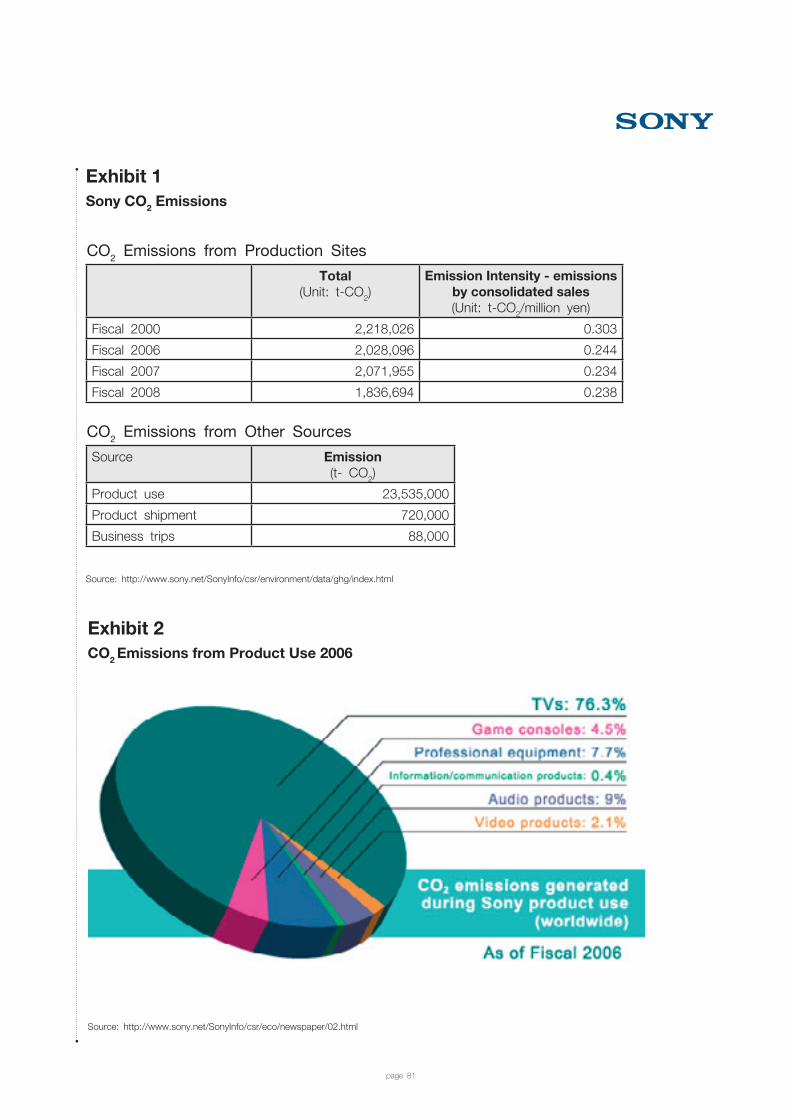
Exhibit 1Sony CO2 Emissions
page 81
Source: http://www.sony.net/SonyInfo/csr/environment/data/ghg/index.html
Total (Unit: t-CO2)
Emission Intensity - emissions by consolidated sales (Unit: t-CO2/million yen)
Fiscal 2000 2,218,026 0.303
Fiscal 2006 2,028,096 0.244
Fiscal 2007 2,071,955 0.234
Fiscal 2008 1,836,694 0.238
CO2 Emissions from Production Sites
Source Emission (t- CO2)
Product use 23,535,000
Product shipment 720,000
Business trips 88,000
CO2 Emissions from Other Sources
Exhibit 2CO2 Emissions from Product Use 2006
Source: http://www.sony.net/SonyInfo/csr/eco/newspaper/02.html

Exhibit 3Sony’s BRAVIA Televisions: CO2 Emissions and Energy-efficiency.
Spring 2008 Models.
page 82
Source: http://www.sony.net/SonyInfo/csr/eco/newspaper/02.html

Exhibit 4Closed-loop Recycling – BRAVIA Televisions
page 83
Source: http://www.sony.net/SonyInfo/csr/eco/newspaper/02.html
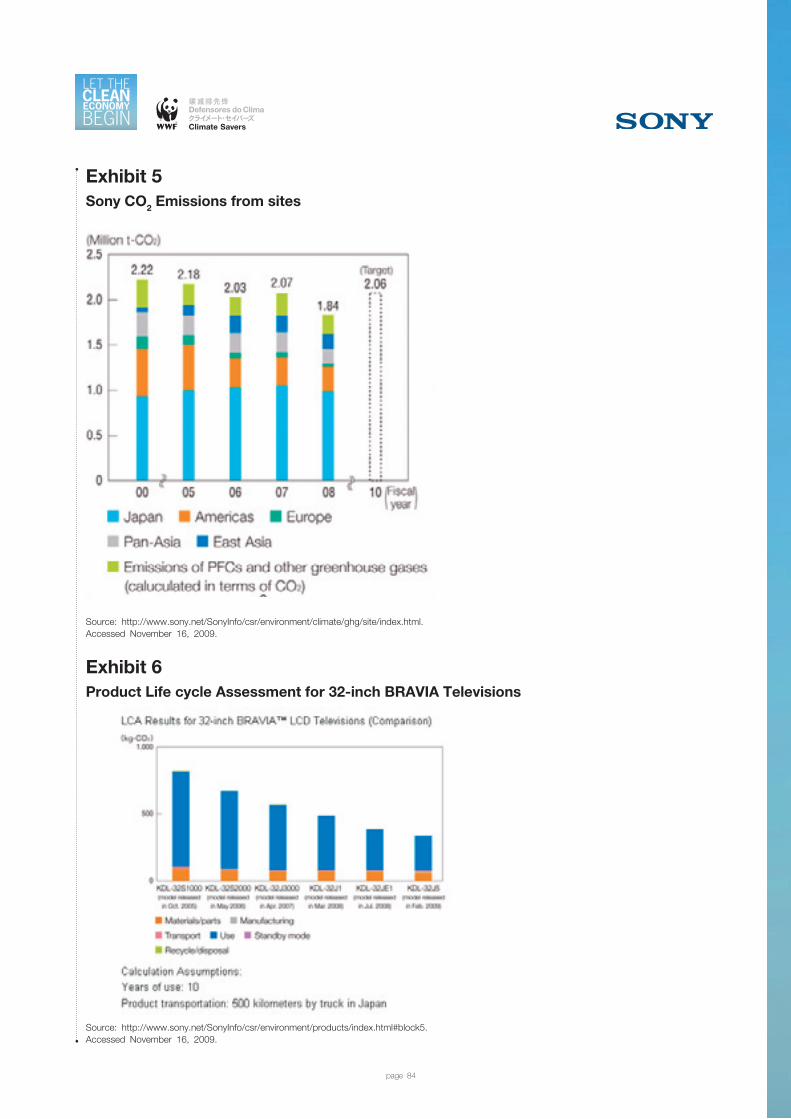
Exhibit 5Sony CO2 Emissions from sites
page 84
Source: http://www.sony.net/SonyInfo/csr/environment/climate/ghg/site/index.html. Accessed November 16, 2009.
Exhibit 6Product Life cycle Assessment for 32-inch BRAVIA Televisions
Source: http://www.sony.net/SonyInfo/csr/environment/products/index.html#block5. Accessed November 16, 2009.
Tetra Pak efforts to align market companies, manufacturing sites and suppliers with its climate goals had required significant organizational change. By empowering shop floor teams to initiate and explore new approaches on energy efficiency along the supply chain, the company had created a structure that allows organic innovation to take place.
Climate InnovationCase Study
page 85
Lund, Sweden: July 10, 2009. Mario Abreu, Global Environment Director for Supply Chain Support at Tetra Pak International, a company involved in WWF’s Climate Savers partnership, was taking advantage of the bright sunny morning to cycle to the office. He pondered about Tetra Pak’s next steps on its Climate Savers journey. He was scheduled to start the day with a meeting to open internal discussions on Tetra Pak climate strategy beyond 2010. He recalled that in 2006, when his predecessor first negotiated climate targets with WWF, he had felt that the company was committing a stretched target, which would be difficult to reach while growing the business. But as of 2008, Tetra Pak has achieved great progress towards reaching the target.
A comfortable level of internal buy-in had been achieved and the joint efforts with market companies and manufacturing sites were providing tangible benefits. Abreu asked himself how far they could go in setting new targets. What would it take to line up factory managers and business units for even higher goals? How fast could they move in lining up suppliers for increased efforts? Tetra Pak had thrived under challenge and achieving a comfort zone could potentially slow down innovation efforts. Abreu hoped that a new challenge was on the way. Background
Tetra Pak is a global company that was founded in 1951 in Lund, Sweden. Part of the Tetra Laval group, it is the world leader for the supply of processing and packaging solutions for milk, juices, soups and other liquids. As of January 2009, Tetra Pak employed over 21 thousand staff, had net sales of 8.825 million Euros and was present in more than 150 countries, where the company distributed 142 billion packages.
Tetra Pak started working with WWF when it became a part of the Global Forest and Trade Network (GFTN), so as to be able to guarantee that the wood fiber used by the company came from responsibly managed forests.
Climate Savers was founded in 1999 by WWF as a platform to enable companies to join forces in committing to more ambitious reductions in their greenhouse gas emissions. At that time Climate Savers was the first partnership program of its kind. The main objective of this innovative venture between a credible global non- governmental organization and leading companies was to transform the more customary incremental and/or passive approach of industry towards climate change action. More “giant steps” were essential and a cleaner economy needed to be achieved more quickly.
Tetra Pak joined Climate Savers in late 2005, thereby taking on a commitment to reduce its absolute CO2 emissions to 10% below 2005 levels by 2010. The target was approved by the company’s Strategy Council, on which the majority of Global Leadership Team (top management) sat, thus validating and endorsing efforts required within the company to achieve this ambition. Tetra Pak’s approach to emission reduction focused on increased energy efficiency at production sites and favouring renewable materials and energy
Research Associate Dr. Tania Braga prepared this case under the supervision of Dr. Aileen Ionescu-Somers and Professor Corey Billington, Deputy Director and Director respectively of the Forum for Corporate Sustainability Management at IMD business school as a basis for learning rather than to illustrate either effective or ineffective handling of a business situation.
This case was commissioned by the WWF Climate Savers Program.
It was developed with inputs from the staffs of Tetra Pak and WWF. The contribution of all parties is gratefully acknowledged.
Breaking down alignment barriers: Tetra Pak pulls together allies to reach climate goals.
page 86
copyright © 2009 by WWF Climate Savers and IMD - International Institute for Management.

(refer to Exhibit 1 for facts & figures on Tetra Pak CO2 emissions). An active engagement with transportation suppliers combined with an internal travel policy aligned with emissions reduction complemented the range of measures put in place by the company.
Ensuring internal alignment
Before ever taking the step to join the Climate Savers in 2005, Tetra Pak already had an internal target for energy efficiency, but the connection with the climate issue was not yet well established and the alignment with business objectives was not yet clearly defined.
When the company joined Climate Savers, they drew up a general plan to combine energy efficiency with purchasing of green energy. The aim was to maintain absolute consumption of energy stable while growing the business and reducing emissions through green energy purchase. Tetra Pak planned to do it in a cost neutral way by using savings from energy efficiency – by using less energy per unit of product – to cover the premium price of green energy. Climate Savers gave the company an external target audited by a third party. Abreu commented on the key role played by the external target.
It sent a very strong message internally. Partnering with WWF gave high visibility to the target and increased buy-in from all levels of management. It focused our efforts on finding solutions. An internal target would have been subject to criticism and endless discussion.
As of 2006, key organizational changes were put in place to ensure internal alignment, amongst them measures refocusing the environmental master pillar on energy efficiency. There were also significant changes made to the internal reward/evaluation systems. Previously, each production plant had an energy cost KPI1 as part of the converting factory2 individual objectives that was incorporated in their bonus system since it was a criteria for factory performance evaluation. Tetra Pak switched the energy KPI to one based on energy efficiency, which meant that factory managers started to have this incorporated to their bonus system also. Then it was scaled up. The aggregate energy efficiency KPI of all converting plants under the responsibility of any given factory manager became part of the bonus evaluation. As for the Global Environmental Vice- President, the absolute CO2 reduction has been incorporated to his bonus evaluation.
Refocusing the environmental master pillar
Since 2004, converting factories at Tetra Pak started putting in place a cross-functional task force of employees responsible for implementing solutions for environment-related manufacturing problems; these were called environmental pillars3. Victoria Olsson, Supply Chain Specialist and Environment Master Pillar Leader, commented on how this approach fundamentally differed to traditional approaches:
In the traditional business hierarchy you have, in the best case, one person responsible for environmental issues in each factory. This person can very easily become isolated even though their work requires liaising with others in the organization. The “pillar approach” enabled us to set up cross-functional groups made up of maintenance staff, engineers, electricians and any other relevant parties. In this way, we get people from different parts of the factory working together to implement solutions. Key messages are transmitted much more effectively by “champions” from the groups and the work involved is
page 87
1 KPI is the acronym for Key Performance Indicator. They are measures commonly used track an organization performance towards long-term goals.
2 Tetra Pak production plants are deno-minated Converting Factories.
3 Tetra Pak is working with World Class Manufacturing (WCM), which is a set of concepts, principles, policies and techniques for managing and operating a manufacturing company. It primarily focuses on continual improvement in quality, cost, lead time, flexibility and customer service. The WCM work within Tetra Pak is built up by a number of “pillars” (teams); for example in the areas of maintenance, cost, focused improvement, quality, safety and environment.

more effectively disseminated within the factory. Since information on targets and progress is shared visually on boards at the factory shop, staff are made aware of developments and are invited to contribute.
Each local environmental pillar communicates with the master pillar at the corporate level, composed of a core group and a few ambassadors (acting as bridges to regional groups of local pillars).
In 2007 Tetra Pak’s environment master environmental pillar objective was refocused on energy efficiency. Dealing with energy efficiency issues inside the environmental pillar was in itself not innovative. What was new was to place it at the very heart of the pillar’s mission. Previously, the environment master pillar focused on diverse environmental issues. The rationale was to better leverage efforts through a highly focused approach on energy efficiency. Abreu commented:
We changed mindsets; the focus in our converting factories switched to prioritizing investments in energy efficiency. We brought people together and gave them a mandate to find solutions, innovate on processes and, with the help of the master pillar, share best practices with other factories in a structured way.
The environmental master pillar called the attention to the robustness of the business case for energy efficiency. A strong message was sent around the company that timely action on energy efficiency was the best way to avoid future costs related to higher energy prices and carbon taxation. Knowing that traditional pay-back time evaluation does not incorporate the full value of future operating cost savings and performance enhancements, Tetra Pak gave flexibility to the evaluation of the pay-back time for energy efficiency projects.
The role of the refocused master pillar was to identify opportunities and share energy efficiency best practices in a structured way. Whenever a local environmental pillar developed a solution that could be shared the master pillar immediately developed an implementation toolset, which first described the problem and its causes and then the solution and newly adopted practice. The toolset explained the solution in detail from the perspective of the factory manager, showing results and giving accurate figures on cost and pay-back time. Part of the master pillar mandate was to collect data on energy efficiency from all converting factories and identify areas where increased efforts were required. It also developed new projects and drove the implementation of large initiatives worldwide.
In 2008 the number of ambassadors within the environmental master pillar was expanded (refer to Exhibit 2 for an overview of its participants as of August 2009) so as to strengthen its capacity to liaise with converting factories in different countries and regions. Jaap Couvee, Quality & Environmental Coordinator at Tetra Pak Moerdijk (Netherlands), who joined the master pillar in June 2009, commented on his own motivation
In 2006, when we first started working towards having our factory powered with 100% renewable energy, master pillar support was crucial to our success. It helped us build a strong business case for the factory manager and to break down skepticism amongst the staff. Essentially, the big “bang for buck” in the area of climate change will be through fundamental changes at shop floor level. I recently joined the environment master pillar mainly to provide support from the factory side. My motivation was to give the team first hand feedback on the application of solutions proposed. I also bring a very hands-on approach to the table and try to make solutions as simple and practical as possible.
page 88

Partnering with suppliers
Partnering with suppliers was one of the other preferred approaches adopted by Tetra Pak to reduce CO2 emissions. Since 2006 the company has been working with suppliers in four different spheres: measuring suppliers’ carbon foot print and seeking for improvements, purchasing renewable energy from electricity suppliers; driving improved energy efficiency at manufacturing sites; optimizing logistics and reducing transportation emissions.
Partnering to ensure responsible renewable energy purchase
Ensuring responsible purchase of green energy had been a major challenge from the outset. Both Tetra Pak and WWF saw that it would be essential to hardwire the climate change strategy such that traps of careless offset projects4 could absolutely be avoided. The WWF Climate Savers program assisted Tetra Pak in setting up clear directives to avoid those traps5. Although directives are clear, Tetra Pak have been facing a recurrent challenge to buy energy at the required quality and scale at the different regions the company operates.
Buying renewable energy can be a particularly complex task in developing countries. Because of the lack of transparency from the outset, companies cannot be sure how the additional resources paid for green energy are actually being used. In order to overcome this barrier and ensure transparency, Tetra Pak took the approach of directly negotiating with energy companies on an individual basis.
In the case of a new plant built in Hohhot, China, the provision of renewable energy was one of the main points of negotiation with local governments when choosing the location of the converting factory. Tetra Pak has worked on the issue with the government of Inner Mongolia and agreed on a Memorandum of Understanding specifically stating that the premium price paid for energy would allow new wind power energy to be brought to the grid.
Decker Yao, Communications Manager at Tetra Pak China responsible for negotiations with the local energy company, explained:
We’re working with the local government and the public company for energy to define a transparent and traceable mechanism to ensure that renewable energy powering the Hohhot facility fully aligns with company policy on green energy supply. We’ll pay a premium energy price for our facility to be exclusively powered with energy coming from additional capacity at local wind farms. The local government will collect the premium and transfer it to the public energy company. We’re working for this process to be transparent. The Inner Mongolia local government is keen to cooperate as it has to meet its own renewable targets, set up by the central government, so it sees this as a win-win situation. Tetra Pak is one of the first companies to pay an energy premium price. We expect the system to be operational by October 2009.
As of July 2009, the European situation was no less challenging. From 2005 to 2009, the Eugene (European Green Electricity Network), an independent group of experts from environmental, consumer organisations and research institutes, facilitated the search for qualified renewable energy providers with quality labels for green electricity. However, in January 2009 Eugene was discontinued6, rendering the process of ensuring responsible energy purchase in Europe more complex and less efficient. As Abreu pointed out,
page 89
4 The offset market is meant to pay for CO2 reductions that would not have happened otherwise. Careless offsetting can enable greenwashing, double selling of carbon credits and other types of fraud to take place.
5 Tetra Pak agreed to go for green energy purchasing only after exploring all the possibilities of on-site generation and energy efficiency. Furthermore, the company agreed to buy energy exclusively from companies audited and certified to bring additional renewable energy to the grid.
6 EUGENE was discontinued as a European organisation because it became clear that green power labels are difficult to harmonise across European electricity markets, as they are tailored to the needs of different national electricity markets and national consumer expectations. Several European markets are not adapted for a functioning voluntary green power market, making it impossible to introduce voluntary labels for green electricity products.

the company had to negotiate making decisions related to renewable energy providers with WWF on a case by case basis.
Working with suppliers on full energy auditing
Energy auditing had already become part of the normal way of doing business at Tetra Pak converting factories even before the company joined Climate Savers. However it was neither systematic nor mandatory. Moreover, energy audits had been restricted to the most strategic areas within converting factories, such as cooling and ventilation systems. Although this worked well for identifying the most salient areas for energy efficiency improvement, it was not that helpful when it came to pushing identification of opportunities for energy efficiency improvement to the limit.
Tetra Pak Brazil addressed the challenge by partnering with a machinery supplier to put in place a systematic full energy audit at Monte Mor converting factory. Energy efficiency was the only path open for the Brazilian business unit to contribute to company efforts to reduce direct CO2 emissions, as energy in Brazil was already mainly generated from renewable sources7. The local environmental pillar decided to address the challenge of pushing energy efficiency to the limit by partnering with Danfoss Group, on a full energy audit project. Valeria Michel, Senior Environment Specialist at Tetra Pak Brazil, described the initiative:
We wanted to gain a better understanding of the energy consumption of all processing systems and equipment in our factory. We installed new measuring systems allowing us to assess energy consumption at multiple points. That way, we can be very precise in determining the energy consumption of individual production steps. We then examined the energy use of our equipment and compared this with the best available technology.
The energy audit results showed a potential of 6.15% of energy savings at Monte Mor facility between 2008 and 2010, with an average pay-back time lower than one year (refer to Exhibit 3). A full potential of 14% increase in energy efficiency at Tetra Pak Brazil was identified. The local pillar shared the results with the master pillar, highlighting the potential for energy savings on the short, mid and long term. Converting factories in Germany adopted this solution with their own suppliers, and they found they could potentially increase energy efficiency by 8%. As of mid 2009, the master pillar was studying the feasibility of issuing a new corporate energy audit policy based on these experiences.
Lining up suppliers with Tetra Pak’s founder vision
Tetra Pak’s founder, Ruben Rausing, used to share a vision that “a package should save more than it costs”. By innovating in energy efficiency, Tetra Pak had now incorporated not only economic performance but also anchored material and energy inputs to this vision.
A significant part of Tetra Pak’s climate strategy is the minimization of material input and the maximization of the use of renewable resources as a raw material. It includes R&D joint initiatives with suppliers to include material minimization as a key criterion in Tetra Pak package design, as well as the creation of long-term partnerships to reduce the carbon footprint of suppliers. As of mid 2009, Tetra Pak had established such partnerships with key paper suppliers and was negotiating with aluminum and polymers suppliers to create similar collaborative initiatives.
page 90
7 As of 2007, 85% of the Brazilian electricity was generated from renewable sources (hydroelectric mainly).
Reducing the carbon footprint of transportation was also part of the company’s approach to allow a package to save more resources than it costs. Abreu explained that Tetra Pak systematically assesses greenhouse gas emissions from centrally-contracted logistic suppliers and uses the information to negotiate improvement or phase out targets. The company was also working on increasing transport efficiency, by delivering aseptic packages to customers in rolls, thus optimizing storage in trucks, and reducing weight while increasing the robustness of carton packages.
Future challenges
Lund, Sweden: July 10, 2009. Abreu parked his bicycle in front of the Tetra Pak office building and quickly checked his e-mail on his blackberry. A message from his counterpart at WWF popped up on the small screen of his blackberry. He smiled to the thought that by having WWF as a partner, Tetra Pak was unlikely to achieve a comfort zone, since the NGO would keep challenging the company to innovate and move forward on their climate savers strategy.
For more information: panda.org/cleaneconomy
page 91

Exhibit 1Tetra Pak CO2 emissions – Facts and Figures
page 92
Source: Environmental and Social Report. Tetra Pak. 2009.
Energy use and production growth in carton packaging material production
Greenhouse gas Emissions: C02 emissions Global Warming Potential (GWP)
Energy efficiency in Packaging material production Energy use
Greenhouse gas emissions by source (GWP), 2008 Greenhouse gas emissions (GWP) by operation, 2008
Refrigerants
District heating
Organic solvents
LPG
Natural Gas
Electricity
Support services
Market companiesProcessing equipment and packaging
machines production
Closures, straws and film production
Carton packaging material production
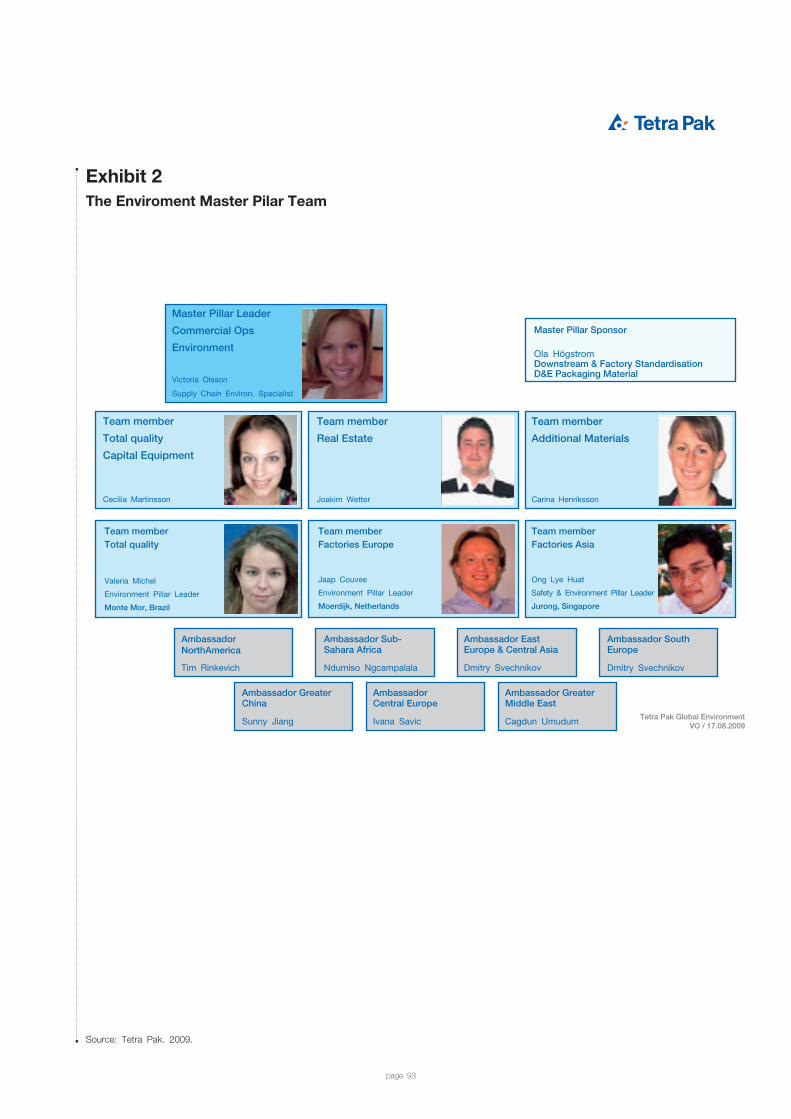
Exhibit 2The Enviroment Master Pilar Team
page 93
Source: Tetra Pak. 2009.
Team member
Total quality
Capital Equipment
Cecilia Martinsson
Master Pillar Leader
Commercial Ops
Environment
Victoria Olsson
Supply Chain Environ. Specialist
Master Pillar Sponsor
Ola HögstromDownstream & Factory StandardisationD&E Packaging Material
Team member
Total quality
Capital Equipment
Cecilia Martinsson
Team member
Real Estate
Joakim Wetter
Team member
Additional Materials
Carina Henriksson
Team memberTotal quality
Valeria Michel
Environment Pillar Leader
Monte Mor, Brazil
Team memberFactories Europe
Jaap Couvee
Environment Pillar Leader
Moerdijk, Netherlands
Team memberFactories Asia
Ong Lye Huat
Safety & Environment Pillar Leader
Jurong, Singapore
Ambassador NorthAmerica
Tim Rinkevich
Ambassador Sub-Sahara Africa
Ndumiso Ngcampalala
Ambassador East Europe & Central Asia
Dmitry Svechnikov
Ambassador South Europe
Dmitry Svechnikov
Ambassador Greater China
Sunny Jiang
Ambassador Central Europe
Ivana Savic
Ambassador Greater Middle East
Cagdun Umudum Tetra Pak Global EnvironmentVO / 17.08.2009
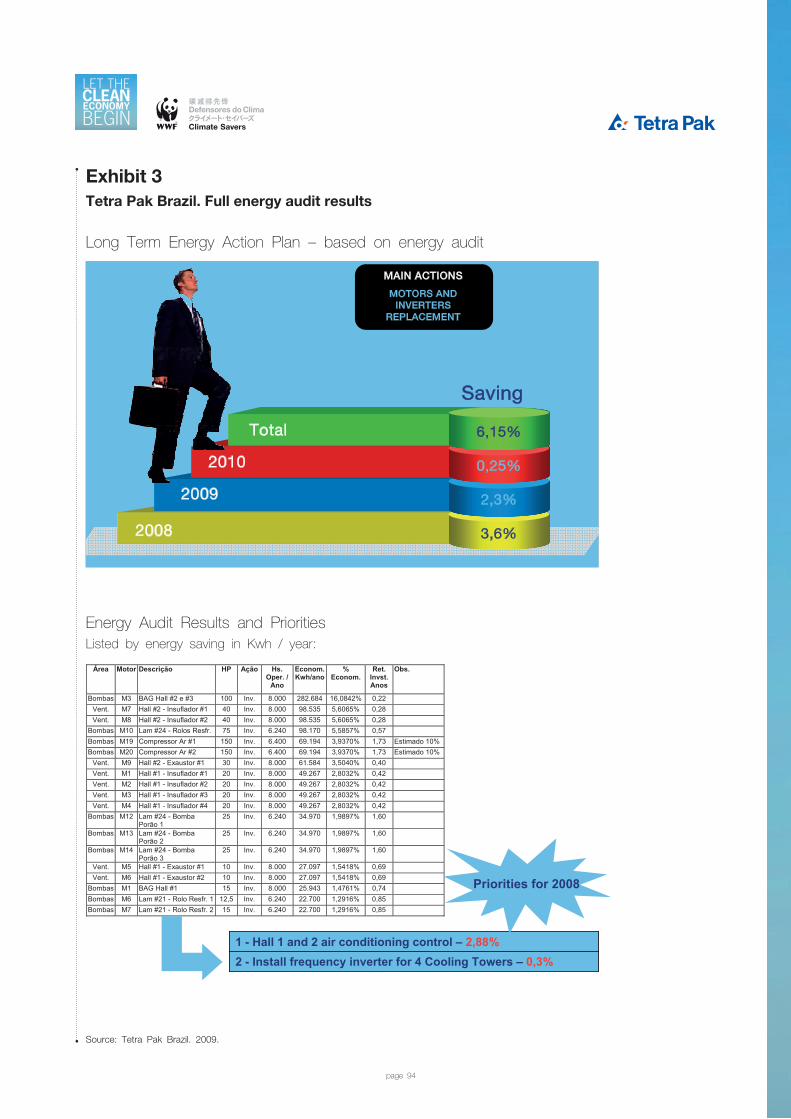
Exhibit 3Tetra Pak Brazil. Full energy audit results
page 94
Source: Tetra Pak Brazil. 2009.
2008
2009
2010
Total
3,6%
2,3%
0,25%
6,15%
Saving
Long Term Energy Action Plan – based on energy audit
MAIN ACTIONS
MOTORS AND INVERTERS
REPLACEMENT
Long Term Energy Action Plan – based on energy audit
Energy Audit Results and Priorities
2 - Install frequency inverter for 4 Cooling Towers – 0,3%1 - Hall 1 and 2 air conditioning control – 2,88%
Energy Audit Results and PrioritiesListed by energy saving in Kwh / year:
Área Motor Descrição HP Ação Hs. Oper. /
Ano
Econom. Kwh/ano
%Econom.
Ret.Invst. Anos
Obs.
Bombas M3 BAG Hall #2 e #3 100 Inv. 8.000 282.684 16,0842% 0,22 Vent. M7 Hall #2 - Insuflador #1 40 Inv. 8.000 98.535 5,6065% 0,28 Vent. M8 Hall #2 - Insuflador #2 40 Inv. 8.000 98.535 5,6065% 0,28
Bombas M10 Lam #24 - Rolos Resfr. 75 Inv. 6.240 98.170 5,5857% 0,57 Bombas M19 Compressor Ar #1 150 Inv. 6.400 69.194 3,9370% 1,73 Estimado 10% Bombas M20 Compressor Ar #2 150 Inv. 6.400 69.194 3,9370% 1,73 Estimado 10%
Vent. M9 Hall #2 - Exaustor #1 30 Inv. 8.000 61.584 3,5040% 0,40 Vent. M1 Hall #1 - Insuflador #1 20 Inv. 8.000 49.267 2,8032% 0,42 Vent. M2 Hall #1 - Insuflador #2 20 Inv. 8.000 49.267 2,8032% 0,42 Vent. M3 Hall #1 - Insuflador #3 20 Inv. 8.000 49.267 2,8032% 0,42 Vent. M4 Hall #1 - Insuflador #4 20 Inv. 8.000 49.267 2,8032% 0,42
Bombas M12 Lam #24 - Bomba Porão 1
25 Inv. 6.240 34.970 1,9897% 1,60
Bombas M13 Lam #24 - Bomba Porão 2
25 Inv. 6.240 34.970 1,9897% 1,60
Bombas M14 Lam #24 - Bomba Porão 3
25 Inv. 6.240 34.970 1,9897% 1,60
Vent. M5 Hall #1 - Exaustor #1 10 Inv. 8.000 27.097 1,5418% 0,69 Vent. M6 Hall #1 - Exaustor #2 10 Inv. 8.000 27.097 1,5418% 0,69
Bombas M1 BAG Hall #1 15 Inv. 8.000 25.943 1,4761% 0,74 Bombas M6 Lam #21 - Rolo Resfr. 1 12,5 Inv. 6.240 22.700 1,2916% 0,85 Bombas M7 Lam #21 - Rolo Resfr. 2 15 Inv. 6.240 22.700 1,2916% 0,85
Priorities for 2008
Listed by energy saving in Kwh / year:
Xanterra Parks & Resorts’ focused strategy of bringing on-site renewable energy generation to the next level required not only significant dedicated resources, but also singular efforts to break down skeptical mindsets and risk-related barriers to innovation. By active learning from an almost terminated project, the company was able to build one of the largest privately-owned solar photovoltaic systems in the US.
Climate InnovationCase Study
page 95

DEATH VALLEY, UNITED STATES. SUMMER, 2009. Andrew N. Todd, president and chief executive officer of Xanterra Parks & Resorts, strolled along the 5,740 solar panels installed by Xanterra at the resorts the company operates in Death Valley National Park. He felt proud and accomplished.
Three years earlier, Todd had publicly recognized that financing and installing one of the largest privately-owned zero-emission renewable energy systems in the sunniest part of the United States looked like a lost battle for Xanterra. However, Todd’s adamant determination to succeed on the project led to its completion and allowed Xanterra to gain scale in its on-site renewable power generation strategy.
Background
Xanterra is the largest park concessionaire in the United States. The privately held company operates hotels and lodges, restaurants, stores, golf courses, marinas and passenger trains at national and state parks such as Yellowstone, Grand Canyon, Death Valley, Rocky Mountain and Crater Lake, among others. As of 2008, Xanterra had over 8,000 seasonal employees and received 18 million visitors annually.
In September 2004 Xanterra became the first hospitality company to join the WWF Climate Savers program. Climate Savers was founded in 1998 by WWF as a platform to enable companies to join forces in committing to more ambitious reductions in their greenhouse gas emissions and to transform industry’s more customary incremental and/or passive approach toward climate change action.
Xanterra’s commitment as a WWF Climate Savers company is to reduce CO2 emissions to 10% below their 2000 emissions by 2015. The approach the company adopted to achieve the emission reduction goal focuses on establishing on-site renewable energy generation systems, mainly solar, at properties operated by the company. Energy efficiency also plays an important role, through a combination of measures such as the installation of energy management control systems at hospitality facilities, seasonal shut-down of systems, education programs aiming to change employees’ behavior regarding energy use, extensive lighting retrofits and efficiency upgrades of equipment.
The goals established by Xanterra with Climate Savers are part of a set of broader environmental goals set by the company in 2004, the Xanterra’s 2015 Environmental Vision goals (refer to Exhibit 1).
Chris Lane, Xanterra’s vice-president of environmental affairs, explained that the company’s commitment to environmental leadership is core to the very nature of the company’s underlying business; that of operating natural parks.
IMD Research Associates Dr. Tania Braga and Eva Hubsman prepared this case under the supervision of Dr. Aileen Ionescu-Somers and Professor Corey Billington, Deputy Director and Director respectively of the Forum for Corporate Sustainability Management at IMD.
This case was commissioned by the WWF Climate Savers Program.
It was developed with inputs from the staff of both Xanterra Parks & Resorts and WWF. The contribution of all parties is gratefully acknowledged.
page 96
Removing barriers to innovation: Xanterra Parks & Resorts gaining scale in on-site solar power generation.
Copyright © 2009 by WWF Climate Savers and IMD - International Institute for Management.

He commented:
If you’re not a leader in environmental management, you’re not going to last very long in this business. Environmental performance is one of the key performance measures evaluated by our client, the National Park Services.
Breaking down skeptical mindsets
As of 2004, the company was aware that achieving their 2015 Environmental Vision goal would call for “giant steps” and the company began to seek opportunities for large scale reductions on both CO2 emissions and dependence on fossil fuels. Todd explained that installing the largest privately-owned zero-emission renewable energy system in the country at one of the properties operated by Xanterra seemed to be their best bet.
Death Valley, the sunniest place in the United States, was a natural choice for a large scale solar power system. Furthermore, Death Valley had built up a solid record as an ideal testing ground for innovative products and systems. According to Xanterra sources:
It’s a good place to test environmental climate change related technologies. When a product survives the 120 °F heat, high winds, and dust storms found only in Death Valley, you know it will work any place!1
In 2004 a project to build a 220 kW solar photovoltaic energy system at the Death Valley was presented to Xanterra senior managers. Reactions were mixed given the poor economic performance of the project. With mounting skepticism in the managerial ranks regarding technical and financial aspects of the project, things were put on hold. In Xanterra’s 2005 corporate sustainability report, Todd stated:
One of the biggest environmental setbacks of the year was our inability to finance and install a 220 kW solar energy system in the sunniest place in the country; Death Valley. While we lost that battle, I vow not to give up on this project because I know that weaning our company off fossil fuels could be the most important environmental achievement we could ever accomplish.
Following Todd’s public recognition of setbacks on the project and pledging to strive for its successful completion, Lane actively focused on learning from the setback and removing existing barriers that prevented Xanterra from building large-scale solar photovoltaic systems.
In 2007 a much larger solar PV system, a one-megawatt project, was presented to senior managers and ownership. Although they were positive regarding the purpose of the project - taking Xanterra to a leadership position in on-site renewable generation - they were skeptical about the magnitude of the project and the level of technical expertise required. Managers questioned the reliability and durability of solar panels, the cost of maintenance and resistance to Death Valley’s tough weather conditions that include high winds and extreme heat. In addition, with a total investment stake of close to 8.5 million dollars, the management team was still uncertain about the economic viability of the project.
Lane explained that solar projects can be quite diverse depending on size and location. A project’s economic viability can also change significantly in proportion to the availability of public incentives. Solar projects often require tailor-made solutions for major technical, operational and financial challenges. He recalled many a late or sleepless night during his search over several
page 97
1 http://www.xanterra.com/energy-efficiency-ghg-reduction-projects-5353.html

months for cutting-edge technology, anticipating and solving operational problems and calculating and recalculating pro-forma reports.
For example, on the technical side, Lane had to find solutions to reduce the system vulnerability to wind storms. Since Death Valley is often hit by strong wind storms (at times over 100 miles per hour), the danger of potential damage to the solar panels had to be eliminated. To mitigate this risk, Xanterra would install a system to monitor wind velocity and automatically flatten the panels once a certain wind speed was exceeded.
On the operational side, the project also faced challenges such as the development of a cost-efficient panel cleaning system - thus avoiding higher maintenance costs draining the project’s financial feasibility2. Additionally, non-native date palm trees covered the site where the system would be installed. Rather than cutting them down, Xanterra salvaged 144 trees, replanting them on site and chipping less healthy trees for landscaping projects on site.
Through careful planning, fiscal incentives - 30% tax credit and accelerated depreciation - from the federal government and State of California Solar Initiative, use of a solar PV tracking system that captures up to 40% more solar rays, and the unique climate of the Death Valley that has more sun than any place in the US, Lane managed to reduce the return on investment to roughly five years3. With solid financial figures and more innovative technical solutions, skepticism to the project dissipated and Lane got the green light to start planning the development of the system in March 2007.
Reaping the rewards
In July of 2008, Xanterra succeeded in taking their renewable energy portfolio to a new level as the Death Valley solar photovoltaic energy system went fully operational. The system is the size of five football fields and generates on-site energy of more than 2.2 million kWh per year.
The Death Valley solar system saves 832 tons of CO2-equivalent per year, representing more than 4% of total company reductions in any one year. The project is also the first of its kind in this business sector. According to Todd:
This system (at the time) is not only the largest renewable energy system in the country amongst all private companies, it is also the largest in the entire tourism industry, the entire Department of Interior, and of any national park concessioners.
The learning curve with the project has been steep, giving Xanterra a unique hands-on knowledge of the challenges and rewards of building and operating large scale solar photovoltaic power systems.
Lane noted that many people think that a solar project is simply putting up panels. However, he explained that there are some operational and technical aspects of this kind of project that become apparent only once it is fully operational. With regard to the shortcomings, he stressed that suppliers and consultants usually do not mention several challenges that can bring substantial additional costs:
No one talks about dust covering panels, heat reducing generation, ongoing maintenance costs, replacement of parts such as inverters that break or overheat, panels being broken by rocks, hail, or golf balls and how to cope with that, the adverse effect of wind on the system, seasonal shade; these are all issues that affect solar panels and these factors inhibit the maximization of electricity generation.
page 98
2 Since Death Valley has a dusty environment with very little precipitation, the accrued dust on the panels was a major issue that could affect their efficiency. To keep maintenance costs down, the company developed a technology to clean the panels using minimal manual labor.
3 The pay-back time calculated for the same project few years earlier was between 10 and 12 years.

Lane mentioned the roughly 40% increased generation of the system due to the sun tracking device4, which he recommends to anyone considering implementing a large scale solar system.
Last but not least, both Todd and Lane see the project as one of the pinnacles of their careers. As put by Lane:
When I am long gone in 50 years, it will still be generating clean, renewable and free electricity while making profits for the company”.
What is next for Xanterra?
In 2007, the company issued a Climate Change Action Plan, which was a starting point to aggregate all the measures and strategies related to the reduction of greenhouse gas emissions. Xanterra internally assessed the likelihood of meeting short and long-term climate goals. The assessment showed that the company had already exceeded its Climate Savers goal in 2007, by reducing emissions by 17% in absolute terms (refer to Exhibit 2 for facts & figures on Xanterra’s CO2 emissions and energy use).
However, Lane noted that this is not the end of the line for Xanterra’s efforts in reducing its carbon footprint. From now on every saving will be more difficult, since all the “low hanging fruit” has been harvested. In addition, it is clear to Xanterra that reaching a target is different from maintaining it. Simple issues, such as an unusually hot Summer or decreasing efficiency of the solar system, affect emission levels. This is where he sees the role of Climate Savers becoming even more critical:
WWF “keeps our feet to the fire” through corporate peer pressure and by ensuring that the company is accountable for its own objectives.
page 99
4 The device automatically adjusts the panels according to the location of the sun so that there is maximum exposure to light at all times. This increases the solar panel efficiency by 30% bringing the total output to 100% of company’s local requirements during daytime. In addition, the system is 100% operational once the sun comes up and it works full capacity until the sun sets.
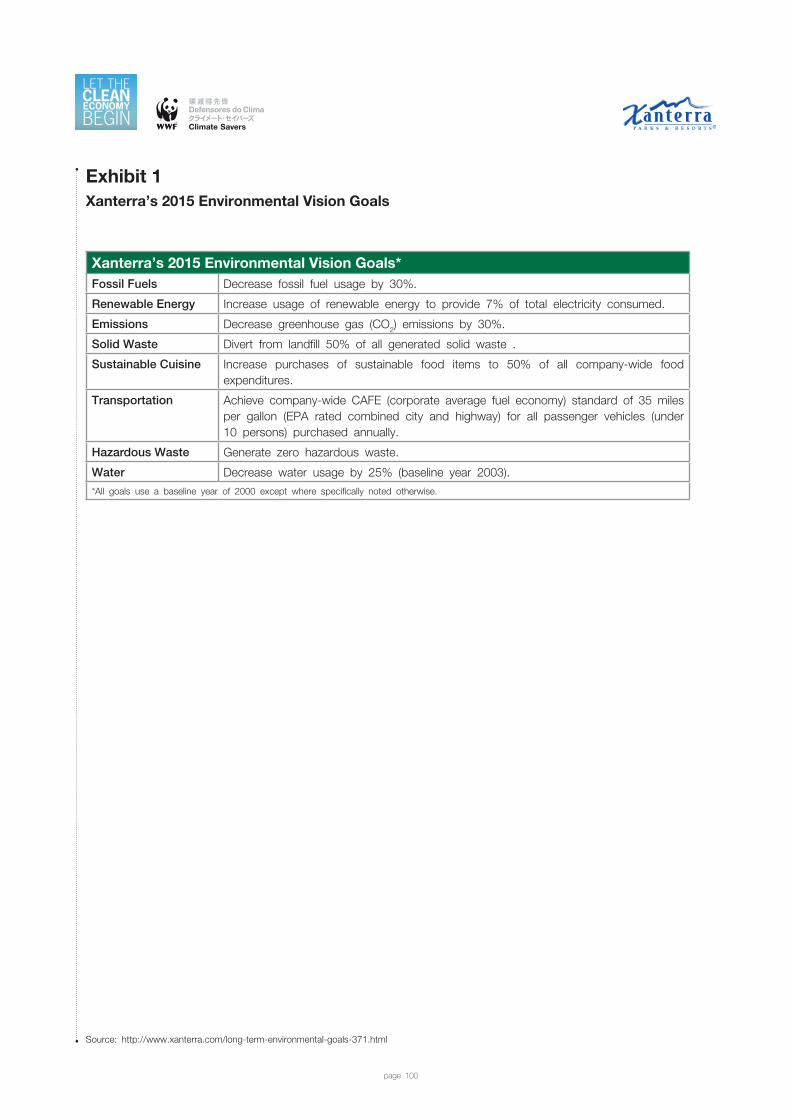
Exhibit 1Xanterra’s 2015 Environmental Vision Goals
page 100
Source: http://www.xanterra.com/long-term-environmental-goals-371.html
Xanterra’s 2015 Environmental Vision Goals* Fossil Fuels Decrease fossil fuel usage by 30%.
Renewable Energy Increase usage of renewable energy to provide 7% of total electricity consumed.
Emissions Decrease greenhouse gas (CO2) emissions by 30%.
Solid Waste Divert from landfill 50% of all generated solid waste .
Sustainable Cuisine Increase purchases of sustainable food items to 50% of all company-wide food expenditures.
Transportation Achieve company-wide CAFE (corporate average fuel economy) standard of 35 miles per gallon (EPA rated combined city and highway) for all passenger vehicles (under 10 persons) purchased annually.
Hazardous Waste Generate zero hazardous waste.
Water Decrease water usage by 25% (baseline year 2003).
*All goals use a baseline year of 2000 except where specifically noted otherwise.
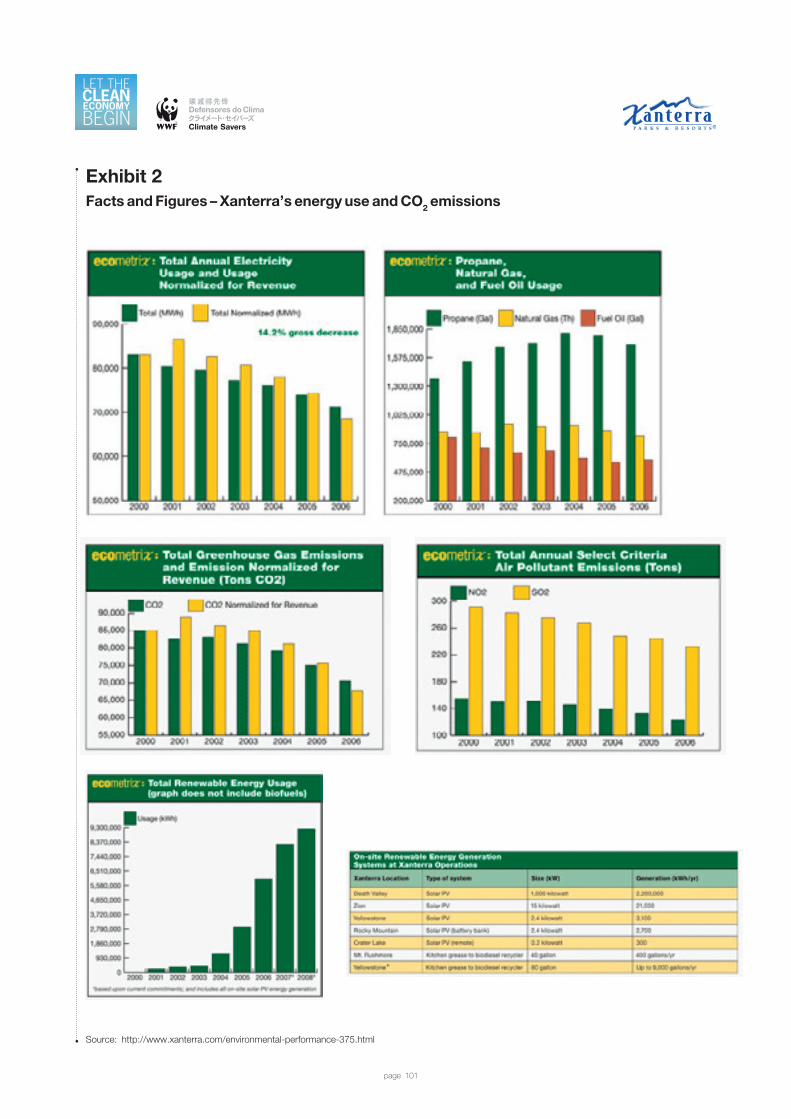
Exhibit 2Facts and Figures – Xanterra’s energy use and CO2 emissions
page 101
Source: http://www.xanterra.com/environmental-performance-375.html


©1986 P
anda symbol W
WF - W
orld Wide Fund For N
ature (Formerly W
orld Wildlife Fund) ®
“WWF” and “living planet” are R
egistered Trademarks
WWF’s mission is to stop the degradation of the planet’s natural environment and to build a future in which humans live in harmony with nature, by:
• conserving the world’s biological diversity
• ensuring that the use of renewable natural resources is sustainable
• promoting the reduction of pollution and wasteful consumption
Climate Business Engagement UnitWWF International
[email protected]/climatesavers