Initial Steps of Rubicene Film Growth on Silicon Dioxide
9
1 Initial Steps of Rubicene Film Growth on Silicon Dioxide 2 Boris Scherwitzl, † Walter Lukesch, † Andreas Hirzer, † Jö rg Albering, ‡ Gü nther Leising, † Roland Resel, † 3 and Adolf Winkler* ,† 4 † Institute of Solid State Physics, Graz University of Technology, Petersgasse 16, A-8010 Graz, Austria 5 ‡ Graz University of Technology, Mandellstrasse 11, 8010 Graz, Austria 6 * S Supporting Information 7 ABSTRACT: The film growth of the conjugated organic molecule rubicene 8 on silicon dioxide was studied in detail. Since no structural data of the 9 condensed material were available, we first produced high quality single 10 crystals from solution and determined the crystal structure. This high purity 11 material was used to prepare ultrathin films under ultrahigh vacuum 12 conditions, by physical vapor deposition. Thermal desorption spectroscopy 13 (TDS) was applied to delineate the adsorption and desorption kinetics. It 14 could be shown that the initial sticking coefficient is only 0.2 ± 0.05, but the 15 sticking coefficient increases with increasing coverage. TDS further revealed 16 that first a closed, weakly bound bilayer develops (wetting layer), which dewets after further deposition of rubicene, leading to an 17 island-like layer. These islands are crystalline and exhibit the same structure as the solution grown crystals. The orientation of the 18 crystallites is with the (001) plane parallel to the substrate. A dewetting of the closed bilayer was also observed when the film was 19 exposed to air. Furthermore, Ostwald ripening of the island-like film takes place under ambient conditions, leading to films 20 composed of few, large crystallites. From TDS, we determined the heat of evaporation from the multilayer islands to be 1.47 eV, 21 whereas the desorption energy from the first layer is only 1.25 eV. 1. INTRODUCTION 22 Organic thin films have attracted high and widespread scientific 23 interest within the past decade. In particular, films composed of 24 conjugated materials, polymers, as well as molecules are of 25 preferred importance. This is due to their interesting and 26 advantageous electrical, 1 optical, 2 optoelectronic, 3 chemical, 27 and mechanical properties, which makes such films attractive 28 for applications in organic electronics and optoelectronics. One 29 of the powerful aspects of conjugated systems is the 30 adjustability of the electronic structure, especially the band 31 gap, based on the individual extent of the π-conjugation within 32 the main chain (in the case of polymers) or within the single 33 molecule (in the case of conjugated oligomers or conjugated 34 molecules). Moreover, the electronic structure of the bulk of 35 conjugated systems (single crystals, thin films) can be strongly 36 tuned by the crystallographic packing of single molecules with 37 respect to each other. 4 This tuning possibility makes them 38 attractive for many optical, electronic, and optoelectronic 39 applications. Other advantageous aspects of organic films are 40 their softness, which allows the production of flexible 41 electronics, the expected low production costs, and a possibly 42 better environmental compatibility. On the other hand, there 43 are also some drawbacks in the endeavor to produce and 44 maintain high quality organic films: poor air stability, 45 deterioration with time, dewetting, and in particular difficulties 46 to produce highly defined layer-like films. 47 In this article, we focus on the initial steps of film formation 48 of rubicene molecules. Rubicene (C 26 H 14 ) is a polycylic 49 hydrocarbon consisting of five benzene rings with three linearly 50 fused rings and one benzene ring at each diagonal side, shown 51 f1f2 in Figure 1 and in the inset of Figure 2a. It is a stiff and planar 52 semiconducting molecule with a molecular weight of m = 326.4 53 amu, a density of ρ = 1.392 g/cm 3 , and a melting point of T m = 54 581 K. Interestingly, this material is poorly investigated; so far Received: December 13, 2012 Revised: January 29, 2013 Figure 1. Package of the molecules in the rubicene crystal, together with the crystal unit cell. The Bravais lattice is primitive monoclinic. The basis consists of four molecules, arranged in a parallel stacking structure. Article pubs.acs.org/JPCC © XXXX American Chemical Society A dx.doi.org/10.1021/jp3122598 | J. Phys. Chem. C XXXX, XXX, XXX−XXX jem00 | ACSJCA | JCA10.0.1465/W Unicode | research.3f (R3.5.i1:3915 | 2.0 alpha 39) 2012/12/04 10:21:00 | PROD-JCAVA | rq_2154903 | 2/08/2013 15:23:52 | 9
Transcript of Initial Steps of Rubicene Film Growth on Silicon Dioxide
1 Initial Steps of Rubicene Film Growth on Silicon Dioxide2 Boris Scherwitzl,† Walter Lukesch,† Andreas Hirzer,† Jorg Albering,‡ Gunther Leising,† Roland Resel,†
3 and Adolf Winkler*,†
4†Institute of Solid State Physics, Graz University of Technology, Petersgasse 16, A-8010 Graz, Austria
5‡Graz University of Technology, Mandellstrasse 11, 8010 Graz, Austria
6 *S Supporting Information
7 ABSTRACT: The film growth of the conjugated organic molecule rubicene8 on silicon dioxide was studied in detail. Since no structural data of the9 condensed material were available, we first produced high quality single10 crystals from solution and determined the crystal structure. This high purity11 material was used to prepare ultrathin films under ultrahigh vacuum12 conditions, by physical vapor deposition. Thermal desorption spectroscopy13 (TDS) was applied to delineate the adsorption and desorption kinetics. It14 could be shown that the initial sticking coefficient is only 0.2 ± 0.05, but the15 sticking coefficient increases with increasing coverage. TDS further revealed16 that first a closed, weakly bound bilayer develops (wetting layer), which dewets after further deposition of rubicene, leading to an17 island-like layer. These islands are crystalline and exhibit the same structure as the solution grown crystals. The orientation of the18 crystallites is with the (001) plane parallel to the substrate. A dewetting of the closed bilayer was also observed when the film was19 exposed to air. Furthermore, Ostwald ripening of the island-like film takes place under ambient conditions, leading to films20 composed of few, large crystallites. From TDS, we determined the heat of evaporation from the multilayer islands to be 1.47 eV,21 whereas the desorption energy from the first layer is only 1.25 eV.
1. INTRODUCTION
22 Organic thin films have attracted high and widespread scientific23 interest within the past decade. In particular, films composed of24 conjugated materials, polymers, as well as molecules are of25 preferred importance. This is due to their interesting and26 advantageous electrical,1 optical,2 optoelectronic,3 chemical,27 and mechanical properties, which makes such films attractive28 for applications in organic electronics and optoelectronics. One29 of the powerful aspects of conjugated systems is the30 adjustability of the electronic structure, especially the band31 gap, based on the individual extent of the π-conjugation within32 the main chain (in the case of polymers) or within the single33 molecule (in the case of conjugated oligomers or conjugated34 molecules). Moreover, the electronic structure of the bulk of35 conjugated systems (single crystals, thin films) can be strongly36 tuned by the crystallographic packing of single molecules with37 respect to each other.4 This tuning possibility makes them38 attractive for many optical, electronic, and optoelectronic39 applications. Other advantageous aspects of organic films are40 their softness, which allows the production of flexible41 electronics, the expected low production costs, and a possibly42 better environmental compatibility. On the other hand, there43 are also some drawbacks in the endeavor to produce and44 maintain high quality organic films: poor air stability,45 deterioration with time, dewetting, and in particular difficulties46 to produce highly defined layer-like films.47 In this article, we focus on the initial steps of film formation48 of rubicene molecules. Rubicene (C26H14) is a polycylic49 hydrocarbon consisting of five benzene rings with three linearly
50fused rings and one benzene ring at each diagonal side, shown
51 f1f2in Figure 1 and in the inset of Figure 2a. It is a stiff and planar
52semiconducting molecule with a molecular weight of m = 326.4
53amu, a density of ρ = 1.392 g/cm3, and a melting point of Tm =54581 K. Interestingly, this material is poorly investigated; so far
Received: December 13, 2012Revised: January 29, 2013
Figure 1. Package of the molecules in the rubicene crystal, togetherwith the crystal unit cell. The Bravais lattice is primitive monoclinic.The basis consists of four molecules, arranged in a parallel stackingstructure.
Article
pubs.acs.org/JPCC
© XXXX American Chemical Society A dx.doi.org/10.1021/jp3122598 | J. Phys. Chem. C XXXX, XXX, XXX−XXX
jem00 | ACSJCA | JCA10.0.1465/W Unicode | research.3f (R3.5.i1:3915 | 2.0 alpha 39) 2012/12/04 10:21:00 | PROD-JCAVA | rq_2154903 | 2/08/2013 15:23:52 | 9
55 nothing is known about the crystallography of condensed56 rubicene and the formation of rubicene thin films. One57 important aspect is that rubicene films can be produced both58 from solution and by thermal evaporation under vacuum59 conditions. In this work, we first prepared rubicene single60 crystals from solution for their structural identification and then61 used this high purity material to prepare thin films under62 ultrahigh vacuum conditions. Under these well controlled63 conditions, we studied the adsorption and desorption proper-64 ties of rubicene on silicon dioxide and the initial steps of film65 formation by using thermal desorption spectroscopy. In
66addition, we were able to study the thermal and air stability67of ultrathin rubicene films. Atomic force microscopy revealed68that the rubicene films are composed of randomly oriented69islands. Dewetting and islanding is a pronounced feature of this70material.
2. EXPERIMENTAL SECTION712.1. Rubicene Purification, Crystal Growth, and72Characterization. The rubicene powder, as purchased from73Arcos Organics, Belgium, has a purity of 98%. To provide a74high chemical purity of the grown crystals, as well as for the75thin films, the purchased rubicene material was thoroughly76purified by a gas transport technique. The purity was verified by77optical spectroscopy (absorption and luminescence excitation78and emission) of highly concentrated solutions, as well as by79infrared absorption spectroscopy in the spectral range of the80C−H stretching vibrations (2800−3100 cm−1) (see the81Supporting Information, Figures SI-1, SI-2, and SI-3).82Rubicene single crystals were grown from a rubicene−83toluene solution which resulted in elongated crystals of several84mm lengths. The XRD measurements were carried out on a85Bruker Kappa APEX II 4K CCD diffractometer using graphite86monochromated Mo Kα radiation with a characteristic87wavelength of 0.71 Å. Moreover, it can envelope the specimen88in a cold nitrogen gas stream to permit crystallographic studies89at low temperatures to improve the accuracy of the structural90data. The crystal structure of rubicene was determined at 10091and 250 K. All calculations were performed using the Bruker92APEX II program system5 and the SHELXTL program93package.6 Absorption corrections were performed by the94program SADABS7 (see the Supporting Information).952.2. Thin Film Deposition. Ultrathin rubicene films were96prepared under ultrahigh vacuum conditions by physical vapor97deposition from a Knudsen cell. The substrates were silicon98dioxides (thickness 150 nm) thermally grown on 0.67 mm thick99Si(100) wafers (10 mm × 10 mm), as supplied by Siegert100Consulting e.K., Germany. A quartz microbalance thin film101monitor (Inficon XTM/2) was used to quantitatively determine102the evaporation rate from the Knudsen cell and hence the103deposited amount of rubicene on the SiO2/Si substrate. For104this purpose, the sample was temporarily replaced by the105microbalance. Typically, deposition rates of 70 ng/(min·cm2),106equivalent to 0.5 nm/min, were applied, which required a107Knudsen cell temperature of about 470 K. The sample108temperature during deposition was either room temperature109or 220 K, as obtained by LN2 cooling. The residual pressure110during deposition was in the 10−9 mbar range.1112.3. Substrate and Thin Film Characterization. The112chemical compositions of the substrate and thin films were113analyzed by Auger electron spectroscopy (AES) (Varian CMA).114On the freshly installed sample, in addition to silicon and115oxygen, carbon was observed as a contaminant. This carbon116could be easily removed by 10 min of argon sputtering (500 V,11730 mA, 5 × 10⁻⁵ mbar argon), resulting in a clean substrate.118However, annealing to 800 K again resulted in some119accumulation of carbon, most probably due to segregation120from the bulk. As we will show below, this carbon121contamination on the silicon dioxide surface had no significant122influence on the adsorption behavior of rubicene. The Auger123analysis of the deposited rubicene film exhibited just carbon; no124impurities could be seen. However, one has to be careful by125interpreting the carbon signal in this case, because there is126strong evidence that rubicene dissociates in the area where the
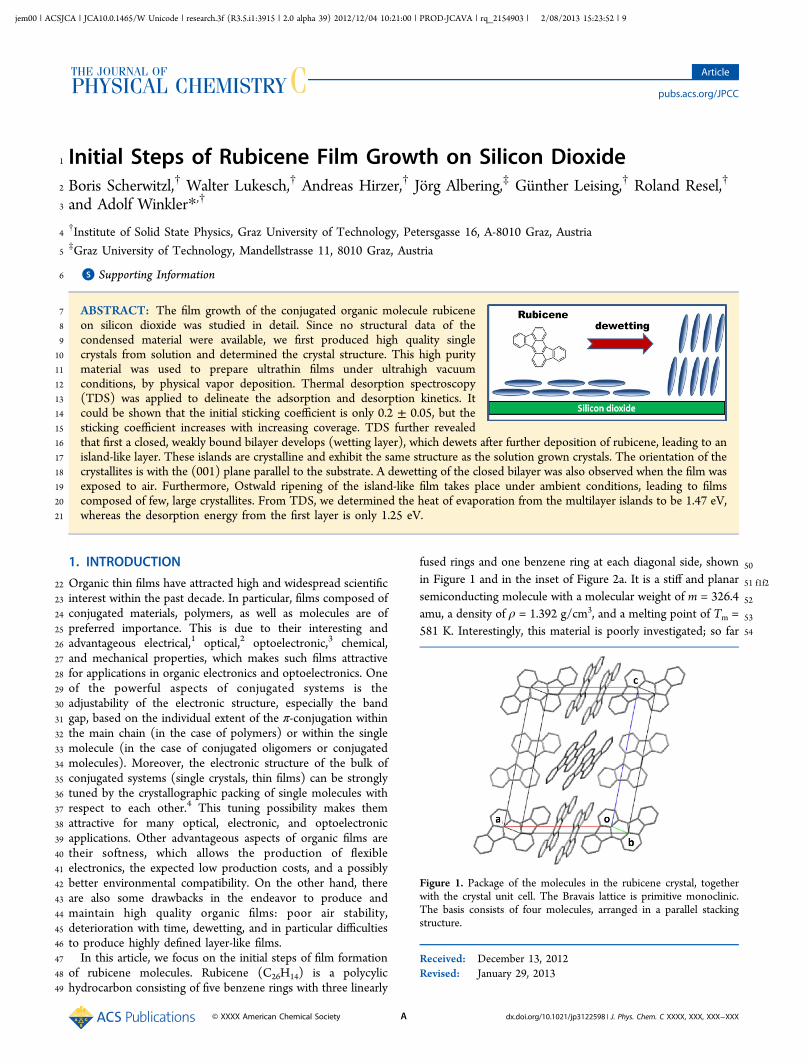
Figure 2. Thermal desorption spectra of rubicene from carboncovered silicon dioxide, for different exposures. Adsorption temper-ature Tad = 220 K, heating rate ß = 1 K/s. The exposure is given in Hz,as determined by a quartz microbalance: (a) 2−42 Hz, (b) 42−67 Hz,(c) 50−118 Hz. The chemical structure of rubicene is shown in theinset of part a.
The Journal of Physical Chemistry C Article
dx.doi.org/10.1021/jp3122598 | J. Phys. Chem. C XXXX, XXX, XXX−XXXB
127 electron beam hits the surface. The morphology of the128 prepared films was determined ex situ by atomic force129 microscopy (AFM) in the tapping mode (Nanosurf Easyscan2).130 The crystallographic structure of the ultrathin films was131 investigated by X-ray diffraction. A Philips X’Pert System132 equipped with an ATC3 cradle was used in Bragg−Brentano133 focusing geometry. Radiation of a sealed chromium tube was134 used in combination with a graphite monochromator at the135 secondary side.136 2.4. Thermal Desorption Spectroscopy. A quite power-137 ful method to determine the thermal stability and the138 quantitative amount of deposited rubicene is thermal139 desorption spectroscopy (TDS). In this case, the rubicene140 covered sample is heated up to 800 K, typically with heating141 rates of 1 K/s, and the desorbing molecules are detected with a142 mass spectrometer. The integral over the spectrum is a measure143 for the deposited amount. From the shape of the spectra and144 the peak maxima, conclusions can be drawn regarding the145 desorption order and the desorption energy. Furthermore, from146 a series of desorption spectra with different adsorbed amounts,147 one can get information on the adsorption kinetics, the layer148 formation, and the desorption kinetics.8 For TDS, we have149 tuned the mass spectrometer (Balzers Quadstar) to mass 163,150 because this showed the highest number of fragments in the151 cracking pattern. In order to perform TDS on a silicon wafer,152 the samples were attached to a stainless steel plate via tantalum153 clamps, as described in more detail elsewhere.9 In this context,154 we have to express a caveat with respect to the desorption155 temperature. Due to the poor heat conductivity of SiO2 and the156 thermal contact resistance between the (oxidized) silicon wafer157 and the steel plate, the temperature of the sample surface lags158 behind the temperature of the heating plate. Although one can159 take this into account by a simple first-order correction9 (see160 the Supporting Information), in the following, we will use the161 uncorrected temperature values, if not stated otherwise.
3. EXPERIMENTAL RESULTS162 3.1. Crystal Structure. So far, no structural characterization163 for rubicene single crystals existed in the literature. Our X-ray164 diffraction measurements revealed that the crystal system of165 rubicene is monoclinic and its Bravais lattice is primitive166 monoclinic (space group P21/n). Figure 1 depicts the package167 of the molecules in the rubicene crystal. The XRD measure-168 ments yield the following unit cell dimensions at T = 250 K: a169 = 16.158(1) Å, b = 5.1230(4) Å, c = 19.112(1) Å, β = 97.22°.170 With these dimension values, one gets V = 1569.5(2) Å3. Since171 the unit cell basis contains four molecules, the rubicene crystal172 density is calculated to be ρ = 1.381 g/cm3. This is in good173 agreement with the literature data.10 Furthermore, the174 interplanar distance between two adjacent parallel molecules175 in the rubicene crystal is 3.38 Å. The observed molecular176 packing is typical for aromatic molecules with disclike shape.11
177 All grown crystals were also analyzed at a temperature of 100 K.178 Since the structural results were almost identical for both179 temperatures, neither a phase transition nor a significant change180 in the crystal structure occurs in the temperature range between181 100 and 250 K (see the Supporting Information). The182 crystallographic data for the structures have also been deposited183 with the Cambridge Crystallographic Data Centre.12
184 3.2. Thermal Desorption Spectra. As outlined above,185 thermal desorption spectroscopy can be applied to delineate186 the kinetics of adsorption and desorption of particles on and187 from substrates. Albeit this method has been mainly applied in
188classical surface science to study reactions at surfaces, it has189proven to also be very powerful to describe the initial stages of190organic film growth.13 In Figure 2, desorption spectra of191rubicene from silicon dioxide after different exposed amounts at192220 K are depicted. In this particular case, the substrate surface193was covered with some carbon. Actually, after each deposition194of rubicene and subsequent heating to 800 K, a specific amount195of carbon remains on the surface. This amount accumulates to a196saturation value above which no further decomposition of197rubicene can be observed (Auger ratio C272/O510 ≈ 0.27).198Therefore, we used this stable substrate for the adsorption/199desorption experiments. For better visibility, the spectra are200plotted in three different figures for different coverage regimes.201The exposed amounts of rubicene are described by the202frequency changes of a quartz microbalance, which was203positioned at the place of the substrate before the actual204deposition at the substrate, in order to install a specific205deposition rate. From the known quartz frequency ( f ≈ 6206MHz), the quartz sensitivity (S = 2.26 × 10⁻⁶ cm2s/g), and the207density of rubicene (ρ = 1.39 g/cm3), one can determine the208correlation between the quartz frequency change (Δf) and the209mean thickness (d) of the exposed amount. According to the210relationship14
ρ= − Δ−d S f f/( )1 2211(1)
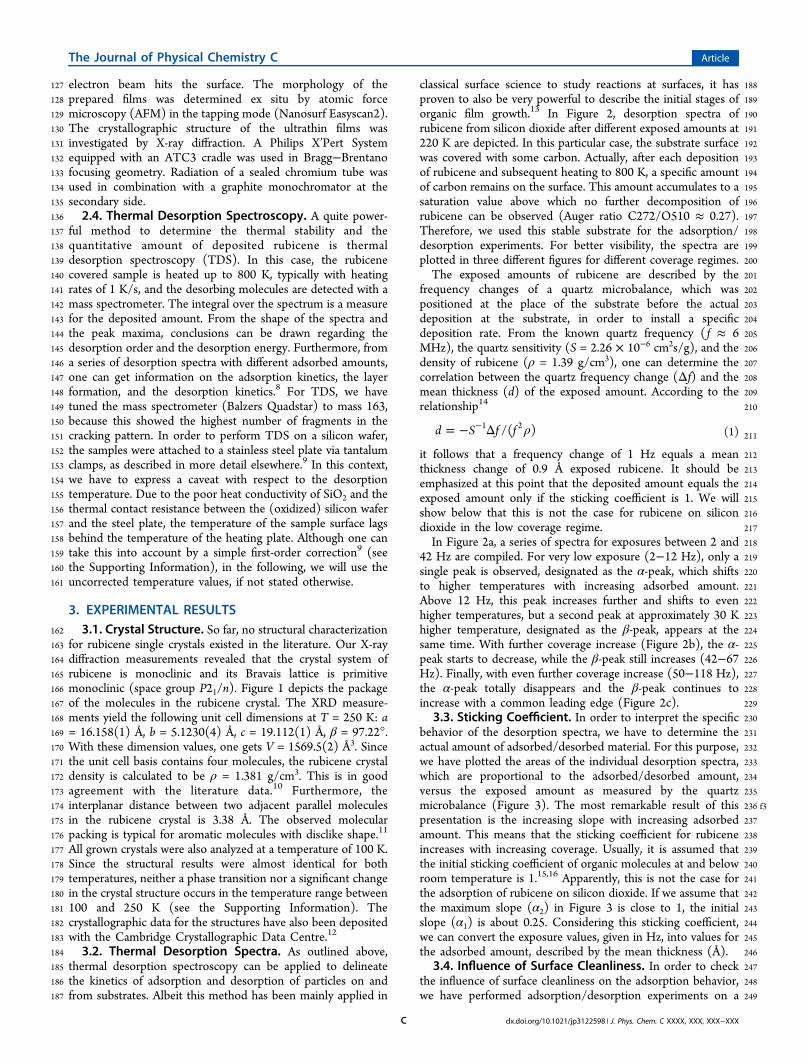
212it follows that a frequency change of 1 Hz equals a mean213thickness change of 0.9 Å exposed rubicene. It should be214emphasized at this point that the deposited amount equals the215exposed amount only if the sticking coefficient is 1. We will216show below that this is not the case for rubicene on silicon217dioxide in the low coverage regime.218In Figure 2a, a series of spectra for exposures between 2 and21942 Hz are compiled. For very low exposure (2−12 Hz), only a220single peak is observed, designated as the α-peak, which shifts221to higher temperatures with increasing adsorbed amount.222Above 12 Hz, this peak increases further and shifts to even223higher temperatures, but a second peak at approximately 30 K224higher temperature, designated as the β-peak, appears at the225same time. With further coverage increase (Figure 2b), the α-226peak starts to decrease, while the β-peak still increases (42−67227Hz). Finally, with even further coverage increase (50−118 Hz),228the α-peak totally disappears and the β-peak continues to229increase with a common leading edge (Figure 2c).2303.3. Sticking Coefficient. In order to interpret the specific231behavior of the desorption spectra, we have to determine the232actual amount of adsorbed/desorbed material. For this purpose,233we have plotted the areas of the individual desorption spectra,234which are proportional to the adsorbed/desorbed amount,235versus the exposed amount as measured by the quartz236 f3microbalance (Figure 3). The most remarkable result of this237presentation is the increasing slope with increasing adsorbed238amount. This means that the sticking coefficient for rubicene239increases with increasing coverage. Usually, it is assumed that240the initial sticking coefficient of organic molecules at and below241room temperature is 1.15,16 Apparently, this is not the case for242the adsorption of rubicene on silicon dioxide. If we assume that243the maximum slope (α2) in Figure 3 is close to 1, the initial244slope (α1) is about 0.25. Considering this sticking coefficient,245we can convert the exposure values, given in Hz, into values for246the adsorbed amount, described by the mean thickness (Å).2473.4. Influence of Surface Cleanliness. In order to check248the influence of surface cleanliness on the adsorption behavior,249we have performed adsorption/desorption experiments on a
The Journal of Physical Chemistry C Article
dx.doi.org/10.1021/jp3122598 | J. Phys. Chem. C XXXX, XXX, XXX−XXXC
250 silicon dioxide surface which was cleaned by argon sputtering251 before each rubicene deposition. A set of thermal desorption252 spectra is shown in the Supporting Information (Figure SI-7).253 The result is similar to that on the carbon contaminated254 substrate. First, a single peak (α) at low temperature appears255 until at about 14 Hz a second peak (β) at higher temperatures256 starts to grow. The α-peak grows further to about double257 intensity, before it starts to decrease and finally disappears258 completely, whereas the β-peak continues to grow with259 exposure. The corresponding relationship between exposure260 and adsorbed amount is depicted in Figure SI-8 of the261 Supporting Information. Again, the slope of the coverage curve262 increases with increasing coverage. Assuming a slope of 1 in the263 high coverage regime yields an initial slope (initial sticking264 coefficient) of about 0.17. This is within the experimental error265 similar to that on the carbon covered substrate.266 3.5. Heat of Evaporation. The desorption spectra for high267 rubicene coverage (Figure 2c) show close to zero-order268 desorption kinetics. From such spectra, one can deduce the269 desorption energy, equivalent to the heat of evaporation.270 Unfortunately, as outlined above, the exact temperature of the271 substrate surface is not known, due to poor heat conductivity272 between the oxidized silicon wafer and the stainless steel273 heating plate. In order to obtain a reliable value for the heat of274 evaporation, we have adsorbed/desorbed rubicene directly on/275 from the steel plate sample holder, where the temperature is276 measured with the thermocouple. A corresponding desorption277 spectrum for an exposure of 100 Hz shows a peak maximum at278 about 390 K (see the Supporting Information, Figure SI-10). A279 comparison with Figure 2 clearly shows the temperature lag of280 desorption from the silicon dioxide surface. However, one can281 observe in those spectra a small peak at around 400 K, which282 stems from desorption from the tantalum foils, which are used283 to clamp the silicon wafer to the steel plate sample holder.284 Thus, a first-order temperature correction can be applied which285 allows the determination of the desorption energy for286 monolayer and multilayer desorption (see the Supporting287 Information).288 The desorption rate Rdes for zero-order (multilayer)289 desorption and first-order (monolayer) desorption can be290 described by the Polanyi−Wigner equation:17
ν= ·Θ · −⎜ ⎟⎛⎝
⎞⎠R N
EkT
expndes ML
des
291(2)
292with ν being the frequency factor, Θ the coverage, n the293desorption order, and NML the number of molecules in the294monolayer. Hence, plotting the logarithm of the desorption rate295Rdes (QMS signal) versus 1/T should yield a straight line with a296slope equivalent to (Edes/k). For multilayer desorption, where297the molecule density in the (001) plane of rubicene is 2.4 ×2981014 molecules/cm2, the calculation yields a desorption energy299of 1.47 ± 0.05 eV. Furthermore, from the intercept with the Y-300axis, we obtain a frequency factor of ν = 3 × 10¹⁸ s−1. We have301also performed independent measurements of the heat of302evaporation by determining the evaporation rate from our303Knudsen cell, measured by the microbalance, as a function of304the cell temperature. The evaluation of these data yields a heat305of evaporation of 1.49 ± 0.05 eV, in good agreement with the306multilayer desorption energy (see the Supporting Information,307Figure SI-9).308By using the same temperature correction, one can also309evaluate the desorption spectra in the monolayer regime, by310assuming first-order desorption. In this case, ln(Rdes/Θ) has to311be plotted versus 1/T. With a molecule density of 8.9 × 10¹³
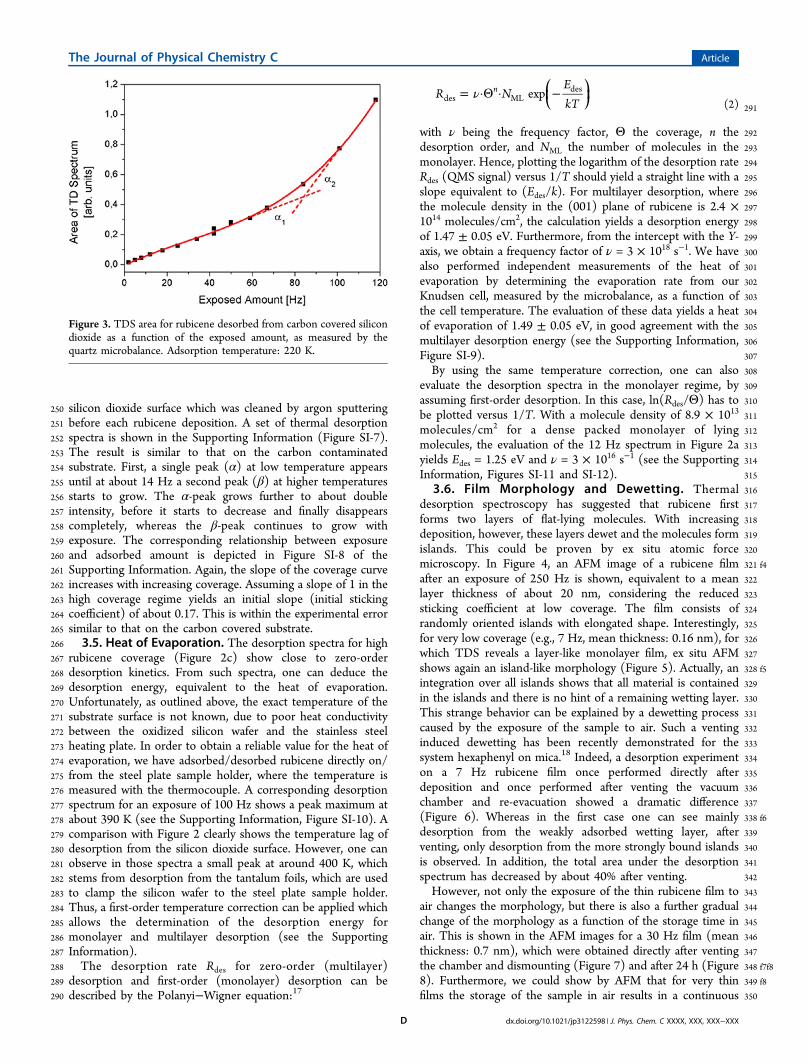
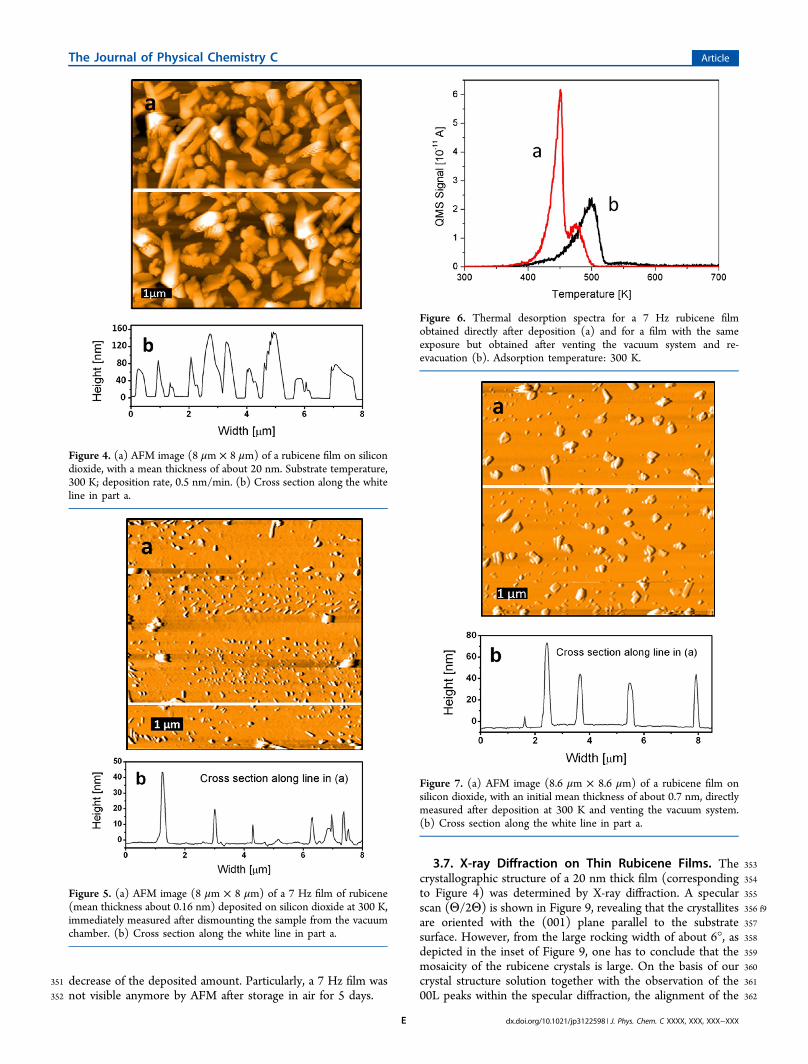
312molecules/cm2 for a dense packed monolayer of lying313molecules, the evaluation of the 12 Hz spectrum in Figure 2a314yields Edes = 1.25 eV and ν = 3 × 10¹⁶ s−1 (see the Supporting315Information, Figures SI-11 and SI-12).3163.6. Film Morphology and Dewetting. Thermal317desorption spectroscopy has suggested that rubicene first318forms two layers of flat-lying molecules. With increasing319deposition, however, these layers dewet and the molecules form320islands. This could be proven by ex situ atomic force321 f4microscopy. In Figure 4, an AFM image of a rubicene film322after an exposure of 250 Hz is shown, equivalent to a mean323layer thickness of about 20 nm, considering the reduced324sticking coefficient at low coverage. The film consists of325randomly oriented islands with elongated shape. Interestingly,326for very low coverage (e.g., 7 Hz, mean thickness: 0.16 nm), for327which TDS reveals a layer-like monolayer film, ex situ AFM328 f5shows again an island-like morphology (Figure 5). Actually, an329integration over all islands shows that all material is contained330in the islands and there is no hint of a remaining wetting layer.331This strange behavior can be explained by a dewetting process332caused by the exposure of the sample to air. Such a venting333induced dewetting has been recently demonstrated for the334system hexaphenyl on mica.18 Indeed, a desorption experiment335on a 7 Hz rubicene film once performed directly after336deposition and once performed after venting the vacuum337chamber and re-evacuation showed a dramatic difference338 f6(Figure 6). Whereas in the first case one can see mainly339desorption from the weakly adsorbed wetting layer, after340venting, only desorption from the more strongly bound islands341is observed. In addition, the total area under the desorption342spectrum has decreased by about 40% after venting.343However, not only the exposure of the thin rubicene film to344air changes the morphology, but there is also a further gradual345change of the morphology as a function of the storage time in346air. This is shown in the AFM images for a 30 Hz film (mean347thickness: 0.7 nm), which were obtained directly after venting348 f7f8the chamber and dismounting (Figure 7) and after 24 h (Figure349 f88). Furthermore, we could show by AFM that for very thin350films the storage of the sample in air results in a continuous
Figure 3. TDS area for rubicene desorbed from carbon covered silicondioxide as a function of the exposed amount, as measured by thequartz microbalance. Adsorption temperature: 220 K.
The Journal of Physical Chemistry C Article
dx.doi.org/10.1021/jp3122598 | J. Phys. Chem. C XXXX, XXX, XXX−XXXD
351 decrease of the deposited amount. Particularly, a 7 Hz film was352 not visible anymore by AFM after storage in air for 5 days.
3533.7. X-ray Diffraction on Thin Rubicene Films. The354crystallographic structure of a 20 nm thick film (corresponding355to Figure 4) was determined by X-ray diffraction. A specular356 f9scan (Θ/2Θ) is shown in Figure 9, revealing that the crystallites357are oriented with the (001) plane parallel to the substrate358surface. However, from the large rocking width of about 6°, as359depicted in the inset of Figure 9, one has to conclude that the360mosaicity of the rubicene crystals is large. On the basis of our361crystal structure solution together with the observation of the36200L peaks within the specular diffraction, the alignment of the
Figure 4. (a) AFM image (8 μm × 8 μm) of a rubicene film on silicondioxide, with a mean thickness of about 20 nm. Substrate temperature,300 K; deposition rate, 0.5 nm/min. (b) Cross section along the whiteline in part a.
Figure 5. (a) AFM image (8 μm × 8 μm) of a 7 Hz film of rubicene(mean thickness about 0.16 nm) deposited on silicon dioxide at 300 K,immediately measured after dismounting the sample from the vacuumchamber. (b) Cross section along the white line in part a.
Figure 6. Thermal desorption spectra for a 7 Hz rubicene filmobtained directly after deposition (a) and for a film with the sameexposure but obtained after venting the vacuum system and re-evacuation (b). Adsorption temperature: 300 K.
Figure 7. (a) AFM image (8.6 μm × 8.6 μm) of a rubicene film onsilicon dioxide, with an initial mean thickness of about 0.7 nm, directlymeasured after deposition at 300 K and venting the vacuum system.(b) Cross section along the white line in part a.
The Journal of Physical Chemistry C Article
dx.doi.org/10.1021/jp3122598 | J. Phys. Chem. C XXXX, XXX, XXX−XXXE
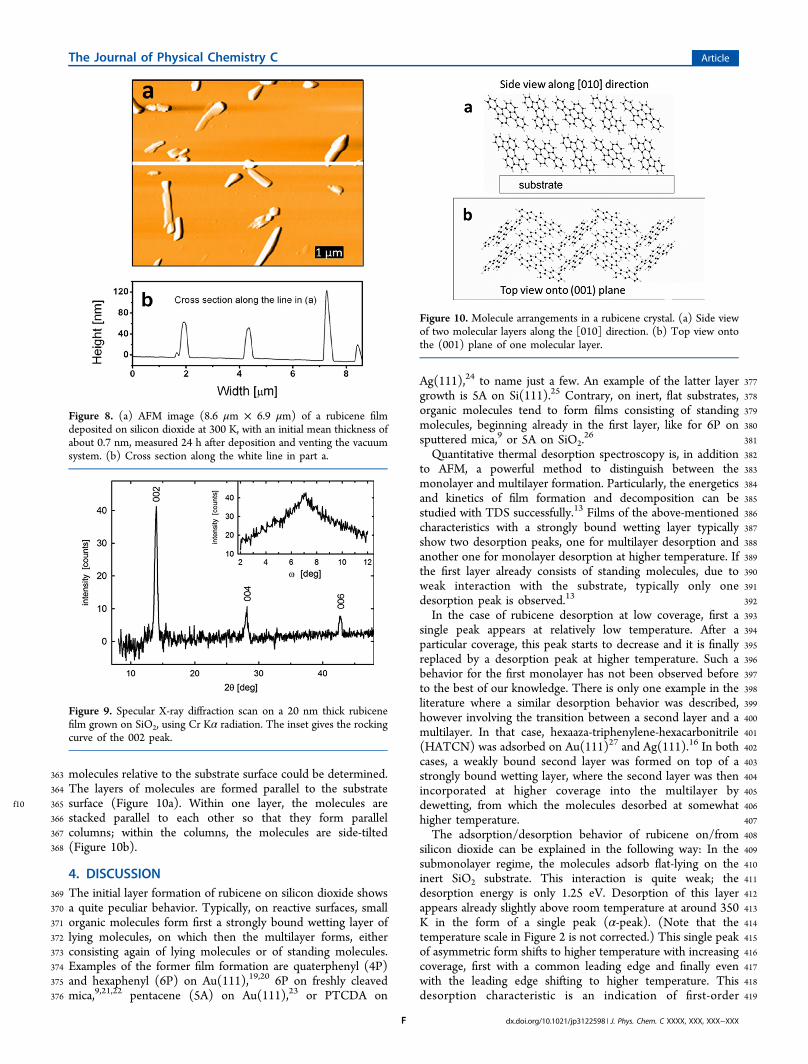
363 molecules relative to the substrate surface could be determined.364 The layers of molecules are formed parallel to the substrate
f10 365 surface (Figure 10a). Within one layer, the molecules are366 stacked parallel to each other so that they form parallel367 columns; within the columns, the molecules are side-tilted368 (Figure 10b).
4. DISCUSSION369 The initial layer formation of rubicene on silicon dioxide shows370 a quite peculiar behavior. Typically, on reactive surfaces, small371 organic molecules form first a strongly bound wetting layer of372 lying molecules, on which then the multilayer forms, either373 consisting again of lying molecules or of standing molecules.374 Examples of the former film formation are quaterphenyl (4P)375 and hexaphenyl (6P) on Au(111),19,20 6P on freshly cleaved376 mica,9,21,22 pentacene (5A) on Au(111),23 or PTCDA on
377Ag(111),24 to name just a few. An example of the latter layer378growth is 5A on Si(111).25 Contrary, on inert, flat substrates,379organic molecules tend to form films consisting of standing380molecules, beginning already in the first layer, like for 6P on381sputtered mica,9 or 5A on SiO2.
26
382Quantitative thermal desorption spectroscopy is, in addition383to AFM, a powerful method to distinguish between the384monolayer and multilayer formation. Particularly, the energetics385and kinetics of film formation and decomposition can be386studied with TDS successfully.13 Films of the above-mentioned387characteristics with a strongly bound wetting layer typically388show two desorption peaks, one for multilayer desorption and389another one for monolayer desorption at higher temperature. If390the first layer already consists of standing molecules, due to391weak interaction with the substrate, typically only one392desorption peak is observed.13
393In the case of rubicene desorption at low coverage, first a394single peak appears at relatively low temperature. After a395particular coverage, this peak starts to decrease and it is finally396replaced by a desorption peak at higher temperature. Such a397behavior for the first monolayer has not been observed before398to the best of our knowledge. There is only one example in the399literature where a similar desorption behavior was described,400however involving the transition between a second layer and a401multilayer. In that case, hexaaza-triphenylene-hexacarbonitrile402(HATCN) was adsorbed on Au(111)27 and Ag(111).16 In both403cases, a weakly bound second layer was formed on top of a404strongly bound wetting layer, where the second layer was then405incorporated at higher coverage into the multilayer by406dewetting, from which the molecules desorbed at somewhat407higher temperature.408The adsorption/desorption behavior of rubicene on/from409silicon dioxide can be explained in the following way: In the410submonolayer regime, the molecules adsorb flat-lying on the411inert SiO2 substrate. This interaction is quite weak; the412desorption energy is only 1.25 eV. Desorption of this layer413appears already slightly above room temperature at around 350414K in the form of a single peak (α-peak). (Note that the415temperature scale in Figure 2 is not corrected.) This single peak416of asymmetric form shifts to higher temperature with increasing417coverage, first with a common leading edge and finally even418with the leading edge shifting to higher temperature. This419desorption characteristic is an indication of first-order
Figure 8. (a) AFM image (8.6 μm × 6.9 μm) of a rubicene filmdeposited on silicon dioxide at 300 K, with an initial mean thickness ofabout 0.7 nm, measured 24 h after deposition and venting the vacuumsystem. (b) Cross section along the white line in part a.
Figure 9. Specular X-ray diffraction scan on a 20 nm thick rubicenefilm grown on SiO2, using Cr Kα radiation. The inset gives the rockingcurve of the 002 peak.
Figure 10. Molecule arrangements in a rubicene crystal. (a) Side viewof two molecular layers along the [010] direction. (b) Top view ontothe (001) plane of one molecular layer.
The Journal of Physical Chemistry C Article
dx.doi.org/10.1021/jp3122598 | J. Phys. Chem. C XXXX, XXX, XXX−XXXF
420 desorption kinetics with attractive interactions between the421 molecules.8 Desorption proceeds in the form of a single peak422 up to an exposure of 12−15 Hz. According to the calibration of423 the quartz microbalance and the experimentally obtained initial424 sticking coefficient of about 0.25, the saturation of this single425 peak can be attributed to a coverage of about 0.3 nm mean426 thickness. This is evidence for a closed monolayer of flat-lying427 molecules. The van der Waals thickness of aromatic molecules428 is about 3.5 Å.28
429 With further exposure, a second desorption peak (β-peak)430 appears, shifted by about 30 K to higher temperature. At the431 same time, the α-peak keeps on growing until it reaches432 saturation at a coverage equivalent to a double layer of lying433 molecules. The β-peak continually grows with increasing434 exposure, indicating desorption from a multilayer, while the435 α-peak decreases until it eventually totally disappears above an436 exposure of about 80 Hz. This is equivalent to a mean film437 thickness of 1.8 nm. We can interpret this behavior as follows:438 After saturation of the first monolayer, further impinging439 molecules adsorb in the second layer again flat on. However,440 this double layer is already metastable. Further adsorption on441 this double layer results in an unstable film and the molecules442 restructure from a flat-lying double layer to a standing443 arrangement, which is apparently energetically more favorable.444 Actually, the formation of a closed double layer before the445 formation of islands starts on this layer is not so uncommon. A446 few examples of such a layer growth are PTCDA on Ag(111),24
447 HATCN on Au(111),27 and sexiphenyl on Cu(110)(2 ×448 1)O.29
449 The key point in the rubicene−SiO2 system is that the450 binding energy of the molecules to the substrate (1.25 eV) is451 weaker than the binding energy between rubicene molecules in452 the bulk phase, which was calculated to be 1.47 eV. However,453 the diffusion probability of the flat-lying molecules in the454 submonolayer phase is not high enough to restructure the layer455 into 3D islands during heating, from where the molecules then456 would desorb at higher temperature. This latter behavior has457 been observed for 6P on sputtered mica.18 Nevertheless, for458 higher coverage, the tendency of dewetting in the system459 rubicene−SiO2 is so high that the growth of smooth, thick films460 is very unlikely (see Figure 4).461 The formation of a full monolayer of flat-lying molecules is462 only possible during growth in UHV. Exposure of a 7 Hz layer463 to air again results in a strong dewetting, as shown by AFM464 (Figure 5). This was also verified by TDS, performed before465 and after venting with subsequent re-evacuation (Figure 6).466 While before venting the desorption peak is at around 450 K467 (uncorrected), indicative of weakly bound molecules to the468 substrate, the desorption peak has shifted to 500 K after469 venting, indicative of desorption from 3D islands. Furthermore,470 the peak area after venting was reduced by about 40%,471 demonstrating the partial desorption during venting. A venting472 induced subsequent nucleation has been recently observed for473 the system 6P-mica.18 It was assumed that upon venting water474 adsorbs on the sample surface and diffuses between film and475 substrate, thus increasing the diffusion probability and/or476 decreasing the activation energy for nucleation. Such venting477 induced subsequent nucleation processes are in particular478 pronounced for very thin films. This should be taken into479 account whenever AFM images of such films are interpreted.480 The quite weak bonding to the substrate (1.25 eV) and the481 rather low heat of evaporation of 1.47 eV, as obtained from482 TDS, has further consequences for the deposited rubicene film
483on SiO2 when stored in air. A comparison of the morphology of484a 30 Hz film (0.7 nm mean thickness) measured with AFM485immediately after exposure to air (Figure 7a) and after 24 h486(Figure 8a) shows significant differences. The film is composed487of many small islands immediately after venting, with the largest488islands having dimensions of about 300 nm in diameter and489heights of about 50 nm (Figure 7b). After storage in air for 24490h, only few, large rectangular shaped islands are visible, with491heights up to 120 nm (Figure 8b). This phenomenon is known492as Ostwald ripening.30 It is again an indication of the weak493bonding of the rubicene molecules at the rims of the 3D494islands, leading to a quite dense 2D gas phase of rubicene495monomers and hence to the growth of large islands at the496expense of the small islands, according to the Gibbs−497Thompson relation.30 The process of Ostwald ripening and498the partial evaporation of the film are relatively more499pronounced on very thin films. A clear reduction of the island500size after 30 days in air has been observed for the 0.7 nm thick501film. Actually, on the 7 Hz film (mean thickness 0.16 nm,502Figure 5), no rubicene material whatsoever could be detected503on the silicon dioxide after several days in air. Similar504morphological changes of organic layers under ambient505conditions have recently been observed also for naphthyl506end-capped thiophenes deposited on mica.31
507The morphology of thick films (20 nm mean thickness,508Figure 4) shows the existence of randomly oriented crystallites.509With X-ray diffraction, we could identify that the structure of510the small crystallites is identical to the bulk structure and that511the crystallites are oriented with the (001) plane parallel to the512substrate (Figure 9). The arrangement of the rubicene513molecules within the bulk crystal in two different views is514shown in Figure 10. Rocking curve measurements (inset in515Figure 9) on this film revealed a quite high fwhm of about 6°,516indicating that the mosaicity of the film is rather large,517significantly larger than for other organic films of rodlike518molecules, like pentacene.32
519Next, we would like to comment on some unusual features520concerning the adsorption and desorption kinetics. The initial521sticking coefficient of sufficiently large organic molecules is522typically assumed to be 1 at and below room temperature.15,16
523However, in this work, we could clearly demonstrate that the524sticking coefficient increases with increasing coverage, which525excludes an initial sticking coefficient of 1 for rubicene on SiO2.526Unfortunately, there exists little quantitative experimental and527theoretical work in the literature on this subject, since all-atom528molecular dynamics (MD) calculations of the adsorption529dynamics of larger molecules are quite expensive. We are530only aware of one theoretical work where the trapping531dynamics of diindenoperylene (DIP) molecules on self-532assembled monolayers (SAMs) have been studied, using MD533simulations with MM3.33 In that work, the authors showed that534the sticking coefficient depends on several parameters, e.g., on535the incidence energy, the angle of incidence, the molecule536orientation and the packing density of the SAM. Actually, these537phenomena are well-known for the adsorption of small538molecules on rigid substrates, both for associative (e.g., CO)539and dissociative adsorption (e.g., H2), for which a wealth of540experimental and theoretical data is available.34−36 Having these541findings in mind, we can at least speculate as to the reason of542the rather low initial sticking coefficient for rubicene on silicon543dioxide of about 0.2 (0.25 on the C-covered surface, 0.17 on544the clean surface). The fundamental question is whether545sufficient energy can be transferred to the substrate for
The Journal of Physical Chemistry C Article
dx.doi.org/10.1021/jp3122598 | J. Phys. Chem. C XXXX, XXX, XXX−XXXG
546 accommodation within the interaction time. It was shown for547 the small molecule CO that the initial sticking coefficient on a548 variety of metal substrates decreases with increasing kinetic549 energy. Furthermore, the sticking coefficient decreases with550 decreasing adsorption energy.37 This can be understood from551 simple classical arguments. The molecules have to transfer552 sufficient kinetic energy during the interaction with the surface553 to become trapped. The adsorption energy for the rubicene554 molecule (C26H14) on SiO2 is 1.25 eV, which means that the555 binding energy per C atom is just about 50 meV. Thus, it is not556 implausible that the initial sticking coefficient is not 1. Another557 aspect is the orientation of the molecules in front of the surface558 during interaction with the surface. The influence of rotational559 energy on sticking has been shown by Batista et al.38 for H2O560 on ice and by Gardner et al.39 for CO on ice substrates. It can561 be anticipated that the orientation effect will be even more562 pronounced for larger rigid molecules. Furthermore, the proper563 mass matching will be relevant for effective accommodation.564 This was shown, e.g., by McMaster et al.40 for propane on565 platinum substrates. The authors explained the increase of the566 sticking coefficient with coverage by the better mass matching567 and a greater deformability of the adlayer. Finally, precursor568 mediated adsorption should be taken into account.41 In this569 scenario, the molecule is first trapped in a weakly bound state570 where it can still move along the surface until final571 accommodation, or desorb again during the residence time in572 the precursor state. The interaction with islands and other573 imperfections on the surface will increase the accommodation,574 which again will lead to an increase of the sticking coefficient575 with coverage.576 Finally, some comments to the desorption behavior of577 rubicene from SiO2. From the desorption spectra, one cannot578 only determine the desorption energy but also the frequency579 factor for desorption, according to eq 2. In particular, the580 frequency factor contains information on the kinetics of581 desorption. For atoms and small molecules, the frequency582 factor can be correlated with the attempt frequency for583 desorption, which is in the order of 1013 s−1. However,584 according to transition state theory,42 the pre-exponential factor585 contains the ratio of the partition functions of the molecules in586 the gaseous phase and the adsorbed phase. Due to the many587 rotational and vibrational degrees of freedom in the gas phase,588 the pre-exponential factor for large organic molecules is by589 orders of magnitudes larger than 1013 s−1.13 In our particular590 case, we determine a frequency factor for the first-order591 desorption of the (sub)-monolayer phase of ν1 ≈ 1016 s−1 and592 for the zero-order desorption from the multilayer phase ν0 ≈593 1018 s−1. The lower frequency factor for the monolayer594 desorption might imply that the molecules in the (sub)-595 monolayer are more mobile than in the bulk phase prior to596 desorption.43,44
5. SUMMARY AND CONCLUSIONS597 The initial film formation of rubicene molecules on silicon598 dioxide exhibits a quite unusual behavior. First, a monolayer of599 flat-lying molecules is formed, followed by a second layer of600 flat-lying molecules. The desorption energy of these molecules601 is 1.25 eV. Deposition of further rubicene leads to a602 destabilization of this bilayer and to dewetting by the formation603 of 3D islands. The crystallographic structure of these islands is604 bulk-like, with the (001) plane being parallel to the substrate.605 This leads to an arrangement of upright standing but tilted606 molecules. The desorption energy for the molecules in the 3D
607islands (heat of evaporation) is larger than that for the flat-lying608molecules in the wetting layer, namely, 1.47 eV. This is the609reason for the strong tendency of dewetting.610Dewetting of the bilayer can also be induced by exposing611such a layer to air. This has been shown by thermal desorption612spectroscopy and atomic force microscopy. Furthermore, for613the island-like film under ambient conditions, Ostwald ripening614was observed, leading to films composed of few, large615crystalline islands. In the case of very thin films, most of the616material in the small islands even disappeared by evaporation617within several days at room temperature.618A further peculiarity of the adsorption system rubicene/SiO2619is related to the sticking coefficient. Contrary to common620wisdom, the initial sticking coefficient is not 1, even at a621substrate temperature of 220 K. We measured an initial sticking622coefficient of only 0.2 ± 0.05, depending on the substrate623conditions. This low value can be related to the relatively weak624interaction energy between the molecules and the substrate.625However, other reasons connected with the adsorption626dynamics can also play a role, e.g., orientational hindering,627insufficient energy accommodation due to mass mismatch, or628precursor mediated adsorption. This can be inferred from the629fact that with increasing coverage the sticking coefficient630increases, and probably approaches 1 for thicker films.631Adsorption and desorption of rubicene on SiO2 is only632weakly depending on the substrate chemical composition.633Accumulation of carbon on the surface, due to some634dissociation of rubicene during sample heating, does not635significantly influence the shape of the desorption spectra nor636the coverage dependence of the sticking coefficient. The reason637for this is again the already weak interaction energy between638rubicene and silicon dioxide, which is not further decreased by639contaminations significantly.
640■ ASSOCIATED CONTENT641*S Supporting Information642Rubicene purification, crystal growth from solution, IR and643optical spectroscopy, single crystal characterization with X-ray644diffraction, thermal desorption from clean silicon dioxide, and645determination of the desorption energy. This material is646available free of charge via the Internet at http://pubs.acs.org.
647■ AUTHOR INFORMATION648Corresponding Author649*E-mail: [email protected]. Phone: ++43 316 873 8463.650Author Contributions651The manuscript was written through contributions of all652authors. All authors have given approval to the final version of653the manuscript.654Notes655The authors declare no competing financial interest.
656■ ACKNOWLEDGMENTS657This work was financially supported by the Austrian Science658Fund FWF, Proj. No. P 23530. We would like to acknowledge659the group of Peter Wilhelm at the FELMI-ZFE for performing660the FTIR microscopy measurements on the rubicene single661crystals.
662■ REFERENCES(1) 663Katz, H.-E.; Huang, J. Thin-Film Organic Electronic Devices.
664Annu. Rev. Mater. Res. 2009, 39, 71−92.
The Journal of Physical Chemistry C Article
dx.doi.org/10.1021/jp3122598 | J. Phys. Chem. C XXXX, XXX, XXX−XXXH
(2)665 Kranzelbinder, G.; Leising, G. Organic Solid State Lasers. Rep.666 Prog. Phys. 2000, 63, 729−762.
(3)667 Kalyani, N. T.; Dhoble, S. J. Organic Light Emitting Diodes:668 Energy Saving Lightening Technology-A Review. Renewable Sustain-669 able Energy Rev. 2012, 16, 2696−2723.
(4)670 Mahns, B.; Roth, F.; Konig, A.; Grobosch, M.; Knupfer, M.;671 Hahn, T. Phys. Rev. B 2012, 86, 035209.
(5)672 Bruker, APEX2 Software Suite (version 2.0-2); Bruker AXS Inc.:673 Madison, WI, 2005.
(6)674 Sheldrick, G. M. A Short History of SHELX. Acta Crystallogr.,675 Sect. A 2008, A64, 112−122.
(7)676 Sheldrick, G. M. SADABS, version 2.10; Siemens Area Detector677 Correction; Universitat Gottingen, Germany, 2003.
(8)678 Masel, R. I. Principles of Adsorption and Reaction on Solid Surfaces;679 John Wiley & Sons, Inc.: New York, 1996.
(9)680 Frank, P.; Hlawacek, G.; Lengyel, O.; Satka, A.; Teichert, C.;681 Resel, R.; Winkler, A. Influence of Surface Temperature and Surface682 Modifications on the Initial Layer Growth of Para-Hexaphenyl on683 Mica(001). Surf. Sci. 2007, 601, 2152−2160.
(10)684 http://www.chemspider.com/Chemical-Structure.60779.html(11)685 Desiraju, G. R.; Gavezzotti, A. Crystal Structures of Polynuclear
686 Aromatic-Hydrocarbons-Classification, Rationalization and Prediction687 from Molecular-Structure. Acta Crystallogr., Sect. B 1989, 45, 473−482.
(12)688 Cambridge Crystallographic Data Centre, 12 Union Road,689 Cambridge CB2 1EZ, U.K.; Supplementary publication no. CCDC690 913540 (rubicene, 100 K) and CCDC 913541 (rubicene, 250 K).
(13)691 Winkler, A. Thermal Desorption of Organic Molecules. Springer692 Proc. Phys. 2009, 129, 29−36.
(14)693 Sauerbrey, G. Verwendung von Schwingquarzen zur Wagung694 Dunner Schichten und zur Mikrowagung. Z. Phys. 1959, 155, 206−695 222.
(15)696 Mullegger, S.; Stranik, O.; Zojer, E.; Winkler, A. Adsorption,697 Initial Growth and Desorption Kinetics of p-Quaterphenyl on698 Polycrystalline Gold Surfaces. Appl. Surf. Sci. 2004, 221, 184−196.
(16)699 Frank, P.; Djuric, T.; Koini, M.; Salzmann, I.; Rieger, R.; Mullen,700 K.; Resel, R.; Koch, N.; Winkler, A. Layer Growth, Thermal Stability,701 and Desorption Behavior of Hexaaza-triphenylene-hexacarbonitrile on702 Ag(111). J. Phys. Chem. C 2010, 114, 6650−6657.
(17)703 Redhead, P. A. Thermal Desorption of Gases. Vacuum 1962, 12,704 203−211.
(18)705 Tumbek, L.; Gleichweit, C.; Zojer, K.; Winkler, A. Origin of the706 Bimodal Island Size Distribution in Ultrathin Films of Para-707 Hexaphenyl on Mica. Phys. Rev. B 2012, 86, 085402.
(19)708 Mullegger, S.; Salzmann, I.; Resel, R.; Winkler, A. Epitaxial709 Growth of Quaterphenyl Thin Films on Gold(111). Appl. Phys. Lett.710 2003, 83, 4536−4538.
(20)711 Haber, T.; Mullegger, S.; Winkler, A.; Resel, R. Temperature-712 Induced Epitaxial Growth Modes of Para-Sexiphenyl on Au(111).713 Phys. Rev. B 2006, 74, 045419.
(21)714 Andreev, A.; Matt, G.; Brabec, C. J.; Sitter, H.; Badt, D.;715 Seyringer, H.; Sariciftci, N. S. Highly Anisotropic Self-Assembled716 Structures of Para-Sexiphenyl Grown by Hot-Wall Epitaxy. Adv. Mater.717 2000, 12, 629−633.
(22)718 Balzer, F.; Rubahn, H.-G. Dipole-Assisted Self-Assembly of719 Light-Emitting p-nP Needles on Mica. Appl. Phys. Lett. 2001, 79,720 3860−3862.
(23)721 France, C. B.; Schroeder, P. G.; Forsythe, J. C.; Parkinson, B. A.722 Scanning Tunneling Microscopy Study of the Coverage-Dependent723 Structure of Pentacene on Au(111). Langmuir 2003, 19, 1274−1281.
(24)724 Kilian, L.; Umbach, E.; Sokolowski, M. Molecular Beam Epitaxy725 of Organic Films Investigated by High Resolution Low Energy726 Diffraction (SPA-LEED): 3,4,9,10-Perylenetetracarboxylic −Dianhy-727 dride (PTCDA) on Ag(111). Surf. Sci. 2004, 573, 359−378.
(25)728 Kury, P.; Roos, K. R.; Thien, D.; Mollenbeck, S.; Wall, D.;729 Horn-von Hoegen, M. Meyer zu Heringdorf, F.-J. Disorder-Mediated730 Ordering by Self-Interfactant Effect in Organic Thin Film Growth of731 Pentacene on Silicon. Org. Electron. 2008, 9, 461−465.
(26)732 Ruiz, R.; Choudhary, D.; Nickel, B.; Toccoli, T.; Chang, K. C;733 Mayer, A. C.; Clancy, P.; Blakely, J. M.; Headrick, R. L.; Iannotta, S.;
734et al. Pentacene Thin Film Growth. Chem. Mater. 2004, 16, 4497−7354508.
(27) 736Frank, P.; Koch, N.; Koini, M.; Rieger, R.; Mullen, K.; Resel, R.;737Winkler, A. Layer Growth and Desorption Kinetics of a Discoid738Acceptor on Au(111). Chem. Phys. Lett. 2009, 473, 321−325.
(28) 739Bondi, A. Van der Waals Volumes+Radii. J. Phys. Chem. 1964,74068, 441−451.
(29) 741Fleming, A. J.; Netzer, F. P.; Ramsey, M. G. Nucleation and 3-D742Growth of Para-Sexiphenyl Nanostructures from an Oriented 2D743Liquid Layer Investigated by Photoemission Electron Microscopy. J.744Phys.: Condens. Matter 2009, 21, 445003.
(30) 745Ratke, L.; Voorhees, P. W. Growth and coarsening: Ostwald746ripening in material processes; Springer-Verlag: Berlin, Heidelberg, New747York, 2002.
(31) 748Balzer, F.; Schiek, M.; Wallmann, I.; Schafer, A.; Lutzen, A.;749Rubahn, H.-G. Stability of Organic Nanowires. Proc. SPIE, Nano-750photonic Materials VIII 2011, 8094, 809409.
(32) 751Nickel, B.; Barabash, R.; Ruiz, R.; Koch, N.; Kahn, A.; Feldman,752L. C.; Haglund, R. F.; Scoles, G. Dislocation Arrangements in753Pentacene Thin Films. Phys. Rev. B 2004, 70, 125401.
(33) 754Kaushik, A. P.; Clancy, P. Trapping Dynamics of Diindenoper-755ylene (DIP) in Self-Assembled Monolayers Using Molecular756Simulation. Surf. Sci. 2011, 605, 1185−1196.
(34) 757Rendulic, K. D.; Winkler, A. Adsorption and Desorption758Dynamics as Seen Through Molecular Beam Techniques. Surf. Sci.7591994, 299−300, 261−276.
(35) 760Matsushima, T.; Shobatake, K. Surface Reaction Dynamics and761Energy Partitioning. J. Mol. Catal. A: Chem. 2010, 315, 135−147.
(36) 762Tully, J. C. Chemical Dynamics at Metal Surfaces. Annu. Rev.763Phys. Chem. 2000, 51, 153−178.
(37) 764Kneitz, S.; Gemeinhardt, J.; Steinruck, H.-P. A Molecular Beam765Study of the Adsorption Dynamics of CO on Ru(0111), Cu(111) and766a Pseudomorphic Cu Monolayer on Ru(0001). Surf. Sci. 1999, 440,767307−320.
(38) 768Batista, E. R.; Ayotte, P.; Bilic, A.; Kay, B. D.; Jonsson, H. What769Determines the Sticking Probability of Water Molecules on Ice? Phys.770Rev. Lett. 2005, 95, 223201.
(39) 771Gardner, D. O. N.; Al-Halabi, A.; Kroes, G.-J. The Effect of772Initial Rotational Energy on the Adsorption of CO on the (0001) Face773of Crystalline Ice-I-h at Hyperthermal Energies. J. Phys. Chem. B 2004,774108, 3540−3547.
(40) 775McMaster, M. C.; Schroeder, S. L. M.; Madix, R. J. Molecular776Propane Adsorption Dynamics on Pt(110)-(1 × 2). Surf. Sci. 1993,777297, 253−271.
(41) 778Weaver, J. F.; Carlsson, A. F.; Madix, R. J. The Adsorption and779Reaction of Low Molecular Weight Alkanes on Metallic Single Crystal780Surfaces. Surf. Sci. Rep. 2003, 50, 107−199.
(42) 781Zhdanov, V. P. Arrhenius Parameters for Rate-Processes on782Solid Surfaces. Surf. Sci. Rep. 1991, 12, 183−242.
(43) 783Paserba, K. R.; Gellman, A. J. Kinetics and Energetics of784Oligomer Desorption from Surfaces. Phys. Rev. Lett. 2001, 86, 4338−7854341.
(44) 786Fichthorn, K. A.; Miron, R. A. Thermal Desorption of Large787Molecules from Solid Surfaces. Phys. Rev. Lett. 2002, 89, 196103.
The Journal of Physical Chemistry C Article
dx.doi.org/10.1021/jp3122598 | J. Phys. Chem. C XXXX, XXX, XXX−XXXI