INIS Clearinghouse other IAEA P. 0. Box 100 ^ i l f A-1400 ...
201
Attention Microfiche User, The original document from which this microfiche was made was found to contain some imperfection or imperfections that reduce full comprehension of some of the text despite the good technical quality of the microfiche itself. The imperfections may be: - missing of illegible pages/figures - wrong pagination - poor overall printing quality, etc. We normally refuse to microfiche such a document and request a replacement document (or pages) from the National INIS Centre concerned. However, our experience shows that many months pass before such documents are replaced. Sometimes the Centre is not able to supply a better copy or, in som, cases, the pages that were supposed to be missing correspond to a wrong pagination only* We feel that it is better to proceed with distributing the microfiche made of these documents than to withhold them till the imperfections are removed. If the removals are subsequestly made then replacement microfiche can be issued. In line with this approach then, our specific practice for microfiching documents with imperfections is as follows: 1* A microfiche of an imperfect document will be marked with a special symbol (black circle) on the left of the title. This symbol will appear on all masters and copies of the document (1st fiche and trailer fiches) even if the imperfection is on one fiche of the report only. 2. If imperfection is not too general the reason will "be specified on a sheet such as this, in the space below. 3. The microfiche will be considered as temporary, but sold at the normal price. Replacements, if they can be issued, will be available for purchase at the regular price. 4. A new document will be requested from the supplying Centre. 5. If the Centre can supply the necessary pages/document a new master fiche will be made to permit production of any replace- ment microfiche that may be requested. The original document from which this microfiche has bees prepared has these imperfections: \ j missing pages/figures numbered: • I j wrong pagination I | poor overall printing quality j \ combinations of the above INIS Clearinghouse other IAEA P. 0. Box 100 ^ilf A-1400, Vienna, Austria Ort
-
Upload
khangminh22 -
Category
Documents
-
view
2 -
download
0
Transcript of INIS Clearinghouse other IAEA P. 0. Box 100 ^ i l f A-1400 ...

Attention Microfiche User,
The original document from which this microfiche was made wasfound to contain some imperfection or imperfections that reducefull comprehension of some of the text despite the good technicalquality of the microfiche itself. The imperfections may be:
- missing of illegible pages/figures- wrong pagination- poor overall printing quality, etc.
We normally refuse to microfiche such a document and request areplacement document (or pages) from the National INIS Centreconcerned. However, our experience shows that many months passbefore such documents are replaced. Sometimes the Centre is notable to supply a better copy or, in som, cases, the pages that weresupposed to be missing correspond to a wrong pagination only* Wefeel that it is better to proceed with distributing the microfichemade of these documents than to withhold them till the imperfectionsare removed. If the removals are subsequestly made then replacementmicrofiche can be issued. In line with this approach then, ourspecific practice for microfiching documents with imperfections isas follows:
1* A microfiche of an imperfect document will be marked with aspecial symbol (black circle) on the left of the title. Thissymbol will appear on all masters and copies of the document(1st fiche and trailer fiches) even if the imperfection is onone fiche of the report only.
2. If imperfection is not too general the reason will "bespecified on a sheet such as this, in the space below.
3. The microfiche will be considered as temporary, but soldat the normal price. Replacements, if they can be issued,will be available for purchase at the regular price.
4. A new document will be requested from the supplying Centre.
5. If the Centre can supply the necessary pages/document a newmaster fiche will be made to permit production of any replace-ment microfiche that may be requested.
The original document from which this microfiche has bees preparedhas these imperfections:
\ j missing pages/figures numbered: •
I j wrong pagination
I | poor overall printing quality
j \ combinations of the above
INIS Clearinghouseother IAEA
P. 0. Box 100^ i l f A-1400, Vienna, Austria
Ort

FlfeST BALKAN fc:.4 ' i .'•
ON ACTIVATI0N ANALYSIS1985
INIS-mf--11126
PROCEEDINGS, VARNA, BULGARIA, MAY 6-8, 1985
INSTITUTE OF NUCLEAR RESEARCH AND NUCLEAR ENERGYBULGARIAN ACADEMY OF SCIENCES

FIRST BALKAN CONFERENCE
ON ACTIVATION ANALYSIS
1985

The Organizing Committee gratefully acknowledges
the financial support of the following institutions:
Agricultural Academy
State Committee for Science and Technical Progress
Committee for Environmental Protection
Union of the Scientific Workers in Bulgaria
Union of Chemistry and Chemical Industry
PUBLISHED BY S O P I A P R E S S
Designer K. Krastev

P R O C E E D I N G S
VARNA, BULGARIA, MAY 6-8,1985

Chairmen of the Organizing Committee - Prof. Zh. Zhelev
Secretary - in - charge - L.Kinova

F O R E W O R D
, Almost fifty years elapsed from the first publication in the field of
activation analysis.During this period activation analysis won a wide recog-
nition. Its principal merits: the possibility of simultaneous determination
of several elements,the high sensitivity.precision and accuracy of measure-
ment, the applicability to different materials,combined with the developement
of high resolution semiconductive detectors and multichannel analysers
brought it to the state of a preferable analytical method in many' areas of
science and technology.
In the last few years NAA found a wide application in the Balkan coun-
tries with a significant contribution to the technical progress. The common
interests in this area are a good premise for collaboration in the. Region.
The purpose of the First Balkan Conference on Activation Analysis is
to give an opportunity to scientists from this area to exchange information
on the state of activation analysis in their countries as well as to create
more close contacts.The united efforts of the scientists from Balkan coun-
tries will foster the further developement of the activation analysis and,
therefore, will enhance the contribution of the atomic energy to peace,health
and prosperity in the Region.

The Proceeding includes all papers submitted to the
Organizing Committee until 1985, March, 30.

C O N T E N T S
REVIEW PAPERS
Neutron Activation Analysis in BulgariaD. A p o s t o l o v
Neutron Activation Analysis in Romania .S . A p o s t o l e s c u
Act ivat ion Analysis in GreeceA. P. G r i m a n i s
METHODS IN ACTIVATION ANALYSIS
Epithermal neutron f lux d i s t r i b u t i o n and i t s impact on ( n, jc )a c t i v a t i o n a n a l y s i s r e s u l t „ 19S. J o v a n o v i c , F . D a C o r t e , A. S i m o n i t s ,L. M o e n a , P. V u k o t i c , R. Z e j n i l o v i c , J. H o s t e
The neutron activation analysis in the study of Langmuir-Blodgettmultilayers composition - relation to othermethods of investigation 25J. G. P e t r o v , I. K u l e f f
Neutron activation analysis of semiconductor silicon 29S. A p o e t o l e a c u , A. P a n t e l i c a , M. S a l a g e a n
Determination of some t race elements in biological ma te r i a l susing the short l i v e d isotopes 32E. T a s k a e v
Se in b io logica l SRM'BI a comparison of r e su l t s obtainedby di f ferent neutron ac t iva t ion methods 35M. D e r m e l j ( A . G o s a r , M. F r a n k o, A. R. B y r n e ,L. K o s t a , P . S t e g n a r
14 MeV proton a c t i v a t i o n for pro te in analys is in c e r e a l s 37B. C o n s t a n t i n e a c u , E. I v a n o v ,D. P l o s t i n a r u , A. P o p a - N e m o i u ,G. P a s c o v i o i
Determination of iodine-129 content of the primarycoolant of nuc lear power reac tor 40I . K u l e f f , S. Z o t s c h e v , G. S t e f a n o v
Neutron ac t iva t ion ana lys i s of some high puri ty substances 44M. S a l a g e a n , A. P a n t e l i c a , C. D a n , E. A p o a t o l
14 MeV neutron a c t i v a t i o n analys is for oxygen determinationin s i l i con s i n g l e - c r y s t a l s 47D. T i m u B , V. G a l a t a n u , D. C a t a n a , N. B l e g a ,0. P o p e s c u , A . B r a d e a n u

Instrumental photoactivation analysis of some elements in steel 50V. G a l a t a n u , D. T i m u s , D. C a t a n a
Application of the INAA to the initial comparison of proectile lead ... 52D. D i m i t r o v
Determination of Al, Cl, S and V by nondestructiveactivation analysis 55
B. S m o d i s f L . K o s t a , A. R. B y r n e , M. D e r m e l jDetermination of platinum concentration in gold matrix
by neutron activation 57V. C o j o c a r u , S. S p i r i d o n
Impurity determination in BigO, and PbClg by neutron activationanalysis and atomic absorption spectrometry 60S. A l e k s a n d r o v , I. K u 1 e f f, R. D j i n g o v a,S. A r p a d j a n , E. T a s k a e v
Determination of mercury content in milk powder 63M. I o v t c h e v . T . G r i g o r o v ,D. A p o s t o l o v
Simple and fast determination of Rb and Cs in mineralizedwaters 65S. T a s k a e v
Gamma - spectrometric system based onpersonal computer "PRAVETS - 83" 66K. J a n a k i e v , L. T o m o v , T. G r i g o r o v ,M. V u t c h k o v
Computational description of fast neutron activation data 69M. A v r i g e a n u , M. I v a s c u , V. A v r i g e a n u
Absolute nondestructive quantitative determination ofuranium in special nuclear materials 71T. D r a g n e v , B. D a m y a n o v , G. G r o z e v ,J. K a r a m a n o v a
Program for the quantitative and qualitative analysisof Ji, - ray spectra 74V. T e p e 1 e a, E. P u r i c e, R. D a n, G. C a 1 c e v,M. D 0 m n i s a n, V. G a 1 i s , G. T e o d o s i u ,C. D e b e r t , N. M o c a n u , M. N a s t a s e
MEDICINE AND BIOLOGY
Investigation of the behaviour of some elementsin heart of thymectomised rats ».. 79L. K i n o v a
The feasibility study of in-vivo analysis of bone calciumby activation of hand with 5 Cl 2 3 8Pu - Be 81H. S e v i m l i
Distribution of some elements in human colon mucosa B3R. J. D r a s k o v i c , U. B o z a n i c
Analysis of human renal calculi by INAA 85L. K i n o v a , I v . P e n e v , M. d e B r u i n

Determination of sodium in Pharmaceuticalsby neutron act ivat ion analysis 87G. D. K a n i a s , N. H. C h o u 1 i s
Invest igat ion of d i s t r ibu t ion of zink, i ron and antimonyin healthy and pathologically a l te red l i ve r t i s sues 90K. K o s t i c , S. S t a n k o v i c , R. J . D r a s k o v i c
The influence of some addit ives to the highly carbohydrate dieton the d i s t r ibu t ion of Al, Ca, Cl, Mg, Mn and Na in tee thenamel and bones of experimental animals 92P. B a k y r d a c h i e v , I . K u l e f f , E. D j u l g e r o v a ,M. I o v t s c h e v
On the content of sodium,potassium, magnesium,calciumand chlorine in organs of WISTAR r a t s 93M » I o v t c h e v , L. K i n o v a , T. G r i g o r o v ,D. A p o s t o l o v , Z. K e m i l e v a
ENVIRONMENT
Instrumental neutron activation analysis inenvironmental research ( invited lecture ) 99M . d e B r u i n
RNAA determination of As, Cd and Zn in biological materials 108E. T a s k a e v, I v . F e n e v , L. K i n o v a
Defining of concentration factors in the biota of ther iver Sava by the method of nondestructive neutronactivation analysis 110S. L u 1 i c
Analysis of some mineral sa l ts by neutron activation method 113A. P a n t e l i c a , M. S a l a g a a n , S. S p i r i d o n ,G h . S p i r i d o n
Determination of trace element concentration factors insome marine organisms by neutron activation analysis 115A. V e r t a c n i k , S. L u l i c
The concentration of active and inactive strontium insome Danube r iver samples . . . . r • 118K. K o s u t i c , S. L u l i c
Mineral composition of the plant npecies of the Hypericum family 121L. M a r i c h k o v a , 0. K j o s t a r o v a
Trace elements in Turkish tea leaves determined byinstrumental neutron activation analysis 124R. D e m i r a l p
Investigations of some regional r iver systemsby INAA and X - ray fluorescence 125R. J . D r a s k o v i c , A . K u k o c , M. P a n t e l i c
Neutron activation investigation on the accumulation ofsome elements in Taraxacum officinale, resulting fromenvironmental pollution 128I . K u l e f f , R. D j i n g o v a

Determination of some elements i n bottom sediments from
Varna bay, Bulgar ia and Saronikos gu l f , Greece 129D. A p o s t o l o v , M, I o v t c h e v , L . K i n o v a ,F. N i k o l o v , I v . P e n e v . E . T a s k a e v ,T. G r i g o r o v , A. S t o j a n o v , A. P. G r i m a n i s ,G. K a n i a a, C. P a p a d o p o u l o u ,M. V a s s i l a k i - G r i m a n i , D. Z a f i r o p o u l o s
Studies of t r a c e elements in marine organisms from Kaste la bayi n the c e n t r a l Adriat ic 132M. T u a e k - Z n i d a r i c , M. S k r e b l i n ,J. P a v i c i c , P. S t e g n a r , T. Z v o n a r i c
Macro - and microelement determination in some species of thefamily Fumaria I. distributed in Bulgaria 134L. H a r i c h k o v a , 0. K j o s t a r o v a
Application of nuclear analytical techniques to Investigate traceelements content in foodstuffs .. 137A. G h a r i b
GEOLOGY
Some remarks on NAA in geochemicalresearch ( invited lecture ) , 141U U G e i s l e r
Neutron activation analysis of some zircon samples from theApuseni montains ( Romania ) 149M. S a l a g e a n , A. P a n t e l i c a ,V. Z n a m i r o v s c h i , A. M o t i u
Determination of some REE elements, scandium and cobaltin Bulgarian geostandard GRANITE G-B 152E. T a s k a e v , D. A p o s t o l o v , H. S c h e l h o r n
Rapid uranium analysis by deayed neutroncounting of neutron activated samples 154M. N. P a p a d o p o u l o s
REE geochemistry of the Stara Planina ophioliteassociation 15?L. D a 1 e v a, I . H a i d o u t o v
Potassium determinations in clayey minerals byneutron act ivation analysis * 160L. D i n e B C U , C. P l a m e d a
Simultaneous neutron activation determination, ofaluminium, magnesium and s i l i c o n in rocks 162I v. P e n e v , I . K u l e f f , R. D j i n g o v a
Multielement neutron activation analysis of s i l i c a t e rocksusing successive short and long sample irradiations «• 1&5P. V u k o t i c , S. J o v a n o v i c
Determination of trace elements in f ly coal ash( ENO, EOP, ECH refference materials ) 171M. S a l a g e a n , A. P a n t e l i c a
Uranium content measurements on II - phosphate ores 174M. S a l a g e a n , A. P a n t e l i c a , S. S p i r i d o n
Determination of uranium and thorium content in rocks
toy epithermal neutron a c t i v a t i o n analys i s 1751 . D i n e s c u , C. F l a m a d a
Act ivat ion a n a l y s i s of indium used as tracer in hydrogeology 177S. P. S t a n e s c u , 0. M. P a r c a s i u , E. G a a p a r ,S. S p i r i d o n , V. 11. N a z a r o v , M. V. F r o n t a s i e v a
Data on the REE, Th and Hf - content in volcanicrocks from central Cuba 180I. I o i l a n o v , D. T c h o u n e v
The detenu-'nation of the silver content in some ancientcoins by using an Am - Be neutron source 183G. C o a a a, T. P i a t, V. Z n a m i r o r s c h i ,L. D a r a b a n , V. M o r a r i u , D. B o r o s , D. A l i c u
Monostandard a c t i v a t i o n a n a l y s i s o f p r e h i s t o r i c
copper o b j e c t s 186vr • n •* c, c a r u , II. I v a s c u , C. B e s l i t t ,D. D i ^ a e r i a n , D. F o p o v i e i
Archaeometrio investigation of medieval Bulgarian glassesand sgraffito ceramics by neutron activation analysis 189R. D j i n g o v a , I. K u l e f f
Determination of trace elements in soil 190M. S a l a g e a n , A. P a n t e l i c a
Investigation of the connection between surface water andunderground water from mine CACOVA - IERII,using activable tracers 192L, D i n e s c u , V. D o m o c o s , S t . C r a c i u m
Fast neutron a c t i v a t i o n ana lys i s of short - l ivednucl ides in some geo log ica l samples 194S. M. A l - J o b o r i , e t a l .
AUTHOR INDSZ 195

R E V I E W PAPE RS

NEUTRON ACTIVATION ANALYSIS IN BULGARIA
D.ApostolovInstitute of Nuclear Research and Nuclear Energy, Sofia
The first attempt for instrumental neutron activation analysis wasmade by analysis of indium in intermetall alloyB by means of Po-Be sourcein the Institute of Nuclear Research and Nuclear Energy in Sofia.The develop-ment on INAA as a routine method starts with bringing into use in I960 ofthe experimental nuclear reactor in Sofia.With the introduction of semi-con-duotive detectors and high quality multichannel analysers the methodfinds its wide applications in different parts of science and industry.
SYSTEMS AND METHODS OP IRRADIATION
At the present the main source of neutrons is the experimental reactor2 MW - IRT-2000.For the purposes of INAA the vertical channels are used.The neutron flux vary from 1 to 6x10¹²n/cm2sf with Cd ratio for gold ofabout 4,4.In one of the channels the neutron flux is additionally thermalisedwith grafite (thermal columne ),In other vertical channel a pneumatic double-tube rabbit system is installed.One of the irradiation positions is equipedwith 1mm Cd shield constantly.With the pressure of the working gas ( air )of 2 bar the transport time in one direction is 2,5 sec.
In this way for INAA are available isotopes with the half-life of fewseconds and more,when the irradiation iB carried out in pile or epithermalneutron flux, and few hours and more,when the irradiation is carried out inthermal column.Because of lack of special system for uniform irradiation anaccuracy of 3% could be reached by use of iron monitors for long irradiatonsand copper monitors for use in the rabbit system.
At the moment in Bulgaria are working also two neutron generators butthe application of 14 MeV neutrons for INAA is still quite limited.
Radiochemical methods ( RNAA ) are used at the present only for investi-gation purposes.
APPLICATIONS
Geology and pedology: The application of INAA in this area is mostdeveloped.Investigated are the composition of the fields,of strongly minera-lised underground waters and the possibility to extract from them some use-ful products.Some investigations are carried out on rocks and sediments forthe purposes of geology.The study of soils is conducted for the improvementof agriculture.
Medicine and biology; Model experiments are performed on laboratoryanimals for the establishment of a connection between the content of essentialmacro- and microelements in different organs and the development of someprocesses in disease.Studied is also on model experiment the effect of plati-num preparations on the treatment of cancer.Investigated is the elementalcontent of human tissuestplants and other.

Environment and pollution: Conducted are tracer experiments for the
study of the effect of point pollution emmiters ( factory chimney for instance).
Examined are the possibilities to use some plants and animals as a monitors
of air pollution.Studied is the influence of different pollutants on the
distribution of toxic elements in human organs,sea water organisms and
others.
Archeology;An extensive investigation is carried out of ancient
glasses and ceramics for archaeometry purposes.An attempt is made for
analogous investigation of ancient flint and obsidian objects.
Technology: By means of INAA is analysed the wearing of some machine
parts,controlled are some processes in metallurgy as well as the final
technological products.Investigated are the possibilities for regeneration
of some valuable apended catalysts from chemical industry.
Meteorology and hydrology: Experiments are conducted with activable
tracers for the study of local atmospheric phenomena and the movement of
the underground waters.
Criminology; Developed are methods based on INAA for analysis of car
paints and traces of shooting for the investigating purposes.
Qualitatively NAA in Bulgaria maintaims a good level.The interlabora-
tory intercomparison runs,organised by IAEA and other institutions offer
a perfect opportunity for each group to check the quality of their results.
Quantitatively the further development of NAA and its applications is
limited by the possibilities of the reactor.In the near future a reconstruc-
tion and modernisation of the reactor is being planned,which will extend
the possibilities for the analysis.Building of accelerator and more power-
ful neutron generator which is due in the near future in Bulgaria will
also contribute to the use of neutron activation analysis.

HBUTRON AOTIVATION ANALISBS IN ROMANIA
SSelian ApostolesouInstitute for Physios and Nuolear EngineeringBucharest IIG-6, Romania
The history of activation analyses in Romania, starts way back in 1957whan a 2000 Iff 7VR-S Nuoltiar Reactor, and in 1958 when a U-200 Cyclotron havebean pat into function. The Institute for Atonic Physics has been developingits researoh activity around these two basic nuclear facilities. Soon afterthat a 30 MeV Betatron entered into operation and during the following yearsseveral 14 HeV neutron generators have been built or installed in varioussites over the country* A king size High Voltage tandem Van de'Graaff accele-rator Joined later the nuclear facilities at the beginning of seventies.
At about the same tine, the State Oommettee for nuclear Energy has orga-nized nationwide Courses for Radioisotope Applications, training specialistsin various fields as geology, biology, medloine, engineering, agriculture andso on, in the peaceful uses of nuolear energy* leaching at this courses werethe research workers and the university staff in this field. In this way thecourses have become a kind of national forum debating the appropriate ways fora wide application of nuclear methods in technology, agrioulture and the otherrelated fields of science and eoonomy* Soon has been found out that the mosteffective lmpaot of the nuolear methods in the related fields, beside the ove-rall problem of nuolear energy consists in the nuolear analyses and X-ray flu-orescence methods*
THKRH&L NEUTRON ACTIVATION ANALYSIS (THAI or INAA)Historically the first thermal neutron activation analyses carried out at
the romanian nuolear reactor, were in late fifties dealing with the analysisof the purity of silicon as semioonduoting material* Since then, traoe elementsdeterminations la silioon has been a oonstant task for our researchers in va-rious groups* She whole romanian industry of semioonduoting devices, benefitsgreatly now of slstematio and routine purity analyses, as well as nuolear do-ping by irradiation of silioon llngots in the aotlve core of our reactor.
In the early sixties, a pneumatio rabbit system has been set up into oneof the horizontal channels of the reactor, enabling measurements on short livedisotopes* The transit time of a few seoonds has allowed determinations on iso-topes whose lifetimes range as short as tens of seconds* This rabbit systemhas been in operation along a period of more than twenty years and is still inservioe. being used by all the research groups dealing with thermal neutronaotivation analysis on short lived isotopes*
ThiB rabbit system is also used for delayed neutrons measurements on theuranium content in ores* Taking into account the faot that lately, the demandsfor such analyses have greatly Increased beyond the oapaolty of the presentpneumatio system, a new and Improved rabbit is under construction and is to beset up ontoanother horizontal channel of the reactor* This new air rabbit willhave a six position revolving ohargeable magazine and an intricate system ofawltohos, to direct the sample in various positions, aooording to the irradia-tion programme* The whole system is designed to be before long controlled bythe computer*
As one oan see in the proceedings of this conference, a great deal of re-search and routine work is being carried on at this moment by an importantnumber of working teams* As an example of some activities in thermal neutronaotivation analyses, the main domains will be be outlined as followsi
QBOLOGT AND MIKIKGBeveral groups in the Institute for PhysiOB and Nuolear Engineering, in
the Institute for Radiation Equipment, in the Institute for Geology and Geo-physics and the Institute for Rare Metals have been and are doing r«searoh androutine work for the determination of useful minerals in ores, like Iron, mo-libdenum, ziroonium, platinlo metals, uranium and thorium and all other metalsas well BB nonmetallferous minerals like kaolins and refractory days*
In the followings, a few works of this kind are mentioned!- Determination of gold and platlnio elements in Apuseni Carpathians ores.- Analysis of some mineral salts by INAA.- Uranium oontents taeaaurements on U-phosphate ores.- Neutron aotivation analysis of some zlroon samples from the Apuseni
Carpathians.- Determination of alumina and silica oontents in kaolins and refractory
olays by a oomblned method of TNAA and PNAA.- Hare-earths determinations in geological samples.

PROCESSING OF MATERIALSThe ras«arohsra of the Institute for Physios and Nuclear Engineering have
oarried out important work in co-operation with the soiantists and technolo-gists of the industry in the study and production of high purity and/or specialmaterials. Units like the Enterprise for Eleotronio Components and Semiconduc-tors, the Institute for Besearoh in Slaotronio Components, the Institute forHetalurgioal Hesaaroh, and many others, osdar routine analyses, or co-operatein research programmes for high purity studios, in solving aoute technologicalproblems*
Here are some examples of works performed in these oo-operationst- Neutron aotivation analysis of semiconductor silicon.- Neutron aotivation analysis of high purity OaFo, GeO?, BioO* and
CN%)2lIoOi|.4 %(> p- P.p.a. level oobalt content in special steels.- Glass powder purity studios by INAA.- INAA on high purity quartz*- INAA on high purity graphite.ENVIRONMENT AND BIOLOGIStudies have been oarried out in co-operation with institutes for healths,
for biology and for food processing* Examples of works in this fields are asfollows!
- Analysis of algae and marine sediments on the ronanian coastline of theBlack Sea*
- Study on the possibility of using algae as detectors for environmentalpollution.
- Analysis of human hair content.- Determination of oligoelements in human serum.AROEBOLOGIA great deal of the analysis work is being oarried on in co-operation and
for the benefit of the history museums all over the country. Here are a few of.the oharaotoriatio works of this kinds
- INAA of prehistorioal copper objects.- A correlation between the XRF and NAA methods in numismatic studies.- NAA studies on middle ago pottery.- NAA characterisation of bizantyne glass wares.INTBROOMPARISONSOne of the interoomparisons, our nuclear analysts have taken part in,
were those organised by I ABA'a Analityoal Quality Oontrol Servioe* Our most re-cant participation is oonnected with the determination of 32 elements at thep.p.m. level in 8OIL-7. a referenoe material prepared of a soil oelleoted nearXbonsoe in Upper AuBtria. We are glad to report good results in comparing ourdeterminations with the oertified values of the AQO Servioe* In the past yearsthe same kind of interoomparison participations have to be mentioned on ryeflour, human hair, and mussel tissue materials*
The same group of our most outstanding analysts have taken part in an in-teroomparison organised by the Institute of Radioeoology and Applied NuclearTechniques of Kosice - Czechoslovakia, on referenoe materials realized fromfly coal ashes*
An interoomparison among the balkan countries would greatly increase theoonneotions and the co-operation of our laboratories*
BPITHBR1IAL NEUTRON AOTIVATION ANALYSIS (BNAA)The determination of uranium and thorium in ores with high Th/U ratios or
high rare earth oontents speoial problems arise in TNAA methods. The problemhas been solved using epithermal neutrons for aotivation. Participation in aIAEA interaomparison on 8-14-, 8-15 and 8-16 reforenoe materials, has shown howgood this method can be in suoh difficult matrioes.
FAST NEUTRON AOTIVATION ANALYSES (PNAA)Three low energy accelerators are used as 14-*1 MeV neutron souroes, one
of them entirely specialised on PNAA.This one, installed in the Institute for the Technology of Radiation
Equipment is provided with speoial equipment for oxygen and low mass elementsdeterminations. This equipment consists in an air rabbit having two parallelways, one for the unknown sample and one for the standard, with simultaneousirradiation and also simultaneous measurement at two large Nal(Tl) measuringhea: ds, appropriately equilibrated*
This installation carries on routine measurements on the determination

of oxygen content In steels and aluminium.Also theoretical nuclear model calculations are being used to extent the
neutron data basis available for applications.This computational method isbased on the statistical model (Hauser - Feshbach STAPRE code) and the pre-equilibrium decay geometry dependent model* Thus en accurate theoretical des-cription of the fast neutron induced reactions is an useful alternate way tosupport FNAA.
OHARGBD PARTICLES ACTIVATION ANALYSES (OFAA)The posibility of bringing out into the air of a proton beam at the cy-
clotron, raised the possibility to install a gravitational sample changer atthe end of a beam line and to perform mechanized analyses for protein deter-minations in grains. Protons of 14 UeV are being used and a (p,n) reactionon nitrogen helps to make the quantitative analysis of this element, that isclosely conneoted to the protein content in grains* The installation, alreadyin routine operations, analyses thousands of samples yearly, each sample mea-ning as container of about 4 cubic centimeters of wheat, barley, corn, sor^umor whatever other oereal*
I include in the domain of charged particles activation analysis, a veryinteresting method of determination of the profiles of hydrogen content inthe surface layers of solids, that has been put into work at the tandem Vande'Graaff accelerator. It uses the isolated narrow resonances that usuallyoocur in heavy ion induced reaotions* For instance, the reaotion
H-S5 + H-l •• 0-12 + He-4 + gamma (4.43 MtV)has a oroas seotiot that is outside the resonanoe three orders of magnitudelower than on the peak. By bombarding the sample with N-15 ions of energygreater than the resonanoe (6*385 MeV) and detecting the resulting 4.4? MeVgamma rays by the help of a large volume Nal(Tl) detector, the distributionin depth of the hydrogen concentration is soanned, by gradually increasing theincident heavy ions energy* Interesting applications in microelectronics, spe-cial glasses industry, archaeology, silicon thin layers production, steal al-loys and superoonduoting •at«rials, have been found oat and co-operation withthose fields are In prooess of being established.
Aa tao Collective for nuclear Analyses has been organised in the Insti-tutt for Physios and Nuclear Engineering starting with the year 19B0, on*hopes that before long all the activities conneoted to nuclear analyse* ofall kinds, aotivation included, to be batter co-ordinated and put on a moreprofessional basis*

ACTIVATION ANALYSIS IN GREECE
A.P. GrimanisRadioanalytical Laboratory, Nuclear Research Center "Demokritos"
153 10 Aghia Paraskevi AttikisAthens, Greece
ABSTRACT
Today Activation Analysis is widely applied to the investigation of medical,environmental, industrial, geological and archaeological problems. In this /eviewthe development of activation analysis methods as well as applications of thesemethods in medicine, environment, geology, and archaeology are described, mainlybased on work done by the author's group in the Nuclear Research Center "Demokritos"of Greece.
INTRODUCTION
In the last 35 years there has been a tremendous growth of research, deve-lopment and applications of neutron activation analysis (NAA) which resulted in adramatic increase of the relevant literature, showing an exponential growth from13 papers in 1949 to over 700 in 1971 (1). This represents a doubling time ofabout three and one half years. From 1971 up to date NAA reached maturity. Theannual accretion of papers in the literature kept an exponential growth pattern ata more reduced rate, more or less equal to that of analytical chemistry (Z). In1968 and 1969 two new scientific journals, the Radioanalytical Chemistry and theRadioanalytical Letters were circulated to cover the continuous growth of publica-tions related to NAA.
The increasing international interest for NAA is evident from the number ofpapers presented at International Conferences of Modern Trends in Activation Ana-lysis (MTAA). In 1961 during the first MTAA Conference about 1/4 of the presentedpapers were from 6 only countries other than USA (3) while during the 5th and 6thMTAA Conferences in 1976 and 1981 more than 3/4 of the presented papers were frommore than 25 countries other than USA.
Several factors contributed to the increasing international interest for NAAsome of which are: the establishment of research nuclear reactors in many coun-tries of the world. The use of other nuclear projectiles (charged particles -photons) to the arsenal of activation analysis. The development of radiochemicalseparation techniques, which, combined with NAA, increased the sensitivity of NAAfor some elements to quantities below 10~9 grams. However the main factors whichcontributed most for the international recognition of NAA were the development ofmultichannel analyzers (4) and Ge(Li) detectors (5) for v-ray counting and thepossibility of v-ray spectra processing by computer techniques. All these increasedthe number of trace elements which can be determined by Instrumental NAA, reducedthe time of analysis and greatly extended the scope of the method. In many casesNAA can be applied successfully as an Instrumental non-destructive multielementanalysis method, based upon multi-channel gamma-ray spectrometry of the neutronactivated sample.
Today NAA is widely applied to the investigation of biomedical, environmentalindustrial, geological and archaeological problems. Due to its great sensitivityprecision and accuracy it is considered as an ideal method for the determinationof a large number of minor and trace elements in several materials.
In this paper a review of research and development on NAA as well as examplesof applications of this method in medicine, environment, geology and archaeologyis presented, taken from work carried out over the last 21 years at the Radioana-lytical Laboratory of the Department of Chemistry in the Greek Nuclear ResearchCenter "Demokritos". Charged particle activation analysis and delayed neutroncounting methods are also mentioned.
DEVELOPMENT OF NAA METHODS AT THE RADIOANALYTICAL LABORATORY
In the last 21 years improved and/or faster radiochemical NAA methods havebeen developed at our Laboratory for the determination of Au(6), Ni(7), Cl(8),As(11), Cu(14), UC15), V(30), Cr(45), Eu(52), Hg(87) and Mo(88) in several materialsas well as for the simultaneous determination of Br and 1(9), Mg, Sr and Ni(12),As and Cu(16), As, Sb and Hg(17), Mn, Sr and Ba(19), Cd and Zn(28), Se and As(28),Mo and Cr(28) in biological materials. Instrumental NAA methods have also b n

developed for the determination of Ag, Cl and Na in lake waters (6), Al, Ca, Mgand V in wines (100) seven trace elements in biological materials (28), 17 traceelements in sediments (46) and 20 minor and trace elements in ceramics (47) . Wehave also developed a coprehensive computer program for routine activation analysisusing Ge(Li) detectors (36).
APPLICATIONS OF NAA IN MEDICAL RESEARCH
In 1971 a review article was written on medical applications of NAA (23) toinform MDs in Greece about the availability of NAA methods in medical research.Cystic Fibrosis is a frequent chronic disease of childhood. Its frequency is 1 in2000 live births. Early diagnosis followed by the appropriate therapeutic programcan help a number of children born with this disease to survive to adult age. Thesweat test is an accurate procedure most widely used for the detection of CF. Thistest however has its limitations. The time, expense and necessity for the patientto visit the laboratory limit the number of people who can be tested. In additionthe sweat test cannot easily be performed in newborns, dehydrated an' malnourishedinfants.
Kopito and Scwachman (111) first found increased concentrations of sodium inthe nail clippings of patients with Cystic Fibrosis (CF). Although their resultswere very valuable, the method they used was destructive of the sample, time-consuming and unacceptable for large scale applications. Nevertheless their find-ings prompted several investigators to apply Instrumental NAA of sodium in nailclippings for the diagnosis of C.F. Some of the advantages of INAA to nails as atool for the detection of C.F. are listed below: a) Small samples (1 mg) are re-quired, b) Simultaneous analysis of many samples per day is possible (over 100),c) Samples are not destroyed. On the other hand nails are very convenient material;they can be clipped by anyone, anywhere and no special storage precautions arenecessary. However, there is a problem. Since sodium is abundant in nature, conta-mination is freq'uent. Thus, cleaning the nails constitutes a major experimentaldifficulty. The problem is to remove the surface "contamination" sodium withoutaffecting "intrinsic" sodium.
In the past we have applied INAA for the study of C.F. (24-26,31). We havedeveloped an improved washing procedure for the removal of external sodium contami-nation from nail clippings which combined with instrumental NAA increased the dia-gnostic accuracy of the method from 75% to >\.90t (25,26). We have developed asimple counting method of sodium-24 in irradiated nail clippings which makes pos-sible the use of inexpensive counting equipment for INAA of sodium in nails. Wehave successfully applied INAA for the determination of Na in fingernails of 80patients with C.F. and 2531 controls. The nail sodium ratio of patients to
children was 3 to 1 in three pediatric groups examined (newborns, infants,children). We have made a systematic study of 11 more trace elements (Al, As, Br,Ca, Cl, Co, Cu, Mg, Mn, K and Zn) in fingernails of patients with C.F. and controlsusing NAA. Bromine and chlorine concentrations in nails of C.F. patients of allage groups were found to be 2 to 5 times higher than those of healthy children.Increased potassium and copper concentrations were found only in the nails of in-fants and children. No significant differences were found for the rest of the ele-ments.
Increased bromine concentrations were first reported by our group (24). Be-side Na and Cl values, Br in nail clippings from patients with C.F. can be used assupplementary indicator for C.F. Concentrations of Br, Cl and Na determined byINAA at our Lab. in the sweat of C.F. patients were found to be 2.5, 4.0 and 6.0times higher respectively than those of controls. This research work was partiallysupported by the IAEA for 3 years (Research Contracts 689/RB/1969, 689/R1/1970,689/R2/1971). This work was done in collaboration with the First Pediatric Clinicof Athens University.
Changes of metabolism happen in women's organism during gestation which areprobably necessary for the development of the embryo. The concentrations of Zn,Co, Cu, Se, As, Au, Br and Rb have been determined by NAA in maternal and umbilicalcord blood sera as well as in healthy non-pregnant women who served as controls(35,39,44,56). The concentrations of Zn and Co were significantly lower, those ofCu and Au significantly higher while levels of As, Se, Br and Rb were similar insera of pregnant as compared to sera of non-pregnant women. The mean value of Znin the umbilical cord sera was about two times higher and that of As 1.7 timeshigher'than those in mothers. Toxic levels of As were not found in the studiedcases.INAA has been applied for thu determination of Co, Rb, Se and Zn in maternaland umbilical cord serum and amnioiic fluid of women with normal pregnancy andprolonged pregnancy (89,90). Significantly lower levels of Co, Se and Zn were foundin maternal blood serum and cord serum of women with prolonged pregnancy as compared

10
with those in sera of mothers with normal pregnancy. Zn concentrations weTe alsofound significantly lower in amniotic fluid of women with prolonged pregnancy.
Six trace elements (Zn, Co, Se , Rb, Br and Au) were also determined in pla-cental and liver tissue samples at birth (53). The mean concentration of theessential trace elements (Zn, Co, Se) were significantly higher in liver than inplacenta, whereas the non-essential trace elements (Rb, Br, Au) were found insignificantly higher concentrations in placental than in liveT tissue.
The principal food of infants during the first months of their life is humanmilk or cow's milk and commercial infant foods. NAA has been applied for thedetermination of seven trace elements (Co, Cr, Cu, Se, Zn, Rb and As) in colostrum,transitional and mature human milk as well as in powdered cow's milk and commercialinfants foods in order to find out whether non-breast-fed infants received thesame or different amounts of- these trace elements as breast-fed ones. Resultshave been reported (61). Among them it was found that average concentration of Cuin human milk is about 9 times higher than that of cow's milk.
These works were done in collaboration with the Second Pediatric Clinic ofthe University of Athens with the exception of the trace element studies in bloodsera and amniotic fluid of women with normal and prolonged pregnancies which wereperformed with the collaboration of the First Clinic of Obstetrics and Gynecologyof the University of Athens.
The distribution pattern of Zn, Co, Se, Fe, Cs and Sb has been found by INAAin three parts of myomatus uterus: myoma, endometrium and myometrium. The contentof these elements was also determined in submucous, intTamural and subserousmyoma (41,62). The variation of the content of Zn, Co and Se in myoma and myome-trium was found to be very significant statistically compared with the variationof these elements in endometrium. The concentration of the six trace elementsdetermined in myoma, myometrium and endometrium has been correlated with age. Thiswork was done in collaboration with the department of Pathology of the Universityof Athens.
The distribution of three essential trace elements (Co, Se and Zn) in theeyes of premature and normal newborn babies has been studied (40). This work wasdone in collaboration with the Second Pediatric Clinic and the First Clinic ofObstetrics and Gynecology of the University of Athens.
Trace elements have been determined in the lens, nail and serum of patientswith cataract (67,78). The distribution pattern of Ag, Co, Cr, Cs, Fe, Rb, Sb,Sc, Se and Zn in the human cataractous lenses has been studied using INAA. Dif-ferences of concentrations of these trace elements were found in the cataractouslens regarding the concentrations of the same elements in the normal lens (91,92).These works were done in collaboration with the Eye Clinics of the University ofAthens.
Active constituents of medicinal plants are products of plant metabolismwhich is influenced from the variation of the concentration of trace elements.Twenty seven trace elements have been determined in the different parts of themedical plant Helleborus cyclophyllus Boiss and in the soil in which the plant hadgrown (64,68). The attributed diuretic action in potassium content in some medi-cinal plants has been studied in correlation with the daily requirement for thiselement in man (69). Recently simple and rapid NAA methods have been developedand used for the direct and indirect determination of active ingredients in drugs(70,96,103,106) and cosmetics (102,105). These works were done in collaborationwith the Department of Pharmaceutical Technology of the University of Athens.
Our Laboratory in collaboration with the Department of Pathology of the Uni-versity of Athens was participating under a research agreement at a WHO/IAEA JointResearch Program for the study of trace elements in cardiovasc ' ir diseases (110).
NAA METHODS IN ENVIRONMENTAL RESEARCH
In the last 21 years in our Laboratory NAA methods have been developed andapplied to trace elements research in the environment.
In environmental studies we have determined: seventeen trace elements (Ag,As, Au, Ba, Br, Cl, Cu, I, Mg, Mn, K, Na, Ni, Re, Sr, V and Zn) in surface andbottom waters from 11 most important lakes of Greece (6,12), the arsenic uptakein grapes and plant tissues (20,21) and the uptake of Cu, Mn and Zn in needles ofseedlings of Pinus grown under a wide spectrum of soil conditions (18). Brominein soils polluted with bromine pesticides and in the same soils after treatment

n
with water (34). Several trace elements in drinking water of the Athens area, inriver waters and in water pipes (113). Eleven trace elements (Al, As, Br, Ca, Cl.Cu, K, Mg, Mn, Na and V) in experimental and commercial red and white wines fromdifferent wine production areas of Greece (16, 81, 100). Certain inorganicnutrients in natural and artificial food of Dacus oleae larvae (60). Nine traceelements (Ag, Co, Cr, Cs, Sb, Sc, Se, V and Zn) in three edible mollusk species(100). A study of trace elements in greek lignites by INAA has been started (113)in collaboration with the Institute of Geological and Mining Research.
However most of the trace element environmental research work done in ourLaboratory has been concerned with the marine environment. In marine pollutionstudies we have determined: Br, Cu, I, V and Zn in Pura microcosmus (13). Tentrace elements in the whole body and in ten different parts of the fish Pagelluserythrinus (29), 12 trace elements (Ag, As, Ba, Co, Cr, Cs, Fe, Hg, Mn, Sb.Sr arid"W in Cynthia claudicans (30). Toxic trace elements and elements of radioecologi-cal importance in mollusk species (27,42) in echinoderm species (43,66) and tuni-cate species (49) from Saronikos Gulf, Greece. It was found that certain of thesemarine organisms may be characterized as radioactive and industrial pollutionindicators. In NAA of As and Hg in Pagellus erythrinus (33) and of As, Cd, Co, Cu,Fe, Mg, Rb, Sb, Se and Zn in Sargus annularis (54), arsenic concentrations in theflesh of these two fish species were found to be two times higher in samples frompolluted areas as compared with samples from the unpolluted areas of the island ofRhodes and Petalion Gulf.
Within the framework UNEP MED POLL II Project, a systematic pollution moni-toring of 14 trace elements (Ag, As, Cd, Co, Cr, Cs, Cu, Fe, Mg, Rb, Sb, Se, V andZn) in Mullus barbatus and Parapenaeus longirostris (58,73,74) has shown increasedconcentrations of As in the flesh of Mullus barbatus from northern Saronikos Gulfwhen compared with specimens from other gulfs of Greece. All higher concentrationsof arsenic found in fish species of Saronikos gulf are within the "natural back-ground" levels reported for edible fish by other investigators. No significantdifferences for the rest of the trace elements were found in the flesh of thesemarine organisms studied in Northern Saronikos Gulf as compared with the same orga-nisms from other gulfs. It seems that these benthic organisms do not reflect thevery high trace element concentrations found in seawaters and sediments of theKeratsini bay in the northern Saronikos Gulf.
A study of trace elements (Ag, As, Au, Ce, Co, Cr, Cs, Eu, Fe, Hg, Hf, La, Lu, Rb,Sb, Sc, Sm, Yb, Zn) as an index to pollution in sea sediments (32,37,46,63) fromthe northern Saronikos Gulf has been made by INAA. It was found that the dischargeof industrial and domestic wastes in the Keratsini and Elefsis bays of the upperSaronikos Gulf has led to elevated concentrations of all toxic and other traceelements determined over at least 100 km2 of seafloor. The 0.5N HC1 extractionmethod (112) of the silt-clay fraction of sediments was used and was successful forthe distinction between anthropogenic and residual concentrations of As and Zn inthe sediments (95).
Increased concentrations of As, Co, Cs, Cu, Fe, Mg, Rb, Sb, Sc and Zn havebeen found in seawater samples collected near the main sewage outfall of KeratsiniBay and to a much lesser degree from Faliron Bay (97,113). The affected area how-ever is not very extended since concentration of trace elements fall to naturalbackground levels within 5 km2 from the outfall.
Six trace elements (As, Co, Cs, Fe, Se and Zn) have been determined by INAAin otoliths of the pelagic fish Scomber japonicus colias from the Aegean Sea (65,71). It has been found that in general the content of the studied elements inotoliths decreases with increasing age of the fish. Several trace elements havebeen also determined by NAA methods in skeletal formation of fish species (48) inplankton (50,85) in marine organisms and sediments of the Aegean Sea (51,59,72,75,76,83,84,86,93,94,99).
Recently the distribution of arsenic in water columns, water particulates andsediment cores from Northern Saronikos Gulf has been studied (109). INAA has beenapplied for the determination of nine trace elements (Ag, Co, Cr, Cs, Fe, Rb, Sc,Se and Zn) in the medusae Aurelia aurita and Pelagia noctiluca (104) and in muscle,liver and heart of Boops boops and TracTiurus mediterraneus (108).
Within the framework of the scientific collaboration between the ActivationAnalysis Group of the Institute of Nuclear Research and Nuclear Energy (INRNE) ofSofia, Bulgaria and the Radioanalytical Laboratory of the Nuclear Research CenterDemokritos, nine trace elements (As, Co, Cr, Cu, Mg, Rb, Se, V and Zn) were deter*mined by NAA in the flesh and liver of the edible fish Gobius niger caught from VarnaBay, Bulgaria and Saronikos and Petalion Gulfs, Greece. No dangerous concentration

12
- for the human health - of the nine trace elements under investigation were foundin all samples of the Gobius niger,
Our laboratory has particinated at the UNEP MED TOM. II and UNEP MED POLL VIIIP.ojects for the protection of the Mediterranean. The partial financial support ofour laboratory for these projects by UNEP/FAO as well as for the Research Program"Fates and Pathways of trace elements in the Saronikos Gulf" by the European Econo-mic Communities is gratefully acknowledged.
NAA IN ARCHAEOLOGY
INAA is widely applied to the investigation of archaeological problems. Ele-mental composition, of an object of art besides form, shape and decorative style maygive a supplementary indication of the origin of the object. The museum curatorwill often permit the removal of a specimen from an object for analysis if theamount taken is such a tiny fleck (a few ings) that its absence is virtually unde-tectable. In such small quantities of a pottery sample for example more than20 trace elements can be determined by INAA.
At our laboratory we have applied INAA methods to the investigation of prove-nance problems of ancient books, ceramics, obsidians, flints, limestones andmarbles. We have examined 50 paper samples from old Venetian books (38) in orderto correlate the concentrations of trace elements and the age of the books.
INAA has been applied for the determination of 20 minor and trace elements(As, Ce, Co, Cr, Cs, Cu, Fe, Hf, La, Cu, Na, Rb, Sb, Sc, Sm, Ta, Tb, Th, Yb and*Zn) in two groups of potsherds (47) which have been excavated at two different sitesof Greece, the island of Thasos (Group A) and Delos (Group B). A good agreementfor all the elements examined between the pottery specimens of Groups A and B wasfound. This matching in chemical composition found by INAA between the two groupsA and B provides strong support for the archaeologistrs hypothesis that the twogroups belong to the same major group of "melian" pottery. INAA and X-ray techni-ques have been applied for the determination of 24 major, minor and trace elementsin four different groups of vases (55,77). Protocorinthian, Thapsos Class, LateGeometric Corinthian and Aigion Crater). The matching in chemical composition ofthe four groups of vases found, strongly suggests the same origin for all of them.
X-ray and NAA and mineralogical examination have been applied to obsidiansamples found in the excavation of Kitsos cave at Sounion (82). The trace elementconcentrations found in Kitsos obsidian match with those of Melos origin found inprevious works.
Current research at our Laboratory on Archaeometry deals with provenancestudies of ancient pottery from the islands of Naxos and Thera, and Peloponese, aswell as ancient marble from different sites of Greece.
Within the framework of collaboration between the AA group of the (INRNE) ofSofia, Bulgaria and the Radioanalytical Lab of NRC Demokritos, Greece a commonproject started on the development and application of NAA methods to the study oftrace elements in flint samples from flint quarries and ores from Bulgaria andGreece as well as in archaeological flint objects found in museums of honey orwhite honey colour.
CHARGED PARTICLES ACTIVATION ANALYSIS
A rather extended charged particle activation analysis program is carried outfor the last 10 years at the Tandem van der Graaff Accelerator Laboratory of theNRC Demokritos, by another group. It includes Particle Induced X-Ray Emission(PIXE) analysis, Particle Induced Prompt Gamma-ray Emission (PIGE), other nuclearreactions and proton activation analysis. It should be noted that the first exter-nal beam PIXE technique was established by this group (114,115).
Several papers (116-121) have been reported with applications in the field ofbiological, environmental sciences in archaeometry etc.
DELAYED FISSION NEUTRON COUNTING
A special neutron activation method, the delayed fission neutron countingmethod is used for the analysis of fissionable elements, as U.Th.Pu, in samples ofthe whole nuclear fuel cycle including geological, enriched and nuclear safeguardssamples. At NRC Demokritos so far the method has been applied extensively to geo-logical samples for uranium exploration (122).
13
In conclusion, I would like to add that NAA is another peaceful applicationof atomic energy. In biomedical and environmental research it may contribute toa higher standard of living. It can also be advantageously used to solve indus-trial, geological and archaeological problems. However, a close collaboration ofclinicians, biochemists, physiologists, environmentalists, ecologists, oceanogra-phers, industrialists, geologists and archaeologists with activation analysis spe-cialists is necessary.
REFERENCES
1. G.J. LUTZ, R.J. BORENI, R.S. MADDOCK, J. WING, Activation Analysis: A biblio-graphy through 1971. Nat. Bur. Stand. (USA) Tech. Note 467 Aug. 1972.
2. F. GIRARDI. J. Radioanal. Chem., 69 (1982) 15.3. W.S. LYON, J. Radioanal. Chem., 69 (1982) 107.4. W.S.CROUTAMEL.F.ADAMS.R.DAMS, Applied Gamma-Ray Spectroscopy, Pergamon Press, New York, 1970.5. F. GIRARDI, G. GUZZI in "Advances in Activation Analysis", vol. 1. J.M.A.
LENIHAN, S.J. THOMSON (eds) Academic Press, London and New York, 1972, p.137.6. A.P. GRIMANIS, G. PANTAZIS, C. PAPADOPOULOS, N. TSANOS, Proc. 3rd U.N. Conf.
Peaceful Uses Atom. Energy, Geneva 15 (1964) 412. Part of this work was alsopublished at the Journal Isotopes and Radiation Technology 2 (1965) 345.
7. A.G. SOULIOTIS, Anal. Chem. 36 (1964) 1385.8. A.G. SOULIOTIS, A.P. GRIMANIS, N.A. TSANOS, Analyst 90 (1965) 499.9. E.P. BELKAS, A.G. SOULIOTIS. Ibid 91 (1966) 199.10. A.G. SOULIOTIS, A.P. GRIMANIS, N.A. TSANOS, Talanta 13 (1966) 158.1 1 . A.P. GRIMANIS, A.G. SOULIOTIS, Analyst 92 (1967) 549.12. A.G. SOULIOTIS, E.P. BELKAS, A.P. GRIMANIS, Ibid 92 (1967) 300.13. C. PAPADOPOULOU, C.T. CAZIANIS, A.P. GRIMANIS, Proc. Nuclear Activation Techni-
ques in the Life Sciences, International Atomic Energy Agency, Vienna (1967)p. 365.
14. A.P. GRIMANIS, Talanta 15 (1968) 279.15. D.C. PERRICOS, E.P. BEI.KAS, Ibid 16 (1969) 745.16. A.P. GRIMANIS, Nat. Bur. Stand. (U.S.) Spec. Publication 312, Vol.1 (1969)
p. 197.17. I. HADZISTELIOS, A.P. GRIMANIS, Nat. Bur. Stand. (U.S.) Spec. Publication 312
Vol. (1969) p. 184.18. N. YASSOGLOU, S. VRACHAMIS, C. NOBELI, A. GRIMANIS, N. TSANOS, C. APOSTOLAKIS,
E. PAPANICOLAOU, Final Report USDA PL 480. Research Project No.E11-F.S.2Athens (1969).
19. I. HADZISTELIOS, C. PAPADOPOULOU, Talanta 16 (1969) 337.20. A.P. GRIMANIS, C. PAPADOPOULOU, B. DARIS, I. KELPERIS, Les Progress Agricole et
Veticole An. 87 (1970) 10, 87 (1970) 38 (in French).21. B.T. DARIS, C. PAPADOPOULOU. I. KELPERIS. A.P. GRIMANIS. Proc. of the 10th
British Wheat Control Conference at Brighton. Enqland, vol. 1.(1970) p. 429.22. A.P. GRIMANIS, M. GRIMANI, Proc. of the 4th Panhellenic Chem. Congr. in Athens
(1970) p. 123 (in Greek).23. A.P. GRIMANIS, latriki 20 (1971) 85 (in Greek).24. A.P. GRIMANIS, M. VASSILAKI-GRIMANI, M. NICOLAIDOU, Ann. Paed. Clin. Univ.
Athens 18 (1971) 233 (in Greek).25. M. NIKOLAIDOU, A.P. GRIMANIS, M. VASSILAKI-GRIMANI, XIII Intern. Congr. of
Paediatrics, Vienna, Genetics vol. 5 (1971) 509.26. A.P. GRIMANIS, M. NIKOLAIDOU, M. VASSILAKI-GRIMANI, Application of neutron
activation analysis in the study of cystic fibrosis. Final Report, IAEAResearch Contract 689/RB Athens (1972).
27. C. PAPADOPOULOU, Contribution in the Radioecology of the Greek seas. Traceelement determination in edible molliisks. Ph.D. Thesis, Athens University,Athens (1972) pp. 140 (in Greek).
28. A.P. GRIMANIS, G. PAPACOSTIDIS, C. PAPADOPOULOU, M. VASSILAKI-GRIMANI, N. PAPA-CHARALAMBUS, G. PLASSARAS, D. KOTOULASj Neutron activation analysis methodsfor the determination of 14 trace elements in tissue samples. Results obtainedwith analytical reference materials in trace elements in relation to cardio-vascular diseases, Technical Report IAEA 157, Vienna (1973) p. 29.
29. C. PAPADOPOULOU, I. HADZISTELIOS, A.P. GRIMANIS, Hellenic Oceanology and Limno-logy. XI (1973) 601 (in Greek).
30. C. PAPADOPOULOU. I. HADZISTELIOS. A.P. GRIMANIS. Hellenic Oceanoloev and Limno-logy XI (1973) 651 .
31. M. NIKOLAIDOU, A.P. GRIMANIS, M. VASSILAKI-GRIMANI, G. ADAM, Ann. Paed. Clin.Univ. Athens 20 (1973) 141.
32. T. HOPKINS, A.P. GRIMANIS, G. PAPACOSTIDIS, T. PAPADOPOULOS, Thalassia Jugosla-vica, 9(1/2) (1973) 219.
33. C. PAPADOPOULOU, A.P. GRIMANIS, I. HADZISTELIOS, Ibid 9(1/2) (1973) 211.34. A.P. GRIMANIS, Certain aspects of neutron activation analysis as applied to
biological materials: Panel meeting on practical aspects of Neutron ActivationAnalysis, IAEA, Vienna (1973).

14
3B.
36.
37.
38.
39.
40.
41.
42.43.
44.
45.46.47.48.49.50.51 .52.53.
54.
55.
56.
57.
58.
59.
60.
61.
62.
63.
64.65.
66.67.
68.69.70.71 .
73.
7475.
D. ALEXIOU, Contribution in the study of trace elements in the mother and thenewly born baby. Thesis submitted for a Readership at the University of AthensAthens (1974) (in Greek).W. BOCK-WERTHMAN, G. PAPAKOSTIDIS, A.P. GRIMANIS, J. PETROU, D. GEORGIOU, M.VASSILAKI-GRIMANI, "ACTANAL" A comprehensive computer program for routineactivation analysis using Ge(Li) detectors. Rept. DEMO 74/15, Greek AEC, NRCDemokritos, Athens (1974).G. PAPACOSTIDIS, A.P. GRIMANIS, D. ZAFIROPOULOS, G.B, GRIGGS, T. HOPKINS,Marine Pollut. Bull. 6(9) (1975) 136.M.I. KARAYANNIS, M. VASSILAKI-GRIMANI, A.P. GRIMANIS; Chimika Chronika, New•Series 3 (1974) 21.D. ALEXIOU, A.P. GRIMANIS, M. GRIMANI, Arch. Med. Soc(in Greek).E. KOUMANTAKIS, The concentration of Zn, Zo and Se in the eyes of the premature
Athens (1975) p. 234,
M.D. Thesis, Univ. of Athens, Athens (1976) (in
A.P. GRIMANIS, MA.P. GRIMANIS, MCCDCI
PAPADOPOULOU, I,HADZISTELIOS, C.
and normal newborn babies.Greek).E. BAIRAKTARI-KOURI, Contribution in the study of trace elements, Zn,Fe,Co,Cs,Se.Sb in myomatus uterus. M.D. Thesis University of Athens, Athens (1976)(in Greek).C. PAPADOPOULOU, G.D. KANIAS, Acta Adriatica, Vol. XVIII (1976) 365.C. PAPADOPOULOU, G.D\ KANIAS, E. MORAITOPOULOU-KASSIMATI, Marine Poll. Bull.7(8) (1976) 143.D. ALEXIOU, A.P. GRIMANIS, M. GRIMANI, G. PAPAEVANGELOU, C. PAPADATOS, Biologyof the Neonate, 28 (1976) 191.C. PAPADOPOULOU, G. KANIAS, I. HADZISTELIOS, J. Radioanal. Chem. 31 (1976) 389.
VASSILAKI-GRIMANI, G.B. GRIGGS, Ibid 37 "(1977) 761.VASSILAKI-GRIKANI, M.I. KARAYANNIS, Ibid 39 (1977) 21.
PAPADOPOULOU, E. KASSIMATI, Thalassia Yugoslavia 13 (1977) 187.PAPADOPOULOU, G.D. KANIAS, Marine Poll. Bull. 8 (19770 229.ZAFIROPOULOS, A.P. GRIMANIS, Ibid. 8 (1977) 79.
HADZISTELIOS, Rapp. Comm. Int. Mer. Medit. 24 (1977) 89.PAPADOPOULOU, J. Radioanal. Chem. 36 (1977) 427.
D. ALEXIOU, A.P. GRIMANIS, E. KOUMANTAKIS, G. PAPAEVANGELOU, M. GRIMANI, C.PAPA-DATOS, Paediatric Research 11 (1977) 646.A.P. GRIMANIS, D. ZAFIROPOULOS, M. VASSILAKI-GRIMANI, Environmental Science andTechnology 12 (1978) 723.A.P. GRIMANIS, M. VASSILAKI-GRIMANI, S. FILIPPAKIS, N. YALOURIS, N. BOSANA-KOUROU, STILI Memorial Volume to N. Kontoleontos (1978) 318 (in Greek).A.P. GRIMANIS, D. ALEXIOU, M. GRIMANI, Paediatriki 41 (1978) 89 (in Greek).
D. ALEXIOU, A.P. GRIMANIS, M. GRIMANI, G. PAPAEVANGELOU, E. KOUMANTAKIS, C.PA-PADATOS, Iatriki 33 (1978) 56 (in Greek).A.P. GRIMANIS, C. PAPADOPOULOU, D. ZAFIROPOULOS, M. VASSILAKI-GRIMANI, N. TSI-MENIDIS, IVes JourntSes Etud. Pollution ANTALYA, CIESM (1978) p. 233.C. PAPADOPOULOU, D. ZAFIROPOULOS, I. HADZISTELIOS, C. YANNOPOULOS, M.VASSILAKI-GRIMANI , Ibid (1978) p. 231.A.G. MANOUKAS, A.P. GRIMANIS, B. MAZOMENOS, Ann. Zool. Ecol. Anim. 10 (1978)123.A.P. GRIMANIS, M. VASSILAKI-GRIMANI, D. ALEXIOU, C. PAPADATOS, Proc. NuclearActivation Techniques in the Life Sciences, IAEA, Vienna (1978) p. 241.E. BAIRAKTARI-KOURT, C. PAPADOPOULOU, N. PAPACHARALAMBUS, Ibid. IAEA. Vienna(1978) p. 363.G.B. GRIGGS, A.P. GRIMANIS, M. VASSILAKI-GRIMANI, Environment. Geology 2 (1978)97.G.O. KANIAS, S.M. PHILIANOS, J. Radioanal. Chem. 46 (1978) 87.C. PAPADOPOULOU, G.D. KANIAS, E. MORAITOPOULOU-KASSIMATI, Marine Pollut. Bull.9 (1978) 106.C. PAPADOPOULOU, I. HADZISTELIOS, Rapp. Comm. Int. Mer. Medit. 25/26 (1970) 5.I. ROUSSOS, A.P. GRIMANIS, S. ECOVOMOU, Memorial volume to Prof. N. Charamisof the Hellenic Opthalmological Society (1979) 117 (in Oeek).G.D. KANIAS, S.M. PHILIANOS, J. Radioanal. Chem. 52 (1979) 389.G.D. KANIAS, A. LOUKIS, S.M. PHILIANOS, Ibid 54 (1979) 103.G.D. KANIAS, Tbid. 60 (1980) 237.C. PAPADOPOU! OU, G.D. KANIAS, E. MORAITOPOULOU-KASSIMATI, Marine Poll. Bull.11 (1980) 68.J . S . ANDREOTIS. C. PAPADOPOULOU. Ves .Tourne'es Etud. P o l l u t i o n s C a g l i a r i , CIESM(1980) 313.A.P. GRIMANIS, D. ZAFIROPOULOS, C. PAPADOPOULOU, M. VASSILAKI-GRIMANI, Ibid.(1980) 407.C . PAPADOPOULOU, D . ZAFIROPOULOS, A . P . GRIMANIS I b i d . ( 1 9 8 0 ) 4 1 9 .M. ANGELIDIS , A . P . GRIMANIS, D . ZAFIROPOULOS, M. VASSILAKI-GRIMANI, I b i d . ( 1 9 8 0 )4 1 3 .

15
76. C. PAPADOPOULOU, D. ZAFIROPOULOS, Thalassia Yugoslavica 16 (1980) 29377. A . P . GRIMANIS, S.E. FILIPPAKIS, B. PERDIKATSIS, M. VASSILAKI-GRIMANI, N.BOSANA-
KOUROU, J. Archaeological Science 7 (1980) 227.78. A.P. GRIMANIS, S. ECONOMOU, Proc. Panhellenic Congr. of Opthalmology (1981)
1 8 7 a79. A . P . GRIMANIS, Proc. First Panhellenic Congress of the Hellenic Nuclear Society
Athens, Section B21 (1981) 1 (in Greek).80. A.P. GRIMANIS, Ibid. Section G3 (1981) 1 (in Greek).81. A.P. GRIMANIS, M. VASSILAKI-GRIMANI, G.D. KANIAS, Proc. 2nd Intern. Flavor
Conference, Athens, in: "The Quality of Foods and Beverages Chemistry andTechnology, (G. CHARALAMBOUS, G.INGLETT, Eds.) Academic Press N.Y. , vol. 2(1981) 349.
82. S.E. FILIPPAKIS, A.P. GRIMANIS, B. PERDIKATSIS, Science and Archaeology 23(1981) 21.
83. M. ANGELIDIS, D. ZAFIROPOULOS, A.P. GRIMANIS, Proc. 1st Intern, Meeting onEnviron. Pollution in the Medit. Region, Athens. Publication of the Medit.Scient. Association of Environ. Pollution (1981) 181.
84. D. ZAFIROPOULOS, C. PAPADOPOULOU, M. VASSILAKI-GRIMANI, Ibid. (1981) 187.85. C. PAPADOPOULOU, I. HADZISTELIOS, M. ZIAKA, D. ZA^IROPOULOS, Rapp. Comm. Int.
Mer. Medit. 27 (1981) 135.86. C. PAPADOPOULOU, C. YANNOPOULOS, I. HADZISTELIOS, Ibid. 27 (1981) 195.87. A.P. GRIMANIS, G.D. KANIAS, J. Radioanal. Chem. 72 (1982) 587.88. I. HADZISTELIOS, C. PAPADOPOULOU, Ibid. 72 (1982) 597.89. K. ANTONIOU. Concentrations of Se, Rb and Zn in maternal and cord blood serum
and amniotic fluid of women with normal and prolonged pregnancies. M.D.Thesis,University of Athens (1982).
90. K. ANTONIOU, M. VASSILAKI-GRIMANI, D. LOLIS, A.P. GRIMANIS, J. Radioanal. Chem.70 (1982) 77.
91. A. KOURIS, Contribution in the study of the trace elements Zn, Fe, Co, Se, Rb,Sb, Ag, Cs, Cr and Se in the human cataractous lenses, M.D. Thesis, Univ. ofAthens (1982).
92. G. THEODOSSIADIS, T. KOURIS, C. PAPADOPOULOU, Opthalmic Research 14 (1982)436.
93. J. ANDREOTIS, C. PAPADOPOULOU, Vies Journees Etud. Pollutions Cannes CIESM(1982) 299.
94. A.P. GRIMANIS, D. ZAFIROPOULOS, C. PAPADOPOULOU, T. ECONOMOU, M. VASSILAKI-GRIMANI, Ibid. (1982) 319.
95. M. ANGELIDIS, D. ZAFIROPOULOS, A.P. GRIMANIS, Ibid. (1982) 339.96. G.D. KANIAS, Contribution of Neutron Activation Analysis in Pharmaceutical
Technology. Determination of active ingredients of drugs. Ph.D. Thesis,Univ. of Athens, Athens (1983) (in Greek).
97. D. ZAFIROPOULOS, Application of Neutron Activation Analysis in studies oftrace elements of Saronikos Gulf. Ph.D. Thesis, Univ. of Athens, Athens (1983)
98. E. BAIRACTARI-KOURI, C. PAPADOPOULOU, M. AGAPITOS, N. PAPACHARALAMBUS, Proc.15th European Congress of Pathology, Hamburg 1983 in "Pathology Research andPractices", 178 (1983) 109.
99. C. PAPADOPOULOU, J. ANDREOTIS, Rapp. Comm. Int. Mer. Medit. 28 (1983) 211.100. A.P. GRIMANIS, MARIA-VASSILAKI-GRIMANI, G.D. KANIAS, Proc. 3rd Intern. Flavor
Conference Corfu, Greece, in "Instrumental Analysis of Foods and Beverages"Recent Progress (G. CHARALAMBOUS, G. INGLETT, Eds.) Academic Press, N.Y.,vol. 2 (1983) 323.
101. C. PAPADOPOULOU, Ibid. vol. 1 (1983) 423.102. G.D. KANIAS, J. Radioanal. and Nucl. Chem. 82/1 (1984) 143.103. G.D. KANIAS, N.H. CHOULIS, Ibid. 83/2 (1984) 261.104. A. ECONOMOU, J. ANDREOTIS, C. PAPADOPOULOU, Ibid, (in press).105. G.D. KANIAS, J. Radioanal. and Nucl. Chem. (in press).106. G.D. KANIAS, N.H. CHOULIS, Ibid. 88 (1985) 281.107. D. APOSTOLOV, M. IOVCHEV, L. KINOVA, I. PENEV, E. TASKAEV, A.P
KANIAS, C. PAPADOPOULOU, M. VASSILAKI-GRIMANI, D. ZAFIROPOULOSEtud. Pollution, Lucerne CIESM (in press).
108. C. PAPADOPOULOU, J. ANDREOTIS, M. VASSILAKI-GRIMANI, C. YANNOPOULOS, Ibid,(in press).
109. A.P. GRIMANIS, D. ZAFIROPOULOS, N. KALOGEROPOULOS, M. VASSILAKI-GRIMANI, Ibid,(in press).
110. A.P. GRIMANIS, Proc. Research Coordination Meeting for the HMO/IAEA JointResearch Programme on Trace Elements in Cardiovascular Diseases, Kjeller,Nor-way 19-21 Sept. 1977.
111. L. KORITO, M. SHWACHAMAN, Nature 202 (1964) 501.112. H. AGEMIAN, A.S.V. CHAU, Analyst 101 (1976) 761.113. A.P. GRIMANIS, Unpublished data.114. A.A. KATSANOS, A. XENOULIS, A. HADJIANTGMIOU, R.W. FINK, Nucl. Inst. and Meth.
137 (1976) 119.115. A.A. KATSANOS, A. HADJIANTONIOU, Ibid. (1978) 469.
GRIMANIS, G.D.Vlles Journees

116. A.A. KATSANOS (invited review paper) Proc. Nuclear Activation Techniques inthe Life Sciences, IAEA, Vienna (1978) 85.Y. MANIATIS, A.A. KATSANOS, ANTHROPOS 7 (1980) 136.A.C. XENOULIS, C.E. DOUKA, T. PARADELLIS, A.A. KATSANOS, J. Radioanal. Chem.63 (1981) 65.Y. MANIATIS, A.A. KATSANOS, Archaeometry 24 (1982) 191.G.A. MOURKIDES, A.A. KATSANOS, M. TZOUMEZI, Chemistry in Ecology 1 (1983) 245.G. BLONDIAU, J.L. DEBRUN, G. COSTA, A.A. KATSANOS, G. VOURVOPOULOS, Nucl.Inst. and Meth. Bl (1984) 66.
122. N.N. PAPADOPOULOS, J. Radioanal. Chem. 72 (1982) 463.
117118
119120121

1=1 In
METHODS
IN
ACTIVATION ANALYSIS

EPITHERMAL NEUTRON FLUX DISTRIBUTION AND ITS IMPACT ON {n,T)
ACTIVATION ANALYSIS RESULT
S.Jovanovic+, F.De Corte++ , A.Simonits+++, L.Moens++, P.Vukotic+,R.Zejnilovi<f\ J.Hoste++
Institute for Mathematics and Physics, Univ."v.Vlahovi<f°Cetinjski put bb, Yu-81ooo Titograd, Yugoslavia
+Institute for Nuclear Sciences, State University Gent,Proeftuinstraat 86, B-9ooo Gent, Belgium
+Central Research Institute for Physics, H-1525 Budapest 114,P.O. Box 49, Hungary.
ABSTRACT
The present paper deals with the epithermal neutron flux distribution
in a thermal reactor. The differences are discussed between the simplified
model, introduced to derive the generally accepted ideal 1/E - law, and the
conditions existing in an actual reactor. For absolute and comparator types
of (n,lf) activation analysis (NAA), the semiempirical 1/E form is a be-
tter approximation - necessary to introduce, but sufficient for practical
purposes. Parameter a , being a measure of the epithermal nonideality, is
a characteristic of the reactor site. The impact of this nonideality on NAA
result is outlined, together with the method for appropriate correction.
INTRODUCTION
After being released by fission of the fuel nuclei, with MeV order ene-
rgies, neutrons in a thermal reactor undergo successive collisions with the
moderator atomic nuclei, losing gradually their energy, down to the thermal
region (meV energies). While in this (moderation or slowing-down) state, ne-
utrons contribute to the epithermal spectrum.
The exact theoretical treatment of the moderation process is extremely
complicated, due to the multiplicity and complexity of the partial processes
involved. However, a fair approximate solution is obtained by introducing
some simplifications, which are more or less adequate for a general thermal
Research Associate of the National Fund for Scientific Research, Belgium
reactor 1,2 These are:
- the moderation takes place in a homogeneous, infinite medium;
- the sources of fission neutrons are homogeneously distributed
troughout the moderator;
- the moderator atoms are free and at rest before being struck
by neutrons;
- the moderator nuclei have the same mass as the neutrons;
- absorption (resonance or 1/v absorption), inelastic and anisotro-
pic elastic scattering during moderation do not occur;
- elastic scattering is energy independent.
Under the above assumptions, moderation is treated by means of theclassic collision theory and the neutron transport theory. The epithermalneutron flux per unit energy interval is then found to be inversely propo-rtional to the neutron energy:
where the proportionality constant
(1)
(2)
is the conventional "epithermal flux", with
qQ = "source strength", i.e. number of fission neutrons arriving
per cm3 and per second at the considered site;
{ = average logarithmic energy decrement per collision;
N = number of moderator nuclei per c m ;
os = microscopic cross-section for elastic scattering (Is=Nus
is the macroscopic scattering cross-section).
Resonance integral (I o), an essential nuclear parameter when perfo-
rming absolute or comparator type standardization methods in (n,T") reactor
neutron activation analysis (NAA), is defined, measured, tabulated in lite-
rature and should be used assuming ideal (1/E) epithermal flux shape:
JECd
(3)

with
ECd " effective cd cutt-off energy (=o.55eV)<r(E)- (n, Y) cross - section.
THE REAL EPITHERMAL FLUX DISTRIBUTION
The simplifications introduced to derive the 1/E-law are obviously
differently valid from one reactor to another or even within the same re-
actor. Nevertheless, let us try to put them in a certain order of importa-
nce (of how they influcence the epithermal spectrum shape) and make some
general conclusions.
a ) Ib§-r.§5£tor_configuration is found in practice the most important
reason for the deviation of the epithermal flux from the ideal 1/E - dis-
tribution. The assumption that sources of fission neutrons (fuel) are homoge-
neously distributed troughout the moderator is quite fair if the fuel (e.g.
in form of rods) is evenly disposed all over the moderator, as is the case
with many power reactors. In another typical configuration, frequently met
with small reactors, the fuel is concentrated in the core, being surrounded
by the moderator. The shape of the epithermal spectrum varies then with the
distance from the core and the deviation from the 1/E-behaviour increases
with increasing distance.
Other construction elements, like control and safety rods or plates,
structurajmetals, etc., have an impact as well (by absorption; see further).
The way of how the reactor configuration affects the epithermal spe-
ctrum shape can hardly be theoretically descrit-'d in its generality.
b) Leakage cf_neutrgns is neglected by supposing the medium to beinfinite. Thus, deviations can be expected when the leakage becomes sin-nificant: close to the reactor boundaries and, in general, more seriousfor small reactors than for large ones. The impact of leakage is hence clo-sely related to the reactor configuration.
c) Absorgtion (resonance or 1/v) of neutrons during moderation is
neglected. However, it inevitably occurs: by fuel (e.g. 3 5 U ) , by fertile
material (e.g.Z38U), by structural material (steel, etc.)t control and sa-
fety elements, poisons or by the moderator itself. This topic has been
extensively studied3, since it is essential for reactor criticality calcu-
lations (neutron balance).
In presence of resonance absorption, relation (1), describing the
epithermal flux distribution is modified to :
»:(E)4P(E) (4)
o
where p(E) is the "resonance escape probability":
pCE) = exp (- |S ^.5
with
(5)
Es = energy at which neutrons are produced(source supposed monoenergetic);
<7a, = microscopic absorption and total cross-section of the
medium, respectively.
Thus, the epithermal spectrum will have sharp dips at the energies
where resonance absorption occurs, the magnitude of the dips increasing with
the amount of the absorber present.
The resonance absorption increases with increasing temperature of themedium, due to the Ooppler broadening of the resonances .
Note that 1/v-absorption is not included in the above. Whatever small,as compared to resonance absorption, 1/v-absorption might distort the 1/E-sp-ectrum, especially at lower energies.
d) As a moderator hydrogen (A=l) is assumed, by taking the mass of the
moderator nuclei equal to the mass of neutrons. This is a good approximation
for light water, but less so for heavy water, beryllium or graphite, which
are also commonly used as moderators (or reflectors).
Is can be shown that in such cases (A>1) the 1/E epithermal distribu-
tion is not valid in the energy range close to the energies at which neutrons
are produced (significant from -0.1 MeV on). This deviation is described by
PLACZEK and increases with increasing mass number of the moderator.
However, close to 0.1 MeV, the epithermal spectrum is already distu-
rbed by the low energy tail of the fast spectrum; 0.1 MeV is thus usually
considered as the upper limit of epithermal neutrons.
From the practical (n,V) -activation standpoint, neutrons from thisregion are, in any case, too few to be significant.

The assumption of homogeneity of the medium is only satisfied when it
is a liquid, not when it is a solid (e.g.graphite). In the latter case, tubes
or gaps are made trough to let the coolant flow.
e) Inelastic_and_anisotrogic elastic scattering are neglected. Thismeans that solely elastic scattering is considered responsible for the slo-wing-down of neutrons.
Inelastic scattering is possible only above the treshold energy which
is a few MeV for light nuclei; thus, it does not affect the epithermal spe-
ctrum.
Anisotropic (not spherically symmetric) elastic scattering occurs
with p-wave neutrons (angular momentum = 1) and is considerable above 0.1 MeV.
This effect would increase the 1/E-fiux with increasing energy.
The elastic scattering cross-section {a) is assumed constant (energy
independent) within the epithermal energy region. For light nuclei, used as
moderator, this is valid up to~0.1 MeV, or even less (~10 keV for H), as
shown in Fig.l. The variation of a% directly influences the w e(E) shape [Eqs.
(1). (2)1.
We will keep in mind that 0.1 HeV is the upper epithermal energy limit,
the region above having little relative importance in practice.
f) Moderator atoms are considered as free and at rest before collisionwith neutrons. This is fair as long as the neutron energies are much abovethe thermal. Once they are comparable, thermal agitation (and even chemicalbindings) of the moderator atoms will affect the spectrum.
In practice, however, the lower limit of the epithermal spectrum is de-
termined by the "cadmium cut-off energy" (=o.55eV) , thus sufficiently high
so that the above has no influence on the 1/E shape.
So as to describe the real epithermal flux distribution, a semieprirical
representationa P. "
(6)
with 0 as in (2) and Ea(=leV) an arbitrary energy, was introduced ' for its
simplicity and good agreement with the experimental data. AHMAD recently rela-
ted a to the actual properties of a reactor and showedthe physical reasonab-
leness of the form (6) chosen.
Thus the parameter „ , to a first approximation energy independent, isa measure of the epithermal spectrum deviation from the ideal 1/E-distribution;for a =0, »g{E)~l/E.
u can be positive or negative, corresponding to a softened or hardenedspectrum, respectively, as compared to the ideal one. This is illustrated inFig. 2. When plotting log . ""'(E) vs.log E, a straight line is obtained withslope = -(1+a).
The numerical value of a for a given position in a reactor could be,
in principle, calculated using some of the formulae given in literature .
However, theoretical descriptions of a generally suffer from inevitable (over-
simplifications, the validity of which'varies from one reactor to another, or
even from one irradiation site to another in the same reactor. For practical
purposes, experimental a-determination , being general, more accurate and
relatively simple is a better and already explored alternative.
Let us still mention that the 1/E model surely does not fit exactlythe epithermal spectrum shape.It is only a better approximation than the ide-alized 1/E - form. Detailed error propagation study showed, however, that the
1/E ° model was necessary to employ, but also sufficient for use in absolute14and comparator NAA .
THE IMPACT OF EPITHERMAL SPECTRUM DEVIATION ON NAA RESULT
Since the definition of resonance integral [ Eq.(3)) holds for the id-eal epithermal spectrum, the latter should be corrected for the actual dis-tribution:
w = JJECd
7t*ad£ (7)
To convert lQ - y o ) the following relation is used15:
1.-0.429 a 0.429oo(8)
with
a = (n,Y) cross-section at 22oo m.s neutron velocity;
Er= effective resonance energy ~ (in eV), which is characteristicof the isotope.

When neglecting the epithermal spectrum nonideality in absolute or
comparator NAA, i.e. when employing Io in place of I 0 M . an error is
made on the analysis result. The magnitude of the error depends on:
- the isotope, characterized by its Er and QQ values (Q0=I0/ff
0)J
- the irradiation conditions, determined by f and a; f is the
thermal to epithermal flux ratio (shortly "flux ratio"): f=0t[)/(Je;
- the comparator used (when applying k - or another comparator
method);
- the type of analysis, i.e. whether the sample is irradiated in the
whole reactor spectrum (reactor neutron activation analysis, RNAA), or
with thermal neutrons screened out by Cd - filter (epicadmium neutron
activation analysis , ENAA).14Since the more detailed error - study overcomes the scope of the
present paper, let us limit to a few interesting conclusions:
- errors are higher than 60% in soma extreme cases; often 5-15" in
RNAA and Z5-4o% in ENAA,
- errors are larqerin ENAA (Cd-covered activation) than in RNAA (bare
activation).This i- due to the fact that in ENAA the whole activity is
induced by epithermal neutrons (whose nonideal spectrum causes the error),
while in RNAA the error is reduced due to the thermal activation contri-
bution.
- in general, error increases with the absolute value of a ;
- errors are larger for isotopes with high Q - factor,than for those
ones with low QQ.For yery low QQ(e.g. Q O<1) the errors are negligible;
these isotopes do not ask for I_-I.(») correction.18 19
- In single comparator methods (e.g. kQ- ' J, the error reduces forthe isotopes whose Qn and E_ values are close to those ones of the compa-
197rator (e.g. Au), since the comparator is exposed to the same epithermaldeviation as the isotope analysed.
To correct the analysis result for the epithermal flux nonideality,
the values of a and Er should be known [ Eq.(8}| . As already mentioned,
it is relatively easy to determine a experimentally, while Er's can be
found in literature ' or measured independently ' . In most cases the
remaining error on the analysis result after correction (originating from
the inaccuracies in a and Ep- values) is within tolerable limits.
CONCLUSION
The nonideality of the epithermal neutron flux distribution should. be taken into account when performing absolute or comparator methodsof (n.lf) activation analysis - significant errors could appear otherwi-se. Two parameters are sufficient for the correction: a , the measureof the epithermal nonideality and the effective resonance energy (E ),characterizing the isotope investigated.
ACKNOWLEDGEMENTS
The financial support of the National Fund for Scientific Research(Belgium) and of the Montenegrin SIZ for Science (Yugoslavia) is highlyappreciated.
REFERENCES
1. A.M. WEINBERG, E.P. WIGNER, The Physical Theory of Neutron Chain Reactors,The University of Chicago Press, Chicago, 1958
2. P.SCHUMANN, D.ALBERT, Kernenergie, 2 (1965) 88
3. A.M.WEINBERG, E.P.WIGNER, Proceedings of the Brookhaven Conference on
Resonance Absorption of Neutrons in Nuclear Reactor (BNL-433) 1956
4. J.R.LAMARSH, Nuclear Reactor Theory, Addison-Wesley, Reading, MenloPark, London, Amsterdam, Don Mills, Sydney, 1966 (second printing, 1972)
5. G.PLACZEK, Phys. Rev., 69 (1946) 423
6. H.GOLDSTEIN.J.A.HARVEY, J.S.STORY, C.H.WEST COTT, Recommended Definitions
for Resonance Integral Cross-sections, Rept. EANDC-12 (1961)
7. T.B.RYVES, Metrologia, 5 (1969) 119
8. A.AHMAD, "Evaluation of Neutron Spectra and Activation Data in Thermal
Reactors", Ph. D. Thesis, University of London, Reactor Centre, 1982
9. Guidebook for the ENDF/E-V Nuclear Data Files, EPRI NP-251o Project 975-1Electric Power Research Institute and BNL, Upton, New York, 1982
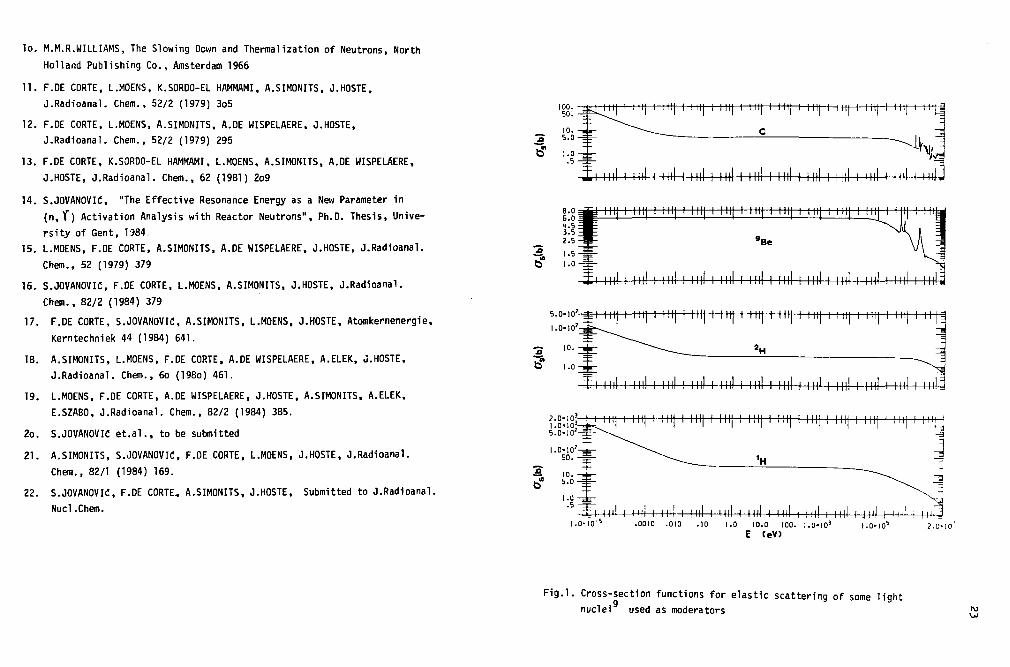
10. H.M.R.WILLIAMS, The Slowing Down and Thermalization of Neutrons, North
Holland Publishing Co., Amsterdam 1966
11. F.DE CORTE, L.MOENS, K.SORDO-EL HAHMAMI, A.SIMONITS, J.HOSTE.J.Radioanal. Chem., 52/2 (1979) 3o5
12. F.DE CORTE, L.MOENS, A.SIMONITS, A.DE WISPELAERE, J.HOSTE,J.Radioanal. Chem., 52/2 (1979) 295
13. F.DE CORTE, K.SORDO-EL HAMMAMI, L.MOENS, A.SIMONITS, A.DE WISPELAERE,
J.HOSTE, J.Radioanal. Chem., 62 (1981) 2o9
14. S.JOVANOVIC, "The Effective Resonance Energy as a New Parameter in
(n,lf) Activation Analysis with Reactor Neutrons", Ph.D. Thesis, Unive-
rsity of Gent, 1984.
15. L.MOENS, F.DE CORTE, A.SIMONITS, A.DE WISPELAERE, J.HOSTE, J.Radioanal.
Chem., 52 (1979) 379
16. S.JOVANOVIC, F.DE CORTE, L.MOENS, A.SIMONITS, J.HOSTE, J.Radioanal.
Chem., 82/2 (1984) 379
17. F.DE CORTE, S.JOVANOVIC, A.SIMONITS, L.MOENS, J.HOSTE, Atomkernenergie,
Kerntechniek 44 (1984) 641.
18. A.SIMONITS, L.MOENS, F.DE CORTE, A.DE WISPELAERE. A.ELEK, J.HOSTE.
J.Radioanal. Chem., 6o (198o) 461.
19. L.MOENS, F.DE CORTE, A.DE WISPELAERE, J.HOSTE. A.SIMONITS, A.ELEK.
E.SZABO, J.Radioanal. Chem., 82/2 (1984) 385.
20. S.JOVANOVIC et.al., to be submitted
21. A.SIMONITS, S.JOVANOVIC, F.DE CORTE, L.MOENS, J.HOSTE, J.Radioanal.
Chem., 82/1 (1984) 169.
22. S.JOVANOVIC, F.DE CORTE., A.SIMONITS, J.HOSTE, Submitted to J.Radioanal.
Nucl.Chem.
100.50.
j f e l l l l l I I I I ] I n i l I I l l j I n i l I n i l I I I I ] I n i l I I l l j I M l ] I I I I ] I l l l [ j
to" i.o
±\ ml i nil i ml i ml i nil I nil I nil i nil i nil i nil i ml i ml.
I l l l | I I i 11 I l l l | I I l l j I I l l j I I I I ) I I I ! ) I I
"Be
nil i ml i nil i ml i nil i nil i ml i i
l l l | I n i | i n i | I i l l j i n i | i i n ; i n i | I n i | I n i j g
i ml i ml i ml i ml i nil i ml i nil i nil i ml i nil i ml i niu
2.0-10^-1.0-10
i n i | t M I ( i n i | i i n ; i n i | i n i | i n i [ •! i i i j i n i | i i i i j i i i
1.0-10'5"I i ml i ml i ml i ml i ml i ml i ml i .ml i ml \ i pH0010 .010 .10 1.0 10.0 100. 1.0-103 I .0-I05 2.0-10"
E (eV)
Fig. l . Cross-section functions for elastic scattering of some lightnuclei used as moderators

10-3 10 10* 106 EleV)
Fig.Z. The epithermal neutron spectrum deviation :
1/E

25
THE NEUTRON ACTIVATION ANALYSIS IN THE STUDY OP LANGMUIR-BLODGETT MULTILAYERS COMPOSITION - RELATION TO OTHERMETHODS OS INVESTIGATION
J.G.Petrov, I.KuleffFaculty of Chemistry, University of Sofia,1, Anton Ivanov ave., 1126 Sofia, Bulgaria
Langmuir-Blodgett multilayers are molecular structures built up in a con-trolled manner by means of irreversible transfer of monolayers of insoluble andnon-volatile organic compounds from a liquid/gas onto a solid/gas interface/1,2/.These lamellar systems are used as gratings for soft X-rays, ion selective mem-branes, mioroeleotronic gas sensors, electroluminescence panels, tunnelling de-vices, e t c / 3 / . The controlled distance between the functional groups has beenutilized in many fundamental studies dealing with energy transfer, light inter-ference effects and other optical and electrooptleal phenomena /4/.Incorporationof enzymes, proteins and antibodies in such assemblies models different biolo-gical systems and enables the investigation of enzyme - substrate and immunolo-gical reactions.
Long chain fatty acids and their bivalent soaps are commonly used to buildup multilayers of good quality /2 / . Recently long chain ammonium salts have beenalso successfully applied /5,6/. These compounds can be irreversibly transferredonly if the aqueous subsolutians contain Cd2+,9Ca2 , Ba2 , Cuz+ or Pb2* (in thecase of fatty acids) and HPO. , HAsO.2-, CrO^" or S0.2- (when long chainamines are used). The above counter ions play 5 decisive role also in the struct-ure and stability of the systems created /7 / . For this reason an investigationof the counterions bonded in multilayers of ionic surfactants proves Importantfor the understanding of the mechanism of their formation and for finding thefactors which determine their structure and stability.
In /8-11/ we have performed neutron-activation analysis of the compositionof several LB Bystems making use of the high sensitivity of the method as wellas of the fact that these samples are rather appropriate for ItB application.The present,paper compares the features of this method with those of otheranalytical techniques used in the study of LB multylayerB, pointing out the a<pointing out the ad-vantages and shortcomings and discussing the possibilities offerred by the la-parallel application.
ANALYTICAL METHODS APPLIEDExcept for the neu t ron-ac t iva t ion ana lys i s / 8 - 1 1 / , several other techniques
have been used in t he study of the mul t i l aye r s composition: radiometry / 1 3 / ,spectrophotometry / 2 0 / , IR-Bpectroscopy /21-27/ and e leo t ron spectroBcopy forchemical analys is / 2 9 - 3 1 / .
Neutron a c t i v a t i o n analys is (NAA): NAA enables the accurate determinationof a g rea t number of elements even in microamounts and t h i s makes i t appropriatefor t h e inves t iga t ion of inorganio lone in LB mul t i l aye r s . Moreover, these sys -tems a re excellent "matr ices" since t he elements of t h e i r organic cons t i t uen t s(H,C,O,N) are not ac t iva t ed when i r r a d i a t e d with p i l e neutrons / 8 , 1 2 / . In orderto avoid the activation of the solid substrate, the lat ter is covered with apolystyrene foil onto which the multilayers are deposited. The foil is thenquantitatively detached (together with the multilayers), dried and sealed bet-ween two sheets of polyethylene /8 / .
The above procedure allows the instrumental mode of NAA to be applied tothe samples thus obtained. It comprises irradiation in a nuclear reactor, appro-priate "cooling time" and measurement of the induced radioaotivity. Thus theamountB of Od, Ba, Cu, Zn, Ca, Mg, Na, K, P, As, Cr and many other elements canbe determined in LB systems. Particularly when rare earth elements are to beanalysed, NAA is the only method (among those discussed here) giving reliableand accurate results. This possibility is of interest when the stability con-stants of rare earth ions with the surfactants used in their flotation should
eAlimthese features were utilized in the Btudy of the Cd and Ba content inarachidic acid multilayers /8.10/ as well as of P, AB and Cr in octadecylamineand docosylamine LB systemB /8.9.11/. The lower sensitivity with respect to Sand Pb requires a too great number of transferred monolayers (Bee Table I ) ; theproblems arising from this requirement restrict the application of NAA in theseC a S e S l very important advantage of this technique is that unlike the priormethods i t provides a possibility for the simultaneous determination of al l the^inorganio ions in the sample. This feature is very eiricient when LB ™ " J J g e »serve as models of biological systems. Thus competitive reactions <£ °^alentand monovalent cations+(Ca2:F/|a+,K*) or specific reactions of c ° ^ ^ ° n * °*equal charge (Zn^/Cd , HPO^/HAsO^-, SO^ /CrO4* ) can be investigated with

26
a«oUnfoft0l}idB?e a l+° B t r e s s e d *£a* NAA Provides information about the total
amount of the elements analysed, being unable to distinguish their valenFlifaW, , . * t d l O m ! t f 1 C / ? a l v a ' ' R f™A * The h 1 ^ sensitivity which can be IcMevef bydetection of ionizing radiations enables the reliable application of the radiometric analysis in the study of the multilayer stoichiomitry. UnLrtuSfely thetagging technique was used for this purpose on a limited scale ( ^ C a ^ I n dea-r ie acid multilayers /13/) regardless of the fact that all the elements of in!terest (except for Mg) have appropriate radionuclides. May be this is due to theobstacles by the absolute radioactivity measurements and/or to the necessity ex-periments with great amounts of radioactive solutions to be carried out. Theseobstacles can be avoided by standartizing the radioactivity measurements and de-termining the specific rate of counting (the rate of counting per unit of mass)/14/«
An increase of the measurement efficiency through reduction of the area ofcounting without diminishing the radiation intensity can be achieved by means ofthe detachment technique proposed in / 8 / . The difficulties due to self absorp-tion which arise in this cage can bgoCorrected /15/ or the measurements of thepure /?-emittance of -^S, 45Ca and •>*? can be performed witl. liquid scintilla-tion counting /16/.
Some competitive ionic reactions might also be studied by means of RMAwhen gamma speotrometry is used. In the case of Ca i t is possible to work withT'Ca but S and P do not offer any convenient radioactive isotopes.
The tagging compounds are commercially available /17/ or can be obtainedby irradiation with neutrons of appropriate targets in a nuclear reactor /18/.It should be mentioned, however, that the radionuclide and the stable ion candiffer in their chemical forms in solution /19/. This is to be expected particu-larly when inorganic anions are analysed in multilayers of cationic surfactants.
Spectrophotometrv (SPh/r A spectrophotometric determination of Cd2+ inmultilayers of aracnidic acid was carried out in /20/. The multilayer was remo-ved from the glass substrate by treatment with saturated solution of HC1 inchloroform and Cd2+ was determined as a diphenylthiocarbazone complex.
By means of the same removal procedure other counterions can be analysedif stable enough complexes with high extinction coefficients can be formed inchloroform media. Thus 5-Br-pyridylazo-diethyl aminophenol (5-Br-PADAP) can beapplied for the determination of heavy metalB (CU2+, Zn2+, Pb2+, Ba2+) since itgives stable red complexes with £ * 10?,
IR-Speqtroscopy (IRS): This is a nondestructive method providing a detail-ed information about the organic constituent of the multilayers. In the systemsbuilt up of long chain ammonium salts i t can also detect the inorganic anions(if they have individual vibrational frequences /21/) identifying their valentform. When multilayers of fatty acid soapB are studied, the binding of the in-organic cations is determined Indirectly, analysing the ratio of the absorban-ces of the dissociated (1583 cm"1) to non-dissociated (1710 cm"1) carboxylicgroups /22/.
In addition to the ab.ove information, the IR-spectra furnish evidence forbasic salt formation (peaks of the OH group at 3340 and 3715 cm"1 /22,23/, oo-ordinative binding of the metal ions (the specific shape of the bands above1500 cm-1 /24/), hydrogen bonds (broadening of the bands and shift of Vmax t°lower frequences /21/), hydration water (a split carboxyl peak at 1580 and 1540cm-1 /23/), etc. Sometimes polarized IR radiation is applied /25/ in order tostudy the structure of the multilayers. Infrared dichroism was also measured in/26/. I t enables a eonformational analysis of L- aC.-dipalmitoyl phosphatidyl-ethanolamine multilayers to be performed.
Earlier studies utilized transmission IR-speotroscopy of multilayers depo-sited on CaF2, AgCl or ZnS substrates (250-300 monolayers on each side). Now-adays the ATR technique makes it possible to obtain measurable absorbance from
l l l / 2 7 /several monolayers only /d(/. ,„.„.» _. . - . . „ . „Electron Spectroscopy for Ohemical Analysis (ESCA); Except for hydrogen,
a l l the elements may be identified by this method /SJB/. Although the absolutesensitivity of the method is very high ( -1 - 10 ng for most elements), therelative content in the sample is usually determined. Since the emitted elec-trons are easily stopped, ESGA provides information about the last few mono-layers of the LB system (of thickness < 100 I/. This helps to avoid the influ-ence of the subetra-te and to obtain a "pure" signal after the Jepositxon ofseveral monolayers only but diminishes the relative accuracy of Jft£ method.
The ESCA spectra give the composition, valent state and binding e n e ^ i e sof the atoms in the multilayer. When they are recorded at low angles << 3U ;defectB in the multilayers structure can be identified /2y/.

27
i:SCA was applied to IB multilayers in several studies which made use of theirdefinite thickness to standartize the method /30/ and for some fundamental in-vestigations of electron wave lengths in metals and polymers /29,31/. The s toi-chiometry of the Cd arachidate multilayers used was also determined from the in-tensi ty rat ios on C ( 1 S ) , 0 (1S) and Cd(3d) levels. The shifts of the C(1S) elec-tron energies in CH2, COOH and COO- were used to obtain the degree of ionizationof the earboxyl group.
The application of ESCA to LB systems requires special care to be taken oftheir possible "skeletonization" (evaporation of the fatty acid molecules) invacuum /32/ . This effect changes the rat io fatty acid/bivalent soap, resp. thestoichiometric relationship in the multilayer,
OTHER POSSIBILITIES
There are some other unemployed possibi l i t ies for the accurate determina-tion of the inorganic components of the IS systems. These components (except forP and S) are among the 30 elements which are particularly appropriate to be ana-lysed by means of the Atomic Absorption Spectrometry /33 / . The practical appli-cation of this method reouires a quantitative dissolution of the multilayers.This procedure can be performed if the l a t t e r s are deposited onto a glass sup-port covered with a polystyrene foi l . As described in / 8 / f th is foil can beeasily detached and transferred into a small (10 ml) volumetric flask with anappropriate solvent (xylene, methylisobutyllcetone, hexone).
The Inductively Coupled Plasma Atomic Emission Spectroscopy (ICP-AES) hasthe main advantage of NAA (possibility for the simultaneous determination ofseveral elements) at a s t i l l higher, by an order of magnitude, sensitivity (Tab-le l ) / 3 4 / . The determination is very quick and efficient, allowing a l l the inor-ganic ions in the multilayers to be analysed. Here also the dissolution proce-dure recommended for the application of AAS should be performed.
COMPARISON OP THE METHODSIR-spectroscopy has been most often appl ied in the i nves t i ga t i on of LB
m u l t i l a y e r s probably due t o the fact t h a t bes ides the stoichiometry many o therproblems can be solved by i t s use . When mul t i l aye r s of long chain ammonium s a l t sare s tud ied , IRS provides information both for the organic and inorganic compo-nents, giving also the valent states of the la t te rs . If however an accurate de-termination of the multilayers eornpo-sition i s •ainreu, additional- anelyBie of-thecounterions should be performed.
The parallel application of another analytical technique is obligatory whenIRS i s applied to fatty acid multilayers. In this case the IR spectra indicatethe organic molecules only and an independent investigation of the content of in-organic cations proves necessary. NAA, ICP-AES, AAS and RMA possess very highsensi t ivi t ies and following the practical recommendations given above they canbe applied successfully for this purpose. The first two methodB are to be prefer-red when multicomponent (with respect to the counterions) systems are studiedand AAS and RMA are convenient if individual elements are determined. In somecases spectrophotometry, which can be applied without special instrumentationand qualification, gives also accurate resul ts .
The possibility to analyse both the organic and inorganic components of themultilayers makes ESCA suitable for their complex investigation, providing thatthev are not affeoted by the vacuum treatment. However, the stopping of theemitted electrons by thei r passage through 3 - 4 monolayers only res t r i c t s theamount of the analysed material and strongly decreases the «»curaer of the s toi-chiometric determination. For this reason the most important information yieldedby th i s method concerns the binding energies of the atoms in the LB system.
Summarizing a l l above statements, a conclusion can be drawn that if thestructure of thi multilayers, their s tabi l i ty , the molecular interactions o r t h ebinding energies of the elements are to be studied, IRS and ESCA methods shouldbe applied, for a plausible determination of the multilayers composition, how-ever* the inorganic content should be analysed accurately by means of one of the
and 1:2 for mono- and bivalent counterions.

28
'Jafrle I
Element
Ba
Ca
Cd
Cu
K
Mg
Na
Pb
Zn
As
Cr
P
S
NAA /35/
80 ng (++)18120 ng (+)90
6 ng (+++)2
0.04 ng (+++)150 ng (++)3812 ng (+)150.08 ng (+++)114000 ng (-)2000
1 ng (+++)10.03 ng (+++)1
8 ng (+++)5
0.5 ng (+++)1
16000 ng (-)15000
RMA
Ba-131 (++)1 0.37 Ba
Ca-45 (++)1 0.04 Ba
Cd-115m (++)1 0.02 Ba
Cu-64 (+)1 0.42 Bo
K-42 (+)1 0.44 Ba
-
Na-24 (+)1 0.64 Ba
Pb-210 (++)1 5.73 Bq
Zn-65 (++)1 0.61 Ba
As-76 (++)1 0.40 Bq
Cr-51 (++)1 0.68 Bq
P_32 (++)1 0.43 Ba
S-35 (+++)1 0.48 Bq
AAS /33/
8 ng/ml (+++)6
0.5 ng/ml(+++)2
1 ng/ml (+++)1
2 ng/ml (++)4
2 ng/rol (+++)6
0.1 ng/ml(+++)10.2 ng/ml(+++)1
10 ng/ml (+++)61 ng/ml (++)2
0.2 ng/ml(++)1
3 ng/ml (++)6
1.106ng/ml (-)580
-
ICP-AES /34/
1 n<*/E'l (+++)"11.6 ng/ml (+++)5
0.06 ng/ml(+++)
1 ng/ml (++)2
1.5 ng/ml (+++)41.5 ng/ml (++)7
7 ng/ml (++)33
2 ng/ml (+++)1 •
0.2 ng/ml (++)1
3 ng/ml (++)5
C.4 ng/ial (++)1
^ng/g <++)
0.2 ng/c (+++)1
(+) measure of the a p p l i c a b i l i t y of the method.REFERENCES
hi K.B.Blodgett, I.Langmuir, Phys.Rev.,51 (1937)964 ; /2/V.IC.Srivastava, Physicsof Thin Films,7(1973)340; /3/G.G.Roberts, P.S.Vinsett.Y'.A.Barlow.Phys.Technol.,12(1981)69; /4/H.Kuhn,D.I,Sbius,H.BUcher,Physical Methods of Chemistry,Pert I I I ,A.V;eisBberger,B.V/.Rossiter(Eds.),V/iley-Intersci.,NY,1972; /5/J.G,Petrov,H.l<uhn,Ann.Univ.Sofia,Fae.Chim.,71(1976/77) H7; /6/G.L.Gaines,Nature,298(1982)544; HIE.P.Honig .J .Col l . In t .Sc i . ,43(1973)66; /8/I .Kuleff ,J .G.Petrov,J .Radioanal .Chem.,49(1979)239; /9/J .G.Petrov,I .Kuleff ,D.Plat ikanov,Ann.Univ.Sofia,Pac.Chim.,73(1979)145; /10/J .G.Pet rov, I .Kulef f ,D.Pla t i lcanov,J .Col l . In t .Sci . ,0B(1982)29;/11/J .G.Pet rov, I .Kuleff ,unpubl ished r e s u l t s ; /12/D.De Soete.R.Gijbels ,J .Hoste,Neutron Activat ion Analysis ,Wiley-Intersci . ,NY, 1972; /i3/H.Sobotka,H.I)emeny,J.D.Chanley,J .Col l .Sci . ,13( i95e)565; /14/I.Kuleff,D.Todorovski,M.Iovtschev,Brenn-s tof f Warme Kraft,28(1976)319; /15/V.B.Luk'ianov,Measurement and Iden t i f i c a t i onof Beta Radioactive Samples,Gosstomizdat,Iioscow,1963; /i6/I.Kobyashi,D.MondBlay,Biological Impl icat ion of Liquid S c i n t i l l a t i o n Counting,Academic Press,NY,1974;/17/The Radiochemical Center Ltd..AmerBham,England; /18/P.Baumgartner,Table ofNeutron Act ivat ion Constants,Kaxl Tiemig Verlag.KUnehen,1972; /19/A.K.LavrikhinaT.V.Malysheva,E.I.Pavlozkaia,Radiochemical Analysis , ANSSSR,I>loseow, 1963$ /20/J.G.Petrov,H.Kuhn,D.Hbbius,J .Coll . Int .Sci . ,73(1980)66; /21/D.Vollhaxdt,K.Vuttig,J.&.Petrov,G.Malewski,J.Coll.Int.Sci.,in press; /22/J.V,'.ElliB,J.L.Pauley,J.Coll.Sci.19(1964)755; /23/J.Bagg,M.Abramson,M.Fichman,M.Haber,H.Gregor,J.Amer.Cheai.Soc.,86(1964)2759; /24/P.Fromherz in "Regular 2D-Arrays of Biomacromolecules",V.'.Bau-meister(Ed.)Springer Verlag,Berlin, 1980; /25/T.Takenaka,K.Nogami,H.Gotoh,ll.GotohJ.Coll.Int.Sci.,35(1971)395; /^6/H.Akutsu,Y.Kyogoku,H.Hakahara,K.Fulcuda,0hem.&Phys.Lipids,15(1975)222; /27/L.H.Sharpe,Instrument News,15(1965)9; /z*/G-ft;™e-ner,V/.M.Riggs,L.E.Davis,J,F.MoulderfG.E.Muilenberg(Ed. Handbook of X-ray Photo-
Chim.Scand.120(1966)2880; / 3 1 / T . 0 h n i s k i , A . I s h i n , ,mura.J.Phys.Chem. ,82(1978)1989; /32/S.J.Gregg,E.E.Widdowson.Kature,144(1939)666/33/J.navezov,D.Zalev,Atomic Absorption Analysis, Nauka i Izkustvo,Sofia,1980;G.E.Kirkbright in"Elemental Analysis of Biological Materials,IAEA,Vienna,19B0,p . 141; /34/V/.J.Haas,V.A.FasBel,i"bid. p . 167; /35/V.P.Guinn,ibid. p . 105; /36/L.A.Currie,Anal.Chem.,40(1968)586.

29
JJUJTROH AOTHTATIOH AHALYBI8 OF SIMTOOBDUOTOR SILICON
8* Apostolescu, Ana Pantelica, Maria S&lageanInstitute for Physios and Nuclear InglneerlngBucharest WS-6, RomaniaAbstraoti 8oaw romanian semiconductor grade ailicon elides were
analysed by IHAA. Surface and volume contaminations ofthe samples nave been studied.
IHfRCDUOflONThe analysis of impurity oontenta in semiconductor materials is an impor-
tant problem since it ia known that small quantities of these impurities oandrastically change their mechanical and eleotrlcal properties,
IXFBRXIBNTALMany samples of semiconductor silicon slides of various types and diffe-
rent proveniences have been analysed. She analysis of only four romanian semi-conductor silicon samples produced by the Institute for Research and Produc-tion of Semiconductor Materials is presented in this paper. She samples of nor p types materials having the resistivities between 40-ft-on and 1.4 Eftemwere irradiated for 40 hours in a 1.4zl01?n/om2.s. flux. Before the irradia-tion the silicon slides were very oleaned and washed. A solution of 0.105 ugof Au and Soll-5 were used as standards. After 4 - 5 days ooollng time themeasurements have been carried out by using a Ge(UL) deteotor with 2 keV reso-lution coupled to a multichannel analyser. A gamma spectrum of the sample nr.3measured for 2 hours after 4 days deoay time is shown in figure 1.
R1SULTS ADD DISOUSSIGHAs, Au, Br, Oo, Or, Ga. Ef, Mo, Ha, 8b, Zn, ff elements were found out.
from another epeotrum of this sample, Ye oould also be measured. Besides theelements before mentioned, Bo end-Hi arc present in some of the samples. Theresults expressed in lO^atoms/onF are given in table 1. fhe samples labeled4 and 5 are the same type of semloonduotor silioon, the difference consistingonly in the way the samples have been treated prior to the irradiation.
Number 4 was very well washed in deionlsed water while number 5 was et-phed in a 3 i 1 i 1 mixture of acids (010., HF, 0H.0OOH, respectively). Allthe other samples were etched in the abovf mlxiure'of aoids. She impurity con-tents are smaller in the sample 5 as compared to the number 4 as oan be seen.
After these first measurements the samples have been ctohed for 5 minutesin a 5 i 3 I 3 mixture of aoids (HHOx, HF, OHzOOOH, respectively) and verythorougly washed in a shower of water. Measurements of 5 - 6 hours have beenoarried out for eaoh sample, fhe concentration of the elements present intothe volume of the samples is presented in table 2, Results are expressed Inppb.
A study of the variation of some element contents with suoceslve etchingsof the samples after irradiation, is also presented in tabel 3. For this studythe two samples namely 4 and 5 were ohosen, I.e. the same type of silioon pre-pared in different ways before irradiation, fhe results are expressed in 10 1 2
atoms. She Buocesive etchings of 2 minutes in a 5 i 3 i 3 mixture of aoidswere oarried out. After the first etching a high decreasing of the elementcontents oan be observed. A surface contamination of the silioon slides duringoutting, polishing, washing and handling before and after their irradiationoan be oonoluded.
After the second etching, element oontents decreased In a variable ratioIn 1 - 4 region while the third etching reveals that the sample elemental con-tents remains oonstant suggesting no further surface contamination.
A high content of the elements on the surface of the semloonduotor sili-oon slides does Indeed exist. An etching of 5 minutes after the sample Irradia-tion In a 5 i 3 » 3 mixture of aoids reveals only the volume contamination ofsilicon semiconductor slides.
TABU 1 - Slemental oontent (lO^atome/om2)
0 1 2 3 4 5
AS 0.08+0.02 0.12+0.04 0.08+0.03 0.5+0.1AU 0.0280+0*0006 0.0150+0.0003 0.0110+0.0002 32.1+0.4 0.243+0.005

30
0
BrGoOr
v«GaHfHoHaHi8bBoZnW
1
-
0.7+0.17.3+0.980+40
-1.5+0.1
0.49+0.05218+25
12+20.024+0.0060.050+0.005
17+30.44+0.07
Saapl* in
12345
2
1.63+0,090.9+0.13*6+0.667*60
1.4+0.4-
0.82+0.08148+18
-0.031+0.006
-40+7
1.0+0.2
q»A?Tl 2
0.051+0.0040.005+0.0.003+0,
0.0032+0.
,002,001.0003
O.OO29+O.OOO2
3
1.57+0.091.3+0.*3.5+0.6132+650.6+0.3
0.03+0.010.62+0.01
170+21-
4
_
9.3+1.6--
0.06+0.01-
14.1+3.5827+21
23+13O.O15+O.OO3 0.21+0.06
-47+6
1.8+0.3
-194+92
26.2+0.3
- l lemental concentration (ppb)
Mo
--
0.03+0.01O.O5+O.O2
ffa
--
5
„
1.1+0.7--
0.07+0.02-
2.2+0.7117+4
----
4 .8+0.1
W
--
0,49+0.07 0.013+0.0030.50+0.02 -
TABU 3 - Variation of aoiu element oontenta(10 atoms) with auooealve etohinge ofthe aaaplaa after irradiation
Sample 4
•lament Xton-etohing Piret etching Second etching Third etolling
AuIfoHaw
32.1+0.414.1+3.4827+21
26.2+0.3
0.0229+0.00060.103+0.069
6.5+9.B0.024+0.005
0.0050+.0.OOO40.0589+0.0466
5.91+0.730.0139+0.0038
0.0.
0.
0038+0.00040685+0.03425.1+0.7
0163+0.0050
Sample 5
Element Non-etohing First etching Second etohing IMrd etching
AuHo.HaW
0.24+0.012.2+0.7117+94.8+0.1
0.00666+0.000530.286+0.0665.27+0.64
0.O055+O.OO19
0.
0 .
00243+0.000320.108+0.0534.79*0.54
00286+0.00137
0.0030+0.00020.1172+0.0486
4.52+0.72—
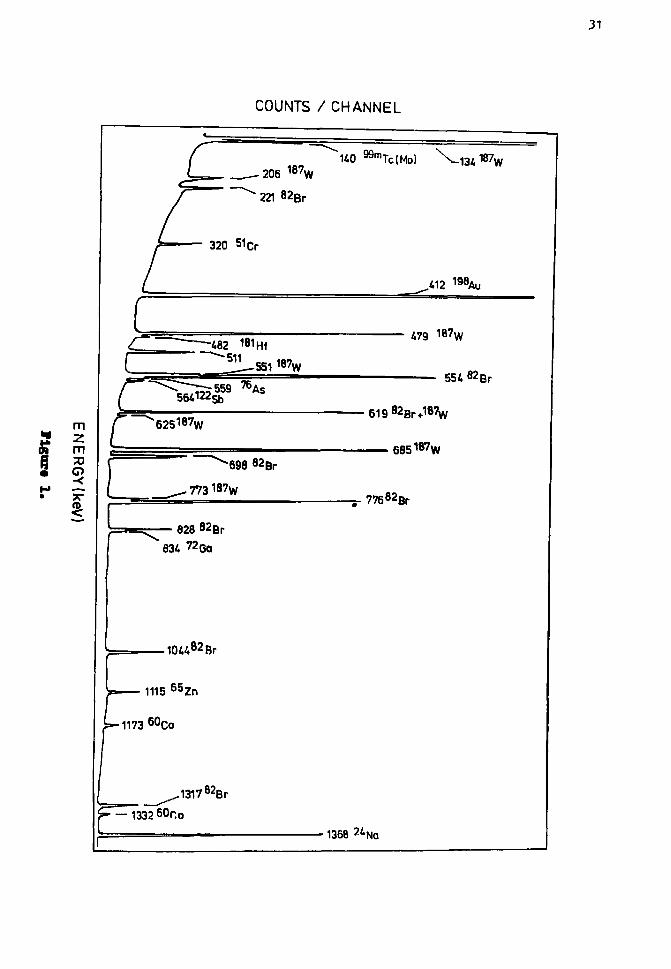
mzma?o
COUNTS / CHANNEL
206 1 8 7W
221 8 2 Br
828 8 2 Br
834 72Oa
"mTc(Mol
1 9 8'Au
479
6851 8 7W
77682Br
r
-1044828r
1115 6 5Zn
1173 60Co
J31782Br
^ — 1 3 3 2 60r.o
• 1368

32
DETERMINATION OF SOME TRhCE ELEMENTS IN BIOLOGICAL MATERIALS
USING THE SHORT LIVED ISOTOPES
E.Taskaev
Institute of Nuclear Research & Nuclear Energy,boul.Lenin No 72, Sofia - 11B4
Studying the trace elements in biology the necessity of vanadiumdetermination often arise (1,2). Its instrumental determination ispractically impossible uith acceptable accuracy in most of the cases. Radio-chemical separation is necessary. Some good procedures for vanadium determi-nation uere proposed (2-5) and the one from Byrne and Kosta (2) was chosen.Determination of some other biologically active elements together uith V isof interest too.
Preparing the sample for analysis and analyzing it for vanadium, theanalyst does the majior part of the uork. So, it is uorthuhile to do somemore separation procedures and get additional information. Radiochemicalprocedure uas even preferable as the errors of instrumental determinationfor these elements (e.g. Cu, fin, Flo etc.) are often bigger than their concen-tration changes in the organs due to bioprocesses. It uas decided to continuethe processing of the sample and to separate Cu, fin, Rb and K. Molibdenumuas isolated together uith vanadium, and consecutive extraction uas used forCu and fin diethy1-dithiocarbamate complexes (6,7) . Sodium tetraphenylborate(Kalignost) uas used for the precipitation of Rb and K (B) .
Standard reference materials SRM-1577 Bovine Liver, SRM-1571 OrchardLeaves and Bouen's Kale were analysed, and the procedure uas used for theanalysis of breast cancer tumors.
EXPERIMENTAL
Irradiation. Samples' tablets about 300 mg Bach were irradiated uithICIS pneumatic sample irradiation system of University of London ReactorCentre (Ascot, GB) . Irradiation time uas 5 min. Irradiation uas carried outin mixed neutron flux: 1.7»1012 thermal neutrons.cm-2.s~1 and 9• 1D11 fastneutrons.om~^.s~'' (9). Samples reached the radiochemical laboratory bypneumotube immediatly after irradiation.
Dissolution. Uet ashing procedure (2) uas usBd for the dissolution.Cnly some differences from (2) uill be mentioned. Carriers for all separatedelements uere put into Kjeldahl flask before dissolution as usualy:V - 400 jjg, Mo - 600 ug, Cu - 3 mg and Rb - 10 mg. 54-Rn and 137-Cs tracers
uere added for chemical yield determination. Thesolution uas dried before sample and acids uereadded to the flask. Solution of KMnO4 used indissolution procedure uas at the same time thecarrier for fin and K. The extraction of M, Mo,Cu and fin uas carried out in siple and effectiveextractor, fig.1. Since V uas separated togetheruith flo, GeLi and multichannel analyser uereused. The contents of the other BlemBnts ueremuch higher than the M content and GeLi uaseffective enough for counting all of them.Samples and standards uere counted in 25 mlvolume flasks, except V and Mo for which 10 mlflasks uere USBC).
Separation of \l and flo. Vanadium and molib-denum uere extracted uith 0.1% N-benzoyl-N-phenylhydroxylamina (BPHA) solution in toluene(2). Organic phase uas counted for 500s and52-V ( Ti/2=3.75 min Ey=1434 kev) uas measured,then it uas counted again for 600s and 101-Mo
Fig.1. Extractor ( T1./2=14.6 min E^=192 kev) uas measured. Thechemical yields ware controled by irradiation
of 0.5 ml aliquotes of organic phases.Separation of Cu. The pH of the aqueous phase uas adjusted at 5 uith
NaOH. Copper uas extracted uith tuo 10 ml portions of 3.5* 10— TO solution ofPb(DDC)2 in CHCI3. Extracts uere gathered, uashed and counted. 511 kev of64-Cu uas used for thB computation. Counting time uas 5 min. Chemical yielduas controled by irradiation of aliquotes.
Separation of fin. About 200 mg of NaDDC uere added to the extractor

33
and manganese uas extracted with tuo 10 ml portions of CHCI3. Extracts ueregathered, uashed and counted for 5 min. 846 kev line of 56-Mn uas used forthe determination. 54-Mn activity uas measured for 900s and B34 kev peakuas used for the calculation of chemical yield after decay of 56-Mn.
Separation of K and Rb. The water phase left- uas transfered in glassbeaker and 20 ml of 0.10 sodium tetraphsnylborate (Kalignost) solution uereadded to precipitate K and Rb. The solubility of KB(C 6H5) 4 and RbB(CfiH5)4could be lessened by decreasing the temperature of the solution using theice bath and uith the surplus of precipitant. The precipitate uas filtratedand uashed uith cold 0.011*1 Kalignost solution. Then it uas dissolved in ace-tone and transfered into the flask for measurement. Both lines of 88—Rh( T1/2=17.B min) B98 ke\» and 1836 kev were used for the analysis. After decayof 88-Rb samples uere counted once mote for 600s and 1.524 kev line of 4 2-Kand 661 kev line of 137-Cs uere measured.
Chemical solutions uere used as comparative standards for all listedelements.
RESULTS AND DISCUSSION
The trace experiments uere carried out uith animal and plant matrixes,in order to study the chemical yields for all the elements. The error of 3%(0.05 confidence level) for single determination of chemical yield uas chosenas the highest value accatable. Houever, this value uas not reached for anyof the elements. It should be noticed that the yields in case of plant matrixuere constantly louer (exept for Rh and K) than for the animal one. The louestvalue uas obtained for Mo (88.7*9.8 % ) . So, it uas decided to control thechemical yields in each case. Since the irradiation of organic aliquotes uaschosen for W, Wo and Cu yield determination, the content of these elements inthe sample should be taken into account. The quantity of carriers correspondeduith the content of the element in the sample. It uas necessary to increasethe amount of Cu carrier, for example, up to 3 mg because the Cu content inthe sample could be high (e.g. up to hundreds ppm).
The possibility of using 137-Cs tracer for K and Rb chemical yield deter-mination uas also checked. The solubility of KB(Ph)^ uas about 4 times higherthan the one of CsB(Ph)4 (B), but in BX C B S S of NaB(Ph)4 and louered tempera-ture of the solution less than 0.1$ of initial potassium could be found inthe solution. That alloued to use the 137-Cs tracer to control the K chemicalyield. That uas even more applicable to Rb.
Special attention had to be paied to the chemical standards. They gavethe possibility to get lou counting statistic error (belou "\%), but on theother hand they could aluays cause sistematic errors (9) . The standards ueretreated in the simplest way. Polythene capsule uith dried irradiated standarduas treated in glass beaker uith appropriate mixture (usually strong acids).
Table 1. Results from 6 independed determination for 5RM (in ppm).
EL
V
rioCufinRbK
SRM-1577t h i s uork
x±2«SD
0.051*0.009
2.7±0.61B7*129.7*0.617.9*2.1
9400*1000
Bovine LivBrI raf.(H)I
0.05861.0.0016(2)
3.4(11)193*1010.3t1D18.3*1.0
9700*600
SRM-1571 Orchard Leaves]this uorkx± 2«SD
0.41110.038
0.2240.0512.510.793*611.241.3
14200+660
r e f . ( i 2 )
0.4710.01.4(2)0.310.112*191*412*1
14700*300
Bouen*th is uork ix± 2«SD I
].3640.05
2.210.64.99*0321.3.9+0.955.216.4245004970
s Kaleref.(iO)
0.37640.013(2)0.3610.04(10)2.3010.214.9010.4215.0*1.252.0*5.224300*120
Active solution uas quantitatively transfered to the volume flask forcounting. The capsule uas checked for the activity left.
To check the uhole procedure thB standard reference materials SRFI-1577Bovine Liver, SRM-1571 Orchard Leaves and Bouen's Kale uere analyzed. Resultsare shoun in Table 1.
Breast cancer tumors had been analyzed using the discribed procedure.
ACKNOWLEDGEMENT
The author thanks Dr. N.Spyrou for most useful discussions, the Univer-sity of London Reactor Centre staff for their assistance and The InternationalAtomic Energy Agency, Vienna, for financial support*

34
REFERENCE
1 . Bengtsson S. and G.Tyler, MARC Technical Report, (1976)2. Byrne A.R., L.Kosta, 3 .Radioanal . ChenT., 44 (197B)2473. Heydorn K.,H.R.Luken3, Risö Report , 13B (1966)4 . Kaiser D.G., U.U.Weinke, Anal.Chim.Acta 29 (1973) 2115. Steinnes E., IAEA Tachn.Report 157, Vienna (1973) p 1496. Bajo S. and A.Uyttenbach, Anal.Chem., V48 No6 (1976) 9027. Shen L.H. and S.J.Yeh, J.M.Lo, Anal.Chem. V52 No12 (l980) 1S828. Plusheu U.E., B.D.Stepin, " A n a l y t i c a l Chemistry of Rb and Cs", Nauka
(1975) Moscou, pp 59-61 ( i n russion )9 . Burhol t G.D., "The Univers i ty of London Reactor" , ULRC/OPS/4
10. Parr R.M., I A E A / R L / 1 0 3 , Sept.19831 1 . C e r t i f i c a t e of Ana lys is , Nat iona l Bureau of Standards, SRPl-1577,reu. 197712. C e r t i f i c a t e of Ana lys is , Nat iona l Bureau of Standards, SRM-1571,reu.1977

35
Se IN BIOLOGICAL SRM's: A COMPARISON OF RESULTS OBTAINED
BY DIFFERENT NEUTRON ACTIVATION METHODS
M.Dermelj, A.Gosar, M.Franko, A.R.Byrne, L.Kosta, P.Stegnar
Faculty of Natural Sciences and Technology and "J.Stefan"I n s t i t u t e , "E.Kardelj" University Ljubljana,61000 Ljubljana, Yugoslavia
INTRODUCTION
wi the basis of var ious s tudies and research , since I960 selenium has been includedamong the micronut r i t i en t s considered e s s e n t i a l for l iv ing organisms III.
Currently, in tens ive research i s being ca r r ied out to e luc ida te i t s ro le in enzymaticprocesses, i t s nutritional importance, i t s antagonistic interactions with other elements.aswell as i t s toxicology. '
Thus there is an important need for developing rapid and sensitive analytical methodsfor Se which give accurate and reproducible results in a variety of biological materials.
In this work we present and compare resul ts for selenium obtained in various IAEA andNBS biological standard reference materials obtained by instrumental neutron activation ana-lys is (INAA) and different radiochemical neutron activation methods (RNAA) developed in ourlaboratory.
EXPERIMENTAL
1. I r r a d i a t i o n : lyophi l i zed and homogenized samples were i r r a d i a t e d in p l a s t i c or s i l i c at u b e s , together with a selenium standard, i n the ro t a t i ng rack of theI n s t i t u t e i s Triga Mark I I reac tor a t a f lux of 2 .10 1 2 n . cm- 2 s - 1 for20-40 hours .
2 . INAA: The V - a c t i v i t y of the '5se i so tope , T1/2 = 120d; E^= 0.121, 0.136,0.264, 0.279 and 0.401 MeV, was measured on a Ge-Li detector (e f f ic iency17%, r e so lu t ion 1.0 KeV for 60co) connected to a Canberra 80 4000 channelana lyse r . The 0.13b and 0.264 MeV peaks were both used for c a l c u l a t i o n .
3. RNAA: For radiochemical determination of selenium in various biological samplesthe following methods, developed in our laboratory can be used:
a) pyrolysis of the sample, volatilization, trapping on soda lime 121b) wet destruction (H2SO4, HNO3 and H2O2) or oxygen combustion of the
sample, extraction of Se(IV) carbamate into toluene or CCI14 111.c) destruction of the sample with saturated Mg(N03)2, reduction of Se(VI)
to Se(IV) with 6M HC1, reaction of Se(IV) witfi S-nitro-o-phenylenediamine (4-NDP) and extraction of the resulting piazselenol withtoluene or CCI4 /4 / .
The i f-act ivi ty of the 75& isotope in samples and standards was measured on a"3x3" well-type Nal(Tl) detector connected to a 400 channel analyser, and the area of0.400 MsV sum peak used for calculat ion.
The chemical yield which is about 85-90% was determined e i ther on the basis oftracer experiments, or by a short react ivat ion of the organic phase (toluene) using theshort-lived selenium isotope °lmse (T1/2 = 57 min; E^ = 0.103 MeV).
RESULTS AND DISCUSSION
The best means of achieving accuracy in trace element analysis i s to apply the methodsdeveloped in the laboratory to the analysis of SRMts and to compare the resul ts obtained withthe cer t i f ied values.
From the resul ts obtained for Se in different IAEA and NBS standard reference mater ials ,presented in the attached table , a l l the methods developed in our laboratory show good repro-duc ib i l i ty and give good agreement with ce r t i f i ed values.
The advantage of 4-NDP method i s tha t , unlike the other techniques, i t can be applieda f t e r only 1-2 days "cooling" of the sample, and also can be combined with solvent extract ionof other trace elements.
REFERENCESIII E.J.Underwood: "Trace Elements in Human and Animal Nutr i t ion" . 4tnEd.,AP, New York 1977.121 A.R.Byrne, L.Kbsta: Talanta, 21 (1974) IO83.Ill H.Polkowska-Nbtrenko, M.Dermelj, A.R.Byrne, A.Fajgelj, P.Stegnar, L.Kosta: Radiochem.
Radioanal .Letters , 53 (1982) 319./ 4 / M.Dermelj, A.Gosar, M.Franko, L.Kosta ( in preparation for p r e s s ) .

36
Table I. Comparison results for Se in Reference Materials (in
SAMPLE
IAEA MAA-1Copepod homogenate
IAEA MAM-1Oyster homogenate
IAEA MAM-2Missels
IAEA MAA-2Fish muscle
IAEA H-8Horse kidney
NBS SRM 1567Wheat Flour
NBS SRM 1577Bovine Liver
pyrolysis
3
2
1
1
4
0.
1.
.16*0.20(n=6)
.36*0.25(n=6)
.94*0.11(n=5)
.08*0.07(n=6)
.87^0.56(n=6)
650*0.073(n=5)
11*0.05(n=6)
Methods and
R Nwet
destruction
3.80*0.40(n=12)
2.24±0.29(n=7)_
1.06*0.11(n=ll)
techniques
A Aoxygen
combustion
3.25*0.19(n=7)
2.32*0.21(n=3)
_
1 10*0 13"(nz5)
4-NDP
_
-
1.63*0.23(n=9)
0.98*0.04(n=10)
4 36±O 24(n=6)'
0.705*0.065(n=l8)
1.00*0.07(n=10)
INAA
_
-
2.08*0.14(n=10)_
_
0.779*0.065(n=8) .
1.13*0.04(nz5)
Certifiedvalues or
range
-
m = 2.1r = 0.05-2.82
-
_
4.67*O.96x
1.1*0.2
1.1*0.1
Note: m = medianr r rangex = overall mean

37
14 MeV PHOTON ACTIVATION FOB PROTEIN ANALYSIS IN CEREALS
B. Oonstant inescu, B. Ivanov, D. P l o s t i n a r u , A. Popa-NemoiuG. PaseovioiInstitute for Physios and Nuclear EnginearingBucharest MG-6, Romania
INTRODUCTIONThe nutritional value for the agricultural products is mainly characte-
rised by their total protein content* Nitrogen tc protein content in cereals isrelated by a 6*25 conversion factor* Thus nitrogen determination in cereals isequivalent to protein analysis.
The olassioal nitrogen analysis method is the Kjeldahl chemical technique,which ia time-consuming, destructive and not suitable for a large number ofsamples*
A fast nuolear nondestructive method for protein analysis using the 14 MeVproton activation to measure total nitrogen content through the reaction*
1 4N (p,n) 1 40 (Tj^ = 71 a)has been developed in our laboratory*
The 14-0 activity is detected by means of its characteristic 2.312 MeVgamma-ray line with a Nal(Tl) detector* She number of gamma-rays to the inci-dent particles ratio for one sample, related to a similar ratio for the adequa-te standards helpj to determine the nitrogen content in that sample.
EXPERIMENTALA beam of 14 MeV protons, produoed by the IHPK U-120 variable-energy fixed-
frequency Cyclotron passes through a 50 nm aluminum foil window into the air*Directly behind the window, the irradiation chamber is located, acting also asa Faraday oup* She effective irradiated and analysed mass of the grain is deter-mined by the difference in range of the protons at 14 MeV and at the reactionthreshold ( 6.4 MeV) and amounts to ~ 0*2 g/em2 (1.4 mm for wheat and barley,1*2 - 1*? mm for corn and soya - beans)* The proton beam hitting the sample(100 + 10 nA) is measured by the charge collected on the Faraday cup.
A grain sample to be analysed is first put into a disposable aluminum con-tainer approximately 25 mm in diameter and 22 mm in length*
For a fast determination samples in a large number the automation of theoperations was necessary* A mechanized system able to analyse samples at a rateof one per minute (see Fig.l) has been developed* She sample 1B gravitationallytransported from the magazine to the irradiation area in 3 s., it is irradiatedin 27 B.i transported again gravitationally to the counter in 3 s., measured 1A27 s. and finally gravitationally transported to a lead screened box. The labo-ratory electronics presented in Pig.2,a Multichannel Analyser (MOA) Nuclear Data,a PDP-8 computer and an electronic module controller - control the entire opera-tion* The MOA is working in the HOS mode (Multichannel Scaling Experiment)! Inone channel the charge information is stored, and in the nejtt channel the gamma-ray intensity indicator* The electronic module controller acts on the mechanicaltransport system for the samples and also on the beam pulsing chopper (27 s. ir-radiation, 33 s. pause for the measurement and sample transport - see Fig*3>
After irradiation, the sample is transported to a scintillation counterwith a 10*16 cm diameter x 10*16 cm thick Nal(Tl) crystal* The counter la shiel-ded toward the sample by a 25 mm lead layer in order to reduoe dead time lossesfrom the high 0*511 MeV gamma-ray activity*
Finally* the PDP-8 computer calculates the ratio of the number of gBJuw-ray counts and of the integrated beam oharge and multiplies the result by a pre-determined normalizing faotor (the total protein oontent of a grain standard;to obtain the total protein oontent of the sample* This result is typed out.
RESULTS AND DISCUSSIONSeveral thousands of samples (wheat, corn, barley, bean and soya-bean) have
been analysed with this nuolear method* Good odfcelation has been obtained be -tween the results of the Kjeldahl method and our nuolear determinations for sam-ples of various cereal grains (see Vig*4).
A problem is the analysis of the whole protein region in a seed. Thus, forwheat and barley seeds the region of maximum protein concentration is 0*2 - 0*6mm in depth /l#2,3/j in corn and soya-bean seeds this region is thicker (0*2 -2 mm)* The effective irradiated and analysed mass is about 0*2 g/cnr (1*2 - 1*4mm), very suitable for wheat and barley* To realise an acourate measurement forcorn and aoya-bean, flour should be used to obtain a protein homogeneous sample*
In this oase, the irradiation dose for a sample is about 33.000 Qy, mainly(99 per oent) from protons (27 s x 100 nA x 14 MeV). Thus, the radiation damage

38
Is conoentrated in a layer of 1.7 - 2 mm under the irradiated surface of theseeds. By protecting the embryo region during irradiation, by the help of asuitable geometry of the samples the future germination of the analysed seedswill be quite normal (70 - 90 per cent normal seedlings) /V. This is the mostimportant advantage of the present method.
EBFEBINOES/I/ D.M. QrodzinBki, O.I1. Hemets, A.ff. llelenevski. Y.A. Tihi ,
Vestnik selskohozlaistvenol nauki, 7 (198?) 47/2/ D.I. Dohan, E.G. Standing, Physics in Industry. Pergamon Press. Oxford and
New Tork, 1976, 509./3/ B. Sundqviat, L. Goenczl, I. Koersner, E. Bergman, IT. Lindh,
Ion Beam Surface Analysis, Plenum Press, New Tork and London, 1976, 945/4/ Gh. Dumitru, Ph. D. Thesis, Polyteohnioal Institute, Bucharest, 1983.
FIGURESFig.l. - Outline of the mechanized system for the analysis.Fig.2. - Experimental eleotroniosi
1 - Nal(Tl) scintillation oounter2 - eleotronio ourrent integrator3 - high-voltage supply4 - linear amplifier5,6 - single-ohannel analyser7 - sealer8 - eleotronio module controller9 - SOB module10 - multichannel analyserA - Control pulse for relays R^ and E,B - Gate pulse for the gamma-say measurement system0 - Oontrol pulse for relays Eg and E^D - Gate pulse for beam-pulsing ohopper (close)1 - Gate pulse for beam-pulsing chopper (open)F - lfOS advance of MOAG - start of MOAH - digital pulse from the ourrent integrator or from the Nal(Tl)
scintillation oounterFig.3. - A typloal analysis sequence for a 60 s. cycle A,B,O,D,B,F - see Fig.2Fig.4. - Comparison between the EJeldahl method results and our nuclear
determinations.MAGAZINE
IRRADIATION
MEASUREMENT

39
A *5V-
B +5V-
0D 0
-6V
E
F
3s
-3V | C
O
B
A C
57S
27s 30s
27s
27s
Tx -SOYA BEAN
f -WHEAT AND BARLEY
. - CORN
H
G 10
!L
20 40 60 80 100 120 140 160 180 200 220 240 260
NUCLEAR NITROGEN a.u.

40 be 8 090 w
DETERMINATION OF I O U I N E * 1 2 9 CONTENT OF THIS PRIMARY
COOLANT OF NUCLEAR POWER REACTORS
I.KuleffFaculty of Chemistry,University of Sofia,1126-Sofia,BulgariaS.ZotachevSAEK"Kozloduy" - Scientific department,3320-Kozloduy,BulgariaG.StefanovInstitute of Nuclear Research and Nuclear Energy,Uul.Lenin 72,11,8**-Sofia, Bulgaria
INTRODUCTION
Iodine-129 is the only iodine radionuclide which exists in nature1 andis- obtained as a result of human activity-nuclear ..explosions and facilitiesaa well. As an uranium fission product (yield 1$) 3I is released in the envi-ronment notgQnly after accidents but at normal working conditions of nuclearreactors* ' X is among those radionuclideu,whose release into the environmentfrom nuclear facilities plays an important gole in the global pollution of thebiosphere due- ta its long half-life (1,7.10 y) and high radiobiologicalptoxity.
In thia.respect the role of recovery plants in the pollution with f I isdiscussed ~ and its gontent has been determined in spent nuclear.fuel ' ,waste waters and gases !' and in various environmental materials . The roleof nuclear reactors in. I pollution is evaluated mainly theoretically fromcalculations of the I content in nuclear fuel or from prognostication ofgaseous radioactive wastes .Besides verj often these evaluations are con-tradictory .The first known determination of °I in the coolant --of a nuclearreactor was done during and after the accident of TMI-2 in USA ' and the re-sults proved to be considerable lower than was expected. „ 17_2g
The determination of yI in various materials,mainly biological ' 'Z »atmospheric air ' ,natural waters '''^ ..is carried out usually by KAA 9.In some cases direct X-ray spectrometry '|J as well as liquid scintilationspectrometry ' ' have been used.Better analytical parameters(lower limit of
detection,accuracy) aire typical for NAA methods while direct X-ray spectromet-ry is more simple.
The aim of the- present investigation was the development of a reliableneutron activation method for .1 determination in the coolant of nuclearpower reactors,since its content there is the basic factor,determining therelease of ' I in the environment at normal work of nuclear reactors. The useof the proposed neutron activation method and X-ray spectrometry are discussedIn the paper aa well.
EXPERIMENTAL
A. Iodine—129 isolation•j •»
V. 3 cm 0.1. M KI are added to 1,000 cm cooling water as a carrier .The,, so-lution is made alkaline(pH 8-3.5) with several drops 2M (NH. )2C0,. and 5 cnr2.5$ NaiOCl are added.After addition of 5 cmJ2 M NH^OH.HCl the solution iscarefully shaken* „
2. The elemental iodine,thus formed is trice extracted with 20 cm CCl^.The violet coloured fraction is gathered in a separatory funnel.
3. 20 cnr distilled water and several drops 1 M Li SO,.6H 0 are added tothe funnel.It is carefully shaken until both phases become colourless.CCl^ isdiscarded. .. „
k. 1 cm conc.HNO- and 1, cm 1i M NaNO are added to the water phase andstep 2 is repeated.
5. Repeat step 3.6. 2 cm 0.1 M Ba(N0_)2 is added to the solution and the residue,thus for-
med is filtered and discarded. „7. The filtrate is acidified with several drops 2M CM C00H,2 cm-1 0.1 MO^)^ are<added and the solution is cooled down in an fee bath.8. The Pbl_ residue is filtered through a paper filter previously washed,
dried and weighed.lt ia dried at 1 1.0C for determination of the chemical yieldand is sealed in a polyethylene foil.
9. Far preparation.of standards on Pbl2 residue a well known amount ofstandard solution of Jti"l (NBS-SRM-^94Q) is added.The sample and standards arepacked in aluminium capsule.
B. Neutron activation determination of iodine-129
After 15 days "cooling" the samples are irradiated for 12 h in a nuclearreactor.After 1.0-1i5 h "cooling" time the gamma-spectra of the irradiated
41
samples are measured with Ge(Li) detector and a multichannel pulse height analy-ser .The 536 Kev gamma-peak of I is used for the determination of "l.Thepeak area is calculated by the TPA-methodJ .
In our investigation the irradiations were carried out in the experimentalnuclear reactor IRT-2000.Sofia,the neutron flux being 1.1O1 cm s . The gamma-spectra were measured with a Ge(Li) detector(Canberra 7229).connected to a 4096channel pulse heght analyser(Canberra 8ISO).The resolution for Co(1332.5 Kev)was 2.3 Kev and the efficiency amouted to 14 /&.The measuring time was 3000 s.
C. Determination of iodine-129 by direct X-ray spectrometry.
The samples are "cooled" for 6 months and the X-ray spectra are measuredwith a Ge-planar detector(Canberra 711005) and a 4096 channel pulse heightanalyser(Canberra 4220) .The shielding of the detector was constructed from Pb(10 cm),Cd(0.05 cm) and Cu(0.1 cm).The sum peak(29.64 and 29.72 Kev) of Xe-K.ie-ii was used for iodine—129 determination .The measuring time was 1CK s.
RESULTS AND DISCUSSION
1. Radiochemical isolationThe isotope exchange in the_yrocess of iodine isolation was done by tiie
method of Glendenin and Metcalf . _In the process of reextraction SO ~ anions^are oxidized to SO. ~ which hin-
ders the precipitation of Pbl . That Is why SOj'anions are first removed asBaSO. anil than is precipitated.
The radiochemical yield of radioiodine isolation from the cooling wateramounts to 75»6 5.4 j£. It is determined as a mean valua from to paralleldeterminations.
2. Neutron activation deteriuinacionThe complex radxoisotope content of the cooling water of nuclear reactors:
is the reason for many steps in the isolation of radioiodine .The latter ensuresa^relatively good purification of ljbl2 residue.In the coolant,however,besides
I,all other iodine isotopes(iodlne-131,,132,133,134,135)are present and theyof course concentrate on the Pbl2 residue.The dominating activity1then is dueto J l(Tii/2 s 8 d) and it makes impossible the determination of yI directlyafter its isolation from the coolant .That is why the neutron-irradiation iscarried out after" coo ling" time at least equal to 2T,,2 of •* l( 15 d).
The gamma-specta of the irradiated Pbl proved that besides •* I,whoseinterference is removed only after cooling,serious influence on the determina-tion of £{I play 8Rme neutron induced radionuclides. The most important amongthem are Na and •* 0a.The radiosodium in the irradiated samples 1B obtainedfrom sodium coming from the polyethylene foil,filter paper and the sodium,Borbed on the residue .Barium is contained in the Pbl, residue due to its addi-tion in step 6 of the radioiodine isolation.
The minimal amount of I,which may by detected at these conditions is:Lc = 1.7 mflq(2.8.10- g): C ^ B Z 9 ^^3(3.8. 1 ( 0-W g/^3) a c c o r d i n e thecriteria in Kef. . They may be improved if before the measuriment Na and
Ua are separated from radioiodine in the_following waytThe Pbl_ residue isdissolved in 15 cmJdistilled water and 3 cnr'conc. UNO and 1 car T M NaNO' areadded. The elementary iodine is trice exracted with 10 cm CClj. .The organicphase is gathered in a polyethylene vessel with a cover and the gamma-spectrumis measured .The standards are processed in the same way.
3. X-ray spectrometry determinationBoth 39.6 Kev gamma-line of I and the X-rays of Xenon may be used for the
determination of iodine-129.The detection limit at1the I gamma-line is worsedue to the lower intensity of the line .The high J I .activity in the pbl2residue makes impossible the direct spectrometry of I immediately after theisolation of the residue .This, demands a- cooling time for the full desintegrationof I.That is why we measured the samples after 6 months cooling time.
129,In the meaaurements,using Iggamma-line the detection limit reached inour conditions was 450 mBq(7.5.iO she, =595 raBq/dm^9.9.1O g/dm"*). Thisresult is in agreement with the datatgiven in Kef.
(tJ . oWhen xenon X-rav were used a detection limit: L = 85 mBq(i,4,10 g);C, =
113 mDq/dmJ(i .9.10 g/dnr) was reached.Thia agrees with the data in Ref. t 7 „«33but is worse than the best results^ .
4. Determination of iodine-129 content in the cooling water of nuclearpower reactors type tftfR-440 1 2 9
The methods proposed above were used for the determination of I contentin the primary coolant of the nuclear reactors WWR-440,working in the nuclearpower station"Kozloduy".The results from the analysis (arithmetic mean from5 parallel determinations (together with the respective standard deviations)a.rggiven in Table I .They prove that NAA enables the reliable determination of 1in the cooling water of nuclear power reactors.
42
129At the same time the I content in the coolant is below the detection limitof direct X-ray spectroraetry,reached at our conditions.
129.Content of I in the coolingnuclear power station "Kozloduy
129Table 1.Content of I in the cooling water of the reactors WWR-44O in
Method Number of Content (mBq 129I/dm'') Ratio 129^7131jdeterminations
NAA. 5 17 T.5 2.5.10"8
X-ray a
spectro- 5 110 16.2.10metry
The data in Table I are 2*»0 times lower than the data for boiling reactors.and 10 times lower than those for Pressure reactora*calculated theoretically .
On the basis of the result for yI,the ratio yl/ J I was experimentallydetermined for the cooling water of nuclear reactors, type WWR-MO.The resultgiven in Table-1. is twice higher from that in Ref. and lower than the value
?iven in Ref. J for pressure reactors(4.6.V0->tiroes) ,and for boiling reactors
4.6.10 times). 1 2 9 ....Using tne result for 1/ I ratio in Table I and assuming the radioiodi-
ne content in the cooling water as a basic factor for its emission in the envi-ronment for a 10 years exploitation periodgof the nuclear power station"Kozloduy" .We used the data given in Ref. for the eight years period(198i)and our results for 1982 and 1983 for the quantities of I released tothe environment from the reactors of nuclear power station "Kozloduy".The totalquantity I emmitted to the environment during the 10 years period amounted to106a Bq which amounts to 44*3 Dq mean disposal per year.If we calculate thetotal quantiti of emitted I to the total quantiti of electric power,producedat nuclear power station "Kozloduy" this means 140.tnQaZMWgCoraparad to the dataabout the emission of "i from recovery plants > f •>*JftJ ,these values areextremely small.
CONCLUSION
The neutron activation.methodproposed in the present work,permits thereliable determination of lz"l in the cooling water of nuclear power reactors.The lower limit of detection amounts to 2.9 mBq/dnr and the precision-to 9 #>.Our Investigations proved that direct X-ray spectrometry is not suitable forthese purposes.
Results were obtained for iodine-129 content in the cooling water of t n e2q
first cycle of nuclear reactors type WWR-44O.On this basis the quantity of Iemitted to the environment at normal, working conditions was calculated andexperimentally the neglegible participation of the nuclear reactors in theglobal pollution of the biosphere with iodine-129 was proved.
REFERENCES
23k
1. H.R.Von Gunten.ActinideB Rev., t(l969)275.2. R.R.Edwards*Science,t37(1962)85*.
E.C.Alexander,B.Srinivasan,0.K.Mannuel,Earth planet Sci.Lett.,5(t969)<t78.L.C.Bate,J.R.Stokely.J.Radioanal.Chem.,72(V982)478. *R.Molina,Proc.Symp.Monitoring of Radioactive Effluents from Nuclear Facili-ties.Portoros,Jugoslavia,1977.IAEA,Vienna,1978,P.18t
6. V.Boehmer,G.Herrraann,H.Wichmann,Seminar on Radioactive Effluents fromNuclear Fuel reprocessing plants,Karlsruhe,1977•
7. R.B.Hower,O.T.Pence,Rep.SAl-00979-i(i978).8. T.J .Anderson,Proc.22." Coaf.On Analytical Chemistry in Energy and Technology,
Gatlinburg,USA, 1,978 .9. T.J.Anderson,Savannah River Lab..Annual rep. ,DP-15a6( 1.978) .10.D.G.Watson,Rep.BNWL-SA-5^11(H975).11, ,P.A.Eddy,J .S .Wilbur,Rep.PNL-3768( 1981).l2.L.A.Konig, Rep.KFK-1,5'*3(i972).13.H.Bonka,R.Bieselt,a.Brenk et al.,Rep.JUl-1220(t975)•I^.J.L.Russell,P.B.Habn,Radiological Health Data and Rep.,I2(197t)t8915.Jadernaya energetica-tshelovek i okruschaiuschaia sreda(Nuclear energy-man
and environment),Energoisdat ,Moskwa,1981 •16.C.A .Pelletier,P.G.VoiHeque,C.D.Thomas,Rep.Gend-O28( 1983)*17.A.Yamato,N.Miyagawa,T.Nomura,M.KinoBhita,Semi-annual Progres ReP.of Power
Reactor and Nucl.Fuel Development Co>rp.,Tokai Works, 1976»P»1'»9.18.M.X.Studier et a l . ,J.In0rg.Nucl.Chem.,2'»( 1962)755*19 . J .Handl, tf .KUhn, J . Radio anal .Chem. ,56(1980 )213 .

43
kO.F. P.Brauer, J.IC.Soldat, H.Tenny, Rep.BNWL-SA-4694( 1973 ) .21 ,Y.Nakaraura,Hoken Dutsurl, 12(1977)27322.T.Nomura,H.Ka.tagiri,S.Fukuda, Proc.5 Intern.Congress of Intern.Radiât .Protec .
A s s o c , Jerusalem, 1980, p.935.ü3.R.Gros,L.Cappellini,M.Gojon de Beauvivier,L.Jeanmarie,F.Patti, Rep.CEA-R-
4691(1975).24.H.L.R»ck, J.Radioanal.Chem., 39(1977)351.25 .Y.Muramatau.Y.Ohmomo.a.Christoffers, J.Radioanal.Nucl.Ctiem.(Art.),83(1984)353.26.ü.C.Auraann,H.Palesohini.L.Friedmann, Radiochim.Acta, 29(1981)209.27.F.P.Brauer,a.G.Rieck,R.L.Hooper, Rep.IAEA-SM-181/6 (1974) .28.T.Sato,T.Kato, J.Radioanal.Chem., 68(1982)17.29.F.P.Brauer,H.G.Riek, Rep.BNWL-SA-4478(1973).30.K.ßunzl.W.Kracke,R.tv'inkler, Hadiochem.Radioanal.Letters, 46(1981 )323.JI.J.Gabaj et a l . , Health Physics, 26(1974)89. CJ2.i'.A.Baedecker, Proc.Symp.Analysis in Cosmochemistry, ICyeller, 197U,Universitär
etsforlaget, 1971» P.175.33.L.li.Glendenin,R.R.Metcalf, N.N.E.S.»Radiochemical Studies, The Fission
Products, New York, 1951, p.278.34.L.A.Currie, Anal.Chem., 40(1968)58635.B.T.Wilkins, Radiological Prot. Bull., 4i(i98i)2436,G.Ditshev,G.Kitov,G.Stefanov,I .Ivanov, in üesetgodischen o pit ot eksploatat-
ziata na AÜZ "Kozloduy" (Ten years experience by exploatation of the nuclearpower station "Kozloduy"), Sofia, Tekhnika,1984,p.76.
37,J.Krezesniak, Sbornik dokladov konferenzii etran tshlenov SEV po Problem!obespetshenia radiatzionnoi bezopasnosti pri eksploatatzii atomnykh elektro-stanziiakh(Problems in radiation safety by exploatation of nuclear powerstat ions) , Usti nad Labem, CSSR, 1975f P.108.
38.K.H.Johansson,R.Schwarzbach, Kernenergie, 23(1980)78.

44
HIUTHOH AOTIVATIOH AKALTSI3 OF 80MB HIGH PUHITI SUBSTAHGB8
Maria S&lagean, Ana FantelloaInstitute for Physios and Nuolear SngineeringBucharest lfQ~6, BoaanieOornelia Dan, Ilena ApostolInstitute for Physios and Technology of MaterialsBucharest MG-6, BomaniaAbstract! 0aI2, Ge02, BigQ, and (HH^gltoO^HgO of high purity
have been analysed by IHAA. Trace elements Ag, Au, As,Br, Oo, Os, Fe, Ha, Bb, Sb, Sc, Sr, Zn at ppm and ppblevel were determined.
IHTBGDUOTIGnIt is Important to know the trace element contents in some samples in or-
der to get high purity materials needed by various domains of resaaxch andtechnology. Impurity levels of 1-50 ppm are considered for these substances.The first three of above analysed substances were obtained in the Institutefor physios and Technology of Materials.
OaFo is used in growing crystal prooesses. These crystals have applica-tions in many domains of optlos (infrared instrumentation windows for gas -analyser, LA81B media, e t c ) . GeO2 and BloO, of high purity were prepared to
owing 6 BIoOx.GeCu crystals with piezoelectricbe utilised in the process of grol _properties and also 2 2U0,,i GeOu having feointiliation properties.
(BHt^MoOi,.* HoO of^high purity was analysed since It is used as a reac-tive <*gent in the trace analysis of F and Si. It is also used in obtaininglead molibdatum of which piezoeleotrio crystals are grown.
The powder samples (30 mg in weight) packed in aluminum foils were irra-diated for 26 hours in a 1.4xlO*>3n/amZ.B. flux. Soil-? and Au (0.105 ug) wereused as standards* The samples were transfered after irradiation in cleanvials to be measured. The measurements of 3-5 hours were performed using aQe(Li) deteotor proteoted by lead after 5t 19« 40 days oooling time. Fragmentsof the gamma spectra registered for the analysed substances are shown in fi-gures 1, 2, 3, 4. The traoe elements found are Au, Ag, As, Br, Oo, Os, Fe, Ha,Eb, Sb. So, Br, Zb. The background contribution in the Oo determination wastaken into aooount.
ES3DLTS AHD DIB0US8IQNThe concentration valuea of the investigated trace elements are presented
in table 1.TABU I
Au(ppb)ASAsBrOo(ppb)Os(ppb)FeHaBbSbBo(ppb)SrZn
0aF2
-
---
1.8±1.0-
< 2----
843
Oonoantration
GeO2
0.9+0.20.05+0.01
•M
-
0.9+0.62 ± 1
1.9+0.619+2
--
0.15±0.06-
0.04+0.03
(pPm)
Bi2Oj
--
0.12+0,020.10+0.030.5±0.3
-1.1+0.60.5+0.2
----
0.04+0.02
(11^)^00^.4^0
-
---
7+2470+30
< 2-
2.4+0.30.10+0.02
--
0.4+0.1

45
Sh« low ierel of the impurities content reflects purity of tba^malns above
ENERGY (keV)
Figure 1
ENERGY (keV)
Figure 2

COUNTS / CHANNEL COUNTS/CHANNEL
73999Mo
mzmo
— 765 95Nb(Mo)
.913 92mNb(Mo)
92mNblMo)
205 91mNb(Mo)
U60 bkg
1692
o
XroO
mzmTOQ
JTn><
609 (Bkg)— 619 8 2 Br
777
82Br
1173 60Co
511
-559 76As
W
o
U60 [Bkg)

$9-85001 bf 47
14-MeV NEUTRON ACTIVATION ANALYSIS FOR OXYGEN DETERMINATIONIN SILICON SINGLE-CRYSTALS
Timus D.M., Gala^anu V. , Oatana D.I n s t i t u t e for Physios and Technology of Radiation DevicesBucharest MG-6, RomaniaBlaga N . , Popesou 0*R-D I n s t i t u t e for Electronic ComponentsBucharest, RomaniaBradeanu A*Radio Components and Semiconductor EntrepriseBucharest, Romania
INTRODUCTIONIn the processing of the semiconductor devices, a frequently ocoining
problem is that of the oxygen oontent In silicon single-crystals. Silicon be-haviour is strongly affected by the concentration, spatial distribution andstate of the oxygen in the orystal volume*
Using infrared absorbtion method, Oshawa et al. /I/ have reported thathelical damages are generated in the high oxygen content domains*
Currently used methods for the oxygen content determination are destruo-tive (emission spectroBoopy) or limited to the interstitial oxygen atoms (in-frared absorbtion)*
The present work deals with the application of the nondestructive, fastneutron activation method for the total oxygen oontent determination with re-gards to the correlation of this content with the material properties of thesilicon.
PRINCIPLES 07 THE FAST NEUTRON ANALYSISThe method applied is based on the study of the nuclear aotivation reac-
tions induced by fast neutrons in their interaction with the nuolei of thechemical elements*
If the sample to be analysed is irradiated in a beam of particles, theinduced radioactivity of the isotope has the following time dependent varia-tion i
f 6..Q2.1O2? a Avogadro's numberM,m a atomic mass, respectively mass of the chemical element, whose isotope
i s activated8 a isotopic natural abundanoe ratio of the activated isotope (%)
mean density of the flux in the investigated speoiaent(oBrZ8"i)oross-seotion of the activation reaotion (am?)
* radioactive constant of the produced radioisotope (cm-1)tT 1 / 2 m half- l i fe of the induced radio isotopet, a irradiation time (the same units as I ^ )
•Che decay of the aotivated radioisotope i s accompanied by the radiationswhose energy and time evolution are characteristic to the ini t ia l activated
element and independent c \ his physioo-ohemioal state*For the oxygen deterioration by aotivation, a large number of nuclear
reactions oan be used in principle /2-4/v from which that based on fast neu-trons i* the most important. For neutron energies Bn> 10 MeV, the followingreaotion i s producedt
Bra6,13 MeV, 7,12 MeV 1 6
p jr > 16OT 7 4/
with energic gamma ray emission.By interpretation of the informations provided by the gamma radiation
specifics to oxygen aotivation, the total oxygen oontent m in silicon can bedetermined using equation (1), taking into account that (Tn,pfM-.10<>^6cm2

(for Bnal4 MeV) and benefiting by the high value of 1 60 abundance ratio (e =
99,76 $ ) .Reaction (2) offers the following advantages!a. The irradiation and measuring times can be short, because of the short
half-life (T1/9a7,4a) of the isotope 1 6N produced. Analysis is rapid.
b. Gamma'rays emitted by the 1 6N have energies (6,13 MeV;7,12 MeV) higherthat of the others elements. Since the energetic discrimination is possible,the analysis ia specific.
o. High neutron and gamma rays penetration, determined by the characte-ristic energies, allows to analyse great volumes. Analysts is representative.
d. Rather high cross-section. Analysis is sensitive.e. Irradiated sample is not physico-ohemioally modified. Analysis is non-
destructive*f• Fast neutron flux densities of (108-109)n.cm~2.s-l. can be obtained
by means of a low voltage direct accelerator type fast neutron generator.In order to avoid the possible errors Induced by the difficulties appear
ring in determination of the neutron field parameters (£,0",ti) from relation(1) /5»6/, we have prefered a relative method with a standard of known oxygencontent (AlgO*, quartz, e t c ) .
APPARATUS AMD EXPERIMENTAL PROCEDUREThe equipment and experimental set-up of the analytical system contain
the following partsta. Fast neutron generator14-MeV monoenergetio neutrons are produced in the following nuclear fu-
sion reaction, by bbabarding a tritium occluded target by deutons with an e-nergy of about 150 keV in our GOT type GEHBDAO neutron generators
H> + a. » a + 4H« (3)Deutons are produoed by deuterium ionisation in an ion source with osci-
lating electrons electrical discharge and axial magnetic plasma confinement.They are extracted from ion source and fooussed by means of an iono-opticlens. Thus formed deuton beam is thehaooelerated in a single gap tube up toa potential of 150 KV, accelerating potential being supplied by a voltagemultiplier self contained in the direct accelerator. The intensity of the de-uton beam can be controlled up to 1 mA by controlling iono-optic parametersof the accelerator. The target end of the accelerator tube can be radiatedfrom the main unit by means of a valve, which allows rapidly replacing of thetarget, without breaking the vacuum in the rest of the accelerator. The tar-get is situated at ground potential and water-cooled. A mobile tantalum screenpneumatically positioned in front of the tritium target intercept the deutonbeam in order to spare the tritium and to correlate the sequences of the ana-lysis cycle.
The neutron production obtained for a deuton beam intensity of 0,5 mA,is about lOiOn.s"1 in 4TT solid angle.
All the functional parameters of the neutron generator are controlledfrom the control panel*
b. Counting and control equipmentGamma ray counting system is composed of two identical units i one for the
sample to be analysed and the other for the standard. They contain a gammascintillation detector (Nal orystal), a photomultiplier, a preamplifier, a li-near amplifier with variable energy discrimination thresholds and a countingscale* Background noise is automatically corrected. Lower discriminator thres-hold is set at 4,5 MeV since no other isotope produced in the sample emitsgamma-rays above 4 MeV. Oounts from both units, which are proportional to oxy-gen oontent, are fed to an electronio computer, where after gaemebloal and at-tenuation corrections, the oxygen oontent of the silicon single-crystal iscalculated.
Bleotronic equipment contain* also the units which control and operatethe temporal sequenoes needed to the analysis oyole.
The sucoesive operations were programmed according to a sequential oyole*The presence of the sample and of the standard at the measuring or at the irra-diation places, as well as the neutron generating state of the neutron genera-tor is indicated on the control board. The irradiation or measuring sequencestarts only if the sample and the standard are in their required places*
o* Pneumatic conveyor systemDue to the short half-life of the 1 6H isotope it is essential to trans-
port rapidly the sample and the standard from the irradiation site to the mea-suring site. A double rectangular section (internal dimensions 21x11 mm) alu-minium pneumatic transport system brings the samples to and from the irradia-tion site. The transit time is less than two seconds. Time dependent varia-
49
tions of the neutron flux density are without effect on the accuracy of theanalysis. In order to avoid the mutual influence on the counts, at bhe measu-ring places, the two transport ducts are separated by a distance of aprox.1 m. The pneumatic system for the sample has an automatic feeder for the in-troduction and ejection of the samples. The decay of the 1 % nuclei is totalafter aproximatelly one minute, so that the standard can serve indefinitelyfor analysis*
RESULT AND DISCUSSIONUse of the relative method of analysis implies the knowledge of a correc-
tion factor for the spatial flux density gradient, energy dependence of crosssaotlon, neutron attenuation in the sample, facing the tritium target.
la the x and s indices refer to the sample and the standard respectivelyand taking into account aquation (l)v the oxygen content has been calcu-lated according to the following relation!
when E is determined by two standards with the same known oxygen content, ir-radiated and measured simultaneously*
Samples (20 mm dia., 10 mm heght) cleaned to remove the surface contami-nations have been conteinarad for easy handling.
Using the above mentioned equipment and experimental set-up, the totaloxygen content has been determined in silicon single-crystals. Values from(lOQ*25)ppm to (180Qi90)ppm have been determined. They are one to two ordersof magnitude higher than the interstitial oxygen content values, due to theannealing treatments applied to the silicon crystals as received*
CONCLUSIONS14—MeV neutron activation analysis of oxygen in silicon single-crystals
is rapid .(total analysis time is less than 60s), specific (allows a good ener-getic discrimination In relation to other elements)and precise, being able tocharacterlaa nondastructlvely the whole volume of the analysed sample*
HBFIHBN0E8/ I / A. Ohsawa, K. Honda, S. Ohkawa, R* Veda. Appl.Phys.Lett.36,2(1980)147/ 2 / R.Van Grieken, J. HoBte, BURIS0T0P-65,Bibliografies-8,1972/ ? / G* Brdtmann, Neutron Aotivation Tables, Verlag Ohemie, Welnhelm,1976/ V S. Godar, Note OBA No.2W-5» 1962/ 5 / D.M.Tlmue, M.N.Tlmue, Bev.Roum.8ol.Teoh.-Bleotroteoh.et Inerg.,17,2(1972)
251D.M.TlmuB, 7T-£2f-1983( IOBPIZ-Buohar«at, 1983.

50
INSXRUMENTAL PH0T0A0TIVATI0N ANALYSIS 07 BOMB ILBMENTS IN BTXSL
V. (*&l&$anu, B. Timus, D. OatanaInstitute for Physios and Technology of Radiation DavicesBuoharest MG-6, Romania
INTRODUCTIONPhotoactivation oan be successfally used for analytical purposes as a
oompl«tua&*ry method to the neutron activation, especially for several lowand medium. 1 elements in balk samples and when moderate sensitivities aren««d«d /1-3/.
This is the oase for steel samples in which must be nondestructively de-termined the concentrations of some minor elements.
The low absorption of activating high energy X-rays, the small crosssections and the unfavorable half-lives and gamma-rays energy of the photoac-tivated major elements offer the possibility to investigate large represen-tative samples.
The main reaction an* speotroscopic data concerning the analysed elementsare summarised in Table 1 /4/.
TABLE 1. - Photoaotivation Data
Analysed Nuclear T, /0 Main gamma-rayselement reaction x/* B (keV (I %)
Or 5 3Or ( i\p) 5 2V 3.76 m 1434.1 (100)Ni 5 8Ni (f ,n) 57Hi 36.0 h 1377.6 (78)Mo 92Ho (f ,n) 9lBMo 65 s 652.9 (48.1) }1508.0(24.2)
INTSRPBHBNOBSThe examination of special tables /5(6/ shows that no other gamma-rays
with energies close to those listed in table 1 are expected to be producedthrough photonuolear reactions.
The most dangerous interferences are due to other nuclear reactions pro-duo ing the same radioactive nuoleus as the useful photonuclear reaction.
Two such interfering reactions are possible only in the case of Cr deter-mination i
5*V
We have experimentally checked by irradiating and counting pure Mn and Vsamples that in our conditions none of these interfering reaotions oan be ob-served.
BXPBRIMBNTAL PROCEDURE AND RBS0LT8The disc sampleB (40 mm diameter and 3*5 mm thickness) were irradiated
in the bremsstrahlung beam of a 25 MeV betatron, at OV5 m from the Ft targetin order to insure a fairly uniform Irradiation. The gamma-rays were detectedwith a 40 am Ge(Ll) detector coupled to an IN 90 programmable analyser. Forthe determination of Ni concentrations, the irradiation, «cooling" and coun-ting times were 1 hour and the exposure dose was monitored with a transmissionionization chamber having an appropriate integrating time constant.
For the determination of Or and Mo concentrations, the irradiation andoounting times were 5 minutes with a 0.5 min. transport time. The exposuredose was monitored by a simultaneous irradiation of pure Gr and Mo samplesand oounting with a different speotrometrio chain.
In order to perform quantitative analysis we prepared standard sampleswith known amounts from the analysed elements. Oorrection factors for selfab-sorption and solid angle have been experimentally determined by irradiatingand counting steel samples with increasing thickness in front of the standardsample.
The unknown concentration 0 of the analysed element is computed with therelation!
- „, . m1 . I0,0" -j- -J
where 0' is the oonoentration of the investigated element in the standard

51
sample, m and m1 are the masses of the sample and the standard, I and I1 arethe intensities of the gamma-rays used for detection and corrected for theselfabsorption and solid angle (the irradiation, cooling and counting timesfor the sample and standard are the same). The concentrations determined arebetween 0.1 and 9 % for Nl, between 0.4 and 18 % for Or and between 0.05 and1.50 % for Mo, The accuracy of the determinations is 10 % for lower concen-trations and 3 % for higher concentrations.
HISBRBHOES/I/ Oh. Sngelmann, J. Radioanal. Ohem. 55 (1980) 379/2/ 7. Gal&tjanu, H. Greoescu, G. Baciu, St. Oero. Fiz. 26 (1974) 9/3/ 7. Galafcanu, U. Grecesou, Rev. Bourn. Phys. 24 (1979) 9/4/ O.M. Lederer, 7.S. Shirley, Table of Isotopes (1978)/5/ 7* Galafcanu, M. Greoescu, J. Radioanal. Ohem. 10 (1972) 315/6/ Z. Banda, V. Kreisinger, J. Radioanal. Ohem. 77 (1983) 279.

52
APPLICATION
OS
OF THE
LEAD
IMAA TO THE INITIAL
PROijCTILEo
D.DimitrovInstitute of Criminalistic, Bul.Slivnitza 235, 1202 Sofia,Bulgaria
INTRODUCTION
Data having certain importance for identification of projectiles, causinggunshots, can be obtained on account of lead impurities concentration.Thisproblem is discussed in a number of works (1,2,3,4), where the two methods ofanalyses are suggested - RNAA(2) and INAA [3,4).The proposed work rate (4J is ofa particular interest because it is express.lt affords the opportunity for mea-suring the contents of Sb, Cu and Ag in a few minutes by using their short-lifeisotops Sb-124m1, Cu-66 and Ag-110.The samples are irradiated with reactor heatneutrons as the duration of each step (irradiation, cooling, measurement) is40s.Gamma-lines 498keV of Sb-124m1, 658keV of Ag_iio and 1O39keV of Cu-66 aremeasured by spectrometer.
The aim of this work i3 the creation of a sequence of operations in car-rying out the INAA of lead samples of proectiles, allowing the qualitative andquantitative initial comparison having in mind a single limitation - the timefor the analysis of one sample must not exeed 20-24min.
RESULTS AND DISCUSSIOM
Some of neutron-activation characteristics of the chemical elements, foundmost frequently as lead impurities, are shown in (5,6).The intensities cf gamma-lines, measured after the irradiation..of the.corresponding chemical elements byr-."l«i.r -MAnn4-Ain Y i a i i 4 - » n n a l.F-t+Vl "P1 r\Z.T n "P 1 O - 'm n m O -FlTT* ^ D c Q T» O 1 Y1 ft 1 Cfl +. C*(\ . TT R T Tl £fslow reactor neutrons with flow of 10'•'n. cm '.s ' for 60s, are indicated.Usingthis work rate it is possible to determine micrograms of Sb, Cu, Ag and Au.Thesame applies to As as the As-76 has a half-life period of 2b.3h.
The alteration limits of concentrations of the impurities in lead samplesand some gamma-lines are shown in table 1(2,4).The expected initial intensitiesare calculated in accordance with[5,6).
Table 1 - Rangeof concentra-tion valueschanges(2,4).
The realconcentrationvalues of theimpurities al-low the instru-mental recordof Sb, As, Cuand Ag only.Theclose locationof 559.1keV ofAs-76 and 564.0keV of Sb-122gamma-linea, thehigh contents ofSb and commensu-rability of half-life periods ofSb-122 and As-76necessitates the
analyses of Aa to be carried out on the 657.OkeV.The presence of As at the sameis a problem concerning the Ag determination on the 657.7keV line of Ag-110.
Table 2 illustrates the possible influence of As on the measurement ol Agon the 657.7keV line of Ag-110.When the ratios between the quantities are asM = m(As)/m(Ag) fe. 50, the duration of the accurate measurement is limited to0 - 30s immidiately after the irradiation.The defined conditions do not allowthe start of measurement by use of a spectrometer earlier than 3O-4Os after tneirradiation.All this necessitates the determination of Ag on the 632.9keV lineof Ag-108 and imposes the choice of irradiation durating 120-180s, cooling -above 200s, when the simultaneous measurement by a spectrometer of the 6>57.OfceVline of As-76 is also possible.
The above considerations orientated us to the use of analysis scheme likethat, shown on fig. 1. .
The scheme is entirely carried out when the concentrations of As and Agare commensurable.When M S* 50, the measurements are done according to thefirst part of the scheme.
•OJ.C1UCI1 U
Sb
AB
Cu
Ag
ZnAu
Range of consentra-tion changes, ft
0.05 -
1.10"2-
7.1O"4-2.10"4-
1
1.10"6-
• 2 . 8
- 5.1O"2
- 5.1O"2
- 8.10"5
10"4
- 9.1O"6
Gamma-lines,keV
498.4602.7645.8
559.1657.0
1039.4632.9657.7910.0
411.8
Intensi ty,c / s
1.1.10"?1.1.10?1.1.105
2 . 7 - 1 0 ^4.2.10^1.8.104
1.9.1O4.4.1.105
1.10"1
3.5

53
Table 2 - Ratio of the intensities of lines 637.0keV of As-76 and657.7keV of Ag-110 in percent.The calculations refer to the simulta-neous irradiation.^ of As and Ag with reactor heat neutrons with a flowof ~ 10 ?n.em .a .
Goo-ling,
000030040080120180300
s 30sM=50
0.51.2_—
15.2a3.o
2.5.10
M=10.010.030.040.110.34
, 1.90556.4
I40s
M=50
0.61.31.85.417.093.3,3.10-
r r a
M=200
2.25.37.021.868.0373.4
d
13
i a t60s
M=500.71.6_——
16.2 ,.s.io5
i o n120s
M=1
0.020.06_--3.93
119.0
M=50
1.22.8---
196.6,6.1O3
M=1
0.0.-
5.173.
180s
0408
703
M=14
2879.
50
.7
.0---.0,
1°
Samples from four real cases with mass between 120 and 180mg are analyzed.
I.
Irradiation.)-180s120-
II.
Cooking„210-2408
Cooling t500-840s
Measurement.300-6O0e
Measurement,600s
Cu-66(iO39.4keV), Ag-108(632.9keV), Sb-124m1(602.7and 498.4keV), AB-76(657.0keV)
As-76(657.OkeV)
Big. 1
Samples Sb As Cu Ag
Table 3 shows the impurity coneentrations from Sb, As, Cu and Ag.Table 3 - Concentration valuesof Sb, As, Cu and Ag in theanalysed lead samples from pro-ectiles, $.
The analyses are carriedout by irradiation with reactorheat1neutrons, flowing at5.10 n.cm .8 and measure-ment lay the use of Ge(Li) detec-tor with efficiency 7.2 # arndresolution 2.3keV on line
In table 4 the values of
ABCD
1.800.00080.0220.091
0.55 0.0013 0.0010.67 0.0008 0.0020.33 0.0028 0.0010.02 0.0021 0.009
the relative statistic deviations of results
<r = (2uu - uc)1/2/ UQ
where U and U are the integrated and pure signals, respectively, from the ana-lytical gamma-line are presented.The correctness of the proposed scheme, res-ponding to the requirements for accurasy and rapidity, is completely confirmed.
Table 4 - Values of the relative statistic deviations at differentanalysis schemes, %.
El e-H6n."fc
SbAsCuAg
Irradiation - Cooling - Measurement, s / Samples120-210-300;120-420-300)
D3.4-9.11.1
A1.13.613.513.1
0
15.611.17.25.8
120-240-600;A B0.63.4 3.59.0 9.39.7 5.0
120-600-600;180-210-600D A B
0.5 -4.7 2.5 2.3
8.4 6.57.5 2.6
C
7.52.65.17.3

54
It must be noted that at Sb concentrations 0.005 $ and at relativelyhigh contents of As (samples B) an additional much longer irradiation andcooling are needed, so that the measurements can be carried out on gamma-li-nes 564.0keV and 692.5keV of Sb-122 or 6O2.6keV of Sb-124.
COflCLUSIOJ!!
A scheme for initial quantitative analyses of lead samples from proec-tiles, carried out by means of IflAA, is proposed.lt gives an opportunity fordetermination the concentrations of Sb, As, Cu and Ag when the contents of Sbare s> 0.005$.The analyses time consuming does not exceed 20 - 25 min.
REFERENCES
1. P.A.VAGAHOV, V.B.IUKiriCHKI, Neutrons and Forensic Bcience, Izdat. Uni-versity of Leningrad, 1981.
2. R.D.GuT. B.D.PATE J. Radioanal. Ohem., 15(1973)155.3. S.J.GAGE, J.B.WHITWORTH, J. Radioanal. Chem., 15(1973)337.4. V.P.GUIHH, M.A.PURCELL, J. Radioanal. Chem., 39(1977)85.5. R.DAMS, J. Radioanal. Chem., 61(1981)13.6. S.A.LIS, PH.K.HOPKE, J.I.PASCHINY, J. Radioanal. Chem., 25(1975)303.

55
DETERMINATION OF Al, Cl, S AND V BY NONDESTRUCTIVE ACTIVATION ANALYSIS
B.Smodis, L.Kosta, A.R.Byrne, M.Dermelj
"J.Stefan" Institute and Faculty of Natural Sciences and Technology,"E.Kardelj" University, 61000 Ljubljana, Yugoslavia
INTRODUCTION
Neutron activation analysis of short-lived radionuclides by non-destructive or instru-mental gamma-ray-spectrometry (INAA) offers good possibilities for rapid and precise deter-mination of a wide range of elements in a broad spectrum of matrices HI. In the present con-tribution, the analysis of Al, Cl, S and V in a range of oils, rubbers, organic liquids,aqueous samples and inorganic solids is presented, together with a brief discussion of thefactors affecting accuracy and precision, interferences, and the possibilities given by pre-or post-irradiation separations in certain cases.
EXPERIMENTAL
For the standard non-destructive procedure, the encapsulated sample together with a suit-able standard or standards were irradiated for periods of a few seconds to several minutes inthe pneumatic transfer system (rabbit) of our TSIGA Mark II reactor at a flux of 4xl0l2n.cm~2sec-1.
The induced gamma activity was measured by an intrinsic Ge detector (17 % efficiency,1.8 KeV resolution at 1.33 MeV) connected to a Canberra 80 Series MCA. For measurements last-ing half of a half life or less, with an initial dead tune of *slO %, a first order correctionbased on the mean dead time (given by the analyser) could be applied. For these high energyy -emitters, a Pb filter was with advantage placed between sample and detector to improve
the signal to "noise" ratio.
RESULTS AND DISCUSSION
Aluminium2?Al(100%) Jn')^,,» 28Al(t, ._ = 2.31 nan, E y = 1.778 MeV, I = 100%)
The main interferences, apart from second order reaction from Mg, are fast neutronproduction of 2 8 ^ V i a 28si(n,p) and 31p(n,o«) processes. However, the cross sections for thesereactions are small, so care is needed only in matrices based on Si, P or Mg, with low Allevels. Corrections based on estimation of the fast neutron contribution using Cd covers toscreen thermal (n,y) reactions were not required for the matrices studied. Al was determinedin rubber, motor oils and oil filters, and in TiO2. (In the latter case use of a thick Pbfilter improved the signal/noise ratio by around a factor of 103). Concentrations from 0.1 to1500 ug/g were measured.
Chlorine3 7 C1(24 .2%) i n ' r n k?h» 3 8 C l ( t 1 / P = 3 7 - 2 n a n , E r l = 1.642 MeV, I = 33%,c = 0 4 3 b 1/2 ' 6 m%
Interferences may arise from second order reaction on 36s( Or fast neutron reactionsvia 38Ar(nFp) and 4lK(nlOe). Again these cross sections are small so that appreciable errorsarise only in matrices based on argon, potassium or sulphur.
Samples analysed included water, steel, corrosion products, welding tape, and variousindustrial products.
The concentrations covered the range 0.4 to 1000 fJg.g"1. Results were verified by gravi-metry in some cases (AgCl). Where high 5BMn activities were induced in certain metal products,distillation separation of 38ci after irradiation was necessary.
Sulphur36S(O.O15%) tf
("'^15g 3 7S(t 1 / 2 = 5.06 rain, E y = 3.10 MeV, I = 90%)
Because of the high Er, (only ^Ca, 3.08 MeV, has a gamma ray in this upper region),selectivity is high; on the other hand, sensitivity is poor (low abundance, small*). Theonly practical interference is via 37ci(n,p)37s. Measurement of 3°ci to determine the S/Clratio is required and a correction is applied if necessary. In oil products and rubber, Cl/Sratios are not of significance and results m the range 0.5 - 4 % and 0.7 - 2.5%, respecti-vely, were obtained. Results were verified by gravimetry (BaSOij) after oxygen ignition, andfrom some results obtained with ASTM mfethods supplied by the refinery for oil products.(Table 1).

Table 1
Sample
Heavy oi l
Heavy oi lHeavy oi l
Heavy oi l
Heavy oi l
1
2
34
5Light heating o i lBenzene
3.2.
2.
2.
3,0,
Comparative
INAA
,53*0.14
,76±O.O5
,74*0.04
,63*0.08.12*0.18
.72-0.03
(4)
(4)
(4)
(4)
(6)
(3)0.048*0.004 (4)
results
Sulphur
for S and V
(ir i %)
gravimetric refinery
3-53*0.2. 81*0.2.74*0.2.66±O.
05
04
11
11
(6)
(6)
(4)
(4)
3 . 2 X
VanadiumINAA
72.9,51.0,41.3,50.6,82.6*10.103,0.001,
67-150.9
40.949.4
.5 (6)
0.0970.0014
Uig.g-1)refinery
determined by gravimetric standard method ASTM-D 1551xxdetermined by colorimetric standard method ASTM-D 1548
Vanadium51V (n,y)t 52 V {t . 3>?5 mini E Y = 1-4314 MeV( : . 100%)
Interference reactions can be ignored at concentrations of V in the ug/g range andabove, where INAA is applicable. V was determined in oils, rubbers (see Table 1) and Ti02pigments. In the latter, a Pb filter is very advantageous.However, if the Al/V ratio isgreater than about 100, determination is very difficult or impossible, and pre-separationbecomes the best option.
Further results will be presented in the full paper. It can be concluded that, provi-ded interferences are controlled, determination of Al, Cl, S and V in a wide range of indu-strial and other products by INAA represents an attractive, and rapid alternative to otheranalytical methods.
REFERENCES
111 Nondestructive Activation Analysis, S.Amiel (Ed), Studies in Anal.Chem. No.3,Elsevier, 1981.

5 9- 8<rooMO57
DETERMINATION OF PLATINUM CONCENTRATION IN GOLD MATRIXBY NEUTRON ACTIVATION
V.Cojeearu, Stefania SpiridonInstitute of Physics and Nuclear Engineering, P.O.Box MG-6MBgurele-Bucharaat, 76900, Ramania
INTRODUCTIONThe determination of platinum concentration in a saaple with a high amount of
gold is a difficult problem. Eren more difficult is to finde the platinum concen-tration in a gold matrix. Nevertheless the problem is important at least in ar-chaeology and geochemistry investigations. Platinum has six stable isotopes, allof them having moderate values of the neutron activation cross section. One hourirradiation of platinum in a reactor gives for th« stable isotopes ^Ojpt, 192p+194pt, 196pt and 198pt a production factor of 0.07, 0.05, 0.08, 5.0 and 100.0 re-spectively. The only nuclei which deserve to pay attention are the last two. 197ptis not very convenient having the most intensive gama-line at 77.46 keV (21 %}that is in the X-ray region and a relatively short half-life (18.5 h).
The most productive is 199pt with a short half-life (30.8 min) and not veryintensive gemma-lines (542.7 keV has 16.4 * ) , but it is B"-decaying in 199Au (TJ/2= 5.13 d ) . This seems to be a good alternative. Unfortunately in neutron irradia-tion !99AU is also coming on the other way (Figure 1).
i , ** I Figure 1197 A u Jn.iL 198 Au M l , 199 Au
The idea of the work consists in the pre-irradiation separation aB far aspessible of platinum of its matrix and to find the most favorable irradiation con-ditiona of the separate sample in order to get a high ratio of activities
A199/ A 1 9 9
were by prime is indicated the interference ehain initiated by !97AU.EXPERIMENTAL
Chemical separation. The pre-irradiation separation was made by means of nanystep organic solvent extraction technique, followed by ion exchange procedure* Thetests wsre made with gold and platinum metals irradiated at the neutron fluxes insuch a way to create balanced activity tracers 198±u ftnd 199pt (or 197pt). Afterirradiation the samples were mixed up, completely dissolved in aqua regia and sep-arated.
Counting was done using a 50 cmc coaxial Qe(Li) detector and a 4096 channelpulse-hight analyzer. System resolution is better than 2 keV fwhm at 1.55 MeV TT-ray. The detector was placed in a low background protection which reduces thebackground around 100 times. In order to keep a constant geometry all samples weremeasured at the sama volume (12 ml). The separation scheme is summarized graphical-ly in Figure 2. The solvent extraction was repeated four timee. The aqueous phaseof the fourth extraction was heated to dryness and the residue was- dissolved in3 ml of 3N HC1. The solution was then passed through a Bmall (0.5 cm diameter)column with 0.25 g Dowex 2 x 10 (200 - 400 mesh) ion exchange resin at a flow of12 dropB/min and washed with 50 - 125 ml solution of HC1 cone.(10 %) + acetone (90%) at the same flow rate.
If the initial ratio Pt/Au = 1, after the first and fourth solvent extractionsteps it becomes in aqueous phase. 200 and 4000 respectively. In this time theplatinum concentration is reduced to 80 %. After the ion exchange procedure theratio becomes Pt/Au • 105 and the total recovery of platinum iB found to be (68 -3) %.

58
Sample |
Disolve in HNO3-HCIMake 3N inHCl (7.5ml)Extract with ethyl acetate (2.5ml)
I
oqueous (Pt) — f-t-y)Heat to dryness -""Disolve in HCI 3N(7.5ml)Extract with ethyl acetate (25ml)
Repeat U times
aqueous (Pt)—(Heat to drynessMake 3N in HCI (3ml)
*Dowex 2»10 brojHCl cone. (10%i
(200 - A 00 mesh) P * 9 acetone (90%)(50 - 125ml!
eluent resme-
Figure 2
Irradiation parameters. The irradiation tine and the neutron flux have to beproperly chosen in order to Bake the ratio of the !99AU activity cosing from plati-num (A199) to the J-99AU activity coming from gold (^199) as high as possible. Onecan find that at the end of neutron irradiation (see Fig.l):
9Im these equations
where I is the integral resonance.The ratio M 9 9 / A199 vs. the irradiation time ie given in Figure J. The
eurves 1, 2 and 5 are ealoulaTed for a flux of lOll, id* and 1OW n em-2 a-1, re-speetiveiy. The lower neutron flux the higher the ratio A190/ A199,but a too lowflux can give an insufficient detection limit for platinum. For a necessary fluenceit is better to chose a lower neutron flux. At the gamma-spectrometeruaed in thiswork the detection limit is of 55 ng Pt far an irradiation time of 5 h «nd a meas-•uring time of 1O0OO a. With a reduction of gold concentration by 105 times and aA / A = 8, an ameuat of 5 mg gold will give a correction of only 10 % in the r~lime of 158.4 keV (199A U). Thia correction ie found by aid of the ratio (area of158.4 keV «*-iiBt)/(area of 411.8 y-line) of a standard of gold irradiated in re-actor together with the investigated samples.
RESULTS AND DISCUSSION
Nuggets of geld from different plaoers of the Apuseni Mountains (Romania) andfrem Romanian rivers j ave been used aa samples. The mass «f the eampleB was between
' "^Im ardor to ebaerva by aid of 198AU tracer the reduetien ef geld alamg theplatimom separatiem process the samples ware irradiated at a low meutrem fluemee

59
(6.101' m «»~ 2). The recovery af platinum waa feund uaing a combination of plati-num and geld with a mass ratio Pt/Au «^ 1/1000 which waa preeeos*d ia tha same waywith tha investigated samples. Tha reaiaa am whiah platinum waa retained wereirradiated a tine of 20 haura at a tharaal neutron flux of 1.1 10 1 1 a ««-2 a-1(thermal column of the W R - S reactor).
8 1
Sj- oat
-1
-2
11 J
If/f1
/f/
r
\
\
\
\\
r2
r3
\••^iBHi
0 1 2 3 4 5 6 7 8
log t j r ( s e c )
Figure 3
counting waa dana after a decaying time af 6 daya in ardar ta gat a law 2*Naaetivitiea earning fram realn. Conoeatratioma af platinum between 0 andaad
460 ppm with an arerege af 270 ppm were faund in the inveatigatad nuggets.I t f Th i t f e r e n c e af 47se (159.4 keV) eoming fram46ca
( p ) p a i b l e , ealeium being not retined by t a ra a t e r(n,p) and (n,<^ ) which produce *7sc are excluded ainea thermal nautran fluxea ware
ll7 ( ) i i i (1
pp ege af 270 ppm were faund in t e nveatigad n u g g t .Interfered to. Tha interference af 47se (159.4 keV) eoming fram46ca(a(ir)47Ca
i l i b i t t i d b th i Al th tiia not poaa) d ( ^ )
to. Tible,hi
a interfeence se ( 5 9 4 e ) g ( ( )ealeium being not retained by tha raain. Alao the reactiene
d *7(n,p) an (, ) ich p o e sc are excluded ainea thermal nautran fluxea waruaed. NaTortheleeB tin by thell7"Sn (14 d) iaatape whiah haa only a /-line (198.4kaV) aan interfere with 199A.tt. Ita preaence can be put in aTidenee ceunting either158.4 kaV tf-line after tha decay af 199A« (ea. 90 d) or 992 keV tf-iina af thaI1"Sm (119 d) iaetepa and doing tha neeeaaary eerreetiene. A tin standard was irra-diated together with the raaina en which platinum wae absorbed in order to find theratio of the areas *(198.4 keV)/*(929 keV) coming from tin. In our samples no tininterferences waa found.

60 5
Jlg BY NliUTHON ACTIVAFIuN
ANALYSIS AND ATCMIC ABSORPTION SPECTROMETRY
IMPURITY Dfc TERMINATION IN Bi.,0 ANJ)
S.Aleitsandrov,I.Kul«ff .R.Djingova,S.Arpadjan
Faculty of Chemistry, University of Sofia, 1126-Sofia,Bulgaria:
E.Taakaev
Institute for Nuclear Research and Nuclear Energy, Bulgarian
Academy of Sciences, 118^-Sofia, Bulgaria
INTRODUCTION
Lately the interest in the production of monocrystals and optical fibresfrom inorganic materials grew immensly because of their importance in lazertechnique and optical electronics. A very important condition in production anduse is the purity of the raw material. In order to evaluate the properties ofthe high purity materials, used nowadays in different branches of electronicsone must use highly sensitive analytical methods.
In the present paper are presented some results from the analysis of highpurity B12O., and PbCl™ obtained by NAA and AAS in the Analytical Chemistry
Department of the Faculty of Chemistry.
EXPERIMENTAL
A.Neutron activation analysis.I. Preparation of samples and standards. About 0.5 - 1 g from the mate-
rial is sealed in polyethylene container (for the first irradiation) or in poly-etiiylene foil (for the second irradiation). (The polyethylene foil has beenootained under high pressure. The two materials are before washed with detergentand water, put for Z-* h in HNO (i:i), washed abundantly with deionized water,
aha alcohole and dried under IR lamp.)As standard IAJUA reference material V-9 (cotton cellulose) is used /i/.
Additionally well Known quantities of Ag and As are added to it since in V-9tnose two elements are in lower concentrations than in the samples. The standardis sealed in the same way as the samples (about 0.1 g ) .
2.Scheme of the analysis. The scheme of the analysis is shown on Fig.l.The radionuclides and gamma-lines used in the analysis are given in Table 1.
The first irradiation isdone using the rabbit system ofthe experimental nuclear reactorIRT-2000, Sofia /z/ with a neutron
Fig. 1
tM-300« Al.Co.Ce,Cu.Mg.Mn
tM-5000i As,Au,Br,Hg,
K,Lo,Na,Sb
tw-1Q0Q0» Ag,Ce,Co,Cr.
Fe,H(,Zn,Zr
Scheme of INAA of Bi 0_.
tfl=irradiation time}to=cooling
tlme;tM= measurement time.
flux 6.10 em .s . The secondirradiation was performed in oneof the vertical channels of thereactor with neutron flux amounting
to (i-3).1.01i2cn.-2.B-\
After the first irradiationthe gamma-spectrometry of thesamples^aone on a Ge( Li) detector(energy resolution 2.8 KeV,efficiency 8 i for H332.5 KeV)connected to a kO96 channel analy-zer Canberra kO, after the secondirradiation the measurements aredone with a 6e( Li) detector (ener-
, ,, . , , . , „ , , BY resolution 2.3 KeV, efficiency1<+ > at KJJ2.5 KeV) connected to 4096 channel analyzer Canberra 31.80. It shouldbe mentioned that the measuring time for the samples of PbCl- was twice longerthan that for Bi^O (shown on Fig.l). *
The data evaluation (including all necessary corrections)was done by usinga program according the algorithm, described in /3/.
B.Atomic absorption spectrometry.The determination of Cu.Fe.Ni, Cd, Zn in PbCl., l s d o n e a f t e r concentration of
the elements by using a three phase extraction with MIBK /k/. The determinationof Mn is performed after acidic extraction with H_S0K.
The samples of Bi g0 3 are dissolved in 8 M HC1. After extraction with MIBK
61
Fe and. Mo are determined in the organic phase by the standard addition method.Cu,M,CoiCd,Pb and Mn are determined after concentration, transformation
of fli.O.into ai(OTK)~ and three phase extraction with MIBK. The elements pass
into tne organic phase, which is directly pulverized in flame air/acetylene.Tne standard addition method is used. All measurements are done on AAS PyeUnicam SP 9.
RiSULTS AND DISCUSSION
Table I, together with some parameters used in the NAA of BigO.. and FbClg
contains the detection limits reached by the analysis. In most cases NAA issensitive enough to give reliable result?. But where due to matrice effects orapeciiity of elements, it is not sensitive enough then AAS comes to the purpose,so the combination of the two methods proves very successful.
One of the most serious problems ift the INAA of high purity materials isthe purity of the packing material used for irradiation. In the analysis ofBipO_ and PbCl., the repacking of the samples after irradiation is not possible
since due to the radiation field in the active zone of the reactor the samplespartially are destructed and as a result of this a new component is formed -elementary Bi and Pb. We used polyethylene as packing material which proved tobe very suitable but it demands irradiation with lower fluxes. This choice wasdone not only because of its purity but because it permitted the determinationof Al in Bi^O~, because of the interference nuclear reaction Si-28(n,p)Al-28
whicii takes place in quartz.It should be mentioned that in PbC^ due to the high matrice activity (Cl-
J6) , Al, Oa.Cu and Mg cannot be determined by NAA. So the short irradiation(Fig.!) in the analysis of PbClg practically brings information jonly for Mn.
The combination with AAS permits in thia case not only the determination ofsome of the mentioned elements but because Mn is also determined by AAS thesnort irradiation in some cases may be omitted.
Tiie results from the NAA and AAS of Bi2O» and PbCl are presented in Tab-le 2. Tne combineduse of both methods permits the determination of more than20 elements and among them as such for which INAA is not sensitive enough ( Pb,Ni,Cd,Mo). Additionally this approach enabled to control the accuracy of themethod by comparison of the obtained results from the two methods (Co,Cu,Fe,Mn,Zn) . This is very useful, since standard refernce materials for the analysis ofhigh purity materials are not available.
Among the elements in Table 2 there are some whose content is usually notnormalized by the user. They were however determined mainly to demonstrate thepossibilities of the combined use of NAA and AAS. At the same time they enablethe producer to critically evaluate some technological steps /5/ as well as tomeet, some specific requirements of different users.
REFERENCES
/I/ L.Pszonicki, A.N.Hanna, O.Suschny, Rep.IASA/RL/97 ( 1>983) ./2/ D.Apostolov, Nuclear Energy (Sofia), 5 (1976) 109./}/ V.Dianovitch.D.Todorovsky.R.Djingova,I.Kuleff.Y.Yanev,J.Radioanal.Chem.,
6J ( 1*81) 13.S.Arpadjon, A.Kojnarska, tt.Djingova, Fresenius Z.Anal.Chem., ( in press).G.Giulmezova, Proc.Nat.Youth School "New Technology and Materials",Primorsko, 19dk ( in press;.

Table 1. iiadionuclides and gamma-lines Table 2. Hesults from IhAA and
Ele-
ment
Ag
AlAsAuB aBrOaOdCe
Co
Or
Ou
P e
l ieKa fL.aMg
MH.
MoNaN ii'bS b
Zn
Zr
used by INAA.Detectionreached by
Radio-HiiA 1 J/lA
nucliuv
Ag- 1.10mAl-28As-76Au-1.98Ba- l^lBr-82Ca-49
„Ce-t4tCo-60
Cr-51Cu-66
_Fe-59' -
He-197K-42Hf-162La- 1i4oMg-27Mn-56
-N&.-24
_-
Sb-122Zn-65
Zr-95
Gamma- J
xxne *
657.71.778.8559.1.411..8496.3776.53084.4
_145.51332.5
320.1i1039.0
-129H.6
-$8.8V524.7482.2
1l 0 T4 r ^I d 1 1 . 2
--
1ijt>8.5
-
564.1.1115
756.7
the analysilimits
s .
Detection limit (ng/g)
Bt2°i6
121 i . 1 i
0 . 94500
0 . 6400
15*0 .6
0.076 *2
8 015*34
125*N.D.1.1,0030 , 2
970.06
1.0*500*
k \
30*1.3
15*400
PbCl2
4N.D.6 . 8
0.01N.D.
19N.D.
15'0 . 5
0.066*2
N.D.15*3 0
1.25*0 . 6
1700N.D.
0 . 2N . D
5 _1.60*N.D.
9^
_0 . 9201.5*N.D.
E le -
in cut
AgA lAsAuBaB rCac dCe
Co
Cr
uu
HeKL aMg
Mn
MoNaN lPbSb
AAS of B i , 0 , and PbClo
ConcentrationBi2°3
^3i4oo - too270 ± 303.9 ± 1 . 6
^55007 * 2<400
3 5 J 2 *1 5 - 3
0.1.4 - 0.04
47 * 5< 8062* 3*
503* 120500 t 25*
-2900 t 14001300 t 50
-i 15004 t 2^*• 1.0
*: 500*720 + 40
25 t 1*3 6 * 2"
k i t180 * 40
N.D.
1 J c
(ng/g)PbCl2
560 ± 50N.D.
23000 t50000 .9 4 0 . 3
N.D.1 1 * 3
N.D.53 t 3"
2 . 1 * 0 . 40 . 8 5 * 0 .12
38 i 6N.D.
72 t 3*11430 t 570
1i32Ot 160*260 ± 90
107000 * 20000»9 i 3N.D.
28 ± 5<1,60*N.D.
1.2000 ±1200270 i 10*
-18 4 I*90 1 209 0 1 1 0 *
N.D. = not. determined
K- determined by AAS
The data in the Table 2 are meanvalues from 3 parallel determinationsand are characterized with the standarddeviations ( Ji t r ) .

63
DETERMINATION OF MERCURY CONTENT IN MILK POWDBR
H. Iovtchev, T. Grigorov, D. ApostolovInstitute of Nuclear Research and Nuclear EnergyBoul. Lenin 72, 1184 Sofia, Bulgaria
INTRODUCTIONThe risks for human organism connected with tne increased content of mer-
cury compounds in some foods require a systematic examination of the differentcomponents of diet.
Along with the particularly Important control of the concentration ofoeroury in certain products (fishes, mushrooms, some animal internal organs)about whioh general accumulation of the element is established and a compari-son with the existing nowns of content is necessary, for the elucidation ofthe total mercury exposition, it is neeeesary to analyze products with compa-ratively low Hg concentration but with a high relative share in human nutri-tion (e.g. flour, milk and products from them) /1-4/.
In this respect it is interesting to examine humanized milks which duringa certain period of human life - in mixed and artificial feeding of new-borasand sucklings - are the basic and almost the only possible food.
EXPERIMENTALlea
ized ful l cream cow milk powder for new-borns (sample A: Bebe 0) ,sucklings (sample Bt Bebe 1) and small children (sample C: Vitalact 2); bio-logically soured milk powder (sample D: Biolacton).
The samples weighing 300-500 mg are activated for 18-24 hours in a neu-tron flux <?= 5.101 2 , reap. 2.101^n/cm2.sec (IRT 2000 - Sofia) in quartz am-pules without preliminary lyophilization (humidity content of 4-5 %).
Method"Wet ashing*1 of the samples in BETHGE'a apparatus in a oxidizing mixture
(HNO»ooaQ : H2S04conc.a 1:2* and removal of HS by amalgamation on Cu powder
/4/. This is a modification of the method suggested by /I/.Mercury waB determined by Hg-203 energy line 279. ikeV with correction for
the relative share of Se-75 in the total peak area /4/. The measurements arecarried out on a Qe/Li-detector (resolution 2.3keV at 1332keV of Co-60).
DISCUSSIONThe mercury concentration data in milk and dairy products from the trade
network, are comparatively scarce and rather discrepant. For example, valuesfor fresh milk vary from 0*1 to 25 ppb /5-8/, for milk powder from Beveral .ppb to 180 ppb /4,9/(the data being valid for industrial developed countries).
In ohoosing the samples we settled upon milk powder which may be acti-vated without preliminary treatment /4/. In such a way possible mistakes frommercury losses during lyophilization are avoided. This is a very importantconsideration, having in mind that for most analytical methods mercury con-centration in milk powder is usuely of the order of the detection limit.
Milk being a protein rich product contains a considerable quantity of Se.At the measurement one must exclude the contribution of Se-75 in the peakarea of Hg-203 at 279*1 keV. The activity correlation of the peaks of Se-75at 279*6 keV and 264.6 keV for the chosen geometry of measurements, is 0*4*
Ag-110m. being eliminated in the amalgam, is not an obstacle to the mer-cury determination.
The results of the analysis are shown in Table 1 (average values from 8determinations; Hg concentrations in ppb). The values obtained for the mercu-ry content in thfc investigated humanized milk (powder) are of the same orderas in most of the references /1,2,5/ and in all oases are many times lowerthan the admissible norm for foodstuffs - 50 ppb (Table 2).

Sample _(ppb
A
B
C
D
5.1 + 2.1
5.8 + 2.3
7.2 ± 3.16.8 + 2.3
3.6
3.4
4.3
4.7
7.3
7.6
8 .7
8.4
Table Is Concentration of mercury i n milk powder / p p b /
Refe- [Hg]rencs (ppb)
hiIMIMX
157*lllx
la/*lit
hoi
510
2.5
130.6
5200.170
(IASA-A-11)
122948
251
180
1 - Values f o r Hg concentra t ions i n freBh milk
Table 2t Comparison of mercury concentrat ions i n milkpowder and i n f r e s h milk
CONCLUSIONThe r e s u l t s show concentra t ions of mercury i n the analysed humanized f u l l
cream cow milk powder considerably under the recommended by WHO Taluea f o rfood products*
At the measurement one must exc lude the c o n t r i b u t i o n of Se-75 i n thepeak area of Hg-203 a t 279.1 keV.
The method a p p l i e d g i v e s a p o s s i b i l i t y to determine mercury by compa-r a t i v e l y s imple radiochemioal prooedure. This l a very important i n c a s e ofl a r g e number o f a n a l y s e s for assessment of human organism burden wi th t h i st o x l o element through food p r o d u c t s .
REFERENCES/ 1 / . R. Sohelenz , J . - E . Diehl : Z. Anal. Chenu, 26£, (1973) 93/ 2 / . R. Sche lenz , J . - E . Diehl : Z. Lebanon. Unters . -Forscto . , 15J. (1973) 369
1S3 (1973) 151/3/. 0. Birke, et al.: Arch. Envir. Health, 2£ (1972) 77/4/« K. Heine, A. Wiechen: Milohwissenschaft, 2J, (1972) 688/5/. J. Huzicka, C.G. Lammt Talanta, 16 (1969) 157/6/. L.J. Qoldwater: Soi. American, 257 (1971) 15i cit. in /4/lit, B. Weigand-EschraghiB, et al.t H B B . VerBff. Nr.1 Mercury; cit. in /4/IB I, J.J.H. de Qceji, et al.: Symp, USA (1972) SE 157/8191. R. E. Jerves, et al.: ASD-Conf. (1970) 349-002; oit. in /4//TO/. R, H. Parr: IAEA/RL/103, September 1983

Simple and fast determination of Rb and Cs in mineralizedwaters.
E.TaskaevInstitute ofNuclear Research & Nuclear Energy,boul.Lenin No72, 11B4-Sofia
For the technological control of mineralized uaters processing a simpleand fast method for Rb and Cs determination uas proposed. The directdetermination is rather difficult because of the very high content of Br,Na,Fe and etc* Sodium tetraphenyl borate (Kalignost) uas USBC) for the precipi-tation of Rb and Cs (i).
Experimental
Tuo 20 ml portions from each uater sample uere used for the determinationone for the Rb and the other for the Cs. The pH of the samples had to beabout 7. Precipitation of Rb and Cs uas carried out uith 0.11*1 solution ofKalignost* Its quantity depended on NH4, K, Rb and Cs content in the sample.The precipitate uas filtrated, washed uith 0.011*1 Kalignost solution andslightly dried with air, passing through it. Then the precipitate uas packedin polythene capsule.
Solutions of RbN03 and CSNO3 uere used as comparative standards.Samples and standards uere irradiated in one of the vertical channels
of IRT-2000 reactor in Sofia using pneumotube with 1.5mm Cd filter (2).Epithermal neutron flux uas 10.10'° n.cm—2.s-1. Irradiation time uas 1. minfor Rb and 5 min for Cs. 86m-Rb (T1/2=1.O1B min Ev =555.8 kev) and 134m-Cs(Ti/2=2.9 h E =127.4 kev) uere used as analytical isotopes. Cooling andcounting times for Rb uere 30 s and 200s. Cooling and counting times for Cs.uere 2-3h and 300s respectively. Y-Spectrometer uith GeLi and multichannelanalyser uas used.
Interference of B2-Br (Ti/2=35.4h Ej"=554.3 kev) uas checked. It turnedout to be negligible in the described conditions.
Some preliminary tracer experiments uith 134-Cs and 86-Rb uere carriedout to establish the chemical yield of the precipitation. The yields uererather high and if soma flagrant errors had not been made, it uas 87—13% forRb and 92-8%for Cs. Since the procedure included only one step precipitation,the rough errors could be obvious and could be eliminated easily. And in thecase of technological control, the chemical yield, accepted from the tracerexperiments, uas considered to be sufficiently accurate.
Carrier free 137-Cs could be usad for more precise control of chemicalyield if necessary.
Results and discussion
The proposed method uas used for the determination of Rb and Cs inhighly mineralized underground uaters and sea lye. As the one step precipi-tation uas not enough to remove the sodium comletely, irradiation uithepithermal neutrons reduced the 24-Na activity in the sample and improvedthe counting conditions. The quantitation limits from 20 ml samples uere14.10~6 g/l and 8.10"6 g/l for Rb and Cs respectively.
The possibility of Ag determination should be mentioned, and thesensitivity is higher when 110-Ag (T1/2=24S Ek*=657 kev) uas used, insteadof 108-Ag (T1/2=2.41 min E^=633 kev).
Reference
1. "Analytical chemistry of Rb and Cs", Nauka (1975) Floscou, pp59-61( in russion )
2. Apostolov D., Nuclear Energy, 3 (1976) 109-111 ( in bulgarian )

DO
GAMMA - 8PECTR0METRIC SYSTEM BASED ON
PERSONAL COMPUTER "PRAVETS-83"
K.Janaklev, L. Tomdiv, T.Grigorov, M.VutchkovInstitute of Nuclear Research and Nuclear EnergyBoul.Lenin 72, 1184 Sofia, Bulgaria
INTRODUCTION
Gamma spectrometry is an attractive technique for elemental analysis,
especially for multjcompo-'nent speciments. The neutron activation analysisis one of the most sensitive analytical methods wridely used by now in sfci-ence as w-ell as in industry.
A gamma spectrometric system based on a personal microcomputer "Pravets^-83 " has been developed in the Institute .-for Nuclear Research and NuclearEnergy. The distinctive peculiarity of the proposed system is that the multi-phanel analyair is realized on the personal microcomputer, which gives thegos-iifeility. the system to work in real time.
HARDWARE OP THE SYSTEM
The system includes all blocks of Jthe spectroraetric tract - from prea-mplifier to computer for data processing.
The preamplifier is in parallel way conected with vlth the detector pow»er supply and has the following characteristics:
- noise at zero capacity of the output - 0.7 kev for 3 «fsj- slope of the noise characteristic - 15 ev/pf; /- sensitivity - 90mv/Mev;
- maximum charge - 100000 I:.ip./s.The linear part of the spectrometer includes:1.High-voltage source for power supply of semiconductor detectors. It has
the following characteristic:- range of power supply - 0 • £ 5000 v with internal selection of the
polarity; ""- maximum output current - 100 uk\- working temperature interval -from 10 C till 35 C;- the source is efficiently protected against overcharging of the
preamplifier at voltage leaping.- a special electron eheme controls the level of the output signal
and in this way the source is protected.2. Spectrometric amplifier with the followihg characteristics*- gain range - from 20 till 1500;- shaping time constant - 1, 2, 3, 6us;- nowise at the input - 6 T;- temperature gain shift - 0,01% / C ; for the temperature diapason
fom 0 till 50°CS- integral nonlinearity - 0,1%.The regeneration of the zero line is strobable with the functional thre-
shold defined by the noise level.The multichannel analyser is based on the personal computer."Pravets"-
83", Bulgarian production, which is analog to Apple II.Analogue digitalconverter (ADC^Canberra" model 8075 with 8192 channels and 100 MHz timefrequency is used. The ADC data are accumulated directly into the computermemory through Direct memory access (DMA) controller with increment time ofthe memory 2*s. The volume of the operational memory necessary for spectrumaccumulation is 12K, The form of the recorded data ( number of channels andcapacity) depends on the number and the type of used ADC. The computer canoperate to 4 ADC.
The system can control the following types of peripl- metric printer of lipson RX80 on which accumulated spectrum can be pri-le system can control the following types of peripheral devices*
nted in letter, figure and profile type ( fig.1);- digital plotter VATANABE type on which the spectrum and itB processing
by the applied programmes is drawn graphically;- two floppydisc devices with bilateral record and double density;- Full compatibility is ensured with the computer Apple II and hardware
and software extensions.
SOFTWARE OF THE SYSTEM
The computer based multichannel analyzer is equipped with system softwareincluding the following modules:
- spectrum vizualization in linear and logarithmic scale which can be

67
Pig.1 - Tipical gamma spec-trum accumulate by proposedsystem without backgroundsubtraction.
Fig.1
3072 Pig.2 - The same gamma spec-2,. 4
; trum with background subtra-ction by method of Gunning.
SEC0000
Pig. 2
change* along X and Y coordinates, simultaneous vizualization of two spectra,region of interest ;
- programme GAMMA-X which 1B desined for complete analysis of a Ge - Litype gamma spectrum. Gamma - X takes 4096 channels spectra. I t has been op t i -mized for o,5 Kev / channel and a detector resolution of 2.7 Kev at energy1332 Kev. Gamma-X detects peaks, peak boundaries, peak widths and multipletstructures with a convolution technique based on a square wave convolute.Two important calibrations are required in order for Gamma-X to be able toanalyse spectra from different gamma spectrometers systems: parameters forconventiona]lchannel units to energy and parameters describing the system reso-lutions as a function of energy. These calibrations have to be carried outfor energy detector system. In order to compensate for small gain shif ts , twomonitor peaks are used ( 59.5 Kev peak of Am - 241 and 1332 Kev of Co - 60 ) .The s t a t i s t i c a l significance of the transform results is tested to eliminatespdrioue peaks by using a two - standard deviation cr i ter ion. The next stepi s to locate the peaks by scanning down in the contrast spectrum for nonzerovalues.The edges of the peak are searched in the square wave convolut spectrumin the negative region. The background i s computed as a staight - line functi-on between the peak edges hy using a 3-channel average for the peak - edgecount. The continium subtraction technique is based on the method of Gunning-Philippot. For resolving overlapping peak structure a par t ia l - strippingdecomposition method i s usred, res t r ic t ing overlap region to 3 channels.
Pig.2 and 3 show a t ip ica l gamma specrum obtained from the primarycoolant c i rcui t of APS "Kozloduy" before and after i t s treatment.
The sequence of spetrum treatwwat with built in siBtematical programscan be given at routin work of the analyzer.

68
The programme languages for the user 's software are BASIC, FORTRAN,PASCAL, PILOT. 5 0
The spectrometer i s tested with standard source Co and shows thefollowing exploatation character is t ics :
- resolution PWHM for an energy 1332 kev - 2.7 kev;- shifting of the peak at charging with 50000 counts per second - ©
0.03%;- shaping time --3- Microseconds.
CONCLUSIONGamma - spectre-metric system was developed and the prototype was t e s t e d .
The r e s u l t s are comparable with t h e s e rece ived by comercialy a v a i l a b l eequipment. The main advantage of t ' h e suggested system i s that i t i s notnecessaxxy to t rans fere the data fr.om the multichannal an lyzer to the memoryof the computer.

OQMPUTATIOHAL DBSORIPTIOH 0? VAST VSUTRGB ACTIVATION DATA
Marileaa Avrlgeanu, H* IvaaouInatitute for Physios and Nuclear lagineerlngBuohareat-Magurele, P.O.Box 1IG-6, 76900 Romania7. AvrigeanuInatitute for ffuolear Power ficaotorsPiteeti, Romania
INTRQDUOTIQHfollowing the developaent of aorc Intense aouroes of 14 MsV neutrons la
the past faw ysara, there baa been growing laterest la the lnatrumental aulti- •eltaeat faat-neutron aotivatioa analysis (ISAA). It ia haped that ths FIAA oaucomplement the thermal-neutron aotivatioa analyaia (TNAA) for certain typea ofanalytioal problaia /!/•
faat-neutron reaotloaa prooaad along thraa relatively atroag reactionohanaalai (a,p), (a««C) and (n(2n). However, the ezperiaental oroaa-seetiondata baaia of praotical uae ia aotivatioa analysis la rather scarce (e.g./2/).An aoourate theoretioal daaorlptloa of thsae reactions ia aa uaeful alternateway to aupport FHAA*
Tha sala taak la perforaing auoh theoretioal oaloulatioas of fast-neutronoroaa aaotioas froa threahold up to 20 1ST, baaad on the* atatiatioal model(Bauaer-feshbaoh STAPB1 ooda) and the preequllibrium deoay geometry dspeadaathybrid Model, are presented la tbJ.a contribution. The appropriate onoioe ofconaiateat aata of input parameters, free of adjuatabla parameters aa muoh aapossible aad uaed la an unitary way, achieved through analysis of Independentdata, has great ly determined the aoouraoy of this approach /3/. The (n,p) aad(n,2n) reactions on 92-Ho have been ohoaen to illustrate our goal, as molybde-aua ia aa important fualoa technology aatorial aa wall aa biological tiaauaaooapoaaat whoae oonteat determination through TNAA haa already been carriedoat/4/.
NUOUtAE MODIL PAHAIBT1RSOptical model parameters (OHP) aet for neutrons ware ohoaen by tha SPRT
method /5/. By aaalyalng the oaloulatad a - aad - p wave atreagth functions,poteatlal aoattering radiua, total oroaa aeotions between 1.5 and 5«J» MeV,shape elaatio aoattering oroaa aeotions up to 4 lev againat the available ex-perimental data, tha Lane ooaalataat OHP daduoed by Lagrange /6/ proved to bethe moat appropriate for lio*
Tha proton OMP of Johnaon at al. /7/ with tha energy dapaadaaoe auggea-ted by Tiigrange /8/ have baaa adopted following the analyaia of the reactionoroaa-aeotiona for both the ayatem p + 93-Hb aad tha 9?-iBb(p,n)93-*o reaotioaup to 5*5 HaV.
Alpha-partiole aad dautaron OUP obtained from data ftta in this aaaa aadenergy range /9|1O/ have alao been uaed.
QaamaHray transmiaalon ooaffloiaata wara baaed on tha abaolute 1 1 gammaray atrength functions generated by Beans of the energy-dependent Breit-flgaar(*Bt) aodel /ll/. B J ™
Tha nuolear level density ahould ba differently traatad aooordiag to thafollowing thraa ezoitatioa taergy regiona.
iTLow axoitation energies (l*s© 2 ta 4 HaV) delimited by tha maxlmuaaxoitatlon energy wart almoat all the dlaorete levela KM believed to ba wallknown froa experimeats. «
II. Maditta excitation energies ( ? ^ I ^ 10 HoV) la the definition domain
level density parameter a and the badtabllahed by the ouaulatlve auaber-ofrage nuolaoa resonance apaoiaga v* *•
aad the baok-ahlftad A of tha grouad-atate) are ea-low energy dlaorete levela aad the ave-
of the aemiempirioal Back-Shifted lermi Gas (BSfG) model. Ita parametera (the- - -• - — - * ... juad-atat k
__ ivela andrage nuolaoa reaonanoe apaoiaga V * ? . Tha fittad values of theae paraaetera tothe aoat raoaat experimental data are aometinea readjusted mainly when the ex-perimental data baaia waa rather soaroe.
III. High, excitation aaarglea (E*£? 10 MeV), where the B8VG parametrlsa-tlon fails gradually aa tha atrong shell affaota observed ia the level densityparaaeter A »t lowar enarglaa dlaaappaar with the iaoreaaa la exoltation. lathis oonneotion, Ignatyuk at al* /12/ have introduced an energy dependent le-vel daaaity parameter a ( 1 * ) , atartlng from the experimental evidence of aoloae oorreapoadenoe between the a. valuta derived from the neutron reaonanoedata and the experimental shell correction <S I to the maaa formula of myersaad Swiateoki /I)/,
la tha traaaltioa region between tha doaaiaa II aad III for theae I M J -glaa a logarithmic iattrpolatlon of the apin dependent level daaaitlta givenby the two models haa been adopted* The eaaroh for the Halts of this tran-

70
sition region was the first goal in tha Hauser-Peshbaoh statistical nodal andhybrid praequilibrium oaloulations of some exoitation functions of the (n.p)and (n,2n) reactions on 92-Mo.
The praequilibrium contribution has been calculated in tha frame of thageometry-dependent hybrid model /14/. The exoiton state density has been xe-lated to the level density parameter A in the statistical calculations(g • 6/rr**a). That enables tha use of tha level density parameter ja in bothstatlstloal and hybrid models in a unified way. The Inclusion of the pairingcorreotlon /157 has also improved the agreement between the atata density usedin praequilibrium oaloulations and the equivalent level densities involved inHauser-Peshbaoh oaloulatlons.
B18UM8 ABD DISCU88I0HThe oaloulated (n,p) and (n.2n) reaction oross sections have shown a gene-
ral good agreement with the available experimental data. These oaloulationsare most sensitive toward the level density parameters. Based on 92-Mo(n,2n)91-Mo experimental oross seotions, representing the bast experimentally defi-ned exoitation function even above 20 MeV incident energy, in oontrast withthose of 92-Mo(nfp)92-Hb, it is apparent that the transition region betweenthe BSPG model and the Ignatyuk formula ranges from 14 to 19 MeV. The upperlimit waa established by the bast agreement with the experimental data above1 «• 17 MeV, while the lower one is imposed by the fit within tha first 2 MeVinterval of the exoitation functions.
The lower limit of the transition is also supported by the (n,p) exoita-tion functions, whose experimental data are soattared within the 13 to 15 MeVneutron energy interval. The faot that tha spin distribution is not muoh affec-ted by the interpolation between the two level density models is avidenoad bytha m/g ratio calculation for the 92-Mo (n,2n)91m-Mo reaction. (Batios of orossseotions for ground to metaatable state production are often used to deduoeinformation relating to spin out off parameters). Those oaloulations have alsobeen validated by tha good agreement between the appropriate measured and oalou-lated averaged oross seotions In the thermal-neutron induced 235-tf fissionneutron spectrum.
BIPIBIH01B/I/ H.l.Williams, p.K.Eopke, B.A.Meyer, J. Badloanal.0hem.72(1982)183/2/ M.Borman, E.Keuert, w.Soobel, Handbook on Huolear Aotlvatlon
oroas-seotions, IAIA Ho.156, IAIA Vienna (1974)/3/ M.Ivaeou, M.Avrigeanu, V.Avrigeanu. preprint IP-28-1983, Buoharest,
I •?•£?!• (1983)/ 4 / LSadBistolios, O.Paptdopoulu, J. Badloamal.Ohem.72(1982)597/ 5 / J.P.Delaroohe, Oh.Lagrange, J.Salvy, Huolaar Theory in leutron Vuolear
Data Iraluatlon (IA1A-190), Vienna IAIA, vol.1(1976) pp.251
/ 6 / Oh.Lagrange, Neutron Data of Structural Materials for Past Beaotors,K.H.Booknott (Id.),Pergamon Praaa,Oxford (1979)PP.756
/?/ O.H.Johnaon, A.Galonsky, B.L.Eermell. Phys.Bev« 0 20 (1979) 2052/ 8 / Oh.Lagxange, Phya. Bev. 0 22 (1980) 896/ 9 / R.GToIarkaon, W.B.Ooker, O.P.ltoore, Phys.Bev. 0 2 (1970) 1097
/10 / r.S.Park, B.D.Jones, D.I.Bainum, Phys.Bev. 0 4 (1971) 778/ l l / D.G.Gaxdner, Preprint UOBL - 87438. Llvermoora (1982)/ 1 2 / A.V.Ignatyuk, G.H.Bairenkin, A.8.Tishin, Tad.Tis. 21(1975) 485/ 1 3 / W.D.myera, W.S.Swiateokl, Ark.Pyeik. 36 (1967) 593A V H.Blaan, H.K.Vonaoh, Phys.Bev. 0 28 (1983) 1475/15 / O.T.PU, Huol.8oi.Ing. 86 (1984) 344.
Supported by the 1.P.H.I, and IAIA - Vienna- Oontraot 2983 / BB

71
ABSOLUTE NONDESTRUCTIVE QUANTITATIVE DETERMINATION OF
URANIUM IN SPECIAL NUCLEAR MATERIALS
U.Dragnev.B.DamSanov, G.Grozev, J.KaramanovaInstitute of Nuclear Research and Nuclear EnergyBoul. Lenin 72, 1184 Pofia, Bulgaria
INTRODUCTION
qualiigfc of the non-destructive gamma- and X-ray measurements dependsstrongly on the calibration and the standards. At present the most severe rest-riction for the widespread application of non-destructive quantitative measu-rements of special nuclear materials (SNM) is the lack of suitable standards ormethods for accurate absolute measurements.The preparation and accepted Bar-tification of standards appropriate for non-destructive quantitative measure-ments and their use by IAEA nuclear material .afeguards is extremely difficultand time consuming because of the large variety of sizes, shapes, concentra-tions, cladding, etc. of SNM items available in different countries. In addi-tion,^the transportation of standards from site to site in one or variouscountries is quite difficult because b£ the existing regulations. Therefore,the development of absolute non-destructive methods and corresponding proce-dures and instruments, which means methods with a reduced number of requiredstandards, suitable for IAEA nuclear material safeguards applications, is ofa great importance.
The object of this work is to develop absolute non-destructive method forquantitative measurement of Uranium concentration and enrichment in SNM.AnIntrinsic Calibration method has been proposed to Bolve this problem, the ob-tained results show good agreement with.clasical known methods and in somecases better.
1. GENERALIZATION OF THE INTRINSIC CALIBRATION CONCEPT*
Intrinsic calibration of high resolution gamma- and X-ray spectrometricmeasurements is a quantitative use of correlations between peak position,sha-pes, areas and their ratios in a measured spectrum and corresponding known ormeasured values of gamma and X-rays energies, emmiting rates, material matrixand other parameters in order to calibrate the measurement system and/or meat*surement results, in general without use of additional standards.
At the begining, the intrinsic calibration was developed only for obtai-ning of overall relative efficiency dependance and isotopic ratios from highresolution gamma spectrometric measurement/1/.During the last years this app-roach has found wider application.
The intrinsic calibration technique uses the results from the measurementsof the sample itself, reduces the number of required standards, the measurementtime and errors and increases the reliability of the results.
General procedures of the intrinsic calibration are following: energy ca-librat&ft.ff the measured spectrum,callibration of the peak width, efficiencycalibration. Using strong and well known lines and having the areas of thepeaks from one isotope or from several isotopes with known isotopic ratios andtheir branching yelds (B) the overall relative efficiency (E) can be determinedwith adequate accuracy.This allows an absolute determination of the isotopicratios and in some cases when well known standards (samples) are measured thenuclear data can be determined more precisely.
2.DETERMINATION OF THE PEAK PARAMETERS.
The measurement equipment used in this work consist ofointrinsinc Ge det-ector with resolution 1,7 kev on the energy 1330 kev of Co , multichanal ana-lyser "Silena" and powerful programabte calculator HP-41CV.
Determination of the peak parameters is made using a Gaussian fit.It isknown, however, that the pe-ik shape is not precisely a Gaussian one, in parti-cular because of the "tailing11. The problem is to determine the fraction of thesingle peak to be used in the determination of the gaussian parameters. In /2/only the part of the peak in which the first and last channels are at a dista-nce 0,8 (FWHM) from the peak maximum position is used. Other authors use thecondition Q,5 (FWHM). We found that the dispersion o-*of the Gaussian distribu-tion of the number of counts in the peak channels depends on the number of channels used. Experimentally it was established that the minimum value of (T isobtained when the first and the lapt channels ueH are at a riirtance 0,o(FW**!)from the peak maximum position.
In many cases the peaks used are not single ones. They consist of severalpeaks groupped together. There are procedures and programmes for resolving acomplex peak but they are not suitable for calculators and it was neoeesaryto develop a new one.

72
The following procedure is proposed:f n _ _ ^* f i r s t t h? sigmas <5j and the positions p. . of maxima of the peaks whichde and u ^ T ^ i 6 3 ^ determined. The energy and sigma calibration are ma-ae and used in- o-rder to determine the P and «, for the individual peaks.
In determing the individual peak argis *»«•*••
£ l = Koi OiV^ i - 1.2 n m
the following formula is used:
vwhere m is the number of the peakB forming the compound peak and N is the
numberoof net counts in a channel p. Using the least square method and pstati-stical weights of the number of net counts it is pdssible to determine the in-dividual peak maximum counts N ,.
It was established that to determine the compound peak areas with a (roodaccuracy the individual peaks forming the expound peak have to be at a distance1 sigma from each other.
In order to determine the individual peak areas of an unrecolved compoundpeak using intrinsinc calibration the following system of linear equations mustbe solved:
Ni——; k= 1,2, ....n >5\
'JO i-1 j=1 xi ^i0 yj0 t j O Ni0
where n is the number of the isotopes emitting gamma quanta within consideredenergy region;
Ok is the number of the single lines participating in this energy regionT ± is the half live period of the isotope i;(B^)., are the branching intensities of gamma rays with energy j fromthe isotope i;0 is a subscript of the parameters of the peak which overall relativeefficiency is accepted to be 1;£ .. m£L is the overall relative efficiency at energy i;
N, is*the number of nuclei of the isotope i.The net area of the peak region S k may be a compound peak area. Using thiF
approach the isotopic ratios can be determined without resolving the compoundpeak. It is convenient and the renults are accurate. This procedure was propo-sed and used first in /1/ where it was described in more details.
3. PROCEDURE FOR URANIUM MEASUREMENTS.In order to determine U isotopic ratioB, U-235 enrichment and U concentra-
cion use of the narow energy range (84-93) kev iB proposed. The followingpeaks are used:
84.24 kev gamma rays emitted by Th.231, which is practically always inequilibrium with U-235;
89.942 kev Th K^? X-rays and gamma rays with the energy emited by Th-231;9 2.367 kev gamma rays emitted by Th-234, which should be in equilibrium
*lth U-238;92.792 kev gamma rays emitted from Th-234;93.35 kev Th K ^ , X-rays;94.666 kev U KL,1 X-rays;98.441 kev U K^-f X-rays.The lines 92.367, 92.792 and 93.35 kev form a compound unresolved peak
called "92.8" kev peak.The areas of the above peaks are determined using a linear background
subtraction.The overall relative efficiency dependence in this energy range is dete-
rmined using the 84.24, 89.942, 94.666 and 98.441 kev peaks. It is assumedthat the overall relative efficiencies for these four energies are lyingo-n a Becond degree curve
e * * a0 + a1Ei + ao E^C98.441 i
where £, is the overall efficiency for the energy

73
The energy dependance of the overall relat ive efficiency is determined by thisequation. Calculating 34.24 and 89,942 by this dependence the branching
, . . J 98.441 98.441 B
is determined to be:B89.942 0.3812 +/- 0.0065B 84.82
+*. * J t l s-iPr?PS«odQJhf i n t e n s i * y ra t io of the 94.666 kev U X, X-ray l ine
the Unresolved "92.3" kev peak to be used as a measure of c o n c e n t t i ^tration^to
3£94.666
S94.S6692.8
This has the following advantages:i . The l ines are very close to each other so the correction for relative changeof the overall detecting efficiency i s not large;i i . The compound peak with an average energy of "92.8" kev ( including 92.367kev92.792 kev and 93.35 kev l ines ) represents a l l possible sources of inner exi-t ing radiat ions.
The resul ts of the measurements on powder and pellet samples of differents ize , shapes, concentration and enrichment are given in following table:
SAMPLE " C H E M / " A 5 A L T
C AC
XRF-GSM~
C AC
A 87.97B 37.84
8 B:»E 37.80F 87.74
6
0.050.080.060.080.090.03
873387873787
.97
. 01
• 51.69. 80
0.130.130.080.160.030.11
COMPARISON OF CHEMICAL AND
X-RAY FLUORESCENT - GAMMA
SPECTROMETRIC MEASUREMENTS
(XRF - GSH ) OF CONCENTRATION
OF SOME SAMPLES
G.34..65. Q_.Q2 34468 Q.15
IT was established that:1 ) This ratio does not depend on the size and the shape of the measured sampleswhich makes the calibration very convenient; 2) The precision of the measurements(0.2 - 0.3)% at 2 (J level depends mainly on the measurement time; 3) The intensi-ty ratios depend on' the enrichment of the measured samples. 1?6 change of theenrichment gives 0.3% change of the intensity ratio. To measure the concentrati-on correctly through thiB intensity ratio one has to know or measure theenrichment of the measured sample. _ ?,s
The following formula is used for the determination of the »-«•§ ratio:
1 £89.942 S92.8
89.942 85
£93.35
£92.6(7)
w/here t, is the overall relative efficiency at energy E,;S. is the peak areas of the energy E.;
K
[8 '92.6k85"Tg 39.942
93.35 S89.942
.6 (Yft)o>3 *C7 + (TCo)oo too *8 *^e branching i n t e n s i t y from(Ye)Qg Q42 ^B * n e branching i n t e n s i t y of Th Kjg a n d 89.942kev l i ne of U,Te and Tg are the ha l f l i f e periodB of U-235 and U-230 i so topes .In de beaming the U-235 enrichment is. usedlthe formula Enrichment = 1 +
The coef.Koe and iC^ were determined by l e a s t square method.CONCLUSION
Method for U i so top ic r a t i o and concentrationWs^ng i n t r i n s i c ca l ib ra t ionand por table instrumentation i s developed and t e s t ed^I t i s pa r t i cu l a r l y su i t ab lefor IAEA safeguards appl icat ions.The i n t r i n s i c ca l ib ra t ion accumulates the p o s i -t i v e experience of the previous measurements and the r e s u l t s wi l l be improvingc o n s t a n t l y . l t i s possible to measure standards mainly in the labora tor ies and touse the r e s u l t s for ana lys i s far away a t d i f ferent time and p laces .
REFERENCESI.Dragnev T,N., IAEA/STR-60,(1976) and J.Radioanal. Chem., 36 (1977), 401.2.Von Meerwall E.D., Gfalvik M.JD., Comp. Phys.Communic. ,v.7,No 3» (1974), 115.

74
PROGRAM FOR THE QUALITATIVE AHD QUALITATIVE ANALYSISOV ft*-RAY SPECTRA
V.Obpelea ,E.Purice,R.Dan,Q.Calo«T,M.Domni8«n,V.Qalia,G.TeodosiuResearon Institute for Computer Technique,Calea Floreasca,l67,72321 Bucharest,RomaniaC.DebertInstitute for Nuclear Power Reactors,Bucharest,RomaniaN. looanu ,M. NastaseFundeni Clinioal Hospital,Calea Fundeni,258,Bucharest,Romania
INTRODUCTIONThe described computing program assures the quantitative and qualitative
analysis of the speotra obtained within the neutron activation analysis method.It is meant for the laboratories interested in detecting and determining theconcentration of certain elements (i.e. medicine,biology,metalurgy labs).
RESULTS AND DISCUSSIONSThe program processes regular spectrum obtained from the irradiation with
neutrons within test standard terms of a sample and measured by a Ge(li) detec-tor. We can use both a TN 17o5 multichannel analyser and a romanian MCA 79 one,both with Io24 channels,the interfaoe with the computer being performed by ITC.
The program has been made and Implemented on the roumanian microcomputersFELIX M118 and FELIX M216 and has a modular, struoture whioh facilitates its useand debugging.The spectrum processing by the program is performed off*-line,after having been memorized on a floppy disk.
After introduction, the speotrum is dumped on display, enabling selectionand extension of some speotrum windows with cross-hair facilities.The next stepis to determine the background paramaters(the background is supposed to be apolynomial of degree 1,2 or 3)*
Further on comes the gaussian ourves fitting using the least squares methodapplid to the equations
Y(x)-ax3+bx7+ox+d+ 2 E y. exp(- (x-xoi f /a«£> (1)The fitting process oan be aimuoltaneously made on maximum lo gauasians
and starts by introduction (by the user) of an initial evaluation of parameters(it may be performed either by a oross-hair or may be taken from another spec-trum analysis program of smaller resolution,for example the PRAO program).
The gaussian curves fitting is lucratively made,ending either whan exceedingan Iteration maximum number or when the process converges.lt is accompanied bythe permanent dump of the initial speotrum as well as of the one calculated af-ter each iteration,In ease the prooeas does not converge it is recovered with arelntroduotion of the gaussian Initial parameters.The identification of the ele-ments la performed using a polynomial relation betwaan energy and channel,ob-tained by the calibration of the device with a standard sample.
Further comes the caloulus of the peak-areas (by Integration) and the ele-ment identifying module,by searohing In the library associated to the program.
The oalculus of the elements concentration (elements previously identifiedin the sample) is made supposing that the relation between then and the Inducedactivities is known.
Finally the program puts at tha user's disposal the list of the elementsIdentified during the test,together with their concentrations,in the form of ananalysis report.
REFERENCES/I/ W.L.Zijp.Leoture notes on computerized gamma-ray spectrometry,ECN,febr.l9B4/2/ V.Tepelte,E.Purioe,G.Teodoslu,V.Galls,B.Mooanu.PRAG-program for antropoga-mmametrlo analysis
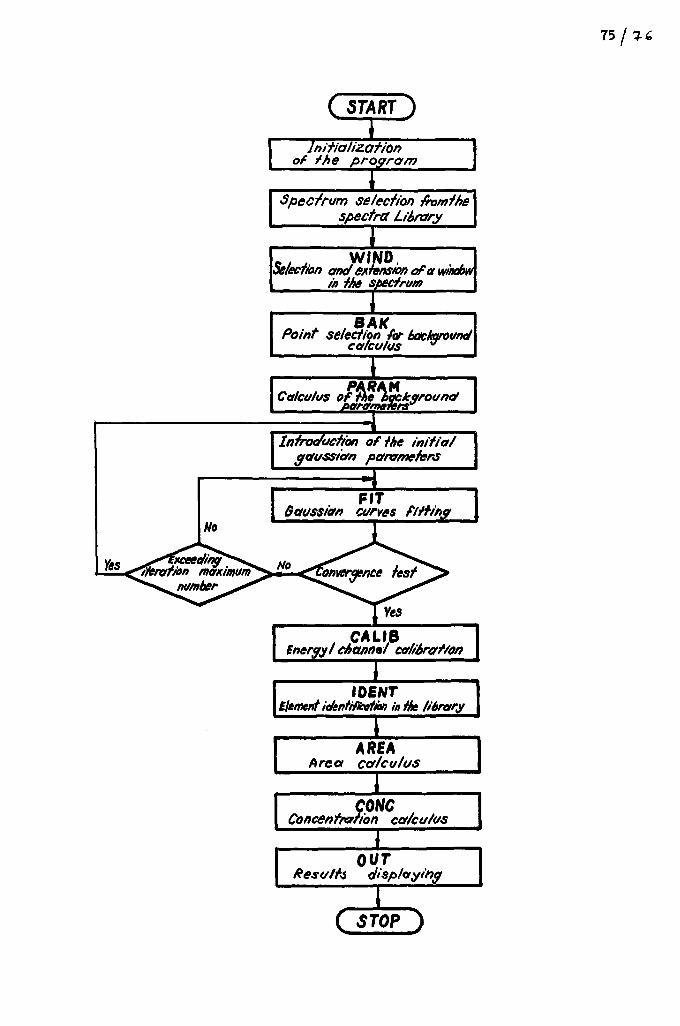
7 5 / %6>
C START
Initializationof //>e program
I•Spectrum selection fromthe
spectra Library
Ic / u WIND,Selection and extension f
in the spectrum
1BAK
Point selection far bctckqroundcalculus *
ICalculus of the" backs
port/met
LIntroduction of the initia/
gaussicrn parameters
r FITI Baussiati curves
weeding*ion maximumnumber
CALIBEnergy/ channel calibrat/on
II DENT
Element identification in Hit library
AREAArea calculus
CONCConcentration calculus
IResulfa
OUTdi

M E D I C I N E
A N D
711
BIOLOGY

79
INVESTIGATION OF THE BEHAVIOUR OF SOME ELEMENTSIN HEART OF THYMECTOMISED RATS
L.KinovaInstitute of Nuclear Research and Nuclear Energy,Sofia,Bulgaria
INTRODUCTION
Tne thymus gland is known to be the primary regulator of the immunedefence in the organism.Later it was recognised as an endocrine organ,thereforeit participates in the regulation of the metabolic processes as well.For themaintenance of normal flow of metabolism some essential elements are required.From this point of view the investigation of elemental behaviour after theremoval of tne thymus gland (thymectomy) will give us an additional informa-tion on the significance and functions of the thymus gland in the organism.
EXPERIMENTALDetermined were elements K, Mn, Ca and Zn in heart of normal (intact)
and thymeotomised Wietar rat8.Thymectomy was performed at the age of 3 month.Analysed were hearts of intact animals at the age of 3, 6, 9 and 12 monthand hearts of thymeotomised animals at 15 days, 3t 6 and 9 month after thyicec-tomy.Determination of the elements of interest was carried out by means ofinstrumental neutron activation analysis.Collection,cleaning and storage ofthe samples.as well as the irradiation,cooling and measuring mode and ana-lytical isotopes used were described in other our work (i).The resultsobtained are presented in ppm in table 1.
Table 1
j(<o
KMnZnCa
KMnZnCa
INTACT
9275 + 7 1 32,79 + 0.2276 + 4
164 + 13
12100 + 4454.59 + 0.3674 + *135 + 11
THYMECTOMISED
8664
59.3976
13830
2.2796171
+
<
±+
±±++
10011
2.298
8570.19712
r
I
1
INTACT
11467 + 8643.91 + 0.22
72 + 3118 + 8
10670 + 9562.78 +0.11
79 + 4177 • 13
THYMECTOMISED
12833 + 1010
<1.484 + 4134 + 10
10990 + 8201.98 + 0.17
42 + 3152 + 12
DISCUSSIONFrom our investigations it was established that the changes in the
concentrations of the elements analysed are most demonstrative in the earli-est term after the tnymectomy (15 days ).Por example observed are decreaseof K, Mn and Zn in comparison with intact rats.For the same term afterthymeotomy Ca concentration in heart increases.
According to the literature the decrease of K and increase of Ca in myo-oard (resp. increase of K and decrease of Ca in serum) leads to slowing of therhytm of heart beating because of difficulties in the transition of the nerveimpuls to heart muscle (2) .The changes in K and Ca concentrations observed byus in myocard of thymectomised animals are in agreement with the investigationsof Kosarev (3), who established decrease of the frequenoy of heart beating inratB after thymeotomy.
According to some authors (4)» changes in the electrocardiogram in thiscase are characterised by elongated S-S interval and diminished T-peak.
On the other hand it is known that Mn defficienoy leads to a reducedoxygen uptake (5) for the reason that Mn is a well known activator for manyoxidising processes in the organism.We found a significant decrease of Mn inthe myocard In the earliest term after thymectomy.Together with the alterationin the metabolism after thymectomy this faot might be an explanation of theresults of Usunova(6) - elongation of S-T interval as it dependes stronglyon the alteration of metabolical processes and especially on the oxygen uptake.The ECG changes mentioned remain in the later terms after thymectomy synchro-nously with the lower oontent of Mn in the myocard of thymectomieed rats (7)*
Our results show a sharp increase of Ca in myocard in first investigatedterm after thymeotomy - 15 days.Increase of Ca is a oause for the rise of his-

80
tamine level in myocard muscle since Ca is a liberator of histamine fromthe mast cells .Although this rise of Ca is observed for quite a long periodup to 6 month after thymectomy - the histamine level in the heart of thyme-ctomia«d is higher than in feeart of intact rats only in first term analysed( 15 days ) after which it falls down under the level of normal (intact)animals ( 7 ).Probable explanation for this fact could be the subsequentrise of Zn ( 3 and 6 month after thymectomy), which has been shown to inhibithistamine release from the mast cells and thus acts as an antagonist of Ca(8).In the latest term ( 9 month after thymectomy) investigated the Zn level inthymectomised heart falls down under that of intact animals which leads againto a rise of histamine level.The behaviour of ratio Zn/Ca in heart of intactand thymeotomised animalB is shown on fig.1.
Fig. 1
0,6
\LO 1VTHCT
X THYMBCT.
Following the alterations of theelements analysed in the latestterms after thymectomy atendency toward a fall underthe normal ( of intact animals)values is observed.
1Z— • •
CONCLUSIONThe data summarised in this work show that the removal of the thymus
gland impair the metabolic processes in the organism.The attempt made by usto explain some of the alterations in the heart after thymectomy by thechanges in the concentrations of elements analysed gives an opportunity fora further clarification of the role of the thymus gland in the organism.
REFERENCES/l/.L.Kinova ,M.Iovchev,T.Grigorov,D.Apo8tolov,Z.Kemileva|Proc.3.Tagung
Nuoleare Analysenverfahren,11.-15*4.1983,Dresden,DDR/2/#A.Ado,L.M.Ishimova» Pathological Physiology, Medicina,Moskva,1973/3/.I.Kosarev \ Dias.,Varna,1972/4/.K.Velikov i Diss.,Varna,1971/5/.E.Underwood i "Trace elements in Human and Animal Nutrition",
Academio Press,London,1977/6/.A.Usunova j Diss.,Varna,1968/7/.Z.Kemileva \ Thymus , Medioina i fiscultura, Sofia,1979/8/.Q.J.Brewer i Trace Elements in the Pathogenesis and Treatment of
Inflammation , Birkhauser Verlag,Basel, 1981

81
THE FEASIBILITY STUDY OP iN-VlVO ANALYSIS OP BONE CALCtUM BY ACTIVATION
OP HAND WlTH 5 Ci 238Pu-Be
H .SevimliQekmeoe Nuclear Research Center F.K.I Havaalam-ISTANBUL-TURKEY
INTRODUCTION
Throe main olinoal methods are used to evaluate the mineral content of human bone:Radiography,semi-quantitative histology performed on a biopsy from the iliac crest andabsorptiometry praoticed on the forearm. The poor sensitivity of radiography and the distressoaused by the biopey process necessarily limit the use of these techniques.
The absorption curve produoed by the bone mineral analysis concerns a "total bonemineral" per unit length of the bone scanned but not the calcium content of this bone. On theother hand neutron activation analysis, which is non-destructive, is an ideal method for thequalitative and quantitative determination of bone mineral elements in living subjects.
An in-vivo neutron activation technique (IVNAA) for the measurement of calcium wasproposed by Maletskos in 1961 (1), performed on man in 1962 by Anderson et al (2). In severallarge centers, this technique was used to measure the calcium mass or calcium concentrationby using whole-body irradiation for studies of osteoporosis. (3-6)
For a number of reasons-differing tissue sensitivities to radiation, difficulty and costof obtaining a uniform whole-body irradiation,«tc-It was started to investigate the calciummetabolism by partial-body neutron activation technique; in hand (7-10),tibia,spine (11-12)and foream (12).
Required neutron flux is provided mostly by isotopic neutron sources,cyclotron (11-13)and D.T generators.
Ideally one should measure the mineral content of lumbar vertebrae,where metabolic damageis detectable earlier. But neutron irradiation of the vertebra present difficulties,both inadministration technique and in the results (since the aorta is often calcified).
Furthermore,in other bone diseases (hyperparathyroidiBm and renal osteodystrophy)mineral lose is early and marked in the hand (14) where the soft-tiBsue component is small,and the peroentage of bone in the hand (v/v) is about twice that for the whole body .Thereforeit was decided to use the hand the neutron activation analysis.
EXPERIMENTAL
The .ga (n,")() Ca reaction was employed for the analysis of calcium.(f»0,185 $ 6VL.lb1-900 mb) 49ca,has 8.8 min. half-live and emits 3.1 MeV gamma photons .The gamma intensity isproportional to the mass of stable caloium exposed to the thermal neutron flux. By comparingthe induoed *9Ca activity with that of a standard of known chemical composition, it is easy tomeasure the mass of stable caloium contained in the bone segment examined .Or to determine theohanges of calcium amount .Measurement may be repeated three of four times a year.
5 Ci 23sPu-Be isotopio neutron Bouroe was used for irradiation.Total emission of sourcel.lxlO? n.Bec"1 . The whole irradiation device is shown on Fig.l.
Hand phantom tubeB were placed into the tubes of device which is put in the middle oftank,around the souroe.
In order to obtain sufficient precision it was necessary to perform four 10-minirradiations each followed by a 1000 Bee. counting period .After each irradiation the tubeswere trensfered to the detector in one minute,a 5"x5" Nal (Tl) well-type detector and a 1024channel multichannel analyzer were used for counting gamma rays. ,_
It was found out,that the contribution of 3100 KeV gamma rays from "ci (n,p) Sti/2-5.06 min. f-24,23 % is negligible.
RESULT and CONCLUSION
The mesurements of calcium series were started first by using 14g of calcium whichcorresponds to the calcium content of i.and .The amount of calcium WBB decreased step by stepPig 2.
Standart deviation over a series of ten analysis performed on the same phantom is within3*.
Dose measurements were carried out* by UBing LlF TL Dosimeters on phantom tubes filledwith homogenized human bone .The Dose rate was 2,7 rad/h and the hand dose is 9 rem.The bestestimate of the 238Pu-Be neutronB RBE appears to be 5 (15).This dose will be decreased byabout a factor of two when two 5"x5" Nal (Tl) detectors are used.
This dose,strictly localized compares favorably with those commonly delivered duringconventional radiotracer examinations such as thyroid uptake tests.
According to International Commission on Radiation Protection (ICRP) standards the maximumdose equivalent acceptable in the hand,for individuals directly engaged in work with radiation,is 50 rem per year or 15 rem per quarter.This measurement may therefore be repeated quitesafely three-four times a year.The repeatation is essential for the study and treatment ofosteoporosis.
When the patient irradiation start,neutron souroe will keep in same position, the patientwill hold It.in hand.The source will be covered one cm thickness of paraffin wax.
x The author thanks Zuhal Ugur for dose measurement.

82
8Q.
800
610
•00
tirr
«e«tDost
4x10 min
txttOOs
Imin
9 ftm
r1 -.0,9965
y = 54,057 >+88,622
6 10
Calcium Amount - g
U
Fig. 2 - 308A KeV Peak Ar«a against Caamount in thi hand phantom.
PhantomTubas(Scm)
Paraffin Wax
Fig. 1 - Irradiation facility
REFERENCES
/ I / Malketskos, C .J . , Keane AT.Li t t l e f i e ld S, e t a l . Annual Progress Report Cambridge952 (1961) 68.
/ 2 / Anderson, $., Osborn SB, ToralinBon RWS Lancet 2 (1964) 1201./ 3 / Chamberlain, ttJ., Premlin, J.H., Peters, U.K., Phi l l ip , H., Br. Med.2 (1968) 581.IM Cohn, S.H., Fairchild.R.G., Shukla, K.K., In Vivo Neutron Activation Analysis (Proc.Panel Vienna 1972) IAEA Vienna (1973) 37./ 5 / Me. Neil l , K.G., Thomas, B J . , Sturtridge, W.C.f Harrison J .E . , J Nucl. Med. 14(1973) 502./ 6 / T J . Spinks, D.K. Bewley, A.S.O. Ranicar G.F Joplin Modern Trends 76 (1976) 221.Ill Catto, G.R.D., Uclnsosh, J.A.R., Uacleod M., Phys. tied. Bio l . , 18 (1973) 508./ 8 / Uazxre, B., Comar, D., Kuntz, D., Jour. Radioanal.Chem. 37 (1977) 357*/ 9 / Guey, A., Leitinne p . , Zeoh, P.Y., Traeger Doyen, J.B. Nucl. Activation Techniquesin the Life Sciences Vienna 1978 I.A.E.A. Vienna (1979) 701./1O/ Maziere, B., Kuntz, D., Comar, D., and Ryckewaert, k.t. Nucl.Med. 20K1979) 85./ l l / Alhit i , K., Thomas, B«t., Altikrity, S.A., Ettinger. K.V., Fremlin, J.H., Dabek,Jt.T., Int . J.Appl. Radiat. I sot . 27 (1976) 97./12 / Smith, M.A., Tothill P. , Phys. Med. Bid. 24 (1979) 319./13 / Ozbas, E., Chettle, D.R., Ettinger, K.V. Int. J . Appl. Radiat. Isot . 27 (1976) 227./14 / Catto, G.R., Macdonald A.F., Mcintosh t .A.R., Lancet 1 (1973) 1150,/15 / Hall E.J. In some Physical Dosimetry and Biomedical Aspects of Cf 252 IAEA Vienna(1976) 151.

DISTRIBUTION OF SOME ELEMENTS IN HUMAN COLON MUCOSA
R. J. DraskovicBoris Krdric Institute of Nuclear Sciences, VinEaPOB 522, 11000 Beograd, YugoslaviaM. BozanicC/H Center " Dr Dragisa Misovic "11000 Beograd, Yugoslavia
INTRODUCTION
Continuing our investigations of the role of TRACE ELEMENTS in livingorganisms ( TE - distribution in plankton, alga, shells, bentos, Crustacea,fish, mices, rats, human organs and tissues; liver.brain, kidney,dents ) wehave determined some elements in healthy and pathologically altered humancolon mucosa, i.e.: ( 1 - 5 )
- healthy - N- Colitis Chronica -CCh- Colitis Ulcerosa -CU- Adenoma Tubulare - AT- Adenocarcinoma - ACa
( The diagnoses were previously verified clinically and histopathologically )
Our aim was:to follow changes of the contents of elements inhuman colon mucosa as a function of pathologicalalterations during development of diseases (dia-gnostic series : from healthy to cancerogenic states ) .
EXPERIMENTAL
The samples were taken for analysis from 80 patients, 'n five diagnosticgroups ( 8 - 4 3 patients ).
The samples ( 0.00023 - O.OOO87 Kg in weight ) were taken during recto-sigmoidoscopy by teflon coated forceps and washed by bidistilled water andC2H5OH ( E. Merck ) / admixtures, mucus, blood /. All samples were deep
frozen ( T = 244° K ) and 1 tophi lyzed in serfes.Thus prepared the samples were irradiated in RA - nuclear reactor at
Vinca by thermal neutron fluxes 0.54 - 1.85 x 10'7 n / mz . s for 3 days.Cooling Time was 7 - 9 weeks.
Measurements were performed on a 4096 - channels analyzer with a Ge(Li) -detector ( Ortec; gfft of IAEA ). Measurements times of samples and sta -ndards ( laboratory standards ) were 3000 s and 100 s , respecively.
Numerical: Method of comparaison; TPA - treatement; contents of elements( Cg- and CE - parameters ) expressed in nKq /g of liophi lyzed njjcosa.
RESULTS AND DISCUSSION
The results for CE - parameters in healthy and pathologically altered
human colon mucosa are presented in Tables 1, and 2.
Co
Zn
Fe
Cr
Sb
Cmln
nKg/g
4.23
28.80
328
1.70
4.1
flw FREQUENCY OF
jj o tnin
g g DIAGNOSTICo GROUPS
Aca
A T ACa:4(5)
ACaAT:l(5)
ACa
ACa
max
nKg / g
56.91
225.10
5652
45.10
480.6
DIAG
NOST
ICGR
OUPS
CCh
AT
CCh
AT
CCh
FREQUENCY OFC INmaxDIAGNOSTICGROUPS
CCh : 3 ( 5
AT : 2 ( 5
)
)
TABLE 1. MINIMUM AND MAXIMUM CONTENTS OF ELEMENTS IN INVESTIGATED
MUCOSA SAMPLES AND FREQUENCY OF THESE PARAMETERS IN DIA -
GNOSTIC GROUPS
CHROMIUM
IRON
COBALT
ZINC
ANTIMONY
CCU23.32
CCCh
3431
CCCh
28.62
'cu143
Ccu
265
> CN
21.06
> <TU
3362
> <CU
28.12
> ^CCh
137
^ CCn
247
> CCCh
19.35
> Si3065
» Si27.62
" S136
139
> CAT ;
14.31
9 'AT
2105
* CAT
16.56
* ?AT
120
> cAT
86.7
» CACa
13.23
> CACa
1B24
> CACa
16
> ^ACa
116
9 rACa
55.69
TABLE 2. RELATIONS OF TOTAL MEAN CONTENTS OF ELEMENTS ( C£ - parameters )
in N -, CCh -, CU -, AT - AND ACa DIAGNOSTIC GROUPS
CONCLUSION
The following conclusions can be drawn:
- the obtained C£ - PARAMETERS DECREASE TOWARDS Ca - groups;
- minimum values of CE ~ parameters were found for elementsFe, Co, Cr and Sb in the ACa groups and maximum for Fe,Coand Sb in CCh - groups;
- in order to prove these conclusions it would be necessaryto follow the dinamics of the changes in mucosa, because ofits cells life cyclus ( <t - 8 days)/ oscillation of elementsconcentrations, especially of Trace Elements,etc ... /.and
- it is very important to take into account the elements co -ncentration changes, caused by oscillation of the exchangewith surrounding tissues, during elimination of contamina -nts through mucosa, in the case of intoxication.
REFERENCES
/ I / DraSkovic R.J., INVESTIGATION OF GEOCHEMICAL CHARACTERISTICS OFCOMPONENTS OF SOME NATURAL WATER SYSTEMS BY NON-DESTRUCTIVE RADIO-ACTIVATION ANALYSIS, University of Beograd, Thesis ( 1978 )
/ 2 / Kostic K., Ristanovic R.,Obradovic V., Djordjevic M., DraskovicR.J., Trace Element Analytical Chemistry in Medicine and Biology,W.de Gruyter and Co. Berlin - New York.ed.: P. Bratter and P.Schramel, ( 1980 ), p.p. 601 - 610
/ 3 / Draskovic R.J., Jacimovic Lj., ( + ) Stojicevlc M., Pajic' P.,Filipovic V. , J. Radioanal.Chem. 70 ( 1982 3,117
/ k I Bozanic M., DETERMINATION OF TRACE ELEMENTS IN HUMAN COLON MUCOSABY THE METHOD OF NEUTRON ACTIVATION ANALYSIS, University of Beograd,Thesis ( 1983 )
/ 5 / Draskovic, R., Bozanic K., Bozanic V., Bonus T., J. Radioanal. Nucl.Chem. 8V2 ( 198<i }T 395 - M>5

85
ANALYSIS OF HUMAN RENAL CALCULI BY INAA
L.Kinova,Iv.PenevInstitute of Nuclear Research and Nuclear Energy,Sofia,BulgariaM.de BruinInteruniveraity Reactor Institute,Delft,The Netherlands
INTRODUCTIONFormation of the renal calculi is a long process helped by such factors as
an impairment of mineral metabolism,slowed urine flow,defects in metabolism ofgenetio origin.Functional disturbances lead to some alterations in the elementalcomposition of the serum and urine,Prom this point of yiew it presents some in-terest to analyse kidney concretions for eventual relation between elementalcomposition and the degree of illness.
EXPERIMENTALSampels of human renal calculi were collected from the population of Delft
area,The Netherlands.25 oamples were analysed: 14 from male patients and 11 fromfemale patients.Clinical data available consisted of serum creatinine and urea.
Analysis was carried out by means of instrumental neutron activation ana-lysis using the facilities of the Interuniveraity Reactor Institute in Delft,consisting of T» ?
2 MW swimming pool reactor with neutron flux 1x10'''n/cm secWell-type detector Phillips with gold linning 0.4 mm and energy resoluti-
on 1.8 and 2*3 KeV at 122 and 1332Kev respectively*Detector signals were processed by an ADC coupled through a CAMAC buffer
memory to the PDF - 11/70 computer.The following elements were determined: NA,MN,FE,CD,SE,CO,CA,BR.For the
treatment of the data obtained duster analysis was applied/ 1 /.DISCUSSION
After applying the duster analysis to the cases investigated they weredivided into two clusters.Each of olUBters thus formed is characterised by thefollowing concentrations of the elements in the concretions/table 1/:
Table 1.
HI.
II.
MB
2.
16.
0+0
8+6
.5
.4
Fe
7B+6.5
1340*460
Co
0.41+0.1
4.2*1.7
Cd
4.4+0.8
32+12
Se
0.4+0.1
2.4+1
la
3200+760
3560+870
Ca/103
258+17
267+20
Br
5.8+1.
13.7+4.
2
3
From the results presented in table 1 it can be seen that the clustersdiffer one from otner in the content of tne elements MN,PE,CO,CD,SE.The clusterI consists of cases with low content of the mentioned elements,the cluster IIcontains cases with high content of the same elements.
The dusters were compared with tho available clinical findings.On the fig.1 is demonstrated the correlation creatlnin - urea for the
renal calculi of the female patients from both olusters( 1 - cases from clus-ter I, 2 - oases from duster II). A tendency oan be observed to a shar-per increase of creatinin with the increase of urea for the cases with highconcentration of the elements of interest.
CONCLUSIONThe number of tne oases analysed is not sufficient to draw some conclusi-
ons .However the results obtained show that the processes leading to thenucleation obviously proceed in such way that they result in a forma- .tion of two kinds of renal calculi - with low and high concentrations of someelements .For further investigations from our point of view it will be ofinterest to analyse only surface layers of the concretions which could pos-sibly have some connection to the clinical findings, characterising tht patientscondition/ 2 /, It also should be cleared if the difference in the content ofthe stones from both clusters is due to the different types of the concre-tions, or to some physiological reasons, or is a result of the influenceof the pollution in the environment .In case that the main reason forthe observed differences is the environmental pollution than the concre-tions could be uBed as a speoific monitors for the Btate of the environment*

86
3 6UREA/(mg%)
pig. 1
REFERENCES
/ 1 / B1I0F - Programme S t a t i s t i c a l Deve lopement ,Univers i ty o f C a l i f o r n i a ,Los-Angeles-London, 1979*
/ 2 / B.E.TaylorfS.A.Saied, British Journal of Uro logy (19B2),5£, 346 - 347

87
DETERMINATION OF SODIUM IN PHARMACEUTICALS
BY NEUTRON ACTIVATION ANALYSIS
G.D. Kanias*and N.H. Choulis***Radioanalytical Laboratory, Chemistry departmentNuclear Research Center "Demokritos", Aghia Paraskevi
Attikis, Athens, Greece
""Laboratory of Pharmaceutical Technology,University of Athens, 104 Solonos str., Athens, Greece
INTRODUCTION
The chemical element sodium exists in all the pharmaceutical preparationseither in active compounds or in excipients or both.
The active compound in a large number of drugs is usually present in the formof its sodium salt because this form gives high solubility of the active compoundin water e.g. injectables, oral solutions.
Different sodium salts are added as excipients during the formulation of thepharmaceutical dosage form such as: sodium alginate for granulation and disinte-gration, sodium benzoate for preservation, sodium chloride for dilution and lubri-cation, etc.
The total concentration of sodium is included in the list of specificationsof some pharmaceutical products e.g. Pentothal in injection dosage form (1).
The knowledge of sodium content in Pharmaceuticals is important because whenthis element belongs to the molecule of the active compound and/or the excipient,the estimation of its content controls directly or indirectly the: identity,strength, quality and purity of the drug in which sodium is found. Also when heartpatients are treated with diuretic and cardiotonic drugs a continuous control ofsodium content in those drugs is needed because it is known that sodium is relatedwith diuresis (2).
Nuclear analytical techniques (neutron activation analysis) have not beenutilized extensively in the pharmaceutical analysis although they have some advan-tages over the conventional methods.
Literature shows only few applications of neutron activation analysis in thecontrol of active compounds in drugs (2,3,4,5,6).
To the best of our knowledge the determination of sodium in drugs for thecontrol of active compounds by neutron activation analysis has not been studied upto now.
It must be pointed out that all pharmaceutical dosage forms do not offerthemselves for the determination of active compound through sodium content, becausethis element is found almost in all the solid excipients. Thus, only the dosageforms which contain tridistilled water as unique excipient, (except eye-drops)could be investigated.
The purpose of this work is to develop a simple, fast and accurate method forthe determination of sodium in pharmaceutical preparations concerning either thedetermination of active compound or the total content of this element. The examineddosage forms consisted of injectable and oral solutions and the applied method wasinstrumental neutron activation analysis.
EXPERIMENTAL
Apparatus
The irradiation of samples and standards was carried out using the rotationsystem of the reactor of Nuclear Research Center Demokritos with a maximum thermalneutron flux of 2.9'K)13n«cm-2«sec-1. Gamma-ray spectrometry of the irradiatedsamples and standards was accomplished with a coaxial Ge(Li) detector series Winib
with an efficiency of 15% connected to an Ino-Tech 1024 channel analyzer (Model IT5200).

88
Sampling
Samples for analysis were selected from the Greek Market. The number ofcollected and analysed samples were 10 ampoules for injection and 10 bottles con-taining oral solution. These were classified according to the dosage form andaccording to the active compound to be determined and in each sample a code numberwas assigned. Each ampoule for injection, bottle with oral solution, was openedand the required volume was withdrawn for analysis.
Standards for analysis
The appropriate amount of analytical grade purity NaN03 was dissolved intridistilled water for the preparation of a standard stock solution containingsodium in a concentration of 40 mg/ml.
Different dilutions of this standard were used for the analyses.
Procedure
For the determination of sodium in drugs 0.7 ml of sample with an equivalentvolume of sodium standard solution of analogous concentration were placed into1 ml polyethylene vials which were heat-sealed for irradiation. Samples and stan-dards were irradiated simultaneously at the rotation system of the reactor for 5minutes. The thermal neutron flux was S.S.'IO11n«cm"2*sec"1 for sample under the<y>de number 6, while for all the other irradiated drugs was 5.8«101"n«cm"2'sec-1.After an hour's cooling time 0.5 ml from samples and standards was transferredinto 5 ml tubes for counting on the multi-channel analyser. After counting thecalculation of sodium content was done by comparison of the photopeaks correspond-ing to the gamma-ray of 2l(Na at 1369 keV of samples and standards.
RESULTS AND DISCUSSION
The results obtained from the determination of sodium in different pharma-ceutical dosage forms by neutron activation analysis are summarized in Table i.
In the column "element found by NAA" the mean value from the analysis of10 different samples of each drug product is given.
TABLE 1
Results of sodium determination in different drugs
Code Dosage formNumber
Composition per dosage form Na calculated Na found Percent labelfrom label by N.A.A. claim basedclaim (ing) (ing) on Na found
12
34
5
6
Injection 1 mlInjection 5 ml
Oral solutionOral solution
Oral solution
Oral solution
Metampyrone 1000 mg/2 mlPitophenone HC1Fenpipramide methylbromateMetampyrone 2500 mg/5 mlMetampyrone 500 mg/mlPitophenone HC1Fenpipramide methylbromateMetampyrone 500 mg/mlSodium dipropylacetate200 mg/mlSodium picosulfate7.5 mg/ml
65.0
16332.6
32.627.6
0.716
63.5
16132.8
32.727.8
0.694
97.7
98.8100
100101
96.8
The sensitivity of neutron activation analysis for the determined elementunder the experimental cqnditions of this work is 40 ug.
Table 2 shows the precision and the accuracy achieved in the determinationof sodium in drugs by neutron activation analysis.

89
TABLE 2
Precision and accuracy of sodium determination in drugs
Code numberof drug
123456
Standard deviation(*)
3.11.01.92.52.82.9
Standard error
2.31.20.60.30.73.2
As it can been seen in Table 1 the pharmaceutical products with code numbers2 and 4 besides sodium contain two other active compounds with the elements chlo-rine and bromine respectively. Normally it was expected that an indirect determi-nation of all three active compounds could be done with one irradiation. But pre-liminary experiments showed that the radioactivity of sodium was so high, thus notallowing the determination of the other two active compounds with the proposedvery simple and fast method of analysis. The rapidity of the developed method forsodium depends on the thermal neutron flux and the cooling time. One hour's cool-ing time and two different thermal neutron fluxes were chosen for this work. Thechoice of these experimental conditions was based on the calculated sodium contentin the examined drugs and on the purpose of irradiating simultaneously big numbersof different samples (from 8 to 50).
A pneumatic transfer system (rabbit) could also be used for the determinationof sodium in drugs but this way of irradiation, although faster than the proposedone it does not offer the advantage of simultaneous irradiation of big numbers ofsamples.
The obtained results of this work as well as those reported in the litera-ture (1,2) showed that neutron activation analysis is a very fast and simple methodfor the determination of sodium in pharmaceutical preparations, whether this deter-mination concerns the estimation of active compound or the total content of thiselement.
The accuracy and the precision of the applied method are found to be veryhigh and therefore this method could be established as an official one.for thedetermination of sodium in pharmaceutical preparations.
REFERENCES
1. G.D. KANIAS. J. Radioanal. Chem., 60 (1980) 237.2. G.D. KANIAS, N.H. CHOULIS. J. Radioanal. & Nucl. Chem. Articles 88/2 (1985)
281.3. A.O. PEDERSEN, E. STEINNES, T. WAALER. Medd. Norsk. Farm. Selsk 30 (1968) 41.4. V. HOLM, E. STEINNES, T. WAALER, Medd. Norsk, Farm. Selsk. 30 (1968) 17.5. J.P.F. LAMBERT, M. MARGOSIS, J. Pharm. Sci. 59 (1970) 1005.6. M. MARGOSIS, J.P.F. LAMBERT, J. Pharm. Sci. 60 (1971) 592.

INVESTIGATION OF DISTRIBUTION OF ZINC, IRON AND
ANTIMONY IN HEALTHY AND PATHOLOGICALLY ALTERED
LIVER TISSUES
K. Kostic, S. StankovicMedical Faculty, Laboratory for Application ofRadioisotopes in Medicine11000 Beograd, YugoslaviaR.J. DraskovicBoris Kidric Institute of Nuclear Sciences - VincaPOB 522, 11000 Beograd, Yugoslavia
INTRODUCTION
Contents of some elements in human organs and tissues often depend on di-fferent pathological processes ( 1 - 5 ) . This phenomenon suggests specificrole of TRACE ELEMENTS in metabolic disorders during the progress of disea -ses. Data on elements'qualitative and quantitative distribution in healthyand pathologically altered tissues and organs can be used as a basis forinvestigation of this role in such processes.
In recent studies of the role of trace elements enabled conditions fordevelopment of a new scientific discipline - MEDfCAL ELEHENTOLOGY.*
in this paper, we present the results of our studies of distributions ofiron, zinc and antimony in healthy tissue, different pathological structuresof cirrhotic liver, cirrhosis associated with evoluted carcinoma and primarycarcinoma of human livers, using INAA as analytical method.
The aim of our work is to demonstrate changes of the contents of some ele-ments as a function of tissues'pathological alterations in different disea -ses of 1iver.
EXPERIMENTAL
Liy.er samples were taken during authopsy.Diaonosae: based on histopathological findings.Analyzed liver samples: healthy; cirrhotic with primary CAand cirrhotic associated with primary evoluted CA.Analyzed tissues: healthy liver ( different parts of theleft and right lobus ) ; cirrhotic liver ( hepatocites - HC ;regenerative nodes - RN ; fibrous tissues - FT ) ; liver withprimary CA ( tumorous nodes - CA ; healthy tissues - H ) ;cirrhotic liver associated with primary evoluted CA ( hepa -tocites - HC ; regenerative nodes - RN ; tumorous tissue - CA ) .Liophilyzation: in Leubold - Hereus GT - 2 apparatus at a pressureof 5.30 Pa ( i» x 10" 2 Torr ) and T = 258° K ( - 15° C ) .Irradiation; in RA - nuclear reactor at Vinca in serias( *)0 - 60 samples with laboratory standards ) by thermalneutron Flux 0 = 1.29 - 2.1 x 10"'7 n/m2 . s ; T j r r = 3 daysCooling time = 7 - '•O days. Mass of samples was circa 0.0001 Kg.( si 1ica ampoules )
x / MEDICAL ELEMENTOLOGY - the term was used for the first timeat the " First International Conference on the Elements inHealthy and Diseases ", 6 / 1 0 February 1983,New Delhi,India
Quantitative determination: Comparaison method and TPA -treatement. The results are presented as partial and totalcontents of elements ( eg - and C^- parameters ) expressedin nKg / g of liophilyzed tissues with statistical, parametersSD, SE and CV .
RESULTS AND DISCUSSION
The Tables 1 and 2 present the data on eg - and Cp- parameters in healthyliver and in H - and CA - tissues of the liver with primary CA.
ELEMENTS
IRON
ZINC
ANTIMONY
CE
1)1)1
351*
0.03
SD
nKg / g
36.1)
20.1)
0.1
SE
7.5
U.I
0.02
CV
%
8.2
5.8
20.1
TABLE 1. TOTAL MEAN CONTENTS OF ELEMENTS ( Cp ) OF IRON, ZINCAND ANTIMONY IN HEALTHY LIVER
ELEMENTS
IRON
ZINC
ANTIMONY
LIVER
TISSUES
HCA
HCA
HCA
CF
6831)61
371)63
0.0.
255355
SD
nKg / g
1991)5
1511
0.0950.081
SE
99.622.7
7.65.6
00.0<i8.Oil
CV
*
299.
h17.
21)1
8
6
1
TABLE 2. PARTIAL MEAN CONTENTS { cp ) OF IRON, ZINC AND ANTIMONYIN LIVER WITH PRIMARY CARCINOMA( CA - TUMOR I US TISSUE ; H - HEALTHY TISSUES )

The data on C_- parameters for cirrhotic liver ( hepatocites - HC ; rege-nerative nodes - RN ; fibrous tissues - FT ) and liver with carcinoma evolutedof cirrhosis ( hepatocites - HC ; regenerative nodes -RN ; timorous tissues- CA ) will be presented at the Conference due to space restriction.
We found the following :
- Cp - parameters of Fe, Zn and Sb are homogeneous foreach investigated healthy liver
- Cp - parameters are heterogeneous for different healthyfc liver
- relations of C £- parameters for HC - ,RN - and FT - tissuesof cirrhotic liver are:
Fe: C
Z n :
Sb:
RN CHc
EHC
CFT
relations of C_- parameters for RN -, HC - and CA-<issuoof cirrhotic liver with primary carcinoma evoluted of cirrhosis are
SB: C
•-RN
RN CHC -CA
relations of c_ - parameters for H- and CA- tissues ofliver with primary carcinoma are:
Fe: cu > crll
Zn: CH > cCA
Sb: cH > ccfl ( liver 1 ) cH
CONCLUSION
U v e r 2
Results of our investigations indicate significant differences in investigated elements ( Fe, Zn, Sb ) in healthy and pathological livers as well asin different structures of cirrhotic liver, cirrhotic liver associated withCA and tumorous liver ( CA ) .
REFERENCES
/I/ Kostic K., Draskovic R.J., Djordjevic H.,Ratkovic M.,Kostic D.,Cvetoje-vic - Savic M., Draskovic R.S., Iron, Cobalt and Zinc Contents in No -rmal and and Pathologically Altered Liver Tissues; Proceeding on Bad Ga-steiner Internationales Symposium, Bad Gastein, Austria ( 1976 ),pp.l65- 173
111 Kostic K., Draskovic R.J., Ojordievic M., Kostic D., Draskovic R.S..
Distribution of Trace Elements in Cirrhotic Human Liver, Proceedinq
on IAEA Symposium of Nuclear Activation Techniques on the Life Scie -
nces, Vienna, Austria ( 1979 ) , pp. 273 - 282
IV Koatic K., Ristanovic R., Obradovic V., Djordjevic H., Draskovic R.J.,
Study of Distribution Homogeneity of Fe, Co and Zn in Different Parts
of Normal and Cirrhotic Human Liver by Neutron Activation Analysis;
W. de Gruyter and Co., Berlin - New York,Ed.: P. Bratter and P. Schra-
mel (1980),pp. 601 - 610
Ik I Kostic K., Draskovic R.J., Djordjevic H..Stankovic S., Radiol. lugo -
slav. 16 ( 1982 ),217
ISI Stankovic S., Byophisical Aspects and Application of Neutron Activati-
on Analysis for Qualitative and Quantitative Investigations of Liver
Tissues, Mr - thesis ( in preparation )
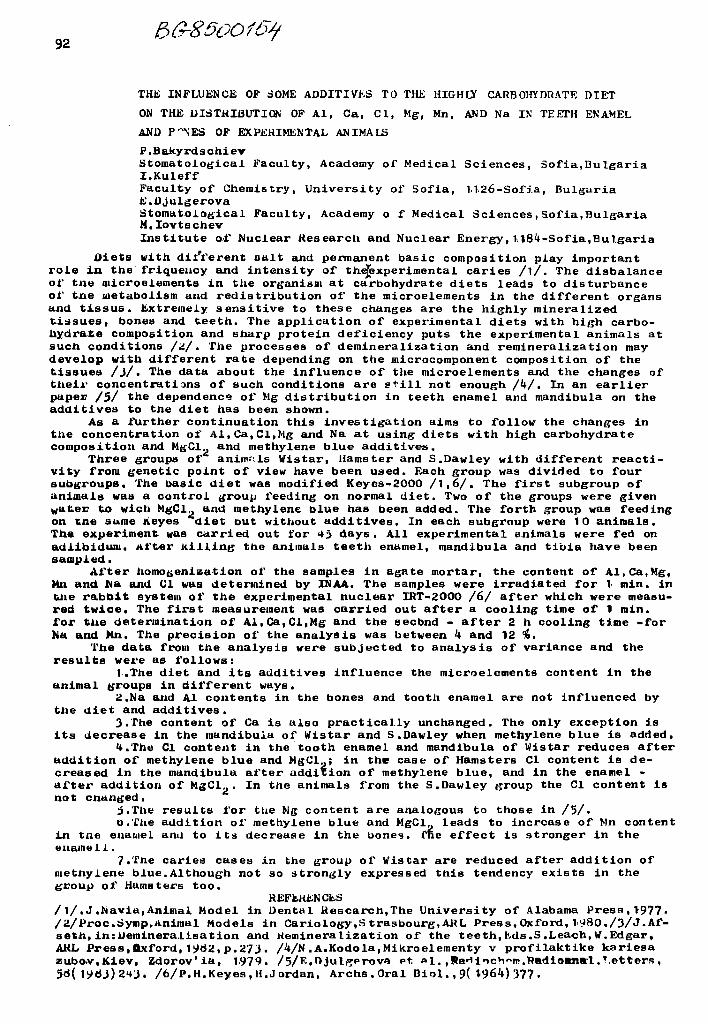
92
THE INFLUENCE OF SOME ADDITIVES TO THE HIGHLY CARBOHYDRATE DIETON THE DISTHIBUTION OF Al, Ca, Cl, Mg, Mn, AND Na IN TEETH ENAMELAND F"NES OF EXPERIMENTAL ANIMALSP.BakyrdschievStomato log ica l Faculty, Academy of Medical S c i e n c e s , S o f i a , B u l g a r i aI.KuleffFaculty of Chemistry, University of Sofia, 1.126-Sofia, BulgariaE.DjulgerovaStomatological Faculty, Academy o f Medical Sciences,Sofia,BulgariaM,IovtschevInstitute of Nuclear Research and Nuclear Energy,1184-Sofia,Bulgaria
Diets with different suit and permanent basic composition play importantrole in the friquency and intensity of thejexperimental caries /i/. The disbalanceof tne microelements in the organism at carbohydrate diets leads to disturbanceof tne metabolism and redistribution of the microelements in the different organsand tissus. Extremely sensitive to these changes are the highly mineralizedtissues, bones and teeth. The application of experimental diets with high carbo-hydrate composition and sharp protein deficiency puts the experimental animals atsuch conditions /<;/. The processes of demineralization and remineralization maydevelop with different rate depending on the microcomponent composition of thetissues / j / . The data about the influence of the microelements and the changes oftheir concentrations of such conditions are still not enough /h/. In an earlierpaper /5/ the dependence of Mg distribution in teeth enamel and mandibula on theadditives to the diet has been shown.
As a further continuation this investigation aims to follow the changes inthe concentration of Al,Ca,Cl,Mg and Na at using diets with high carbohydratecomposition and MgCl» and methylene blue additives.
Three groups of animals Wistar, Hamster and S.Dawley with different reacti-vity from genetic point of view have been used. Each group was divided to foursubgroups. The basic diet was modified Keyes-2000 /i,6/. The first subgroup ofanimals was a control group feeding on normal diet. Two of the groups were givenwater to wich MgCJ.,, and methylene blue has been added. The forth group was feedingon tne same lieyes diet but without additives. In each subgroup were 10 animals.The experiment was carried out for 45 days. All experimental animals were fed onadlibidum. After killing the animals teeth enamel, mandibula and tibia have beensampled.
After homogenization of the samples in agate mortar, the content of Al,Ca,Mg,Mn and Na and 01 was determined by INAA. The samples were irradiated for \ min. inthe rabbit system of the experimental nuclear IRT-2000 /6/ after which were measu-red twice. The first measurement was carried out after a cooling time of 1 min.for tUe determination of Al,Ca,Cl,Mg and the secbnd - after 2 h cooling time -forNa and Mn, The precision of the analysis was between k and 12 H>.
The data from the analysis were subjected to analysis of variance and theresults were as follows:
1.The diet and its additives influence the microelements content in theanimal groups in different ways.
2.Na and Al contents in the bones and tooth enamel are not influenced bythe diet and additives.
3.The content of Ca is also practically unchanged. The only exception isits decrease in the mandibula of Wistar and S.Dawley when methylene blue is added.
<t.The Cl content in the tooth enamel and mandibula of Wistar reduces afteraddition of methylene blue and MgCl2; in the case of Hamsters Cl content is de-creased in the mandibula after addition of methylene blue, and in the enamel -after addition of MgCl., . In the animals from the S.Dawley group the Cl content isno t changed.
5.The results for tue Mg content are analogous to those in /5/.b.The addition of methylene blue and MgCl leads to increase of Mn content
in tne enamel and to its decrease in the bones. fne effect is stronger in theename11.
7.The caries cases in the group of Wistar are reduced after addition ofmethylene blue.Althoug-h not so strongly expressed this tendency exists in thegroup of Hamsters too.
REFERENCES/ 1/.J.Navia,Animal Model in Dental Research,The University of Alabama Press,1977./2/Proc.Symp.Animal Models in Cariology.Strasbourg,ARL Press,Oxford, 1980./3/J.Af-seth,in:Ueminera.Lisation and Hemineralization of the teeth,Eds.S.Leach,W.Edgar,ARL Press,Oxford, 1b>dJJ, p.273 . /k/K .A.Kodola.Mikroelementy v profilaktike kariesazubov.Kiev, Zdorov'ia, 1979. /5/F.,n julfjprovn et nl. ,RaHiich"in.R«dioKnrl.T,etters,5«K 19«*J)2<+:J. /6/P.H.Keyes, H.Jordan, Archs . Oral Biol. , 9( 196*0 377 •
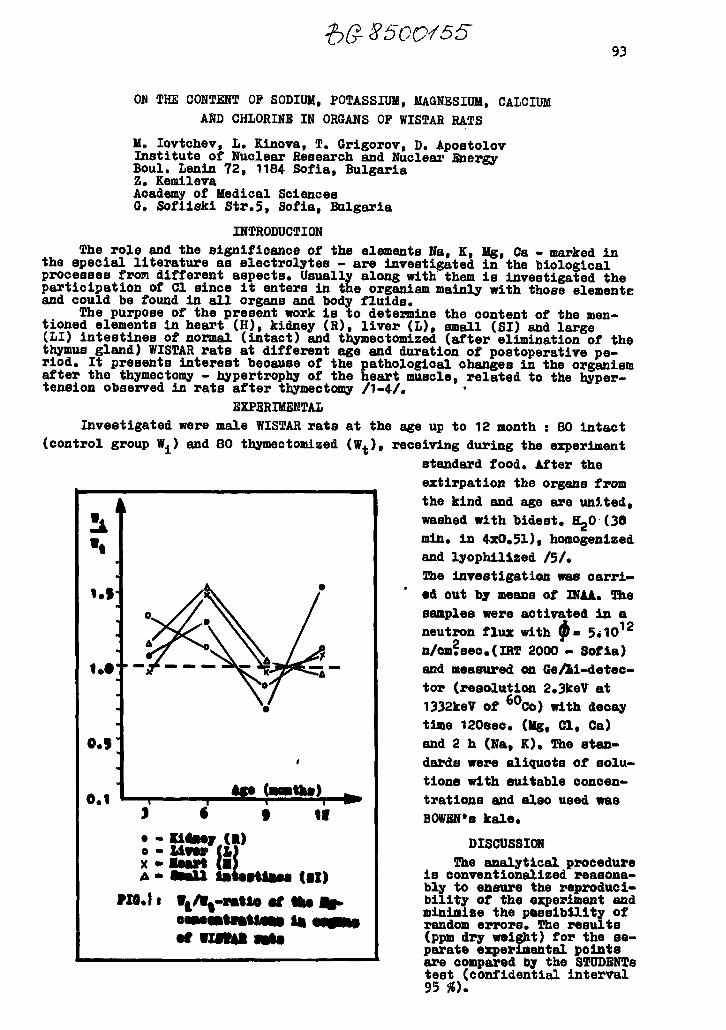
^ 500-/55-93
ON THE CONTENT OP SODIUM, POTASSIUM, MAGNESIUM, CALCIUMAND CHLORINE IN ORGANS OF WISTAR RATS
M. Iovtchev , L. Kinova, T. Grigorov, D. ApostolovI n s t i t u t e o f Nuclear Research and Nuclear EnergyBoul . Lenin 7 2 , 1184 S o f i a , Bulgar iaZ. KemilevaAcademy of Medical SciencesG. Sofiiski Str.5, Sofia, Bulgaria
INTRODUCTIONThe role and the significance of the elements Na, K, Mg, Ca - marked in
the special literature as electrolytes - are investigated in the biologicalprocesses from different aspects. Usually along with them is investigated theparticipation of Cl since it enters in the organism mainly with those elementsand could be found in all organs and body fluids.
The purpose of the present work is to determine the content of the men-tioned elements in heart (H), kidney (R), liver (L), small (SI) and large(LI) intestines of normal (intact) and thymectomized (after elimination of thethymus gland) WISTAR rats at different age and duration of postoperative pe-riod. It presents interest because of the pathological changes in the organismafter tho thymectomy - hypertrophy of the heart muscle, related to the hyper-tension observed in rats after thymectomy /1-4/.
EXPERIMENTALInvestigated were male WISTAR rats at the age up to 12 month : 80 intact
(control group Wi) and 80 thymectomized (W+), receiving during the experimentstandard food. After theextirpation the organs fromthe kind and age are united,washed with bide at. B^O (30min. in 4x0.51), homogenizedand lyophilized /5/,The investigation was carri-ed out by means of INAA. Thesamples were activated in a
$ 12
• - Klteey (l)o - Uvtr (L)x «• InH (IIA • I H U labttlBM
neutron flux with 5<1O1 2$ 5n/cm?seo.(IRT 2000 - Sofia)and measured on Ge/li-detec-tor (resolution 2.3keV ati332keV of 60Co) with decaytime 120sec. (Kg, Cl, Oa)and 2 h (Na, K), The stan-dards were aliquots of solu-tions with suitable concen-trations and also used wasBOWSN*s kale.
DISCUSSIONThe analytical procedure
is conventionalized reasona-bly to ensure the reproduci-bility of the experiment andminimize the possibility ofrandom errors. The results(ppm dry weight) for the se-parate experimental pointsare compared by the STUDENTStest (confidential interval95 %).

1.1-
O.f.
0.1
(81)
FI0.2i wt/w%-**tt* of tto Ctf
of ffXSf Aft r»«i
1.5-
1.4
0.9
0 .Aft (Mfttlu)
I t
11 B 8 UtttlMt
t«f»tl«M in•t tin a
SODIUM
The results differ significan-tly for both groups (exceptionH).W.i General decrease of the
concentration with the agefor X and SI; maximum at6 and 9 month for H,R,LI.
Wti The concentration increaseafter 3 month.
POTASSIUMHigher absolute values in com-parison with Na.W.: The tendency follous the
behavior of Na.Wt: Increase of the concentra-
tion (H and L), for therest organs the differen-ces are not significant.
MAGNESIUMW±: Age tendencies as for Na
and K (exceptions: L, whe-re concentration is rela-tively constant; R - in-crease at 12 month).
Wt: Relatively slight changeof the concentration withthe age (exception 11 -with a strong maximum at9 month).
CALCIUMWji There is no clear tenden-
cy with the age. In H andR the concentrations axerelatively constant.
Wtt Sharp increase of the con-centration in all organsanalysed at the age of 3month. At the next termanalysed a slow decreaseof the Ca content is ob-served.
CHLORINEThe results for both groupsfollow generaly the Na tenden-cy.W.: There is no significant
difference in the concenttration values after 6month.
Wt: A significant differenceis observed only for Land SI.
The results for large intesti-nes LI are most varying forall elements.
The changes in the concentra-tions of the elements determi-ned in organs of thymectomizedrats can be followed by compa-rison of both groups W.. and W+

95 /
• - EUMf . ( • )o • U*W (fc)X - iMUPt (HIA- ami u
For Mg (Fig.7) are observedcomparatively small devia^tions in the ratio W./W..For the rest of the elementsthe utmost deviations are ob-served for 3 month (first termafter thymectomy), as it isfor calcium (Fig.2), where concentrations in W.are muchhigher, than in W^. For Cl(Fig.3) the concentrations inW^ for 3 month are much lower,than in W±.All elements investigated showa tendency to approach normalconcentration values at theage of 12 month.The ratio of the elements forboth groups (W^ versus W^) anddifferent ages could illustra-te the alterations of theelectrolyte balance of the or-ganism.In the ratio. Na/K no changesare observed with the age inthe Wit which correspond tothe physiological balance ofboth elements in the organism.The ratio Na/K behaves in thesame way in the group of thy-mectomized rats W. (exceptionR - first term after thymecto-my). In W^ vs. Wt there is atendency to equalization at.,the age 12 month of the ratioNa/K for the most of the or-
gans analysed after thymectomy (Fig.4).CONCLUSION
The concentrations of the determined elements in the group W^ (intactWISTAR rats) follow a common tendency in the investigated age periods. Esta-blished are changes in the concentrations for thymectomized rats (Wt) in thefirst term after thymectomy. The observed tendency to level with the normal va-lues for the concentrations of the elements in thymectomized rats could be ex-plained with the ability of the organism for adaptation and recovery of essen-tial functions in the absence of an important enzyme regulator - the thymusgland.
REFERENCES/I/. Z. Kemileva : Thymus , Hedicina i fisoultura, Sofia 197912/. Z. Kemileva, M. Balucov: Compt. Rend. Acad. Sci. Bulg., 29 (1976) 1849/3/. P. Deschaux, et al.: Canad. J. Physiol. Pharmacol., £2 (1975) 501/4/. A. Gray: Clinical Pathology , Oxford 1966/5/. L. Kinova, M. Iovtchev, T. Grigorov, D. Apostolov, Z. Kemileva: Proc.
3. Tagung Nukleare Analyseverfahren, 11.-15*04.1983, Dresden, DDR

ENVIRONMENT

9 9
INSTRUMENTAL NEUTRON ACTIVATION ANALYSIS IN ENVIRONMENTAL RESEARCH
M. de BruinInteruniversity Reactor InstituteMekelweg 15', 2629 JB Delft,The Netherlands
INTRODUCTION
The introduction of Ge-semiconductordetectors and laboratory computers hao stronglystimulated the development of neutron activation analysis (NAA) over the past two decades. Thehigh energy resolution of Ge(Li)-detectors and apparently unlimited computing facilities madechemical separations superfluous for many sample materials (1). The detection limits are not aslow as obtained when applying chemical separation,but in many types of samples such as geologicalmaterials,soils,air particulates,refuses.industrial wastes and plant materials,tens of elementscan be determined simultaneously by a purely instrumental technique. Instrumental neutronactivation analysis (INAA) is very well suited for application in environmental research andmonitoring. It has been discussed extensively in literature (2) and at meetings such as the IAEAsymposium "Measurement,Detection and Control of Environmental Pollutants" held in 1975 (3) andthe five consecutive conferences on "Nuclear Methods in Environmental and Energy Research",organized by the ANS. In his contribution at the most recent of these conferences (Mayaguez,Puerto Rico, 1984) Steinnes (.4) stressed the pertaining importance of nuclear analyticaltechniques in environmental research along with other techniques such as atomic absorptionspectrometry and emission spectroscopy. The advantages of neutron activation analysis in generalhave been discussed recently by Greenberg (5). The characteristics of instrumental NAA whenapplied to environmental samples can be summarized as
- high sensitivity for many relevant elements- high accuracy for a variety of sample types- insensitive for light elements- information on many elements simultaneously- economically attractive.
These characteristics are discussed in more detail in the next section.At Delft, INAA is used in a variety of environmental research projects. A description of the IRIsystem for INAA will be given,with some recent results obtained in monitoring heavy metal airpollution using lichens. Finally,some ideas will be presented regarding the position of INAA inenvironmental research and monitoring in the near future.
CHARACTERISTICS OF INAA, RELEVANT FOR ENVIRONMENTAL APPLICATIONS
SensitivityAlthough lower than what is achievable by radiochemical NAA,the sensitivity of INAA is still
such that many (potentially) toxic elements can be detected in the environment far belowdetrimental concentration levels. Therefore,the behaviour of such elements in the environrr t canbe studied often at natural concentration levels. When using INAA in environmental monitc ig,increases of heavy metal concentration levels can be observed -and the necessary measures etaken- long before they have developed into an accute environmental problem. This is illustratedby the detection limits of INAA for some elements in air filters,and the maximum permissable ionmission concentrations (MIC-value) for these elements,presented in Table I. The filters im-(cellulose, 5 cm2,10 m3 of air) were analysed with the IRI-system for INAA which will bediscussed in the next section.
Be and Fb are the only elements of environmental concern to which INAA is not applicable:the determination of lead using Z07mPb is regarded as inadequate when compared to thedetermination by AAS.
AoauraoyThe low risks of contamination of element loss, typical for NAA, are particularly important
in the analysis of environmental samples,where the concentrations of interest are mostly in theppb- to ppm-range. Equally important is the lack of matrix effects for a large range of matrixcompositions. This makes it possible to obtain absolute and directly comparable concentrationvalues for strongly differing materials such as surface water,air particulate matter,human andanimal tissues,plant materials and soils. In addition,when using INAA, no destruction or chemicalseparations are applied,so that post-irradiation losses are avoided.
These factors are the basis of the high accuracy obtainable with NAA, reflected in thedominating role of this analytical technique in establishing certified coneputrations of traceelements in reference materials (6,7).
Insensitivity for light elementsOf most light elements the thermal neutron cross-sections are very low,or the reactions lead
to nuclides with very short half lives. Even when present at high concentrations, elements suchas H,C,N,O,(Al,)P,S,Si and Ca do not interfere in the INAA procedure, neither directly by theinduced activity or inuirectly through neutron flux depression or self-shielding. As theseelements are the major constituents of water, tissues,soils and filter materials, they areapparently absent in the analysis and do not hamper the detection of the heavier elements presentat trace level.
The major light element interference is due to zltNa,the neutron activation product ofoodium. The high concentrations of this element in most human and animal tissues or fluids and

100
sea materials severly limit the sensitivity for elements determined on basis of nuclides withintermediate half lives. For certain elements, the use of a nuclide with short or long half lifeas alternative for an otherwise more sensitive nuclide with intermediate half life, may lead toimproved detectability. For example,the detection limit of Cu in toenails when measuring 61|Cu(12.7h) is approximately 10 ppm because of the high zl*Na-activity; when using 66Cu (5.1h),thedetection limit is lowered by a factor of 10 to less than 1 ppm. Self-evidently,high sodiumcontents such as present in whole blood,do not affect analyses using nuclides with long halflives (8). Limitations due to 21tNa can be avoided also by applying a hybrid of radiochemical andinstrumental NAA, where the Na is selectively separated using hydrated antimony pentoxide 19).But this approach is relatively laboreous and the accuracy may be affected by losses in thechemical procedure.
Multi-e Lement capabilityThe large number of elements determined simultaneously in an INAA-procedure is becoming
increasingly important for many environmental applications. As it is often not known a prioriwhich elements are matter of concern in a certain area,a "broad spectrum" analysis covering alarge part of the Periodic Table,is of the first importance for environmental monitoring. In thisrespect, INAA is very suitable as it yields information on all (potentially) toxic elementsexcept Be and Pb,when present at relevant levels.
Part of the information obtained refers to elements which are not of direct environmentalconcern. This additional information may play an essential role in the interpretation of thetoxic element concentration data. As elements such as As and Sb are present in natural soils atppm levels, it is important to distinguish between the "natural" amounts of these elementsoriginating from that soil and the amounts from anthropogenic sources. Normalization of theobserved concentrations on basis of the concentrations in the same sample of selected referenceelements characteristic for soil (Al,Sc,Fe,R.E.) yields an Enrichment Factor (12) which allows todiscriminate between these possible sources.
Possibly the most important application of the multi-element information obtained from INAAis the use of trace element patterns as fingerprints for identifying specific sources ofinorganic pollutants. The basic idea is that the elements of primary interest are introduced into,the environment in specific combinations with other elements, and that certain elements orelement ratios are specific for different sources. Identifications of sources of pollutants onbasis of element patterns of environmental samples mostly regard the elucidation of the originof inorganic air pollution using the element concentration patterns observed in air filters. Butapplications have been reported also for other materials such 4s lichens used as biologicalindicator for pollution with heavy metals (13,14).
In the identification procedures reportedvtwo basically different approaches can bedistinguished. When the relevant sources and the compositions of the associated emissions areknown,the "Chemical Element Balance" method can be used to estimate the relative contributions ofeach of these sources at a specific place or in a specific sample (15,16). When applying FactorAnalyses procedures,a set of hypothetical components is calculated from the compositions of alarge number of samples, without using a priori knowledge of actual sources or compositions.These hypothetical components can then be identified with realistic components or sources onbasis of their calculated element concentration patterns. The Factor Analysis approach has beendiscussed thoroughly by Hopke (.17); Chemical Element Balance and the Factor analyses methods wereevaluated recently by Stevens (18).
Analysis costsIn environmental research and particularly in environmental monitoring, large numbers of
samples and analyses are involved. Therefore, cost per analysis will be an important factor whenjudging the value of a specific analysis technique for such applications. INAA is often regardedas a complicated and expensive analysis technique,to be carried out by high level specialists.But since it is a purely instrumental technique, automation and computerization are possible to ahigh degree. At present,the capacity of laboratory compurers is such that their use for automatedmeasurement,spectrum analysis and interpretation,and administration may reduce considerably bothamount and level of labor involved in INM. Although the resulting savings in analysis costs willdepend on local conditions such as the ratio between labor- and instrumentation/computer-costs.itwill in general lead to appreciable cost reductions. For the system for routine INAA in use atIRI.the costs are DF1 125-200 ($35-50) for a complete analysis involving two irradiations andthree measurements (19). This is comparable to or even lower than the costs of the alternatives,which often include laboreous and costly chemical manipulations.
THE IRI SYSTEM FOR ROUTINE INAA
Description of the systemThe analysis system 120) is based on the use of the single comparator method of
standardization (21) to take full advantage of the multi-element capabilities of INAA without theproblems associated with the preparation and use of trace element standards covering two thirdsof the periodic system. Zinc is used as mono-element standard; the element concentrations arecalculated on basis of a weighed average of the 65Zn- and 69mZn-activities,using experimentallydetermined conversion factors.
The analyses are. performed according to a standard protocol comprising a first irradiationof 15-30 s followed by a measurement after 0.5-20 tn decay,and a second irradiation of O.5--4 hfollowed by too measurements after 2-6 d and 3-5 w respectively. The irradiations are^carriedout in the Institute's 2Mw swimming pool reactor in a thermal neptron flux of 1 x 10 "n/cro .s..

101
The irradiation facilities used are a fast rabbit system (transport time <3 5 s) for shortirradiations and a slow rabbit system (transport time 8 s) for the long irradiations.
The spectrometers,equipped with coaxial and well-type Ge(Li)-detectors are integrated witha DEC PDP-11/44 computer through buffered input gates in a CAMAC interface system (Fig. 1). Thewell-type detectors are expensive but have the advantage of a high photopeak efficiency (5-50% ,depending on yray energy),so that good detection limits are obtained even after an irradiationof a few hours at a moderate neutron flux.
OCTECTOR PULSEGENERATOR
AMPLIFIER
ADC
CAMAC
~L BUFFER
TIMER
CONTROL
CLOU
•COMPUTER
Fig. 1. spectrometer used in INAA
The y-v&y spectra are converted into element concentrations using a set of dedicatedcomputer programs (22,23). The INAA software package comprises the following main functions:- spectrum analysis and interpretation,including conversion of the peak area data into elementconcentrations or estimated upper concentration limits. The isotope identification is based ona catalog of measured y-ray energies and intensities (24);
- comparison and combination of the intermediate results obtained from measurements afterdifferent decay times, correction for blank and for contributions from interfering reactions;
- generation of the final analysis report in hard copy or on tape or disk;-^bookkeeping of the results obtained from reference materials for detection of systematic errors
in the analytical procedure.
The results obtained in repeated analyses of reference materials indicate that the accuracy ofthe method is in general better than ± 5%,which is adequate for most environmental samples.Table I shows some detection limits obtained routinely in materials of environmental interest.
Table I. Routine INAA at IRI
Element Detection limit
VCrMnFeZnAsSeCdSbHg
soil(ppm)
311
100101310.33
plants(ppm)
11I
3010.1110.11
nails/hair(ppm)
10.313010.030.30.30.010.3
MIC-valueair in air (25)particulates (ng/m3)(ng/m3)
1 2501 1001 25000
100 500010 100000.1 50U1 —
1 5001 25001 10
Environmental applications of the INAA systemCurrently, more than half of the 4000 samples analyzed annually are related to studies of
the transport of heavy metals in the environment. In these applications, the multi-elementcapabilities of INAA are essential, either to study a range of heavy elements simultaneously, orfor source identification on basis of trace element patterns. Major projects are:-identification of sources of heavy metal air pollution using air filters or biological

102
indicators such as mosses and lichens. The air filter daia are interpreted by correlation withmeterological data and by Factor analysis. The studies using lichens are discussed in somedetail in the next paragraph;
- study of the uptake and translocation of heavy elements in plants. This study involves plantsgrown in actually polluted areas as well as plants grown under controlled conditions at thelaboratory. In a complementary approach, trace element transport kinetics are studied inisolated plant parts with fadionuclides of 15 elements simultaneously (26). A separate study isaimed at evaluating the use of selected plant species for "biological cleaning" of soilspolluted with cadmium;
- evaluation of human toe-nails as an indicator of heavy metal uptake by populations in pollutedareas. This study is combined with a survey using lichens in the same area;
- evaluation of bird feathers (27),mollusks and waterplants as possible indicators for heavymetal pollution in fresh water and estuarine areas.
Part of the studies are carried out in cooperation with chemists,physicists and biologists fromDutch universities.
USE OF LICHENS AS BIOLOGICAL MONITOR FOR HEAVY METAL AIR POLLUTION
IntroductionThe major part of our effort in environmental research is focussed on the development,
evaluation and application of epiphytic lichens as accumulating monitor for identifying sourcesof heavy metal air pollution. Various plant species have been used for such monitoring, especiallyin Scandinavia, Great-Brittain, Ireland and Canada (28,29,30,31), but the results have to behandled carefully to avoid misleading conclusions (32). Therefore, special attention is paid tomathematical techniques for a reliable interpretation of the element concentration patternsobserved in sets of lichen samples.In air pollution surveys, epiphytic lichens are collected at places regularly spread over an areaunder investigation. At the laboratory, the lichens are separated from the substrate bark, washed,dried and analyzed by routine INAA. In Table II, ranges and mean values are listed of elementconcentrations found in material collected in De Kempen, an industrialized area in the South ofThe Netherlands.Besides mapping of the element concentrations, two additional procedures are applied to theconcentration data, to obtain information on position and identity of any significanc sourcespresent in an area:- mapping of the concentrations of individual elements after conversion to Enrichment Factors;- application of Factor Analysis to the multi-element dataset and identification of sources of
pollution and their contributions for each relevant element.The relevance of carefull data interpretation will be illustrated below with some of the resultsfrom two recent air pollution surveys in The Netherlands. The first survey covered the entirecountry, the second one was focussed on De Kempen, a small area along the Southern border (Fig.2a), known to be polluted by heavy metals.
El.
NaMgAlClKScTiVCr
Table
av.cone.
ppm68014805200680
43001.5
4202930
II. Trace elements
rangeppm
200-1900420-51001900-11000290-12001400-110000.42-4.2100-430012-76
9.7-88
in
el.
FeCoZnAsSeBrCd3bLa
Lecanora
av.con.ppm
61004.9
590112.5505.0134.4
conizaeoi
range
ppm1700-17001.4-23120-75002.4-41
0.80-8.17.5-1401.0-333.4-611.3-12
el.
EuDyYbLuHfWAuHgThU
av.con.ppm
0.150.490.310.0571.01.30.0120.981.10.56
rangeppm
0.052-0.400.19 -1.10.055-0.970.011-0.200.25 -3.20.25 -120.003-0.0910.20 -130.32 -2.60.13 -1.9Mn 97 43-175 Ce 8.3 2.8-22
Application of Enrichment FactorsOur experiences so far indicate that straightforward Reographical mappinc of concentrations of
individual elements and locating sources on basis of concentration gradients does not yieldreliable results. Local differences in growing conditions of the lichens may lead to artifactsnot related to the factors studied. Conversion of element concentrations into Enrichment FactorBimproves this situation as this conversion implies correction for differences in soil contributionor growth rate.
The Enrichment Factor of an element x on basis of a reference element y is defined as:
CxEF = ^Cy*lichen
In our studies, the Enrichment Factors are calculated with scandium as reference element, usingthe element-scandium ratios experimentally determined for "clean" Dutch soils.Fig. 2a and b show maps of the arsenic concentrations and arsenic Enrichment Factors of Parmelia

103
Pormelio SulcoloAt-concentroli
(ppml
Potmelio Sulcolo
Fig. 2. Distribution over The Netherlands of arsenic in lichens and theaverage atmospheric S02~concentration.K = De Kerapen
sulcata collected over the country. The first map shows a concentration gradient towards theSouth-Western border, suggesting a major source of arsenic in that direction. The arsenicEnrichment Factor however has a rather flat distribution. This suggests that the high As-contentis due to locally high soil contributions, or that the arsenic is emitted together with soilelements in a natural ratio.
Fig. 2c represents the distribution of the atmospheric SC>2-concentrations over the country.The similarity between the SO2- and the arsenic-distributions suggest either a common source ofthe two (e.g. coal burning), or a casual relationship between the two concentrations. Influenceof the atmospheric S02~concentrations on trace element concentrations in lichens is not unlikelysince high S02~concentrations are known to inhibit lichen growth (33).
It will be clear from this example that one has to be very carefull with conclusions basedonly on concentrations of single elements.
Application of Factor AnalysisDc Kempen is an area along the Dutch-Belgian border which has been for a long time, and
still is, polluted by emissions from metallurgical industries. Several zinc smelters have been inoperation for more than a century and the area also houses a branch of a large electronic industry.Part of the zinc smelters have changed their production process recently to reduce heavy metalemission. Contributions to the air pollution can also be expected from the center of industrialactivities around Antwerp, appr. 50 km in Westerly direction (fig. 3).
Antwerp50 km
Fig. 3. The 20 x 50 km area surveyed in De Kempen.o = zinc smelter; x = electronic industry
The lichen Lecanora conizaeoides was collected in an area of 20 x 50 km at in total 140 samplingpoints positioned on a lath of 3 x 3 km. Factor Analysis was applied to the element concentrationdataset, using the information on 17 elements: Al, K, Sc, V, Cr, Mn, Fe, Co, Zn, As, Se, Br, Cd,Sb, Eu, W and Th. The Factor Analysis procedure yielded 5 factors or hypothetical components,accounting in total for more than 85% of the variance present in the dataset. The normalized

104
elemental compositions of these components are listed in Table III.
Table III. Results of Factor Analysis
Element Factor composition
CdAsSbZnAlKSeVCrMnFeCoSeBrEuWTh
factor 1
1.52.9
940
0.256.62.917
10001.50.37
0.01
0.15
factor 2
3205400.24
5.76.1
10000.67
0.02
0.17
factor 3
210310
7130
1000
factor 4
4.73.64.2
1000
0.66
factor 5
1000
800
Factors 1 and 2 can be identified with contributions from the soil, either separated artificiallyinto two components, or representing two real soil components.Factor 3 consists ofi a group of volatile elements, originating from high temperature industrialprocesses, including coal burning and refuse incineration, and from automobile exhaust (Br).Factor 4, with a characteristic Zn/Cd-ratio of appr. 200, is associated with zinc ore processing.Factor 5 does not reflect a typical emission pattern, but the cadmium and tungsten may originatefrom independent processes at the same location.
A next step in the source identification procedure was the calculation of an estimate of thecontributions of the individual factors or aerosol components to the element concentrations ineach of the lichen samples. Geographical maps of these individual contributions to the concentra-tions of a certain element give direct insight into the position of the associated sources andinto the contributions of each of the sources to the total concentration of an element at aspecific place.Fig. 4 shows a map of the unprocessed cadmium concentrations and maps of the separate parts ofthe cadmium concentrations originating from the cadmium-containing factors 4 and 5.Part of the sources of factor 4, and the source of factor 5 can be identified with industrialactivities indicated in fig. 3. The largest source of cadmium in factor 4 can not be correlateddirectly with an industrial process actually going on, but it may originate from secondaryemissions from dumps of zinc ashes.Fig. 5 shows a similar series of maps for antimony. An appreciable part of the antimony originatesfrom soil contribution. The major source of antimony is associated with factor 3, comprising thevolatile elements. The source of the corresponding component is possibly positioned just at theborder of the area studied, but may be as well at greater distance in westerly direction. In themap of antimony from component 4 appears the same, yet not well identified, source as found forcadmium.
The results presented illustrate how multi-element information and use of appropiate datainterpretation techniques can'play an essential role in identifying sources of atmosphericpollutants. They underline the importance of multi trace-element analysis techniques such asINAA for environmental research and control.
Future position of INAA in environmental science.
It is always difficult to predict future developments in science and technology and one hasto be very reserved when discussing the prospects of a specific technique. But there are nosigns of developments in physics or chemistry, leading within the next decade to new routinelyapplied analytical technique for trace elements. Therefore, it may be worthwhile to discuss thefuture prospects of INAA, starting from the presently available alternative analytical techniques.
When regarding INAA as a routine method for the simultaneous determination of many traceelements present at often low concentration levels, the only realistic alternatives areinductively coupled plasma emission spectoscopy (ICPES), X-ray fluorescense analysis (XRF) andcharged particle induced X-ray emission spectroscopy (PIXE). Atomic absorption spectroscopy cannot be regarded as a multi-element analysis method, whereas analytical techniques based oninorganic mass spectroscopy are not suitable for application on a routine scale.

105
I!!!!!!!::!::::::!:::::
CD - CflDHIUM
BINs l.DD
• < 5.00
• 2 5.00
• i ID.00
• > 15.00
• t 20.00
UHKHOUK CONC.
HHXi 32.72PPM
CD-CONCENTR. INLECRNORR CON 12.IN -DE KEMPEN-
I:::?::::::::;:::
i n i i i i i
« . • » . . .
:iyi!jijjpii. lillL :::::::::!:..::::::5HBp:.I::::.::::::::::::::::::. ••:::::::::*::KnR::::::::: • : : : : : : : : : : : : : : : : : : . ••:::: .
i i i i^::i i: i i:: i; i i::::::::;:: iiiiiijiiiiiiiiii:"'
CO IN FRCTOH V
HINi O.OD
• < 2.50
• t 2.50
• * S.OO
• » 7.S0
• t 10.00
UNKNOHN CDNC.
HRXi 31.01PPM
CONCENTR. INLECflNORR CONIZ.IN -DE KEMPEN-
mi
• • : • • • • • ! • • • • ! • • •
• • * • • • • • • • • • • • • •
; : : . ; ; : : ; : : ; . ; : ; ; : : : ; : : : . : : : : : . .
• • • • : : • • • • • •
iiH::::iiij
:i:::::::::
i
!i!!!!IiSi!S!i!- i i I l i i i ,
iiiffiilkB!!ih»..':s""iniim:..»in!iU:u::::::::;;::::;::;:::::::r -:;:::::::::::;:::
ii|iii!!i!!S!i!SJ!i!!!h!!!!!!!!!S!!!J!!!i!jjj!!J!l^it!«Jii|ii;:::!:::i:i::::i:::i:i::i:i::i::i:;'•
# v "^^ r ^Ni ; iL ' . . . .
CD IN FACTOR 5
MNt D.DO
•*< 2.50
• t Z.BD
> » S.OO
• t 7.50
• I 10.00
UNKNOHN CONC
PPM
CONCENrR. IN
IN -DE KEHPEN"
1RI
Fig. 4. Geographical distributions of total cadmium (a), and cadmium from factor 4 (b)and factor 5 (c).

106SB - UNI I MOON -RNTIMONT
HINi 3.37
• < 10.00
• 2 10.00
• > ao.oo
• » 3D. 00
• 2 HO.00
UNKNOHN CONC.
HflX: 61.2BPPM
SB-CONCENTR. INLECRNORR CQNIZ.IN "DE KEHPEN-
SB IN FRCTDR 1
HINi 0.00
• « 5.00
• t 5.DO
• > ID.00
• > 19.00
• 2 20.00
UNHNOHN CONC.
tmx: 2U.U6PPH
CONCENTR. INLECfiNOHR C0N1Z.IN -DE KEHPEN"
liti
:::::::::::::::::
iipijjjiiHiiiji•IPI l l l l l l l l : : " "
UBisiiiKHHP"""HlBliJH;
;::::
iiiii|iiiiiCIIII
:::::::::::::;;;::::::::::;::::::===========|M»»::::
iihRliiiiiiiilll:::::::::::::::::
IHIilllllillllU
:::::::
i::::::
:::::::•S«!Si*
i::::::iii::i:::::ii:i::i :::::::ir::::::::: : : : : : '
::::: |c:::::::::::::: .:::::::::: ...:::::::::::::::::::::::
!!Hffi!!ii!i!!!!iii!l!!iiii;;iii!iii!niii!l!i;!i;!r•i ^^x^iiiiiiiiiiiiiiiiMiiiiiiiiiiii
SB IN FHCTDH 3
HINi 0.00
• < 5.00
• « 5.DO
• > 10.00
• <• IS.00
• t 20.00
UNKNOWN CONC.
hnxi 27.aaPPM
CDNCENTB. INLECBNORB CONIZ.IN "DE KEHPEN"
mi
SG IN FRCTDH <i
HlNs 0 .00
• « 5.00
• « G.00
• > ID .00
• » IS .00
• * 3D.00
UNKNOHN CONC.
Hi l l : 20. 12PPM
CONCENTR. INLECPNORfl C0N17.IN "OE HEMPEN^
Fig. 5. Geographical distributions of total antimony (a) and antimony from factor 1 (b).factor 3 (c) and factor 4 (d)

107
Of ICPES the sensitivity seems on the average comparable to what can be obtained by INAA; forwater, ICPES seems even superior when no preconcentration is applied (35). For solid samples, theaccuracy of ICPES may be affected by contamination or losses in the dissolution step.For most elements, the detection limits obtainable by energy dispersive as well as wavelengthdispersive XRF are higher than those for INAA or ICPES (36). For PIXE, the minimum detectablemasses are comparable to, and for some elements even lower than those for INAA (37). But sincePIXE can only be applied to. very thin specimens, it provides an alternative to INAA only for alimited number of sample types, such as air filters, thin slices of biological materials or traceelements in water after preconcentration. Moreover, application of PIXE is expensive because ofthe extensive use of a particle accelerator.
In the author's opinion three fields of application can be indicated where INAA is atpresent, and will be in the foreseeable future, the method of choice for multi-element traceanalysis- for routine analysis of materials which are difficult to convert into a solution suitable for
ICPES;- in cases where only milligram quantities of sample material are available;- as reference method for certifying standard materials or for testing other analytical techniques.A further increase of the supply of environmental samples for INAA can be expected as a result ofincreasing use of trace element pattern interpretation procedures in environmental research andmonitoring.
REFERENCES
IM G.L. Schroeder, H.W. Kraner, R.D. Evans, T. Brydges, Saienee J_5£ (1966) 815-817.Ill D.E. Robertson, R. Carpenter, Neutron Activation Techniques for the Measurement of TraceMetals in Environmental Samples. Report NAS-NS-3114, USAEC-TIC, Oak Ridge, 1974./3/ Proc. Symp. on Measurement, Detection and Control of Environmental Pollutants. IAEA,Vienna, 1976./4/ E. Steinnes, Trans. 5th Int. Conf. on Nuclear Methods in Environmental and Energy Research,Mayaguez, 1984. Proceedings to be published by the ANS./5/ R.R. Greenberg, R.F. Fleming, R. Zeisler, Environment International J_0_ (1984) 129-136./6/ R.M. Parr, ed., Quality Assurance in Biomedical Neutron Activation Analysis. Report of anadvisory group meeting, Vienna, 1982. IAEA-TECDOC-323, Vienna, 1984.PI E.S. Gladney, D.R. Perrin, R.D. Robinson, P.E. Trujillo, J. Radioanal. Nual. Chem. 83_ (1984)379-386./8/ L.M. Mosulishvili, N.I. Shonia, E.N. Ginturi, E.Yu. Efremova, N.E. Kharabadze, J. Radioanal.Nual. Chem. 88, 1 (1985) 121-134./9/ F. GirardT, R. Pietra, Atomic Energy Review U± (1973) 521./10/ J. Kucera, J.J.M. de Goeij, J. Radioanal. Chem. 63_ (1981) 23-40./ll/ T.M. Tanner, L.A. Rancitelli, W.A. Haller, Water, Air and Soil Pollution \_ (1972) 132-143./12/ K.A. Rahn, J.W. Winchester, Sources of Trace Elements - an Approach to Clean Air. TechnicalReport 089030-9-T, Univ. of Michigan, Ann Arbor, 1971./13/ K.J. Puckett, E.J. Finegan, Can. J. Botany 58_, 19 (1980) 2073-2089./I4/ M. de Bruin, H.Th. Wolterbeek, Trans. 5th Int. Conf. on Nuclear Methods in Environmental andEnergy Research, Mayaguez, 1984. Proceedings to be published by the ANS./15/ M.S. Miller, S.K. Friedlander, G.M. Hidy, J. Colloid Interface So. 3£, 1 (1972) 165-176./16/ G. Gartrell, S.K. Friedlander, Aim. Em). 9_ (1975) 279-299./17/ Ph.K. Hopke, in: Atmospheric Aerosol, E.S. Macias, Ph.K. Hopke, eds., ACS Monograph 167,1981./18/ R.K. Stevens, T.G. Pace, Aim. Env. \±, 8 (1984) 1499-1506./19/ M. de Bruin, P.J.M. Korthoven, P. Bode, J. Radioanal. Chem. 70_, 1-2 (1982) 497-512./20/ M. de Bruin, Instrumental Neutron Activation Analysis - a Routine Method, Delft UniversityPress, Delft, 1983./21/ F. Girardi, G. Guzzi, J. Pauly, Anal. Chem. 3£, 9 (1965) 1085-1092./22/ P.J.M. Korthoven, M. de Bruin, J. Radioanal. Chem. 35_ (1977) 127./23/ P.J.M. Korthoven, M. de Bruin, Proc. Conf. on Computers in Activation Analysis and Gamma-RaySpectroscopy, Mayaguez, 1978. CONF-780421, NTIS, Oak Ridge, 1979./24/ M. de Bruin, P.J.M. Korthoven, M.J.J.A. Faasse, A Catalogue of Gamma-Ray and Isotope Datafor Use in Neutron Activation Analysis. IRI-Report 133-73-17, Delft, 1973./25/ Overzicht Nomen Luchtkwaliteit. Interprovinciaal Documentatiecentrum, The Hague, 1977./26/ H.Th. Wolterbeek, J. van Luipen, M. de Bruin, Physiol. Plant 6j_ (1984) 599-606./27/ A.A. Goede, M. de Bruin, Env. Poll. B. 8 (1984) 281-298./28/ G.T. Goodman, T.M. Roberts, Nature 23J_ Tl971) 287-292./29/ F. Leblanc, D.N. Rao, Son. bot. Fr.3 Coll. Bryologie3 (1974) 237-255./30/ M.H. Martin, P.J. Coughtry, Biological Monitoring of Heavy Metal Pollution. Appl. SciencePubl., London, 1982./31/ M. Kauppi, Methodological Contributions on the Use of Lichens as a Tool for Studying AirPollution. Acta Universitatis Ouluensis, Series A, no.104, University of Oulu, 1980./32/ M.R.D. Seaward, Proc. 3rd Int. Conf. Bioindicat. Deteriorisationis Regionis, Liblice, 1977.Academia, Prague, 1980./33/ O.L. Gilbert, in: V. Ahmadjian, M.E. Hale, eds., The Lichens, Acad. Press, New York, 1973./34/ Luchtverontreiniging, Metingen Buitenlucht, april 1983 - maart 1984. CBS, The Hague, 1984./35/ R.L. Dahlquist, J.W. Knoll, Appl. Speotroso. 32, 1 (1978) 1-30.
/36/ E.P. Bertin, Principles and Practice of X-ray Spectrometric Analysis,2nd ed. Plenum Press,
New York, 1975, p.529-570.
/37/ Proc. Int.Conf .on Particle Induced X-Ray Emission and its Analytical Applications,Lund,1976.
Publ. in Nual.In8tr.Meth. 142 (1977) 1-338.

108
RNAA DETERMINATION DF As.Cd AND Zn IN BIOLOGICAL MATERIALS
E.Taskaev, Iv.Penev and L.KinovaInstitute of Nuclear Research & Nuclear Energy,boul.Lenin 72, Sofia-1184
In conection uith the monitoring project No 3739/RB promoted by theInternational Atomic Energy Agency, Vienna, uas necessary to determine Hg,As,Cd,Cu and Zn in some human organs. As the rational approach, on our opinion,is to determine these elements in a single spesimen, us have choosen theconsecutive extraction* Aiming at getting reliable results ue used uellestablished systems: ditizone uas used to separate Hg and Cu (1), and As, Cdand Zn uere extracted as diethyldithiocarbamate complexes (2-5). Specialattention uas payed to the accuracy and precision of the determination^) .Monitoring, optimization of cooling time and control of chemical yield uerecarried out in each case.
EXPERIMENTAL
Preparation of samples for irradiation. Liophilized and homogenized humanorgan samples uere ueighted and packed in polythene capsules. Samples' weightswere up to 5Q0mg. The preparation of samples for the analysis met almost allthe requirements of the IAEA.SRM Bovine LivBr 1577a (NBS), Bouen's Kale andchemical solutions uere used as comparative standards.
Irradiation. The samples uere irradiated in the vertical channel of theIRT-2000 reactor in Sofia, in the termal neutron flux of about 5.1012 n.cm—?s~!for 24 h. Each sample uas monitored uith iron monitor. Cooling time variedfrom 20h to 30h. „ 6 Q
Counting. V'-Spectrometer uith 56 cm GeLi (2.5 kev resolution at Co)and multichannel analyser CANBERRA-40 uas used. Counting time uas up to In.Cadmium fractions uere left after separation for 24h to reach equilibrium115-Cd - 115-In. The standards and final extracts uere counted in 25ml volumeflasks. The following isotopes uere used to calculate the contents:
197-Hg Ev <= 77 kev T1/2 = 64.1h76-As Ev = 559 kev Ti/2 = 26.4h115-Cd E« = 52B kev T1/2 = 53.4h (for control only)115-In El = 336 kev Ti/2 = 4.5h69-Zn E- = 439 kev T1/2 = 13.9h65-Zn . Ev = 1115 kBv T1/2 = 244d (for control only)64-Cu E y = 511 kev T1/2 = 12.7h
Chemical yield determination. 0,5ml aliquotes of the respective organicphases uere dried in polythene capsules at the room temperature and irradiatedin the described conditions for 6h. Ue used 115-Cd, 76-As and 69-Zn for the
chemical yield determination.Chemical separation. Carriers uere added to the speciment before dis-
solution: 2mg of Hg and Img of As,Cd,Cu and Zn* Acid mixture of cone. H2SO4,10% HCIO4 and 1U0>» HNO3 (1:2:5) uas used to dissolve the speciment.Dissolution uas carried out in slightly modified Bethge apparatus. After 30minboiling ( 110°C) the nitric acid uas distilled (end of distillation at 205°C)and collected. The left uas transfered in an extractor, the flask uas rinseduith distilled uater, rinsings added and the acidity adjusted up to 4M H2SO4.M e r c u r y and c o p p e r uere extracted uith tuo 10ml portions ofditizone in CHCI3. The solution uas transfered to thebeaker and to achievethe acidity of 3M HC1 about 2.5ml of cone. HC1 uere added. Uith a pinch of
KI As(U) uas reduced to As(lll) while boiling. Then the solution uas cooledand return back to the extractor. About 200mg NaODC uere added and a r s e -n i c diethyldithiocarbamate uas extracted uith tuo 10ml portions of CHCI3.The extracts uere gathered, uashed uith 2M HC1 and counted.Adding 1M NaOH the pH of the solution uas adjusted C I O S B to 11, and about300 mg NaDDC uBre added. Both z i n c and c a d m i u m DDC complexes uereextracted uith tun portions (10ml) of chlororm. The extracts uere gathereduashed and counted.
RESULTS AND DISCUSSION
The described procedure alloued us to determine As, Cd and Zn content ina single specimen uith high accuracy. Mercury determination uas not sufficientlyselective and did not meet our requirements for several reasons.
Since 197-Hg uas choosen as analytical isotope, the counting conditionsdepended on thB amount of 64-Cu in ditizone fraction. It uas even impossibleto find any mercury in the samples uith comparatively high copper content(e.g. Bovine Liver 1577a).

109
Moreover ue pinned to use 203-Hg (279 kev) as a tracer for chemicalyield determination. Insignificant, but desturbing coextraction of75-Se uasestablished too. The above mentioned reasons directed us to additionalseparation step, uhich gave good results. MBrcury uas reextracted from theditizone fraction uith 4I"I KBr in 11*1 H2SO4. pH of the solution uas adjustedto 6 and Hg uas extracted again uith chloroform solution of ditizDne. Uedeliberately reconciled to some mercury losses during HNO3 distillation,simplifying the procedure. They uere about 1 2/i according to our estimation.Further on ue intended to replace the polythene ampules u/ith the quartz onesand different uay of monitoring uill be introduced (7). That uill allou usto eliminate some of the possible errors and to obtain better results for Hg.
Despite of the identically applied procedure the chemical yieldsobtained uere defferent each time. That confirmed our confidence to controlit every time. Some preliminary experiments uere made on chemical yielddetermination of arsenic uith 77-As (239 kev) tracer. The latter one proovedto be more precise and less time consuming. Ue had good agreement betueenyield values obtained by reirradiation and tracer.
Using the described procedure ue determined the As, Cd and Zn contentin human spleen,kidney,heart and liver samples and in SRn Bovine Liver 1577aand Bouen1 s Kale.The results for the 5RFI are given in Tablei.
Table 1. As. Cd and Zn content in Bovine Liuer 1577a and Bouen1s Kale
Content} Bovine Liver 1577a (NBS) I Bouen1sTKale T
ppb I x±2.S0 ILD I LQ I Ref.(B) I x*2.SD ILD 1 LU 1 Ref.(8)
AsCd
Zn ppm
45.9*3496*88120*8
.6 0
0
.15
22
.7
0
2
.50
75
.3
47*6440*62123*-8
11.0*10960*14030.0*2.B
0
0
.3334
.7
1 .
11
2 .
13
3
140*20690*9031.0*2 .2
L0 - limit of detection, LQ - limit of quantitation
ACKNOWLEDGMENTThe authors are grefetful to the International Atomic Energy Agency,
Vienna, for financial support.
REFERENCE
1. Gladyshev U.P., et all, Anal. Chem. of Mercury, Nauka(i974) (loscou,pp 52-55 (in russion)
2. Uyttenbach A., S.Bajo, Mnal.Chem., V47,No11 (1975)1813-173. Zgivopistsev U.P., E.A.Selezneva, Analytical Chemistry of Zinc, Nauka
(1975) Moscou, p.46 (in russion)4. Bajo S., A.Uyttenbach, Anal.Chiam., V49,No1 (1977) 158-615. Bajo S., A.Uyttenbach, Anal.Chem,. V51,No3 (1979) 376-7B6. Quality assurance in biomedical neutro activation analysis, IAEA-TECDOC-
323, Vienna, 19847. Geisler M., H.Schelhorn, Isotopenpraxis, 18 (1982) 548. Parr R.M., IAEA/RL/103, 1983, Vienna

110
DEFINING OF CONCENTRATION FACTORS IN THE BIOTA OF THE
RIVER SAVA BY THE METHOD OF NONDESTRUCTIVE NEUTRON
ACTIVATION ANALYSIS
S. LulicThe Rudjer Boskovic InstituteCenter for Marine Research ZagrebBijenicka 54, 41000 Zagreb, Yugoslavia
INTRODUCTION
The effects of nuclear power plants (NPP) upon the pollution of the environ-ment are becoming more and more a great problem both for the countries where theNPPs are constructed and for those where their radioactive effluents could appearin rivers, sea or the atmosphere.
The present experience in the field of radioecology has clearly proved thatthe level of radioactivity is not the only deciding factor in an ecosystem, there isalso the uptake of radioactive substances into organisms, depending upon the phys-ico-chemical state in which particular radionuclides are found. Therefore, thechemical contents of inactive parts of effluents and possible interactions of dis-charged radioactive effluents in the environment are of a special radiological in-terest .
Having this in mind it is very important that before a NPP has been constructeda thorough investigation is carried out with respect to each particular system ofa NPP and location and fate of effluents discharged into the environment. Theradioactive material is the product of the nuclei decay, capture of neutrons, orthe decay of radioactive isotopes. In the cooling water of a reactor, besides cor-rosive products we find also the products of nuclei decay.
The greatest problem of the environmental pollution in the case of the KrskoNuclear Power Plant presents the discharge of radioactive effluents into the riverSava. Even though the discharging of radioactive substances into the Sava causestheir temporary dilution, certain plants and animals accumulate them during phys-iological processes. Accumulation of particular radionuclides on the basis of thephysico-chemical processes with sediments and suspended matter of the river Savahas been examined. We should emphasize that various industries discharge their ef-fluents into the river Sava (acids, surface active substances, coal particles andvarious organic and anorganic substances) which essentially influence adsorption--desorption processes of particular radionuclides.
Therefore, in order to define the capacity of particular biological speciesor to define bloindicators of radioactive pollution it is necessary to know thevalues of concentration factors. Values of a concentration factor may be definedon one side from the ratio contents of radionuclides in a particular biologicalspecies and the water, and, on the other side, from the ratio contents of a par-ticular element in a biological species and the water.
To define concentration factor values we have been using the latter method,namely we have been defining the contents of elements by the method of nondestruc-tive activation analysis because the level of radioactivity in biological species,sediment and water was too low to enable us to establish the ratio of their con-centration factor values for a sufficiently large number of radionuclides.
EXPERIMENTAL
The samples of biota were first dried at room temperature, then at 110°C,homogenized and finally stored into plastic ampules. A 2 liter water sample wasevaporated to dryness, homogenized and stored into a plastic ampule. In this waythe prepared samples of biota and the water, together with a standard (prepared inthe same way as the NBS standard Reference Material 1577, Bovine Liver) were sentto be irradiated in the TRIGA reactor of the Jozef Stefan Institute in Ljubljana.The samples and the standard were irradiated under the same condition, i.e. underthe flux thermal neutrons 1.8x 10 1 2 neutron/cm2/sec during 48 hours, namely inintegral neutron flux 3.1 x101? neutron/cm2.
After irradiation, the sample and the standard were .ft to get cooled for acertain period of time and then counted by a "Canberi-a" 4096 multichannal analyserand a 40 cm3 Ge(Li) semiconductor detector with 25% of efficiency and about 2 keVresolution.
From the gamma spectrum obtained the number of elements was calculated bythe absolute method of neutron activation analysis using the following equation:
A x M
6.023 x 10²³ xt f x £ x S x 6where, g - the weight in grams
A - the ac t i v i t y measurement

111
M - the molecular weight of the target material(5 - the activation cross sectionfD - the neutron flux \.S - the saturation factor, S = (1 - e~' ),
where, X - the radioactive constantt - the time irradiation
Q - the isotopic abundance
RESULTS AND CONCLUSION
In ten samples of biota, benthos, sediment, seston and the water, concentra-tions of 14 elements have been defined by the method of nondestructive activationanalysis (Table, the first line). On the basis of the calculated concentrations ofparticular elements in biota, benthos, sediment, seston and the river Sava water,concentration factors have been calculated for particular elements (Table, thesecond line). The concentration factor,
_p _ Concentration of element in aquatic organism (g/g wet weight)Concentration of element in water (g/ml water)
The values of concentration factors range from 10 -10 . The concentration factorshave been used to define accumulations of particular radionuclides or elements inaquatic organisms.
On the basis of experimentally defined concentration factors organisms serv-ing as bioindicators for the control of radioactive contamination of the riverSava caused by the work of the Krsko Nuclear Power Plant have been determined.

112
Table 1. Concentrations and concentration factors in Sava river sar.ple-5
n e m e n t S i d e E (keV)
So
Cr
Fe
CO
Zn
Se
Sr
Rb
Ag
Sb
Ba
Cs
La
Eu
46So
51Cr
59
60Co
65Zn
75'Se
85Sr
86Rb
110m'Ag
121Sb
131Ba
131Cs
140La
152Eu
S a m p 1 eWater Chladophera Sediment Gancarus Hirudinea Alburnus Rutilas
889 5.68(12? 1.42(6)** 5.50(6)
2.50(5)*** 9.68(5)
320 7.90(10) 1.91(5)2.41(4)
Fe 1098 5.56(8) 1.26(2)
2.26(5)
1332 5.13(11) 2.17(6)4.23(4)
1115 3.07(8)
401 5-98(9)
514 2.19(7)
1076 1.20(9)
658 7.38(11)
1-85(4)
6.02(3)ft.
6.19(6)
1.03(3)
1.67(5)1.39(4)
1695 4.97(10) 1.15(6)
2.31(3)
496 5.43(9) 2.07(4)3.81(4)
796 6.22(11) 1.49(6)2.39(4)
1595 9-35(10) 3.18(6)
3.40(3)
1407 1.02(12) 1.36(7)1.33(5)
6.24(5)7.89(4)
3.45(2)
6.20(5)
4.57(6)
8.91(4)
6.18(4)2.01(4)
8.60(5)1.44(4)
7.28(7)1.28(5)
2.91(6)3.68(3)
2.56(3)4.60(4)
3.98(7)
7.76(3)
3.60(5)
1.17(3)
7-95(10)1.39(2)
6.03(5)1.13(3)
6.85(8)
1.33(3)
1.49(5)4.85(3)
2.29(6)
3.83(2)
1.23(5) 7-91(6)2.21(2) 1.42(2)
4.65(9) 6.51(9)9.06(1) 1.27(2)
3.06(5) 2.71(5)9.97(2) 8.83(2)
2.58(7) 4.08(7)4.31(1) 6.82(1)
5.18(5)4.32(4)
1.50(4)6.84(2)
4.79(6)
3.99(3) 1.81(3)
3-17(8)
4.29(2)
3.17(6)
3.63(3)2.58(7)5.19(2)
7.39(4) 5.54(5)1.36(5) 1.02(4)
6.04(6)9.71(4)
9.26(7)1.49(4)
2.17(6) 2.38(6)
1.98(3) 6.7K4)
8.3K9) 8.55(9)1.13(2) 1.16(2)
5.34(8) 6.61(8)1.07(2) 1.24(2)
6.09(6) 1.11(6)1.12(3) 2.04(2)
1.46(8) 1.24(8)
2.35(2) 1.99(2)
3.23(6) 8.73(7)
3.45(3) 8.95(2)
4.02(7)3.94(5)
7.54(10)
7.39(2)
fit
XXX
concentration in g/ml water 5.68(12) = 5.68 x 10concentration in g/g wet weight 1.42(6) = 1.42 x 10value of the concentration factor 2.50(5) = 2.50 x 10⁵
-12
-6

AHALTSIS OF 80MB MDOfiAL SILTS BY EEVTRW ACTIVATION MTROD
Ana Pante l loa , Maria S&lagean, Stefania SplrldonI n s t i t u t e for Physios and Nuolear EngineeringBuoharest 11G-6, BomaniaOb, SpiridonInat l tu t s for Biology and Animal Nutrit ionBucharest, Romania
IHTBODUOTIQNThe i n d u s t r i a l system i n animal and poul try bringing-up has determined
many ohangas in tha technology of e x p l o i t a t i o n aspeoia l ly i n the nutr i t ionand tha technology of feeding problems.
In the mineral n u t r i t i o n domain many s t u d i e s of the s p e c i a l i s t s have beenissued i n order to provide the animal feeding with some mineral compounds andvarious essential trace minerals together with their tozioity limits*Obviously in these conditions the composition of these minerals must be verywell known. On this purpose the neutron activation analysis has been used.
Three oaloium carbonate samples from different mining sites all1 over thecountry have been analysed. She samples were homogenised and dried, Two irra-diations have been oarried outi
- One of 4 hours for the samples (<M1OO mg in weight) and Bo 11-5, SL-1standards 1 A a 2xl0l2a/om2ss, flux. The measurements of 30 mln.-2 hours after7-20 days cooling time have been oarried out,
A gamma spectrum of the sample 2 is shown in fig.l.- The seoond one was a short irradiation of 30 s. in a 2xlOl2n/os2.s flux
in the air rabbit.Sample weights of ~ 40 mg have been used, W-l reference material has
been irradiated as a standard. Irom this last irradiation Al, Ey, Kg, MB, Tland T oontents were determined. In table 1 the concentrations of 34 elementsare given, for Au, Mo and Te determinations the monostandard method was used,
E1SDLTS ABD DI80US8I0HThe oaloium oarbonate salts analysed ware used in 1 * proportion in the
oomblned forages of three groups of poultry in both growing and fating periods.In another group oaloium of high level of purification has been used. Thisgroup was considered as a control one. The liveweight to delivery to feed massconversion ratio and mortality were the parameters in attention.
In these experiments the results obtained did not. reveal significant dif-ferences between the four groups regarding the aforementioned parameters.Oonolusions that the mineral compounds used did not influenoe the growing andfeed conversion have been drawn.
Borne traoe elements determined (As, Br, Or, 8b, Sr, Th, U, eto.) are oon-sidered toxic but their presence at the ppm level did not influence the live-weight at slaughter time or the mortality.
TABU 1
Al(%)AsAu(ppb)BaBrOa(*)OeGoOrOsDy
i
0,67 ± 0,043,2 + 0,432+560 + 221*5 + 0.630,6 + 4,810.4 + 0.61.9 + 0.120 + 2
< 0.2
2.3 ± °«*
Oonocntration (ppm)
2
0.70 • 0.041.9 ± 0.2
8 + 258 + i!3
1.0 + 0.433.2 • 5.214.7 • 0.92.4 • 0.1
8 ± 10,7 t °»l2.1 + 0.4
3
0.14 ± 0.020.4 +0.15 ± 1
190 + 470.? + 0,230,6 + 4,8
3,0 + 0,30.30 • 0.032.3 + 0.41.8 j 0.1
-

114
Ef
LaLu(ppb)
MB
HoMa(J6)HbSbSo8M
SrTbfaShTiU?TbZft
0.280.350.30
<5.940
1.5*214
90.26
<0.620.651.22
2810.13
61.23852.2
260.5
20
+++
0«050,010.08
0.08+•
•
+
£*• c
£+•
±+
±•
i
t+
±
0.470.161310.02
>0.090,050.07320.0720.11230.330.13
0.470.420.7
0.2410.0
750.30292
40.062
180.210.74
1.73540.3
1.35110.9
260.6
21
+
+
t++
tt+•
t+•
t+++
±+
++•
£
0.070.020,10.080.6110.101610.00560.040.050.1360.1
0.11070.120.13
0.040.0620.170.041.14
270.72307
40.036
6.40.090.170.31179
+ 0.01• 0,005+ 0.05+ 0.03+ 0,09± 5t °'08
± 18+ 1+ 0.003+ 3.5+ 0.02+ 0.01
t °'02
* 194 + 1
0.19 + 0.04475 + 1751.1 ± 0.1
4 + 20.15 + 0.04
5 + 1
F t ,

115
DETERMINATION OF TRACE ELEMENT CONCENTRATION FACTORS IN
SOME MARINE ORGANISMS BY NEUTRON ACTIVATION ANALYSIS
A. Vertacnik,S.LulicCenter for Marine Research Zagreb, "Rudjer Boskovic" Institute,Zagreb, Bijenicka cesta 54, Yugoslavia
INTRODUCTION
The organisms living in sea water media are effective accumulators of chemical elements,
among which a number of essential or nonessential trace elements. In order to determine the
concentration of some trace elements, their concentration factors and possible pathways through
the food chain, neutron activation analysis of various marine organisms was performed.
EXPERIMENTAL
Selected marine organisms (Table 1), sampled from the middle Adriatic area were dried at 11O°C,
grinded and 0.2000 g of each weighed into polyethylene ampoules, as well as the sea water residue
after rotavapor evaporation.
SattpU n u m b e r O r g a n i s m s S o i l - 5 standard were irradiated under
Samples together with 0.200 g of NBS
Soil-5 standard were irradiated underneutron flux of U8 x ™™ n/cn)2s for1. Fucus virsoides J.Ag-Phaeophyta
2. Posidonia oceanica (L.) Del. k8 hours in "™&n reactor- "J- Ste"
3. Zooplancton fan" Institut^ A nondestructive NAA
4. Area noae L.-Molusca was P e r f°™ e d by u^ing gamma-counting
5. Spirographis spallanzani Viviani-Polyheata s^stwi which oonsisted of the 40 cm3
6. Eriphia apiniformis(Herbst)-Crustacea Ge(LL) crystal (FWHM 2"10 for 1332
7. Labrus merula-Labridae keV' P e a k : CmPtm 29:1- eff- 7'2%)
8. Maena chryselis Cuv.et Val.-Maenidae attachec to a ^096-channel pulse-
9. Conger conger L.-Muraenidae " h e i e h t analyser. The quantities oftrace elements (expressed in g/g wet
T bl - organism) were calculated from charac-
teristic photopeaks after all necces-
sary corrections for efficiency, geo-
metry, decay sheme had been applied,
and listed in Table 2.
RESULTS AND DISCUSSION
Concentration factor, defined as the ratio of the element concentration in an aquatic
organism to that in the surrounding water under equilibrium or steady state conditions can be
calculated from the formula:
CF _ ^l^wet org.gel/mlsea water
CF values listed in Table 2 are meant to represent edible portions, so the> are weighed
toward muscle and soft parts of the organism. Lower organisms such as brown algae and marine
plants are excellent accumulators of Sc, Fe, Co, Br, Rb, Sr, Sb, Cs, Ce and Cr, Zr, Eu, Au, Th
(from cone, per wet weight) which they concentrate from the ground they are growing on. Inver-
tebrates, as shells or crabs are good accumulators of Zn, Se, Br and Ag, while fishes are poor
accumulators of microelements except Zn, Se, Sr and Cs.1 ii
Cur- experimentally obtained CF values are in the range 10 10 , that is in good agreement
with the literature data (1,2,3). Some difference in CF's for Sc, Fe, Sb, Cs and Ce may be the
result of different microelement availability for marine species that had been investigated on
the limited middle Adriatic area.

116
Table 2. Microelement concentrations and CF values for some marine organisms.
ElementRadionuclideE (keV)
Sc46Sc-BB9
CT
51Cr-320
Fe59Fe-109B
Co60Co-1332
Zn65Zn-1115
Se75Se-401
Br82Br-1475
RbB6Rb--1076
SrB5Sr-514
Zr95Zr-756.6
Agl l O mAg-658
Sb126Sb-1695
Csl3/lCs-795.7
Bal31Ba-496
Ce
""ce-145.6
Eu132Eu-1407
Au199Au-411.7
Th233Pa-31l.9
Seawater
5.33(11)*
n.d.
2.58(7)
2.94(10)
1.66(B)
9.00(11)
6.85(5)
1.46(7)
3.19(6)
n.d.
3.60(10)
1.79(9)
7.99(10)
n.d.
5.80(10)
n.d.
n.d.
n.d.
1
l.B6(Bf*
3.36(2?*
7.08(7)
-
3.62(5)
1.40(2)
1.46(7)
4.97(2)
9.38(6)
5.62(2)
2.94(8)
3.23(2)
9.95(5)
1.40(0)
2.36(6)
1.62(1)
1.13(4)
3.54(1)
-
1.26(7)
3.50(2)
4.92(8)
2.71(1)
4.60(8)
5.B0(l)
8.67(6)
8.95(8)
1.54(2)
1.32(9)
1.61(9)
2.74(8)
2
1.17(7)
•"2.01(3)
1.70(6)
-
1.31(4)
5.08(2)
2.99(7)
1.02(3)
9.95(6)
5.99(2)
8.03(8)
B.92(2)
1.72(4)
2.50(0)
3.69(6)
2.53(1)
3.49(5)
1.09(1)
3.03(9)
-
9.89(8)
2.75(2)
1.53(7)
8.55(1)
2.44(7)
3.05(2)
7.33(6)
5.83(7)
1.00(3)
6.50(9)
3.B6(9)
1.69(7)
SAMPLE
3
8,15(8)
1.44(3)
9.03(7)
-
3.77(4)
1.46(3)
9.54(e)
3.24(2)
2.55(5)
1.54(3)
2.09(7)
2.32(3)
1.26(4)
1.80(0)
9.11(7)
6.20(0)
1.29(4)
4.04(1)
1.14(9)
-
2.28(8)
6.33(1)
1.07(7)
5.98(1)
1.92(7)
2.40(2)
3.47(5)
2.45(7)
4.22(2)
3.75(9)
5.78(9)
8.86(8)
4
1,46(8)
2.64(2)
2.59(7)
-
4.11(5)
1.59(2)
2.09(7)
7.11(2)
2.43(5)
1.46(3)
1.01(6)
1.12(4)
2.74(4)
4.00(0)
6.55(7)
4.50(0)
9.05(6)
2.80(0)
n.d.
-
2.50(6)
6.94(3)
1.64(8)
9.20(0)
3.05(8)
3.80(1)
2.04(6)
1.06(7)
1.83(2)
1.67(9)
3.81(9)
2.71(8)
5
5.30(8)
9.58(2)
5.75(7)
-
1.62(4)
6.28(2)
1.70(7)
5.7B(2)
1.55(5)
9.34(2)
8.42(7)
9.36(3)
6.80(4)
1.00(1)
1.20(6)
8.20(0)
1.52(5)"
4.80(0)
1.12(9)-
2.33(6)
6.47(3)
2.90(8)
1.62(1)
1.21(7)
1.51(2)
2.91(5)
1.44(7)
2.48(2)
2.14(9)
2.67(9)
4.87(B)
6
3.25(9)
5.90(1)
1.21(7)
-
2.0B(b)
8.10(1)
3.30(8)
1.12(2)
2.82(5)
1.70(3)
2.87(7)
3.19(3)
1.93(4)
2.80(0)
1.60(6)
1.10(1)
5.23(4)
1.64(2)
n.d.
-
5.21(7)
1.45(3)
n.d.
-
2.57(8)
3.20(1)
5.88(6)
3.B7(8)
6.67(1)
1.13(9)
n.d.
6.36(9)
7
4.B4(9)
B.EO(l)
1-47(7)
-
3.31(5)
1.28(2)
1.53(B)
5.20(1)
1.48(5)
8.92(2)
3.51(7)
3.90(3)
3.02(5)
4.00(-l)
8.73(7)
6.00(0)
9.02(5)
2.83(1)
!.!4(9^
-
n.d.
-
4.53(9)
2.50(0)
7.2B(8)
9.10(1)
n.d.
n.d.
-
7.63(10)
n.d.
1.53(B)
8
1.48(8)
2.68(2)
4.05(7)
-
6.87(5)
2.66(2)
3.91(8)
1.33(2)
2.18(5)
1.31(3)
8.61(7)
9.57(3)
1.95(5)
3.00(-l)
7.39(7)
5.10(0)
5.46(5)
1.71(1)
n.d.
-
n.d.
-
n.d.
-
7.39(8)
9.20(1)
6.60(6)
n.d.
-
1.05(9)
n.d.
1.31(8)
9
7.85(10)
1.40(1)
3.85(7)
-
9.00(6)
3.50(1)
1.43(8)
4.90(1)
1.68(5)
1.01(3)
4.3B(7)
4.87(3)
2.51(5)
4.C0(-l)
5.84(7)
4.00(0)
2.29(5)
7.20(0)
n.d.
-
3.B5(B)
1.07(2)
8.42(9)
4.70(0)
5.89(8)
7.40(1)
n.d.
n.d.
-
n.d.
n.d.
n.d.
K*concentration in g/ml sea waterconcentration in g/g wet weight
*** concentration factor valuen.d. = not detected
5.53(11) = 5.53 x 101.86(B) = 1.B6 x 103.36(2) = 336
-11

117
Experimentally determined CF values can be used for the calculations of marine food chains,
as well as for the selection of indicator organism in the case of pollution by heavy metals or
radionuclides.
REFERENCES .
(1) S.E.Thompson,C.A.Burton,D.J.Quinn(Y.C.Ng, Concentration factors of chemical elements in
edible aquatic organisms, UCRL-50564 Rev.1, 1972.
(2) G.N.Saenko,M.D.Koryakova,V.F.Makieriko,I.G.Dobrosmyslova, Marine Biology 34 (1976), 169.
(3) D.Huljev.P.Strohal, Marine Biology 73 (1983) 239.

i>ff 8
118
THE CONCENTRATION OF ACTIVE AND INACTIVE STRONTIUM IN
SOME DANUBE RIVER SAMPLES
K. Kosutic, S. LulicThe Rudjer Boskovic InstituteCenter for Marine Research ZagrebBljenicka'54, 41000 Zagreb, Yugoslavia
INTRODUCTION
The present knowledge in radioecology has clearly proved that the level of
radioactivity is not only deciding factor in an ecosystem. The physico-chemical
state in which particular radionuclides are found is important for the uptake of
radioactive substances into organisms. Among the radionuclides arising in uranium
fission process, from the nuclear power plants, " Sr and Sr are of a particular
importance for man because of their radiotoxicity.
Strontium, being a chemical element with similar properties to those of the
calcium, is metabolised by the food chains identically with calcium. Therefore,
the presence of inactive and active strontium in the effluents and their possible
interactions in environment are of a special radiological interest.
This paper deals with some results of strontium concentration as well as con-
centration factors for inactive and active strontium for some fish species in
Danube river. The samples are colected during 1981.
EXPERIMENTAL
Inactive strontium in the water residue (after evaporation), sediment and
fishes is determined by nondestructive neutron activation analysis by using the
^-counting system wnicn consisted of the 40 cm3 Ge(Li) semiconductor crystal
(FWHM 2 2,1-1332 keV, peak: Compton = 29 : 1, eff. 7,2%) attached to a 4096-channel
pulsehight analyser.
The quantities of strontium are calculated relatively, using standard so-
lution which contained 5 x 10 g of strontium per 100 \ .
Radioactive strontium is measured after several separation procedures (1,2).9 0SrCO 3 in equilibrium with its daughter
9 0 Y (3) is detected in the /^-low-level
counting antieoincldent system with gas-flow detector. Background rate was about
1 cpm, and eff. for Sr was 20-24%. The activity of Sr is calculated from the
ratio of Sr activity in the sample and 9 Sr activity in the standard (150,9290
mBq Sr/ml solution). Corrections for the efficiency as well as for chemical
yield were applied.
RESULTS AND DISCUSSION
The results of total.strontium, active strontium and concentration factors
for some Danube fishes and Danube sediment are presented in Table 1. The concen-
tration factors were calculated from the formula:
_„ _ gram strontium/gram fresh fishSr = gram strontium/ml water '
90Cp _ mBq ' Sr/gram fresh fish
90Sr mBq 90Sr/ml water

TABLE 1.
Specie
total strontium90spec, activity Sr
ourresults
lit.(4)values
ourresults
lit.(4)values
gSr/ml w
mBq 90Sr/g f
QOmBq Sr/ml w
x 1.37 (5) = 1.37 x 10" ; for fish results in g/g freshweight or mBq/g freshweightxx for sediment results in g/g dry or r.Bq/g dryxxx for water results in g/ml or mBq/ml
mBq 90Sr
mg Sr
Barbus barbus
Acipenserruthenus
Abramisbrama
Stizostedionlucioperca
Silurus glanis
Cyprinus carpio
Sediment
Water
1.37
2.39
3.26
1.75
4.06
6.27
1.63
1.87
(5)*
(5)
(5)
(5)
(5)
(5)
(3)**
(7)***
1.51.1
1.41.3
1.11.3
1.11.9
-
-
-
2.0
(5)(5)
(5)(5)
(5)(5)
(5)(5)
0.21*
0.26
0.44
0.26
0.59
1.05
13.58**
1.89 (3)***
0.550.46
0.390.47
0.570.39
0.390.72
-
-
-
37
73
128
173
94
217
336
8727
-
110
137
233
135
312
557
7185
-
15.2
10.9
13.5
14.6
14.5
16.7
8.3
10.1

120
Our results confirm the literature data CJ,5) that sediment concentrations90of the total strontium and the active Sr are several times greater than those in
the water. This can be explained with the fact, that the adsorption of strontium
depends on the physico-chemical state of the sediment (6). Therefore, sediments
are suitable and very sensitive indicators (static indicators) of long-term radio-
active waste discharges. Fishes, that are living in the aquatorium are dinamic
indicators of pollution, and they are the last link in the food chain towards man.
Comparing the results for the fishes, we observed that concentration factors for
Silurus glanls and Cyprinus carpio are much higher than the other fish species.
This fishes, which are living near bottom can be used as a selected indicator
organism for the radioactive pollution of the environment.
REFERENCES
(1) J.H. Harley, Editor, HASL 300 (1976).
(2) J.R.Noyce et al., Environmental Radioactivity Standards, River Sediment,
NBS (1975).
(3) B. Al-Deen, S. Lulic, K. Kosutic, XI Jugosl. Symp. of HDZZ (1981), p. 99.
(11) J. Chiosila, E. Revin, U. Chirovici, IAEA-TECDOC-219, Vienna (1979), P-
(5) W.A. Goldsmith, E.W. Bolch, Proc. ASCE-SA 9£ (1970) 1115.
(6) Gh. Furnica et al., IAEA-TECDOC-219, Vienna (1979), P- *»5.

121
MINERAL COMPOSITION OF THE PLANT SPECIES OF THE HYPERICUM FAMILY
L. Marichkova, 0. KjostarovaInstitute of Nuclear Research and Nuclear EnergyBui. Lenin 72, 1184 Sofia, Bulgaria
INTRODUCTION
Lately more and more the attention is payed to the mineral composition of medicinal plants, as it is established that they are biologically active components aswell as the healing agents as alkaloides, glucosidesand others (3,4,6,7). Medicinalplants have usually been used for a long time for treating chronic diseases. Havingin mind the importance of microelements for the human body, we set ourselves as anobjeot to investigate the element composition of some species of the Hypericum fa-mily. AB popular medicine uses water extracts from the epigeous parts of the plantsthe analysis were carried out on the epigeous parts of the plants as well as ontheir 10/o water extracts.
EXPERIMENTAL
The investigated objects were taken from different regions in Bulgaria. Previ-ously air withered epigeous parts of the plants are later dried at 60°C until rea-ching a constant weight and homogenity.
Macro- and microelement concentration determinations were made by use of non-destructive method of neutron activation analysis (1,2,5) which because of its highsensibilitsxand accuracy gives the possibility for determination of trace elements(10~ -10" g) • On the other hand the method allows to determine wide range of ele»-ments. The elements: Mn, Ni and Sr in the epigeous parts of the plants were deteramined by X-ray fluorescent analysis, using Rh-tube and LiP (200) crystal. X-rayintensites were detected by both scintilation and flow counters.
RESULTS AND DISCUTION
The standards for quantitative analysis were laboratory prepared as well asinternational plant standard (kale pouder Bowin) was used.
The results are tabulated. In table 1 the investigated plant species are given.In fable 2 macroelement quantities of Na, E, Ca, Cu, Pe and Zn in the epigeousparts of the examined plants as well as their 10# water extracts are given. AB itis seen the water extracts contain microelement concentrations in an order lowerthan the epigeous parts of the plants. Exception is the iron, where the concentra-tion is two orders lower. In table 3 the microelement quantities in dry weight inthe epigeous parts and in 10# water extracts of the investigated species are given.It can be noted that the elements: Ce, Se, Cd and Sb are not found in water extractsThe elements such as Sm, Or, Br, Ce, Se, Rb, Co and La are in concentrations in anorder lower than in the epigeous parts of the plants.
CONCLUSIONS
1. Using the neutron activation analysis totally eighteen macro- and microele-ments in. the epigeous parts of the plants as well as their 10$ water extracts inten species of the Hypericum family are determined. Using X-ray fluorescent analysisthe elements: Mn, Ni and Sr in epigeouB partB of the plants are determined.
2. The quantities found out in the extracts are in order lower than that in theepigeous parts of the plants except iron where the concentration in the extractsis two order lower than that in epigeous.
3. The elements: Ce, Se, Cd and Sb are not found in 10$ water plant extracts.4. Toxic elements such as As and Hg are not found in the epigeouB parts of the
plants in the examined BpecieB.
Table 1. Investigated plant species of the Hypericum family
Number ofthe nrobe
1234567891011
Plant species name
H. calycinum L.H. Patulum Thunb.H. patulum Henryi.H. andrsoenum L.H. ascyron L.H. maculatum Grants var. maculatumH. inmaculatum CranteH. tetrapterum FriesH. perforation L.H. olympicum L.H. cerastoideB (Spach.) N. Robson

122
TABLE 1. Macroelement content of the diy drug Pumaria family specieB in ppm
Numberof the Objectprobe
1 Herba2 „34 n
567 n
1 Radix234\67
3,4.5,7 Soil1.2,6
E
Na
254,7235,8128.692,8
112,1083,274,4
436,9483,2345,6198,3146,6134,3116,3
28673256
1 E 1 E H I S
K
98301(5201129083809560
1025012320
5110605062704940500052706110
32682654
Ca
12330101909390
1112012530128508850
4290382030504010413043203270
11751984
Cu
56,8548,5493,8479,1285,8268,3470.21
96,3264,86
1(8,2693,19
108,2972,8489,9932,624,4
Pe
246,7223,6214,5309,4432,1456,2602,4
1325143628743925444946787856
32343659
Zn
56,35143,23126,2289,9863,9169.97
101,82
384,9231,9232,1934,6781,2811.4941,8
1001,21012,3
TABLE 2. Microelement content of the dry drug Fumaria family species in ppm
Numberof theprobe
12
3456
71
2
3456
7
3,4,5,71,2,6
Object
HerbaM
n
n
H
n
I I
Radixn
n
H
n
it
a
Soiln
Sm
1,6409-
0,7544--
1,92530,3658
1,94050,9886
0,32450,22182,3458
0,85630,1215
8,19867,1097
1,1 .
0,
Or
0002
,9144-
,52730,88910,8570
0,
1 ,
2,
,5872
•2568
,08240,86230,
1,1,0,
1
1
,9628,2432
,4587,1613
,2863,3287
E I E M
Sb0,5123
0,72140,58040,69210,44180,46230,9223
0,3182
0,50850,46660,43520,2856
0,22340,6524
0,73620,4186
E N I S
Br
4,25343.64636,25B1
2,54975,86735,1138
6,2543
0,3856
0,29341.1800
0,35650,42830,48111,2384
18,7416,93
Se
0,22090,24050,30020,23480,20050,29260,2887
0,2386
0,34250,39640,28520,245B
0,18510,2256
0,42360,3811
Rt
29,23,48.
»
9248
12
32,4543,44,
,18
,5752.19
3,4561
3,4,3,4,4,4,
36,43
,2834,?257,2*79,2^62
,3796,9835
,12,18
0,
0,
1 ,
1 .
o,1.
1,
o,
Co
,6044,1903,5062,6676
,5539,7825,4008
,93250,38562,,96372,84250,99941
1,1815,2365
2,86893 ,1234
La
1,64320,84580,93842,53843,05053,48172,9436
2,36451,05061,00183,24563,98964,05163,0128
1,11802,6822
The elements: manganese, strontivun and zirconitim are detrained by meanB of X-ray radio fluo re scent analysis and their concentrations in ppm are in the follow ranges
ObjectHerbaRadixSoil
Mn4,239-9,112
12,385-21,431400,00 -450,00
3337
170
Sr,038-43,84,42 -85,27,75 -175,0
Zr0,0611-0
n106,7 -1
,1660n
16,00

123
continuation of the Table 5-concentration of the elements, present onlyin the dry weight of the plants in ppm
Numberof theprobe
125456769
1011
Ce
-——-——-—
0,8270,494
E L E M
Se
0,5690,144
-0,1530,2650,844
-0,0790,2020,5650,271
E N
2,
2,
T S
Cd
765——---—
071——
Sb
0,5920,6800,7110,5570,459
-0,5590,5850,8730,5470,589
Mn
15,4515,823,55
-49,5475,2574,0324,2545,0455,76
105,61
Ni
0,550,270,45
_0,500,440,310,500,400,510,54
Er
51,5140,0656,00
—92,0077,0076,0048,0045,0046,0045,00
REFERENCES1. I . DCHnW, L. MARIGHKOVA, Compt. Ren. Bulg. Acad. S c i . , 2 , 19742. L. MARI0HK07A, I . DONBV, D. PASK07, P . NINOVA, Pharmacia, 6, 19765 . V. ERMAKOV? V. KOVALSKI, Biological importance of Se, Acad. of E c i . , USSR, 19744. B. KASAVINA and o t h e r s , M n . Resursi na Organisraa, M., 54-38, 19755. I . LONEV, L. MARICHKOTA, L. YAHKOV, Compt. Rend. Bulg. Acad. of S c i . , 59, 19756. P . ELIAS, Maso lec ivy r o s t l . , 2, 19767. Reports and s tud ies IMGO (PAO) DNESSCO, 1976

124
TRACE ELEMENTS IN TUlUUSh TEA
INSTKUhENTAL NEUTKON ACTIVATION ANALYSIS
H.DemiralpTechnical University of Istanbul, Institute forNuclear Energy, Ayazaga Kampusu, foaalak, Iatanbul-'l'uritey
INXKODUCTIWI
The human- body continuously assimilates a variety of inorganicelements from food and the environment. Some of these elements(AstSb,*n.Co, etc.) are aiosely related to human health and disorder as theirdeficiency or excess induces physiological and metabolic changesU;. Xheseelements are- usually present in agricultural products because of theincreasing industrialization and associated pollution of the biosphere,uptake from the soil, fertilizer, pesticide treatment, and other industrialand domestic operation.
lea is one of the most popular stimulating beverages which isconsumed by low and high income family groups in many countries.
Instrumental neutron activation analysis is one of the preferredmethods(S,3) because information on a large number of elements can beobtained simultaneously.
five packets each of the seven commanly used brands of tea wereobtained from the market. In order to determine the transfer of traceelements into the drinkable portion, about 2-3 g. of the tea leaves wereboiled in hot water for 2 min. Alter filtration the used tea leaves weredried at 65°C in an oven and a portion, about 200 mg. was used for ana-lysis, samples and standards ( NBS-SHM 1571 ) were irradiated lu min. and2 hrs. at pneumatic system and central thimble in the i'ttlU* hAttk -11 re-search reactor.
After irradiation, the activities of samples and standards weremeasured with a coaxial lie dedector ( Ortec UEto-18200 model ) coupled toa spectroacopic amplifier ( Ortec model 472 >. A Canberra 90 model multi-channel analyser with an 8k memory was used for pulse height analysis.The system has a resolution (FWitt) of .3.0 keV. for the 1532.5 keV. gammaray of Co with peak to Compton ratio of 43:1 and efficiency of IBrelative to the 3" x 3" Nal(Tl) crystal.
Cooling and counting timeB were arrenged according to the nuclearproperties of radioisotopes ( 4,5,6 ). The samples and standards werecounted for 5 min. to 3 hrs. for the. determination radionuclidea. Theanalyzer system was calibrated with standard sources prior to every setof counting.
The activity of the sample and standard was compared and from theelemental concentration of the standard ( 7,6 ), the element content oi thesample was calculated. In this calculation, necessary corrections for decayand counting time were applied taking into account half-life of radio -nudidea. Samples of each brand were irradiated in two seperate sets forall the measurments.
Results of this study are presented.
UEFEHENCBS
1/ S.Ahmad, h.S.Chaudhary et al , J.Kadioanal. Chem., 78(1983)3752/ d.'iVi'enner, h.H.Freedman, o.hadioanal. Chem.,37(1977) 5293/ j-.A.Ojuereshi et a l , J.Kadioanal. Chem..68(1982)2084/C .hishra, li.N.Shaikh, o.Kadioanai. uhea.78(1983)3855/ G.Erdtmann(Ed.) Neutron Activation Tablea, 1976, Verlag Cheaie6/ L.Hdiokwere, J.Radioanal. Chem.,85(1984)3257/ S.Amiel, Nondestructive Activation Analysis, 1981, Elsevter Science8/ D.DeSoete, H.&ijbels, J.Hoste, Activation Analysis, 1982, John Wiley and
Sons
125
INVESTIGATIONS OF SOME REGIONAL RIVER SYSTEMSBY INAA AND X - RAY FLUORESCENCE
R.J. DraSkovic", A. KukocBoris Kidric Institute of Nuclear Sciences - VincaPOB 522, 11000 Beograd, YugoslaviaM. Pantelic"Pedagogical - Technical Faculty32000 Cacak
INTRODUCTION
Following our investigations of r i ve r systems in Yugoslavia ( 1 - 5 ),we have investigated d is t r ibu t ion of some elements in materials dissolved inwater ( C - parameters ) and suspended materials ( Csm - parameters ) in ther ivers Ibar and Zapadna Morava by INAA, and the Ibar, Zapadna Morava andi t s t r ibutary Kamenica, by X - ray fluorescence.
The aim of these investigations was to obtain the data on eventual conta-mination of these regional r iver systems, and on intensi ty of such processes.
EXPERIMENTAL
Water ( 2 l i t r e s samples ) and corresponding suspended maperials wereanalyzed. Suspended materials were separated by sendimentation and f i l t r a -t i o n . The water samples were evaporated and the i r dry residue used for ana -l y s i s .
I . INAA Water and suspended materials of r ivers the Zapadna Moravaand Ibar ( Locations: Zapa-na Morava - upsteam and downstream of Kru -§evac and Trstenik ; Ibar - Raska and Mataruska banja ) were analyzed.
Qw = 0.00522 - 0.00955 9 J Qsm = 0.03901 - 0.06488 g
I r rad ia t ion : in VKG - channels of RA - nuclear reactor - Vinca
0 = 2.5 x 10¹⁷ n/m2 . s ; T i r r = 3 days
Measurements: On the SEIN ( France ) 4096 channels analyzer with Ge(Li) -detector - Ortec ( G i f t of IAEA ); comparaison method ; TPA - treatement;contents of elements ( Zn, Hg, Cr, Sb, Sc, Fe and Co ) are expressed innKg / g of dry mater ia ls. Dis t r ibut ion coeff icients were detrmind by therelat ion D = Csm/ Cw.
II. X - RAY ANALYSIS Analyzed samples: suspended materials of locations:
- Kamenica, t r ibutary of Z. Morava: v. Pri jevor
- Z. Morava:mouth of Vrnjacka reka i n Z.M.: downstream of Kru§evacand of mouth of Rasina in Z. Morava, and
- Ibar: downstream of Ra§ka and Mataruska banja
Qsm = 0.15 g ; Source: 241Am ( 3.7 x 10⁹ Bq ; E = 59.5 keV )
Excited character is t ic l ine K * ( L^in Pb )Measurements:On 2000 - Channels analyzer withS«(Li) - detectorResolution : 170 eV za K .- X emission of Mn( Registred ac t i v i t y - calculated for 1 g of i r rad iated materials
was used for determination of the contamination factors )

126
RESULTS AND DISCUSSION
Calculated d is t r ibut ion coeff ic ients ( D = C
Table 1. ( Csm
/ C ) are presented in
smand C - parameters are obtained by INAA ).w
ELEMENTS RANGE OF
sm/wIBAR AND Z.MORAVA
RANGE OF
sm/wOTHER RIVER SYSTEMS IN YUGOSLAVIA
ZINC 4.9 - 227CHROMIUM 54.7 - 147
ANTIMONY 1.45 - 21.2
IRON
COBALT
64.5 - 89.3
Scandium 49 - 131
4.1 - 45.2
a. 1.96 - 4.33b. 2.68 - 4.04c. 1.33d. 2.85 - 18.88
a. 1.24 - 2.85b. 2.33 - 7.46c. 1.36d. 1.07 - 2.76
a. 0.96 - 1.23b. 1.92 - 12.87c. 8.09d. 1.71 - 13.26
a. 1.22 - 1.88b. 6.08 - 10.23c. 1.08d. 1.84 - 42.74
a. 1.14 - 2.19d. 1.15 9.72
TABLE 1. DISTRIBUTION PARAMTERS ( D s m / W ) OF THE IBAR AND Z.M6RAVA RIVERSYSTEMS IN COMPARAISON WITH THE CORRESPONDING PARAMTERS FOROTHER RIVER SYSTEMS IN YUGOSLAVIA( a. Tisa b. Sava c. V. Morava d Danube )
On the basis of activity values ( A ), obtained by X - ray analysis,ca -lculated per 1 g of samples, we have determined contamination factors forinvestigated river regional systems, in comparaison on the uncontaminated wa-ter system: r. Kamenica, tributary of Z. Morava, as well as on mutual real -tions.
CODE: r. KAMENICA r. IBAR r. Zapadna Morava
v. Prijevor (1) downsteram of Raska (2) mouth of Vrnjackadownstream of reka (4)Mataruska banja (3) downsteram of
Krusevac (5)

127
downsteram of mouth ofr. Rasina (6)
These contamination and mutual r e l a t i o n factors are:
Ba: A? ,
Ca: A2 /Fe: A6 ,Zn: Ap /Pb: A3 ,
/A1
'Al'Al'Al'Al
= 3.05
= 4.47= 2.55= 9.14=12.40
Y:
Rb:Cd:
Ce-Sr:
A4 / A2
Ag / A2
A6 / A2
A3 /
A 6
= 1.52
= 5.48= 9.18= 5.38= 2.19
= 2.64
CONCLUSION
Our data, obtained by INAA and X - ray f luorescence, indicate the poss ib i -l i t i e s of u t i l i z a t i o n o f these two ana ly t ica l matehods fo r invest igat ions andcontro l of biogeochemical and contamination processes i n small regional watersystems.which are espec ia l ly important f o r modern studies i n l i f e sciences.
REFERENCES
/ 1 / Draskovic" R.J . , Invest igat ion of Geochemical Character ist ics of Co-mponents of Some Natural Water systems by Non - Destructive Radio -ac t iva t ion Analys is , University of Beograd, Thesis (1978)
/ 2 / Radosavljevid R.: Geochemistry of Fe, Co and Co in the Danube RiverSystem Water - Sediment, Water - Suspended Materials and Water -Biocomponent, Univers i ty of Beograd , Thesis ,(1975)
/ 3 / Anovski T . , Appl icat ion of Isotopic Techniques for Invest igat ions ofContamination of Water Systems, Univers i ty of Skopje.Thesis(1984)
/ 4 / Minfieva B., Appl icat ion of Ac t iva t ion Analysis for GeochemicalInvestigat ions of AUar Ores Region, Universi ty of Beograd (1983)
/ 5 / Dralkovic" R.J . , Pantel id M., StepiC R., Radosavljevid R.,Some Pos-s i b i l i t i e s of Appl icat ion of Nuclear Analyt ical Methods i n Enviro-nmental Pro tec t ion , Proceeding on Symposium of Epidemilogical Pro-blems in Protect ion and Progress of Environment, Pula,Yugoslavia,(1981),p.805

128
NEUTRON ACTIVATION INVESTIGATION ON THE ACCUMULATION OF SOME
ELEMENTS IN TARAXACUM OFFICINALE, RESULTING FROM ENVIRONMENTAL
POLLUTION
I.Kuleff, R.Djingova
Faculty of Chemistry. University of Sofia, HH26-Sofia,Bulgaria
The world wide distribution of anthropogenic toxic metals has stimulated in-vestigations on the development of reliable methods for pollution monitoring.Since the microelements composition of pla.its usually reflects the chemical andgeoi&hemical features of soil and environment the attention of the investigatorshas been directed towards discovering appropriate biological monitors of air,water, and soil pollution.
In this respect we have proposed Taraxacum officinale (dandelion) as a bio-logical monitor /1/. Taraxacum officinale is a widely distributed plant growingat various latitudes and altitudes, near industries, in cities and in the bio-logical preserves.
INAA has been used to determine the content of As,Br,Cd,Co,Cr,Hg.Mn.Sb,Se,Zn, and AAS - to determine of Cu and Pb in leaf samples of Taraxacum officinale,which were collected from three different regions in Bulgaria. The first one isround a smelter (i), the second - in a living quarter in a big city (2) and thethird - high up in Rila mountains and may be considered unaffected by directurban or industrial pollution. Samples from the first region were collected atdifferent distancesfrom the emitting source, along the direction of the highestwind friquency.
The results from the analysis have shown that in the leaves of Taraxacumofficinale growing near the smelter there is an increase in the content of As(14 times),Br(j times) , Cd( 9 times), Co( 3 times), Cr( 2 times) , Cu( 3 times), Hg( 6times), Pb(7O times) ,Sb( 1.2 times) ,Se( 1i4 times) ,Zn( V6 times) in comparison tonormal "zero" values (region 3)• When the behaviour of these elements in depen-dence on the distance from the emitter was investigated it proved that theyfollow logarithmic dependence from the type:
Ci = a + b.lnx
where: C,= concentration of the i-th element in the leaves of the dandelion;x = distance from the polluting emitter (km);a = concentration at x = 1 km;b = the slope.
The coefficients of correlation being: r. =0.9i»; r_.=0.89; r_ =0.97;rpb=0.90; 1^=0.95; rSb=0.99.
There is also a linear correlation between the contents of Sb/Zn, Ca/Pb,Cu/Sb, Pb/Cd, Zn/Pb in the leaves of the plant.
Br and Mn contents although being elevated in the vicinity of the smeltershow more complex behaviour than the other elements. The concentration of Br inthe leaves of the dandelion have a maximal increase on the 5-th km from thesmelter. That is characteristic for pollutants which are in water soluble forms/2/. Analogous pattern of the concentration changes of pollutants released ingaseous state is detected by investigation of precipitation samples /3/. In thecase of Mnthe maximum in concentration is detected on the 3-th km from thesmelter. This is in good agreement with the theoretical prediction that themaximum of the aerosol pollutants concentration should be expected at a distan-ce 1.0-14 times of the height of the stack /Z/.
The results from the analysis of the leaves of Taraxacum officinale, gro-wing in the living quarter of the city have shown that the dandelion can indi-cate also the urban pollution. For the concentration of As is 6 times higher incomparison to normal "zero" value (region (3) » of Br (2 times), of Hg (3 times),of Se (9 times), of Pb (j times). At the same time the concentration of thementioned pollutants in the city is lower than that near the smelter.
The results from the investigation have shown that the leaves of Taraxacumofiicinale accumulate metals and thus reflect the level of environmentalpollution. So it seems that the dandelion (Taraxacum officinale) will be verysuitable bioindicator for local environmental pollution.
REFERENCES/I/ I. Kuleff, R.Djingova, Water,Air, and Soil Pollut.,21 ( 1i98 ) 77. /2/ V.Dobro-volsky, Geography of Microelements.Global Dispersion.,"Mysl" Publ.Moscow H98"}./3/ J.Hallet.P.Lardinois.C.Ronneau, J.Cara, Pel. Total Environ.,25 (11982) 99.

129
DETERMINATION OF SOME ELEMENTS IN BOTTOM SEDIMENTS FROMVARNA BAY, BULGARIA, AND SARONIKOS GULF, GREECE
D. Apostolov, M. Iovtchev, L. Kinova, F. Nikolov, I. Penev,S. Taskaev, T. Grigorov ' , A, Stojanov ^' andA. P. Grimanis, G. Kanias. C. Papadopoulou, M. Vassilaki-Grimani, D. Zafiropoulos * '(1) Activation Analysis Group, Institute of Nuclear Research
and Nuclear Energy, Sofia, Bulgaria(2) Radioanalytical Laboratory, Nuclear Research Center
"Demokritos", Athens, Greece(3) Institute of Marine Research and Oceanology, Varna,
Bulgaria
INTRODUCTIONWithin the framework of the project "Uethodology and application of neu-
tron activation analysis in ecology" between the Activation Analysis Group,Institute of Nuclear Research and Nuclear Energy, Sofia, and the Radioanaly-tical Laboratory, Nuclear Research Center "Demokritos", Athens, was determi-ned the content of toxic and other trace elements in seawater organisms andbottom sediments from Varna Bay and Saronikos Gulf.
The investigated regions are characterized with highly concentrated po-pulation and various industrial activities. The purpose of the project isdiscussed in other work , as well as the results of the determination of ni-ne trace elements in fish Gobius niger, all the year round inhabitents of thementioned areas /I/.
In the present work are determined the concentrations of 16 trace ele-ments (Ce, Co, Cr, Cs, Eu, Fe, Hf, La, Mg, Mn, Rb, Sb, Sc, Sn, and V) inbottom sediments as an essential component of the chosen aquasystem. The re-sults obtained allow some conclusions on the eoological condition of thesystem and an assessment of the conditions in the environment.
EXPERIMENTALSampling sediments
The samples are collected from the upper 5cm layer of the bottom sedimentstogether with fish from 5 points of Varna Bay and from 2 pointB of SaronikosGulf in the summer of 1980.Treatment of the samples
The bottom sediments are air dryed at room temperature for 8 days, themgrinded in agate mills and homogenized after sifting two fractions are sepa-rated ( <0.05 mm <) by means of water-mechanical method by use of ATERBERGcylinders /2/; the time of the precipitation is calculated from the tables ofKOSTER /3/.
The carbonate component in bottom sediments is mainly biogenic.Analysis
For the determination of all 16 elements was used instrumental neutronactivation analysis (DTAA)/1/.
The results are mean values of tree determinations with the respectivestandard deviations* AB a reference material was used geostandard TB (DDR)and standard solutions.
RESULTS AND DISCUSSIONThe concentrations of the determined elements are presented in tables
1 - 3 in ppm dry weight. Table 1 gives the elements Co, Cr, Rb and V determi-ned simultaneously in bottom sediments and in flesh and liver of Gobius niger*While the Rb concentrations are Bimilar for both regions, cobalt, chromiumand vanadium values are synonymously higher for S^aronikos Gulf* Additionallymust be noted strong variability of Cr concentrations between all investiga-ted points.
Table 2 presents the results of the determination of Cs, Fe, Mg, Mn, Sb, which could play *n important role from ecological aspect in connec-
tion with human activity. Again must by noted a tendency to higher concentra-tions in bottom sediments from Saronikos Gulf, especially for Cs and Sb.
The concentrations of the rare earth elements Ce, Eu, Hf, La, Sm and al-so Sc varys slightly for both regions as well as between different points.This is according to their origin, which exclude the influence of human acti-vity.

130
Samp-l i n gPoints
A12
345
BA-10A-3
Table
Co
2.43 +4.10 +U76 +1.12 +1.55 +
22.4 +15.7 ±
0.170.230.100.090.12
3.51.5
CONCENTRATIONS /ppm/
Cr
33.3 + 2.219.0 + 3.85.65 + 0.26.60 + 0.86.05 • 2.7
150 + 2087.5 • 8.3
Rb
63.5 + 2.354.6 + 4.051.5 + 2.078.0 + 9.022.0 + 3.0
76.0 • 1.566.5 + 7.6
V
14.3 + 2.116.7 + 2.66.7 + 0.47.1 + 1.07.3 • 0.3
90.8 + 2083.0 + 14
1: Concentrations of Co, Cr, Rb and V in bottom sedi -ments from Varna Bay (A) and Saronikos Gulf (B)
m
BBSSEBBSB=S===BS
Sampi-
polnts
X12345
BA-10A-3
Cs
1.16 +1.27 ±0.78 +0.87 +0.43 +
8.68 +8.06 +
======
0.060.050.060.030.04
1.211.15
CONCENTRATIONS"=/ppm/"=
Fe
8270 • 380
13600 + 5506440 + 2604460 + 2604770 + 560
31800 +460031000 +2100
Mg
5700 +13606130 + 13063100 • 10837590 + 24303970 + 1070
23250 + 450023430 + 4400
:SESSSSSE=BBBasESESBBBBBSSB
lin
186 + 13
245 + 8149 + 967 + 9
390 + 22
2284 ±175362 + 29
Sb
0.42 +0.59 +0.35 +0.31 +0.20 +
2.98 t3.89 +
0 .
0 .
0 .0 .0 .
0506040302
0.590 . 20
SSBaBBSBBBESSBSSBBBSBBBSBBSSBeSSBBSSBBBSBBSBSBSES
Table 2: Concentrations of Cs, Fe, ttg, Mn and Sb in bottom sedimentsfrom Varna Bay (A) and Saronikos Gulf (B)
Samp- CONCENTRATIONS /ppm/
l U g 'pointsA
12
34
VJl
BA-10A-3
Ce
60.3+3.17.8+0.8.2+0.
11.7+1.14.9+2.
45.3+7.58.9+3.
37330
33
Bu
0.73+0.0.46+0,0.23+0,
-05.04.02
0.26+0,020.28+0,
0.93+0,0.78+0,
.04
.05
.07
14
0 .
1 .
1 .
2.1 .
Hf
.6+1.181+0.0884+0.0479+0.0937+0.17
79+0.1798+0,51
La
29.5+19.8+04.8+06.8+0
.6
.6
.4
.77.1+0.7
27.6+2 . 1
29.5+2.5
So
2.70+0,113.10+0.120.89+0.050.85+0.061.04+0.10
9.7+1.4
Sm
3.38+0.321.54+0,170.78+0,0.85+0,0.81+0,
3.60+0,10.7+0.7 3.37+0,
-SBS"SSSSSSSESSS=E£!
,08
.05>1O
.20
.239SSSB
Table 3: Concentrations of Ce, Eu, Hf, La, So and Sm in bottomsediments from Varna Bay (A) and Saronikos Gulf (B)

131
CONCLUSIONThe higher content of some elements in the bottom sediments from Saroni-
kos Gulf could be explained by an intensive human activity concentrated inthe area of this gulf (navigation, shipbuilding, chemical industry and others.In any case the high concentrations in bottom sediments bulgarian and greekare not reflected on the concentrations of the same elements in the flesh andliver of edible fish (Gobius niger), since in the latter the concentrationsof the investigated elements are considerably under the recommended by WHOvalues.
RfifSRBNCBS/I/. D. Apostolov, M. Iovtchev, L. Kinova, I. Penev, E. Taskaev, A. Grimanis,
G. Kanias, C. Fapadopoulou, M. Vassilaki-Grimani, D. Zafiropoulos:"Studies of nine trace elements in flesh and liver of the fish Gobius' ar from Varna Bay, Bulgaria and Saronikos Gulf, Greece (first part)"
VII" Workshop on Marine Pollution of the Mediterranean, M»13.10.1984,Lucerne
/2/. G. Miiller: Methoden der Sedimentuntersuchung, E. Schweizbart'sche Ver-lagsbuchhandlung, Stuttgart 1964
/3/. E. KSster: Granulometrische und morphometrische Mefimethoden, F. EnkeVerlag, Stuttgart 1964

132
STUDIES OF TRACE ELEMENTS IN MARINE ORGANISMS FROM KASTELA BAY
IN THE CENTRAL ADRIATIC
M.Tusek-Znidaric, M.Skreblin*, J.Pavicicx, P.Stegnar, T. Zvonaricxx
"J.Stefan" Institute, "E.Kardelj University, Ljubljana, YugoslaviaxCenter for Marine Research, Institute "R.Boskovic", Rovinj, YugoslaviaxxInstitute of Oceanography and Fisheries, Split, Yugoslavia
INTRODUCTION
Coastal seas are subject to the influence of local sources of pollution which can beconsiderable. This has effects on food production (fisheries, mariculture) and tourism;henoe it is important to discover more about the behaviour of various pollutants, theiruptake and the mechanisms by which they are bound.
In the present paper we present data on the concentration levels of As, Cd, Cu, Hg, Sb,Se and Zn in the muscle of fish and molluscs from Kastela Bay in the Central Yugoslav Jriaticcoast, obtained by radiochemical neutron activation analysis (RNAA). In addition, in themussel Mytilus galloprovincialis mercury was determined in other organs (gills, digestivegland, mantle with gonads, and muscle); by means of gel filtration chromatography, mercurybinding proteins were isolated.
EXPERIMENTAL
For the analysis of Hg and Se, samples were sealed in quartz ampoules; otherwise poly-thene ampoules were used. The samples, together with standards, were irradiated in the In s t i -tu te ' s TRIGA M< II reactor for 18-20 hours at a flux of 2xlO12n.cm-2sec-1. The induced radio-huclides were separated by specific radiochemical procedures:
As and Sb: - wet destruction in acid, extraction of their iodides with toluene / I , 2 /
- 69mZn, 115tnCd—-115rnIn, 64Cu: - wet destruction, extraction of their carbamates /3,4,5/197 75
- 7lHg and Se: - pyrolysis and volatilization, selective trapping on Se paper or soda lime,rescpectively /6,7/
For isolation of proteins /8/ the sapple was homogenized (suffer 20mM Tris-HCl, pH=8.6),centrifuged (27000 g, 1 hour at 4°C) and chromatographed on a column of Sephadex G-75, whichhad been calibrated with, chimotripsinogen A, myoglobin and cytochrome E. The absorbance offractions from the column were measured at 280 and 254 ran, and then analysed for Hg.
RESULTS AND DISCUSSION
Table 1 shows the concentrations of As, Cd, Cu, Hg, Sb, Se and Zn in muscle of marineorganisms, except for mussels, where all internal organs were analysed together. The resultsshow that the levels of As, CU, Sb and Zn in muscle tissue of molluscs is considerably higherthan in fish muscle, while the levels of Cd, He and Se are not appreciably different, exceptin mussels (Hg, Cd).
The Bay of Kastela is polluted by discharges from a chlor-alkali plant containing inor-ganic Hg, which results in the relatively high concentrations of this element in all samplesfrom tho area.
The internal organs of mussels (Mvtilus galloprovincialis) strongly accumulate Hg, Cdand Zn, which is related to that feeding habit (filter feeders). Studies of the distributionand binding of Hs /9/ showed that the highest concentrations are found in gills and digestivegland (Table 2). For comparison, values from the non-polluted area of Strunjan are also pre-sented.
In both organs, the majority of Hs is bound on high molecular weight proteins (Fig.l),which contain about 70 % of the total supernatant Hg. In distinction to Cd /10/, the lowmolecular weight, metallothionein-like protein fractions contain little Hg. It is possiblethat the high molecular weight proteins binding Hg are polymerized metallothionein-likeproteins, or that the mode of binding of Cd and Hg in mussels is different.
REFERENCES
III A.R.Byrne: AnalyUChim.Acta, 59, 91 (1972).121 A.R.Byrne, A.Vakselj: Croat.Chim.Acta, 46, 225 (1974).IV V.Ravnik, M.Dermelj, L.Kbsta: J.Radioanal.Chem.20, 334 (1974)./4/ M.Dermelj, V.Ravnik, L.Kbsta: Radiochem.Radioanal.Letters, 24, 91 (1976).151 M.Dermelj, A.Vakselj, V.Ravnik, B.Smodis: Radiochem.Radioanal.Letters, 41, 149 (1979).Ibl L.Kosta, A.R.Byrne: Talanta, 16, 1297 (1968).Ill A.R.Byrne, L.Kbsta: Talanta, 21, 1083 (1974)./8/ M.Tusek-2nidaric, M.Skreblin, J.Pavicic, I.Kregar, P.Stegnar, A.Prosenc, VIIebJournees
Eutd.Pollutions, Lucerne, C.I.E.S.M. (1984) (in press)./9/ M.Tusek-2nidaric, P.Stegnar, V.Zelenko, A.Prosenc, VI Journees Etud.Pollutions, Cannes,
C.I.E.S.M. (1982).110/ J.Pavioic, M.Skreblin, I.Kregar, M.Tusek-Znidaric, P.Stegnar, VIIesJournees Etud.Pollu-
tions, lucerne, C.I.E.S.M. (1984) (in press).

133
Table 1: Concentrations of trace elements in marine organisms in mg kgfresh weight, except Od and Sb which are in jug kg"-'-
-1
Qupea sp.Diplodus annularisGadus cepelanusNfcrluccius merlucciusMillus barbatusPagellus erythrinusSolea soleaOctopus macropusSepia officinalisLoligo vulgarisNtytilus galloprovincialis
As
5.5512.711.111.516.52.343.74
25.326.37.392.93
Cd
17.810.010.0
-
10.0'10.010.010.010.010.0
380
Cu
0.020.280.200.100.120.150.072.100.850.921.33
HS
0.161.360.160.170.400.821.200.260.290.1310.6
Sb
1.361.416.882.0410.11.652.3136.856.77.7031.5
Se
0.720.400.320.260.290.430.520.470.290.430.95
Zn
7.230.932.691.48
3.19
1.14
1.90
8.655.445.4185.3
Table 2: Distribution of Hg in the internal organs of Mytilus galloprovincialisin mg.kg~l fresh weight
Kastela Bay Strunjantfe
gillsdigestive glandmantle and gonadsmuscle
26.420.2
3.681.70
0.030.100.010.02
Fig.l. Sephadex G-75 chromatograms of supernatants of mussel digestive glands(A) and gills (B). In 5-7 ml fractions total mercury ( ), absorbanceat 280 nm ( ) and 254 run ( ) were measured.
240 40Ve(ml)
134
MACRO- AND MIGROELEMENT DBTERMINATICK IN SOME SPECIES OS THEFAMILY FUMARIA. L. DISTRIBUTED IN BULGARIA
L. Marichkova, 0. KjostarovaI n s t i t u t e o f Nuclear Re search and Nuclear EnergyBui. Lenin 7 2 , 1184 S o f i a , Bulgaria
INTRODUCTIONMoat of the s p e c i e s of family Fumaria L. (rosopas) are widly d i s tr ibuted i n our
oountry. In Bulgarian popular medicine only the Fumaria o f f i c i n a l i e L. (pharmaceu-t i c a l roBopas) epigeous parts are used . The market drug cons i s t ing of the Fumaria L.epigeous parts usua l ly contains not only the Eumaxla o f f i c i n a l i e , but a l s o others p e c i e s o f the same fami ly . For that reason phy to chemical s tud ies of morphologicallys i m i l a r spec ies o f the mentioned family were se t about. I t was found out that mor-p h o l o g i c a l l y s imi lar Fumaria L. family p l a n t s contain d i f f e r e n t a lka lo id substances(6) and therefore they must not be replaced one by another. Taking in account thatthe Fumaria o f f i c i n a l i s L. i s used widly In our t r a d i t i o n a l popular medicine, thedrugs have to be d i s t inguished we l l one from another. The Fumaria o f f i c i n a l i s L.planii s used a l so in USSR against d i f ferent deseases ( 1 ) . The mineral composition stuaingof different species of the mentioned family was of interest as this compositionparticipates in methabolism of the human body. It was important to know whether theweak toxity of alkaloiden was not accelarated by the mineral one. In this paper se-ven Fumaria L. species are determined. The probes were collected in the bloom periodnear by Varna city.
EXPERIMENTALThe macro- and mioroelement determination was carr ied out general ly by means of
neutron a c t i v a t i o n a n a l y s i s nondestructivemethod. The measured spec i e s (probes andstandards) were i r r a d i a t e d in Sof ia IRT-2000 reactor f o r time periods according torad loaot ive izotop a c t i v a t i o n s . The elements: manganese, strontium and zirconiumwere determined u s i n g radioizotop X-ray f luorescent a n a l y s i s for both the p l a n t s andthe s o i l s . Cd-109 source , S i ( L i ) - d e t e c t o r and Nokie multichanal analyser were used.The standards were prepared inour laboratory from pure chemical r e a c t i v e s f o r ana-l y s i s , as w e l l as Internat iona l p lant standard "Kale powder Bowin" was used . Thelaboratory standards were dropped by means of abso lu te ly prec ised "Etamiltonnpipets,Ca l i forn ia . The element quantity determination method was described i n our previousworks ( 3 s 4 , 5 ) .
RESULTS AND DISCUTICNIn Table 1 the macroelement determination r e s u l t s i n the epigeous p a r t s and in
the r o o t s of the p l a n t s a s wel l a s the s o i l s on which they grow are g i v e n . Erom theTable one can see t h a t sodium i s i n g r e a t e r amount In the roots than In the epigeouep a r t s . Potassium and calcium q u a n t i t i e s are In greater amount In epigeouB p a r t sthan i n the r o o t s . The copper i s a l i t t l e more in the r o o t s . The same h o l d s goodi r o n and zinc.The q u a n t i t i e s of sodium, potassium and z i n c i n s o i l s are i n greaterconcentrat ion than i n the p lant s whereas the q u a n t i t i e s o f calcium, copper and zincare i n lower concentrat ions .
In Table 2 the microelement q u a n t i t i e s i n the epigeous and root p lant par t s asw e l l a s of the s o i l s on which they grow are g iven. Bromine and rubidium are accumu-l a t e d more in the epigeous parts than i n the root p a r t s . The remaining elements areapproximately o f the same q u a n t i t i e s i n the epigeous p a r t s and the r o o t s . Mercury,a r s e n i c and other t o x i c elements are not found in the p l a n t B . The determined e l e -ments are i n admiss ible range for p lant probes ( 3 , 4 , 5 ) .
Farticulary usefull for the qualities of drugs are the elements: calcium, co-pper, zinc, potaBBlum,cobalt and iron.
Legend It refers for the macro- as well as for the microelements
Number of the probe Name of the species1 Fumaria schramii well2 Fumaria porvlflora Lam.3 Fumaria vaillantii Loisel.4 Fumaria kralikii Jordan.5 Fumaria officinalis Lang.6 Fumaria officinalie vor micrantha Lang.7 Fumaria officinaliB vor olensiflora Parl.

135
Table 2. Macroelement quantities in the epigeous parts and in 1O# waterextracts of some species of the Hypericum family in ppm.I-eoncentrations in dry weight epigeous parts in ppmIl-concentrations in 10# water extracts in ppm
Number ofthe probe
123456789
1011
123456789
1011
Na
148,8252,1178,6289,0186,2116,9277,8161,8177,6211,1195,4
19,825,320,829,615,325,727,823,426,524,323,8
'E L E MK
1448012540138101512011850127601054012330161801543016950
23402180204032101980223018602180348030403540
E N T SCa
98409320
1103012310885087709640
128601009089909110
13201230157016301010111012701630114012901250
Cu
59,162,859,453,848,365,783,142,856,561,238,7
9,810,69,48,78 , 0
11,212,37,69,8
11,22»3
Pe
235,8204,1193,2165,6191,5164,3131,7281,3159,8169,3295,0
7,767,016,865,966,985,845,018,815,736,019,0
Zn
21,116,018,221,562,519,425,440,232,530,346,4
1,240,961,031,334,061,00,383,233,153,023,85
Table 3. Microelement quantities in some species of the Etypericum familyI-concentrations in dry weight of the epigeous parts in ppmIl-concentrations in 10$ water extracts in ppm
numberof theprobe
123456789
1011
123456789
1011
0 ,o.o,
o,o,o!o,o,o,o,
0,o!o.o!
Sm
068021035
__-,092,022,084,091
,016,005,007
-__
,024,005,019,020
E LCr
0,1520,7670,2430,©400,3230,2840,1950,5050,1850,1810,414
0,0400,0840,0420,0930,0490,0380,0350,0680,0370,0350,052
E M E NBr
8,2714,17,10,17,8,
14,18,10,1 1 j
10,
1,1,2,1,2,122111
,80,83,75,64,59,19,12,15,02,57
,23,97,0B,69,54,18,06,23,38,22,19
T
2 ,1 ,
6 ,
3,8,3,4,2,
o,0,
*o,•
o,0,000
sCs
,019,037
-,809-,737,799,054,594,564
,18,10
,58
,29,73,28,35,12
So
0,0250,0260,0270,0520,041
-0,022
-0,0390,0580,043
0,00210,00220,00270,00420,0036
—0,0025
-0,00370,00430,0032
Rb
10,
17
,28,89,83
18,75773B4421101912
12217342111
,64,59,19,47,58,42,84
,53,64,85,97,54,28,56,77,18,86.19
Co
5,2 ,1 ,3,3,0,
*2,
o.o,0o;00
0
,26,23,08,73,17,76
•
,86
,460,201,098,324,303,068----
,243
La
—---
0,2750,2840,2520,6510,3840,579
_----
0,0250,0190,0180,6680,0440,061

136
Zirconium is found in almost the same quantities in both the epigetms partsand the roots.
Note The s o i l s under the species N° 3 f4,5»7 as well a s under IT0 1,2,6 a r e uni-t ed a s the plants are found in neibourhood and the Soi l i s one and the same forthem.
EEJBKSWCBS1. H. AKOIIOB, KpoBoocTaHaBaHBajomHe paoTeHHH, 19,60, 93 , TantKeHT.2 . E. AxTapoB, MaiepnanH aa 6uirapcKH 6oTaHHiecKH pemunc, 1939, 109, CO$HH3 . JI. MapHWKOBa H flp., $apMaijHH, 1976, 6, 344 . JIi MapmKOBa H flp., 3>apMauHH, 1978, 4 , 95 . Jl. MapHMKOBa, A. BoeBa, VII HaUHOuaneH KOHrpec no $H3HOJiornH Ha
1980, 237, 242
6. H. Bvlogieva and oth. , Flanta Medlca, 1960, 1

137 /
Application of Nuclear Analytical Techniques to Investigate TraceElements Content in Foodstuffs
A. GharibNuclear Research Centre AEOIP.O. Box 11365-8-586Teheran-Iran
ABSTRACT
This work has been performed with the IAEA as a joint project in a
coordinated programme on " Trace Elements in Human Nutrition and
Bio-Enviromental Systems " to evaluate their nutritional requirements,
interrelations and the role of Trace Elements in health, metabiolism
etc,.
This study includes those foodstuffs which are being used by almost
everybody in all over of Iran. This is because of their essentiality
and / or popularity, such as milk and breads ( wheat, flour, breads ).
The later provides up to 70% needed protein of the people.
The secondary aim of this project was the assessment of various
analytical techniques involved. However, in the present work, the
method involved were ASS, PIXE and NAA. The later method was applied,
both instrumentally and radiochemically. The precision .for NAA allows
greater degree of acceptance respectively. Although PIXE is a very
fast and rather routine but the technique for trace elements analysis
needs certain adaptations and development.

133 I'
GEOLOGY

141
SOME REMARKS ON NAA IN GEOCHEMICAL RESEARCH
M. GeielerInstitut fiir Isotopen- und StrahlenforschungDDR - 7050 Leipzig, Permoserstrasse 15
INTRODUCTION
Next year will see the 5oth anniversary of the first neutron activationanalysis. In this relatively short time of only one or two generations ofscientists this method has become a powerful analytical tool which can yieldmaximum outputs in various respects. Among the manifold fields of application,geology is one of the most important ones. This can be clearly seen by the factthat recently geological sections have been included in many conferences on ac-tivation analysis.
There are various reasons for this. One of them is of course the greatnumber of possibilities inherent in activation analysis. Secondly, the develop-ment of geology itself has contributed greatly. The different neutron sourcesranging from portable isotopic neutron sources with a source strength of some106 n'S"1 to nuclear reactors giving neutron fluxes of 1013 n-s'^-.cm"2 end moreare suitable for analysis for concentrations from the per cent range of geolo-gical macrocomponent6 up to ppb or sub-ppb levels of trace elements. Some ele-ments, especially light ones, are analysed by fast neutrons of neutron genera-tors, and for some time elements of the periodic table having e low neutronactivation sensitivity have been analysed by high-energy gamma rays generatedby linacs and microtrons.
Neutron activation analysis can be performed in geological bore holes, inore dressing plants and on field exploration vans. But the neutron source usedmost widely for activation analysis, also for geological purposes, is the nu-clear reactor and will continue to be so in future.
As far as the measuring aspect of NAA is concerned we do not find such adiversified picture. Equipment for geological analysis ranges from scintilla-tion counters to multi-chennel-analysers coupled semiconductor detectors.
It is not possible here to deal with geological NAA in all its various as-pects. Rather I would like to restrict myself to reactor activation and make afew remarks on NAA in geochemicel research without pretending to give a comple-te and comprehensive picture. For this purpose it might be first of ell usefulto have a look et the efficiency of NAA in geochemicel conditions. Then it willbe easieer to define the position of NAA in geological research. Finally, thestatements made will be illustrated by a few examples.
THE EFFICIENCY OF NAA
Sensitivity and detection limits ere some of the most interesting parame-ters of an analytical method. Sensitivities of NAA are tabulated frequently.Analytical detection limits LA containing counting detection limit Lc and sen-sitivity S as
LA = V S
are not of such general significance because the conditions of counting detec-tion limit are mostly idealized and related to pure samples, end therefore theyare not valid for the large field of instrumental NAA (INAA). For this reasonwe will first of ell concentrate on sensitivity in our subsequent considera-tions.
If an analytical method is to be appraised relating to a special group ofsamples, i. e. geological ones, then sensitivities should be combined with thetypical contents of these samples. This has been done in Fig. 1. Of course itis not so easy to define the typical geological sample. In our investigationsa fictive sample was used for this purpose containing the lithospheric Clarkeconcentrations, that is the mean contents of the elements in the whole litho-sphere. The lithosphere is generally Bssumed to contain 2 parts acidic and 1part basic rock. These contents (in ppm) /I/ ere multiplied by NAA sensitivi-ties (counts per second and /ug element) taking into consideration the activa-tion of 100 h or up to saturation in 10±3 n.cm-Z.s-1, the intensity of thestrongest gamma line and the detection effeciency of a medium size Ge(Li)-de-tector for this line. The product may be called Clarke sensitivity and givesthe pulses per g of the fictive sample in the strongest line of the most activeradionuclid of each element. These values are compiled in Fig. 1.
Three different symbols are used to represent these values depending onthe NAA technique mainly employed to determine an element in geological samp-les: INAA either by short irradiation in a range of minutes or by longer irra-diation of some hours, followed by measurement after some days or weeks, rasp.,or as a third way, radiochemical separation before measurement. As a result ofthis marking procedure, symbols contain indirectly half-life relations and con-

H2
dirions in the gamma spectra.Though Fig. 1 cannot give all details of NAA in geology, many facts of
this field are immediately visible from it. Thus it shows very clearly the li-mitation of short irradiation INAA by Al and Mn and of long irradiation by Naand to a certain extent by La and Sm.
Here we have the favourable circumstance that more than 20 elements can bedetermined instrumentally in geological samples which is mainly due to the factthat so many Clarke sensitivities are concentrated in a relatively narrow beltin the middle of Fig. 1 without having long-lived ones on top. Elements needingradiochemical separation are placed in the lower part and include both NAA-sen-sitive ones, such as Ir and Au, and insensitive ones, such as Ni and Zr having,however, high Clarkes.
I would like to stress once more that the classification INAA - radioche-mical NAA is purely empirical, and certain experimental conditions can lead tovariations in borderline cases. Such modified techniques ere i. e. epithermalnoutron activation which has been increasingly used in routine work recently/2/, measuring of X-rays, or spectrometric coincidence measurements*
Diagrams such as Fig. 1 can also be arranged for other rock types withvariations occuring only in some elements in most cases. Completely altered re-lations are obtained for ores or special minerals.
A second criterion for the assessment of an analytical method is the num-ber of elements analyzed. More than 20 trace elements in geological samples isa remarkable result for INAA. Only mass spectroscopy seems to be superior toit. However, it should also be noted that NAA is doubtless a multielement me-thod but without any survey character because sensitivity varies from elementto element, and some important elements such as F or Pb are missing totally.
If we include radiochemical separation procedures more than 60 elementscan be analysed by NAA. This now touches another aspect of analysis - effortand expense in terms of equipment and manpower.
NAA requires more specialized equipment than other methods as a nuclearreactor and conditions for radioactive working are necessary. Whereas in thebeginning NAA was restricted to nuclear research centers only their irradiation
l O t
90
Nftfl SENSTTTVITIFS FOR R GEOLOQICRL SfltiPLE REPRESENTED BYI. TTHOSF'HERIC CL.RRKE VfiLUES. <PULSES PER SECOND HND GRflM SRMPLEIN THE STRONGEST LINE BV fl MEDIUM-SI2E GECLO DETECTOR RFTER
H flCTIVRTION (OR SF)TURRTION> IN 10*13 N/S*CM'!'2>
143
service is often used today. The radioactive disadvantage is partly compensatedat the very least in INAA by nondestructive handling of samples avoiding chemi-cal dissolutions as necessary for atomic spectroscopical methods. Moreover gem-ma-spectroscopy has best conditions for automation and computer evaluation.Therefore today microcomputerbased systems accomplish INAA of geological samp-les fully automatically if the are supplied with activated samples. Such systemswork in geological institutions too.
In fully automatic systems the number of samples analysed per year can bebetween 5C00 and 10000. As a result of this efficient exploitation of equipmentand low labour demand the cost per element determination can be in the same or-der or lower than that obtained with most other analytical techniques /2/. Inthis way INAA ie able to compete with other methods also in terms of economy.
This is not possible if radiochemical separations are involved. But hereother aspects have to be taken into consideration. Only radiochemical separationremoving the Compton background under analytical lines can take full advantageof high NAA sensitivities and make it possible to attain detection limits forwhich other economically comparable methods do not exist. For instance it ishardly possible to obtain detection limits of 0.02 ppb Pd, 0.5 ppb Pt. end0.002 ppb Ir /3/ in silicatic rocks by methods other than NAA.
In my opinion, radiochemical NAA should be used more intensely in futureafter its relative decrease during the last decade in which greater attentionwas paid to INAA . Despite improvements in competing methods - or may be evenbecause of them - radiochemical NAA has its chance if used in the right place.Separation should be done up to a level pure enough for gemma-spectroscopicalmeasurement but always under control of chemical yield for which the tools wereenlarged by new tracer methods /4/.
Further analytical parameters are precision connected with random errorsand accuracy connected with systematic ones. NAA is well-known for its excellentaccuracy. This is valid for geochemical samples too. The reasons for this can bebriefly characterized i. e. by no chemical influence on nuclear reactions, con-trollable interferences as neutron self-shielding or interfering reactions, se-lectivity by direct spectrometric identification in the measuring process andno contamination after activation. What is mostly practised in geological INAAis the application of reference materials as standards avoiding additional er-rors by standard preparation. Fortunately there are good geological standardreference materials.
All that is said about accuracy is rather theoretical. A confirmation by apractical example will be given below.
Whereas it is always necessary to aspire to highest accuracy the questionof precision needed for geological samples is more delicate. Here the type ofsamples has to be taken into consideration. For instance a eet of samples froma geological profile with a possible small variation of contents will require abetter precision than samples for the investigation of a geological phenomenonfrom different regions for which perhaps only the order of magnitude is intere-sting. Such problems including sample representance and preparation should al-ways be discussed together with geologists because too high demands for preci-sion can cause inconveniently long measuring periods.
A coarse rule for trace analysis should be: as accurate as possible - asprecise as necessary. Interactions between both terms can complicate the situ-ation from case to case.
But the question is justified which precision is in general attainable.Two main factors influence precision in NAA. The first of them is reproducibili-ty of all analytical conditions for all samples and standards during analysis.This includes neutron flux, counting geometry etc. Using an individual neutronflux monitor for each sample /5/, considering build-up correction etc. a repro-ducibility of 1-2 % rel. is obtainable. The second factor is counting statis-tics. In INAA, analysing more then 20 elements under the above mentioned condi-tions, precision for about only a third of them is limited by reproducubility.For the rest counting statistics is dominating and precision of some per centrel. is typical. Here an improvement of precision requires a quadratic prolon-gation of measuring time.
THE POSITION OF NAA IN GEOCHEMISTRY
The main task of geological research is to help secure the country's rawmaterial basis or - more exactly - to provide a scientific foundation of advan-tage for the mining industry. In some articles on geological basic researchthis connection does not seam to become too evident. But increasing difficul-ties in the exploration and exploitation of deposits make it necessary to carryout more basic research before special exploration can start. One example iethe study of general regularities of deposit formation as a prerequisite for theformulation of exploration criteria. In this connection such basic geologicalquestions as the old granite problem ere raised once more.
In the old days activities oriented towards mining output began only at lo-cal exploration of deposits. Fundamental geological investigations were carried

144
STflGES OF GEOLOGICRLRND MINING RCTIVITIES
-FUNDRMENTHL RESERRCH*BfiSIC PROBLEMS OF FOR-MRTION OF DEPOSITS
-VflLURTION OF REQIONfiLDEPOSIT PROBfiBILITV
-E^PLORHTION OFDEPOSITS <LOCflL>
-DEPOSIT EVfiLURTION
-MINING PROCESSCONTROL
CONTENT OFTHE ELE-MENTS DE-TERMINED
\ CLRRKE\ <PPM)
V \• • • Sm
NUMBER OFSflMPLESRNRLVSED
\ < 180
> 1800 ^
NUMBER OFTHE ELE-MENTS DE-TERMINED
\ MflNV
1 *
HVfllLRBLETIME FORHNRLYSIS
\ MONTHS
< HOURS '
FIG.2 : REQUIREMENTS FOR fiNflLVSIS IN SEVERflL STFlGES OF GECLOGICRLRESEflRCH flND MINING
out nearly independently. Nowadays the chain from basic research to practicalmining is longer and also more compact.
In Fig. 2 some steps of this chain ere compiled together with differentanalytical requirements. Fundamental geological research mostly far away fromconcentrations where mining would be worthwhile is the main field of geologicaltrace analysis. Typical concentrations are in Clarice levels. Up to the presentday one can find many articles about thie field in which sample numbers lowerthan 100 are analysed. These investigations are mostly of a relatively complexcharacter and if no other methods ere included at the very least many elementsare determined. Usually there is nb limitation in time available for carryingout the analysis. As far as the mining industry is concerned fundamental re-search is followed by evaluations relating to the possibility of deposits in lar-ger regions before local explorations take place. The last step is controllingthe mining process.
In this line concentrations increase up to those where mining is worthwhi-le which vary for different ores but ear. be in the per cent region. The numberof samples to be analysed increases whereas the number of elements determineddecreases. In exploration sometimes special indicating elements are used, andtherefore not only the mining element is analysed. But at the face only the oreforming element is important. Looking at available analysis periods makes itclear: the nearer to the end of this chain the faster the results are needed.
The position of NAA will become obvious from these considerations. The pa-rameters in the first line are the typical ones for reactor NAA. Multielementanalysis in Clarke concentration level is its strong point as we have seen. InINAA decay periods up to one month till the last measurement are necessary.Therefore results cannot be obtained any faster.
With that the close connection between NAA and geochemical fundamental re-search which we all know has become a little more founded. But the new tenden-cies towards increasing sample numbers by full automation open at least the nexttwo lines in Fig. 2 for INAA in special cases. After that competing methods pre-dominate using bore hole logging techniques or portable instruments. Radiochemi-cal NAA is mostly used in fundamental research only.
The share of trace analysis in geochemistry may be demonstrated by the fol-lowing numbers. Only 8 macroelements account for more than 99 % of the litho-sphere. the 8 next frequent ones for 0.9 % end all other elements together forless than 0.1 % /I/. We find much higher variations in trace elements then inmacrocomponentB especially in equel or similar rock types. Therefore trace ele-ments can give information about more complex geological processes. On the other

145
hand we must not forget that in most cases we determine the trace content of thewhole sample and not of individual mineral phases or even solve crystal structureproblems for traces which all can be carried out for macroelements.
At the beginning when I was talking about the reasons in geology itself forthe success of NAA I had the following in mind. During its development NAA en-countered a geology changing from a more phenomenological and descriptive scien-ce to a measuring and calculating one. NAA stimulated this process in the sameway as other methods. During this period of data collection geologists were andare interested in as many data as possible. All of us who work together withgeologists know this tendency. It can be understood by the very complicated in-terpretation of geochemical or more general geological phenomena, always hopingthat an element more could give a hint more.
Recently, the next step has been taken more frequently: instead of a moreor less empirical interpretation attempts are made to advance to the fundamentalprocessses forming the complex picture of geological occurences. Because a satis-factory laboratory simulation is often not possible owing to extreme physicalparameters geological processes have to be studied by their results in nature.This requires very complex investigation techniques including NAA among manyother methods.
In our institute these are physical age determination, investigation of sta-ble isotopes together with the study of liquid and gaseous inclusions. Mostworks are performed in close cooperation with geological institutions which con-tribute also their analytical methods.
In such complex systems it ie important for the analyst to have good rela-tions to all coworking institutions for optimizing analytical tasks end tracingthe results in the final interpretation.
Although NAA offers a wide and manifold spectrum of possibilities in geo-chemistry some application fields stand out. Determination of rare earth ele-ments (REE) should be mentioned in first place in my opinion. This first placeresults from the number of publications, the geological importance of REE anddifficulties in determination by other methods. It is possible to determine morethan the half the REE in most rocks by INAA together with many other elements.If INAA fails i. e. in ultrabasic rocks there are effective radiochemical proce-dures to separate the REE group before measurement and determine nearly all REE.
REE can provide information in connection with many geological problems.Their chemical behaviour ie very similar through the whole group (except Ce andEu) but the varying ionic radii can cause different conditions for incorporatingthem into the crystal lattice. The measured contents ere usually normalized tothe adequate contents in chondrites representing primary matter, or to othersuitable samples. These REE patterns are interpreted, but unfortunately mostlyin a qualitative manner only. This rather unsetiefactory situation results fromthe fact that the path of REE has not yet been explored quantitatively in manygeological fundamental processes. Exceptions exist in en embryonic stage. Never-theless or even because q.f this REE should etey in the foremost position.
A second main field is determination of very rare elements mostly in con-centration levels in which NAA ie superior to other methods by exhausting itswhole sensitivity using radiochemical separation. Favoured objects here eregold, rhenium and the elements of the pletin group.
Contributions of NAA in establishing geochemical or similar standard refe-rence materials should also be mentioned as a third field.
Let me unterpin my rather theoretical statements by som' small examplesfrom these three fields.
EXAMPLES
REE IN GRANITES AND FLUORITES: In the western part of Erzgebirge (GDR)there are two large granitic intrusive complexes both including three intrusivephases. Their temporal order is established by geological fact6 and Rb/Sr agedeterminations /6/. The older complex (AG) is geochemically very similar to nor-mal granites. The younger one (3G) is highly specialized for some elements andconnected with Sn-deposits /7/.
More than 40 granites of these complexes were analysed for REE by INAA.Fig. 3 shows chondrite-normalized REE patterns of the three phases of the oldercomplex (AG 1-3) as averages from several samples in each case. The slope of thepatterns from La to Lu decreases through the phases 1-3. The Eu anomaly increa-ses. There are the same tendencies through the phases of the younger complex. Ina diagram Eu anomaly (E) via slope (S), as in Fig. 4, homogeneousness and deve-lopment of the phases in both complexes are clearly demonstrated as well as theinterposition of the intermediate granites 2G 1 end ZG 2. Increasing Eu anomalyin connection with other facts (low initial isotopic Sr-87/Sr-86-ratio) indica-tes increasing focal depht for younger granites.
This nearly empirical interpretation of REE patterns is successfully trans-ferable to other granites of the southern part of the GDR.

146
100-
10
La Cc Nd SmEu Tb
FIG.3: REE IN GRANITES OF OLDER IN-TRUSIVE COMPLEX IN U-ERZGE-BIRGF <GDR> CCHONDRITE-NGR-MfilIZED>
0.5-
0.2-
O.t
0.05-
0.02'
terr.
E
AG3
/ • JG 2
av. ^;*
•ZG1• ZG2
* " Yb
" " Sm+Tb
2 5 10 20
FIG.4: DEVELOPMENT OF REE PRTTERNSIN GRHNITIC INTRUSIVE COM-PLEXES TN W-ER2GEBIRGE <•GDR >
5-
2-
I
I 5-
2-
pigmotitic '
hydrothsrmat
0.005 0.01 0.02 0.05fractionatron indtx Tb/la •
FIG.58 TB/CR-TB/'LB D l f i -GRflM OF FLUORITESFROM Pi PROF IL flTBOESENBRUNN.. VOGT-LflND <0DR>
0

147
f n , m H ^ e r S r e t a t i S n ° f R E E * n f luor i te mineralization is theoret ical ly betterfounded and considers geochemical fundamental processes.
We analysed many samples from a prof i le across a more than 2 mthick vein^n ?h « r l t e - ? x n e i n t h e v ° 9 t l a n d region, GDR. We found very great variationshp H H P K 6 r 2 S 6 V e n °ver small distances i n cm range. Some c l a r i t y couldbe provided by a diagram of the kind proposed by Ho l ie r et a l . / a / on the basis
L f D ™ H C Sn considerations on f r a c t i o n a l c r y s t a l l i z a t i o n including REE com-
5«m? ?f J A* 9 , *L . 5 ? h o w s t h l s d l a 9 r a m . The d i rec t ion of primary formation isdominating i n d i s t r i b u t i o n of measuring p o i n t s . Considering t h e i r order in thep r o t i i e i t i s possible to i d e n t i f y some cycles which were passed successively.I«nf? 5Sk ° n ! c Y c l e
xa r e espec ia l ly marked i n F i g . 5 . These cycles were also
confirmed by analysis of l i q u i d inclusions (macroelement composition, isotopicr a t i o s ) . On the basis of these facts in connection with the geothermal gradientdetermined by homogenisation measurements and by Na/Ca/K-temperetures of l i q u i dinclusions a seismic pumping system i s proposed as a model / 9 / .
DETERMINATION OF OSMIUM: Os may serve as an example fo r an element requ i -ring chemical separa t ion . An osmium geochemistry has not yet been worked out be-cause there are to few d a t a . But Os takes a par t in Re/Os age determinat ion. Du-ring previous preparat ion work for introducing th is method i n our i n s t i t u t e ourlaboratory worked out a method for NAA determinat ion of osmium i n geologicalsamples / 1 0 / . Separation i s based on d e s t i n a t i o n of Os as osmiumtetroxide f o l -lowed by e x t r a c t i o n in chloroform. A detect ion l i m i t of 0 . 0 1 ppb is a t t a i n e d .MAA lu c a s e o f O s a r a r e l Y appearing circumstance has to be considered inNAA. The isotope ra t io i n Os can be changed i n Re r ich geo log ica l samples by r a -d ioact ive decay of Re-187 ( h a l f - l i f e 4 .3*1010 y ) . N A A v i a a c t i v a t i o n of Os-190yie lds only the non-radiogenic part of Os using a "normal" Os as NAA standard.
This a n a l y t i c a l disadvantage can give a d d i t i o n a l geo log ica l ly relevant i n -formation i f the t o t a l Os content is determined by another method. This was rea -l i z e d by Merz and Herr / l l / as ear ly as 1958 f o r molybdenites i n higher concen-t r a t i o n l e v e l s by spectrophotometry. F i r s t attempts in our laboratory by a c a t a -l y t i c t o t a l Os determination showed for instance ra t ios of radiogenic Os to non-radiogenic one in the order of 10 :1 in samples connected wi th copper mining.Such combinations of NAA w i t h other methods can give informat ion i n concentra-t ion l e v e l s below t y p i c a l working concentrations of mass-spectrometric isotoper a t i o determinat ions . '
NAA IN INTERCOMPARISONS: The best method and the only one under p r a c t i c a lconditions to obtain informat ion about accuracy of a trace a n a l y t i c a l techniqueis comparing resul ts of the same sample analysed by severa l laborator ies using
different analyt ica l methods i fpossible. Such intercomparisonsare organized by several i n s t i t u -tions and part iz ipat ion can behighly recommended.
Part icipating laboratories aresupplied with extensive and de-ta i led data from the f ina l re-ports. But these reports do not oronly partly evaluate expl ic i te lythe quality of laboratories andmethods. This is omitted becausequality c r i t e r i a must have 6omearbitrary character among otherthings. I carried out such evalu-ations for the lest two intercom-parisons in which our laboratorytook part . They ere SOIL-7 fromthe IAEA / 1 2 / and f ly coal ashesECH, ENO and EOP from the I n s t i t u -te of Radioecology and Applied Nu-clear Techniques Kosice (CSSR)/ 1 3 / , both similar to geologicalsamples.
I used the following evalu-at ion. The accepted data of eachelement are roughly devided into
Fro.6: BEGINNING FIND END OF LftBORfi- three equal parts in order of i n -creasing value of results. Labo-ratories or methods having a re-sult in the middle part aroundthe overal l mean get a positivpoint. Outliers produce negativepoints. Taking into consideration
PLACENO.
12345
6 - 9
52-53
545556
LRB.CODENO.
564930334322263145
•
24324 14215
RNflLYTICflLMETHODS
NOT REPORTEDNflfiNflflNfiflXRFNflfiNflflFlftSNflfl
•
•
XRFflftS>RESfl«S>ET.flL.RflSflflS
POINTS
16121110
93888
- 1 2- 1 2- 1 6- 2 2- 2 8
BEGINNING FIND END OF LflBORA-TORV FLRCF.MEf4T L I S T IN INTER-COMPflRISON SOIL 7

total numbers of positive points and outliers, one outlier gives about 2.5 ne-gative points.
Fig. 6 shows beginning and end of the SOIL-7 laboratory placement list in-dicating a leading part of NAA. 5G laboratories partizipated in SOIL-7, 18among them used NAA exclusively. But 8 NAA laboratories are placed among the 12best ones. In the fly-ash intercomparison the respective figures are 34-10-7.But here laboratories in the two last places are also NAA ones. That indicatesthat NAA can also be performed in a wrong manner.
Disregarding laboratories and evaluating only methods in SOIL-7 the orderis: 1. NAA, 2. AES, 3. XRF, 4. AAS. In the case of fly-eshes NAA also holdsthe first place with advantage. This indicates that for this statement the kindof evaluation criteria is not so important.
REFERENCES
/I/ H. 3. RDSLER, H. LANGE, Geochemische Tabellen, VEB Deutscher Verlag furGrundstoffindustrie, Leipzig 1965/2/ R. 3. ROSENBERG, M. KAISTILA, R. ZILLIACUS, 3. Radioanal. Chem. 71 (1982)429/3/ K. KROGNER, 3. Radioanal. Nucl. Chem., Art. 83 (1984) 117/4/ H. SCHELHORN, M. GEISLER, 3. Radioanal. Nucl. Chem., Art. 33 (1984) 5/5/ M. GEISLER, H. SCHELHORN, Isotopenpraxis 18 (1982) 54/&/ H. GERSTENBERGER, TH. KAEMMEL, G. HAASE, M. GEISLER, Preprint ZfI-14, 1982/7/ H. LANGE, G. TISCHENDORF, VI. PALCHEN, I. KLEMM. W. OSSENKOPF, Geologie(Berlin) 21 (1972) 457/ 8 / P. MDLLER, H. MAUS, H. GUNDLACH, 3h . g e o l . Lendesamt Beden-Wurtemberg 24(1932) 35/9/ H. KAWPF priv. comra./10/ H. SCHELHORN, M. GEISLER, H. GERSTENBERGER, 3. Radioanal. Chem. 58 (1980)239/ l l / E. MERZ, W. HERR, Proc. Sec. I n t . Conf. on Peaceful Uses of A t . Energy, UNOGeneva, vol. 28 (1958) 491/12/ L. PSZONICKI, A. N. HANNA, 0. SUSCHNY, Report on Intercomparison IAEA/SOIL-7 of the Determination of Trace Elements in SOIL, IAEA Vienna 1984/13/ M. KALINCAK. S. BARTHA, S. WIRDZEK, Report on Intercomparison ECH of theDetermination of Trace Elements in Fly Coal Ash from Coal Fired Power Plants,Kosice 1984; item ENO and EOP

149
NEUTRON ACTIVATION ANALYSIS OF SOME ZIRCON SAMPLES FROM THEAPU8ENI MONTAINS (ROMANIA)
Maria Salagean, Ana PanteliciInstitute for Physios and Nuclear EngineeringBuohareBt MG-6. RomaniaV. Znamirovsohi, A* Mo$luUniversity of Cluj-Napoca, Romania
INTRODUCTIONZiroon belongs to the isolated SiO* tetrahedra group of silicates, its
salient feature of crystal struoture being the occurence of the unit cell asdetached tetrahedral (SIO4)*- aniona. These tetrahedra stand isolated in thecrystal struoture. none of the oxygen ions surrounding the Si ion being sharedby the adjacent silicon-oxygen tetrahedra.
From the chemioal point of view the Ziroon could be regarded as a salt ofthe hypothetical & SiO* add. The most important oations one finds in Zirconaret Oa2*, Pe2*, Al?+, Pe5+, Zr*+, Th*+, Nb5*, Ce3+, Hf*+, Y 3 + , U6*, Sn2+,0i*?+and some rare earths.
According to its formula the Zircon contains ZrOp-67,1 % (Zr-49,5 %) andSiO-32,9 %* Practically always it has a slight admixture of Fe20z (up to 0,35% or more) often OaO (0,05 to 4 %) and sometimes AI0O3. It always containshafnium oxide sometimes up to 4- % of HfO2, and in alvlte from Kragerb* (Norway)even 16 %. It may contain Y0O3 and rare earths, ohiefly Ce?05 (hagatalite)sometimes up to 16 %, with P2O5 content of 4- % to 5 % (amagutilite). Certainvarieties may contain Nb and Ta (naegite), Th Ob up to 7 % and even 12 % inhb'gtveitlte. and also U3O3, up to 1,5 % and even more. It occasionaly containsnegligible Sn and Be (in alvlte the content of BeO + AI2O3 may reach 15 %),
Varieties containing a lot of P2°5 oxe known as oxyamalite, malacons andcyrtolites rich in radioactive substances and hence metaoict contains conside-rable amounts of Hjp (2 % to 12 % ) .
Usually Ziroon occurs as small, rare, disseminated crystals in magmaticrooks. As a chemically inert mineral, Ziroon Is easily liberated from its ac-cessories In the course of weathering and passes into placers and hence asrounded grains, into sedimentary rooks.
The X-ray investigation of the Zircon samples shows a typical radical io-y g t irc a p l e hows a t y p i a icalnic struoture comprising anionio SiQu. groups and Zr4"** cations surrounded byeight pxygen ions ( f i g . l ) . The SiQit cetrahedra alternate parallel to Ir withthe Zr^+ions.
The habitus of the Zircon crystal i s short-columnar, often isometric,sometimes dipyramidal* The commonest forms aret the tetragonal prisms {100} ;
{110} and the tetragonal dipyramld (111) ( f ig .2) . Twins are genlculate likethose of Rut He but ocour far less often.
110
Fig.l. Fig.2.
The analysed samples come from the titaniferous placers of the N-NB-rnpart of the VlBdeasa massif as the result of the weathering of daoites and an-deaites /I/* But it was pointed out that the highest concentration of ZrSlO^ocour when the original rook is daolte and Zircon is almost missing when it isandesite. The spreading of titanium and airoonium minerals is closely relatedto the weathering extentlon of the daoites* The frequency of Zircon crystalsis raising with the oontent of magnetite and llmanlte in the placers originatedexclusively from daoites.
Considering the extention of the dacites as well as old dacite quarries

150
and the frequency of the placers along the torents and rivers of the ApuseniMts. this area oould represent a highly Interesting zone for the Industrialextraction of the Zircon. This mineral being the only source for metallic zir-conium, which has a wide use In technology, a more advanced study of this rawmaterial absolutely necessary is considered.
EXPERIMENTAL
Using INAA the concentrations of 23 elements in a Zircon sample have beendetermined* The sample and SL-1, Soil-5 standards were irradiated for 50 hoursin a thermal flux of l.lxlOlln/om2«8* for the long lived isotopes determina-tion* For Zr determination a ZrO» standard was used. She measurements werecarried out by a Ge(Li) dateotor with 2 ksV resolution after 8 - 30 days coo-
NLDenCN
i
_J\.
o °*"cN &)in t^
T /\1 I
_ A I L » A .
qCDr-
JD00
1
JL
3SIDCD
A
3o
inCM
en
1
in
in
-
oCV
\
1ftf
CN
I
i Ji
,5CMCD
'A
1221
123
I
ENERGY (keV)
Figure 3*

151
l ing time. In f i g . 3 a spectrum of the Zircon sample i s presented. After an i r -radiation for 1 min. l a a 2xl0 1 2 n/om 2 . s . f l u x , short l ived isotopes Al, Dy,Mn, Ti, V have been determined. W-l standard was used In t h i s case.
RESULTS ABC DISCUSSIONThe r e s u l t s of major and traoe elements concentrations are shown in t a -
ble 1. The elemental content of Zircon concentrates proves to be extremely i n -terest ing for geochemists and petrologists / 2 / .
TABLE 1
Element
Al(St)AuOeCoCrDySu*«(%)Hf(*)LaLuMnNdSoSnTaTbThTi<*)UVzr(%)Yb
Concentration (ppm)
0.72 + 0.040.06 + 0.021694 + 1152,0 + 0.312? + 32172 • 226 + 2
0.88 + 0.130.67 + 0.031037 + 31
5 9 + 6206 + 20732 + 130
63 + 5105 + 7
9 + 218 + 3
514 + 263.7 + 0,2206 + 3146 + 5
35.0 + 2.5402 + 52
The Zr/Hf ratio emphasizes the ori-gin and affiliation of the Zircon to acertain rock type. The value of this ra-tio (48.9) given in /?/ proves as Zirconbearing rock a granite that is an acidicrook. The Hf oontent is lowering in Zir-coas from alkaline rocks. From our re-sults a ratio of 52.2 ± 4.5 was obtained.
According to /4/ where the Th/U ra-tio for different rock types is calcula-ted, this ratio for acidic rocks variesfrom 3 to 4. Uranium content increasesaccording to the acidity of the rock. Forthe examined sample this ratio is 2.5 +0.4.
It can be observed either a selec-tive concentration of the uranium insidethe Zircon lattice, or a rather complica-ted process by which these placers wereformad.
A, high enough concentration of somerare-earths Ce, La, Nd, Tb, Dy, Sm, Lu,Su, Tb was found.
The presence of certain minor ele-mtiits, as well as their content and res-pective ratios can provide a very pecu-liar key to put into evidence what onecalls "geochemioal signature" allowingthe geologist to identify those specificrocks and areas the Zircon came from.
REFERENCES/I/ B.Stoicovici, H.Roth, Stud. core, geol-geogr., Clud, VIII, 1-2 (1957) 46/2/ N.Korte, lI.Kbllenbaoh, S.Donivan, Analitlca Ohimica Acta, 146 (1983) 267/3/ E.Rankama, Th.&.Sahama, Geochimla (1970) 511/4/ P.Sentfle, N.B. Eeevil, TranB. Am. Geophys. Union, 28 (1947) 732.

152
DETERMINATION OF SOME RE E LEl'iENTS .SCANDIUM AND COBALT
IN BULGARIAN GEOSTANDARD GRANITE G-6.
E.Taskaev, D.ApostolovI n s t i t u t e of Nuclear Research & Nuclear Energy,Bou l . Len in 72 , Sof ia-11B4H.SchelhornCentra l I n s t i t u t e of Isotope and Radiat ion Research,Leipz i . j -7050, GDK
Radiochamical separat ion was used f o r determinat ion of content of somerare ear th (RE) , scandium and coba l t i n the Bulgar ian geostandard Grani teG-B. The RE and Sc were separated by p r e c i p i t a t i o n as oxa la tes ( i ) . Then Scuas separated from the RE by ex t r ac t i on u i t h TBP. Co uas separated bye x t r a c t i o n of i t s d ie thy ld i th ioca rbamate complex u i t h CHC1... The r e s a l t sobta ined uere compared w i th the data from INAA ( 2 , 3 ) , AAS and X-rayf luorecence ana lys is ( 4 ) . The standard reference m a t e r i a l So i l - 5 of theI n t e r n a t i o n a l Atomic Lnerrgy Agency uas analysed concu r ren t l y .
EXPERIMENTAL
I r rad ia t ion. Samples uere irradiated in polythene capsules for 20-2000 reactor in Sofia. Neutron flux uas 5.10 n.cm" / !.s~1. Samples'
h inIRTueights uere about 250 mg. Solutions of RE, Sc and Co chlorides uere used asstandards. •,
Counting. ^-Spectrometer uith 26 cm GeLi uith resolution 2.3 kev atCo and multichannel analyser uas used. The samples and standards uere
counted in 25 ml volume flasks. Counting time varied from 10 to 30 min.Dissolution.5ampj.es, after 5 days of cooling, uere dissolved in
presence of carriers (50 mg of La, 10 mg of Ce, 1 nig of Sc and 1 mg of Co)and tracers (57-Co and 144-Ce). The mixtures of HF + HNQ3, (2ml : 1ml) andHF + HCIO4 (2ml : 1ml) uere used for the consecutive dissolution. Uhen thelatter uao evaporatod the residue uas dissolved in about 20 ml of 2n HC1( + feu drops of H202)« Solutions uere trasfered from the platinum cruciblesto the glass beakers.
Separation of RE and Sc.About 5 g of NH4CI and 3ml of NH4QH uere addedto the solution.lt uas heated and the RE and Sc hydroxides precipitates uerecentrifuyed. The precipitate uas uashed uith NH4CI + NH4OH mixture anddissolved in feu ml of 6*7n HC1. The pH of the solution uas adjusted to 3+4uith NH4OH and then about 10ml of saturated oxalic acid solution uas added,uhile heating and stirring. The precipitate uas separated and uashed uith5ml of 0.1M oxalic acid. The oxalates uere destroyec uith tuo portions ofH1MO3 + HCIO4 (1si) mixture. The solution uas evaporated and the residuedissolved in 10ml 10n HC1. From this solution Sc uas extracted uith tuoportions of TBP (5+5ml) saturated uith HC1. Bouth phases uere counted as theaqueous phase contained the RE and the organic phase - the Sc. The chemicalyiBld uas controled in each sample uith 144-Ce for RE and uith irradiationof aliquote of organic phase (0.5ml) For Sc (5min in the above describedconditions).
Separation of Co. The solution left after the dBcantation of RE and Schydroxides uas dried. ThB dry residue uas dissolved in 10ml of CH3COOH andabout 200 mg of each CH^COONa and NaDDC UBTB added. Co(DDC)3 uas extracteduith tuo portions (i0+10ml) of CHCI3. Chemical yield uas determined by 57-Co.
RESULTS AND DISCUSSION
The results obtained are given in Table 1. The data for Soil-5 ueobtained, shoued very good coincidence uith the ones given in (5). Thatalloued us to accept uith the confidence the data for Granite G-B.Table 1.Content of some RE,Sc and Co in ppm in G-B (6 individual determination)
Element(energy)
SmEuLuCeLaYbTbScCo
10 3kev)1403kev)208kev)145kev)1596kev)396kev299kev368kev1332kB\i)
This uork.G-B
3.50*00.92*00.22*050.7*821.7*31,86*01.65*0.5.83*06 . 0 * 0 .
. 5 7
. 1 1
. 0 5
.1
. 5
. 2 924.729
•X>2.SDSoil-5
5.53*0.B61.14*0.140.35*0.0361 .0*8.629.4*4.72.04*0.340.63*0.1115.3*1.B314.0*1.5
ReferenceG-B(2)
3.5*0.b0.9*0.10.35*1). 0 83R*226*21.8*0.31.2*0.15.67 . 0
( 3 )
4 . 30.980.414824
7 . 05.4
( 4 )
4 . 61 .00 . 548.525
7 . 5
Soil-5(5)
5.42*0.391.18*0.0B0.336*0.04459.7*3.028.1*1.52.24*0,200.665*O,o7514.B*0.6614,B*0.76

153
The separation procedure for RE, using oxalate precipitation, was moretime consuming than the extraction one (1), but in the case of standardmaterial analysis, uhich is not serial, it seemed the preferable one to beused. On our opinion, that procedure allowed thB separation of the RE withless impurities. Undoubt advantage was the use of 144-CB and 57-Co tracers forthe control of chemical yield.
REFERENCE1 . Rjabchikou P. I , ,V.A,Rjabuhyn, A n a l y t i c a l chemistry of RE and Y, Nauka,
(1966) Moscou.pp 122-145 ( i n russion)2 . Apostolov D.,5,3ordanov, Nuclear Energy, 4 (1976) 77 ( i n bulgar ian)3* Rosenberg R., p r i va te communication4 . Iv/anov E 1 . A 1 . , Geostandards Neus le t te rs , V5, Noi (1981) 275. Dybczynski R., A.Tugsavul , D.Suschny, Report IAEA/RL/46, 1978

154
RAPID URANIUM ANALYSIS BY DELAYED NEUTRON
COUNTING OF NEUTRON ACTIVATED SAMPLES
N.N. PapadopoulosNuclear Research Center "Demokritos"Aghiar Paraskevi 153 10, Attiki, Athens-Greece
INTRODUCTION
The neutron activation delayed neutron counting method for uranium analysis,in spite of its many advantages, as speed, accuracy, reliability, sensitivity,wide measurable concentration range, simple sample preparation because of non-destructive analysis, independence of matrix effects, low cost a.o., is appliedonly in a limited number of laboratories in certain countries.
This is due, among other reasons, to past international disagreement onthe usefulness of the method /^/ . Thus it was believed that the method can beapplied routinely only for total uranium analysis, while it can also be used forcxtractable uranium determination, since for neutron activation and counting thesample can be either in solid or in liquid form.
On the other hand, the conventional pneumatic transfer systems installed atmost research reactors are not suitable for very short activation analysis, asin the case of delayed neutron measurements. Therefore a special system forshort-lived nuclide analysis, with cyclic activation possibility for the improve-ment of sensitivity, had to be developed /2/.
EXPERIMENTAL SET-UP
The new home-made uranium analyzer (fig. 1) at the 5 MW swimming pool reactorof Nuclear Research Center "Demokritos", which was developed after more than sevenyears experience in uranium analysis, meets the special requirements of the de-layed neutron method, including a special pneumatic transfer system for short-lived nuclides with less than 2 s transfer time. It also has the possibilityof cyclic measurements and covers a wide uranium concentration range from geo-chemical up to nuclear safeguards samples because of its flexible irradiationterminal, the variable sample size and other factors /3,4/. A double pneumatictube for the transfer of samples in capsules of. variable size increases the de-terminable sample concentration range from fractions of ppm up to 100%. Thus, fordissolved geochemical samples of low uranium concentration, a double containmentof 5 ml vials in 10 ml capsules is used. For highly enriched nuclear safeguardsor other samples of high concentration, 1 ml vials in 5 ml capsules serve as con-tainers. The variable irradiation position at the reactor core with differentneutron fluxes from 5x10¹¹ to 5x1O13 n/cm2 s has been forseen to avoid toopoor counting statistics or too high radioactivity release from the activatedsamples, or pulse pile-up during the measurements. For mineral samples of inter-mediate concentration, 2 ml vials are available. Thousands of samples have beenanalyzed so far.
Since the analytical demand is increasing, complete automation of the systemby a microcomputer is in progress. For testing the computerized automatic controlsystem, a simulator of the analyzer has been constructed. The system will nowbe adjusted to the real analyzer. The control includes various functions, assample loading, sample transfer to the reactor, irradiation timing, sample returnto the counting station, counting timing and sample storage. In order to coverthe wide application range, special operation controls are possible, as cyclic ac-tivation, simultaneous sample irradiation and counting of the previous one, tempo-rary storage after counting or irradiation during cyclic analysis, change of thecounting end for v-ray spectrometry instead of uranium and thorium analysis bydelayed neutron counting, a.o. For thorium analysis, cadmium covers are neededto increase the fast to thermal neutron flux ratio. With this automatic arranqe-ment the rate of uranium analysis can exceed 500 samples per day. For v-spectrummultielement analysis of short-lived nuclides, the ;:ate is less but stil compe-titive with other conventional analytical methods, while the sensitivity fora number of elements is higher.

155
RESULTS AND DISCUSSION
Comparisons between the delayed neutron method for total uranium and the flu-orimetric method for extractable uranium analysis showed a relatively constantextractability, ranging from 60% to 85% (Table 1), while in the case of dissolvedextractable uranium in low concentration rather large discrepancies have been ob-served between the two methods, so that further investigations are necessary(Table 2). The results between the delayed neutron and the x-ray fluorescencemethod (XRF) were in good agreement in the range between 100 ppm and 2000 ppmwhile beyond these limits some discrepancies have been observed (Table 3). Forchemically enriched samples the results between the delayed neutron and the spectro-photoiretricmethod showed rather large discrepancies which have to be checked(Table 4). Uranium in lignite has been determined by the delayed neutron methodand by gamma-ray spectrometry of natural radioactivity with good comparativeresults (Table 5).
These intercomparisons show that the results of some methods are in goodagreement while significant discrepancieshave been observed between other ones.This means that frequent intercomparisons are advisable, to check the reliabi-lity of the various methods.
Thanks are depressed to E. Christodoulou, P. Kritidis, N. Gaitanis,G. Lefkopoulos, C. Gatsos, V. Lymberiades, N. Malliaros a.o. from N.R.C. "Demo-kritos" and to S. Gana, B. Perdikatsis from the Institute for Geological andMineral Exploration, for their collaboration.
REFERENCES
/1/ R.G. GARETT, J.J. LYNCH, Proc. Exploration for Uranium Ore Deposits, IAEAand NEA, Vienna (1976) 321, 333.
/2/ N.N. PAPADOPOULOS, J. Radioanal. Chem. 72 (1982) 463/3/ N.N. PAPADOPOULOS, Abstr., Seminar on the Use of Research Reactors in
Fundamental and Applied Sciences, N.R.C. Tajoura, Libya (1984) 44./4/ N.N. PAPADOPOULOS, Abstr., Int. Conf. on Nuclear and Radiochemistry, Lindau,
F.R.G. (1984) 169.
Table 1
Comparison of t o t a l and ex trac tab le uranium a n a l y s i s by the delayedneutron and the f luorimetr ic method r e s p e c t i v e l y
DN ( t o t . ) FM(extr.) DN(tot.) FM(extr.)(ppm) (ppm) (ppm) (ppm)
52 32 184 12532 26 288 17518 12 328 22945 27 1028 845
127 105 1700 1200
Table 2
Comparison of extractable uranium analysis between the delayedneutron and the fluorimetric method
DN FM(ppm) (ppm)
4.8 2.36 34 2.58 315 6
DN(ppm)
1026
68
10
FM(ppm)
3 . 2131.654 . 8

156
Table 3
Comparison of total uranium analysis between the delayedru'Ut ron and XRP method in ppm
ON
132181243
XRF2217
1 J9163241
Table 4
DN358560
111217083993
XRF333573
114516063405
Comparison of dissolved uranium analysis between the delayednoutron and the spectrophotometric method
DN(ppm)
28.58 3.03903.51.23236.534.53545.5
SP(ppm)4363.53B6602726353142
Table 5
DN(ppm)
406.5
212316.52038334124
SP(ppm)
43.5073.51747611.536303624
Comparison of total uranium analysis between the delayedmethod and gamma-ray spectrometry in ppir
neutron
GS
31292.42.429
32302.21.B31
DN
2069632323
GS
266B602425
C n •
CV "D -
L -
P =
R =
RL =
S =
TS =
V =
V *
Neutron Counter
Gamma Counter
Diverter
Loader
Pump
Reactor
Reloader
Storage
Temporary Storage
Air Valve
Capsule-Air Valve
Fiq. 1 Uranium Analyzer

157
REE GEOCHEMISTRY OF THE STARA PLANINA OPHIOLITEASSOCIATION
L.Daieva, I .HaidoutovGeolog ica l I n s t i t u t e , Bulgarian Academy of Sciences"AcaU. G. Boncev a t r . " , b l . 24 , 1113 Sof ia , Bulgaria
INTRODUCTION
The Stara pianina o p h i o l i t e a s s o c i a t i o n crops out in the core of westermostpart of the a l p i n e Balcan range (Ntf B u l g a r i a ) , i t i s represented of s t r a t i f i e d s e -quence, c o n s i s t i n g of u n i t s o f cumulates ,sheeted dykes and p i l l o w lavas . Two subun-i t s are distinguished in the f irs t one; the cyclic one containing Iherzolites, c l i -nopyroxenites and gabbros and the layered gabbro one. The relationships of theseunits are transitional.
The ophiolites are covered by the sedimentary-volcanic Uerkovica Group.Caledonian age is supposed for the two sequences.Like most ophiolites the stara pianina ophiolite suite has undergone conside-
rable alteration and greenshist facies metamorphism / I / . These alteration and meta-morphic processes have caused important geochemical changes,so that many presentgeochemical features could not be used to clarify the petrogenesis of rock types/2,3 / . Several geochemical studies have demonstrated that low-temperature alterationand hydrothermal metamorphism of basalts has either l i t t l e effect on REE-abundances/2,V»<>r causes only relative increases in LREE / 3 , 5 , 6 / . Coleman / 7 / shows thatthese elements are important for establishing the analogy of ophiolite sequences.Inthis paper a comparison of absolute and relative REE-abundances In the rocks fromStara Pianina ophiolite association with other ophiolites and modern oceanic crusti s made. Detailed structural,petrological and geochemical data on that ophioliteassociation are presented in a previous work / I / .
EXPERIMENTAL
Samples from the fo l l owing rock types have been studied; one l h e r z o l i t e , o n egabbro from the c y c l i c subuni t , two from the layered gabbro one , three metabasa l t s ,one p lag iophorphir i t e from sheeted dykes, two p i l l ow lavas and two keratophyresfrom Derkovica Group. La.Ce,sm,Eu,Tb,Yb,Lu contents of the rocks were determined by
INAA. A sample USGS-W-1 was usedTABLE I . REE content of samples from Stara
Pianina ophiol i fe associat ion
as reference. The samples wereirradiated for .18 h bg neutronflux of l , 6 x i O 1 2 n/sm sec in ex -perimental reactor IRT - 2000,So-f ia . Iron was employed as a fluxmonitor. The obtained re la t iveerror for the REE was from 3 to10% except for Tb - 2O?4. The da-ta are presented in Table I .
RESULTS AND DISCUSSIONThe three p l a g i o c l a s e - r i c h / l /
(35-65 vol%) gabbros - s.**6*8,'»and the lherzo l i t e - s.46 , havethe lowest REE-abundances fromthe whole assoc ia t ion , in compa-rison with Bay of Islands gabbros/k/ these from Stara pianinaophiol i te s u i t e have higher REE-abundances and are closer to thegabbros from Troodos / 2 / . Thechondrite-normalized REE-patternsare characterized by re la t iveIHEE-depletion and posit ive Eu-anomaly. (pig . l ) , which are com-
mon features of gabbros from ophio l i tes and Mid-Atlantic Ridge.The chondrite-normalized REE-patterns of the three metabasalts - 6. 1,3,35 a"d
the plagiophorphirite - 3 are with s l ight LREE-depletion and negative Eu-anomaly,typical for the ocean ridge basal ts and island arc tho le i tes / 2 / . Pig.2 shows thatthe sheeted dykes (1 ,3 ,3*) are situated in the dykes f i e ld from Troodos and Bay ofislands ophio l i t e complexes /2,k/.
The both pillow lavas - s . 5°,k!l have s imilar £ REE as the sheeted dykes. TheirREE-patterns are nearly chondrit ic with s l i g h t convex-upwards REE-distribution (F"i/T-3),which fol lows the REE-patterns of pillow lavas in Troodos and Bay of Islandsophiol i te complexes, such REE-paterns are found for mid-ocean ridge basalts and i s -land arc volcanics /k/.
sampleN»
8k
I
33 a
355*
hz5868
La
0 , 9
1 , 2
!.<•0 , 5
3,5<».75,6^ . 0
3,6
3 ,315,221.1
Ce
1 , 0
2,6
2,55 , 0
6,38 , 8
9,68 , 0
10,37,7
29,263,2
Sm
0 , *
0,1*2 , 0
1,32,93,73,7
l i *
3,93,92,95,7
Eu
0,U20,560,760,600,921,231.13l,kk1,18
1,360,761,50
Tb 1 Yb
nd 1nd
0 , 20 , 2
0 , 8
0 , 9
1 . 0
0 , 8
0 , 7nd
0 , 1
0 , 9
nd
0,30,70,92 , 1
2,52,50 , *
2,73,30 , 52 , 2
Lu
0,040,0^0,130,160,390,46o,*ta0,110,510,530,060,33

158
Y» inI
Fig. l REE-pattern in the rocks fromcumulate unit
Both investigated keratophyres cut-ting the sheeted dyke unit - B.58,68 ha-ve higher £ REE among a l l other rocksin the sui te . The REE-patterns (Fig-l*)are characterized with strong LREE-en-richment and s l i gh t ly expressed negati-ve Eu-anomaly. such characteristics arecommon for the Ca-alkaline intrusivesfrom this region - stakevski (1) andSvetinikolski granitoids (II,unpubl.d.)
The REE-abundances in the invest i -gated rocks from Stara Planina ophioli*te association are similar to those inanalogous rocks from other ophiolite lo-c a l i t i e s : Troodos /2/,Bay of Islands/**/.
Most of the analyzed gabbros inophiolites have variable but lower REE-abundances than associated volcanics.Typically these gabbros have strong po-s i t ive Eu-anomalies with relat ive LREE -depletion. I t i s shown that cumulaterocks formed by accumulation of 6O"6 pla-gioclase,25?6 clinopyroxene and 10$ or-thopyroxene /&*/ from a liquid with REE-abundances similar to the sample 3 fromthe sheeted dyke unit have Eu-enrich -ments and LREE-depletions similar to
gabhros from ophiol i tes . In terms of plagioclase,clinopyroxene / I / and REE-abundan-ces this model i s appropriate for the Stara planina ophiol ite gabbros - s.*»6 , 8 .The avai l ih le petrolo*?ical data / I / , the REE-abundance (the highest one) and s l ight -
ly expressed positive Eu-anomalyof s.k give us no reason to cla-sify th is gabbro as a cumulaterock.
The metabasalts from sheetedS'r—-~=^W
J. -—* i*^'^ m dyke unit and pillow lavas havey^Z.. J^V'''""''**1' **^*:'"..—•••"5' REE-abundances nearly lOXchondri-
'" ^ '' '- - " ^ ^ ^ J S * tes with relative LREE-depletion.This i s characteristic for MORBand so we find unlikely that thisdiagnostic feature in ophiolitebasalts i s due to alteration andmetamorphism / 2 , V especial ly be-cause oceanic low-temperature a l -teration processes preferentiallyincrease LREE-abundances / 3 , 5 , 6 / .The comparison of the pillow la-vas and sheeted dykes REE-pat -terns from Stara Planina ophioli-te association with the f i e ld ofnormal-MORB / 9 / shows that theinvestigated metabasalts are in
the upper part of this f ield (Fig.5) . Such REE-abundances and chondrite-normalizedREE-pattern can be found also in some unmatured island arc basalts / 10 / and smallocean basin basalts /2,k/.
30
LO Ct
Fig. 2 REE-pattern ir_ metabasalts of thesheeted dykes unit
u|u to
T h e a v a l l i b l e REE^ta f o r
the both keratophyres cutting thesheeted dyke unit are not suff i -cient proof to explain theirLREE-enrichment by oceanic low-temperature alteration and green-shist facies metamorphism. I t i spossible,however,that this LREE-enrichment may have some connec-tion with later magmatic eventsin this region.
sn eu Th Tk in
Fig.3 REE-pattern in pillow lavas

159
CONCLUSIONS
I t i s found that o p h i o l i t e rocks from the Stara Planina o p h i o l i t e a s s o c i a t i o n ,Troodos and Ray of Islands have important REE s i m i l a r i t i e s . REE-abundances of l a v a s ,dykes and gabbros r e f l e c t a s imi lar petrogenesis including a mantle source r e l a t i -
vely depleted in LREE. Although these ophi -o l i t e rocks have REE-abundance features s i -milar to those of oceanic ridge rocks weconcur with other autors /2 , '« / that onlythese data are not sufficient to distingu-ish between different tectonic environmentssuch as deep ocean ridge, small ocean basinor an unmature island arc.
too-
La O Nd Sm En Tb
REE-pattern in keratophiresand Stnkevski(l) and Sveti-nikolski(ll) granitoids
to C« Eu Tb tb L«
Fig.5 D i s t r ibut ion of REE in dykes and pil lowlavas compared with MORB-field.
REFERENCES/ I / I .Haidoutov,L.Daieva,S.NedJalkova, G e o t e c t . , Tectonophys . ,Geodin. ,18(I985) ,1 ./ 2 / R.W.Kay.R.G.Senechal, J .Geophls .Res . , 81 (1976) ,964/ 3 / I.Moody, can.Miner. ,17 ( I 9 7 9 ) f 8 7 1 ./k/ C.J.Suen.F.A.Frey,J.Malpas, Earth P l a n e t . S c i . L e t t . , ^ 5 (1979) ,337 ./ 5 / Ch. Bonnot-Courtois, Chem.Geol.,31 ( I 9 8 o ) , l l 9 ./ 6 / J.N.Ludden,G.Thompson, E a r t h . P l a n e t . S c i . L e t t . , ^ 3 (1979)185./ 7 / R.G.Coleman, Ophio l i t e s , springer-Verl. ,NY (1977),229pp./ 8 / C. J .Allegre,R.Montigny,Y.Bott inga, Bu l l . Soc.Geol.Fr. ,15 (I973) , '»6 l ./ 9 / A.D.Saunders,Y.Tamey, Geochim.Cosmochini.Acta, 43 (1979) ,555-
/ 1 0 / A.Masuda, Earth p lane t . S c i . L e t t . ,k (1968),28I*.

160
POTASSIUM DETERMINATIONS IN CLAYEY MINERALS BY NEUTRONACTIVATION ANALYSIS
Lucre^ia Dinescu, Carmen PlaaadaInstitute for Physics and Nuclear EngineeringBucharest MG-6, RomaniaAbstraoti Seven samples of clayey mineral (illit) have been ana-
lysed. Potassium oontents have been determined by IHAA,with a preoision better then 3.3 %.
INTRODUCTIONThe knowledge of potassium oontent in minerals and rocks is very impor-
tant for age determinations. The potassium determination is performed both byolasio and nuclear methods. The K-Ar nuolsar method is well known in age de-terminations*
In this work the nuclear reaction (n, $T) for the potassium measurementhas been used.
EXPERIMENTALNuclear data for potassium and sodium are given in table 1.TABLE 1
T.nfftnil Isotopio G"o *o p»nfln«+ TI/P Photopeaea usedIsotope abpgaano, parn parn Product 1/2 £ a V
4 1 K 6.7 1.46 1.42 ^ K 12.36 1524.7 (17.9 %)zha 100 0.53 0*34 2 4Na 15.03 1368.5 ;2754.1 (99.85 %)
The element sodium is given here to facilitate the understanding. It is ahigh disturbing element in potassium measurements.
Powder samples of about 200 mg were weighted in small plastic bags whichwere heat sealed. Baoh bag was wrapped in aluminium foil. Standards were pre-pared in the same way as the samples. Kalium diohromicum - KgO^Oo (a hunga-garian produot) was used as standard.
Illit mineral samples, togather with standards were irradiated 1/2 hourin 1.4xlOi5n/om2.s. flux* The samples have been irradiated both, without andwith oadmium foil, but a significant Improvement in sensitivity was not ob-tained at the epithermal neutron irradiation. Measurements were carried out for300-800 s, after 24 h cooling time.
RESULTS AND DISCUSSIONSeven illit mineral samples have been analysed by INAA.Potassium concentration in the sample was oaloulated from the formulae t
c = ^e'f'>'"•••
werei 0 - K oonoentration in sample, 0 - K oonoentration in standard, t - ti-me of sample measurement, ta - time of"standard measurement, A - the 1524 pho-topeak area in sample, A« - the 1524- photopeak area 1 A standard, X =0*693 ™The method preoision was oaloulated from the formulae!
(2)
werei n • number of samples irradiated from the same mineral (four in our case)Results obtained are given in table 2, along with the results obtained by theK-Ar method*
The preoiBion was better then ± 3*3 %• A good concordance with the K-Arresults was obtained* The K-Ar method is sensitive and precise, but a verypainstaking. The INAA is a simple and rapid method and the results precisionis BatiBfaotory. The great disadvantage of this method consists in the factthat it cannot be used for the K determinations in minerals with high sodiumoontent.

161
TABLE 2Potassium concentration in i l l i t minerals
Sample
1234567
Concentration, %
K-Ar mothod
*yK (n.p) *9A
5.965.575.876.595.474.922.94
IHAA method
6.015.505.896.635.735.263.05

162
SIMULTAlEOnS HEUTRON ACTIVATION DETERMINATION OFALOHIKIUli, MA&BESIUM AID SILICOH IB ROCKS
Iv.PenevInstitute of Nuclear Research and Nuclear Energy, Sofia, BulgariaI.Kuleff and R.DjingowaFaculty of Chemistry* Sofia University, Bulgaria
INTRODUCTIONThe determination of Al, Mg and Si in various types of rocks and mine -
rals is very important for different geochemical investigations.Although wide-ly used for analysis of geological materials, NAA is not among the numerousanalytical methods flj.osed for determination of the three elements, due tospecific difficulties in the simultaneous determination of Al, Mg and Si.
In the present paper a method for the simultaneous neutron activationdetermination of Al, Mg and Si in different kinds of rocks is described.
THEORETICALFor neutron activation determination of Al the nuclear reaction
27A1 (n,ji.) 28A1 ( 1)
is used.However Al is a product of two other nuclear reactions:2SSi (n, p) 28A1 ; ( 2}31P (n. o6> 28A1 . C 3>
For the analysis of Kg, the reaction26Mg (n, AJ
27Mg ( 4)is of primary importance, but there are again two interfering reactions:
27A1 (n, p) 27IIg ; C 5)30Si (tt,o6) 27Mg . C 6)
?7 This means that after reactor irradiation the two radionuolides Al and'Mg are obtained as products of three nuclear reactions (.1-3) and (4-6) for
Al and Mg respectively.In the case of Al, this may be expressed in the following way
' SA1 " V * Hp * H<* • ( 7)
28where N A 1 is total number of Al nuclei in irradiated sample, N ^ , B and N^are contributions of reactions (1), (2) and (3) respectively.Absolutely thesame may be written for Mg.The ways to solve this analytical problem are ge -nerally two £2,37:
i, irradiation of the samples in a well thermalized neutron flux, whicheliminates the interferences from reactions (2) and (3) for aluminium and (5)and (6) for magnesium.
ii. repeated activation of the samples with neutron fluxes inadequate inrespect to energy distribution:
HA1 • •£ + V * "£ • (9)
The system of equations 17-9) allows to calculate the concentrations ofthe elements of interest ( Al, Si and P in this case }, because the contribu -tions VC are proportional to the weight of the sample and the concentration ofthe X - th element in it. _ -
The data of other autors J4.5J as well as our experimental results provedthat the contribution of reaction (3) to the total number of 28-Al is negligi-ble. In most cases analogous is the situation with reaction (6)) in the analysisof Mg in rocks.This permits the solution of the problem for 28-A1 (resp.27-Mg)to be reducet to solution of a system of two equations with two unknown con -centrations after two irradiations and measurements:
kAlCAl • kSiCSi+ kiiGsi

163
where Cj is a concentration of the respective element in the material analy -sed,S is a signal received by the HPA froa the'analytical gamma-line for eachirradiation, m are the weights of the samples for each irradiation and T1- therespective time factors:
T = Ci-e3tp(-/4tB))expC-/6tc)(1-expC-^tll) ,
tB, tc and tM are respectively irradiation, cooling and measuring times, A isdecay constant of the analytical isotope.The coefficients ki are determinedexperimentally using pure substances, for each type of neutron flux.
Solution of the system (10,11) gives simultaneously concentrations of Aland Si in the material analysed.lt should be noted specially that the determi-nation of Si, thus performed, is considerably better then by use of reactions
29 2930Si
, thus performed, is consi31Si and 29Si (a, p) 29A1.t t i f M d Al
. (, p)Concentrations of Mg and Al can be determined simultaneously in the same
way using 27-Mg.EXPERIMENTAL
Sample and standard pre ition.Samples of about 0.05-0.15 g were sea-volume about 1 cm3.Pure substances - A12O« ,led in- polyethylene capsules
SiO and Mg(CH^C00)2.4H20 were used as standards and were sealed in capsules(0.08 - 0.1 g ).
The irradiation was carried out in the rabbit system of the experimentalnuclear reactor IRT-2000, Sofia.The first irradiation was done with, eplthermal( epicadmium ) neutrons using about 1.5 mm cadmium shield, and the second -with 5.1O12 cm~2.s"1 pile neutron flux.Copper monitors of about 5 mg were usedto control the neutron fluxes.
Measurement.The gamma-spectrometry measurements of the samples were carri-ed out with a QetLi) detector ( energy resolution 2.8 KeV, efficiency 8$ for1332.5 KeV ), connected to a 4096 channel HPA Canberra-40.The gamma - lines ,given in Table 1 have been used in the analysis.The measurements of the irra-diated samples started after a cooling time of 1 to 10 minutes, depending onthe activity of the sample, when the total counting rate is 10* cps.
Fig.1. Scheme of themethodtg-irradiation time,tg-cooling time,tu-measuring time,N j-epithermal flux,B t h -flux of pile
neutrons
SampleStandard
J IrradiationNGpj/tB=120s
!i IrradiationN l h / tB -30s
tc-
tc-
MOmin
MOmin
tM
tM
=300s
= 300s
RESULTS AND DISCUSSIONAnalysis.The scheme of the proposed neutron activation method for simul-
taneous deiermination of Al, Mg and Si is presented on Fig. 1.Geometry of spec-trometry and initial countig rate was keept invariable.
Table 1. Analytical iBOtopes, Sensitiviti and Precision
ELEMENT NUCLIDE HALF-LIFE GAMMA-LIMB DET.LIMIT REL.SD(min) (KeV) (mg/g) (S6)
Al
Si
Hg
+ - matrix
Al-28
Mg-27
100$ SiO,
2.24
9.45
! • ++
1778.9
1014.5
- matrix ioo%
0.03+
30++
0.8++
A1 2O 3
2
7
B

164
Detection limit.The detection limits were calculated according to [jo] .The results are presented in Table 1 and may be accepted as satisfactory foranalysis of various types of rocks and minerals.
Table 2.Results of standard reference materials
STANDARDREFERENCEMATERIAL THIS
AlgOWORK
C 0 N C S
CERT.VAL.
N T R
THIS
A T I 0 N S (MgO
WORK CERT.VAL.
% )
THISSiO2
WORK CERT.VAL,
40.4+2.8 46.4+0.1
5.74\o.O7 47.0+3.8 49.1+0.1
AH SSSR •»SGD-1ACgabbro) 14.9+0.3 14.9+0.1 5.95+0.45 7.0+0.1AH SSSR -ST-1A(basalt) 14.1+0.3 14.2+0.1 5.4+0.6ZGI - Gil(granite) 14.3+1.0 13.6+0.4 0.43+0.30 O.3B+O.13 75.4+8.5 73.5+5.1USGS-PGC-1(peridotitc)0.82+0.04 0.74 - 41.8+0.9 43.2 - 43.7+1.7 41.9 -ANRT-BB-N(basalt) 10.1+0.4 10.2+0.6 12.2+0.7 13.3+0.7 39.4+0.7 38.4+1.3CRPG-1IA-N(granite) 18.3+0.5 17.7+1.1 -«=0.25 0.06 - 70.4±4.2 66.6+1.5
Accuracy and precision.The results from the analysis of different stan -dard reference materials are presented in Table 2. The are mean values of threeparallel determinations, characterised with the respective standard deviations.The certificate values for the analysed materials are given as well.The goodagreement of the experimental data and the certified values proves that thecoditions of analysis ensure the obtaining of reliable results.The typical va-lues for the precision are given in Table I.It say be accepted as satisfactoryfor analysis of Al, Mg and Si in most types of rocks and minerals.
Acknowledgement.this work was supported of the Ministry of Education ofBulgaria, contract mutter 16116.
RBPBR5RCBS1. P.Jeffery, Chemical methods of rook analysis, Pergamon Press, Oxford, 1970.2. D.De Soete, R.Gijbels, J.Hoste, Neutron Activation Analysis, Wiley Inter -
science, 1972, p.478.3. K.A.Kryjenkova, U.G.Valieva, A.A.Kist, Rep.VINITI, Io.2192-70, Tashkent ,
1970.4. G.Brdtman, Neutron Activation Tables, Kernohemie in fiinaeldarstellungen ,
Vol.6, Verlag Chemie, Weinheim, New York, 1976.5. P.Baumgartner, Table of Neutron Activation Constants, Karl Tiemlg, UUn -
ehen, 1965.6. L.A.Currie, Anal.Cham., 40 (1968) 586.

MULTIELEMENT NEUTRON ACTIVATION ANALYSIS OF SILICATE
ROCKS USING SUCCESSIVE SHORT AND LONG SAMPLE IRRADIATIONS
P.Vukotic, S.Jovanovic
Institute for Mathematics and Physics,
University "V.Vlahovic", Yu-8looo Titograd, Yugoslavia
ABSTRACT
Concentrations of 3o elements in silicate rock samples are
determined by relative method, using BCR-1 as a standard. Sa-
mples are irradiated twice: firstly for 5 minutes and then,
after few'days cooling,for 7 hours, the induced activities
being measured on planar and coaxial Ge(Li) detector systems.
Reference rock samples AGV-1 and G-2 are analysed to check the
analytical method applied.
INTRODUCTION
Instrumental neutron activation analysis (INAA) is nowdays
an irreplaceable tool when analysing geological samples. The imp-
roved characteristics of spectrometry systems(e.g. energy reso-
lution and detection efficiency of Ge(Li) detectors) .together
with the computerized spectra processing, do enable simultane-
ous determination of the increasing number of trace elements
- with a satisfactory precision and accuracy.
It was also the aim of the present work to determine as
many elements as possible in silicate rocks by means of INAA.
EXPERIMENTAL
Samples p. The following samples are analysed: DBM diabase,
AM andesite and DCM dacite. As standard the U.S.G.S. BCR-1 re-
ference rock (split 78/position 18) fe- used while AGV-1 (92/13)
and G-2 (38/17) reference rocks are analysed to test the analy-
tical method used.
9oo mg of fine powdered rock, together with 25o mg of
H0ECH3T-WA.CHS C powder binder was each time homogenized and
pressed to a 12 mm diameter and 6 mm thickness pellet, so that
all samples to be irradiated had the same geometrical shape
and the same ' -["Parent" density.
Irradiations. Samples are irradiated in Thetis Research
Reactor (Gent, Belgium) during 5 minutes and then, after few Jays
cooling, for about 7 hours.
Short irradiations were carried out in a reactor channel
with well thermalized neutron flux {<&.. =1.8. lo n.cir .s ,_ _ tn '<Dth/a> . = 158, *tn/<J> =lo6;d>is the "equivalent" fission flux),
so as to minimize the yield of (n,p) and (n,o) reactions. The cha-
nnel is equipped with pneumatic rabbit system under electronic
watch control. Sample is situated in a polyethilene vial of
appropriate dimensions. Both vial and a Rh flux monitor pellet
are fixed in the rabbit. 3 samples of DBM, 3 of DCM, 2 of AM and
one of each of the U.S.G.S. reference rocks were separately irr-
adiated and put afterwards in clean polyethilene vials.
The same samples, together with an additional sample of
each of reference rocks, were irradiated for the second time
during 7 hours in a reactor channel with the fallowing flux
3,characteristics: <J>,.=1.5.1o n.cm" .s , <t> /d>th th epi
J>t- /0 =11.5- 6 samples and a standard were each ti;:e simultareo-
usly irradiated. Two such irradiations were performed, with di-
fferent disposition of standard and samples in the rabbit,
in order to check whether the analytical method corrects and/or
eliminates possible systematic errors, especially those ones
originating from sample preparation and irradiation conditions.
Cu wire, rolled arround each of the samples, served to correct
for the flux gradient within the rabbit.
Gamma-spectrometry. Countings were performed on two Ge(Li)
detectors:an 62cm3 active volume coaxial detector with 1.85 keV
resolution at 1332 keV and a low-energy photon detector with
active volume and O.215 keV resolution at 5.9 keV. Besides the
standard electronics,each of the detector systems was coupled to
a DIDAC ^ooo-channel analyser connected to a PDP 11/20 computer
which recorded the spectra. During the measurements of the short
-irradiated samples a dead-time stabilizer, operating on the
BARTOSEK et.al. principle, was used to correct for dead-time.
Counting sdnene is shown in TAble 1, while the radioisoto-
pds formed and their gamma-lines chosen for quantitative analysis
are given Table 2. ^

Together with the short-irradia<^ed samples, the activity
137
of Cs source (in a fixed geometry) was measured on the coa-
xial detector. Based on the 661.6 keV peak intensity of 1^^Cs,
a simple approximative pile-up correction was performed. (The
dominating contribution to the pile-up losses originated fron2 8A1 activity.)
In spite of the fact that the well thermalized neutron
flux reduces significantly the contribution of the interfering
reactions to the induced activity of the radioisotope measured,
the contribution of the interfering reaction Al(n,p) Mg was
not negligible and amount*^ to 8.1 jig Mg/mg Al. The latter corre-
sponds to 14% of the actual concentration of Mg in G-2. For this
reason, the appropriate correction is done when determining Mg
in each of the samples.
The fission contribution to the induced activities of
La, Ce and Nd raJioisotopes was corrected for as well, although
the analysed silicate rocks in combination with BCR-1 standard
were not critical in this respect .
Some of the spectral interferences with significant inf-
luence on the analysis result, were not possible to avoid by
choice of a more convenient analytical peak, counting scheme
or peak integration method. These interferences, given in Table
3, were corrected for by the corresponding comparator peak of
the interfering isotope.
The analytical peaks were processed using the program
LESDEP , which gives the ratio of the concentration of the ele-
ment in a sample to that one in standard.
RESULTS AND DISCUSSION
Based on relative IKAA method described and accepting
FLANAGAN compilation for the values of the concentrations of
elements in BCR-1 standard, the results given in Table « are
obtained. The concentrations of the i-th element found in di-
fferent samples of the same rock are shown in subsequent rows
as weighted means x,t together with the associated standard de-
viations s,, calculated from the counting statistics. From the-
se results the arithmetic mean "x is calculated as the best ev-
aluation of the element concentration in the analysed material.
Table b shows that no systematic deviations exist between
the results obtained for different samples of the same rock and
different irradiations. This fact proves that the method is ca-
pable of controlling the impact of the possible sources of syst-
ematic errors. One can also notice that the error figures, even
expressed as standard deviations based on counting statistics only,
do overlap in nearly all cases, emphasizing the good reproducibi-
lity of the method.
We obtained the following precision in determination of
the investigated elements (expressed as standard deviations);
<5%; Na, Al, Sc, V,Mn, Fe, Co, Ba, La, Ce, Nd, Sm, Eu,
Tb, Dy, Yb, Lu, Hf, Ta, Th, U
5-lo%: Ca, Ti, Cr, Rb, Gd, Tm
lo-15%: Mg, K, Ho.
Based on the analysis results of AGV-1 and G-2 reference
rocks, it can be concluded that the precision of the analytical
method is very good for most of the elements analysed. However,
one could doubt about the results for Mg, Ca, Sc (in AGV-1), Co,
La, Nd, Gd, Tb( in G-2), Tm and Yb (in G-2) given in Table «. For
Mg, Ca, Gd and Tm it is a realistic doubt, due to the inaccuracies
in interference corrections. For the other elements we see no rea-
son for the errors. The discrepancies are probably due to poorly
accurate compilation of the element concentrations in BCR-1 ,
AGV-1 and G-2. Such a statement is supported by the work of
GOVINDARAJU and ROELANDTS7, in which the results of FLANAGAN are
critically evaluated and the following values proposed for the
concentrations we are interested in here (in ppm): Sc: 11.9(AGV-1);
Co: 15.7UGV-1), 4.6 (G-2); La: 37UGV-1), 87(G-2); Nd: 37( AGV-1),
53(G-2); Tb: o.H6(G-2); Yb:o.8o(G-2). The results of the present
work do match the above ones, except for Nd in AGV-1.
On the other side, even not obvious from Table U, the pra-
ctice of the described method experienced serious difficulties
when determining Mg, Cr, Bb, Ba, Gd, Ho and Tm, depending on the
concentrations of the investigated and interfering isotopes in
the sample.

The experimental part of this work is realized at the In-
stitute for Nuclear Sciences (University of Gent, Belgium). The
authors wish to thank the colleagues from the Institute for the-
ir friendship and cooperation.
REFERENCES
1. J.BARTOSEK, F.ADAMS, J.HOSTE, Nuel.Instr. Methods, lo3(1972;iJ5.
2. N.G.GUSEV, P.P.DMITRIJEV, Kvantovoje izluchenije radioaktivnih
nuklidov, Atomizdat, Moskva 1977.
3. P.VUKOTIC, J.Radioanal. Chem., 63 (1981) 353.
4. P.VUKOTIC, J.Radioanal. Chem., 78(1983) Io5.
5. J.HERTOGEN. J.DE DONDER , private communication.
6. F.J.FLANAGAH, Geochim. Cosmochim. Acta, 37(1973) 1189.
7. K.GOVINDARAJU, I .HOELANDTS, Geostandards Newsletter, 1(1977)163.
Count!na schepe
Table 1
Countset
Coollnntine Detector Countina tine
5 roin.Irra-diation
7 hours Irra-diation
12
3
45
15
2"5
ca.
5-6
1?.
30
mm
3h
days
davs
days
Coaxial
Planar
Coaxial
PlanarCoaxialPlanarCoaxialPlanarCoaxial
8
35
15
50
1
R
mm
rn
mh
h

"able 2.
"adionuclirfes arv* the ir T-lineR nseH £nr mianti tat ive anal".<:l<;
Padionu-clide
24Na2Vcr2 8A14 2 K47Pc(Ca)4 6 Sc5 1 Ti5 2 V5 1Cr56«n5 9 Fe6 0Co
****
Pha1 4 0La1 4 l C e147Md1 5 3 Pm152EU1 5 3 r d
1 6 0 7 b
1 6 5 D v1 6 6 Ko170Tm1 6 9Yb1 7 5 v b
1 7 7 Lu|181H f
1 8 2 Ta2 3 3 Pa(7h230Mnfr;,
naif-life2
15.005 h9.46 in2.24 n>
12.36 h3.40 d
83.8 d5.80 n3.76 m
27.73 d2.578 h
45.1 d5.272 y18.66 d
11. R d
40.22 h32.50 d10.98 d46.44 h13.2 v
241.6 d72.3 d
2.334 h27.00 h
128.6 d30.7 d
4.19 d6.71 d
42.4 d115.0 d
27.0 d?.-"55 <1
P VaVTi r. , K e ":
nsn.5, i732.n (nr>mi4.4756.7 (DE) , 177.1.71524.6159.4889.2, 1120.53 1 9
1433.9320.184G.6192.2,1099.3,1291.61173.2,1332.51076.6123.7,496.2328.8,487.0,815.8,1596.5145.491,169.7, 103.2121.8,244.7,140^.197.4,103.286.894.7 'R O . 6
84.363.1232.5
208.31 1 3 . 0 , 1 3 6 . 2 , 4 * 2 . 0
6 7 . 7 , 1 0 0 . 1 , 1 5 2 . 4 , 1 2 2 1 . •» !
94.7 (OT^j) ,9B. 4 {"!<„.,) ,111 .1
116.1
I Count «?Pt: Planar CoaxiAli detector Hetectnr| !-
J . 1 , ": ! ir
1! 4 !
j: 4 , 5 ,62 1 1
i 1 » 35 , 6 ! 5 , 6
4 i 4 ,54 , 5 , 6 '.
4 ,5 ,6
4 , 5 4 , 5
4 ,5 ,6 | 5,fi
P 15,6 :
2 1,1
46
4 ,5 ,65 4 ,^
4,5 '. 4,^
4 ,5 ,6 • 5,«
5,6 fi
4 , S O ! 4, "•.,«4'" 1
Table 3.
Spectral interferences corrected
to
RadlonuclideAnal"tical npak Interfering neak Comparator r>f>ak
F,V:e"2
5 1Cr
1 5 3R .
iss,,
160
170n
Tb
32P.1
103.2
97.4
103.2
8f .n
31".4147Tld
9n.
101.n233na
91.1 1 4 7 Nd
i 1 0 6 . 1 Z J I!n
ion .1

Table 4.
Concentrations in the silicate rocks investigated 169
2°
O
2°3
0
o
m
°2
DB'Jl
x . ( s . )
(1)
4 . 3 2 ( 0 . 0 5 )4 . 3 6 ( 0 . 0 5 )4 . 3 2 ( 0 . 0 5 )
4 . 2 ( 0 . 4 )4 . 1 ( 0 . 4 )3 . 8 ( 0 . 4 )
1 3 . 6 ( 0 . 3 )1 4 . 0 ( 0 . 3 )1 3 . 6 ( 0 . 3 )
_
1 5 . 4 ( 0 . 4 )1 6 . 1 ( 0 . 5 )1 5 . 3 ( 0 . 4 )
3 0 . 6 2 ( 0 . 1 4 )3 0 . 9 5 ( 0 . 1 4 )3 0 . 4 6 ( 0 . 1 4 )
1 . 9 3 ( 0 . 1 0 )2 . 0 9 ( 0 . 1 0 )2 . 0 2 ( 0 . 1 0 )
X
(2)
4.33
4 , 0
13.7
-
15.fi
30.68
2.01
wx l ( s i »
(3)
3.39(0.04)3.43(0.04)
3.2(0.4)3.2(0.4)
16.2(0.3)16.0(0.3)
2.0(0.3)2.3(0.4)
4.8(0.2)4.2(0.2)
17.51(0.08)17.91(0.00)
0.67(0.07)0.61(0.06)
X(4)
3.41
3 . 2
16.1
2 . 2
4 . 5
17.70
0.F4
DCM
(5)
3.27(0.04)3.31(0.04)3.24(0.04)
-
11.8(0.2)11.8(0.2)11.8(0.2)
3.3(0.4)3.5(0.5)3.4(0.4)
-
5.04(0.03)5.08(0.03)4.94^0.031
X
(6)
3.27
-
11.8
3 . 4
-
5.02
ACV-1
X i ( s i >(7)
4.19(0.05)4.23(0.05)
1.8(0.2)
17.0(0.4)
2.R(0.4)3.0(0.4)
5.3(0.2)4.7(0.2)
12.2(0.1)12.1(0.1)
0.99(0.06)
5(8)
Flana-qanri
*(9)
4.21
1 .8
17.0
2 . 9
5 . 0
12.2
0.99
4.26
1.53
17.25
2.89
4.90
13.4
1.04
r - 2
(in)
3.98(0.04)4.10(0.05)
0.9(0.2)
15.6(0.3)
4.3(0.5)4.5(0.6)
2.1(0.1)2.1(0.1)
3.5(0.1)3.5(0.1)
0.4R(0.05)
V
( 1 1 )
4 . 0 4
0 . 0
15.6
4 .4
2.1
3 . 5
0.48
f'lana-nan6
*(12)
4.07
0.76
15.40
4.51
1.94
3.7
0.50
Table 4. (continued)
r
im
!2°3
>m
>m
m
m
(1)
3 1 5 ( 7 )3 3 0 ( 7 )320(71
15(1)14(1)11(1)
1872(19)1905(19)
._§___!__
11.37(0.06)11.41(0.06)
38.6(0.3)38.9(0.3)
-
-
10.1(0.2)10.1(0.2)
24.7(0.4)24.8(0.4)24.6(0.41
(2)
322
13
1R74
11.35
38.6
-
-
10.1
24.7
(3)
105(5)99(5)
207(11)210(10)
358(10)840(10)
6.00(0.03)6.14(0.04)
18.8(0.2)18.6(0.2)
61(6)60(5)
324(12)312(13)
22.3(03)22.4(0.3)
44.9(0.6)44.5(0.6)
(4)
102
210
850
6 . 1
IB.7
60
318
22.4
44.7
(5) .
1
1 0 ( 1 ) i9(1)
97(2)102(2)
_21Lll |0 . 9 5 ( 0 . 0 1 )
0 . 9 6 ( 0 . 0 1 )
_2_2__2_2_10.75(0.02)0.76(0.02)
79(7)84(6)81151
368(24)358(12)371_12l
13.2(0.2)13.5(0.2)12.9(0. 2)
29.0(0.4)29.2(0.4)28.3(0.41
(6)
-
10
99
0.94
0.76
81
366
13.2
28.R
(7)
119(4) ',
13(1)13(1)
717(14)
6.72(0.04)6.68(0.04)
15.8(0.1)15.7(0.1)
67(6)65(5)
1237(30)1189(30)
39.4(0.5)39.2(0.5)
6R.4(1.3)66.5(1.3)
(8)
119
13
717
6.70
15.8
66
1213
39.3
67.4
(9)
125
12.2
763
6.76
14.1
67
1208
(35)
6 3
(10)
38(3)
10(1)10(1)
250(7)
(11) (171
3P 3 5 . '
IP (7)
250 ?P1
2 . 6 4 ( 0 . 0 2 ) , 2 .66 2.6C.
2 . 6 8 ( 0 . 0 2 ) ! ;
4 . 5 ( 0 . 1 )4 . 5 ( 0 . 1 )
157(14)166(12)
1898(45)lflR9(45)
8 9 . 9 ( 1 . 0 )9 1 . 4 ( 1 . 0 )
158(3)158(3)
4 . 5
16?
9 0 . 6
5 .5
—
______
96
(15l>
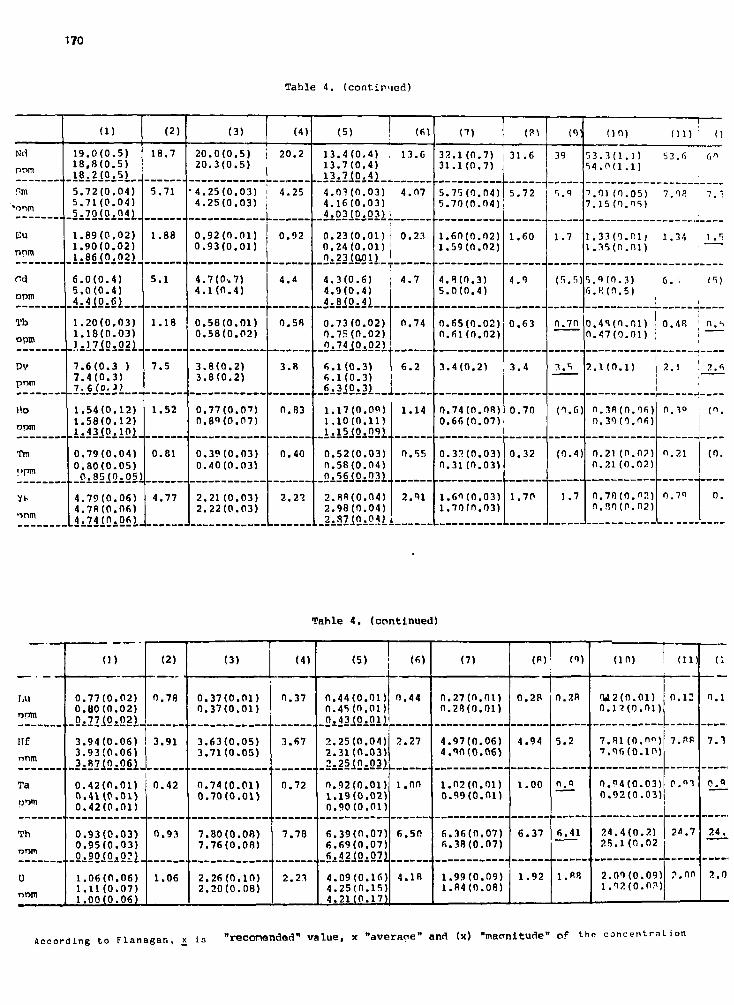
170
Table 4. (continued)
nnm
mm
Eu
nnra
Cd
opm
Tb
opm
Dvpnm
Ho
opm
Tm
191818
5.5.
-Si
1.1.1.
6.5.4.
1.1.
7.7.7.
1 .1 .1 .
0 .0 .c
( 1 )
. 0 ( 0 . 5 )
. 8 ( 0 . 5 )
. 2 ( 0 . 5 )
7 2 ( 0 . 0 4 )7 1 ( 0 . 0 4 )70(0.04)
89(0 .02)90(0 .02)86(0 .02)
0 (0 .4 )0 (0 .4 )4J0.6J.
20(0.03)18(0.03)17(0.02)
6 ( 0 . 3 )4 ( 0 . 3 )6 ( 0 . i)
5 4 ( 0 . 1 2 )5 8 ( 0 . 1 2 )4 3 ( 0 . 1 0 )
7 9 ( 0 . 0 4 )8 0 ( 0 . 0 5 ). 8 5 ( 0 . 0 5 )
4 . 7 9 ( 0 . 0 6 )4 . 7 8 ( 0 . 0 6 )4 . 7 4 ( 0 . 0 6 )
18
5 .
1 .
5 .
1 .
7 .
1 .
0 .
4 .
(2)
.7
71
88
1
18
5
52
81
77
( 3 )
2 0 . 0 ( 0 . 5 )2 0 . 3 ( 0 . 5 )
• 4 . 2 5 ( 0 . 0 3 )4 . 2 5 ( 0 . 0 3 )
0 . 9 2 ( 0 . 0 1 )0 . 9 3 ( 0 . 0 1 )
4 . 7 ( 0 . 7 )4 . 1 ( 0 . 4 )
0 . 5 8 ( 0 . 0 1 )0 . 5 8 ( 0 . 0 2 )
3 . 8 ( 0 . 2 )3 . 8 ( 0 . 2 )
0.77(0.Of)0.89(0.07)
0.39(0.03)0.40(0.03)
2 . 2 1 ( 0 . 0 3 )2 . 2 2 ( 0 . 0 3 )
20
4 .
0 .
4 .
0 .
3 .
0 .
0 .
2 .
(4)
. 2
25
92
4
58
8
83
40
(5)
1 3 . 4 ( 0 . 4 )1 3 . 7 ( 0 . 4 )1 3 . 7 ( 0 . 4 2
4 . 0 3 ( 0 . 0 3 )4 . 1 6 ( 0 . 0 3 )4 . 0 3 ( 0 . 0 3 )
0 . 2 3 ( 0 . 0 1 )0 . 2 4 ( 0 . 0 1 )0 .23(0 ,01)
4 . 3 ( 0 . 6 )4 . 9 ( 0 . 4 )4.810.42
0.73(0.02)0.75(0.02)0.74j0.02)j
6.1(0.3)
1.17(0.09)1.10(0.11)
._Iii§J2i22L0.52(0.03)0.58(0.04)O.56JO.O32
2.88(0.04)2.98(0.04)2.87J0.04)
13
4 .
0 .
4 .
0 .
6 .
1 .
0 .
2 .
(6 )
.6
07
23
7
74
2
14
55
91
( 7 )
3 2 . 1 ( 0 . 7 )3 1 . 1 ( 0 . 7 )
5 . 7 5 ( 0 . 0 4 )5 . 7 0 ( 0 . 0 4 )
1 . 6 0 ( 0 . 0 2 )1 . 5 9 ( 0 . 0 2 )
4 . 8 ( 0 . 3 )5 . 0 ( 0 . 4 )
0.65(0.02)0.61 (0.02)
3.4(0.2)
0.74(0.08)0.66(0.07)
0.32(0.03)0.31(0.03)
1.69(0.03)1.70(0.03)
31.6
5.72
1.60
4 . 9
0 . 6 3
3 . 4
0 .70
0 . 3 2
1 . 7 0
39
•5.9
1 . 7
( S . S )
0.70
(O.fi)
(0.4)
1 . 7
( i n )
5 3 . 1 ( 1 . 1 )5 4 . 0 ( 1 . 1 )
•?.0] ( 0 . 0 5 )7 . 1 5 ( 0 . 0 5 )
1 . 3 3 ( 0 . 0 1 ;1 . 3 5 ( 0 . 0 1 )
5 . 9 ( 0 . 3 )6 . R ( 0 . 5 )
0 . 4 1 ( 0 . 0 1 )0 . 4 7 ( 0 . 0 1 )
2 . 1 ( 0 . 1 )
0 . 3 8 ( 0 . 0 6 )0 . 3 9 ( 0 . 0 6 )
0 .21 ( 0 . 0 ? )0 . 2 1 ( 0 . 0 2 )
0.7(1(0.0?.)0 . 8 0 ( 0 . 0 2 )
(11)
5 3 .6
7.T3
! . , «
6 . ;
0.4B
2 . 1
0 . 1°
0 . 2 1
0 .7"
Cp"
7.1:
1 ."i
o.s
( 0 .
( 0 .
0 .
Tahle 4. (continued)
r.u
nnm
Ta
Th
nnm
U
nnm
0 )
0 . 7 7 ( 0 . 0 2 )0 . B 0 ( 0 . 0 2 )
3 . 9 4 ( 0 . 0 6 )3 . 9 3 ( 0 . 0 6 )
0 . 4 2 ( 0 . 0 1 )0 . 4 1 ( 0 . 0 1 )0 . 4 2 ( 0 . 0 1 )
0 . 9 3 ( 0 . 0 3 )0 . 9 5 ( 0 . 0 3 )
1 . 0 6 ( 0 . 0 6 )1 . 1 1 ( 0 . 0 7 )1 . 0 0 ( 0 . 0 6 )
0
3
0
0
1
(2)
.78
.91
.42
.93
.06
(3)
0 .37(0 .01)0 .37(0 .01)
3 .63(0 .05)3 .71(0 .05)
0 .74(0 .01)0 .70(0 .01)
7 .80(0 .08)7 .76(0 .08)
2 .26(0 .10)2 .20(0 .08)
0 .
3 .
0 .
7 .
2 .
(4)
37
67
72
78
23
(5)
0 .44(0 .01)0 .45(0 .01)
_0 i43J0 iO12
2.25(0.04)2 .31(0 .03)
0 .92(0 .01)1.19(0.02)0 .90(0 .01)
6 .39(0 .07)6 .69(0 .07)6.42J0.071
4.09(0 .16)4 .25(0 .15)4 .21(0 .17)
0
2
1
6
4
CM
.44
.27
. 0 0
. 5 0
. 1 8
(7)
0 .27(0 .01)0 .28(0 .01)
4.97(0.06)4 .90(0 .06)
1.02(0.01)0.99(0.01)
6 .36(0 .07)6 .38(0 .07)
1.99(0.09)1.84(0.08)
0
4
1
6
1
(R)
• 2R
.94
.00
.37
.92
0
5
0
6
1
(9)
.2R
.2
. 0
.41
.88
(10)
OA2(0 .01)0 . 1 3 ( 0 . 0 1 )
7
00
8 1 ( 0 . 0 « )9 6 ( 0 . 1 0 )
9 4 ( 0 . 0 3 )9 2 ( 0 . 0 3 )
2 4 . 4 ( 0 . 2 )2 5 . 1 ( 0 . 0 2
21
. 0 1 ( 0 . 0 9 )
.12(0 .0?*)
( U )
o . i :
7.HP
P.«1
2 4 . 7
? .00
c
0 . 1
7 .T
—
24.
2 .0
According t o F l a n a g a n , x i s " r e c o n e n d e d " v a l u e , x " a v e r a g e " and (x) " m a m i t u d e " o f the c o n c e n t r a t i o n

DITERMIHATION OF IRACB ELEMENTS IN FLT GOAL ASH(INO, IOP, BOH HIFBBBNOB MATERIALS)
Maria S&l&gean, Ana FantelioftInstitute for Physios and nuclear EngineeringBuoharest MG-6, BomaniaAbstractt Oonoentration of 32 elements in three reference
materials is determined
INTRODUCTIONThis work presents the work regarding an intercomparison organised by the
Institute of Radioeoology and Applied Nuclear Techniques from Eolice - Czecho-slovakia. By using the instrumental neutron activation analysis method the ma-terials of fly-ashes character from ooal-ftrad power plants was analysed. Anumber of 34 laboratories from 11 oountries have participated at this inter-ooaparison.
IXFBRI MENTALThe concentration of Ba, Oa, Ce, Co, Or, Os, la. Fe, Hf, La, Lu, NA, Bb,
Sb, So. Sm, Sr. Ta, Tb, Zh, U, Ib, Znf Zr was determined after a long irradia-tion (50 hours) of the samples in a thermal neutron flux of l l l o HTh s m l e s (v 100 i iht) d S i l 5 S L 1 GSP1
(5 ) a p ter euton f u of l.lxlom/one.sThe samples (<v 100 mg in weight) and Soil-5, SL-1, GSP-1 as standards, weremeasured 2-5 hours after a decay times of 10-30 days. Concentration of Al, Astlu, K, Mm, Ha. Sm, Ti, V, Dy was obtained after a short irradiation of 1 min.in a 10l2n/om2.s. flux, ff-1 and arsenic oxyde ware used as standards. After 6min.- 24 hours oooling time the samples and standards were measured for 100 -1800 s., by using a Ge(Id) deteotor with 2 koV resolution.
BI8UX0S AMD DISCUSSIONThe oontent of elements determined in this way are presented in table 1,
2, 3. for INO, 10F and 10H respectively. A, B class of results denotes theoertlfled values with satisfactory or acceptable degree of confidence respec-tively* Non reoommended values are denoted by 0* Our values are obtained SBarithmetic average from four Independent determinations. The standard devia-tion is given. Our results are in a good enough agreement with the oertifiedvalues.
Only for Zn in INO material our value was rejected from the overall meanoaloulated. As there can be observed, a large oontent of arsenlum is present inthe INO material.
Our values for U concentration are systematically lower than the certifiedvalues. We have to oheok our method in analysing this element.
For lu. Lu, Na, So in the I0F material our standard deviation is verysmall i.e. the four values obtained for each element being very dose. Also asone oan see our value for the Na oonoentration in the I0P material is higherthan the oertified value. W* would suspect a small contamination in our mea-surements for this material.
TABLB 1 - BNO
Element "oncentration confidence limits Our results SesSts*0 1 2 3 4
10.5 - 11*3 11.0 • 0.7 A1680 - 1900 1643 + 3 7 B630 - 717 690 + 78 A2.96 - 3.72 2.50 + 0.05 A93.2 - 104 92.5 + 1.5 B24.9 - 27.4 27.7 + 0.6 B88.0 - 104 92.3 + 0.8 A110 - 126 122 • 0.8 A
7.52 S 0.27 01.41 - 2,11 1.77 + 0.09 A7.23 - 7.70 7.9* + 0.04 A4.64 - 5.14 4.46 ± 0.28 B
Al(Jl)AsBa0a(%)Oa00OrOaDyBuFe(J6)Hf
10.917906743.3*98.726.196.1118
7.021.767.464.89

172
0
K(%)
LaLuHnNa(%)NdRbSbSoSm3rTaTbThTi(JOU7TbZnZr
Blamant
0
• 1 0 0ASBaOaOOOaOoCrOsDyBu
Hf
K(JOLa
LuHnNa(*)NdRbSb
1
1.7342.90.54634
0.5456". 1149
5.7220.79.45283
1.221.2515.30.467.29
1913.49
149222
Oonoantration(ppm)
1
15.879.111001.68322
53.2183
20.110.84.995.1617.70.64
164
0.51440
0.37141
69.01.94
2
1.67 -39.7 -0.50 -607 -
0.52 -
141 -3.68 -18.7 -8.33 -262 -
1.17 -
13.7 -0.42 -6.13 -
179 -3.14 -141 -170 -
TABU 2
1.7846.10.596610.57
1577.7622.810.63041.27
16.90.498.452033.84157274
- 10P
Oonfidanoa limits
2
14.5 -72.4 -1050 -1.43 -301 -
51.5 -172 -
18.4 -
4.22 -4.96 •16.5 -0.62 •155 •0.47 •409 '
0.32 •
59.3 •1 . 8 1 •
17.0•85.7, U60• 1.93- 343• 55.0• 195-21.7
•5.77•5.36• 18.9- 0.67• 173- 0.55- 470- 0.41
• 78.6- 2.07
3
1.64 + 0.0649.1 + 0.80,57 + 0.02628 + 11
0.54 + 0.0140.5 + 7.6
163 + 154.49 + °»3521.3 + 0.18.85 ± 0.18345 + 17
1.20 + 0.021.47 + 0.1915.7 + 0.20.51 + 0.083.96 + 1.14193 + 7
2.85 + 0.10203 + 13246 + 33
Our rasuits
3
16.6 +0.377.0 • 3.71202 4 1041.83 + 0.13306 + 1
56.7 + 0.5188+2
22.5 + 0.39.8 + 0.1
5.20 + 0.005.55 + 0.0416.3 + 0.40.60 + 0.01170 + 2
0.52 + o.oo451 ± 16
0.55 + 0.00146 + 15
94.7 + 3.32.15 + 0.36
4
ABBAACABAaAB0BABABAB
Glass ofrasults
4
AAABAAAA0AABAABAB0AB
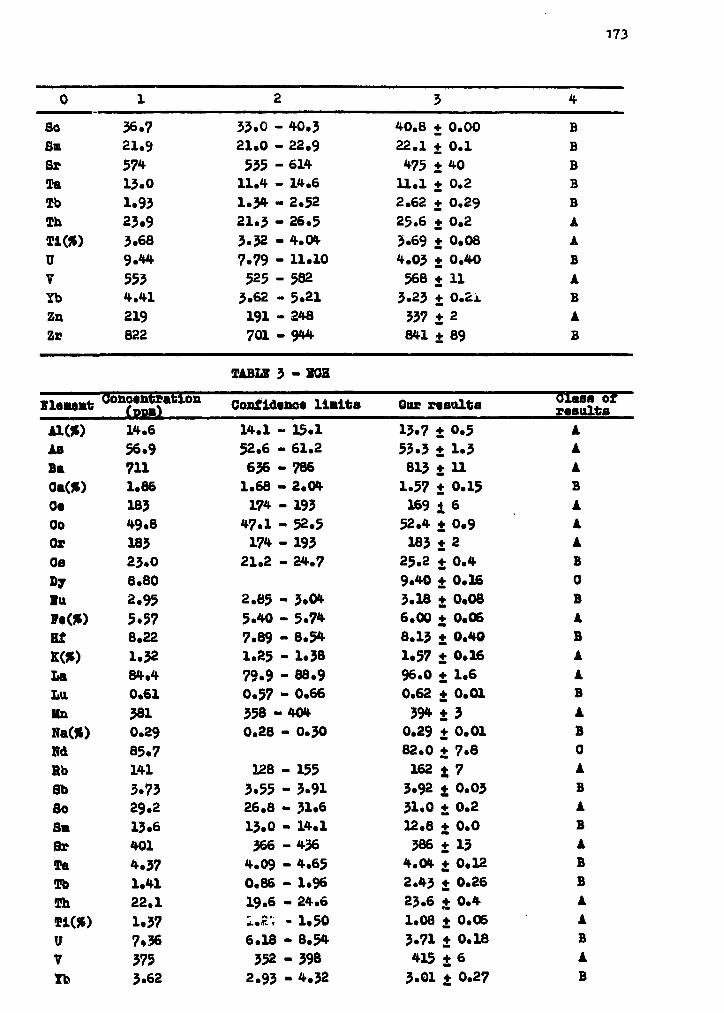
173
0
Sc6mSrTaTbThTl(ff)0VYbZnZr
Ilaaaat G
1
36.721.957413.01.9323.93.689.445534.41219822
lonoantratio
2
33.0 - 40.321.0 - 22.9
535 - 61411.4 - 14.61.34 - 2.5221.3 - 26.53.32 - 4.047.79 - 11*10525 - 582
3.62 - 5.21191 - 248701 - 944
TABLE 3 - XOH
n Coaftdaaoa l imits
3
40,8 + 0.0022.1 + 0.1475 + 40
11.1 + 0.22.62 + 0,2925,6 + 0.23.69 + 0.084.03 + 0.40
568 + 113*23 + 0.2x
337 + 2841 + 89
Our results
4
BBBBBAABABAB
SiIStar
Al(%)ASBaOa(»)OaOoOrOaDyl u' • (%)E£E(%)
LaLuUnNaOf)RdRbSbSoSmSrTaTbThTi(%)UVtb
14.656.97111.8618349.818323*08.802.955.578.221.3284.40.613810.29B5.71413.7329*213.64014.371.4122.11.377*363753.62
14.152.6636
1.68174
47.1174
21.2
2.855*407.891.2579.90.57358 •0.28
1283.5526.813.0
3664.090.8619.6l.£'i6.18
3522.93
- 15.1- 6 1 . 2-786- 2.0*- 193- 5 2 . 5- 193- 24.7
- 3.0*- 5.74- 8 . 5 4- 1.38- 88.9- 0.66. 40*- 0*30
- 155- 3.91- 31*6- 14.1-436- 4 . 6 5- 1.96- 24.6- 1.50- 8.54- 3 9 8- 4 . 3 2
13.7 + 0.553.3 • 1.3813 + 11
1.57 • 0.15169 i 6
52.4 + 0.9183 + 2
25.2 + 0.49.40 + O.lfi3.18 + 0.086.00 + 0.068.13 i 0.401.57 + 0.1696.0 + 1.60.62 + 0.01
394 • 30.29 + 0.0182.0 + 7.8
162 + 73.92 + 0.0331.0 ± 0.212.8 ± 0.03B6 • 13
4.0* ± 0.122.43 + 0.2623.6 + 0.41.08 + 0.063.71 + 0.18415 ± 6
3.01 + 0.27
AAABAAAB0BABAABAB0ABABABBAABAB

174
0
ZaZr
1
251361
233291
2
- 269- 430
299497
3
+ 36+ 77
4
BA
URANIUM OQMBHT M1ASUHIMI1ITS OR U-PH0SFHAT1 OBIS
Maria S&lfigean, Asa Paatelloft, Stafanla SplridonInstitute for Phyalos aad ffuolear EngineeringBucharest MQ-6, RomaniaAbatraoti Ooaoeatratlon of uramlua In 8-171 S-18 aad 8-19
rafaraaoa aatorlala haa baan dataralaad ualng theaeutroa aotivation analysia
UKEBODUOTIONThe aaalytioal quality Ooatrol Sarvloa of IAIA haa orgaalaed this lnter-
ooapariaoa oa thraa Braalllaa uraalua phoaphata oraa eoataialag a low, a u -dlua aad a larga ooaoaatratlon of uraalua S-17t S-18 aad 8-19 raapaotlvaly)la ordar to eartlfy thaaa aatarlala aa rafaraaoa aatariala aad alao to provideaa opportunity to tha participating laboratories to ooapara their aaalytloalaathodi aad reaulta with tha othera. A auaber of 24 laboratorlea froa 19 ooua-.trlaa have participated la thla latarooaparlaoa. 19 % froa the reaulta uaadtha neutron aotlvatloa aaalyala aethod.
IXP1RIMIVZALValag the theraal neutron aotlvatlon aaalyala four Independent detaralna-
tloaa far eaoh of tha three typoa of aaaplea have baaa perforaed by our labo-
Ihe aaaplea with <^ 150 as la weight and uraalua aoatate (aqueoua aolution)aa a ataadard. have baaa Irradiated 10 hours la a LlxloJ-Wca^.e. flux aadaeaaurad for 1-2 houra after 6-7 days deoay time by using a Ge(Li) dataetorhaving 2 keV reaolution.
BISULfS AHD DISCUSSIONIn the tabla tha oonoentration of uranium In the IAJA/B-17. 8-18 aad 8-19
phasphate urriiua oraa la presented and oan be recommended with a satisfactorydegree of confidence.
Material 0 < m(J5£ r a t l o a Oonfidenoe Intervale Our results
8-1? 370 360 - 390 3 8 4 + 4S-18 770 750 - 790 791 + 68-19 2280 2210 - 2390 2388 + 17
Our reBUlts are within of the oonf Idenoe limits given by IAIA after theevaluation of all tha received results.

175
DETERMINATION OF URANIUM AND THORIUM CONTENT IN ROCKS,BY BPITHERMAL NEUTRON AOTIVATION ANALYSIS
Lucrefcia Dinescu, Oarmen PlamadaInstitute for Physios and Nuclear EngineeringBucharest UG-6, RomaniaAbstract! The epithernal neutron activation followed by gamma -
apeotrometry measurements is used for samples with high Th/U ratios or highrare earth contents* The results of the IAEA intercomparison for S-14, 8-15,S-16 samples are given.
INTRODUCTIONThe determination of the uranium and thorium in rooks is of interest in
prospecting analyses and in more fundamental geochemioal studies. Thermal neu-tron aotivafion analysesf based on Ga(Li) gamma-ape otroma try provides adequatesensitivity for thorium in most oases when the aotivity measurements are car-ried on at least two weeks after the irradiation. The sensitivity of uraniumdetermination by this technique is satisfactory for equilibrated Th/U ratiosand low rare earth contents in sample analysed. When the Th/U ratio is increa-sed, the sensitivity of uranium determination is less satisfactory. The acti-vation with epithermal neutrons, using a cadmium cover to eliminate the ther-mal neutrons, gives rise to a considerable improvement in sensitivity for bothelements, and especially for uranium, as can be seen from table 1.
TABLE 1Nuclear data for uranium and thorium
Radionudid
238-U232-Th
barn
2.72+0.037.4+0.1
Iobarn
267+588+3
1.29+0.0143.41+0.08
EXPERIMENTAL
Product
239-Np233-Pa
d
2.3627.0
Used peafcskeV
228 | 278
311
Powder samples of 0.100 - 0*250 g were weighed in small plastlo bags andthe bags were heat sealed. Xaohtag was wrapped in aluminium foil. Rook samples,toghether with standards (prepared in the same way) were paoked in a 1 mm thiokoadmium box and irradiated for two hours in a 1.4xlOl3n/oB?.s. flux. Measure-ments have been carried out with a Ge(Li)-deteotor and the ND-6620 acquisitionand processing system, after 6 days of cooling time for uranium, and 20 daysfor thorium.
Measuring time i 1000 - 4200 s.Standards used i the IAEA 8-12 (UxOa t 0*014 %) for uranium, and a stan-
dard of 0.99 % Th from Soviet Union for thorium.RESULTS AND DISCUSSION
Five uranium rook samples with a high content of rare earths have beenirradiated without and with a oadmium oover. The results have been comparedwith these obtained by delayed neutron analysis, that is considered the mostsensitive method. Table 2 shows that the results obtained by ENAA are betterthan those obtained by INAA,
TABLE 2
o O B n l, Delayed neutron INAA ENAA
Alh.*3*4h
702102604152245
551742233482082
662142643902256
Another possibility to check the validity of our results was to partici-

176
pata to the IAEA. Intarcomparison. In table 3 our results are given elong withthe average established by IAEA, for three thorium ore samples 8-14, S-15,S-16, having a difficult matrix to analyse t high ratio Th/U (about 40 for8-19, S-16 and about 20 for 8-14) and high rare earths content.
TABLE 3
Concentrations of thorium and uranium in samples t S-14, 8-15) 8-16
•lament Units Sample IPIHconcentration
IAEA
Concentration Confidence limits
S-14 0,036 + 0.002Th Wt % S-15 0,356 + 0.006
8-16 1.641 + 0.025
0.0610.36?1.680
0.057 - 0.0660.351 - 0.3741.620 - 1.750
jug/g8-14S-15S-16
24.1 + 2.0
76.5 • 3.1454.3 + 8.0
2985445
26 - 31
79 - 89427 - 468
The confidence limits are established for a significance level of 0.05.Table 3 speaks by itself on the validity of our BNAA method.

177
ACTIVATION ANALYSIS OF INDIUM USED AS TBAOTE IN HXDROGBOLOGY
S.F. Stenescu, O.M. PfiroaBiu, S. Gaspar, Stefanla SpiridonIns t i tu te for Physics and Nuclear EngineeringBucharest MG-6, RomaniaV.M. Nazarov, M.V. FrontaeievaJoint Ins t i tu te for Nuclear ResearohDubna, U.S.S.R.
INTRODUCTIONFrom the aotivation analysis point of view, indiun has a series of pro-
perties enabling a great improvement in the analysis sensitivity* the isotope115-In has a high isotopio abundance f a high value of the neutron aotivationcross aeotion (155 bn) and the 116m-In isomer formed by aotivation is associa-ted with gamma radiations and has a oonvenable long half-time (54 mln.). Whenindium neutron aotivation analysis is preceded by a ohemioal-sre concentration(by oopreoipitation, for instance) a detection limit of lO^g/om? in the wa-ter samples may be obtained.
Prom the hydrogeologioal point of view, indium is an element rarely en-oountered in natural waters, in small concentrations is not toxic and underthe form of In-IDTA complex has a great ohemical stability. In this respect,indium oan successfully be used as a tracer In the hydrogeological studies.
1XPBRIHBNIALSample preparation and measurement methodStarting with the results obtained by the german researcher* in the use
of indium as a tracer /l/» an improved method of indium analysis has been ela-borated and applied in the hydro-karstic studies /2/«
The water sampling has been carried on in 250 - 750 ml polyethylene bot-tles* The water samples were transported to the laboratory where indium waspreoonoentrated by oopreoipitation with BiOE by the following procedure 1
- at 100 ml water sample 1 ml HpSQj. cone, and 2 ml Bi solution (10.7 gbasio bismuth oarbonat dissolved in a mixture of 150 ml HNOx with 350 ml a>0and then diluted to 1000 ml) were added} *
- after 1 h, 7 ml NH^OH (25 *) was added;- the preoipitate thus formed, was filtrated through a nuclear membrane
filter (holes diameter of 0.8 am) with a roughing pump and dried to ambienttemperature 1
- the dried preoipitate was detaohed from the filter and was introducedinto a polyethylene vial*
In addition to the one presented in the paper /I/, the method used herehas the following advantages 1 the method is simpler, the samples do not oon-tain the filter, and arc small in volume*
5 to 10 samples were at onoe Irradiated with a standard sample.(contai-ning about 15 ag In) 1A the nuolear reaotor at a neutron flux of lO^n/ooF.s.with the aid of an air rabbit* After an irradiation time of 20 - 60 minutesand a decay time of 15 minutes, the samples were measured with a Ge(Li) detec-tor having FWHM a 2.5 keV at 1332.5 keV and a multichannel analyser in 5 - 10minuteB measuring time, quantitative determinations have been performed by cal-culating the areas of the 417*0 keV photopeak of the 116m-In isomer.
In some conditions a detection threshold of 1.10-l2g/cm? for the indiumin the natural waters was obtained.
The samples measuring error was below 10 %, according to In concentrationin samples, number of samples simultaneously irradiated and radiation back-ground givs£ by the other radioisotopes.
In fig.l the gamma-ray spectrum for a sample of 1.10-l°g/em3 indium con-centration is presented.
RESULTS AND DISCUSSIONPractical applicationsThe activation analysis of indium from natural waters was suooessfully ap-
plied during the last three years in a series cf hydrological studies of somekarstic structures from Romania /3-5/» About 2500 samples obtained from 18 wa-ter labelling* have been analyzed. The water flow rate values laid between 0.05and 2.7 m3/s and transit time values were from 30 h to 200 days. The quantityof indium used for a labelling was oaloulated function of the emergences flowrate value and the estimated transit time and varied from 1 to 100 g.
In fig.2 and 3 as an example two obtained water transfer ourves are pre-sented*

178
15 POO
N/counts'Whonnel
10.000
5.000
846.6keV
U 9Nd211.3keV
139165JBkeV 2 116mIn
417.0keV
•*«4KLitf
116mIn
116mIn i293.4keV1097.1 keV I
38 Cl
i368.5keV5 6 M n
1811,2 keV
.,._l,,,,_j,_,....Channel number 2048
Fig. 1
t(d)
In fig.2 the obtained water transfer curve in the labelling with 100 gof indium of the sinkhole SOOROTA and followed by the water sampling fromOERHA spring having an average flow rate of 2.7 mVs, are presented. We haveobtained a transit time of 12 days.
In the second experiment (fig.3) the water sampling was carried out onthe TOPLITZA DB VIOA spring having an average flow rate of 0.075 mVs. Thelabelling was made In the sinkhole BIOHII with 10 g indium in the complexcompound In-BDTA. A long water transit time of 40 days was obtained.
From the interpretation of water transfer curves obtained by Indium la-belling, dates of a great importance about the karstic configuration of theinvestigated zones in mine and hydroteohnical works were obtained.
CONCLUSIONSThe aotivation analysis of indium in water samples combined with the pre-
conoentration by copreolpitation proved to be an useful method in the UBS ofindium as tracer in hydrogeological studies.

179
120
Fig. 3
REFERENCES
150 200t l d )
Besides the useof the fluorescentdyes and radioactiveisotopes the use ofIn-EDTA as tracerproved to be a com-plementary method inthe simultaneous l a -belling and preferen-t i a l l y to use in theease of the greatwater flow rate andlong transit timeswhen the use of an-other tracers i s dif-f icult or impossible.
The cost of thetracer and measuringact ivit ies i s compa-rable with that in-volved by radioacti-ve tracers, even theworking proceduresare a bit more trou-blesome.
on
/ ! / H. Eehrens, H, Uoser, B. Wildner, J. Radioanal. Ohem., 38(1977) 491/ 2 / S.P. Stanesou, E. Gaspar, S. Spiridon, O.M. Farcasiu, R. Gatilina,
Preprint IOEFIZ, HP 24 - Deoembrie 1982/ 3 / S. Gaspar, O.M. Ffircasiu, 8.P. Stanesou, 8. Spiridon, Proc. First Symp.
Theoretioal and Applied EarBtology, Buoharest 22-24 Aoril 1983/ 4 / 0. F&roaeiu, E. Gaspar, S.P. Stanescu, S. Spiridon, Proc. 2-nd National
Symp. on Methods, Models and Techniques in Physios and Related Fields,Olud-Napooa, 14-15 Oct. 1983B* Gaspar, S.P« Stanescu, I* Or&seanu, 0. Farcasiu, S. Spiridon, Proc.2-nd Symp. on Theoretioal and Applied Karstology, Bucharest, 1-3 June 1984.

180
DATA ON THE REE, Th AND Hf - COVTENT IN /OLC.WIC
ROCKS FROM CENTRAL CUBA
I.Iordanov, D.TchounevGeolog ica l I n s t i t u t e , Bulgarian Academy of Sc iences"Acad. G.Boncev s t r . " , b l . 2k, 1113 Sof ia , Bulgaria
INTRODUCTION
The i n v e s t i g a t i o n of some authors / I , 2 / shows that the Cretec ious v o l c a n i c s inCentral Cuba a m developed as an i s land arc system.
In the volcano-sedimentary complex from t h i s region two l i t h o s t r a t i g r a p h i cgroups are d i s t i n g u i s h e d : the lower one - b u i l t up from v o l c a n i c f lysh and synchro-nously deep see low-K-&leal ine volcanism; the upper - presented by volcanic molas -s e s , accompaned mainly by subaer ia l volcanism, which i s evolved from intermediateto acidic.
For petrographical description the rocks from Central Cuba are subdivided ac-cording to their SiO2 -content / 3 / into three groups;
- basic rocks - basaltstholeiltic and trachybasalts, composed by pheuocrystsof plagioclase,pyroxene, olivine and amphibole. The groundmass of the rocks is de-termined as kryptomere to finegrained;
- intermediate rocks - andesite basalts, trachyandesite basalts, andesites,trachyandesites and trachytes;
- acidic - dacites, rhyodacitus and rhyolites, which represents the final stageof volcanic activity in Central Cuba.
In this study we present additional geochemical data on the behaivior of theREE, Th and Hf in the rocks from the region mentioned above.
EXPERIMENTAL
Seventy one samples from basa l t s t h o l e i i t i c (Bth ) , t ruchybasa l t s (TB), a n d e s i t eb a s a l t s (AB) . trachyandes i te b a s a l t s (TAB), a n d e s i t e s (A) , t r a c h y t e a n d e s i t e s (TA),trachytes (T) and r h y o l i t e s in Central Cuba are analyzed. La, Ce, Nd, Sin, I5u, Tb,Yb, Lu, Th and Hf-content o f the rocks are determined by INAA. The samples were i r -radiated for 13 h by neutron f lux of 1,6X10*-^ n/sm2 sec in experimental reactorIRT-2000, S o f i a . For the meaauremnts a G e ( L i ) - d e t e c t o r with k9 sin a c t i v e volumeand 2 , 3 keV r e s o l u t i o n ( a t 1332 kev of Co-60) was used, i sample USGS-AGV-l was em-
ruble I Average trace element content of rocks fromCentral Cuba
Bosoltstholeiltic (121
TrQChybQSQltS (24)
Andeslte bosaits (6)
frachyandesite basalfsQ
Andesltes IS)
Trachyteandesites (14)
Trachytes
Rhyoleles (71
Lo
B.I
qs
10,6
"2,2
14,8
18,1
32,4
34,5
Ce
19.8
2$
16.4
5.0
225
1.8
525
B,7
Nd
12
15
14
19
22
18
17
25
Sm
SP
8.1
5,6
6,3
8,4
8,5
8,5
Eu
1.1
1,3
1.0
1.3
1.4
1,1
13
043
Tb
0,4
05
Q5
1,2
Q6
0,5
1.2
1,4
Vb
2,2
2.3
2.2
2.4
2,8
2,6
4,0
3,7
Lu
OP
*°H55
•[45
073
063
LaVb
2.4
3P
3.1
3,4
3,5
4,7
53
9,3
Th
0,8
1.6
1.8
2.1
3,1
2.9
4,8
4,3
Hf
2,0
1.7
2,5
2,0
33
3.3
3.0
K
5500
16100
12300
28000
18600
27100
52900
26500
Ti
4500
4300
3300
2640
3500
2800
2160
2070

181
oloyed ns reference . The r e s u l t s given in Table I present :nean values of elementsiletermined for each type of the rocks inves t i ga t ed .
RESULTS AND DISCUSSIONThe chemical composition of the analysed rocks varies from low-K-thole i i tes
to high K-volcanics , which i s c o n s i s -tent with the ir developnwnt in a ma-tured island arc /k/. with increasingK- and decreasing Ti-contents (Table!)from basic to a c i d i c rocks in thecomplex, increased a l s o the £REE(due to the LREE-enrichment mainly),Th and Hf-contents.
For the two f i r s t members of thesequence ( b a s a l t s t h o l e i i t i c and tra-chybasalts) the chondrite-normalizedREE-pattern v'Fig. I) i s characterizedwith s l i ght LREE-enrichment and abse.i-ce of negative Eu-anomaly in
Fig . I Chondrite-normalized REE-patternsin b a s a l t s t h o l e i i t i c (BTh) andtrachybasalts (TB).
La Ce Nd Yb Lu
La Ce Yb Lu
. 2 Chondrite-normalized REE-patterns inanilesite basalts (AB) , trachyandesitebasalts (TAB).
Lo Ce Nd Sm Eu Tb Yb Lu
Fig.3 Chomlrite-normalized RKE-pat ternsin trachyainieaites (TA) and ande-sites ( A ) .
Fig.'* Chondrite-normalized REE-pat-terns in trachytes ( T ) andrhyolites ( R ) .
the tholeiitic basalts from the com-plex. A slight negative Eu-anomalyis pronounced in trachybasalts. TheLREE-enrichment and the negative Eu-anomaly become more expressed in thelater members of this sequence: ande-s i te basalts and trachyandesite ba-salts (Fig.2); andesites and trachynn-desites (Fig.3); trachytes and rhyo-Lites (Fig.k). In the same way increa-ses;the(La/Yb) -ratio from 2,U in ba-saltstholeiititc to 5,3 in trachytesand 9,3 i» rhyolites. The last oneshave the strongest negative Eu-anoma-ly, the most expressed LREE-enrich-
Lo Ce Nd Sm Ei Yb Lu

182
ment and the highest ITREE in the complex. A.t the same time a r e l a t i v e HREE-enrich-ment i s observed.
The c h a r a c t e r i s t i c s of REE,Th and Hf for the rocks from Central Cuba discuss;-,iabove are s imi lar to the analougous rocks from Grenada, Lesser A n t i l l e s / 5 / .
CONCLUSION
The presented data for the behaivior o f REE, Th and Hf in the volcanics fromCentral Cuba are in support of the suggest ion of other authors / I , 2 / for t h e i r development in i s land arc system with erupt ion of b a s a l t i c lavas in deep see condi -t i o n s . The evolut ion continued with formation of molasses in shallows condit ionrinii a c f d i c lavas in suhaer ia l environment.
REFERENCES
/1/M. I turra lde-Vinent , D. Tohnunev, R. Cabrera, Repport, I n s t i t u t o de Geologiay pa l eonto log ia , 4cademia de Ciencias de Cuba, ( 1 9 S I ) .
/ 2 / B . Echevaria, F. Talavera, D. Tchounev, I . iordanov, Repport, I n s t i t u t o de Geo-lofjia y Pa leonto log ia , Academia de Cienc ias <ie Cuba, (19>14'4).
/ 3 /O .A . Bogatikov, B . I . Gonshakova, C.B. Efremova, M, "Nedra", ( ifjSl) , l66pp/ '» /D.J . Whitford, J.A. N i c h o l l s , S.R. Taylor , Contrib. Mineral , p e t r o l . , ( 1 9 7 9 ) ,
70 , 3^1./ 5 / J .R. 4rculus , Geol . SOC ton. B u l l . , ( 1 9 7 6 ) , 8 7 , 612.

183
THE DETERMINATION OF THE SILVER CONTENT IN SOME ANCIENTCOINS BY USING AN Am-Be NEUTRON SOURCE
C.Coama.T.Fiat.V.Znamirovschi
Department of Physics ,Univers i ty of Cluj-Napoca,RomaniaL.Daraban.V.Morariu
I n s t i t u t e for I so topio and Molecular Technology,Cluj-IJapoca, RomaniaDoina Boro?,D.Alicu
The History Museum of Transilvania.Cluj-Napoca,Romania
INTRODUCTIONThe i n v e s t i g a t i o n of the valuable metals of ancient co ins , jewel lery or
others i s useful for the purpose of gaining information on the economicalstatus of a determinated historical period /1 -5 / .
The ancient coins have a high historical and art ist ical value thereforetheir analyais should be performed by non destructive methods of analysis. Theuse of the surface analysis has a limited value as the coins may suffer elec-trochemical corrosion in time /5/« This phenomenon will result in noble metalsenrichment of the surface.
In the present paper the silver content of 40 Roman and Greek coins issuedbefore and after the Roman conquest Dacia have been determined.
EXPERIMENTAL METHODThe s t a n d a r d ma te r i a l and the coins have been i r r a d i a t e d in s i m i l a r con-
d i t i o n s in a the rmal neutron f l u x from Am-Be source ( -10 n / s ) by us ing a de -vice which ensures an Identical geometry for the irradiations / 6 / .
The pure silver standard had a similar weight and shape with the analysedcoins. The irradiated samples have been analysed by using a monocannel spectro-meter with a scinti l lator crystal Nal(Tl) having a relatively large size(45x40 mm). The spectrometer calibration was made by using the 662 keV energyof ^ C s as well as the 295 keV, 352 keV and 609 keV energies of pitchblende/!/. The coins were set on the entrance window of the crystal, in the centerof i t , the maximum measuring geometry being about 2lf.
The measurements were performed with the help of a scintillation probetype VA-5-968 placed in a lead castle type VA-H-161 in order to decrease thebackground of the detector. The concentration, expressed in weight percent wascalculated in the following way:
m. I -F
where m is the standard ma te r i a l weight (2.036 g ) , m is the coin weight(1.7-4 g ) , I m i s the pulse number counted in the presence of the coin withinthe 550 - 720 keV energy range, I_ i s the pulse number counted wi th in the sameenergy range in the preaence of the standard m a t e r i a l , F i s the backgroundpulse number wi th in the same time and energy range .
The 550 - 720 keV energy range was se lec ted be cause two of the maingamma energies of s i l v e r are loca ted within t h i s range for thermal neutron ac -t i v a t i o n namely 620 keV (108Ag) and 660 keV (110Ag) / B / .
The above energy range was se lec ted in order to avoid in te r fe rence withthe 511 keV peak of Cu which i s a l so contained in the coins / 9 / . The 4J0 keVpeak of Ag was neglected for the same reason.

184
The measurements were performed in the following way: 2 minutes for the
irradiation time, 20 aec. for the cooling time and 1 minute for the measuring
time. The ratio of the counting rate for the standard material and the back-
ground was 2.5.
RESULTS AND DISCUSSION
The silver oontent of the 38 Roman and 2 Greek coins /10/ were included in
table 1. The experimental errors about 5% for concentrations higher than about
5O5S and increasingly higher for lower silver concentrations. The metastable
states of Ag and Ag have an unsignifiant contribution in the spectrum
due to the small aotlvation sections and high value of the half life times.The
Table 1. Silver content expressed in weight percents in some ancient coins
No
1
2
3
4
5
6
7
8
9
10
11
12
13
14
15
16
17
18
19
20
The ancient coins
Denar,Antoninus Pius(140-143 A.C.)
Dena r,Ca ra ca1la(196-198 A.C.)
Denar.Lucius Verus -(166 A.C.)
Denar,Marcus Aurelius(168 A.C.)
Denar,Geta(209 A.C.)
Denar,Septimius Severus(198-200 A.C.)
Denar,Traianus(104-105 A.C.)
Denar.Vespasianus(74 A.C.)
DenartTraianus(102 A.C.)
Drahma,Dyrrhachium(II I B.C.)
Denar,Traianus(108-111 A.C.)
Denar,Caracalla(206-210 A.C.)
Drahma (Dyrrhachium(III B.C.)
Antoninian,Philippus II(244-247 A.C.)
Danar.Hadrianus(128-138 A.C.)
Denar,Traianus(102 A.C.)
Denar(Traianus(102 A.C.)
Denar(Caracalla(207 A.C.)
Denar,Ssverus Alexander(222-228 A.C.)
Plated denar,AntoninusPius (147-148 A.C.)
Thesilvercontent
89.
57.
96
79.
85.
79.
98.
86.
96.
9 1 .
99
91
83 .
44
84.
91 .
91.
66
60
10
4
6
9
5
4
6
8
3
9
3
8
,6
,6
No
21
22
23
24
25
26
27
28
29
30
31
32
33
34
35
36
37
38
39
40
The ancient coins
Denar(Severus Alexander(222-228 A.C.)
Denar,Caracalla(196-198 A.C.)
Denar.Blagabal(218-222 A.C.)
Denar,Antoninus Pius(140-143 A.C.)
Denar,Septimius Severus(196-197 A.C.)
Denar,Vespasianus(74 A.C.)
Denar,Domitianus Caesar(79 A.C.)
Antoninian,Philippus II(244-246 A.C.)
Denar,Severus Alexander(231-235 A.C.)
Denar,Caracalla(207 A.C.)
Denar,Septimius Severus(201 A.C.)
Denar,Traianus(114-117 A.C.)
Denar,Hadrianus(119-122 A.C.)
Antoninian(Philippus I(248 A.C.)
Denar(Lucille(161-180 A.C.)
Denar,Hadrianus(125-128 A.C.)
Denar,Severus Alexander(222 A.C.)
Denar,Iulia Paula(218-220 A.C.)
Antoninian,Hostilllanus(251 A.C.)
Denar,Severus Alexander(227 A.C.)
Thes ilvercontent
($5)
78
77
45.
79.
91
90
3
74.
5
79
80
12
72
4
2
92,
79
87
49
36
,5
,5
.5
.5
.5
contribution of the °°Cu energies higher than 72Q keV by Compton effect is low
because the activation section of HJU is one order of magnitude lower than
for Ag. This is also due to the intensity of the nuclear transitions /ll/. The
Fe and Pb isotopes may be ignored as they much less easily activated than Ag.

185
The coins no. 1-20 from tab le 1 have been discovered in the Roman camp ofGherla (45 km NE of Cluj-Napoca). This group cons is t of 16 denars , 2 Greekdrahmas, one pla ted denar and one antoninlan. No fa lse coins were ident i f iedwithin th ia group and t h i s could be eas i ly understood as they probablybelonged to s o l d i e r s .
The coins no. 21-40 have been unearthed a t Ulpia Traiana Sarmizegetusa,i t s being 17 denars and 3 an ton in ians . Several fa l se coins are evident withint h i s group (coins no. 27 and 29) as well as some h i s t o r i c a l unconalatencies(coins no . 28, 34, 35)• the g rea t e r d ive r s i t y of the composition might be ex-plained by the fact tha t the plaoe where they were found was the admin i s t r a t i -ve centre of the province and an important t r ad ing place. The s i l v e r contentshow a maximum around the year 110 A.C. which i s the f lour i sh ing period of theRoman Empire under Trajan emperor. This i s a l so the post-Dacian wars(105-106 A.C.) period, when the gold and s i l v e r of the conquered Dacia floodedRome / 1 2 / .
REFEKENCES/ I / J.N.BARRANDON.J. Radioanal. Ghem., 55 (1980) 317121 A.A.GOROUS, Archaeometry, 10 (1967) 78I'M R.W.THIELE.U.AUNGHIN.U.KYAW, Archaeometry, 14 (1972) 199IM CH.CHALOUHIj, E.HOURANI,R.LOOS,S.MELKI, Nuol. I n s t r . Methods, 200 (1982)553151 C.BESLIU, V.COJOCARU, Prepr in t Univ. Bueuree t i , CUP, 23 , Mai 1982161 T.PIAT.L.DARABAN, Studia Univers i t a t i s Babee-Bolyai, 21 (1976) 74111 C.COSMA.I.MASTAM.V.ZNAMIROVSCHI, Stud. Cero. Piz . 33 (1981) 351/ 8 / S.A.LIS,PH.K.HOPKE,J,L.FLASCHING, J . Radioanal. Chem.,25 (1975) 303131 T.FIATfC.COSMA,L.DARABAN,V.MORARIU, The Vl- th Conference "Advances in
phys ics" , Sibiu, Romania, 1984, p . 640/10 / H.MATINGLY.E.SYDENHAMM, Roman Imperial Coinage, London, 19231111 N.G.GUSEV.P.P.DMITRIEV, Kvantovoe iz lucenie radioaot ivnih nuclidov Atomiz-
da t , Moskva 1977/12 / J.CARCOPINO, L'or des Daces at les f inances de Rome sous Trajan, Dacia,
I (1924).

136
MONOSTANDARD ACTIVATION ANALYSIS OF PREHISTORICCOPPER OBJECTS
V.Cojocaru,M.Ive§cuInstitute of Physics arid Nuclear Engineering, P.O.Box MG-6,Magurele-Buchcreat, 76900. RomaniaC.BesliuUniversity of Bucharest, Faculty of Physics, Bucharest, RomaniaD.DimaerianInstitute for Civil Engineering, Bucharest, RomaniaD.PopovieiMuseum of National History, Bucharest, Romania
INTRODUCTIONInvestigation on the composition of metalic prehistoric, objects has become
more and more systematic in the last years. Among these the analysis of copperobjects has to answer • series of questions concerning the ancient mining and pro-duction of metal. The most used method for the investigation of prehistoric copperobjects was spectral analysis. By its means tens of thousand of objects were ana-lysed at the Stuttgard Museum /I/ and at the Institute of Archaeology of the USSRAcademy of Science /2/. The sensitivity reported in ref./2/ is about an order ofmagnitude higher than that obtained at Stuttgart.
It is to suppose that the neutron activation analysis (NAA) can be as simpleas the spectral analysis but allowing probably lower detection limits, an advantagewhich ought not to be ignored. In order to demonstrate the possibilities of NAA oncopper objects and to compare them with those of spectral analysis, especially fromthe point of view of detection limits, eleven eneolithic copper axes and other threeobjects have been chosen as investigation objects. Nine of these axes are adze-axes(cross-axes). The idea was to simplify as far as possible the method of analysis.With that end in view the monostandard activation analysis was used /?/• The reso-nance integrals used in this work were weighted averge values calculated on thebasis of data from Gryntakis' and Kim's compilation /A/.
EXPERIMENTALFragments from the investigated objects were cut with a special knife of hard
steel resulting samples weighting between 2 and 20 mg. After a careful washing inpure alcohol each sample was wrapped up in a pure aluminium foil. These samples, theneutron flux standard, a nickel and two copper stanflarda were placed together intoa quarts ampoule which was heat sealed. Irradiatiom was performed at the WR-S re-actor of the IPNE from MBgurele at an average thermal flux of 9.5xl012n cm-2e-l for96 heurs. The two copper standards were pure metalie "Analar" copper with weightsof 2 and 25 mg. Since their masses are more or leas equal to the minimum and maximummeasea of the -investigated samples, the specific activity ratio gives an indicationef aelf-shielding affects of neutron flux and decaying gamma-rays in solid samples.Both the calculations /5/ and the experimental data show effeete smaller than 5 *•
After irradiatiom eaeh sample was unwrapped, put in a clean vial and countedat a gamma spectrometer with a large Oe(Li) dcteeter with 1.8 keV fwhm for 1.9? MeVgamma-ray and a 4096 channel analyser. The counting was performed beginning withthe 6-th day after the end of irradiation. The concentration of nickel was meaauredby means of 58Co(71.3 d) isotope produced by 58Ni(n,p) reaction, using the nickelstandard. A correction was made for the contribution of the 67Cu(n,ot T60C© reactionwhen the concentration of cobalt waa determined. Thia haa been done by means of apure copper standard irradiated together with the investigated samples.
The results obtained by monoatandard NAA are given in Table 1. All the iaotopeameaaured here have long half-lives (more than 27 days) excepting 76AS (1.096 d) and1 3 bAu (2.697 d). These two isotopeB, especially 76AS, have to be counted during afew days from the end of irradiation. The are* cf 279.17 keV (20?Hg) photopeak wascorrected for the interference given by the gamma-ray of 279.5 keV (25 %) emittedby '?Se, using for this the area of the 155.9 keV (58 fc) gamma-line of the samenuclidc.
Since lead and bismuth cannot be analysed by NAA followed by gamma-ray apectros-eepy, all the objecta but nrs. 11 and 1? were investigated by aid of a X-ray spectro-meter with a Si(Li) detector having a resolution of 180 eV fwhm for K-Mn. No leadand bismuth could be detected at a concentration detection limit of 0.01 %.
DETECTION LIMITSThe sensitivity which can be reached in the instrumental NAA depends to a great
extend on the purity of copper. Copper itself has two natural isotopes, « C u and65Cu, with abundance of 69.1 % and 30.9 %» respectively. In a reactor neutron fluxthey give (n.tf), (n,p), (n,oO and (n,2n) reactions. All resulting nuclides but60c© have quite short helf-livee and 6 days after the end of irradiation 6*Cu (12-7

c00 Table 1. Concentration of trace elementa in prahiatorio oopper objeota
SampleNr.
1 .2 .
3 .4 .
5.6 .
7.8 .
9.1 0 .
11 .12.13 .1 4 .
Table
Nr. ofinventory
MIRSR 14050MIRSR 15687MIRSR 32041MIRSR 15916MTRSR 14049Goll.AparuMIRSR 54045MIRSR 54751MIRSR 14066
MIRSR 15917Link I 65MIRSR 39258Awl I 33Rua/80 SIII
0.03110.00160.08600.00220.00450.11400.00320.00240.00140.00090.00310.00950.00520.0470
2. Detection limita
Ilenant I H M
AgAaAuBiGoGrFaHg
0.000050.00070.00002
-
0.000020.00030.00260.00003
0.00570.00141.7620.00040.01600.01200.00320.00260.00070.00530.00081.5650.00020.1010
Aa
0.000700.000040.000180.000120.000130.000940.000080.000070.000020.000030.000210.000490.000110.00006
(56) obtained in
SA
0.00010.0070.0010.00050.001
-0.001
-
Element
MnS IPb
Be8nSbZn
Oo
0.000130.00004
n.d.0.000010.00001
n.d.n.d.n.d.
0.000270.000020,000020.000140.00009 s0.00003
inetrumeni
IHAA
0.00050.002
0.000030.0080.000040.0002
Or * •
n.d. 0.01200.0211 0.0400
n.d. n.d.0.0008 0.0060
n.d. £0.0050n.d. ^0.0100
- ^0.00200.0786 0.0026
0.0060- <0.0020
0.0003 0.0032n.d. 0.0060
0.0002 n.d.0.0025 n.d.
u0.00020.0012
n.d.0.000040.000600.000200.000100.00060.0002
0.000030.000060.000100.000400.00010
ial activation analyaia
SA
0.010.00050.001
-
0.0050.00150.003
Hi
0.00200.00400.00300.00400.00500.02300.00300.00800.01200.00700.00900.00600.01500.0130
Se
0.00520.0015
50.00020.00030.00080.0021
n.d.0.00010.00130.00020.00220.00400.00390.0023
Sb
0.00740.00230.17300.00020.00500.00310.00030.00170.00020.00040.00010.00140.00010.0054
fin Zn
n.d. ^0.00120.1300
n.d.n.d.n.d.n.d.n.d.n.d.n.d.n.d.n.d.n.d.n.d.n.d.
(IHAA) and apectral analyaia (SA)
0.0042n.d*
0.00110.00160.00120.00110.00110.00160.00130.00180,00160.00050.0005

188
h) activity diminishes 4.10-4 times fl&Aa activity decreases only a factor of 0.02)and the sample ean be counted. An element present in the sample in a high concentra-tion or/and large activation cross section ean mask an other isotope with a snailrate of accumulation. The situation is worse when the last one emits only one T-ray.
The detection limits estimated in INAA are given in Table 2. The smallest con-centration* which could be measured by apaotral analysis /2/ for nore than 1200sanples are also given for cemparation in Table 2. It ean be cosidered that thesmallest determined concentration is quite elose of the detectien limit. Some valuesin Table 2 for NAA are taken on a similar ground.
For manganese the detection limit was determined by 1 min irradiation of aeopper sample (10 mg) at the rabbit system of WR-S reactor (2xiol2n cm-28-l), usinga decaying time of 1 h and e counting time of 1000 s.
By means of INAA a number of 12 elements could be determined in a long irradi-ation run, the sane number as in speetral analysis. Six elements have a detectionlimit an order of magnitude higher in INAA in comparison with spectral analysis andonly three have a lower detection limit (Pe, Ni, Sn). If the irradiation time isincreased 4 tines, only tin remains with a lower detection limit. Furthermore, otherthree elements are seen with high sensitivity (Hg, Cr, Se) which are not reported inspeetral analysis.
DISCUSSIONA number of 38 adze-azes found on the territory of Bulgaria has been analysed
by Chernyh /2/ and all of then are framed in the six groups defined by him, the ma-jority being in the first group. In our ease only two axes ean be included in thefirst group, three in the eeeond group, but the rest of four cannot be placed in anyof the Chernyh'e group. This fact demonstrates that these groups are not enough tocharacterize the copper objects from eneelithic.
One can see that two axes have a high concentration of arsenic (between 1 and2 %) indicating an arsenical bronze (eSn<0.4 %) /2/ produced deliberately in orderto change the metallic proprieties of copper. It is interesting to try some supposi-tions on the nature of mineral which inserted arsenic in metal. In bronzing a highconcentration of arsenic could be obtained by adding sulpharsenide minerals, suchaa energite or tennatite, or sulphide .minerals such as orpiment or realgar.
In eulpharsenidee arsenic, antimony and silver are geochemically associated,that is a certain ratio exists between their concentrations. As Goffer shown /6/ theconcentration ratios As/Sb and As/Ag for copper objects found in the Dead Sea areaare correlated. From the plot 11.6 of ref ./6/ one can infer that the correlation is
where the elemental concentration is expressed in per cent. This correlation agreesvery well for the axe nr.3, but not for the axe nr.12. On the Romanian territoryenergite and tennatite were identified in many places /7/.
In conclusion it can be said that monostandard INAA is a rather simple and re-liable method. It has a sensitivity higher than spectral analysis, the processing ofthe spectra can be performed by means of a computer and an averege counting time of1 h seems to be enough for a satisfactory statistics. Furthermore, it is not neces-sary to do any chemical processing on the sample, except maybe a slight etching andwashing before, or even better after neutron irradiation. It is also an advantagethat the sample is not destroyed. In this way it can be preserved or, if it is neces-sary, analysed again by NAA or some other method. All these advantages representgood premises for the prospect of studying many thousand of archaeological copperobjects found on Romanian territory.
REFERENCES/I/ D.Ankner, Auegabunnen in Deutschland, Teil ?, Mains 1975,p.145./2/ E.N.Chernyh. Gornoe delo i metalurgia v drevneishei Bolgani.Igd.Bolgarskii Akad.
Nauk, Sofia 1978./ V J.I.Kim and H.Stlrk, Activation Analyais in Geochemistry and Cosmochemistry.
Universiteteforlaget, Oslo 1971,p.397•/4/ E.M.Gryntakia and J.I.Kim. J.Radieanal.Chen.76 (198?) 741./5/ T.Takeuchi, Radioisotopes 29 (1980) 119./6/ Z.Goffer, Archaeological Chemistry. J.Wiley&Sons, 1980/7/ P.DBnila" and M.DBnilB. Cuprul. Ed.TehnicS. Bucure§ti 1982, p.38.

189
ARCHAEOMETRIC INVESTIGATION OF MEDIEVAL BULGARIAN GLASSES
AND SGRAFFITO CERAMICS BY NEUTRON ACTIVATION ANALYSIS
R.Djingova, I.Kuleff
Faculty of Chemistry, University of Sofia, 1iH26-Sofia, Bulgaria
The results from the investigations of the chemical composition of anarchaeological find permit the reliable localization of its production, sincethe chemical composition of the analyzed materials is determined by the sourcethe raw materials come from. The method most widely rased in provinience studiesis NAA, due to its ability to determine a big number of elements with thenecessary precision, accuracy and detection limit (see /1,2/). To solve thelocalization problem the data from NAA are usually subjected to suitablemathematical interpretation /i/.
Already several years at the Faculty of Chemistry, University of Sofia incollaboration with the Archaeological Institute of the Bulgarian Academy ofSciencies archaeomefcric investigations are carried out wich include investiga-tions of medieval Bulgarian glass /3-5/ as well as of sgraffito ceramics /6/.
INAA /'}/ has been used to determine the content of Au.Ba, Ca, Ce, Cl, Cr, Co,Cs,Cu,Eu,Fe,Hf, !La, Lu,Mn,Na,Rb,Sb.Sc,Sm,Sr,Ta,Tb,Th,Ti,U,V, and Yb in glasssamples taken from the walls of glassmaking pots excavated from the medievalglassworkshops in Pliska (the first Bulgarian capital - 681-873) and Preslav(the second Bulgarian capital - 873-972) and in 20 glass finds from Preslav.
By instrumental NAA /6/ 15 sgraffito ceramic samples excavated inTzarevetz-, Veliko Tarnovo were analyzed and the el-em en ts Al,As, Au,Ba,Br,Ce, Co,Cr,Cs,Dy,Eu,Fe,Hf,K,La,Lu,Mg,Mn,Na,Nd,Rb,Sb,Sc,Si,Sm,Ta,Tb,Th,Ti,U,V, and Ybhave been determined.
The results from the analysis were subjected to cluster analysis and step-wise discriminant analysis using the program package BMDP /7/.
Due to this approach the variety of the production of the medieval glassworkshop in Preslav was defined and evaluated /^It's also proven that thechemical composition might be successfully used to differenciate between theproduction of the two workshops, which is very interesting having in mind thegeographical closeness of Pliska and Preslav and the fact that both workshopsactually functioned in one period of time.
The combination of NAA and cluster analysis proved that part of theanalyzed sgraffito ceramics samples have been produced in one and the sameplace (that is using one clay source). Since this production covereda period of 400 years (XV-XVIII c.) it may be supposed that it was locally made.
Meanwhile along the Black sea coast and in some other places of Bulgariaa lot. of sgraffito ceramics has been excavated.Part of it is decorated withmonograms, described in /«/. Similar finds are found in Constantinopole, AsiaMinor, Thessaloniki,Roumania etc/9/. This poses an interesting problem to besolved whether these finds ware imported, or were local production withimitation of the same monograms. These investigations are now in progress.
Acknowledgment. These investigations are possible thanks to the finencialsupport of the Bulgarian Ministry of Education, contract number 16116.
REFERENCES
/1/G.Harbottle, in: A Specialist Periodical Report "Radiocheaistry", vol.3,Burlington House, London, 1976,p.33.
/2/I.Perlman, in; Nondestructive Activation Analysis, Elsevier Sci.Publ.Comp.,Amsterdam, V981,p.259.
/3/I.Kuleff,R.Djingova,I.Penev, J.Radioanal.Nucl.Chem.(Art.) ,83 (1984) 333./4/I.Kuleff,R.Djingova,G.Djingov, Archaeometry-{ in press)./5/I.Kuleff,R.Djingova,I.Penev, Glastechn.Ber., (in press) ./6/I.Kuleff,R.Djingova,I.Penev, J.Radioanal.Nucl.Chem.(Art.) , { in press)./7/BMDP, Biomedical Computer Programs, Department of Biomathematics, University
of California, Los Angeles, 1981./8/D.Talbot Rice, Byzantine Glazed Pottery, Oxford, 1930./ / , Bull, du Musee National de Varna, vol.X.(xxv) (197*0 i!55.

DETERMINATION OF TRICE ELEMENTS IN SOIL
Maria S&l&gean, Ana PantelicaInstitute for Physics and nuclear EngineeringBucharest MG-6, RomaniaAbstract! Concentration of 32 elements in reference material
SOIL-7 is determined
INTRODUCTIONThe work described in this paper was the subject of an intercomparison
organised by IAEA's Analitycal Quality Control Service on the determinationof tract elements in soil materials (Soil-7 collected near Ibensee in UpperAustria) la order to provide a reference material for multielement analysesand also to verify the performance of different analysis methods of the par-ticipating laboratories.
The composition of soil is of interest for the specialists in variousfields of research as geology, biology, nutrition and environmental pollution.A number of 56 laboratories from 25 countries using different methods of ana-lysis sent their results at this interoomparison. Activation analysis was themost frequent method used (38 % of all determinations).
EXPERIMENTALBy using the instrumental neutron aotivation analysis method the concen-
tration of 32 elements has been determined in our laboratory.She concentration of Ba, Oa, Oe, Oo, Os, Cr, Iu( Fe, Hf, La, Lu, Nd, Rb,
Sb, So, Sm, Sr, Ta, Tb, Th, U, Ib, Zn, Zr have been determined after 50 hoursirradiation time in a thermal neutron flux of l.lxiolln/cne.s.
The samples («J 150 mg in weight) and Soil-5, SL-1, GSP-1 as standardshave been measured 2 - 5 hours after 10 a- 30 days.
In a pneumatlo tube with a lO^n/onF.s. flux the samples and W-l stan-dard material have been Irradiated for 1 - 3 minutes. After 6 min.- 24 hoursdeoay time the samples were measured for 100 - 1800 s. The concentration ofAl, Dy, lu, X, Hg, Un, Ba, Sm. Ti, Y was in this way determined. In both typesof irradiation the concentration values are the arithmetic average of the va-lues for 4 independent determinations.
A multichannel analyser connected to a 65 om? Go (Li) detector with 2 keVresolution was used*
RESULTS ADD DISCUSSIONThe results for the concentration of the elements thus determined are
presented in table 1.These values are classified by the IAIA (column 5) as recommended values
with satisfactory (A) or acceptable (B) degree of confidence and informationvalues - non-oertified (0).
lor the major elements Al, Oa, Fe, llg, E, Na and Ti their values pass allthe test criteria of class A but their confidence Intervals are larger thanthose usually required for major components of reference materials. These va-lues oan not be certified but may be used as reference values In the oases inwhich these too large confidence intervals do not cause problems in futureanalytical works. These elements are denoted by A * .
Our results shown in table 1 are in a good enough agreement with the re-sults presented by IAEA exoept for U and Sr concentration. In this case ourvalue was rejected by statistioal test. For Oa and Zn our values of concentra-tion have been taken into aooount in the estimation of the results althoughthese values are outside of confidence intervals.
TABLE 1
Element <»•«••«•*"•• Confidence intervals Our results
Al(%)Ba0a(*)OeOoOr
4.7159
16.3618.960
4.4 - 5.1131 - 19615.7 - 17.450 - 6 36.4 - 10.149 - 74
4.2 ± 0.1195 + 1611.6 + 0.2
53 + 19*2 + 0.264 + 1
A*0A*BAB

191
0
Os»y
*«(*>HfK(J6)LaLaMg(%)UfaNa(56)HdKbSbSoSBSrTaTbThTi(56)UVXbZ&Zr
1
5.43.91.02.575.11.21
28.00.31.13
6310.24
3051
1.78.35.1
1080.80.68,2
0.32.6
662 .4104185
4.93.20.9
2.524.8
1.1327.0
0.11.10604
0.232247
1.46.94.81030.60.56.5
0.262.259
1.9101180
2
- 6.4- 5.3- 1.3- 2.63- 5.5- 1.27- 29.0- 0.4- 1.18- 650- 0.25- 34- 56- 1.8- 9.0- 5.5- 114- 1.0-0 .9-8.7- 0.37- 3.3- 7 3- 2 . 6- 113. 201
3
5.2 + 0.23.3 ± 0.2
1.05 + 0.132.56 + 0.054.7 + 0.2
1.28 + 0.0528.3 + 0.40.34 + 0.011.11 + 0.14605 + 16
0.223 + 0.00431 + 24 9 + 4
1.77 + 0.108.4 + 0.15.5 + 0.2161 • 17
0.58 + 0.130.85 + 0.138.03 • 0,100.26 + 0.030.91 + 0.12
54 + 52.4 + 0.1161 ± 10185 + 26
4
BBB
A *AA *BCA*AA*BABBBBBBBA*AABAA

192 &G860C/&1
INVESTIGATION OF THE CONNECTION BETWEEN SURFACE WATER AND UNDER-GROUND WATER PROM MINE GAOOVA-IERII, USING AGTIVABIiE TRACERS
Lucretia Dinescu, Victoria Domocos, St. CraciunInstitute for Physics and Nuclear EngineeringBucharest MG-5, RomaniaAbstracts The paper emphasizes the advantage of using the activa-
ble tracers when studying the mining hydrogeology. Two tracers where simulta-neously used! indium in the form of In-EDTA complex and the radioisotope 82-Br.The determination of indium was carried out by passing the water samplesthrough the ion exchangercolum/i to retain the other disturbing elements (suchasi Mn, 01, Na, K, etc*)* Then indium was copreclpitatied with bismuth hydroxi-de and was determined by neutron activation analyses. The connection betweensurface waters and underground Cacova-Ieril mine water was proved. Concomiten-tly, valuable data regarding the velocity and the circulation way could be ob-tained.
INTRODUCTIONThe radioactive tracers techniques is succesfully used in hydrogeological
studies for many years* In the past years, due to limits imposed by sanitarynorms, it was necessary to use lower and lower activities. Since in the mostcases of hydrologioal tracer applications, a high dilution occurs,the radio-isotope concentration in the measuring point could be under the detection li-mit.
Problems of radiation protection do not rise by the use of inactive tra-cers. The most reliable tracer for this purpose is Indium, as In-EDTA complex,wich can be detected in very low concentrations, by NAA based on gamna-spec-trommetry.
Two tracersi inactive indium and radioisotope 82-3r were simultaneouslyused for hydrogeological studies performed in Oacova-Ierii tested area.
EXPERIMENTALThe water flow rate looses on the river Oacova and Ier^ii were determined
by classical methods*The In-EDTA and 82-Br were used to prove the connection between surface
and infiltrating mine water.Quantities of 750 ml water were collected at different time intervals,
at four mine deph levels.Eaoh water sample was passed through the ion exchanger column, to retain
the other disturbing ions (Fe, tin, Cl, Na, K, etc.).The In-EDTA complex was distroyed by adding HgSO*.Indium was coprecipitated with Bi(OH)g* The precipitate was collected on
molecular filters wioh were put into the plastic bags-heat sealed. Bach bagwas wrapped in aluminium foil. 8-10 samples along with standard wera irradia-ted simultaneously at a lO1?n/cm2.s. flux, in the WR-S reaotor and measuredimmediatly after irradiation. The standards were prepared in the same way asthe samples*
Irradiation time was 20 min. and measuring time 200 a. Nuclear data forindium are given in table 1*
TABLE 1
Nuclear data forIsotope leotopioxsecopfj abundance
U5in 95.7
indium
(%) barn
155
Product
1 1 6 > ln
IJ!l/2min.
5*
Photopeakused (keV)
417.0
Measurements were performed with a Ge(Li) detector and ND-6620 acquisi-tion and processing system. The deaintegration correction was taken into ac-count for concentration calculation*
The 82-Br determination was carried out by "in situ" measurements witha sointillation probe*
RESULTS AND DISCUSSIONFour experiments have been performed in tested area Oaoova-Ierii. For
three marking points, situated on the small riverst Vadului, Oacova andIerfcii, the connection between surface water and underground mine water wasproved* In the fourth experiment, the decanting pond was marked with In-BDTA.

193
The In tracer did not appear in mine infiltrating, water, so it was provedthat no connection exists between surface and underground water in this point,The results obtained were used to establish the transit times.
REFERENCES/I/ H. Behrens, H. Moser, S. Wildner, J. Radioanal. Ohem., 38 (1977) 491/2/ S.P. Stanescu, E. Gagpar, S. Spiridon, O.M. Fareaspiu, R. Catilina,
Preprint ICEFIZ, NP 24 - Decembrie 1982/5/ So Ga§par, O.M. Farcagiu, S.P. Stanescu, S. Spiridon, Froc. First Bymp.
on Theoretical and Applied Kara to logy, Bucharest 22-24 April 1983.

FAST NEUTRON ACTIVATION ANALYSIS OF SHORT-LIVEDNUCLIDES IN SOME GEOLOGICAL SAMPLES
S.M.Al-Joboti, e t a l .
Fast neutron act ivat ion analys i s technique was applied for the
determination of major, minor and trace elements (such as S i , Fe, Ti,
Al, Zr, Au and U) in geological samples. The samples and standards
were ir tadiated with a monoenerqetic neutron flux of 109 n.cm~2 - S
produced by KAMAN type neutron generator. The pneumatic f a c i l i t y was
used to transfer the sample and standard between the i rrad ia t ion and
counting s t a t i o n s . The standard was prepared from f l i n t c lay obtained
from NBS.
The gamma-ray a c t i v i t i e s from samples and standards were counted
using a 30 cm3 Ge(Li) detector (FWHM) = 2.9 keV at 1.33 MeV) coupled
t o on-l ine computer f a c i l i t y .

195
A U T H O R I N D E X
Alekaandrov, S.: 60Alicu, 0 . : 183Al-Jobori, S. II.: 194Apostol, E.: 44Apostoleaou, S.: 5, 29Apostolov, D.: 3, 63, 93, 129, 152Arpadjan, S.: 60Avrigeanu, M.: 69Avrigeanu, V.: 69
Bakyrdschiev, P.: 92Besliu, C : 186Blaga, N.: 47Boros, 0.: 183Bozanic, M.: 83Bradeanu, A.: 47Byrne, A. R.: 35, 55
Calcev, G.: 74Catena, D.: 47, 50Choulia, N. H.: 87Cojooaru, V.: 57, 186Constantinescu, B.: 37Cosma, C : 183Cracium, S.: 192
Daieva, L.: 157Damyanov, B.: 71Dan, C.: 44Dan, R.: 74Daraban, L,: 183Debert, C.j 74De Bruin, M.: 85, 95De Corte, P.: 19Demiralp, R.: 124DermelJ, M.t 35, 55Dimaerian, D.: 186Dimitrov, D.: 52Dineseu, L.: 160, 175, 192Djingova, R.: 60, 128, 162, 189Djulgerova, E.: 92Domnisan, M.: 74Domocos, V.: 192Dragnev, T.: 71Draskovic, R, J.: 83, 90, 125
Pareasiu, 0. M.: 177Fiat, T.: 183Franko, M.: 35Prontasieva, M. V.: 177
Galatanu, V.: 47, 50Galis, V.: 74Caspar, E.: 177Geisler, H.: 141Gharib, A.: 137Gosar, A.: 35Grigorov, T.: 63, 66, 93, 129Grimanis, A.: 8, 129Grozev, G.: 71
Haidoutov, I.: 157Hoste, J.: 19
Iordanov, I.: 180Iovtchev, M.: 63, 92, 93, 129Ivanov, E.: 37Ivascu, 11.: 69, 186
Janakiev, K.: 66Jovanovic, S.: 19, 165
Kanias, G. D.: 07, 129Karamanova, J.: 71Kemileva, Z«: 93Kinova, L.: 79, 85, 93, 108, 129Kjoetarova, 0.: 121, 134Kosta, L.: 35, 55Koatic, K.: 90Kosutic, K.: 118Kukoe, A.: 125Kuleff, I.: 25, 40, 60, 92, 128,
162, 189
Lulic, S.: 110, 115, 118
Marichkova, L.: 121, 134Mocanu, N.: 74UoenB, L.: 19Morariu, V.: 183Motiu, A.: 149

196
A U T H O R
Naataae, It.: 74Nazarov, V. 11.: 177Nikolov, P.: 129
Pantelic, M.: 125Panteliea, A.: 29, 44, 113, 149,
171, 174, 190Papadopoulos, N. N.: 154Papadopoulou, C : 129Pascovici, G.: 37Pavioic, J.: 132Penev, I.: 85, 108, 129, 162Petrov, J. G.: 25Plamada, C : 160, 175Plostinaru, D.: 37Popa-Nemoiu, A.: 37Popesou, 0.: 47Popovioi, D.: 186Purice, E.: 74
Salagean, ».: 29, 44, 113, 149,171, 174, 190
Schelhorn, H.s 152Sevimli, H.: 61Stmonlta, A.: 19Skreblin, U.: 132Smodis, B.: 55
I N D E X
Spiridon, G.: 113Spiridon, S.: 57, 113, 174, 177Staneacu, S.P.: 177Stankovic, S.: 90Stefanov, G.: 40Stegnar, P.: 35, 132Stojanov, A.: 129
Taekaev, E.: 32, 60, 65, 108,129, 152
Tchounev, D.: 180Teodosiu, G.: 74Tepelea, V.: 74Timus, D.: 47, 50Tomov, L.: 66Tusek-Znidaric, M.: 132
Vassilaki-Grimani, M.: 129Vertacnik, A.: 115Vukotio, P.: 19, 165Vutchkov, H.: 66
Zafiropouloa, D.: 129Zejnilovie, R.: 19ZnamirovBChi, V.: 149, 183Zotschev, S.: 40Zvonaric, T.: 132