New synthetic glutathione derivatives with increased antiviral activities

7) 141–148www.elsevier.com/locate/yviro
Virology 361 (200
Inhibition of viral replication reduces regulatory T cells and enhances theantiviral immune response in chronic hepatitis B
Jeroen N. Stoop, Renate G. van der Molen 1, Ernst J. Kuipers,Johannes G. Kusters, Harry L.A. Janssen ⁎
Department of Gastroenterology and Hepatology, Erasmus MC-University Medical Center Rotterdam, 's-Gravendijkwal 230, Room Ca 326,3015 CE Rotterdam, The Netherlands
Received 5 September 2006; returned to author for revision 3 October 2006; accepted 15 November 2006Available online 20 December 2006
Abstract
Regulatory T cells (Treg) play a key role in the impaired immune response that is typical for a chronic Hepatitis B virus (HBV) infection. Togain more insight in the mechanism that is responsible for this impaired immune response, the effect of viral load reduction resulting fromtreatment with the nucleotide analogue adefovir dipivoxil on the percentages of Treg and HBV-specific T-cell responses was analyzed. Peripheralblood mononuclear cells (PBMC) of 12 patients were collected at baseline and during treatment. In parallel to the decline in viral load, we found adecline in circulating Treg, combined with an increase in HBV core antigen-specific IFN-γ production and proliferation. The production of IL10did not decrease during therapy. In conclusion, adefovir induced viral load reduction results in a decline of circulating Treg together with a partialrecovery of the immune response.© 2006 Elsevier Inc. All rights reserved.
Keywords: HBV; Immune tolerance; FoxP3; Treg; Viral load
Introduction
Hepatitis B virus (HBV) is a common non-cytopathic DNAvirus. Infection with HBV in adults usually results in a self-limiting, acute hepatitis, which confers protective immunity andcauses no further disease. In 10% of infected adults, HBV leadsto a chronic infection. Chronic HBV infection is an importantrisk factor for the development of liver cirrhosis andhepatocellular carcinoma. Worldwide 400 million people sufferfrom a chronic HBV infection and approximately 1 millionpeople die annually from HBV-related disease (Lee, 1997; Loket al., 2001).
In patients with an acute self-limiting HBV infection, a mul-tispecific CD4+ and CD8+ T-cell response with interferon-γ
⁎ Corresponding author. Fax: +31 10 4665916.E-mail addresses: [email protected] (J.N. Stoop),
[email protected], [email protected] (R.G. van der Molen),[email protected] (E.J. Kuipers), [email protected](J.G. Kusters), [email protected] (H.L.A. Janssen).1 Present address: Medical Immunology, Reinier de Graaf Group, PO-Box
5011, 2600 GA Delft, The Netherlands.
0042-6822/$ - see front matter © 2006 Elsevier Inc. All rights reserved.doi:10.1016/j.virol.2006.11.018
(IFN-γ) production is important for control of the infection(Bertoletti and Naoumov, 2003; Rehermann et al., 1995).Patients with a chronic HBV infection lack such a vigorousmultispecific T-cell response, but instead exhibit a weak orundetectable virus-specific T-cell response (Bertoletti andNaoumov, 2003). Patients with a chronic HBV infection haveincreased percentages of CD4+CD25+ regulatory T cells (Treg)in their peripheral blood. Treg are capable of inhibiting theHBV-specific immune response in a dose dependent mannerand depletion of Treg results in an increased proliferation andIFN-γ production against HBV core antigen (HBcAg) (Stoop etal., 2005). In addition, Xu et al. recently showed that patientswith a high viral load have more peripheral Treg as compared topatients with a low viral load (Xu et al., 2006). It has beensuggested that Treg can be induced through a repetitivestimulation of T cells by the presence of high concentrationsof antigen for longer periods of time (Taams et al., 2002). Thehigh viral load present in peripheral blood of HBV patientscould possibly provide such a stimulus.
One of the therapeutic options for patients with a chronicHBV infection is antiviral treatment with nucleos(t)ide analogs

142 J.N. Stoop et al. / Virology 361 (2007) 141–148
(Marcellin et al., 2003). Adefovir dipivoxil is the prodrug ofadefovir, an acyclic phosphonated adenine nucleotide analogue.Intracellularly, adefovir dipivoxil undergoes two phosphoryla-tion steps to compete with deoxyadenosine triphosphate toinhibit viral DNA polymerase and HBV reverse transcriptase,resulting in chain termination of DNA synthesis (Asmuth et al.,2004).
The aim of this study was to determine how the decreasein viral load and antigenic pressure affects the percentage ofTreg and the antiviral immune response, as tested by T-cellproliferation, IFN-γ and IL10 production.
Results
HBV DNA decreased and alanine aminotransferase levelsnormalized during adefovir treatment
Serum HBV DNA level and alanine aminotransferase level(ALT) were determined at baseline, as well as after 3 and 6months of treatment (Fig. 1). The median reduction in serumHBV DNA from baseline to month six was 5.2 log10. Sixmonths of treatment led to undetectable HBV DNA in nine(75%) patients and to normalization of the ALT levels in
Fig. 1. (A) The serum HBV DNA levels of the 12 patients at baseline after 3months and after 6 months of adefovir therapy. The bar represents the medianserum HBV DNA level. (B) The serum ALT levels of the 12 patients at baselineafter 3 months and after 6 months of adefovir therapy. The bar represents themedian serum ALT level. HBV DNA and ALT levels were significantly lower at3 and 6 months compared to baseline (p<0.05).
eight (66%) patients; eight (66%) patients reached bothendpoints. Three patients had seroconversion from HBeAg toanti-HBeAg during treatment. No patient exhibited loss ofserum HBsAg.
The proportion peripheral blood Treg decreased duringadefovir induced viral load reduction
To assess the effect of treatment with adefovir on theimmune response, we first determined the proportion of Tregfrom cells that stained positive for CD4. Treg were defined asthe percentage of cells positive for CD4, CD25, CD45RO andCTLA-4 divided by the percentage CD4 positive cells (Fig.2A). After 3 and 6 months of therapy, we found a significantdecrease in the percentage of Treg (baseline 4.0±0.4 vs. 3months 3.2±0.3 vs. 6 months 3.3±0.4, p=0.019 and p=0.037respectively; Fig. 2B). A weak correlation was observedbetween the percentage decrease in HBVDNA and thepercentage decrease in the proportion of Treg (r=0.384 andp<0.05; data not shown).
Since FoxP3 is considered to be the most specific markerfor Treg, we also performed a flow cytometry staining withantibodies against CD4, CD25 and FoxP3 in four of ourpatients (Fig. 3A). For this the percentage of cells that stainedpositive for CD4, CD25 and FoxP3 was divided by theproportion of CD4 positive cells. All four patients had adecrease in the proportion of Treg (10% decrease±3.5%) du-ring the first 3 months of treatment. After 6 months of treat-ment, the proportion of Treg increased somewhat, but re-mained lower than at baseline. These results concurred withthe CD4, CD25, CD45RO and CTLA-4 Treg staining for allfour patients (Fig. 3B). To determine whether the CD4+CD25+CTLA-4+ cells are FoxP3+ Treg, flow cytometry wasperformed with those four markers on PBMC from healthycontrols. FoxP3 was expressed by 97% of the CD4+CD25+CTLA-4+ cells. One representative healthy control is depic-ted in Fig. 3C.
Proliferation and IFN-γ production increased during adefovirinduced viral load reduction
To determine the (HBV) specific proliferation and IFN-γproduction, PBMC collected at baseline and during therapywere stimulated with HBcAg or tetanus toxin. As comparedto baseline the HBcAg specific proliferation had increasedboth after 3 and 6 months of adefovir treatment (baseline2893 CPM±689 vs. 3 months 5372 CPM±1382 vs. 6 months4287 CPM±906; Fig. 4A). A similar increase was found forthe proliferation to tetanus toxin (Fig. 4B). The percentagedecrease in HBV DNA and the percentage increase inproliferation to HBcAg were weakly correlated (r=0.371 andp<0.05; data not shown).
PBMC from healthy controls did not proliferate uponstimulation with HBcAg (data not shown).
In parallel, the number of IFN-γ producing cells as deter-mined by Elispot significantly increased during treatmentboth to HBcAg (5.7 spots/100,000 cells±1.8 at baseline vs.

Fig. 3. (A) The Treg staining was performed with antibodies against CD4,CD25 and FoxP3. The cells depicted in the gate of the left dot plot are CD4+and are depicted in the right dot plot. The cells in the upper right quadrant ofthe right dot plot are CD4+CD25+FoxP3+ and are considered to be Treg. Thegates were set using isotype matched control antibodies. (B) The percentage ofTreg defined as the percentage of CD4+CD25+FoxP3+ cells divided by thepercentage of CD4+ cells (line and right y-axis) or the percentage of CD4+CD25+CD45RO+CTLA-4+ cells divided by the percentage of CD4+ cells(bars and left y-axis) (n=4). The change in percentage of Treg follows thesame trend for both staining methods. Data are expressed as mean±SEM. (C)Flow cytometry staining experiment from a representative healthy control. Thestaining was performed using antibodies against CD4, CD25, CTLA-4 andFoxP3. The cells depicted in the gate of the left dot plot are CD4+CD25+ andare depicted in the right dot plot. The cells in the upper right quadrant of theright dot plot are CD4+CD25+CTLA-4+FoxP3+. The gates were set usingisotype matched control antibodies.
Fig. 2. (A) Flow cytometry staining experiment from a representative patient.The Treg staining was performed using antibodies against CD4, CD25,CD45RO and CTLA-4. The cells depicted in the upper right quadrant of the leftdot plot are CD4+CD25+ and are depicted in the right dot plot. The cells in theupper right quadrant of the right dot plot are CD4+CD25+CD45RO+CTLA-4+and are considered to be Treg. The gates were set using isotype matched controlantibodies. (B) The percentage of Treg defined as the percentage of cells thatstained positive for CD4, CD25, CD45RO and CTLA-4 divided by thepercentage of cells that stained positive for CD4. The dotted lines represent theindividual patients and the solid line depicts the mean percentage Treg. *p<0.05compared to baseline.
143J.N. Stoop et al. / Virology 361 (2007) 141–148
17.5 spots 100,000 cells±4.9 at 3 months vs. 15.7 spots/100,000 cells±5.0 at 6 months, p=0.014 and p=0.014 res-pectively; Fig. 4C) as well as to tetanus toxin (Fig. 4D).
Adefovir induced viral load reduction did not lead to a reducedIL10 production
Since clearance of HBV requires a cytokine responsewith a T helper 1 type profile, we determined the effect ofadefovir therapy on the anti-inflammatory cytokine IL10.For this purpose, PBMC collected at baseline and duringtherapy were stimulated with HBcAg or with PHA as apositive control. The number of IL10 producing cells wasdetermined by Elispot. Treatment resulted in a non-significantincrease (baseline vs. 6 months; p=0.155) in the number ofIL10 producing cells upon stimulation with HBcAg (base-line 24.9 spots/100,000 cells±6.6 vs. 3 months 28.7 spots100,000 cells±8.11 vs. 6 months 37.6 spots/100,000 cells±8.0; Fig. 5).
Adefovir had no direct effect on PBMC
The increased proliferation of PBMC upon stimulation withHBcAg during adefovir treatment could be caused by a directeffect of adefovir on PBMC or by decrease in viral load. PMEA

Fig. 4. PBMC obtained at baseline, after 3 months and after 6 months of treatment were stimulated for 6 days with HBcAg (A) or tetanus toxin (B). The proliferationwas determined by the incorporation of [3H]-thymidine. PBMC were also stimulated for 48 h with HBcAg (C) or tetanus toxin (D). IFN-γ production was determinedby Elispot. The dotted lines represent the individual patients and the solid line depicts the mean, *p<0.05 compared to baseline.
144 J.N. Stoop et al. / Virology 361 (2007) 141–148
is the active metabolite of adefovir. To examine whether PMEAhas a direct stimulatory activity, PBMC from untreated HBVpatients were stimulated with HBcAg in culture mediumsupplemented with different concentrations of PMEA. Thisagent had no direct stimulatory effect resulting in proliferation(Fig. 6A) or IL10 production (Fig. 6B; n=6). When stimulatedwith HBcAg, different concentrations of PMEA had also noeffect on the proliferation of PBMC (Fig. 6A) or the number ofIL10 producing cells (Fig. 6B).
Discussion
Patients with chronic HBV infection lack the vigorousmultispecific CD4+ and CD8+ T-cell response with a type 1cytokine profile necessary to clear the infection (Bertoletti et al.,1997; Bertoletti and Naoumov, 2003). The precise mechanismresponsible for this impaired T-cell response is not known. Tregrepresent a unique lineage of T cells with a critical role inmaintaining immune homeostasis. Treg are very potentsuppressors of the immune response. It has recently been
shown that a slight decrease in percentage of Treg (1.3%) canresult in the development of autoimmune disease (Lan et al.,2006). Previously, we have shown that Treg contribute to theimpaired immune response in patients with a chronic HBVinfection by inhibiting the proliferation and IFN-γ production toHBcAg in a dose dependent manner (Stoop et al., 2005). Tregare also capable of inhibiting the proliferation and IFN-γproduction of HBV-specific CD8+ T cells (Franzese et al.,2005).
In the current study we observed a decrease in the per-centage of Treg after the first 3 months of adefovir treatment,the time-period in which the most prominent decrease in viralload occurs. Simultaneously we observed an increase in theproliferation and the number of IFN-γ producing cells uponstimulation with HBcAg. This increased response to HBcAg ismost likely an increase in CD4+ T-cell functioning since HBcAghas been described to induce predominantly a CD4+ T-cellresponse (Lau et al., 2002). After 6 months of adefovir treatmentthere was no further decline in Treg and no further increase in thenumber of IFN-γ producing cells and proliferation to HBcAg.
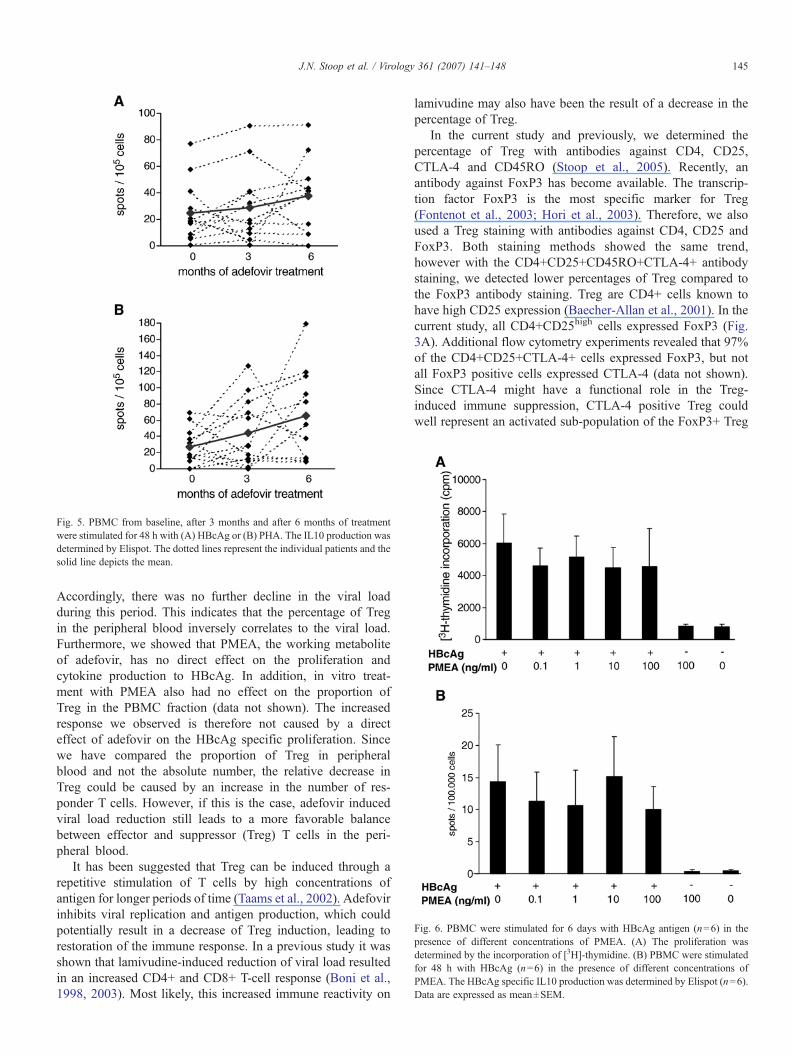
Fig. 5. PBMC from baseline, after 3 months and after 6 months of treatmentwere stimulated for 48 h with (A) HBcAg or (B) PHA. The IL10 production wasdetermined by Elispot. The dotted lines represent the individual patients and thesolid line depicts the mean.
Fig. 6. PBMC were stimulated for 6 days with HBcAg antigen (n=6) in thepresence of different concentrations of PMEA. (A) The proliferation wasdetermined by the incorporation of [3H]-thymidine. (B) PBMC were stimulatedfor 48 h with HBcAg (n=6) in the presence of different concentrations ofPMEA. The HBcAg specific IL10 production was determined by Elispot (n=6).Data are expressed as mean±SEM.
145J.N. Stoop et al. / Virology 361 (2007) 141–148
Accordingly, there was no further decline in the viral loadduring this period. This indicates that the percentage of Tregin the peripheral blood inversely correlates to the viral load.Furthermore, we showed that PMEA, the working metaboliteof adefovir, has no direct effect on the proliferation andcytokine production to HBcAg. In addition, in vitro treat-ment with PMEA also had no effect on the proportion ofTreg in the PBMC fraction (data not shown). The increasedresponse we observed is therefore not caused by a directeffect of adefovir on the HBcAg specific proliferation. Sincewe have compared the proportion of Treg in peripheralblood and not the absolute number, the relative decrease inTreg could be caused by an increase in the number of res-ponder T cells. However, if this is the case, adefovir inducedviral load reduction still leads to a more favorable balancebetween effector and suppressor (Treg) T cells in the peri-pheral blood.
It has been suggested that Treg can be induced through arepetitive stimulation of T cells by high concentrations ofantigen for longer periods of time (Taams et al., 2002). Adefovirinhibits viral replication and antigen production, which couldpotentially result in a decrease of Treg induction, leading torestoration of the immune response. In a previous study it wasshown that lamivudine-induced reduction of viral load resultedin an increased CD4+ and CD8+ T-cell response (Boni et al.,1998, 2003). Most likely, this increased immune reactivity on
lamivudine may also have been the result of a decrease in thepercentage of Treg.
In the current study and previously, we determined thepercentage of Treg with antibodies against CD4, CD25,CTLA-4 and CD45RO (Stoop et al., 2005). Recently, anantibody against FoxP3 has become available. The transcrip-tion factor FoxP3 is the most specific marker for Treg(Fontenot et al., 2003; Hori et al., 2003). Therefore, we alsoused a Treg staining with antibodies against CD4, CD25 andFoxP3. Both staining methods showed the same trend,however with the CD4+CD25+CD45RO+CTLA-4+ antibodystaining, we detected lower percentages of Treg compared tothe FoxP3 antibody staining. Treg are CD4+ cells known tohave high CD25 expression (Baecher-Allan et al., 2001). In thecurrent study, all CD4+CD25high cells expressed FoxP3 (Fig.3A). Additional flow cytometry experiments revealed that 97%of the CD4+CD25+CTLA-4+ cells expressed FoxP3, but notall FoxP3 positive cells expressed CTLA-4 (data not shown).Since CTLA-4 might have a functional role in the Treg-induced immune suppression, CTLA-4 positive Treg couldwell represent an activated sub-population of the FoxP3+ Treg

Table 1
Patient characteristics at baseline (n=12)
Sex 10 male (83%)Age 48 (28–67) a yearsHBV DNA (copies/ml) 1.69×10⁸ (2.00×10⁴–2.14×10⁹) a
Race Asian: 5 (42%)Caucasian: 7 (58%)
ALT (units/l) 119 (43–467) a
HBeAg positive 6 (50%)Cirrhosis 2 (17%)Previous treatment Treatment naive: 7 (58%)
PEG interferon+ lamivudine: 3 (25%)Entecavir: 2 (17%)
a Median (range).
146 J.N. Stoop et al. / Virology 361 (2007) 141–148
(Read et al., 2000; Takahashi et al., 2000; Thornton andShevach, 2000).
The response to the control antigen (tetanus toxin) was alsoincreased. This could be explained by a decrease in activatedHBV-specific Treg. Treg have to be activated through their T-cell receptor, but once activated the suppression by Treg is non-specific (Jonuleit et al., 2001; Thornton and Shevach, 2000).Therefore, the decrease in viral load will result in less HBV-specific activated Treg capable of inhibiting the response of alsonon-HBV-specific T cells.
The number of IL10 producing cells was not reducedduring treatment. The lack in decrease of cells producing thisimmunoregulatory cytokine could be one of the reasons thatantiviral therapy does not lead to a sustained antiviral res-ponse, but also suggests that Treg are not solely responsiblefor the hyporesponsiveness in chronic HBV patients. Re-cently, another regulatory T-cell type, besides CD4+CD25+Treg, has been described. These so called T regulatory type1 cells (Tr1) are CD4 positive cells, and their suppression ismediated through an IL10 dependent mechanism (Foussat etal., 2003). These Tr1 cells also play a dominant role in thelatent immune response against Epstein–Barr virus (Marshallet al., 2003) and could be responsible for part of the IL10production by PBMC observed in patients with a chronicHBV infection (Hyodo et al., 2003). Since the viral loadreduction caused by adefovir is not sufficient to restore theantiviral immune response, as depicted by the unchangedproduction of the immunoregulatory cytokine IL10, combi-nation therapy with antiviral drugs and immunomodulatorytherapy may be more successful in perpetuating the antiviralimmune response after treatment discontinuation.
In conclusion, viral load reduction induced by treatment withadefovir results in a partial restoration of the impaired immuneresponse, as indicated by a decrease in percentages of Treg aswell as an increased HBV-specific proliferation and IFN-γproduction. IL10 production, however, remained unaffected.The decrease in Treg is most likely established by the removalof the constant activation of the immune system by the highviral load.
Materials and methods
Patients
Peripheral blood mononuclear cells (PBMC) from 12chronic hepatitis B patients (10 males and 2 females, age 28to 67 years; Table 1) were obtained at baseline and after 3 and 6months of adefovir treatment (10 mg orally per day). Atbaseline the median serum HBV DNA level was 1.7×10⁸ geq/ml (range 2.0×10⁴ to 2.1×10⁹), and median alanine trans-aminase level (ALT), which is an indication of the extent ofhepatocellular injury, was 119 U/l (range 43–467). Six patientswere HBV e antigen (HBeAg) positive at baseline, and allpatients had biopsy proven chronic hepatitis with various degreeof liver inflammation and fibrosis. Seven patients weretreatment naive, and five patients had previously been treatedwith IFN-α and lamivudine (n=3) or with entecavir (n=2).
Patients co-infected with human immunodeficiency virus,hepatitis A virus, hepatitis C virus (HCV) or hepatitis D virusand patients with other types of hepatitis were excluded fromthis study. Also patients who were pregnant or had receivedantiviral, immune suppressive or immunomodulatory treatmentduring the last 6 months were excluded from this study. Allparticipants gave informed consent before blood sampling.
Virological assessment
Serum HBeAg and anti-HBe were determined quantitativelyusing the Abbott IMX system (Abbot Laboratories, NorthChicago, IL) according to the manufacturer's instructions.Serum HBV DNAwas determined using an in-house developedTaqMan Polymerase chain reaction based on the Eurohepstandard (detection limit, 373 geq/ml) (Applied Biosystems,Foster City, CA) (Pas et al., 2000).
Isolation of the PBMC and flow cytometric analysis
PBMC were obtained by ficoll separation (Ficoll-Paque™plus, Amersham Biosciences, Buckinghamshire, UK). Theywere immediately frozen in RPMI 1640 (Bio Whittaker,Verviers, Belgium) containing 20% fetal calf serum (Hyclone,Logan, UT) and 10% dimethyl sulfoxide and stored at −135 °C.PBMC from different time points were tested simultaneously toavoid interassay variations in individual patients. Flow cyto-metric analysis was performed on the stored samples usingfluorochrome conjugated antibodies specific for the surfacemarkers CD4, CD45RO and CD25 diluted in PBS/0.3% bovineserum albumin. The cells were fixed by incubation withintraprep reagent 1 and permeabilized by incubation withintraprep reagent 2 (Beckman-Coulter, Marseille, France). Anti-CTLA-4 antibody was added during permeabilization. Thefollowing antibodies were used: anti-CD4-PerCP-Cy5.5 (SK3)(Pharmingen, San Diego, CA), anti-CD45RO-APC (UCHL1)(Becton Dickinson, San Jose, CA), anti-CD25-FITC (2A3)(Becton Dickinson), anti-CTLA-4-PE (BNI3) (Immunotech,Marseille, France). For the anti-CD45RO-APC, anti-CD25-FITC and CTLA-4-PE, isotype matched control antibodies wereused to determine the level of background staining. The FoxP3antibody staining was performed according to the manufac-turer's instructions. Briefly, cells surface markers were stained

147J.N. Stoop et al. / Virology 361 (2007) 141–148
with anti-CD25-PE (M-A251) (Pharmingen) and anti-CD4-PerCP-Cy5.5 (SK3) (Pharmingen). The cells were fixed andpermeabilized with Fix/perm buffer and permeabilization buffer(eBiosciences, San Diego, Ca) anti-FoxP3-APC (PCH101)(eBiosciences) was added during permeabilization. For anti-CD25-PE and anti-FoxP3-APC isotype matched control anti-bodies were used. After staining the cells were analyzed using afour-color cytometer (FACScalibur™, CELLQuest Pro™ soft-ware, Beckton Dickinson).
Proliferation assay
The proliferation of mainly CD4+ T cells was determined asdescribed earlier (Stoop et al., 2005). Briefly, PBMC werecultured in triplicate in a concentration of 1×10⁵ cells per wellin 100 μl RPMI 1640 (Bio Whittaker) containing 5% pooledhuman serum (Department of Immunohematology and Blood-bank, Leiden University Medical Center, Leiden, The Nether-lands) and penicillin/streptomycin (Gibco, Paisley, UK). Thecells were stimulated with 1 μg/ml HBcAg (a kind gift by M.van Roosmalen, Biomerieux, Boxtel, The Netherlands), 15limits of flocculation/ml purified tetanus toxin (SVM, Biltho-ven, The Netherlands) or not stimulated and cultured for 6 days.After 5 days of incubation, the cells were pulsed with 0.25 μCi/well of [3H]-thymidine (Radiochemical Centre, Amersham,Little Chalfont, UK). The cells were harvested 16 h later.Proliferation was determined by liquid scintillation counting ofthe harvested cells.
IFN-γ and IL10 Elispot
The IFN-γ production of CD4+ T cells was determined byElispot as described earlier (Lau et al., 2002). Briefly, PBMCwere cultured in triplicate in a concentration of 1×10⁵ cells perwell in 100 μl RPMI 1640 (Bio Whittaker) containing 5%pooled human serum (Department of Immunohematology andBloodbank, Leiden University Medical Center) and penicillin/streptomycin (Gibco). The cells were stimulated with either1 μg/ml HBcAg, 20 μg/ml phytohemagglutinin (PHA) (Murex)or 15 limits of flocculation/ml purified tetanus toxin (SVM) orwere left unstimulated and cultured for 24 h. After 24 h thePBMC were transferred to antibody coated Elispot immuno-plates. The IFN-γ Elispot kit was obtained from U-CyTech(Utrecht, The Netherlands) and the IL10 Elispot kit wasobtained from Miltenyi Biotec (Bergisch Gladbach, Germany).Both assays were performed according to the manufacturer'sinstructions. The spots were counted using a Bioreader 3000from BioSys (Karben, Germany). The number of spots depictedrepresents the number of spots produced by stimulated cellsminus the number of spots produced by unstimulated cells.
In vitro effect of adefovir on the functioning of PBMC
9-(-2)-phosphonylmethoxy-ethyladenine (PMEA) is theactive metabolite of adefovir (Liu et al., 2004). PMEA waskindly provided by Gilead Sciences Inc. (Foster City, CA).PBMC from untreated HBV patients were stimulated with
HBcAg in the presence of 100 ng/ml, 10 ng/ml, 1 ng/ml and0.1 ng/ml of PMEA or no PMEA. Unstimulated PBMC andunstimulated PBMC in the presence of 100 ng/ml of PMEAwere used as a negative control. The proliferation and IL10production were determined by [3H]-thymidine incorporationand Elispot for all conditions.
Statistical analysis
All flow cytometry and functional data were compared tolevels at baseline using a Wilcoxon matched pairs signed ranksum test. SPSS version 11.5 for Windows (SPSS, Chicago, IL)was used. Correlations were determined using Spearman'scorrelation test. Results are given in mean±SEM, unlessspecified otherwise.
Acknowledgments
The authors want to thank M. van Roosmalen for providingrecombinant HBcAg and P.J. Biesta for technical assistance. Wealso want to thank W.F. Leemans, M.J. ter Borg, A.Keizerwaard, L.A. van Santen-van der Stel and C. van deEnt-van Rij for their help with obtaining blood samples.
Financial support for this study was provided by GileadSciences. HLA Janssen is a clinical fellow of the NetherlandsOrganization of Scientific Research (NWO, The Hague, TheNetherlands).
References
Asmuth, D.M., Nguyen, H.H., Melcher, G.P., Cohen, S.H., Pollard, R.B., 2004.Treatments for hepatitis B. Clin. Infect. Dis. 39 (9), 1353–1362.
Baecher-Allan, C., Brown, J.A., Freeman, G.J., Hafler, D.A., 2001. CD4+CD25high regulatory cells in human peripheral blood. J. Immunol. 167 (3),1245–1253.
Bertoletti, A., Naoumov, N.V., 2003. Translation of immunological knowledgeinto better treatments of chronic hepatitis B. J. Hepatol. 39 (1), 115–124.
Bertoletti, A., D'Elios, M.M., Boni, C., De Carli, M., Zignego, A.L., Durazzo,M., Missale, G., Penna, A., Fiaccadori, F., Del Prete, G., Ferrari, C., 1997.Different cytokine profiles of intrahepatic T cells in chronic hepatitis B andhepatitis C virus infections. Gastroenterology 112 (1), 193–199.
Boni, C., Bertoletti, A., Penna, A., Cavalli, A., Pilli, M., Urbani, S.,Scognamiglio, P., Boehme, R., Panebianco, R., Fiaccadori, F., Ferrari, C.,1998. Lamivudine treatment can restore T cell responsiveness in chronichepatitis B. J. Clin. Invest. 102 (5), 968–975.
Boni, C., Penna, A., Bertoletti, A., Lamonaca, V., Rapti, I., Missale, G., Pilli, M.,Urbani, S., Cavalli, A., Cerioni, S., Panebianco, R., Jenkins, J., Ferrari, C.,2003. Transient restoration of anti-viral T cell responses induced bylamivudine therapy in chronic hepatitis B. J. Hepatol. 39 (4), 595–605.
Fontenot, J.D., Gavin, M.A., Rudensky, A.Y., 2003. Foxp3 programs thedevelopment and function of CD4+CD25+ regulatory T cells. Nat.Immunol. 4 (4), 330–336.
Foussat, A., Cottrez, F., Brun, V., Fournier, N., Breittmayer, J.P., Groux, H.,2003. A comparative study between T regulatory type 1 and CD4+CD25+ T cells in the control of inflammation. J. Immunol. 171 (10),5018–5026.
Franzese, O., Kennedy, P.T., Gehring, A.J., Gotto, J., Williams, R., Maini, M.K.,Bertoletti, A., 2005. Modulation of the CD8+-T-cell response by CD4+CD25+ regulatory T cells in patients with hepatitis B virus infection.J. Virol. 79 (6), 3322–3328.
Hori, S., Nomura, T., Sakaguchi, S., 2003. Control of regulatory T celldevelopment by the transcription factor Foxp3. Science 299 (5609),1057–1061.

148 J.N. Stoop et al. / Virology 361 (2007) 141–148
Hyodo, N., Tajimi, M., Ugajin, T., Nakamura, I., Imawari, M., 2003.Frequencies of interferon-gamma and interleukin-10 secreting cells inperipheral blood mononuclear cells and liver infiltrating lymphocytes inchronic hepatitis B virus infection. Hepatol. Res. 27 (2), 109–116.
Jonuleit, H., Schmitt, E., Stassen,M., Tuettenberg, A., Knop, J., Enk, A.H., 2001.Identification and functional characterization of human CD4(+)CD25(+)T cells with regulatory properties isolated from peripheral blood. J. Exp.Med. 193 (11), 1285–1294.
Lan, R.Y., Cheng, C., Lian, Z.X., Tsuneyama, K., Yang, G.X., Moritoki, Y.,Chuang, Y.H., Nakamura, T., Saito, S., Shimoda, S., Tanaka, A., Bowlus,C.L., Takano, Y., Ansari, A.A., Coppel, R.L., Gershwin, M.E., 2006.Liver-targeted and peripheral blood alterations of regulatory T cells inprimary biliary cirrhosis. Hepatology 43 (4), 729–737.
Lau, G.K., Suri, D., Liang, R., Rigopoulou, E.I., Thomas, M.G., Mullerova, I.,Nanji, A., Yuen, S.T., Williams, R., Naoumov, N.V., 2002. Resolution ofchronic hepatitis B and anti-HBs seroconversion in humans by adoptivetransfer of immunity to hepatitis B core antigen. Gastroenterology 122 (3),614–624.
Lee, W.M., 1997. Hepatitis B virus infection. N. Engl. J. Med. 337 (24),1733–1745.
Liu, Y., Xu, G., Xu, C., Garcia, L., Lin, C.C., Yeh, L.T., 2004. Ultra sensitivemethod for the determination of 9-(2-phosphonylmethoxyethyl)adeninein human serum by liquid chromatography-tandem mass spectrometry.J. Chromatogr., B: Analyt. Technol. Biomed. Life Sci. 803 (2), 293–298.
Lok, A.S., Heathcote, E.J., Hoofnagle, J.H., 2001. Management of hepatitis B:2000—Summary of a workshop. Gastroenterology 120 (7), 1828–1853.
Marcellin, P., Chang, T.T., Lim, S.G., Tong, M.J., Sievert, W., Shiffman, M.L.,Jeffers, L., Goodman, Z., Wulfsohn, M.S., Xiong, S., Fry, J., Brosgart, C.L.,2003. Adefovir dipivoxil for the treatment of hepatitis B e antigen-positivechronic hepatitis B. N. Engl. J. Med. 348 (9), 808–816.
Marshall, N.A., Vickers, M.A., Barker, R.N., 2003. Regulatory T cells secretingIL-10 dominate the immune response to EBV latent membrane protein 1.J. Immunol. 170 (12), 6183–6189.
Pas, S.D., Fries, E., De Man, R.A., Osterhaus, A.D., Niesters, H.G., 2000.Development of a quantitative real-time detection assay for hepatitis B virusDNA and comparison with two commercial assays. J. Clin. Microbiol. 38(8), 2897–2901.
Read, S., Malmstrom, V., Powrie, F., 2000. Cytotoxic T lymphocyte-associatedantigen 4 plays an essential role in the function of CD25(+)CD4(+)regulatory cells that control intestinal inflammation. J. Exp. Med. 192 (2),295–302.
Rehermann, B., Fowler, P., Sidney, J., Person, J., Redeker, A., Brown, M., Moss,B., Sette, A., Chisari, F.V., 1995. The cytotoxic T lymphocyte response tomultiple hepatitis B virus polymerase epitopes during and after acute viralhepatitis. J. Exp. Med. 181 (3), 1047–1058.
Stoop, J.N., van der Molen, R.G., Baan, C.C., van der Laan, L.J., Kuipers, E.J.,Kusters, J.G., Janssen, H.L., 2005. Regulatory T cells contribute to theimpaired immune response in patients with chronic hepatitis B virusinfection. Hepatology 41 (4), 771–778.
Taams, L.S., Vukmanovic-Stejic, M., Smith, J., Dunne, P.J., Fletcher, J.M.,Plunkett, F.J., Ebeling, S.B., Lombardi, G., Rustin, M.H., Bijlsma, J.W.,Lafeber, F.P., Salmon, M., Akbar, A.N., 2002. Antigen-specific T cellsuppression by human CD4+CD25+ regulatory T cells. Eur. J. Immunol. 32(6), 1621–1630.
Takahashi, T., Tagami, T., Yamazaki, S., Uede, T., Shimizu, J., Sakaguchi, N.,Mak, T.W., Sakaguchi, S., 2000. Immunologic self-tolerance maintained byCD25(+)CD4(+) regulatory T cells constitutively expressing cytotoxic Tlymphocyte-associated antigen 4. J. Exp. Med. 192 (2), 303–310.
Thornton, A.M., Shevach, E.M., 2000. Suppressor effector function of CD4+CD25+ immunoregulatory T cells is antigen nonspecific. J. Immunol. 164(1), 183–190.
Xu, D., Fu, J., Jin, L., Zhang, H., Zhou, C., Zou, Z., Zhao, J.M., Zhang, B., Shi,M., Ding, X., Tang, Z., Fu, Y.X., Wang, F.S., 2006. Circulating and liverresident CD4+CD25+ regulatory T cells actively influence the antiviralimmune response and disease progression in patients with hepatitis B.J. Immunol. 177 (1), 739–747.
Copyright © 2022 FDOKUMEN