Infrared Light Curves of Mira Variable Stars from COBE DIRBE Data
34
arXiv:astro-ph/0111151v1 7 Nov 2001 Infrared Light Curves of Mira Variable Stars from COBE DIRBE Data Beverly J. Smith Department of Physics and Astronomy, East Tennessee State University, Box 70652, Johnson City, TN 37614 [email protected] David Leisawitz Goddard Space Flight Center [email protected] Michael W. Castelaz Pisgah Astronomical Research Institute, 1 PARI Drive, Rosman, NC 28772 [email protected] Donald Luttermoser Department of Physics and Astronomy, East Tennessee State University, Box 70652, Johnson City, TN 37614 [email protected] ABSTRACT We have used the COBE DIRBE database to derive near- and mid-infrared light curves for a well-defined sample of 38 infrared-bright Mira variable stars, and compared with optical data from the AAVSO. In general, the 3.5 μm and 4.9 μm DIRBE bandpasses provide the best S/N light curves, with S/N decreasing with wavelength at longer wavelengths. At 25 μm, good light curves are only available for ∼10% of our stars, and at wavelengths ≥ 60 μm, extracting high quality light curves is not possible. The amplitude of variability is typically less in the near-infrared than in the optical, and less in the mid-infrared than in the near-infrared, with decreasing amplitude with increasing wavelength. On average, there are 0.20 ± 0.01 magnitudes variation at 1.25 μm and 0.14 ± 0.01 magnitudes variation at 4.9 μm for each magnitude variation in V. The observed amplitudes are consistent with results of recent theoretical models of circumstellar dust shells around Mira variables. For a few stars in our sample, we find clear evidence of time lags between the optical and near-infrared maxima of phase ∼ 0.05 - 0.13, with no lags in the minima. For three stars, mid-infrared maximum appears to occur slightly before that in the near-infrared, but after optical maximum. We find three examples of secondary maxima in the rising portions of the DIRBE light curves, all of which have optical counterparts in the AAVSO data, supporting the hypothesis that they are due to shocks rather than newly-formed dust layers. We find no conclusive evidence for rapid (hours to days) variations in the infrared brightnesses of these stars. Subject headings: stars: AGB and post-AGB, stars: variable: Miras 1
Transcript of Infrared Light Curves of Mira Variable Stars from COBE DIRBE Data
arX
iv:a
stro
-ph/
0111
151v
1 7
Nov
200
1
Infrared Light Curves of Mira Variable Stars
from COBE DIRBE Data
Beverly J. SmithDepartment of Physics and Astronomy, East Tennessee State University, Box 70652, Johnson City, TN
37614
David LeisawitzGoddard Space Flight Center
Michael W. CastelazPisgah Astronomical Research Institute, 1 PARI Drive, Rosman, NC 28772
Donald LuttermoserDepartment of Physics and Astronomy, East Tennessee State University, Box 70652, Johnson City, TN
37614
ABSTRACT
We have used the COBE DIRBE database to derive near- and mid-infrared light curves for awell-defined sample of 38 infrared-bright Mira variable stars, and compared with optical data fromthe AAVSO. In general, the 3.5 µm and 4.9 µm DIRBE bandpasses provide the best S/N lightcurves, with S/N decreasing with wavelength at longer wavelengths. At 25 µm, good light curvesare only available for ∼10% of our stars, and at wavelengths ≥ 60 µm, extracting high qualitylight curves is not possible. The amplitude of variability is typically less in the near-infrared thanin the optical, and less in the mid-infrared than in the near-infrared, with decreasing amplitudewith increasing wavelength. On average, there are 0.20 ± 0.01 magnitudes variation at 1.25 µmand 0.14 ± 0.01 magnitudes variation at 4.9 µm for each magnitude variation in V. The observedamplitudes are consistent with results of recent theoretical models of circumstellar dust shellsaround Mira variables. For a few stars in our sample, we find clear evidence of time lags betweenthe optical and near-infrared maxima of phase ∼ 0.05 − 0.13, with no lags in the minima. Forthree stars, mid-infrared maximum appears to occur slightly before that in the near-infrared, butafter optical maximum. We find three examples of secondary maxima in the rising portions ofthe DIRBE light curves, all of which have optical counterparts in the AAVSO data, supportingthe hypothesis that they are due to shocks rather than newly-formed dust layers. We find noconclusive evidence for rapid (hours to days) variations in the infrared brightnesses of these stars.
Subject headings: stars: AGB and post-AGB, stars: variable: Miras
1
1. Introduction
Current theories of stellar evolution indicatethat low mass (≤8 M⊙) stars pass through the pul-sating Mira star phase at the end of their time asAsymptotic Giant Branch stars (Wood 1997; Olof-sson 1999). Although the time that stars spend asMira variables is relatively short (∼6 × 10⁴ years;Wood (1990)), this stage is very important be-cause these stars have very high rates of mass loss(up to 10−4 M⊙ yr−1; Knapp & Morris (1985)).This means that they return large quantities ofcarbon, oxygen, and nitrogen-enriched gas to theinterstellar medium (Sedlmayr 1994). At present,the mass loss process, the properties of the cir-cumstellar envelopes of these stars, and how theserelate to the variability of the star are still not verywell-understood.
To better understand these processes, detailedstudies of Mira variables at infrared wavelengthsare helpful. In the near-infrared, photosphericemission dominates, while at wavelengths longerthan ∼3 µm emission from dust in the circum-stellar envelope becomes important (Woolf & Ney1969). Infrared observations have been used toconstrain models of the circumstellar envelopesof Mira variables and to estimate mass loss ratesfrom these stars (Jura 1986; Bedijn 1987; Onakaet al. 1989a,b; Anandarao et al. 1993; Le Bertre &Winters 1998). These studies, however, are basedon time-averaged broadband fluxes from the In-frared Astronomical Satellite (IRAS) (Jura 1986;Bedijn 1987; Anandarao et al. 1993; Le Bertre &Winters 1998) or time-averaged 8 − 23 µm IRASLow Resolution Spectrometer (LRS) spectra (On-aka et al. 1989a,b), and have not investigated mid-or far-infrared variability of these stars.
To better understand mass loss in these stars,infrared monitoring is helpful. Such studies haverevealed variations in the infrared spectral en-ergy distributions of Miras with time. Broad-band infrared observations indicate that the am-plitude of variation tends to decrease with wave-length from the optical through the mid-infrared(Lockwood & Wing 1971; Harvey et al. 1974;Catchpole et al. 1979; Barthes, Chenevez, & Mat-tei 1996; Le Bertre 1992, 1993; Little-Marenin etal. 1996). Spectroscopic observations with IRAS(Little-Marenin & Stencel 1992; Hron & Aringer1994; Little-Marenin et al. 1996), ground-based
telescopes (Creech-Eakman et al. 1997; Monnieret al. 1998), and the Infrared Space Observatory(ISO) (Onaka et al. 1997) showed that at leastfor some Miras the silicate features tend to de-crease in flux from light curve maximum to min-imum. There is also evidence from IRAS datafor far-infrared variations of Miras (Little-Marenin& Stencel 1992; Little-Marenin et al. 1996; Spearet al. 1993), however, the IRAS light curves arepoorly-sampled, so variations at these wavelengthsare not well-studied.
Infrared monitoring of Mira variables has alsorevealed wavelength-dependent phase lags. Themaxima at 1 µm (Petit & Nicholson 1933; Lock-wood & Wing 1971; Barnes 1973) and 2.7 µm(Maran et al. 1977) typically lag those at V byabout 0.1 phase, while no lags are seen in the min-ima. At present, phase lags at longer wavelengthsare not well-determined. There have also been afew reported observations of large-amplitude (0.5− 1 magnitudes) very short-term (hours to days)variations in the visual (Maffei & Tosti 1995; deLaverny et al. 1998) and near-infrared (Smak &Wing 1979b; Guenter & Henson 2001) light curvesof Mira variables, but such variations have not yetbeen reported at longer wavelengths.
The previously-cited studies generally providelong-wavelength infrared light curves for only arelatively small sample of stars, and generally sam-ple only a fraction of the light curve of these stars.To obtain more complete infrared light curves fora larger sample of Mira stars, we have used datafrom the Diffuse Infrared Background Experiment(DIRBE) instrument (Hauser et al. 1998) on theCosmic Background Explorer (COBE) spacecraft(Boggess et al. 1992). To date, little research hasbeen done on infrared variability of stars usingDIRBE data, in spite of its suitability for suchstudies.
The COBE satellite was launched in Novem-ber 1989, and the DIRBE instrument functionedat cryogenic temperatures from 11 December 1989until 21 September 1990. This 10 month timescaleis suitable for searching for variations in long pe-riod variables. In the course of a week, a typ-ical point on the sky was observed 10-15 timesby DIRBE, and over the course of the cryogenicmission, it was observed about 200 times (Hauseret al. 1998). The temporal coverage of DIRBEvaries with sky position. Some parts of the sky
2
had relatively complete coverage; for other re-gions, there were gaps in the coverage of severalmonths (Hauser et al. 1998). DIRBE operated at10 infrared wavelengths (1.25, 2.2, 3.5, 4.9, 12,25, 60, 100, 140, and 240 µm), providing a nearlycomplete infrared spectrum. This allows us to tiestellar phenomena, as seen in the visual and near-infrared, to circumstellar emission, seen at longerwavelengths. The beam size of the DIRBE in-strument, 0.7 degrees, although large, is still suffi-ciently small that individual infrared-bright starscan be discerned.
We have used DIRBE data to extract 1.25 µm− 240 µm light curves for 38 Mira variables andcompared them to available optical data. We haveinvestigated the shapes of the light curves, ampli-tude variations, and phase lags, and have com-pared these results to recent models of circumstel-lar dust emission from Miras.
2. Sample Selection and Infrared Light
Curve Derivation
Our stars were selected from the 12 µm flux-limited sample of variable stars described by Sloan& Price (1998) and Sloan et al. (1998). This sam-ple was obtained by cross-referencing the GeneralCatalogue of Variable Stars (Kholopov et al. 1985-1988) with the IRAS Point Source Catalog (1988).We selected a subset of this sample, with an IRAS12 µm flux density cutoff of 235 Jy and classifica-tion as Mira stars. A total of 38 stars are includedin our set (Tables 1 and 2). Eight of these areclassified as carbon-rich Mira variables (Table 1),while 30 are oxygen-rich (Table 2). In Tables 1 and2, we provide the positions, the period of variabil-ity, the IRAS 12 µm magnitude, the optical spec-tral type, and the dust spectral type (based onthe IRAS LRS spectra). The positions are fromthe SIMBAD database; the rest of the informa-tion is from Sloan & Price (1998) or Sloan et al.(1998).
Infrared light curves were derived for these starsfrom the DIRBE data using two methods. Wefirst extracted light curves from the COBE DIRBEWeekly Sky Maps. These are weekly-averaged in-tensity maps of the sky in the ten DIRBE wave-length bands. The stellar photometry was deter-mined by multiplying the surface brightess of theWeekly Sky Maps at the stellar position by the
DIRBE beam solid angle, after sky subtraction.For sky values, we used the average of the fluxesat four positions 2◦ N, S, E, and W in equatorialcoordinates. Flux uncertainties were obtained byusing the quoted DIRBE photometric uncertain-ties combined in quadrature with the dispersionin the four sky measurements. At 1.25 µm − 240µm, respectively, the average noise levels in theselight curves are 35 Jy, 40 Jy, 35 Jy, 20 Jy, 120 Jy,155 Jy, 140 Jy, 460 Jy, 2850 Jy, and 1250 Jy.
The second method of obtaining light curvesused the DIRBE Calibrated Individual Observa-tions (CIO) data files. The CIO database con-tains the calibrated individual 1/8th second sam-ples taken in science-survey mode during each dayof the cryogenic mission. For all scans that passedwithin 0.3◦ of the target position, a linear base-line was fit to the sections ±1.35◦ − 2.25◦ fromthe point of closest approach. The point sourcephotometry was obtained by subtraction of thisbaseline and correcting for DIRBE beam response.The uncertainties in the point source photometryare calculated as the quadrature sum of the rmsnoise of the baseline, an error due to positionaluncertainties of 1′ in both the in-scan and cross-scan directions, an error due to short-term detec-tor gain variations, and signal-dependent detectornoise. For the light curves derived from the CIOdata, average noise levels per datapoint are 25 Jy,20 Jy, 20 Jy, 10 Jy, 30 Jy, 55 Jy, 320 Jy, 765 Jy,4800 Jy, and 2750 Jy for the DIRBE 1.25 − 240µm filters, respectively.
Datapoints with large uncertainties (greaterthan three times the average uncertainty) wereeliminated from the dataset, since anomalouslylarge errorbars were likely caused by cosmic rayhits or the presence of a nearby companion in theDIRBE scan. Careful comparison of individualDIRBE scan locations with the IRAS Point SourceCatalog (1988) and the all-sky near-infrared cat-alog developed by Smith (1995) for position re-construction for the Infrared Telescope in Space(IRTS) mission (Murakami et al. 1996; Wheatonet al. 1997) shows that when an infrared-brightcompanion was present in the baseline portionof the scan, the derived stellar photometry wassometimes discrepant with large uncertainties.
These two methods provided consistent lightcurves, with flux densities that agree within 15%,4%, 12%, 2%, 6%, 3%, and 12%, for the 1.25
3
µm - 60 µm bands, respectively, when averagedover our light curves. As noted in the DIRBE Ex-planatory Supplement (Hauser et al. 1998), pointsource photometry from the Weekly Sky Mapsmay suffer a small systematic offset when com-pared to the CIO data. The CIO data are believedto be more accurate for point source photometry(Hauser et al. 1998), so for the following analy-sis we focus on the CIO light curves. Note thatfor the six shortest wavelengths, the uncertaintiesin the CIO light curves are less than those of thephotometry derived from the Weekly Sky Maps, inspite of the shorter time coverage per data point.This provides a second reason for using the CIOlight curves rather than the light curves from theWeekly Sky Maps.
Note that the uncertainties used in this pa-per do not include absolute flux calibration er-rors, and that color corrections were not madeto the DIRBE flux densities. The color correc-tions are typically quite small, particularly at theshorter DIRBE wavelengths. For the stars in oursample, the color correction tables in Hauser etal. (1998) give estimated color correction factors(Fobserved/Ftrue) that range from 0.99 − 1.03 at1.25 µm, 0.99 − 1.03 at 2.2 µm, 0.98 − 1.01at 3.5 µm, 0.99 − 1.01 at 4.9 µm, 0.89 − 1.1at 12 µm, and 0.5 − 2.8 at 25 µm. The rangequoted for each wavelength reflects the uncertaintyassociated with the shape of the emissivity law(ǫ ∝ ν1−2), the fact that the spectral energy dis-tribution of each star is variable in time, and thefact that each star has a slightly different spectralenergy distribution.
3. Optical Data
For the period of the COBE mission, 23 outof our 38 stars have well-sampled visual (V) lightcurves available from the American Association ofVariable Star Observers (AAVSO) dataset (Mattei2000). These stars are identified in the last columnof Tables 1 and 2. These optical light curves areplotted along with the infrared data in Figures 1and 2.
4. Results
4.1. Overview of the Light Curves
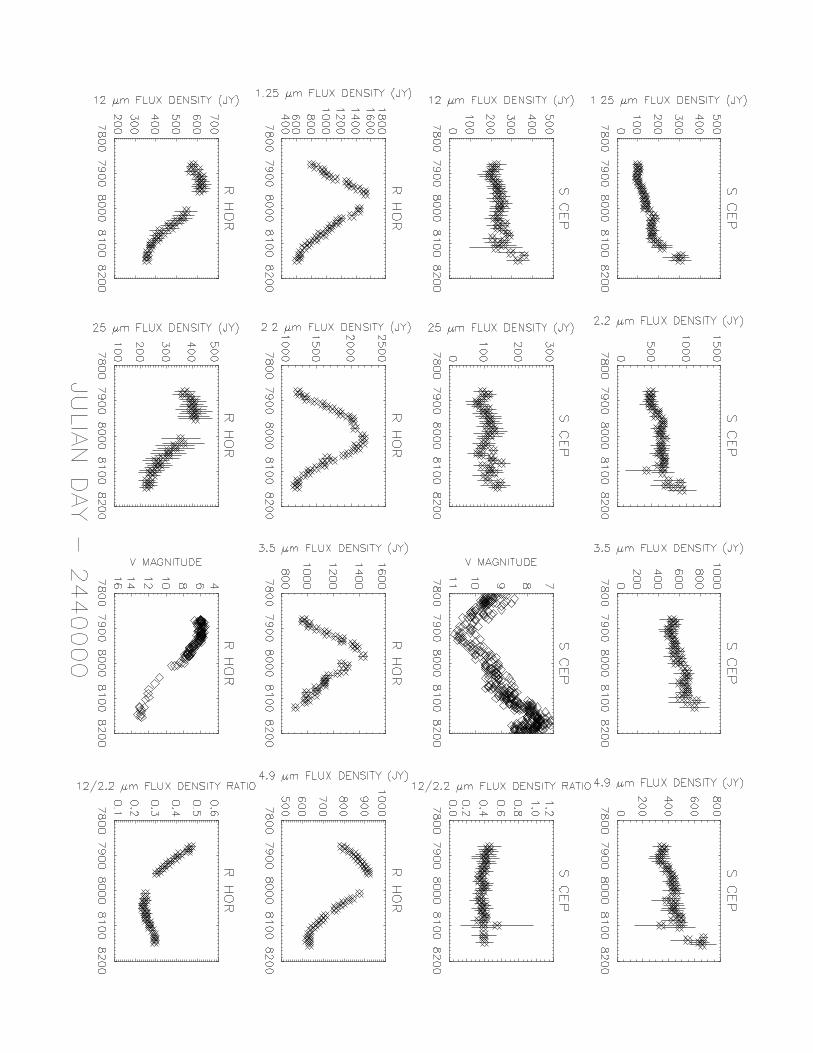
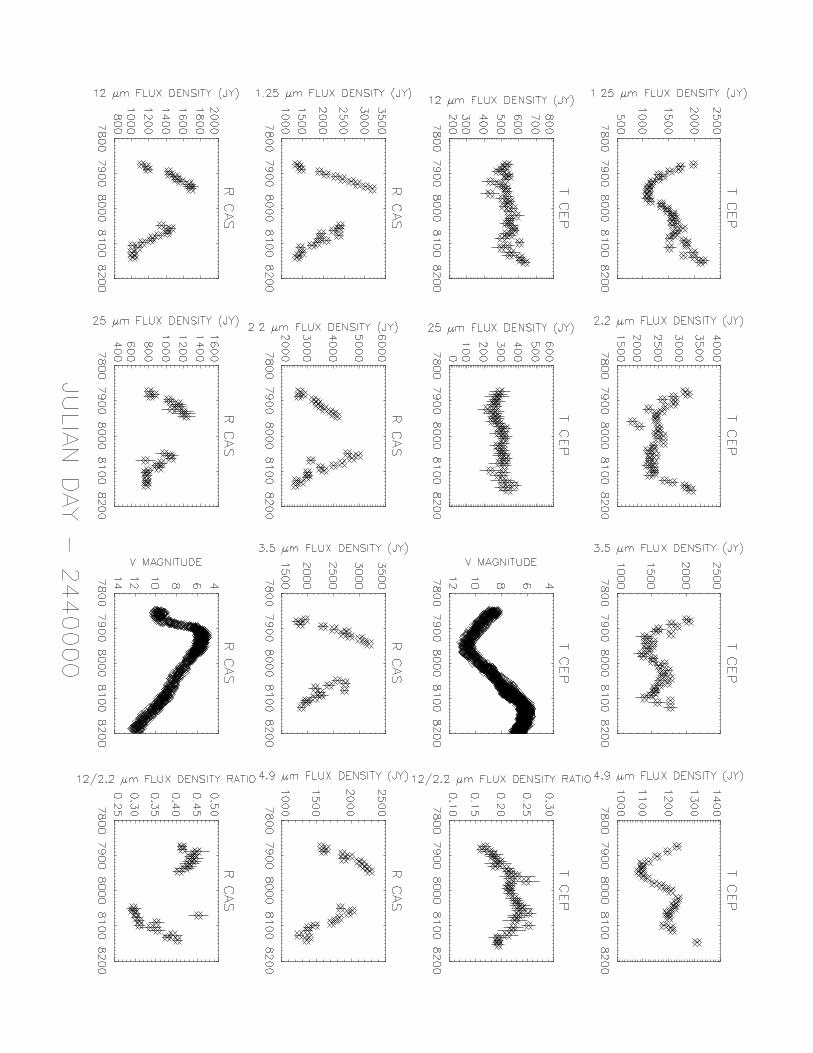
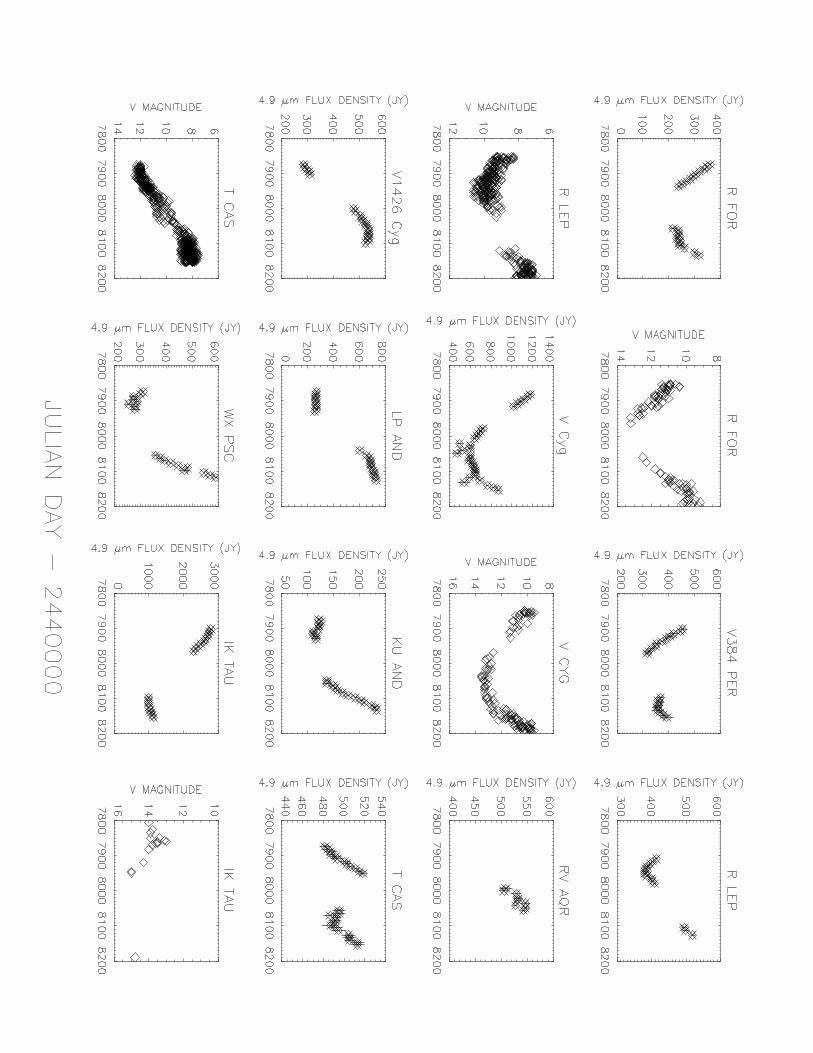
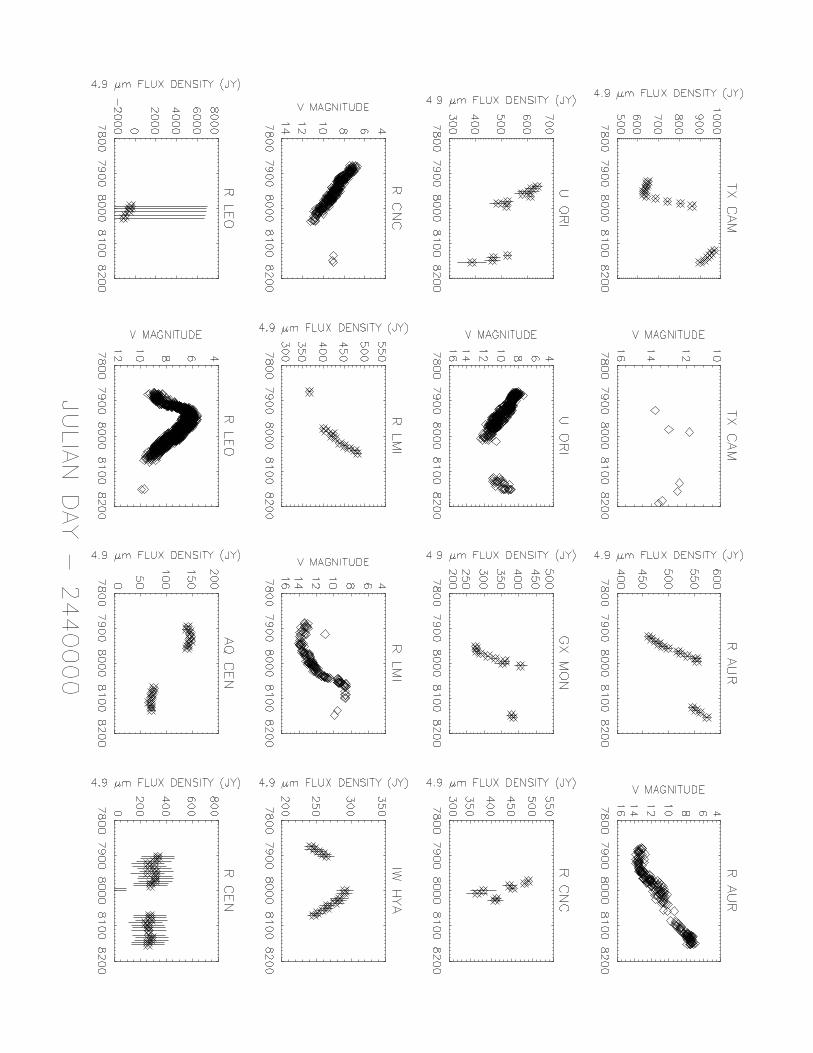
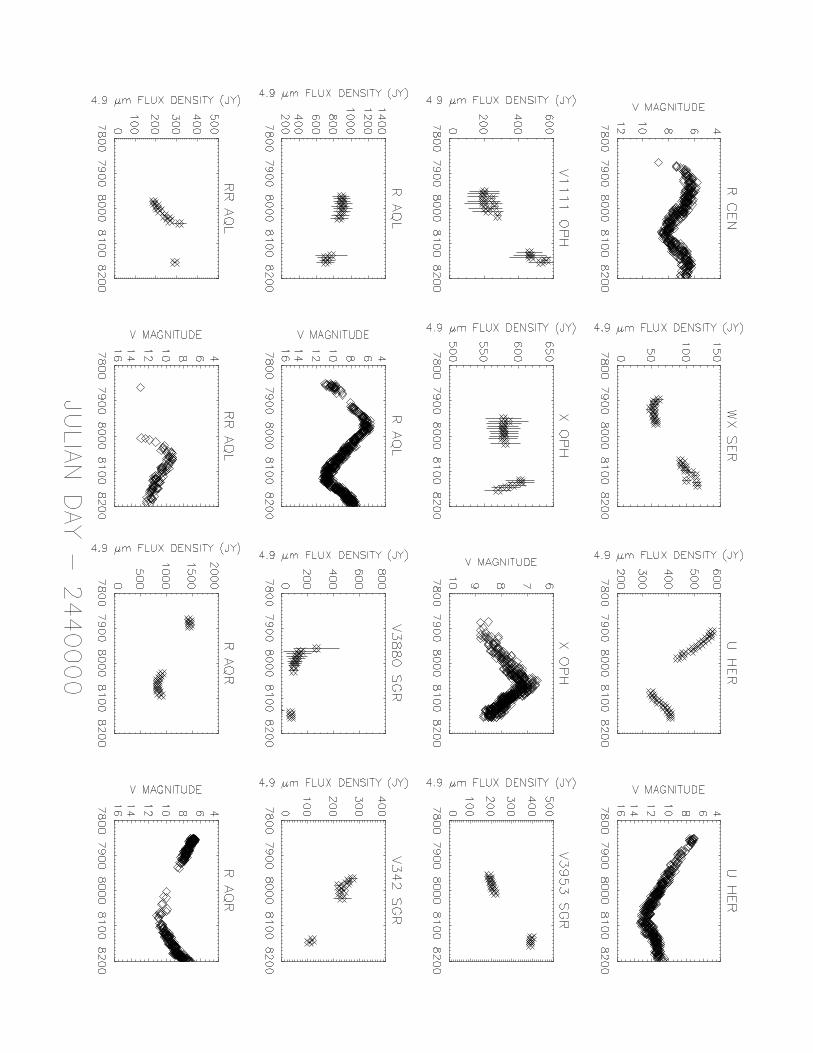
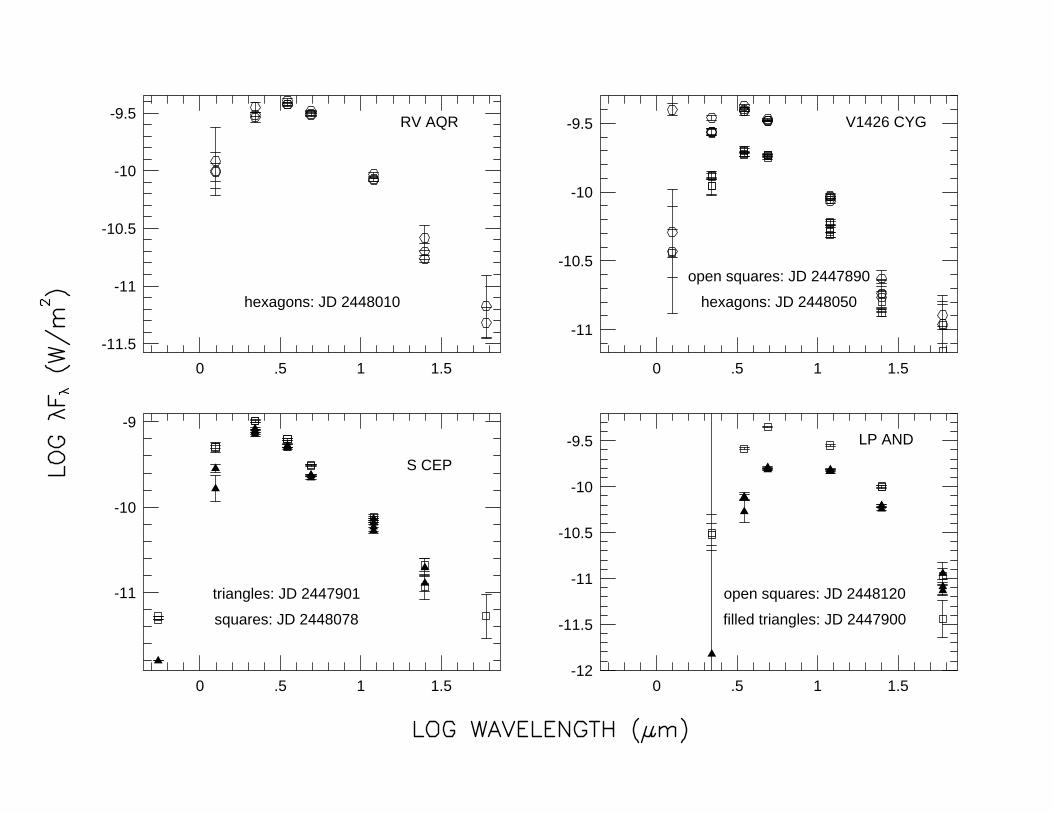
In Figure 1 we present plots of flux density vs.time for the six shortest wavelength DIRBE bandsfor six stars with relatively complete DIRBE lightcurves. In Figure 1, we also include the visuallight curves when available, as well as the 2.2 µmto 12 µm flux ratio as a function of time. For RWVel, which does not have optical data available, wealso plot F4.9 µm/F2.2 µm vs. time. In Figure 2, weprovide 4.9 µm light curves for the remaining 31stars in our sample, along with optical light curveswhen available. These same data are displayedin a different manner in Figure 3, where we plotthe optical-infrared spectral energy distributionsfor all 38 stars at one or more times during theCOBE mission vs. wavelength.
In general, the 3.5 µm and 4.9 µm light curveshave the best S/N. At 3.5 µm and 4.9 µm, re-spectively, on average the stars have 18.0 and 17.15σ weekly-averaged flux measurements from theWeekly Sky Maps (out of a total possible of 41weeks). In the CIO light curves, at 3.5 µm, theaverage number of datapoints is 490, and at 4.9µm, 500 points are available on average. Almostcomplete 4.9 µm light curves (≥30 weeks of 5σ
data) are available for five stars in the sample,while 31 stars (82% of the sample) have at least10 5σ datapoints available. Beyond 4.9 µm, theS/N drops with increasing wavelength. At 12 µm,for example, out of the 38 sample stars only 14(37%) have more than ten datapoints detected atthe 5σ level or better in the Weekly Maps. By 25µm, this number is down to nine stars (24%), andat the four longest DIRBE wavelengths, no starshave more than ten 5σ weekly datapoints in theirWeekly Map light curves.
The stars in our sample are expected to beamong the brightest in the infrared, so these statis-tics show the limitations of DIRBE data in study-ing infrared variability of unresolved sources. At60 µm and longer wavelengths, the signal-to-noiseratio is too poor to obtain light curves usingDIRBE data. At 25 µm, good light curves (20weeks at 5σ) are available for only four out of our38 stars (11%).
4
4.2. Infrared Variability of our Sample
Stars from DIRBE
In many of the light curves shown in Figures1 and 2, variations are clearly apparent in theDIRBE data. Variations are also clearly evidentin the spectral energy distributions plotted in Fig-ure 3. The best wavelengths at which to observevariability are 3.5 µm and 4.9 µm, where 30 and31 stars, respectively, show ≥3σ variability in theWeekly Maps. At 25 µm, only 3 stars vary morethan 3σ in the weekly data.
As an approximation based on the general ap-pearance of the light curves in Figure 1, whenpossible we fit the infrared light curves (in mag-nitude units) to sine functions to estimate ampli-tudes and dates of maxima (Table 3). Such fitswere only possible for three stars in our sample:R Hor (Figure 1a), RW Vel (Figure 1b), and RCas (Figure 1c). The rest of the light curves weretoo incomplete or too peculiar to be accurately fitto a sine function. Even for R Hor, RW Vel, andR Cas, these fits should be taken as approxima-tions, since the light curves are not perfect sinefunctions. These fits, however, provide useful es-timates of the amplitudes of variation and the JDdates of maxima as a function of wavelength (Ta-ble 3). Since we have less than a full pulsation cy-cle of infrared data for these stars, we were unableto obtain a good fit for the period of variabilityfrom the DIRBE data alone. We therefore fixedthe period to be equal to that in the optical, andfit the DIRBE data for the amplitude and timeof maximum. For R Hor and R Cas, we obtainedthe optical period by fitting the AAVSO data forJD = 2447500 − 2448700 (∼3 pulsation cycles) tosine functions. We found periods of 416.5 days and439.7 days for R Hor and R Cas, respectively, closeto the values given in Sloan & Price (1998) (Table2). For RW Vel, which does not have AAVSO dataavailable for this time period, we simply used theperiod given in Sloan & Price (1998) of 443.1 days(Table 2).
The stars in our sample with almost completeDIRBE light curves (Figure 1) can be dividedinto two groups: those with approximately sinu-soidal infrared light curves (R Hor, R Cas, andRW Vel), and those which show a plateau, or in-flection point, in the rising portion of their lightcurves (R Car, T Cep, and S Cep). Note that all
three of the stars with sinusoidal light curves areoxygen-rich stars, while two stars with inflectionpoints are oxygen-rich (R Car and T Cep) and one(S Cep) is a carbon star.
The best example of a secondary maximum isseen in the light curves of R Car (Figure 1b) atJD ∼ 2448045 (phase ∼ 0.75), where it is visibleat all wavelengths between 1.25 µm and 12 µm,and maybe at 25 µm as well, with a duration of ∼40 days (Figure 1). These secondary maxima showan increase in brightness of ∼15 − 40% relative tothat expected from a sinusoidal light curve. Thisinflection point is also visible in the optical lightcurve, at a similar level (∼0.4 magnitudes).
The lower S/N light curves of T Cep (Figure1c) show weak inflection points at JD ∼ 2448020at 1.25 µm, 2.2 µm, 3.5 µm, and 4.9 µm, with a du-ration of ∼ 90 days. S Cep (Figure 1a) has possibleinflection points between JD ∼ 2447980−2448020in the four shortest wavelength DIRBE bands. Inboth cases, optical counterparts are indicated bythe AAVSO data, with ∆mag(V) ∼ 0.4.
We also searched the CIO light curves for largeamplitude, short-term (2 hours to 10 days) varia-tions in brightness, but found no conclusive de-tections greater than 0.2 magnitudes at the 3σ
level. A handful of datapoints with very dis-crepant fluxes were noted in the CIO light curves,however, these were always individual isolatedpoints, with discrepant fluxes at only one wave-length, thus their anomalous fluxes are likely dueto cosmic ray hits rather than stellar variations.We note that in the CIO data, the typical timebetween successive observations of the same staris ∼9 hours, so these data are not particularly sen-sitive to extremely short variations.
4.3. Wavelength-Dependent Phase Lags
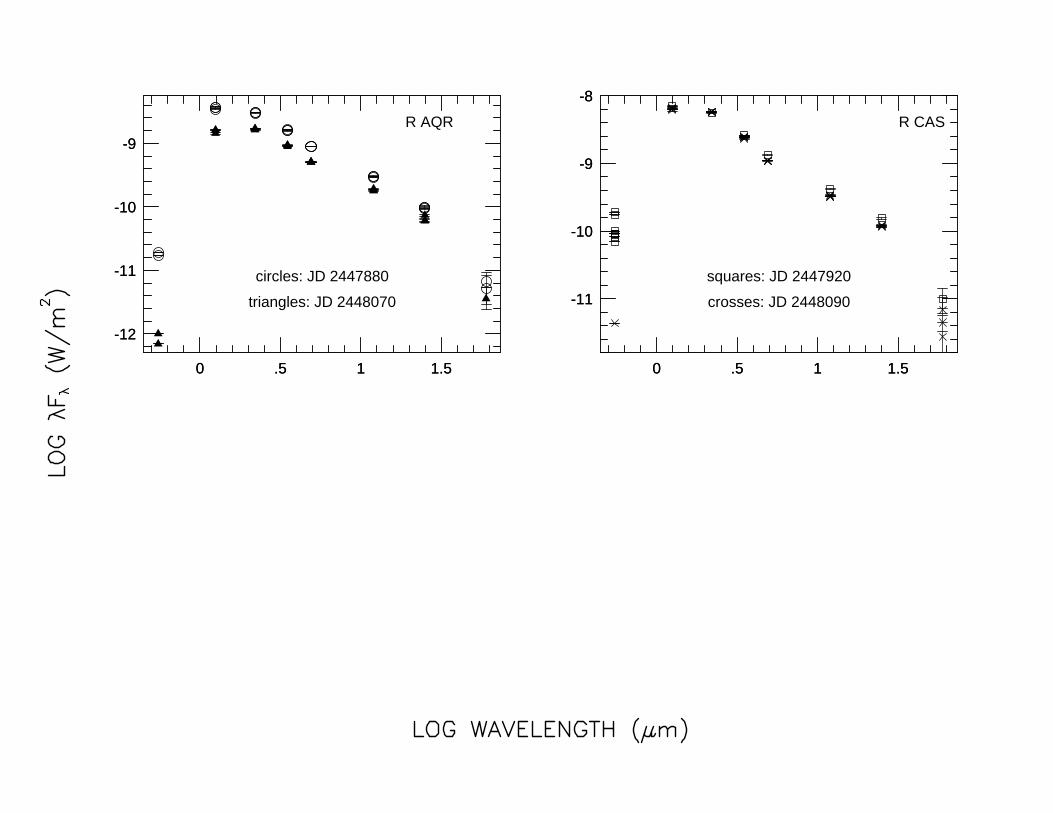
We used our light curves to search for phase lagsof the maxima as a function of wavelength. Fiveof our stars (R Hor, R Cas, R Cen, R Aql, andR Aqr), all of which are oxygen-rich, have bothoptical and infrared data available near maximumlight. All five stars show hints of an infrared delayrelative to V.
The best example is R Hor (Figure 1a), whichclearly shows a delay of the infrared relative toV at 1.25 µm, 2.2 µm, 3.5 µm, and 4.9 µm, andperhaps at 12 µm and 25 µm as well. The opti-
5
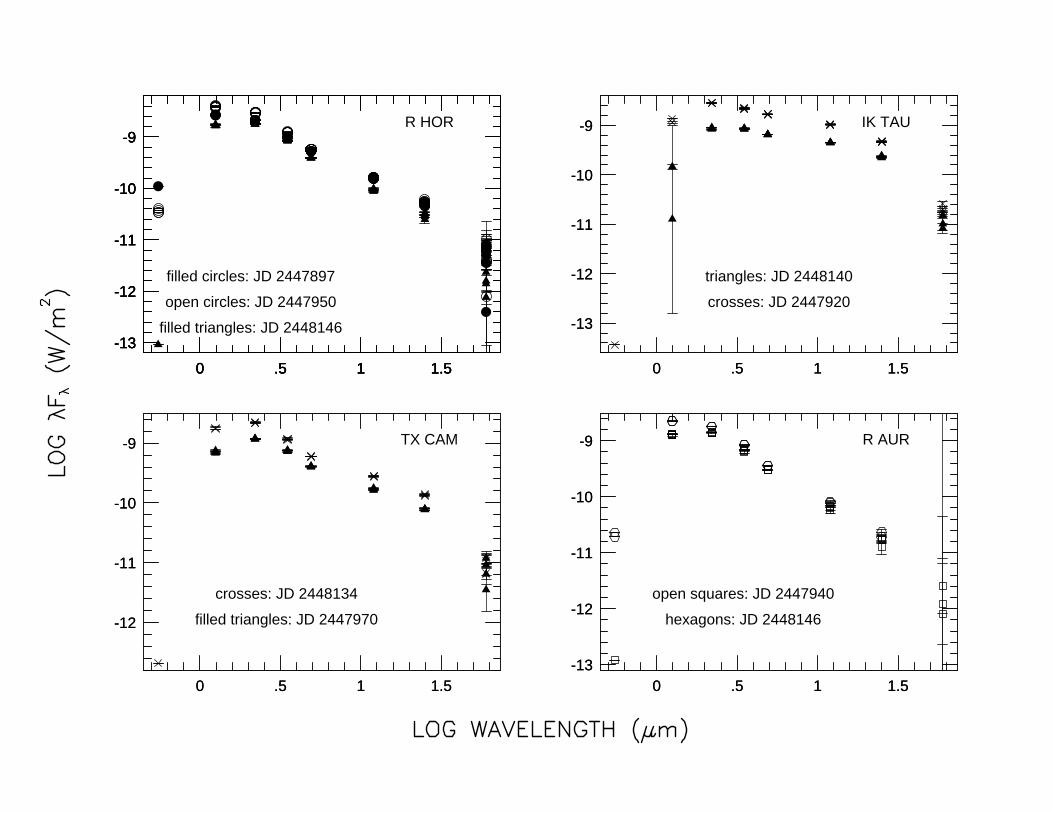
cal light curve peaks at JD ∼ 2447930, while theinfrared light curves are still rising until at leastJD ∼ 2447960, after which there are gaps in theDIRBE data until JD ∼ 2447990. These gaps arefollowed by a decrease in the infrared brightness.This phase lag can also be seen in Figure 3d, thespectral energy distribution plots. The optical fluxwas brighter in the JD 2447897 spectrum than inthe JD 2447950 spectrum, while the infrared fluxeswere brighter at JD 2447950.
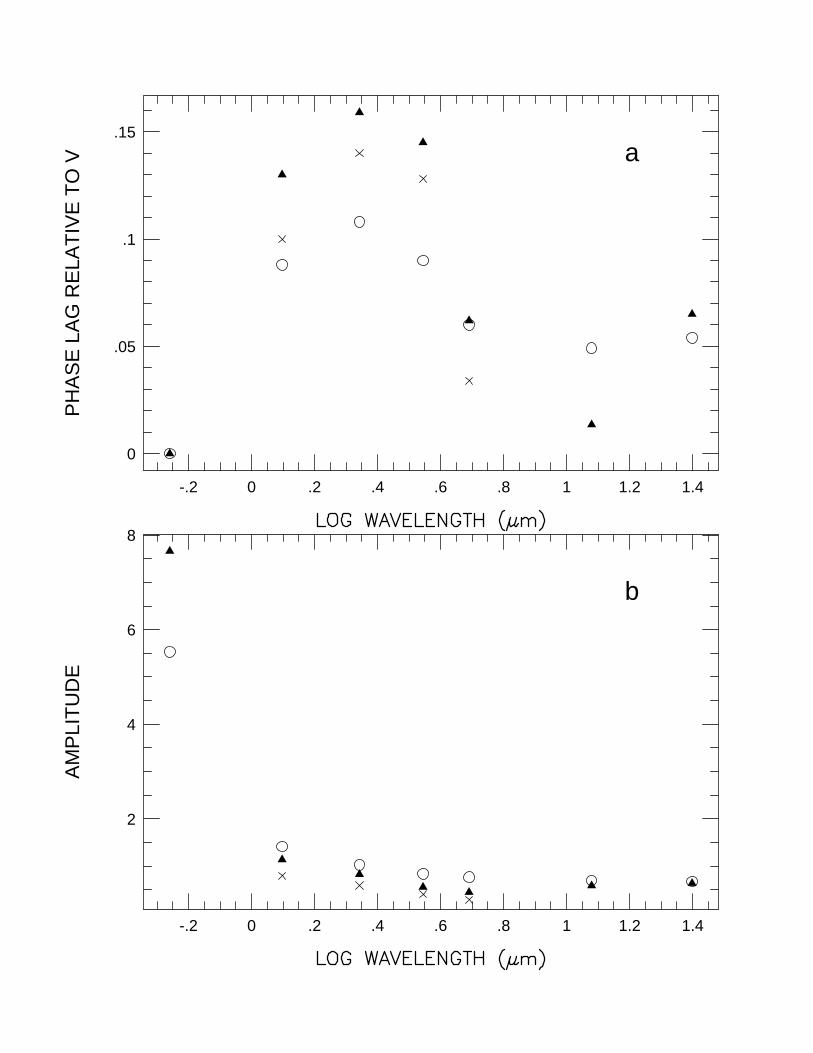
The existence of this lag is supported by oursinusoidal fits to the light curves (Table 3), whichshow that the 1.25 µm maximum followed thatat V by ∼53 days (0.13 phase) and the 2.2 µmmaximum lagged V by ∼65 days (0.16 phase). InFigure 4a, for the three stars for which we obtainedsinusoidal fits to the light curves, we plot the phaselag relative to V as a function of wavelength. ForRW Vel, for which we have no optical data, weassumed a 1.25 µm lag relative to V of 0.1 phase.
R Cas also shows evidence for an infrared toV time lag (Figure 1c; Figure 4). In the visible,R Cas was brightest at JD ∼ 2447930, while the1.25 µm − 25 µm emission was still increasing 10days later, at JD ∼ 2447940 (phase ∼ 0.02), afterwhich there is a gap in the DIRBE coverage. Thebest-fit sine curves (Table 3) show a 1.25 µm lagrelative to V of 38 days (0.09 phase) and a 2.2 µmlag relative to V of 47 days (0.11 phase).
Our data suggest not just offsets between op-tical to infrared maxima, but also offsets betweenthe DIRBE wavelengths. For two of our stars withrelatively complete, high S/N DIRBE light curves,R Hor and R Cas, the shapes of the observed lightcurves differ from wavelength to wavelength. Inparticular, comparison of the 2.2 µm, 4.9 µm, and12 µm light curves hint that the 4.9 µm and 12µm maxima for these stars may have occurred be-fore the 2.2 µm peaks (but after the optical max-ima). The existence of these offsets is supportedby our sinusoidal fits to the data (Table 3; Figure4). For R Hor, the best fit maxima at 1.25 µm to3.5 µm are at JD = 2447993 ± 6 days (0.13 − 0.16phase), while those at 4.9 µm to 25 µm were 30− 50 days earlier (0.06 − 0.12 phase). For R Cas,the maxima at 1.25 µm to 3.5 µm occurred at JD= 2447999 ± 6 (∼0.10 phase), while the 4.9 µmto 25 µm peak is at JD = 2447979 ± 3, 20 daysearlier (∼0.05 phase).
Of the stars with no optical data available, the
most complete infrared light curves are availablefor RW Vel (Figure 1b). For this star, the max-ima at 1.25 µm, 2.2 µm, and 3.5 µm occurred atJD = 2448023 ± 9, while the 4.9 µm maximumhappened 40 days earlier (0.09 phase) (Table 3).This is also visible in the F4.9 µm/F2.2 µm timeplot (Figure 1b). Other stars with possible phaselags include R Cen, R Aqr, and R Aql, whose 1.25µm maxima appear to lag those at V by ∼30 days(0.05 − 0.1 phase). These are uncertain, however,because of incompleteness in the light curves.
In addition to a mid-infrared/near-infraredphase shift, there may be smaller offsets betweenthe three near-infrared bands. In particular, notethat for the three stars with sinusoidal fits to theirlight curves (Table 3; Figure 4), the 2.2 µm lagsare always larger than those at 1.25 µm and 3.5µm. This result, however, is uncertain becausethese light curves are not perfect sine curves.
For six stars in our sample, there are both op-tical and infrared data available for a minimum inthe light curve: R Cen, V Cyg, T Cep, R Lep,R Aqr, and R Car. In all of these cases, there isno evidence for a wavelength-dependent time de-lay. Of the six, the highest S/N data are thoseof R Car (Figure 1b), which provides a 3σ upperlimit to the time lag relative to V for 1.25 µm −
25 µm of ∼50 days (phase ∼ 0.16). The data forR Lep (Figure 2a) provide a 3σ upper limit to apossible 4.9 µm to V time lag of 20 days (phase ∼
0.05), however, strong limits are not available forthe other DIRBE wavelengths.
4.4. Amplitude Variations with Wave-
length
Except for the phase lags noted above, in gen-eral the DIRBE light curves trace the opticallight curves, but with smaller amplitudes of varia-tion. For example, the optical brightness of R Hordropped 4.5 magnitudes between JD = 2448000and 2448160 (a factor of 63 in flux density), whilethe 1.25 micron flux density decreased by only afactor of 2.4 during this time (0.6 magnitudes). Ingeneral, the amplitude decreases with increasingwavelength. This is shown in Figure 4b, wherethe fitted amplitudes for the three stars in Table3 are plotted as a function of wavelength.
As noted earlier, it was not possible to fit thelight curves for most of our stars to an assumed si-
6
nusoidal variation, due to the incompleteness andpeculiarities of the light curves. To investigate am-plitude variations in a larger sample of stars, forthe stars with near-continuous high S/N time cov-erage for at least 10 weeks in both the optical andDIRBE data, in Figure 5a we plot the observed
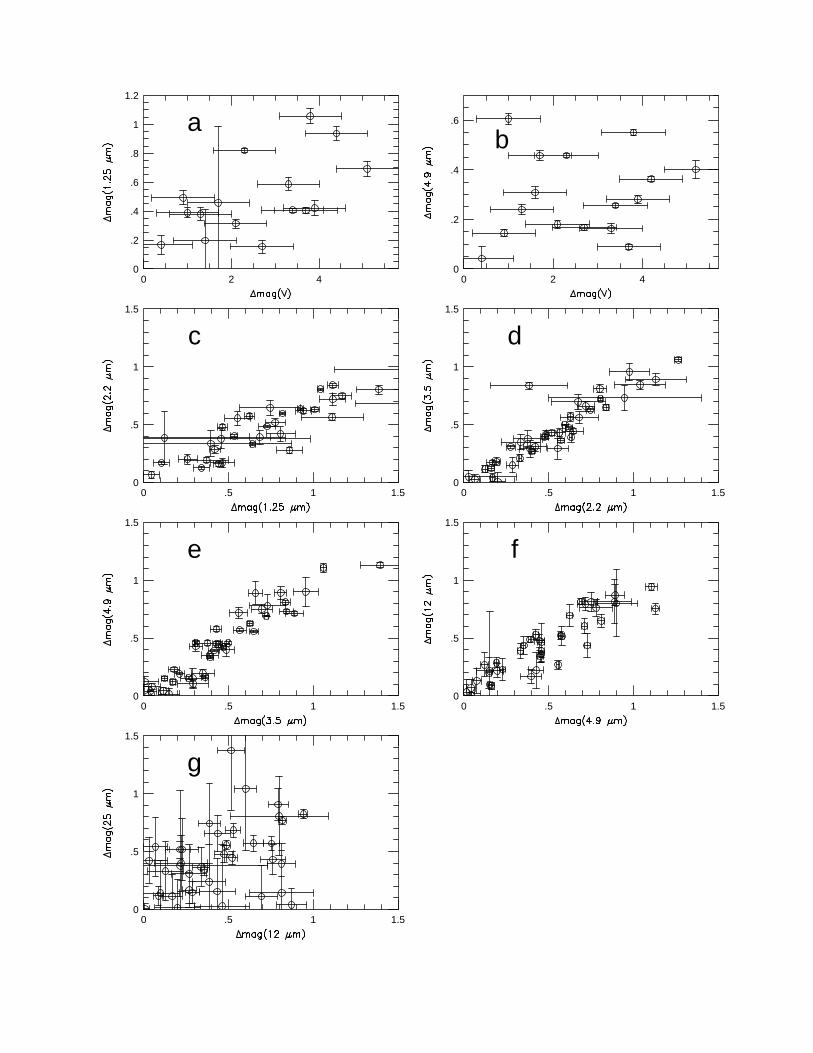
change in the V magnitude vs. the observed changein the 1.25 µm magnitude over the time periodfor which we have near-continuous data. We em-phasize that these magnitude changes generally donot represent the full range of variation for thesestars: they only represent time ranges for whichwe have full sets of data. We have excluded timeperiods during which a maximum or minimum wasoccuring because of the possibility of phase lags.In Figure 5b, we plot ∆mag(V) against ∆mag(4.9µm), using the same criteria.
In Figures 5c − 5g, we plot ∆mag(1.25 µm) vs.∆mag(2.2 µm), ∆mag(2.2 µm) vs. ∆mag(3.5 µm),∆mag(3.5 µm) vs. ∆mag(4.9 µm), ∆mag(4.9 µm)vs. ∆mag(12 µm), and ∆mag(12 µm) vs. ∆mag(25 µm).The data plotted in these figures is for all stars inour sample, regardless of whether optical data areavailable, excluding only stars with less than 10weeks of high S/N data. The magnitude changeswere measured between the observed maxima andminima of the light curves, ignoring time periodsduring which no data were available. As with theFigures 5a and 5b, these magnitude changes donot necessarily represent the full range of varia-tion for these stars; they are merely the magnitudechanges observed in the DIRBE data.
Figures 5a and 5b show that, although the Vmagnitudes of these stars may vary by severalmagnitudes during the plotted time intervals, the1.25 µm magnitudes typically only change by ∼0.5magnitudes, and the 4.9 µm typical vary by only∼0.25 magnitudes. On average, for every mag-nitude of variation in V, the 1.25 µm brightnessvaries by 0.20 ± 0.01 magnitudes and the 4.9µm brightness varies by 0.14 ± 0.01 magnitudes.There is a slight correlation of ∆(1.25 µm) with∆V, and no observed correlation of ∆(4.9 µm)with ∆V.
In all of the infrared-infrared plots (Figures5c-5g), with the exception of ∆(25 µm) vs.∆(12 µm), clear correlations are visible. Theslopes of the best-fit lines are all less thanone, indicating decreasing amplitude, on average,with increasing wavelength. For each magnitude
change at 1.25 µm, on average, the 2.2 µm fluxchanges by only 0.69 ±0.01 magnitudes. The slopeof the ∆mag(2.2 µm) vs. ∆mag(3.5 µm) plot is0.83 ± 0.01, while the best-fit ∆mag(3.5 µm) vs.∆mag(4.9 µm) line has a slope of 0.96 ± 0.01.The ∆mag(4.9 µm) vs. ∆mag(12 µm) best-fit linehas a slope of 0.93 ± 0.04, and the ∆mag(12 µm)vs. ∆mag(25 µm) slope is 0.92 ± 0.10. Thusthe decrement of the amplitude with wavelengthis smaller in the mid-infrared than in the near-infrared.
In these plots, the slopes for oxygen-rich andcarbon-rich stars are similar, except that oxygen-rich stars have somewhat larger ∆mag(2.2 µm)/∆mag(1.25 µm)ratios on average (0.69 ± 0.01) than the carbon-rich stars (0.39 ± 0.04), and somewhat smaller∆mag(4.9 µm)/∆mag(3.5 µm) ratios (0.94 ±
0.01 vs. 1.26 ± 0.05). There are no signifi-cant differences between the slopes of long pe-riod (≥ 400 days) and short period stars, orbetween early-type (M4 − M6.5) and late-type(M7 − M10) oxygen-rich stars. The slopes forstars with dust spectral types of SE1 − SE4are consistent with those for stars with typesSE5 − SE7 (Table 2), with the exception ofthe ∆mag(12 µm)/∆mag(4.9 µm) ratio, whichis higher in SE5 − SE7 stars (1.02 ± 0.02 vs. 0.71± 0.05). Spectral types SE5 − SE7 have nar-rower, more pronounced 9.7 µm silicate emissionfeatures than types SE1 − SE4 (Sloan & Price1998). As noted earlier, a number of multi-epochinfrared spectroscopic studies show that, at leastfor some Miras, as the star increases in bright-ness, the strength of the silicate feature tends toincrease (Little-Marenin & Stencel 1992; Hron Åer 1994; Little-Marenin et al. 1996; Creech-Eakman et al. 1997; Onaka et al. 1997; Monnier etal. 1998). Thus, over a pulsation period, for starswith strong silicate emission features (dust typesSE5 − SE7), this effect may cause a larger changein F12 µm/F4.9 µm than in other stars, enhancingthe 12 µm/4.9 µm amplitude ratios for these starscompared to stars with dust types SE1 − SE4.
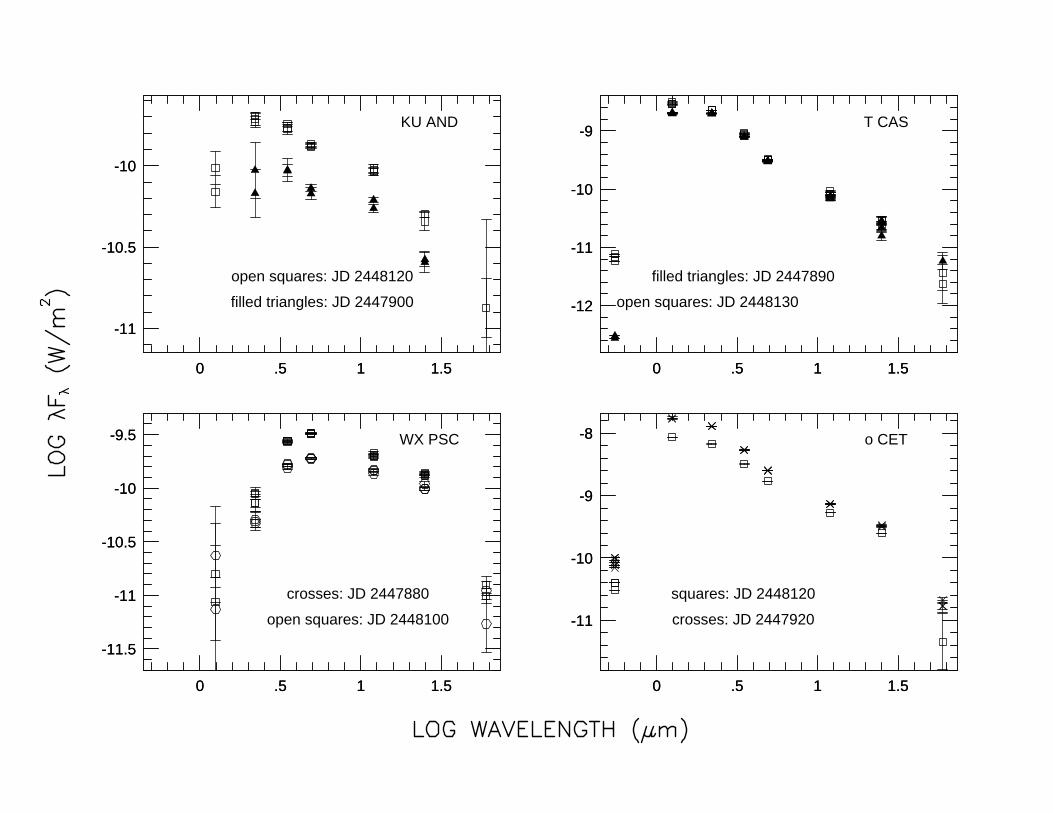
Amplitude decrements with wavelength are alsovisible in some of the spectral energy distributionplots (Figure 3). In particular, note the variationsin the spectral energy distributions of o Cet andIK Tau with time (Figures 3c and 3d). At a givenwavelength, the separation between data pointsobtained at different times tends to get smaller as
7
the wavelength increases.
4.5. General Remarks about the Optical-
Infrared Spectra
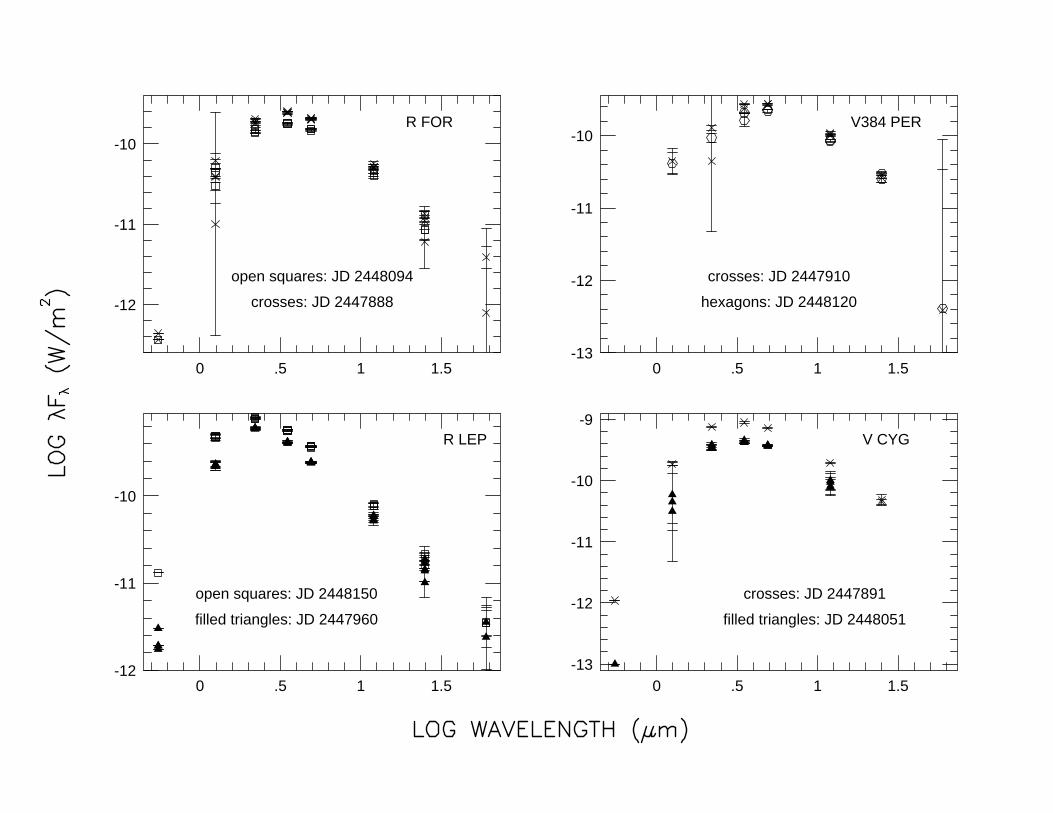
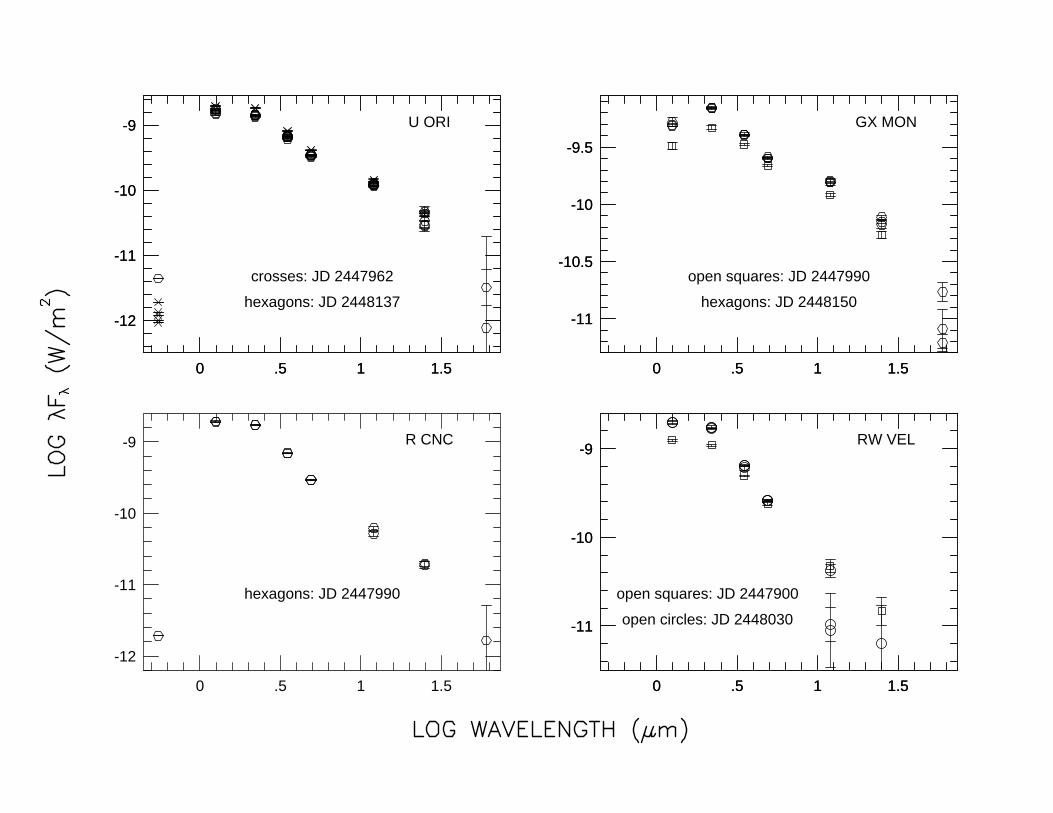
Figure 3 shows that the variation in the spectralenergy distribution of a given star over a pulsationperiod is much less than star-to-star differencesin spectral shape. The majority of the stars inour sample have spectral energy distributions thatpeak at 2.2 µm, but several are brightest at 1.25µm (for example, X Oph and R Aql; Figure 3h),and a number of stars peak at 3.5 µm (for exam-ple, R For and V Cyg; Figure 3a). Three stars, LPAnd (Figure 3b), V384 Per (Figure 3a), and WXPsc (Figure 3c), have very red spectral energy dis-tributions, peaking at 4.9 µm. Figure 3 shows thatthere is a clear statistical difference in the infrared-optical spectral energy distributions of carbon andoxygen-rich Miras, with carbon stars tending tohave redder spectral energy distributions. Six ofthe 8 carbon stars peak at 3.5 µm or 4.9 µm, butonly two of the 30 oxygen stars.
We note that WX Psc, the only oxygen-rich starin our sample to peak at 4.9 µm (Figure 3c), isalso the only star in our sample with an IRASdust spectral type of ‘silicate self-absorbed emis-sion’ (SB) (Table 2; see Sloan & Price (1998)).The rest of the stars have silicate emission spectra(dust class SE). With the exception of WX Psc,within the oxygen-rich class there is no strong cor-relation of the IRAS dust spectral type (Table 2)with the peak of the infrared-optical spectral en-ergy distribution as seen in the DIRBE data (Fig-ure 3). There is a weak correlation between opti-cal spectral type (Table 2) and the wavelength ofthe peak of the optical-infrared spectrum (Figure3), in that the two oxygen-rich stars with infraredspectral energy distributions that peak at 3.5 µm(IW Hya; Figure 3f) and 4.9 µm (WX Psc; Figure3c) have very late optical spectral types (M9 andM8, respectively).
For the carbon-rich stars, all but two have IRASdust spectral types of SiC, i.e., with the 11.2 µmSiC feature (Table 1, see Sloan et al. (1998)). Onestar (S Cep) has an IRAS spectral type of SiC+(the 11.2 µm feature plus a secondary feature at8.5 − 9 µm). The last carbon star in our sam-ple, LP And, has an IRAS classification of ‘red’,meaning that, in addition to the 11.2 µm feature,in the IRAS 8 − 23 µm spectrum the star shows a
strong infrared continuum increasing with increas-ing wavelengths. LP And is one of the two carbonstars in our sample with a very red DIRBE spec-trum, peaking at 4.9 µm (Figure 3b). LP And isalso the carbon star with the latest optical spectraltype in our sample, C8. For the rest of the car-bon stars, excluding LP And, there is no strongcorrelation of optical spectral type (Table 1) withDIRBE spectral peak (Figure 3).
5. Discussion
Our data show that the amplitude of varia-tion for our sample stars decreases with increasingwavelength, from the optical out to 25 µm. Theamount of decrease with wavelength is consistentwith the ground-based results of Le Bertre (1992,1993). If, at a particular time during the pulsationcycle, one approximates the ratio of the fluxes intwo adjacent wavelength bands by an attenuatedblackbody spectrum, the observed amplitude de-crease with increasing wavelength means that thetemperature of this blackbody increases as the starbecomes brighter.
The observed amplitude decrement with wave-length of a particular carbon-rich Mira, R For, wassuccessfully modeled by Le Bertre (1988). In thismodel, the dust condensation temperature is fixed,which causes the radius of condensation to movein and out in phase with the luminosity of thestar. The stellar spectrum was approximated by ablackbody, and a λ−1.3 dust opacity law was used.At a given radius, the dust temperature is high-est at highest stellar luminosity. Averaged over allthe dust in the shell, the effective dust tempera-ture is highest at maximum, consistent with theobservations.
More general, and more complex, models forcarbon-rich long period variables were developedby Winters et al. (1994b, 2000), using time-dependent hydrodynamics and a detailed treat-ment of the formation, growth, and evaporationof carbon grains. In these models, the pulsationof the underlying star is simulated by a sinusoidalvariation of the velocity in the lowest layer of theatmosphere, and isothermal shocks and completedust-grain momentum coupling are assumed. Newlayers of dust are formed periodically in the cir-cumstellar envelope, and radiation pressure pushesthis dust, and its swept-up gas, outwards. Dust
8
formation and growth are triggered by compres-sion of the gas due to the pulsation, and grain nu-cleation, growth, and evaporation are calculatedaccording to the relations in Gail, Keller & Sedl-mayr (1984), Gail & Sedlmayr (1988), and Gaugeret al. (1990). The frequency-dependent radiativetransfer equation in spherical geometry is solved asin Winters, Dominik, & Sedlmayr (1994a), usinggray absorption and thermal emission of the gasand frequency-dependent absorption and thermalemission of the dust. In the calculation of the dustopacity, the particles are assumed to be sphericaland small compared to the relevant wavelength ofthe radiation field.
Using this model, Winters et al. (1994b) calcu-lated light curves for a 1 M⊙, 104 L⊙ star with anassumed stellar temperature of 2600K, a period of650 days, and a velocity amplitude of 2 km s−1.They find amplitudes of 8 magnitudes at 0.55 µm,2.8 magnitudes at 0.9 µm, 1 magnitude at 1.65µm, 0.7 magnitudes at 2.2 µm, 0.35 magnitudesat 4.8 µm, and 0.2 magnitudes at 25 µm. Theseamplitude ratios are within a factor of two of ouraverage values for carbon stars, with the exceptionof the 25 µm amplitude, which is low by a factorof four.
By comparing the DIRBE data with lightcurves from the AAVSO, we found evidence fortime lags in the near-infrared maxima (1.25 − 3.5µm) relative to the optical for six stars, with phaseshifts between ∼0.05 − 0.13. This confirms thatthe stellar luminosity maximum occurs after visualmaximum, and the V light curve does not tracethe bolometric luminosity. We also found possiblelags between the near-infrared and mid-infraredmaxima (4.9 − 12 µm) for three stars, with themid-infrared flux peaking before the near-infraredbut after visual maximum. The mid-infrared tonear-infrared relative phase shifts are between ∼
0.05 − 0.12.
At present, there are no theoretical models ofMiras that predict both of these lags. The well-known 1.04 µm phase lag in Miras relative to V(Lockwood & Wing 1971; Barnes 1973) has beensuccessfully modeled by Alvarez & Plez (1998)as a consequence of the propagation of perturba-tions through the atmosphere. These perturba-tions cause time lags in the strength of the vana-dium oxide absorption relative to titanium ox-ide, because these species are formed at different
depths in the atmosphere. The V magnitudes ofM stars are strongly attenuated by TiO absorption(Smak & Wing 1979a).
Another factor that may contribute to phaselags is variations in the optical depth of the cir-cumstellar shell, which may periodically attenu-ate the visual light more than the near- and mid-infrared. Extinction-induced infrared-optical off-sets in the maxima are seen in the models of Win-ters et al. (1994b), however, in these models, op-tical maximum occurs after infrared maximum,while in our observations, the infrared maximumlags that in the optical. We note that the Winterset al. (1994b) models do not include the effect ofmolecular line opacity, while the models of Alvarez& Plez (1998) do not include dust absorption, soneither set of models do a complete analysis ofphase lags. It is possible that, for some stars, dustextinction can be neglected, for example, Lobel etal. (2000) model variations in the spectral energydistribution of o Cet using the DUSTY radiativetransfer code (Ivezic, Nenkova, & Elitzur 1996),and find that the circumnuclear shell of this staris optically thin. They conclude that the observedvisual-to-near-infrared phase lag of Mira cannotbe due to modulation of the optical by circumstel-lar extinction, but instead must originate in thestellar atmosphere itself.
In Section 3.2, we noted that some of our lightcurves are asymmetric, with secondary maxima orplateaus in the rising portion of the light curve.These two types of light curves were previouslynoted by Le Bertre (1992). Similar features ap-pear in the models of Winters et al. (1994b, 1995),where they are due to the formation of a newdust layer and subsequent excess infrared dustemission. Alternative explanations for such inflec-tion points are dissipation of shock wave energyin the inner part of the atmosphere (Feuchtingeret al. 1993) or formation of secondary shocks inthe inner-most dust-free region (Bowen et al. 1990;Willson et al. 1994). The fact that matching opti-cal excesses are present in the AAVSO data sup-ports the hypothesis that these features are dueto shocks rather than dust, since the dust modelspredict that extinction by the newly-formed dustlayer will cause concurrent depressions (ratherthan enhancements) of the optical light curves.
9
6. Conclusions
Using data from the DIRBE instrument onCOBE, we have obtained 1.25 µm − 25 µm lightcurves for 38 infrared-bright Mira variables andcompared with AAVSO optical data. We havefound decreasing amplitudes of variation with in-creasing wavelength, with magnitudes consistentwith recent theoretical models of circumstellardust shells around Mira stars. For the oxygen-rich Miras R Car and T Cep and the carbon starS Cep, we see secondary maxima in the rising partof the DIRBE light curves. These features are alsopresent in the optical data from the AAVSO, sug-gesting that they are due to shocks rather than todust formation.
We have detected near-infrared-to-optical timedelays of the maxima of six stars with phases ∼
0.05 to 0.12. We also find possible offsets of themid-infrared maxima relative to those in the near-infrared for three stars, in that the mid-infraredpeaks occurs after optical maximum but beforethat in the near-infrared. These lags may becaused by variations in the amount of molecularabsorption over a pulsation period, in combina-tion with variations in dust opacity. More detailedmodeling is needed to disentangle these two ef-fects.
We find no evidence for large magnitude (≥0.2magnitudes) short-term (hours to days) variationsin the near- or mid-infrared in our stars. Withtypical time resolution of 9 hours, however, theCOBE data are not particularly sensitive to burstsof a few hours in duration.
We thank the COBE team for making thisproject possible. We are especially grateful toNils Odegard, who helped developed the DIRBECIO Point Source Photometry Research Tool, aservice provided by the Astrophysics Data Facil-ity at NASA’s Goddard Space Flight Center withfunding from the NSSDC. We also thank EdwardWright, whose colloquium at the University ofColorado in 1999 on the COBE mission inspiredthis project. We also thank two ETSU students,Mike Houchins and Randy Keeling, for help withthe data acquisition. In this research, we haveused, and acknowledge with thanks, data from theAAVSO International Database, based on obser-vations submitted to the AAVSO by variable star
observers worldwide. This research has made useof the SIMBAD database, operated at CDS, Stras-bourg, France. This research was funded in partby NSF POWRE grant AST-0073853.
REFERENCES
Alvarez, R., & Plez, B. 1998, A&A, 330, 1109
Anandarao, B. G., Pottasch, S. R., & Vaidya, D.B. 1993, A&A, 273, 570
Barnes, T. G. 1973, ApJS, 25, 369
Barthes, D., Chenevez, J., & Mattei, J. A. 1996,AJ, 111, 2391
Bastian, U. & Roser, S. 1991, Sterne und Wel-traum, 30, 592
Bedijn, P. J. 1987, A&A, 186, 136
Boggess, N. W., et al. 1992, ApJ, 397, 420
Bowen, G. H. 1990, in The Numerical Modellingof Non-linear Stellar Pulsations, Buchler, J. R.(ed), Kluwer Academic Publishers, p. 155
Catchpole, R. M., Robertson, B. S. C., Lloyd-Evans, T. H. H., Feast, M. W., Glass, I S., &Carter, B. S. 1979, SAAO Circulars, 1, 61
Claussen, M. J., Kleinmann, S. G., Joyce, R. R.,& Jura, M. 1987, ApJS, 65, 385
Conrow, T., et al. 1993, B.A.A.S., 183, 03.03
Creech-Eakman, M. J., Stencel, R. E., Williams,W. J., & Klebe, D. I. 1997, ApJ, 477, 825
De Laverny, P., Mennessier, M. O., Mignard, F.,& Mattei, J. A. 1998, A&A, 330, 169
Feuchtinger, M. U., Dorfi, E. A., & Hofner, S.1993, A&A, 273, 513
Gail, H.-P., Keller, R., & Sedlmayr, E. 1984, A&A,235, 245
Gail, H.-P., & Sedlmayr, E. 1988, A&A, 206, 153
Gauger, A., Gail, H.-P., & Sedlmayr, E. 1990,A&A, 235, 345
Guenter, H., & Henson, G. 2001, in preparation
Harvey, P. M., Bechis, K. P., Wilson, W. J., &Ball, J. A. 1974, ApJS, 27, 331
10
Hauser, M. G., Kelsall, T., Leisawitz, D., & Wei-land, J. 1998, ‘COBE Diffuse Infrared Back-ground Experiment (DIRBE) Explanatory Sup-plement’, V. 2.3.
Hron, J. & Aringer, B. 1994, A&A, 281, 139
Ivezic, Z., Nenkova, M., & Elitzur, M. 1996, UserManual for DUSTY, available on the Internet:http://www.pa.uky.edu/moshe/dusty/
Ivezic, Z, & Knapp, G. R. 2000, Proceedings ofIAU Symposium 191: AGB Stars, A.S.P. Con-ference Series, V. 203, p. 124
IRAS Point Source Catalog (1988), Version 2,Joint IRAS Science Working Group (Washing-ton: GPO).
Jarrett, T. 1992, Ph.D. Thesis, University of Mas-sachusetts.
Jura, M. 1986, ApJ, 303, 327
Knapp, G. R., Phillips, T. G., Leighton, R. B.,Lo, K. Y., Wannier, P. G., Wootten, H. A., &Huggins, P. J. 1982, ApJ, 252, 616
Knapp, G. R., & Morris, M. 1985, ApJ, 292, 640
Koornneef, J. 1983, A&A, 128, 84.
Kholopov et al. 1985-1988, General Catalog ofVariable Stars.
Le Bertre, T. 1988, A&A, 190, 79
Le Bertre, T. 1992, A&AS, 94, 377
Le Bertre, T. 1993, A&AS, 97, 729
Le Bertre, T. 1993, A&A, 324, 1059
Le Bertre, T., & Winters, J. M. 1998, A&A, 334,173
Le Sidaner, P., & Bertre, T. 1993, A&A, 278, 167
Le Sidaner, P., & Bertre, T. 1996, A&A, 314, 896
Little-Marenin, I. R. & Stencel, R. E. 1992,PASPC, 26, 591
Little-Marenin, I. R., Stencel, R. E., & Staley, S.B. 1996, ApJ, 467, 806
Lockwood, G. W. & Wing, R. F. 1971, ApJ, 169,63
Lobel, A., Bagnulo, S., Doyle, J. G., & Power, C.2000, MNRAS, 317, 391
Lobel, A., Doyle, J. G., & Bagnulo, S. 1999, A&A,343, 466
Maffei, P., & Tosti, G. 1995, AJ, 109, 2652
Maran, S. P., et al. 1977, Infrared Phys., 17, 565
Mattei, J. A. 2000, Observations from the AAVSOInternational Database, private communica-tion.
Monnier, J. D., Geballe, T. R., & Danchi, W. C.1998, ApJ, 502, 833
Moshir, M., et al. 1992, Explanatory Supplementto the IRSA Faint Source Survey, Version 2,JPL D-10015 8/92 (Pasadena: JPL)
Murakami, H., et al. 1996, P.A.S.J., 48, L41
Olofsson, H. 1999, Proceedings of the Science withthe Atacama Large Millimeter Array, 45.
Onaka, T., de Jong, T., & Willems, F. J. 1989a,A&AS, 81, 261
Onaka, T., de Jong, T., & Willems, F. J. 1989b,A&A, 218, 169
Onaka, T. et al. 1997, Ap&SS, 255,311
Petit, E., & Nicholson, S. B. 1933, ApJ, 78, 320
Sedlmayr, E. 1994, in Molecules in the StellarEnvironment, IAU Colloquium 146, (Springer-Verlag: New York), 163
Skrutskie, M., et al. 1997, in The Impact of Large-Scale Near-IR Sky Surveys, ed. F. Garzon et al.(Dordrecht: Kluwer), 187
Sloan, G. C., & Price, S. D. 1995, ApJ, 451, 758
Sloan, G. C., & Price, S. D. 1998, ApJS, 119, 141
Sloan, G. C., Little-Marenin, I. R., & Price, S. D.1998, AJ, 115, 809
Smak, J., & Wing, R. F. 1979, Acta. Astron., 29,187
Smak, J., & Wing, R. F. 1979, Acta. Astron., 29,199
11
Smith, B. J. 1995, J Band CatalogInformation, Internal IPAC Memo,http://www.etsu.edu/physics/bsmith/irtsdat/JBAND.CAT.VER5.INFO
Spear, G. G., Owen, B., & Madore, B. 1993,PASPC, 43, 35
Wheaton, W. A., et al. 1997, Pointing Reconstruc-tion Processing for IRTS, Internal IPAC Memo,http://spider.ipac.caltech.edu/staff/waw/irts/irts.html
Willson, L. A., Struck-Marcell, C., & Bowen, G.H. in Cosmic Winds and the Heliosphere, eds.J. R. Jokipii, C. P. Sonett, and M. S. Giampapa
Winters, J. M., Dominik, C., & Sedlmayr, E.1994a, A&A, 288, 255
Winters, J. M., Fleischer, A. J., Gauger, A., &Sedlmayr, E. 1994, A&A, 290, 623
Winters, J. M., Fleischer, A. J., Gauger, A., &Sedlmayr, E. 1995, A&A, 302, 483
Winters, J. M., Le Bertre, T., Jeong, K. S.,Helling, C., & Sedlmayr, E. 2000, A&A, 361,641
Wood, P. R. 1990, in Confrontation between Stel-lar Pulsations and Theory, eds. C. Cacciari &G. Clementini, ASP Conf. Series 11, 355
Wood, P. R. 1997, in Planetary Nebulae, IAUSymp. 180, 297
Woolf, N. J., & Ney, E. P. 1969, ApJ, 155, L181
This 2-column preprint was prepared with the AAS LATEX
macros v5.0.
12
Fig. 1.— The COBE DIRBE 1.25 − 25 µm lightcurves from the DIRBE Weekly Maps for six sam-ple stars with relatively complete light curves: SCep, R Hor, RW Vel, R Car, T Cep, and R Cas.The carbon star S Cep is plotted first, followed bythe five oxygen-rich stars in R.A. order. Whenavailable, optical light curves from the AAVSOare also plotted. The 12 µm/2.2 µm flux ratioas a function of time is also provided. For RWVel, which does not have optical data available,F4.9µm/F2.2µm is plotted instead of the opticallight curve. Note that the infrared light curvesare plotted in flux density units, while the opticaldata are given in magnitudes.
Fig. 2.— The 4.9 µm DIRBE light curves for theremaining 31 stars in our sample, from the DIRBEWeekly Maps. The carbon stars (Table 1) are plot-ted first, in R.A. order, followed by the oxygen-richstars (Table 2). These are compared with opticallight curves when possible.
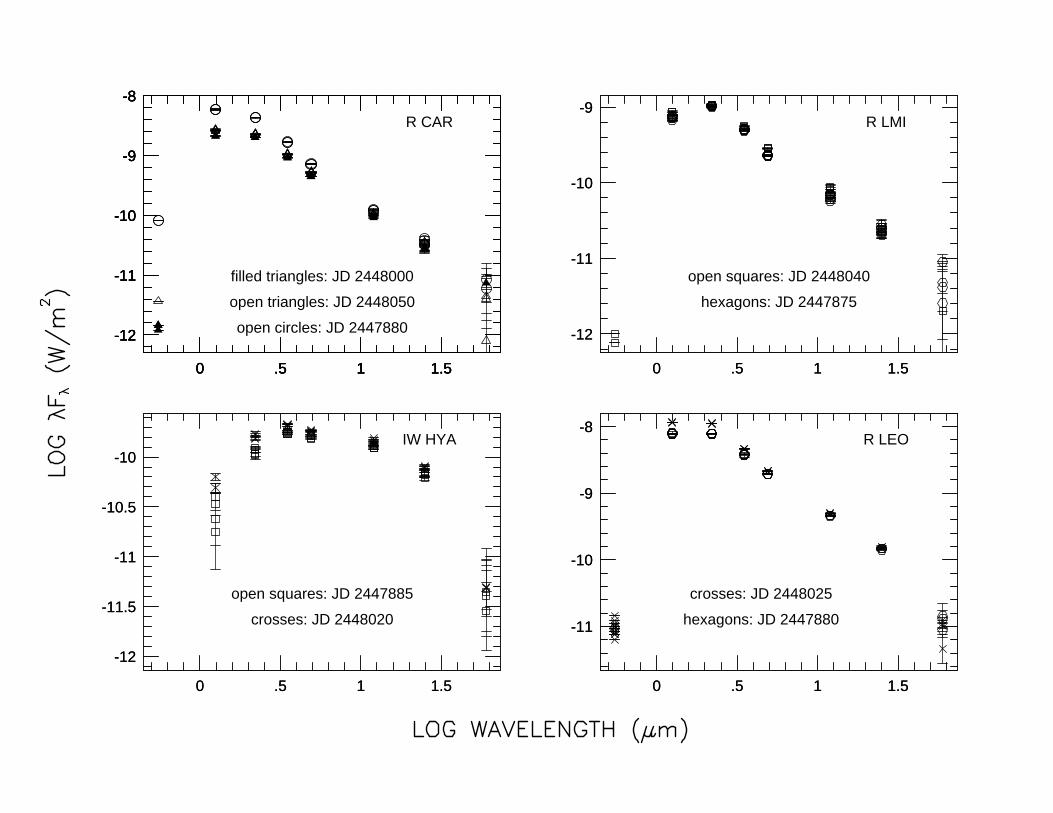
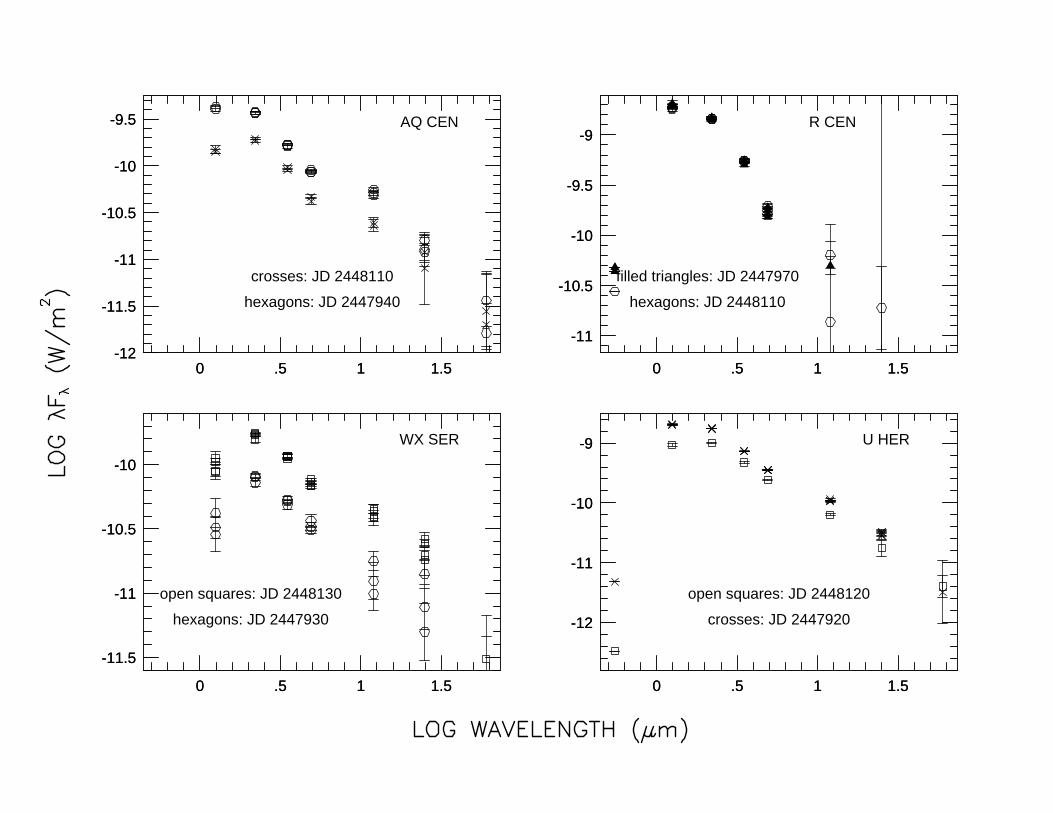
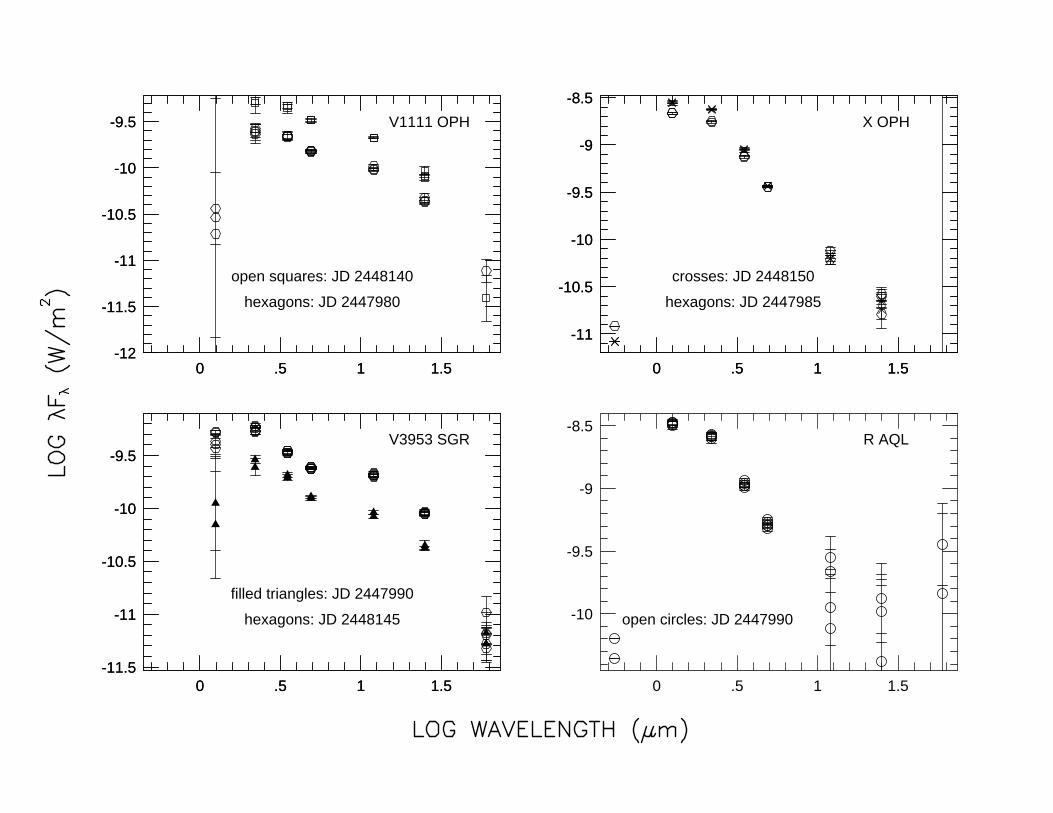
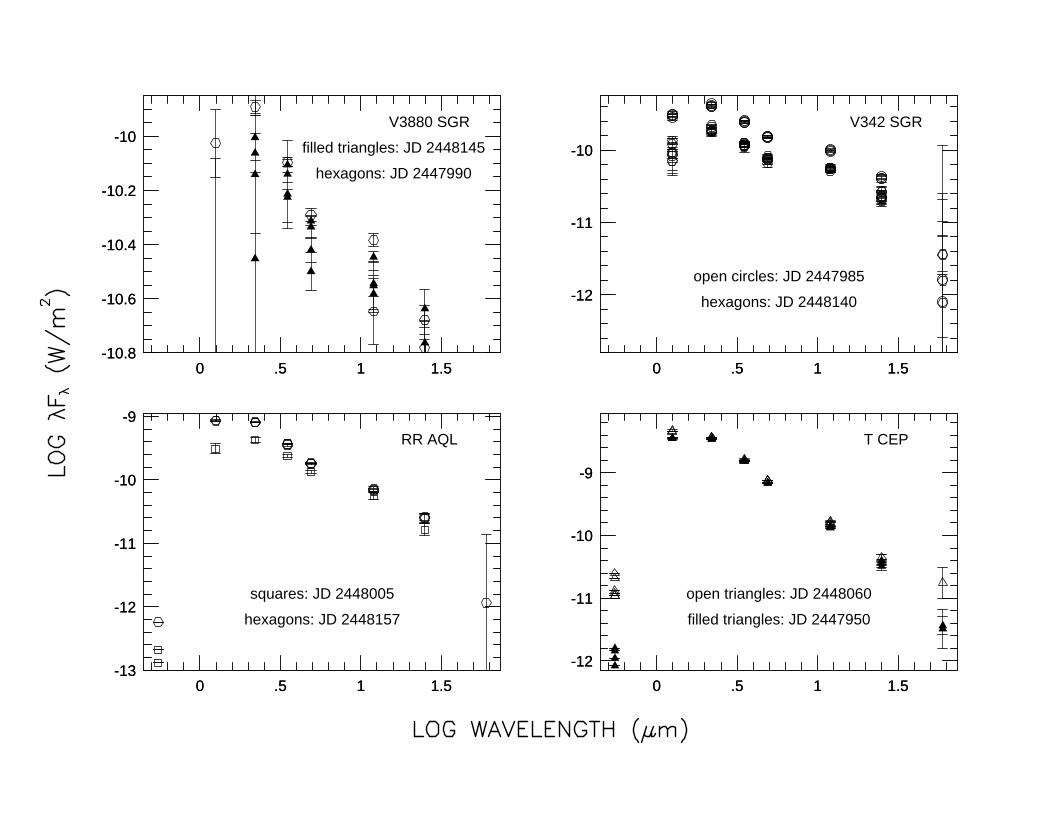
Fig. 3.— The optical to infrared spectra for se-lected stars, at one to three different times duringthe COBE mission. The stars are plotted in R.A.order, with the carbon stars first, as in Tables 1and 2. The symbols indicate the location in thelight curve as follows: filled triangles: times nearminimum; open triangles: inflection points; opencircles: near infrared maximum; filled circles: op-tical maximum (when clearly offset from infraredmaximum); open squares: times when the lightcurve is rising; crosses: times when the light curveis falling. A hexagon is used when it is unclearwhat part of the light curve the data are located.All data points within 1 day of the given time wereplotted. Note that the shape of the spectra varywith time, with the shorter wavelength fluxes in-creasing a larger amount with increasing bright-ness than longer wavelength fluxes. Also note thatthe spectra of carbon stars tends to peak at longerwavelengths than those of oxygen-rich stars.
Fig. 4.— a) Phase lag of maximum relative tothe maximum at V vs. wavelength, for the threestars with sine fits to their light curves (Table 3):R Hor (filled triangles), R Cas (open circles), andRW Vel (crosses). No appropriate optical datawere available for RW Vel, so we assumed a 1.25µm lag relative to V of 0.1 phase. b) Amplitudeof variation vs. wavelength, for the three stars in
Table 3. The symbols are the same as those inFigure 4a.
Fig. 5.— a) Top left: ∆mag(1.25 µm) vs.∆mag(V) for the stars with at least 10 continu-ous weeks of optical and infrared data available.The uncertainties in V were calculated assum-ing ∼0.5 magnitudes uncertainties in the AAVSOdata. Note that the plotted magnitude changes donot always represent the full amplitude of the star;they are merely the observed change in magnitudeover the available continuous data. b) Top right:∆mag(4.9 µm) vs. ∆mag(V) for the stars with atleast 10 continuous weeks of optical and infrareddata available. c) Second row, left: ∆mag(1.25µm) vs. ∆mag(2.2 µm) for the stars with at least10 weeks of high S/N data at both wavelengths.The magnitude changes were measured betweenthe observed maxima and minima of the lightcurves, ignoring time periods during which no datawere available. Note that the plotted magnitudechanges do not always represent the full amplitudeof the star; they are merely the observed changein magnitude over the available DIRBE data (ig-noring gaps in the light curves). d) Second row,right: ∆mag(2.2 µm) vs. ∆mag(3.5 µm) for thestars with at least 10 weeks of high S/N data atboth wavelengths. e) Third row, left: ∆mag(3.5µm) vs. ∆mag(4.9 µm) for the stars with at least10 weeks of high S/N data at both wavelengths.f) Third row, right: ∆mag(4.9 µm) vs. ∆mag(12µm) for the stars with at least 10 weeks of highS/N data at both wavelengths. g) Fourth row,left: ∆mag(12 µm) vs. ∆mag(25 µm) for the starswith at least 10 weeks of high S/N data at bothwavelengths.
13
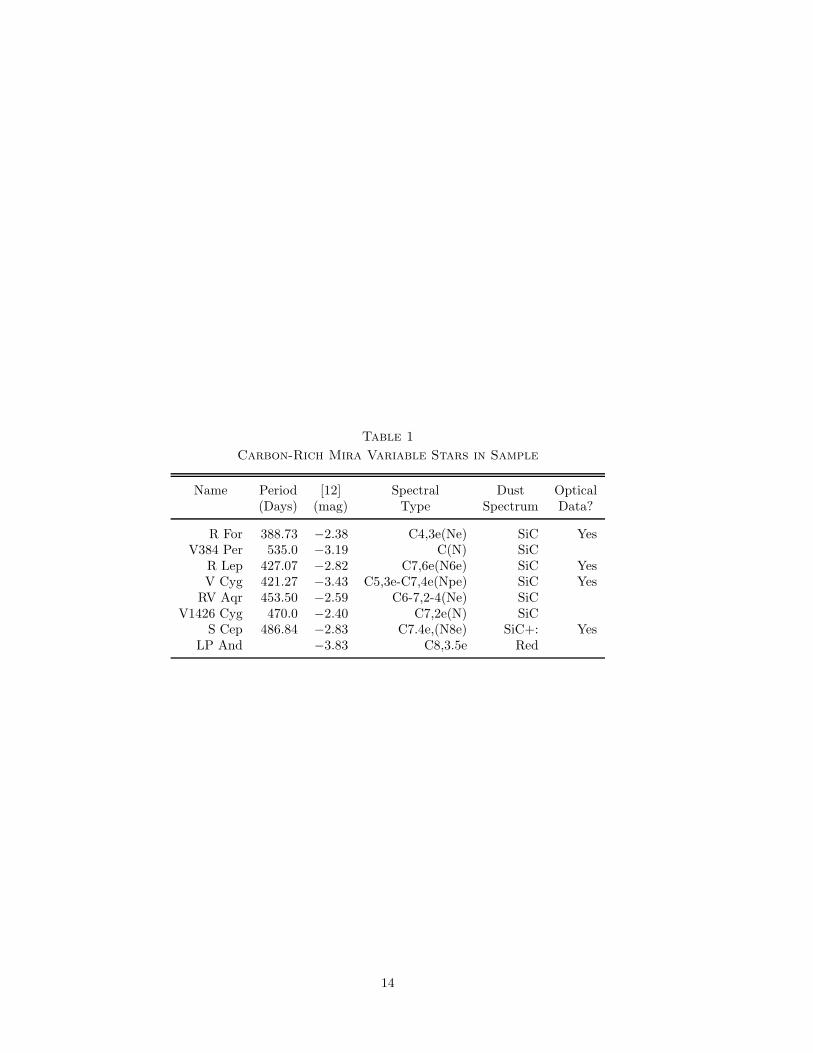
Table 1
Carbon-Rich Mira Variable Stars in Sample
Name Period [12] Spectral Dust Optical(Days) (mag) Type Spectrum Data?
R For 388.73 −2.38 C4,3e(Ne) SiC YesV384 Per 535.0 −3.19 C(N) SiC
R Lep 427.07 −2.82 C7,6e(N6e) SiC YesV Cyg 421.27 −3.43 C5,3e-C7,4e(Npe) SiC Yes
RV Aqr 453.50 −2.59 C6-7,2-4(Ne) SiCV1426 Cyg 470.0 −2.40 C7,2e(N) SiC
S Cep 486.84 −2.83 C7.4e,(N8e) SiC+: YesLP And −3.83 C8,3.5e Red
14
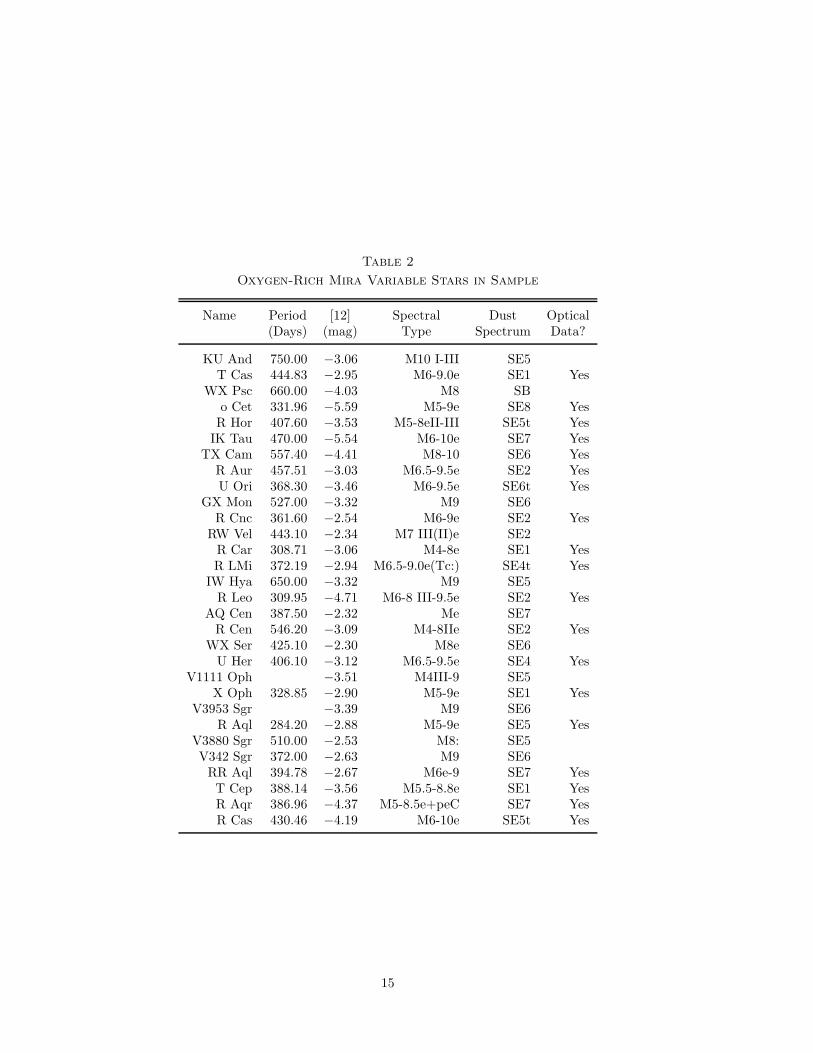
Table 2
Oxygen-Rich Mira Variable Stars in Sample
Name Period [12] Spectral Dust Optical(Days) (mag) Type Spectrum Data?
KU And 750.00 −3.06 M10 I-III SE5T Cas 444.83 −2.95 M6-9.0e SE1 Yes
WX Psc 660.00 −4.03 M8 SBo Cet 331.96 −5.59 M5-9e SE8 YesR Hor 407.60 −3.53 M5-8eII-III SE5t Yes
IK Tau 470.00 −5.54 M6-10e SE7 YesTX Cam 557.40 −4.41 M8-10 SE6 Yes
R Aur 457.51 −3.03 M6.5-9.5e SE2 YesU Ori 368.30 −3.46 M6-9.5e SE6t Yes
GX Mon 527.00 −3.32 M9 SE6R Cnc 361.60 −2.54 M6-9e SE2 Yes
RW Vel 443.10 −2.34 M7 III(II)e SE2R Car 308.71 −3.06 M4-8e SE1 YesR LMi 372.19 −2.94 M6.5-9.0e(Tc:) SE4t Yes
IW Hya 650.00 −3.32 M9 SE5R Leo 309.95 −4.71 M6-8 III-9.5e SE2 Yes
AQ Cen 387.50 −2.32 Me SE7R Cen 546.20 −3.09 M4-8IIe SE2 Yes
WX Ser 425.10 −2.30 M8e SE6U Her 406.10 −3.12 M6.5-9.5e SE4 Yes
V1111 Oph −3.51 M4III-9 SE5X Oph 328.85 −2.90 M5-9e SE1 Yes
V3953 Sgr −3.39 M9 SE6R Aql 284.20 −2.88 M5-9e SE5 Yes
V3880 Sgr 510.00 −2.53 M8: SE5V342 Sgr 372.00 −2.63 M9 SE6RR Aql 394.78 −2.67 M6e-9 SE7 YesT Cep 388.14 −3.56 M5.5-8.8e SE1 YesR Aqr 386.96 −4.37 M5-8.5e+peC SE7 YesR Cas 430.46 −4.19 M6-10e SE5t Yes
15
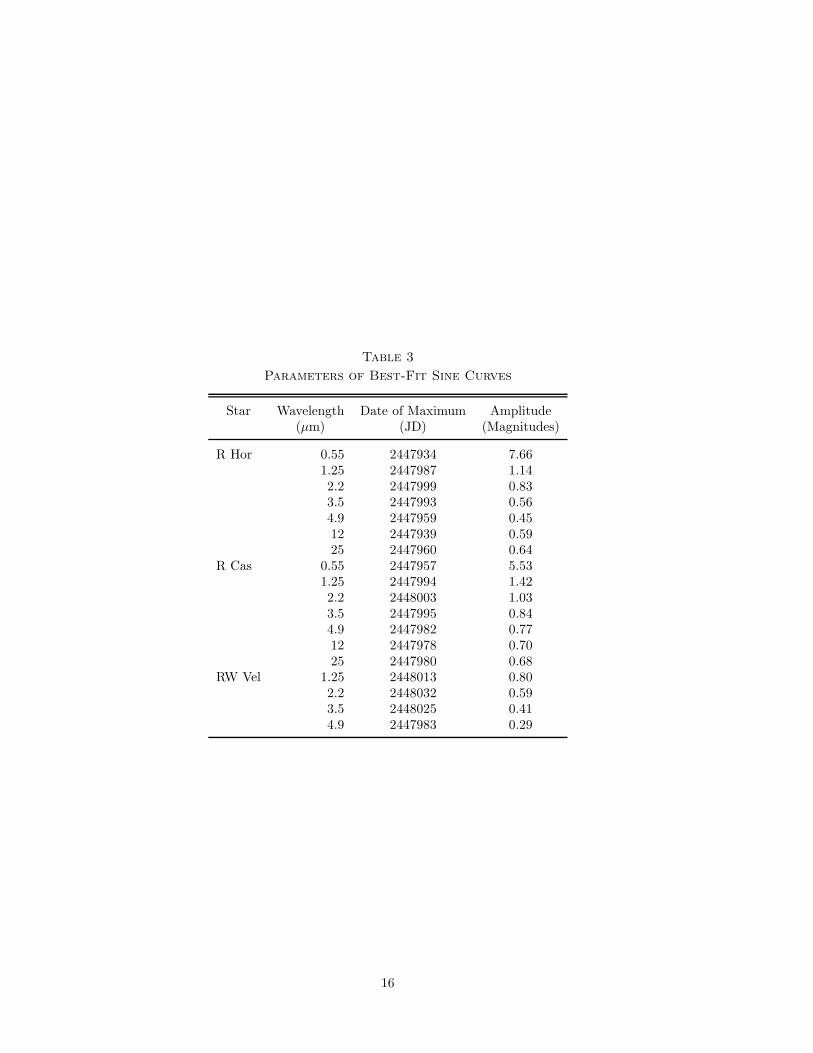
Table 3
Parameters of Best-Fit Sine Curves
Star Wavelength Date of Maximum Amplitude(µm) (JD) (Magnitudes)
R Hor 0.55 2447934 7.661.25 2447987 1.142.2 2447999 0.833.5 2447993 0.564.9 2447959 0.4512 2447939 0.5925 2447960 0.64
R Cas 0.55 2447957 5.531.25 2447994 1.422.2 2448003 1.033.5 2447995 0.844.9 2447982 0.7712 2447978 0.7025 2447980 0.68
RW Vel 1.25 2448013 0.802.2 2448032 0.593.5 2448025 0.414.9 2447983 0.29
16

0 .5 1 1.5
-12
-11
-10
R FOR
open squares: JD 2448094
crosses: JD 2447888
0 .5 1 1.5-13
-12
-11
-10V384 PER
crosses: JD 2447910
hexagons: JD 2448120
0 .5 1 1.5-12
-11
-10
R LEP
open squares: JD 2448150
filled triangles: JD 2447960
0 .5 1 1.5-13
-12
-11
-10
-9V CYG
crosses: JD 2447891
filled triangles: JD 2448051
0 .5 1 1.5
-11.5
-11
-10.5
-10
-9.5 RV AQR
hexagons: JD 2448010
0 .5 1 1.5
-11
-10.5
-10
-9.5 V1426 CYG
open squares: JD 2447890
hexagons: JD 2448050
0 .5 1 1.5
-11
-10
-9
S CEP
triangles: JD 2447901
squares: JD 2448078
0 .5 1 1.5-12
-11.5
-11
-10.5
-10
-9.5 LP AND
open squares: JD 2448120
filled triangles: JD 2447900
0 .5 1 1.5
-11
-10.5
-10
0 .5 1 1.5
-11
-10.5
-10
KU AND
open squares: JD 2448120
filled triangles: JD 2447900
0 .5 1 1.5
-12
-11
-10
-9
0 .5 1 1.5
-12
-11
-10
-9T CAS
filled triangles: JD 2447890
open squares: JD 2448130
0 .5 1 1.5
-11.5
-11
-10.5
-10
-9.5
0 .5 1 1.5
-11.5
-11
-10.5
-10
-9.5 WX PSC
crosses: JD 2447880
open squares: JD 2448100
0 .5 1 1.5
-11
-10
-9
-8
0 .5 1 1.5
-11
-10
-9
-8 o CET
squares: JD 2448120
crosses: JD 2447920
0 .5 1 1.5
-13
-12
-11
-10
-9
0 .5 1 1.5
-13
-12
-11
-10
-9
0 .5 1 1.5
-13
-12
-11
-10
-9
0 .5 1 1.5
-13
-12
-11
-10
-9R HOR
filled circles: JD 2447897
open circles: JD 2447950
filled triangles: JD 2448146
0 .5 1 1.5
-13
-12
-11
-10
-9
0 .5 1 1.5
-13
-12
-11
-10
-9 IK TAU
triangles: JD 2448140
crosses: JD 2447920
0 .5 1 1.5
-12
-11
-10
-9
0 .5 1 1.5
-12
-11
-10
-9 TX CAM
crosses: JD 2448134
filled triangles: JD 2447970
0 .5 1 1.5-13
-12
-11
-10
-9
0 .5 1 1.5-13
-12
-11
-10
-9 R AUR
open squares: JD 2447940
hexagons: JD 2448146
0 .5 1 1.5
-12
-11
-10
-9
0 .5 1 1.5
-12
-11
-10
-9 U ORI
crosses: JD 2447962
hexagons: JD 2448137
0 .5 1 1.5
-11
-10.5
-10
-9.5
0 .5 1 1.5
-11
-10.5
-10
-9.5
GX MON
open squares: JD 2447990
hexagons: JD 2448150
0 .5 1 1.5
-12
-11
-10
-9 R CNC
hexagons: JD 2447990
0 .5 1 1.5
-11
-10
-9
0 .5 1 1.5
-11
-10
-9RW VEL
open squares: JD 2447900
open circles: JD 2448030
0 .5 1 1.5
-12
-11
-10
-9
-8
0 .5 1 1.5
-12
-11
-10
-9
-8
0 .5 1 1.5
-12
-11
-10
-9
-8
0 .5 1 1.5
-12
-11
-10
-9
-8
R CAR
filled triangles: JD 2448000
open triangles: JD 2448050
open circles: JD 2447880
0 .5 1 1.5
-12
-11
-10
-9
0 .5 1 1.5
-12
-11
-10
-9R LMI
open squares: JD 2448040
hexagons: JD 2447875
0 .5 1 1.5
-12
-11.5
-11
-10.5
-10
0 .5 1 1.5
-12
-11.5
-11
-10.5
-10IW HYA
open squares: JD 2447885
crosses: JD 2448020
0 .5 1 1.5
-11
-10
-9
-8
0 .5 1 1.5
-11
-10
-9
-8R LEO
crosses: JD 2448025
hexagons: JD 2447880
0 .5 1 1.5-12
-11.5
-11
-10.5
-10
-9.5
0 .5 1 1.5-12
-11.5
-11
-10.5
-10
-9.5 AQ CEN
crosses: JD 2448110
hexagons: JD 2447940
0 .5 1 1.5
-11
-10.5
-10
-9.5
-9
0 .5 1 1.5
-11
-10.5
-10
-9.5
-9R CEN
filled triangles: JD 2447970
hexagons: JD 2448110
0 .5 1 1.5
-11.5
-11
-10.5
-10
0 .5 1 1.5
-11.5
-11
-10.5
-10
WX SER
open squares: JD 2448130
hexagons: JD 2447930
0 .5 1 1.5
-12
-11
-10
-9
0 .5 1 1.5
-12
-11
-10
-9 U HER
open squares: JD 2448120
crosses: JD 2447920
0 .5 1 1.5-12
-11.5
-11
-10.5
-10
-9.5
0 .5 1 1.5-12
-11.5
-11
-10.5
-10
-9.5 V1111 OPH
open squares: JD 2448140
hexagons: JD 2447980
0 .5 1 1.5
-11
-10.5
-10
-9.5
-9
-8.5
0 .5 1 1.5
-11
-10.5
-10
-9.5
-9
-8.5
X OPH
crosses: JD 2448150
hexagons: JD 2447985
0 .5 1 1.5-11.5
-11
-10.5
-10
-9.5
0 .5 1 1.5-11.5
-11
-10.5
-10
-9.5V3953 SGR
filled triangles: JD 2447990
hexagons: JD 2448145
0 .5 1 1.5
-10
-9.5
-9
-8.5R AQL
open circles: JD 2447990
0 .5 1 1.5-10.8
-10.6
-10.4
-10.2
-10
0 .5 1 1.5-10.8
-10.6
-10.4
-10.2
-10V3880 SGR
filled triangles: JD 2448145
hexagons: JD 2447990
0 .5 1 1.5
-12
-11
-10
0 .5 1 1.5
-12
-11
-10
V342 SGR
open circles: JD 2447985
hexagons: JD 2448140
0 .5 1 1.5-13
-12
-11
-10
-9
0 .5 1 1.5-13
-12
-11
-10
-9
RR AQL
squares: JD 2448005
hexagons: JD 2448157
0 .5 1 1.5
-12
-11
-10
-9
0 .5 1 1.5
-12
-11
-10
-9
T CEP
open triangles: JD 2448060
filled triangles: JD 2447950
0 .5 1 1.5
-12
-11
-10
-9
0 .5 1 1.5
-12
-11
-10
-9R AQR
circles: JD 2447880
triangles: JD 2448070
0 .5 1 1.5
-11
-10
-9
-8
0 .5 1 1.5
-11
-10
-9
-8
R CAS
squares: JD 2447920
crosses: JD 2448090
-.2 0 .2 .4 .6 .8 1 1.2 1.4
0
.05
.1
.15
a
PH
AS
E L
AG
RE
LAT
IVE
TO
V
-.2 0 .2 .4 .6 .8 1 1.2 1.4
2
4
6
8
b
AM
PLI
TU
DE
0 2 40
.2
.4
.6
b
0 2 40
.2
.4
.6
.8
1
1.2
a
0 .5 1 1.50
.5
1
1.5
c
0 .5 1 1.50
.5
1
1.5
d
0 .5 1 1.50
.5
1
1.5
e
0 .5 1 1.50
.5
1
1.5
f
0 .5 1 1.50
.5
1
1.5
g