Influenza virus-like particles as a new tool for vaccine immunogenicity testing: Validation of a...
39
Accepted Manuscript Title: INFLUENZA VIRUS-LIKE PARTICLES AS A NEW TOOL FOR VACCINE IMMUNOGENICITY TESTING: VALIDATION OF A NEURAMINIDASE NEUTRALIZING ANTIBODY ASSAY Authors: Victor Gavrilov, Tatyana Orekov, Casper Alabanza, Udayasree Porika, Hua Jiang, Kevin Connolly, Steven Pincus PII: S0166-0934(11)00101-7 DOI: doi:10.1016/j.jviromet.2011.03.011 Reference: VIRMET 11490 To appear in: Journal of Virological Methods Received date: 9-9-2010 Revised date: 3-3-2011 Accepted date: 9-3-2011 Please cite this article as: Gavrilov, V., Orekov, T., Alabanza, C., Porika, U., Jiang, H., Connolly, K., Pincus, S., INFLUENZA VIRUS-LIKE PARTICLES AS A NEW TOOL FOR VACCINE IMMUNOGENICITY TESTING: VALIDATION OF A NEURAMINIDASE NEUTRALIZING ANTIBODY ASSAY, Journal of Virological Methods (2010), doi:10.1016/j.jviromet.2011.03.011 This is a PDF file of an unedited manuscript that has been accepted for publication. As a service to our customers we are providing this early version of the manuscript. The manuscript will undergo copyediting, typesetting, and review of the resulting proof before it is published in its final form. Please note that during the production process errors may be discovered which could affect the content, and all legal disclaimers that apply to the journal pertain.
-
Upload
independent -
Category
Documents
-
view
4 -
download
0
Transcript of Influenza virus-like particles as a new tool for vaccine immunogenicity testing: Validation of a...
Accepted Manuscript
Title: INFLUENZA VIRUS-LIKE PARTICLES AS A NEWTOOL FOR VACCINE IMMUNOGENICITY TESTING:VALIDATION OF A NEURAMINIDASE NEUTRALIZINGANTIBODY ASSAY
Authors: Victor Gavrilov, Tatyana Orekov, Casper Alabanza,Udayasree Porika, Hua Jiang, Kevin Connolly, Steven Pincus
PII: S0166-0934(11)00101-7DOI: doi:10.1016/j.jviromet.2011.03.011Reference: VIRMET 11490
To appear in: Journal of Virological Methods
Received date: 9-9-2010Revised date: 3-3-2011Accepted date: 9-3-2011
Please cite this article as: Gavrilov, V., Orekov, T., Alabanza, C., Porika, U.,Jiang, H., Connolly, K., Pincus, S., INFLUENZA VIRUS-LIKE PARTICLES AS ANEW TOOL FOR VACCINE IMMUNOGENICITY TESTING: VALIDATION OF ANEURAMINIDASE NEUTRALIZING ANTIBODY ASSAY, Journal of VirologicalMethods (2010), doi:10.1016/j.jviromet.2011.03.011
This is a PDF file of an unedited manuscript that has been accepted for publication.As a service to our customers we are providing this early version of the manuscript.The manuscript will undergo copyediting, typesetting, and review of the resulting proofbefore it is published in its final form. Please note that during the production processerrors may be discovered which could affect the content, and all legal disclaimers thatapply to the journal pertain.

Page 1 of 38
Accep
ted
Man
uscr
ipt
INFLUENZA VIRUS-LIKE PARTICLES AS A NEW TOOL FOR VACCINE
IMMUNOGENICITY TESTING: VALIDATION OF A NEURAMINIDASE
NEUTRALIZING ANTIBODY ASSAY
Victor Gavrilov, Tatyana Orekov, Casper Alabanza, Udayasree Porika, Hua Jiang, Kevin Connolly2,
Steven Pincus*
Novavax, Inc., 9920 Belward Campus Drive, Rockville, MD 20850, USA
*Corresponding author
Tel: +1 240-268-2032; fax: +1 240-268-2132
E-mail address: [email protected]
2Present address: PharmAthene, One Park Place Suite 450, Annapolis MD 21401
SUMMARY
Detection of neutralizing antibody to viral neuraminidase (NA) by testing for enzyme
inhibition has been recognized as an important part of the immunogenicity of influenza vaccines.
However, the absence of a well characterized standard source of active NA and validated assays has
significantly limited clinical studies of NA immunity. Influenza virus-like particles (VLPs)
containing hemagglutinin (HA), NA, and M1 proteins were produced from insect cells infected with
a recombinant baculovirus and used as the NA source for the NA inhibition (NAI) assay . The NA
activity of 6 different VLP strains varied from 0.43 to 1.61 (x 10-3) enzyme units per µg of HA and
was stable over 6 months of storage at 2-8oC. The NAI assay using 2′-(4-Methylumbelliferyl)-α-D-N-
acetylneuraminic acid as a substrate was modified for testing the antibody titer in clinical samples
and validated. The advantages of the assay include: 1) stable, reproducible, and standardized source
of NA; 2) testing the antibody titer specific to each subtype of NA in serum from subjects immunized
with trivalent vaccines (H1N1, H3N2, B) with no interference from antibodies specific to the HA
and to heterologous subtypes of the NA; 3) suitability for conducting long-term clinical trials as a
Page 2 of 38
Accep
ted
Man
uscr
ipt
result of low intra- and inter-assay variability, and 4) a wide analytical range due to 25% inhibition
cut-off value for the NAI titer estimation.
Key words: Neuraminidase neutralizing antibody, influenza virus-like particle, assay
validation, vaccine immunogenicity.
Abbreviations: , NA - neuraminidase, NAA – neuraminidase activity, NAI – neuraminidase
inhibition, NIT – neuraminidase inhibition titer, VLP – virus-like particle
1. Introduction
The immunogenicity of influenza vaccines is evaluated historically by measuring antibody (Ab)
titer to hemagglutinin (HA), the major virus surface glycoprotein. Antibody to enzymatically active
neuraminidase (NA), the other major surface glycoprotein, essentially enhances protective immunity
induced by influenza vaccines (Sylte and Suarez, 2010; Sylte et al. 2007). NA removes sialic acid
from both viral and host proteins and participates in the release of viruses from infected cells. Only
functional antibodies which inhibit the enzyme are protective and provide so-called permissive
immunity: they do not prevent viral infection by themselves but significantly reduce virus spreading
throughout the body and the severity of disease (Johansson et al., 1989; Sylte and Suarez, 2010).
Although the concept of an improved influenza vaccine with both the HA and active NA
proteins present together has been discussed (Sylte and Suarez, 2010), no commercial vaccine with
controlled NA activity is produced today. The lack of control for NA activity (NAA) in influenza
vaccines could be explained by a significant loss of enzyme activity during storage (Kendal et all.,
1980). The problem with NA instability has also limited testing of anti-NA immune response during
clinical studies.
The principle of testing NA inhibition (NAI) by antibody includes the comparison of NA
activity in samples incubated without and with NA-specific immune serum (Cate et al., 2010). There
are several well-established methods for testing the NAA in viruses and these methods are used for
monitoring enzyme activity in vaccines during manufacturing (Kalbfuss et al., 2008) or screening

Page 3 of 38
Accep
ted
Man
uscr
ipt
mutants resistant to chemical NA inhibitors (Gubareva et al., 2002; Wetherall et al., 2003). For these
applications the highly variable NA activity in virus samples is expected and the NAA level
represents the object of analysis. In contrast, the neutralizing antibody assay requires a stable and
reproducible source of active NA with a specified absolute activity (enzyme units/ml) and storage life
as for any other analytical enzymatic reagent . Thus, existing publications discussing NA immunity
are able to present scientific proof of concept for NA neutralizing antibody but do not provide
comparable results for antibody titers and the activity of the used source of NA.
Using live influenza viruses for analytical purposes remains very complicated due to their
pathogenicity (especially for pandemic virus strains), laborious and expensive preparation, and lack
of standardization. Therefore, an inactivated virus vaccine (Cate et al., 2010) and a purified NA
protein (Johansson et all., 1989) were proposed as a more convenient source of neuraminidase.
However, the conditions required for adequate measurement of NAI using these substitutes of live
virus, have not been established. For inactivated vaccine preparations which most often have a very
low level of NA activity (Kendal et al.,1980), and a high contribution of unfolded (denaturated)
proteins (Feng et al., 2009), the requirements for the NA qualification may include the enzyme
stabilization for long-term storage and setup of the range providing NAA results relevant to those in
live viruses. The active H1N1 and H5N1 neuraminidases can now be purchased from SinoBiological
(Beijing, China) and RnD Systems (Minneapolis, USA). However, these preparations may contain
unfolded NA molecules or reduced associated forms ( dimeric or monomeric) of NA instead of a
tetrameric complex present in virus (Sylte and Suarez, 2010) and their binding properties to
antibodies could thus be altered compared to live virus.
Recent progress achieved in creating influenza virus-like particles (VLPs) that contain the HA
and NA viral proteins with relevant functional activity and immunoreactivity makes VLP an excellent
candidate to substitute for live viruses (Kang et al., 2009; Pushko et al., 2005; Lai et al., 2010). The
unique combination of comparable structural and biological properties to influenza viruses, enhanced
Page 4 of 38
Accep
ted
Man
uscr
ipt
stability and ease of handling gives VLPs a big advantage over other discussed virus substitutes. This
allows for expanding VLP applications outside of vaccine development into the study of different
areas of virus properties (Kang et al., 2009; Lai et al., 2010). Unfortunately, NA in VLPs has not
been fully characterized: only a few publications have reported detectable NA activity without proper
quantification in absolute units (Lai et al., 2010). Furthermore, it has not been demonstrated that the
activity and stability of NA in VLPs are sufficient for analytical applications.
To test NA activity, the fluorogenic 2′-(4-Methylumbelliferyl)-α-D-N-acetylneuraminic acid
sodium salt hydrate (MUNANA) substrate was chosen. This is the only substrate which gives
comparable results for NA activity from multiple sources as the assay is based on quantification of
the enzymatic reaction product (Potier et al., 1979; Wetherall et al., 2003 Kalbfuss et al., 2008). To
adjust the MUNANA-based NAA assay for testing NAI titer, we need to determine 1) the acceptable
range of initial NA activity in VLP samples that would provide consistent results for a given antibody
titer; 2) whether VLP could be applied for testing the antibody titer specific to only one subtype of
NA in the serum from subjects immunized with a trivalent vaccine with no interference from the
antibody specific to HA and heterologous subtypes of NA; and 3) how the assay performance
depends on the NAI cut-off value for the antibody titer estimation and what is the optimal cut-off
value. Currently, no MUNANA-based NAI assay has an established analytical range nor has been
validated.
Therefore, the objective of this study was to qualify the VLP as a new source for active
neuraminidase in the NAI-based antibody assay. To optimize the assay, the range for the initial NA
activity and the optimal NAI cut-off value for antibody titer estimation were established. To set up an
analytical range, the modified assay was validated for specificity, precision, accuracy, and linearity as
per ICH guidelines (ICH, 1996).
2. Materials and methods
2.1. VLP preparation
Page 5 of 38
Accep
ted
Man
uscr
ipt
Purified VLPs are comprised of recombinant influenza virus hemagglutinin (HA),
neuraminidase (NA) and matrix 1 (M1) proteins. The appropriate genes are cloned into a baculovirus
expression vector with each under the control of their own set of transcription regulatory
elements.VLPs are then assembled from recombinant HA, NA, and M1 proteins expressed in
recombinant virus infected Spodoptera frugiperda (sf9) insect cells (ATCC CRL-1711) (Invitrogen,
Carlsbad, USA). Abbreviations for influenza viruses or proteins used in this study are A/Indo
(A/Indonesia 05/2005 (H5N1)), A/Cal (A/California 04/2009 (H1N1)), A/NewCal (A/New
Caledonia/20/99(H1N1)), H1N1 A/Br (A/Brisbane 59/2007 (H1N1)), A/NY (A/New York/55/2004
(H3N2)), H3N2 A/Br (A/Brisbane 10/2007 (H3N2)), B/Br (B/Brisbane 60/2008), B/Fl (B/Florida
04/2006) and B/Sh (B/Shanghai/361/2002).
The cloning of influenza HA, NA, and M1 into baculovirus (BV) expression vectors was
described previously (Pushko et al., 2005; Bright et al., 2007; Mahmood et al., 2008). The sf9 insect
cells were infected with a recombinant baculovirus. VLPs were purified from the supernatant
harvested from the sf9 cell culture (Bright et al., 2007). After removal of the sf9 cells, the VLP
preparation was concentrated and diafiltered through tangential flow filtration (TFF). The separation
of VLPs from BV particles and contaminating DNA, RNA and sf9 proteins was achieved by anion
exchange (IEX) followed by size-exclusion (SEC) chromatography. To ensure sterility the VLP
preparation was filtered through a 0.22µm PVDF membrane and stored refrigerated (2-8oC).
The expression of HA, NA, and M1 proteins in VLP preparations was confirmed by SDS-PAGE
and Western blot analysis and the HA concentration was quantified by a single-radial-
immunodiffusion (SRID) as described (Pushko et al., 2005; Mahmood et al., 2008). The total protein
(TP) concentration was tested using the BCA assay (Pierce, Rockford, USA).
2.2. Purified neuraminidase and hemagglutinin protein preparations
NA and HA proteins from H5N1 A/Indo, ,H3N2 A/NY and B/Fl viruses were produced by the
following procedure. The corresponding native HA and secreted NA (fusion of NA with HA
Page 6 of 38
Accep
ted
Man
uscr
ipt
secretion sequence) genes were individually cloned into the BV expression vector used to produce
VLP’s. The sf9 cells were infected with the resulting recombinant viruses and the proteins were
expressed in a similar manner as VLPs described in this paper. The HA proteins were extracted from
the cell paste and purified through TMAE anion exchange, lentil lectin affinity chromatography, and
hydroxyapatite (CHT) chromatography. The secreted NA proteins were harvested from the culture
supernatant and purified through three column chromatography steps including Fractogel EMD
TMAE, lentil lectin, and hydroxyapatite columns. The purified HA and NA proteins with > 95%
purity as determined by SDS-PAGE, and densitometric scanning were used for animal immunization
to raise mono-specific polyclonal antiserums.
2.3. Antisera against purified neuraminidase and hemagglutinin
Sheep immunization with purified HA and NA proteins from B/Fl, H3N2 A/NY and
H5N1 virus strains, followed by blood collection and antiserum preparation were performed by
Covance (Princeton, USA). Sheep were immunized ID/IM with 50 µg of antigen in complete
Freund’s adjuvant and boosted three weeks later by the same route with 30 µg of antigen mixed with
in-complete Freund’s adjuvant. The antibody titers were determined by ELISA as described below.
2.4. Ferret antisera after immunization with A/Brisbane/10/07(H3N2) virus
Male ferrets (Mustela putorious furo) 3-4 months of age and confirmed to be seronegative
against H3N2 A/Bris virus were used for immunization (Bioqual Inc, Rockville, USA). Egg grown
H3N2 A/Bris virus was produced as described (Bright et al., 2008) and given intranasally to ferrets (
n = 4) in a volume of 0.5 ml (250 µl per nostril), under anesthesia. Each ferret was inoculated with a
total of 1 x 10⁸ pfu/0.5 ml of virus. Twenty days after inoculation, blood was collected from the
anesthetized ferrets via the anterior vena cava. The serum was separated and frozen at -80 ± 5oC. The
ferrets were euthanized and exsanguinated on Day 35. All procedures were in accordance with the
NRC Guide for the Care and Use of Laboratory Animals.
2.5. Human antisera after vaccination with trivalent VLP vaccine
Page 7 of 38
Accep
ted
Man
uscr
ipt
Seasonal trivalent VLP vaccine comprised of H1N1 A/Bris, H3N2 A/Bris, and B/Fl VLP
strains recommended for the 2008-2009 influenza vaccine was used in a clinical trial (manuscript in
preparation). Normal healthy adults (18-50 years old) were randomized to receive the trivalent VLP
vaccine at 15 µg HA of each strain (85 subjects), 60 µg HA of each strain (85 subjects) or placebo
(50 subjects). Blood samples were collected before (day 1) and after (day 22) immunization followed
by serum preparation.
2.6. Antibody titer determination by ELISA.
Antibody (total IgG) titers in anti-HA and anti-NA sheep sera were determined by ELISA.
Briefly, a 96-well microplate Immulon 2HB (Corning Inc, Lowell, USA) was coated with 50 µl/well
of a 2.0 µg/ml VLP sample formulated in 25 mM tris-buffered saline (TBS), pH 7.2. The plate was
incubated for 2 hr at room temperature (RT) with shaking and washed with 25 mM TBS buffer
containing 0.05% Tween20 using a Microplate washer Biotek ELx405 (Biotek Inc, Winooski, USA).
The plate was blocked with 150 µl/well of the Superblock buffer (Pierce) for 30-40 min at RT. Six 2
or 4-fold serial serum dilutions starting from a 1:10 dilution were prepared using the Superblock
buffer with 0.1% Tween20. After blocking, 30 µl of each serum dilution was added to each well in
duplicate. After 1 hr incubation, the plate was washed as described above followed by addition of 30
µl per well of 50 ng/ml peroxide-conjugated donkey anti-sheep immunoglobulin (Jackson
Immunoresearch Laboratories, West Grove, USA) diluted in the Superblock buffer containing 0.1%
Tween 20. After 1 hr incubation followed by washing, 100 µl of the SureBlue Reserve TMB
microwell peroxide substrate (KPL, Gaithersburg, USA) was added to each well. The plate was
incubated for 10-15 min and the reaction was stopped by adding 25 µl/well of 1.0 M HCl. The plate
was read at 450 nm on a microplate reader Infinity M200 (Tecan, Mannedorf, Switzerland). The OD
readings (OD450) were corrected by background subtraction and an average of the duplicates was
obtained.
Page 8 of 38
Accep
ted
Man
uscr
ipt
The corrected mean OD450 values were plotted against the natural logarithm (ln) of the
serum dilutions. A linear regression equation was generated using the linear portion of the serum
titration curve. The endpoint Ab titer was determined by back calculating the serum dilution from ln
(serum dilution) which was obtained by extrapolating the linear regression line to the cut-off
absorbance OD450 = 0.2. The calculation was performed using the following equation:
Antibody Titer = exp[(lnD2-lnD1)*(OD1-0.2)/(OD1-OD2) + lnD1]
where OD1 and OD2 represent OD values on the linear portion of titration curve; D1
and D2 are the corresponding serum dilutions; 0.2 – cut-off absorbance value.
2.7. Hemagglutination inhibition (HAI) assay
The validated hemagglutination inhibition (HAI) assay for human serum samples was
conducted by a certified laboratory (Focus Diagnostics, Inc.,Cypress, USA) using turkey red
blood cells (RBC) and influenza viruses representing each strain in the trivalent vaccine as
source of agglutinating HA. The HAI titer was determined by the reciprocal of the last serum
dilution which contained non-agglutinated RBC’s. The HA-specific immune response was
estimated by Post-to-Pre Ratio (PPR) of HAI titers after (postimmune) and before (preimmune)
vaccination. For each separated donor group the Geometric Mean Ratio (GMR) as a geometric
mean of individual PPR values was calculated.
2.8. Neuraminidase inhibition (NAI) assay
The NAI inhibition assay involves testing NA activity in VLP samples after their incubation
with serial dilutions of a serum containing potential NA-specific antibodies and calculating the
residual NAA to the activity in the absence of serum. The NAA was measured by a fluorometric
assay with 2′-(4-Methylumbelliferyl)-α-D-N-acetylneuraminic acid sodium salt hydrate (MUNANA)
as a substrate and fluorometric detection of the fluorescent reaction product 4-Methyl
Umbellipherone (MU) (Potier et al.,1979; Wetherall et al., 2003).
2.8.1. Reagent preparation
Page 9 of 38
Accep
ted
Man
uscr
ipt
Stock solutions of the 100 mM MUNANA (Gold Biotechnology Inc., St. Louis, USA) and the
2.0 mM MU (Sigma-Aldrich, St. Louis, USA) were prepared in the HyPure water (Fisher Scientific,
Pittsburgh, USA) in amber glass vials. Assay buffer 1 (AB1) contained 32.5 mM MES sodium salt,
4.0 mM CaCl2 and 0.1% Tween 20 from Sigma with the pH adjusted to 6.5. The assay buffer 2
(AB2) was prepared from AB1 by adding 60 µg/ml of bovine serum albumin (BSA) from Pierce. The
stop solution contained 0.1M glycine and 25% ethanol from Fisher adjusted to the pH 10.7. The
MUNANA Stock solution aliquots were stored at -20oC. All other reagents were stored at 2-8oC.
Working solutions of 90 µM MU in AB1 and 300 µM MUNANA in AB2 were freshly prepared prior
to performing the assay and used on the same day.
2.8.2. VLP sample preparation
VLP samples were diluted 1:1 with the 2X Stabilization buffer containing 60 mM MES-Na,
8.0 mM CaCL2, 1.0 M NaCL (Sigma), 0.1% TPGS (Alpha Tocopheryl Polyethylene Glycol 1000
Succinate) (Cognis, Cincinnati, USA ) and 10% Glycerol (Fisher). The samples were aliquoted in 1.5
mL cryovials and stored at 2-8oC for up to six months or at -20oC for up to one year. Prior to the NAI
test, VLP samples were diluted with AB1 to obtain a final NA activity ranging from 1.0-2.0 nmol
MU/well and used on the same day.
2.8.3. Assay procedure
The assay was performed in 96-well black microplates (Greiner Bio-One, Monroe, USA). The
MU standard solutions were prepared in AB1 and added to wells (90 µl/well) in duplicate to provide
final MU concentrations of: 0, 0.1, 0.5, 1.0, 2.0 and 3.0 nmol/well.
The serum samples were stored frozen. Prior to the analysis, the samples were thawed and
placed at 2-8oC for up to one week until tested in the assay. To provide 0 to 50% NA inhibition, two
serum dilution schemes were used: six 4-fold serial dilutions within the range 1:4 to 1:4096 for
elevated antibody titers and six 2-fold serial dilutions within the range 1:2 to 1:64 for low antibody
titers. The VLP sample (30 µl /well) was mixed with 30 µl of each serum dilution in duplicates or
Page 10 of 38
Accep
ted
Man
uscr
ipt
with 30 µl of AB1 in four replicates for the VLP control sample. The plate was incubated at RT with
shaking for 40 min. 30 µl of 300 µM MUNANA was added to wells containing VLP samples or 60
µl of AB1 (Substrate blank) to a final concentration of 100 µM. The plate was incubated at 37oC with
shaking on an incubator-shaker, Jitterbug-4 (Boekel Scientific, Feasterville, USA) for 40 min. The
reaction was stopped by adding 150 µl/well of Stop solution to all wells.
Fluorometric measurements were performed immediately with the Modulus Microplate
Multimode Reader (Turner Biosystems, Sunnyvale, USA) at an Excitation of 365 nm and an
Emission of 410-460 nm and expressed in Relative Fluorescence Units (RFU).
2.8.4. Calculation of NA inhibition titer (NIT)
A standard curve RFU vs. MU and a linear regression equation were generated using readings
from the standards corrected for blank fluorescence. The corrected sample RFU was obtained by
subtracting the average substrate blank RFU from the measured mean sample RFU. The NA activity
of the samples was calculated using the linear regression equation obtained for the MU standards and
expressed as an amount of the product (nmol/well of MU) accumulated during the incubation time.
In some cases, NAA was converted from nmol/well to mU/ml using the equation
NAA (mU/ml) = MUx(nmol/well)*DF/(Vx*Tincub) = 0.56*MU x *DF
where MU is the amount of MU product accumulated over the enzymatic reaction; DF is a
dilution factor or a final dilution of VLP sample; Vx = 30 µL volume of VLP sample; Tincub = 40
min incubation time; mU is milliUnit of enzyme activity corresponding to the conversion of 1 nmol
substrate to product in 1 minute.
The inhibition curve was generated as a % Residual NAA compared to the initial NAA for
the VLP control lacking serum versus log2 [Serum Dilution] as shown in Figure 2.
The optimized procedure included a calculation of NAI titer corresponding to 25% of
inhibition, or 75% of Residual NAA which was designated NIT25 or just NIT. For its estimation, the
linear part of the inhibition curve around 75% of the Residual NAA was approximated by the linear

Page 11 of 38
Accep
ted
Man
uscr
ipt
regression followed by the calculation of log2[Serum dilution] corresponding to 75% of Residual
NAA. The NIT was reported as the serum dilution back calculated from antilog2[NIT]. Any log2NIT
≤ 0 was assigned a value of 0 and corresponded to NIT = 1.
During assay development the NAI titer was also estimated at two additional cut-off levels.
The log2NIT50 representing 50% of inhibition was calculated using the same inhibition curve. The
log2NIT10 representing approximately 10% of inhibition was defined based on (Sylte et al., 2007) as
one log2 serum dilution below the log2 dilution corresponding to NAI ≤5%:
Log2NIT10 = Log2NIT5 – 1.
2.9. Qualification of active NA in VLPs
Seven VLP samples containing different subtypes of NA were prepared in the stabilization
buffer and tested for NAA, total protein and HA concentration to obtain the results comparable with
NAA measurements in live influenza viruses, purified NA proteins, and inactivated virus vaccines.
Stability of NAA in the VLP was analyzed as % Residual NAA after storage at 2-8oC for 6 months.
2.10. Standardization of NA (in activity units) for antibody titration
Since testing an antibody titer requires a constant antigen concentration, it is important to
establish an acceptable range for the initial NA activity in VLP samples that provides consistent
neutralization antibody titer results. To determine this range, four dilutions of H3N2 A/Bris VLP
sample with initial NAA = 3.21 nmol/well of MU were prepared as a neat sample, 2-fold, 3-fold and
4-fold dilutions. Each VLP sample was tested for the NAI titer with an H3N2-NA(A/Bris)-specific
antiserum and a bias between log2NIT values for neat and diluted samples was calculated.
2.11. Assay specificity
To compare the NAI in the VLP sample by antibody specific to homologous and heterologous
NA and HA proteins, the B-Fl VLP was assayed for NIT using sheep serum samples specific to NA
(B/Fl), HA(B/Fl), NA(H3N2 A/NY) and HA(H3N2 A/NY). To evaluate any interference effect of the
antibody to homologous HA and heterologous NA and HA on the specific NA inhibition, different

Page 12 of 38
Accep
ted
Man
uscr
ipt
combinations of the NA(B/Fl)-specific antiserum and antisera specific to other NA and HA proteins
were prepared and tested for NAI titer using a B-Fl VLP sample. To analyze NA subtype specificity,
the antiserum specific to H5N1-NA (A/Indo) was tested for NIT against homologous (H5N1 A/Indo)
and heterologous (H1N1 A/NewCal, H3N2 A/NY and B/Sh) VLPs.
To confirm that NAI titer measured in sera from subjects vaccinated by a trivalent vaccine is
due to an immune response to each NA protein and not a cross-reactive antibody elicited by a single
NA, serums from 81 subjects were tested for NIT before (preimmune) and after (postimmune)
vaccination with a seasonal trivalent VLP vaccine containing H1N1 A/Bris, H3N2 A/Bris, and B/Fl
influenza strains. The anti-NA immune response was tested for B and N2 subtypes of NA separately
using B/Fl and H3N2 A/Br VLPs respectively and considered positive if post-to-pre Ratio of NAI
titers (PPR) was ≥ 2.0. The distribution of subjects with a positive NAI response against both NA
subtypes and against only one NA subtype was analyzed. Using NAI and HAI assays, the Geometric
Mean Ratio (GMR) of post- and preimmune Ab titers against NA and HA for each group was
calculated.
2.12. NAI assay validation
NAI assay validation was performed following ICH guidelines (ICH, 1996) and included
testing accuracy, precision, and linearity of the assay.
2.12.1. Accuracy
Accuracy was determined in a dilution experiment in which the serum obtained from a ferret
immunized with H3N2 A/Bris virus was serial diluted (2-fold) up to a 1:1024 dilution with a
preimmune (naïve) serum and tested for NAI titer using the H3N2 A/Bris VLP. The expected NIT in
diluted samples for both cut-off values NIT25 and NIT50 was calculated using the following
equation:
NITdil = NITp/D + NITn*(D-1)/D
Page 13 of 38
Accep
ted
Man
uscr
ipt
where NITdil, NITp and NITn are titers for diluted sample, positive (immune) and negative
(preimmune) serums; D is positive serum dilution.
Expected log2NIT10 for sample with dilution D was calculated as
log2NIT10 (neat) - log2D
To analyze any impact of different cut-off values on assay performance, the accuracy was
determined for all three levels of NA inhibition: 10% (log2NIT10), 25% (log2NIT25) and 50%
(log2NIT50) by calculating the bias between found and expected log2 NIT values. Accuracy was
considered acceptable if the absolute value for the calculated bias was ≤ 1.0 which corresponds to one
2-fold serum dilution.
2.12.2. Intra- and inter-assay precision
The intra-assay precision was evaluated by testing three serum samples with different
antibody titers corresponding to low, medium, and high levels of log2NIT. These samples were
prepared by diluting the anti H3N2-NA (A/Bris) sheep serum with a preimmune serum and each
sample was assayed for NAI titer six times. To evaluate the inter-assay variability, the NAI titer for
the ferret antiserum derived by immunization H3N2 A/Bris virus was tested by two analysts on two
separate days using H3N2 A/Bris VLP. The intra-assay and inter-assay variation between log2NIT
results, including between-day and between-analyst repeatability, was calculated by ANOVA and is
presented as the mean along with the %CV values. The % CV was acceptable if it was ≤ 10.0%.
2.12.3. Linearity and analytical range
Linearity was analyzed using data obtained for accuracy. The log2NIT values measured from
the assay were plotted against the expected log2NIT values and then subjected to linear regression
analysis.
The linearity was acceptable if the correlation coefficient value (R square) was ≥ 0.90. The
range of the NAI assay was established as the range of log2NIT values that met the acceptance
criteria for accuracy, precision, and linearity.
Page 14 of 38
Accep
ted
Man
uscr
ipt
2.13. Statistical analysis
All statistical analysis was performed by ANOVA using Microsoft Excel software.
3. Results
The experiments reported here were designed to establish using VLPs as an NA enzyme source
and MUNANA as an enzyme substrate for reproducible measuring the NA neutralizing antibody
in clinical trial samples.
3.1. Qualification of active NA in VLP samples
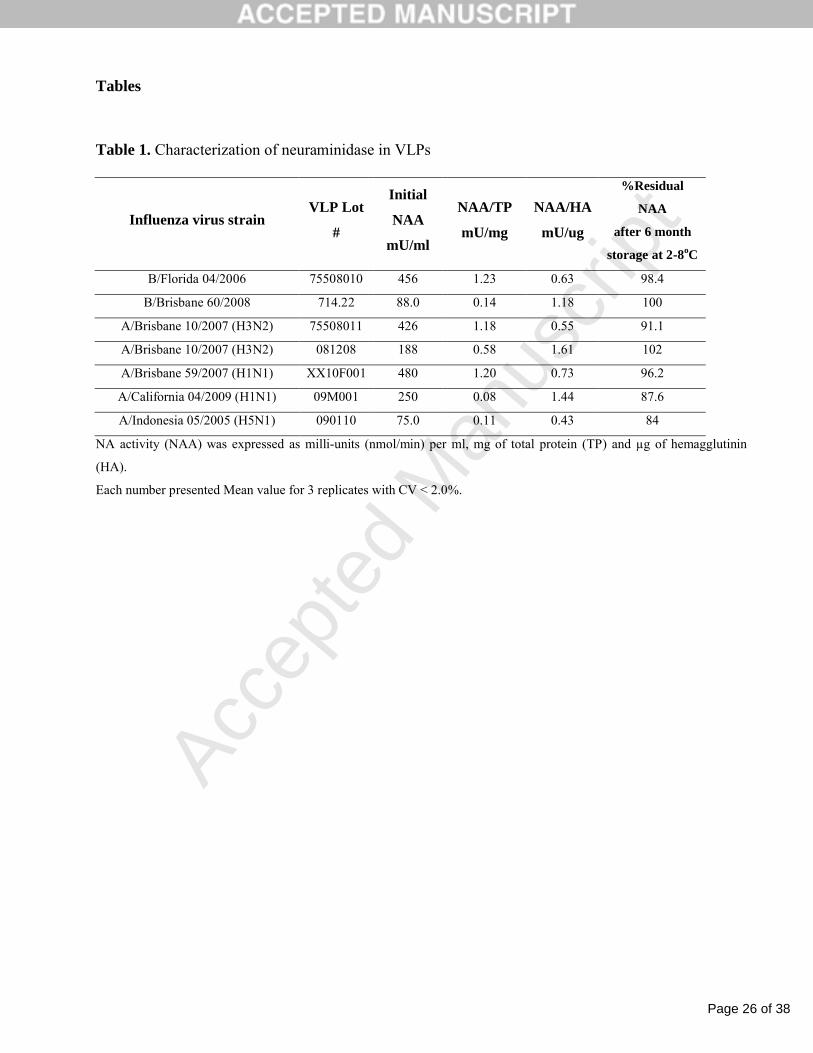
The NAA determined for seven VLP preparations with different subtypes of NA varied
between 75 mU/ml and 480 mU/ml (Table 1). The relative NAA per mg of total protein was within
the range of 0.08 to 1.23 mU/mg total protein and the relative NAA per µg of HA was more
consistent with a 3.7-fold variability from 0.43 to 1.61 mU/µg HA. All VLP preparations
demonstrated high stability of active NA upon storage for 6 months at 2-8oC. %Residual NAA was
within the range of 84-100%.
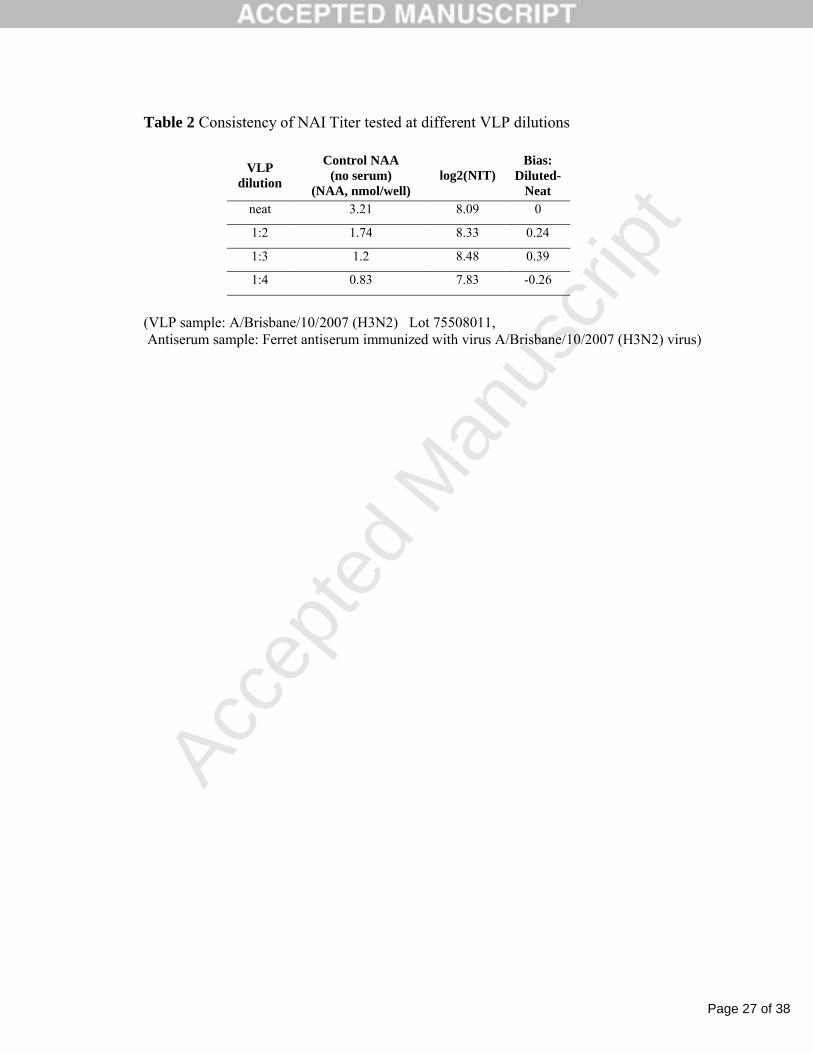
3.2. Standardization of NA (in activity units) for antibody titration
The relevant calculation of NAA in VLPs requires the fluorescence measurement of MU
within the analytical range which was determined and found to be 0.1-3.0 nmol/well of MU. Four 2-
fold serial dilutions of H3N2 A/Bris VLP with an initial NAA varying from 3.21 to 0.83 nmol/well
were prepared and tested for the NAI titer with H3N2-NA(A/Bris)-specific antiserum . NAI curves
and the calculation of log2 NIT25 are shown in Fig.1. The log2NIT tested for different initial NAA
levels was between 7.83 to 8.48 with a bias which did not exceed 1.0 or one two-fold serum dilution
(Table 2). Therefore, the NAA in VLPs was qualified within the range of 2.0 to 1.0 nmol /well as
acceptable for providing consistent NIT results.
3.3. Specificity for testing NAI in the presence of homologous and heterologous NA and HA-
protein specific antibody
Page 15 of 38
Accep
ted
Man
uscr
ipt
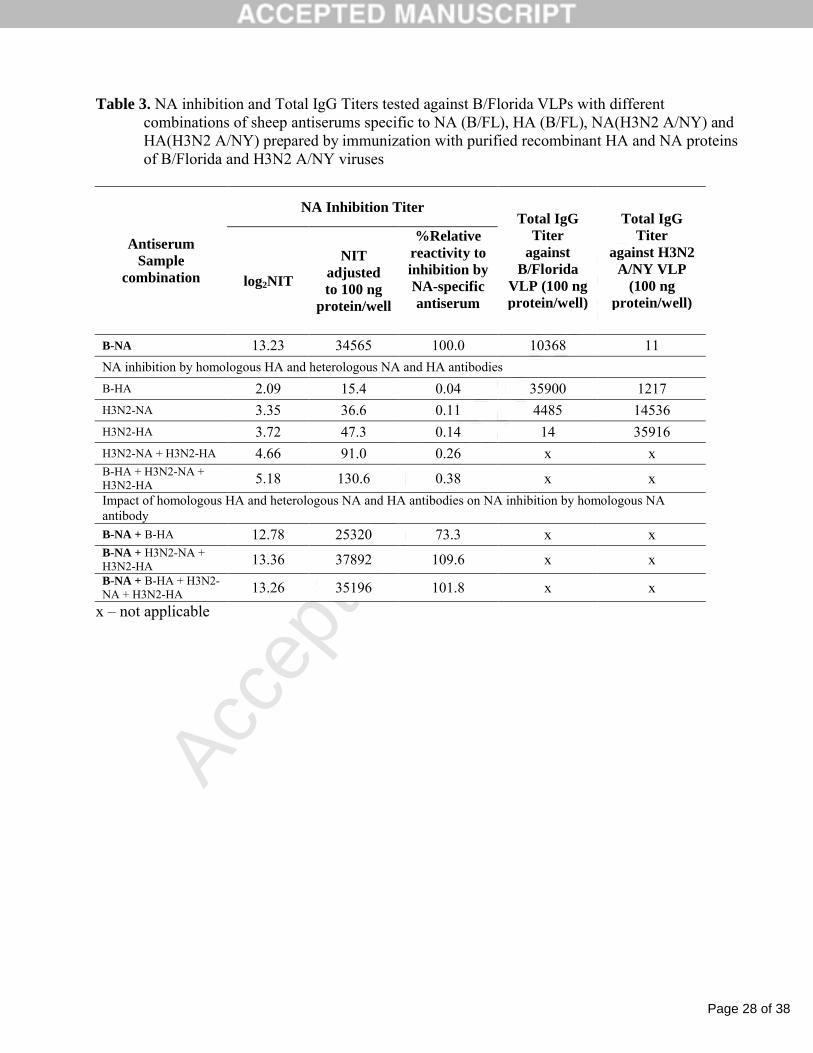
The specificity of anti-NA and anti-HA sera was confirmed by testing for their total IgG titer
by ELISA. All four antisera demonstrated very high specificity for homologous proteins: B/Fl-NA
and B/Fl-HA-specific sera had high titers against B/Fl VLP and very low titers with H3N2 A/NY
VLP. In contrast, H3N2 (A/NY)-NA and H3N2 (A/NY)-HA specific antisera had high titers with
H3N2 A/NY VLP and low titers with B/Fl VLP ( Table 3).
A high NAI titer was detected when testing B/Fl VLP with homologous B-NA antiserum,
while NITs for homologous B-HA and heterologous H3N2-NA and H3N2-HA antisera were 735-
2300 times lower. A mixture of H3N2-NA and H3N2-HA antisera or a mixture of B-HA, H3N2-NA
and H3N2-HA antisera resulted in a low total NIT with B/Fl VLP matching the sum of the NAI titers
from individual serum samples. These results demonstrated the specificity of the assay for
homologous NA antibody due to very low NAI response on homologous B-HA and heterologous
H3N2-NA and H3N2-HA antibodies.
To test any interference effect, the B-NA antiserum was combined with different
combinations of homologous B-HA antiserum and heterologous H3N2-NA and H3N2-HA which
simulates the antiserum from immunization with B/Fl VLP alone or with a combination of B/Fl and
H3N2 VLPs. The log2NIT values obtained for these simulated antisera with additional B-HA, H3N2-
NA and H3N2-HA antibodies had no significant difference from log2NIT tested for the B-NA
antiserum alone: the calculated bias between log2NIT titers for the original B-NA antiserum and any
of its modification did not exceed 0.5. These results confirm the using VLPs for testing antibody
specific only to homologous NA in the presence of homologous HA and heterologous NA and HA
antibodies. .
Specificity of the NAI assay was also confirmed by testing NIT in the serum specific to one
subtype of NA (H5N1 A/Indo) against VLPs with different NA subtypes. This antiserum specifically
inhibited the homologous subtype of NA in H5N1 A/Indo VLP and did not inhibit other subtypes
such as H3N2 A/NY and B/Fl (Fig 2). However, when assayed against VLP containing another strain
Page 16 of 38
Accep
ted
Man
uscr
ipt
of N1 subtype NA (H1N1 A/NewCal) a reduced but measurable inhibition titer was detected. To
quantitate the cross-reactivity of anti-NA (H5N1 A/Indo) antibodies towards different subtypes of
NA the ratio of the NAI titer against a heterologous VLP to the NIT against the homologous H5N1
A/Indo VLP was evaluated (Table 4). The cross-reactivity of H1N1-NA (A/NewCal) to H5N1-NA
specific antibody was low but detectable (2.16%), while the cross-reactivity of N2 and B subtypes of
NA to the same antibody was not detected.
The NAI titers measured independently against B and N2 subtypes of NA in sera from
donors immunized with the trivalent influenza VLP vaccine demonstrated no correlation (R = 0.06)
between immune responses for these two NA subtypes. While 64% of donors had a positive immune
response (PPR ≥2.0) to both NA subtypes, 25% of donors had a positive immune response against
only one subtype of NA (20% had a response against B-NA and 5% against N2-NA), and 11% had
no response to both B-NA and H3N2 NA (Table 5). All volunteers responded to vaccination with at
least a geometric mean 2-fold rise in HA titer. This demonstrates that the assay is able to identify the
immune response to individual NA subtypes when testing human vaccines for the anti-NA antibody
responses.
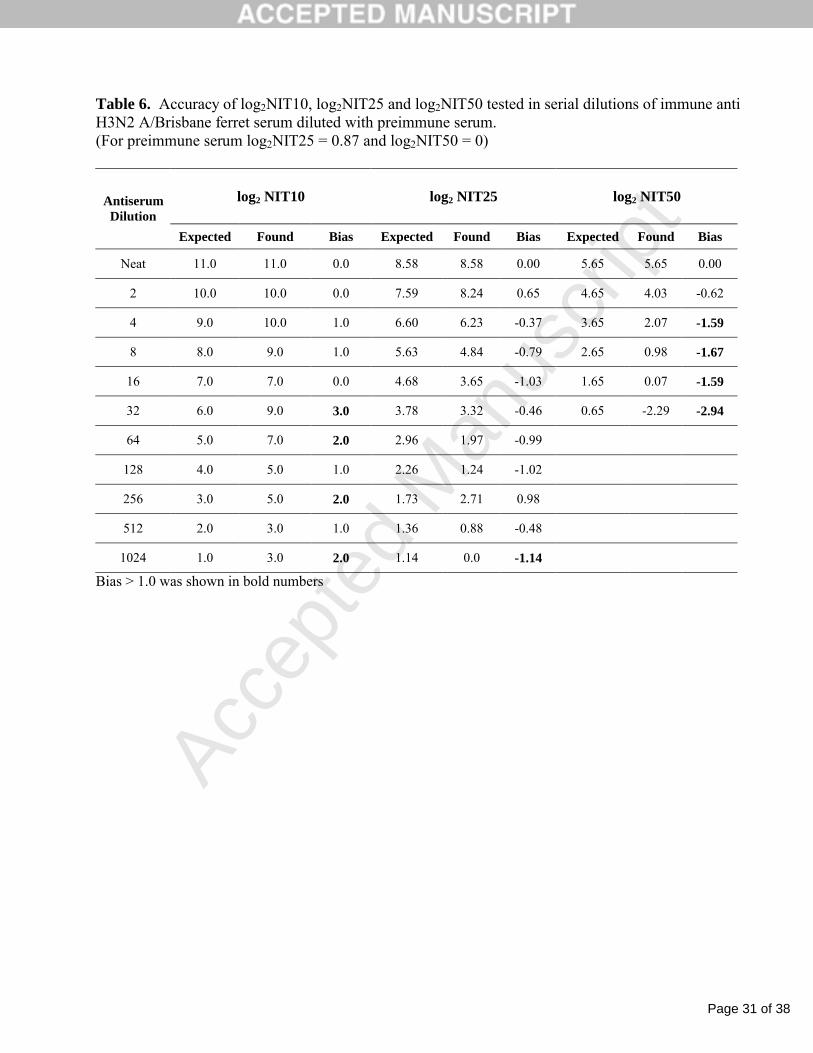
3.4. Accuracy
Reducing a NA-specific antibody concentration in serum samples by diluting the immune
serum with the preimmune (naïve) serum led to a substantial decrease in the inhibition effect (Fig.3)
and demonstrated that the NAI assay can distinguish serums with varying titers. Choosing different
points on the inhibition curve for the undiluted immunized serum had a significant impact on the
NAI titer values which ranged from a high for log2NIT10 of 11.0 (at 10% of NA inhibition) to a low
for log2NIT50 of 5.65 (at 50% of NA inhibition), (Table 6).
For three NAI cut-off levels (10%, 25% and 50%), the accuracy range was determined as the
range of serum dilutions with NAI titers yielding bias ≤1.0 between measured and expected log2NIT
values. Log2NIT50 provided a very narrow range with acceptable accuracy due to a bias ≥ 1.6 at 1:8
Page 17 of 38
Accep
ted
Man
uscr
ipt
and higher serum dilutions. A broader accuracy range, up to 1:16 serum dilution, was found for using
log2NIT10 or 10% cut-off level. Meanwhile, 25% cut-off level and the calculation of log2NIT25
further expanded this range up to 1:512 serum dilution. Based on the expanded accuracy range, the
log2NIT25 designated also as log2NIT was selected for the final NAI titer assignment and used for
further assay validation.
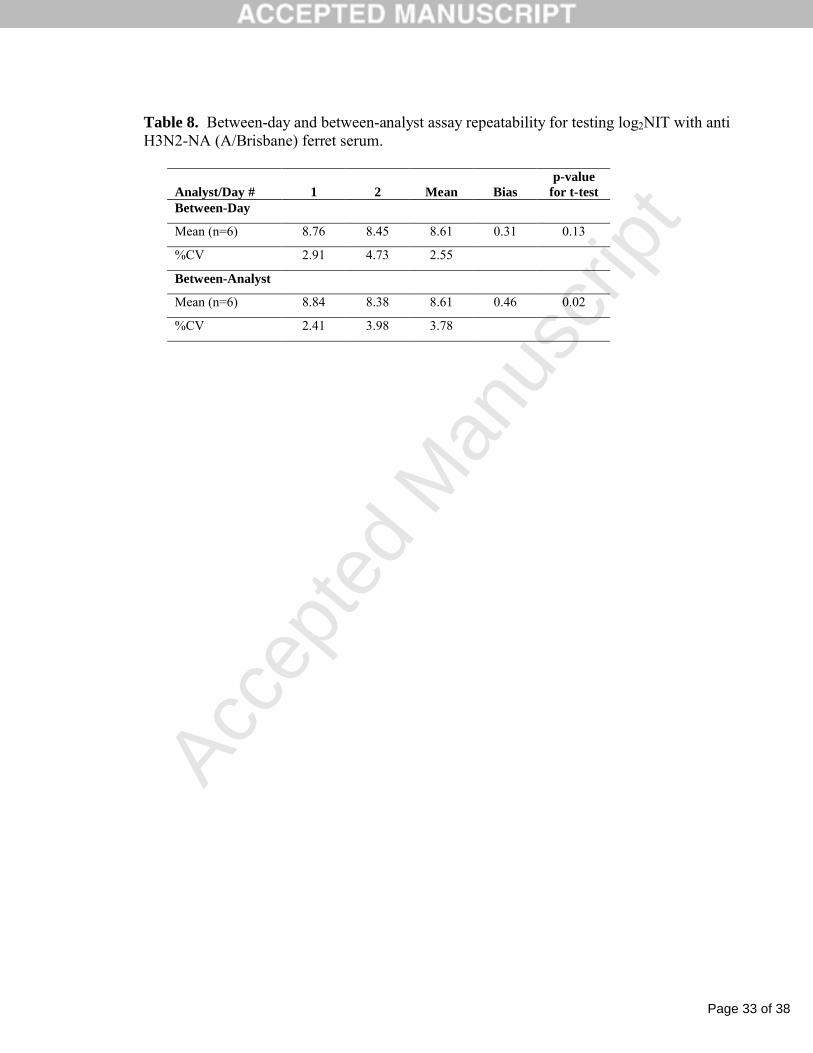
3.5. Intra-assay and inter-assay precision
Intra-assay repeatability was analyzed at three levels of log2NIT25, ranging from 7.86 to 3.41
and demonstrated a low variability, with % CV ≤ 2.3% (Table 7). The inter-assay precision measured
as total variability of mean log2NIT on two different days when performed by two analysts
corresponded to a % CV of 3.95%. Data collected for inter-assay precision were arranged into groups
representing between-day and between-analyst variability (Table 8). The between-day variability
demonstrated a % CV of 2.55% and a statistically insignificant bias of 0.31 (p-value > 0.05 for
Student t-test). The between-analyst variability had a %CV of 3.78% and a bias of 0.46 (p-value <
0.05). Overall, the NAI assay demonstrated excellent precision since the % CV and bias were well
below the acceptance criteria for the % CV (≤ 10%) and bias (≤ 1.0).
3.6. Linearity and analytical range
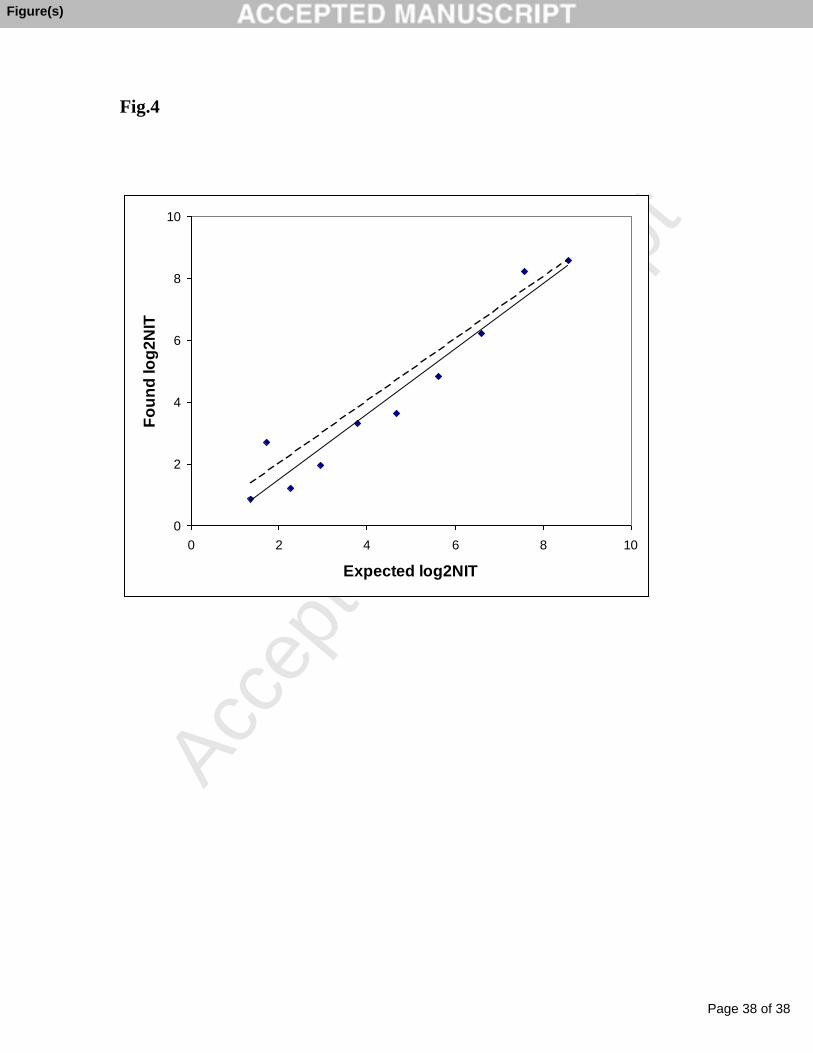
Using data from the accuracy testing, the measured log2NIT was plotted against the expected
log2NIT and linear regression analysis was performed (Fig.4). The NAI assay produced a good linear
response over the entire range of log2NIT from 8.6 to 1.4 and also demonstrated a high correlation
between the measured and expected values with a R square value of 0.94. Overall, the regression line
fit well to the line of identity and only at the lower end of the range the lower than expected values
for measured log2NIT were obtained. Therefore, the analytical range for the NAI assay which met
the acceptance criteria for accuracy, precision, and linearity was determined to be 1.4 to 8.6 of
log2NIT when calculated for 25% of NAA inhibition.

Page 18 of 38
Accep
ted
Man
uscr
ipt
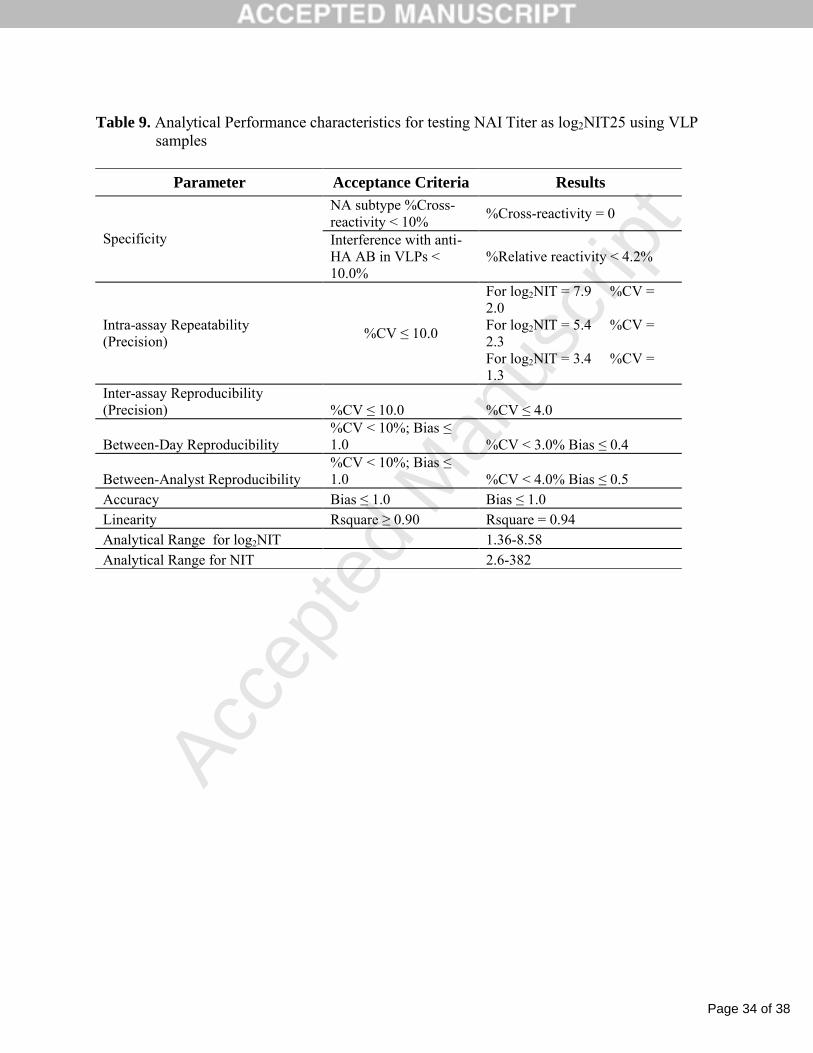
The analytical performance of the NAI assay is summarized in Table 9. Since all acceptance
criteria were met, the assay was validated and can be used for long-term clinical studies to measure
the NAI antibody responses to influenza vaccines.
4. Discussion
It is recognized widely that generating protective immune responses against both HA and NA
viral proteins could significantly improve efficacy of influenza vaccines (Sylte and Suarez, 2010;
Bright at al., 2008, 2007). Therefore, there is a significant demand for a validated assay to measure
the NA neutralizing antibody response after vaccination. Key parameters for such an assay must
include 1) a stable source of active NA enzyme; 2) standardization of an active NA sample used for
antibody titration; and 3) high reactivity to specific NA antibodies with little to no reactivity against
HA antibody and heterologous NA antibodies. To establish the analytical range, assay accuracy,
precision, and linearity must be validated.
The results were the first time the NAA in VLPs was quantified in enzymatic units and
compared against the NAA in inactivated vaccines as well as purified NA preparations. The NAA in
our VLPs varied from 0.43 to 1.61 mU/µg HA and corresponded to the highest NA activity found in
inactivated influenza vaccines (1.0-1.6 mU/µg HA) (Lambre et al., 1989) whereas most of these
vaccines had much lower NA activity (Kendal et al., 1980; Chaloupka et al., 1996). The NAA in
VLPs exceeded the enzymatic activity reported for commercial purified H1N1 NA (167 mU/mL) and
H5N1 NA (60 mU/mL) from SinoBiological (Beijing, China). Since the NA content in VLPs
measured by SDS-PAGE and densitometry is less than 10% of the total protein, the H5N1 VLPs had
about 2-fold lower NA activity per NA protein than purified H5N1 NA (2.5 mU/µg) from RnD
Systems (Minneapolis, USA). Overall, the NAA in VLPs can potentially match the highest level of
the NA activity detected for inactivated vaccines and purified enzyme preparations.
It was demonstrated that six strains of influenza VLPs prepared in the stabilization buffer and
stored at 2-8oC for 6 months had maintained 84-100% of NAA. The active NA was more stable in
Page 19 of 38
Accep
ted
Man
uscr
ipt
VLPs than in purified NA preparations and inactivated vaccines. By vendor specifications, all
commercial purified NA preparations were stable up to 6-12 months only upon storage at -20oC.
Based on limited published results, H1N1 inactivated vaccines showed a loss of 50-100% of NA
activity after 6 months of refrigerated storage (Kendal et al., 1980). Our VLP technology has
therefore provided different strains of VLPs with the most active and stable NA available. Ultimately,
these may be considered a better source of the active enzyme for NA neutralizing antibody assay.
Another potential advantage of VLP could be maintenance of the native NA structure allowing better
binding of antibody. Preliminary experiments have suggested that the anti-NA antibody from serum
samples generated by immunization with VLP vaccine had higher affinity to homologous NA
presented in VLPs than to the purified soluble NA (data are not presented).
All known NA neutralizing antibody studies have used a non-characterized source of active
NA evaluated only by its relative activity, and thus none of the published NAI antibody titers can be
directly compared. In our study, we set up and qualified an NA standard for the antibody titration.
Since preparing VLP samples with equal NA activity is difficult, the range for an acceptable NA
activity was established between 1.0-2.0 nmol/well of MU. In this range the assay produced similar
results for NAI titers with a calculated bias less than one 2-fold serum dilution. Using an average
value for standard NA activity (1.5 nmol/well), each antibody titer can be defined as a serum dilution
providing a specified level of inhibition for 25 µU of active NA. Various VLP preparations with NA
from the same and different influenza strains could have a wide range of NAA, which could lead to a
variable number of NA molecules used for antibody titration. For a given sample that lost 80% of
NAA during storage, normalization by the number of activity units provides 5 times higher number
of NA molecules and would generate a much lower antibody titer than for testing using a 100%
active NA. This demonstrates the crucial importance of NA stability in obtaining reproducible NIT
results which were provided in our study by maintaining the stable NAA in VLPs during 6 months of
storage.
Page 20 of 38
Accep
ted
Man
uscr
ipt
To ensure the same NA activity in the VLP sample for testing pre- and postimmune serum
samples, were analyzed on one microplate. To compare antibody titers specific to different subtypes
of NA, additional NA standardization in VLPs needs to be developed. The reasonable approach may
include measuring the specific enzyme activity per NA protein concentration by developing NA-
specific ELISA. From this standpoint, the evaluation of NA immune response using a seroconversion
ratio of antibody titers for post- and preimmune sera seems currently to be a more reliable approach
than measuring absolute antibody titers themselves.
Generally, binding HA-specific antibody with HA can partially inhibit access of substrate or
anti-NA antibody to NA due to the proximity of both surface proteins, which could result in a
misleading overestimate for NAI titer. The inhibition by anti-HA antibody binding can be avoided
by using reassortant viruses with mismatched HA which, for example, has been used for the NAI
assay using the glycoprotein fetuin as a substrate (Hassantoufighi et al., 2010, Cate et al., 2010). The
major advantage of a synthetic substrate such as MUNANA with a low molecular weight is that the
NAI assay has shown no interference from homologous HA-specific antibody. . Furthermore,
heterologous HA and NA-specific antibody also had no significant impact on NAI titer. The assay
demonstrated excellent specificity to NA subtypes.
The NAI titers for serums obtained from donors immunized with a trivalent seasonal VLP
vaccine confirmed assay specificity and led to the significant conclusions that patients immunized
with a polyvalent vaccine generated an independent immune response against each subtype of NA
and the NAI assay is able to detect this independent and specific immune response. It should be noted
that the high specificity of the MUNANA-based assay may result in its ability to detect only the
subset of NA-specific antibodies which directly bind with the active site of the enzyme and thus it
may underestimate the actual level of NAI.
The cut-off value on the NA inhibition curve used for antibody titer estimation appeared to be
a key factor in determining the accuracy range and the overall analytical range of the assay. The
Page 21 of 38
Accep
ted
Man
uscr
ipt
evaluation of NAI titer using 25% of NAI levels provided a significantly broader accuracy range than
for the previously used 10% and 50% cut-off levels.
Both the intra-assay precision evaluated at low, medium, and high levels of log22NIT25 and the
inter-assay precision examined by between-day and between-analyst variability demonstrated
excellent assay performance with all %CV values below 5.0%. The high assay precision was a result
of the combination of high NA stability and standardization of NAA in VLPs and the optimization of
the cut-off value for antibody titer estimation. The high assay reproducibility demonstrates its
suitability for conducting long-term multisite clinical trials and comparison of results obtained in
multiple trials.
Finally, the regression analysis of measured versus expected log2NIT values confirmed linearity
of the assay with an R square value of 0.94. The assay has been validated for testing NA neutralizing
antibody in serum samples within the range 1.4 to 8.6 of log2NIT. The upper limit of the range could
be greater if an antiserum with a higher Ab titer was evaluated. For example, the antibody titer with
log2NIT up to 12.8 was detected in some clinical samples from donors immunized with a trivalent
VLP vaccine. To our knowledge, this study is the first one presenting the validation of a NA
neutralizing antibody assay. With this data, the reported analytical range could be used as a
benchmark for all available assays along with any new assay development.
The new NA neutralizing antibody assay using VLPs as a substitute for live virus could be of
great value in further studies of NA immunity, especially with regards to new research evaluating the
synergistic effect of NA and HA-specific antibodies on protection against influenza virus infection
(Bosch et al., 2010).
Acknowledgements
We thank Travis Sadowski and Dr Sarathi Boddapati for critical review of the manuscript.
References
Page 22 of 38
Accep
ted
Man
uscr
ipt
Bosch B.J., Bodewes R., de Vries R.P., Kreijtz J.H., Bartelink W., van Amerongen G., Rimmelzwaan
G.F., de Haan C.A., Osterhaus A.D., Rottier P.J. 2010. Recombinant soluble, multimeric
HA and NA exhibit distinctive types of protection against pandemic swine-origin 2009
A(H1N1) influenza virus infection in ferrets. J.Virol. 84, 10366-10374.
Bright R.A., Carter D.M., Crevar C.J., Toapanta F.R, Steckbeck J.D., Cole K.S., Kumar N.J., Pushko
P., Smith G., Tumpey T.M., Ross T.M. 2008. Cross-clade Protective Immune Responses
to Influenza Viruses with H5N1 HA and NA elicited by an Influenza Virus-Like Particle.
PLoS ONE, 1, e1501.
Bright R.A., Carter D.M., Daniluk S, Toapanta F.R, Ahmad A, Gavrilov V, Massare M, Pushko P.,
Mytle N., Rowe T., Smith G., Ross T.M. 2007. Influenza virus-like particles elicit broader
immune responses than whole virion inactivated influenza virus or recombinant
hemagglutinin. Vaccine 25, 3871–3878.
Cate T.R., Rayford Y., Nino D.,Winokur P., Brady R., Belshe R., Chen W., Atmar R.L., Couch R.B.
2010. A high dosage influenza vaccine induced significantly more neuraminidase
antibody than standard vaccine among elderly subjects. Vaccine 28, 2076-2079.
Chaloupka I., Schuler A., Marschall M., Meier-Ewert H. 1996. Eur. J Clin Microbiol Infect Dis, 15,
121-127.
Feng, J., Gulati, U., Zhang, X.,Keitel, W.A., Thompson, D.M., James, J.A., Thompson, L.F., Air,
G.M. 2009. Antibody quantity versus quality after influenza vaccination. Vaccine 27,
6358-6362.
Gubareva LV., Webster RG., Hayden FG. 2002. Detection of influenza virus resistance to
neuraminidase inhibitors by an enzyme inhibition assay. Antivir.Res. 53, 47-61.
Hassantoufighi A., Zhang H., Sandbulte M., Gao J., Manishewitz J., King L., Golding H., Straight
T.M., Eichelberger M.C. 2010. A practical influenza neutralization assay to
simultaneously quantify hemagglutinin and neuraminidase-inhibiting antibody responses.
Vaccine, 28, 790-797.
International Conference on Harmonization (ICH) of Technical Requirements for the Registration of
Pharmaceuticals for Human Use, Validation of analytical procedures: Methodology,
adopted in 1996, Geneva
Johansson B.E., Bucher D.J., Kilbourne E.D. 1989. Purified influenza virus hemagglutinin and
neuraminidase are equivalent in stimulation of antibody response but induce contrasting
types of immunity to infection. J.Virol. 63, 1239-1246.
Page 23 of 38
Accep
ted
Man
uscr
ipt
Kalbfuss B., Knochlein A., Krober T., Reichl U. 2008. Monitoring influenza virus content in vaccine
production: precise assays for the quantitation of hemagglutination and neuraminidase
activity. Biologicals, 36, 145-161.
Kang S., Song J., Quan F., Compans R.W. 2009. Influenza vaccines based on virus-like particles.
Vir.Res. 143, 140-146.
Kendal A.P., Bozeman F.M., Ennis F.A. 1980. Further studies of the neuraminidase content of
inactivated influenza vaccines and the neuraminidase antibody responses after vaccination
of immunologically primed and unprimed populations. Infection & Immunity, 29, 966-
971.
Lai J.C.C., Chan W.W.L., Kien F.,Nicholls J.M., Malik Peiris J.S., Garcia J.M. 2010. Formation of
virus-like particles from human cell lines exclusively expressing influenza
neuraminidase. J.Gen.Vir. 91, 2322-2330.
Lambre C.R., Chauvaux S., Pilatte Y. 1989. Fluorometric assay for the measurement of viral
neuraminidase in influenza vaccines. Vaccine, 7, 104-105.
Mahmood K., Bright RA, Mytle N., Carter DM., Crevar CJ., Achenbach JE., Heaton PM., Tumpey
TM., Ross TM. 2008. H5N1 VLP vaccine induced protection in ferrets against lethal
challenge with highly pathogenic H5N1 influenza viruses. Vaccine 26, 5393–5399.
Potier M., Mameli L., Belisle M., Dallaire L., Melancon SB. 1979. Flurometric Assay of
Neuraminidase with a Sodium (4-methylumbelliferyl-α-D-N-Acetylneuraminate)
substrate. Anal.Biochem. 94, 287-296.
Pushko P, Tumpey TM, Bu F, Knell J, Robinson R, Smith G. 2005. Influenza virus-like
particles comprised of the HA, NA, and M1 proteins of H9N2 influenza virus
induce protective immune responses in BALB/c mice. Vaccine 23, 5751–5759.
Sylte,M.J.,Suarez, D.L., 2010. Influenza neuraminidase as a vaccine antigen, in: Compans,
R.W.,Orenstein, W.A. (Eds.), Vaccines for Pandemic Influenza, Current Topics in
Microbiology and Immunology 333., Springer-Verlag, Berlin Heidelberg, pp.227-241.
Sylte,M.J., Hubby,B.,Suarez, D.L. 2007. Influenza neuraminidase antibodies provide partial
protection for chickens against high pathogenic avian influenza infection. Vaccine 25,
3763-3772.
Wetherall NT, Trivedi T., Zeller J.,Hodges-Savola C., McKimm-Breshkin JL., Zambon M., Hayden
FG. 2003. Evaluation of neuraminidase enzyme assays using different substrates to
measure susceptibility of influenza virus clinical isolates to neuraminidase inhibitors:

Page 24 of 38
Accep
ted
Man
uscr
ipt
Report of the Neuraminidase Inhibitor Susceptibility Network. J.Clin.Microbiol. 41, 742-
750.

Page 25 of 38
Accep
ted
Man
uscr
ipt
Figure Captions
Fig.1
Calculation of log2NIT using NA inhibition curves. NAI curves were plotted as Residual NA
activity (NAA%) versus log2[serum dilution] for preimmunized (log2 (NIT1) and immunized (log2
(NIT2) sheep serums using purified NA from B/Florida virus as an immunogen. NAI assay was
performed with B/Florida VLPs (Lot 75508010).
Solid lines indicate linear regression lines generated using part of inhibition curves around %Residual
NAA = 75%. Dashed lines represent graphical determination of log2NIT corresponded to 25% of NA
inhibition for both curves. Calculated values for log2 (NIT) were log2 (NIT1) = 1.72 and log2 (NIT2)
= 7.9.
Fig.2
Inhibition of different NA subtypes by NA(H5N1 A/Indo) – specific serum.
NA inhibition curves in H5N1 A/Indo, H1N1 A/NewCal, H3N2 A/NY and B/Sh VLPs by serum
from sheep immunized with purified NA from H5N1 A/Indo virus (AB Titer 410,000).
Fig.3
NA Inhibition by neat and prediluted serum samples with reduced anti-NA Ab level.
Prediluted anti-H3N2 A/Br ferret serum samples were prepared by dilutions of immune serum
(NIT25 = 382.7) with preimmune serum (NIT25 =1.83) 1:8 and 1:256 and tested with H3N2
A/Brisbane VLP for NAI titer as per the assay procedure.
Fig.4
Found log2NIT versus expected log2NIT. NAI titers were tested using H3N2 A/Brisbane VLP and
anti- H3N2 A/Brisbane ferret serum samples prepared by dilution with preimmune serum. A dashed
line indicates the line of identity and a solid line indicates the line of linear regression.
Page 26 of 38
Accep
ted
Man
uscr
ipt
Tables
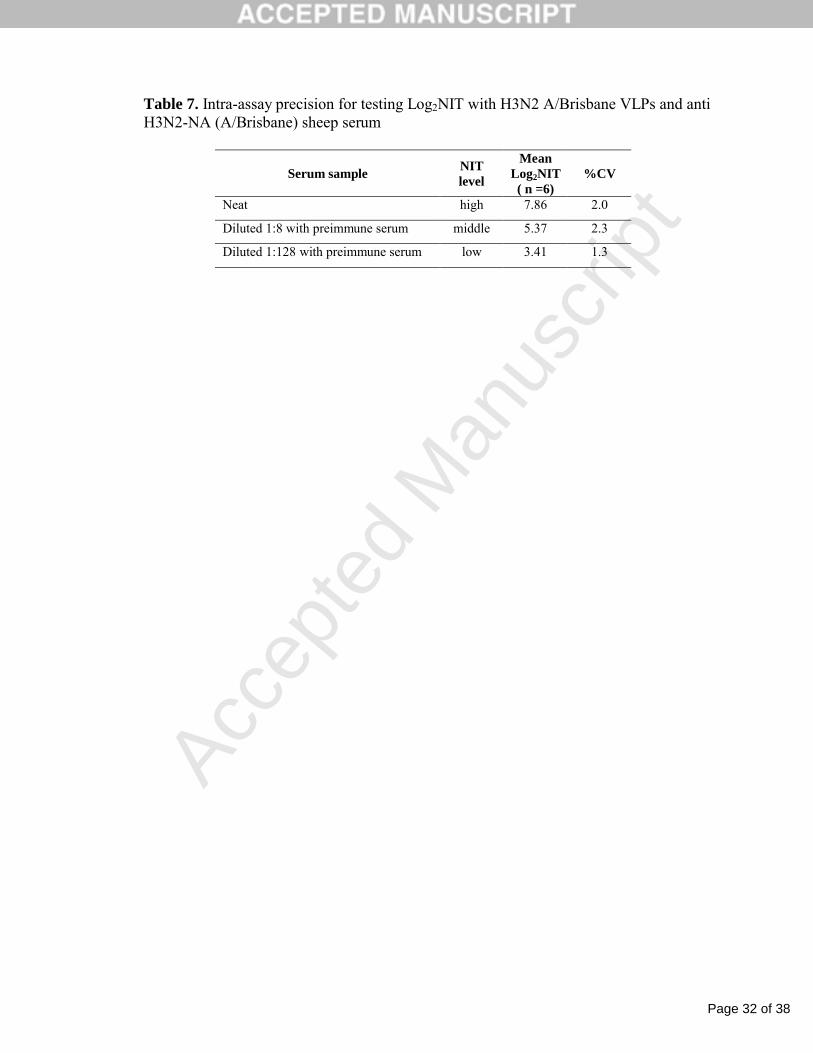
Table 1. Characterization of neuraminidase in VLPs
Influenza virus strainVLP Lot
#
Initial
NAA
mU/ml
NAA/TP
mU/mg
NAA/HA
mU/ug
%Residual
NAA
after 6 month
storage at 2-8oC
B/Florida 04/2006 75508010 456 1.23 0.63 98.4
B/Brisbane 60/2008 714.22 88.0 0.14 1.18 100
A/Brisbane 10/2007 (H3N2) 75508011 426 1.18 0.55 91.1
A/Brisbane 10/2007 (H3N2) 081208 188 0.58 1.61 102
A/Brisbane 59/2007 (H1N1) XX10F001 480 1.20 0.73 96.2
A/California 04/2009 (H1N1) 09M001 250 0.08 1.44 87.6
A/Indonesia 05/2005 (H5N1) 090110 75.0 0.11 0.43 84
NA activity (NAA) was expressed as milli-units (nmol/min) per ml, mg of total protein (TP) and µg of hemagglutinin
(HA).
Each number presented Mean value for 3 replicates with CV < 2.0%.
Page 27 of 38
Accep
ted
Man
uscr
ipt
Table 2 Consistency of NAI Titer tested at different VLP dilutions
VLP dilution
Control NAA (no serum)
(NAA, nmol/well)log2(NIT)
Bias: Diluted-
Neatneat 3.21 8.09 0
1:2 1.74 8.33 0.24
1:3 1.2 8.48 0.39
1:4 0.83 7.83 -0.26
(VLP sample: A/Brisbane/10/2007 (H3N2) Lot 75508011, Antiserum sample: Ferret antiserum immunized with virus A/Brisbane/10/2007 (H3N2) virus)
Page 28 of 38
Accep
ted
Man
uscr
ipt
Table 3. NA inhibition and Total IgG Titers tested against B/Florida VLPs with different combinations of sheep antiserums specific to NA (B/FL), HA (B/FL), NA(H3N2 A/NY) and HA(H3N2 A/NY) prepared by immunization with purified recombinant HA and NA proteins of B/Florida and H3N2 A/NY viruses
NA Inhibition Titer
Antiserum Sample
combination log2NIT
NIT adjusted to 100 ng
protein/well
%Relative reactivity to inhibition by NA-specific antiserum
Total IgG Titer
against B/Florida
VLP (100 ng protein/well)
Total IgG Titer
against H3N2 A/NY VLP
(100 ng protein/well)
B-NA 13.23 34565 100.0 10368 11
NA inhibition by homologous HA and heterologous NA and HA antibodies
B-HA 2.09 15.4 0.04 35900 1217
H3N2-NA 3.35 36.6 0.11 4485 14536
H3N2-HA 3.72 47.3 0.14 14 35916
H3N2-NA + H3N2-HA 4.66 91.0 0.26 x xB-HA + H3N2-NA + H3N2-HA 5.18 130.6 0.38 x x
Impact of homologous HA and heterologous NA and HA antibodies on NA inhibition by homologous NA antibody
B-NA + B-HA 12.78 25320 73.3 x xB-NA + H3N2-NA + H3N2-HA 13.36 37892 109.6 x xB-NA + B-HA + H3N2-NA + H3N2-HA 13.26 35196 101.8 x x
x – not applicable

Page 29 of 38
Accep
ted
Man
uscr
ipt
Table 4 Cross-reactivity of H5N1 NA antibodies with different types of Neuraminidase tested with NA inhibition assay
VLP NIT %Cross-reactivity
H5N1 A/Indonesia Lot 022007 8462.7 N/A
H1N1 A/NewCaledonia Lot 75508005 182.7 2.16
H3N2 A/NewYork Lot 090407 1.0 0.01
B/Shanghai Lot 101607 4.6 0.05

Page 30 of 38
Accep
ted
Man
uscr
ipt
Table 5. Distribution of donors vaccinated with 60 µg HA dose of seasonal trivalent VLP vaccine (A/Brisbane/59/2007(H1N1), A/Brisbane/10/2007 (H3N2), B/Florida/04/2006) on groups with no(Post-to-Pre Ratio of NAI titers < 2.0) and positive (PPR ≥ 2.0) NAI immune response against both B-NA and H3N2-NA and only one B-NA or H3N2-NA and Geometric Mean ratio (GMR) of post-and preimmune antibody titers against NA (by NAI assay) and HA (by HAI assay) in each group
Geometric Mean Ratio (GMR) of post-and preimmune antibody titers
B/FL VLP H3N2-A/Br VLPGroup N %Total N
NAI HAI NAI HAI Total 81 100 9.7 5.6 5.9 9.2
Response for both B-NA and H3N2-NA 52 64.2 15.5 7.5 12.4 14.6
Response only for B-NA 16 19.8 11.0 4.8 1.4 4.5
Response only for H3N2-NA 4 4.9 1.4 2.5 5.0 6.0
No response for both B-NA and H3N2-NA 9 11.1 1.2 2.1 1.1 2.7
Page 31 of 38
Accep
ted
Man
uscr
ipt
Table 6. Accuracy of log2NIT10, log2NIT25 and log2NIT50 tested in serial dilutions of immune anti H3N2 A/Brisbane ferret serum diluted with preimmune serum.(For preimmune serum log2NIT25 = 0.87 and log2NIT50 = 0)
log2 NIT10 log2 NIT25 log2 NIT50Antiserum Dilution
Expected Found Bias Expected Found Bias Expected Found Bias
Neat 11.0 11.0 0.0 8.58 8.58 0.00 5.65 5.65 0.00
2 10.0 10.0 0.0 7.59 8.24 0.65 4.65 4.03 -0.62
4 9.0 10.0 1.0 6.60 6.23 -0.37 3.65 2.07 -1.59
8 8.0 9.0 1.0 5.63 4.84 -0.79 2.65 0.98 -1.67
16 7.0 7.0 0.0 4.68 3.65 -1.03 1.65 0.07 -1.59
32 6.0 9.0 3.0 3.78 3.32 -0.46 0.65 -2.29 -2.94
64 5.0 7.0 2.0 2.96 1.97 -0.99
128 4.0 5.0 1.0 2.26 1.24 -1.02
256 3.0 5.0 2.0 1.73 2.71 0.98
512 2.0 3.0 1.0 1.36 0.88 -0.48
1024 1.0 3.0 2.0 1.14 0.0 -1.14
Bias > 1.0 was shown in bold numbers
Page 32 of 38
Accep
ted
Man
uscr
ipt
Table 7. Intra-assay precision for testing Log2NIT with H3N2 A/Brisbane VLPs and anti H3N2-NA (A/Brisbane) sheep serum
Serum sampleNIT level
MeanLog2NIT( n =6)
%CV
Neat high 7.86 2.0
Diluted 1:8 with preimmune serum middle 5.37 2.3
Diluted 1:128 with preimmune serum low 3.41 1.3
Page 33 of 38
Accep
ted
Man
uscr
ipt
Table 8. Between-day and between-analyst assay repeatability for testing log2NIT with anti H3N2-NA (A/Brisbane) ferret serum.
Analyst/Day # 1 2 Mean Biasp-value
for t-testBetween-Day
Mean (n=6) 8.76 8.45 8.61 0.31 0.13
%CV 2.91 4.73 2.55
Between-Analyst
Mean (n=6) 8.84 8.38 8.61 0.46 0.02
%CV 2.41 3.98 3.78
Page 34 of 38
Accep
ted
Man
uscr
ipt
Table 9. Analytical Performance characteristics for testing NAI Titer as log2NIT25 using VLP samples
Parameter Acceptance Criteria Results
NA subtype %Cross-reactivity < 10%
%Cross-reactivity = 0
Specificity Interference with anti-HA AB in VLPs < 10.0%
%Relative reactivity < 4.2%
Intra-assay Repeatability (Precision)
%CV ≤ 10.0
For log2NIT = 7.9 %CV = 2.0For log2NIT = 5.4 %CV = 2.3For log2NIT = 3.4 %CV = 1.3
Inter-assay Reproducibility (Precision) %CV ≤ 10.0 %CV ≤ 4.0
Between-Day Reproducibility%CV < 10%; Bias ≤ 1.0 %CV < 3.0% Bias ≤ 0.4
Between-Analyst Reproducibility%CV < 10%; Bias ≤ 1.0 %CV < 4.0% Bias ≤ 0.5
Accuracy Bias ≤ 1.0 Bias ≤ 1.0Linearity Rsquare ≥ 0.90 Rsquare = 0.94Analytical Range for log2NIT 1.36-8.58Analytical Range for NIT 2.6-382
Page 35 of 38
Accep
ted
Man
uscr
ipt
Fig.1
0
20
40
60
80
100
120
0 2 4 6 8 10 12 14
log2[Serum Dilution]
% R
esid
ual
NA
A
Immunized serum
preimmunized
serum
log2(NIT1) log2(NIT2)
Figure(s)

Page 36 of 38
Accep
ted
Man
uscr
ipt
Fig.2
0
20
40
60
80
100
120
4 6 8 10 12 14 16 18
log2[Serum Dilution]
% R
esid
ual
NA
A
H5N1 A/Indo
H1N1 A/NewCal
H3N2 A/NY
B/Shanghai
Figure(s)

Page 37 of 38
Accep
ted
Man
uscr
ipt
Fig.3
0.0
20.0
40.0
60.0
80.0
100.0
120.0
0 2 4 6 8 10 12 14
log2[Serum Dilution]
%R
esid
ual
NA
A
Neat Prediluted sample (1:8) Prediluted sample (1:256)
Figure(s)
Page 38 of 38
Accep
ted
Man
uscr
ipt
Fig.4
0
2
4
6
8
10
0 2 4 6 8 10
Expected log2NIT
Fo
un
d lo
g2
NIT
Figure(s)