Influence of the Sampling Rate and Noise Characteristics on Prediction of the Maximal Safe Laser...
10
Int J Thermophys DOI 10.1007/s10765-013-1451-x Influence of the Sampling Rate and Noise Characteristics on Prediction of the Maximal Safe Laser Exposure in Human Skin Using Pulsed Photothermal Radiometry L. Vidoviˇ c · M. Milaniˇ c · B. Majaron Received: 15 February 2012 / Accepted: 14 August 2012 © Springer Science+Business Media New York 2013 Abstract Pulsed photothermal radiometry (PPTR) allows for noninvasive determi- nation of the laser-induced temperature depth profile in strongly scattering samples, including human skin. In a recent experimental study, we have demonstrated that such information can be used to derive rather accurate predictions of the maximal safe radi- ant exposure on an individual patient basis. This has important implications for efficacy and safety of several laser applications in dermatology and aesthetic surgery, which are often compromised by risk of adverse side effects (e.g., scarring, and dyspigmenta- tion) resulting from nonselective absorption of strong laser light in epidermal melanin. In this study, the differences between the individual maximal safe radiant exposure ( H max ) values as predicted from PPTR temperature depth profiling performed using a commercial mid-IR thermal camera (as used to acquire the original patient data) and our customized PPTR setup are analyzed. To this end, the latter has been used to acquire 17 PPTR records from three healthy volunteers, using 1 ms laser irradiation at 532 nm and a signal sampling rate of 20 000 s −1 . The laser-induced temperature profiles are reconstructed first from the intact PPTR signals, and then by binning the data to imitate the lower sampling rate of the IR camera (1000 fps). Using either the initial temperature profile in a dedicated numerical model of heat transfer or protein denaturation dynamics, the predicted levels of epidermal thermal damage (Ω) and the corresponding H max are compared. A similar analysis is performed also with regard to the differences between noise characteristics of the two PPTR setups. L. Vidoviˇ c(B ) · M. Milaniˇ c · B. Majaron Jožef Stefan Institute, Jamova 39, 1000 Ljubljana, Slovenia e-mail: [email protected] B. Majaron Faculty for Mathematics and Physics, University of Ljubljana, Jadranska 19, 1000 Ljubljana, Slovenia 123
-
Upload
independent -
Category
Documents
-
view
2 -
download
0
Transcript of Influence of the Sampling Rate and Noise Characteristics on Prediction of the Maximal Safe Laser...

Int J ThermophysDOI 10.1007/s10765-013-1451-x
Influence of the Sampling Rate and NoiseCharacteristics on Prediction of the Maximal SafeLaser Exposure in Human Skin Using PulsedPhotothermal Radiometry
L. Vidovic · M. Milanic · B. Majaron
Received: 15 February 2012 / Accepted: 14 August 2012© Springer Science+Business Media New York 2013
Abstract Pulsed photothermal radiometry (PPTR) allows for noninvasive determi-nation of the laser-induced temperature depth profile in strongly scattering samples,including human skin. In a recent experimental study, we have demonstrated that suchinformation can be used to derive rather accurate predictions of the maximal safe radi-ant exposure on an individual patient basis. This has important implications for efficacyand safety of several laser applications in dermatology and aesthetic surgery, whichare often compromised by risk of adverse side effects (e.g., scarring, and dyspigmenta-tion) resulting from nonselective absorption of strong laser light in epidermal melanin.In this study, the differences between the individual maximal safe radiant exposure(Hmax) values as predicted from PPTR temperature depth profiling performed usinga commercial mid-IR thermal camera (as used to acquire the original patient data)and our customized PPTR setup are analyzed. To this end, the latter has been used toacquire 17 PPTR records from three healthy volunteers, using 1 ms laser irradiationat 532 nm and a signal sampling rate of 20 000 s−1. The laser-induced temperatureprofiles are reconstructed first from the intact PPTR signals, and then by binning thedata to imitate the lower sampling rate of the IR camera (1000 fps). Using either theinitial temperature profile in a dedicated numerical model of heat transfer or proteindenaturation dynamics, the predicted levels of epidermal thermal damage (Ω) and thecorresponding Hmax are compared. A similar analysis is performed also with regardto the differences between noise characteristics of the two PPTR setups.
L. Vidovic (B) · M. Milanic · B. MajaronJožef Stefan Institute, Jamova 39, 1000 Ljubljana, Sloveniae-mail: [email protected]
B. MajaronFaculty for Mathematics and Physics, University of Ljubljana,Jadranska 19, 1000 Ljubljana, Slovenia
123

Int J Thermophys
Keywords Infrared detection · Noise characteristics · Pulsed photothermalradiometry · Sampling rate · Temperature depth profiling
1 Introduction
The efficacy of several laser procedures in dermatology and aesthetic surgery is com-promised by the risk of permanent side effects, such as dyspigmentation or scarring.Such adverse effects can arise from overheating of the epidermis (superficial layer ofskin), which contains a natural broadband absorber, melanin. Although the concentra-tion and distribution of melanin in skin exhibit large inter- and intrapatient variations,the applied laser radiant exposure is currently selected based on subjective visualimpression and expert opinion of the treating physician.
Pulsed photothermal radiometry (PPTR) allows for noninvasive measurement oftemperature depth profiles induced in biological tissue by irradiation with short laserpulses [1–3]. In a recent retrospective study, we have demonstrated that such infor-mation could be used to derive rather accurate predictions of the maximal safe radiantexposure (Hmax) of human skin on an individual patient basis [4,5]. In that study, wehave used PPTR signals recorded earlier on extremities of 13 healthy volunteers using3 ms laser pulses at 755 nm [6]. From those PPTR signals, we have reconstructed therespective laser-induced temperature depth profiles in skin using a custom iterativealgorithm [7]. Solving for subsequent temperature profile evolution enabled us to pre-dict the level of epidermal thermal damage at the radiant exposure applied to the sametest location in the clinical part of the same study [6] and to establish a quantitativerelationship with severity of the resulting adverse effects (i.e., crusting).
Once this relationship has been established, the same approach could be applied topredict the individual value Hmax for any subsequent laser application, based on PPTRmeasurement performed on the specific treatment site. However, the radiometric sig-nals under study [6] were obtained using a fast mid-IR camera, which is unnecessarilycomplex and rather cumbersome for use in anticipated clinical trials of the describedapproach. At the same time, the maximal sampling rate and noise characteristics of thecamera are inferior to those offered by the dedicated portable PPTR setup developedrecently in our laboratory.
In the present study, we analyze the anticipated differences between the recon-structed temperature depth profiles, computed tissue damage levels, and predictedindividual values of Hmax when PPTR signals are obtained using our dedicated setupversus the commercial mid-IR camera as used in Ref. [6]. To this end, we use the for-mer to acquire PPTR measurements from three healthy volunteers, using 1 ms laserirradiation at 532 nm and a signal sampling rate of 20 000 s−1. The laser-inducedtemperature profiles are then reconstructed first by applying near-optimal nonuniformbinning of the full-bandwidth PPTR signals [8]. Subsequently, the signal points areuniformly binned to match the sampling rate of 1000 s−1, as used in Ref. [6], whichyields a suboptimal replica of the same temperature profile. A dedicated numericalmodel of heat transfer and protein denaturation dynamics is then applied to predict thelevel of epidermal thermal damage and the corresponding Hmax, obtained from eitherof the initial temperature profiles. The observed differences are statistically analyzed.
123
Int J Thermophys
A similar analysis is performed also with regard to different noise characteristics ofthe two PPTR setups.
2 Experimental Apparatus and Procedures
2.1 Principles of PPTR
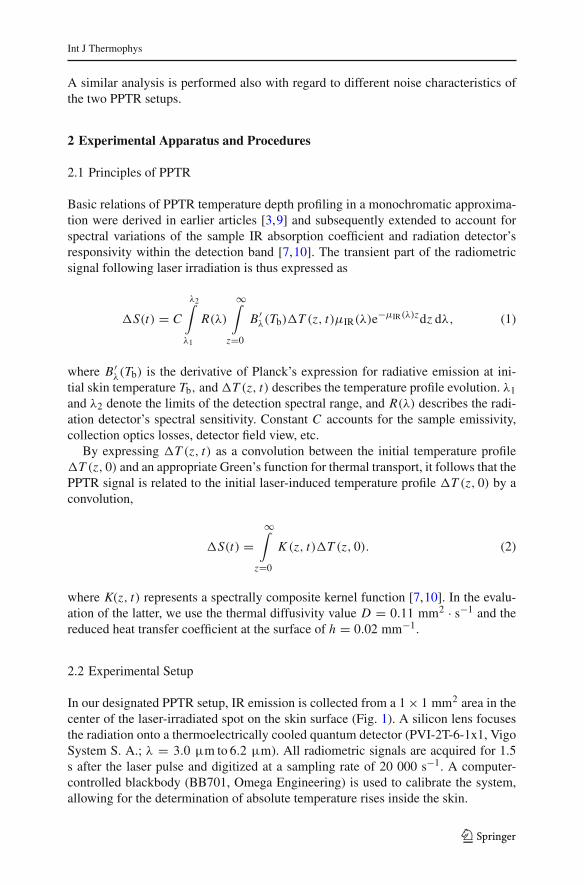
Basic relations of PPTR temperature depth profiling in a monochromatic approxima-tion were derived in earlier articles [3,9] and subsequently extended to account forspectral variations of the sample IR absorption coefficient and radiation detector’sresponsivity within the detection band [7,10]. The transient part of the radiometricsignal following laser irradiation is thus expressed as
�S(t) = C
λ2∫
λ1
R(λ)
∞∫
z=0
B ′λ(Tb)�T (z, t)μIR(λ)e−μIR(λ)zdz dλ, (1)
where B ′λ(Tb) is the derivative of Planck’s expression for radiative emission at ini-
tial skin temperature Tb, and �T (z, t) describes the temperature profile evolution. λ1and λ2 denote the limits of the detection spectral range, and R(λ) describes the radi-ation detector’s spectral sensitivity. Constant C accounts for the sample emissivity,collection optics losses, detector field view, etc.
By expressing �T (z, t) as a convolution between the initial temperature profile�T (z, 0) and an appropriate Green’s function for thermal transport, it follows that thePPTR signal is related to the initial laser-induced temperature profile �T (z, 0) by aconvolution,
�S(t) =∞∫
z=0
K (z, t)�T (z, 0). (2)
where K(z, t) represents a spectrally composite kernel function [7,10]. In the evalu-ation of the latter, we use the thermal diffusivity value D = 0.11 mm2 · s−1 and thereduced heat transfer coefficient at the surface of h = 0.02 mm−1.
2.2 Experimental Setup
In our designated PPTR setup, IR emission is collected from a 1 × 1 mm2 area in thecenter of the laser-irradiated spot on the skin surface (Fig. 1). A silicon lens focusesthe radiation onto a thermoelectrically cooled quantum detector (PVI-2T-6-1x1, VigoSystem S. A.; λ = 3.0 µm to 6.2 µm). All radiometric signals are acquired for 1.5s after the laser pulse and digitized at a sampling rate of 20 000 s−1. A computer-controlled blackbody (BB701, Omega Engineering) is used to calibrate the system,allowing for the determination of absolute temperature rises inside the skin.
123

Int J Thermophys
Fig. 1 Experimental setup forPPTR
IR detector
Laserhandpiece
ObjectIR lensTo
ADC
In contrast, a commercial mid-IR camera (Phoenix, FLIR Systems; 3.0 µm to5.5 µm) was used in the former study [6] at a sampling rate of 1000 s−1.
2.3 Test Sites and Irradiation
PPTR signals were acquired from 17 independent sites on the lower and upper armsin three healthy volunteers with fair skin (Fitzpatrick types II and III). Before mea-surement, each test site was shaved, and the superficial layer of dehydrated skin cellsremoved by tape stripping. The site was cleaned using medical-grade ethanol, rehy-drated using physiological solution, and air-dried.
The test skin sites were irradiated with a single 1 ms pulse from a Nd:YAG/KTPlaser at 532 nm and spot size of 4 × 6 mm2. A sub-therapeutic radiant exposure of1 J · cm−2 was used to prevent any adverse effects.
2.4 Temperature Profile Reconstruction
Inasmuch as PPTR signals and temperature profiles can be represented as vectors,Eq. 2 becomes a matrix equation,
S = KT; Ki, j = K (z j , ti )�z. (3)
Owing to the defect rank of matrix K, computation of the initial temperature profileT from S presents a severely ill-posed inverse problem [3,9]. In the presence of noise,a unique solution does not exist in general, so a best-fit solution is reconstructed byiterative minimization of the residual norm, ε = ||S − KT||2. Specifically, the vectorsT, consisting of 100 initial temperature values, are reconstructed using the projectedν-method with a nonnegative constraint and regularization by early termination [7].The algorithm is implemented in Matlab (Mathworks) with specific custom subrou-tines written in C++.
2.4.1 Binning of PPTR Signals
The accuracy and stability of the reconstruction results can be improved by applyingnonuniform binning of the full-bandwidth PPTR signals [8]. In our favorite approach,
123

Int J Thermophys
called quadratic binning [8], the bin boundaries ti are related to predetermined depthvalues zi as
ti = z2i
D, (4)
where D stands for the thermal diffusivity.The depth values zi are themselves distributed nonuniformly over the solution
interval, according to
zi+1 = z0 + αi2 (5)
After selecting the initial depth (z0 = 1 µm), factor α can be easily computed forany solution interval (zN = 1.5 mm) and the number of points (N = 100).
In order to simulate the limited acquisition rate allowed by the IR camera in [6],the same PPTR signal is also binned uniformly to 1000 s−1 and used as input to anindependent reconstruction run.
2.4.2 Signal Noise
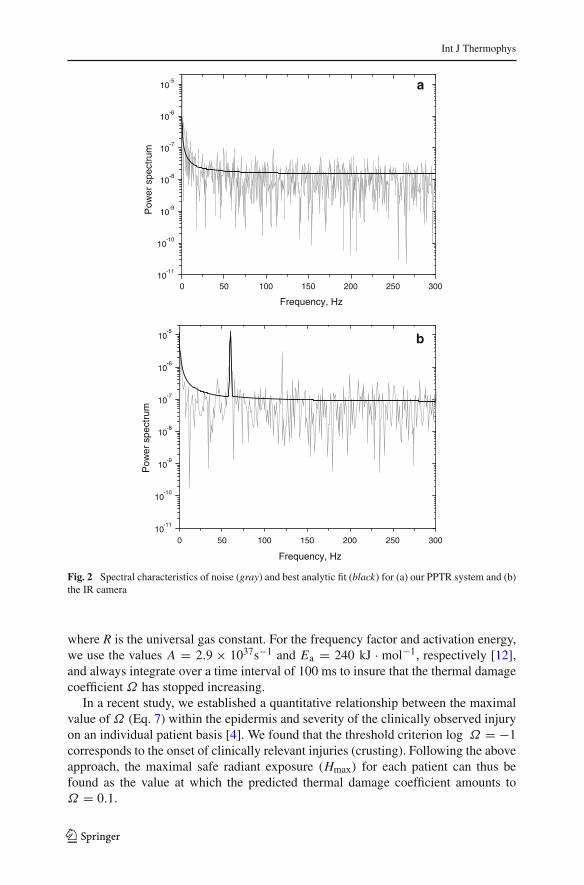
The difference in spectral characteristics of noise between our PPTR setup and the16 × 16 pixel sub-window from the commercial IR camera’s detection array is illus-trated in Fig. 2. Best analytic fits are presented by black lines. A higher level ofwhite noise and a significant amount of power-grid noise at 60 Hz are evident inthe latter case (Fig. 2b). In order to imitate the inferior performance of the IR cam-era, we synthesize several noise vectors with spectral characteristics matching thedifference between the two analytic fits, and add them to our experimental PPTRsignals.
2.5 Epidermal Thermal Damage and Maximal Safe Radiant Exposure
A dedicated numerical model [11] is used to predict the level of epidermal thermaldamage from each reconstructed initial laser-induced temperature profile, �T (z, 0).By using the latter as the initial condition, the temperature profile evolution can becalculated from the one-dimensional heat diffusion equation,
D∂2�T (z, t)
∂z2 = ∂�T (z, t)
∂t. (6)
Thermal damage at the clinically applied radiant exposure H can then be estimatedfrom the suitably scaled-up temperature profile TH(z, t), according to the Arrheniusmodel of protein denaturation dynamics:
Ω(z, t) = A
t∫
0
exp−Ea
RTH(z, t ′)dt ′ (7)
123
Int J Thermophys
10-11
10-10
10-9
10-8
10-7
10-6
10-5
Pow
er s
pect
rum
Frequency, Hz
a
0 50 100 150 200 250 300
0 50 100 150 200 250 30010
-11
10-10
10-9
10-8
10-7
10-6
10-5
Pow
er s
pect
rum
Frequency, Hz
b
Fig. 2 Spectral characteristics of noise (gray) and best analytic fit (black) for (a) our PPTR system and (b)the IR camera
where R is the universal gas constant. For the frequency factor and activation energy,we use the values A = 2.9 × 1037s−1 and Ea = 240 kJ · mol−1, respectively [12],and always integrate over a time interval of 100 ms to insure that the thermal damagecoefficient Ω has stopped increasing.
In a recent study, we established a quantitative relationship between the maximalvalue of Ω (Eq. 7) within the epidermis and severity of the clinically observed injuryon an individual patient basis [4]. We found that the threshold criterion log Ω = −1corresponds to the onset of clinically relevant injuries (crusting). Following the aboveapproach, the maximal safe radiant exposure (Hmax) for each patient can thus befound as the value at which the predicted thermal damage coefficient amounts toΩ = 0.1.
123

Int J Thermophys
0
1
2
3
4
0,0 0,1 0,2 0,3 0,4 0,5 0,0 0,1 0,2 0,3 0,4 0,5 0,0 0,1 0,2 0,3 0,4 0,5 0,0 0,1 0,2 0,3 0,4 0,5
Δ S, K
a
Time, s
b c d
Fig. 3 Calibrated radiometric signal from a healthy skin site: (a) as acquired at 20 000 s−1; (b) afterquadratic binning; (c) uniformly binned to 1000 s−1; and (d) uniformly binned to 1000 s−1 with addednoise to imitate the IR camera performance
0
1
2
3
4
5a
Tem
pera
ture
ris
e, K b
Depth, mm
0,0 0,1 0,2 0,3 0,4 0,5 0,6 0,0 0,1 0,2 0,3 0,4 0,5 0,6 0,0 0,1 0,2 0,3 0,4 0,5 0,6
c
Fig. 4 Initial laser-induced temperature profiles �T (z, 0) reconstructed from PPTR signal: (a) Fig. 2b; (b)Fig. 2c; and (c) Fig. 2d. Gray area in (c) indicates standard deviation of the temperature values
3 Results
From each experimental PPTR signal, three versions of the signal vector S are preparedfor the inverse analysis, as described in Sect. 2.4. Figure 3 presents one PPTR signal asacquired at 20 000 s−1(Fig. 3a), after application of quadratic binning (Fig. 3b), afteruniform binning to 1000 s−1 (Fig. 3c), and with synthetic noise added to the latter toimitate the IR camera performance (Fig. 3d).
The initial laser-induced temperature profiles �T (z, 0), reconstructed from PPTRsignals in Figs. 3b–d, are presented in Figs. 4a–c. The evident similarity between theprofiles demonstrates the robustness of our reconstruction algorithm. Nevertheless,the peak temperature level is significantly decreased upon lowering the sampling rateto 1000 s−1 (Fig. 4b), as compared to the case of quadratically binned PPTR signal(Fig. 4a). Such lowering and broadening of temperature peaks is an expected result ofsignal undersampling, affecting particularly the shallower part of the profile.
A further lowering of the temperature peak is observed when noise is added tothe former signal to imitate the IR camera performance (Fig. 4c). The gray area inFig. 4c indicates the standard deviation of the temperature profiles obtained with 15realizations of synthetic noise with the same spectral characteristics. The relativelysmall variability suggests that the subsequent analysis will not be adversely affectedby the randomness inherent in the discussed approach.
Figure 5 shows the degree of thermal damage (Ω) as a function of laser radiantexposure (H), as predicted numerically from temperature profiles in Fig. 4a–c (see thelegend and figure caption). The horizontal dashed line indicates the damage threshold
123

Int J Thermophys
15 16 17 18 19 20 21
-3,5
-3,0
-2,5
-2,0
-1,5
-1,0
-0,5
0,0
0,5
1,0
H'max
quadratic binning
1000 s–1
1000 s–1+noise
log(
Ω)
Radiant exposure, J•cm–2
Hmax
Fig. 5 Degree of thermal damage (Ω) as a function of laser radiant exposure (H), as predicted numericallyfrom temperature profiles in Figs. 3a (white squares), 3b (gray diamonds), and 3c (black circles). Dashedline indicates the damage threshold level (log Ω = −1), as determined using the IR camera in Ref. [4],thus defining the maximal safe radiant exposure for this test site, Hmax. See text for interpretation of H ′
max
level (log Ω = −1), as determined in Refs. [4] and [5] using the IR camera. Themaximal safe radiant exposure for this test site is thus indicated by the value wherethe results imitating the camera performance (solid circles) cross the threshold line(Hmax = 19.6 J · cm−2).
As is evident from Fig. 5, observing the same threshold value also for damagepredictions obtained from PPTR measurements with our optimized setup and signalprocessing (open squares) yields a significantly lower value of the maximal radiantexposure (H ′
max = 17.0). Statistical analysis of the resulting difference from our17 independent measurements indicates an average underestimation by 7 % with astandard error of ±1 % (Fig. 6, open box).
Admittedly, our “true” values of Hmax bear some uncertainty because of random-ness of the synthetic noise, added to simulate IR camera performance. However, byrepeating the same analysis with 15 different realizations of noise (Fig. 4c), we canestimate the related uncertainty to less than 0.3 % (Fig. 6, gray box).
Since a 7 % difference in the radiant exposure value may have a significant effecton the laser treatment outcome, it seems warranted to determine the correct epider-mal damage threshold value to be used with our, presumably better, experimentalsetup. Establishing a quantitative relationship between the computed Ω and clinicallyobserved injuries is clearly a daunting task. However, we can obtain an estimate ofthe corrected damage threshold level by observing the Ω values, numerically pre-dicted from our near-optimal PPTR measurements (e.g., open squares in Fig. 5), at the“actual” values of Hmax determined from the camera-imitating data (solid circles), asdescribed above.
By performing such analysis for our entire dataset, we obtain a corrected ther-mal damage threshold value of log Ω = −0.41 ± 0.09 (Fig. 7, open box). Whenconsidering only the improved noise characteristics (i.e., by keeping the acquisition
123

Int J Thermophys
Fig. 6 Statistical analysis of theratio between the maximal saferadiant exposure valuespredicted from measurementswith the two PPTR setups (openbox). Variation of Hmax due torandomness of noise realizationis presented for comparison(gray). Diamonds mark themean values, rectangles indicatestandard errors, and bars arestandard deviations
0,85
0,90
0,95
1,00
1,05
H ' m
ax /
Hm
axvariation due to randomness of noise
ratio
Fig. 7 Anticipated shift of thedamage threshold level for ourPPTR system, relative to thereference value (log Ω = −1;dashed line) as determined usingthe IR camera in Ref. [4]:Contribution from improvednoise performance, whilemaintaining the acquisition rateof 1000 s−1 (gray box); and thesame combined with highersignal acquisition rate(20 000 s−1; open)
-1,5
-1,0
-0,5
0,0
0,5
1000
Acquisition rate, s–1
20,000
log(
Ω)
rate at 1000 s−1 for both systems), however, the damage threshold is indicated atlog Ω = −0.84 ± 0.07 (gray), much closer to the value of −1 obtained in the originalstudy.
It may be worth commenting on the difference between the Hmax values discussedin this study and the maximal permissible exposure (MPE) value for skin as defined bythe ANSI and IEC standards (∼0.2 J ·cm−2). The latter indicates the radiant exposurethat is believed to cause no biological effects in skin and is typically determined as onetenth of the value at which the first effect can be observed in any skin constituent. It istherefore evident that in any laser treatment, from therapy of vascular lesions to electivecosmetic procedures such as hair removal or skin rejuvenation, radiant exposures wellabove the corresponding MPE must be applied. Our Hmax values represent the upperboundaries of the therapeutic range, where adverse effects due to nonspecific damageto the epidermis may start appearing in a given person.
4 Conclusions
PPTR temperature profiling allows for objective determination of the maximal saferadiant exposure (Hmax) on an individual patient basis, thus offering improved efficacy
123

Int J Thermophys
and safety of several cutaneous laser procedures. However, our dedicated PPTR setupyields temperature profiles with less artifactual broadening as compared with the IRcamera used in the reference study [6,4]. This results in predictions of higher thermaldamage coefficients (Ω) and consequently lower Hmax values if the same thermaldamage threshold as determined in Ref. [4] is considered. In order to obtain moreaccurate results with our PPTR system, the latter should be increased to log Ω ∼ −0.4.The difference results mostly from the higher acquisition rate, not so much fromsuperior noise characteristics of our system.
Acknowledgment The authors thank Fotona d.d. (Ljubljana, Slovenia) for lending the laser system foruse in this study.
References
1. F.H. Long, R.R. Anderson, T.F. Deutsch, Appl. Phys. Lett. 51, 2076 (1987)2. S.L. Jacques, J.S. Nelson, W.H. Wright, T.E. Milner, Appl. Opt. 32, 2439 (1993)3. T.E. Milner, D.M. Goodman, B.S. Tanenbaum, J.S. Nelson, J. Opt. Soc. Am. A 12, 1479 (1995)4. B. Majaron, L. Vidovic, M. Milanic, W. Jia, J.S. Nelson, Lasers Surg. Med. Supp. 23, 916 (2011)5. B. Majaron, L. Vidovic, M. Milanic, W. Jia, J.S. Nelson, Lasers Surg. Med. (in press)6. W. Verkruysse, W. Jia, W. Franco, T.E. Milner, J.S. Nelson, Lasers Surg. Med. 39, 757 (2007)7. M. Milanic, I. Serša, B. Majaron, Phys. Med. Biol. 54, 2829 (2009)8. M. Milanic, B. Majaron, Proc. SPIE 7371, 773100–1 (2009)9. S.U. Sathyam, A.S. Prahl, J. Biomed. Opt. 2, 251 (1997)
10. B. Majaron, W. Verkruysse, B.S. Tanenbaum, T.E. Milner, J.S. Nelson, Phys. Med. Biol. 47, 1929(2002)
11. M. Milanic, W. Jia, J.S. Nelson, B. Majaron, Lasers Surg. Med. 43, 164 (2011)12. C.D. Gaylor, Ph.D. Thesis, Massachusetts Institute of Technology, Cambridge, MA (1989)
123