Influence of the pH on (open) mixed culture fermentation of glucose: A chemostat study
11
ARTICLE Influence of the pH on (Open) Mixed Culture Fermentation of Glucose: A Chemostat Study Margarida F. Temudo, Robbert Kleerebezem, Mark van Loosdrecht Department of Biotechnology, Delft University of Technology, Julianalaan 67, 2628 BC Delft, The Netherlands; telephone: þ31 15 2781482; fax: þ31 15 2782355; e-mail: [email protected] Received 31 January 2007; accepted 23 February 2007 Published online 9 March 2007 in Wiley InterScience (www.interscience.wiley.com). DOI 10.1002/bit.21412 ABSTRACT: Catabolic products from anaerobic fermenta- tion processes are potentially of industrial interest. The volatile fatty acids and alcohols produced can be used as building blocks in chemical processes or applied directly as substrates in a mixed culture process to produce bioplastics. Development of such applications requires a predictable and controllable product spectrum of the fermentation process. The aim of the research described in this paper was (i) to investigate the product spectrum of an open mixed culture fermentation (MCF) process as a function of the pH, using glucose as substrate, and (ii) to relate the product spectrum obtained to generalized biochemical and thermodynamic considerations. A chemostat was operated under carbon and energy limitation in order to investigate the pH effect on the product spectrum in a MCF process. A transition from CO 2 / H 2 production at lower pH values to formate production at higher pH values was observed. The ratio of CO 2 /H 2 versus formate production was found to be related to the thermo- dynamics of formate dehydrogenation to CO 2 /H 2 . This transition was associated with a shift in the catabolic pro- ducts, from butyrate and acetate to ethanol and acetate, likely due to a decrease in the oxidation state of the electron carriers in the cell. The product spectrum of the MCF process as a function of the pH could largely be explained using general biochemical considerations. Biotechnol. Bioeng. 2007;98: 69–79. ß 2007 Wiley Periodicals, Inc. KEYWORDS: fermentation; pH; products; glucose; mixed microbial population Introduction The anaerobic fermentation is a widely applied process for treatment of wastewater and organic solid waste; generally methane is the end product. An alternative anaerobic process could aim for the production of intermediates in the methanogenic process from complex substrates. This can be established by specific inhibition of methane production using operational measures like lowering the pH or the biomass growth rate. Potentially interesting products that can be produced in this way include organic acids (acetate, butyrate, lactate, succinate), solvents (ethanol, butanol, acetone) and energy carriers like molecular hydrogen. Which mixture of products are formed will depend on the substrate treated, the microbial population present and the operational conditions (Lengeler et al., 1998). An extra advantage of anaerobic processes is its association with a low biomass yield, that is, low sludge production. Open mixed culture biotechnology based on natural inocula with a high microbial diversity allows for operation of bioprocesses under non-sterile conditions with no risk of strain degeneration. As opposed to pure culture processes, mixed cultures furthermore allow for the use of continuous processing, and are capable of dealing with mixtures of substrates of variable composition. All these aspects significantly reduce the costs of mixed culture fermentation (MCF) processes compared to pure culture based industrial fermentations. Glucose fermentation can provide a variety of end products (Fig. 1). Substrates first need to be transported into the cell, phosphorylated and enter the hexose monopho- sphate pool. The latter enters the glycolytic pathway, producing pyruvate, energy (ATP) and reducing equivalents (NADH) (Lengeler et al., 1998). The fate of pyruvate will be controlled by the cellular redox balance and the kinetic properties of the catalytic capacities available. Table I summarizes the possible products from glucose fermenta- tion (Fig. 1) together with ATP and NADH generated during the whole conversions. Fluxes in a metabolic network are controlled by kinetic and/or thermodynamic limitations. Thermodynamic con- trol of a certain branch in the metabolism is more likely to Correspondence to: R. Kleerebezem Contract grant sponsor: Dutch Technology Foundation Contract grant number: DPC5904 ß 2007 Wiley Periodicals, Inc. Biotechnology and Bioengineering, Vol. 98, No. 1, September 1, 2007 69
Transcript of Influence of the pH on (open) mixed culture fermentation of glucose: A chemostat study
ARTICLE
Influence of the pH on (Open) Mixed CultureFermentation of Glucose: A Chemostat Study
Margarida F. Temudo, Robbert Kleerebezem, Mark van Loosdrecht
Department of Biotechnology, Delft University of Technology, Julianalaan 67, 2628 BCDelft,
The Netherlands; telephone: þ31 15 2781482; fax: þ31 15 2782355;
e-mail: [email protected]
Received 31 January 2007; accepted 23 February 2007
Published online 9 March 2007 in Wiley InterScience (www.interscience.wiley.com).
DOI 10.1002/bit.21412ABSTRACT: Catabolic products from anaerobic fermenta-tion processes are potentially of industrial interest. Thevolatile fatty acids and alcohols produced can be used asbuilding blocks in chemical processes or applied directly assubstrates in a mixed culture process to produce bioplastics.Development of such applications requires a predictable andcontrollable product spectrum of the fermentation process.The aim of the research described in this paper was (i) toinvestigate the product spectrum of an open mixed culturefermentation (MCF) process as a function of the pH, usingglucose as substrate, and (ii) to relate the product spectrumobtained to generalized biochemical and thermodynamicconsiderations. A chemostat was operated under carbon andenergy limitation in order to investigate the pH effect on theproduct spectrum in a MCF process. A transition from CO2/H2 production at lower pH values to formate production athigher pH values was observed. The ratio of CO2/H2 versusformate production was found to be related to the thermo-dynamics of formate dehydrogenation to CO2/H2. Thistransition was associated with a shift in the catabolic pro-ducts, from butyrate and acetate to ethanol and acetate,likely due to a decrease in the oxidation state of the electroncarriers in the cell. The product spectrum of the MCFprocess as a function of the pH could largely be explainedusing general biochemical considerations.
Biotechnol. Bioeng. 2007;98: 69–79.
� 2007 Wiley Periodicals, Inc.
KEYWORDS: fermentation; pH; products; glucose; mixedmicrobial population
Introduction
The anaerobic fermentation is a widely applied process fortreatment of wastewater and organic solid waste; generallymethane is the end product. An alternative anaerobicprocess could aim for the production of intermediates in the
Correspondence to: R. Kleerebezem
Contract grant sponsor: Dutch Technology Foundation
Contract grant number: DPC5904
� 2007 Wiley Periodicals, Inc.
methanogenic process from complex substrates. This can beestablished by specific inhibition of methane productionusing operational measures like lowering the pH or thebiomass growth rate. Potentially interesting products thatcan be produced in this way include organic acids (acetate,butyrate, lactate, succinate), solvents (ethanol, butanol,acetone) and energy carriers like molecular hydrogen.Which mixture of products are formed will depend onthe substrate treated, the microbial population present andthe operational conditions (Lengeler et al., 1998). An extraadvantage of anaerobic processes is its association with a lowbiomass yield, that is, low sludge production.
Open mixed culture biotechnology based on naturalinocula with a high microbial diversity allows for operationof bioprocesses under non-sterile conditions with no risk ofstrain degeneration. As opposed to pure culture processes,mixed cultures furthermore allow for the use of continuousprocessing, and are capable of dealing with mixtures ofsubstrates of variable composition. All these aspectssignificantly reduce the costs of mixed culture fermentation(MCF) processes compared to pure culture based industrialfermentations.
Glucose fermentation can provide a variety of endproducts (Fig. 1). Substrates first need to be transported intothe cell, phosphorylated and enter the hexose monopho-sphate pool. The latter enters the glycolytic pathway,producing pyruvate, energy (ATP) and reducing equivalents(NADH) (Lengeler et al., 1998). The fate of pyruvate will becontrolled by the cellular redox balance and the kineticproperties of the catalytic capacities available. Table Isummarizes the possible products from glucose fermenta-tion (Fig. 1) together with ATP and NADH generated duringthe whole conversions.
Fluxes in a metabolic network are controlled by kineticand/or thermodynamic limitations. Thermodynamic con-trol of a certain branch in the metabolism is more likely to
Biotechnology and Bioengineering, Vol. 98, No. 1, September 1, 2007 69
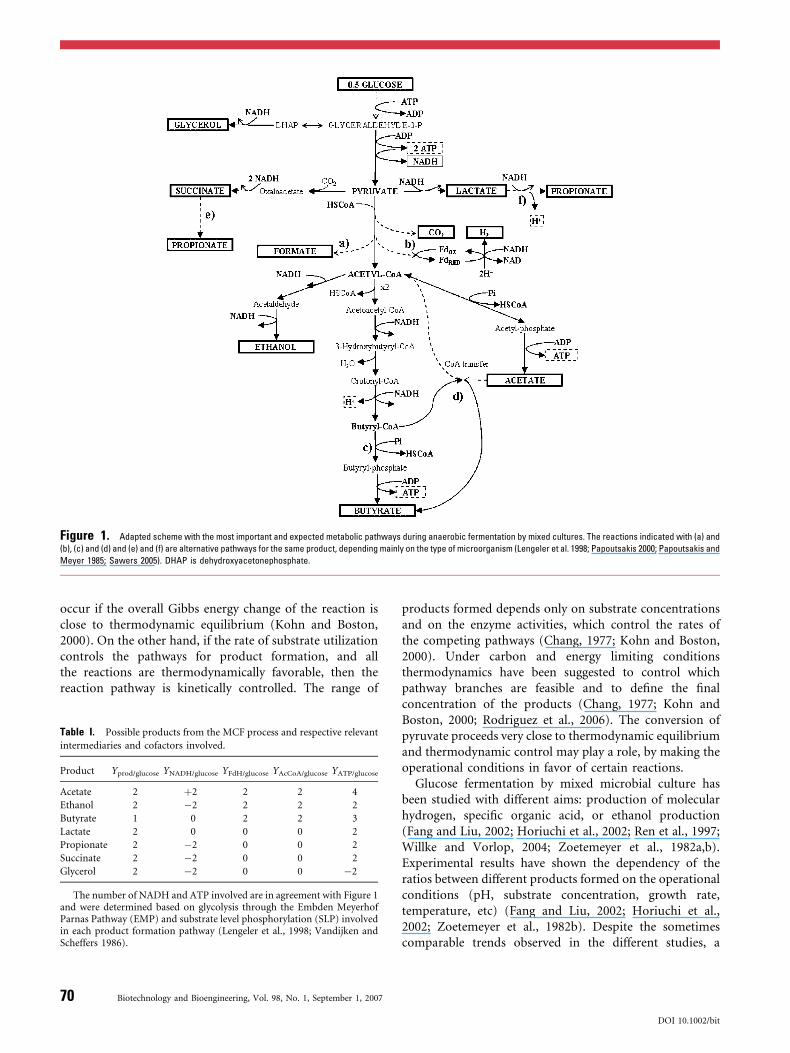
Figure 1. Adapted scheme with the most important and expected metabolic pathways during anaerobic fermentation by mixed cultures. The reactions indicated with (a) and
(b), (c) and (d) and (e) and (f) are alternative pathways for the same product, depending mainly on the type of microorganism (Lengeler et al. 1998; Papoutsakis 2000; Papoutsakis and
Meyer 1985; Sawers 2005). DHAP is dehydroxyacetonephosphate.
occur if the overall Gibbs energy change of the reaction isclose to thermodynamic equilibrium (Kohn and Boston,2000). On the other hand, if the rate of substrate utilizationcontrols the pathways for product formation, and allthe reactions are thermodynamically favorable, then thereaction pathway is kinetically controlled. The range of
Table I. Possible products from the MCF process and respective relevant
intermediaries and cofactors involved.
Product Yprod/glucose YNADH/glucose YFdH/glucose YAcCoA/glucose YATP/glucose
Acetate 2 þ2 2 2 4
Ethanol 2 �2 2 2 2
Butyrate 1 0 2 2 3
Lactate 2 0 0 0 2
Propionate 2 �2 0 0 2
Succinate 2 �2 0 0 2
Glycerol 2 �2 0 0 �2
The number of NADH and ATP involved are in agreement with Figure 1and were determined based on glycolysis through the Embden MeyerhofParnas Pathway (EMP) and substrate level phosphorylation (SLP) involvedin each product formation pathway (Lengeler et al., 1998; Vandijken andScheffers 1986).
70 Biotechnology and Bioengineering, Vol. 98, No. 1, September 1, 2007
products formed depends only on substrate concentrationsand on the enzyme activities, which control the rates ofthe competing pathways (Chang, 1977; Kohn and Boston,2000). Under carbon and energy limiting conditionsthermodynamics have been suggested to control whichpathway branches are feasible and to define the finalconcentration of the products (Chang, 1977; Kohn andBoston, 2000; Rodriguez et al., 2006). The conversion ofpyruvate proceeds very close to thermodynamic equilibriumand thermodynamic control may play a role, by making theoperational conditions in favor of certain reactions.
Glucose fermentation by mixed microbial culture hasbeen studied with different aims: production of molecularhydrogen, specific organic acid, or ethanol production(Fang and Liu, 2002; Horiuchi et al., 2002; Ren et al., 1997;Willke and Vorlop, 2004; Zoetemeyer et al., 1982a,b).Experimental results have shown the dependency of theratios between different products formed on the operationalconditions (pH, substrate concentration, growth rate,temperature, etc) (Fang and Liu, 2002; Horiuchi et al.,2002; Zoetemeyer et al., 1982b). Despite the sometimescomparable trends observed in the different studies, a
DOI 10.1002/bit
relation with the metabolic and thermodynamic state ofthe system has not been established. Furthermore, theoperational conditions are often poorly defined and themeasurements conducted do not allow for straightforwardcomparison of the results reported by different authors. Thisknowledge would allow understanding and predicting thebehavior at different operational conditions.
The aim of this research is to investigate the productspectrum of glucose fermentation as a function of the pH ina MCF process. By determination of all substrates andproducts in the experimental system a thermodynamic andkinetic state analysis can be conducted. If possible, a linkbetween the product spectrum as a function of the pH, andthe thermodynamic and kinetic state of the system will beelaborated based on generalized biochemical principles. Ifwe understand why certain products are prevailing in MCF,we may be able to predict the product spectrum as a functionof the operational conditions independent of the specificpopulation present.
Materials and Methods
Reactor Operation
A continuous stirred reactor of 3 L capacity (2 L workingvolume) was used (mechanical stirring 300 rpm). Water wasrecirculated through a water jacket to maintain thetemperature constant at 30� 18C. The reactor was spargedwith nitrogen gas at a flow rate of 120 mL/min, to maintainanaerobic conditions. The pH was controlled (pH� 0.1) byautomatic titration (ADI 1030 Bio controller) with 4 MNaOH and HCl solutions. The hydraulic retention time(HRT) was 8 h for pH� 5.5 and 20 h for pH� 5.5. Toprevent excessive foaming, 3 mL/h of a 3% solution ofsilicone antifoaming agent (BDH, Poole, England) wascontinuously added.
Inoculum
The anaerobic mixed culture used as inoculum consisted ofa mixture of two sludges obtained from two differentsources. The first inoculum was from a distillery wastewatertreatment plant, Biothane in Delft, The Netherlands. AnUASB operated at 308C, pH 6.8–7.2, COD¼ 2,500 mg/L.The second inoculum was a sludge solution from a potatostarch processing acidification tank in Broek op Langendijk,Smiths Food, The Netherlands. Before each experiment thereactor was freshly inoculated, with approximately 20 g ofeach inoculum, and operated in batch conditions untilbiomass growth was observed.
Medium
The cultivation medium contained the following(in g/L): glucose 4.0; NH4Cl 1.34; KH2PO4 0.78; NaCl
0.292; Na2SO4.10H2O 0.130; MgCl2.6H2O 0.120; FeSO4.7H2O 0.0031; CaCl2 0.0006; H3BO4 0.0001; Na2MoO4.2H2O 0.0001; ZnSO4.7H2O 0.0032; CoCl2.H2O 0.0006;CuCl2.2H2O 0.0022; MnCl2.4H2O 0.0025; Ni.Cl2.6H2
O 0.0005; EDTA 0.050. The glucose and mineral solutionswere prepared and fed separately. The glucose solution wassterilized in an autoclave at 1108C for 20 min.
Steady State Characterization
To characterize the product spectrum at each pH, thereactor was run in continuous mode until a stable productcomposition and a biomass concentration was established.It took always approximately 3 weeks to reach stableoperation, which means more than 25 generation times atlow pH, and more than 60 generation times at pH higherthan 5.5. The gas productivities (H2 and CO2) and the baseadded for pH control are monitored on-line, allowing fordirect analysis of the system stability. When these three ratemeasurements were stable or varied within a limited range(�10%), not tending to increase or decrease, a set of sampleswas taken during the following week. Concentrations ofsoluble organic fermentation products and biomass con-centration in the reactor volume were determined.
Analytical Methods
Reactor broth samples were immediately filtered (Milliporemembrane of 0.45 mm), substrate and end productswere determined and quantified. Glucose, volatile fattyacids (acetate, propionate, butyrate, iso-butyrate, valerate,iso-valerate, and caproate), lactate, succinic acid, formicacid were determined by HPLC, using an Aminex HPX-87Hcolumn (T¼ 608C) from Bio Rad coupled to an UV and a RIdetector, while phosphoric acid 0.01 M was used as eluent.The alcohols analyzed were ethanol, propanol, and butanol.These analyses were performed by gas chromatography,Chromopack 9001, equipped with a flame ionizationdetector (FID) and a fused-silica capillary column15 m� 0.53 mm HP-INNOWAX. The column temperaturewas 808C for alcohols. The temperature of the injector anddetector were 180 and 2008C, respectively. Helium was usedas carrier gas.
Measurements of H2 and CO2 were performed on-line. Agas detection system was coupled to the bioreactor outletand a Rosemount Analytical NGA 2000 MLT 1 Multi-component analyzer (infrared detector). Data acquisition(pH and gas) was made with SCADA software, Sartorius BBIsystems MFCS/win 2.1.
Total dissolved and suspended COD were measured inthe influent and in the reactor liquid with the Dr Lange kitfor the range 1,000–10,000 mgCOD/L. Total organic carbon(TOC) and total inorganic carbon (TIC) were measuredusing a Shimadzu TOC 5050A analyzer. For total TOC andCOD in samples with suspended solids, the samples were
Temudo et al.: Influence of pH on Mixed Culture Fermentation 71
Biotechnology and Bioengineering. DOI 10.1002/bit
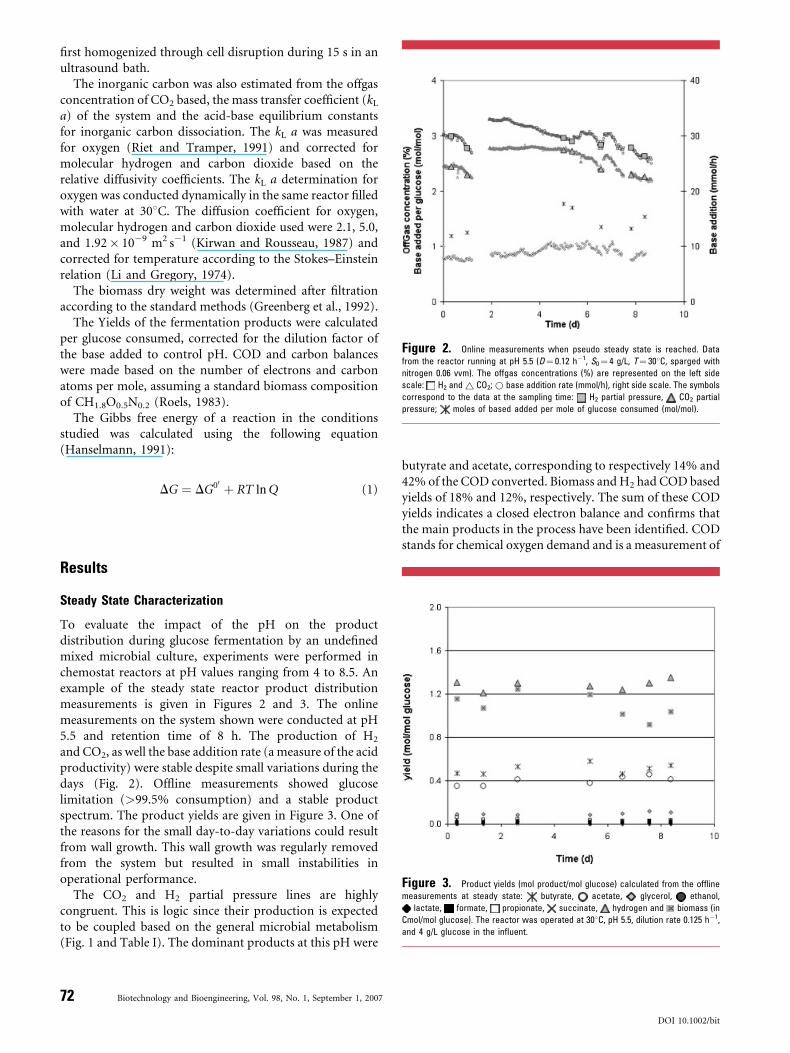
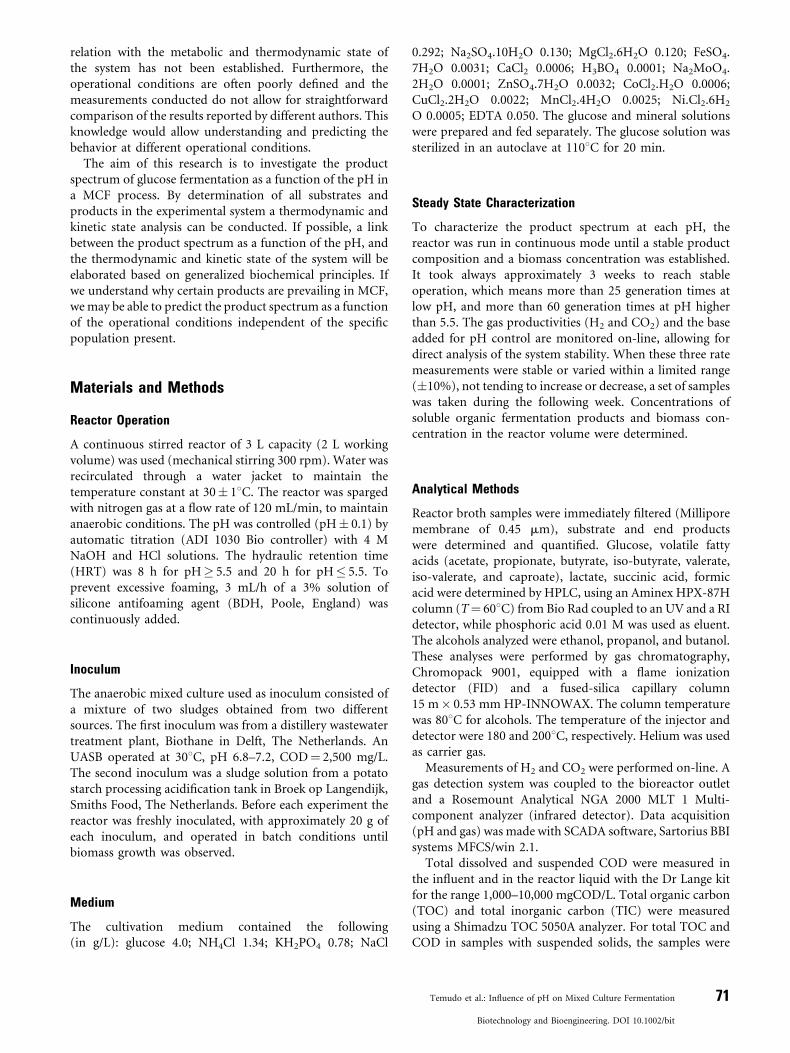
Figure 2. Online measurements when pseudo steady state is reached. Data
from the reactor running at pH 5.5 (D¼ 0.12 h�1, S0¼ 4 g/L, T¼ 308C, sparged with
nitrogen 0.06 vvm). The offgas concentrations (%) are represented on the left side
scale: H2 and~ CO2;* base addition rate (mmol/h), right side scale. The symbols
correspond to the data at the sampling time: H2 partial pressure, CO2 partial
pressure; moles of based added per mole of glucose consumed (mol/mol).
first homogenized through cell disruption during 15 s in anultrasound bath.
The inorganic carbon was also estimated from the offgasconcentration of CO2 based, the mass transfer coefficient (kL
a) of the system and the acid-base equilibrium constantsfor inorganic carbon dissociation. The kL a was measuredfor oxygen (Riet and Tramper, 1991) and corrected formolecular hydrogen and carbon dioxide based on therelative diffusivity coefficients. The kL a determination foroxygen was conducted dynamically in the same reactor filledwith water at 308C. The diffusion coefficient for oxygen,molecular hydrogen and carbon dioxide used were 2.1, 5.0,and 1.92� 10�9 m2 s�1 (Kirwan and Rousseau, 1987) andcorrected for temperature according to the Stokes–Einsteinrelation (Li and Gregory, 1974).
The biomass dry weight was determined after filtrationaccording to the standard methods (Greenberg et al., 1992).
The Yields of the fermentation products were calculatedper glucose consumed, corrected for the dilution factor ofthe base added to control pH. COD and carbon balanceswere made based on the number of electrons and carbonatoms per mole, assuming a standard biomass compositionof CH1.8O0.5N0.2 (Roels, 1983).
The Gibbs free energy of a reaction in the conditionsstudied was calculated using the following equation(Hanselmann, 1991):
DG ¼ DG00 þ RT lnQ (1)
Figure 3. Product yields (mol product/mol glucose) calculated from the offline
measurements at steady state: butyrate, acetate, glycerol, ethanol,
lactate, formate, propionate, succinate, hydrogen and biomass (in
Cmol/mol glucose). The reactor was operated at 308C, pH 5.5, dilution rate 0.125 h�1,
and 4 g/L glucose in the influent.
Results
Steady State Characterization
To evaluate the impact of the pH on the productdistribution during glucose fermentation by an undefinedmixed microbial culture, experiments were performed inchemostat reactors at pH values ranging from 4 to 8.5. Anexample of the steady state reactor product distributionmeasurements is given in Figures 2 and 3. The onlinemeasurements on the system shown were conducted at pH5.5 and retention time of 8 h. The production of H2
and CO2, as well the base addition rate (a measure of the acidproductivity) were stable despite small variations during thedays (Fig. 2). Offline measurements showed glucoselimitation (>99.5% consumption) and a stable productspectrum. The product yields are given in Figure 3. One ofthe reasons for the small day-to-day variations could resultfrom wall growth. This wall growth was regularly removedfrom the system but resulted in small instabilities inoperational performance.
The CO2 and H2 partial pressure lines are highlycongruent. This is logic since their production is expectedto be coupled based on the general microbial metabolism(Fig. 1 and Table I). The dominant products at this pH were
72 Biotechnology and Bioengineering, Vol. 98, No. 1, September 1, 2007
butyrate and acetate, corresponding to respectively 14% and42% of the COD converted. Biomass and H2 had COD basedyields of 18% and 12%, respectively. The sum of these CODyields indicates a closed electron balance and confirms thatthe main products in the process have been identified. CODstands for chemical oxygen demand and is a measurement of
DOI 10.1002/bit
the oxidation state of the chemicals present, proportionalto the number of electrons that can still be transferredto oxygen producing water and oxidizing the carboncompound into inorganic carbon.
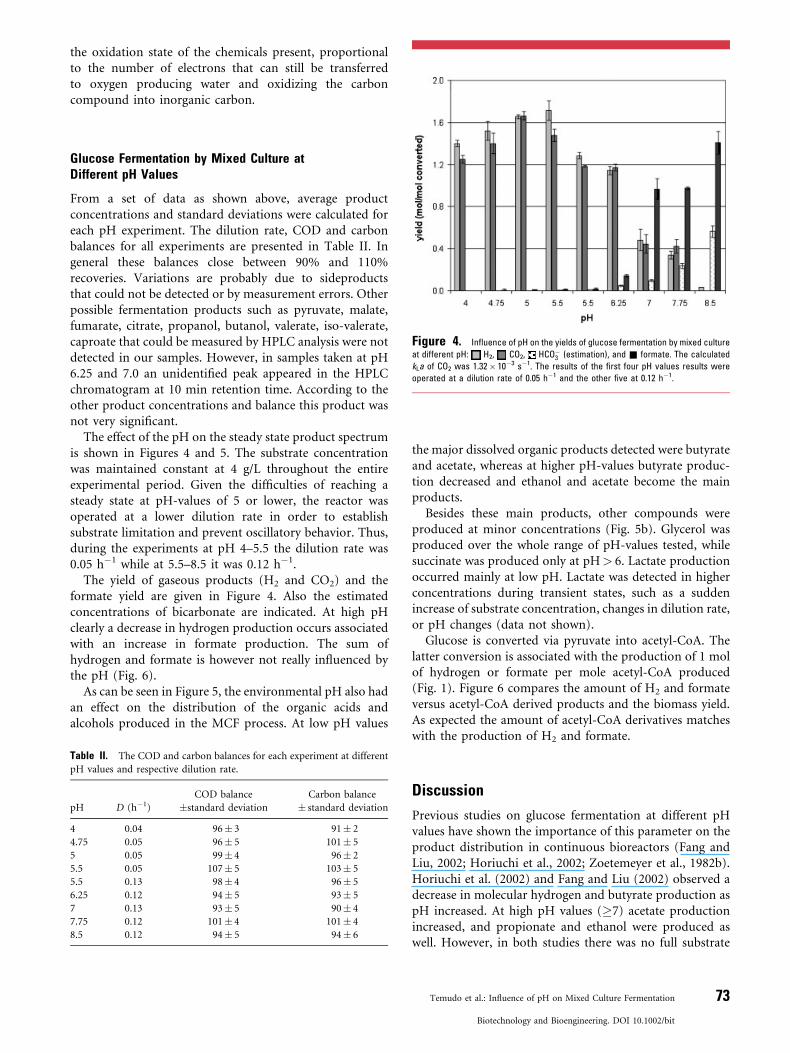
Figure 4. Influence of pH on the yields of glucose fermentation by mixed culture
at different pH: H2, CO2, HCO�3 (estimation), and & formate. The calculated
kLa of CO2 was 1.32� 10�3 s�1. The results of the first four pH values results were
operated at a dilution rate of 0.05 h�1 and the other five at 0.12 h�1.
Glucose Fermentation by Mixed Culture atDifferent pH Values
From a set of data as shown above, average productconcentrations and standard deviations were calculated foreach pH experiment. The dilution rate, COD and carbonbalances for all experiments are presented in Table II. Ingeneral these balances close between 90% and 110%recoveries. Variations are probably due to sideproductsthat could not be detected or by measurement errors. Otherpossible fermentation products such as pyruvate, malate,fumarate, citrate, propanol, butanol, valerate, iso-valerate,caproate that could be measured by HPLC analysis were notdetected in our samples. However, in samples taken at pH6.25 and 7.0 an unidentified peak appeared in the HPLCchromatogram at 10 min retention time. According to theother product concentrations and balance this product wasnot very significant.
The effect of the pH on the steady state product spectrumis shown in Figures 4 and 5. The substrate concentrationwas maintained constant at 4 g/L throughout the entireexperimental period. Given the difficulties of reaching asteady state at pH-values of 5 or lower, the reactor wasoperated at a lower dilution rate in order to establishsubstrate limitation and prevent oscillatory behavior. Thus,during the experiments at pH 4–5.5 the dilution rate was0.05 h�1 while at 5.5–8.5 it was 0.12 h�1.
The yield of gaseous products (H2 and CO2) and theformate yield are given in Figure 4. Also the estimatedconcentrations of bicarbonate are indicated. At high pHclearly a decrease in hydrogen production occurs associatedwith an increase in formate production. The sum ofhydrogen and formate is however not really influenced bythe pH (Fig. 6).
As can be seen in Figure 5, the environmental pH also hadan effect on the distribution of the organic acids andalcohols produced in the MCF process. At low pH values
Table II. The COD and carbon balances for each experiment at different
pH values and respective dilution rate.
pH D (h�1)
COD balance
�standard deviation
Carbon balance
� standard deviation
4 0.04 96� 3 91� 2
4.75 0.05 96� 5 101� 5
5 0.05 99� 4 96� 2
5.5 0.05 107� 5 103� 5
5.5 0.13 98� 4 96� 5
6.25 0.12 94� 5 93� 5
7 0.13 93� 5 90� 4
7.75 0.12 101� 4 101� 4
8.5 0.12 94� 5 94� 6
the major dissolved organic products detected were butyrateand acetate, whereas at higher pH-values butyrate produc-tion decreased and ethanol and acetate become the mainproducts.
Besides these main products, other compounds wereproduced at minor concentrations (Fig. 5b). Glycerol wasproduced over the whole range of pH-values tested, whilesuccinate was produced only at pH> 6. Lactate productionoccurred mainly at low pH. Lactate was detected in higherconcentrations during transient states, such as a suddenincrease of substrate concentration, changes in dilution rate,or pH changes (data not shown).
Glucose is converted via pyruvate into acetyl-CoA. Thelatter conversion is associated with the production of 1 molof hydrogen or formate per mole acetyl-CoA produced(Fig. 1). Figure 6 compares the amount of H2 and formateversus acetyl-CoA derived products and the biomass yield.As expected the amount of acetyl-CoA derivatives matcheswith the production of H2 and formate.
Discussion
Previous studies on glucose fermentation at different pHvalues have shown the importance of this parameter on theproduct distribution in continuous bioreactors (Fang andLiu, 2002; Horiuchi et al., 2002; Zoetemeyer et al., 1982b).Horiuchi et al. (2002) and Fang and Liu (2002) observed adecrease in molecular hydrogen and butyrate production aspH increased. At high pH values (�7) acetate productionincreased, and propionate and ethanol were produced aswell. However, in both studies there was no full substrate
Temudo et al.: Influence of pH on Mixed Culture Fermentation 73
Biotechnology and Bioengineering. DOI 10.1002/bit
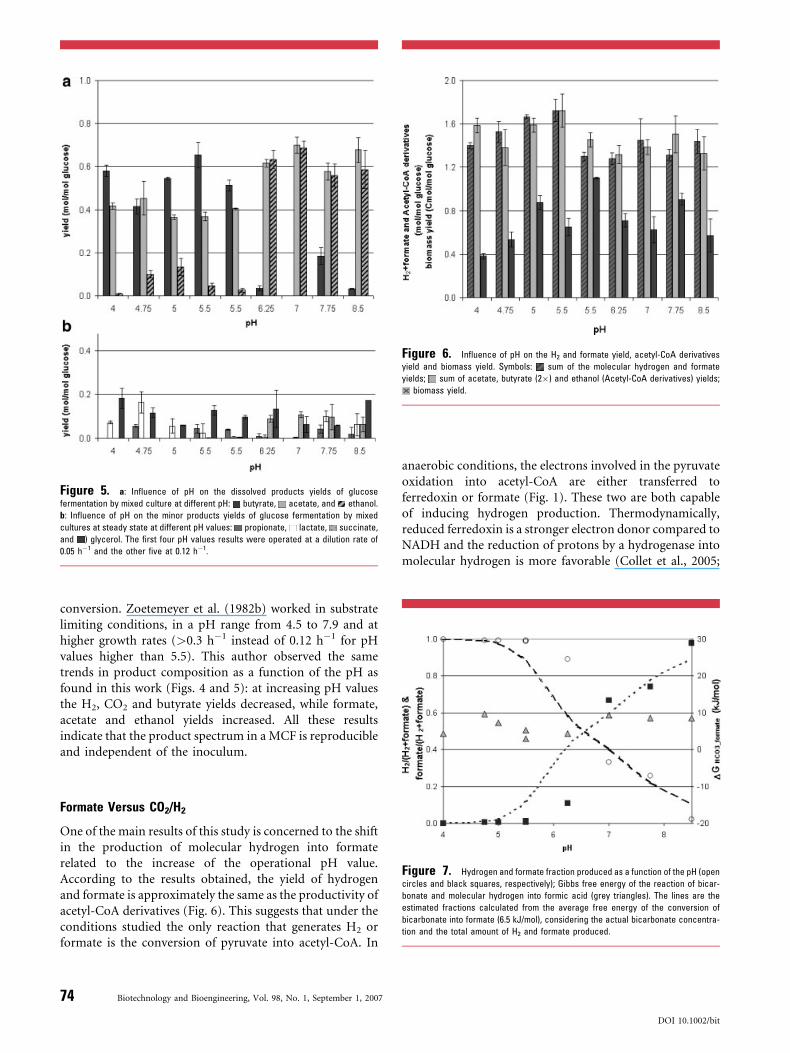
Figure 5. a: Influence of pH on the dissolved products yields of glucose
fermentation by mixed culture at different pH: butyrate, acetate, and ethanol.
b: Influence of pH on the minor products yields of glucose fermentation by mixed
cultures at steady state at different pH values: propionate, lactate, succinate,
and ) glycerol. The first four pH values results were operated at a dilution rate of
0.05 h�1 and the other five at 0.12 h�1.
Figure 6. Influence of pH on the H2 and formate yield, acetyl-CoA derivatives
yield and biomass yield. Symbols: sum of the molecular hydrogen and formate
yields; sum of acetate, butyrate (2�) and ethanol (Acetyl-CoA derivatives) yields;
biomass yield.
conversion. Zoetemeyer et al. (1982b) worked in substratelimiting conditions, in a pH range from 4.5 to 7.9 and athigher growth rates (>0.3 h�1 instead of 0.12 h�1 for pHvalues higher than 5.5). This author observed the sametrends in product composition as a function of the pH asfound in this work (Figs. 4 and 5): at increasing pH valuesthe H2, CO2 and butyrate yields decreased, while formate,acetate and ethanol yields increased. All these resultsindicate that the product spectrum in a MCF is reproducibleand independent of the inoculum.
Figure 7. Hydrogen and formate fraction produced as a function of the pH (open
circles and black squares, respectively); Gibbs free energy of the reaction of bicar-
bonate and molecular hydrogen into formic acid (grey triangles). The lines are the
estimated fractions calculated from the average free energy of the conversion of
bicarbonate into formate (6.5 kJ/mol), considering the actual bicarbonate concentra-
tion and the total amount of H2 and formate produced.
Formate Versus CO2/H2
One of the main results of this study is concerned to the shiftin the production of molecular hydrogen into formaterelated to the increase of the operational pH value.According to the results obtained, the yield of hydrogenand formate is approximately the same as the productivity ofacetyl-CoA derivatives (Fig. 6). This suggests that under theconditions studied the only reaction that generates H2 orformate is the conversion of pyruvate into acetyl-CoA. In
74 Biotechnology and Bioengineering, Vol. 98, No. 1, September 1, 2007
anaerobic conditions, the electrons involved in the pyruvateoxidation into acetyl-CoA are either transferred toferredoxin or formate (Fig. 1). These two are both capableof inducing hydrogen production. Thermodynamically,reduced ferredoxin is a stronger electron donor compared toNADH and the reduction of protons by a hydrogenase intomolecular hydrogen is more favorable (Collet et al., 2005;
DOI 10.1002/bit
Stams, 1994):
NADH þ Hþ ! NADþ þ H2
DG00 ¼ þ18:1 kJ mol�1(2)
2FdðredÞ þ 2Hþ ! 2FdðoxÞ þ H2
DG00 ¼ þ3:1 kJ mol�1(3)
Reduced ferredoxin can also transfer its electrons tobicarbonate, producing formate instead or, in case CO2
and H2 are produced (catalyzed by pyruvate ferredoxinoxidoreductase-PFOR), the CO2 can be further reducedby CO2 reductase into formate, taking the electrons fromreduced ferredoxin as shown above (Jungerma et al., 1970;Scherer and Thauer, 1978).
2FdðredÞ þ HCO�3 ! 2FdðoxÞ þ formate þ Hþ
DG00 ¼ þ1:7 kJ mol�1(4)
H2 þ HCO�3 ! formate þ H2O
DG00 ¼ �1:3 kJ mol�1(5)
Formate can at low pH be cleaved into H2 and CO2 bythe formate hydrogenlyase (Sawers, 2005) or formatedehydrogenase (Ferry, 1990; Liu and Mortenson, 1984;Voolapalli and Stuckey, 2001). Formate can also derive fromthe reaction catalyzed by the enzyme pyruvate formate lyase(PFL) (Thauer et al., 1977):
Pyruvate þ CoA ! Acetyl � CoA þ Formate
DG00 ¼ �13 kJ mol�1(6)
This suggests that molecular hydrogen production isindependent from the cellular NADH generated duringglycolysis, given that it comes exclusively from the pyruvateoxidation into acetyl-CoA.
In equilibrium the ratio [formate]/[H2] depends mainlyon the pH, shifting to formate at increasing pH-values. Thisresult can be clearly seen in Figure 7, which besides thefractions of formate and hydrogen presents also the freeenergy of the reaction HCO�
3 –H2/HCOO�. The calculatedvalues, free energy at each given condition, are always veryclose to zero along the whole range of pH values. Thissupports the assumption that formate and H2 are close toequilibrium. According to the estimated value (dashed lines)the trend is in agreement with the observed results. Howeverfrom the data obtained no conclusive answer can be given tothe question which microorganism or enzyme was present inthe mixed anaerobic culture (whether ferredoxin or formateinduces molecular hydrogen production) because the shift(hydrogen into formate) is the same as pH changes.
Redox Balance
To understand which products can be produced at eachcondition it is important to look at the different possiblemetabolic pathways and at thermodynamic constrains. Forthis purpose a general scheme with the most commonmetabolic pathways for glucose fermentation is shown inFigure 1. According to this scheme glucose is convertedthrough the glycolysis into pyruvate. Besides pyruvate,glycolysis supplies the cell with energy (ATP) and reducingequivalents (NADH). In the absence of an external electronacceptor the organic substrate is used as electron donor andreceptor. This means that part of the substrate will bereduced and part oxidized. The sum of the degree ofreduction of the products formed during catabolism andanabolism has to be equal to that of the substrate.Additionally, NAD/NADH is a cofactor and exists inlimited amounts inside the cell, the NAD reduced intoNADH during glycolysis has to be regenerated, whichinvolves the reoxidation of NADH through reduction oforganic intermediates (Neijssel et al., 1997). All productsthat derive from pyruvate involve NADH generation, butonly some allow its reoxidation namely butyrate, ethanol,succinate, glycerol, lactate and propionate, Figure 1 andTable I (Lengeler et al., 1998). Lactate and butyrateproduction are in this case the redox-neutral conversions(consume the number of NADH produced in the glycolysis,see Fig. 1 and Table I). Whereas during acetate productionnet NADH is formed, as it is derived from pyruvate. TheNADH that is left cannot be reoxidized into H2 unless thehydrogen partial pressure is very low. Thus, this NADHmust be reoxidized by reducing other organic compounds(acetyl-CoA, dihydroxiacetone phosphate, oxaloacetate,etc.), producing more reduced compounds (ethanol,glycerol, succinate, etc.). Glycerol production is one wayof restoring the redox balance under anaerobic conditionswhen acetate is produced, besides succinate and ethanol.Glycerol production did not show pH dependency (Fig. 5b).Succinate, on the other hand, is mainly produced atneutral pH values (>5.5), suggesting its dependency on thebicarbonate concentration since it involves a carboxylationreaction.
This phenomenon is also known in yeast, in Sacchar-omyces cerevisiae, glycerol is a by-product of thefermentation of sugar to ethanol in a redox-neutral process.The role of NADH-consuming glycerol formation is tomaintain the cytosolic redox balance especially underanaerobic conditions, compensating for cellular reactionsthat produce NADH, for example, growth or acetate that isproduced in order to get more ATP, for this the doubleamount of glycerol is generated (Vandijken and Scheffers,1986). Analogously, in Anammox microorganisms thatconvert ammonia and nitrite into molecular nitrogen in aneutral-redox process. This microorganisms need, in orderto grow, to produce also nitrate. The oxidation of nitrite intonitrate will provide the reducing equivalents to reduce thecarbon source (deGraaf et al., 1996).
Temudo et al.: Influence of pH on Mixed Culture Fermentation 75
Biotechnology and Bioengineering. DOI 10.1002/bit
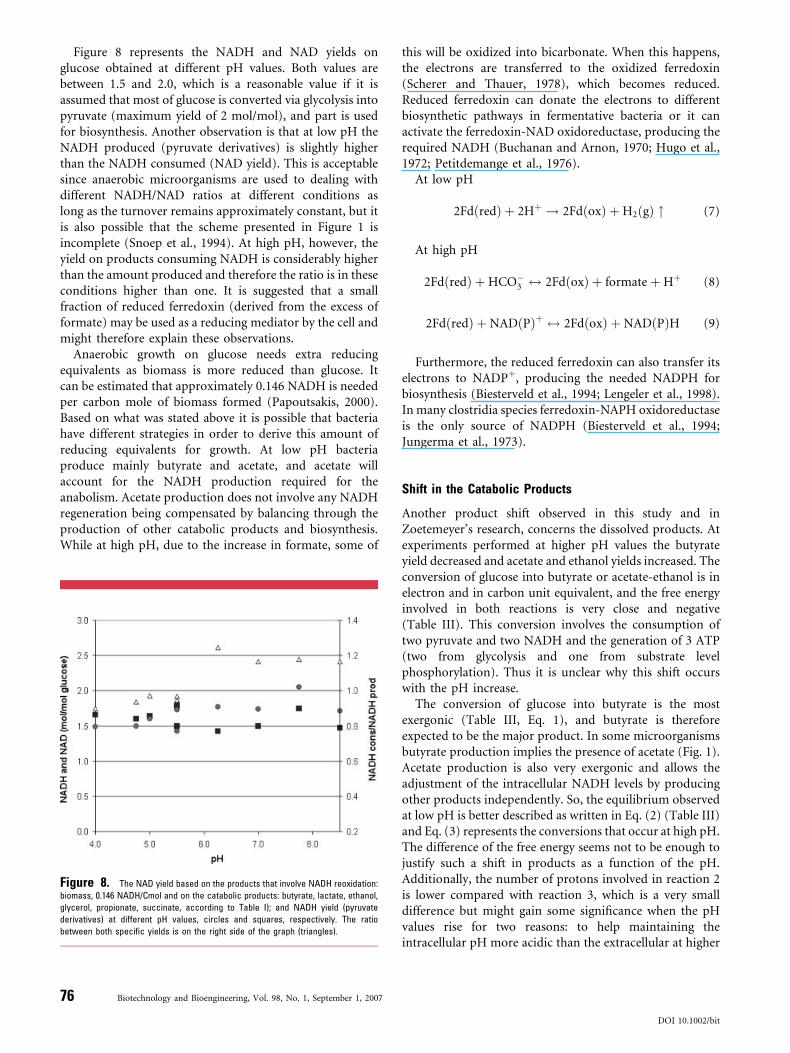
Figure 8 represents the NADH and NAD yields onglucose obtained at different pH values. Both values arebetween 1.5 and 2.0, which is a reasonable value if it isassumed that most of glucose is converted via glycolysis intopyruvate (maximum yield of 2 mol/mol), and part is usedfor biosynthesis. Another observation is that at low pH theNADH produced (pyruvate derivatives) is slightly higherthan the NADH consumed (NAD yield). This is acceptablesince anaerobic microorganisms are used to dealing withdifferent NADH/NAD ratios at different conditions aslong as the turnover remains approximately constant, but itis also possible that the scheme presented in Figure 1 isincomplete (Snoep et al., 1994). At high pH, however, theyield on products consuming NADH is considerably higherthan the amount produced and therefore the ratio is in theseconditions higher than one. It is suggested that a smallfraction of reduced ferredoxin (derived from the excess offormate) may be used as a reducing mediator by the cell andmight therefore explain these observations.
Anaerobic growth on glucose needs extra reducingequivalents as biomass is more reduced than glucose. Itcan be estimated that approximately 0.146 NADH is neededper carbon mole of biomass formed (Papoutsakis, 2000).Based on what was stated above it is possible that bacteriahave different strategies in order to derive this amount ofreducing equivalents for growth. At low pH bacteriaproduce mainly butyrate and acetate, and acetate willaccount for the NADH production required for theanabolism. Acetate production does not involve any NADHregeneration being compensated by balancing through theproduction of other catabolic products and biosynthesis.While at high pH, due to the increase in formate, some of
Figure 8. The NAD yield based on the products that involve NADH reoxidation:
biomass, 0.146 NADH/Cmol and on the catabolic products: butyrate, lactate, ethanol,
glycerol, propionate, succinate, according to Table I); and NADH yield (pyruvate
derivatives) at different pH values, circles and squares, respectively. The ratio
between both specific yields is on the right side of the graph (triangles).
76 Biotechnology and Bioengineering, Vol. 98, No. 1, September 1, 2007
this will be oxidized into bicarbonate. When this happens,the electrons are transferred to the oxidized ferredoxin(Scherer and Thauer, 1978), which becomes reduced.Reduced ferredoxin can donate the electrons to differentbiosynthetic pathways in fermentative bacteria or it canactivate the ferredoxin-NAD oxidoreductase, producing therequired NADH (Buchanan and Arnon, 1970; Hugo et al.,1972; Petitdemange et al., 1976).
At low pH
2FdðredÞ þ 2Hþ ! 2FdðoxÞ þ H2ðgÞ " (7)
At high pH
2FdðredÞ þ HCO�3 $ 2FdðoxÞ þ formate þ Hþ (8)
2FdðredÞ þ NADðPÞþ $ 2FdðoxÞ þ NADðPÞH (9)
Furthermore, the reduced ferredoxin can also transfer itselectrons to NADPþ, producing the needed NADPH forbiosynthesis (Biesterveld et al., 1994; Lengeler et al., 1998).In many clostridia species ferredoxin-NAPH oxidoreductaseis the only source of NADPH (Biesterveld et al., 1994;Jungerma et al., 1973).
Shift in the Catabolic Products
Another product shift observed in this study and inZoetemeyer’s research, concerns the dissolved products. Atexperiments performed at higher pH values the butyrateyield decreased and acetate and ethanol yields increased. Theconversion of glucose into butyrate or acetate-ethanol is inelectron and in carbon unit equivalent, and the free energyinvolved in both reactions is very close and negative(Table III). This conversion involves the consumption oftwo pyruvate and two NADH and the generation of 3 ATP(two from glycolysis and one from substrate levelphosphorylation). Thus it is unclear why this shift occurswith the pH increase.
The conversion of glucose into butyrate is the mostexergonic (Table III, Eq. 1), and butyrate is thereforeexpected to be the major product. In some microorganismsbutyrate production implies the presence of acetate (Fig. 1).Acetate production is also very exergonic and allows theadjustment of the intracellular NADH levels by producingother products independently. So, the equilibrium observedat low pH is better described as written in Eq. (2) (Table III)and Eq. (3) represents the conversions that occur at high pH.The difference of the free energy seems not to be enough tojustify such a shift in products as a function of the pH.Additionally, the number of protons involved in reaction 2is lower compared with reaction 3, which is a very smalldifference but might gain some significance when the pHvalues rise for two reasons: to help maintaining theintracellular pH more acidic than the extracellular at higher
DOI 10.1002/bit
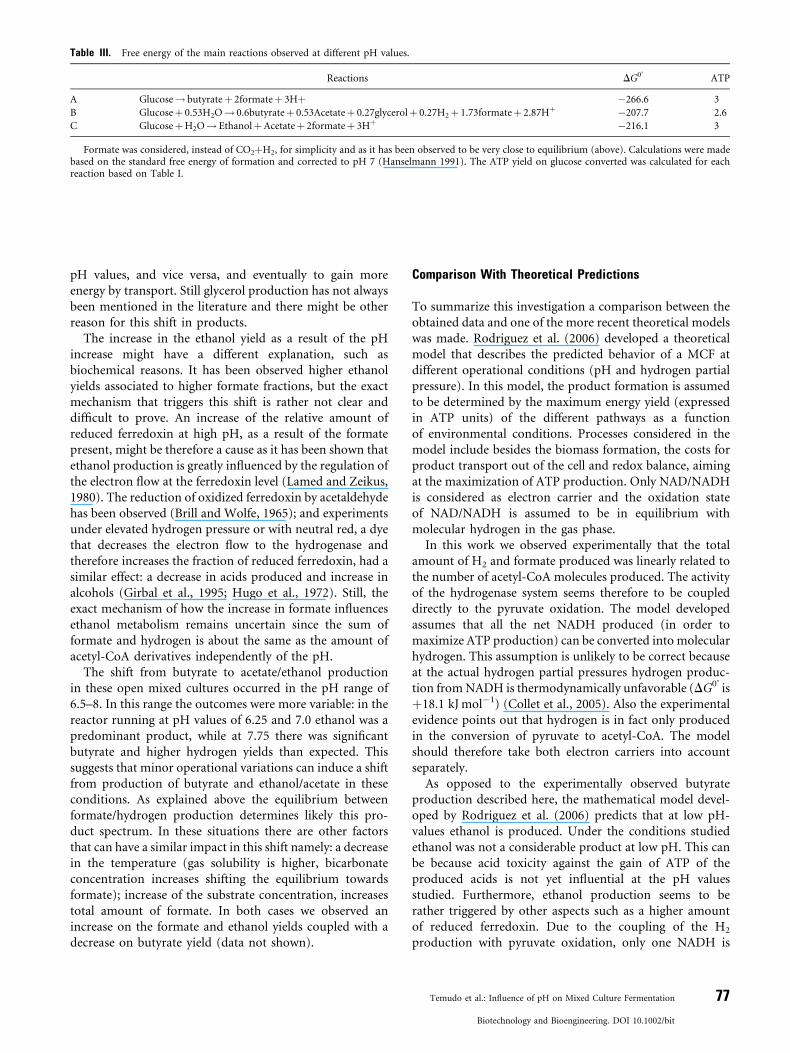
Table III. Free energy of the main reactions observed at different pH values.
Reactions DG0’ ATP
A Glucose! butyrateþ 2formateþ 3Hþ �266.6 3
B Glucoseþ 0.53H2O! 0.6butyrateþ 0.53Acetateþ 0.27glycerolþ 0.27H2þ 1.73formateþ 2.87Hþ �207.7 2.6
C GlucoseþH2O! EthanolþAcetateþ 2formateþ 3Hþ �216.1 3
Formate was considered, instead of CO2þH2, for simplicity and as it has been observed to be very close to equilibrium (above). Calculations were madebased on the standard free energy of formation and corrected to pH 7 (Hanselmann 1991). The ATP yield on glucose converted was calculated for eachreaction based on Table I.
pH values, and vice versa, and eventually to gain moreenergy by transport. Still glycerol production has not alwaysbeen mentioned in the literature and there might be otherreason for this shift in products.
The increase in the ethanol yield as a result of the pHincrease might have a different explanation, such asbiochemical reasons. It has been observed higher ethanolyields associated to higher formate fractions, but the exactmechanism that triggers this shift is rather not clear anddifficult to prove. An increase of the relative amount ofreduced ferredoxin at high pH, as a result of the formatepresent, might be therefore a cause as it has been shown thatethanol production is greatly influenced by the regulation ofthe electron flow at the ferredoxin level (Lamed and Zeikus,1980). The reduction of oxidized ferredoxin by acetaldehydehas been observed (Brill and Wolfe, 1965); and experimentsunder elevated hydrogen pressure or with neutral red, a dyethat decreases the electron flow to the hydrogenase andtherefore increases the fraction of reduced ferredoxin, had asimilar effect: a decrease in acids produced and increase inalcohols (Girbal et al., 1995; Hugo et al., 1972). Still, theexact mechanism of how the increase in formate influencesethanol metabolism remains uncertain since the sum offormate and hydrogen is about the same as the amount ofacetyl-CoA derivatives independently of the pH.
The shift from butyrate to acetate/ethanol productionin these open mixed cultures occurred in the pH range of6.5–8. In this range the outcomes were more variable: in thereactor running at pH values of 6.25 and 7.0 ethanol was apredominant product, while at 7.75 there was significantbutyrate and higher hydrogen yields than expected. Thissuggests that minor operational variations can induce a shiftfrom production of butyrate and ethanol/acetate in theseconditions. As explained above the equilibrium betweenformate/hydrogen production determines likely this pro-duct spectrum. In these situations there are other factorsthat can have a similar impact in this shift namely: a decreasein the temperature (gas solubility is higher, bicarbonateconcentration increases shifting the equilibrium towardsformate); increase of the substrate concentration, increasestotal amount of formate. In both cases we observed anincrease on the formate and ethanol yields coupled with adecrease on butyrate yield (data not shown).
Comparison With Theoretical Predictions
To summarize this investigation a comparison between theobtained data and one of the more recent theoretical modelswas made. Rodriguez et al. (2006) developed a theoreticalmodel that describes the predicted behavior of a MCF atdifferent operational conditions (pH and hydrogen partialpressure). In this model, the product formation is assumedto be determined by the maximum energy yield (expressedin ATP units) of the different pathways as a functionof environmental conditions. Processes considered in themodel include besides the biomass formation, the costs forproduct transport out of the cell and redox balance, aimingat the maximization of ATP production. Only NAD/NADHis considered as electron carrier and the oxidation stateof NAD/NADH is assumed to be in equilibrium withmolecular hydrogen in the gas phase.
In this work we observed experimentally that the totalamount of H2 and formate produced was linearly related tothe number of acetyl-CoA molecules produced. The activityof the hydrogenase system seems therefore to be coupleddirectly to the pyruvate oxidation. The model developedassumes that all the net NADH produced (in order tomaximize ATP production) can be converted into molecularhydrogen. This assumption is unlikely to be correct becauseat the actual hydrogen partial pressures hydrogen produc-tion from NADH is thermodynamically unfavorable (DG0’ isþ18.1 kJ mol�1) (Collet et al., 2005). Also the experimentalevidence points out that hydrogen is in fact only producedin the conversion of pyruvate to acetyl-CoA. The modelshould therefore take both electron carriers into accountseparately.
As opposed to the experimentally observed butyrateproduction described here, the mathematical model devel-oped by Rodriguez et al. (2006) predicts that at low pH-values ethanol is produced. Under the conditions studiedethanol was not a considerable product at low pH. This canbe because acid toxicity against the gain of ATP of theproduced acids is not yet influential at the pH valuesstudied. Furthermore, ethanol production seems to berather triggered by other aspects such as a higher amountof reduced ferredoxin. Due to the coupling of the H2
production with pyruvate oxidation, only one NADH is
Temudo et al.: Influence of pH on Mixed Culture Fermentation 77
Biotechnology and Bioengineering. DOI 10.1002/bit
supplied for ethanol to be produced. Consequently, ethanolproduction should be accompanied by acetate production tofulfil the NADH balance.
Implementation in the model of two different electroncarriers will therefore also solve this discrepancy between themodel and the experimental observations as mentionedabove. Another possibility is to directly couple H2/formateto pyruvate oxidation.
Conclusion
It is predictable from thermodynamic and general metabolicreasoning that, independent of the inoculum, a reactor fedwith glucose running under substrate limitation will shift itsproduct distribution from butyrate, acetate and molecularhydrogen at low pH (4–6.5) into acetate, ethanol andformate at high pH (6.5–8.5). The shift in productformation seems to be directly related to the pH-dependentchange thermodynamics of the Formate/H2–HCO�
3 reac-tion. However, it remains unclear which the main cause ofthe product shift between butyrate and ethanol is, since bothconversions are in electron and carbon terms equivalent;two hypothesis have been suggested.
This work was funded by the Dutch Technology Foundation (STW),
project no. DPC5904. The authors also want to thank to Jasper Meijer
and Nienke Stein for carrying out some of the experiments reported in
this article.
References
Biesterveld S, Kok MD, Dijkema C, Zehnder AJB, Stams AJM. 1994. D-
xylose catabolism in bacteroides xylanolyticus X5-1. Arch Microbiol
161(6):521–527.
Brill WJ, Wolfe RS. 1965. Ferredoxin reduction by acetaldehyde. Fed Proc
24(2P1):233–236.
Buchanan BB, Arnon DI. 1970. Ferredoxins-chemistry and function in
photosynthesis, nitrogen fixation, and fermentative metabolism. Adv
Enzymol Relat Subj Biochem 33:119–176.
Chang R. 1977. Physical chemistry with applications to biological systems.
New York: Mcmillan Publishing Co., Inc.
Collet C, Gaudard O, Peringer P, Schwitzguebel JP. 2005. Acetate produc-
tion from lactose by Clostridium thermolacticum and hydrogen-
scavenging microorganisms in continuous culture—Effect of hydrogen
partial pressure. J Biotechnol 118(3):328–338.
deGraaf AAV, deBruijn P, Robertson LA, Jetten MSM, Kuenen JG. 1996.
Autotrophic growth of anaerobic ammonium-oxidizing micro-organ-
isms in a fluidized bed reactor. Microbiology—UK 142:2187–2196.
Fang HHP, Liu H. 2002. Effect of pH on hydrogen production from glucose
by a mixed culture. Bioresource Technol 82(1):87–93.
Ferry JG. 1990. Formate dehydrogenase. FEMS Microbiol Rev 87(3–4):377–
382.
Girbal L, Vasconcelos I, Saintamans S, Soucaille P. 1995. How neutral red
modified carbon and electron flow in clostridium-acetobutylicum
grown in chemostat culture at neutral Ph. FEMS Microbiol Rev
16(2–3):151–162.
Greenberg AE, Eaton AD, Clesceri LS. 1992. Standard methods for
the examination of water and wastewater. 18th edition. London:
Chapman-Hall.
Hanselmann KW. 1991. Microbial energetics applied to waste repositories.
Experientia 47(7):645–687.
78 Biotechnology and Bioengineering, Vol. 98, No. 1, September 1, 2007
Horiuchi JI, Shimizu T, Tada K, Kanno T, Kobayashi M. 2002. Selective
production of organic acids in anaerobic acid reactor by pH control.
Bioresource Technol 82(3):209–213.
Hugo HV, Schobert S, Gottscha G, Madan VK. 1972. Coenzyme specificity
of dehydrogenases and fermentation of pyruvate by clostridia. Arch
Mikrobiol 87(3):189–202.
Jungerma K, Kirchnia H, Thauer RK. 1970. Ferredoxin dependent Co2
reduction to formate in clostridium pasteurianum. Biochem Biophys
Res Commun 41(3):682–689.
Jungerma K, Thauer RK, Leimenst G, Decker K. 1973. Function of reduced
pyridine nucleotide-ferredoxin oxidoreductases in saccharolytic clos-
tridia. Biochim Biophys Acta 305(2):268–280.
Kirwan DJ, Rousseau RW. 1987. Mass transfer principles, handbook of
separation process technologyQ11. John Wiley & Sons.
Kohn R, Boston R. 2000. The role of thermodynamics in controlling rumen
metabolism. In: McNamara JP, France J, Beever D, editors. Modelling
nutrient utilization in farm animals. Oxford, RU: CAB International.
p 11–21.
Lamed R, Zeikus JG. 1980. Ethanol-production by thermophilic bacteria—
Relationship between fermentation product yields of and catabolic
enzyme-activities in clostridium-thermocellum and thermoanaero-
bium-brockii. J Bacteriol 144(2):569–578.
Lengeler JW, Drews G, Schlegel HG. 1998. Biology of prokaryotes. Oxford:
Blackwell Science. p 955.
Li YH, Gregory S. 1974. Diffusion of ions in sea-water and in deep-sea
sediments. Geochimica Et Cosmochimica Acta 38(5):703–714.
Liu CL, Mortenson LE. 1984. Formate dehydrogenase of clostridium-
pasteurianum. J Bacteriol 159(1):375–380.
Neijssel OM, Snoep JL, deMattos WJT. 1997. Regulation of energy
source metabolism in streptococci. J Appl Microbiol 83:S12–
S19.
Papoutsakis ET, Meyer CL. 1985. Fermentation equations for propionic-
acid bacteria and production of assorted oxychemicals from various
sugars. Biotechnol Bioeng 27(1):67–80.
Papoutsakis ET. 2000. Equations and calculations for fermentations of
butyric acid bacteria. (Reprinted from Biotechnology and Bioengineer-
ing, vol 26, pg 174-187, 1984). Biotechnol Bioeng 67(6):813–
826.
Petitdemange H, Cherrier C, Raval G, Gay R. 1976. Regulation of NADH
and NADPH-ferredoxin oxidoreductases in clostridia of butyric group.
Biochim Biophys Acta 421(2):334–347.
Ren N, Wang B, Huang JC. 1997. Ethanol-type fermentation from carbo-
hydrate in high rate acidogenic reactor. Biotechnol Bioeng 54:428–
433.
Riet K, Tramper J. 1991. Basic bioreactor design. New York: Marcel Dekker,
Inc.
Rodriguez J, Kleerebezem R, Lema JM, van Loosdrecht MCM. 2006.
Modeling product formation in anaerobic mixed culture fermenta-
tions. Biotechnol Bioeng 93(3):592–606.
Roels JA. 1983. Energetics and kinetics in biotechnology. Amsterdam:
Elsevier.
Sawers RG. 2005. Formate and its role in hydrogen production in Escher-
ichia coli. Biochem Soc Trans 33:42–46.
Scherer PA, Thauer RK. 1978. Purification and properties of
reduced ferredoxin-Co2 oxidoreductase from clostridium-pasteuria-
num, a molybdenum iron-sulfur-protein. Eur J Biochem 85(1):125–
135.
Snoep JL, Degraef MR, Demattos MJT, Neijssel OM. 1994. Effect of culture
conditions on the NADH/NAD ratio and total amounts of NAD(H) in
chemostat cultures of enterococcus-faecalis NCTC-775. FEMS Micro-
biol Lett 116(3):263–267.
Stams AJM. 1994. Metabolic interactions between anaerobic-bacteria in
methanogenic environments. Antonie Van Leeuwenhoek Int J Gen Mol
Microbiol 66(1–3):271–294.
Thauer RK, Jungermann K, Decker K. 1977. Energy conservation in
Chemotrophic anaerobic bacteria. Bacteriol Rev 41:100–180.
Vandijken JP, Scheffers WA. 1986. Redox balances in the metabolism of
sugars by yeasts. FEMS Microbiol Rev 32(3–4):199–224.
DOI 10.1002/bit

Voolapalli RK, Stuckey DC. 2001. Hydrogen production in anaerobic
reactors during shock loads- influence of formate production and
H2 kinetics. Water Res 35(7):1831–1841.
Willke T, Vorlop KD. 2004. Industrial bioconversion of renewable resources
as an alternative to conventional chemistry. Appl Microbiol Biotechnol
66(2):131–142.
Zoetemeyer RJ, Matthijsen A, Cohen A, Boelhouwer C. 1982a. Product
inhibition in the acid forming stage of the anaerobic-digestion process.
Water Res 16(5):633–639.
Zoetemeyer RJ, Vandenheuvel JC, Cohen A. 1982b. pH Influence on
acidogenic dissimilation of glucose in an anaerobic digester. Water
Res 16(3):303–311.
Temudo et al.: Influence of pH on Mixed Culture Fermentation 79
Biotechnology and Bioengineering. DOI 10.1002/bit