Influence of stress relaxation on clamp-up force in hybrid composite-to-metal bolted joints
10
This article appeared in a journal published by Elsevier. The attached copy is furnished to the author for internal non-commercial research and education use, including for instruction at the authors institution and sharing with colleagues. Other uses, including reproduction and distribution, or selling or licensing copies, or posting to personal, institutional or third party websites are prohibited. In most cases authors are permitted to post their version of the article (e.g. in Word or Tex form) to their personal website or institutional repository. Authors requiring further information regarding Elsevier’s archiving and manuscript policies are encouraged to visit: http://www.elsevier.com/copyright
-
Upload
independent -
Category
Documents
-
view
0 -
download
0
Transcript of Influence of stress relaxation on clamp-up force in hybrid composite-to-metal bolted joints

This article appeared in a journal published by Elsevier. The attachedcopy is furnished to the author for internal non-commercial researchand education use, including for instruction at the authors institution
and sharing with colleagues.
Other uses, including reproduction and distribution, or selling orlicensing copies, or posting to personal, institutional or third party
websites are prohibited.
In most cases authors are permitted to post their version of thearticle (e.g. in Word or Tex form) to their personal website orinstitutional repository. Authors requiring further information
regarding Elsevier’s archiving and manuscript policies areencouraged to visit:
http://www.elsevier.com/copyright
Author's personal copy
Influence of stress relaxation on clamp-up force in hybridcomposite-to-metal bolted joints
Vincent Caccese a,*, Keith A. Berube a, Mauricio Fernandez a, J. Daniel Melo b, Jean Paul Kabche a
a University of Maine, Department of Mechanical Engineering, 5711 Boardman Hall, Orono, ME 04469, USAb Universidade Federal do Rio Grande do Norte, Department of Materials Engineering, Natal, RN 59072-970, Brazil
a r t i c l e i n f o
Article history:Available online 12 August 2008
Keywords:A. Hybrid connectionsB. Stress relaxationD. Viscoelastic creepE. Bolted joints/joining
a b s t r a c t
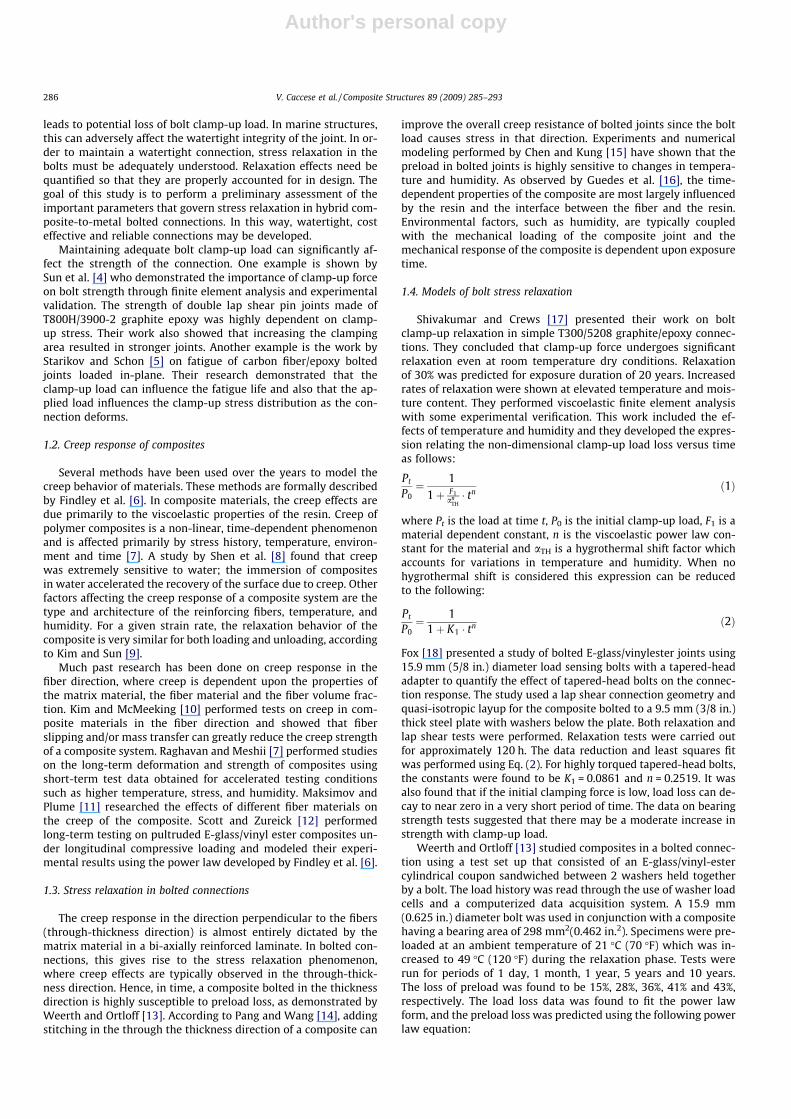
This paper presents an experimental investigation of the influence of stress relaxation on clamp-up loadin hybrid composite-to-metal bolted connections. Loss of bolt clamp-up load may influence the strengthand fatigue life of the connection. This study focuses on the effects of bolt retightening, use of tapered-head bolts versus protruding-head bolts, and briefly addresses environmental effects including temper-ature. All tests were conducted for a time period of at least three months in order to estimate primary andsecondary stress relaxation effects. Bolt clamp-up load curves were fit to three different but similar equa-tions for stress relaxation using a least squares method. The bolt retightening tests show that some of thepreload in the connections can be maintained with periodic retightening of the bolts. Little difference inrelaxation was observed when comparing tapered-head bolts with protruding-head bolts, given thatroughly equal stress relaxation rates were observed. In a limited amount of testing, it was observed thattemperature shifts caused more rapid stress relaxation rates and that post cure of the composite is essen-tial to achieve a stable thermal response.
� 2008 Elsevier Ltd. All rights reserved.
1. Introduction
The present experimental study of stress relaxation in hybridcomposite/metal bolted connections is part of an ongoing effortto investigate the response of hybrid composite/metal connectionsused in US Navy vessels. Bolted connections are used in structureswhere the ability to easily remove structural components is re-quired. Concern over the effect of stress relaxation due to the vis-coelastic nature of the composite material was the impetus for thisstudy. Stress relaxation due to creep in the through-the-thicknessdirection of the composite material typically occurs in bolted com-posite connections. Accordingly, a composite panel bolted in thethickness direction is susceptible to loss of clamp-up load, due tothe viscoelastic nature of the resin, which dominates thethrough-the-thickness direction response. Loss of clamp-up loadmay have a deleterious effect on the strength and the fatigue lifeof the connection.
The US Navy currently has interest in developing hull-formsusing advanced materials such as composites and corrosion resis-tant metals in order to enhance its future naval capabilities. Meet-ing stiffness requirements in some applications may be difficultwith E-glass/vinyl ester (EG/VE) composites due to their low mate-rial stiffness when compared to a metal such as steel. Hybrid
construction has merged the use of metals and composites as away of implementing EG/VE systems into the bulk of the structure,while maintaining adequate stiffness. Barsoum [1] describes thedevelopment of hybrid hulls where non-magnetic stainless steelis used in combination with EG/VE composites to create advancedhull-forms with low electromagnetic signatures. He stated that EG/VE composites alone lack the stiffness and in-plane strength re-quired for the larger ship hull structures. Alm [2] estimated thata 50-m composite naval ship would be 2.4 times less stiff thanits steel counterpart indicating the potential benefit of hybrid sys-tems. Kabche et al. [3] described a hybrid system where compositepanels are attached to a metallic sub-structure; which provided theimpetus for this research effort.
1.1. Use of bolted hybrid connections
Oftentimes it is feasible to attach dissimilar materials usingbonded connections to reduce the effects of stress concentrations.In some instances, however the use of bolted hybrid connections isnecessary, especially in cases where removable panels are re-quired. The hybrid joint presents a greater challenge than thatfound in joining similar materials, mainly due to the differencesin the constituent material properties. While bolted connectionsoffer easily removable parts, the bolt clamp-up load may be com-promised by bolt stress relaxation. Composites tend to creep overtime due to the viscoelastic nature of the matrix material, which
0263-8223/$ - see front matter � 2008 Elsevier Ltd. All rights reserved.doi:10.1016/j.compstruct.2008.07.031
* Corresponding author. Tel.: +1 207 581 2131; fax: +1 207 581 2379.E-mail address: [email protected] (V. Caccese).
Composite Structures 89 (2009) 285–293
Contents lists available at ScienceDirect
Composite Structures
journal homepage: www.elsevier .com/locate /compstruct
Author's personal copy
leads to potential loss of bolt clamp-up load. In marine structures,this can adversely affect the watertight integrity of the joint. In or-der to maintain a watertight connection, stress relaxation in thebolts must be adequately understood. Relaxation effects need bequantified so that they are properly accounted for in design. Thegoal of this study is to perform a preliminary assessment of theimportant parameters that govern stress relaxation in hybrid com-posite-to-metal bolted connections. In this way, watertight, costeffective and reliable connections may be developed.
Maintaining adequate bolt clamp-up load can significantly af-fect the strength of the connection. One example is shown bySun et al. [4] who demonstrated the importance of clamp-up forceon bolt strength through finite element analysis and experimentalvalidation. The strength of double lap shear pin joints made ofT800H/3900-2 graphite epoxy was highly dependent on clamp-up stress. Their work also showed that increasing the clampingarea resulted in stronger joints. Another example is the work byStarikov and Schon [5] on fatigue of carbon fiber/epoxy boltedjoints loaded in-plane. Their research demonstrated that theclamp-up load can influence the fatigue life and also that the ap-plied load influences the clamp-up stress distribution as the con-nection deforms.
1.2. Creep response of composites
Several methods have been used over the years to model thecreep behavior of materials. These methods are formally describedby Findley et al. [6]. In composite materials, the creep effects aredue primarily to the viscoelastic properties of the resin. Creep ofpolymer composites is a non-linear, time-dependent phenomenonand is affected primarily by stress history, temperature, environ-ment and time [7]. A study by Shen et al. [8] found that creepwas extremely sensitive to water; the immersion of compositesin water accelerated the recovery of the surface due to creep. Otherfactors affecting the creep response of a composite system are thetype and architecture of the reinforcing fibers, temperature, andhumidity. For a given strain rate, the relaxation behavior of thecomposite is very similar for both loading and unloading, accordingto Kim and Sun [9].
Much past research has been done on creep response in thefiber direction, where creep is dependent upon the properties ofthe matrix material, the fiber material and the fiber volume frac-tion. Kim and McMeeking [10] performed tests on creep in com-posite materials in the fiber direction and showed that fiberslipping and/or mass transfer can greatly reduce the creep strengthof a composite system. Raghavan and Meshii [7] performed studieson the long-term deformation and strength of composites usingshort-term test data obtained for accelerated testing conditionssuch as higher temperature, stress, and humidity. Maksimov andPlume [11] researched the effects of different fiber materials onthe creep of the composite. Scott and Zureick [12] performedlong-term testing on pultruded E-glass/vinyl ester composites un-der longitudinal compressive loading and modeled their experi-mental results using the power law developed by Findley et al. [6].
1.3. Stress relaxation in bolted connections
The creep response in the direction perpendicular to the fibers(through-thickness direction) is almost entirely dictated by thematrix material in a bi-axially reinforced laminate. In bolted con-nections, this gives rise to the stress relaxation phenomenon,where creep effects are typically observed in the through-thick-ness direction. Hence, in time, a composite bolted in the thicknessdirection is highly susceptible to preload loss, as demonstrated byWeerth and Ortloff [13]. According to Pang and Wang [14], addingstitching in the through the thickness direction of a composite can
improve the overall creep resistance of bolted joints since the boltload causes stress in that direction. Experiments and numericalmodeling performed by Chen and Kung [15] have shown that thepreload in bolted joints is highly sensitive to changes in tempera-ture and humidity. As observed by Guedes et al. [16], the time-dependent properties of the composite are most largely influencedby the resin and the interface between the fiber and the resin.Environmental factors, such as humidity, are typically coupledwith the mechanical loading of the composite joint and themechanical response of the composite is dependent upon exposuretime.
1.4. Models of bolt stress relaxation
Shivakumar and Crews [17] presented their work on boltclamp-up relaxation in simple T300/5208 graphite/epoxy connec-tions. They concluded that clamp-up force undergoes significantrelaxation even at room temperature dry conditions. Relaxationof 30% was predicted for exposure duration of 20 years. Increasedrates of relaxation were shown at elevated temperature and mois-ture content. They performed viscoelastic finite element analysiswith some experimental verification. This work included the ef-fects of temperature and humidity and they developed the expres-sion relating the non-dimensional clamp-up load loss versus timeas follows:
Pt
P0¼ 1
1þ F1an
TH� tn
ð1Þ
where Pt is the load at time t, P0 is the initial clamp-up load, F1 is amaterial dependent constant, n is the viscoelastic power law con-stant for the material and aTH is a hygrothermal shift factor whichaccounts for variations in temperature and humidity. When nohygrothermal shift is considered this expression can be reducedto the following:
Pt
P0¼ 1
1þ K1 � tn ð2Þ
Fox [18] presented a study of bolted E-glass/vinylester joints using15.9 mm (5/8 in.) diameter load sensing bolts with a tapered-headadapter to quantify the effect of tapered-head bolts on the connec-tion response. The study used a lap shear connection geometry andquasi-isotropic layup for the composite bolted to a 9.5 mm (3/8 in.)thick steel plate with washers below the plate. Both relaxation andlap shear tests were performed. Relaxation tests were carried outfor approximately 120 h. The data reduction and least squares fitwas performed using Eq. (2). For highly torqued tapered-head bolts,the constants were found to be K1 = 0.0861 and n = 0.2519. It wasalso found that if the initial clamping force is low, load loss can de-cay to near zero in a very short period of time. The data on bearingstrength tests suggested that there may be a moderate increase instrength with clamp-up load.
Weerth and Ortloff [13] studied composites in a bolted connec-tion using a test set up that consisted of an E-glass/vinyl-estercylindrical coupon sandwiched between 2 washers held togetherby a bolt. The load history was read through the use of washer loadcells and a computerized data acquisition system. A 15.9 mm(0.625 in.) diameter bolt was used in conjunction with a compositehaving a bearing area of 298 mm2(0.462 in.2). Specimens were pre-loaded at an ambient temperature of 21 �C (70 �F) which was in-creased to 49 �C (120 �F) during the relaxation phase. Tests wererun for periods of 1 day, 1 month, 1 year, 5 years and 10 years.The loss of preload was found to be 15%, 28%, 36%, 41% and 43%,respectively. The load loss data was found to fit the power lawform, and the preload loss was predicted using the following powerlaw equation:
286 V. Caccese et al. / Composite Structures 89 (2009) 285–293
Author's personal copy
Pt ¼ P0 � tð1:482�10�11 �P2:2440 �0:0497Þ ð3Þ
where Pt is the load in pounds in the connection at any time, t, andP0 is the initial preload. The constants in the exponent of thisexpression were computed by curve fit in US customary units tothe data collected from six test samples tested using a preload rang-ing from 56 kN (12,621 lbs) to 1.4 kN (314 lbs) resulting in an aver-age composite material stress range of 188–4.7 MPa.
A simple power law expression can be used be to account for ashift in time required to compute the load at t = 0 as follows:
Pt ¼ P0 � ð1þ tÞ�a ð4Þ
This expression results in the initial preload at t = 0 and includes asingle parameter, a, in the curve fit. The value of a may dependupon such variables as temperature, humidity, moisture content,stress and thickness. Use of the single parameter allows for a simplenumerical case by case comparison when compared to the 2-parameter model in Eq. (2). A 2-parameter power law expressionfor computation of the bolt load loss with respect to time was em-ployed prior by Pelletier et al. [19] for bolted hybrid connections.This power law expression is given by Eq. (5) as follows:
Pt ¼ b � P0 � ð1þ tÞ�a ð5Þ
In this expression a and b are constants that depend on constituentmaterials, geometry and test conditions. This expression normallyresults in a closer curve fit than Eq. (4) but does not result in the ini-tial preload at t = 0 unless b is equal to unity. A value of b other thanone may be due to the continually changing load value at the startof the tests which is affected by the primary creep response.
2. Test objectives
The objective of the experimental effort described herein is tocharacterize the stress relaxation of hybrid bolted connections un-der normal use conditions. Hybrid connections were studied at asub-component level in order to isolate the effects of the viscoelas-tic creep on the relaxation of the bolt. Several parameters werestudied in this investigation as follows: (1) bolt stress distribution;(2) bolt retightening; (3) varying thickness of the constituents; (4)varying bolt size; (5) type of bolt used (protruding-head versustapered-head) and (6) thermal cycling.
2.1. Test article configuration
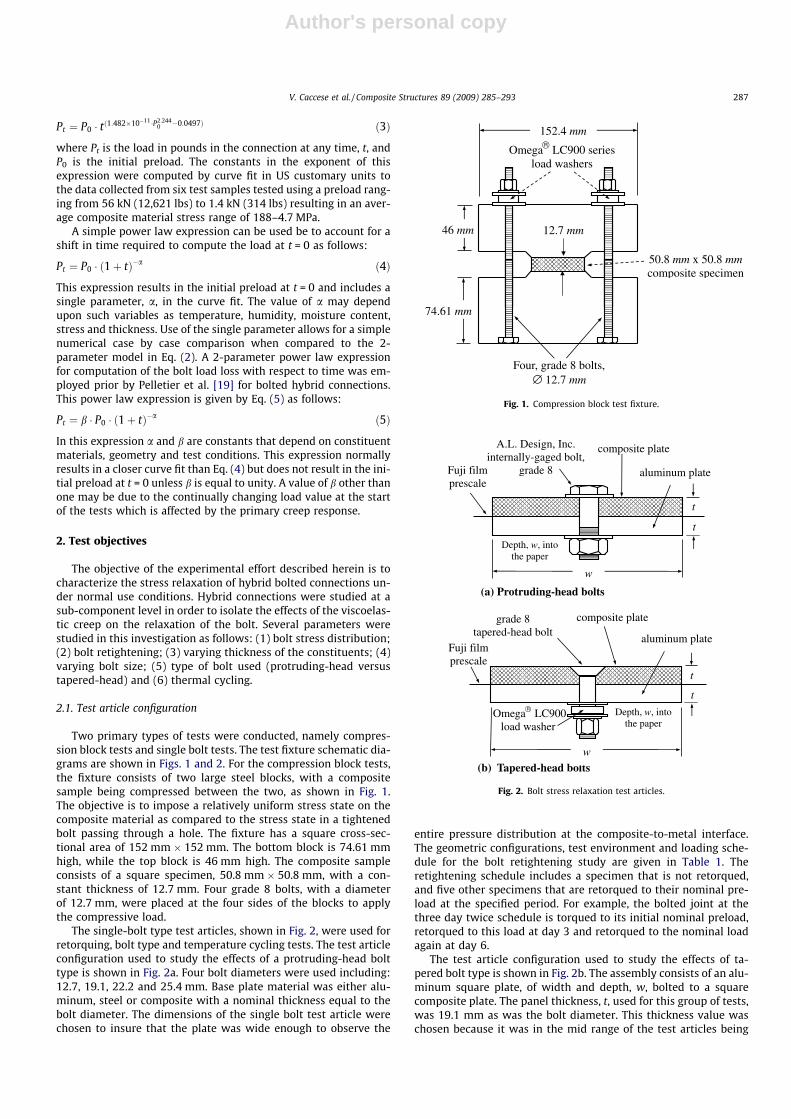
Two primary types of tests were conducted, namely compres-sion block tests and single bolt tests. The test fixture schematic dia-grams are shown in Figs. 1 and 2. For the compression block tests,the fixture consists of two large steel blocks, with a compositesample being compressed between the two, as shown in Fig. 1.The objective is to impose a relatively uniform stress state on thecomposite material as compared to the stress state in a tightenedbolt passing through a hole. The fixture has a square cross-sec-tional area of 152 mm � 152 mm. The bottom block is 74.61 mmhigh, while the top block is 46 mm high. The composite sampleconsists of a square specimen, 50.8 mm � 50.8 mm, with a con-stant thickness of 12.7 mm. Four grade 8 bolts, with a diameterof 12.7 mm, were placed at the four sides of the blocks to applythe compressive load.
The single-bolt type test articles, shown in Fig. 2, were used forretorquing, bolt type and temperature cycling tests. The test articleconfiguration used to study the effects of a protruding-head bolttype is shown in Fig. 2a. Four bolt diameters were used including:12.7, 19.1, 22.2 and 25.4 mm. Base plate material was either alu-minum, steel or composite with a nominal thickness equal to thebolt diameter. The dimensions of the single bolt test article werechosen to insure that the plate was wide enough to observe the
entire pressure distribution at the composite-to-metal interface.The geometric configurations, test environment and loading sche-dule for the bolt retightening study are given in Table 1. Theretightening schedule includes a specimen that is not retorqued,and five other specimens that are retorqued to their nominal pre-load at the specified period. For example, the bolted joint at thethree day twice schedule is torqued to its initial nominal preload,retorqued to this load at day 3 and retorqued to the nominal loadagain at day 6.
The test article configuration used to study the effects of ta-pered bolt type is shown in Fig. 2b. The assembly consists of an alu-minum square plate, of width and depth, w, bolted to a squarecomposite plate. The panel thickness, t, used for this group of tests,was 19.1 mm as was the bolt diameter. This thickness value waschosen because it was in the mid range of the test articles being
152.4 mm
46 mm
74.61 mm
Omega LC900 series load washers
50.8 mm x 50.8 mmcomposite specimen
Four, grade 8 bolts, ∅ 12.7 mm
12.7 mm
®
Fig. 1. Compression block test fixture.
(b) Tapered-head bolts
composite plate A.L. Design, Inc. internally-gaged bolt,
grade 8Fuji film prescale
aluminum plate
w
t
t
Fuji film prescale
aluminum plate
Omega LC900 load washer
grade 8 tapered-head bolt
composite plate
w
t
t
Depth, w, into the paper
Depth, w, into the paper
®
(a) Protruding-head bolts
Fig. 2. Bolt stress relaxation test articles.
V. Caccese et al. / Composite Structures 89 (2009) 285–293 287
Author's personal copy
studied in the retightening tests. Tests were performed at preloadsof 22 and 45 kN.
2.2. Materials and test article fabrication
The materials used for the composite test article fabricationwere DOW Derakane 8084 vinyl ester resin and E-glass fibers.The reinforcing fibers were 680 g of 0–90� and 680 g of ±45� knitfabric, manufactured by Brunswick Technologies, Inc. (BTI) The 0�and 90� fibers are stitched together, as are the +45 and �45� fibers.The composite material specimens were fabricated at the HybridStructures Laboratory (HSL), University of Maine, using a vac-uum-assisted resin transfer molding process (VARTM). A quasi-iso-tropic lay-up configuration was used, [(±45, 0/90)n]s, where nvaried according to the panel thickness. The process resulted in afiber volume content of 51%. Cure of the specimens was done atroom temperature for a minimum of 6 months prior to testing.Compression block test articles were cut from the same panel.For the retightening, bolt type, and environmental tests, the metal-lic plates were made of grade 6061-T6 aluminum or A36 steel plateand the bolts were instrumented steel bolts. The plates of the com-pression block tests were made of A36 grade steel.
2.3. Coefficient of thermal expansion measurement
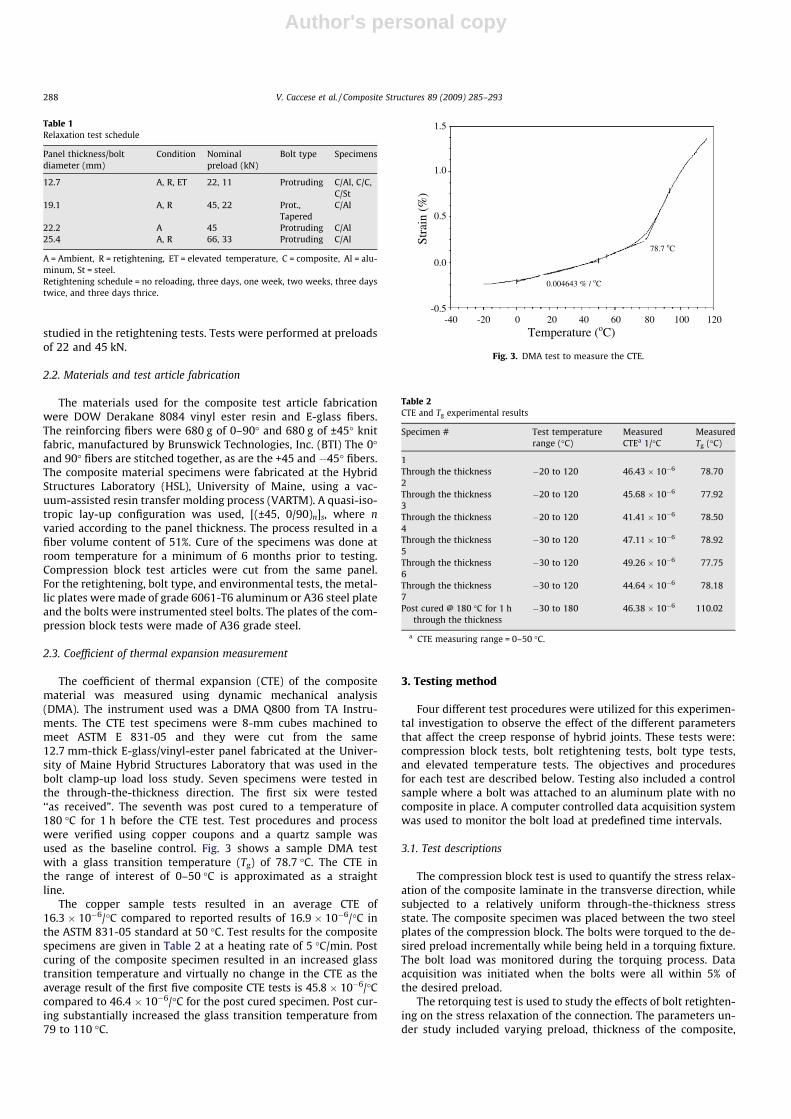
The coefficient of thermal expansion (CTE) of the compositematerial was measured using dynamic mechanical analysis(DMA). The instrument used was a DMA Q800 from TA Instru-ments. The CTE test specimens were 8-mm cubes machined tomeet ASTM E 831-05 and they were cut from the same12.7 mm-thick E-glass/vinyl-ester panel fabricated at the Univer-sity of Maine Hybrid Structures Laboratory that was used in thebolt clamp-up load loss study. Seven specimens were tested inthe through-the-thickness direction. The first six were tested‘‘as received”. The seventh was post cured to a temperature of180 �C for 1 h before the CTE test. Test procedures and processwere verified using copper coupons and a quartz sample wasused as the baseline control. Fig. 3 shows a sample DMA testwith a glass transition temperature (Tg) of 78.7 �C. The CTE inthe range of interest of 0–50 �C is approximated as a straightline.
The copper sample tests resulted in an average CTE of16.3 � 10�6/�C compared to reported results of 16.9 � 10�6/�C inthe ASTM 831-05 standard at 50 �C. Test results for the compositespecimens are given in Table 2 at a heating rate of 5 �C/min. Postcuring of the composite specimen resulted in an increased glasstransition temperature and virtually no change in the CTE as theaverage result of the first five composite CTE tests is 45.8� 10�6/�Ccompared to 46.4 � 10�6/�C for the post cured specimen. Post cur-ing substantially increased the glass transition temperature from79 to 110 �C.
3. Testing method
Four different test procedures were utilized for this experimen-tal investigation to observe the effect of the different parametersthat affect the creep response of hybrid joints. These tests were:compression block tests, bolt retightening tests, bolt type tests,and elevated temperature tests. The objectives and proceduresfor each test are described below. Testing also included a controlsample where a bolt was attached to an aluminum plate with nocomposite in place. A computer controlled data acquisition systemwas used to monitor the bolt load at predefined time intervals.
3.1. Test descriptions
The compression block test is used to quantify the stress relax-ation of the composite laminate in the transverse direction, whilesubjected to a relatively uniform through-the-thickness stressstate. The composite specimen was placed between the two steelplates of the compression block. The bolts were torqued to the de-sired preload incrementally while being held in a torquing fixture.The bolt load was monitored during the torquing process. Dataacquisition was initiated when the bolts were all within 5% ofthe desired preload.
The retorquing test is used to study the effects of bolt retighten-ing on the stress relaxation of the connection. The parameters un-der study included varying preload, thickness of the composite,
Table 1Relaxation test schedule
Panel thickness/boltdiameter (mm)
Condition Nominalpreload (kN)
Bolt type Specimens
12.7 A, R, ET 22, 11 Protruding C/Al, C/C,C/St
19.1 A, R 45, 22 Prot.,Tapered
C/Al
22.2 A 45 Protruding C/Al25.4 A, R 66, 33 Protruding C/Al
A = Ambient, R = retightening, ET = elevated temperature, C = composite, Al = alu-minum, St = steel.Retightening schedule = no reloading, three days, one week, two weeks, three daystwice, and three days thrice.
Stra
in (
%)
Temperature (oC)
78.7 oC
0.004643 % / oC
1.5
1.0
0.5
0.0
-0.5 -40 -20 0 20 40 60 80 100 120
Fig. 3. DMA test to measure the CTE.
Table 2CTE and Tg experimental results
Specimen # Test temperaturerange (�C)
MeasuredCTEa 1/�C
MeasuredTg (�C)
1Through the thickness �20 to 120 46.43 � 10�6 78.702Through the thickness �20 to 120 45.68 � 10�6 77.923Through the thickness �20 to 120 41.41 � 10�6 78.504Through the thickness �30 to 120 47.11 � 10�6 78.925Through the thickness �30 to 120 49.26 � 10�6 77.756Through the thickness �30 to 120 44.64 � 10�6 78.187Post cured @ 180 �C for 1 h
through the thickness�30 to 180 46.38 � 10�6 110.02
a CTE measuring range = 0–50 �C.
288 V. Caccese et al. / Composite Structures 89 (2009) 285–293

Author's personal copy
and the time between bolt retightening. Pressure paper was placedbetween the plates to record the peak contact stress distribution.The test procedure included periodic retightening of the bolts.The data acquisition program was stopped before the retighteningprocess was started and it was reinitialized after retorquing thebolts to the desired load. The relaxation parameters were modeledaccording to a power curve fit to the data.
Bolt type tests are used to study possible effects of using ta-pered-head bolts versus protruding-head bolts on the stress relax-ation of the connection. Pressure paper was used between thealuminum and composite plates, in the same manner as in theretightening tests. No retightening was applied for this series oftests. The load washers were placed at the end of the bolt, betweentwo mounting washers, so that the load applied to the washer wasuniform.
Elevated temperature tests were performed to study the influ-ence of temperature on bolt clamp-up force. Non-post cured spec-imens were temperature cycled from room temperature to 62 �C toassess the affect of temperature variation on clamp-up load. Thepeak temperature of 62 �C was chosen in order to remain belowthe Tg of the material during cycling.
3.2. Instrumentation
Omega� Engineering LC900 compression load washers wereused to monitor the bolt preload in the compression block and ta-pered-head single bolt tests. For the compression block test, 12.7-mm load washers, with a 133-kN load capacity, were used. For thebolt type tests, the 19-mm load washers, with a 289-kN loadcapacity, were used with the tapered bolts. The load washers werecalibrated at 5 V bridge excitation using a BK Precision� Model1651A, triple power supply. The internally gaged bolts used inthe protruding-head single bolt tests were provided by A.L. Design,Inc., model numbers: ALD-BOLT-.500 X 200 LONG, ALD-BOLT-.7500 X2.500 LONG, and ALD-BOLT-100 X 3.500 LONG. Three sizes of bolts wereused for testing: 12.7, 19, 22 and 25.4 mm. These bolts have a loadcapacity of 41, 96, and 175 kN, respectively. A 10-V power supplywas used, since this was the excitation used during calibration.The humidity was monitored using a Honeywell? HIH-3610 seriessensor, operated at 5 V DC. The room temperature was monitoredusing an LM34CZ chip, manufactured by National Semiconductor.Fujifilm prescale pressure paper was used to quantify the pressuredistribution between plates.
The data acquisition process was PC-controlled using the DAQ-FI-D5 software, written at the University of Maine. Two IOTECHTM
Daqboard 2000 cards were used for data-acquisition. This systemhas 16 bit analog-to-digital conversion resolution and is capableof reading 32 channels at a throughput rate of 1 kHz, which is morethat adequate for the rate of testing used in this study.
Multiple samples of data were averaged during acquisition toreduce the error due to instrumentation noise. Bolt preload wasapplied using a BlackhawkTM torque wrench. The data acquisitionprogram was set to take data according to the schedule given inTable 3. To begin the test procedure, an initial data point was re-corded, which quantified the bias voltage at zero load. This voltagewas used as the zero point for the load washers or load bolts. The
starting voltage was input into the voltage-offset section of thedata-acquisition program. The voltage bias was then subtractedfrom the output voltage recorded after loading. Hence, the unbi-ased voltage was determined and the actual bolt load was ob-tained. A single data point, indicating the starting load in eachbolt, was logged into the data file, and the data acquisition pro-gram was initiated and left to record the data over a three-monthperiod.
3.3. Data analysis
The data analysis was performed by determining the constantsin Eqs. (2), (4) and (5) using a least squares regression approach.The constants in Eq. (2) can be found by solving the expressionfor K1tn and taking the logarithm of each side. This result in Eq. 6where n and K1 can be found from a linear regression analysis(see Fig. 4).
log1� Pt
P0PtP0
" #¼ n � logðtÞ þ logðK1Þ ð6Þ
A similar approach can be used to solve for the constant, a and b, inEq. (5). This results in the expression
logPt
P0
� �¼ a � logð1þ tÞ þ log½b� ð7Þ
The constant a can be found in Eq. (4) using the above expressionbut forcing the intercept in the regression analysis, log[b], to zerosuch than b equals unity. Fig. 5 shows a sample case giving a
Table 3Data-acquisition recording schedule
Time period Data recording
Start to 1 h Every minute1–24 h Every 10 min24 h to 30 days Every 30 min30 days to 4 weeks Every 7 days4 weeks to end Every 14 days
0.70
0.75
0.80
0.85
0.90
0.95
1.00
0 500 1000 1500 2000 2500Time, hr.
12.7 mm Protruding head dataEq. 2Eq. 4Eq. 5
Pt/ P
0
Fig. 4. Comparison of the use of various relaxation equations.
0.8
0.85
0.9
0.95
1
0 500 1000 1500 2000
Pt/ P
0
Time, hr.
Comp. Blk data - @ 34 kPa
Comp. Blk data - @ 71 kPa
Comp. Block curve fit @ 71 kPa
Comp. Block curve fit @ 34 kPa
Fig. 5. Compression block tests.
V. Caccese et al. / Composite Structures 89 (2009) 285–293 289
Author's personal copy
comparison of the three equations. Eqs. (2) and (5) typically show asomewhat better fit to the data than does equation (4).
4. Test results
4.1. Compression block test results
Fig. 5 shows the load history of the compression block test oftwo specimens preloaded to 184 and 89 kN. The clamp-up load isnon-dimensionalized by dividing the load at time t, Pt, by the initialpreload, P0. The actual initial preload on each the four bolts in the184 kN test was 46.6, 45, 47.8 and 44.5 kN at an average pressureof 71 kPa. The actual preload one each bolt for the 89 kN test was22.3, 22.3, 22.3 and 22.3 kN at an average pressure of 34 kPa. Anaverage 13% reduction in the initial preload was observed for allbolts, over a period of approximately 2000 h. The percentage loss
in the range tested is relatively insensitive to initial stress. Basedon a power law fit to the curves, equations were developed forthe load in each bolt of the compression block tests. Results ofthe various equation parameters are given in Table 4.
4.2. Bolt retightneing test results
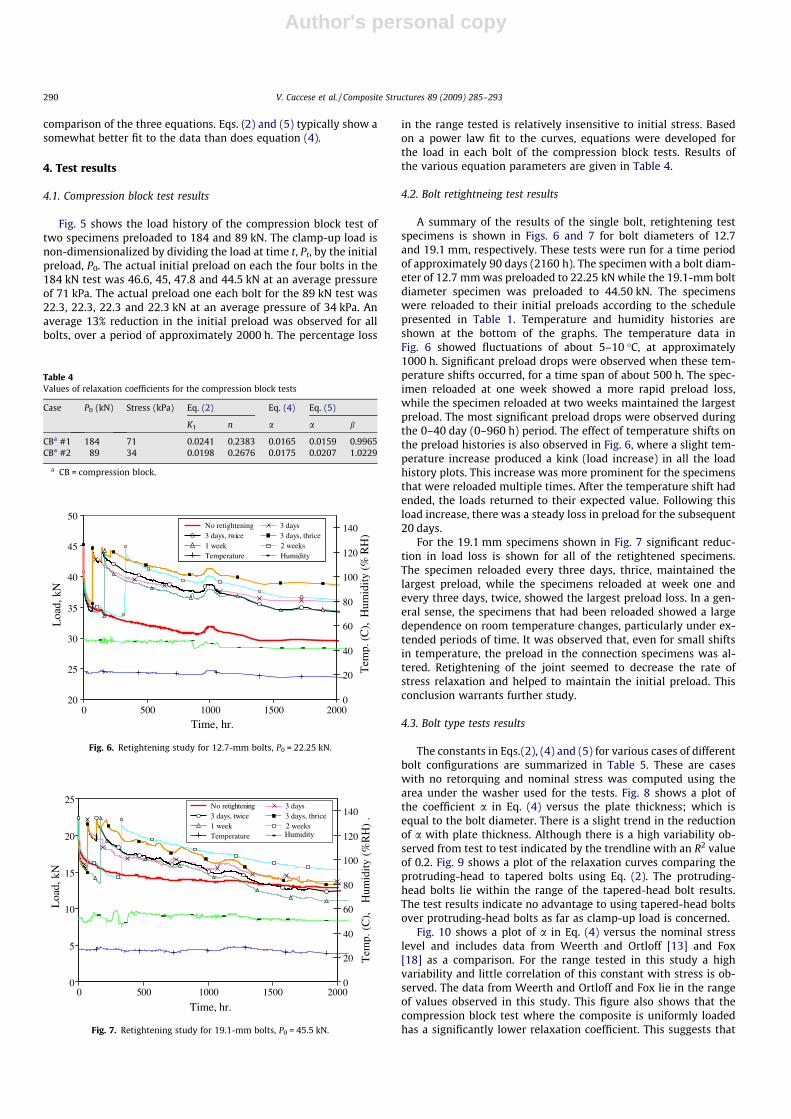
A summary of the results of the single bolt, retightening testspecimens is shown in Figs. 6 and 7 for bolt diameters of 12.7and 19.1 mm, respectively. These tests were run for a time periodof approximately 90 days (2160 h). The specimen with a bolt diam-eter of 12.7 mm was preloaded to 22.25 kN while the 19.1-mm boltdiameter specimen was preloaded to 44.50 kN. The specimenswere reloaded to their initial preloads according to the schedulepresented in Table 1. Temperature and humidity histories areshown at the bottom of the graphs. The temperature data inFig. 6 showed fluctuations of about 5–10 �C, at approximately1000 h. Significant preload drops were observed when these tem-perature shifts occurred, for a time span of about 500 h. The spec-imen reloaded at one week showed a more rapid preload loss,while the specimen reloaded at two weeks maintained the largestpreload. The most significant preload drops were observed duringthe 0–40 day (0–960 h) period. The effect of temperature shifts onthe preload histories is also observed in Fig. 6, where a slight tem-perature increase produced a kink (load increase) in all the loadhistory plots. This increase was more prominent for the specimensthat were reloaded multiple times. After the temperature shift hadended, the loads returned to their expected value. Following thisload increase, there was a steady loss in preload for the subsequent20 days.
For the 19.1 mm specimens shown in Fig. 7 significant reduc-tion in load loss is shown for all of the retightened specimens.The specimen reloaded every three days, thrice, maintained thelargest preload, while the specimens reloaded at week one andevery three days, twice, showed the largest preload loss. In a gen-eral sense, the specimens that had been reloaded showed a largedependence on room temperature changes, particularly under ex-tended periods of time. It was observed that, even for small shiftsin temperature, the preload in the connection specimens was al-tered. Retightening of the joint seemed to decrease the rate ofstress relaxation and helped to maintain the initial preload. Thisconclusion warrants further study.
4.3. Bolt type tests results
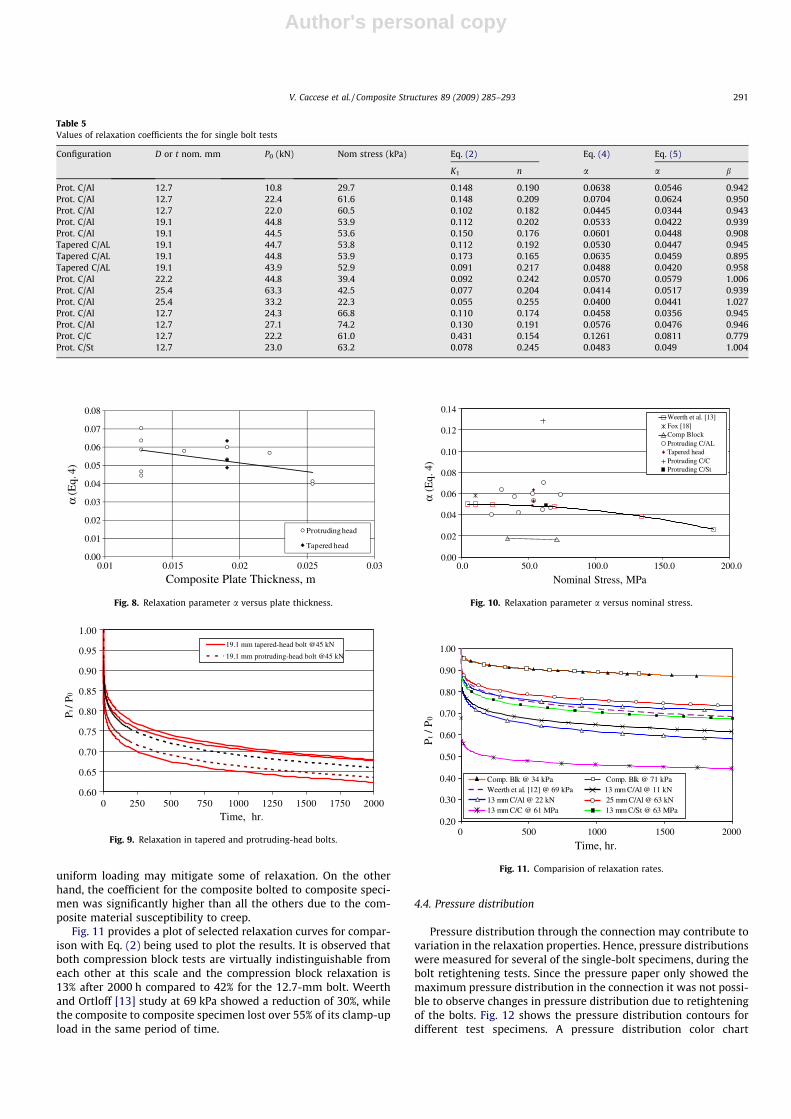
The constants in Eqs.(2), (4) and (5) for various cases of differentbolt configurations are summarized in Table 5. These are caseswith no retorquing and nominal stress was computed using thearea under the washer used for the tests. Fig. 8 shows a plot ofthe coefficient a in Eq. (4) versus the plate thickness; which isequal to the bolt diameter. There is a slight trend in the reductionof a with plate thickness. Although there is a high variability ob-served from test to test indicated by the trendline with an R2 valueof 0.2. Fig. 9 shows a plot of the relaxation curves comparing theprotruding-head to tapered bolts using Eq. (2). The protruding-head bolts lie within the range of the tapered-head bolt results.The test results indicate no advantage to using tapered-head boltsover protruding-head bolts as far as clamp-up load is concerned.
Fig. 10 shows a plot of a in Eq. (4) versus the nominal stresslevel and includes data from Weerth and Ortloff [13] and Fox[18] as a comparison. For the range tested in this study a highvariability and little correlation of this constant with stress is ob-served. The data from Weerth and Ortloff and Fox lie in the rangeof values observed in this study. This figure also shows that thecompression block test where the composite is uniformly loadedhas a significantly lower relaxation coefficient. This suggests that
20
25
30
35
40
45
50
0 500 1000 1500 2000
Time, hr.
Loa
d, k
N
0
20
40
60
80
100
120
140
Tem
p. (
C),
Hum
idity
(%
RH
)
No retightening 3 days 3 days, twice 3 days, thrice 1 week 2 weeks Temperature Humidity
Fig. 6. Retightening study for 12.7-mm bolts, P0 = 22.25 kN.
0
5
10
15
20
25
0 500 1000 1500 2000
Time, hr.
Loa
d, k
N
0
20
40
60
80
100
120
140
Tem
p. (
C),
H
umid
ity (
%R
H)
.
No retightening 3 days 3 days, twice 3 days, thrice 1 week 2 weeks Temperature Humidity
Fig. 7. Retightening study for 19.1-mm bolts, P0 = 45.5 kN.
Table 4Values of relaxation coefficients for the compression block tests
Case P0 (kN) Stress (kPa) Eq. (2) Eq. (4) Eq. (5)
K1 n a a b
CBa #1 184 71 0.0241 0.2383 0.0165 0.0159 0.9965CBa #2 89 34 0.0198 0.2676 0.0175 0.0207 1.0229
a CB = compression block.
290 V. Caccese et al. / Composite Structures 89 (2009) 285–293
Author's personal copy
uniform loading may mitigate some of relaxation. On the otherhand, the coefficient for the composite bolted to composite speci-men was significantly higher than all the others due to the com-posite material susceptibility to creep.
Fig. 11 provides a plot of selected relaxation curves for compar-ison with Eq. (2) being used to plot the results. It is observed thatboth compression block tests are virtually indistinguishable fromeach other at this scale and the compression block relaxation is13% after 2000 h compared to 42% for the 12.7-mm bolt. Weerthand Ortloff [13] study at 69 kPa showed a reduction of 30%, whilethe composite to composite specimen lost over 55% of its clamp-upload in the same period of time.
4.4. Pressure distribution
Pressure distribution through the connection may contribute tovariation in the relaxation properties. Hence, pressure distributionswere measured for several of the single-bolt specimens, during thebolt retightening tests. Since the pressure paper only showed themaximum pressure distribution in the connection it was not possi-ble to observe changes in pressure distribution due to retighteningof the bolts. Fig. 12 shows the pressure distribution contours fordifferent test specimens. A pressure distribution color chart
Table 5Values of relaxation coefficients the for single bolt tests
Configuration D or t nom. mm P0 (kN) Nom stress (kPa) Eq. (2) Eq. (4) Eq. (5)
K1 n a a b
Prot. C/Al 12.7 10.8 29.7 0.148 0.190 0.0638 0.0546 0.942Prot. C/Al 12.7 22.4 61.6 0.148 0.209 0.0704 0.0624 0.950Prot. C/Al 12.7 22.0 60.5 0.102 0.182 0.0445 0.0344 0.943Prot. C/Al 19.1 44.8 53.9 0.112 0.202 0.0533 0.0422 0.939Prot. C/Al 19.1 44.5 53.6 0.150 0.176 0.0601 0.0448 0.908Tapered C/AL 19.1 44.7 53.8 0.112 0.192 0.0530 0.0447 0.945Tapered C/AL 19.1 44.8 53.9 0.173 0.165 0.0635 0.0459 0.895Tapered C/AL 19.1 43.9 52.9 0.091 0.217 0.0488 0.0420 0.958Prot. C/Al 22.2 44.8 39.4 0.092 0.242 0.0570 0.0579 1.006Prot. C/Al 25.4 63.3 42.5 0.077 0.204 0.0414 0.0517 0.939Prot. C/Al 25.4 33.2 22.3 0.055 0.255 0.0400 0.0441 1.027Prot. C/Al 12.7 24.3 66.8 0.110 0.174 0.0458 0.0356 0.945Prot. C/Al 12.7 27.1 74.2 0.130 0.191 0.0576 0.0476 0.946Prot. C/C 12.7 22.2 61.0 0.431 0.154 0.1261 0.0811 0.779Prot. C/St 12.7 23.0 63.2 0.078 0.245 0.0483 0.049 1.004
0.00
0.01
0.02
0.03
0.04
0.05
0.06
0.07
0.08
0.01 0.015 0.02 0.025 0.03
α (E
q. 4
)
Composite Plate Thickness, m
Protruding head
Tapered head
Fig. 8. Relaxation parameter a versus plate thickness.
0.60
0.65
0.70
0.75
0.80
0.85
0.90
0.95
1.00
0 250 500 750 1000 1250 1500 1750 2000Time, hr.
Pi /
P0
19.1 mm tapered-head bolt @45 kN
19.1 mm protruding-head bolt @45 kN
Fig. 9. Relaxation in tapered and protruding-head bolts.
0.00
0.02
0.04
0.06
0.08
0.10
0.12
0.14
0.0 50.0 100.0 150.0 200.0
Nominal Stress, MPa
α (E
q. 4
)Weerth et al. [13]Fox [18]Comp BlockProtruding C/ALTapered headProtruding C/CProtruding C/St
Fig. 10. Relaxation parameter a versus nominal stress.
0.20
0.30
0.40
0.50
0.60
0.70
0.80
0.90
1.00
0 500 1000 1500 2000
Time, hr.
Pt /
P0
Comp. Blk @ 34 kPa Comp. Blk @ 71 kPa Weerth et al. [12] @ 69 kPa 13 mm C/Al @ 11 kN 13 mm C/Al @ 22 kN 25 mm C/Al @ 63 kN 13 mm C/C @ 61 MPa 13 mm C/St @ 63 MPa
Fig. 11. Comparision of relaxation rates.
V. Caccese et al. / Composite Structures 89 (2009) 285–293 291
Author's personal copy
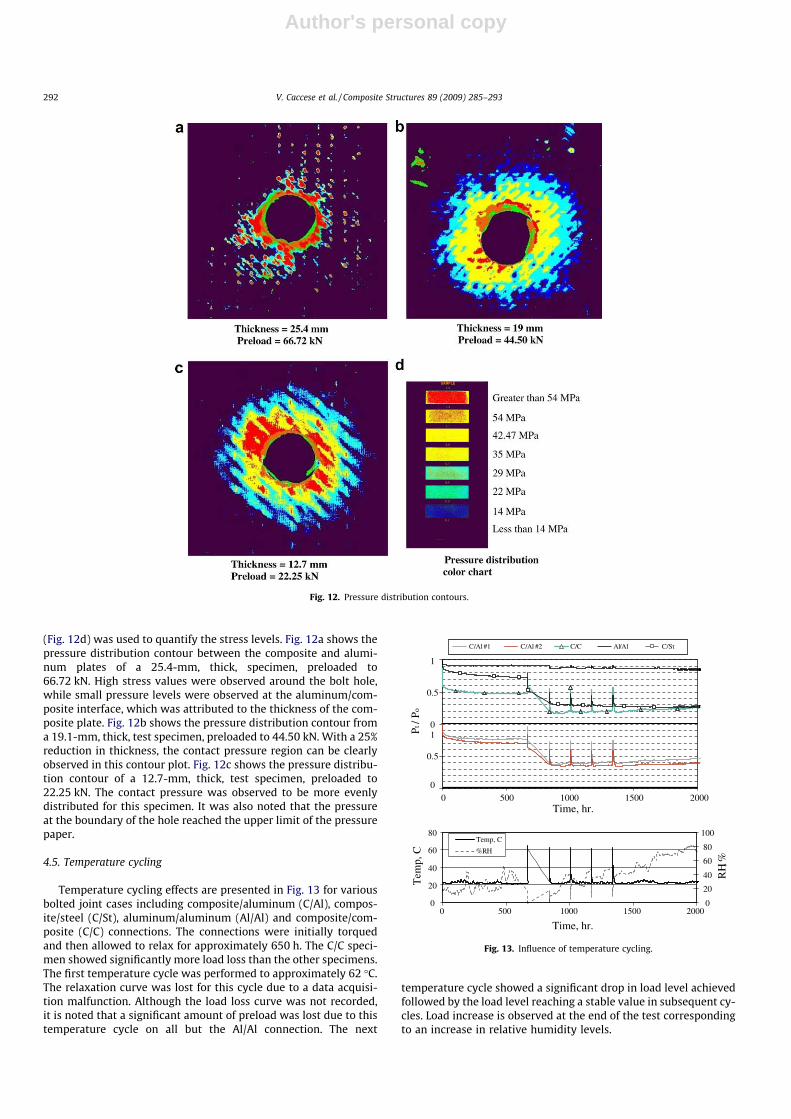
(Fig. 12d) was used to quantify the stress levels. Fig. 12a shows thepressure distribution contour between the composite and alumi-num plates of a 25.4-mm, thick, specimen, preloaded to66.72 kN. High stress values were observed around the bolt hole,while small pressure levels were observed at the aluminum/com-posite interface, which was attributed to the thickness of the com-posite plate. Fig. 12b shows the pressure distribution contour froma 19.1-mm, thick, test specimen, preloaded to 44.50 kN. With a 25%reduction in thickness, the contact pressure region can be clearlyobserved in this contour plot. Fig. 12c shows the pressure distribu-tion contour of a 12.7-mm, thick, test specimen, preloaded to22.25 kN. The contact pressure was observed to be more evenlydistributed for this specimen. It was also noted that the pressureat the boundary of the hole reached the upper limit of the pressurepaper.
4.5. Temperature cycling
Temperature cycling effects are presented in Fig. 13 for variousbolted joint cases including composite/aluminum (C/Al), compos-ite/steel (C/St), aluminum/aluminum (Al/Al) and composite/com-posite (C/C) connections. The connections were initially torquedand then allowed to relax for approximately 650 h. The C/C speci-men showed significantly more load loss than the other specimens.The first temperature cycle was performed to approximately 62 �C.The relaxation curve was lost for this cycle due to a data acquisi-tion malfunction. Although the load loss curve was not recorded,it is noted that a significant amount of preload was lost due to thistemperature cycle on all but the Al/Al connection. The next
temperature cycle showed a significant drop in load level achievedfollowed by the load level reaching a stable value in subsequent cy-cles. Load increase is observed at the end of the test correspondingto an increase in relative humidity levels.
Fig. 12. Pressure distribution contours.
0 500 1000 1500 2000Time, hr.
Pt /
Po
C/Al #1 C/Al #2 C/C Al/Al C/St
1
0.5
0.5
01
0
0
20
40
60
80
0 500 1000 1500 2000
Time, hr.
Tem
p, C
0
20
40
60
80
100
RH,
%
Temp, C
%RH
Fig. 13. Influence of temperature cycling.
292 V. Caccese et al. / Composite Structures 89 (2009) 285–293
Author's personal copy
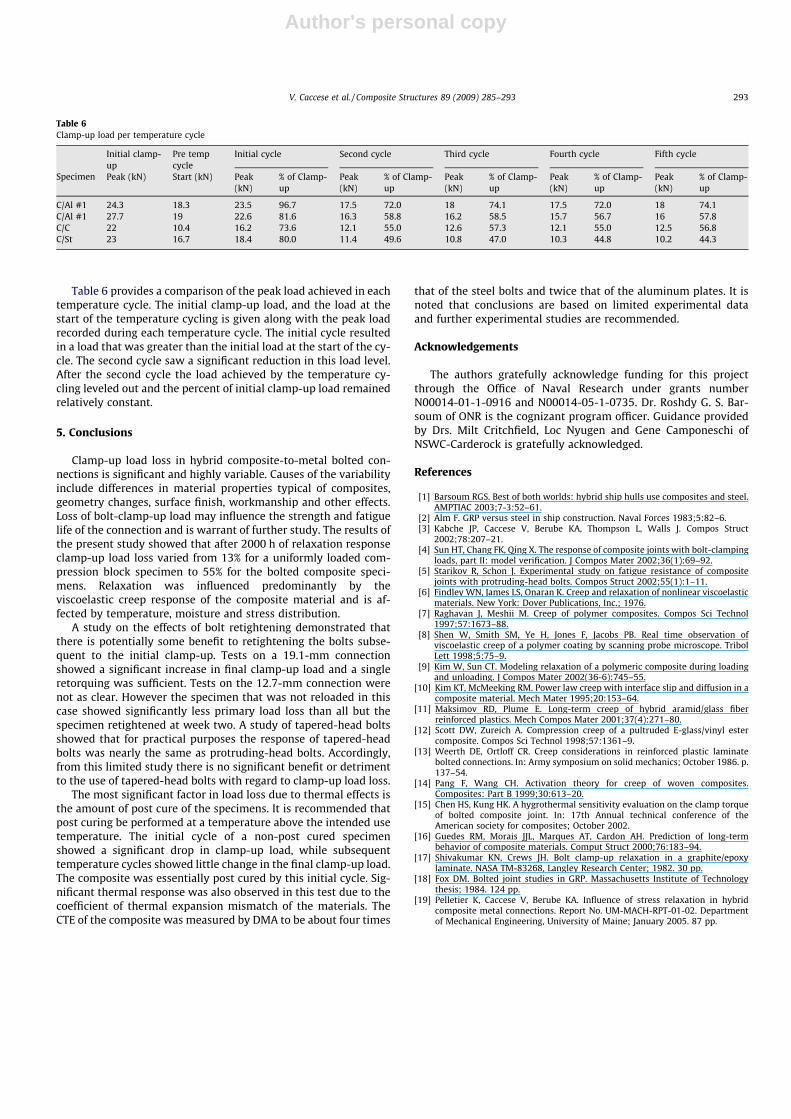
Table 6 provides a comparison of the peak load achieved in eachtemperature cycle. The initial clamp-up load, and the load at thestart of the temperature cycling is given along with the peak loadrecorded during each temperature cycle. The initial cycle resultedin a load that was greater than the initial load at the start of the cy-cle. The second cycle saw a significant reduction in this load level.After the second cycle the load achieved by the temperature cy-cling leveled out and the percent of initial clamp-up load remainedrelatively constant.
5. Conclusions
Clamp-up load loss in hybrid composite-to-metal bolted con-nections is significant and highly variable. Causes of the variabilityinclude differences in material properties typical of composites,geometry changes, surface finish, workmanship and other effects.Loss of bolt-clamp-up load may influence the strength and fatiguelife of the connection and is warrant of further study. The results ofthe present study showed that after 2000 h of relaxation responseclamp-up load loss varied from 13% for a uniformly loaded com-pression block specimen to 55% for the bolted composite speci-mens. Relaxation was influenced predominantly by theviscoelastic creep response of the composite material and is af-fected by temperature, moisture and stress distribution.
A study on the effects of bolt retightening demonstrated thatthere is potentially some benefit to retightening the bolts subse-quent to the initial clamp-up. Tests on a 19.1-mm connectionshowed a significant increase in final clamp-up load and a singleretorquing was sufficient. Tests on the 12.7-mm connection werenot as clear. However the specimen that was not reloaded in thiscase showed significantly less primary load loss than all but thespecimen retightened at week two. A study of tapered-head boltsshowed that for practical purposes the response of tapered-headbolts was nearly the same as protruding-head bolts. Accordingly,from this limited study there is no significant benefit or detrimentto the use of tapered-head bolts with regard to clamp-up load loss.
The most significant factor in load loss due to thermal effects isthe amount of post cure of the specimens. It is recommended thatpost curing be performed at a temperature above the intended usetemperature. The initial cycle of a non-post cured specimenshowed a significant drop in clamp-up load, while subsequenttemperature cycles showed little change in the final clamp-up load.The composite was essentially post cured by this initial cycle. Sig-nificant thermal response was also observed in this test due to thecoefficient of thermal expansion mismatch of the materials. TheCTE of the composite was measured by DMA to be about four times
that of the steel bolts and twice that of the aluminum plates. It isnoted that conclusions are based on limited experimental dataand further experimental studies are recommended.
Acknowledgements
The authors gratefully acknowledge funding for this projectthrough the Office of Naval Research under grants numberN00014-01-1-0916 and N00014-05-1-0735. Dr. Roshdy G. S. Bar-soum of ONR is the cognizant program officer. Guidance providedby Drs. Milt Critchfield, Loc Nyugen and Gene Camponeschi ofNSWC-Carderock is gratefully acknowledged.
References
[1] Barsoum RGS. Best of both worlds: hybrid ship hulls use composites and steel.AMPTIAC 2003;7-3:52–61.
[2] Alm F. GRP versus steel in ship construction. Naval Forces 1983;5:82–6.[3] Kabche JP, Caccese V, Berube KA, Thompson L, Walls J. Compos Struct
2002;78:207–21.[4] Sun HT, Chang FK, Qing X. The response of composite joints with bolt-clamping
loads, part II: model verification. J Compos Mater 2002;36(1):69–92.[5] Starikov R, Schon J. Experimental study on fatigue resistance of composite
joints with protruding-head bolts. Compos Struct 2002;55(1):1–11.[6] Findley WN, James LS, Onaran K. Creep and relaxation of nonlinear viscoelastic
materials. New York: Dover Publications, Inc.; 1976.[7] Raghavan J, Meshii M. Creep of polymer composites. Compos Sci Technol
1997;57:1673–88.[8] Shen W, Smith SM, Ye H, Jones F, Jacobs PB. Real time observation of
viscoelastic creep of a polymer coating by scanning probe microscope. TribolLett 1998;5:75–9.
[9] Kim W, Sun CT. Modeling relaxation of a polymeric composite during loadingand unloading. J Compos Mater 2002(36-6):745–55.
[10] Kim KT, McMeeking RM. Power law creep with interface slip and diffusion in acomposite material. Mech Mater 1995;20:153–64.
[11] Maksimov RD, Plume E. Long-term creep of hybrid aramid/glass fiberreinforced plastics. Mech Compos Mater 2001;37(4):271–80.
[12] Scott DW, Zureich A. Compression creep of a pultruded E-glass/vinyl estercomposite. Compos Sci Technol 1998;57:1361–9.
[13] Weerth DE, Ortloff CR. Creep considerations in reinforced plastic laminatebolted connections. In: Army symposium on solid mechanics; October 1986. p.137–54.
[14] Pang F, Wang CH. Activation theory for creep of woven composites.Composites: Part B 1999;30:613–20.
[15] Chen HS, Kung HK. A hygrothermal sensitivity evaluation on the clamp torqueof bolted composite joint. In: 17th Annual technical conference of theAmerican society for composites; October 2002.
[16] Guedes RM, Morais JJL, Marques AT, Cardon AH. Prediction of long-termbehavior of composite materials. Comput Struct 2000;76:183–94.
[17] Shivakumar KN, Crews JH. Bolt clamp-up relaxation in a graphite/epoxylaminate. NASA TM-83268, Langley Research Center; 1982. 30 pp.
[18] Fox DM. Bolted joint studies in GRP. Massachusetts Institute of Technologythesis; 1984. 124 pp.
[19] Pelletier K, Caccese V, Berube KA. Influence of stress relaxation in hybridcomposite metal connections. Report No. UM-MACH-RPT-01-02. Departmentof Mechanical Engineering, University of Maine; January 2005. 87 pp.
Table 6Clamp-up load per temperature cycle
Specimen
Initial clamp-up
Pre tempcycle
Initial cycle Second cycle Third cycle Fourth cycle Fifth cycle
Peak (kN) Start (kN) Peak(kN)
% of Clamp-up
Peak(kN)
% of Clamp-up
Peak(kN)
% of Clamp-up
Peak(kN)
% of Clamp-up
Peak(kN)
% of Clamp-up
C/Al #1 24.3 18.3 23.5 96.7 17.5 72.0 18 74.1 17.5 72.0 18 74.1C/Al #1 27.7 19 22.6 81.6 16.3 58.8 16.2 58.5 15.7 56.7 16 57.8C/C 22 10.4 16.2 73.6 12.1 55.0 12.6 57.3 12.1 55.0 12.5 56.8C/St 23 16.7 18.4 80.0 11.4 49.6 10.8 47.0 10.3 44.8 10.2 44.3
V. Caccese et al. / Composite Structures 89 (2009) 285–293 293