Influence of specimen dimensions and strain measurement methods on tensile stress–strain curves
10
Materials Science and Engineering A 525 (2009) 68–77 Contents lists available at ScienceDirect Materials Science and Engineering A journal homepage: www.elsevier.com/locate/msea Influence of specimen dimensions and strain measurement methods on tensile stress–strain curves Y.H. Zhao a,∗ , Y.Z. Guo b,c , Q. Wei b,∗∗ , T.D. Topping a , A.M. Dangelewicz d , Y.T. Zhu e , T.G. Langdon f,g , E.J. Lavernia a a Department of Chemical Engineering and Materials Science, University of California at Davis, Davis, CA 95616, USA b Department of Mechanical Engineering, University of North Carolina at Charlotte, Charlotte, NC 28223, USA c NW Polytech University, Sch Aeronaut, Xian 710072, PR China d Los Alamos National Laboratory, Los Alamos, NM 87545, USA e Department of Materials Science and Engineering, North Carolina State University, Raleigh, NC 27695-7919, USA f Departments of Aerospace & Mechanical Engineering and Materials Science, University of Southern California, Los Angeles, CA 90089-1453, USA g Materials Research Group, School of Engineering Sciences, University of Southampton, Southampton SO17 1BJ, UK article info Article history: Received 5 May 2009 Received in revised form 15 June 2009 Accepted 16 June 2009 Keywords: Strain measurements Tensile testing Finite element modeling (FEM) Miniature specimens Stress–strain curves abstract Miniature tensile specimens, having various sizes and geometries, are often used to measure the mechan- ical properties of bulk nanostructured materials. However, these samples are generally too small for use with conventional extensometers so that the strains are usually calculated from the crosshead displace- ments. This study uses experimental results and finite element modeling (FEM) to critically evaluate the influence of the specimen dimensions and strain measurement methods on the tensile curves obtained from miniature specimens. Using coarse-grained Cu as a model material, the results demonstrate that the values of strain obtained from the crosshead displacement are critically influenced by the speci- men dimensions such that the uniform elongation and the post-necking elongation both increase with decreasing gauge length and increasing specimen thickness. The results provide guidance on the opti- mum procedures for the tensile testing of miniature specimens of both coarse-grained and nanostructured materials. © 2009 Elsevier B.V. All rights reserved. 1. Introduction The numerous reports of super-high strength for various nanos- tructured (NS, structural features <100nm) metals and alloys continue to attract interest from the scientific and technical communities. It is evident, however, that a significant obstacle obstructing the widespread engineering application of this class of materials lies in their generally poor ductility [1–4]. Inspec- tion of the scientific literature shows numerous recent efforts directed towards developing strategies for improving the ductil- ity of these materials and these strategies have met with varying degrees of success [5–15]. A review of the published experimental results reveals that the ductility is frequently measured using non- standardized mechanical testing incorporating miniature dog-bone tensile specimens having different sizes and geometries that are not in conformity with ASTM standards [16]. Thus, the thickness of some of these nanostructured tensile specimens vary from about ∗ Corresponding author. Tel.: +1 530 7529568; fax: +1 530 7529554. ∗∗ Corresponding author. Tel.: +1 704 6878213. E-mail addresses: [email protected] (Y.H. Zhao), [email protected] (Q. Wei). 100 m [10,11] or even about 10 m [17] to several millimeters [8,9,12–15] and the gauge lengths vary from 1 mm [18–21] to sev- eral millimeters [8–15,17] or even several centimeters [22] where these various dimensions depend primarily upon the availability of material. On the basis of ASTM standards, a subsize rectangular tensile specimen should have a gauge length of 25 mm, a width of 6 mm, a thickness smaller than 6 mm and a radius fillet of 6 mm. An impor- tant requirement is that the ratio of gauge length to width should be maintained at 4. In the case of tensile specimens with circular cross-sections, the ratio of gauge length to gauge diameter should be 5 and the fillet radius should equal the gauge diameter. In prac- tice, the ratio of gauge length to thickness/diameter used in NS materials is frequently smaller than 4. Moreover, because of the small dimensions of the gauge lengths, the strains of the minia- ture specimens are often derived from the crosshead displacements due to the difficulties in attaching strain gauges or applying exten- someters [18–21]. As a consequence of these variations, it is not surprising that published results for bulk NS materials are often dif- ficult to interpret in terms of the underlying mechanisms (ductility, for example) and they invariably pose a challenge in any attempts to reproduce the data. 0921-5093/$ – see front matter © 2009 Elsevier B.V. All rights reserved. doi:10.1016/j.msea.2009.06.031
Transcript of Influence of specimen dimensions and strain measurement methods on tensile stress–strain curves

Is
YTa
b
c
d
e
f
g
a
ARRA
KSTFMS
1
tccootdidrstns
0d
Materials Science and Engineering A 525 (2009) 68–77
Contents lists available at ScienceDirect
Materials Science and Engineering A
journa l homepage: www.e lsev ier .com/ locate /msea
nfluence of specimen dimensions and strain measurement methods on tensiletress–strain curves
.H. Zhao a,∗, Y.Z. Guo b,c, Q. Wei b,∗∗, T.D. Topping a, A.M. Dangelewicz d, Y.T. Zhu e,
.G. Langdon f,g, E.J. Lavernia a
Department of Chemical Engineering and Materials Science, University of California at Davis, Davis, CA 95616, USADepartment of Mechanical Engineering, University of North Carolina at Charlotte, Charlotte, NC 28223, USANW Polytech University, Sch Aeronaut, Xian 710072, PR ChinaLos Alamos National Laboratory, Los Alamos, NM 87545, USADepartment of Materials Science and Engineering, North Carolina State University, Raleigh, NC 27695-7919, USADepartments of Aerospace & Mechanical Engineering and Materials Science, University of Southern California, Los Angeles, CA 90089-1453, USAMaterials Research Group, School of Engineering Sciences, University of Southampton, Southampton SO17 1BJ, UK
r t i c l e i n f o
rticle history:eceived 5 May 2009eceived in revised form 15 June 2009ccepted 16 June 2009
a b s t r a c t
Miniature tensile specimens, having various sizes and geometries, are often used to measure the mechan-ical properties of bulk nanostructured materials. However, these samples are generally too small for usewith conventional extensometers so that the strains are usually calculated from the crosshead displace-ments. This study uses experimental results and finite element modeling (FEM) to critically evaluate the
eywords:train measurementsensile testinginite element modeling (FEM)iniature specimens
influence of the specimen dimensions and strain measurement methods on the tensile curves obtainedfrom miniature specimens. Using coarse-grained Cu as a model material, the results demonstrate thatthe values of strain obtained from the crosshead displacement are critically influenced by the speci-men dimensions such that the uniform elongation and the post-necking elongation both increase withdecreasing gauge length and increasing specimen thickness. The results provide guidance on the opti-mum procedures for the tensile testing of miniature specimens of both coarse-grained and nanostructured
tress–strain curves materials.
. Introduction
The numerous reports of super-high strength for various nanos-ructured (NS, structural features <100 nm) metals and alloysontinue to attract interest from the scientific and technicalommunities. It is evident, however, that a significant obstaclebstructing the widespread engineering application of this classf materials lies in their generally poor ductility [1–4]. Inspec-ion of the scientific literature shows numerous recent effortsirected towards developing strategies for improving the ductil-
ty of these materials and these strategies have met with varyingegrees of success [5–15]. A review of the published experimentalesults reveals that the ductility is frequently measured using non-
tandardized mechanical testing incorporating miniature dog-boneensile specimens having different sizes and geometries that areot in conformity with ASTM standards [16]. Thus, the thickness ofome of these nanostructured tensile specimens vary from about∗ Corresponding author. Tel.: +1 530 7529568; fax: +1 530 7529554.∗∗ Corresponding author. Tel.: +1 704 6878213.
E-mail addresses: [email protected] (Y.H. Zhao), [email protected] (Q. Wei).
921-5093/$ – see front matter © 2009 Elsevier B.V. All rights reserved.oi:10.1016/j.msea.2009.06.031
© 2009 Elsevier B.V. All rights reserved.
100 �m [10,11] or even about 10 �m [17] to several millimeters[8,9,12–15] and the gauge lengths vary from 1 mm [18–21] to sev-eral millimeters [8–15,17] or even several centimeters [22] wherethese various dimensions depend primarily upon the availability ofmaterial.
On the basis of ASTM standards, a subsize rectangular tensilespecimen should have a gauge length of 25 mm, a width of 6 mm, athickness smaller than 6 mm and a radius fillet of 6 mm. An impor-tant requirement is that the ratio of gauge length to width shouldbe maintained at 4. In the case of tensile specimens with circularcross-sections, the ratio of gauge length to gauge diameter shouldbe 5 and the fillet radius should equal the gauge diameter. In prac-tice, the ratio of gauge length to thickness/diameter used in NSmaterials is frequently smaller than 4. Moreover, because of thesmall dimensions of the gauge lengths, the strains of the minia-ture specimens are often derived from the crosshead displacementsdue to the difficulties in attaching strain gauges or applying exten-
someters [18–21]. As a consequence of these variations, it is notsurprising that published results for bulk NS materials are often dif-ficult to interpret in terms of the underlying mechanisms (ductility,for example) and they invariably pose a challenge in any attemptsto reproduce the data.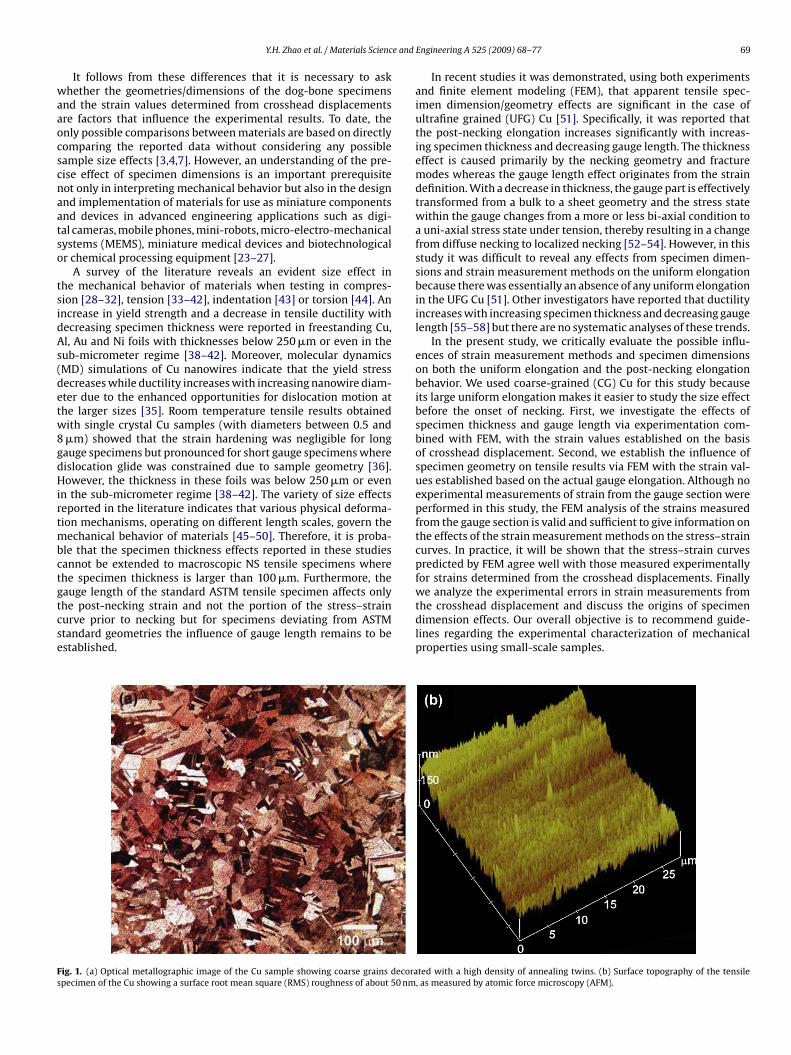
e and
waaocscnaatso
tsidAs(detw8gdHirtmbctgtcse
Fs
Y.H. Zhao et al. / Materials Scienc
It follows from these differences that it is necessary to askhether the geometries/dimensions of the dog-bone specimens
nd the strain values determined from crosshead displacementsre factors that influence the experimental results. To date, thenly possible comparisons between materials are based on directlyomparing the reported data without considering any possibleample size effects [3,4,7]. However, an understanding of the pre-ise effect of specimen dimensions is an important prerequisiteot only in interpreting mechanical behavior but also in the designnd implementation of materials for use as miniature componentsnd devices in advanced engineering applications such as digi-al cameras, mobile phones, mini-robots, micro-electro-mechanicalystems (MEMS), miniature medical devices and biotechnologicalr chemical processing equipment [23–27].
A survey of the literature reveals an evident size effect inhe mechanical behavior of materials when testing in compres-ion [28–32], tension [33–42], indentation [43] or torsion [44]. Anncrease in yield strength and a decrease in tensile ductility withecreasing specimen thickness were reported in freestanding Cu,l, Au and Ni foils with thicknesses below 250 �m or even in theub-micrometer regime [38–42]. Moreover, molecular dynamicsMD) simulations of Cu nanowires indicate that the yield stressecreases while ductility increases with increasing nanowire diam-ter due to the enhanced opportunities for dislocation motion athe larger sizes [35]. Room temperature tensile results obtainedith single crystal Cu samples (with diameters between 0.5 and�m) showed that the strain hardening was negligible for longauge specimens but pronounced for short gauge specimens whereislocation glide was constrained due to sample geometry [36].owever, the thickness in these foils was below 250 �m or even
n the sub-micrometer regime [38–42]. The variety of size effectseported in the literature indicates that various physical deforma-ion mechanisms, operating on different length scales, govern the
echanical behavior of materials [45–50]. Therefore, it is proba-le that the specimen thickness effects reported in these studiesannot be extended to macroscopic NS tensile specimens wherehe specimen thickness is larger than 100 �m. Furthermore, theauge length of the standard ASTM tensile specimen affects only
he post-necking strain and not the portion of the stress–strainurve prior to necking but for specimens deviating from ASTMtandard geometries the influence of gauge length remains to bestablished.ig. 1. (a) Optical metallographic image of the Cu sample showing coarse grains decorapecimen of the Cu showing a surface root mean square (RMS) roughness of about 50 nm
Engineering A 525 (2009) 68–77 69
In recent studies it was demonstrated, using both experimentsand finite element modeling (FEM), that apparent tensile spec-imen dimension/geometry effects are significant in the case ofultrafine grained (UFG) Cu [51]. Specifically, it was reported thatthe post-necking elongation increases significantly with increas-ing specimen thickness and decreasing gauge length. The thicknesseffect is caused primarily by the necking geometry and fracturemodes whereas the gauge length effect originates from the straindefinition. With a decrease in thickness, the gauge part is effectivelytransformed from a bulk to a sheet geometry and the stress statewithin the gauge changes from a more or less bi-axial condition toa uni-axial stress state under tension, thereby resulting in a changefrom diffuse necking to localized necking [52–54]. However, in thisstudy it was difficult to reveal any effects from specimen dimen-sions and strain measurement methods on the uniform elongationbecause there was essentially an absence of any uniform elongationin the UFG Cu [51]. Other investigators have reported that ductilityincreases with increasing specimen thickness and decreasing gaugelength [55–58] but there are no systematic analyses of these trends.
In the present study, we critically evaluate the possible influ-ences of strain measurement methods and specimen dimensionson both the uniform elongation and the post-necking elongationbehavior. We used coarse-grained (CG) Cu for this study becauseits large uniform elongation makes it easier to study the size effectbefore the onset of necking. First, we investigate the effects ofspecimen thickness and gauge length via experimentation com-bined with FEM, with the strain values established on the basisof crosshead displacement. Second, we establish the influence ofspecimen geometry on tensile results via FEM with the strain val-ues established based on the actual gauge elongation. Although noexperimental measurements of strain from the gauge section wereperformed in this study, the FEM analysis of the strains measuredfrom the gauge section is valid and sufficient to give information onthe effects of the strain measurement methods on the stress–straincurves. In practice, it will be shown that the stress–strain curvespredicted by FEM agree well with those measured experimentallyfor strains determined from the crosshead displacements. Finallywe analyze the experimental errors in strain measurements from
the crosshead displacement and discuss the origins of specimendimension effects. Our overall objective is to recommend guide-lines regarding the experimental characterization of mechanicalproperties using small-scale samples.ted with a high density of annealing twins. (b) Surface topography of the tensile, as measured by atomic force microscopy (AFM).

70 Y.H. Zhao et al. / Materials Science and Engineering A 525 (2009) 68–77
Fig. 2. (a) Dog-bone specimen model used to simulate the geometric effects on themeasured stress–strain behavior under nominally uni-axial tension. In this model,trt
2
fglhmcwtstaarbrflprawtw
Fig. 3. Experimental (a and b) and FEM simulated (c) tensile stress–strain curves ofcoarse-grained Cu showing the thickness T effect. The tensile specimens have a gauge
he width is fixed at 2.0 mm, and the size of the fillets is fixed at 3.0 mm (curvatureadius). (b) Stress–strain behavior of the simulated material. The material is assumedo exhibit bi-linear constitutive behavior.
. Experimental
The as-received pure copper (99.99%) rod was annealed at 500 ◦Cor 3 h in an argon atmosphere to promote the formation of a coarserain structure with an average grain size of about 50 �m as estab-ished by optical metallographic analyses and shown in Fig. 1a. Aigh density of annealing twins, with spacings ranging from severalicrometers to tens of micrometers, was observed within these
oarse grains. Flat dog-bone specimens with different dimensionsere then sectioned using electro-discharge machining (EDM). In
his study, we studied a range of specimen dimensions. First, thepecimen thickness (T) was varied from ∼250 �m to ∼2.0 mm whilehe gauge length (L) and width (W) were maintained constant at 1.0nd 2.0 mm, respectively. Second, L was varied from 1.0 to 10.0 mmnd T and W were maintained constant at 250 �m and 2.0 mm,espectively. Two sets of samples were prepared for every com-ination of T and L in order to ensure reproducibility of results. Theadius of the fillets of all specimens was maintained at 3 mm. Theat surfaces of the dog-bone specimens were polished using SiCapers with a final FEPA standard grit size of 4000 to yield a surfaceoot mean square (RMS) roughness of about 50 nm as measured by
tomic force microscopy (AFM) and shown in Fig. 1b. Tensile testsere performed using a Shimadzu Universal Tester with an ini-ial quasi-static strain rate of 1.0 × 10⁻³ s−1. Measurements of strainere derived based on the crosshead displacements.
length L of 1 mm. The different thicknesses are indicated in the figures. The truestress–strain curves (b) were transferred from the engineering stress–strain curves(a). The input stress–strain curve in FEM simulation was indicated by a dashed linein part (c).
In parallel with the experimental analysis, FEM was used to
simulate the effect of specimen size/geometry and the strain mea-surement method on the tensile behavior of dog-bone specimensunder nominally uni-axial tension. The dog-bone specimen modelused for the FEM simulations is shown in Fig. 2a. In this model, the
Y.H. Zhao et al. / Materials Science and Engineering A 525 (2009) 68–77 71
Fct
wfiooesm1t
ig. 4. Experimental (a and b) and FEM simulated (c) tensile stress–strain curves ofoarse-grained Cu showing the gauge length L effect. The tensile specimens have ahickness T of 250 �m. The different values of L are indicated in the figures.
idth is fixed at 2.0 mm and the fillet or curvature radius is 3.0 mmor all samples. Four gauge lengths of 1.0, 2.0, 4.0 and 10.0 mm werenvestigated at a constant T of 250 �m and four specimen widthsf 250, 500, 800 and 2000 �m were investigated at a constant Lf 1.0 mm. In order to maintain the analysis tractable, we consid-
red a material of ideal bi-linear constitutive behavior with thetress–strain curve displayed by Fig. 2b. The yield strength of theodel material was taken as 44 MPa with an elastic modulus of10 GPa, and a strain-hardening modulus, representing the slope ofhe second plastic portion of the stress–strain curve, of 100 MPa as
Fig. 5. Thickness T (a) and gauge length L (b) effects on elongation to failure εef ,uniform elongation εue and post-necking elongation εpe of the CG Cu with L = 1 mmand T = 250 �m, respectively, as indicated in the figures.
measured experimentally. This ideal bi-linear material was used asthe input for the FEM modeling and we assumed that the left endof the specimen was fixed with a velocity load applied to the rightend. In this study we compared two ways of measuring elongationof the specimen �l: using the crosshead displacement as in theexperiments and using the gauge length elongation.
The ABAQUS software was used to perform the FEM simulations.The surface topography of the tensile specimens was establishedusing a Nanoscope®IIIa Scanning Probe Microscope operating in atapping mode. The fracture surface observations were performedusing an FEI XL-30 SFEG Scanning Electron Microscopy (SEM) oper-ating at a voltage of 25 kV.
3. Results
3.1. Strain derived from crosshead displacement
3.1.1. The results in tensionFig. 3 shows the experimentally measured engineering (Fig. 3a)
and true (Fig. 3b) stress–true strain curves as well as the FEMsimulated true stress–true strain curves (Fig. 3c) of the Cu sam-ples with the strain derived from the crosshead displacementwith an L of 1.0 mm and, as indicated, different values of T.The experimental true stress–strain curves (Fig. 3b) were trans-

72 Y.H. Zhao et al. / Materials Science and Engineering A 525 (2009) 68–77
Table 1The thickness T effect on uniform elongation εue , the post-necking elongation εpe
and elongation to failure εef of the CG Cu.
T (�m) εef (%) εpe (%) εef (%)
250 188 34 154350 205 41 164770 241 64 177
2100 302 110 192
Table 2The gauge length L effect on uniform elongation εue , the post-necking elongation εpe
and elongation to failure εef of the CG Cu.
L (mm) L−1 (mm−1) εef (%) εpe (%) εue (%)
1 1 188 34 1542 0.5 112 17 95
fsutefstholnCshe(
asFtptram
FT
Table 3The thickness T effect on shear fracture angle � and area reduction RA ofCu.
T (�m) � (◦) A (%)
250 58 90350 85 91770 83 95
2100 81 96
Table 4The gauge length L effect on shear fracture angle � and area reduction RA of Cu.
L (mm) L−1 (mm−1) � (◦) A (%)
The elongation to failure εef, εue and the post-necking elongationεpe (=εef − εue) of CG Cu are shown in Fig. 5a and b as a functionof T and L and listed in Tables 1 and 2, respectively. From Fig. 5a,the effect of specimen thickness (T) on elongation to failure can beprincipally attributed to its effect on the post-necking component.
4 0.25 69 6 6310 0.1 46 5 41
erred from the engineering stress–strain curves (Fig. 3a). For allamples, both experimental and FEM simulation revealed largeniform deformation accompanied by evident strain hardening inhe CG Cu in tension leading to a large overall tensile ductility orlongation to failure. This behavior is typical for coarse-grainedace-centered cubic (f.c.c.) metals due to their high dislocationtorage capability. Specifically, with increasing thickness bothhe necking portion (post-necking elongation) and the strain-ardening part (uniform elongation) in the stress–strain curvesf the CG Cu are prolonged to a higher strain resulting in a
arger overall ductility (Fig. 3a and b). However, there is no thick-ess effect on the yield strength or the strain-hardening rate ofu within the thickness range studied in these experiments. Allamples have yield strengths of about 44 MPa and similar strain-ardening rates. The results of the FEM simulations reveal thicknessffects which correspond closely to those observed experimentallyFig. 3c).
The gauge length effects on the experimental engineering (4a)nd true (4b) stress–strain curves and the FEM simulated truetress–strain curves (4c) of CG Cu with a T of 250 �m are shown inig. 4. A reduction in gauge length prolongs the stress–strain curveso higher fracture strains or higher apparent ductility primarily byrolonging the uniform elongations. Moreover, with decreasing L,he rate of strain hardening decreases. However, the yield strengthemains independent of L with a constant value of about 44 MPa for
ll samples. It is evident that the FEM simulations and the experi-ental results are consistent with each other.ig. 6. Tensile fractured specimens with L = 1 mm and different thicknesses (a), and= 250 �m and different gauge lengths (b), as indicated in the figures.
1 1 58 902 0.5 62 934 0.25 65 91
10 0.1 59 93
The uniform elongation εue can be determined using the Consid-ère’s criterion [53] governing the onset of localized deformation:(
∂�
∂ε
)ε̇
= � (1)
Fig. 7. Thickness (a) and gauge length (b) effects on fracture surface area reductionand shear failure angle of the CG Cu with L = 1 mm and T = 250 �m, respectively, asindicated in the figures.

Y.H. Zhao et al. / Materials Science and Engineering A 525 (2009) 68–77 73
F �m (i ) andi
BfovcdamεL
3
eifait
ig. 8. SEM images of the fracture orientations of the CG Cu with L = 1 mm and T = 250mages of (a) and (b) near fracture, respectively. (c) and (f) are magnified images of (as found to occur in the gauge corner parts.
y increasing T from 250 �m to 2100 �m, εpe increases significantlyrom 34 to 110%, and εue increases from 154 to 192% resulting in anverall increase in εef from 188 to 302%. However, from Fig. 5b theariation of the uniform elongation versus L reveals a dominantontribution to the overall variation of the elongation to failure. Byecreasing L from 10 to 1 mm, εef is increased from 46 to 188% withdominant contribution from εue (increased from 41 to 154%) and ainor contribution from εpe (increased from 5 to 34%). All values of
ef, εue and εpe reveal a consistent proportional relationships with−1.
.1.2. The fracture surface morphology and fracture modeIn order to understand the above specimen size and geometry
ffects on the tensile behavior of the CG Cu, it is necessary to crit-
cally examine the failure characteristics. Fig. 6 shows the tensileractured samples with L = 1 mm and different values of T (Fig. 6a)nd with T = 250 �m and different values of L (Fig. 6b). From Fig. 6at is seen that the specimen thickness critically influences the frac-ure mode. With increasing thickness, the fracture mode of the CGa–c), and with L = 1 mm and T = 2100 �m (d–f), respectively. (b) and (e) are magnified(b) near gauge corner parts marked by “c” and “f”, respectively. Evident deformation
Cu changes from shear to normal tensile fracture. However, fromFig. 6b it is seen that the gauge length has no apparent influence onthe shear fracture mode of the CG Cu with T of 250 �m.
We also performed detailed SEM observations on the size effectof the fracture mode as well as the fracture surfaces. The T and Leffects on the shear fracture angle, �, between the fracture planeand the loading axis are plotted in Fig. 7 from the SEM observationsand they are listed in Tables 3 and 4, respectively. It is evident thatthe shear fracture angle increases from 58◦ to 85◦ with increasingT from 250 to 350 �m (Fig. 7a) but thereafter it remains unchangedwith increasing T up to a value of 2.1 mm. On the other hand, �remains constant at approximately 58–65◦ when L varies from 1to 10 mm with T = 250 �m (Fig. 7b). These results demonstrate thatthinner samples are more susceptible to shear failure and that the
gauge length has no evident influence on the failure mode.Fig. 8 shows some typical side-view SEM images of fracturedtensile specimens at different magnifications with L = 1 mm andT = 250 �m (Fig. 8a–c) and with L = 1 mm and T = 2.1 mm (Fig. 8d–f),respectively. It is evident that, with the exception of the shear frac-

74 Y.H. Zhao et al. / Materials Science and Engineering A 525 (2009) 68–77
F (a ani respec
tawabfaadosw
frbuaal
tLcstmuTcwrgti
ig. 9. SEM images of the fracture surfaces of the CG Cu with L = 1 mm and T = 250 �mmages of (a) and (b) to show dimple size and morphology in the fracture surfaces,
ures (Fig. 8a), the pre-polished specimen surfaces become irregularfter tension and the extent of the surface irregularities increaseith increasing T and in areas closer to the fracture point (Fig. 8a
nd d). Multiple slip bands are visible at high magnifications withand-to-band distances of several micrometers from areas near theracture point (Fig. 8b and e) to the gauge corners (Fig. 8c and f),s highlighted by the arrows. The original equiaxed grains with anverage size of about 50 �m are elongated significantly upon plasticeformation by slip and, in addition, different grains with differentrientations coalesce giving rise to uneven surfaces. The rougherurfaces in the thicker specimens suggest a larger deformation,here this is consistent with the measured higher ductilities.
The T and L effects on the surface area reduction, RA%, as obtainedrom SEM results are also plotted in Fig. 7 and listed in Tables 3 and 4,espectively. It is evident that RA% increases slightly from 90 to 96%y increasing T from 250 to 2100 �m (Fig. 7a) whereas RA% remainsnchanged at approximately 90–93% when L varies from 1 to 10 mmnd T = 250 �m (Fig. 7b). These results suggest that thicker samplesre susceptible to necking and a larger RA% value but the gaugeength has no evident influence on the necking behavior.
Fig. 9 shows typical SEM images of the fracture surfaces ofhe tensile specimens with L = 1 mm and T = 250 �m (a and b) and= 1 mm and T = 2.1 mm (c and d), respectively. It appears that thehange in tendency towards necking with T originates from thepecimen geometry or more specifically from the T/W ratio. Forhin, sheet-like specimens where T/W is small, necking occurs pri-
arily along the direction of T (Fig. 9a); but when T/W is close tonity or T is comparable to W, necking occurs in both the W anddirections (Fig. 9c). A close examination of the SEM images indi-
ates that when T = 2.1 mm necking reduces the thickness and the
idth by 80% resulting in an RA% of 96%. When T = 250 �m, neckingeduces the thickness by 87% but the width only by about 25% toive a value for the RA% of 90%. Large necking at T = 2.1 mm leadso a rougher cross-sectional surface and a larger necking lengthn the tensile direction (Fig. 8a and c), giving rise to a prolonged
d b), and L = 1 mm and T = 2100 �m (c and d), respectively. (b) and (d) are magnifiedtively.
post-necking strain in the stress–strain curves (Fig. 3). Fig. 9b and dshows the magnified fracture surfaces for specimens with L = 1 mmand T = 250 �m and L = 1 mm and T = 2.1 mm, respectively. Elongateddimples are observed in thinner specimens caused by shear frac-ture in contrast with the rounded dimples in thicker specimens asa result of normal fracture.
3.2. The strain measured from the gauge section
From the above experimental and FEM results, it is apparent thatthe strain derived from the crosshead displacement is significantaffected by the specimen dimensions (both thickness and gaugelength). It is usually considered that the gauge length of ASTM stan-dard tensile specimen affects only the post-necking elongation andhence there should be no influence on the uniform elongation priorto necking. Therefore, it is possible that the experimental effects ofspecimen dimensions on uniform elongation may be caused by anerror in strain on the basis of the crosshead displacement. To clar-ify this problem, FEM simulations were undertaken to establish theeffect of the specimen dimensions using strain values determinedfrom the gauge length elongations.
Fig. 10 shows the FEM results of the thickness T effect on thetrue stress–strain curves of the CG Cu with the strain measuredfrom the gauge length elongation with L = 1 mm. It is apparentthat the uniform elongation is independent of T and, furthermore,that T has influence only on the post-necking elongation. The error(εCH − εGE)/εGE in the strain measurement based on the crossheaddisplacement (εCH) relative to that from the gauge length elonga-tion (εGE) is shown in Fig. 10(b) and it is apparent that the error maybe as large as four times the value of εGE.
Fig. 11 shows the FEM results of the effects of the gauge length Lon the true stress–strain curves of CG Cu with the strain measuredby the gauge length elongation and T = 250 �m. These plots showthat the uniform elongation is also independent of L and, as withT, L influences only the post-necking elongation. Fig. 11(b) shows

Y.H. Zhao et al. / Materials Science and Engineering A 525 (2009) 68–77 75
Fig. 10. (a) FEM simulated results of the thickness T effect on true stress–straincTce
tTtL
4
4
tlicstLptFbste
Fig. 11. (a) FEM simulated results of the gauge length L effect on true stress–strain
the upper plane of the gauge section. However, when T is equal to800 and 2000 �m, shear deformation is also observed on the sideplane of the gauge region as shown in Fig. 12(c) and (d). The inter-action of the two series of shear bands at the upper and side planes
urves of the CG Cu with strain measured by gauge length elongation and L = 1 mm.he different thicknesses are indicated in the figure. (b) Error (εCH − εGE)/εGE of usingrosshead displacement to calculate strain εCH compared with using gauge lengthlongation to calculate strain εGE .
he error (εCH − εGE)/εGE for using εCH compared with using εGE.hus, the error increases with decreasing L and may be as large ashree times the value of εGE. Nevertheless, even for the situation of= 10 mm, the error remains at about 10% of εGE.
. Discussion
.1. Strain measurements using the gauge length elongation
On the basis of the above results, if the strain is determined usinghe gauge length elongation, the specimen thickness and the gaugeength affect only the post-necking elongation which increases withncreasing T and decreasing L. The effect of T may be explained by ahange in the failure mode of the CG Cu specimens as a function ofpecimen thickness and this may be further understood with assis-ance from the FEM results shown in Fig. 12. When specimens with= 1.0 mm are pulled to an engineering strain of about 175%, oneair of conjugated localized shear bands appears at the gauge cen-er of the sheet-like specimen (T/W ratio very small) as shown in
ig. 12(a). When T is 250 �m, the shear band-like structures com-ine to form a singular shear band on the upper plane of the gaugeection as illustrated in Fig. 12(b). The shear angle with respect tohe tensile direction is about 50◦, agreeing approximately with thexperimental value of ∼58◦ for CG Cu with T = 250 �m. From thecurves of the CG Cu with strain measured by gauge length elongation and T = 250 �m.The different gauge lengths are indicated in the figure. (b) Error (εCH − εGE)/εGE ofusing crosshead displacement to calculate strain εCH compared with using gaugelength elongation to calculate strain εGE .
equivalent plastic strain (PEEQ) distribution at the side plane ofthe gauge region, it is seen that shear deformation occurs only in
Fig. 12. FEM results on thickness (a–d) effects on the equivalent plastic strain (PEEQ)distribution in the specimens. Parts (a)–(d) show the PEEQ distributions of thespecimens with L = 1 mm and T equals to 0, 250, 800 and 2000 �m at about 175%engineering strain.

76 Y.H. Zhao et al. / Materials Science and
F(tP
ltm
tFnrmpttms
be
�
wtcotFwinliwili
4
coeiec
ig. 13. FEM results on gauge length (a–c) effects on the equivalent plastic strainPEEQ) distribution at the specimens. Parts (a)–(c) show the PEEQ distributions ofhe specimens with T = 250 �m and gauge lengths of 1, 2 and 4 mm at a maximumEEQ of about 0.7.
eads to a more complex stress state within the thicker specimens,hereby giving rise to the experimentally observed normal fracture
ode.These observations agree well with the SEM observations on
he fracture mode and fracture surface morphology as shown inigs. 6–9. In addition to the specimen geometry limitation on theecking response, the presence of surface defects, such as surfaceoughness and a localized deformation layer caused by grinding,
ay also contribute to the thickness effect in both the uniform andost-necking strain. This is because the proportional influence ofhe surface layer increases with decreasing thickness. For the CG Cu,he decreased number of grain layers across the thickness direction
ay also contribute to the thickness effect because the large grainize of 50 �m is comparable to the small specimen thickness.
The gauge length effect on the post-necking elongation maye explained using the definition of the contributions to the totallongation �l that defines the engineering strain:
l = �l1 + �l2 + �l3 (2)
here �l1 is the elastic elongation, �l2 the uniform plastic elonga-ion and �l3 the plastic elongation by necking. For the CG Cu, theontributions from �l1 are usually negligible. The post-loading SEMbservations suggest that the gauge length has no evident effect onhe failure mode and necking process, as further verified by theEM results shown in Fig. 13. The necking area is about 2.0 mm inidth which is the same as the width of the specimen. These results
mply that �l3 is independent of gauge length. Therefore, the post-ecking component �l3/l0 is inversely proportional to initial gauge
ength l0. This is further confirmed on the basis of the results shownn Fig. 5b. Both εef and εpe of the CG Cu exhibit linear relationships
ith l−10 . By extrapolating the εpe and εef versus l−1
0 curves to l−10 = 0,
t is found that εpe ≈ 0 and εef ≈ 30% (εue). This means that an infinite0 tends to nullify the post-necking strain so that the failure strains then equal to the uniform strain.
.2. The error in strain from the crosshead displacement
The preceding results show that the strain derived from theross-head displacement shows a significant dimensional influence
n the uniform elongation of the CG Cu: specifically, the uniformlongation increases with decreasing gauge length and increas-ng specimen thickness. However, FEM simulations verify that thisffect of the specimen dimension on the uniform elongation isaused by the error in the strain measurement. This error in theEngineering A 525 (2009) 68–77
measured global strain has two sources: one is from the machinecompliance of the loading frame, �l4, and the other is from thedeformation of the gauge corner region, �l5, so that Eq. (2) isreplaced with
�l = �l1 + �l2 + �l3 + �l4 + �l5 (3)
As shown in Fig. 8, the specimen surface at the gauge cornerregion also becomes rough and at higher magnification multi-slipevents occur in the corner part (Fig. 8c and f). This is further con-firmed by the FEM results in Figs. 12 and 13. Relatively high PEEQstrain is also identified in the corner region. The strain contributionfrom the deformation of the gauge corner region (with elonga-tion �l5) should be increased with increasing thickness, resultingin an increased uniform elongation versus thickness (Fig. 3). It isnoted that �l4 is a constant for a given machine and material (CGCu) and increasing the gauge length can mitigate the strain errorand cause a decrease in uniform elongation with increasing gaugelength (Fig. 4).
It is evident that strain measurements can be accurately estab-lished by using extensometers of various types. For small samples,special techniques based on laser interferometry have been devel-oped [59,60]. Alternative methods include the application of adigital image correlation (DIC) technique which is now becomingincreasingly popular in experimental micro-/nano-mechanics [61].The advantage of DIC resides in its dynamic and two-dimensionalnature as well as its resolution.
Since the present testing and simulation results relate to CGCu, it is important to assess the applicability of these results tonanostructured materials. As discussed in the introduction, CG Cuwas selected as a model material because it displays a large uni-form elongation which makes it easier to study the size effecton ductility and especially the uniform elongation. By contrast,nanostructured materials processed by severe plastic deformationwere not selected for this investigation because of their smalluniform elongations which make it difficult to evaluate the sizeeffect. Despite these limitations, earlier work on nanostructured Curevealed a similar trend whereby the uniform elongation decreasedwith decreasing specimen thickness and increasing gauge lengthwhen strain was measured from the crosshead displacement (see,for example, Fig. 2 of reference [51]). The post-necking elongationand the elongation to failure decrease evidently with decreasingspecimen thickness and increasing gauge length. Thus, these resultsare in good agreement with the present results obtained from theFEM simulation and experiments using CG Cu. In addition, a sim-ilar size effect in which the elongation to failure decreased withdecreasing specimen thickness was reported also in a nanocrys-talline NiFe alloy prepared using an electrodeposition method [55].Based on this evidence, it is reasonable to anticipate that the presentconclusions, although derived from CG Cu, are equally applicable tonanostructured materials.
5. Conclusions
1. In the absence of accurate strain measurement techniques intension, such as digital image correlation technique or laserinterferometry, the strains derived based on the crossheaddisplacement may contain serious errors depending on the spec-imen geometry and size. Thus, both the uniform elongationand the post-necking elongation increase with decreasing gaugelength and increasing specimen thickness.
2. The experimental errors in strain measurements from thecrosshead displacement are attributed to the contributions ofmachine compliance of the loading frame and gauge cornerdeformation, where the latter increases with increasing thick-ness and decreasing gauge length.

e and
3
4
5
A
bw
R
[
[
[[[
[
[[[
[
[[
[
[
[
[[[[[[
[[[
[
[[[[
[[[[[[[[[[
[
[[
[[[[[
Mater. 283 (2000) 1014–1017.
Y.H. Zhao et al. / Materials Scienc
. The strain measured from the gauge length elongation is influ-enced by the specimen dimensions so that the post-neckingelongation increases with decreasing gauge length and increas-ing specimen thickness.
. The results show that the strain is most readily measured fromthe gauge length elongation and the extent of uniform elonga-tion should be used for comparisons of the tensile ductilities ofmaterials having different dimensions.
. The results demonstrate it would be advantageous to develop anexperimental protocol for testing miniature dog-bone specimensthat can be adopted throughout the materials science commu-nity. This would minimize measurement errors and provide anopportunity for making meaningful comparisons of experimen-tal data from different laboratories.
cknowledgements
Y.H. Zhao and E.J. Lavernia would like to acknowledge supporty the Office of Naval Research (Grant number N00014-08-1-0405)ith Dr. Lawrence Kabacoff as program officer.
eferences
[1] C.C. Koch, D.G. Morris, K. Lu, A. Inoue, MRS Bull. 24 (1999) 54–58.[2] J.R. Weertman, in: C.C. Koch (Ed.), Nanostructured Materials: Proceeding, Prop-
erties and Applications, 2nd ed., William Andrews, Norwich, New York, 2007,pp. 537–564.
[3] C.C. Koch, Scripta Mater. 49 (2003) 657–662.[4] E. Ma, Scripta Mater. 49 (2003) 663–668.[5] C.C. Koch, K.M. Youssef, R.O. Scattergood, K.L. Murty, Adv. Eng. Mater. 7 (2005)
787–794, references therein.[6] E. Ma, JOM 58 (4) (2006) 49–53, references therein.[7] Y.T. Zhu, X.Z. Liao, Nat. Mater. 3 (2004) 351–352.[8] Z. Horita, K. Ohashi, T. Fujita, K. Kaneko, T.G. Langdon, Adv. Mater. 17 (2005)
1599–1602.[9] Y.H. Zhao, X.Z. Liao, S. Cheng, E. Ma, Y.T. Zhu, Adv. Mater. 18 (2006) 2280–2283.10] Y.H. Zhao, Y.T. Zhu, X.Z. Liao, Z. Horita, T.G. Langdon, Appl. Phys. Lett. 89 (2006)
121906-1–1121906-3.11] Y.H. Zhao, J.F. Bingert, X.Z. Liao, B.Z. Cui, K. Han, A. Serhueeva, A.K. Muhkerjee,
R.Z. Valiev, T.G. Langdon, Y.T. Zhu, Adv. Mater. 18 (2006) 2494–2498.12] X.H. Chen, L. Lu, Scripta Mater. 57 (2007) 133–136.13] S. Cheng, Y.H. Zhao, Y.T. Zhu, E. Ma, Acta Mater. 55 (2007) 5822–5832.14] K.X. Tao, H. Choo, H.Q. Li, B. Clausen, J.E. Jin, Y.K. Lee, Appl. Phys. Lett. 90 (2007)
101911-1–1101911-3.
15] Y.H. Zhao, T. Topping, J.F. Bingert, A.M. Dangelewicz, Y. Li, W. Liu, Y.T. Zhu, Y.Z.Zhou, E.J. Lavernia, Adv. Mater. 20 (2008) 3028–3033.16] http://www.astm.org.17] L. Lu, Y. Shen, X. Chen, L. Qian, K. Lu, Science 304 (2004) 422–425.18] K.M. Youssef, R.O. Scattergood, K.L. Murty, J.A. Horton, C.C. Koch, Appl. Phys.
Lett. 87 (2005) 091904-1–091904-3.
[[[[[
Engineering A 525 (2009) 68–77 77
19] K.M. Youssef, R.O. Scattergood, K.L. Murty, C.C. Koch, Scripta Mater. 54 (2006)251–256.
20] R.Z. Valiev, A.V. Sergueeva, A.K. Mukherjee, Scripta Mater. 49 (2003) 669–674.21] A.V. Sergueeva, V.V. Stolyarov, R.Z. Valiev, A.K. Mukherjee, Scripta Mater. 45
(2001) 747–752.22] V.L. Tellkamp, A. Melmed, E.J. Lavernia, Metall. Mater. Trans. A32 (2001)
2335–2343.23] X.C. Luo, K. Cheng, D. Webb, F. Wardle, J. Mater. Process. Tech. 167 (2005)
515–528.24] R. Boden, M. Lehto, U. Simu, G. Thornell, K. Hjort, J.A. Schweitz, Sens. Actuators
A127 (2006) 88–93.25] B.D. Iverson, S.V. Garimella, Microfluidics Nanofludics 5 (2008) 145–174.26] U. Simu, S. Johansson, Sens. Actuators A132 (2006) 632–642.27] Y. Qin, J. Mater. Process. Tech. 177 (2006) 8–18.28] M.D. Uchic, D.M. Dimiduk, J.N. Florando, W.D. Nix, Science 305 (2004) 986–989.29] C.A. Volkert, E.T. Lilleodden, Phil. Mag. 86 (2006) 5567–5579.30] J. Biener, A.M. Hodge, J.R. Hayes, C.A. Volkert, L.A. Zepeda-Ruiz, A.V. Hamza, F.F.
Abraham, Nano Lett. 6 (2006) 2379–2382.31] J.R. Greer, W.C. Oliver, W.D. Nix, Acta Mater. 53 (2005) 1821–1830.32] A. Rinaldi, P. Peralta, C. Friesen, K. Sieradzki, Scripta Mater. 56 (2008) 511–514.33] X.D. Han, K. Zheng, Y.F. Zhang, X.N. Zhang, Z. Zhang, Z.L. Wang, Adv. Mater. 19
(2007) 2112–2118.34] H. Guo, P.F. Yan, Y.B. Wang, J. Tan, Z.F. Zhang, M.L. Sui, E. Ma, Nat. Mater. 6 (2007)
735–739.35] W. Liang, M. Zhou, Proc. Instn. Mech. Engs. C218 (2004) 599–606.36] D. Kiener, W. Grosinger, G. Dehm, R. Pippan, Acta Mater. 56 (2008) 580–592.37] T. Tabata, H. Fujita, S. Yamamoto, T. Cyoji, J. Phys. Soc. JPN 40 (1976) 792–797.38] M. Klein, A. Hadrboletz, B. Weiss, G. Khatibi, Mater. Sci. Eng. A319 (2001)
924–928.39] A. Hadrboletz, B. Weiss, G. Khatibi, Int. J. Fract. 109 (2001) 69–89.40] H.D. Espinosa, B.C. Prorok, B. Peng, J. Mech. Phys. Solids 52 (2004) 667–689.41] G. Simons, C. Weippert, J. Dual, J. Villain, Mater. Sci. Eng. A416 (2006) 290–299.42] Y. Yang, N. Yao, W.O. Soboyejo, C. Tarquinio, Scripta Mater. 58 (2008) 1062–1065.43] Q. Ma, D.R. Clarke, J. Mater. Res. 10 (1995) 853–863.44] N.A. Fleck, J.W. Hutchinson, J. Mech. Phys. Solids 41 (1993) 1825–1857.45] Z.P. Bazant, S.D. Pang, PNAS 103 (2006) 9434–9439.46] H.M. Zbib, E.C. Aifantis, Scripta Mater. 48 (2003) 155–160.47] K. Sieradzki, A. Rinaldi, C. Friesen, P. Peralta, Acta Mater. 54 (2006) 4533–4538.48] G. Dehm, C. Motz, C. Scheu, H. Clemens, P.H. Mayrhofer, C. Mitterer, Adv. Eng.
Mater. 8 (2006) 1033–1045.49] G.P. Zhang, C.A. Volkert, R. Schwaiger, P. Wellner, E. Arzt, O. Kraft, Acta Mater.
54 (2006) 3127–3139.50] Y. Xiang, J.J. Vlassak, Acta Mater. 54 (2006) 5449–5460.51] Y.H. Zhao, Y.Z. Guo, Q. Wei, A.M. Dangelewicz, C. Xu, Y.T. Zhu, T.G. Langdon, Y.Z.
Zhou, E.J. Lavernia, Scripta Mater. 59 (2008) 627–630.52] A.K. Ghosh, W.A. Backofen, Metall. Trans. 4 (1973) 1113–1123.53] G.E. Dieter, Mechanical Metallurgy, McGraw-Hill, New York, 1986.54] A.K. Ghosh, Metall. Trans. 5 (1974) 1607–1616.55] H. Wei, G.D. Hibbard, G. Palumbo, U. Erb, Scripta Mater. 57 (2007) 996–999.56] Y. Kohno, A. Kohyama, M.L. Hamilton, T. Hirose, Y. Katoh, F.A. Garner, J. Nucl.
57] Y. Ma, T.G. Langdon, Metall. Mater. Trans. A25 (1994) 2309–2311.58] K. Decamp, L. Nauvineau, J. Besson, A. Pineau, Inter. J. Fracture 88 (1997) 1–18.59] W.N. Sharpe, B. Yuan, R.L. Edwards, J. Microelectromech. Syst. 6 (1997) 193–199.60] K.J. Hemker, W.N. Sharpe, Annu. Rev. Mater. Res. 37 (2007) 93–126.61] G. Vendroux, W.G. Knauss, Exp. Mech. 38 (1998) 86–92.