CCEA GCSE Specimen Assessment Materials for - Biology
208
CCEA GCSE Specimen Assessment Materials for Biology For first teaching from September 2017 For first assessment in Summer 2018 For first award in Summer 2019 Subject Code: 1010 GCSE
-
Upload
khangminh22 -
Category
Documents
-
view
2 -
download
0
Transcript of CCEA GCSE Specimen Assessment Materials for - Biology

CCEA GCSE SpecimenAssessment Materials for
Biology
For first teaching from September 2017For first assessment in Summer 2018For first award in Summer 2019Subject Code: 1010
GCSE


ForewordCCEA has developed new specifications which comply with criteria for GCSE qualifications. The specimen assessment materials accompanying new specifications are provided to give centres guidance on the structure and character of the planned assessments in advance of the first assessment. It is intended that the specimen assessment materials contained in this booklet will help teachers and students to understand, as fully as possible, the markers’ expectations of candidates’ responses to the types of tasks and questions set at GCSE level. These specimen assessment materials should be used in conjunction with CCEA’s GCSE Biology specification.

BLANK PAGE

GCSE BiologySpecimen Assessment Materials
Contents
Specimen Papers 3
Unit 1: Foundation Tier 3Unit 1: Higher Tier 25Unit 2: Foundation Tier 49Unit 2: Higher Tier 75Unit 3A: Apparatus and Materials List Foundation and Higher 99Unit 3A: Candidate Practical Instruction Sheet Foundation Tier 101Unit 3A: Candidate Practical Instruction Sheet Higher Tier 103Unit 3A: Practical Skills Foundation Tier 105Unit 3A: Practical Skills Higher Tier 113Unit 3B: Practical Skills Foundation Tier 121Unit 3B: Practical Skills Higher Tier 139
Mark Schemes 155
General Marking Instructions 157Unit 1: Foundation Tier 161Unit 1: Higher Tier 167Unit 2: Foundation Tier 173Unit 2: Higher Tier 179Unit 3A: Practical Skills Foundation Tier 185Unit 3A: Practical Skills Higher Tier 187Unit 3B: Practical Skills Foundation Tier 189Unit 3B: Practical Skills Higher Tier 195

Subject Code 1010
QAN 603/1371/7
A CCEA Publication © 2017
You may download further copies of this publication from www.ccea.org.uk

SPECIMEN PAPERS


Centre Number
Candidate Number
General Certificate of Secondary Education2018
For Examiner’s use only
Question Number
Marks
1
2
3
4
5
6
7
8
9
10
11
TotalMarks
TIME1 hour 15 minutes.
INSTRUCTIONS TO CANDIDATESWrite your Centre Number and Candidate Number in the spaces provided at the top of this page.Write your answers in the spaces provided in this question paper.Answer all questions.
INFORMATION FOR CANDIDATESThe total mark for this paper is 75.Figures in brackets printed down the right-hand side of pages indicate the marks awarded to each question or part question.Quality of written communication will be assessed in Question 5.
Biology
[CODE]SPECIMEN PAPER
Unit 1
Foundation Tier
3
Examiner Only
Marks Re-mark
4
1 The diagram below shows the respiratory system.
From ‘GCSE Biology 2nd Edition’ by James Napier. © James Napier 2011. Reproduced by Permission of Hodder Education
Look at the diagram above.
(a) Name parts A, B and C. A [1]
B [1]
C [1]
(b) What is the function of D?
[1]

Examiner Only
Marks Re-mark
5
2 (a) On the diagram below, draw a line to link each ecological term with its description.
The number of organisms of the same species in an area.
The feeding relationships between the organisms in an area.Biodiversity
The surroundings an organism lives in.Population
A measure of the number and types of organisms in an area.
DescriptionEcological term
[2]
Examiner Only
Marks Re-mark
6
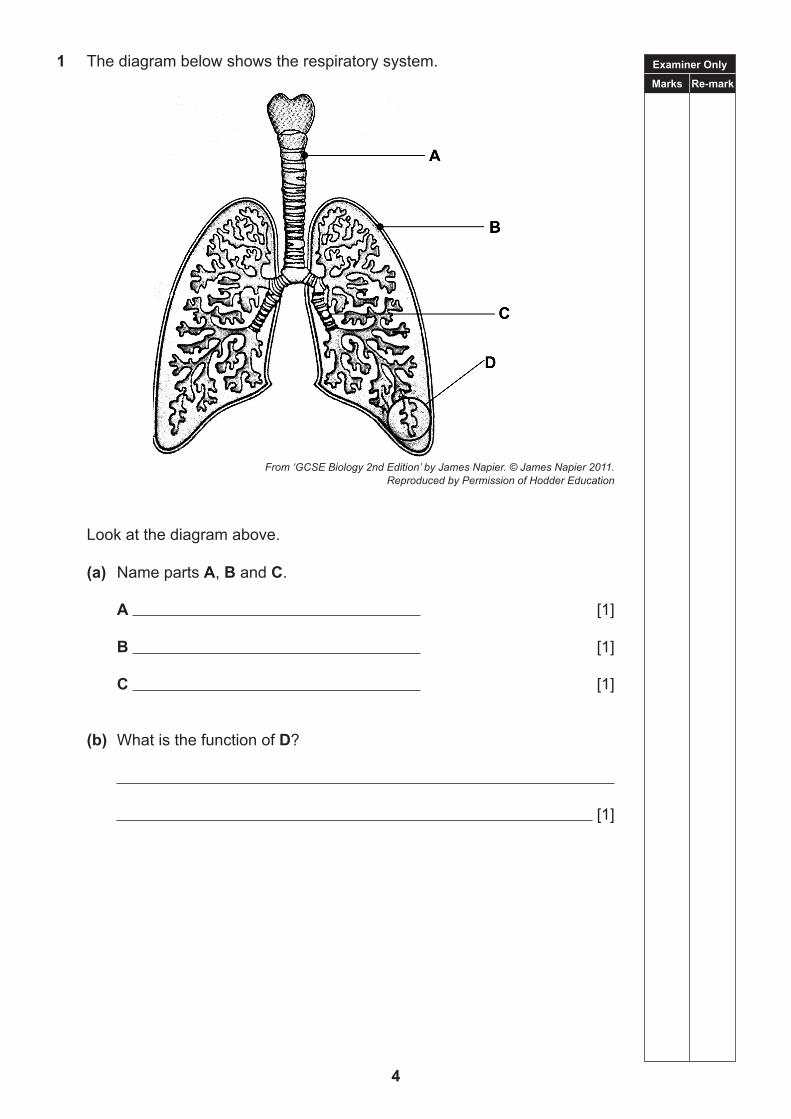
(b) The photograph below shows a red ruffed lemur.
© mjf795/iStock/Thinkstock
The red ruffed lemur is only found in the north east of Madagascar.
It spends most of its time in the tops of tall rainforest trees where it feeds on the vegetation and builds nests for its offspring.
(i) What is the habitat of the red ruffed lemur?
[1]
The red ruffed lemur is classified as a Critically Endangered species.
This is because a population decrease of 80% is likely over a 24-year period.
The red ruffed lemur population is 50 000 individuals.
(ii) Calculate the number of individuals remaining after 24 years.
Show your working.
[2]

Examiner Only
Marks Re-mark
7
3 The diagram below shows an animal cell.
Look at the diagram above.
(a) Name parts A and B.
A [1]
B [1]
The diagram below shows some of the structures present in a plant leaf cell.
(b) Complete the diagram above by drawing three other structures found in a leaf cell. [3]
(c) Give one way a bacterial cell differs from plant and animal cells.
[1]

Examiner Only
Marks Re-mark
8
4 The table below shows some of the main processes of the carbon cycle.
Each process either adds carbon dioxide (CO2) to the atmosphere or removes carbon dioxide (CO2) from the atmosphere.
(a) Complete the table below by placing a tick () in the correct box to show if each process adds or removes carbon dioxide.
Process Adds CO2 to atmosphere
Removes CO2 from atmosphere
Photosynthesis
Respiration
Combustion
[3]
The diagram below shows part of the carbon cycle.
carbon compounds in plants
carbon compounds in soil
carbon compounds in animals
carbon compounds in coal or oil
C
A
B
Look at the diagram above.
(b) Name A, B and C
A [1]
B [1]
C [1]

Examiner Only
Marks Re-mark
9
5 Describe and explain how a leaf is adapted for photosynthesis. In this question you will be assessed on your written communication
skills, including the use of specialist scientific terms.
[6]

Examiner Only
Marks Re-mark
10
6 The diagram below shows an investigation into the effect of one-sided light on the growth of a plant over five days.

Examiner Only
Marks Re-mark
11
Look at the diagram on the opposite page.
Over the five days the plant has bent towards the light.
(a) Give two other ways the plant in the diagram has changed during the five days.
1.
[1]
2.
[1]
(b) Describe how the plant bends towards the light.
[2]
(c) Suggest how this response is an advantage to the plant.
[2]
12
Examiner OnlyMarks Remark
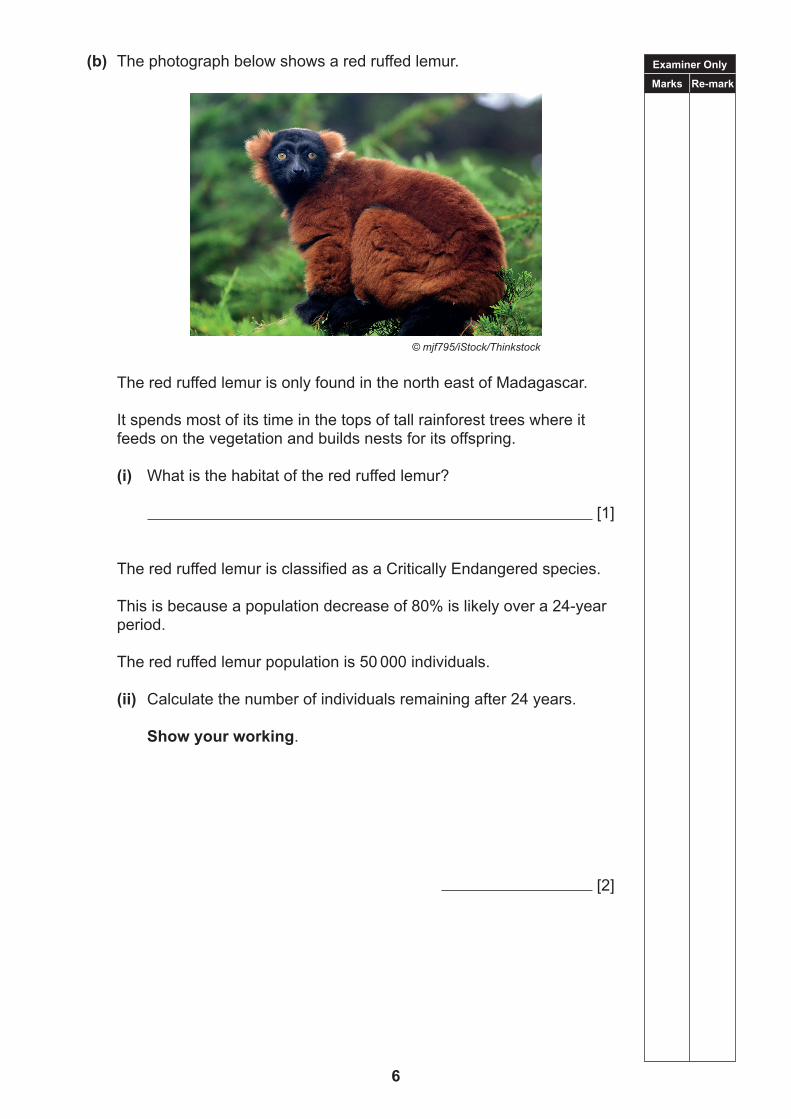
7 The central nervous system is made up of two main parts.
(a) Name these two parts.
1. [1]
2. [1]
(b) The photograph below shows how two students investigated the effect of caffeine on reaction time.
When student A released the ruler, student B caught the ruler as quickly as possible.
They recorded the distance the ruler dropped before student B caught it.
The experiment was repeated after student B drank a cup of coffee containing caffeine.
The table shows the results.
CaffeineDistance ruler dropped/mm
Test 1 Test 2 Test 3 Average
Absent 114 108 102 108
Present 41 38 35 38
© CCEA

Examiner Only
Marks Re-mark
13
(i) What was the dependent variable in this experiment?
[1]
(ii) Give two ways the students kept this a fair test.
1.
[1]
2.
[1]
(iii) Explain the reason for repeating each experiment three times and calculating an average.
[1]
(iv) Give two conclusions you can make from the results of this experiment.
1.
2.
[2]

Examiner Only
Marks Re-mark
14
8 (a) Biological molecules are made up of smaller units.
On the diagram below draw a line to link each biological molecule to the smaller units that make it up.
proteins
fats
cellulose
Biological molecule
glycerol
sugars
amino acids
Smaller unit
[2]
(b) An experiment was carried out to investigate the activity of two different enzymes at different temperatures.
The table below shows the results.
Temperature/°CEnzyme activity/arbitrary units
Enzyme A Enzyme B
0 0 0
10 24 8
20 96 22
30 66 62
40 42 80
50 20 10
60 0 0

Examiner Only
Marks Re-mark
15
The graph below shows the results for enzyme A.
Enz
yme
activ
ity/a
rbitr
ary
units
0
20
40
60
80
100
0 10 20 30 40 50 60
Temperature/°C
Enzyme A
(i) Draw the graph for enzyme B on the same axes. Plot the points accurately. Draw a line through the plotted points. [3]
(ii) Give the optimum temperature for enzyme B.
°C [1]
(iii) Enzyme A is used in biological washing powder. Suggest why.
[2]
Examiner Only
Marks Re-mark
16
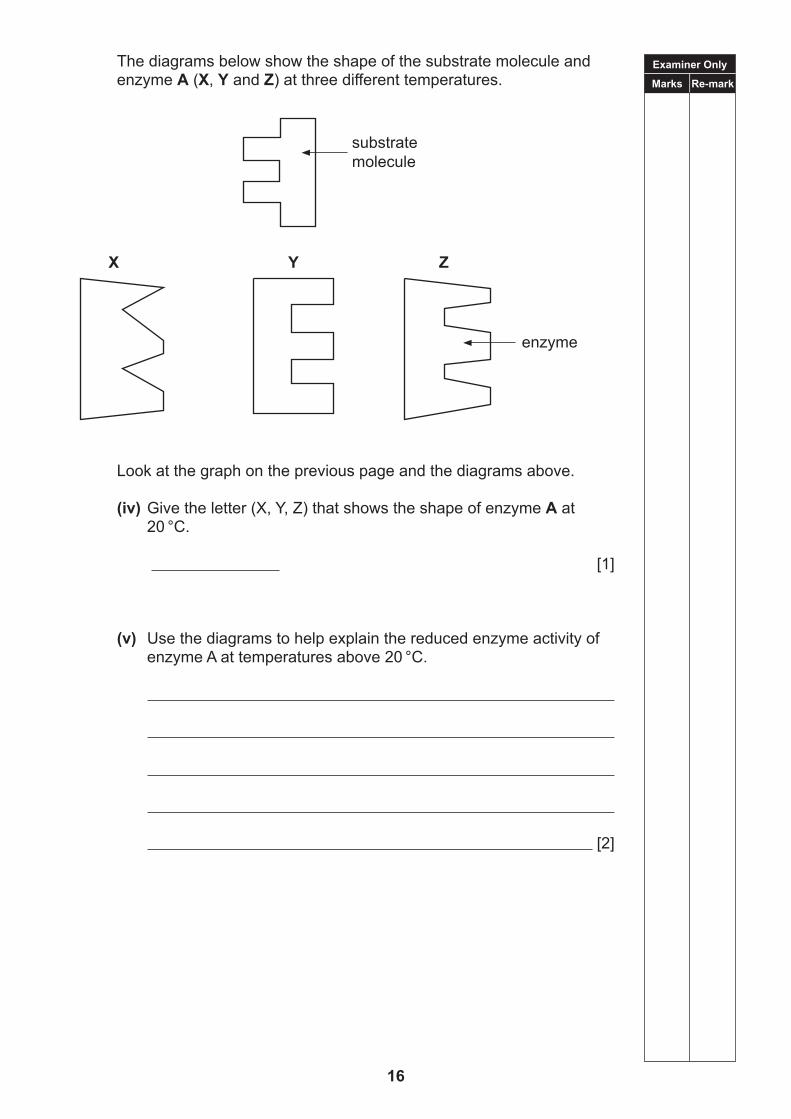
The diagrams below show the shape of the substrate molecule and enzyme A (X, Y and Z) at three different temperatures.
substratemolecule
enzyme
X Y Z
Look at the graph on the previous page and the diagrams above.
(iv) Give the letter (X, Y, Z) that shows the shape of enzyme A at 20 °C.
[1]
(v) Use the diagrams to help explain the reduced enzyme activity of enzyme A at temperatures above 20 °C.
[2]

Examiner Only
Marks Re-mark
17
9 (a) The diagram below shows a cross section of a kidney.
(i) On the diagram above draw labelled lines to show the cortex and the medulla. [2]
(ii) Which organ does the vessel labelled X on the diagram lead to?
[1]
© CCEA

Examiner Only
Marks Re-mark
18
(b) The diagram below shows the volume of water gained and lost each day by the body while at rest.
(i) Complete the diagram above by adding the total volume of water lost each day at rest. [1]
(ii) Calculate the volume of water lost through urine while at rest.
cm3 [1]
(iii) A person carried out exercise and lost 1000 cm3 of water in sweat.
Calculate the change in the volume of urine produced.
cm3 [1]
(iv) Explain how the kidney caused this change in the volume of urine.
[2]
respiration300 cm3
drink1200 cm3
food1000 cm3
Total 2500 cm3
Water gained
exhaled air400 cm3
sweat600 cm3
urine cm3
Total
Water lost

Examiner Only
Marks Re-mark
19
(v) The control of the water content of the body is an example of homeostasis.
Name this example of homeostasis. [1]

Examiner Only
Marks Re-mark
20
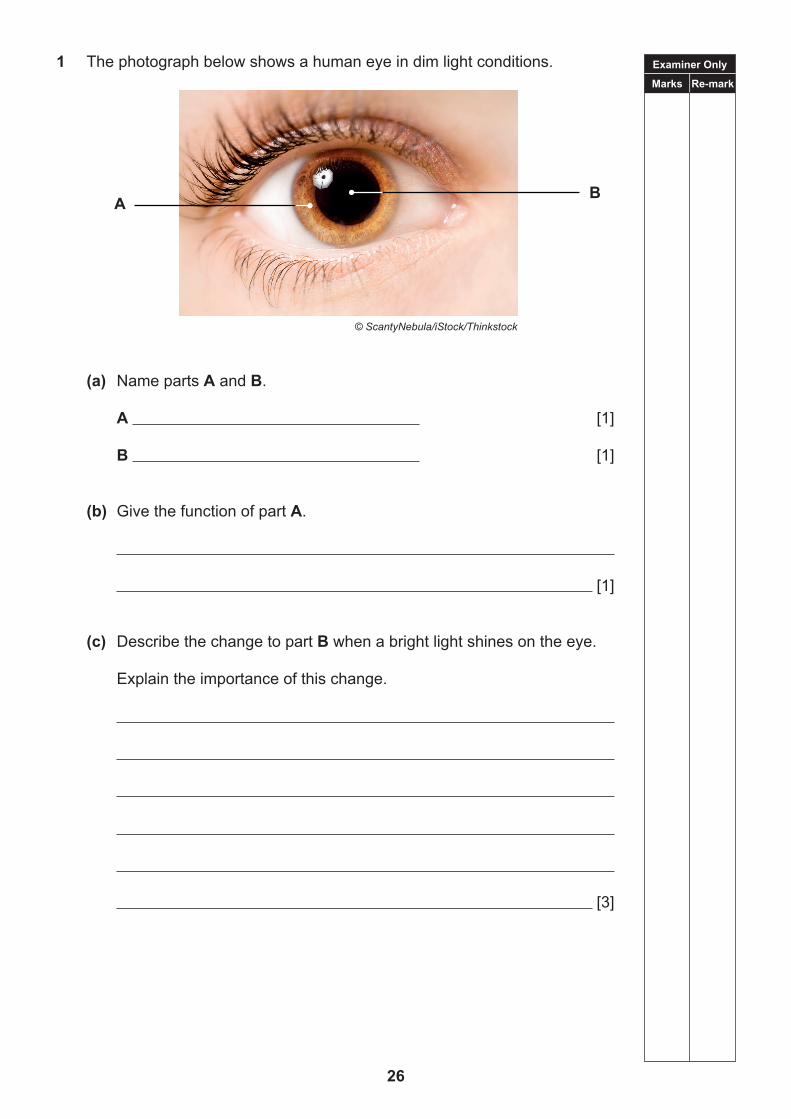
10 The photograph below shows a human eye in dim light conditions.
© ScantyNebula/iStock/Thinkstock
(a) Name parts A and B.
A [1]
B [1]
(b) Give the function of part A.
[1]
(c) (i) Describe the change to part B when a bright light shines on the eye.
[1]
(ii) Explain the importance of this change.
[2]
A B

Examiner Only
Marks Re-mark
21
11 (a) The diagram below shows part of a grassland food web.
From ‘GCSE Biology 2nd Edition’ by James Napier. © James Napier 2011. Reproduced by Permission of Hodder Education
(i) What is the original source of energy for a food web?
[1]
(ii) Name the producer in this food web.
[1]
(iii) What do the arrows in this food web represent?
[1]
(iv) Name one secondary consumer from this food web.
[1]

Examiner Only
Marks Re-mark
22
During the 1950s a disease called myxomatosis was introduced into the UK.
It was used to reduce the population of wild rabbits.
Rabbits with the disease died very quickly, often within 48 hours.
This disease may have caused a decrease or an increase in the fox population.
(b) Describe how:
foxes decrease
[1]
foxes increase
[3]

THIS IS THE END OF THE QUESTION PAPER
23

BLANK PAGE
24

Centre Number
Candidate Number
General Certificate of Secondary Education2018
For Examiner’s use only
Question Number
Marks
1
2
3
4
5
6
7
8
9
TotalMarks
TIME1 hour 15 minutes.
INSTRUCTIONS TO CANDIDATESWrite your Centre Number and Candidate Number in the spaces provided at the top of this page.Write your answers in the spaces provided in this question paper.Answer all questions.
INFORMATION FOR CANDIDATESThe total mark for this paper is 75.Figures in brackets printed down the right-hand side of pages indicate the marks awarded to each question or part question.Quality of written communication will be assessed in Question 8(b).
Biology
[CODE]SPECIMEN PAPER
Unit 1
Higher Tier
25
Examiner Only
Marks Re-mark
26
1 The photograph below shows a human eye in dim light conditions.
© ScantyNebula/iStock/Thinkstock
(a) Name parts A and B.
A [1]
B [1]
(b) Give the function of part A.
[1]
(c) Describe the change to part B when a bright light shines on the eye. Explain the importance of this change.
[3]
A B

Examiner Only
Marks Re-mark
27
2 (a) The diagram below shows part of a grassland food web.
(i) What is the original source of energy for a food web?
[1]
(ii) Name the producer in this food web.
[1]
(iii) What do the arrows in this food web represent?
[1]
(iv) Name one secondary consumer from this food web.
[1]
From ‘GCSE Biology 2nd Edition’ by James Napier. © James Napier 2011. Reproduced by Permission of Hodder Education
Examiner Only
Marks Re-mark
28
(b) During the 1950’s a disease called myxomatosis was introduced into the UK.
It was used to reduce the population of wild rabbits.
Rabbits with the disease died very quickly, often within 48 hours.
This disease may have caused a decrease or an increase in the fox population.
Describe how:
foxes decrease
[1]
foxes increase
[3]

Examiner Only
Marks Re-mark
29
3 (a) Define diffusion.
[3]
(b) The diagram below shows an experiment set up by students to investigate the effect of concentration on the rate of diffusion.
The students concluded that the higher the concentration of iodine solution the faster the rate of diffusion.
(i) Explain how the results of this experiment supported this
conclusion.
[2]

Examiner Only
Marks Re-mark
30
(ii) Explain why the Petri dishes were kept at 20 °C.
[1]

Examiner Only
Marks Re-mark
31
4 Describe and explain three ways the ileum is adapted for the absorption of digested food.
1. Description
[1]
Explanation
[1]
2. Description
[1]
Explanation
[1]
3. Description
[1]
Explanation
[1]

Examiner Only
Marks Re-mark
32
5 The diagram below shows an experiment set up to investigate gas exchange in plants.
(a) What colour is the hydrogencarbonate indicator at the start of the experiment?
[1]
© CCEA

Examiner Only
Marks Re-mark
33
The table below shows the results of the experiment after 24 hours in the bright light.
Tube Light conditions
Colour of the hydrogencarbonate
indicator after 24 hours
Photosynthesis Respiration
A Bright Purple Yes
B Dim Red Yes
C No Yes
(b) Complete the table above. [4]
(c) Explain why the hydrogencarbonate indicator turned purple in tube A.
[2]

Examiner Only
Marks Re-mark
34
6 (a) Stem cells are simple cells present in plants and animals.
(i) Why are stem cells useful in medicine?
[2]
The diagram below shows stem cells being used to culture other types of cells.
(ii) On the diagram, draw a circle around the stem cells. [1]
(iii) Give the source of stem cells shown in the diagram.
[1]

Examiner Only
Marks Re-mark
35
(b) Read the passage on how to become a stem cell donor and use it to answer the questions that follow.
(i) Suggest why a saliva sample can be used to determine a genetic match for the patient.
[2]
DONATE YOUR STEM CELLSSign up to our register and you could be a lifesaving match for someone with blood cancer.
What does joining the register involve?If you’re between 16–30 and in good health, you can sign up to the Anthony Nolan register (you’ll stay on it until you turn 60). We’ll send you a spit kit in the post so that you can give us a quick saliva sample.
Whenever a patient with blood cancer or a blood disorder needs a lifesaving stem cell transplant, we search the register, looking for someone who’s a genetic match for that patient.
If you’re a match, we’ll be in touch, and we’ll ask you to donate if you’re still healthy and happy to do so.
© Anthony Nolan

Examiner Only
Marks Re-mark
36
(ii) The use of stem cells in medicine also has risks for the patient.
Describe two of these risks.
1.
[1]
2.
[1]

BLANK PAGE
(Questions continue overleaf)
37

Examiner Only
Marks Re-mark
38
7 (a) Give one similarity and one difference between the nervous system and the hormonal system.
Similarity
[1]
Difference
[1]
(b) The photograph below shows motor neurone cells viewed under an electron microscope.
(i) Name parts A and B.
A [1]
B [1]
(ii) Draw an arrow on structure B above to show the direction of an impulse. [1]
© Tharun15/iStock/Thinkstock

Examiner Only
Marks Re-mark
39
(iii) Use evidence from the photograph to suggest why impulses can travel very quickly in these neurones.
[1]
(iv) Describe one other way these neurones are adapted to their function.
Use evidence from the photograph to support your answer.
[1]
Many pain-relieving drugs prevent the release of a transmitter substance from the end of the sensory neurone attached to the pain receptor.
(c) Suggest how these drugs provide pain relief.
[3]

Examiner Only
Marks Re-mark
40
8 (a) The diagrams below show an experiment set up by a student to investigate the effect of nitrate on the growth of wheat seedlings.
(i) Describe and explain how the lack of nitrates affects the growth of the seedlings.
[2]
Another student set up a similar experiment using a bottle of nutrient solution that did not have a label on it.
The seedling grew slightly in the solution but its leaves were yellow.
(ii) Which mineral is likely to have been missing from the solution?
Mineral [1]
Explain your answer.
[1]
© CCEA

BLANK PAGE
(Questions continue overleaf)
41

Examiner Only
Marks Re-mark
42
(b) The photograph below shows a lake in Central Park, New York, where the surface of the water is covered with green algae.
© Barbara Vallance / iStock / Thinkstock
Water covered in green algae

Examiner Only
Marks Re-mark
43
Describe the events that caused the surface of the water to be covered with green algae.
Explain how these events could have lead to the death of aquatic animals.
In this question you will be assessed on your written communication skills, including the use of specialist terms.
[6]

Examiner Only
Marks Re-mark
44
9 (a) Diabetes is a condition in which the blood glucose regulation mechanism fails.
(i) List two symptoms of diabetes.
1.
[1]
2.
[1]
(ii) Describe two differences between Type 1 and Type 2 diabetes.
1.
[1]
2.
[1]
(b) The table below shows the blood glucose concentrations of two people after they have eaten a meal rich in carbohydrates.
Time after meal/minutes
Blood glucose concentration/mg per 100 cm3
Person A Person B
0 70 90
10 70 110
20 90 130
30 130 150
40 150 160
50 110 155
60 80 150
70 70 125

Examiner Only
Marks Re-mark
45
(i) Using the information in the table identify which person has diabetes.
Person [1]
(ii) Explain your reason.
[2]
(iii) Name the hormone responsible for the regulation of blood glucose.
[1]
(c) Explain how the regulation of blood glucose is an example of negative feedback.

Examiner Only
Marks Re-mark
46
[6]

THIS IS THE END OF THE QUESTION PAPER
47

BLANK PAGE
48

Centre Number
Candidate Number
General Certificate of Secondary Education2019
For Examiner’s use only
Question Number
Marks
1
2
3
4
5
6
7
8
9
10
11
12
13
TotalMarks
TIME1 hour 30 minutes.
INSTRUCTIONS TO CANDIDATESWrite your Centre Number and Candidate Number in the spaces provided at the top of this page.Write your answers in the spaces provided in this question paper.Answer all questions.
INFORMATION FOR CANDIDATESThe total mark for this paper is 90.Figures in brackets printed down the right-hand side of pages indicate the marks awarded to each question or part question.Quality of written communication will be assessed in Question 5.
Biology
[CODE]SPECIMEN PAPER
49
Unit 2
Foundation Tier
Examiner Only
Marks Re-mark
50
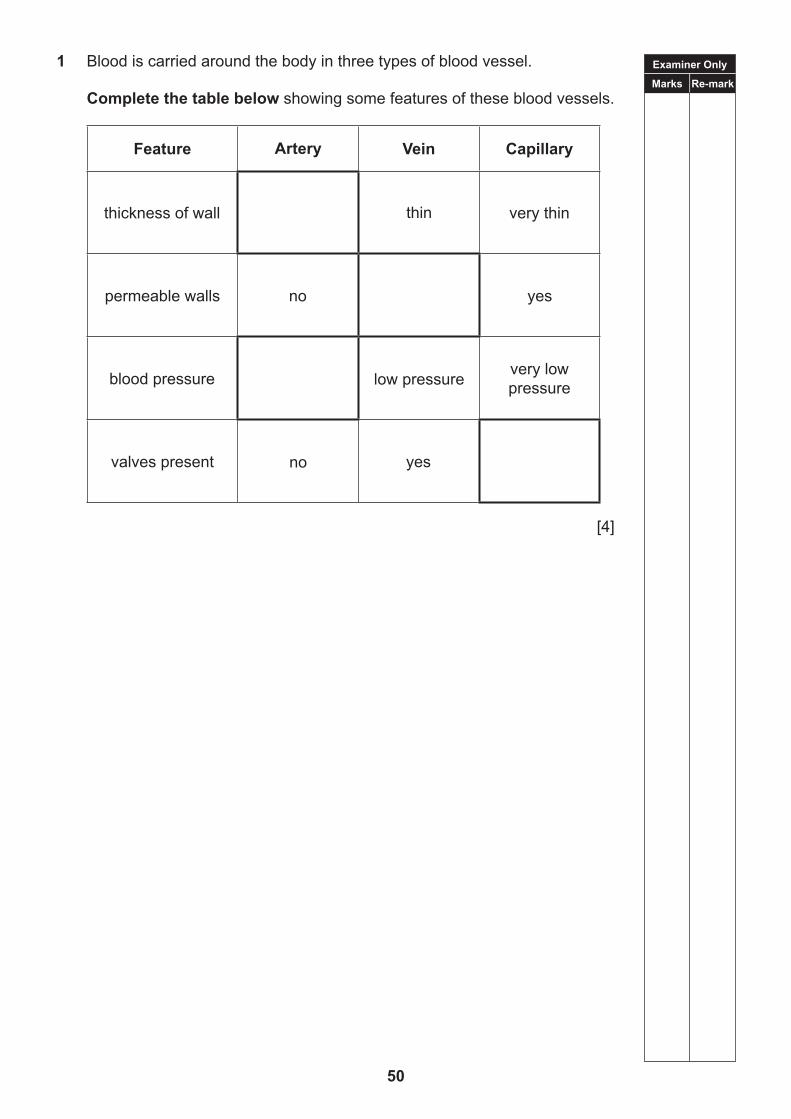
1 Blood is carried around the body in three types of blood vessel.
Complete the table below showing some features of these blood vessels.
Feature Artery Vein Capillary
thickness of wall thin very thin
permeable walls no yes
blood pressure low pressure very low pressure
valves present no yes
[4]

Examiner Only
Marks Re-mark
51
2 The diagram below shows the male reproductive system.
From ‘GCSE Single Award Science for CCEA’ BY James Napier, Alyn G McFarland, Roy White. © James Napier, Alyn McFarland, Roy White, Colin Murphy 2013. Reproduced by permission of Hodder Education
Look at the diagram above.
(a) (i) Name parts A and B. A [1]
B [1]
(ii) Give the function of C.
[1]
(b) Body temperature is 37 ºC in humans.
The ideal temperature for the production of sperm is 35 °C.
The testes are held outside the main body cavity.
Suggest why.
[2]
C
A
B

Examiner Only
Marks Re-mark
52
3 (a) Microorganisms cause many diseases.
(i) Tuberculosis is caused by a bacterium.
Describe how it is spread.
[1]
(ii) AIDS can be spread by the exchange of fluids during sexual intercourse.
What type of microorganism causes AIDS?
[1]
(iii) Fungal spores can infect potatoes through the air and from soil water.
Name one disease of potatoes caused in this way.
[1]
(b) A frozen chicken should be defrosted completely before cooking.
Explain why.
[2]

Examiner Only
Marks Re-mark
53
4 The graph below shows variation in the height of humans.
Per
cent
age
of p
opul
atio
n
1
0
2
3
4
5
6
7
8
9
10
11
12
13
14
15
16
140 145 150 155 160 165 170 175 180 185 190 195 200Height/cm
females
males
Look at the graph above.
(a) Describe two differences between the variation shown by males and females.
1.
[1]
2.
[1]

Examiner Only
Marks Re-mark
54
(b) (i) Name the type of variation shown by height.
[1]
(ii) Use data to explain your answer.
[2]
(c) One cause of variation in height of humans is genetic.
Give one other cause of variation in humans.
[1]

BLANK PAGE
(Questions continue overleaf)
55

Examiner Only
Marks Re-mark
56
5 The diagram below shows how some white blood cells help defend the body against a bacterial infection.
© CCEA

Examiner Only
Marks Re-mark
57
Use the diagram on the previous page to help describe how these white blood cells destroy bacteria.
In this question you will be assessed on your written communication skills Including the use of specialist scientific terms.
[6]

Examiner Only
Marks Re-mark
58
6 This equation is used to calculate a person’s cardiac output.
Stroke volume(volume of blood
per beat)
Heart rate(number of beats
per minute)
Cardiac output(volume of blood
per minute)× =
(a) When a person exercises, their cardiac output increases because of increases in stroke volume and heart rate.
Use the information in the equation above to complete the sentences.
(i) An increase in stroke volume means
[1]
(ii) An increase in heart rate means
[1]
(b) Explain why the body needs to increase cardiac output when exercising.
[3]
(c) Describe how regular exercise benefits the muscle of the heart.
[1]

Examiner Only
Marks Re-mark
59
7 The diagram below shows a small section of DNA from a gene.
Look at the diagram.
(a) Complete the diagram above by labelling the three blank bases. [3]
(b) Describe the shape of the part of the DNA molecule labelled X.
[1]
(c) The backbone of the DNA labelled Y is made of two types of molecule.
Draw a circle around each of the two types of molecule in the DNA
backbone.
sugar protein phosphate carbohydrate fat
[2]
(d) What is a gene?
[2]
© CCEA
T
G
A

Examiner Only
Marks Re-mark
60
8 (a) The diagram below represents the 28 days of the menstrual cycle.
On the diagram above label the section
(i) when menstruation (a period) occurs: A [1]
(ii) when the uterus lining is thickest: B [1]
An egg is released from the ovary on day 14.
(b) Explain why sexual intercourse on day 17 of the menstrual cycle is likely to cause fertilisation.
[2]

Examiner Only
Marks Re-mark
61
(c) Oestrogen is a hormone that controls the stages of the menstrual cycle.
Name one other sex hormone that controls the stages of the menstrual cycle.
[1]
(d) The table below shows the percentage of women who became pregnant while using different methods of contraception.
Look at the table above.
(i) Which method is most effective at preventing pregnancy?
Use data from the table above to support your answer.
[2]
(ii) Condoms can be used to prevent sexually transmitted infections.
Explain how.
[1]
Data adapted from https://patient.info/doctor/contraception-general-overview#ref-6 © Patient Platform Limited
Method of contraception used
Percentage of women who become pregnant
Male condom 2.00
Female condom 5.00
Contraceptive pill 0.30
Hormone implant 0.05
Natural (rhythm) 9.00
None 85.00

Examiner Only
Marks Re-mark
62
(e) Describe and explain how the contraceptive pill prevents pregnancy.
[2]

Examiner Only
Marks Re-mark
63
9 (a) Name the type of cell division involved in growth.
[1]
(b) The diagram below shows different stages during the division of a growing animal cell containing one pair of chromosomes.
Stage A Stage B Stage C Stage D
pair ofchromosomes
Look at the diagram above.
(i) Describe two differences between the cell at stages A and B.
1.
[1]
2.
[1]
(ii) Name part X.
[1]
(iii) Complete the diagram above to show the cells at stage D. [2]

Examiner Only
Marks Re-mark
64
(c) Read the passage below.
Years ago farmers in Europe wanted dairy cattle that would make the best use of grass.
They bred black dairy cattle from Germany with white dairy cattle from the Netherlands to produce the modern dairy cattle of today.
Over many generations they bred these cattle which produce large quantities of milk and calve more often.
In recent years the breeders have also been able to increase the protein content of the milk.
Use the information in the passage to answer the questions below.
(i) Give one piece of evidence from the passage to explain what is meant by selective breeding.
[3]
(ii) Give two other features which have been selected for in modern dairy cattle.
[1]
Examiner Only
Marks Re-mark
65
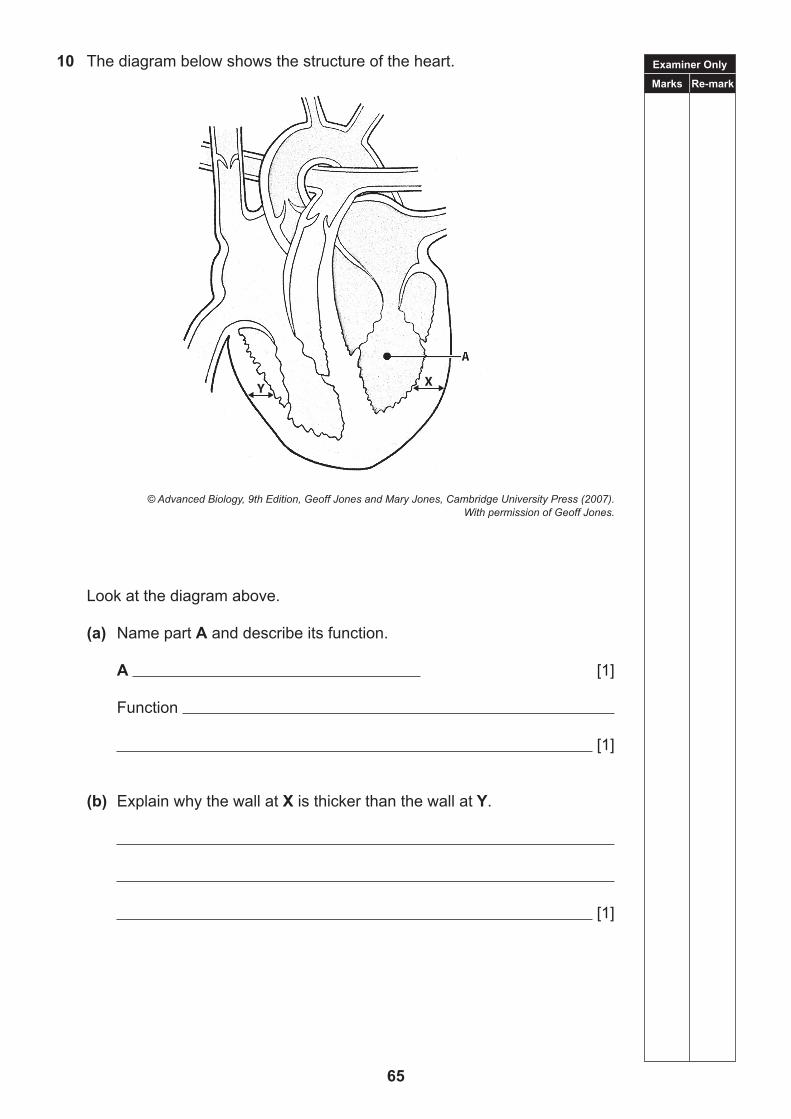
10 The diagram below shows the structure of the heart.
© Advanced Biology, 9th Edition, Geoff Jones and Mary Jones, Cambridge University Press (2007).
With permission of Geoff Jones.
Look at the diagram above.
(a) Name part A and describe its function.
A [1]
Function
[1]
(b) Explain why the wall at X is thicker than the wall at Y.
[1]

Examiner Only
Marks Re-mark
66
The graph below shows the percentage of people with unhealthy levels of cholesterol in their blood.
Data adapted from http://www.statcan.gc.ca/pub/82-625-x/2010001/article/11136-eng.htm
Look at the graph above.
(c) Describe the trend in the graph.
[1]
Per
cent
age
of p
eopl
e w
ith u
nhea
lthy
leve
ls o
f cho
lest
erol
0
10
20
30
40
50
60
70
21 to 40 41 to 60 61 to 80 80+Age group / years

Examiner Only
Marks Re-mark
67
(d) Explain how high levels of cholesterol can lead to a stroke.
[3]
Diagram A below shows a section through a normal coronary artery.
artery wall
lumen
Look at the diagram above. (e) Complete diagram B above to show a section through a coronary
artery from a heart attack victim. [2]
(f) There are a number of different treatments for heart disease.
(i) Name one drug used to reduce the risk of heart disease.
[1]
(ii) Name one type of surgery used to treat heart disease.
[1]

Examiner Only
Marks Re-mark
68
11 The table below shows the main blood vessels which carry blood to or from major organs.
(a) Complete the table below.
Blood Vessel Carries blood to or from Major organ
Aorta from Heart
to Lungs
Renal Artery
from Liver
[4]
(b) Describe two differences between the blood in the vena cava and the aorta.
1.
[1]
2.
[1]

Examiner Only
Marks Re-mark
69
12 (a) Describe osmosis.
[3]
The diagrams below show the effects of osmosis on three plant cells A, B and C.
Each of the plant cells had been placed in a different concentration of solution.
Look at the diagrams above.
(b) Complete the table below to show which plant cell was placed in each solution.
Solution Plant cell
Concentrated sugar solution
Dilute sugar solution
Water
[2]
(c) Which of the plant cells is turgid?
[1]

Examiner Only
Marks Re-mark
70
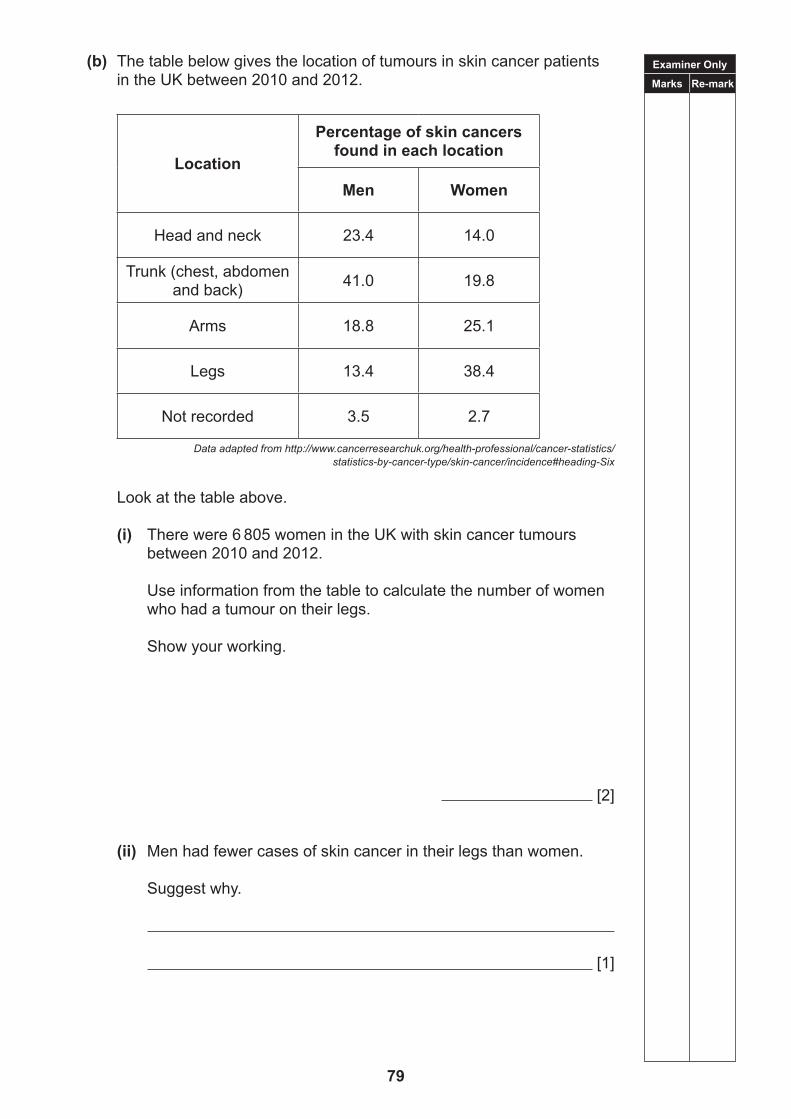
(b) The table below gives the location of tumours in skin cancer patients in the UK between 2010 and 2012.
Location
Percentage of skin cancers found in each location
Men Women
Head and neck 23.4 14.0
Trunk (chest, abdomen and back) 41.0 19.8
Arms 18.8 25.1
Legs 13.4 38.4
Not recorded 3.5 2.7
Look at the table above.
(i) There were 6 805 women in the UK with skin cancer tumours between 2010 and 2012.
Use information from the table above to calculate the number of women who had a tumour on their legs.
Show your working.
[2]
(ii) Men had fewer cases of skin cancer in their legs than women.
Suggest why.
[1]
Source: Data adapted from http://www.cancerresearchuk.org/health-professional/cancer-statistics/statistics-by-cancer-type/skin-cancer/incidence#heading-Six
13 The diagram below shows a malignant skin cancer tumour.
(a) (i) What is cancer?
[1]
(ii) Name one environmental factor that can cause skin cancer.
[1]
(iii) Why is a malignant tumour like the one in the diagram, more harmful than a benign tumour?
[1]
© Claus Lunau / Science Photo Library

Examiner Only
Marks Re-mark
71
(b) The table below gives the location of tumours in skin cancer patients in the UK between 2010 and 2012.
Location
Percentage of skin cancers found in each location
Men Women
Head and neck 23.4 14.0
Trunk (chest, abdomen and back) 41.0 19.8
Arms 18.8 25.1
Legs 13.4 38.4
Not recorded 3.5 2.7
Look at the table above.
(i) There were 6 805 women in the UK with skin cancer tumours between 2010 and 2012.
Use information from the table above to calculate the number of women who had a tumour on their legs.
Show your working.
[2]
(ii) Men had fewer cases of skin cancer in their legs than women.
Suggest why.
[1]
Source: Data adapted from http://www.cancerresearchuk.org/health-professional/cancer-statistics/statistics-by-cancer-type/skin-cancer/incidence#heading-Six

Examiner Only
Marks Re-mark
72
(iii) Suggest a reason for the difference in the percentage of skin cancers found on the trunk of men and women.
[1]

THIS IS THE END OF THE QUESTION PAPER
73

BLANK PAGE
74
Centre Number
Candidate Number
General Certificate of Secondary Education2019
For Examiner’s use only
Question Number
Marks
1
2
3
4
5
6
7
8
9
10
11
TotalMarks
TIME1 hour 30 minutes.
INSTRUCTIONS TO CANDIDATESWrite your Centre Number and Candidate Number in the spaces provided at the top of this page.Write your answers in the spaces provided in this question paper.Answer all questions.
INFORMATION FOR CANDIDATESThe total mark for this paper is 90.Figures in brackets printed down the right-hand side of pages indicate the marks awarded to each question or part question.Quality of written communication will be assessed in Question 10(b).
75
BiologyUnit 2
Higher Tier
[CODE]SPECIMEN PAPER

Examiner Only
Marks Re-mark
76
1 The table below shows the main blood vessels which carry blood to or from major organs.
(a) Complete the table.
Blood Vessel Carries blood to or from Major organ
Aorta from Heart
to Lungs
Renal Artery
from Liver
[4]
(b) Describe two differences between the blood in the vena cava and the aorta.
1
[1]
2
[1]

Examiner Only
Marks Re-mark
77
2 (a) Describe osmosis.
[3]
The diagrams below show the effects of osmosis on three plant cells A, B and C.
Each of the plant cells had been placed in a different concentration of solution.
Look at the diagrams above.
(b) Complete the table below to show which plant cell was placed in each solution.
Solution Cell
Concentrated sugar solution
Dilute sugar solution
Water
[2]
(c) Which of the plant cells is turgid?
[1]

Examiner Only
Marks Re-mark
78
3 The diagram below shows a malignant skin cancer tumour.
(a) (i) What is cancer?
[1]
(ii) Name one environmental factor that can cause skin cancer.
[1]
(iii) Why is a malignant tumour like the one in the diagram, more harmful than a benign tumour?
[1]
© Claus Lunau / Science Photo Library
Examiner Only
Marks Re-mark
79
(b) The table below gives the location of tumours in skin cancer patients in the UK between 2010 and 2012.
Location
Percentage of skin cancers found in each location
Men Women
Head and neck 23.4 14.0
Trunk (chest, abdomen and back) 41.0 19.8
Arms 18.8 25.1
Legs 13.4 38.4
Not recorded 3.5 2.7
Data adapted from http://www.cancerresearchuk.org/health-professional/cancer-statistics/statistics-by-cancer-type/skin-cancer/incidence#heading-Six
Look at the table above.
(i) There were 6 805 women in the UK with skin cancer tumours between 2010 and 2012.
Use information from the table to calculate the number of women who had a tumour on their legs.
Show your working.
[2]
(ii) Men had fewer cases of skin cancer in their legs than women.
Suggest why.
[1]

Examiner Only
Marks Re-mark
80
(iii) Suggest a reason for the difference in the percentage of skin cancers found on the trunk of men and women.
[1]

Examiner Only
Marks Re-mark
81
4 (a) The photograph below shows a blood smear.
(i) Name part A and describe its function.
A [1]
Function
[1]
(ii) Name cell B and describe one way it is adapted to its function.
B [1]
Adaptation
[1]
(b) The number of white blood cells in a person’s body can change.
(i) Suggest one reason for this change.
[1]
(ii) How would this affect the number of white blood cells in the person?
[1]
© Steve Gschmeissner / Science Photo Library
Examiner Only
Marks Re-mark
82
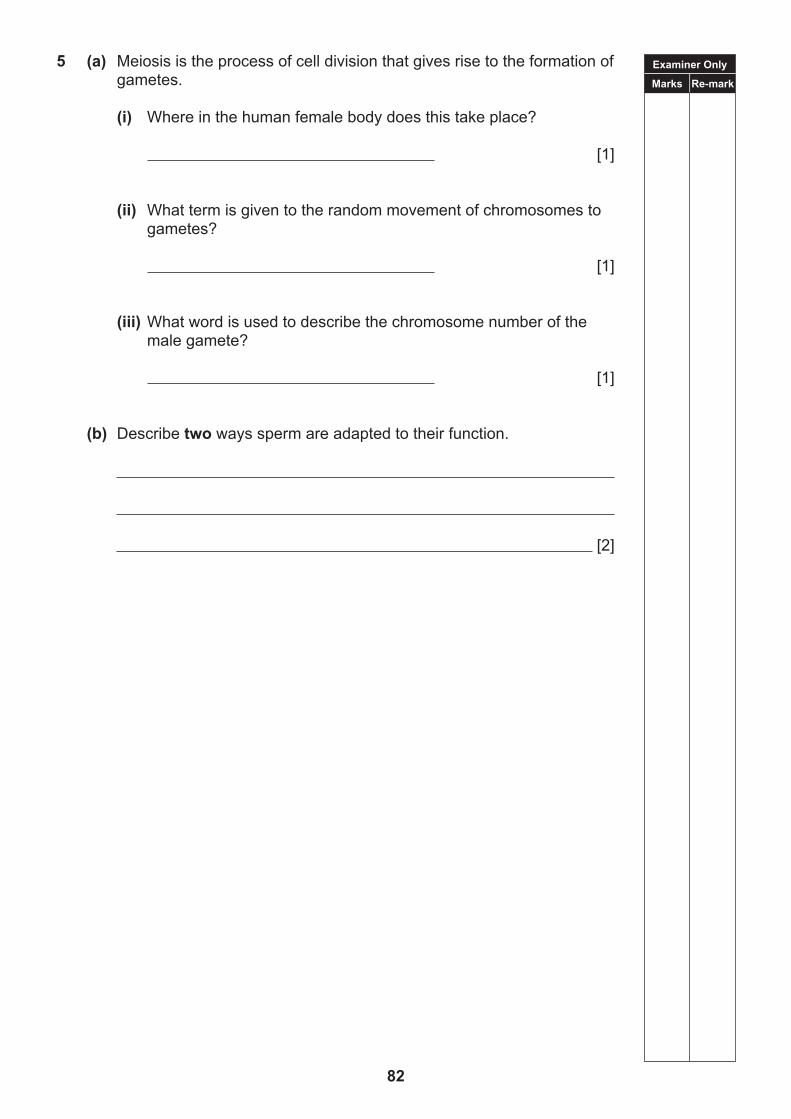
5 (a) Meiosis is the process of cell division that gives rise to the formation of gametes.
(i) Where in the human female body does this take place?
[1]
(ii) What term is given to the random movement of chromosomes to gametes?
[1]
(iii) What word is used to describe the chromosome number of the male gamete?
[1]
(b) Describe two ways sperm are adapted to their function.
[2]

Examiner Only
Marks Re-mark
83
(c) The diagram below shows part of the female reproductive system.
(i) Name parts A, B and C. A [1]
B [1]
C [1]
On the diagram above draw a line labelled
(ii) X to show where ova are released. [1]
(iii) Y to show where implantation of the embryo takes place. [1]
© Advanced Biology, 9th Edition, Geoff Jones and Mary Jones, Cambridge University
Press (2007). With permission of Geoff Jones.

Examiner Only
Marks Re-mark
84
(d) Describe how a zygote develops into an embyro.
[2]

Examiner Only
Marks Re-mark
85
6 A couple are diagnosed as infertile when they have been unable to conceive after one year of trying.
(a) Give two causes of infertility
1.
2.
[2]
(b) In vitro fertilisation (IVF) is one method of treating infertility.
Describe the process of IVF.
[4]

Examiner Only
Marks Re-mark
86
7 Read the passage.
Spiders’ silk is a very strong fibre, even stronger than steel.
Scientists have removed the gene for the silk protein from the spider’s genome and inserted it into the DNA of a female goat.
Milk produced by the female goat contains the spider silk protein which can be downstreamed.
(a) What term describes the process of modifying the genome of an organism to introduce desirable characteristics?
[1]
(b) (i) What type of enzyme is used to cut the spider silk gene from the spider's DNA?
[1]
(ii) The same enzyme is used to cut the goat DNA so that the spider silk gene can be inserted.
Explain why.
[3]
(c) Explain what is meant by downstreaming.
[2]

Examiner Only
Marks Re-mark
87
8 (a) The table below shows information about the development and production of different types of drugs by a company.
Antibiotics Painkillers Other medical drugs
Cost of producing drug/million pounds 7.4 7.5 4.9
Time to produce drug/years 9.5 6.5 6.5
Profit per drug/million pounds 2.1 2.9 4.2
Number of drugs in development 2 4 7
(i) Suggest two economic reasons why this company has fewer antibiotics and painkillers in development than ‘other medical drugs’.
[2]
(ii) Health organisations are concerned about the treatment of bacterial infections in the next decade.
Use the information in the table to help explain why.
[3]

Examiner Only
Marks Re-mark
88
(b) Preclinical and clinical trials must take place before a new medicine is made available to the public.
(i) Explain the role of preclinical and clinical trials.
Preclinical trials
[2]
Clinical trials
[1]
Animal testing is an important stage in the preclinical trials of new medicines.
Scientists must hold a government licence to carry out animal testing.
The animals in laboratories receive regular veterinary checks and are given pain relief during any invasive procedures.
(ii) Suggest why these regulations are necessary.
[1]
(iii) Suggest one disadvantage of preclinical trials using animals.
[1]
(iv) Give one other way new drugs are tested during preclinical trials.
[1]

Examiner Only
Marks Re-mark
89
9 Height in pea plants is determined by a single pair of alleles.
The allele for tallness (T) is dominant to the allele for shortness (t).
A student was investigating the inheritance of height in pea plants and found an unidentified seed.
The student wanted to discover the genotype of this seed, so the student planted it and it grew into a tall plant.
The student then cross pollinated this tall (parent) plant with a homozygous short pea plant.
The student collected the seeds from this cross and planted them.
The seedlings were a mixture of both tall and short plants.
(a) What is the name given to this type of genetic cross?
[1]
(b) (i) Explain how the student used these results to identify the genotype of the unknown parent plant.
[2]
(ii) Complete the Punnett square below for this cross.
Short pea plant gametes
t t
Unknownparent plant
gametes
[3]

Examiner Only
Marks Re-mark
90
(iii) In genetic crosses, it is important to produce large numbers of offspring.
Explain why large numbers of offspring are needed to ensure conclusions are valid.
[1]

BLANK PAGE
(Questions continue overleaf)
91

Examiner Only
Marks Re-mark
92
10 (a) Populations of living organisms show variation.
Explain the term variation.
[2]
Read the passage below.
The rock pocket mouse is found in desert areas of Arizona, USA.
The coat of this mouse has two forms, a sandy colour and a dark colour.
The main predators of the mouse are birds like owls.
In most of the desert areas the majority of the mice have the sandy coloured coats.
Some areas of the desert have changed because dark rocks have come to the surface.
In these areas most of the mice have the dark coat colour.

Examiner Only
Marks Re-mark
93
(b) Using evidence from the passage, explain how the dark coloured rock pocket mice show natural selection.
In this question you will be assessed on your written communication skills, including the use of specialist scientific terms.
[6]
(c) Explain how continual natural selection can lead to evolution.
[2]

Examiner Only
Marks Re-mark
94
11 (a) Haemophilia is a sex-linked condition that prevents blood from clotting effectively.
Use the above statement to give the location of the gene for haemophilia.
[1]
(b) The pedigree diagram below shows the inheritance of haemophilia in a family.
(i) Complete the table below by giving two family members who have haemophilia and describe their relationship to individual 1.
Member of family Relationship to individual 1
[2]

Examiner Only
Marks Re-mark
95
(ii) Explain why these two family members have haemophilia, even though their parents do not.
[3]
(c) Genetic screening involves testing an individual for the presence of a particular genetic condition.
The diagram below shows a pregnant woman having a medical procedure to allow genetic screening on her foetus.
Ultrasound scanning ensures the doctor gets the needle in the correct position to take the sample.
(i) Name this procedure.
[1]
(ii) Give one risk of this procedure to the foetus.
[1]
© Halli Verrinder / Thinkstock

Examiner Only
Marks Re-mark
96
(iii) Describe two other ethical issues of genetic screening.
[2]
The photograph below shows the chromosomes of a foetus screened by this procedure.
(iv) Name the genetic condition.
[1]
(v) Circle the chromosomes in the photograph above that cause this condition. [1]
© L Willatt / East Anglican Regional Genetics Service / Science Photo Library

THIS IS THE END OF THE QUESTION PAPER
97

BLANK PAGE
98

APPARATUSAND
MATERIALSLIST
General Certificate of Secondary Education2019
99
PhysicsAssessment Unit 3A
assessing
Practical Skills AssessmentPractical Booklet A
Foundation & Higher Tiers[CODE]
SPECIMEN
Biology
[CODE]
SPECIMEN
Unit 3 Practical Skills
Booklet A
Foundation & Higher Tiers

100
Task 1: Sampling Plant Abundance
The quadrats should be set out randomly, ready for the students to carry out the sampling technique.
Apparatus and Materials
Quadrat 0.25m2
Measuring tapes 20m
Identification key for daisy, dandelion and plantain species
Task 2: Osmosis in Potato
Apparatus and Materials
Freshly cut potato tissue (cylinders or chips of uniform size) at least 50mm long
0.0M sucrose solution (distilled water)
0.2M sucrose solution
0.4M sucrose solution
0.6M sucrose solution
0.8M sucrose solution
Knife/scalpel
5 beakers or similar containers
Ruler mm
Labels or marker
White tile (for cutting potato cylinders/chips)
Filter paper/paper towels (to dry potato tissue)
Balance (Higher Tier only)

General Certificate of Secondary Education2019
101
INFORMATION FOR CANDIDATESThis Practical Instruction Sheet tells you how to set up the practical and any initial information you may have to record.If you have recorded any data on the Practical Instruction Sheet, you will have access to this when completing Booklet A. Any information recorded during the setup of the practical is not assessed at this stage. The time taken by you to set up this practical is not part of the 2 hours allocated for completing Booklet A.
Biology
[CODE]
SPECIMEN
Unit 3 Practical Skills
Booklet A
Foundation Tier
102
Use the apparatus and materials provided to set up the following procedure.
Procedure
1 Label four beakers 1, 2, 3 and 4.
2 Pour 0.0 M sucrose solution into beaker 1, 0.2 M sucrose solution into beaker 2, 0.4 M sucrose solution into beaker 3 and 0.8 M sucrose solution into beaker 4.
3 Cut four potato chips to exactly the same length.
4 Record the length of the potato chips below.
Length of potato chip
5. Place one potato chip in each of the four beakers and leave for 24 hours.

BiologyUnit 3 Practical Skills
Booklet A
Candidate Practical Instruction Sheet
Higher Tier
[CODE]SPECIMEN
General Certificate of Secondary Education2019
103
INFORMATION FOR CANDIDATESThis Practical Instruction Sheet tells you how to set up the practical and any initial information you may have to record.If you have recorded any data on the Practical Instruction Sheet, you will have access to this when completing Booklet A. Any information recorded during the setup of the practical is not assessed at this stage. The time taken by you to set up this practical is not part of the 2 hours allocated for completing Booklet A.

104
Use the apparatus and materials provided to set up the following procedure.
Procedure
1 Label four beakers 1, 2, 3 and 4.
2 Pour 0.0 M sucrose solution into beaker 1, 0.2 M sucrose solution into beaker 2, 0.4 M sucrose solution into beaker 3 and 0.8 M sucrose solution into beaker 4. Record in the table below.
3 Cut four potato chips approximately 50 mm long.
4 Weigh one potato chip and record its mass in the table below.
5 Place the potato chip in beaker 1.
6 Repeat steps 4 and 5 with the three remaining potato chips, using beakers 2, 3 and 4.
7 Leave for 24 hours.
Results
Beaker Concentration of sucrose solution /M
Mass of potato chip /g
1234
Centre Number
Candidate Number
General Certificate of Secondary Education2019
For Examiner’s use only
Question Number
Marks
1
2
TotalMarks
INSTRUCTIONS TO CANDIDATESWrite your Centre Number and Candidate Number in the spaces provided at the top of this page.Write your answers in the spaces provided in this question paper.Answer all questions.
INFORMATION FOR CANDIDATESThe total mark for this paper is 30.Question 1 is a practical exercise worth 13 marks.Question 2 is a practical exercise worth 17 marks.Figures in brackets printed down the right-hand side of pages indicate the marks awarded to each question or part question.
You will have access to apparatus and materials required for the practical exercise.
You may not have access to notes or textbooks to assist you.
Biology
[CODE]SPECIMEN PAPER
Unit 3 Practical Skills
Booklet A
Foundation Tier
105
Unit 3 Practical Skills
Booklet A
Foundation Tier

Examiner Only
Marks Re-mark
106
Task 1: Sampling Plant Abundance
Use the quadrat to estimate the average number of daisy, dandelion and plantain plants in the area within the quadrat.
1 (a) What size is the quadrat you are using?
[2]
(b) Describe how to use the quadrat and the measuring tapes in this investigation.
[5]

Examiner Only
Marks Re-mark
107
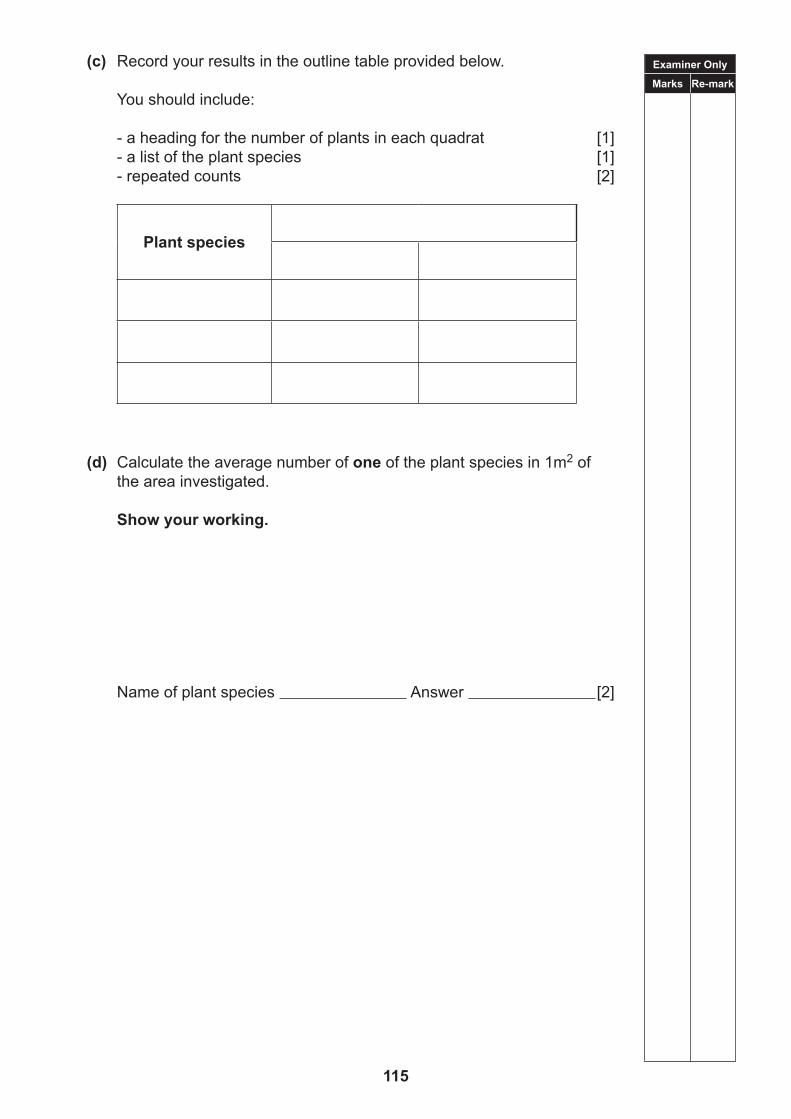
(c) Record your results in the outline table provided below.
You should include:
- a heading for the number of plants in each quadrat [1] - a list of the plant species [1] - repeated counts [2]
Plant species
(d) Calculate the average number of one of the plant species in 1m2 of the area investigated.
Show your working.
Name of plant species Answer [2]

Examiner Only
Marks Re-mark
108
Task 2: Osmosis in Potato
Procedure
Remove the potato chips from the beakers. Measure the length of each.
Results
(a) Length of each potato chip at the start. [2]
(b) Complete the table below by:
- inserting appropriate headings with units; [2] - recording the length of each potato chip after 24 hours; [1] - calculating the change in length of each potato chip. [2]
Beaker Concentration of sucrose solution/M
Change in length of potato chip/mm
1 0.0
2 0.2
3 0.4
4 0.8

Examiner Only
Marks Re-mark
109
(c) Record your own results for the change in length of the potato chips in the table below. [1]
Collect two other sets of results for each concentration of sucrose from other groups in your class and record those in the table. [1]
Calculate and record the average change in length of the potato chips. [2]
Concentration of sucrose solution/M
Change in length of potato chip/mm
Own Results Group 1 Group 2 Average
0.0
0.2
0.4
0.8
(d) Plot your results as a graph on the axes provided on the next page.
Label each axis, including units.
Select an appropriate scale for each axis.
Plot the points accurately.
Draw a line through the plots. [6]

Examiner Only
Marks Re-mark
110
00

111
THIS IS THE END OF THE QUESTION PAPER

BLANK PAGE
112

Centre Number
Candidate Number
General Certificate of Secondary Education2019
For Examiner’s use only
Question Number
Marks
1
2
TotalMarks
INSTRUCTIONS TO CANDIDATESWrite your Centre Number and Candidate Number in the spaces provided at the top of this page.Write your answers in the spaces provided in this question paper.Answer all questions.
INFORMATION FOR CANDIDATESThe total mark for this paper is 30.Question 1 is a practical exercise worth 13 marks.Question 2 is a practical exercise worth 17 marks.Figures in brackets printed down the right-hand side of pages indicate the marks awarded to each question or part question.
You will have access to apparatus and materials required for the practical exercise.
You may not have access to notes or textbooks.
113
Biology
[CODE]SPECIMEN PAPER
Unit 3 Practical Skills
Booklet A
Foundation Tier
Unit 3 Practical Skills
Booklet A
Foundation Tier
Unit 3 Practical Skills
Booklet A
Higher Tier

Examiner Only
Marks Re-mark
114
Task 1: Sampling Plant Abundance
Use the quadrat to estimate the average number of daisy, dandelion and plantain plants in the area within the quadrat.
1 (a) What size is the quadrat you are using?
[2]
(b) Describe how to use the quadrat and the measuring tapes in this investigation.
[5]
Examiner Only
Marks Re-mark
115
(c) Record your results in the outline table provided below.
You should include:
- a heading for the number of plants in each quadrat [1] - a list of the plant species [1] - repeated counts [2]
Plant species
(d) Calculate the average number of one of the plant species in 1m2 of the area investigated.
Show your working.
Name of plant species Answer [2]

Examiner Only
Marks Re-mark
116
Task 2: Osmosis in Potato
Procedure
Remove the potato from each beaker.Dry the surface of the chip and weigh.
Results
(a) Complete the table below by:
- recording the mass of each potato chip at start; [1] - recording the mass of each potato chip after 24 hours; and [1] - calculating and recording the percentage change in mass for each potato chip. [2]
BeakerConcentration
of sucrose solution/M
Mass of potato chip/g
At start After 24 hours
Percentage change in mass
1 0.0
2 0.2
3 0.4
4 0.8

Examiner Only
Marks Re-mark
117
(b) (i) Explain why the percentage change in mass was calculated.
[1]
(ii) Give two steps in the procedure that help the accuracy of your results.
1.
2. [2]
(c) Record your own results for the percentage change in mass of the potato chips in the table below. [1]
Collect two other sets of results for each concentration of sucrose from other groups in your class and record those in the table. [1]
Calculate and record the average percentage change in mass of the potato chips. [2]
Concentration of sucrose solution/M
Percentage change in mass of potato chip
Own result Group 1 Group 2 Average
0.0
0.2
0.4
0.8

Examiner Only
Marks Re-mark
118
(d) Plot these results as a graph on the axes provided on the next page.
Label each axis, including units.
Select an appropriate scale for each axis.
Plot the points accurately.
Draw a line of best fit. [6]

Examiner Only
Marks Re-mark
119
00

THIS IS THE END OF THE QUESTION PAPER
120

Centre Number
Candidate Number
General Certificate of Secondary Education2019
For Examiner’s use only
Question Number
Marks
1
2
3
4
5
6
TotalMarks
TIME1 hour.
INSTRUCTIONS TO CANDIDATESWrite your Centre Number and Candidate Number in the spaces pro-vided at the top of this page.Write your answers in the spaces provided in this question paper.Answer all questions.
INFORMATION FOR CANDIDATESThe total mark for this paper is 70.Figures in brackets printed down the right-hand side of pages indicate the marks awarded to each question or part question.Quality of written communication will be assessed in Question 3(b)(iii).
121
Biology
[CODE]SPECIMEN PAPER
Unit 3 Practical Skills
Booklet B
Foundation Tier
Examiner Only
Marks Re-mark
122
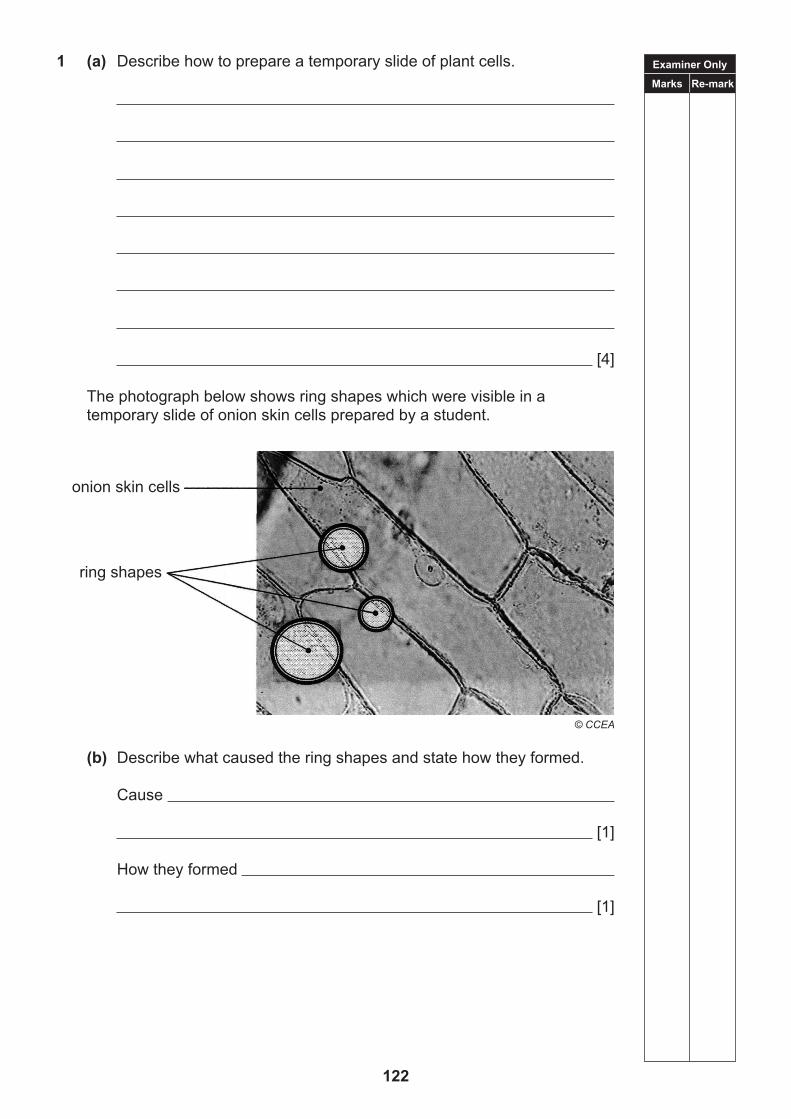
1 (a) Describe how to prepare a temporary slide of plant cells.
[4]
The photograph below shows ring shapes which were visible in a temporary slide of onion skin cells prepared by a student.
(b) Describe what caused the ring shapes and state how they formed.
Cause
[1]
How they formed
[1]
© CCEA
onion skin cells
ring shapes

Examiner Only
Marks Re-mark
123
(c) The photograph below shows a leaf cell.
(i) Make a drawing of this leaf cell in the box.
[5]
(ii) Use the millimetre scale to measure the diameter of the leaf cell nucleus.
mm [1]
The leaf cell in the photograph is magnified 4000 times.
© Herve Conge, ISM / Science Photo Library

Examiner Only
Marks Re-mark
124
(iii) Calculate the actual size of the nucleus.
Show your working.
Give your answer in appropriate units.
Answer [3]

BLANK PAGE
(Questions continue overleaf)
125

Examiner Only
Marks Re-mark
126
2 A student investigated the effect of two antibiotics, X and Y, on the growth of bacteria.
The student carried out the following procedure using aseptic techniques.
1. 1 ml of bacterial culture was added to a sterile glass Petri dish containing sterile nutrient agar as shown in diagram A.
2. Filter paper discs were soaked in antibiotic solutions or water and placed on top of the nutrient agar. This is shown in diagram B.
3. The Petri dish was sealed, inverted and incubated at 20 ºC for 48 hours. Diagram C shows the appearance of the Petri dish after this time.
sterile glasson Petri dish
A
B
bacteria onnutrient agar
filter paper discsoaked in water
bacteria onnutrient agar
filter paper disc soakedin antibiotic solution X
filter paper disc soakedin antibiotic solution Y
C
water
X
Yclear zone

Examiner Only
Marks Re-mark
127
Use evidence from the diagram and the procedure on the previous page to answer the following questions.
(a) (i) Describe how the glass Petri dish is sterilised.
[1]
(ii) Explain why this is necessary.
[1]
(b) (i) Explain why the Petri dish is sealed.
[1]
(ii) Explain why the Petri dish is not incubated above 20 ºC.
[1]
(c) Give two factors that the student has controlled in this experiment.
1. [1]
2. [1]
The student concluded that antibiotic Y was the most effective.
(d) Give evidence from Diagram C on the previous page that supports this conclusion.
[2]

Examiner Only
Marks Re-mark
128
3 The photograph below shows a variegated geranium plant.
The plant was destarched before a photosynthesis experiment.
(a) Describe how the plant was destarched.
[2]
(b) A leaf from the destarched plant was then removed and tested for the presence of starch.
(i) Explain why it is necessary to test this leaf before the photosynthesis experiment.
[1]
(ii) Predict the colour of the reagent at the end of this test.
[1]
© Hemera Technologies /PhotoObjects.net /Thinkstock

Examiner Only
Marks Re-mark
129
(iii) Describe and explain how to test the leaf for starch.
In this question you will be assessed on your written communication skills, including the use of specialist scientific terms.
[6]

Examiner Only
Marks Re-mark
130
(c) The diagram below shows another leaf from the destarched plant in an experiment set up to investigate two factors required for photosynthesis.
The plant was left in bright light for several hours and then tested for the presence of starch.
The diagram below shows the results.
(i) Complete the diagram above of the results of the starch test by shading the areas of the leaf which would contain starch. [2]
(ii) Suggest two factors that these results show are required for photosynthesis.
1. [1]
2. [1]

Examiner Only
Marks Re-mark
131
4 The diagram below shows the apparatus a student used to measure the water uptake of a leafy shoot.
Look at the diagram above.
(a) Name the apparatus.
[1]
The apparatus was placed in warm conditions for 10 minutes.
(b) Describe and explain one change you would expect to see after this time.
Description
[2]
Explanation
[2]
© CCEA

Examiner Only
Marks Re-mark
132
The student was also given a fan.
(c) Suggest how the student could use the fan and the apparatus to investigate the effect of wind on the water uptake by the leafy shoot.
[4]
(d) Name the independent variable in this investigation.
[1]

Examiner Only
Marks Re-mark
133
5 The diagram below shows the apparatus used by students investigating the energy in pasta.
From ‘Biology Lives’ by Morton Jenkins. © 1999, 2001 Morton Jenkins. Reproduced by permission of Hodder Education
(a) (i) Suggest why the test tube is inside a tin can.
[2]
(ii) Explain why there is a gap between the tin can and the heatproof mat.
[2]

Examiner Only
Marks Re-mark
134
The thermometers show the temperature of the water before and after burning a piece of pasta.
(b) Use the information in the diagrams above to calculate the temperature rise caused by burning the piece of pasta.
Show your working.
Answer °C [3]
The students used their results to calculate the energy in the piece of pasta.
The value they calculated was lower than that given on the packet.
(c) Suggest two reasons why the students’ value was lower.
1.
[1]
2.
[1]

Examiner Only
Marks Re-mark
135
6 The diagram below shows part of the apparatus set up to investigate the effect of temperature on the respiration of yeast.
The volume of gas A was measured after 10 minutes.
(a) (i) Name gas A.
[1]
The investigation was repeated at different temperatures.
(ii) Name the apparatus that could be used to control the temperature of the yeast and glucose solution.
[1]
© CCEA

Examiner Only
Marks Re-mark
136
(b) The table below shows the results of the investigation.
Temperature/°C Volume of gas A/cm3
0 0
5 0.5
15 2
25 20
35 25
45 26
(i) Draw a graph of the results on the grid below.
Label each axis.
Plot the points accurately.
Draw a line through the points. [5]
0
5
10
15
20
25
30
0 10 20 30 40 50

Examiner Only
Marks Re-mark
137
(ii) Describe the trend in the results. Include data from the graph on the previous page to support your
answer.
[4]
(iii) Suggest why the experiment was not repeated at temperatures above 45 °C.
[1]
(c) Suggest two other factors that should be controlled in this experiment.
1. [1]
2. [1]
THIS IS THE END OF THE QUESTION PAPER
138

Centre Number
Candidate Number
General Certificate of Secondary Education2019
For Examiner’s use only
Question Number
Marks
1
2
3
4
5
6
TotalMarks
TIME1 hour.
INSTRUCTIONS TO CANDIDATESWrite your Centre Number and Candidate Number in the spaces provided at the top of this page.Write your answers in the spaces provided in this question paper.Answer all questions.
INFORMATION FOR CANDIDATESThe total mark for this paper is 70.Figures in brackets printed down the right-hand side of pages indicate the marks awarded to each question or part question.Quality of written communication will be assessed in Question 3(b)(iii).
139
Biology
[CODE]SPECIMEN PAPER
Unit 3 Practical Skills
Booklet B
Higher Tier

Examiner Only
Marks Re-mark
140
1 (a) Describe how to prepare a temporary slide of plant cells.
[4]
The photograph below shows ring shapes which were visible in a temporary slide of onion skin cells prepared by a student.
(b) Describe what caused the ring shapes and state how they formed.
Cause
[1]
How they formed
[1]
© CCEA
onion skin cells
ring shapes

Examiner Only
Marks Re-mark
141
(c) The photograph below shows a leaf cell.
(i) Make a drawing of this leaf cell in the box. [5]
The scale bar represents a length of 5 micrometres.
(ii) Use the scale bar to calculate the magnification of the leaf cell in the photograph.
Show your working.
Answer [3]
© Herve Conge, ISM / Science Photo Library

Examiner Only
Marks Re-mark
142
(iii) Use this magnification to calculate the diameter of the leaf cell nucleus.
Show your working.
Give your answer in appropriate units.
Answer [3]

BLANK PAGE
(Questions continue overleaf)
143

Examiner Only
Marks Re-mark
144
2 A student investigated the effect of two antibiotics, X and Y, on the growth of a bacterium.
The student carried out the following procedure using aseptic techniques.
1 1 ml of bacterial culture was added to a sterile glass Petri dish containing sterile nutrient agar as shown in diagram A.
2 Filter paper discs were soaked in antibiotic solutions or water and placed on top of the nutrient agar. This is shown in diagram B.
3 The Petri dish was sealed, inverted and incubated at 20 ºC for 48 hours. Diagram C shows the appearance of the Petri dish after this time.
sterile glasson Petri dish
A
B
bacteria onnutrient agar
filter paper discsoaked in water
bacteria onnutrient agar
filter paper disc soakedin antibiotic solution X
filter paper disc soakedin antibiotic solution Y
C
water
X
Yclear zone
Use the information provided to help answer the following questions.

Examiner Only
Marks Re-mark
145
(a) (i) Describe how the glass Petri dish is sterilised.
[1]
(ii) Explain why this is necessary.
[1]
(b) (i) Explain why the Petri dish is sealed.
[1]
(ii) Explain why the Petri dish is not incubated above 20 ºC.
[1]
(c) Give two factors that the student has controlled in this experiment.
1 [1]
2 [1]
The student concluded that antibiotic Y was the most effective.
(d) Give evidence from Diagram C on the previous page that supports this conclusion.
[2]

Examiner Only
Marks Re-mark
146
3 The photograph below shows a geranium plant
The plant was destarched before a photosynthesis experiment.
(a) Describe how the plant was destarched.
[2]
(b) A leaf from the destarched plant was then removed and tested for the presence of starch.
(i) Explain why it is necessary to test this leaf before the photosynthesis experiment.
[1]
(ii) Predict the colour of the reagent at the end of this test.
[1]
© Hemera Technologies /PhotoObjects.net /Thinkstock

Examiner Only
Marks Re-mark
147
(iii) Describe and explain how to test the leaf for starch.
In this question you will be assessed on your written communication skills, including the use of specialist scientific terms.
[6]

Examiner Only
Marks Re-mark
148
(c) The diagram below shows another leaf from the plant in an experiment set up to investigate one factor required for photosynthesis.
(i) Explain the role of the sodium hydroxide solution in this experiment.
[1]
(ii) Which factor, required for photosynthesis, is being investigated in this experiment?
[1]
(iii) Describe a suitable control for this experiment.
[2]
Source: Chief Examiner

Examiner Only
Marks Re-mark
149
4 The diagram below shows apparatus a student used to measure the rate of water uptake of a leafy shoot.
(a) Name the apparatus.
[2]
(b) What is the function of the syringe of water?
[1]
© CCEA

Examiner Only
Marks Re-mark
150
The apparatus was placed in warm conditions for 10 minutes.
(c) Describe and explain one change you would expect to see after this time.
Description
[2]
Explanation
[2]
The student was also given a fan.
(d) Suggest how the student could use the fan and the apparatus to investigate the effect of wind on the rate of water uptake by the leafy shoot.
Describe any calculations the student should make.
[5]
(e) The results obtained by different students showed a lot of variation.
Suggest a reason why.
[1]

Examiner Only
Marks Re-mark
151
5 The diagram below shows the apparatus used by students investigating the energy in different types of pasta.
thermometer
tin can
pin or plasticine
heatproof mat
piece of pasta
20cm3 of water
cotton wool
From ‘Biology Lives’ by Morton Jenkins. © 1999, 2001 Morton Jenkins. Reproduced by permission of Hodder Education
(a) (i) Suggest why the test tube is inside a tin can.
[2]
(ii) Explain why there is a gap between the tin can and the heatproof mat.
[2]

Examiner Only
Marks Re-mark
152
When the apparatus was used the average temperature rise produced by a piece of pasta was 25 °C.
(b) (i) Calculate the energy in the piece of pasta using the following equation.
Energy/J = Temperature rise/ºC × mass of water/g × 4.2
Show your working.
Answer [2]
The piece of pasta weighed 1.5 g.
(ii) Calculate the average energy in 1 g of pasta.
Show your working.
Answer [2]
The energy value given on the packet of pasta was 1500 kJ per 100 g.
(iii) Calculate the error in the students’ result as a percentage of the value given on the packet of pasta.
Show your working.
Percentage error % [3]
(iv) Suggest two reasons for this percentage error.
1
[1]
2
[1]

Examiner Only
Marks Re-mark
153
6 The diagram below shows part of the apparatus set up to investigate the effect of temperature on the respiration of yeast.
The volume of gas A was measured after 10 minutes.
The experiment was repeated at different temperatures.
(a) Name gas A.
[1]
(b) Complete the diagram above by drawing the apparatus used to control the temperature of the yeast and glucose solution.
Label the apparatus you add. [3]
(c) Suggest why the maximum temperature used in this experiment was 45 °C.
[1]
© CCEA

THIS IS THE END OF THE QUESTION PAPER
154

MARK SCHEMES
155

156

General Certificate of Secondary Education
GENERAL MARKING INSTRUCTIONS
Biology
157
158
General Marking Instructions
IntroductionMark schemes are intended to ensure that the GCSE examinations are marked consistently and fairly. The mark schemes provide markers with an indication of the nature and range of candidates’ responses likely to be worthy of credit. They also set out the criteria which they should apply in allocating marks to candidates’ responses.
Assessment objectivesBelow are the assessment objectives for GCSE Biology.
Candidates must:
AO1 demonstrate knowledge and understanding of: scientific ideas; and scientific techniques and procedures;AO2 apply knowledge and understanding of and develop skills in: scientific ideas; scientific enquiry, techniques and procedures; andAO3 analyse scientific information and ideas to: interpret and evaluate; make judgements and draw conclusions and develop and improve experimental procedures.
Quality of candidates’ responsesIn marking the examination papers, examiners should be looking for a quality of response reflecting the level of maturity which may reasonably be expected of a 16-year-old which is the age at which the majority of candidates sit their GCSE examinations.
Flexibility in markingMark schemes are not intended to be totally prescriptive. No mark scheme can cover all the responses which candidates may produce. In the event of unanticipated answers, examiners are expected to use their professional judgement to assess the validity of answers. If an answer is particularly problematic, then examiners should seek the guidance of the Supervising Examiner.
Positive markingExaminers are encouraged to be positive in their marking, giving appropriate credit for what candidates know, understand and can do rather than penalising candidates for errors or omissions. Examiners should make use of the whole of the available mark range for any particular question and be prepared to award full marks for a response which is as good as might reasonably be expected of a 16-year-old GCSE candidate.
Awarding zero marksMarks should only be awarded for valid responses and no marks should be awarded for an answer which is completely incorrect or inappropriate.
Marking calculationsIn marking answers involving calculations, examiners should apply the ‘own figure rule’ so that candidates are not penalised more than once for a computational error.
Types of mark schemesMark schemes for tasks or questions which require candidates to respond in extended written form are marked on the basis of levels of response which take account of the quality of written communication.

159
Other questions which require only short answers are marked on a point for point basis with marks awarded for each valid piece of information provided.
Levels of responseTasks and questions requiring candidates to respond in extended writing are marked in terms of levels of response. In deciding which level of response to award, examiners should look for the ‘best fit’ bearing in mind that weakness in one area may be compensated for by strength in another. In deciding which mark within a particular level to award to any response, examiners are expected to use their professional judgement. The following guidance is provided to assist examiners.
Threshold performance: Response which just merits inclusion in the level and should be awarded a mark at or near the bottom of the range.
Intermediate performance: Response which clearly merits inclusion in the level and should be awarded a mark at or near the middle of the range.
High performance: Response which fully satisfies the level description and should be awarded a mark at or near the top of the range.
Quality of written communicationQuality of written communication is taken into account in assessing candidates’ responses to all tasks and questions that require them to respond in extended written form. These tasks and questions are marked on the basis of levels of response. The description for each level of response includes reference to the quality of written communication.
For conciseness, quality of written communication is distinguished within bands of response as follows:
Band A: Quality of written communication is excellent.Band B: Quality of written communication is good.Band C: Quality of written communication is basic.
In interpreting these level descriptions, examiners should refer to the more detailed guidance provided below:
Band A (Excellent): The candidate successfully selects and uses the most appropriate form and style of writing. Relevant material is organised with a high degree of clarity and coherence. There is widespread and accurate use of appropriate specialist vocabulary. Presentation, spelling, punctuation and grammar are of a sufficiently high standard to make meaning clear.
Band B (Good): The candidate makes a reasonable selection and use of an appropriate form and style of writing. Relevant material is organised with some clarity and coherence. There is some use of appropriate specialist vocabulary. Presentation, spelling, punctuation and grammar are sufficiently competent to make meaning clear.
Band C (Basic): The candidate makes only a limited selection and use of an appropriate form and style of writing. The organisation of material may lack clarity and coherence. There is little use of specialist vocabulary. Presentation, spelling, punctuation and grammar may be such that intended meaning is not clear.

BLANK PAGE
160

MARKSCHEME
General Certificate of Secondary Education2018
161
Biology
[CODE]SPECIMEN
Unit 1
Foundation Tier

AVAILABLE MARKS
162
4
5
6
6
AVAILABLE MARKS
1 (a) A – Trachea/cartilage [1] B – Pleural membrane/pleural cavity/pleural fluid [1] C – Bronchus [1]
(b) D – Site of gas exchange/increased surface area [1]
2 (a) Biodiversity – A measure of the number and type of living things in an area [1] Population – The number of organisms of the same species in an area [1]
(b) (i) Rainforest/tall forest trees [1]
(ii) 50 000 ÷ 100 × 20 [1] 10 000 [1] or 50 000 ÷100 × 80 = 40 000 50 000 – 40 000 = 10 000
3 (a) A – Nucleus [1] B – Cell membrane [1]
(b) Structures drawn: Cell wall outside cell membrane [1] Large vacuole in cytoplasm [1] Chloroplasts in cytoplasm [1]
(c) Any one from:• Non-cellulose cell wall• Absence of nucleus• Presence of plasmids [1]
4 (a) Photosynthesis – removes CO2 [1] Respiration – adds CO2 [1] Combustion – adds CO2 [1]
(b) A – Feeding [1] B – Fossilisation [1] C – Decomposition [1]

AVAILABLE MARKS
163
6
AVAILABLE MARKS
5 Indicative content: 1. The leaf is broad and flat/has a large surface area 2. Allows maximum light absorption 3. Thin/transparent cuticle/upper epidermis 4. Allows light to enter leaf 5. Chloroplasts (in mesophyll) 6. To absorb light energy 7. Palisade cells end on to top surface/closely packed/
contain most chloroplasts 8. Most light absorbed close to top surface/
before it passes through many cell walls 9. Spongy cells have a large surface area/contain air spaces/
stomata in lower epidermis 10. Allows gas exchange
Band Response Mark
A
The candidate selects at least six of the indicative points. The relevant material is organised with a high degree of clarity and coherence. There is widespread and accurate use of specialist vocabulary. Presentation, spelling, punctuation and grammar are of a sufficiently high standard to make the meaning clear.
[5]–[6]
B
The candidate selects at least four of the indicative points. The relevant material is organised with some degree of clarity and coherence. There is some use of specialist vocabulary. Presentation, spelling, punctuation and grammar are of a sufficiently competent standard to make the meaning clear.
[3]–[4]
C
The candidate selects at least two of the indicative points. The organisation may lack clarity and coherence. There is little use of specialist vocabulary. Presentation, spelling, punctuation and grammar may be such that the meaning is not clear.
[1]–[2]
Response not worthy of credit. [0]
[6]

AVAILABLE MARKS
164
6
8
11
AVAILABLE MARKS
6 (a) Taller [1] More leaves [1]
(b) Any two from:• Phototropism• Uneven distribution of plant hormone/auxin• Causes differential growth of cells/cells grow more on shaded side [2]
(c) Increased light trapped/absorbed [1] Increased photosynthesis [1]
7 (a) Brain [1] Spinal cord [1]
(b) (i) The distance the ruler drops [1]
(ii) Any two from: • Arm rested on bench/kept steady [in one place]• Ruler held between finger and thumb• Same [weight of] ruler [2]
(iii) Reduce effect of anomalies [1]
(iv) Caffeine speeds up reactions/reduces reaction time [1] Repeating the experiment speeds up reactions/ reduces reaction time [1]
8 (a) One correct link [1]; two or more correct links [2] Proteins → amino acids Fats → glycerol Cellulose → sugars [2]
(b) (i) Accurate plots [×2] [2] Line drawn [point to point/line of best fit] [1] [3] (ii) 40 °C [1]
(iii) Works better at lower temperature / lower optimum temperature; [1] Lower energy costs. [1]
(iv) 20 °C – Y [1]
(v) Any two from:• Temperature above optimum• Enzyme denatured• Substrate does not fit enzyme/active site• Enzyme cannot break down substrate [2]

AVAILABLE MARKS
165
9
6
8
75
AVAILABLE MARKS
9 (a) (i) Label line drawn correctly to cortex [1] Label line drawn correctly to medulla [1]
(ii) Bladder [1]
(b) (i) 2500 cm3/day (units must be shown) [1]
(ii) 1500 cm3/day [1]
(iii) Decreased by 400 cm3/produced 1100 cm3 urine [1]
(iv) Less water is filtered out of the blood/due to ultrafiltration. More reabsorbed back into blood/capillaries. Sign/symptom of type 2 diabetes. [2]
(v) Osmoregulation [1]
10 (a) A – Iris [1] B – Pupil [1]
(b) Controls the amount of light entering the eye [1]
(c) (i) Part B/pupil would get smaller [1] (ii) Reduce the amount of light entering eye [1] Prevents damage to retinal cells/ allows image to be produced on retina [1]
11 (a) (i) The Sun [1]
(ii) Grass/flowers/plants/weeds/dandelions or any other type of plants [1]
(iii) Consumption/transfer of energy/ transfer of substances (carbon/nitrogen) [1]
(iv) Shrew/fox [1]
(b) Decrease – Less rabbits mean less food for foxes [1]
Increase – More caterpillars [1] Less competition with rabbits/more food for caterpillars [1] More shrews for foxes to eat [1]
Total

BLANK PAGE
166

MARKSCHEME
Biology
[CODE]SPECIMEN
Unit 1
Higher Tier
General Certificate of Secondary Education2018
167

AVAILABLE MARKS
168
AVAILABLE MARKS
1 (a) A – Iris [1] B – Pupil [1]
(b) Controls the amount of light entering the eye [1]
(c) Part B/pupil would get smaller [1] Reduce the amount of light entering eye [1] Prevents damage to retinal cells/allows image to be produced on retina [1]
2 (a) (i) The Sun [1]
(ii) Grass/flowers/plants/weeds/dandelions or any other type of plants [1]
(iii) Consumption/transfer of energy/ transfer of substances (carbon/nitrogen) [1]
(iv) Shrew/fox/man/frog/insect-eating birds/ladybirds/birds of prey [1]
(b) Decrease – Less rabbits mean less food for foxes [1]
Increase – More caterpillars [1] Less competition with rabbits/more food for caterpillars [1] More shrews for foxes to eat [1]
3 (a) Movement of molecules [1] from (region of) high concentration [1] to (region of) low concentration [1]
(b) (i) Iodine solution reacts with starch/becomes blue-black [1] Larger dark circle in B means faster diffusion [1]
(ii) Temperature affects diffusion rate/ increased temperature speeds up diffusion/controlled variable [1]
4 Any three pairs (description and appropriate explanation) from: Description: excellent good supply Explanation: maintains diffusion gradient/transport the products of digestion
Description: thin surface/single layer Explanation: short/small diffusion distance
Description: lacteals Explanation: to absorb breakdown products of fat
Description: villus/(micro)villi Explanation: increases surfaces area [6]
6
8
6
6
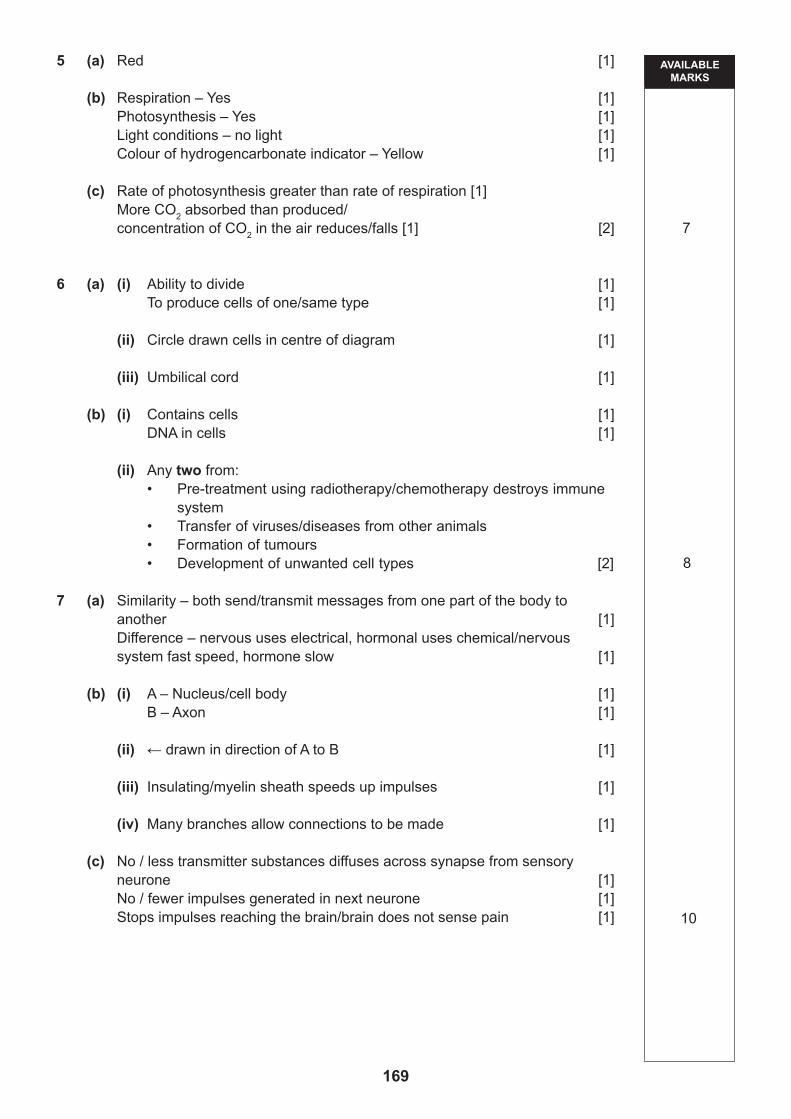
AVAILABLE MARKS
169
AVAILABLE MARKS
5 (a) Red [1]
(b) Respiration – Yes [1] Photosynthesis – Yes [1] Light conditions – no light [1] Colour of hydrogencarbonate indicator – Yellow [1] (c) Rate of photosynthesis greater than rate of respiration [1] More CO2 absorbed than produced/ concentration of CO2 in the air reduces/falls [1] [2]
6 (a) (i) Ability to divide [1] To produce cells of one/same type [1]
(ii) Circle drawn cells in centre of diagram [1]
(iii) Umbilical cord [1]
(b) (i) Contains cells [1] DNA in cells [1]
(ii) Any two from:• Pre-treatment using radiotherapy/chemotherapy destroys immune
system• Transfer of viruses/diseases from other animals• Formation of tumours• Development of unwanted cell types [2]
7 (a) Similarity – both send/transmit messages from one part of the body to another [1]
Difference – nervous uses electrical, hormonal uses chemical/nervous system fast speed, hormone slow [1]
(b) (i) A – Nucleus/cell body [1] B – Axon [1]
(ii) ← drawn in direction of A to B [1]
(iii) Insulating/myelin sheath speeds up impulses [1]
(iv) Many branches allow connections to be made [1]
(c) No / less transmitter substances diffuses across synapse from sensory neurone [1]
No / fewer impulses generated in next neurone [1] Stops impulses reaching the brain/brain does not sense pain [1]
7
8
10

AVAILABLE MARKS
170
AVAILABLE MARKS
8 (a) (i) Any two from: [2]• Less leaves/less roots/less growth• Nitrate required for amino acids/proteins• Proteins linked with growth
(ii) Magnesium [1] No chlorophyll (produced) [1]
(b) Indicative content: 1 Extra minerals/nitrates from organic waste/sewage/fertiliser run-off 2 Stimulate growth of aquatic plants/algae 3 Algae on surface prevent light reaching plants lower down/
cause shading/increased competition for light/reduced photosynthesis 4 Plants/algae die 5 Dead plants are decomposed by microorganisms 6 Microorganisms respire aerobically/use oxygen 7 Concentration of dissolved oxygen in the water reduces/
water becomes anaerobic 8 Aquatic animals/vertebrates/invertebrates die due to lack of O2
Band Response Mark
A
The candidate selects at least five of the indicative points. The relevant material is organised with a high degree of clarity and coherence. There is widespread and accurate use of specialist vocabulary. Presentation, spelling, punctuation and grammar are of a sufficiently high standard to make the meaning clear.
[5]–[6]
B
The candidate selects at least three of the indicative points. The relevant material is organised with some degree of clarity and coherence. There is some use of specialist vocabulary. Presentation, spelling, punctuation and grammar are of a sufficiently competent standard to make the meaning clear.
[3]–[4]
C
The candidate selects at least one of the indicative points. The organisation may lack clarity and coherence. There is little use of specialist vocabulary. Presentation, spelling, punctuation and grammar may be such that the meaning is not clear.
[1]–[2]
Response not worthy of credit. [0]
[6] 10
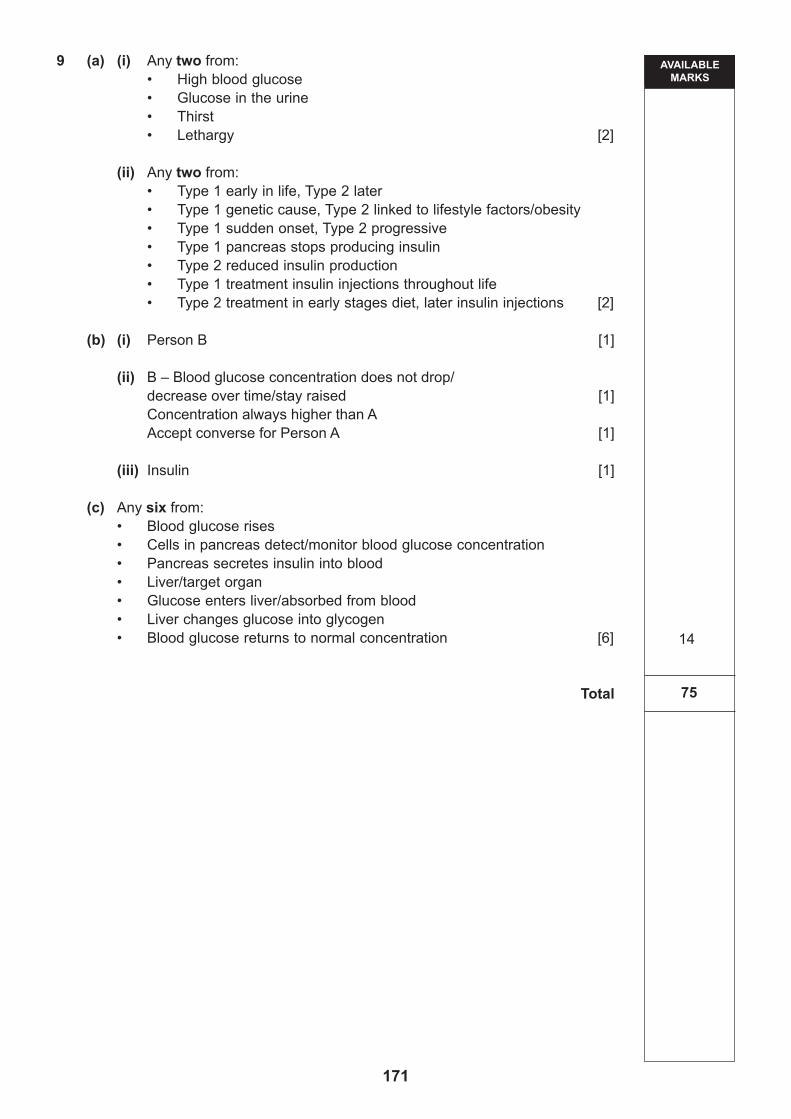
AVAILABLE MARKS
171
9 (a) (i) Any two from:• High blood glucose• Glucose in the urine• Thirst• Lethargy [2]
(ii) Any two from:• Type 1 early in life, Type 2 later• Type 1 genetic cause, Type 2 linked to lifestyle factors/obesity• Type 1 sudden onset, Type 2 progressive• Type 1 pancreas stops producing insulin• Type 2 reduced insulin production• Type 1 treatment insulin injections throughout life• Type 2 treatment in early stages diet, later insulin injections [2]
(b) (i) Person B [1]
(ii) B – Blood glucose concentration does not drop/ decrease over time/stay raised [1] Concentration always higher than A Accept converse for Person A [1]
(iii) Insulin [1]
(c) Any six from:• Blood glucose rises• Cells in pancreas detect/monitor blood glucose concentration• Pancreas secretes insulin into blood• Liver/target organ• Glucose enters liver/absorbed from blood• Liver changes glucose into glycogen• Blood glucose returns to normal concentration [6]
Total
14
AVAILABLE MARKS
75

BLANK PAGE
172

MARKSCHEME
Biology
[CODE]SPECIMEN
Unit 2
Foundation Tier
General Certificate of Secondary Education2018
173

AVAILABLE MARKS
174
4
5
5
6
AVAILABLE MARKS
1 Thick [1] No [1] High [1] No [1]
2 (a) (i) A – Prostate gland [1] B – Testis [1]
(ii) C – Sperm/urine pass out of the body [1]
(b) Where the temperature is lower than body temperature/ at ideal temperature [1] More sperm produced/greater sperm production [1]
3 (a) (i) Airborne droplet infection/coughing/sneezing [1]
(ii) HIV/virus [1]
(iii) Potato blight [1]
(b) Inside/frozen parts would not reach a high [enough] temperature/75 °C [1] To kill microorganisms/bacteria/Salmonella [1]
4 (a) Males – taller/higher maximum height [1] Males – larger/wider range Males – lower percentage of population at mean height [1] Accept – converse for females (b) (i) Continuous [1]
(ii) Large number of values possible/in between values possible [1] Suitable data, e.g. Males can be 155, 156, 157… [1]
(c) Environmental/named example [food] [1]

AVAILABLE MARKS
175
6
AVAILABLE MARKS
5 Indicative content: 1 Phagocytes/phagocytosis 2 White blood cells in blood/capillary 3 White blood cells move/squeeze through capillary wall; into body tissues 4 White blood cells move towards/attracted to bacteria 5 White blood cells engulf bacteria 6 Enzymes secreted 7 Bacteria digested/broken down 8 Break down products of bacteria released from white blood cells
Band Response Mark
A
The candidate selects at least five of the indicative points. The relevant material is organised with a high degree of clarity and coherence. There is widespread and accurate use of specialist vocabulary. Presentation, spelling, punctuation and grammar are of a sufficiently high standard to make the meaning clear.
[5]–[6]
B
The candidate selects at least three of the indicative points. The relevant material is organised with some degree of clarity and coherence. There is some use of specialist vocabulary. Presentation, spelling, punctuation and grammar are of a sufficiently competent standard to make the meaning clear.
[3]–[4]
C
The candidate selects at least one of the indicative points. The organisation may lack clarity and coherence. There is little use of specialist vocabulary. Presentation, spelling, punctuation and grammar may be such that the meaning is not clear.
[1]–[2]
Response is not worthy of credit. [0]
[6]

AVAILABLE MARKS
176
6
8
10
AVAILABLE MARKS
6 (a) (i) Larger volume of blood per beat [1]
(ii) More beats per minute [1]
(b) Increase in blood to the muscle [1] More glucose/oxygen to/carbon dioxide from [muscles] [1] For respiration/energy production [1]
(c) Strengthens the heart muscle [1]
7 (a) A [1] C [1] T [1]
(b) Double helix [1]
(c) Circles drawn around: sugar; and [1] phosphate. [1]
(d) Short length of DNA/section of a chromosome [1] Codes for amino acid/protein/characteristic [1]
8 (a) (i) Shaded: Day 1–5 [1]
(ii) Day 16–28 shaded [1]
(b) Egg still alive/may not have passed out of the body yet [1] Sperm can meet egg [1]
(c) Progesterone [1]
(d) (i) Hormone implant [1] 0.05% [1]
(ii) Physical/mechanical barrier [1]
(e) Changes hormone levels [1] Prevents ovaries from releasing eggs [1]
9 (a) Mitosis [1]
(b) (i) Stage B has no nucleus/nuclear membrane [1] Chromosomes have doubled/replicated [1]
(ii) X – Cell membrane [1]

AVAILABLE MARKS
177
10
11
6
6
AVAILABLE MARKS
(iii) Nuclear membrane drawn in both [1] Pair of chromosomes (1 white, 1 black) in each nucleus [1]
(c) (i) Man/humans [1] Picked cows with highest milk yield [1] Bred them together [1]
(ii) Calve more often and increases protein content (need both) [1]
10 (a) Left ventricle [1] Pumps blood out of heart/into the aorta/around the body [1]
(b) X – Has to pump the blood further/higher pressure [1] Accept – converse for Y
(c) Percentage of people with unhealthy levels of cholesterol increases with age [1]
(d) Build-up of cholesterol leads to blockage/clot formation in blood vessels leading to brain [1]
Reduced oxygen/glucose to cells [1] Reduced cell respiration/cell death [1]
(e) Identical drawing [1] with the addition of fatty deposits within the lumen [1]
(f) (i) Statins/aspirin [1]
(ii) Stents/angioplasty [1]
11 (a) Pulmonary artery [1] to [1] Kidneys [1] Hepatic vein [1]
(b) Any two from: • Vena cava carries deoxygenated blood, aorta carries oxygenated/vena
cava less oxygen• Vena cava carries high carbon dioxide, aorta low carbon dioxide/
vena cava more carbon dioxide• Vena cava at lower pressure/aorta at higher pressure [2]
12 (a) Movement/diffusion of water (molecules) [1] From dilute solution to a more concentrated solution [1] Through a selectively permeable membrane [1]
(b) C; A; B [2] [3 correct = 2 marks, 1 correct = 1 mark]
(c) B [1]

AVAILABLE MARKS
178
7
90
AVAILABLE MARKS
13 (a) (i) Uncontrolled/abnormal cell division [1]
(ii) UV light/sun/sunlight [1]
(iii) It can spread into blood stream/is invasive [1]
(b) (i) 6 805 ÷ 100 [1] × 38.4 = 2 613 [1]
(ii) Legs of men covered more often (by trousers) [1]
(iii) Men often remove their shirts/tops [1]
Total

MARKSCHEME
Biology
[CODE]SPECIMEN
Unit 2
Higher Tier
General Certificate of Secondary Education2018
179
AVAILABLE MARKS
180
6
6
7
6
AVAILABLE MARKS
1 (a) Pulmonary artery [1] to [1] Kidneys [1] Hepatic vein [1]
(b) Any two from: • Vena cava carries deoxygenated blood, aorta carries oxygenated/vena
cava less oxygen• Vena cava carries high carbon dioxide, aorta low carbon dioxide/
vena cava more carbon dioxide• Vena cava at lower pressure/aorta at higher pressure [2]
2 (a) Movement/diffusion of water [1] From dilute solution to a more concentrated solution [1] Through a selectively permeable membrane [1]
(b) C; A; B [2] [3 correct = [2] marks, 1 correct = [1] mark]
(c) B [1]
3 (a) (i) Uncontrolled/abnormal cell division [1]
(ii) UV light/sun/sunlight [1]
(iii) It can spread into blood stream/is invasive [1]
(b) (i) 6 805 ÷ 100 [1] × 38.4 = 2 613 [1]
(ii) Legs of men covered more often (by trousers) [1]
(iii) Men often remove their shirts/tops [1]
4 (a) (i) A – Blood plasma/plasma [1] Function: Any one from:
• To carry/transport named substance around the body (urea/glucose/carbon dioxide/hormones)
• Transport heat/maintain body temperature• Forms tissue fluid [1]
(ii) B – Red blood cell [1] Adaption: large surface area [biconcave shape]/ contains haemoglobin [1]
(b) (i) Any one from: • When pathogens enter the body/fights (named) disease • During some cancers/cancer treatment [1]
(ii) Numbers increase/decrease Credit only if appropriate to answer in (b)(i) [1]

AVAILABLE MARKS
181
12
6
7
AVAILABLE MARKS
5 (a) (i) Ovary [1]
(ii) Independent assortment [1]
(iii) Haploid [1]
(b) Flagellum/tail for swimming/movement [1] Haploid nucleus [1]
(c) (i) A – Oviduct [1] B – Cervix [1] C – Vagina [1]
(ii) X – Ovary [1]
(iii) Y – Lining of the uterus [1]
(d) Fertilised egg/zygote divides by mitosis [1] Grows into a ball of cells/embryo [1]
6 (a) Any two from:• Failure to produce eggs/ova• Blocked/twisted oviducts• Complications of sexually transmitted infections• Lining of uterus does not develop properly/problems with implantation• Vagina hostile to sperm/lining is too thick/lining is too acidic• Not enough sperm produced/sperm not healthy• Impotence [2]
(b) Fertility drugs/hormones given to woman to increase production of eggs Eggs collected from ovaries (surgically) Sperm donated/mixed with eggs in laboratory/described Successful embryos placed into mother’s uterus [4]
7 (a) Genetic engineering [1]
(b) (i) Restriction enzymes [1]
(ii) Enzymes creates exposed (DNA) bases/sticky ends [1] Complementary to those in the spider silk gene [1] Allows goat DNA and spider gene to bind to base pairing [1]
(c) Extraction of silk protein from milk/purification Modification/spinning/packaging [2]8 (a) (i) They are cheaper to produce [1] There is more profit [1]

AVAILABLE MARKS
182
11
7
AVAILABLE MARKS (ii) Any three from:
• Antibiotics are used to treat bacterial infections• Company has only two in development• Takes the company 9.5 years to develop an antibiotic• Running out of antibiotics/ bacteria are increasing their antibiotic
resistance [3]
(b) (i) Preclinical – check if drug is poisonous [1] and how effective it is. [1] Clinical – to determine the optimum dosage of the drug [1]
(ii) Prevent animal suffering [1]
(iii) Animals are different from humans/ what works in animals may not work in humans [1]
(iv) Cells/tissue [models] [1]
9 (a) Test cross [1]
(b) (i) Short plants in the offspring [1] Unknown genotype must carry a recessive allele/be Tt [1] or Short plants can only be produced if both recessive alleles are present Unknown plant must have been a carrier of the recessive allele/ both parents must have at least one recessive allele.
(ii) T, t; [1] Tt, Tt; [1] tt, tt; [1]
(iii) Larger numbers are required to see the frequency of all genotypes [1]
[1] mark for H each column

AVAILABLE MARKS
183
10
AVAILABLE MARKS
10 (a) Range [several types] of a trait/characteristic [1] in the same species. [1]
(b) Indicative content: 1 Mutations/sexual reproduction causes variation in a population 2 In sandy areas light coat/in dark areas dark coat provides camouflage 3 This provides an advantage against predation/owls/less predation 4 Individuals with advantage are more likely to survive/differential survival 5 Individuals with an advantage reproduce 6 Individuals with an advantage pass on genes [to next generation] 7 Individuals with the advantage increase in numbers 8 Individuals without the advantage decrease in number/become extinct
Band Response Mark
A
The candidate selects at least five of the indicative points. The relevant material is organised with a high degree of clarity and coherence. There is widespread and accurate use of specialist vocabulary. Presentation, spelling, punctuation and grammar are of a sufficiently high standard to make the meaning clear.
[5]–[6]
B
The candidate selects at least three of the indicative points. The relevant material is organised with some degree of clarity and coherence. There is some use of specialist vocabulary. Presentation, spelling, punctuation and grammar are of a sufficiently competent standard to make the meaning clear.
[3]–[4]
C
The candidate selects at least one of the indicative points. The organisation may lack clarity and coherence. There is little use of specialist vocabulary. Presentation, spelling, punctuation and grammar may be such that the meaning is not clear.
[1]–[2]
Response not worthy of credit. [0]
[6]
(c) Any two from:• [Natural selection] causes gradual changes [in an organism] [1]• Over a long period of time, can lead to development of a new species
[1]
AVAILABLE MARKS
184
12
90
AVAILABLE MARKS
11 (a) X chromosome [1]
(b) (i) 3, son [1] 10, grandson [1]
(ii) Their mothers are carriers/carry haemophilia gene on their X chromosome [1] They inherited the haemophilia gene from their mother [1] Only get one X chromosome/Y chromosome does not contain the haemophilia gene [1]
(c) (i) Amniocentesis [1]
(ii) Miscarriage/death of foetus [1]
(iii) Any two from:• Who decides who will be tested• Dilemma of positive test• Should genetic information be made available to wider society, e.g.
insurance companies [2]
(iv) Down’s Syndrome [1]
(v) Circle drawn round chromosomes 21 [1]
Total

MARKSCHEME
Biology
[CODE]SPECIMEN
Practical Skills Assessment Unit 3
Booklet A
Foundation TierGeneral Certificate of Secondary Education
2019
185
Unit 3 Practical Skills Assessment
Booklet AFoundation Tier

AVAILABLE MARKS
186
Task 1 (a) 50cm × 50cm ⁄ 0.5m × 0.5m ⁄ 0.25m2 [1] Correct units used [1] [2]
(b) Mark off/map/measure area using measuring tape [1] Position quadrat randomly/using random numbers/throwing over shoulder/ appropriate method described [1] Identify each species [1] Count/record the number of plants of each species inside the quadrat [1] Calculate the average number of each species per quadrat [1] [5]
(c) Heading – Number of plants/weeds in quadrat [1] Plant species – Daisy, Dandelion, Plantain [1] Counts replicated [2] [4]
(d) Calculation: Average number of plants per quadrat ÷ area of quadrat m2 [1] Correct computation to nearest whole number [1] [2]
Task 2 (a) Appropriate measurement [=/> 50] [1] mm [1] [2]
(b) Appropriate headings with units for each column [2] Final lengths recorded accurately [1]
Change in length calculated and recorded accurately [2] [5]
(c) Own results for change in length of potato chip recorded [1] Results from two other groups recorded [1] Average changes in length of potato chip calculated and recorded [2] [4]
(d) x-axis labelled + units/ Concentration of sucrose solution/M [1]
y-axis labelled + units/ Average change in length of potato chip/mm [1]
Appropriate scale (use at least half a page) [1]
Accurate plots [×2] [2]
Line joining points [1] [6]
Total
13
17
30

MARKSCHEME
Biology
[CODE]SPECIMEN
Unit 3 Practical Skills
Booklet A
Higher Tier
General Certificate of Secondary Education2019
187
Unit 3 Practical Skills Assessment
Booklet AHigher Tier

AVAILABLE MARKS
188
Task 1 (a) 50cm × 50cm × 0.5m × 0.5m × 0.25m2 [1] Correct measurements of quadrat used [1] [2]
(b) Mark off/map/measure area [1] Position quadrat randomly/using random numbers/throwing over shoulder/ appropriate method described [1] Identify each species [1] Count/record the number of plants of each species inside the quadrat [1] Calculate the average number of each species per quadrat [1] [5]
(c) Heading – Number of plants/weeds in quadrat [1] Weed species – Daisy, Dandelion, Plantain [1] Counts repeated [2] [4]
(d) Calculation: Average number of plants per quadrat × (1 ÷ area of quadrat [m]) [1] Correct computation to nearest whole number [1] [2]
Task 2 (a) Starting masses of the five potato chips accurately recorded [1]
Masses of the five potato chips after 24 hours accurately recorded [1] Percentage change in mass calculated for each potato chip [2] [4]
(b) (i) Because the starting masses are not all the same/equal [1]
(ii) Dried the potato chips [1] Left the potato chips in the solution for 24 hours [1] [2]
(c) Own results for percentage change in mass of potato chip accurately recorded [1]
Results from two other groups recorded [1] Average percentage change in mass of potato chip calculated and recorded [2] [4]
(d) x-axis labelled + units/ Concentration of sucrose solution/M [1]
y-axis labelled + units/ Percentage change in mass of potato chip [1]
Appropriate scale (use at least half a page) [1]
Accurate plots (×2) [2]
Points joined by smooth curve as line of best fit [1] [6]
Total
13
17
30

MARKSCHEME
Biology
[CODE]SPECIMEN
Unit 3 Practical Skills
Booklet B
Foundation Tier
General Certificate of Secondary Education2019
189
Unit 3 Practical Skills Assessment
Booklet B
Foundation Tier

AVAILABLE MARKS
190
1 (a) Add drop of water to a clean slide [1] Place thin section layer of plant cells on the water [1] Hold cover glass/slip at angle to the water [1] (Use forceps to) slowly lower cover glass/slip onto slide [1]
(b) How they formed: bubbles (of air) between the slide and cover slip/cover glass/described [1] Coverslip lowered too quickly [1]
(c) (i) Proportions – Length = 3× width [approx]/drawing fits box provided [1] Line style – single lines without breaks [1] Cell wall – shown as double line [1] Nucleus – approx correct size and position [1] Chloroplasts – approx same numbers and distribution [1]
(ii) 28 [±1] mm [1]
(iii) 28 ÷ 4000/28000 ÷ 4000 [1] 0.007(mm)/7 [1] µm/micrometres [1]
2 (a) (i) Heat in an autoclave/steam to [above] boiling point of water [1]
(ii) To kill microorganisms [1]
(b) (i) Sealed – to prevent the escape of cultured microorganisms/bacteria [1]
(ii) 20 ºC – prevent growth of [human] pathogenic microorganisms/bacteria [1]
(c) Any two from: • Concentration of the antibiotic• Size of the filter paper• Incubation time [2]
(d) Y has the largest [diameter] clear zone/correct diameter measurement [1] The larger the clear zone the more bacteria are killed/
the less resistant the bacteria are to the antibiotic [1]
15
8

AVAILABLE MARKS
191
3 (a) Placed in dark/cupboard [1] For 24<48 hours [1]
(b) (i) Demonstrate no starch present before experiment [1]
(ii) Yellow-brown [1]
(iii) Indicative content: 1. Boil leaf in water 2. To kill leaf/break down cell membranes 3. Boil in ethanol/alcohol 4. To remove/dissolve the chlorophyll 5. Dip in water 6. To soften leaf 7. Cover with iodine (solution) 8. Colour change yellow-brown to blue-black shows presence of starch
Band Response Mark
A
The candidate selects at least five of the indicative points. The relevant material is organised with a high degree of clarity and coherence. There is widespread and accurate use of specialist vocabulary. Presentation, spelling, punctuation and grammar are of a sufficiently high standard to make the meaning clear.
[5]–[6]
B
The candidate selects at least three of the indicative points. The relevant material is organised with some degree of clarity and coherence. There is some use of specialist vocabulary. Presentation, spelling, punctuation and grammar are of a sufficiently competent to make the meaning clear.
[3]–[4]
C
The candidate selects at least one of the indicative points. The organisation may lack clarity and coherence. There is little use of specialist vocabulary. Presentation, spelling, punctuation and grammar may be such that the meaning is not clear.
[1]–[2]
Response not worthy of credit. [0]
[6]
(c) (i) Green area to left of lightproof paper shaded [1] Green area to right of lightproof paper shaded [1]
(ii) Light [1] Chlorophyll [1] 14

AVAILABLE MARKS
192
4 (a) Potometer [1]
(b) Description: Bubble moves [1] towards shoot [1] Explanation: Water absorbed/taken up by shoot/evaporates from leaves [1] draws water from capillary tube [1]
(c) Record distance bubble moves Record time taken for movement Repeat [credit once only]/calcaulate average Use fan at different distances from potometer/use fan and no fan [4]
(d) Wind [speed]/air movement [1]
5 (a) (i) Reduce heat loss To the atmosphere/air [2]
(ii) Allow air/oxygen/O2 to enter [1] so pasta can burn completely [1] [2]
(b) 8 [1] 16 [1] = 8 [1]
(c) Any two from:• Heat loss to tin/test tube/pin/plasticine• Inaccurate measurement of temperature/mass of water• Water not mixed before temperature taken/maximum temperature not
taken [2]
10
9
AVAILABLE MARKS
193
6 (a) (i) Carbon dioxide/CO2 [1]
(ii) Water bath [1]
(b) (i) Axis label + units (×2) [2] Accurate plots (×2) [2] Line drawn [point to point] [1]
(ii) Volume of gas increases slowly (between 0-15°C) [1] Volume of gas increases fastest (between 15-25°C) [1] Volume of gas levels off/slows again (above 25°C) [1] Final mark is awarded for the use of specific quantitative data from the graph to support any one of the above points [1]
(iii) Above 45 °C would kill the yeast/denature enzymes [1]
(iv) Mass of yeast used [1] Mass/volume/concentration of glucose solution [1]
Total
14
70

BLANK PAGE
194

MARKSCHEME
Biology
[CODE]SPECIMEN
Unit 3 Practical Skills
Booklet B
Higher Tier
General Certificate of Secondary Education2019
195
Unit 3 Practical Skills Assessment
Booklet B
Higher Tier

AVAILABLE MARKS
196
AVAILABLE MARKS
1 (a) Add drop of water to a clean slide [1] Place thin section layer of leaf cells on the water [1] Hold cover glass/slip at angle to the water [1] (Use forceps to) slowly lower cover glass/slip onto slide [1]
(b) How they formed bubbles (of air) [1] Between the slide and cover slip/cover glass/described [1]
(c) (i) Proportions – Length = 3× width [approx]/drawing fits box provided [1] Line style – single lines without breaks [1] Cell wall – shown as double line [1] Nucleus – approx correct size and position [1] Chloroplasts – approx same numbers and distribution [1]
(ii) [Measurement] 20mm [1] 20 × 1000 ÷ 5 [1] = 4000 [1]
(iii) [Measurement] 28mm [1] 28 × 4000/28000 ÷ 4000 [1] 7µm/micrometres [1]
2 (a) (i) Heat in an autoclave/steam to [above] boiling point of water [1]
(ii) To kill microorganisms [1]
(b) (i) Sealed – to prevent the escape of cultured microorganisms/bacteria [1]
(ii) 20 ºC – prevent growth of [human] pathogenic microorganisms/bacteria [1]
(c) Any two from: • Concentration of the antibiotic • Size of the filter paper • Incubation time [2]
(d) Y has the largest [diameter] clear zone/correct diameter measurement; The larger the clear zone the more the bacteria are killed/
the less resistant the bacteria are to the antibiotic [2]
17
8

AVAILABLE MARKS
197
3 (a) Placed in dark/cupboard [1] For 24<48 hours [1]
(b) (i) Demonstrate no starch present before experiment [1]
(ii) Yellow-brown [1]
(iii) Indicative content: 1. Boil leaf in water 2. To kill leaf/break down cell membranes 3. Boil in ethanol/alcohol 4. To remove/dissolve the chlorophyll 5. Dip in water 6. To soften leaf 7. Cover with iodine (solution) 8. Colour change yellow-brown to blue-black shows presence of starch
Band Response Mark
A
The candidate selects at least five of the indicatice points. The relevant material is organised with a high degree of clarity and coherence. There is widespread and accurate use of specialist vocabulary. Presentation, spelling, punctuation and grammar are of a sufficently high standars to make the meaning clear.
[5]–[6]
B
The candidate selects at least three of the indicative points. The relevant material is organised with some degree of clarity and coherence. There is some use of specialist vocabulary. Presentation, spelling, punctuation and grammar are of a sufficiently competent to make the meaning clear.
[3]–[4]
C
The candidate selects at least one of the indicative points. The organisation may lack clarity and coherence. There is little use of specialist vocabulary. Presentation, spelling, punctuation and grammar may be such that the meaning is not clear.
[1]–[2]
Response not worthy of credit. [0]
[6]
(c) (i) To absorb CO2 [1]
(ii) CO2 [1]
(iii) Same apparatus [1] Water/no sodium hydroxide [1] 14

AVAILABLE MARKS
198
4 (a) Bubble [1] Potometer [1]
(b) Return bubble to bottom of capillary/zero on scale [1]
(c) Description: Bubble moves [1] towards shoot [1] Explanation: Water absorbed/taken up by shoot/evaporates from leaves [1] draws water from capillary tube [1]
(d) Record distance bubble moves [1] Record time taken for movement [1] Calculate rate/distance per unit time (described) [1] Repeat [credit once only]/calculate average [1] Use fan at different distances from potometer/use fan and no fan. [1]
(e) Any one from:• Shoots had different number of leaves/surface area• Different amounts of light on the shoots [1]
5 (a) (i) Reduce heat loss [1] To the atmosphere/air [1]
(ii) Allow air/oxygen/O2 to enter [1] so pasta can burn completely [1]
(b) (i) 25 × 20 × 4.2 [1] = 2100[J] [1]
(ii) 2100 ÷ 1.5 [1] = 1400[J] [1]
(iii) 1500kJ per 100g = 15000 J per g [1] [(15000 – 1400) × 100] ÷ 15000 [1] = 90.66 [accept 90/91%] [1]
(iv) Any two from: • Heat loss to: tin/test tube/pin/plasticine• Inaccurate measurement of temperature/mass of water• Water not mixed before temperature taken/
maximum temperature not taken [2]
13
13

AVAILABLE MARKS
199
6 (a) Carbon dioxide/CO2 [1]
(b) Drawing shows: Flask of yeast in beaker of water/electronic waterbath [1] Thermometer in beaker of water [1] Quality of drawing [1]
(c) Above 45 °C would kill the yeast/denature enzymes [1]
Total
5
70

BLANK PAGE
200


© CCEA 2017