Reporting in Visual Studio 1.pdf - CCEA
15
Page 1 of 15 Reporting in Visual Studio (1) These notes were originally created for those schools using VS2013 community and MS SQL server. For schools using VS 2013 community and using the service based db approach then follow similar instruction but skip part 6 as it has about connecting to the SQL server. Your database should automatically connect. For the purpose of familiarity create a table with 5 fields and populate 3 records, then use this as your first dataset. For the purpose of this exercise open ‘MS SQL Server’ and restore the database file <Studio2ForTesting.bak> which was sent in an email along with this tutorial. How do I create a report? 1. Open Microsoft Visual Studio Community 2013 and start a new solution. 2. Go to Project menu click Add New Item… 3. Select Reporting and then click Report, rename appropriately and click Add If the above window does not display when you click ‘Add New Item’ then do the following; • Right click on the project name in the Solution Explorer window, from the pop-up window select ADD and from the second pop-up window select NEW ITEM (see image below)
-
Upload
khangminh22 -
Category
Documents
-
view
1 -
download
0
Transcript of Reporting in Visual Studio 1.pdf - CCEA

Page 1 of 15
Reporting in Visual Studio (1) These notes were originally created for those schools using VS2013 community and MS SQL server. For schools using VS 2013 community and using the service based db approach then follow similar instruction but skip part 6 as it has about connecting to the SQL server. Your database should automatically connect. For the purpose of familiarity create a table with 5 fields and populate 3 records, then use this as your first dataset. For the purpose of this exercise open ‘MS SQL Server’ and restore the database file <Studio2ForTesting.bak> which was sent in an email along with this tutorial.
How do I create a report? 1. Open Microsoft Visual Studio Community 2013 and start a new solution. 2. Go to Project menu click Add New Item…
3. Select Reporting and then click Report, rename appropriately and click Add
If the above window does not display when you click ‘Add New Item’ then do the following; • Right click on the project name in the Solution Explorer window, from the pop-up window select ADD
and from the second pop-up window select NEW ITEM (see image below)

Page 2 of 15
The blank report will now open (shown below). Objects can be inserted into the report area for displaying on the report.
Expanded view of the report area.
4. If the Report Data Toolbox is not visible then select View from the menu bar and click on the last option Report Data, the toolbox should now display.
5. In the Report Data toolbox, expand the New menu and click Dataset… to open the Dataset Properties dialog:
Page 3 of 15
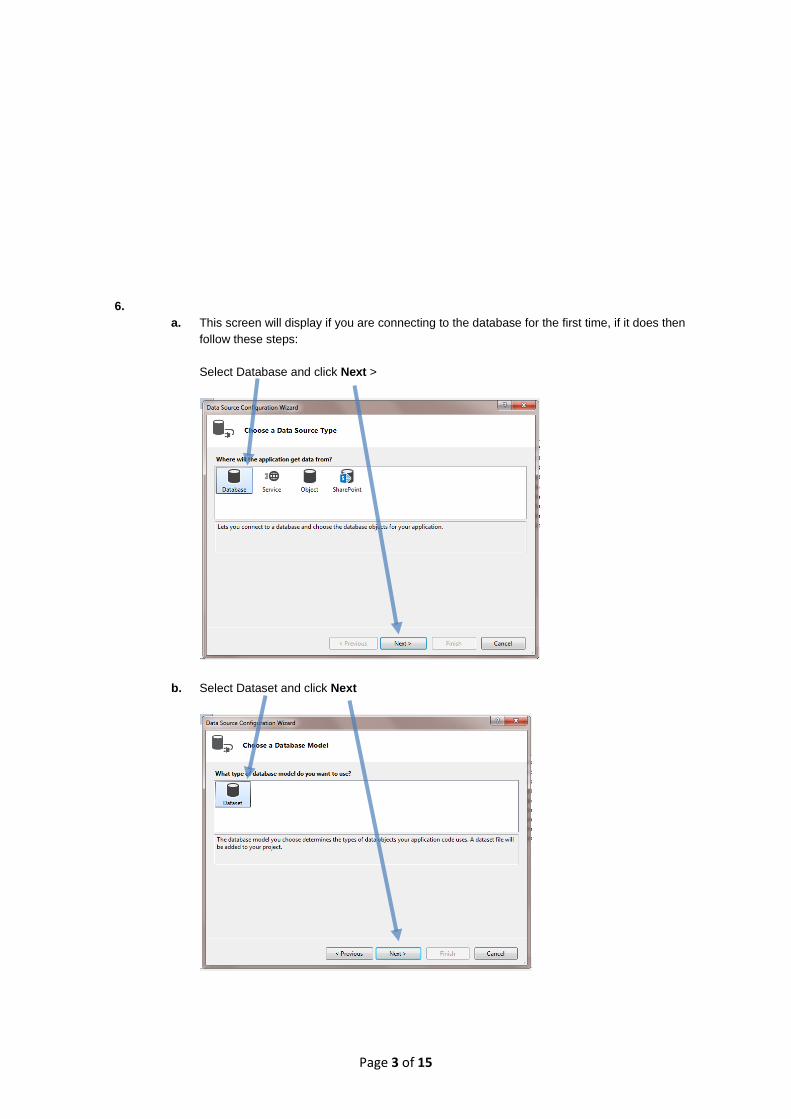
6. a. This screen will display if you are connecting to the database for the first time, if it does then
follow these steps: Select Database and click Next >
b. Select Dataset and click Next

Page 4 of 15
c. Click New Connection… to open the Add Connection dialog window
d. The Change Data Source window (shown below will) be displayed upon first use and you will select Microsoft SQL Server. On subsequent connections Microsoft SQL Server (SqlClient) will be selected by default. If not then click on Change to display the Change Data Source window, select it from the list and click OK.
e. Add Connection Dialog window

Page 5 of 15
f. Set Server name to LOCALHOST (you may have to type this) and select Use Windows Authentication (this is selected by default)
g. In Connect to a database section select your Database (e.g. Studio2ForTesting) then click OK
h. Click Next >

Page 6 of 15
i. Click Yes, save the connection as: name the connection then click Next
j. Select required database objects when prompted. Expand tables to see all the tables in the database (in this case we will select all the tables). You can also expand each table to see the fields in it. Then name the Dataset.
k. Click Finish. For the purpose of this example choose the Member dataset
l. Click OK

Page 7 of 15
Skip step 8 on the first occasion you make a connection to the database. This step is used when a connection has already been made and you want to make alternative reports.
8. If you have already made a connection to the database then when you select NEW > DATASET (step 6 above) the window below will display.
a. Name the Dataset, b. Select the Data source from the drop-down box
c. Select the Dataset from the drop-down box; you will see the fields available in box on the right of the window.
d. Click OK
You are now ready to add data to the blank report.

Page 8 of 15
The Report Data toolbox will now contain your selected fields and the Toolbox (you will need to select this) contains all the available objects for use in your report.
Report Area
Once you have added the objects to the report you must then add the report to a form in order to view it.
How do I add objects to a report? This report will simply display the details of all Studio2 members. We will now add a table to a report and connect it to the dataset we just created. Click on the Table option in the toolbox and drag it onto the report area.

Page 9 of 15
The report area will now appear as shown
Now expand the Members DataSet in the Report Data window,
And drag the fields you wish to display onto the grid, the grid will expand automatically as you drag in more fields.
Page 10 of 15
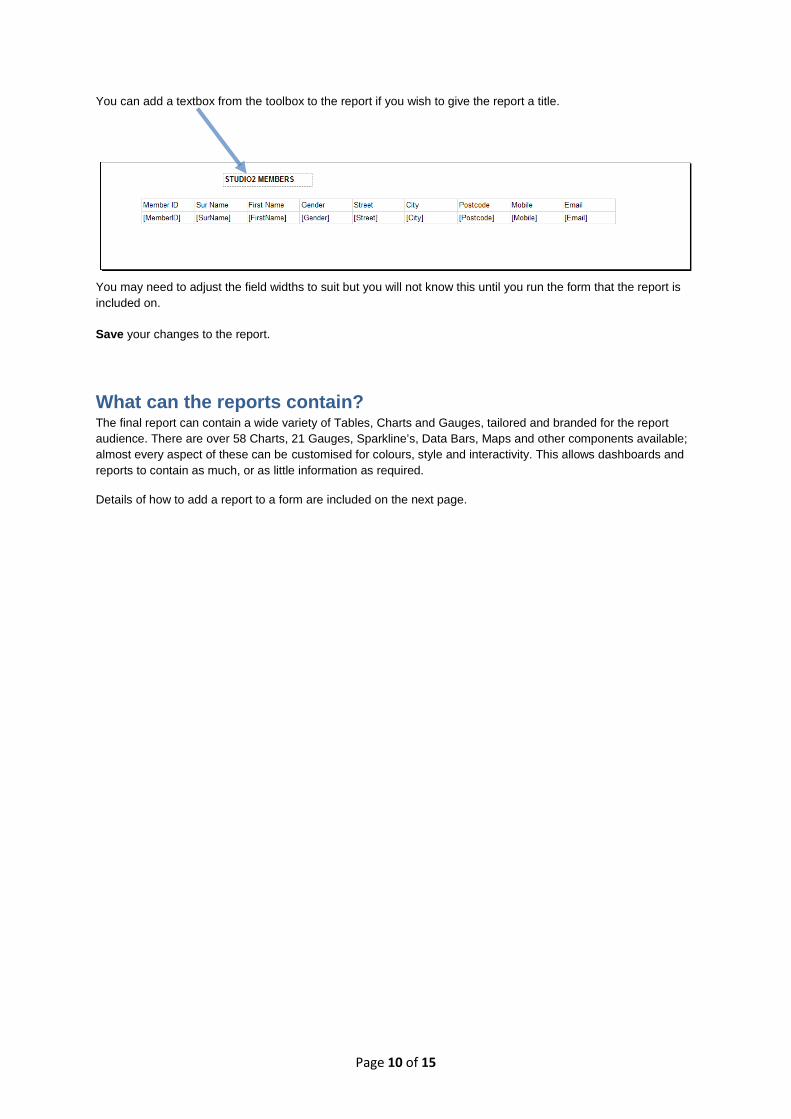
You can add a textbox from the toolbox to the report if you wish to give the report a title.
You may need to adjust the field widths to suit but you will not know this until you run the form that the report is included on. Save your changes to the report.
What can the reports contain? The final report can contain a wide variety of Tables, Charts and Gauges, tailored and branded for the report audience. There are over 58 Charts, 21 Gauges, Sparkline’s, Data Bars, Maps and other components available; almost every aspect of these can be customised for colours, style and interactivity. This allows dashboards and reports to contain as much, or as little information as required.
Details of how to add a report to a form are included on the next page.
Page 11 of 15
How do I add a report to a form?
As mentioned earlier, in order to view the report you must add it to a form.
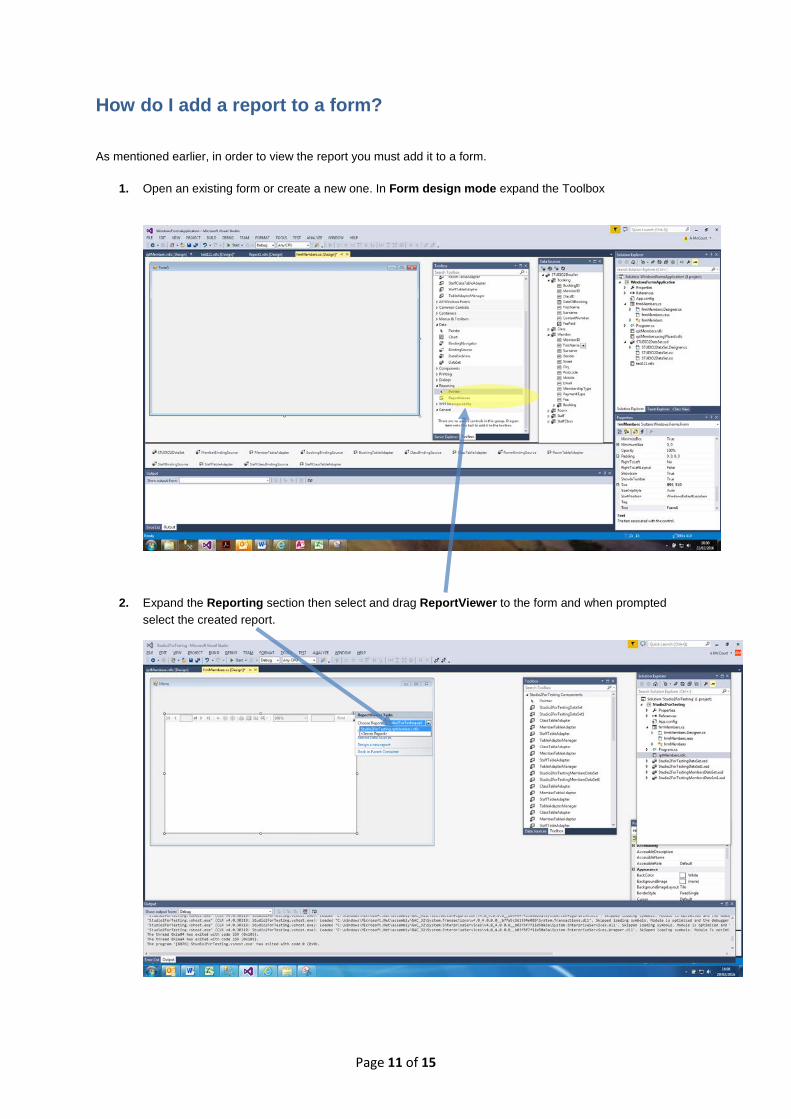
1. Open an existing form or create a new one. In Form design mode expand the Toolbox
2. Expand the Reporting section then select and drag ReportViewer to the form and when prompted select the created report.
Page 12 of 15
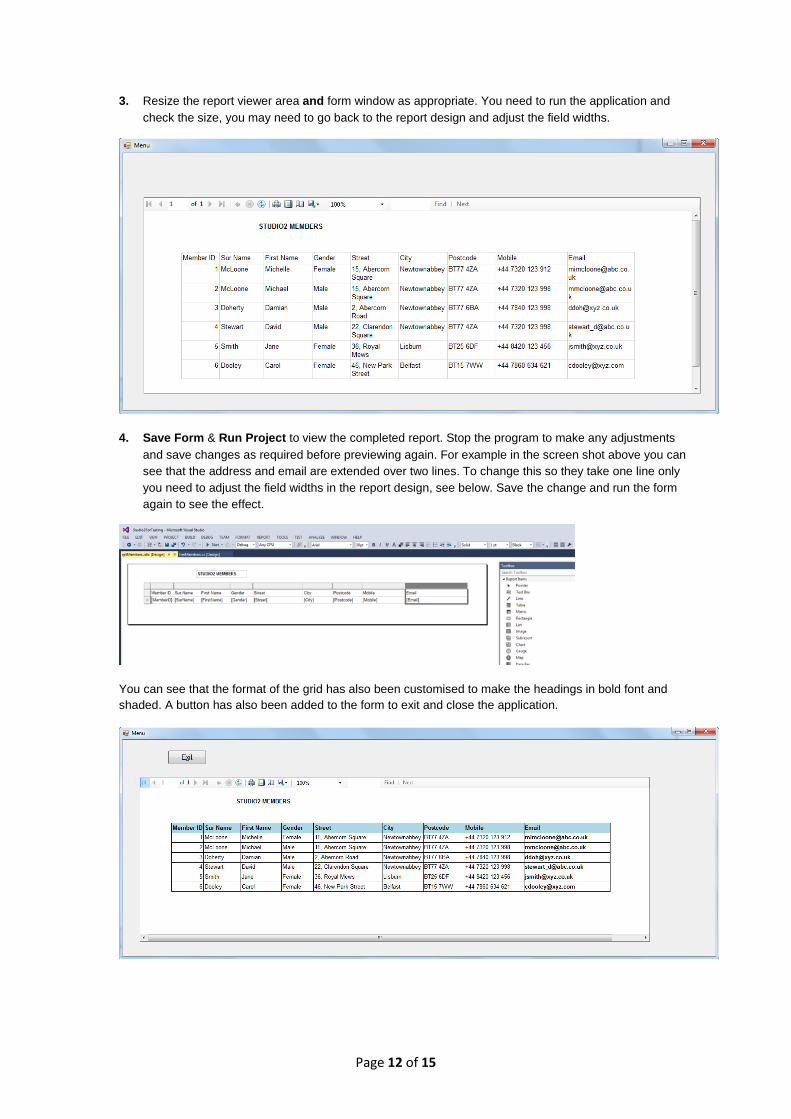
3. Resize the report viewer area and form window as appropriate. You need to run the application and check the size, you may need to go back to the report design and adjust the field widths.
4. Save Form & Run Project to view the completed report. Stop the program to make any adjustments and save changes as required before previewing again. For example in the screen shot above you can see that the address and email are extended over two lines. To change this so they take one line only you need to adjust the field widths in the report design, see below. Save the change and run the form again to see the effect.
You can see that the format of the grid has also been customised to make the headings in bold font and shaded. A button has also been added to the form to exit and close the application.

Page 13 of 15
5. The report can be saved as an Excel, Word or PDF file.
This icon is used to export the report. Click on it and choose the format you wish to save the report in.
There are several options available: Excel – The most common exported format, this exports the tables as editable data, with charts/graphs as static images. The formatting remains as close to the original report as possible, and will include some features such as Groupings and Sorting in the exported file (Note, formulas are not exported) PDF – Export in PDF format, wide compatibility, restricts editing. Word – The report can be deployed into a Microsoft Word format. Similar to excel the tables can be edited, but any interactive features are lost.
Saves the report in Word format.
This icon re-runs and refreshes the report data.
The Print icon is used to print the report.

Page 14 of 15
What else can I do with the reports? Reports can be designed to provide all the information on screen or alternatively to be exported to allow further analysis in Excel. Good report design allows the user to follow an interactive journey through the information, from a high level into the detail. There is a navigation toolbar on the main report screen, with the following options.
This allows you to move through multiple pages of a large report. You can also type a page number to go straight to that page.
The page zoom level, changing the way the page is displayed.
A search box; allows a text search through the entire report. Other examples of reporting objects. Charts Indicators

Page 15 of 15
Gauges Sparklines