Influence of soils and topography on Amazonian tree diversity: a landscape-scale study
33
The text that follows is a PREPRINT. Please cite as: Laurance, Susan G.W., Laurance, William F.; Andrade, Ana; Fearnside, Philip M.; Harms, Kyle E. Vicentini, Alberto & Luizão, Regina C.C. 2009. Influence of soils and topography on Amazonian tree diversity: A landscape-scale study. Journal of Vegetation Science. (in press) ISSN 1100-9233 International Association of Vegetation Science Opulus Press, Grangärde, Sweden. The original article will be available from: http://www.opuluspress.se
Transcript of Influence of soils and topography on Amazonian tree diversity: a landscape-scale study

The text that follows is a PREPRINT. Please cite as:
Laurance, Susan G.W., Laurance, William F.; Andrade, Ana; Fearnside, Philip M.; Harms, Kyle E. Vicentini, Alberto & Luizão, Regina C.C. 2009. Influence of soils and topography on Amazonian tree diversity: A landscape-scale study. Journal of Vegetation Science. (in press)
ISSN 1100-9233 International Association of Vegetation Science Opulus Press, Grangärde, Sweden. The original article will be available from: http://www.opuluspress.se
1
Influence of soils and topography on Amazonian tree diversity: a landscape-scale study
Susan G. W. Laurance1, William F. Laurance1,2*, Ana K. M. Andrade2, Philip M. Fearnside3,
Kyle E. Harms1,4, and Regina C. C. Luizão2
1Smithsonian Tropical Research Institute, Apartado 0843-03092, Balboa, Ancón, Panama
2Biological Dynamics of Forest Fragments Project, National Institute for Amazonian Research
(INPA), C.P. 478, Manaus, AM 69011-970, Brazil
3Department of Ecology, National Institute for Amazonian Research (INPA), C.P. 478,
Manaus, AM 69011-970, Brazil
4Department of Biological Sciences, Louisiana State University, Baton Rouge, LA 70803, USA
*Correspondence: William F. Laurance, Smithsonian Tropical Research Institute, Apartado
0843-03092, Balboa, Ancón, Panama. E-mail: [email protected]
ABSTRACT
We evaluated the influence of 14 soil and topographic features on species diversity of
rainforest trees (≥10 cm diameter-at-breast height) in central Amazonia, a region with nutrient-
starved soils but some of the biologically richest tree communities on earth. Our study was
based on a network of 63 1-ha plots scattered over an area of ~400 km2. An ordination analysis
identified three major edaphic gradients: (1) flatter areas had better soils (higher clay content,
carbon, nitrogen, phosphorus, pH, and exchangeable bases, and lower aluminum saturation)
than did slopes and gullies; (2) sandier soils had lower water storage (plant-available-water
capacity), phosphorus, and nitrogen; and (3) soil pH varied among sites. Gradient 2 was the
2
strongest predictor of tree diversity (species richness and Fisher’s alpha values), with diversity
increasing with higher soil fertility and water availability. Gradient 2 also was the best
predictor of the number of rare (singleton) species, which accounted for over half (56%) of all
species in each plot on average. We conclude that, although our plots invariably supported
diverse tree communities (≥225 species ● ha-1), the most species-rich sites (up to 310 species ●
ha-1) were least constrained by soil water and phosphorus availability. Intriguingly, the
numbers of rare and common species were not significantly correlated in our plots, and they
responded differently to major soil and topographic gradients. For unknown reasons rare
species were significantly more frequent in plots with many large trees.
Keywords
Amazon, density dependence, Fisher’s alpha, permanent plots, rare species, species diversity,
species richness, soil chemistry, soil texture, soil water, topography, tropical trees.
INTRODUCTION
Central Amazonia sustains some of the biologically richest tree communities on earth (Oliveira
& Mori, 1999; Leigh et al., 2004) and faces escalating pressures from forest colonization,
logging, and infrastructure expansion (Fearnside & Graça, 2006; Laurance & Luizão, 2007).
Understanding the factors that influence Amazonian tree diversity at varying spatial scales is
important for effective conservation planning and for assessing the potential threats from
imminent forest conversion on species survival (Laurance et al., 2001; Hubbell et al., 2008).
Although a number of studies have evaluated tree-community composition and
diversity at broad geographic scales in Amazonia (e.g. Prance, 1977; Gentry, 1990; Terborgh &
Andresen, 1998; ter Steege et al., 2000, 2006; Oliveira & Nelson, 2001; Pitman et al., 2002),
3
fewer have focused on variation at smaller landscape scales (e.g. Phillips et al., 2003; Tuomisto
et al., 2003; Valencia et al., 2004). Working in our same central-Amazonian study area,
Bohlman et al. (2008) recently assessed the influence of soils, topography, and geographic
distance on tree-community composition and β diversity, but did not consider factors affecting
tree diversity. Related work in this same study area has evaluated the influence of soils on tree
(Laurance et al., 1999) and liana (Laurance et al., 2001) biomass.
Here we assess the effects of soils and topography on tree diversity and abundance in a
central Amazonian landscape spanning about 400 km2. Our analysis is based on 63 1-ha plots
in which nearly all trees (≥10 cm diameter-at-breast-height) have been identified to species or
morphospecies level, and in which detailed data on soil chemistry, texture, and topography
were collected. Our study area, like much of the Amazon basin, overlays heavily weathered,
nutrient-starved soils (Sombroek, 1984, 2000; Richter & Babbar, 1991). Our findings provide
insights into how local edaphic features influence tree diversity in one of the world’s most
hyper-diverse forests.
METHODS
Study area
The study area is located 80 km N of Manaus, Brazil (2o 30' S, 60o W). Today, this area is a
partially fragmented landscape spanning ~1,000 km2 (Lovejoy et al., 1986; Laurance et al.,
2002), but the soil and floristic data reported here were collected before or during initial forest
clearing, from Jan. 1981-Jan. 1987. Rainforests in the study area are evergreen and terra-firme
(not seasonally flooded), and range from 50-100 m elevation. The climate is tropically hot
with total rainfall ranging from 1,900-3,500 mm. Monthly rainfall averages >100 mm even in
the dry season (June-October) although conditions can become unusually dry during occasional
4
El Niño years. During a severe drought in 1997, for example, dry-season rainfall was less than
a third of normal (Laurance, 2001).
The topography of the study area consists of undulating plateaus dissected by many
stream and river gullies. Flat areas tend to have high clay (45-75%) and organic-carbon (0.8-
3.3%) contents, which are associated with relatively high (although still very modest)
concentrations of important nutrients such as nitrogen (N) and exchangeable bases (Laurance et
al., 1999; Luizão et al., 2004; Castilho et al., 2006). On sloping terrain, however, a
‘podzolization’ process occurs over time because lateral water movement results in the gradual
destruction of clay-rich upper soil horizons. This ultimately leads to the creation of dendritic
valley systems with increasing sand on lower slopes and valley bottoms (Chauvel et al., 1987;
Bravard & Righi, 1989).
The soils in the study area are mostly classified as xanthic ferralsols (using the
FAO/UNESCO system; Beinroth, 1975). Ferralsols are widespread in the Amazon Basin,
heavily weathered, and usually have a low base saturation. They often are well aggregated,
porous, and friable, with variable clay contents. Clay particles in ferralsols can form very
durable aggregations, giving the soil poor water-holding characteristics, even with high clay
contents (Richter & Babbar, 1991). Xanthic ferralsols in the Manaus area are derived from
Tertiary deposits and are typically acidic and very poor in nutrients such as phosphorus (P),
calcium (Ca), and potassium (K) (Chauvel et al., 1987; Fearnside & Leal-Filho, 2001).
Tree communities
For this study we used data from 63 square, 1-ha plots scattered over an area of ~400 km2.
Plots were arrayed using a predetermined system of study grids, irrespective of local
topography or soils. Within each plot all trees (≥10 cm diameter-at-breast-height [dbh]) were
5
mapped, marked with a numbered aluminum tag, and measured for dbh. A sterile or fertile
voucher specimen was collected for nearly all trees and lodged in the BDFFP Herbarium,
Manaus, Brazil (see Laurance et al., 1998, 2006 for details). On average, 97.6% of the trees in
each plot were identified to species (or genus and morphospecies) level (range: 94.1-99.7%).
Non-identified trees were excluded from analyses.
We generated five parameters to assess tree diversity in each plot: (1) number of tree
stems; (2) overall species richness; (3) Fisher’s alpha, a diversity index that is quite insensitive
to variation in sample size (Magurran, 1988); (4) the number of ‘rare’ (singleton) species,
represented by just one individual per plot; and (5) the number of ‘common’ species, having
two or more individuals per plot.
Edaphic features
For each plot we derived 12 soil parameters from soil-surface samples (0-20 cm), using field
and laboratory methods detailed in Fearnside & Leal-Filho (2001) and briefly summarized
here. Although we did not sample deeper soil strata, surface soils tend to integrate the nutrient
cycle in the forest and thus represent local site characteristics, and also are the zone where tree
seedlings develop and obtain nutrients and water (Belknap et al., 2003).
Each 1-ha plot was divided into 25 quadrats of 20 X 20 m each. Within each plot, 9-13
quadrats were selected for sampling, using an alternating pattern to provide good coverage of
the plot. Within each quadrat, 15 surface samples were collected at haphazard locations using
a soil auger, then bulked and subsampled. Composite samples for each quadrat were
oven-dried, cleaned by removing stones and charcoal fragments, then passed through 20 mm
and 2 mm sieves. In all cases, values for soil parameters were derived separately for each
quadrat, and then combined to yield a mean value for each 1-ha plot.
6
Textural analyses were conducted to separate samples into percentage clay (particles
<0.002 mm diameter), silt (0.002-0.05 mm), and sand (0.05-2 mm) components, using the
pipette method. Clay and sand, the dominant soil components, were so strongly and negatively
associated (F1,61=1049.0, R2=94.5%, P<0.0001; linear regression) that the clay-sand gradient
could be represented by a single variable, percent sand content.
Plant-available-water capacity (PAWC), a measure of the amount of water the soil can
hold in a form extractable by plant roots, was estimated as the difference between the field
capacity (moisture content retained in soil under a suction of 0.33 atmospheres) and the wilting
point (moisture content retained at 15 atmospheres), using a pressure membrane apparatus.
Samples were dried, sieved, and re-wetted before determining available water capacity, making
the results only an index of water available to plants in the field.
A pH meter was used to measure soil pH. Total N was determined by Kjeldahl
digestion and total organic carbon (C) by dry combustion. Total P was determined by digestion
in HNO3+, HClO4, and HF, and reaction with ammonium molybdinate. Soil phosphate (PO43-)
was measured in an autoanalyzer using the molybdenum blue method. Organic (Walkley-
Black) carbon to total nitrogen (C:N) ratios were calculated to provide an index of N
availability; if C/N>15, N tends to be limiting for plant growth.
Cation exchange capacity (CEC) was the sum of K+, Ca2+, Mg2+, Al3+, and H+ ions.
Total exchangeable bases (TEB) was the sum of K+, Ca2+, Mg2+, and Na+. Aluminum
saturation was ((Al3+ + H+)/CEC) X 100. Cation concentrations were derived at the Brazilian
Center for Nuclear Energy and Agriculture (CENA), Piracicaba, São Paulo, using atomic
emission spectroscopy to assess K+ and atomic absorption spectrophotometry to determine
Ca2+, Mg2+, Na+, Al3+, and H+. Before analysis samples were digested in HClO4, HNO3, and
7
H2SO4, with extracts buffered to pH 7.0.
For each plot, slope was the average of the maximum slope (determined with a
clinometer) for each of the 25 quadrats. Plot aspect (percentage of quadrats with northern
aspects, facing 1-45o or 315-360o) was determined with a compass. Because our study area is
in the southern hemisphere, northern aspects receive greater direct insolation over the year than
do other aspects.
Data analysis
We used two strategies for data analysis. First, Pearson correlations were used to search for
associations between the edaphic and tree-diversity variables. This involved a substantial
number of tests, so a Bonferroni-corrected alpha value (P=0.011) was employed to reduce the
likelihood of spurious correlations, using an experiment-wise error rate of 0.15 to limit Type II
statistical errors (Chandler, 1995).
Second, we used an ordination analysis to identify major gradients in the edaphic data,
and then tested the effects of these gradients on tree diversity using multiple linear regressions.
This approach ensures that multiple regressions do not suffer from colinearity effects because
the ordination axes are statistically independent, and minimizes the chances of spurious
associations because only a few axes are tested. Best-subsets regressions were used to select
the predictors. Performance of the final regression models were assessed by comparing the
standardized residuals to the fitted values and to each significant predictor (Crawley, 1993).
We used a robust ordination method, nonmetric multidimensional scaling (NMS), on
the PC-ORD package (McCune & Mefford, 1995). All variables were weighted equally prior
to analysis with the standardization by maximum method (Noy-Meir et al., 1975).
Randomization tests (n=250) were used to determine the number of ordination axes that
8
explained significantly more variation than expected by chance.
For the predictor variables, data transformations were used as needed to reduce outliers
(i.e. percent slope, percent sand, and aspect data were arcsine-square-root transformed, whereas
C:N ratios were log-transformed). None of the five tree-community variables departed
significantly from normality (P>0.10 in all cases; Wilk-Shapiro tests), so none was
transformed.
RESULTS
Tree diversity and abundance
Across the 63 plots, species richness ranged from 225 to 310 species ● ha-1, averaging (±SD)
261±18 species ● ha-1. On average, 56% of the species in each plot (range 43-65%) were
classified as ‘rare’ (singletons), with the remainder being ‘common’ (>1 stem per plot).
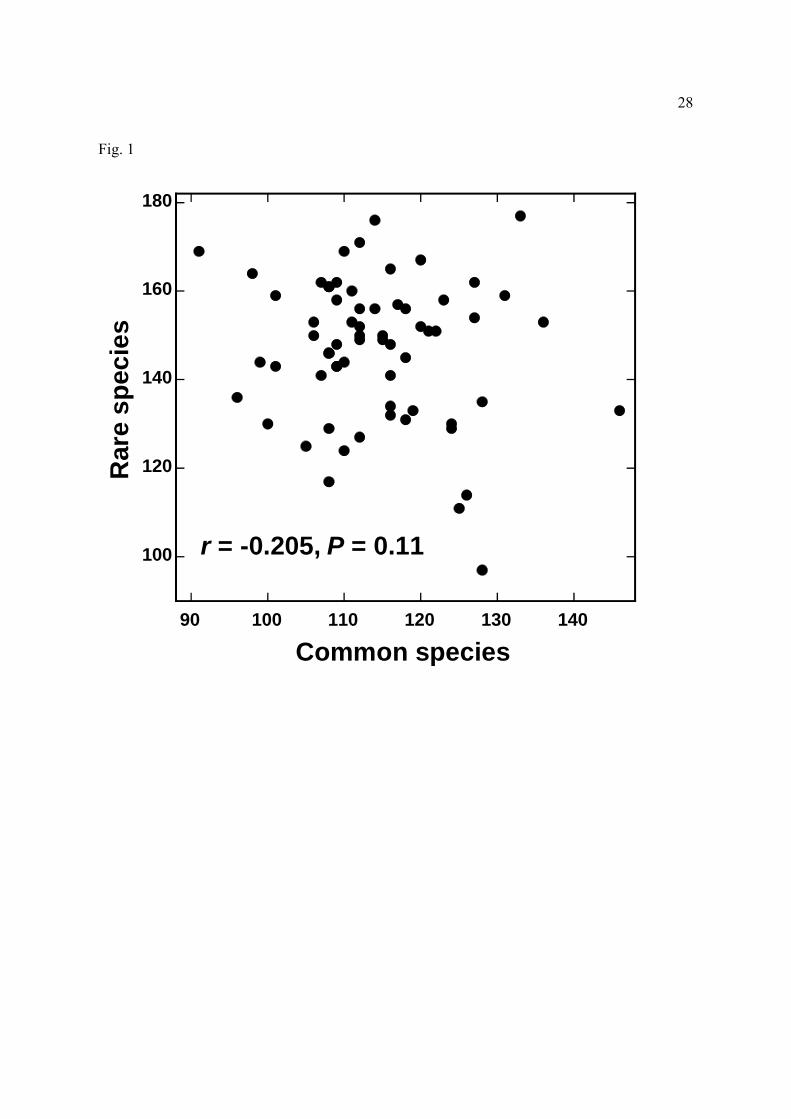
Notably, the numbers of rare and common species in each plot (Fig. 1) were not significantly
correlated (r= -0.205, P=0.11; Pearson correlation).
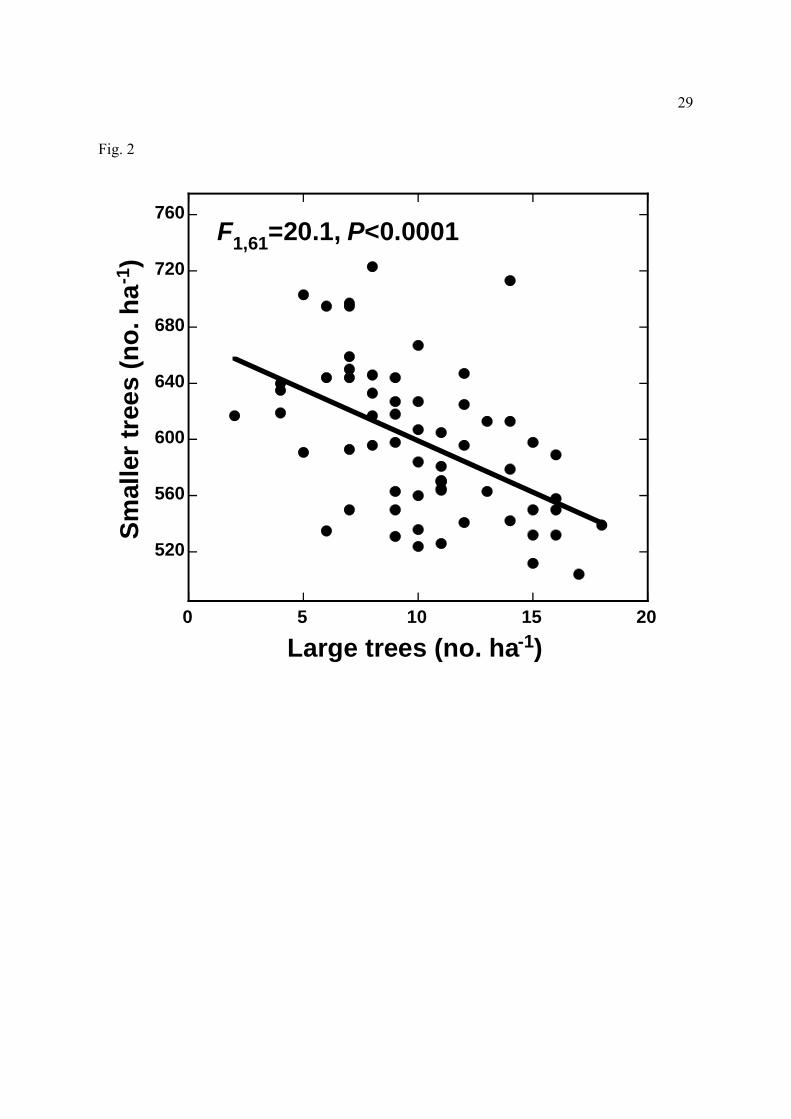
Tree density ranged from 521 to 731 stems per plot, averaging 608±52 stems ha-1. Plots
with many large (≥60 cm dbh) trees had fewer trees overall (F1,61=14.95, R2=19.7%,
P=0.0003), evidently because each large tree displaced many smaller trees, leading to lower
stem densities where large trees were abundant (Fig. 2). Plots with many stems tended to have
somewhat higher species richness than those with fewer stems, although the relationship was
not significant (F1,61=2.21, R2=3.7%, P=0.13).
As expected, Fisher’s alpha values were strongly and positively associated with species
richness (F1,61=109.37, R2=64.2%, P<0.0001). Fisher’s alpha values were strongly associated
with the number of rare species in each plot (F1,61=116.1, R2=65.6%, P<0.0001) but not with
the number of common species (F1,61=0.67, R2=1.1%, P=0.41; all linear regressions).
9
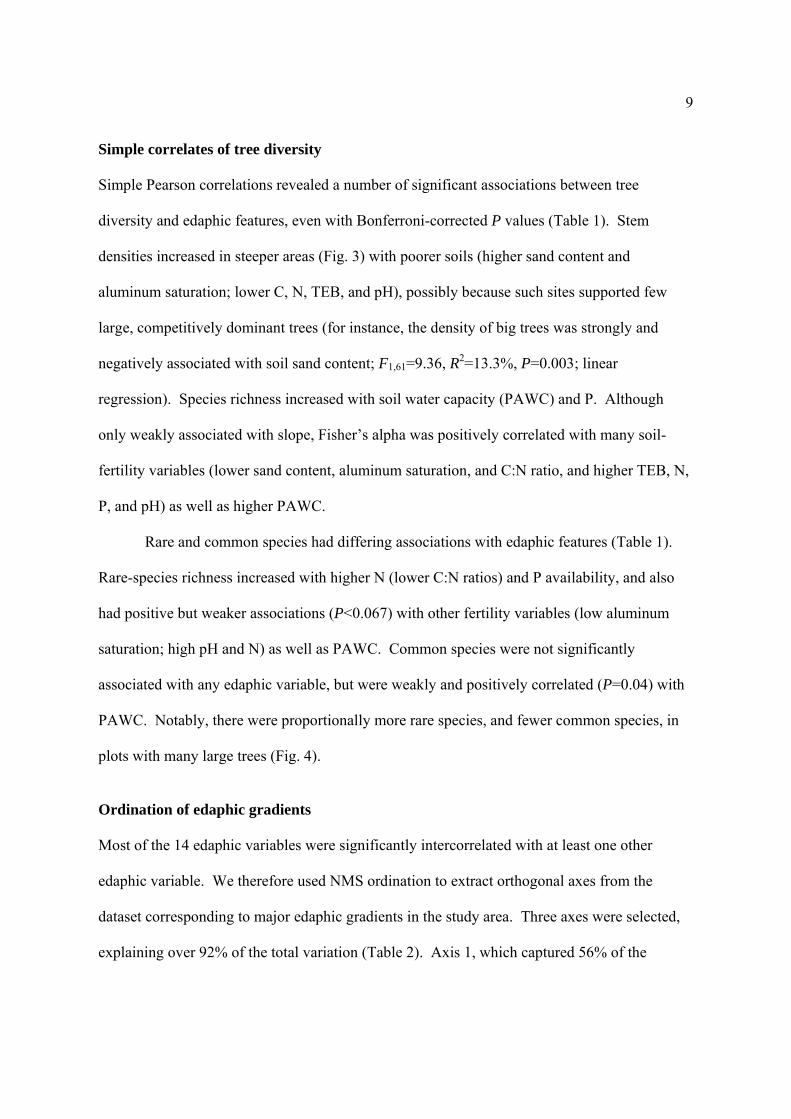
Simple correlates of tree diversity
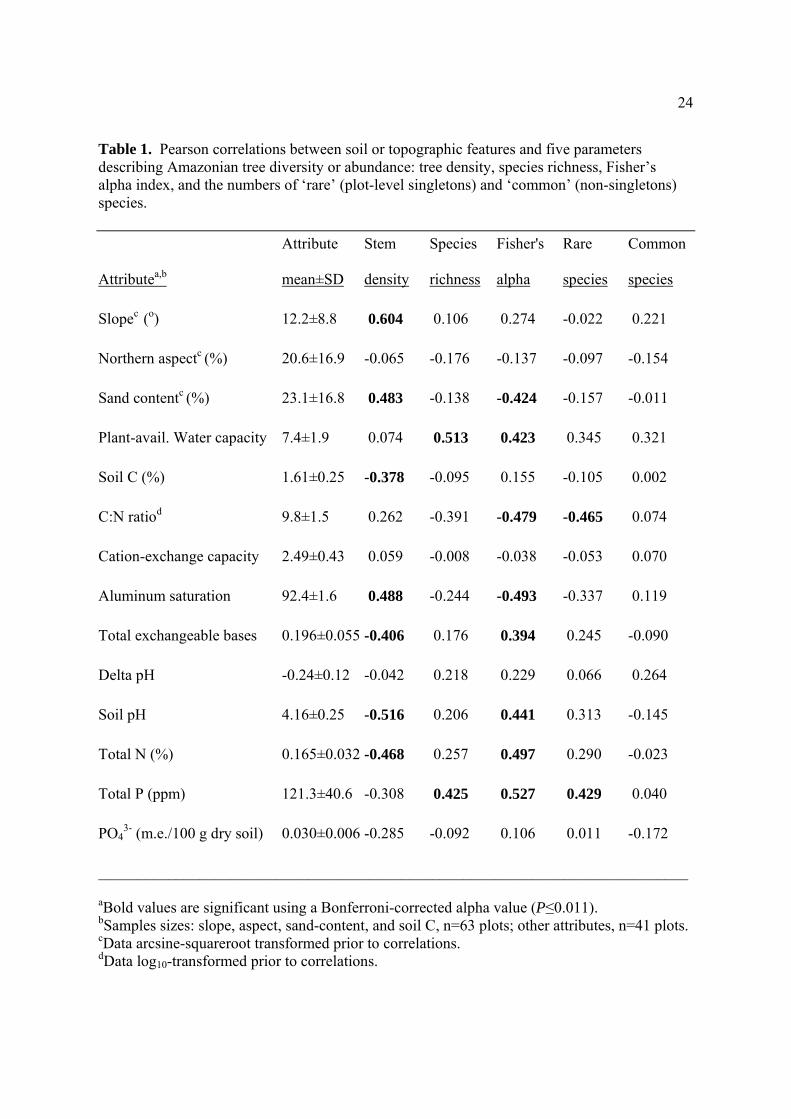
Simple Pearson correlations revealed a number of significant associations between tree
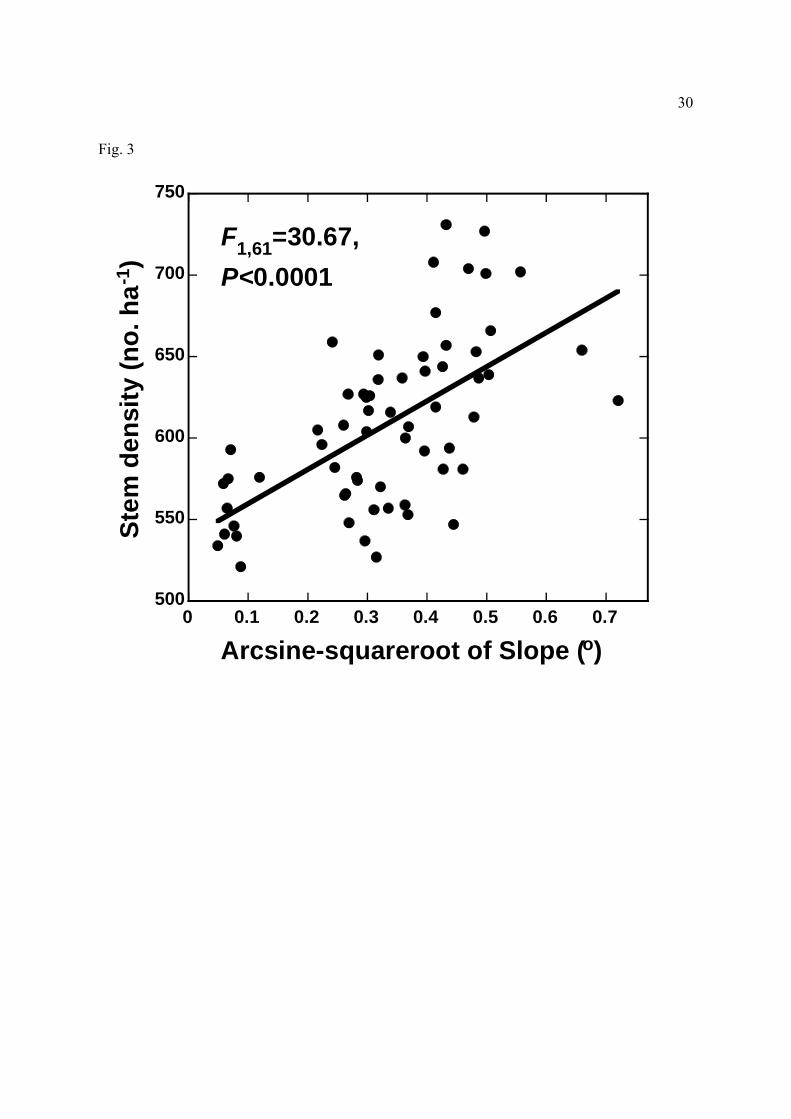
diversity and edaphic features, even with Bonferroni-corrected P values (Table 1). Stem
densities increased in steeper areas (Fig. 3) with poorer soils (higher sand content and
aluminum saturation; lower C, N, TEB, and pH), possibly because such sites supported few
large, competitively dominant trees (for instance, the density of big trees was strongly and
negatively associated with soil sand content; F1,61=9.36, R2=13.3%, P=0.003; linear
regression). Species richness increased with soil water capacity (PAWC) and P. Although
only weakly associated with slope, Fisher’s alpha was positively correlated with many soil-
fertility variables (lower sand content, aluminum saturation, and C:N ratio, and higher TEB, N,
P, and pH) as well as higher PAWC.
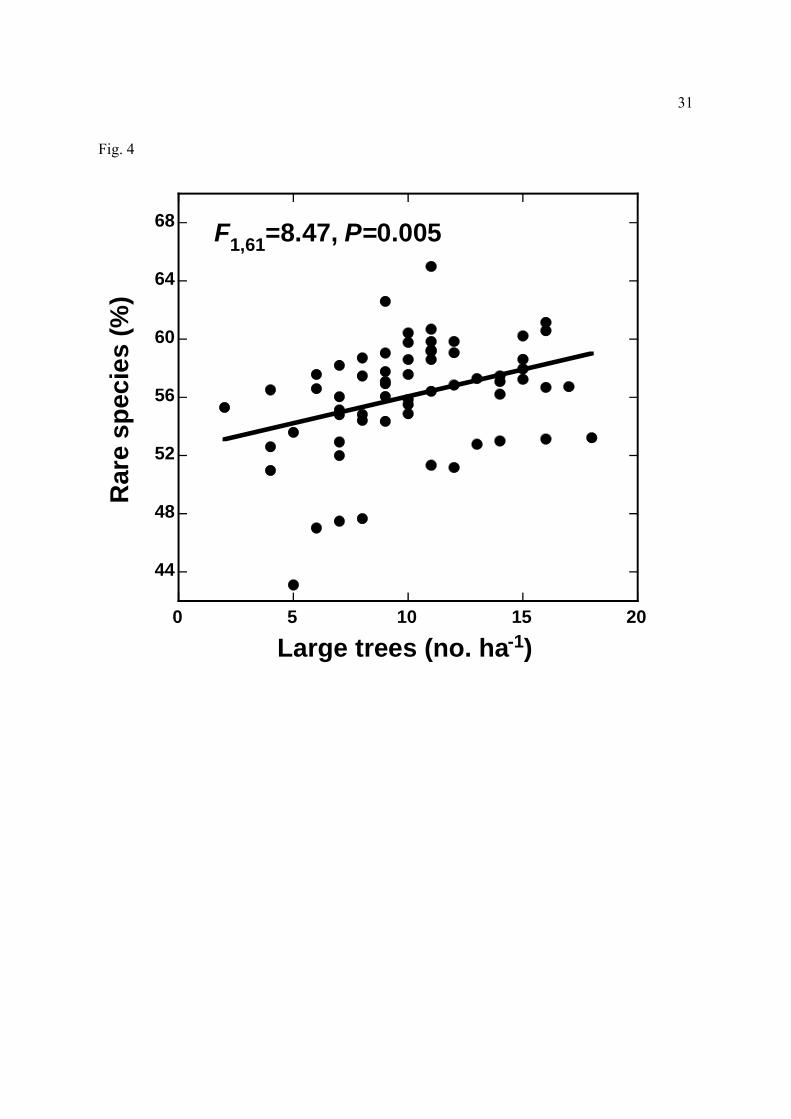
Rare and common species had differing associations with edaphic features (Table 1).
Rare-species richness increased with higher N (lower C:N ratios) and P availability, and also
had positive but weaker associations (P<0.067) with other fertility variables (low aluminum
saturation; high pH and N) as well as PAWC. Common species were not significantly
associated with any edaphic variable, but were weakly and positively correlated (P=0.04) with
PAWC. Notably, there were proportionally more rare species, and fewer common species, in
plots with many large trees (Fig. 4).
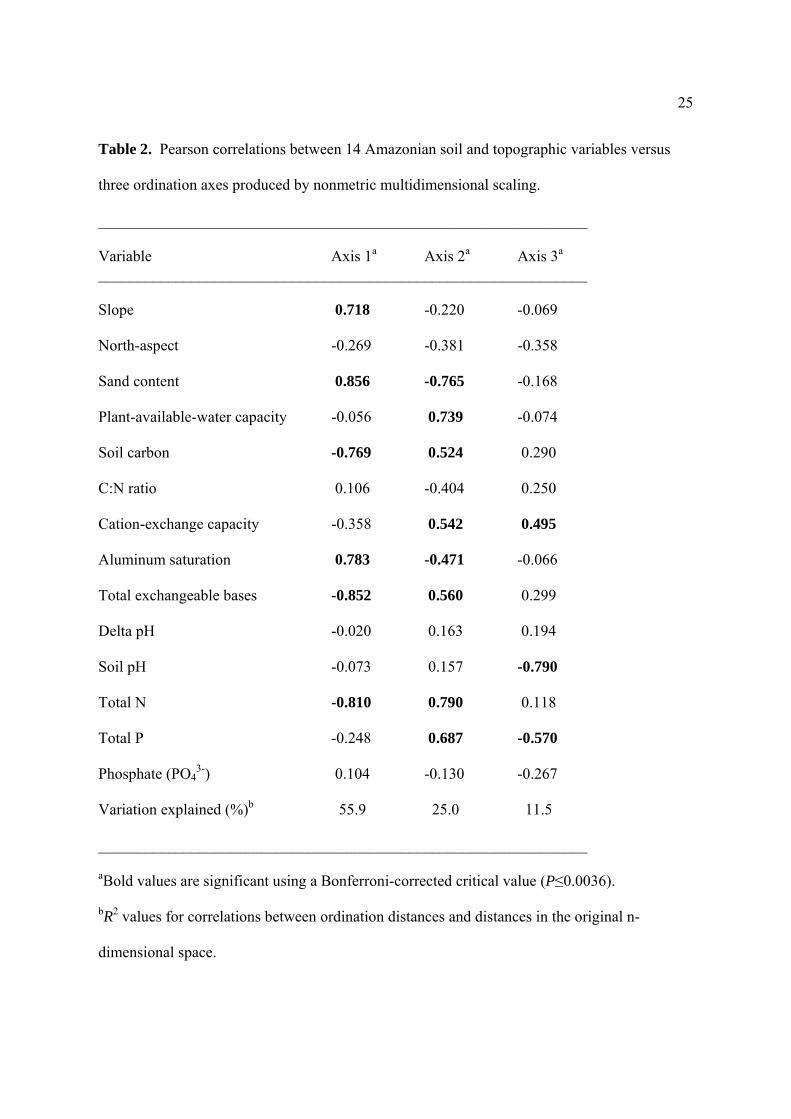
Ordination of edaphic gradients
Most of the 14 edaphic variables were significantly intercorrelated with at least one other
edaphic variable. We therefore used NMS ordination to extract orthogonal axes from the
dataset corresponding to major edaphic gradients in the study area. Three axes were selected,
explaining over 92% of the total variation (Table 2). Axis 1, which captured 56% of the
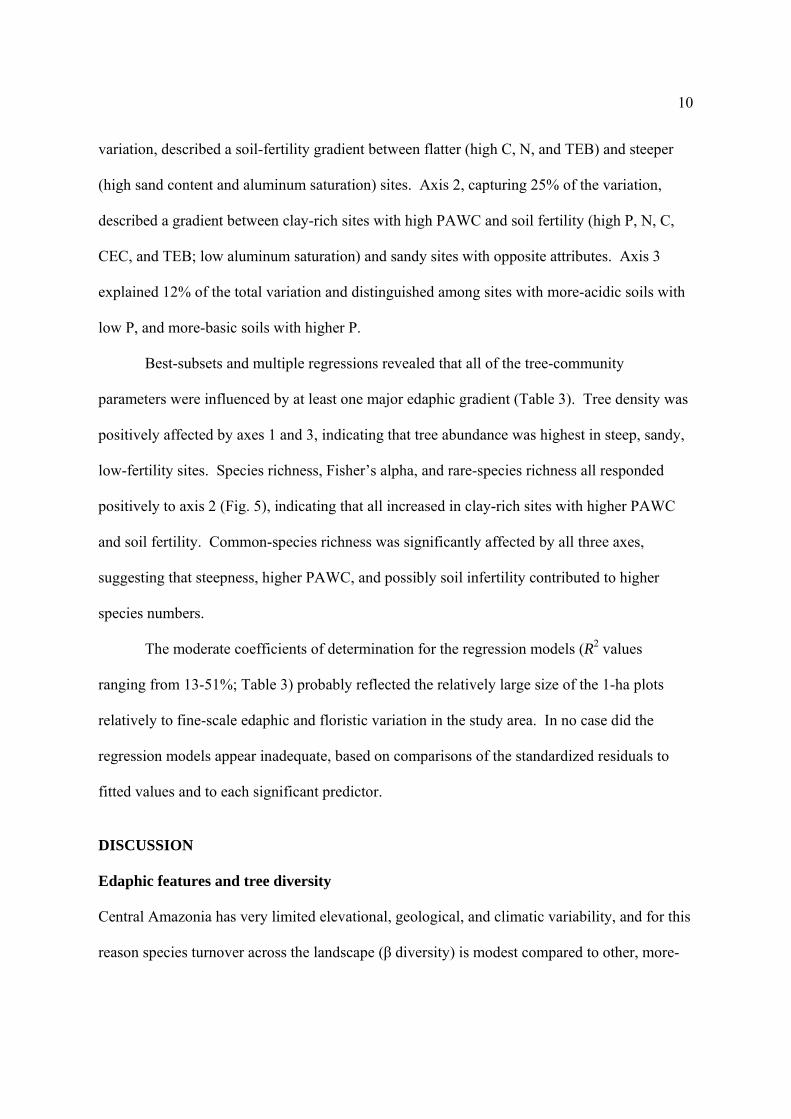
10
variation, described a soil-fertility gradient between flatter (high C, N, and TEB) and steeper
(high sand content and aluminum saturation) sites. Axis 2, capturing 25% of the variation,
described a gradient between clay-rich sites with high PAWC and soil fertility (high P, N, C,
CEC, and TEB; low aluminum saturation) and sandy sites with opposite attributes. Axis 3
explained 12% of the total variation and distinguished among sites with more-acidic soils with
low P, and more-basic soils with higher P.
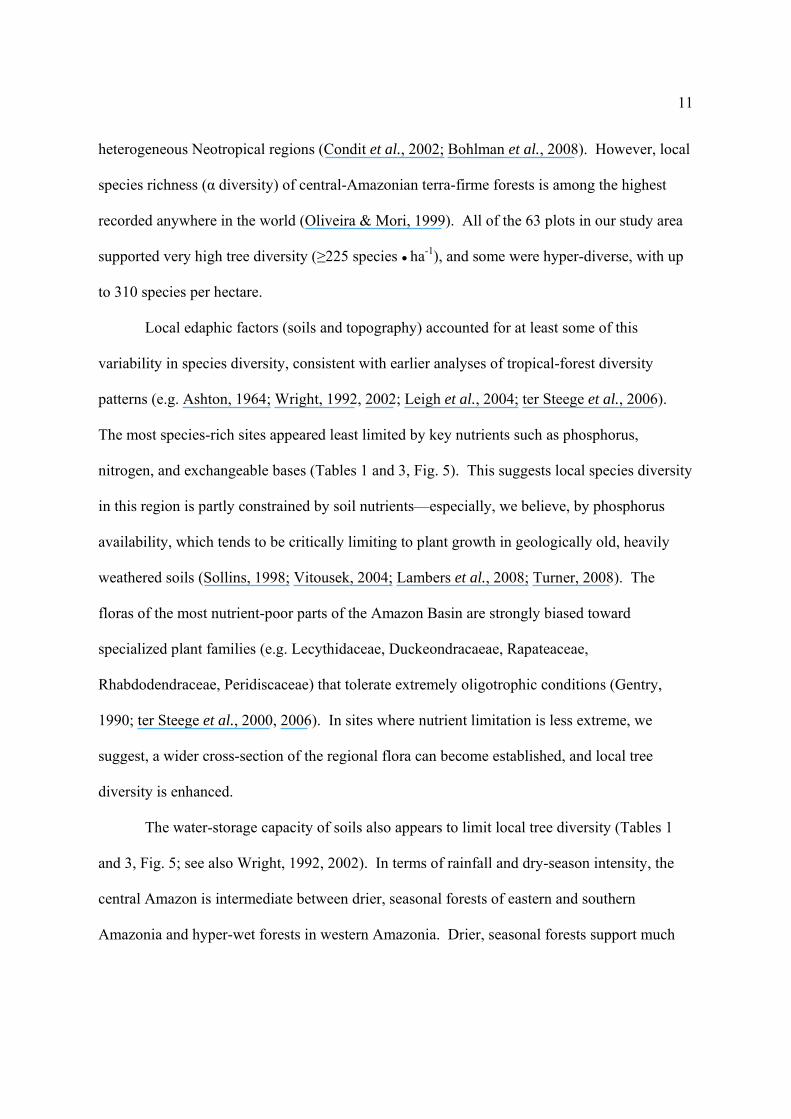
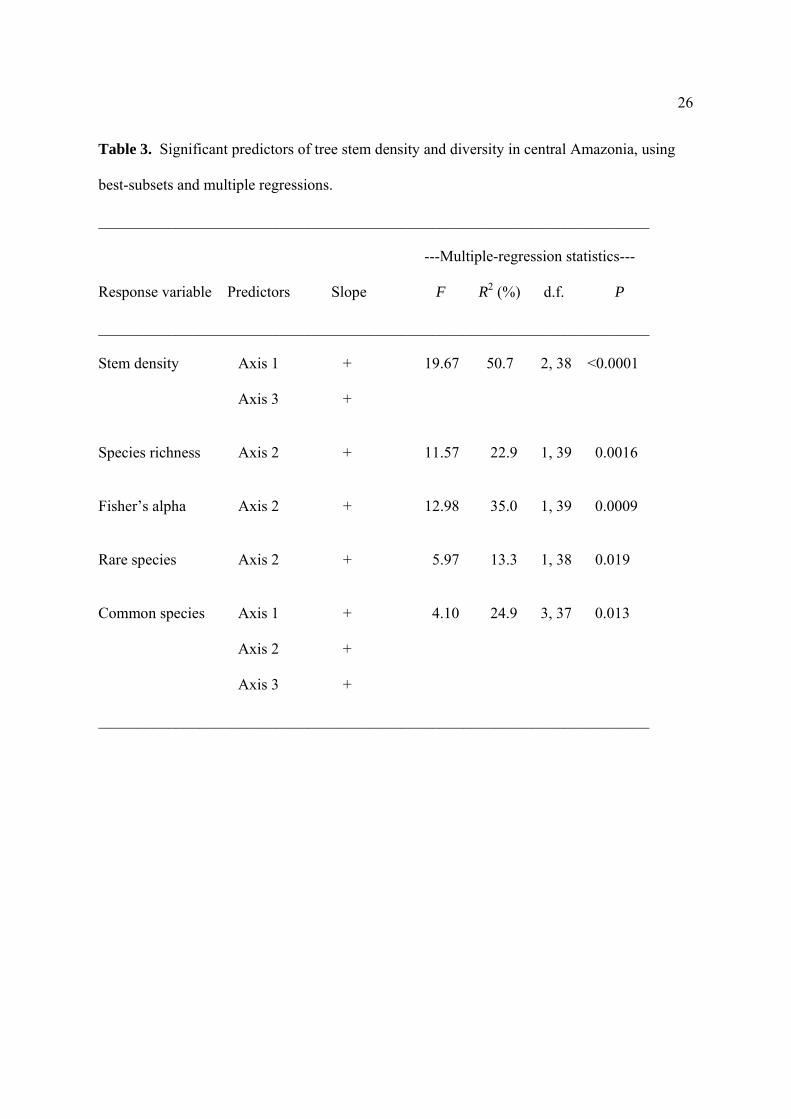
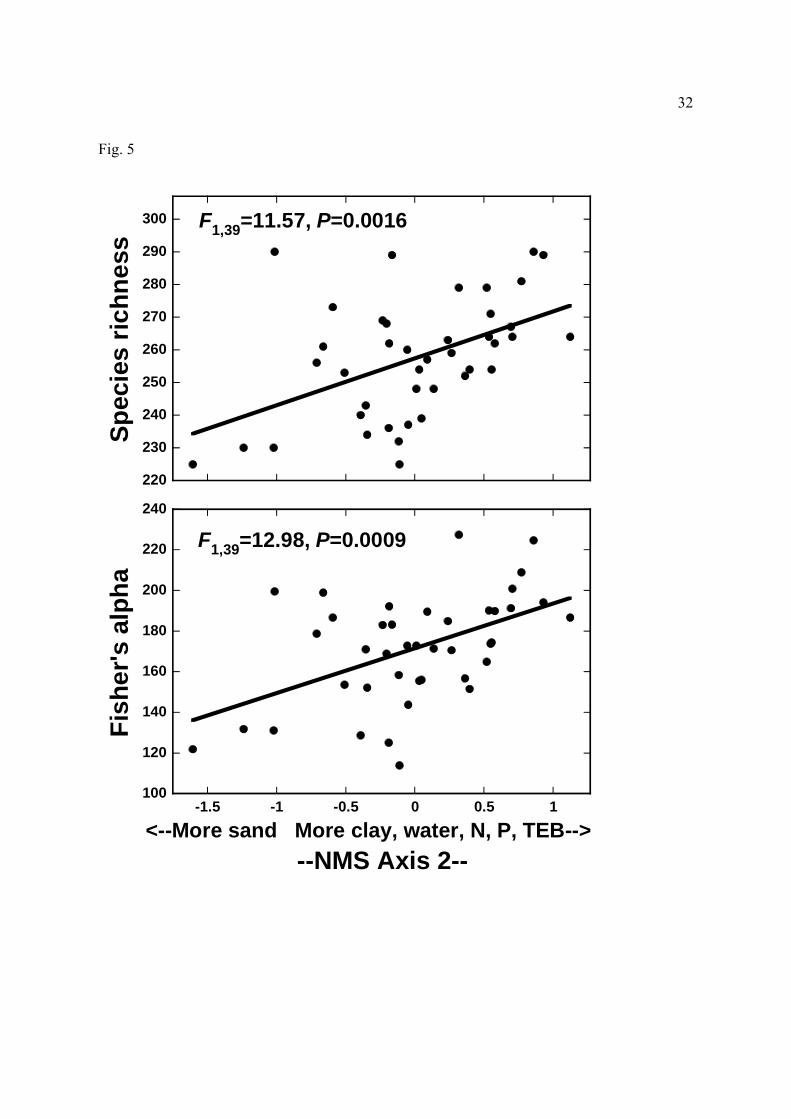
Best-subsets and multiple regressions revealed that all of the tree-community
parameters were influenced by at least one major edaphic gradient (Table 3). Tree density was
positively affected by axes 1 and 3, indicating that tree abundance was highest in steep, sandy,
low-fertility sites. Species richness, Fisher’s alpha, and rare-species richness all responded
positively to axis 2 (Fig. 5), indicating that all increased in clay-rich sites with higher PAWC
and soil fertility. Common-species richness was significantly affected by all three axes,
suggesting that steepness, higher PAWC, and possibly soil infertility contributed to higher
species numbers.
The moderate coefficients of determination for the regression models (R2 values
ranging from 13-51%; Table 3) probably reflected the relatively large size of the 1-ha plots
relatively to fine-scale edaphic and floristic variation in the study area. In no case did the
regression models appear inadequate, based on comparisons of the standardized residuals to
fitted values and to each significant predictor.
DISCUSSION
Edaphic features and tree diversity
Central Amazonia has very limited elevational, geological, and climatic variability, and for this
reason species turnover across the landscape (β diversity) is modest compared to other, more-
11
heterogeneous Neotropical regions (Condit et al., 2002; Bohlman et al., 2008). However, local
species richness (α diversity) of central-Amazonian terra-firme forests is among the highest
recorded anywhere in the world (Oliveira & Mori, 1999). All of the 63 plots in our study area
supported very high tree diversity (≥225 species ● ha-1), and some were hyper-diverse, with up
to 310 species per hectare.
Local edaphic factors (soils and topography) accounted for at least some of this
variability in species diversity, consistent with earlier analyses of tropical-forest diversity
patterns (e.g. Ashton, 1964; Wright, 1992, 2002; Leigh et al., 2004; ter Steege et al., 2006).
The most species-rich sites appeared least limited by key nutrients such as phosphorus,
nitrogen, and exchangeable bases (Tables 1 and 3, Fig. 5). This suggests local species diversity
in this region is partly constrained by soil nutrients—especially, we believe, by phosphorus
availability, which tends to be critically limiting to plant growth in geologically old, heavily
weathered soils (Sollins, 1998; Vitousek, 2004; Lambers et al., 2008; Turner, 2008). The
floras of the most nutrient-poor parts of the Amazon Basin are strongly biased toward
specialized plant families (e.g. Lecythidaceae, Duckeondracaeae, Rapateaceae,
Rhabdodendraceae, Peridiscaceae) that tolerate extremely oligotrophic conditions (Gentry,
1990; ter Steege et al., 2000, 2006). In sites where nutrient limitation is less extreme, we
suggest, a wider cross-section of the regional flora can become established, and local tree
diversity is enhanced.
The water-storage capacity of soils also appears to limit local tree diversity (Tables 1
and 3, Fig. 5; see also Wright, 1992, 2002). In terms of rainfall and dry-season intensity, the
central Amazon is intermediate between drier, seasonal forests of eastern and southern
Amazonia and hyper-wet forests in western Amazonia. Drier, seasonal forests support much
12
lower tree diversity than do wetter, aseasonal areas (ter Steege et al., 2006), with trees in drier
regions maintaining evergreen canopies only by virtue of having deep root systems (Nepstad et
al., 1999). We suggest that sites with poor soil-water-storage capacity will lack drought-
sensitive species that characterize wetter parts of the Amazon. Central Amazonia is considered
a biogeographic crossroads where distinct floras from drier and wetter parts of the basin
intermix (Oliveira & Daly, 1999; Oliveira & Nelson, 2001).
Local edaphic features had additional effects on tree diversity and abundance. Site
slope and its correlates had a strong influence on tree stem density, with steeper, sandier, more
nutrient-poor sites supporting higher tree densities (Fig. 3). The most plausible explanation, we
believe, is that such steep sites have few large (≥60 cm dbh) canopy and emergent trees (see
also Castilho et al., 2006), which competitively reduce the abundance of smaller trees (Fig. 2).
Thus, steeper sites with poorer soils support high tree densities but have low tree biomass
(Laurance et al., 1999), because most of the trees present are small. Large trees may be scarce
on steep slopes because soil nutrients (nitrogen and exchangeable bases) are critically limiting
or because large trees are prone to uprooting on steep or sandy sites.
It is intriguing that sites with many large trees also supported many locally rare species
(Fig. 4). We speculate that such a relationship might arise indirectly—for instance, many rare
species might be near the limits of their geographic ranges or environmental tolerances, and
thereby favor sites with less nutrient-starved soils. Alternatively, large canopy and emergent
trees, with their abundant fruit crops, might be magnets for mobile frugivores (e.g. Kwit et al.,
2004) that bring in propagules of new tree species from afar. It would be interesting to test the
generality of this pattern elsewhere, to see if rare species tend to cluster around large trees in
other tropical forests.

13
Although different tropical tree species often show distinctive associations with soil
properties (e.g. John et al., 2007; Turner, 2008), it is puzzling that common tree species in our
study area exhibited different associations with edaphic variables than did rare species (Tables
1 and 3). Moreover, within each plot, the numbers of rare and common species were not
significantly correlated (Fig. 1). These differences highlight the fact that much of the variation
in overall tree diversity among plots was attributable to varying numbers of rare (singleton)
species, which comprised 43-65% of the species richness of each plot. Such striking rarity is a
conspicuous feature of central Amazonian forests, evidently because of their extreme nutrient
limitation (Laurance, 2001) and because the vast regional species pool in Amazonia enhances
local biodiversity via continual species colonization (Oliveira & Daly, 1999). Forests such as
these are especially vulnerable to habitat fragmentation because their many rare species are
prone to random demographic events (cf. Melbourne & Hastings, 2008) and to environmental
changes in isolated fragments (Laurance et al., 2002, 2006).
Tree diversity in central Amazonia
In terms of local tree diversity, Amazonia and northern Borneo are the two most spectacularly
biodiverse regions in the world (Leigh et al., 2004). The western Amazon, where soil fertility
is far higher than central Amazonia because of inputs of geologically young sediments from the
Andes, was once considered the biologically richest part of the Amazon Basin (Gentry, 1988).
It is now apparent, however, that the zone of peak tree diversity extends from the western
Amazon well into central Amazonia (Oliveira & Mori, 1999; ter Steege et al., 2006), with
much of this hyper-diverse region overlaying strong weathered, nutrient-poor soils.
How can nutrient-starved forests sustain such high tree diversity? First, it is apparent
that plant species in these forests have evolved highly efficient mechanisms to recycle and

14
scavenge scarce nutrients, especially phosphorus, and the forests thereby maintain relatively
high productivity (Herrera et al., 1978; Stark & Jordan, 1978). Second, poor soils might
actually help to promote species coexistence. Where nutrients are strongly limiting, plants are
likely to invest heavily in defensive compounds to reduce tissue loss from herbivory and
pathogens (Waterman, 1983; Coley & Barone, 1996). Givnish (1999) has proposed that, by
promoting strong plant defenses, low soil nutrients should reduce—rather than increase—tree
diversity because the diversity-enhancing role of density-dependent herbivores and pathogens
(Janzen, 1970; Connell, 1971; Wills et al., 1997, 2006; Harms et al., 2000) is lessened. The
central Amazon, however, with its remarkably high tree diversity and infertile soils, stands in
stark contrast to this hypothesis. We assert the opposite of Givnish (1999), that low soil
nutrients may actually promote tree diversity (e.g. Huston, 1979; Aerts & Chapin, 2000)
because strong plant defenses (especially diverse chemical defenses) should favor specialized
over generalized herbivores and pathogens (Waterman, 1983; Coley & Barone, 1996). It is
these specialized enemies that drive density-dependent mortality and thereby help to maintain
local tree diversity. In this vein it is notable that, in dipterocarp forests in Borneo, tree diversity
peaks on relatively infertile rather than richer soils (Ashton, 1989).
It has also been suggested that high rates of canopy turnover (corrected for rainfall
variation) should promote local tree diversity, by promoting a mix of species with different
life-history characteristics (Phillips et al., 1994; Clinebell et al., 1995). Again, the features of
central Amazonian forests appear to be in opposition to this idea (S. G. Laurance et al.,
submitted). Rates of tree growth and turnover are considerably lower in central Amazonia than
in many other parts of the tropics, with long-term turnover averaging just 1.2% per year
(Laurance, 2001). Yet these forests sustain some of the richest tree communities ever
15
observed.
In our view a combination of factors, such as the vast Amazonian species pool that
enhances local diversity via immigration (cf. Terborgh, 1973; Ricklefs, 2004), possible mid-
domain effects (Colwell & Lees, 2000), strong density-dependence and slow growth rates that
collectively limit interspecific competition, and a mixing of drier- and wetter-adapted regional
floras (Oliveira & Daly, 1999), collectively underlay the very high local diversity of central
Amazonian forests. It is also apparent that soil and topographic features have pronounced
effects on local tree diversity in this region, as well as far-reaching influences on community
structure and tree abundance.
ACKNOWLEDGEMENTS
We thank Benjamin Turner, Egbert Leigh, Richard Condit, and Phyllis Coley for useful
comments on the manuscript. Support was provided by the U.S. National Science Foundation,
Marisla Foundation, Conservation, Food and Health Foundation, Blue Moon Fund, NASA-
LBA program, and Smithsonian Institution. This is publication number --- in the technical
series of the Biological Dynamics of Forest Fragments Project.
REFERENCES
Aerts, R. & Chapin, F.S. (2000) The mineral nutrition of wild plants revisited: a re-evaluation
of processes and patterns. Advances in Ecological Research, 30, 1–67.
Ashton, P.S. (1964) Ecological studies in the mixed dipterocarp forests of Brunei State.
Clarendon Press, Oxford, UK.
Ashton, P.S. (1989) Species richness in tropical forests. Tropical forests: Botanical dynamics,
speciation and diversity (ed. by Holm-Nielsen, L., Nielsen, I. & Balslev, H), pp. 239–
16
251, Academic Press, London, UK.
Beinroth, F.H. (1975) Relationships between U.S. soil taxonomy, the Brazilian system, and
FAO/UNESCO units. Soil management in tropical America (ed. by E. Bornemisza &
A. Alvarado), pp. 97-108, North Carolina State University, Raleigh, North Carolina.
Belknap, J., Hawkes, C.V. & Firestone, M.K. (2003) Boundaries in nature: two examples from
soil. BioScience, 53, 739-749.
Bohlman, S., Laurance, W.F., Laurance, S.G., Nascimento, H., Fearnside, P.M. & Andrade, A.
(2008) Effects of soils, topography, and geographic distance in structuring central
Amazonian tree communities. Journal of Vegetation Science, 19, 863-874.
Bravard, S. & Righi, D. (1989) Geochemical differences in an oxisol-spodosol toposequence of
Amazonia, Brazil. Geoderma, 44, 29-42.
Castilho, C.V., Magnusson, W.E., Nazare, R., de Araujo, O., Luizão, R.C.C., Luizão, F.J.,
Lima, A.P. & Higuchi, N. (2006) Variation in aboveground tree live biomass in a
central Amazonian forest: Effects of soil and topography. Forest Ecology &
Management, 234, 85-96.
Chandler, C.R. (1995) Practical considerations in the use of simultaneous inference for
multiple tests. Animal Behaviour, 49, 524-527.
Chauvel, A., Lucas, Y. & Boulet, R. (1987) On the genesis of the soil mantle of the region of
Manaus, Central Amazonia, Brazil. Experientia, 43, 234-240.
Clinebell, R.R., Phillips, O.L., Gentry, A.H., Stark, N. & Zuring, H. (1995) Prediction of
neotropical tree and liana species richness from soil and climatic data. Biodiversity
and Conservation, 4, 56–90.
Coley, P.D. & Barone, J.A. (1996) Herbivory and plant defenses in tropical forests. Annual
17
Review of Ecology and Systematics, 27, 305-315.
Colwell, R.K. & Lees, D.C. (2000) The mid-domain effect: geometric constraints on the
geography of species richness. Trends in Ecology and Evolution, 15, 70–76.
Condit, R., Pitman, N., Leigh, E.G., Chave, J., Terborgh, J., Foster, R.B., Nuñez, P., Aguilar,
S., Valencia, R., Villa, G., Muller-Landau, H.C., Losos, E. & Hubbell, S.P. (2002)
Beta-diversity in tropical forest trees. Science, 295, 666-669.
Connell, J.H. (1971) On the role of natural enemies in preventing competitive exclusion in
some marine animals and in rain forest trees. Dynamics of populations (ed. by P.J. den
Boer & G.R. Gradwell), pp. 298–312, Centre for Agricultural Publication and
Documentation, Wageningen, The Netherlands.
Crawley, M.J. (1993) GLIM for ecologists. Blackwell Scientific, London.
Fearnside, P.M. & Graça, P.M.L.A. (2006) BR-319: Brazil’s Manaus-Porto Velho Highway
and the potential impact of linking the arc of deforestation to central Amazonia.
Environmental Management, 38, 705-716.
Fearnside, P.M. & Leal-Filho, N. (2001) Soil and development in Amazonia: Lessons from the
Biological Dynamics of Forest Fragments Project. Lessons from Amazonia: the ecology
and conservation of a fragmented forest (ed. by R.O. Bierregaard, C. Gascon, T.E.
Lovejoy & R. Mesquita), p. 291-312, Yale University Press, New Haven, Connecticut.
Gentry, A.H. (1988). Tree species richness of upper Amazonian forests. Proceedings of the
National Academy of Sciences USA, 85, 156–159.
Gentry, A.H. (1990) Floristic similarities and differences between southern Central America
and upper and central Amazonia. Four neotropical rainforests (ed. by A.H. Gentry), pp.
141-157, Yale University Press, New Haven, Connecticut.
18
Givnish, T.J. (1999) On the causes of gradients in tropical tree diversity. Journal of Ecology,
87, 193-210.
Harms, K.E., Wright, S.J., Calderón, O., Hernández, A. & Herre, E.A. (2000) Pervasive
density-dependent recruitment enhances seedling diversity in a tropical forest. Nature,
404, 493–495.
Herrera, R., Merida, T., Stark, N. & Jordan, C.F. (1978) Direct phosphorus transfer from leaf
litter to roots. Naturwissenschaften, 65, 208-209.
Hubbell, S.P., He, F., Condit, R., Borda-da-Agua, L., Kellner, J. & ter Steege, H. (2008) How
many tree species are there in the Amazon and how many of them will go extinct?
Proceedings of the National Academy of Sciences USA, 105, 11498-11504.
Huston, M. (1979) A general hypothesis of species diversity. American Naturalist, 113, 81–
101.
Janzen, D.H. (1970) Herbivores and the number of tree species in tropical forests. American
Naturalist, 104, 501–528.
John, R., Dalling, J.W., Harms, K.E., Yavitt, J.B., Stallard, R., Mirabello, M., Hubbell, S.P.,
Valencia, R., Navarrete, H., Vallejo, M. & Foster, R.B. (2007) Soil nutrients influence
spatial distributions of tropical tree species. Proceedings of the National Academy of
Sciences USA, 104, 864-869.
Kwit, C., Levey, D.J. & Greenberg, C.H. (2004) Contagious seed dispersal beneath
heterospecific fruiting trees and its consequences. Oikos, 107, 303-308.
Lambers, H., Raven, J.A., Shaver, G. & Smith, S.E. (2008) Plant nutrient-acquisition strategies
change with soil age. Trends in Ecology & Evolution, 23, 95-103.
Laurance, S.G., Andrade, A., Laurance, W.F. & Nascimento, H. (Submitted) Unexpected
19
relationship between local tree turnover and diversity in central Amazonian forests.
Biotropica.
Laurance, W.F. (2001) The hyper-diverse flora of the central Amazon: an overview. Lessons
from Amazonia: the ecology and conservation of a fragmented forest (ed. by R.O.
Bierregaard, C. Gascon, T.E. Lovejoy & R. Mesquita), p. 47-53, Yale University Press,
New Haven, Connecticut.
Laurance, W.F., Cochrane, M.A., Bergen, S., Fearnside, P., Delamonica, P., Barber, C.,
D’Angelo, S. & Fernandes, T. (2001) The future of the Brazilian Amazon. Science, 291,
438-439.
Laurance, W.F., Lovejoy, T.E., Vasconcelos, H.L., Bruna, E.M., Didham, R.K., Stouffer, P.C.,
Gascon, C., Bierregaard, R., Laurance, S.G. & Sampiao, E. (2002) Ecosystem decay of
Amazonian forest fragments: a 22-year investigation. Conservation Biology, 16, 605-
618.
Laurance, W. F., Fearnside, P.M., Laurance, S.G., Delamonica, P., Lovejoy, T.E., Rankin-de
Merona, J.M., Chambers, J.Q. & Gascon, C. (1999) Relationship between soils and
Amazon forest biomass: a landscape-scale study. Forest Ecology and Management,
118, 127-138.
Laurance, W.F. & Luizão, R.C.C. (2007) Driving a wedge into the Amazon. Nature, 448, 409-
410.
Laurance, W.F., Nascimento, H., Laurance, S.G., Andrade, A., Ribeiro, J., Giraldo, J.,
Lovejoy, T., Condit, R., Chave, J. & D’Angelo, S. (2006) Rapid decay of tree-
community composition in Amazonian forest fragments. Proceedings of the National
Academy of Sciences USA, 103, 19010-19014.
20
Laurance, W.F., Perez-Salicrup, D., Delamonica, P., Fearnside, P.M., D’Angelo, S.,
Jerozolinski, A., Pohl, L. & Lovejoy, T.E. (2001) Rain forest fragmentation and the
structure of Amazonian liana communities. Ecology, 82, 105-116.
Leigh, E.G., Jr., Davidar, P., Dick, C.W., Puyravaud, J.-P., Terborgh, J., ter Steege, H. &
Wright, S.J. (2004) Why do some tropical forests have so many species of trees?
Biotropica, 36, 447–473.
Lovejoy, T.E., Bierregaard, R.O., Rylands, A.B., Malcolm, J.R., Quintela, C.E., Harper, L.H.,
Brown, K.S., Powell, A.H., Powell, G.V.N., Schubart, H.O.R. & Hays, M.B. (1986)
Edge and other effects of isolation on Amazon forest fragments. Conservation biology:
the science of scarcity and diversity (ed. by M. E. Soulé), pp. 257-285, Sinauer,
Sunderland, Massachusetts.
Luizão, R.C.C., Luizão, F.J., Paiva, R., Monteiro, T., Sousa, L. & Kruijt, B. (2004) Variation of
carbon and nitrogen cycling processes along a topographic gradient in a central
Amazonian forest. Global Change Biology, 10, 592-600.
Magurran, A.E. (1988) Ecological diversity and its measurement. Croom-Helm, London.
McCune, B. & Mefford, M.J. (1999) PC-ORD: Multivariate analysis of ecological data.
Version 5.0, MjM Software, Gleneden Beach, Oregon, USA.
Melbourne, B. & Hastings, A. (2008) Extinction risk depends strongly on factors contributing
to stochasticity. Nature, 454, 100-103.
Nepstad, D.C., Carvalho, C., Davidson, E., Jipp, P., Lefebre, P., Negreiros, P., Silva, E., Stone,
T., Trumbore, S. & Vieira, S. (1994) The role of deep roots in the hydrological and
carbon cycles of Amazonian forests and pastures. Nature, 372, 666-669.
Noy-Meir, I., Walker, D. & Williams, W.T. (1975) Data transformations in ecological
21
ordination. II. On the meaning of data standardization. Journal of Ecology, 63, 779-800.
Oliveira, de, A.A. & Daly, D.C. (1999) Geographic distribution of tree species occurring in the
region of Manaus, Brazil: Implications for regional diversity and conservation.
Biodiversity and Conservation, 8, 1245-1259.
Oliveira, de, A.A. & Mori, S.A. (1999) A central Amazonian terra firme forest. I. High tree
species richness on poor soils. Biodiversity and Conservation, 8, 1219-1244.
Oliveira, de, A.A. & Nelson, B.W. (2001) Floristic relationships of terra firme forests in the
Brazilian Amazon. Forest Ecology and Management, 146, 169-179.
Phillips, O.L., Hall, P., Gentry, A.H., Sawyer, S.A. & Vasquez, R. (1994) Dynamics and
species richness of tropical forests. Proceedings of the National Academy of Sciences
USA, 91, 2805–2809.
Phillips, O.L., Nuñez, P., Monteagudo, A.L., Cruz, A.P. Zans, M.-E., Sanchez, W.G., Yli-
Halla, M. & Rose, S. (2003) Habitat association among Amazonian tree species: A
landscape-scale approach. Journal of Ecology, 91, 757–775.
Pitman, N., Terborgh, J., Silman, M.R., Nuñez, P.V., Neill, D.A., Cero´ n, C.E., Palacios, W.A.
& Aulestia, M. (2002) A comparison of tree species diversity in two upper Amazonian
forests. Ecology, 83, 3210-3224.
Prance, G.T. (1977) The phytogeographic subdivisions of Amazonia and their influence on the
selection of biological reserves. Extinction is forever (ed. by G.T. Prance & T.S. Elias),
pp. 195-213, New York Botanical Garden, New York.
Richter, D.D. & Babbar, L.I. (1991) Soil diversity in the tropics. Advances in Ecological
Research, 21, 315-389.
Ricklefs, R. E. (2004) A comprehensive framework for global patterns in biodiversity. Ecology
22
Letters, 7, 1–15.
Sollins, P. (1998) Factors influencing species composition in tropical lowland rain forest: does
soil matter? Ecology, 79, 23-30.
Sombroek, W. (1984) Soils of the Amazon region. The Amazon: limnology and landscape
ecology of a mighty tropical river and its basin (ed. by H. Sioli), pp. 521-535, Dr. W.
Junk Publishers, Dordrecht, The Netherlands.
Sombroek, W. (2000) Amazon landforms and soils in relation to biological diversity. Acta
Amazonica 30, 81-100.
Stark, N.M. & Jordan, C.F. (1978) Nutrient retention by the root mat of an Amazonian rain
forest. Ecology, 59, 434-437.
Terborgh, J. (1973) On the notion of favorableness in plant ecology. American Naturalist, 107,
481–501.
Terborgh, J. & Andresen, E. (1998) The composition of Amazonian forests: patterns at local
and regional scales. Journal of Tropical Ecology, 14, 645-664.
ter Steege, H., Pitman, N., Phillips, O.L., Chave, J., Sabatier, D., Duque, A., Molino, J.-F.,
Prevost, M.-F., Spichiger, R., Castellanos, H., von Hildebrand, P. & Vasquez, R. (2006)
Continental-scale patterns of canopy tree composition and function across Amazonia.
Nature, 443, 444-447.
ter Steege, H., Sabatier, D., Castellanos, H., Van Andel, T., Duivenvoorden, J., de Oliveira,
A.A., de Ek, R., Lilwah, R., Maas, P. & Mori, S. (2000) An analysis of the floristic
composition and diversity of Amazonian forests including those of the Guiana shield.
Journal of Tropical Ecology, 16, 801-828.
Tuomisto, H., Ruokolainen, K., Aguilar, M. & Sarmiento, A. (2003) Floristic patterns along a
23
43-km long transect in an Amazonian rain forest. Journal of Ecology, 91, 743–756.
Turner, B.L. (2008) Resource partitioning for soil phosphorus: a hypothesis. Journal of
Ecology, 96, 698-702.
Valencia, R., Foster, R.B., Villa, G., Condit, R., Svenning, J.-C., Hernandez, C., Romoleroux,
K., Losos, E., Magard, E. & Balslev, H. (2004) Tree species distributions and local
habitat variation in the Amazon: large forest plot in eastern Ecuador. Journal of
Ecology, 92, 214-229.
Vitousek, P.M. (2004) Nutrient cycling and limitation: Hawai’i as a model system. Princeton
University Press, Princeton, New Jersey.
Waterman, P.G. (1983) Distribution of secondary metabolites in rain forest plants: toward an
understanding of cause and effect. Tropical rain forest: ecology and management (ed.
by S.L. Sutton, T.C. Whitmore & A.C. Chadwick), pp. 167-179, Blackwell Scientific,
Oxford, UK.
Wills, C., Condit, R., Foster, R.B. & Hubbell, S.P. (1997) Strong density- and diversity-related
effects help to maintain tree diversity in a Neotropical forest. Proceedings of the
National Academy of Sciences USA, 94, 1252–1257.
Wills, C., Harms, K.E., Condit, R., King, D., Thompson, J., He, F., H, Muller-Landau, H., et al.
(2006) Nonrandom processes maintain diversity in tropical forests. Science 311, 527–
531.
Wright, S.J. (1992) Seasonal drought, soil fertility and the species density of tropical forest
plant communities. Trends in Ecology and Evolution, 7, 260-263.
Wright, S.J. (2002) Plant diversity in tropical forests: a review of mechanisms of species
coexistence. Oecologia, 130, 1-14.
24
Table 1. Pearson correlations between soil or topographic features and five parameters describing Amazonian tree diversity or abundance: tree density, species richness, Fisher’s alpha index, and the numbers of ‘rare’ (plot-level singletons) and ‘common’ (non-singletons) species.
Attributea,b
Attribute
mean±SD
Stem
density
Species
richness
Fisher's
alpha
Rare
species
Common
species
Slopec (o) 12.2±8.8 0.604 0.106 0.274 -0.022 0.221
Northern aspectc (%) 20.6±16.9 -0.065 -0.176 -0.137 -0.097 -0.154
Sand contentc (%) 23.1±16.8 0.483 -0.138 -0.424 -0.157 -0.011
Plant-avail. Water capacity 7.4±1.9 0.074 0.513 0.423 0.345 0.321
Soil C (%) 1.61±0.25 -0.378 -0.095 0.155 -0.105 0.002
C:N ratiod 9.8±1.5 0.262 -0.391 -0.479 -0.465 0.074
Cation-exchange capacity 2.49±0.43 0.059 -0.008 -0.038 -0.053 0.070
Aluminum saturation 92.4±1.6 0.488 -0.244 -0.493 -0.337 0.119
Total exchangeable bases 0.196±0.055 -0.406 0.176 0.394 0.245 -0.090
Delta pH -0.24±0.12 -0.042 0.218 0.229 0.066 0.264
Soil pH 4.16±0.25 -0.516 0.206 0.441 0.313 -0.145
Total N (%) 0.165±0.032 -0.468 0.257 0.497 0.290 -0.023
Total P (ppm) 121.3±40.6 -0.308 0.425 0.527 0.429 0.040
PO43- (m.e./100 g dry soil) 0.030±0.006 -0.285 -0.092 0.106 0.011 -0.172
____________________________________________________________________________
aBold values are significant using a Bonferroni-corrected alpha value (P≤0.011). bSamples sizes: slope, aspect, sand-content, and soil C, n=63 plots; other attributes, n=41 plots. cData arcsine-squareroot transformed prior to correlations. dData log10-transformed prior to correlations.
25
Table 2. Pearson correlations between 14 Amazonian soil and topographic variables versus
three ordination axes produced by nonmetric multidimensional scaling.
_______________________________________________________________
Variable Axis 1a Axis 2a Axis 3a _______________________________________________________________
Slope 0.718 -0.220 -0.069
North-aspect -0.269 -0.381 -0.358
Sand content 0.856 -0.765 -0.168
Plant-available-water capacity -0.056 0.739 -0.074
Soil carbon -0.769 0.524 0.290
C:N ratio 0.106 -0.404 0.250
Cation-exchange capacity -0.358 0.542 0.495
Aluminum saturation 0.783 -0.471 -0.066
Total exchangeable bases -0.852 0.560 0.299
Delta pH -0.020 0.163 0.194
Soil pH -0.073 0.157 -0.790
Total N -0.810 0.790 0.118
Total P -0.248 0.687 -0.570
Phosphate (PO43-) 0.104 -0.130 -0.267
Variation explained (%)b 55.9 25.0 11.5
_______________________________________________________________
aBold values are significant using a Bonferroni-corrected critical value (P≤0.0036).
bR2 values for correlations between ordination distances and distances in the original n-
dimensional space.
26
Table 3. Significant predictors of tree stem density and diversity in central Amazonia, using
best-subsets and multiple regressions.
_______________________________________________________________________
---Multiple-regression statistics---
Response variable Predictors Slope F R2 (%) d.f. P
_______________________________________________________________________
Stem density Axis 1 + 19.67 50.7 2, 38 <0.0001
Axis 3 +
Species richness Axis 2 + 11.57 22.9 1, 39 0.0016
Fisher’s alpha Axis 2 + 12.98 35.0 1, 39 0.0009
Rare species Axis 2 + 5.97 13.3 1, 38 0.019
Common species Axis 1 + 4.10 24.9 3, 37 0.013
Axis 2 +
Axis 3 +
_______________________________________________________________________
27
FIGURE CAPTIONS
Figure 1. Numbers of ‘rare’ (1 stem per plot) versus ‘common’ (>1 stem per plot) tree species
within 63 1-ha plots in central Amazonia.
Figure 2. Relationship between the densities of large (≥60 cm dbh) and smaller (10-59.9 cm
dbh) trees in central Amazonian forest plots.
Figure 3. Relationship between mean slope and the density of trees in Amazonian forest plots.
Figure 4. Relationship between the density of large (≥60 cm dbh) trees and percentage of rare
(singleton) species in Amazonian forest plots.
Figure 5. Relationships between a major gradient in soil fertility and water-storage capacity
versus species richness (above) and Fisher’s alpha values (below) for Amazonian tree
communities (‘water’ is plant-available-water capacity; ‘TEB’ is total exchangeable bases).
28
Fig. 1
100
120
140
160
180
r = -0.205, P = 0.11
90 100 110 120 130 140
Rar
e sp
ecie
s
Common species
29
Fig. 2
520
560
600
640
680
720
760F1,61=20.1, P<0.0001
0 5 10 15 20
Smal
ler t
rees
(no.
ha-1
)
Large trees (no. ha-1)
30
Fig. 3
500
550
600
650
700
750
F1,61=30.67, P<0.0001
0 0.1 0.2 0.3 0.4 0.5 0.6 0.7
Stem
den
sity
(no.
ha-1
)
Arcsine-squareroot of Slope (o)
31
Fig. 4
44
48
52
56
60
64
68 F1,61=8.47, P=0.005
0 5 10 15 20
Rar
e sp
ecie
s (%
)
Large trees (no. ha-1)
32
Fig. 5
220
230
240
250
260
270
280
290
300 F1,39=11.57, P=0.0016
Spec
ies
richn
ess
100
120
140
160
180
200
220
240
-1.5 -1 -0.5 0 0.5 1
F1,39=12.98, P=0.0009
Fish
er's
alp
ha
--NMS Axis 2--<--More sand More clay, water, N, P, TEB-->