Influence of optical standing waves on the femtosecond laser-induced forward transfer of transparent...
24
Influence of optical standing waves on the femtosecond laser-induced forward transfer of transparent thin films David P. Banks, 1,∗ , Kamal S. Kaur, 1 , and Robert W. Eason 1 1 Optoelectronics Research Centre, University of Southampton, Southampton SO17 1BJ, UK ∗ Corresponding author: [email protected] The effects of the formation of an optical standing wave during femtosecond laser-induced forward transfer of transparent films is analysed using a numerical interference model. The dependence of the intensity distribution on a number of easily-controllable experimental parameters is investigated. Results of the model are compared to experimental studies of the transfer of gadolinium gallium oxide (GdGaO) with a polymer sacrificial layer. The model allows us to explain the observed variation in deposit morphology with the size of the air gap, and why forward transfer of the GdGaO was possible below the ablation thresholds of both polymer and oxide. c 2008 Optical Society of America OCIS codes: 350.3390, 190.4180, 310.6860, 160.2750, 160.5470 1. Introduction The Laser-Induced Forward Transfer (LIFT) technique (as shown in fig. 1) was initially proposed by Bohandy et al. as a method for depositing metal for the repair of damaged photomasks [1]. In LIFT, a thin film of the material to be deposited (the donor film ) is coated onto one face of a transparent support substrate (the carrier ) and brought into close contact (typically the separation is on the order of a few microns) with another substrate (the receiver ). Transfer of the donor film to the receiver is effected by focusing or demagnifying a laser pulse through the carrier onto the carrier-donor interface. The laser initiates melting [2] or ablation [3, 4] of the donor film, providing the thrust required to propel material to the receiver. LIFT has been successfully applied for the direct-writing of metals (e.g., see [1, 2, 5–11] amongst others), polymers [12], oxides [13, 14], superconductors [15], diamond [16], carbon nanotube field emission cathodes [17], conducting polymers [18], and an adenosine triphos- phate sensor fabricated from luciferase [19]. Recently, several groups have also investigated 1
-
Upload
independent -
Category
Documents
-
view
1 -
download
0
Transcript of Influence of optical standing waves on the femtosecond laser-induced forward transfer of transparent...
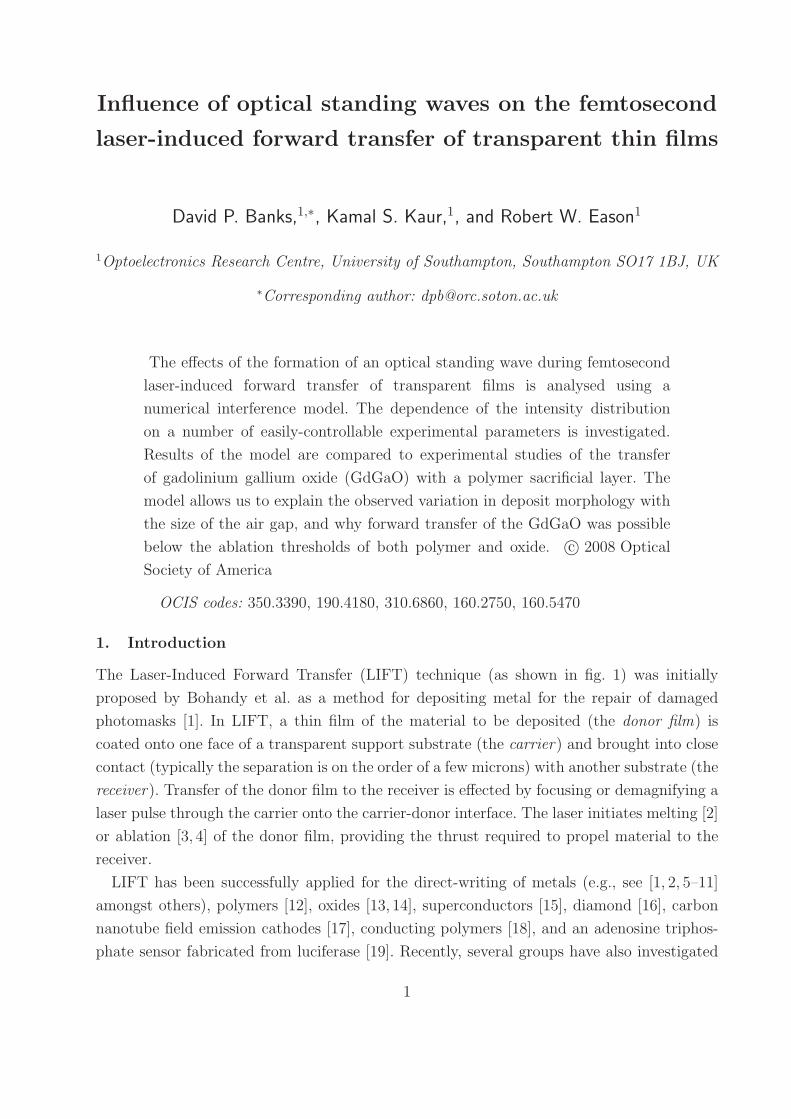
Influence of optical standing waves on the femtosecond
laser-induced forward transfer of transparent thin films
David P. Banks,1,∗, Kamal S. Kaur,1, and Robert W. Eason1
1Optoelectronics Research Centre, University of Southampton, Southampton SO17 1BJ, UK
∗Corresponding author: [email protected]
The effects of the formation of an optical standing wave during femtosecond
laser-induced forward transfer of transparent films is analysed using a
numerical interference model. The dependence of the intensity distribution
on a number of easily-controllable experimental parameters is investigated.
Results of the model are compared to experimental studies of the transfer
of gadolinium gallium oxide (GdGaO) with a polymer sacrificial layer. The
model allows us to explain the observed variation in deposit morphology with
the size of the air gap, and why forward transfer of the GdGaO was possible
below the ablation thresholds of both polymer and oxide. c© 2008 Optical
Society of America
OCIS codes: 350.3390, 190.4180, 310.6860, 160.2750, 160.5470
1. Introduction
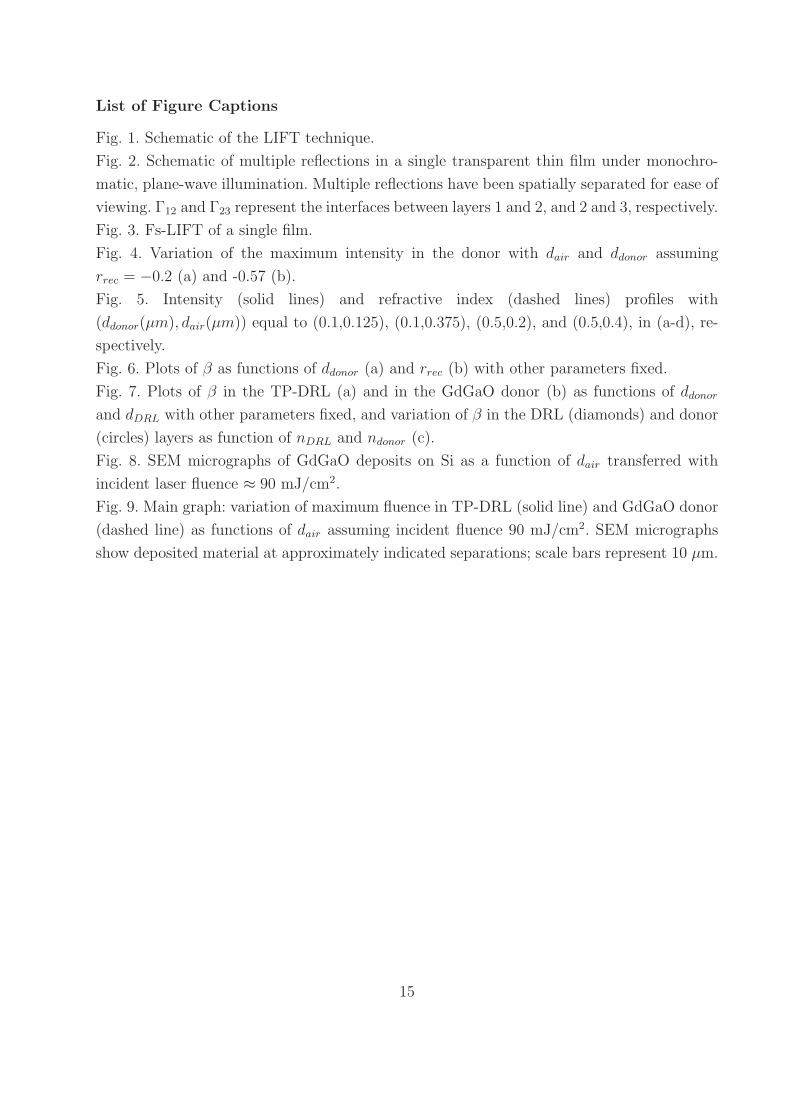
The Laser-Induced Forward Transfer (LIFT) technique (as shown in fig. 1) was initially
proposed by Bohandy et al. as a method for depositing metal for the repair of damaged
photomasks [1]. In LIFT, a thin film of the material to be deposited (the donor film) is
coated onto one face of a transparent support substrate (the carrier) and brought into close
contact (typically the separation is on the order of a few microns) with another substrate (the
receiver). Transfer of the donor film to the receiver is effected by focusing or demagnifying a
laser pulse through the carrier onto the carrier-donor interface. The laser initiates melting [2]
or ablation [3, 4] of the donor film, providing the thrust required to propel material to the
receiver.
LIFT has been successfully applied for the direct-writing of metals (e.g., see [1, 2, 5–11]
amongst others), polymers [12], oxides [13, 14], superconductors [15], diamond [16], carbon
nanotube field emission cathodes [17], conducting polymers [18], and an adenosine triphos-
phate sensor fabricated from luciferase [19]. Recently, several groups have also investigated
1
the effects of using ultrashort (sub-picosecond) pulses for LIFT (fs-LIFT ) [13, 20–24]. The
majority of work has focused on achieving the smallest possible structures, but fs-LIFT
has also been shown to be capable of transferring viable biomaterials [25] and contiguous
solid-phase sections of donor film [26] without requiring a sacrificial matrix or protective
layer.
1.A. LIFT of transparent materials
For materials that do not absorb strongly at the laser wavelength, other techniques have
been developed that utilise ablation of absorbing sacrificial materials to provide the thrust
for forward transfer [27–31]. Although these techniques have vastly expanded the range of
materials that can be deposited using forward transfer, they also introduce extra complexity
to the process. For example, one commonly applied approach is to include a sacrificial layer
between the carrier and the donor, which is often referred to as a dynamic release layer
(DRL) [28]. Metallic layers are often used as DRLs [28, 29] but, as metals do not dissociate
cleanly, contamination of deposited donor material by residual DRL is possible [32]. Although
this problem can be minimised using optimised polymeric DRLs [30, 33, 34], such materials
can limit the range of available donors due to their sensitivity to high temperatures or solvent
treatment. Clearly, therefore, it would be desirable to have a technique capable of directly
transferring transparent materials.
In a recent work, we demonstrated that by utilising multi-photon absorption of femtosec-
ond duration pulses at λ = 800 nm, forward transfer of an effectively transparent (absorption
depth several orders of magnitude greater than the film thicknesses), amorphous gadolin-
ium gallium oxide (GdGaO) donor was possible [35]. Furthermore, by including a triazene
polymer (TP) DRL [36], also transparent to the laser wavelength, it was possible to forward
transfer very clean discs of GdGaO with no evidence of residual DRL. An interesting obser-
vation was that the transfer threshold using the DRL was only ≈ 20% of the TP ablation
threshold at λ = 800 nm.
1.B. Optical standing waves
An important consideration when transferring transparent films by fs-LIFT is the formation
of an optical standing wave due to interference between forward and backward propagating
waves reflecting off the various interfaces between carrier, DRL, donor, air gap and receiver.
The result is potentially a large intensity modulation along the laser propagation direction
within the thin films. Hence, the local intensity can vary significantly from the incident
intensity, which will affect the transfer threshold and may cause unintentional damage to
the transferred material.
In this work we will consider the fs-LIFT of transparent films in more detail. A model for
2

the intensity profile in arbitrary stacks of DRL and donor film(s) is presented. The effects of
various material and experimental parameters on the peak intensity within the film(s) are
discussed in terms of their potential impact on the LIFT process. Lastly, the model is applied
to the case of fs-LIFT of GdGaO with a TP-DRL. We investigate whether the formation of
a standing wave can explain the surprisingly low transfer threshold observed previously [35].
Also studied are the effects of varying the size of the air-gap in the setup on the quality of
the resultant GdGaO depositions.
2. Standing wave model
The formation of standing waves in thin films has been considered by a number of authors
for the case of lithographic patterning (see e.g. [37]). In particular, an analytical description
of the standing wave intensity pattern in stacks of arbitrary numbers of thin films has been
developed by Mack [38].
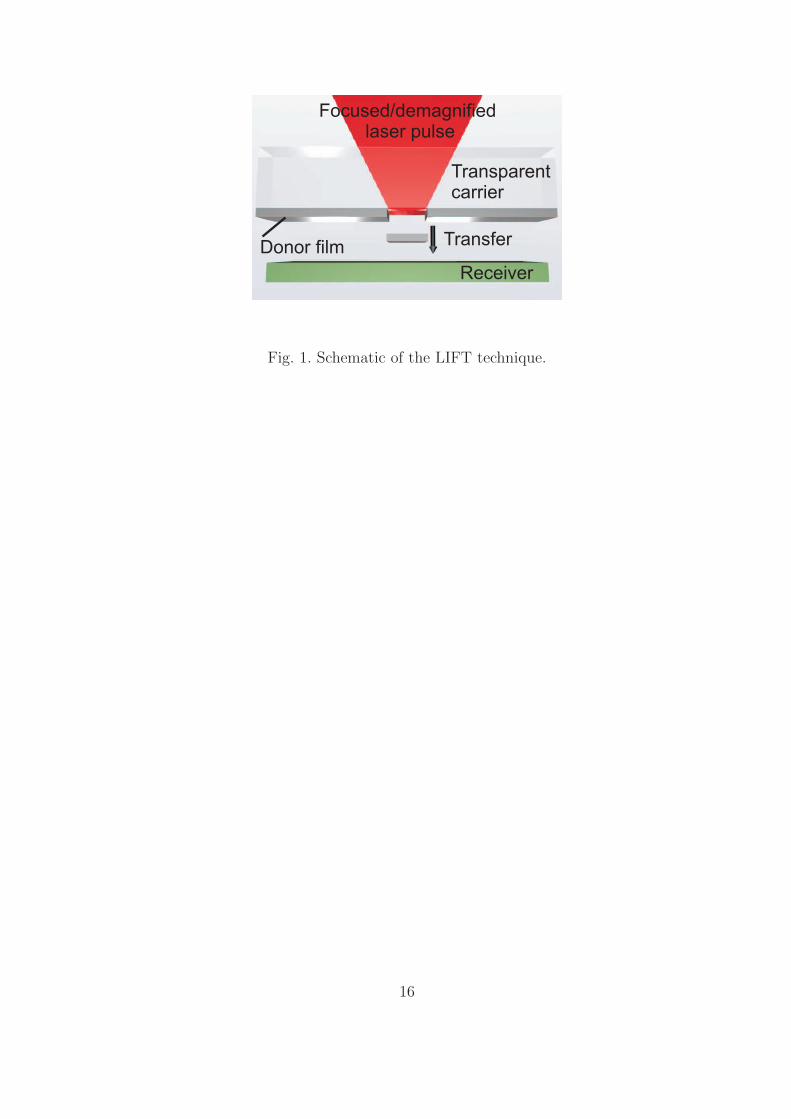
2.A. Single film case
It is relatively simple to determine the intensity profile in a single thin film between two,
effectively infinite, dielectric media, as shown in fig. 2. The film is exposed through layer 1
(refractive index, n1 = n1+iκ1) to a normally incident monochromatic plane wave, EIn(z) =
EInexp(−ik1z). For simplicity, it is chosen to set z = 0 at the first interface, Γ12. The wave
is partially transmitted into the film where it undergoes consecutive reflections off Γ23 and
Γ12. Note that, although the theory is for monochromatic illumination, the femtosecond
Ti:sapphire laser used in the experiments (described later) had a bandwidth of around 10
nm. The result of using a source with a finite bandwidth would be to reduce the standing
wave amplitude relative to the monochromatic case. However, because the laser bandwidth
was small compared to the standing wave period (≈ 100)s nm, the model still provided an
acceptable level of accuracy for comparison between experimental and numerical results.
A geometrical approach yields a series of forward and backward propagating waves in the
film, E+(z) and E−(z) respectively, of the form
E+a (z) = EInt12r
a−123 ra−1
21 τ2(a−1)2 exp(−ik2z) (1)
E−
a (z) = EInt12ra23r
a−121 τ 2a
2 exp(ik2z) (2)
where tij = 2ni/(ni + nj) = the amplitude transmission coefficient at Γij
rij = (ni − nj)/(ni + nj) = the amplitude reflection coefficient at Γij
τj = exp(−ikjdj) = the internal transmittance of layer j
dj = thickness of layer j
kj = 2πnj/λ = the propagation constant in layer j
3

λ = wavelength of incident laser pulse
a = denotes multiple reflections
The total electric field in the thin film, Efilm(z), is then just the summation of all these
forward and backward propagating waves:
Efilm(z) =∞∑
a=1
(
E+a (z) + E−
a (z))
(3)
Substituting eqns. (1) and (2) into (3), it is then straightforward to show that
Efilm(z) = EInt12[exp(−ik2z2) + r23τ22 exp(ik2z2)] × S (4)
where S = 1 + r21r23τ22 (1 + r21r23τ
22 (1 + . . .)), is a geometric series. Hence, noting that
r21 = −r12, we arrive at [38]
Efilm(z) = EInt12
(
exp(−ik2z) + r23τ22 exp(ik2z)
1 + r12r23τ 22
)
(5)
Finally, the intensity in the film, Ifilm(z), is found by squaring the magnitude of Efilm(z),
Ifilm(z) =cǫ0ǫ2
2|Efilm(z)|2 (6)
where ǫ0 is the permittivity of free space and ǫ2 is the permittivity of the thin film.
2.B. Multiple film case
The above analysis can be extended to the case of multiple thin films between two substrates.
In this situation it is convenient to define two effective amplitude reflection coefficients, r′j,j+1
and r∗j−1,j [38]. Now r′j,j+1 is the effective reflection coefficient between layer j and all the
layers beyond it (i.e. layers j +1, j +2, . . . ,m+1) and r∗j−1,j is the coefficient between layer j
and all the preceding layers (i.e. layers 1, 2, . . . , j−1). We also introduce the effective fluence
incident on layer j, EIn,j. r∗j−1,j, r′j,j+1, and EIn,j can be calculated from the refractive indices
and thicknesses of all the layers in the structure as described in [38].
Consider now the case of m− 1 thin films (i.e. m + 1 layers including the two substrates).
The substrates are layers 1 and m + 1. The field in layer 2, the first thin film, is then given
by [38]:
E2(z) = EInt12exp(−ik2z) + r′23τ
22 exp(ik2z)
1 + r12r′23τ22
(7)
Note that the electric field in layer 2 is almost identical in the single and multiple film
cases except that the reflection coefficient at Γ23 in eqn. (5), r23, is replaced by the effective
reflection coefficient between layer 2 and all the subsequent layers, r′23.
4

Similarly, if it is desired to know the field in the jth layer, Ej(z), this is given by [38]
Ej(z) = EIn,jt′
j−1,j
exp(−ikjzj) + r′j,j+1τ2j exp(ikjzj)
1 + r∗j−1,jr′
j,j+1τ2j
(8)
where zj is the local depth in layer j, such that zj = 0 at Γj−1,j and zj = dj at Γj,j+1, and
t′j−1,j is the effective transmission coefficient at Γj−1,j (t′j−1,j = 1 − r′j−1,j = 1 + r∗j−1,j). Note
that, in layer m (the last thin film), r′j,j+1 is just equal to rj,j+1.
The intensity in the top or jth layer can then be found by squaring the magnitude of
eqn. (7) or (8), respectively.
I2(z) =cǫ0ǫ2
2|E2(z)|
2 (9)
Ij(z) =cǫ0ǫj
2|Ej(z)|
2 (10)
where ǫj is the permittivity of layer j.
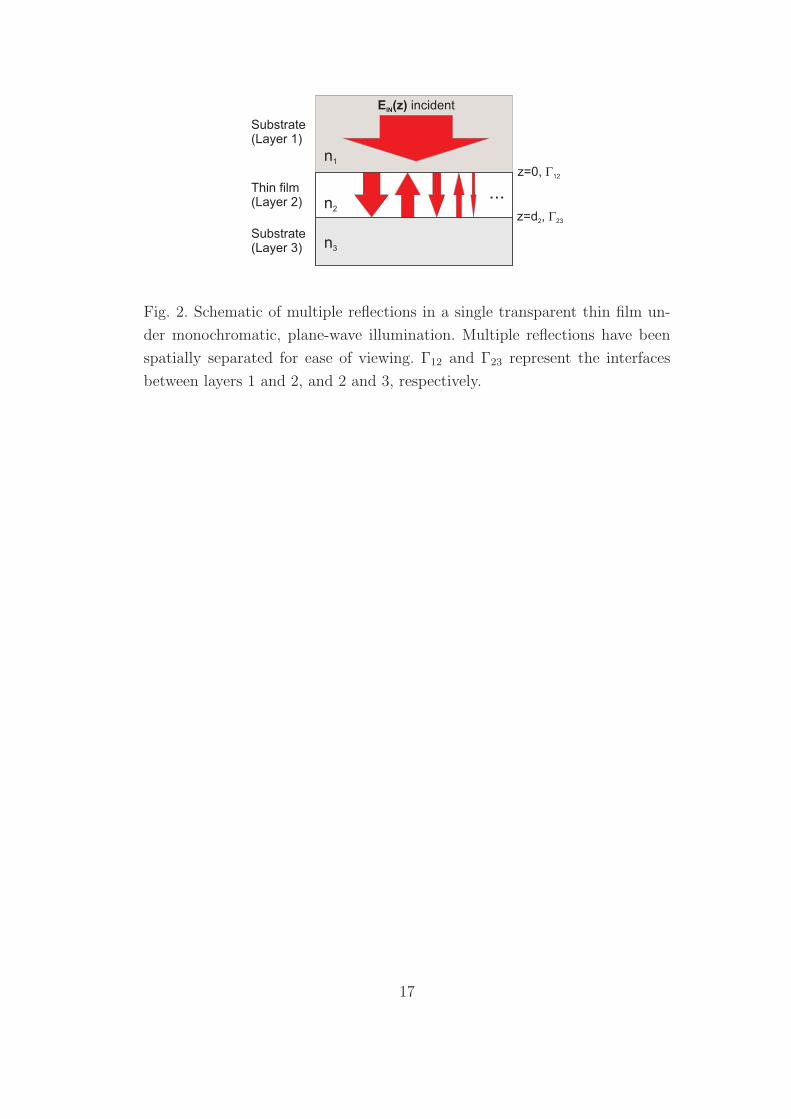
3. Implications of Standing Waves for fs-LIFT
Using the above, multi-layered model, it is simple to determine the standing wave intensity
profile in a typical fs-LIFT setup. Consider first the case of a single donor film of refractive
index ndonor and thickness ddonor on a silica carrier (ncarrier ≈ 1.47 + 0i) separated by an
air gap of thickness dair from a receiver with a surface reflection coefficient rrec, as shown in
fig. 3. Clearly the carrier is equivalent to layer 1 in the above model; the donor is layer 2,
the air gap layer 3, and the receiver layer 4.
For the simulations, the laser wavelength was chosen to be 800 nm, in accordance with
experiments. EIn, I2, and Ij were all set to 1 for simplicity, and hence the incident intensity
at the carrier-donor interface (z = 0) was also unity. For the donor, a material similar to
the GdGaO was chosen, so ndonor = ndonor + iκdonor ≈ 1.95 − 0.03i; the value of κdonor
corresponded to a 1/e absorption depth of approximately 2 µm.
There are essentially three variable parameters in this set-up, ddonor, dair, and rrec (ndonor is
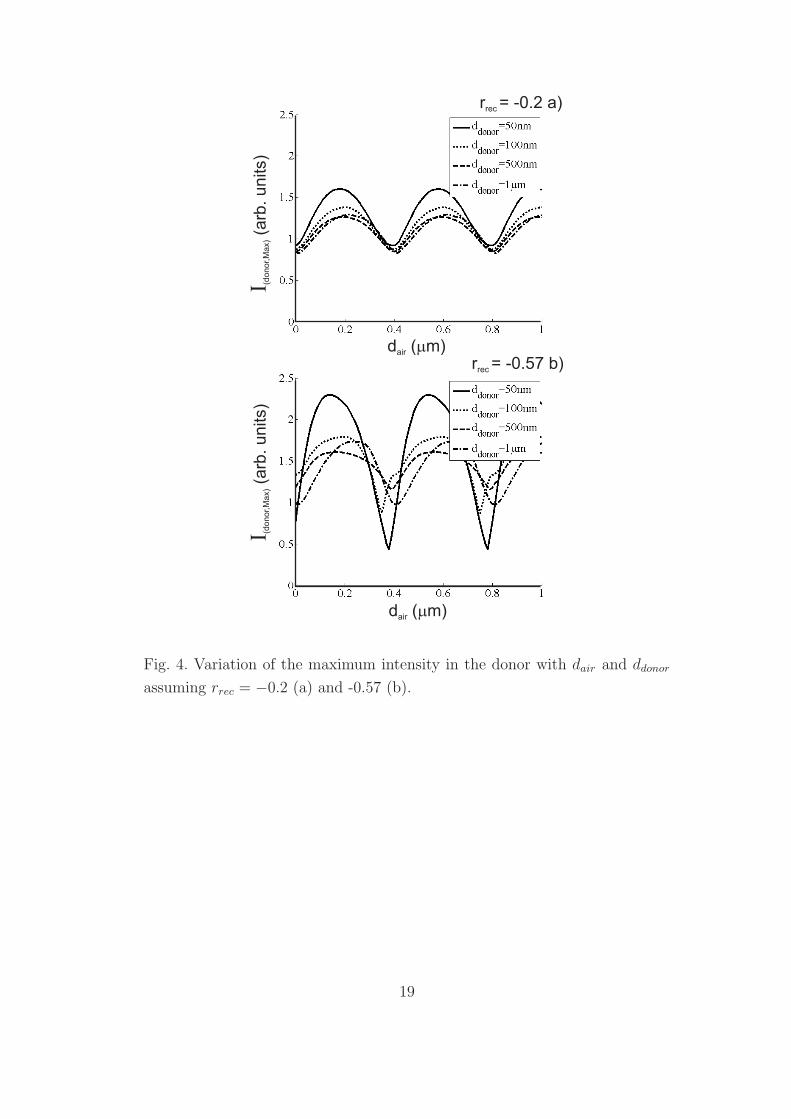
obviously fixed by the application). Figure 4 shows the variation of maximum intensity in the
donor, I(donor,Max), as a function of dair for a range of donor film thicknesses, with receivers
approximately corresponding to silica (rrec = −0.2, fig. 4(a)) and silicon (rrec = −0.57,
fig. 4(b)). The most obvious trend that can be seen is that I(donor,Max) varied approximately
sinusoidally with dair with a period of around λ/2. This result was intuitive as interference
in the donor film due to the first reflection off the receiver was constructive for 2dair =
λ/2, 3λ/2, . . . and destructive for 2dair = 0, λ, 2λ, . . . (note the π-phase shift upon reflection
from the air-receiver interface).
The dependence on ddonor was also relatively easy to explain. Due to interference between
the forward propagating incident wave and the two back-reflections off the donor-air interface
5
and the receiver surface, a pattern of maxima and minima was formed in the donor film with
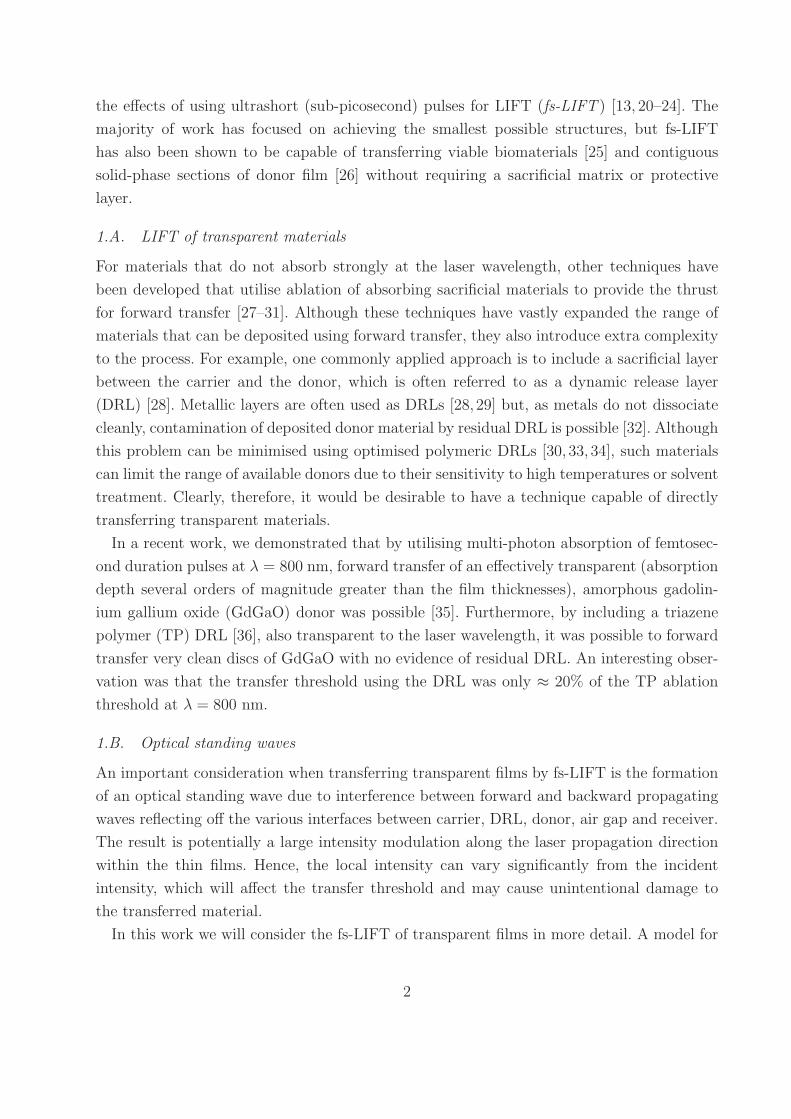
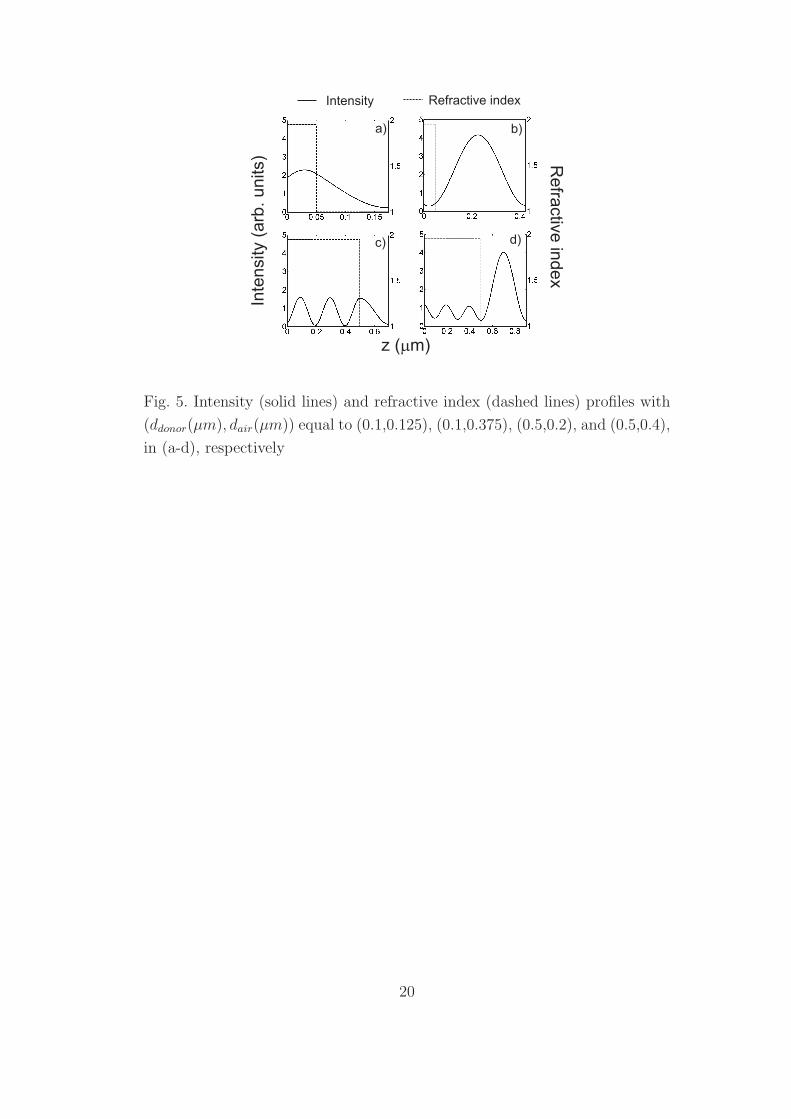
a period of λ/2ndonor ≈ 200 nm. Consider fig. 5 which shows the calculated intensity profiles
in the donor and air layers with (ddonor(µm), dair(µm)) equal to (0.1,0.125), (0.1,0.375),
(0.5,0.2), and (0.5,0.4), in fig. 5(a)-(d), respectively. The receiver reflectivity was rrec = −0.57
and the refractive index profile is included as a dashed line to indicate the donor-air boundary.
The necessity to have an intensity minimum at the receiver surface meant that dair de-
termined the positions of the maxima and minima in the donor layer. For very thin films
(ddonor ≤ λ/2ndonor), the film thickness was less than the standing wave period so whether
there was a maximum or minimum in the donor was determined by dair (see fig. 5(a) and
(b)). As a result, the maximum intensity in very thin films was highly dependent on dair (see
fig. 4). For thicker films with ddonor > λ/2ndonor, there was always a standing wave maximum
in the donor, and so the dependence on dair decreased. However, there was still a significant,
approximately sinusoidal, dependence of the maximum on dair.
LIFT techniques are well known to be highly sensitive to the applied laser fluence (see
e.g. [1, 21]). Hence, having the maximum intensity in the donor highly dependent on dair
represents a problem as dair is then another parameter that must be accurately controlled for
reproducible results. If we define β as the ratio of the maximum value of Idonor,Max achieved
by varying dair to the minimum value, then β quantifies the variation of the maximum
intensity in the donor as dair is changed. A value of β = 1 is ideal so there is no dependence
of Idonor,Max on dair and critical control of the size of the air gap is not necessary.
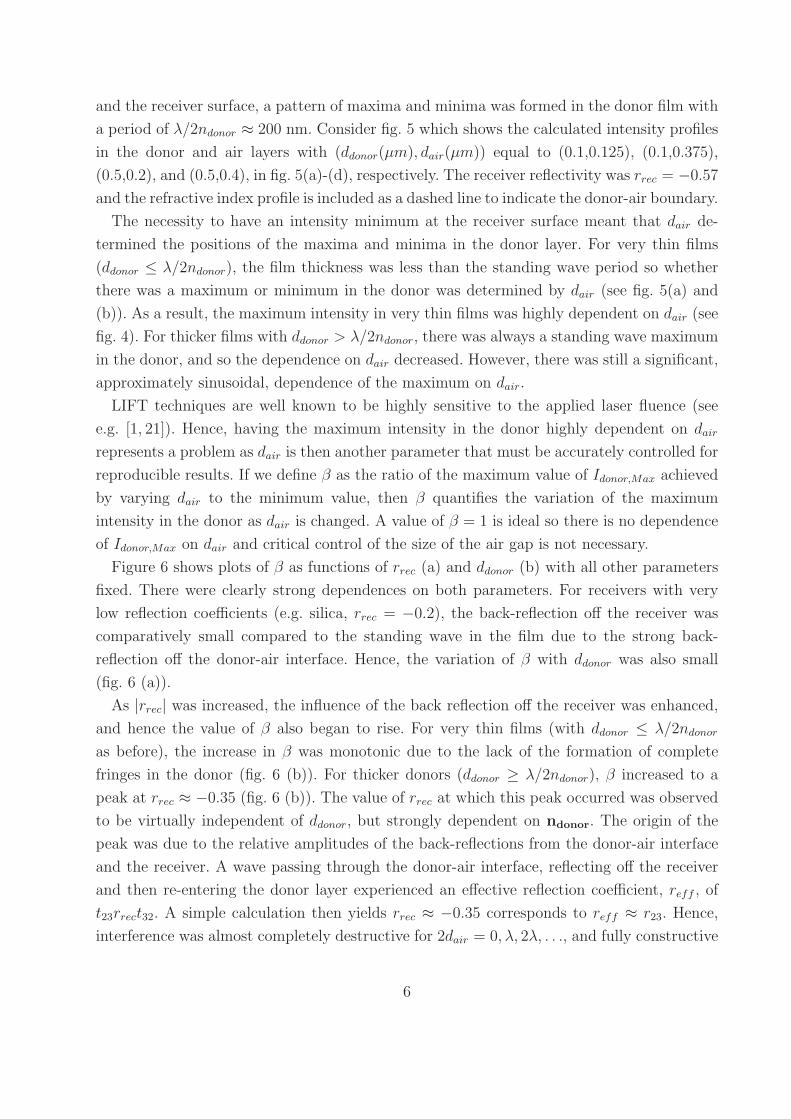
Figure 6 shows plots of β as functions of rrec (a) and ddonor (b) with all other parameters
fixed. There were clearly strong dependences on both parameters. For receivers with very
low reflection coefficients (e.g. silica, rrec = −0.2), the back-reflection off the receiver was
comparatively small compared to the standing wave in the film due to the strong back-
reflection off the donor-air interface. Hence, the variation of β with ddonor was also small
(fig. 6 (a)).
As |rrec| was increased, the influence of the back reflection off the receiver was enhanced,
and hence the value of β also began to rise. For very thin films (with ddonor ≤ λ/2ndonor
as before), the increase in β was monotonic due to the lack of the formation of complete
fringes in the donor (fig. 6 (b)). For thicker donors (ddonor ≥ λ/2ndonor), β increased to a
peak at rrec ≈ −0.35 (fig. 6 (b)). The value of rrec at which this peak occurred was observed
to be virtually independent of ddonor, but strongly dependent on ndonor. The origin of the
peak was due to the relative amplitudes of the back-reflections from the donor-air interface
and the receiver. A wave passing through the donor-air interface, reflecting off the receiver
and then re-entering the donor layer experienced an effective reflection coefficient, reff , of
t23rrect32. A simple calculation then yields rrec ≈ −0.35 corresponds to reff ≈ r23. Hence,
interference was almost completely destructive for 2dair = 0, λ, 2λ, . . ., and fully constructive
6
for 2dair = λ/2, 3λ/2, . . . when rrec ≈ −0.35. This led to the largest possible variation of
Idonor,Max with dair, and hence a maximum in the value of β.
For rrec ≥ reff , the value of β began to fall to a minimum (fig. 6 (b)). Note that, for certain
values of ddonor, the minimum was at an unphysical value of |rrec| > 1. To understand this
behaviour, it is necessary to consider the higher-order reflections that can occur. For example,
consider the second order reflection off the donor-carrier interface for backward-propagating
waves in the donor. The relative strength of this reflection will depend on whether there
is a minimum or a maximum at this interface, which in turn depends on whether there
is a minimum or a maximum at the donor-air interface. The important point to note is
that, if ddonor = mλ/4ndonor (m = 1, 3, 5, . . .) then there will always be a minimum at the
donor-carrier interface if there is a maximum at the donor-air interface and vice-versa (see
fig. 5 (c)&(d)). For ddonor = mλ/4ndonor (m = 2, 4, 6, . . .) the opposite is true. Hence, for
m = 1, 3, 5, . . ., the reflection off the donor-carrier interface acts to counter the variation
in Idonor,Max due to dair, whilst for m = 2, 4, 6, . . . the two effects combine to increase the
variation. Thus the second-order reflection explains why a periodic behaviour of β with ddonor
is observed with a period of λ/2ndonor (fig. 6 (a)). Similarly, the reason why β begins to
increase again above a certain ddonor-dependent value of |rrec| can be explained by considering
even higher order reflections. One final observation to note is that, for all values of rrec, β → 1
as ddonor → ∞ due to the small amount of absorption in the donor film.
To conclude this section, fs-LIFT of transparent films is complicated by the formation
of an optical standing wave. The effect of this standing wave is a dependence of Idonor,Max
on dair that is not observed with absorbing films and means that dair must be accurately
controlled to achieve reproducible results. However, using the above model, it is possible
to identify sets of experimental parameters that minimise this problem. If the application
allows for variation of rrec, then the problem can be reduced significantly. If only control of
dair and ddonor is available, as is likely in many real applications, then it is still possible to
use the model to find optimal values of these parameters.
4. fs-LIFT of transparent GdGaO: Influence of dair
In the previous section it was demonstrated theoretically that the formation of an optical
standing wave during fs-LIFT of transparent films led to a strong dependence of the peak
intensity in the film(s) on the size of the air-gap. It was shown that great care must be taken to
choose optimal values of the various experimental parameters to obtain reproducible results.
In this section we will consider how significant the effect is in practice by investigating the
transfer of a sample transparent donor and how the deposited structures on the receiver vary
with dair.
As a sample donor material, a GdGaO film transparent to all wavelengths greater than
7
≈ 300 nm was used. In a recent work we demonstrated the fs-LIFT of this material using
multi-photon absorption of an 800 nm Ti:sapphire laser pulse (130 fs) [35]. However, it was
observed that direct transfer of the donor resulted in poor quality depositions, which would
be difficult to analyse in terms of damage caused by localised high intensities corresponding
to standing wave maxima. By including a TP-DRL, transparent to wavelengths longer than
400 nm, it was possible to transfer clean discs of GdGaO. Hence we will use the same setup
already described in [35] (DRL: TP 100 nm thick; donor: GdGaO 150 nm thick) for our
studies here.
The above model can easily be extended to include the DRL by including an extra layer
between the carrier and the donor. The TP-DRL is now layer 2 with refractive index nDRL =
nDRL + iκDRL ≈ 1.7−0.06i [39]; the GdGaO donor is layer 3, the air layer 4, and the receiver
layer 5. Note that, in the previous section the value of ndonor was taken to be 1.95. This
corresponds to the refractive index of single crystal gadolinium gallium garnet. However,
because the donor in this experiment had to be grown at room temperature to protect
the heat-sensitive TP-DRL, the resultant film was amorphous. The refractive index of this
amorphous GdGaO is not known so it was chosen to use the value of ndonor = 1.95 as an
approximation.
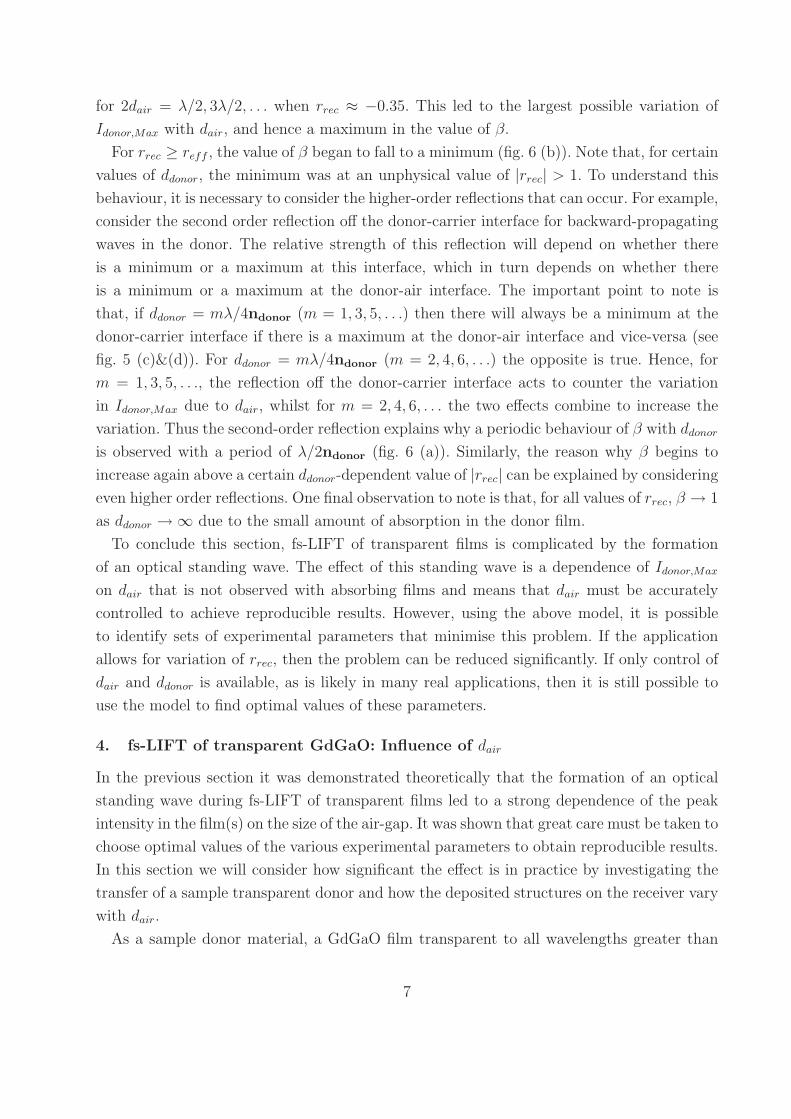
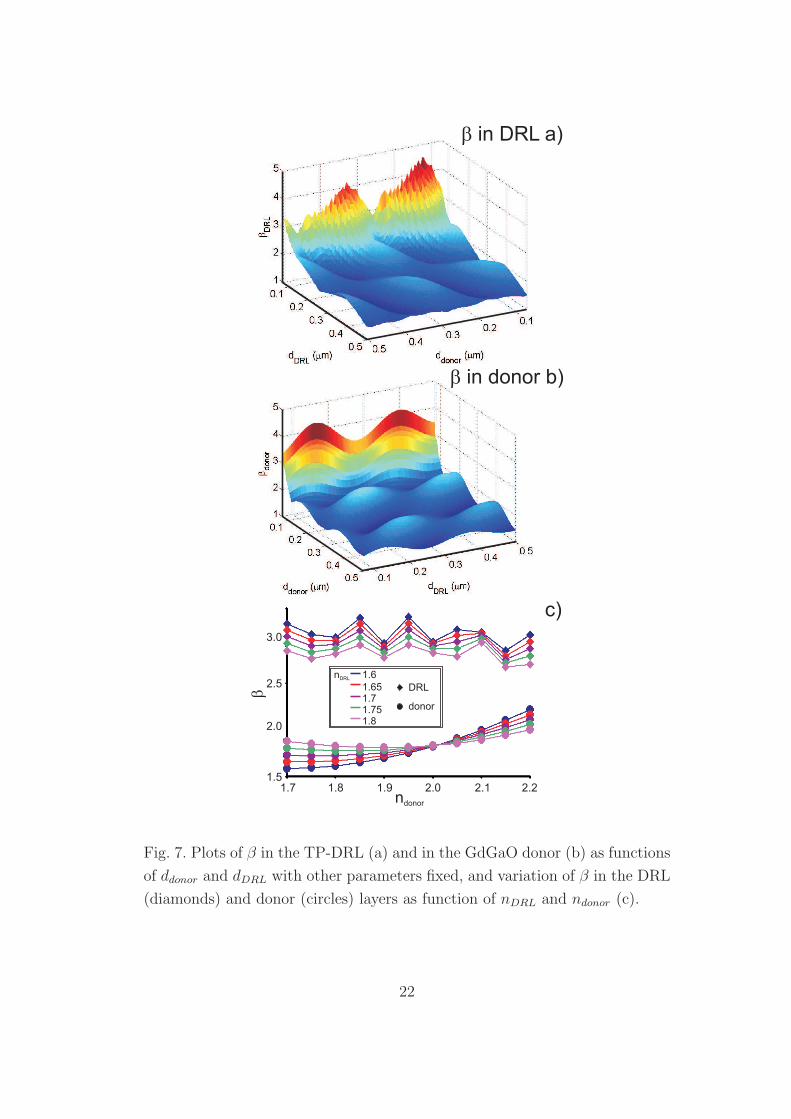
In this multiple-film geometry, the parameter β is important in both the DRL and donor
films. Similar calculations to those performed above again yielded periodic dependences of β
on the film thicknesses of both DRL and donor, as shown in fig. 7(a) and (b), respectively.
This behaviour can be easily explained considering the relative intensities of the multiple
reflections as before.
Assuming the best guesses of nDRL and ndonor given above for the TP and the GdGaO,
the model gives β = 3.0717 in the DRL and β = 1.7882 in the donor for dDRL = 100 nm
and ddonor = 150 nm. When nDRL and ndonor were allowed to vary while keeping the film
thicknesses constant (fig. 7(c)), it was found that, although there were dependences of β on
the refractive indices in both layers, these dependences were comparatively weak. Hence, the
most important parameters in determining the values of β in the two films appear to be the
film thicknesses. In this case the minimum values of β were ≈ 1.25 and ≈ 1.4 in the DRL
and donor layers, respectively. However, given the uncertainty in the values of nDRL and
ndonor, such numerical results should be considered as somewhat approximate.
4.A. Experiments with GdGaO
The fs-LIFT experiments were performed using a micromachining workstation (modified New
Wave UP-266) fitted with a white light source and a CCD camera for viewing the workpiece.
As the DRL and donor films were transparent to the white light, thin film interference of
the white light occurred that was observed as coloured fringes on the CCD. Estimating the
8

reflection coefficients of the interfaces using the previously given refractive indices yielded
r12 ≈ −0.07, r23 ≈ −0.07, r34 ≈ 0.32, and r45 = rrec ≈ −0.57. Hence, the back reflections off
the donor-air and air-receiver interfaces were by far the strongest and so we can conclude
that the visible fringes were primarily the result of thin film interference in the air gap.
Therefore, it was possible to estimate dair from the colour of the fringe, λf , and the fringe
number, f . For example, for the first green fringe, λf ≈ 530 and f = 1, dair = fλf/4 ≈ 130
nm.
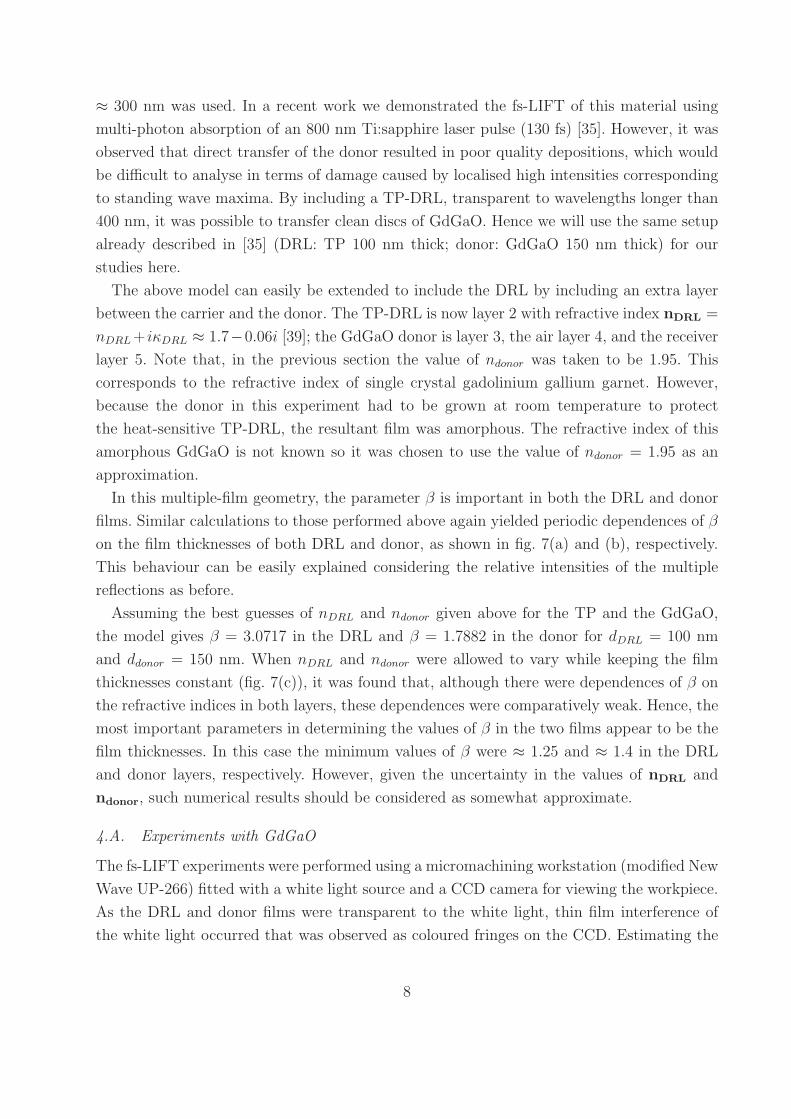
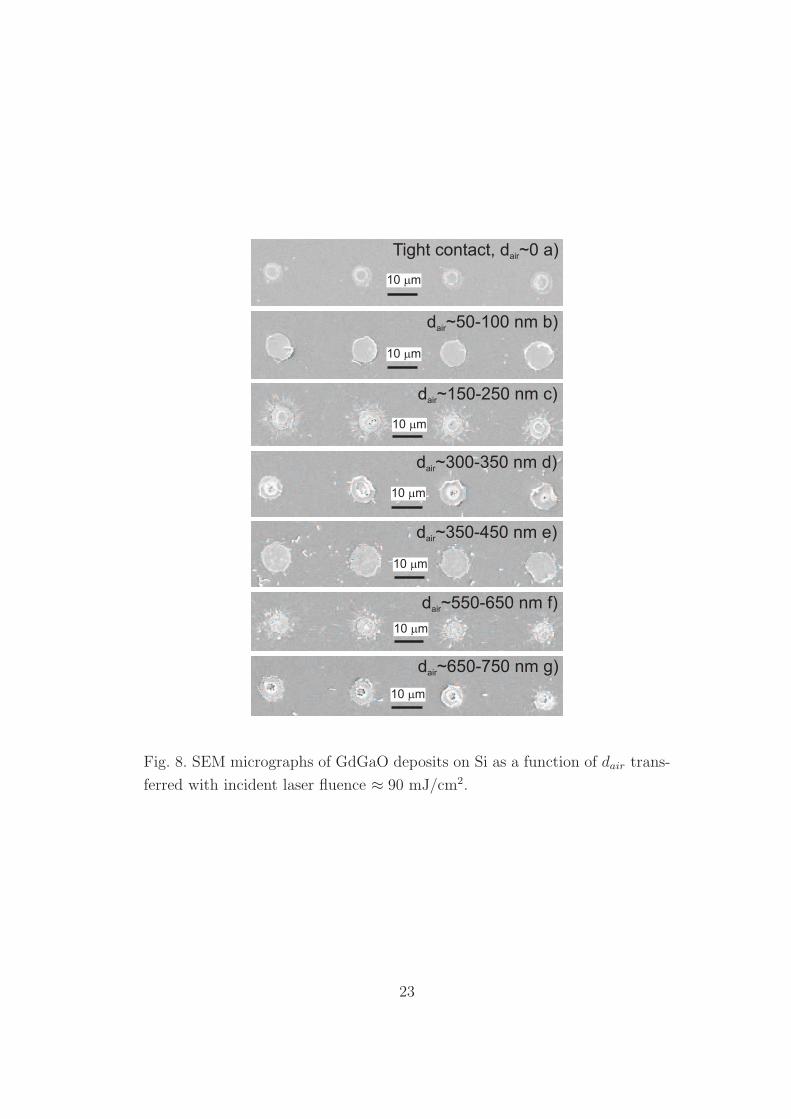
Figure 8 shows SEM micrographs of deposited GdGaO as a function of dair. For reasons
described in [35], it is believed that all the TP-DRL was removed during the forward transfer
process. Observation of these results revealed a periodic dependence of the GdGaO deposit
morphology on dair. With donor and receiver in tight contact (dair ≈ 0 fig. 8(a)) no deposits
were obtained. This was believed to be due to the fact that the donor layer did not have
sufficient room to deform and shear due to the close proximity of the receiver [35]. Increas-
ing dair to around 50 or 100 nm (fig. 8(b)) resulted in the good quality, unshattered discs
reported previously [35]. For dair ≈ 200 nm, the deposited structures were very different, ex-
hibiting significant laser damage and splattered material transferred around the main deposit
(fig. 8(c)). Further increasing dair resulted in a gradual reduction in the amount of apparent
laser damage (fig. 8(d)) until around dair ≈ 400 nm when similar good quality discs to those
observed at dair ≤ 100 nm were seen again (fig. 8(e)). However, at this separation, there was
evidence of more (solid phase) debris, believed to be due to shattering during transfer [35].
When dair was increased to greater than 400 nm, similar behaviour was observed. Firstly,
the amount of laser damage to the GdGaO increased with dair up to dair ≈ 600 nm (fig. 8(f)),
before decreasing again until relatively clean discs were seen for dair ≈ 800 nm (fig. 8(g)).
This periodic variation of deposits continued with the donor-receiver separation, with good-
quality deposits obtained when dair ≈ 400, 800, . . . nm and significantly damaged material
when dair ≈ 200, 600, . . . nm.
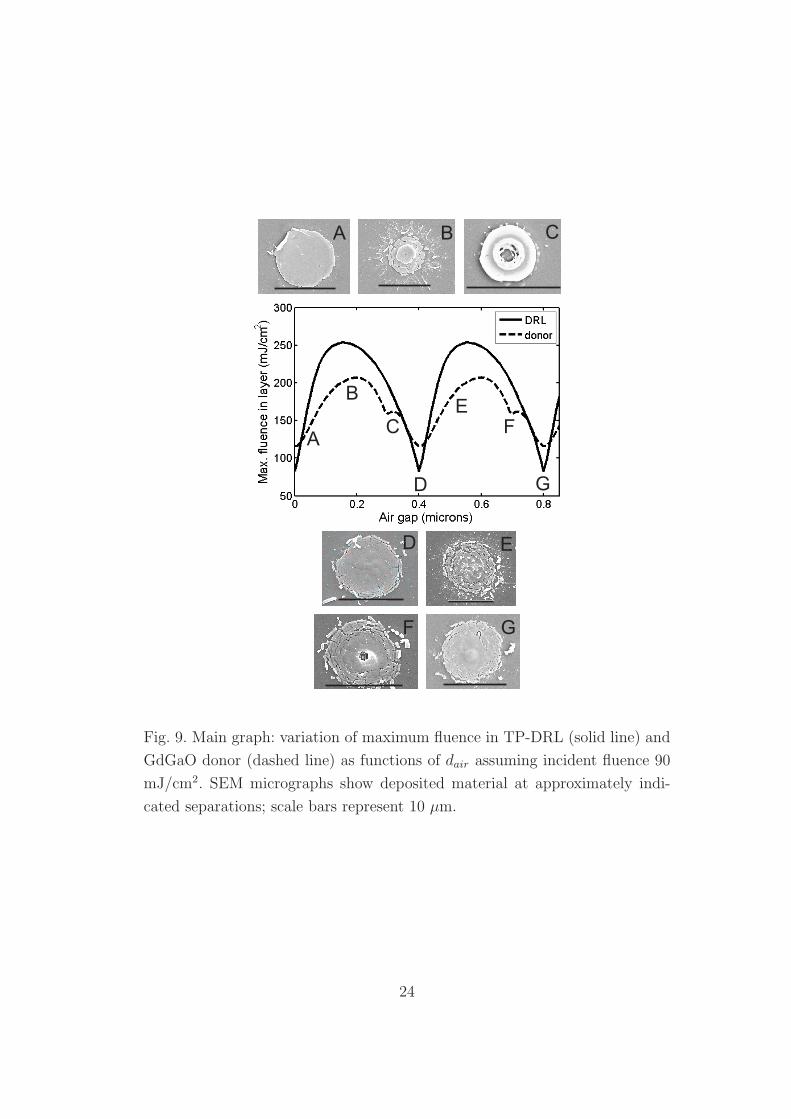
It is simple to explain the observed variation in the quality of deposited material by
considering the effect of multiple reflections. In previous work, the forward transfer threshold
of a 150 nm GdGaO donor on a 100 nm TP-DRL was measured to be around 90 mJ/cm2,
compared to ablation thresholds of 110 and 500 mJ/cm2 for the GdGaO and TP, respectively
[35]. Figure 9 shows a plot of the variation of maximum fluence in the DRL (solid line)
and donor (dashed line) layers with dair calculated using the material properties described
above and assuming an incident fluence of 90 mJ/cm2. The SEM micrographs A-G show
typical deposits obtained at values of dair indicated by A-G on the graph. As would be
expected, the relatively undamaged deposits coincided with values of dair where destructive
interference resulted in relatively low fluences in the DRL and donor (see A,D,G). Similarly,
the most obviously damaged deposits were obtained when dair corresponded to constructive
9
interference in the films (B,E).
The results in fig. 9 also provide a likely explanation for the surprisingly low (below the
ablation threshold) transfer thresholds of GdGaO when a TP-DRL was included [35]. As can
be seen from the plot in fig. 9, assuming an incident fluence of 90 mJ/cm2, the maximum
fluence in the TP-DRL varied from ≈80 to ≈ 250 mJ/cm2 as dair changed, and hence the
fluence was never sufficient to photolytically decompose the TP-DRL. However, the fluence
in the donor was consistently above 110 mJ/cm2 (i.e. greater than the measured ablation
threshold). This observation suggested that the forward transfer of GdGaO resulted from
absorption of the laser in, and associated heating of, the donor; the hot donor film then
conductively heated the TP-DRL which subsequently thermally decomposed. Note that these
results indicate that it is possible to get good quality transfer of donor material, even when
the donor has a lower ablation threshold than the DRL at the laser wavelength, provided
that the donor can withstand heating to the DRL ablation/decomposition temperature. Note
also the apparent disparity between the numerical results in fig. 9 and the measured ablation
threshold of the GdGaO. The model predicted fluences in the donor well above its ablation
threshold for most values of dair, but no evidence of laser damage was seen in the deposits
at dair ≈ 0, 400, 800, . . . nm. This can be explained by the fact that the model does not take
into account the increase in κdonor as the fluence approached the ablation threshold and the
GdGaO began to absorb the laser nonlinearly.
5. Conclusions
To conclude, a thin film interference model has been used to predict the standing wave
intensity distribution formed during the femtosecond LIFT of transparent films. The model
has been used to investigate the effects of varying a number of experimental parameters,
including the thicknesses of the donor, DRL, and air layers, and the receiver reflectivity. An
important consideration that has been identified was the dramatic variation of the fluence in
the DRL and donor layers as dair was changed. We have shown that, in principle, it is possible
to minimise this effect with the proper choice of film thicknesses (and receiver reflectivity, if
this parameter can be varied).
The results of the model have been compared to experimental results of the transfer of
a GdGaO donor on a TP-DRL. The model appeared to explain the periodic variation in
the morphology of GdGaO deposits with dair. Also, the model provided an explanation
of the below ablation threshold transfer of GdGaO. The transfer process is now believed
to be a thermolytic decomposition of the TP layer due to conductive heating from the
overlying donor, which nonlinearly absorbed the laser at a lower fluence. Taken together, the
experimental and numerical results indicate that fs-LIFT is a viable method for the transfer
of transparent materials. However, extra care must be taken with regards to the formation
10
of a standing wave and the relative damage thresholds of the DRL and donor materials.
6. Acknowledgments
This work was funded by the Engineering and Physical Sciences Research Council, UK, under
Grant No. EP/C515668/1. The authors are grateful to Romain Fardel and Matthias Nagel
at EMPA, and Thomas Lippert at the Paul Scherrer Institut for providing the TP-DRLs
and for illuminating discussions.
11
References
1. J. Bohandy, B. Kim, and F. Adrian, “Metal deposition from a supported metal film
using an excimer laser,” J. Appl. Phys. 60, 1538–1539 (1986).
2. D. Willis and V. Grosu, “Microdroplet deposition by laser-induced forward transfer,”
Appl. Phys. Lett. 86, 244103 (2005).
3. F. Adrian, J. Bohandy, B. Kim, A. Jette, and P. Thompson, “A study of the mechanism
of metal deposition by the laser-induced forward transfer process,” J. Vac. Sci. Technol.
B 5, 1490–1494 (1987).
4. R. Baseman and N. Froberg, “Minimum fluence for laser blow-off of thin gold films at
248 and 532 nm,” Appl. Phys. Lett. 56, 1412–1414 (1990).
5. Z. Toth, Z. Kantor, P. Mogyorosi, and T. Szorenyi, “Surface patterning by pulsed laser
induced transfer of metals and compounds,” Proc. SPIE 1279, 150–157 (1990).
6. H. Esrom, J. Zhang, U. Kogelschatz, and A. Pedraza, “New approach of a laser-induced
forward transfer for deposition of patterned thin metal films,” Appl. Surf. Sci. 86, 202–
207 (1995).
7. I. Zergioti, D. Papazoglou, A. Karaiskou, C. Fotakis, E. Gamaly, and A. Rode, “A
comparative schlieren imaging study between ns and sub-ps laser forward transfer of
Cr,” Appl. Surf. Sci. 208-209, 177–180 (2003).
8. Y. Nakata and T. Okada, “Time-resolved microscopic imaging of the laser-induced for-
ward transfer process,” Appl. Phys. A [Suppl.] 69, S275–S278 (1999).
9. R. Bahnisch, W. Gross, and A. Menschig, “Single-shot, high repetition rate metallic
pattern transfer,” Microelectron. Eng. 50, 541–546 (2000).
10. B. Tan, K. Venkatakrishnan, and K. Tok, “Selective surface texturing using femtosecond
pulsed laser induced forward transfer,” Appl. Surf. Sci. 207, 365–371 (2003).
11. L. Landstrom, J. Klimstein, G. Schrems, K. Piglmayer, and D. Bauerle, “Single-step
patterning and the fabrication of contact masks by laser-induced forward transfer,” Appl.
Phys. A 78, 537–548 (2004).
12. I. Lee, W. Tolbert, D. Dlott, M. Doxtader, D. Foley, D. Arnold, and E. Ellis, “Dynamics
of laser ablation transfer imaging investigated by ultrafast microscopy,” J. Imag. Sci.
Tech. 36, 180–187 (1992).
13. I. Zergioti, S. Mailis, N. Vainos, P. Papakonstantinou, C. Kalpouzos, C. Grigoropoulos,
and C. Fotakis, “Microdeposition of metal and oxide structures using ultrashort laser
pulses,” Appl. Phys. A 66, 579–582 (1998).
14. H. Sakata, S. Chakraborty, E. Yokoyama, M. Wakaki, and D. Chakravorty, “Laser-
induced forward transfer of tio-au nanocomposite films for maskless patterning,” Appl.
Phys. Lett. 86, 114104 (2005).
12

15. E. Fogarassy, C. Fuchs, F. Kerherve, G. Hauchecorne, and J. Perriere, “Laser-induced
forward transfer of high-Tc ybacuo and bisrcacuo superconducting thin films,” J. Appl.
Phys. 66, 457–459 (1989).
16. S. Pimenov, G. Shafeev, A. Smolin, V. Konov, and B. Vodolaga, “Laser-induced forward
transfer of ultra-fine diamond particles for selective deposition of diamond films,” Appl.
Surf. Sci. 86, 208–212 (1995).
17. S. Chang-Jian, J. Ho, J. Cheng, and C. Sung, “Fabrication of carbon nanotube field
emission cathodes in patterns by a laser transfer method,” Nanotechnology 17, 1184–
1187 (2006).
18. B. Thomas, A. Alloncle, P. Delaporte, M. Sentis, S. Sanaur, M. Barret, and P. Collot,
“Experimental investigations of laser-induced forward transfer process of organic thin
films,” Appl. Surf. Sci. 254, 1206–1210 (2007).
19. Y. Tsuboi, Y. Furuhata, and N. Kitamura, “A sensor for adenosine triphosphate fabri-
cated by laser-induced forward transfer of luciferase onto a poly(dimethylsiloxane) mi-
crochip,” Appl. Surf. Sci. 253, 8422–8427 (2007).
20. L. Yang, C. Wang, X. Ni, Z. Wang, W. Jia, and L. Chai, “Microdroplet deposition of
copper film by femtosecond laser-induced forward transfer,” Appl. Phys. Letts 89, 161110
(2006).
21. D. Banks, C. Grivas, J. Mills, I. Zergioti, and R. Eason, “Nanodroplets deposited in
microarrays by femtosecond ti:sapphire laser induced forward transfer,” Appl. Phys.
Lett. 89, 193107 (2006).
22. S. Bera, A. Sabbah, J. Yarbrough, C. Allen, B. Winters, C. Durfee, and J. Squier,
“Optimization study of the femtosecond laser-induced forward-transfer process with thin
aluminium films,” Appl. Optics 46, 4650–4659 (2007).
23. C. Germain, L. Charron, L. Lilge, and Y. Tsui, “Electrodes for microfluidic devices
produced by laser induced forward transfer,” Appl. Surf. Sci. 253, 8328–8333 (2007).
24. F. Claeyssens, A. Klini, A. Mourka, and C. Fotakis, “Laser patterning of zn for zno
nanostructure growth: Comparison between laser induced forward transfer in air and in
vacuum,” Thin Solid Films 515, 8529–8533 (2007).
25. I. Zergioti, A. Karaiskou, D. Papazoglou, C. Fotakis, M. Kapsetaki, and D. Kafetzopou-
los, “Time resolved schlieren study of sub-pecosecond and nanosecond laser transfer of
biomaterials,” Appl. Surf. Sci. 247, 584589 (2005).
26. D. Banks, C. Grivas, I. Zergioti, and R. Eason, “Ballistic laser-assisted solid transfer
(blast) from a thin film precursor,” Opt. Express 16, 3249–3254 (2008).
27. A. Pique, D. Chrisey, R. Auyeung, J. Fitz-Gerald, H. Wu, R. McGill, S. Lakeou, P. Wu,
V. Nguyen, and M. Duignan, “A novel laser transfer process for direct writing of elec-
tronic and sensor materials,” Appl. Phys. A [Suppl.] 69, S279–S284 (1999).
13
28. W. Tolbert, I. Lee, M. Doxtader, E. Ellis, and D. Dlott, “High-speed color imaging by
laser ablation transfer with a dynamic release layer: fundamental mechanisms,” J. Imag.
Sci. Tech. 37, 411–421 (1993).
29. P. Serra, M. Colina, J. Fernandez-Pradas, L. Sevilla, and J. Morenza, “Preparation of
functional dna microarrays through laser-induced forward transfer,” Appl. Phys. A 85,
1639–1641 (2004).
30. G. Blanchet, Y.-L. Loo, J. Rogers, F. Gao, and C. Fincher, “Large area, high resolution,
dry printing of conducting polymers for organic electronics,” Appl. Phys. Lett. 82, 463–
465 (2003).
31. R. Fardel, M. Nagel, F. Nuesch, T. Lippert, and A. Wokaun, “Fabrication of organic
light-emitting diode pixels by laser-assisted forward transfer,” Appl. Phys. Lett. 91,
061103 (2007).
32. T. Smausz, B. Hopp, G. Kecskemeti, and Z. Bor, “Study on metal microparticle content
of the material transferred with absorbing film assisted laser induced forward transfer
when using silver absorbing layer,” Appl. Surf. Sci. 252, 4738–4742 (2006).
33. R. Fardel, M. Nagel, F. Nuesch, T. Lippert, and A. Wokaun, “Laser forward transfer
using a sacrificial layer: influence of the material properties,” Appl. Surf. Sci. 254, 1322–
1326 (2007).
34. N. Kattamis, P. Purnick, R. Weiss, and C. Arnold, “Thick film laser induced forward
transfer for deposition of thermally and mechanically sensitive materials,” Appl. Phys
Lett. 91, 171120 (2007).
35. D. Banks, K. Kaur, R. Gazia, R. Fardel, M. Nagel, T. Lippert, and R. Eason, “Triazene
photopolymer dynamic release layer-assisted femtosecond laser-induced forward transfer
with an active carrier substrate,” Europhys. Lett. 83, 38003 (2008).
36. M. Nagel, R. Hany, T. Lippert, M. Molberg, F. Nuesch, and D. Rentsch, “Aryltriazene
photopolymers for uv-laser applications: Improved synthesis and photodecomposition
study,” Macromol. Chem. Phys. 208, 277–286 (2007).
37. F. Dill, “Optical lithography,” IEEE T. Electron Dev. ED-22, 440–444 (1975).
38. C. Mack, “Analytical expression for the standing wave intensity in photoresist,” Appl.
Optics 25, 1958–1961 (1986).
39. J. Bonse, J. Solis, L. Urech, T. Lippert, and A. Wokaun, “Femtosecond and nanosecond
laser damage thresholds of doped and undoped triazenepolymer thin films,” Appl. Surf.
Sci. 253, 7787–7791 (2007).
14
List of Figure Captions
Fig. 1. Schematic of the LIFT technique.
Fig. 2. Schematic of multiple reflections in a single transparent thin film under monochro-
matic, plane-wave illumination. Multiple reflections have been spatially separated for ease of
viewing. Γ12 and Γ23 represent the interfaces between layers 1 and 2, and 2 and 3, respectively.
Fig. 3. Fs-LIFT of a single film.
Fig. 4. Variation of the maximum intensity in the donor with dair and ddonor assuming
rrec = −0.2 (a) and -0.57 (b).
Fig. 5. Intensity (solid lines) and refractive index (dashed lines) profiles with
(ddonor(µm), dair(µm)) equal to (0.1,0.125), (0.1,0.375), (0.5,0.2), and (0.5,0.4), in (a-d), re-
spectively.
Fig. 6. Plots of β as functions of ddonor (a) and rrec (b) with other parameters fixed.
Fig. 7. Plots of β in the TP-DRL (a) and in the GdGaO donor (b) as functions of ddonor
and dDRL with other parameters fixed, and variation of β in the DRL (diamonds) and donor
(circles) layers as function of nDRL and ndonor (c).
Fig. 8. SEM micrographs of GdGaO deposits on Si as a function of dair transferred with
incident laser fluence ≈ 90 mJ/cm2.
Fig. 9. Main graph: variation of maximum fluence in TP-DRL (solid line) and GdGaO donor
(dashed line) as functions of dair assuming incident fluence 90 mJ/cm2. SEM micrographs
show deposited material at approximately indicated separations; scale bars represent 10 µm.
15
Focused/demagnifiedlaser pulse
Transparentcarrier
Receiver
Donor film Transfer
Fig. 1. Schematic of the LIFT technique.
16
E (z)IN incident
Thin film(Layer 2)
Substrate(Layer 1)
Substrate(Layer 3)
z=0, G12
z=d ,2 23G
n1
n2
n3
...
Fig. 2. Schematic of multiple reflections in a single transparent thin film un-
der monochromatic, plane-wave illumination. Multiple reflections have been
spatially separated for ease of viewing. Γ12 and Γ23 represent the interfaces
between layers 1 and 2, and 2 and 3, respectively.
17
nair
ndonor
ncarrier
ddonor
l=800 nm,=1E
In
dair
rreceiver
Fig. 3. Fs-LIFT of a single film.
18
r = -0.2 a)rec
d ( m)air m
d ( m)air mr = -0.57 b)rec
I(d
on
or,M
ax)(a
rb.
un
its)
I(d
on
or,M
ax)(a
rb.
un
its)
Fig. 4. Variation of the maximum intensity in the donor with dair and ddonor
assuming rrec = −0.2 (a) and -0.57 (b).
19
a) b)
c) d)
Inte
nsity (
arb
. u
nits) R
efra
ctiv
e in
de
x
z ( m)m
Intensity Refractive index
Fig. 5. Intensity (solid lines) and refractive index (dashed lines) profiles with
(ddonor(µm), dair(µm)) equal to (0.1,0.125), (0.1,0.375), (0.5,0.2), and (0.5,0.4),
in (a-d), respectively
20

d ( m)donor m
rrec
b
b
a)
b)
Fig. 6. Plot of β as functions of ddonor (a) and rrec (b) with other parameters
fixed.
21
b in DRL a)
c)
b in donor b)
1.7 1.8 1.9 2.0 2.1 2.21.5
2.5
3.0
2.0
ndonor
b
n 1.6
1.651.71.751.8
DRL
DRL
donor
Fig. 7. Plots of β in the TP-DRL (a) and in the GdGaO donor (b) as functions
of ddonor and dDRL with other parameters fixed, and variation of β in the DRL
(diamonds) and donor (circles) layers as function of nDRL and ndonor (c).
22
10 mm
d ~50-100 nm b)air
Tight contact, d ~0 a)air
10 mm
10 mm
d ~150-250 nm c)air
10 mm
d ~300-350 nm d)air
10 mm
d ~350-450 nm e)air
10 mm
d ~550-650 nm f)air
10 mm
d ~650-750 nm g)air
Fig. 8. SEM micrographs of GdGaO deposits on Si as a function of dair trans-
ferred with incident laser fluence ≈ 90 mJ/cm2.
23
A
B
C
D
EF
G
A B C
D E
F G
Fig. 9. Main graph: variation of maximum fluence in TP-DRL (solid line) and
GdGaO donor (dashed line) as functions of dair assuming incident fluence 90
mJ/cm2. SEM micrographs show deposited material at approximately indi-
cated separations; scale bars represent 10 µm.
24