Características fisiológicas e crescimento de clones de eucalipto em resposta ao boro

This article was downloaded by: [Ismail Kashif Hany]On: 13 February 2012, At: 10:12Publisher: Taylor & FrancisInforma Ltd Registered in England and Wales Registered Number: 1072954 Registeredoffice: Mortimer House, 37-41 Mortimer Street, London W1T 3JH, UK
Phase Transitions: A MultinationalJournalPublication details, including instructions for authors andsubscription information:http://www.tandfonline.com/loi/gpht20
Influence of heat treatment onstructure and some physical propertiesof lithium boro-niobate glassI. Kashif a , E.M. Sakr b , A.A. Soliman b & A. Ratep ba Faculty of Science, Department of Physics, Al-Azhar University,Nasr City, Cairo, Egyptb Faculty of Girls, Department of Physics, Ain Shams University,Heliopolis, Cairo, Egypt
Available online: 10 Feb 2012
To cite this article: I. Kashif, E.M. Sakr, A.A. Soliman & A. Ratep (2012): Influence of heattreatment on structure and some physical properties of lithium boro-niobate glass, PhaseTransitions: A Multinational Journal, DOI:10.1080/01411594.2011.648934
To link to this article: http://dx.doi.org/10.1080/01411594.2011.648934
PLEASE SCROLL DOWN FOR ARTICLE
Full terms and conditions of use: http://www.tandfonline.com/page/terms-and-conditions
This article may be used for research, teaching, and private study purposes. Anysubstantial or systematic reproduction, redistribution, reselling, loan, sub-licensing,systematic supply, or distribution in any form to anyone is expressly forbidden.
The publisher does not give any warranty express or implied or make any representationthat the contents will be complete or accurate or up to date. The accuracy of anyinstructions, formulae, and drug doses should be independently verified with primarysources. The publisher shall not be liable for any loss, actions, claims, proceedings,demand, or costs or damages whatsoever or howsoever caused arising directly orindirectly in connection with or arising out of the use of this material.
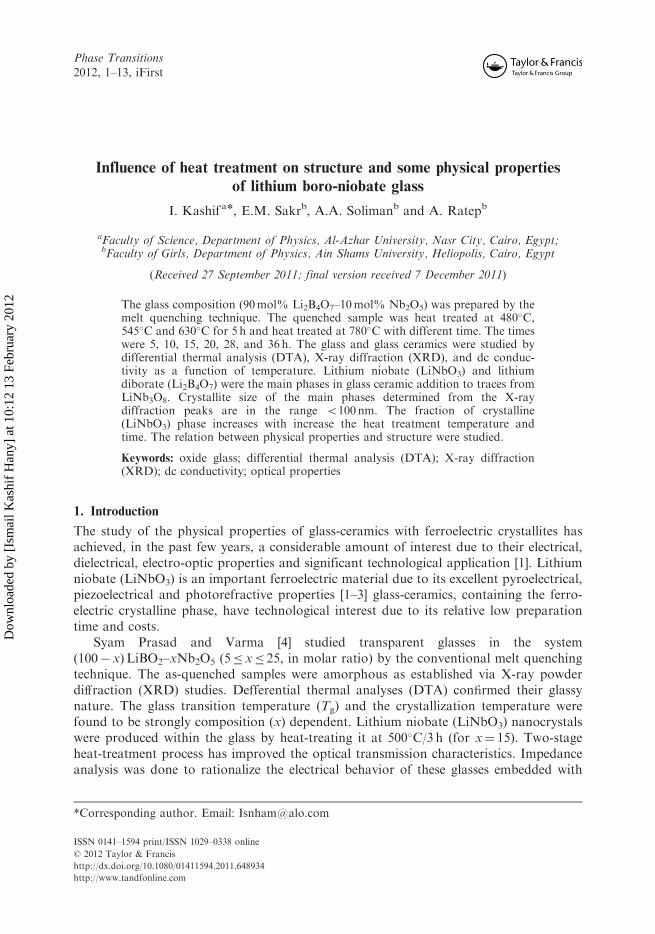
Phase Transitions2012, 1–13, iFirst
Influence of heat treatment on structure and some physical properties
of lithium boro-niobate glass
I. Kashif a*, E.M. Sakrb, A.A. Solimanb and A. Ratepb
aFaculty of Science, Department of Physics, Al-Azhar University, Nasr City, Cairo, Egypt;bFaculty of Girls, Department of Physics, Ain Shams University, Heliopolis, Cairo, Egypt
(Received 27 September 2011; final version received 7 December 2011)
The glass composition (90mol% Li2B4O7–10mol% Nb2O5) was prepared by themelt quenching technique. The quenched sample was heat treated at 480�C,545�C and 630�C for 5 h and heat treated at 780�C with different time. The timeswere 5, 10, 15, 20, 28, and 36 h. The glass and glass ceramics were studied bydifferential thermal analysis (DTA), X-ray diffraction (XRD), and dc conduc-tivity as a function of temperature. Lithium niobate (LiNbO3) and lithiumdiborate (Li2B4O7) were the main phases in glass ceramic addition to traces fromLiNb3O8. Crystallite size of the main phases determined from the X-raydiffraction peaks are in the range 5100 nm. The fraction of crystalline(LiNbO3) phase increases with increase the heat treatment temperature andtime. The relation between physical properties and structure were studied.
Keywords: oxide glass; differential thermal analysis (DTA); X-ray diffraction(XRD); dc conductivity; optical properties
1. Introduction
The study of the physical properties of glass-ceramics with ferroelectric crystallites hasachieved, in the past few years, a considerable amount of interest due to their electrical,dielectrical, electro-optic properties and significant technological application [1]. Lithiumniobate (LiNbO3) is an important ferroelectric material due to its excellent pyroelectrical,piezoelectrical and photorefractive properties [1–3] glass-ceramics, containing the ferro-electric crystalline phase, have technological interest due to its relative low preparationtime and costs.
Syam Prasad and Varma [4] studied transparent glasses in the system(100� x) LiBO2–xNb2O5 (5� x� 25, in molar ratio) by the conventional melt quenchingtechnique. The as-quenched samples were amorphous as established via X-ray powderdiGraction (XRD) studies. Defferential thermal analyses (DTA) conErmed their glassynature. The glass transition temperature (Tg) and the crystallization temperature werefound to be strongly composition (x) dependent. Lithium niobate (LiNbO3) nanocrystalswere produced within the glass by heat-treating it at 500�C/3 h (for x¼ 15). Two-stageheat-treatment process has improved the optical transmission characteristics. Impedanceanalysis was done to rationalize the electrical behavior of these glasses embedded with
*Corresponding author. Email: [email protected]
ISSN 0141–1594 print/ISSN 1029–0338 online
� 2012 Taylor & Francis
http://dx.doi.org/10.1080/01411594.2011.648934
http://www.tandfonline.com
Dow
nloa
ded
by [
Ism
ail K
ashi
f H
any]
at 1
0:12
13
Febr
uary
201
2

100 nm sized LiNbO3 crystallites. The observed pyroelectric response and ferroelectric(P vs. E) hysteresis loop at room temperature conErmed the polar nature ofthese composites.
Abdel-Khalek and Bahgat [5] studied the glass composition 92.5Li2B4O7–7.5Nb2O5
(mol%) was prepared by the conventional melt quenching technique. The as-quenchedsample, blue and transparent, was heat-treated at 550�C and 650�C (HT). The glassynature of the as-quenched sample was established by Differential scanning calorimetry(DSC). Lithium niobate LiNbO3 and Li2B4O7 nanocrystals were produced within the glassby heat-treating it at 550 and 650�C/3 h. The amorphous nature of the as-quenched glassesand crystalline of glass nanocrystal composites were conErmed by X-ray powderdiffraction studies. Various optical parameters such as optical band gap (Eopt) andUrbach energy (DE) of these transparent glass–ceramics have been found to be crystallitesize dependent. The volume ratio of the particles increases with increase in heat-treatmenttemperature. The behavior of the �ac, with the increase in the heat treatment (HT)temperature, was related with the decrease in the free ions number in the glass matrix andconsequent increase in the fraction of the crystallites LiNbO3 phase to the crystallitesLi2B4O7 phase and the glass matrix. The dielectric constants of the glass–ceramics decreasewith increase in the HT temperature and with increase in frequency (0.12–100 kHz).
Graca et al. [6] studied the electrical and dielectrical properties of the glass and glass-ceramics with the 60SiO2–30Li2O–10Nb2O5 (mol%) composition, containing LiNbO3
crystallites, were studied. The dc electric conductivity (�dc) and dc activation energy(Ea(dc)) decreases with the rise of the heat treatment (HT) temperature and with theincrease of the amplitude of the applied electric Eeld. The highest dielectric constant, 48.19,was observed in the 650 HT sample. The dielectrical properties were discussed through athree serial capacitor model, two related with the sample surfaces and one with the bulkmaterial, showing that the bulk has the major contribution for the dielectricalcharacteristics. A resistance in parallel with a constant phase element (CPE) is the bestequivalent circuit that describes the dielectrical behavior. The obtained results reFect theimportant role carried out by the treatment temperature and the applied electric Eeld in theelectrical and dielectrical properties of the glass.
Graca et al. [7] studied Lithium niobate (LiNbO3) is a ferroelectric material in thecrystalline form and considerable interest has recently been shown in the study of itsproperties in a glass structure. A 34SiO2–33Li2O–33Nb2O5 (mol%) glass was preparedusing the conventional melt quenching method. LiNbO3 crystals were precipitated in theglass matrix by a heat treatment (HT) process. These glasses were studied by diGerentialthermal analysis, X-ray power diGraction, scanning electron microscopy, dc electricalconductivity (�dc), ac conductivity (�ac) and dielectric measurements. LiNbO3 crystalphase was detected by XRD on the sample HT at 600�C. The dc and ac conductivity, at300K, decreases with the increasing of the HT temperature. The dielectric study infunction of frequency, at constant temperature, was made using the modulus (M) modeland a distribution of relaxation times was observed. The dielectric data was Etted with thecomplex nonlinear least squares procedure, revealing that a resistor in parallel with aconstant phase element is the best equivalent circuit. The dielectric constant value,measured at 1 kHz and room temperature, decreases from 102 to 62 with the increasing ofthe HT temperature, suggesting a random orientation of the dipolar moments associatedwith the LiNbO3 nano crystals.
The main goal of the present work is the preparation of the 90Li2B4O7 mol%–10Nb2O5 mol% Glass compositions, by the melt quenching method, and glass ceramicswith LiNbO3 particles through a heat treatment process. The study the effect of the
2 I. Kashif et al.
Dow
nloa
ded
by [
Ism
ail K
ashi
f H
any]
at 1
0:12
13
Febr
uary
201
2

application of the isothermal and non isothermal heat treatment is another purpose of thestudy. The Avrami constant from heating different rate at glass sample and the activationenergy of crystallization were determined. And the dc conductivity was studied.
2. Experimental
A transparent glass, with the 90Li2B4O7þ 10Nb2O5 molar composition was prepared bymelt quenching. The reagents (Li2B4O7, Nb2O5) in appropriate amount were mixed for 1 hin agate ball mixing planetary system. The mixture was heated in platinum crucible at1200�C for 2 h. The molten material was quenched between to a stainless steel plate atroom temperature and pressed by another plate to obtain flat sample. After that the glasssample was annealed at 300�C (during 2 h) to eliminate internal stress, and then was slowlycooled inside the furnace (as-prepared sample) to obtain glass ceramics. The as-preparedsample was heated-treated at 430�C, 480�C, and 630�C for 5 h. These temperatures werechosen in agreement with differential thermal analysis (DTA) results and heat-treated at780�C for 5, 10, 15, 20, 28, and 36 h.
The DTA measurements were carried out using a SHIMADZU DTA-50 ANALYZERbetween 25�C and 1000�C (in N2 gas and using Al2O3 as reference material)
The X-ray diffraction (XRD) patterns were obtained at room temperature, usingpowder samples, in a Philips X’pert system, with a K� radiation (�¼ 1.54056 A) at 40 kV,and 30mA, with a step of 0.05� in 1 s. For the electrical measurements the opposite sides ofthe sample painted with silver paste. The dc electrical conductivity (�dc) measurements inthe temperature range from 300K to 600K were obtained with a programmable Keithleyelectrometer (type 617). (in steps of 5K. the accuracy of the temperature control andmeasurement is less than 0.1K over the whole range). The optical transition spectra of theas- quenched polished was measured using Jasco 570 spectrophotometer.
3. Result and discussion
Figure 1 shows the DTA curves of the (Li2B4O7, Nb2O5) glass as prepared sample and heattreated at 430�C, 480�C, and 630�C. This figure shows the presence of endothermic peakthat indicate the value of Tg and exothermic peaks that represent the crystallizationtemperature. The as prepared sample was heat-treated at temperature around this valueand measured each time at DTA. Also, Figure 1 shows the exothermic peak disappearedwhen sample heat treated at 630�C.
Figure 2 shows the XRD patterns of the base glass (untreated sample) and heat treatedsample at 480�C, 545�C, and 630�C for 5 h. From Figure 2, it can be observed that theXRD diffraction pattern of glass sample show broad halo peaking at around a diffractionangle 2�¼ 32�, characteristic of an amorphous structure and confirming the absence ofcrystal in the untreated sample.
The heat treatments at all temperature make the sample opaque. This opticalcharacteristic indicates the presence of crystalline in glass matrix, which confirmed by theXRD as shown in Figure 2. The XRD patterns of the heat treated sample for differenttemperature detected the presence of LiNbO3 and Li2B4O7 and traces of LiNb3O8. And theheat treated above 480�C indicates that the increase of the heat treatment temperaturefavors the LiNbO3 phase grows. As mentioned, the increase of the heat treatmenttemperature favors the increase of the volume ratio between crystallites (LiNbO3) and theglass matrix.
Phase Transitions 3
Dow
nloa
ded
by [
Ism
ail K
ashi
f H
any]
at 1
0:12
13
Febr
uary
201
2

Figure 3 shows the XRD patterns of glass sample heat treated at 780�C for various
times up to 36 h. From Figure 3, it can be observed that the LiNBO3 and Li2Nb4O7 and
traces of LiNb3O8 phases were detected in the glass sample heat treated at 780�C for
various times. And these peaks of LiNBO3 phase are seen to increase when the heat
treatment time is increased up to 36 h and the other phases Li2Nb4O7 and LiNb3O8
decreases as shown in Figure 4.The crystallite size for major phase was estimated using the Scherrer equation:
L ¼ k�=b cos �
where L is the mean dimension of the crystallite, k is a constant approximately equal to
unity, � is the wavelength used (1.5406 A), b is the full-width at half maximum in radians
Figure 1. The DTA curves of untreated and heat treated glass sample at 430�C, 480�C, and 630�C.
Figure 2. The XRD curves of glass base and heat treated glass sample at 480�C, 545�C, and 630�Cfor 5 h [x – LiNbO3, o – Li2B4O7, * – LiNb3O8].
4 I. Kashif et al.
Dow
nloa
ded
by [
Ism
ail K
ashi
f H
any]
at 1
0:12
13
Febr
uary
201
2

(obtained for high intense peak in the present studies) and � is the related Bragg angle.From Table 1 it can be seen that the crystallite size depend on the heat treatmenttemperature and time. This is related to the formation and change of LiNbO3 and Li2B4O7
crystallite. Also the crystallite size of Li2B4O7 is larger than the LiNbO3 crystallite size forall heat treated sample.
Figure 5 shows the non-isothermal DSC curves for the investigated sample at differentheating rate, �, up to 40�Cmin�1. It is clear that the exothermic peak becomes sharper andshifted to higher frequency as heating rate increases.
The theoretical basis for interpreting DSC results is provided by the formal theory oftransformation kinetics as developed by special case of Johnson–Mehl–Avrami equa-tion [8–10]:
x ¼ 1� exp f�ðKtÞng
where x is the volume fraction of crystallization phase at a given temperature in time t, n isAvrami exponent and K is deEned as the effective overall reaction rate, related to theactivation energy E through the Arrhenion temperature dependence as
K ¼ Ko expð�E=RTpÞ
where E is the effective activation energy describing the overall crystallization process, Ko
is the pre exponential constant, R is the gas constant, and Tp is the crystallization absolutetemperature. The fraction of crystallization at constant temperature for different heatingrates is assumed to be proportional to the amount of heat evolved during crystallization
which is proportional to the area under the exothermic peak, and the Avrami exponent, isrelated to directionality of crystal growth. The value of n, can be determined from theslope of plotting the relation between ln[�ln(1�x)] versus ln’ as shown in Figure 6according the relation [10]:
d ln½� lnð1� xÞ�=d ln ’ ¼ n,
where ’ is the heating rate.
Figure 3. The XRD patterns of the heat treated glass sample at 780�C for different time [D –LiNbO3, o – Li2B4O7, * – LiNb3O8].
Phase Transitions 5
Dow
nloa
ded
by [
Ism
ail K
ashi
f H
any]
at 1
0:12
13
Febr
uary
201
2

The deduced value of n is equal about 3.86, which revealed that the crystallization
process was occurred with three mechanisms and bulk crystallization growth [11].The activation energy of crystallization process of glass sample has been calculated by
method of Ozawa–Chen [12,13] according to equation:
lnðTp=�Þ ¼ ð1=n lnKoÞ þ E=RTp
The activation energy for crystallization determined from the slope of the straight line
which is plotted from the relation between ln(�/Tp) and 1000/Tp as shown in Figure 7.
From it can be observed that the value of the activation energy of crystallization of three
phases equal 133 kJmol�1.Figure 8 shows the optical transmission spectrum for untreated glass sample as
recorded in the 190–800 nm wavelength range at room temperature. From Figure 8, it can
be observed that the wavelength at which the percentage transmission equal zero
(�cut-off¼ 312 nm) and its agreement with the values obtained by other researchers [5,14].
It may be corresponded to an electron transfer, which can be schematized [15]
O2�ð2P6Þ þNb5þð4d0Þ ! O�ð2P5
Þ þNb4þð4d1t2gÞ
Table 1. Crystallite size of heat treated sample.
Crystallite size (nm)
LiNbO3 Li2B4O7
HT temp (�C)430 – 38480 – 29630 20 58
HT time (h)5 15 11515 47 5820 59 7728 47 4636 59 57
Figure 4. The relation between phase content and heat treatment time.
6 I. Kashif et al.
Dow
nloa
ded
by [
Ism
ail K
ashi
f H
any]
at 1
0:12
13
Febr
uary
201
2

Figure 5. The non-isothermal DSC curves for the investigated sample at different heating rate, ’.
Figure 7. The relation between ln(’/Tp) and 1000/Tp.
Figure 6. The relation between ln[�ln(1�x)] vs. ln ’.
Phase Transitions 7
Dow
nloa
ded
by [
Ism
ail K
ashi
f H
any]
at 1
0:12
13
Febr
uary
201
2

The absorption coefficient, �(�), near the edge of glass spectrum was calculated using
the equation [16]:
� ð�Þ ¼ ð1=d ÞlnðI0=ItÞ ð1Þ
where d is the thickness of the sample (cm), Io and It are the incident and transmitted
radiation beam. The optical band gap calculated according to:
�h� ¼ B2ðh�� EgÞr
ð2Þ
where Eg is the optical band gap, B is a constant called the band tailing parameter. h� is theincident photon energy. r is the index have different values {r¼ 2, 3, 1/2 and 2/3
corresponding to indirect allowed, indirect forbidden, direct allowed and direct forbidden,
respectively}. In glass sample, Equation (2) give a straight line where r¼ 1/2 the variation
of (�h�)2 with h� is shown in Figure 9.The value of Eg has been calculated by extrapolating the linear region of the curve to
meet the x-axis (h�) and equal to 3.71 eV. The energy tail calculated using the following
relation [17,18]:
lnð�Þ ¼ Cþ h�=DE
where C is a constant and DE is the Urbach energy.
Figure 8. The optical transmission spectrum for untreated glass sample.
Figure 9. The variation of (�h�)2 with h�.
8 I. Kashif et al.
Dow
nloa
ded
by [
Ism
ail K
ashi
f H
any]
at 1
0:12
13
Febr
uary
201
2

Urbach energy is calculated from the inverse slope of the ln(�) versus h� as shown inFigure 10 and equal 0.31 eV. Urbach energy, which corresponds
to the width of localized states, is used to characterize the degree of disorder inamorphous and crystalline systems. Materials with larger DE would have greater tendencyto convert weak bonds into defects. The values of DE of the xNb2O5–(30�x) [CaO or BaOor SrO]–70B2O3 glass system lie in the range 0.16–0.25 eV [18]. The theory of Urbach’s ruleattempts to explain the observed exponential tail in terms of internal electric fieldsgenerated within the solid as due to the formation of localized states. These internalelectric fields lead to an exponential broadening of the energy states. Accordingly, thedegree of localization of electrons decreases with the decrease in NBO, thereby decreasingthe number of donor centers.
Two absorption edges are observed in Figure 9. They are related to the absorption edgeof the glass matrix (B2O3) and other may be due to nanocomposite phase. Previous studiesexplain the absorption edge of strontium barium niobate to charge transfer within niobatecomplex [19,20].
From Figure 9 the curve with the energy above 4 eV is mainly due to the borate matrix,and below 4 eV, there are two linear and one nonlinear regions. They correspond to theslow dropping (weak absorption), shoulder, and fast dropping (strong absorption).The slow dropping comes from the contribution of defects and the fast dropping isassigned to indirect transition.
Figure 11 shows the relation between the electrical resistance and temperature. FromFigure 11, it can be observed that the R increase with the increasing the temperature up to398K and then decrease.
The thermal variation of resistivity showed insulator (semiconductor) to metaltransition (MIT) peak around T¼ 398K (Figure 12). Transition from insulating(paramagnetic) to metallic (ferromagnetic) phase occurs below their respective (Curietemperatures) which is little below Tp. This phase are semiconducting for T4Tp, andmetallic T5Tp.
According Hoppe et al. [21] have shown that when Nb2O5 content approaches10mol%, some oxygens are found in Nb –O–Nb bridges, which indicates that the Nb2O5
has a network forming properties. This leads to the formation of cross-linked NbO4
tetrahedra and as a consequence an increase of the number of bridging oxygen (BO) ions,which leads to decrease in the dc conductivity, and act as metallic.
The value of the conductivity in glasses maybe attributed to the Li2þ ions thatremove the network modifying Nb5þ ions from interstitial positions to network formingpositions [22].
Figure 10. The relation between ln(�) and h�.
Phase Transitions 9
Dow
nloa
ded
by [
Ism
ail K
ashi
f H
any]
at 1
0:12
13
Febr
uary
201
2

From Figure 12, it can be shown that the conductivity increases with increase in
temperature 4Tp. This behavior of thermally stimulated process should be attributed to
the increase in the charge carrier’s energy with the rise of temperature. From the variations
in dc conductivity, it can be assumed that some Nb5þ ions existing in NbO4 tetrahedra
take part as network formers, forming three dimensional structural units, while the rest of
Nb5þ ions exist in the form of NbO6 octahedra and Li2þ ions occupy interstitial positions
as network modifiers and increase the number of NBO ions [23,24].The conductivity data of the sample in the high temperature (above Tp) range can be
interpreted following Mott’s [25] small polaron hopping model viz.
� ¼ �oT expð2�RÞexpðEp=kBT Þ
where �o¼ kB/[�PhNe2R2C(1�C)], kB is the Boltzmann constant and T is the absolute
temperature, N is the number of ion sites per unit volume, R is the average intersite
spacing, obtained from the relation R¼ (1/N)1/3, � is the electron wave function decay
constant, �Ph is the optical phonon frequency. Ep is the activation energy for hopping
conduction and is given by the relation
Ep ¼WH þWD=2 ðfor T4 �D=2Þ
and Ep ¼WD ðfor T5 �D=4Þ, where WH is the polaron hopping energy and WD is the
disorder energy. The hopping energy WH is calculated from relation [25]
WH ¼ e2=4"pð1=rp � 1=RÞ,
Figure 12. The relation between the electrical resistivity and temperature.
Figure 11. The relation between the electrical resistance and temperature.
10 I. Kashif et al.
Dow
nloa
ded
by [
Ism
ail K
ashi
f H
any]
at 1
0:12
13
Febr
uary
201
2

where "p¼ (1/"s � 1/"1), "1, "s are the high frequency and static dielectric constants of thesamples. When the overlap integral between the sites Joexp(2R�) approaches J, thehopping is adiabatic, mainly controlled by the activation energy. The inverse temperaturedependence of ln(�/T) (only in the high temperature region) is shown in Figure 13.The linearity of ln(�/T) versus 1/T curve breaks around �D/2, where �D is known as theDebye temperature. The values of �D is 543K and MIT is 398K.
Low temperature (below �D/2) conductivity in semiconductors follow variable rangehopping (VRH) mechanism. Recently Crespi et al. [26] and Jaime et al. [27] and Viret et al.[28], however, applied VRH conduction mechanism in systems. At higher temperatures(above 400K) which has the form [25]
� ¼ �o expð�To=TÞ1=4
where To is a constant (¼16 �3/kBN(EF)) and N(EF) is the density of states at the Fermilevel which can be calculated from the slope of the plot of log � versus T�1/4 curves (shownin Figure 14). From Figure 14 it is seen that the high temperature conductivity data of thesample followed pervious equation.
4. Conclusions
The glass composition 90Li2B4O7–10Nb2O5 (mol%) gives origin to a homogeneous andblue glass. The LiNbO3 and Li2B4O7 nanocrystals were precipitated in the glass matrix by
Figure 14. The relation between log � and T�1/4.
Figure 13. The inverse temperature dependence of ln(�/T) (only in the high temperature region).
Phase Transitions 11
Dow
nloa
ded
by [
Ism
ail K
ashi
f H
any]
at 1
0:12
13
Febr
uary
201
2

a controlled heat treatment process. The rise of the heat treatment temperature and time
induces an increase in the volume ratio of LiNbO3 to the glass matrix, which makes thesample opaque. The crystallite size in the nanometer scale has been observed with increasein the heat treatment temperature and time. The number of lithium and niobium ions
inserted structurally in the glass network is the main parameter of these glass–ceramicsconduction process. The results suggest that the electrical properties can be ascribed to two
contributions, the free network modifiers in the glass matrix and the particles character-istics. Transition from insulating (paramagnetic) to metallic (ferromagnetic) phase occursat Tp¼ 398K. This phase is semiconducting for T4Tp, and metallic for T5Tp.
References
[1] M.M. Aboulleil and F.J. Leonberger, Waveguides in lithium niobate, J. Am. Ceram. Soc. 72
(1989), pp. 1311–1320.[2] E.M. Vogel, Glasses as non-linear photonic materials, J. Am. Ceram. Soc. 72 (1989), pp. 719–724.
[3] M.P.F. Graca, M.G. Ferreira da Silva, and M.A. Valente, Structural and electrical properties of
SiO2–Li2O–Nb2O5 glass and glass-ceramics obtained by thermoelectric treatments, J. Mater. Sci.
42(8) (2007), pp. 2543–2550.
[4] N. Syam Prasad and K.B.R. Varma, Evolution of ferroelectric LiNbO3 phase in a reactive glass
matrix (LiBO2–Nb2O5), J. Non-Cryst. Solids 351(16–17) (2005), pp. 1455–1465.[5] E.K. Abdel-Khalek and A.A. Bahgat, Optical and dielectric properties of transparent glasses and
nanocrystals of lithium niobate and lithium diborate in borate glasses, Phys. B: Condens. Matter
405(8) (2010), pp. 1986–1992.[6] M.P.F. Graca, M.G. Ferreira da Silva, A.S.B. Sombra, and M.A. Valente, Electrical and
dielectrical properties of SiO2–Li2O–Nb2O5 glass and glass-ceramics obtained by thermoelectric
treatments, J. Non-Cryst. Solids 352(42–49) (2006), pp. 5199–5204.[7] M.P.F. Graca, M.A. Valente, and M.G. Ferreira da Silva, Electrical properties of lithium
niobium silicate glasses, J. Non-Cryst. Solids 325(1–3) (2003), pp. 267–274.[8] N. Syam Prasad and K.B.R. Varma, Crystallization kinetics of the LiBO2–Nb2O5 glass using
differential thermal analysis, J. Am. Ceram. Soc. 88(2) (2005), pp. 357–361.[9] M. Avrami, Kinetics of phase change II. Transformation-time relations for random distribution of
nuclei, J. Chem. Phys. 8 (1940), pp. 212–224.[10] J. Massera, J. Remond, J. Musgraves, M.J. Davis, S. Misture, L. Petit, and K. Richardson,
Nucleation and growth behavior of glasses in the TeO2�Bi2O3�ZnO glass system, J. Non-Cryst.
Solids 356 (2010), pp. 2947–2955.[11] A.A. Solimana, I. Kashif, E.M. Sakr, and A. Ratep, Elucidation of the crystallization kinetics for
sodium-alumino-silicate glasses containing different amounts of manganese oxide, Phase. Trans.
83(12) (2010), pp. 1096–1113.[12] T. Ozawa, A new method of analyzing thermogravimetric data, Bull. Chem. Soc. Jpn. 38(11)
(1956), pp. 1881–1886.[13] H.S. Chen, A method for evaluating viscosities of metallic glasses from the rates of thermal
transformations, J. Non-Cryst. Solids 27(2) (1978), pp. 257–263.[14] H.G. Kim, T. Komatsu, R. Sato, and K. Matusita, Incorporation of LiNbO3 crystals into
tellurite glasses, J. Mater. Sci. 31(8) (1996), pp. 2159–2164.
[15] Z. Teixeira, O.L. Alves, and I.O. Mazali, Structure, thermal behavior, chemical durability, and
optical properties of the Na2O–Al2O3–TiO2–Nb2O5–P2O5 glass system, J. Am. Cer. Soc. 1(90)
(2007), pp. 256–263.
[16] E.A. Davis and N.F. Mott, Conduction in non-crystalline systems V. Conductivity, optical
absorption and photoconductivity in amorphous semiconductors, Philos. Mag. 22 (1970),
pp. 903–922.
12 I. Kashif et al.
Dow
nloa
ded
by [
Ism
ail K
ashi
f H
any]
at 1
0:12
13
Febr
uary
201
2

[17] F. Urbach, The long-wavelength edge of photographic sensitivity and of the electronic absorptionof solids, Phys. Rev. 92(5) (1953), p. 1324.
[18] S. Sanghi, S. Rani, A. Agarwal, and V. Bhatnagar, Influence of Nb2O5 on the structure, opticaland electrical properties of alkaline borate glasses, Mater. Chem. Phys. 120(2–3) (2010),
pp. 381–386.[19] A. Kh. Zeinally, N.N. Lebedeva, A.R. Mordukhayev, and Mohamed A. Osman,
Photoluminescence of barium-strontium niobates and strontium pyroniobate, Ferroelectrics 45(1)
(1982), pp. 83–88.[20] S.G. Lu, C.L. Mak, and K.H. Wong, Optical studies of transparent ferroelectric strontium–
barium niobatesilica Nanocomposite, J. Appl. Phys. 94(5) (2003), p. 3422.
[21] U Hoppe, E Yousef, C Russel, J Neuefeind, and A.C. Hannon, Structure of zinc and niobiumtellurite glasses by neutron and X-ray diffraction, J. Phys.: Condens. Matter 16(9) (2004), p. 1645.
[22] J. Lin, W. Huang, Z. Sun, C.S. Ray, and D.E. Day, Structure and non-linear optical performance
of TeO2–Nb2O5–ZnO glasses, J. Non-Cryst. Solids 336(3) (2004), pp. 189–194.[23] S. Inoue, A. Nukui, K. Yamamoto, T. Yano, S. Shibata, M. Yamane, and T. Maeseto,
Refractive-index pattering of tellurite glass surfaces by laser spot heating, Appl. Optics 37(1)(1998), pp. 48–53.
[24] M.P.F. Graca, M.G. Ferreira da Silva, and M.A. Valente, Influence of thermal andthermoelectric treatments on structure and electric properties of B2O3–Li2O–Nb2O5 glasses,J. Non-Cryst. Solids 354(10–11) (2008), pp. 901–908.
[25] N.F. Mott and E.A. Davis, Electronic Processes in Noncrystalline Materials, Clarendon Press,Oxford, 1971.
[26] V.H. Crespi, L. Lu, Y.X. Jia, K. Khazeni, A. Zettl, and M.L. Cohen, Thermopower of single-
crystal Nd1�x(Sr, Pb)xMnO3-, Phys. Rev. B 53(21) (1996), pp. 14303–14308.[27] M. Jaime, M.B. Salamon, K. Pettit, M. Rubinstein, R.E. Treece, J.S. Horwitz, and D.B.
Chrisey, Magnetothermopower in La0.67Ca0.33MnO3 thin films, Appl. Phys. Lett. 68(11) (1996),p. 1576.
[28] M. Viret, L. Ranno, and J.M.D. Coey, Magnetic localization in mixed-valence manganites,Phys. Rev. B 55(13) (1997), pp. 8067–8070.
Phase Transitions 13
Dow
nloa
ded
by [
Ism
ail K
ashi
f H
any]
at 1
0:12
13
Febr
uary
201
2
Copyright © 2022 FDOKUMEN


![[PSS 2A-1Z9 F] RTT20 and RTT25 - Eck-Boro GmbH](https://static.fdokumen.com/doc/165x107/63398034480d127c4101ec93/pss-2a-1z9-f-rtt20-and-rtt25-eck-boro-gmbh.jpg)