INFLUENCE OF ELECTRICITY CONSUMPTION ON ECONOMIC GROWTH IN GHANA AN ECONOMETRIC APPROACH
20
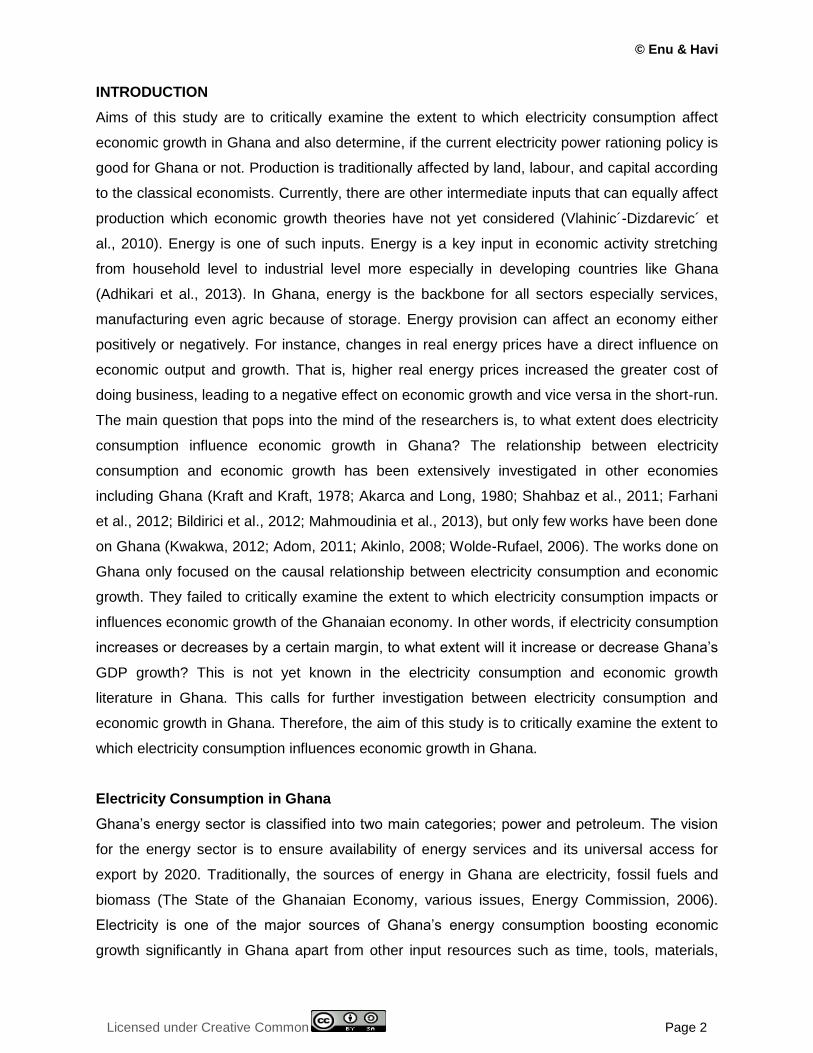
International Journal of Economics, Commerce and Management United Kingdom Vol. II, Issue 9, Sep 2014 Licensed under Creative Common Page 1 http://ijecm.co.uk/ ISSN 2348 0386 INFLUENCE OF ELECTRICITY CONSUMPTION ON ECONOMIC GROWTH IN GHANA AN ECONOMETRIC APPROACH Enu, Patrick Methodist University College, Ghana [email protected]; [email protected] Havi, Emmanuel Dodzi K Methodist University College, Ghana [email protected] Abstract Aims of the study were to critically examine the extent to which electricity consumption influences economic growth in Ghana and also determine, if it is electricity consumption that causes economic growth in Ghana or otherwise. The study employed Augmented Dickey-Fuller test, Cointegration test, Vector Error Correction Model and Granger Causality test. The study revealed that, in the long term, a hundred percent increase in electricity power consumption will cause real gross domestic product per capita to increase by approximately fifty-two percent. However, in the short run, electricity consumption negatively affects real gross domestic product per capita. The study again revealed that unidirectional causality run from electricity consumption to economic growth meaning that any policy actions taken to affect the smooth consumption of electricity in Ghana will definitely affect her gross domestic product per capita. Therefore, the current load shedding policy due to low supply of electricity will definitely affect the Ghanaian economy negatively, that is lower production levels, high inflation, and high rates of unemployment and lower standard of living. Therefore, the government of Ghana should invest massively into electricity infrastructure and conservation measures to meet the needs of the various sectors of the Ghanaian economy. Keywords: Electricity Consumption, the Extent, Economic Growth, Ghana
Transcript of INFLUENCE OF ELECTRICITY CONSUMPTION ON ECONOMIC GROWTH IN GHANA AN ECONOMETRIC APPROACH
International Journal of Economics, Commerce and Management United Kingdom Vol. II, Issue 9, Sep 2014
Licensed under Creative Common Page 1
http://ijecm.co.uk/ ISSN 2348 0386
INFLUENCE OF ELECTRICITY CONSUMPTION
ON ECONOMIC GROWTH IN GHANA
AN ECONOMETRIC APPROACH
Enu, Patrick
Methodist University College, Ghana
[email protected]; [email protected]
Havi, Emmanuel Dodzi K
Methodist University College, Ghana
Abstract
Aims of the study were to critically examine the extent to which electricity consumption
influences economic growth in Ghana and also determine, if it is electricity consumption that
causes economic growth in Ghana or otherwise. The study employed Augmented Dickey-Fuller
test, Cointegration test, Vector Error Correction Model and Granger Causality test. The study
revealed that, in the long term, a hundred percent increase in electricity power consumption will
cause real gross domestic product per capita to increase by approximately fifty-two percent.
However, in the short run, electricity consumption negatively affects real gross domestic product
per capita. The study again revealed that unidirectional causality run from electricity
consumption to economic growth meaning that any policy actions taken to affect the smooth
consumption of electricity in Ghana will definitely affect her gross domestic product per capita.
Therefore, the current load shedding policy due to low supply of electricity will definitely affect
the Ghanaian economy negatively, that is lower production levels, high inflation, and high rates
of unemployment and lower standard of living. Therefore, the government of Ghana should
invest massively into electricity infrastructure and conservation measures to meet the needs of
the various sectors of the Ghanaian economy.
Keywords: Electricity Consumption, the Extent, Economic Growth, Ghana
© Enu & Havi
Licensed under Creative Common Page 2
INTRODUCTION
Aims of this study are to critically examine the extent to which electricity consumption affect
economic growth in Ghana and also determine, if the current electricity power rationing policy is
good for Ghana or not. Production is traditionally affected by land, labour, and capital according
to the classical economists. Currently, there are other intermediate inputs that can equally affect
production which economic growth theories have not yet considered (Vlahinic´-Dizdarevic´ et
al., 2010). Energy is one of such inputs. Energy is a key input in economic activity stretching
from household level to industrial level more especially in developing countries like Ghana
(Adhikari et al., 2013). In Ghana, energy is the backbone for all sectors especially services,
manufacturing even agric because of storage. Energy provision can affect an economy either
positively or negatively. For instance, changes in real energy prices have a direct influence on
economic output and growth. That is, higher real energy prices increased the greater cost of
doing business, leading to a negative effect on economic growth and vice versa in the short-run.
The main question that pops into the mind of the researchers is, to what extent does electricity
consumption influence economic growth in Ghana? The relationship between electricity
consumption and economic growth has been extensively investigated in other economies
including Ghana (Kraft and Kraft, 1978; Akarca and Long, 1980; Shahbaz et al., 2011; Farhani
et al., 2012; Bildirici et al., 2012; Mahmoudinia et al., 2013), but only few works have been done
on Ghana (Kwakwa, 2012; Adom, 2011; Akinlo, 2008; Wolde-Rufael, 2006). The works done on
Ghana only focused on the causal relationship between electricity consumption and economic
growth. They failed to critically examine the extent to which electricity consumption impacts or
influences economic growth of the Ghanaian economy. In other words, if electricity consumption
increases or decreases by a certain margin, to what extent will it increase or decrease Ghana’s
GDP growth? This is not yet known in the electricity consumption and economic growth
literature in Ghana. This calls for further investigation between electricity consumption and
economic growth in Ghana. Therefore, the aim of this study is to critically examine the extent to
which electricity consumption influences economic growth in Ghana.
Electricity Consumption in Ghana
Ghana’s energy sector is classified into two main categories; power and petroleum. The vision
for the energy sector is to ensure availability of energy services and its universal access for
export by 2020. Traditionally, the sources of energy in Ghana are electricity, fossil fuels and
biomass (The State of the Ghanaian Economy, various issues, Energy Commission, 2006).
Electricity is one of the major sources of Ghana’s energy consumption boosting economic
growth significantly in Ghana apart from other input resources such as time, tools, materials,
International Journal of Economics, Commerce and Management, United Kingdom
Licensed under Creative Common Page 3
money, human resource and information. The reason is that in this modern times of Ghana no
electricity supply, means no production (Ghana Statistical Service, 2010).
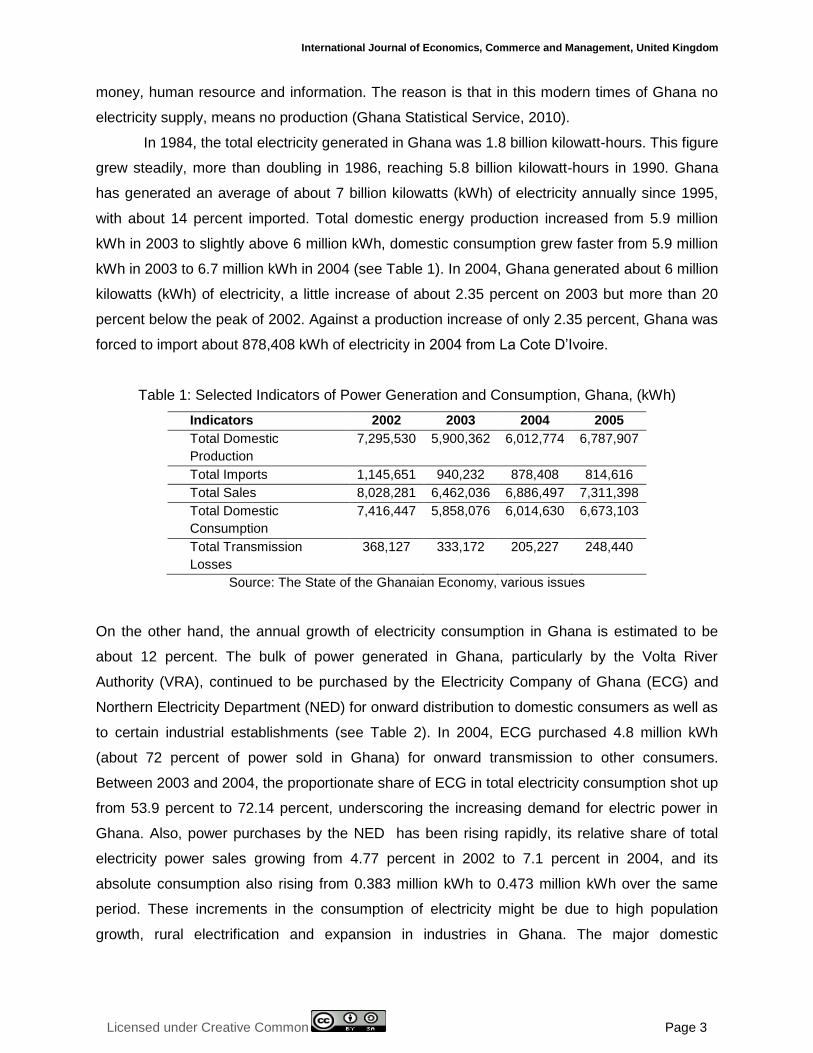
In 1984, the total electricity generated in Ghana was 1.8 billion kilowatt-hours. This figure
grew steadily, more than doubling in 1986, reaching 5.8 billion kilowatt-hours in 1990. Ghana
has generated an average of about 7 billion kilowatts (kWh) of electricity annually since 1995,
with about 14 percent imported. Total domestic energy production increased from 5.9 million
kWh in 2003 to slightly above 6 million kWh, domestic consumption grew faster from 5.9 million
kWh in 2003 to 6.7 million kWh in 2004 (see Table 1). In 2004, Ghana generated about 6 million
kilowatts (kWh) of electricity, a little increase of about 2.35 percent on 2003 but more than 20
percent below the peak of 2002. Against a production increase of only 2.35 percent, Ghana was
forced to import about 878,408 kWh of electricity in 2004 from La Cote D’Ivoire.
Table 1: Selected Indicators of Power Generation and Consumption, Ghana, (kWh)
Indicators 2002 2003 2004 2005
Total Domestic
Production
7,295,530 5,900,362 6,012,774 6,787,907
Total Imports 1,145,651 940,232 878,408 814,616
Total Sales 8,028,281 6,462,036 6,886,497 7,311,398
Total Domestic
Consumption
7,416,447 5,858,076 6,014,630 6,673,103
Total Transmission
Losses
368,127 333,172 205,227 248,440
Source: The State of the Ghanaian Economy, various issues
On the other hand, the annual growth of electricity consumption in Ghana is estimated to be
about 12 percent. The bulk of power generated in Ghana, particularly by the Volta River
Authority (VRA), continued to be purchased by the Electricity Company of Ghana (ECG) and
Northern Electricity Department (NED) for onward distribution to domestic consumers as well as
to certain industrial establishments (see Table 2). In 2004, ECG purchased 4.8 million kWh
(about 72 percent of power sold in Ghana) for onward transmission to other consumers.
Between 2003 and 2004, the proportionate share of ECG in total electricity consumption shot up
from 53.9 percent to 72.14 percent, underscoring the increasing demand for electric power in
Ghana. Also, power purchases by the NED has been rising rapidly, its relative share of total
electricity power sales growing from 4.77 percent in 2002 to 7.1 percent in 2004, and its
absolute consumption also rising from 0.383 million kWh to 0.473 million kWh over the same
period. These increments in the consumption of electricity might be due to high population
growth, rural electrification and expansion in industries in Ghana. The major domestic
© Enu & Havi
Licensed under Creative Common Page 4
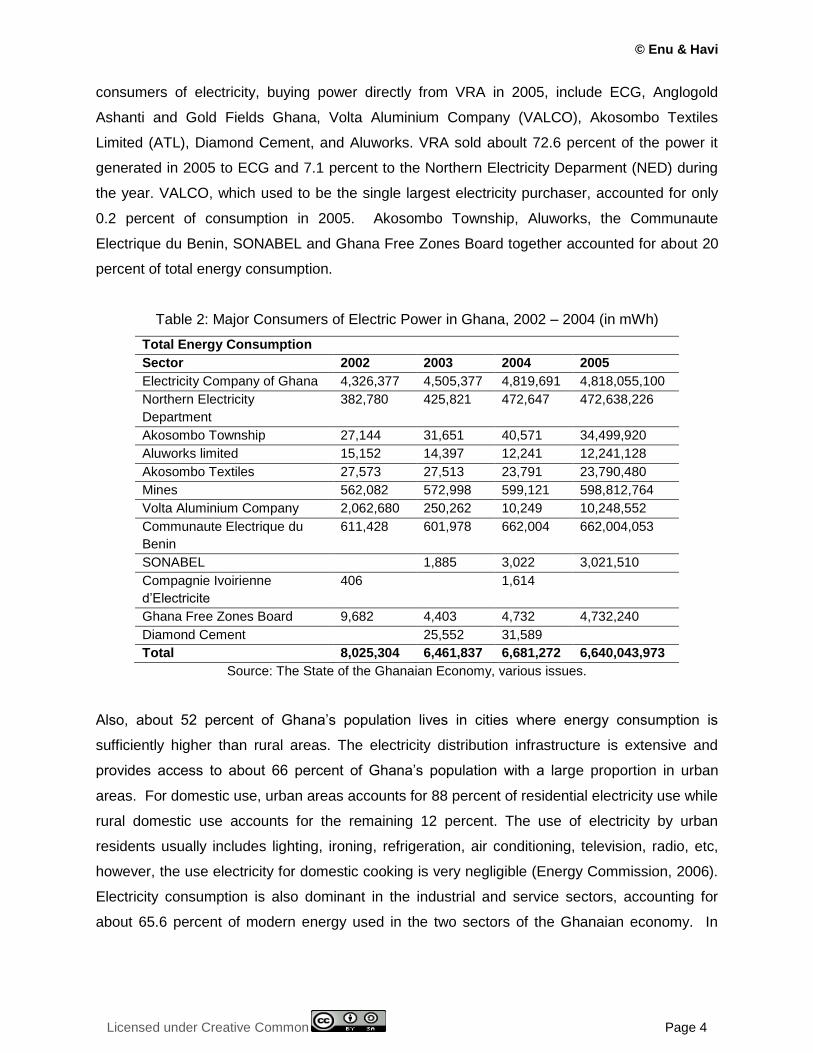
consumers of electricity, buying power directly from VRA in 2005, include ECG, Anglogold
Ashanti and Gold Fields Ghana, Volta Aluminium Company (VALCO), Akosombo Textiles
Limited (ATL), Diamond Cement, and Aluworks. VRA sold aboult 72.6 percent of the power it
generated in 2005 to ECG and 7.1 percent to the Northern Electricity Deparment (NED) during
the year. VALCO, which used to be the single largest electricity purchaser, accounted for only
0.2 percent of consumption in 2005. Akosombo Township, Aluworks, the Communaute
Electrique du Benin, SONABEL and Ghana Free Zones Board together accounted for about 20
percent of total energy consumption.
Table 2: Major Consumers of Electric Power in Ghana, 2002 – 2004 (in mWh)
Total Energy Consumption
Sector 2002 2003 2004 2005
Electricity Company of Ghana 4,326,377 4,505,377 4,819,691 4,818,055,100
Northern Electricity
Department
382,780 425,821 472,647 472,638,226
Akosombo Township 27,144 31,651 40,571 34,499,920
Aluworks limited 15,152 14,397 12,241 12,241,128
Akosombo Textiles 27,573 27,513 23,791 23,790,480
Mines 562,082 572,998 599,121 598,812,764
Volta Aluminium Company 2,062,680 250,262 10,249 10,248,552
Communaute Electrique du
Benin
611,428 601,978 662,004 662,004,053
SONABEL 1,885 3,022 3,021,510
Compagnie Ivoirienne
d’Electricite
406 1,614
Ghana Free Zones Board 9,682 4,403 4,732 4,732,240
Diamond Cement 25,552 31,589
Total 8,025,304 6,461,837 6,681,272 6,640,043,973
Source: The State of the Ghanaian Economy, various issues.
Also, about 52 percent of Ghana’s population lives in cities where energy consumption is
sufficiently higher than rural areas. The electricity distribution infrastructure is extensive and
provides access to about 66 percent of Ghana’s population with a large proportion in urban
areas. For domestic use, urban areas accounts for 88 percent of residential electricity use while
rural domestic use accounts for the remaining 12 percent. The use of electricity by urban
residents usually includes lighting, ironing, refrigeration, air conditioning, television, radio, etc,
however, the use electricity for domestic cooking is very negligible (Energy Commission, 2006).
Electricity consumption is also dominant in the industrial and service sectors, accounting for
about 65.6 percent of modern energy used in the two sectors of the Ghanaian economy. In
International Journal of Economics, Commerce and Management, United Kingdom
Licensed under Creative Common Page 5
2010, the industrial, residential and commercial (non-residential) sectors accounted for 46
percent, 40 percent and 14 percent, respectively, of the total electricity end-use in Ghana.
The annual growth of national demand for power is estimated at 10 – 14 percent and the
inability to fulfill this demand has been a major constrained on industrial, domestic productivity
and growth. The energy sector of Ghana is hardly hit by supply side of the sector undermining
accessibility, affordability and reliability of energy supply. About 70 percent of Ghana’s electricity
is generated from two hydro-electric dams, low level of water inflows into the hydro-electric
dams have resulted in severe electricity crises. In 1998, 2002, 2006, and 2012, Ghana
experienced drought-related electricity crises. This resulted in an extensive load shedding
programme to cut down and manage the demand load of the country since energy production
was less than energy demand which is still the case in Ghana. This has led to shut down of
some companies and industries in Ghana which in the long run has affected the country’s GDP
growth. Hence, Ghana has adopted rationing to resolve her electricity consumption crises. Is
this electricity conservation policy measure healthy for Ghana’s economic expansion? In other
words, is Ghana less electricity consumption dependent or more electricity consumption
dependent country?
LITERATURE REVIEW
Energy consumption plays a very significant role in economic growth and socio-economic
development in both developed and developing economies (World Bank Report, 2007; Isma’il et
al., 2012; Mallick, 2009; Vlahinic´-Dizdarevic´ et al., 2010; Baek et al., 2011; Atif et al. 2010;
Masuduzzaman, 2013). Its role is well recognized in the energy economic growth nexus
literature. From literature it is observed that unidirectional causality run from economic growth
to energy consumption; this implies that a country is not entirely dependent on electricity for its
economic growth, and that energy conservation policies will have little or no adverse effects on
the economic growth of that country. On the other hand, if unidirectional causality runs from
energy consumption to economic growth, it means that economic growth is dependent on
electricity consumption, and a decrease in electricity consumption will likely restrain economic
growth (that is unemployment, budget deficit, low income, etc) and that the country should
employ additional resources in subsidizing energy prices and securing long term and stable
energy sources for its economy. There is also bidirectional causality between energy
consumption and economic growth, which implies that energy and economic growth
complement each other. That is increases in economic growth raised electricity consumption
and increasing electricity consumption increases economic growth. These hypotheses have
been tested in many energy consumption and economic growth literature. The direction of
© Enu & Havi
Licensed under Creative Common Page 6
causality between energy consumption and economic growth varies from country to country, the
reasons might be due to different economic structure of particular countries being studied;
different economies have different consumption pattern and various sources of energy and also
the kind of methodology used for the study. Some of such findings are illustrated below.
Akomolafe et al. (2014) examined the relationship between electricity consumption and
economic growth for the period 1990 to 2011. The study employed Augmented Dickey Fuller
test and Philip Perrron unit roots test; Johansen test for cointegration, vector error correction
and Granger Causality test. The results of the study showed unidirectional causality from
electricity consumption to real gross domestic product.
Bayer (2014) examined the relationship between economic growth and electricity power
consumption in emerging countries during the period 1970 to 2011. The study made use of
Pedroni, Kao and Johansen co-integration tests and Granger causality tests. The findings
demonstrated that electricity consumption has a positive impact on the economic growth in the
whole panel and electricity has the largest impact on economic growth in Hungary, while it had
the smallest impact in Indonesia. The Granger causality test demonstrated that there was
bidirectional causality between economic growth and electricity consumption. The study
suggested that emerging countries should diversify energy supply and increase the share of
renewable energy sources in energy consumption by considering their highly dependence on
electricity.
Pathan et al. (2014) examined the causality between energy consumption and economic
growth in Pakistan over the period of 1991 to 2006. The study employed Granger causality and
unit root test. The study found that electric power consumption Granger-causes GDP growth.
Shaari et al. (2013) investigated the relationship among population, energy consumption and
economic growth in Malaysia for the period 1991 to 2011 using unit root test, cointegration test
and Granger causality test. The results showed that population has an effect on energy
consumption and energy consumption contributes to economic growth in Malaysia.
Hossain (2013) examined the dynamic causal relationships between energy
consumption and economic growth using time series data from 1972 to 2010 of Bangladesh.
The study made use of unit root test, cointegration test and Vector Error Correction Model
(VEC). The study found a unidirectional causality from economic growth to energy consumption.
Adhikari et al. (2013) investigated the long-run relationship between energy consumption
and economic growth for 80 developing countries during the period 1990 to 2009. The 80
countries were divided into upper middle income countries, lower middle income countries, and
low income countries. They employed panel unit root tests, panel co-integration test and
dynamic ordinary least squares estimator. The empirical result revealed strong relation running
International Journal of Economics, Commerce and Management, United Kingdom
Licensed under Creative Common Page 7
from energy consumption to economic growth for upper middle income countries and lower
middle income countries, and a strong relation running from economic growth to energy
consumption for low income countries.
Akinwale et al. (2013) examined the causal relationship between electricity consumption
and economic growth in Nigeria for the period 1970 to 2005. The paper adopted the methods of
Augmented Dicky Fuller test, Vector Auto Regressive (VAR) and Error Correction Model (ECM)
to test the causality between real GDP and electricity consumption. The result showed that
there is a unidirectional causality from real GDP to electricity consumption without a feedback
effect.
Mehrara et al. (2012) examined the causal relationship between electricity consumption
and GDP in a panel of 11 selected oil exporting countries by using panel unit root tests and
panel cointegration analysis. The results showed a strong unidirectional causality from oil
revenues and economic growth to electricity consumption in the oil exporting countries with no
feedback effect from electricity to GDP for oil dependent countries. Oil revenues had significant
effects on GDP in the short-run. This implied that oil and GDP drove the electricity and not vice
versa.
Shaari et al. (2012) examined the relationship between energy consumptions and
economic growth. The study used the method of unit root tests, Johansen cointegration test and
Granger causality model. The result indicated that oil and coal consumptions do not Granger
cause economic growth and vice versa. The study found causality runs from economic growth
to electricity consumption. A unidirectional relationship existed between gas and economic
growth, with causality running from electricity use to economic growth in Malaysia.
Ahmad et al. (2012) investigated the relationship between energy consumption and
economic growth of Pakistan. A time series data was used for the period 1973 – 2006. The
study employed unit root test (Augmented dickey Fuller test), Granger Causality test and
Ordinary Least Squares test. The results of Granger causality test showed unidirectional
causality running from GDP to energy consumption. Also, the results of ordinary least squares
test showed positive relation between GDP and energy consumption in Pakistan.
Kakar et al. (2011) explored the nature of the relationship between economic growth and
total energy consumption for Pakistan for the period 1980 to 2009. The study employed unit root
test, Johansen cointegration test, vector error correction model, and Granger causality test. The
study indicated that unidirectional causality exists between economic growth and total energy
consumption, and that the direction of causality runs from energy consumption to economic
growth and any energy shock may affect the long run economic development of Pakistan.
© Enu & Havi
Licensed under Creative Common Page 8
Orhewere et al. (2011) investigated the causality between GDP and each of the basic
subcomponents of energy consumption in Nigeria. The study aimed at finding out whether
different sources of energy have varying impact on economic growth of Nigeria. The study
found non-stationary and cointegrated series for both economic growth and energy variables in
Nigeria; for the 1970 – 2005 periods. Using a vector error correction based Granger causality
test, the study found a unidirectional causality from electricity consumption to GDP both in the
short-run and long-run. The study also found that unidirectional causality run from gas
consumption to GDP in the short-run and bidirectional causality between the variable in the
long-run. No causality was found in either direction between oil consumption and GDP. The
study indicated that a policy to reduce energy consumption aimed at reducing emission will
have negative impact on the GDP in Nigeria.
Apergis et al. (2010) examined the relationship between nuclear energy consumption
and economic growth for sixteen countries within a multivariate panel framework over the period
1980 to 2005. The study employed panel cointegration test and panel vector error correction
model. The study revealed a long-run equilibrium relationship between real GDP, nuclear
energy consumption, real gross fixed capital formation, and the labour force with the respective
coefficients positive and statistically significant. The results of the panel vector error correction
model found bidirectional causality between nuclear energy consumption and economic growth
in the short-run while unidirectional causality run from nuclear energy consumption to economic
growth in the long run.
Odhiambo (2010) examined the dynamic causal relationship between electricity
consumption and economic growth in Kenya during the period 1972 to 2006. The study used
cointegration and error – correction models to determine the causal link between electricity
consumption and economic growth in Kenya. The found a distinct unidirectional causal flow
from electricity consumption to economic growth in Kenya. In addition, the study found that both
economic growth and electricity consumption Granger cause labour force participation in Kenya.
The study concluded that electricity consumption is a panacea for economic growth in Kenya
and any enery conservation policies should be treated with extreme caution.
Acaravci (2010) investigated the causal relationship between energy consumption and
economic growth with structural breaks for period of 1986 to 2005 by using cointegration and
vector error-correction models for Turkish economy. The results indicated that electricity
consumption per capita weakly and strongly causes real per capita in both short-run and long-
run. The study also found no causal evidence from real GDP per capita to electricity
consumption per capita. The study concluded that electricity consumption plays a key role in
International Journal of Economics, Commerce and Management, United Kingdom
Licensed under Creative Common Page 9
Turkey’s economic growth and therefore, policies to manage the supply of electricity are
required to ensure that the electricity is sufficient to support Turkey’s economic growth.
Noor et al. (2010) investigated the causal relationship between energy consumption and
economic growth for five South Asian countries over period 1971 – 2006. The study applied
panel unit root test, cointegration test, fully modified ordinary least squares estimates and
Granger causality test. The results indicated that a unidirectional causality is found from GDP
per capita to energy consumption in the short-run.
Olusegun Odularu et al. (2009) investigated the relationship between energy
consumption and economic growth in Nigeria from the period 1970 to 2005. The energy sources
used to test for this relationship were crude oil, electricity and coal. The study employed the
method of cointegration. The results derived infer that there exists a positive relationship
between current period energy consumption and economic growth and coal also had the same
positive relationship. A negative relationship was noted for lagged values of energy
consumption and economic growth. The implication of the study is that increased energy
consumption is a strong determinant of economic growth in Nigeria.
Hye et al. (2008) determined the direction of causality between energy consumption and
economic growth, using annual data from 1971 to 2007. The study employed the bounds testing
approach to cointegration and an augmented form of the Granger causality test to identify the
direction of the relationship between variables both in the short run and long run. The study
found bidirectional causality between economic growth and energy consumption in the short-run
while in the long-run unidirectional causality run from economic growth to energy consumption.
Aktas et al. (2008) examined the short-run and long-run causal relationship between oil
consumption and economic growth in Turkey. The study employed Granger causality test. The
study found that there exist bidirectional Granger causality between oil consumption and
economic growth in the short run and long run.
Akinlo (2008) observed bidirectional relationship between energy consumption and
economic growth for Gambia, Ghana and Senegal and causality run from economic growth to
energy consumption in Sudan and Zimbabwe and no causality in Cameroon and Cote D’Ivoire.
Also Wolde-Rufael (2006) examined the causal relationship between electricity
consumption and growth for 17 African countries. The study found unidirectional causality
running from electricity consumption to economic growth in Cameroon, Ghana, Nigeria, and
Senegal, Zambia and Zimbabwe and no causality for the rest.
Kwakwa (2012) examined the causality between the disaggregated energy consumption
and economic growth in Ghana for the period 1971 to 2007. The study employed unit root test,
cointegration test and Granger causality test. The empirical results found that electricity
© Enu & Havi
Licensed under Creative Common Page 10
consumption and fossil consumption do not Granger causes overall economic growth while
aggregate growth Granger cause electricity consumption and fossil consumption. When growth
was disaggregated, the study found unidirectional causality from agriculture to electricity
consumption both in the short run and long run. Also, bidirectional causality was found between
manufacturing and electricity consumption but a unidirectional causality from manufacturing to
fossil consumption in the short run and long run. The study recommended that efforts should be
geared towards ensuring a high supply of energy to the manufacturing sector in order to sustain
its contribution to the economy. The study did not determine the extent of electricity
consumption on economic growth.
Adom (2011) determined the causality between electricity consumption and economic
growth from the period 1971 to 2008. The study employed unit root test, ARDL Bounds
Cointegration Analysis and Toda and Yomamoto Granger Causality Test. The study revealed
that data on Ghana supports the Growth-led-electricity hypothesis. The results implied that
electricity conservation measures are a viable option for Ghana. The study failed to determine
the extent to which energy consumption influence economic growth in Ghana.
Based on the empirical evidences above, there are mixed findings from one study to
another for individual countries and regions. For Ghana, the extent to which electricity
consumption influences economic growth is not clearly established. As a result, this study aims
at: (1) determine the extent to which electricity consumption influences economic growth in
Ghana; and (2) determine if the current load shedding policy measure is good for the growth
process of Ghana.
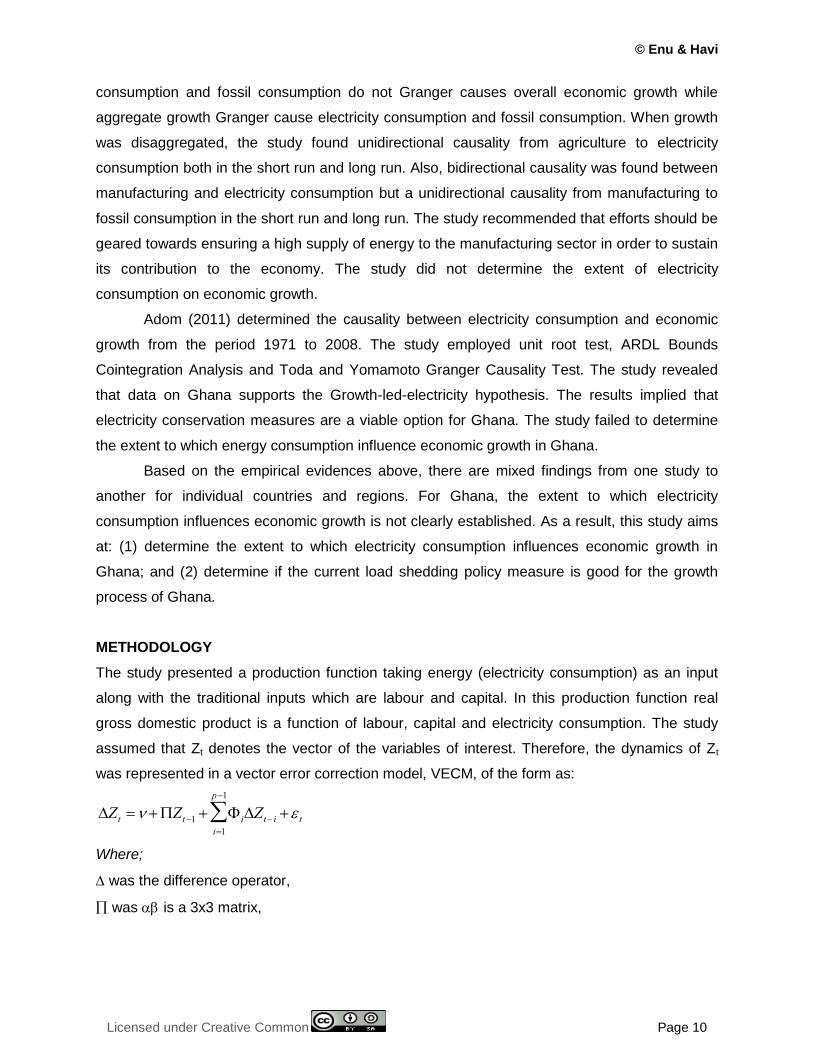
METHODOLOGY
The study presented a production function taking energy (electricity consumption) as an input
along with the traditional inputs which are labour and capital. In this production function real
gross domestic product is a function of labour, capital and electricity consumption. The study
assumed that Zt denotes the vector of the variables of interest. Therefore, the dynamics of Zt
was represented in a vector error correction model, VECM, of the form as:
Zt Zt1 iZtii1
p1
t
Where;
was the difference operator,
was is a 3x3 matrix,
International Journal of Economics, Commerce and Management, United Kingdom
Licensed under Creative Common Page 11
was the speed of the adjustment parameter and indicated how much of the disequilibrium was
being corrected and it ranged between -1 and 0.
was a matrix of cointegration vectors among the variables under consideration,
i were the short-run coefficients,
t was a 3x1 vector of structural disturbances assumed to be a white noise process
p was the optimal lag length,
and Zt was a vector of the variables defined as follows:
RGDP was real gross domestic product measured as real growth domestic product per capita.
K was Capital measured as gross fixed capital formation.
L was labour is measured as total level of employment.
EPCPC was electricity consumption measured as electricity consumption per capita.
Economic theory requires that the partial derivatives of the explanatory variables of real gross
domestic product satisfy certain conditions; labour, capital and energy, a priori, were expected
to be positive. The stationarity of the variables were checked using Augmented-Dickey-Fuller
tests. After establishing that the variables were integrated of the same order and then, the
Johansen Cointegration test was carried out to find out if there exist a long run relationship
among the variables or not. The idea of the cointegration test was to determine whether these
non-stationary variables were cointegrated or not. This study applied the Johansen
Cointegration Maximum Likelihood Method of Cointegration developed by Johansen (1988) to
determine the number of cointegrating vectors. The maximum Eigen value test was applied. If
this test had shown that the variables were not cointegrated, then, the vector autoregressive,
VAR, model would have been estimated; otherwise, the vector error correction model (VECM)
will be estimated. The data for the variables of interest were sourced from the World
Development Indicators, 2013.
RESULTS AND DISCUSSION
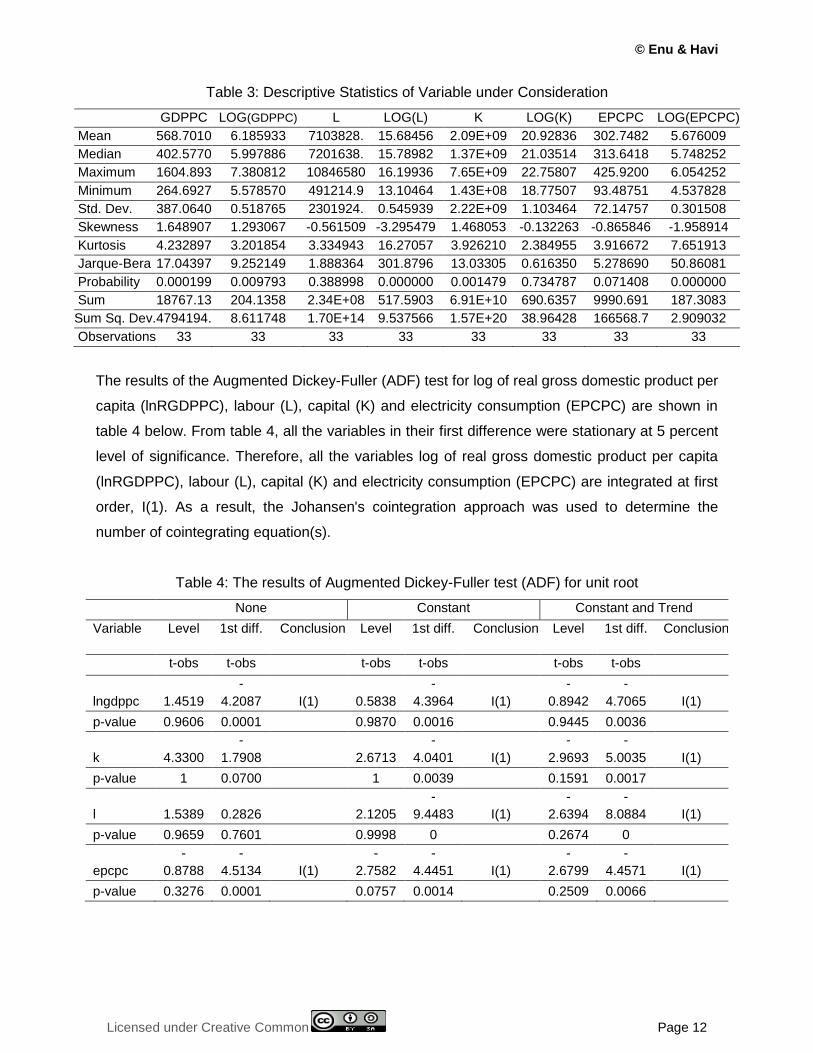
The summary statistics of all variables of interest used in this study are shown in table 3 below.
From table 3, the logarithm of real gross domestic product per capita (LNRGDPPC), labour (L),
capital (K) and electricity consumption (EPCPC) are approximately normal since their kurtoses
are about three. Therefore, these variables were used in the estimation of the model. The model
estimated had its dependent variable in logarithm form while the independent variables were not
in logarithm form.
© Enu & Havi
Licensed under Creative Common Page 12
Table 3: Descriptive Statistics of Variable under Consideration
GDPPC LOG(GDPPC) L LOG(L) K LOG(K) EPCPC LOG(EPCPC)
Mean 568.7010 6.185933 7103828. 15.68456 2.09E+09 20.92836 302.7482 5.676009
Median 402.5770 5.997886 7201638. 15.78982 1.37E+09 21.03514 313.6418 5.748252
Maximum 1604.893 7.380812 10846580 16.19936 7.65E+09 22.75807 425.9200 6.054252
Minimum 264.6927 5.578570 491214.9 13.10464 1.43E+08 18.77507 93.48751 4.537828
Std. Dev. 387.0640 0.518765 2301924. 0.545939 2.22E+09 1.103464 72.14757 0.301508
Skewness 1.648907 1.293067 -0.561509 -3.295479 1.468053 -0.132263 -0.865846 -1.958914
Kurtosis 4.232897 3.201854 3.334943 16.27057 3.926210 2.384955 3.916672 7.651913
Jarque-Bera 17.04397 9.252149 1.888364 301.8796 13.03305 0.616350 5.278690 50.86081
Probability 0.000199 0.009793 0.388998 0.000000 0.001479 0.734787 0.071408 0.000000
Sum 18767.13 204.1358 2.34E+08 517.5903 6.91E+10 690.6357 9990.691 187.3083
Sum Sq. Dev. 4794194. 8.611748 1.70E+14 9.537566 1.57E+20 38.96428 166568.7 2.909032
Observations 33 33 33 33 33 33 33 33
The results of the Augmented Dickey-Fuller (ADF) test for log of real gross domestic product per
capita (lnRGDPPC), labour (L), capital (K) and electricity consumption (EPCPC) are shown in
table 4 below. From table 4, all the variables in their first difference were stationary at 5 percent
level of significance. Therefore, all the variables log of real gross domestic product per capita
(lnRGDPPC), labour (L), capital (K) and electricity consumption (EPCPC) are integrated at first
order, I(1). As a result, the Johansen's cointegration approach was used to determine the
number of cointegrating equation(s).
Table 4: The results of Augmented Dickey-Fuller test (ADF) for unit root
None Constant Constant and Trend
Variable Level 1st diff. Conclusion Level 1st diff. Conclusion Level 1st diff. Conclusion
t-obs t-obs t-obs t-obs t-obs t-obs
lngdppc 1.4519
-
4.2087 I(1) 0.5838
-
4.3964 I(1)
-
0.8942
-
4.7065 I(1)
p-value 0.9606 0.0001
0.9870 0.0016
0.9445 0.0036
k 4.3300
-
1.7908
2.6713
-
4.0401 I(1)
-
2.9693
-
5.0035 I(1)
p-value 1 0.0700
1 0.0039
0.1591 0.0017
l 1.5389 0.2826
2.1205
-
9.4483 I(1)
-
2.6394
-
8.0884 I(1)
p-value 0.9659 0.7601
0.9998 0
0.2674 0
epcpc
-
0.8788
-
4.5134 I(1)
-
2.7582
-
4.4451 I(1)
-
2.6799
-
4.4571 I(1)
p-value 0.3276 0.0001
0.0757 0.0014
0.2509 0.0066
International Journal of Economics, Commerce and Management, United Kingdom
Licensed under Creative Common Page 13
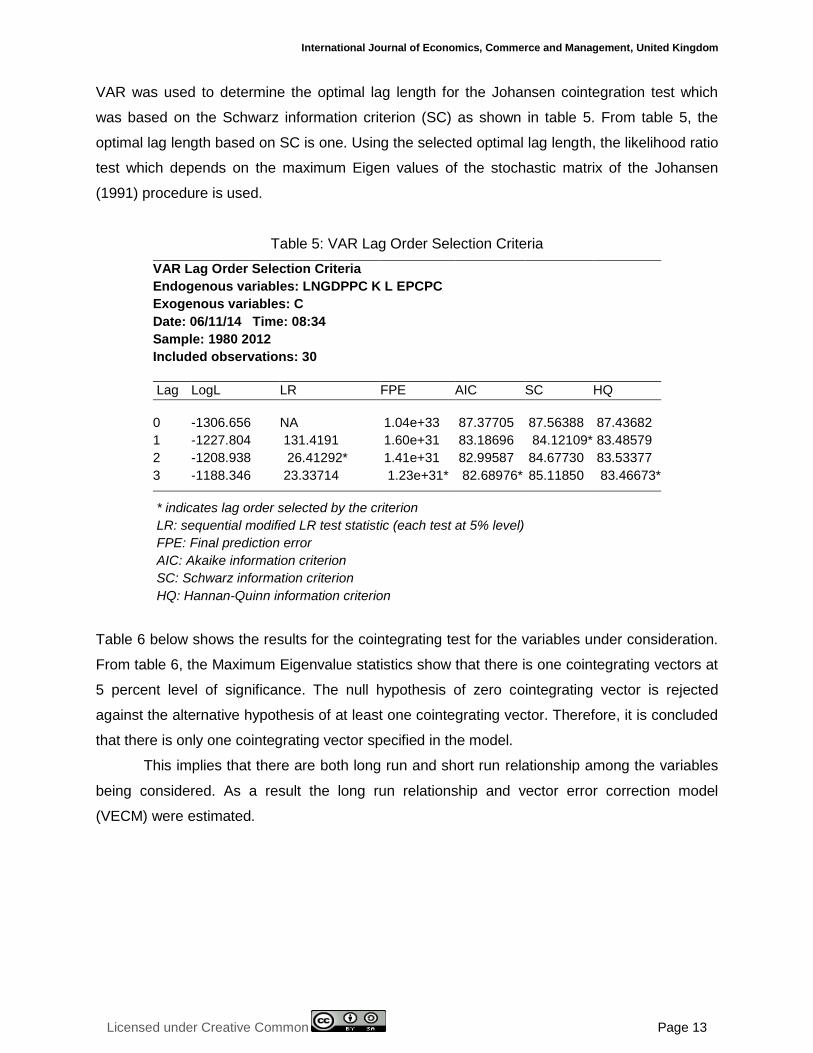
VAR was used to determine the optimal lag length for the Johansen cointegration test which
was based on the Schwarz information criterion (SC) as shown in table 5. From table 5, the
optimal lag length based on SC is one. Using the selected optimal lag length, the likelihood ratio
test which depends on the maximum Eigen values of the stochastic matrix of the Johansen
(1991) procedure is used.
Table 5: VAR Lag Order Selection Criteria
VAR Lag Order Selection Criteria
Endogenous variables: LNGDPPC K L EPCPC
Exogenous variables: C
Date: 06/11/14 Time: 08:34
Sample: 1980 2012
Included observations: 30
Lag LogL LR FPE AIC SC HQ
0 -1306.656 NA 1.04e+33 87.37705 87.56388 87.43682
1 -1227.804 131.4191 1.60e+31 83.18696 84.12109* 83.48579
2 -1208.938 26.41292* 1.41e+31 82.99587 84.67730 83.53377
3 -1188.346 23.33714 1.23e+31* 82.68976* 85.11850 83.46673*
* indicates lag order selected by the criterion
LR: sequential modified LR test statistic (each test at 5% level)
FPE: Final prediction error
AIC: Akaike information criterion
SC: Schwarz information criterion
HQ: Hannan-Quinn information criterion
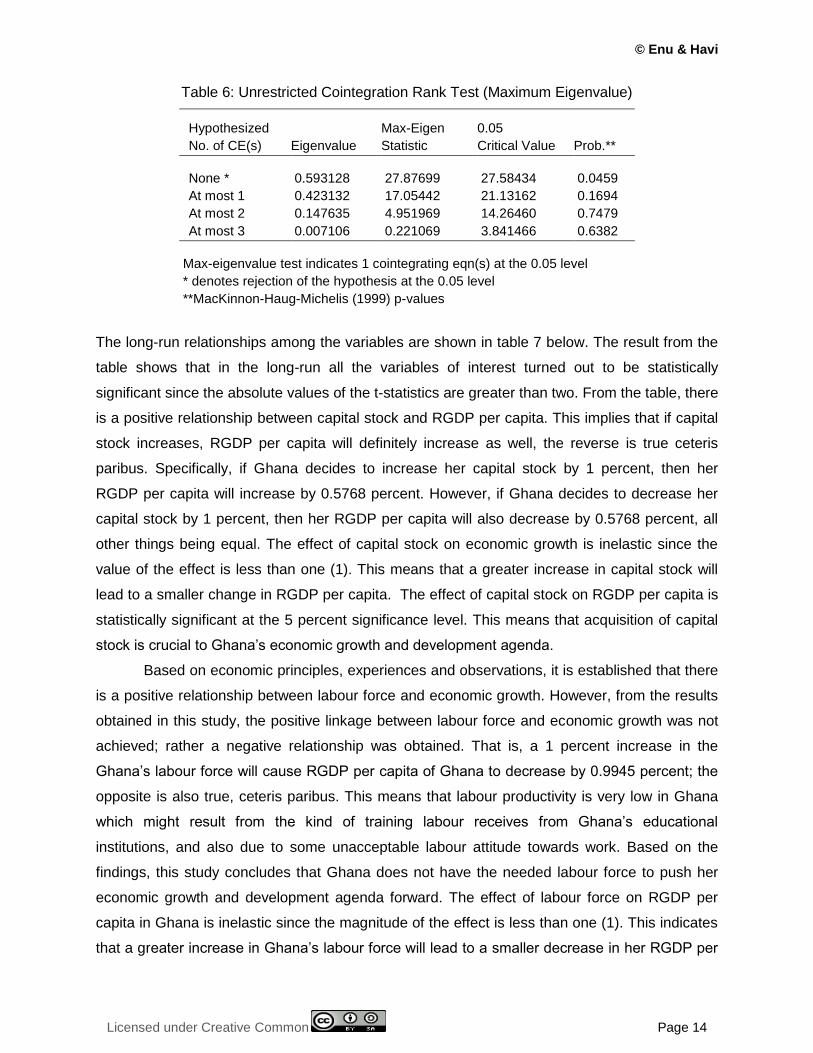
Table 6 below shows the results for the cointegrating test for the variables under consideration.
From table 6, the Maximum Eigenvalue statistics show that there is one cointegrating vectors at
5 percent level of significance. The null hypothesis of zero cointegrating vector is rejected
against the alternative hypothesis of at least one cointegrating vector. Therefore, it is concluded
that there is only one cointegrating vector specified in the model.
This implies that there are both long run and short run relationship among the variables
being considered. As a result the long run relationship and vector error correction model
(VECM) were estimated.
© Enu & Havi
Licensed under Creative Common Page 14
Table 6: Unrestricted Cointegration Rank Test (Maximum Eigenvalue)
Hypothesized Max-Eigen 0.05
No. of CE(s) Eigenvalue Statistic Critical Value Prob.**
None * 0.593128 27.87699 27.58434 0.0459
At most 1 0.423132 17.05442 21.13162 0.1694
At most 2 0.147635 4.951969 14.26460 0.7479
At most 3 0.007106 0.221069 3.841466 0.6382
Max-eigenvalue test indicates 1 cointegrating eqn(s) at the 0.05 level
* denotes rejection of the hypothesis at the 0.05 level
**MacKinnon-Haug-Michelis (1999) p-values
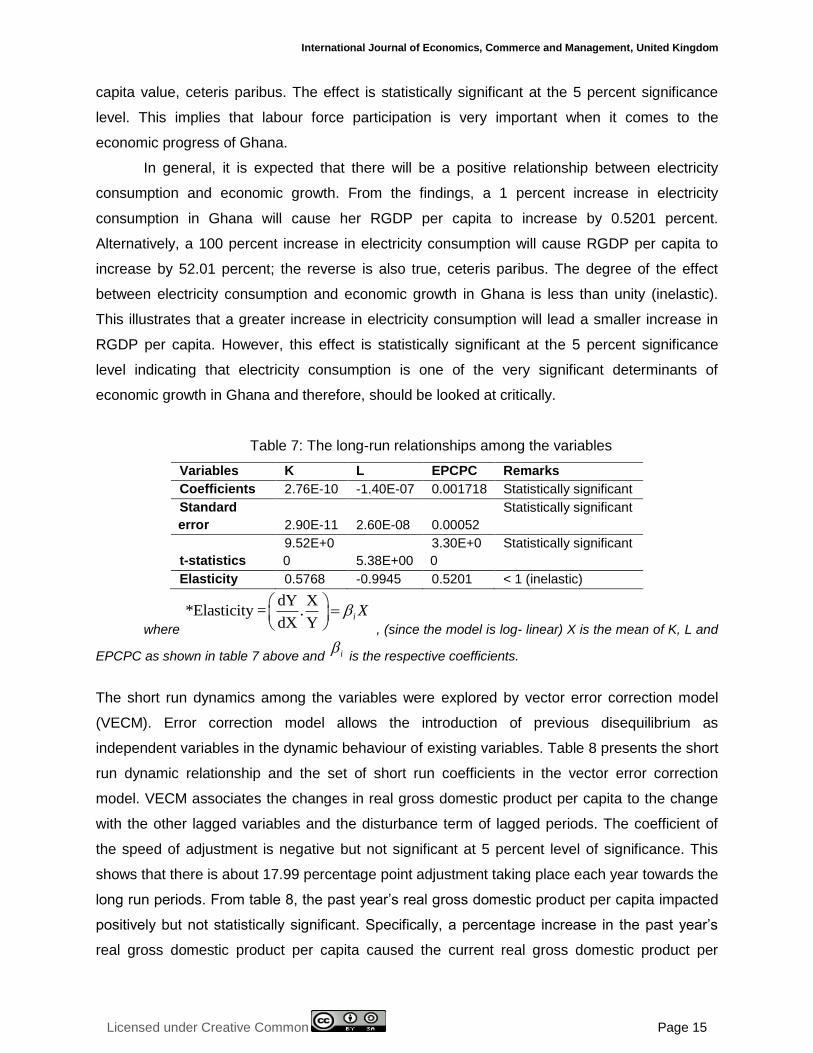
The long-run relationships among the variables are shown in table 7 below. The result from the
table shows that in the long-run all the variables of interest turned out to be statistically
significant since the absolute values of the t-statistics are greater than two. From the table, there
is a positive relationship between capital stock and RGDP per capita. This implies that if capital
stock increases, RGDP per capita will definitely increase as well, the reverse is true ceteris
paribus. Specifically, if Ghana decides to increase her capital stock by 1 percent, then her
RGDP per capita will increase by 0.5768 percent. However, if Ghana decides to decrease her
capital stock by 1 percent, then her RGDP per capita will also decrease by 0.5768 percent, all
other things being equal. The effect of capital stock on economic growth is inelastic since the
value of the effect is less than one (1). This means that a greater increase in capital stock will
lead to a smaller change in RGDP per capita. The effect of capital stock on RGDP per capita is
statistically significant at the 5 percent significance level. This means that acquisition of capital
stock is crucial to Ghana’s economic growth and development agenda.
Based on economic principles, experiences and observations, it is established that there
is a positive relationship between labour force and economic growth. However, from the results
obtained in this study, the positive linkage between labour force and economic growth was not
achieved; rather a negative relationship was obtained. That is, a 1 percent increase in the
Ghana’s labour force will cause RGDP per capita of Ghana to decrease by 0.9945 percent; the
opposite is also true, ceteris paribus. This means that labour productivity is very low in Ghana
which might result from the kind of training labour receives from Ghana’s educational
institutions, and also due to some unacceptable labour attitude towards work. Based on the
findings, this study concludes that Ghana does not have the needed labour force to push her
economic growth and development agenda forward. The effect of labour force on RGDP per
capita in Ghana is inelastic since the magnitude of the effect is less than one (1). This indicates
that a greater increase in Ghana’s labour force will lead to a smaller decrease in her RGDP per
International Journal of Economics, Commerce and Management, United Kingdom
Licensed under Creative Common Page 15
capita value, ceteris paribus. The effect is statistically significant at the 5 percent significance
level. This implies that labour force participation is very important when it comes to the
economic progress of Ghana.
In general, it is expected that there will be a positive relationship between electricity
consumption and economic growth. From the findings, a 1 percent increase in electricity
consumption in Ghana will cause her RGDP per capita to increase by 0.5201 percent.
Alternatively, a 100 percent increase in electricity consumption will cause RGDP per capita to
increase by 52.01 percent; the reverse is also true, ceteris paribus. The degree of the effect
between electricity consumption and economic growth in Ghana is less than unity (inelastic).
This illustrates that a greater increase in electricity consumption will lead a smaller increase in
RGDP per capita. However, this effect is statistically significant at the 5 percent significance
level indicating that electricity consumption is one of the very significant determinants of
economic growth in Ghana and therefore, should be looked at critically.
Table 7: The long-run relationships among the variables
Variables K L EPCPC Remarks
Coefficients 2.76E-10 -1.40E-07 0.001718 Statistically significant
Standard
error 2.90E-11 2.60E-08 0.00052
Statistically significant
t-statistics
9.52E+0
0 5.38E+00
3.30E+0
0
Statistically significant
Elasticity 0.5768 -0.9945 0.5201 < 1 (inelastic)
where
dY X*Elasticity = .
dX Yi X
, (since the model is log- linear) X is the mean of K, L and
EPCPC as shown in table 7 above and i is the respective coefficients.
The short run dynamics among the variables were explored by vector error correction model
(VECM). Error correction model allows the introduction of previous disequilibrium as
independent variables in the dynamic behaviour of existing variables. Table 8 presents the short
run dynamic relationship and the set of short run coefficients in the vector error correction
model. VECM associates the changes in real gross domestic product per capita to the change
with the other lagged variables and the disturbance term of lagged periods. The coefficient of
the speed of adjustment is negative but not significant at 5 percent level of significance. This
shows that there is about 17.99 percentage point adjustment taking place each year towards the
long run periods. From table 8, the past year’s real gross domestic product per capita impacted
positively but not statistically significant. Specifically, a percentage increase in the past year’s
real gross domestic product per capita caused the current real gross domestic product per
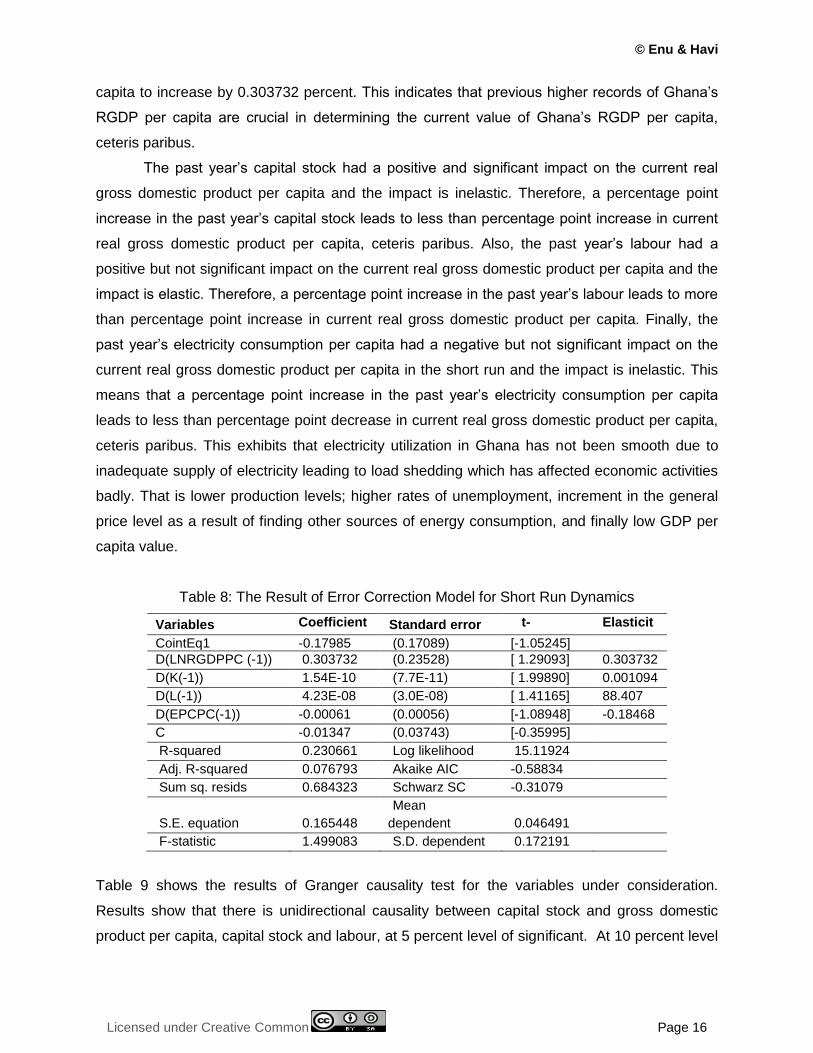
© Enu & Havi
Licensed under Creative Common Page 16
capita to increase by 0.303732 percent. This indicates that previous higher records of Ghana’s
RGDP per capita are crucial in determining the current value of Ghana’s RGDP per capita,
ceteris paribus.
The past year’s capital stock had a positive and significant impact on the current real
gross domestic product per capita and the impact is inelastic. Therefore, a percentage point
increase in the past year’s capital stock leads to less than percentage point increase in current
real gross domestic product per capita, ceteris paribus. Also, the past year’s labour had a
positive but not significant impact on the current real gross domestic product per capita and the
impact is elastic. Therefore, a percentage point increase in the past year’s labour leads to more
than percentage point increase in current real gross domestic product per capita. Finally, the
past year’s electricity consumption per capita had a negative but not significant impact on the
current real gross domestic product per capita in the short run and the impact is inelastic. This
means that a percentage point increase in the past year’s electricity consumption per capita
leads to less than percentage point decrease in current real gross domestic product per capita,
ceteris paribus. This exhibits that electricity utilization in Ghana has not been smooth due to
inadequate supply of electricity leading to load shedding which has affected economic activities
badly. That is lower production levels; higher rates of unemployment, increment in the general
price level as a result of finding other sources of energy consumption, and finally low GDP per
capita value.
Table 8: The Result of Error Correction Model for Short Run Dynamics
Variables Coefficient
s Standard error t-
statistics
Elasticit
y CointEq1 -0.17985 (0.17089) [-1.05245]
D(LNRGDPPC (-1)) 0.303732 (0.23528) [ 1.29093] 0.303732
D(K(-1)) 1.54E-10 (7.7E-11) [ 1.99890] 0.001094
D(L(-1)) 4.23E-08 (3.0E-08) [ 1.41165] 88.407
D(EPCPC(-1)) -0.00061 (0.00056) [-1.08948] -0.18468
C -0.01347 (0.03743) [-0.35995]
R-squared 0.230661 Log likelihood 15.11924
Adj. R-squared 0.076793 Akaike AIC -0.58834
Sum sq. resids 0.684323 Schwarz SC -0.31079
S.E. equation 0.165448
Mean
dependent 0.046491
F-statistic 1.499083 S.D. dependent 0.172191
Table 9 shows the results of Granger causality test for the variables under consideration.
Results show that there is unidirectional causality between capital stock and gross domestic
product per capita, capital stock and labour, at 5 percent level of significant. At 10 percent level
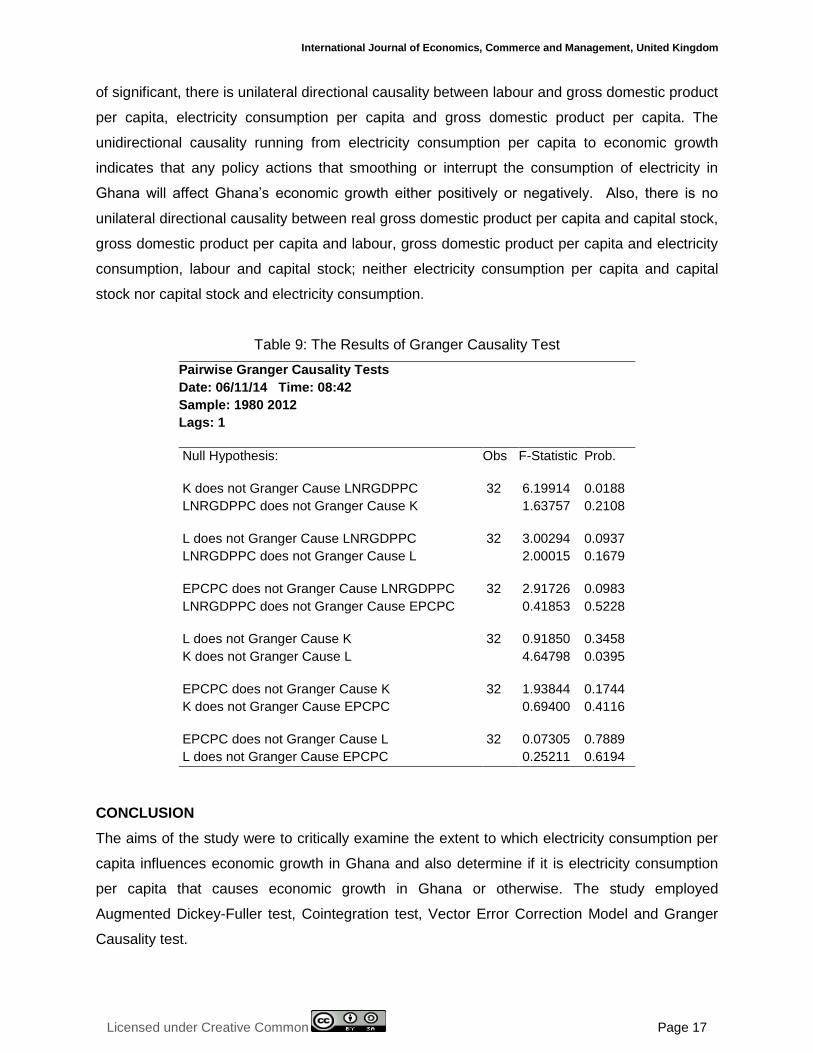
International Journal of Economics, Commerce and Management, United Kingdom
Licensed under Creative Common Page 17
of significant, there is unilateral directional causality between labour and gross domestic product
per capita, electricity consumption per capita and gross domestic product per capita. The
unidirectional causality running from electricity consumption per capita to economic growth
indicates that any policy actions that smoothing or interrupt the consumption of electricity in
Ghana will affect Ghana’s economic growth either positively or negatively. Also, there is no
unilateral directional causality between real gross domestic product per capita and capital stock,
gross domestic product per capita and labour, gross domestic product per capita and electricity
consumption, labour and capital stock; neither electricity consumption per capita and capital
stock nor capital stock and electricity consumption.
Table 9: The Results of Granger Causality Test
Pairwise Granger Causality Tests
Date: 06/11/14 Time: 08:42
Sample: 1980 2012
Lags: 1
Null Hypothesis: Obs F-Statistic Prob.
K does not Granger Cause LNRGDPPC 32 6.19914 0.0188
LNRGDPPC does not Granger Cause K 1.63757 0.2108
L does not Granger Cause LNRGDPPC 32 3.00294 0.0937
LNRGDPPC does not Granger Cause L 2.00015 0.1679
EPCPC does not Granger Cause LNRGDPPC 32 2.91726 0.0983
LNRGDPPC does not Granger Cause EPCPC 0.41853 0.5228
L does not Granger Cause K 32 0.91850 0.3458
K does not Granger Cause L 4.64798 0.0395
EPCPC does not Granger Cause K 32 1.93844 0.1744
K does not Granger Cause EPCPC 0.69400 0.4116
EPCPC does not Granger Cause L 32 0.07305 0.7889
L does not Granger Cause EPCPC 0.25211 0.6194
CONCLUSION
The aims of the study were to critically examine the extent to which electricity consumption per
capita influences economic growth in Ghana and also determine if it is electricity consumption
per capita that causes economic growth in Ghana or otherwise. The study employed
Augmented Dickey-Fuller test, Cointegration test, Vector Error Correction Model and Granger
Causality test.
© Enu & Havi
Licensed under Creative Common Page 18
The study revealed that, in the long term, a 1 percent increase in electricity power consumption
will cause GDP per capita to increase by 0.5201 percent. However, in the short run, electricity
consumption per capita negatively affects GDP per capita.
The study again revealed that unidirectional causality run from electricity consumption
per capita to economic growth meaning that any policy actions taken to affect the smooth
consumption of electricity in Ghana will definitely affect her GDP per capita growth. Therefore,
the current load shedding policy due to low supply of electricity will definitely affect the
Ghanaian economy negatively (i.e. lower production levels, high inflation, high rates
unemployment and lower standard of living).
In future, the extent to which other kinds of energy affect economic growth in Ghana
shall be investigated by disaggregating economic growth.
POLICY RECOMMENDATIONS
The study identified that the Ghanaian economy depends strongly and heavily on electricity
consumption per capita and, therefore, the current electricity policy of load shedding due to
inadequate electricity supply will affect the Ghanaian economic negatively (i.e. lower production
levels, high inflation, high rates unemployment and lower standard of living). Therefore the
following policies are suggested:
1. The Citizens of Ghana should be educated to use the limited electricity supply wisely.
2. The prepaid metering system should be extended to public institutions, private
institutions and the remaining households of the country. This will further ensure wise
usage of the limited electricity supply, reduce or prevent illegal connections drastically
and ensure 100 percent revenue collection for the power providers.
3. Industries should invest in machinery that uses other sources of energy other than
hydroelectric power. This will call for research and development of such new technology
that will not rely on hydroelectric power generation.
4. The government should invest heavily in electricity infrastructure; this will ensure that
there is enough energy to meet the needs of the agricultural, manufacturing and services
sectors of the Ghanaian economy.
5. Households, industries and government should find new ways of investing in energy
conservation methods so as to ensure sustainability now and in the future.
International Journal of Economics, Commerce and Management, United Kingdom
Licensed under Creative Common Page 19
REFERENCES
Acaravci, A. (2010). Structural Breaks, Electricity Consumption and Economic Growth: Evidence from Turkey. Romanian Journal of Economic Forecasting, No. 2, pp: 140 – 154.
Adom, P.K. (2011). Electricity-Economic Growth Nexus: The Ghanaian Case. International Journal of Energy Economics and Policy, vol. 1, No. 1, pp: 18 – 31.
Akarca A. and Long, T. (1980). On the Relationship between Energy and GNP: A Re-examination. Journal of Energy and Economics, vol. 5, pp: 326-331.
Akinwale, Y., Jesuleye, O., and Siyanbola, W. (2013). Empirical Analysis of Causal Relationship between Electricity Consumption and Economic Growth in Nigeria. British Journal of Economics, Management and Trade, 3(3): 277 – 295.
Aktas, C. and Yilmaz, V. (2008). Causal Relationship between Oil Consumption and Economic Growth in Turkey. Kocaeli Universitesi Sosyal Bilimler Enstitusu Dergisi (15)2008/1: 45 -55.
Akinlo, A. E. (2008). Energy Consumption and Economic Growth: Evidence from 11 African Countries, Energy Economics, vol. 30, pp. 2391 – 2400.
Akomolafe, K.J., and Danladi, J.D. (2014). Electricity Consumption and Economic Growth in Nigeria: A Multivariate Investigation. International Journal of Economics, Finance and Management, vol. 3, No. 1; pp. 28 – 33.
Atif, S. M., and Siddiqi, M.W. (2010). The Electricity Consumption and Economic Growth Nexus in Pakistan: A New Evidence. The Open Access Publication Server of the ZBW.htt://hdl.handle.net/10419/65688.
Baek, J. and Kim, H. S. (2011). Trade Liberalization, Economic Growth, Energy Consumption and the Environment: Time Series Evidence from G-20 Economies. Journal of East Asian Economic Integration, vol. 15, No. 1, pp: 3 – 30.
Belke, A., Dreger, D., and de Haan, F. (nd). Energy Consumption and Economic Growth: New Insight into the Cointegration Relationship. Ruhr Economic Papers No. 190.
Bildirici, M. E., Bakirtas, T., and Kayikci, F. (2012). Economic growth and Electricity Consumption: Auto Regressive Distributed Lag Analysis. Journal of Energy in Southern Africa, vol. 23, No. 4, pp. 29 – 45.
Energy Commission Ghana. (2006). Strategic National Energy Plan 2006 – 2020, Main Report.
Farhani, S. and Ben Rejeb, J. (2012). Link between Economic Growth and Energy Consumption in over 90 Countries. Interdisciplinary Journal of Contemporary Research in Business, vol. 3, No. 11, pp. 282-297.
Hossain, MD. S. (2013). Energy Consumption Nexus Economic Growth: A Dynamic Cointegration and Causality Analysis. Scholars World-IRMJCR, vol 1, issue 111, online:ISSN 2320-3145, Print: ISSN 2319-5789
Hye, Q.M.A., and Riaz, S. (2008). Causality between Energy Consumption and Economic Growth: The Case of Pakistan. The Lahore Journal of Economics, vol 13, No. 2, pp: 45 – 58.
Isma’il, M., and Musa, I.J. (2012). Visual Relationship between Energy Consumption and Economic Growth: The Geographical Perspective. Global Business and Economics Research Journal, vol. 1, No.1, p: 12 – 24.
Kakar, Z.K., and Khilji, B. A. (2011). Energy Consumption and Economic Growth in Pakistan. Journal of International Academic Research, vol. 11, No.1, pp: 33 – 36.
Kraft, J., and Kraft, A. (1978). On the Relationship between Energy and GNP. Journal of Energy and Development.
Kwakwa, P. A. (2012). Disaggregated Energy Consumption and Economic Growth in Ghana. International Journal of Energy and Policy, vol. 2, No. 1, pp: 34 – 40.
© Enu & Havi
Licensed under Creative Common Page 20
Mahmoudinia, D., Amroabadi, B. S., Pourshahabi, F., and Jafari, S. (2013). Oil products Consumption, Electricity Consumption-Economic Growth Nexus in the Economy of Iran: A Bounds Testing Co-integration Approach. International Journal of Academic Research in Business and Social Sciences, vol. 3, No. 1, pp. 353 – 367
Mallick, H. (2009). Examining the Linkage between Energy Consumption and Economic Growth in India. The Journal of Development Areas, vol. 43, No. 1, pp: 249 – 280.
Masuduzzaman, M. (2013). Electricity Consumption and Economic Growth in Bangladesh: Cointegration Analysis. Research Study Series No. – FDRS 02/2013.
Odhiambo, N.M. (2010). Electricity consumption, Labour force participation rate and economic growth in Kenya: An Empirical investigation. Problems and Perspectives in Management, vo. 8, issue 1, pp. 31 – 38.
Orhewere, B., and Henry, M. (2011). Energy Consumption and Economic Growth in Nigeria. JORIND, (9) 1, pp: 153 – 165.
Pathan, N., and Abasi, M.A. (2014). Causality between Energy Consumption and Economic Growth in Pakistan. European Journal of Business and Management, vol. 6, No. 4, pp. 46 – 53.
Shaari, M.S., Hussain, N.E., and Ismail, M.S. (2012). Relationship between Energy Consumption and Economic growth: Empirical Evidence for Malaysia. Business Systems Review, vol. 2, Issue 1, pp. 17 – 28.
Shahbaz, M. and Feridun, M. (2011). Electricity Consumption and Economic Growth: Empirical Evidence from Pakistan. Springer Science and Busness Media B.V. Qual Quant, DOI 10.1007/s11135-011-9468-3.
Vlahinic-Dizdarevic, N., and Zikovic, S. (2010). The Role of Energy in Economic Growth: the case of Croatia. Zb. Rad. Ekon. Fak. Rij., vol. 28, sv. 1, pp: 35 – 60.
Wolde-Rufael, Y. (2006). Electricity Consumption and Economic Growth: A Time Series Experience for 17 African Countries. Energy Policy, vol 34, pp. 1106 - 1114.