Influence of debris cover on terminus retreat and mass changes of Chorabari Glacier, Garhwal region,...
11
Influence of debris cover on terminus retreat and mass changes of Chorabari Glacier, Garhwal region, central Himalaya, India D.P. DOBHAL, Manish MEHTA, Deepak SRIVASTAVA Centre for Glaciology, Wadia Institute of Himalayan Geology, Dehra Dun, Uttarakhand, India E-mail: [email protected] ABSTRACT. Recent studies of Himalayan glacier recession indicate that there is wide variability in terminus retreat rate and mass balance in the different sectors of the mountain range, primarily linked to the topography and climate of the region. Variable retreat rates of glacier termini and inadequate supporting field data (e.g. mass balance, ice thickness, velocity, etc.) in the Himalayan glaciers make it difficult to develop a coherent picture of climate change impacts. In this study, the results of a detailed mapping campaign and ground-based measurements of ablation rate, terminus retreat and ice loss are reported for the period 2003–10. In addition, background information from an old glacier map (Survey of India, 1962) was compiled and terminus recession measurements were carried out from 1990 field photographs of Chorabari Glacier, central Himalaya. Ourablation stake network results suggest that the influence of debris cover is significant for Chorabari Glacier mass balance and terminus retreat. The terminus survey finds that the glacier is retreating, but at a lower rate than many other non-debris- covered glaciers in the region. The recession and ablation data (particularly in the upper ablation area at higher altitudes) suggest that the ice volume loss of the glaciers is of greater magnitude than the slow terminus retreat and, if the process continues, the lowermost part of the glacier may reduce to a quasi- stationary position while significant ice loss continues. INTRODUCTION The Himalayan mountain range contains thousands of glaciers of widely varying properties, which are spread over nearly 37 000 km 2 with an east–west range >2000 km (Raina and Srivastava, 2008). This large geographic extent, with complex and extreme topography along with variable climatic conditions, results in an inhomogeneous set of glacial recessions. The primary climatic forcing, moving from west to east, is a decreasing influence of the mid- latitude westerlies and an increasing influence of the Indian summer monsoon (Bookhagen and Burbank, 2010). Thus, the distribution of glaciers in the Himalaya is uneven, with a higher concentration of glaciers in the northwest than in the northeast of the mountain range. In general, glaciers in the region have debris-covered ablation areas with debris thickness ranging from millimetres to tens of centimetres. As a consequence of the complex climate system, glacial geometry, glacier surface properties and geology, the recession rates of the glaciers are variable (Scherler and others, 2011). Various studies, such as mapping of debris-cover extent and its correlation with glacier melting and recession, have been carried out using remote-sensing and field-based data in different parts of the world (Lougeay, 1974; Bishop and others, 2001; Taschner and Ranzi, 2002; Paul and others, 2004; Buchroithner and Bolch, 2007; Stokes and others, 2007; Bolch and others, 2008; Shukla and others, 2009; Kamp and others, 2011; Scherler and others, 2011). Supraglacial debris on glaciers is commonly found to have significant control on the rate of ice ablation (Bozhinsky and others, 1986; Lundstrom and others, 1993). A debris cover influences the terminus dynamics and modifies a glacier’s response to climate change (Scherler and others, 2011). Surface ablation rates are generally increased in the presence of a thin (<5 cm) debris cover, but are significantly reduced when a thick (>5 cm) debris cover is present (Østrem, 1965; Lundstrom and others, 1993; Mattson and others, 1993; Reznichenko and others, 2010; Scherler and others, 2011). A thin and patchy debris cover reduces the albedo and elevates shortwave radiation absorption, whereas ablation rates are strongly reduced further down the glacier due to the insulating effect of thicker debris (Mattson and others, 1993; Jackson and Fountain, 2007; Reznichenko and others, 2010). The local mass balance of debris-covered glaciers is distinctly nonlinear and non- monotonic with elevation. Generally ablation takes place below the equilibrium-line altitude (ELA) and ablation rates increase with decreasing elevation; however, at Chorabari Glacier at lower altitudes, where the debris cover thickens to >5 cm, ablation rate decreases. In the central Himalaya a large number of glaciers are debris-covered, especially in the ablation zone, which can exist over stagnant termini. Over some glacier surfaces, growing meltwater ponds and surface lowering due to internal melting indicate that these glaciers are downwasting on the whole. This paper presents recent results of ablation observations on Chorabari Glacier from 2003 to 2010. Our aim is to quantitatively evaluate the influence of the debris cover on summer ablation and terminus recession and to discuss the effects of debris cover on mass-balance processes. Study site Chorabari Glacier (30846’20.58’’ N; 7982’59.381’’ E) is a medium-sized compound valley-type glacier covering an area of 6.6 km 2 . The glacier is located in the Mandakini River basin of the Alaknanda catchment (a tributary of the River Ganga) (Fig. 1a). Chorabari Glacier has its accumu- lation area below Bhartkhunta peak (6578 m a.s.l.) and Kedarnath peak (6940 m a.s.l.) and flows from north to south between 6400 and 3895 m a.s.l. with an average Journal of Glaciology, Vol. 59, No. 217, 2013 doi: 10.3189/2013JoG12J180 961
Transcript of Influence of debris cover on terminus retreat and mass changes of Chorabari Glacier, Garhwal region,...

Influence of debris cover on terminus retreat and mass changes ofChorabari Glacier, Garhwal region, central Himalaya, India
D.P. DOBHAL, Manish MEHTA, Deepak SRIVASTAVACentre for Glaciology, Wadia Institute of Himalayan Geology, Dehra Dun, Uttarakhand, India
E-mail: [email protected]
ABSTRACT. Recent studies of Himalayan glacier recession indicate that there is wide variability interminus retreat rate and mass balance in the different sectors of the mountain range, primarily linked tothe topography and climate of the region. Variable retreat rates of glacier termini and inadequatesupporting field data (e.g. mass balance, ice thickness, velocity, etc.) in the Himalayan glaciers make itdifficult to develop a coherent picture of climate change impacts. In this study, the results of a detailedmapping campaign and ground-based measurements of ablation rate, terminus retreat and ice loss arereported for the period 2003–10. In addition, background information from an old glacier map (Surveyof India, 1962) was compiled and terminus recession measurements were carried out from 1990 fieldphotographs of Chorabari Glacier, central Himalaya. Our ablation stake network results suggest that theinfluence of debris cover is significant for Chorabari Glacier mass balance and terminus retreat. Theterminus survey finds that the glacier is retreating, but at a lower rate than many other non-debris-covered glaciers in the region. The recession and ablation data (particularly in the upper ablation area athigher altitudes) suggest that the ice volume loss of the glaciers is of greater magnitude than the slowterminus retreat and, if the process continues, the lowermost part of the glacier may reduce to a quasi-stationary position while significant ice loss continues.
INTRODUCTIONThe Himalayan mountain range contains thousands ofglaciers of widely varying properties, which are spread overnearly 37 000 km2 with an east–west range >2000 km (Rainaand Srivastava, 2008). This large geographic extent, withcomplex and extreme topography along with variableclimatic conditions, results in an inhomogeneous set ofglacial recessions. The primary climatic forcing, movingfrom west to east, is a decreasing influence of the mid-latitude westerlies and an increasing influence of the Indiansummer monsoon (Bookhagen and Burbank, 2010). Thus,the distribution of glaciers in the Himalaya is uneven, with ahigher concentration of glaciers in the northwest than in thenortheast of the mountain range. In general, glaciers in theregion have debris-covered ablation areas with debristhickness ranging from millimetres to tens of centimetres.As a consequence of the complex climate system, glacialgeometry, glacier surface properties and geology, therecession rates of the glaciers are variable (Scherler andothers, 2011).
Various studies, such as mapping of debris-cover extentand its correlation with glacier melting and recession, havebeen carried out using remote-sensing and field-based datain different parts of the world (Lougeay, 1974; Bishop andothers, 2001; Taschner and Ranzi, 2002; Paul and others,2004; Buchroithner and Bolch, 2007; Stokes and others,2007; Bolch and others, 2008; Shukla and others, 2009;Kamp and others, 2011; Scherler and others, 2011).Supraglacial debris on glaciers is commonly found to havesignificant control on the rate of ice ablation (Bozhinsky andothers, 1986; Lundstrom and others, 1993). A debris coverinfluences the terminus dynamics and modifies a glacier’sresponse to climate change (Scherler and others, 2011).Surface ablation rates are generally increased in thepresence of a thin (<5 cm) debris cover, but are significantly
reduced when a thick (>5 cm) debris cover is present(Østrem, 1965; Lundstrom and others, 1993; Mattson andothers, 1993; Reznichenko and others, 2010; Scherler andothers, 2011). A thin and patchy debris cover reduces thealbedo and elevates shortwave radiation absorption,whereas ablation rates are strongly reduced further downthe glacier due to the insulating effect of thicker debris(Mattson and others, 1993; Jackson and Fountain, 2007;Reznichenko and others, 2010). The local mass balance ofdebris-covered glaciers is distinctly nonlinear and non-monotonic with elevation. Generally ablation takes placebelow the equilibrium-line altitude (ELA) and ablation ratesincrease with decreasing elevation; however, at ChorabariGlacier at lower altitudes, where the debris cover thickens to>5 cm, ablation rate decreases.
In the central Himalaya a large number of glaciers aredebris-covered, especially in the ablation zone, which canexist over stagnant termini. Over some glacier surfaces,growing meltwater ponds and surface lowering due tointernal melting indicate that these glaciers are downwastingon the whole. This paper presents recent results of ablationobservations on Chorabari Glacier from 2003 to 2010. Ouraim is to quantitatively evaluate the influence of the debriscover on summer ablation and terminus recession and todiscuss the effects of debris cover onmass-balance processes.
Study siteChorabari Glacier (30846’20.58’’N; 7982’59.381’’ E) is amedium-sized compound valley-type glacier covering anarea of �6.6 km2. The glacier is located in the MandakiniRiver basin of the Alaknanda catchment (a tributary of theRiver Ganga) (Fig. 1a). Chorabari Glacier has its accumu-lation area below Bhartkhunta peak (6578ma.s.l.) andKedarnath peak (6940ma.s.l.) and flows from north tosouth between 6400 and 3895ma.s.l. with an average
Journal of Glaciology, Vol. 59, No. 217, 2013 doi: 10.3189/2013JoG12J180 961
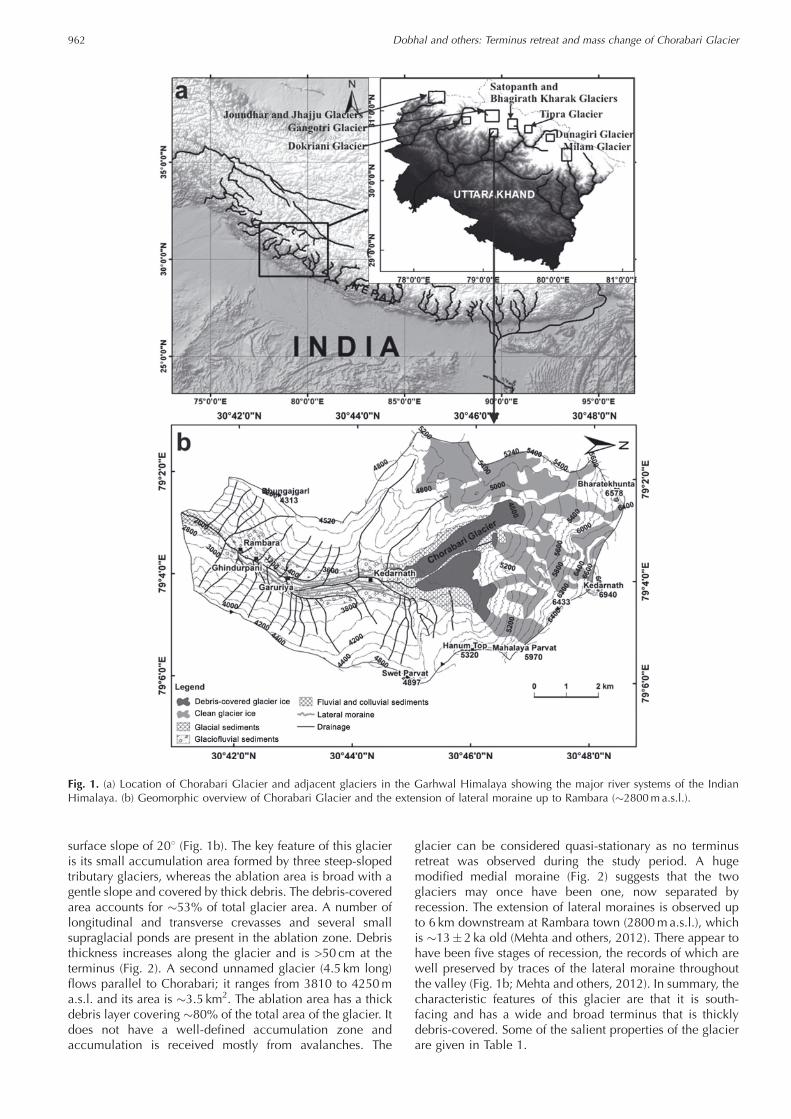
surface slope of 208 (Fig. 1b). The key feature of this glacieris its small accumulation area formed by three steep-slopedtributary glaciers, whereas the ablation area is broad with agentle slope and covered by thick debris. The debris-coveredarea accounts for �53% of total glacier area. A number oflongitudinal and transverse crevasses and several smallsupraglacial ponds are present in the ablation zone. Debristhickness increases along the glacier and is >50 cm at theterminus (Fig. 2). A second unnamed glacier (4.5 km long)flows parallel to Chorabari; it ranges from 3810 to 4250ma.s.l. and its area is �3.5 km2. The ablation area has a thickdebris layer covering �80% of the total area of the glacier. Itdoes not have a well-defined accumulation zone andaccumulation is received mostly from avalanches. The
glacier can be considered quasi-stationary as no terminusretreat was observed during the study period. A hugemodified medial moraine (Fig. 2) suggests that the twoglaciers may once have been one, now separated byrecession. The extension of lateral moraines is observed upto 6 km downstream at Rambara town (2800ma.s.l.), whichis �13�2 ka old (Mehta and others, 2012). There appear tohave been five stages of recession, the records of which arewell preserved by traces of the lateral moraine throughoutthe valley (Fig. 1b; Mehta and others, 2012). In summary, thecharacteristic features of this glacier are that it is south-facing and has a wide and broad terminus that is thicklydebris-covered. Some of the salient properties of the glacierare given in Table 1.
Fig. 1. (a) Location of Chorabari Glacier and adjacent glaciers in the Garhwal Himalaya showing the major river systems of the IndianHimalaya. (b) Geomorphic overview of Chorabari Glacier and the extension of lateral moraine up to Rambara (�2800ma.s.l.).
Dobhal and others: Terminus retreat and mass change of Chorabari Glacier962

General climatic settingThe area is precipitated by the Indian summer monsoon insummer and westerly disturbances in winter (Owen andothers, 1996). Vohra (1981) suggested that the Ganga basinexperiences equal amounts of summer monsoon precipi-tation and winter westerly precipitation. Therefore theseglaciers are also called summer as well as winter accumu-lation type glaciers (Vohra, 1981; Ageta and Higuchi, 1984;Higuchi and Ohata, 1996).
The general climate of the study area is humid–temperatein summer and dry–cold in winter. There are no long-terminstrumental data available for weather parameters. The
monitoring of Chorabari Glacier began in 2003 and amanned meteorological observatory (3820m a.s.l.) wasinstalled to monitor air temperature, wind speed andprecipitation during the investigation period. In 2007, anautomatic weather station (AWS; Campbell Scientific) wasinstalled near the terminus of the glacier at 3820ma.s.l.Daily mean temperature was found to fluctuate between+128C and –18C (June–October) during the period 2003–10.Maximum air temperature was 16.68C in June 2009, and theminimum was –188C in January 2008. Summer precipitationis highly influenced by the monsoon and average rainfallrecorded between 2007 and 2010 was 1253mm (June–October). Winter precipitation generally occurs betweenDecember and March (when the westerlies are dominant inthe area as they move eastward over northern India) and isthe main source of snow accumulation. There are noinstrumental data available for winter snowfall; however,residual snow depth fluctuated between 25 and 50 cm inApril and early May at 4000ma.s.l. during the study periodfrom 2003 to 2010. Snow normally melts before themonsoon commences in mid-June. The average wind speedat the AWS was 2.5m s–1 and average daily sunshineduration was 190min between 2007 and 2010 (Fig. 3a).The measured daily mean temperature and rainfall areshown in Figure 3b.
STUDY METHODSGlacier surveyThe earliest record of Chorabari Glacier is available in theSurvey of India (1962) topographic map on 1:50 000 scalewith 40m contour interval (planimetric accuracy �12.5mand elevation accuracy �6.5m; Prasada Raju and Ghosh,2003). In 1990, the terminus (snout) position was markedand the glacier was photographed. Changes in the terminusposition were measured (fixed date) during the field seasonsof 2003–10 with handheld GPS (Magellan, Pro Mark-X) withvertical accuracy (z) 1–5m and horizontal accuracy (x, y)
Fig. 2. Chorabari Glacier showing the clean accumulation zone (Acz) and debris-covered ablation zone (Abz). On the right-hand side is anunnamed glacier with thick debris cover (3.5 km2) flowing parallel to Chorabari.
Table 1. Salient features and geomorphological parameters ofChorabari Glacier
Coordinates 30846’20.58’’N, 7982’59.381’’ ESurface area (1962) �7.37 km2
Surface area (2010) �6.66 km2
Ablation area (2010) �3.67 km2
Accumulation area (2010) �2.99 km2
Length (2010) �7.5 kmOrientation SouthElevation extension 3895–6420ma.s.l.Average surface slope 208Ablation slope 108Accumulation slope 308Mean total width 0.43 kmELA (2010) 5070mAAR (2010) 0.44General climate Humid temperate in summer and
dry cold in winterTemperature at 3820ma.s.l.(2007–10)
Annual daily average 3.48CDaily maximum 16.048C
(Jun 2007)Daily minimum –188C (Jan 2008)
Geology (rock type) Crystalline rocks, mainly augen andgranitic gneisses
Dobhal and others: Terminus retreat and mass change of Chorabari Glacier 963

3m (0.01’) and survey-grade total station measurementsfrom the fixed stable survey point (see Fig. 5a further below).The area vacated by the glacier due to recession wasestimated by comparing the field measurements with theSurvey of India (1962) map. The annual monitoring ofglacier terminus position, frontal area loss, surface volumeloss and elevation change was undertaken following well-established techniques (Østrem and Brugman, 1991; Dobhaland others, 2004, 2008; Wagnon and others, 2007).
Mass-balance and debris thickness measurementMass-balance measurements were undertaken by the glacio-logical stake network method (Østrem and Brugman, 1991).In October 2003 a network of 44 stakes was set up and eachstake was fixed to a depth of 10–12m by stream drill(Heucke ice drill) to measure the accumulation, ablationand debris thickness (Fig. 4a). However, in the upperablation zone (4400–4600ma.s.l.) a few stakes were lostin winter. These were replaced as per standard procedure.The process was repeated in each measurement year as thearea is steeply sloped, with a bare ice surface in the upperablation region and thick debris cover in the lower ablationregion. These stakes were labelled Nos. 01–44 in sequencefrom the terminus to the accumulation area. Stake heightreadings were taken at an interval of 5–10 days during theentire ablation period to determine monthly melting and netablation. Accumulation measurements were made in snowpits and by probing at different locations. These measure-ments were made in April–May (early summer) and again in
October each year. Snowpack density was measured atvarious altitudes. The density measured in several pits atdifferent altitudes was used to assess water equivalentmeasurement. Average densities of 0.56 and 0.85 g cm–3
were calculated for snow–firn and ice, respectively. Stakelocations, obtained by total station and handheld GPS, weretransferred to the map for further analysis. In addition, basedon the Survey of India (1962) topographic map, LandsatEnhanced Thematic Mapper Plus (ETM+) imagery (2005)glacier outlines were delineated and a contour mapprepared. The outlines of debris cover were manuallydelineated. The surface area of each elevation band wascalculated using a planimeter and multiplied by the calcu-lated value of net accumulation/ablation for each elevationband used for final calculation of net mass balance for abudget year. The standard error, estimated to be 10% of totalmass balance, comprises stake height measurement, snowice density variation and extrapolation for inaccessiblecrevasse-prone areas (Wagnon and others, 2007; Dobhaland others, 2008).
The distribution of ablation stakes for measurement ofmelting and debris thickness was divided into threecategories: clean ice (stake Nos. 35–40), thin debris cover�5 cm (stake Nos. 25–34) and thick debris cover >5 cm (stakeNos. 01–24). Maximum debris thickness measured was�1.8m in the lower ablation zone near the glacier terminus(Fig. 4c). In order to study the influence of debris thickness onthe ablation process, the area was divided into four differentaltitude zones (Fig. 4b): (1) below 4300ma.s.l., (2) between
Fig. 3. Meteorological data collected during the study period from an AWS at 3820ma.s.l.: (a) wind speed and sun duration; (b) averagedaily temperature and rainfall. Date format is day-month-year.
Dobhal and others: Terminus retreat and mass change of Chorabari Glacier964
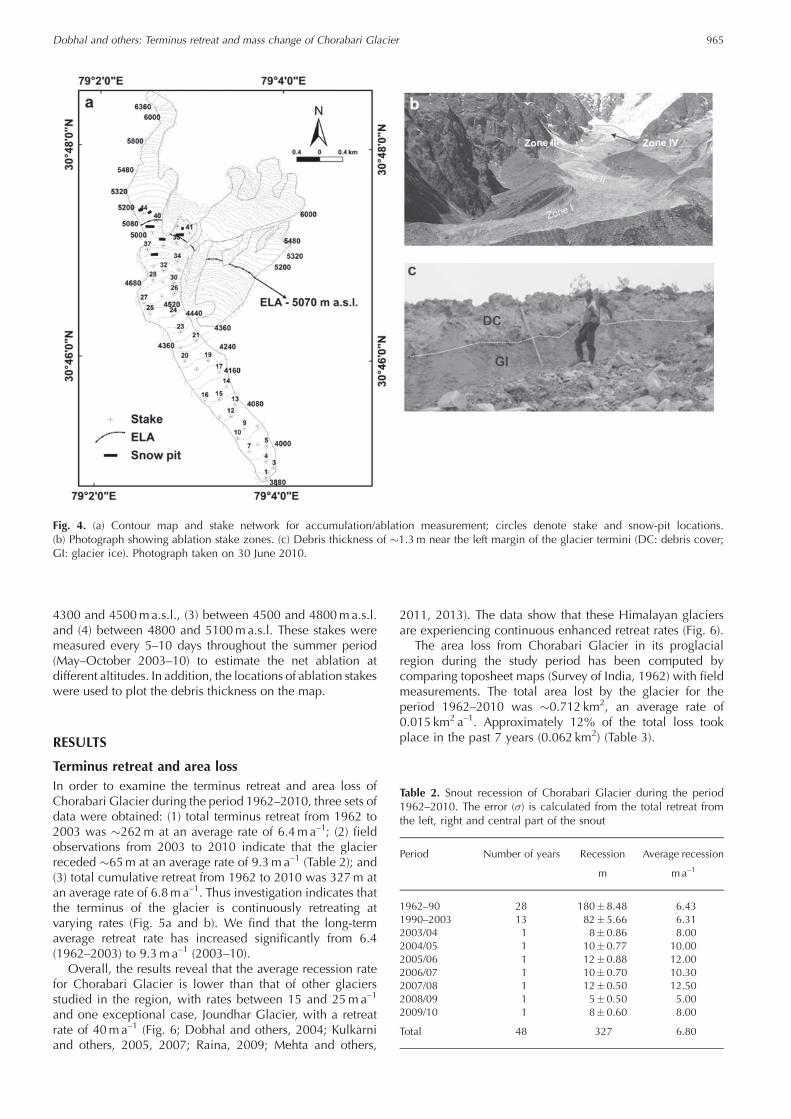
4300 and 4500ma.s.l., (3) between 4500 and 4800ma.s.l.and (4) between 4800 and 5100ma.s.l. These stakes weremeasured every 5–10 days throughout the summer period(May–October 2003–10) to estimate the net ablation atdifferent altitudes. In addition, the locations of ablation stakeswere used to plot the debris thickness on the map.
RESULTS
Terminus retreat and area lossIn order to examine the terminus retreat and area loss ofChorabari Glacier during the period 1962–2010, three sets ofdata were obtained: (1) total terminus retreat from 1962 to2003 was �262m at an average rate of 6.4ma–1; (2) fieldobservations from 2003 to 2010 indicate that the glacierreceded �65m at an average rate of 9.3ma–1 (Table 2); and(3) total cumulative retreat from 1962 to 2010 was 327m atan average rate of 6.8ma–1. Thus investigation indicates thatthe terminus of the glacier is continuously retreating atvarying rates (Fig. 5a and b). We find that the long-termaverage retreat rate has increased significantly from 6.4(1962–2003) to 9.3ma–1 (2003–10).
Overall, the results reveal that the average recession ratefor Chorabari Glacier is lower than that of other glaciersstudied in the region, with rates between 15 and 25ma–1
and one exceptional case, Joundhar Glacier, with a retreatrate of 40ma–1 (Fig. 6; Dobhal and others, 2004; Kulkarniand others, 2005, 2007; Raina, 2009; Mehta and others,
2011, 2013). The data show that these Himalayan glaciersare experiencing continuous enhanced retreat rates (Fig. 6).
The area loss from Chorabari Glacier in its proglacialregion during the study period has been computed bycomparing toposheet maps (Survey of India, 1962) with fieldmeasurements. The total area lost by the glacier for theperiod 1962–2010 was �0.712 km2, an average rate of0.015 km2 a–1. Approximately 12% of the total loss tookplace in the past 7 years (0.062 km2) (Table 3).
Fig. 4. (a) Contour map and stake network for accumulation/ablation measurement; circles denote stake and snow-pit locations.(b) Photograph showing ablation stake zones. (c) Debris thickness of �1.3m near the left margin of the glacier termini (DC: debris cover;GI: glacier ice). Photograph taken on 30 June 2010.
Table 2. Snout recession of Chorabari Glacier during the period1962–2010. The error (�) is calculated from the total retreat fromthe left, right and central part of the snout
Period Number of years Recession Average recession
m ma–1
1962–90 28 180�8.48 6.431990–2003 13 82�5.66 6.312003/04 1 8�0.86 8.002004/05 1 10�0.77 10.002005/06 1 12�0.88 12.002006/07 1 10�0.70 10.302007/08 1 12�0.50 12.502008/09 1 5�0.50 5.002009/10 1 8�0.60 8.00
Total 48 327 6.80
Dobhal and others: Terminus retreat and mass change of Chorabari Glacier 965

Annual mass balance, surface elevation and mass lossAnnual mass balance of the glacier is calculated byintegrating values (accumulation and ablation) obtainedfrom field measurements between 2003/04 and 2009/10(Fig. 7). The result is that the net balance over these 7 yearsshowed a negative trend ranging from –4.97�106m3w.e. in2005/06 to –3.9� 106m3w.e. in 2007/08 (Table 4). Basedon the stake data (accumulation/ablation), we calculate totalmass loss to be 30.8�106m3w.e. at an average of4.4�106m3w.e. a–1 over the 7 year period. We estimatethe average specific balance to be –0.73mw.e. a–1. Duringthe measurement period, specific mass balance of the glacieris strongly negative, reaching –0.82mw.e. in 2005/06.Subsequently its magnitude decreased to reach �–0.65m
w.e. in 2009–10 (Table 4). The study also reveals that masswasting in the ablation zone ranged from –0.46 to–2.97mw.e. a–1, while the mass gain in the accumulationarea ranged from +0.42 to +0.94mw.e. a–1 between 2003/04 and 2009/10. The ELA ascended �15m between 2003/04 and 2009/10 (Fig. 7) and the average accumulation–arearatio (AAR) was calculated to be �0.44 for the period2003–10 (Table 4).
Surface elevation changes between 2003 and 2010 weremeasured by monitoring ablation stakes installed along thecentre line as well as along a line transverse to flow (Fig. 4a).The surface elevation loss is spatially variable, with amaximum value of 20m in the ablation zone between4500 and 4300ma.s.l. and a minimum of 3m near the
Fig. 5. Frontal retreat of Chorabari Glacier. (a) Photograph showing the different snout positions and benchmarks for termini survey(black circle). (b) Map of terminus positions and retreat of glacier during the period between 1962 (Survey of India, 1962) and 2003–10(field survey).
Fig. 6. Histogram showing terminus retreat rates of glaciers nearChorabari Glacier (Fig. 1a).
Table 3. Total and frontal area vacated by Chorabari Glacier (1962–2010). Glacier area loss is �11% between 1962 and 2010 (48years)
Period Years Total areavacated
Annualaverage
Frontal areavacated
Annualaverage
km2 km2 a–1 km2 km2 a–1
1962–2003 41 0.650 0.016 0.058 0.00142003–2010 7 0.062 0.009 0.014 0.0020
Total 48 0.712 0.015 0.072 0.0015
Dobhal and others: Terminus retreat and mass change of Chorabari Glacier966

equilibrium line (5050–4950ma.s.l.; Fig. 8). However, in thelower reaches between 4300 and 3895ma.s.l. the observedelevation changes averaged 15m (Fig. 8). Generally, meltingat lower elevations is higher than in the upper areas; atChorabari, this is not the case, probably due to the thickdebris cover (Fig. 8).
Melt rate and its correlation with debris thicknessThe altitudinal distribution of the ablation area of ChorabariGlacier, which is larger than the accumulation area,extends between 3895 and 5070m. Utilizing 7 years(2003–07) of ablation stake data, the distribution of meltingpatterns was estimated. Most surface ablation was observedbetween 4300 and 4500m, which encompasses areascovered by thin and patchy debris up to 4 cm thick. We
suggest that a thin cover reduces albedo without signifi-cantly introducing an insulating layer at the surface. Themaximum ablation rates occurring at higher altitudes(4500m) were 2.3 and 3.3ma–1 at 4400ma.s.l. wheredebris layer thickness was �2 cm (Fig. 9a). The meltingdecreased with greater debris thickness and was 1.6ma–1
at 4120ma.s.l., where the debris thickness was 20 cm, and0.75ma–1 at 4000ma.s.l. with debris thickness of 53 cm(Fig. 9a). In order to evaluate the influence of debris coveron melting, nine stakes (between 4300 and 4400ma.s.l.)within a 200m2 area at locations that were debris-free orhad thick (20–50 cm) or thin (1–2 cm) debris cover weremonitored from 10 June to 30 July 2010 (50 days). Themelting obtained for the thick debris-covered surface was0.8 cmd–1 and for the debris-free surface and thin debriscover was 2.5 and 3.3 cmd–1, respectively. Thus, it isobserved that melting reduces substantially with increased
Fig. 7. Specific mass balance versus elevation (2003/04 to 2009/10) and area distribution of Chorabari Glacier derived from fieldmeasurements (stakes and pits). Between 4200 and 4500ma.s.l. the glacier experiences high ablation (less debris cover) compared withlower areas (3800–4200ma.s.l.; thick debris cover).
Table 4. Net mass balance, specific balance, ELA and AAR ofChorabari Glacier for the period 2003/04 to 2009/10
Year Net balance Specific balance ELA AAR
106m3w.e. a–1 mw.e. a–1 m
2003/04 –4.57 –0.74 5055 0.452004/05 –4.90 –0.79 5055 0.452005/06 –4.97 –0.82 5070 0.442006/07 –4.50 –0.75 5070 0.442007/08 –3.90 –0.67 5075 0.442008/09 –4.00 –0.67 5075 0.442009/10 –3.93 –0.65 5070 0.44
Average –4.40 –0.73 5067 0.44 Fig. 8. Total thickness changes at different altitude bands between2003 and 2010.
Dobhal and others: Terminus retreat and mass change of Chorabari Glacier 967

debris thickness. Melting in the ablation zone of ChorabariGlacier is greatest in the upper and terminus ablation areaswhere the glacier surface is thinly covered or is free ofdebris. An exponential relationship between surface melt-ing and debris thickness shows a good correlation(R2 = 0.93) (Fig. 9b). It is postulated that the presence ofsupraglacial debris strongly influences glacier ablation,given otherwise similar conditions.
Our study covers an area where the number of debris-covered glaciers is high, yet very little attention has beenpaid to determining the influence of debris cover on glaciermelting or terminus retreat. Our data indicate that a thickdebris cover retards melting by shielding and insulating theglacier surface.
DISCUSSION AND CONCLUSIONGlaciers worldwide are excellent climate indicators and aretherefore symbols for climate change. It has been speculatedthat the Himalayan glaciers are retreating faster than glaciersin other regions of the world (Cruz and others, 2007). Owingto the large geographical extent of the Himalayan mountainsand regional differences in climate and topography, wecannot generalize about the state of retreat or advance of thewhole system. Very few field-based measurements of glacierrecession have been carried out in the Himalaya. Forinstance, of the nearly 10 000 glaciers in the Indian Hima-laya, only 11 have been studied in detail for mass balanceand little more than 100 glaciers are being monitored forterminus fluctuations (Dobhal and others, 2008; Bhambri
and others, 2011). There are many debris-covered glaciersthat are retreating relatively slowly, such as Dunagiri(3.0ma–1), Shankulpa (6.8ma–1) and Bhagirathi Kharak(1.5ma–1), but many others are retreating at faster rates ofup to 25ma–1 (Vohra, 1981; Swaroop and others, 2001;Nainwal and others, 2008; Raina and Srivastava, 2008).These variations in frontal recession may or may not reflectchanges in mass, the critical parameter for long-term glacierhealth. Lack of data on volume change and ice thickness instudies in the Himalaya has hampered proper evaluation ofglacier mass change in the region.
The present study of terminus, area, volume and averagethickness changes by field measurement indicates thatChorabari Glacier has retreated at 6.4ma–1 (1962–2003)and 9.3m a–1 (2003–10), leading to a total area lossequivalent to �11% of its surface area during 1962–2010.However, during the later study period of 2003–10, theglacier surface lowered at �2ma–1 in the ablation zone. Themass-balance measurement over the 7 year period indicatesa negative balance ranging between –4.97�106m3w.e. in2005/06 and –3.9� 106m3w.e. in 2007/08. The average netmass balance of the glacier over the 7 years (2003/04 to2009/10) was estimated to be �–4.4�106m3w.e. a–1 withspecific balance –0.73mw.e. a–1. The cumulative surfacemass loss of 30.8�106m3w.e. over the 7 years is significant.
We suggest that the ice volume change due to melting isprobably greater than earlier estimated solely from terminusposition measurements. The enhanced glacier shrinkage inthe higher area of Chorabari Glacier is closely related toclimate change. The regional climate is mainly controlled by
Fig. 9. (a) Relationship between debris thickness and ice melting along the centre line of Chorabari Glacier (4500ma.s.l.) during observationperiods between 2003 and 2010. (b) Relationship between debris thickness and annual melting. Observation made from 10 June to 30 July2010 (50 days).
Dobhal and others: Terminus retreat and mass change of Chorabari Glacier968

the south Asian monsoon in summer and westerlies in winter(Vohra, 1981; Owen and others, 1996; Gupta and others,2003). In general, the terminus recession pattern of ChorabariGlacier shows that there is no uniform frontal retreatobserved during the past few decades. However, the rightmargin of the frontal part of the glacier is almost in a stablecondition (Fig. 5) and the central part is gradually retreating.Similarly, the terminus of the adjoining unnamed glacier(Fig. 2) appears to be in a stationary condition, likely due toits thick debris cover. It is observed that no change hasoccurred in the terminus position of this unnamed glaciersince 1962. However different surface features such asmeltwater ponds, ice cliffs and an undulating surface(suggesting subsurface melting) indicate shrinking ofthe glacier (Fig. 2). Thus, we suggest that consideration ofthe terminus boundary alone can lead to a poor estimateof the net mass loss for debris-covered glaciers.
As noted earlier for Chorabari Glacier, there is significantvariability in melt along the length of the glacier. Theablation rate under 10 cm of debris is roughly one-tenth ofthat for clean ice; for layers >100 cm the ablation becomesnegligible (Mattson and others, 1993; Nakawo and others,1999; Reznichenko and others, 2010). Reznichenko andothers (2010) developed a relationship between debris coverand clean ice for surface melting and found that ice meltedfastest under a 10mm debris cover and less as debristhickness (>5 cm) increased. Similarly, Inoue and Yoshida(1980) and Nakawo and others (1999) found that forKhumbu Glacier, a heavily debris-covered glacier in theNepal Himalaya, the change in terminus position is not agood indicator of mass change.
Across the Himalayan ranges glaciers are wasting atvariable rates. The annual mean net mass balance of studiedglaciers ranges between –0.67 and –2.66� 106m3w.e. a–1
except for Chorabari Glacier (–4.4� 106m3w.e. a–1, presentstudy) (Table 5). Nevertheless, various estimations based onin situ and satellite glacier mass balance in the entire HinduKush–Karakoram–Himalayan (HKKH) region indicate het-erogeneous behaviour (Cogley, 2011; Bolch and others,2012; Gardelle and others, 2012; Kaab and others, 2012).Kaab and others (2012) reported that the specific balanceacross the HKKH glaciers as a whole during 2003–08 was–0.21�0.05 mw.e. a–1 and that thinning rates were0.66� 0.09ma–1 in the Jammu Kashmir region; Gardelleand others (2012) suggest that the specific mass balance ofthe central Karakoram glaciers was positive (0.11� 0.22mw.e. a–1) between 1999 and 2008.
Themagnitude of the mass change (–4.4� 106m3w.e. a–1)for Chorabari Glacier is higher than that of other glaciers inthe region (Table 5). In addition, because of the gradient indebris cover, the higher-elevation areas (with less debris)have lost significantly more mass than the lower regions. Ifthis process continue, the lower part of the glacier mayremain quasi-stagnant while volume loss continues in higherglacier areas. If we assume that the debris-cover profile isrelatively constant, with thin debris (and high melt) below theELA, then a warming climate and a rise in ELA will tend toaffect the higher elevations of these glaciers disproportion-ately. We suggest that current models and estimates based onnon-debris-covered glaciers will lead to uncertainty in massloss in a warming scenario. Although the measured rates arefew in number while the number of debris-covered glaciersin the Himalaya is high, we conclude that monitoring ofterminus position is not sufficient to estimate the loss andgain of ice mass. Studies need to be enhanced withobservations of melt rate at different elevations with theaim of reducing uncertainty in estimates of the future iceresources of this important region.
ACKNOWLEDGEMENTSWe thank Anil K. Gupta, Director, Wadia Institute ofHimalayan Geology (WIHG), Dehra Dun, India, for provid-ing facilities to carry out this work. We also thank Robert A.Spicer and Sridhar Anandakrishanan for discussion andvaluable suggestions. Rakesh Bhambri, Amit Kumar, BhanuThakur and Akshya Verma are acknowledged for help in thefield. We also thank the Department of Science andTechnology, Ministry of Science, New Delhi, India, forfinancial support.
REFERENCESAgeta Y and Higuchi K (1984) Estimation of mass balance
components of a summer-accumulation type glacier in theNepal Himalaya. Geogr. Ann. A, 66(3), 249–255
Bhambri R, Bolch T, Chaujar RK and Kulshreshtha SC (2011)Glacier changes in the Garwal Himalaya, India, from 1968 to2006 based on remote sensing. J. Glaciol., 57(203), 543–556(doi: 10.3189/002214311796905604)
Bishop MP, Bonk R, Kamp U, Jr and Shroder JF, Jr (2001) Terrainanalysis and data modeling for alpine glacier mapping. PolarGeogr., 25(3), 182–201 (doi: 10.1080/10889370109377712)
Bolch T, Buchroithner MF, Kunert A and Camp B (2008) Automateddelineation of debris-covered glaciers based on ASTER data.
Table 5. Annual specific balance and mass loss of Himalayan glaciers in different regions of India
Glacier name Observation period Glacier area Specific balance Netmass balance
Region Source
km2 mw.e. a–1 106m3w.e. a–1
Neh Nar 1975–84 1.25 –0.54 –0.67 Kashmir Raina and Srivastava (2008); Raina (2009)Gara 1974–82 5.19 –0.37 –1.94 Himachal Raina and Srivastava (2008); Raina (2009)Gor Gorang 1976–84 2.02 –0.43 –0.87 Himachal Raina and Srivastava (2008); Raina (2009)Shaune Gorang 1981–91 4.98 –0.40 –2.00 Himachal Raina and Srivastava (2008); Raina (2009)Dunagiri 1984–90 4.39 –0.60 –2.66 Uttarakhand Raina and Srivastava (2008); Raina (2009)Dokriani 1992–2000 7.00 –0.32 –2.25 Uttarakhand Dobhal and others (2008)Chorabari 2003–10 6.60 –0.73 –4.40 Uttarakhand Present studyChangmeKhangpu
1979–83 5.60 –0.27 –1.50 Sikkim Raina and Srivastava (2008); Raina (2009)
Dobhal and others: Terminus retreat and mass change of Chorabari Glacier 969

EARSeL eProc., 403–410 http://web.unbc.ca/�bolch/publica-tions/BolchAl07_EARSeL-iPr.pdf
BolchTand10 others (2012) The state and fate ofHimalayan glaciers.Science, 336(6079), 310–314 (doi: 10.1126/science.1215828)
Bookhagen B and Burbank DW (2010) Toward a completeHimalayan hydrological budget: spatiotemporal distribution ofsnowmelt and rainfall and their impact on river discharge.J. Geophys. Res., 115(F3), F03019 (doi: 10.1029/2009JF001426)
Bozhinskiy AN, Krass MS and Popovnin VV (1986) Role of debriscover in the thermal physics of glaciers. J. Glaciol., 32(111),255–266
Buchroithner MF and Bolch T (2007) An automated method todelineate the ice extension of the debris-covered glaciers at MtEverest based on ASTER imagery. Grazer Schr. Geogr. Raum-forsch. 43, 71–78
Cogley JG (2011) Present and future states of Himalaya andKarakoram glaciers. Ann. Glaciol., 52(59), 69–73 (doi: 10.3189/172756411799096277)
Cruz RV and 9 others (2007) Asia. In Parry ML, Canziani OF,Palutikof JP, Van der Linden PJ and Hanson CE eds. Climatechange 2007: impacts, adaptation and vulnerability. Contri-bution of Working Group II to the Fourth Assessment Report ofthe Intergovernmental Panel on Climate Change. CambridgeUniversity Press, Cambridge, 469–506
Dobhal DP, Gergan JG and Thayyen RJ (2004) Recession andmorphogeometrical changes of Dokriani glacier (1962–1995),Garhwal Himalayas, India. Current Sci., 86(5), 692–696
Dobhal DP, Gergan JT and Thayyen RJ (2008) Mass balance studiesof the Dokriani Glacier from 1992 to 2000, Garhwal Himalaya,India. Bull. Glacier Res., 25, 9–17
Gardelle J, Berthier E and Arnaud Y (2012) Slight mass gain ofKarakoram glaciers in the early 21st century. Nature Geosci.,5(5), 322–325 (doi: 10.1038/ngeo1450)
Gupta AK, Anderson DM and Overpeck JT (2003) Abrupt changesin the Asian southwest monsoon during the Holocene and theirlinks to the North Atlantic Ocean. Nature, 421(6921), 354–357(doi: 10.1038/nature01340)
Higuchi K and Ohata Y (1996) Specific features of snow and iceregime under the conditions of central Asia. In Kotlyakov VM ed.Variation of snow and ice in the past and present on a global andregional scale. (International Hydrological Programme IHP-IV:Project H-41) UNESCO, Paris, 45–51
Inoue J and Yoshida M (1980) Ablation and heat exchange over theKhumbu glacier. Seppyo, J. Jpn. Soc. Snow Ice, 41, Special Issue,26–33
Jackson KM and Fountain AG (2007) Spatial and morphologicalchange on Eliot Glacier, Mount Hood, Oregon, USA. Ann.Glaciol., 46, 222–226 (doi: 10.3189/172756407782871152)
Kaab A, Berthier E, Nuth C, Gardelle J and Arnaud Y (2012)Contrasting patterns of early twenty-first-century glacier masschange in the Himalayas. Nature, 488(7412), 495–498 (doi:10.1038/nature11324)
Kamp U, Byrne M and Bolch T (2011) Glacier fluctuations between1975 and 2008 in the Greater Himalaya Range of Zanskar,southern Ladakh. J. Mt. Sci., 8(3), 374–389 (doi: 10.1007/s11629-011-2007-9)
Kulkarni AV, Rathore BP, Mahajan S and Mathur P (2005) Alarmingretreat of Parbati Glacier, Beas basin, Himachal Pradesh. CurrentSci., 88(11), 1844–1850
Kulkarni AV and 6 others (2007) Glacial retreat in Himalaya usingIndian remote-sensing satellite data. Current Sci., 92(1), 69–74
Lougeay R (1974) Detection of buried glacial and ground ice withthermal infrared remote sensing. In Santeford HS and Smith JLeds. Advanced concepts and techniques in the study of snowand ice resources. National Academy of Sciences, Washington,DC, 487–493
Lundstrom SC, McCafferty AE and Coe JA (1993) Photogrammetricanalysis of 1984–89 surface altitude change of the partiallydebris-covered Eliot Glacier, Mount Hood, Oregon, USA. Ann.Glaciol., 17, 167–170
Mattson LE, Gardner JS and Young GJ (1993) Ablation on debris-covered glaciers: an example from the Rakhiot Glacier, Punjab,Himalaya. IAHS Publ. 218 (Symposium at Kathmandu 1992 –Snow and Glacier Hydrology), 289–296
Mehta M, Dobhal DP and Bisht MPS (2011) Change of TipraGlacier in the Garhwal Himalaya, India, between 1962 and2008. Progr. Phys. Geogr., 35(6), 721–738 (doi: 10.1177/0309133311411760)
Mehta M, Majeed Z, Dobhal DP and Srivastava P (2012)Geomorphological evidences of post-LGM glacial advance-ments in the Himalaya: a study from Chorabari Glacier, GarhwalHimalaya, India. J. Earth Syst. Sci., 121(1), 149–163 (doi:10.1007/s12040-012-0155-0)
Mehta M, Dobhal DP, Pratap B, Verma A, Kumar A and Srivastava D(2013) Glacier changes in Upper Tons River basin, GarhwalHimalaya, Uttarakhand, India. Z. Geomorph., 57(2), 225–244(doi: 10.1127/0372-8854/2012/0095)
Nainwal HC, Negi BDS, Chaudhary M, Sajwan KS and Gaurav A(2008) Temporal changes in rate of recession: evidence fromSatopanth and Bhagirath Kharak Glaciers, Uttarakhand, usingTotal Station Survey. Current Sci., 94(5), 653–660
Nakawo M, Yabuki H and Sakai A (1999) Characteristics ofKhumbu Glacier, Nepal Himalaya: recent changes in thedebris-covered area. Ann. Glaciol., 28, 118–122 (doi:10.3189/172756499781821788)
Østrem G (1965) Problems of dating ice-cored moraines. Geogr.Ann. A, 47(1), 1–38
Østrem G and Brugman M (1991) Glacier mass-balance measure-ments: a manual for field and office work. (NHRI Science Report4) National Hydrology Research Institute, Environment Canada,Saskatoon, Sask.
Owen LA, Derbyshire E, Richardson S, Benn DI, Evans DJA andMitchell WA (1996) The Quaternary glacial history of theLahul Himalaya, northern India. J. Quat. Sci., 11(1), 25–42(doi: 10.1002/(SICI)1099-1417(199601/02)11:1<25::AID-JQS209>3.0.CO;2-K)
Paul F, Huggel C and Kaab A (2004) Combining satellite multi-spectral image data and a digital elevation model for mappingdebris-covered glaciers. Remote Sens. Environ., 89(4), 510–518(doi: 10.1016/j.rse.2003.11.007)
Prasada Raju PVSP and Ghosh S (2003) Role of remote sensing anddigital cartography in sustainable development. Indian Cartogr.,23, 88–95
Raina VK (2009) Himalayan glaciers: a state-of-art review ofglacial studies, glacial retreat and climate change. MoEFDiscussion Paper. Ministry of Environment and Forests, Govern-ment of India/GB Pant Institute of Himalayan Environment andDevelopment, New Delhi/Kosi-Katarmal, Almora http://indiaenvironmentportal.org.in/files/MoEDiscussionPaper.pdf
Raina VK and Srivastava D (2008) Glacier atlas of India. GeologicalSociety of India, Bangalore
Reznichenko N, Davies T, Shulmeister J and McSaveney MJ (2010)Effects of debris on ice-surface melting rates: an experimentalstudy. J. Glaciol., 56(197), 384–394 (doi: 10.3189/002214310792447725)
Scherler D, Bookhagen B and Strecker MR (2011) Spatially variableresponse of Himalayan glaciers to climate change affected bydebris cover. Nature Geosci., 4(3), 156–159 (doi: 10.1038/ngeo1068)
Shukla A, Gupta RP and Arora MK (2009) Estimation of debris coverand its temporal variation using optical satellite sensor data: acase study in Chenab basin, Himalaya. J. Glaciol., 55(191),444–452 (doi: 10.3189/002214309788816632)
Stokes CR, Popovin V, Aleynikov A, Gurney SD and ShahgedanovaM (2007) Recent glacier retreat in the Caucasus Mountains,Russia, and associated increase in supraglacial debris cover andsupra-/proglacial lake development. Ann. Glaciol., 46, 195–203(doi: 10.3189/172756407782871468)
Survey of India (1962) Topographic map of Chorabari Glacier,1 : 50 000 scale; 40m contour interval (planimetric accuracy
Dobhal and others: Terminus retreat and mass change of Chorabari Glacier970

�12.5m and elevation accuracy �6.5m). Survey of India,Dehra Dun
Swaroop S, Oberoi K, Srivastava D and Gautam CK(2001) Recent fluctuations in snout front of Dunagiriand Chaurabari glaciers, Dhauliganga and Mandakini-Alaknanda basins, Chamoli district, Uttar Pradesh. InProceedings of the Symposium on Snow, Ice and Glaciers – aHimalayan Perspective, 9–11 March 1999, Lucknow, India.(Special Publication 53) Geological Survey of India,Lucknow, 77–81
Taschner S and Ranzi R (2002) Comparing the opportunities ofLandsat-TM and ASTER data for monitoring a debris-covered
glacier in the Italian Alps within the GLIMS project. In 22ndInternational Geoscience and Remote Sensing Symposium(IGARSS 2002), 24–28 June 2002, Toronto, Canada. Proceed-ings, Vol. 2. Institute of Electrical and Electronics Engineers,Piscataway, NJ, 1044–1046
Vohra CP (1981) Himalayan glaciers. In Lall JS and Moddie ADeds. The Himalaya: the aspects of change. Oxford UniversityPress, Delhi, 138–151
Wagnon P and 10 others (2007) Four years of mass balance onChhota Shigri Glacier, Himachal Pradesh, India, a new bench-mark glacier in the western Himalaya. J. Glaciol., 53(183),603–611 (doi: 10.3189/002214307784409306)
MS received 28 September 2012 and accepted in revised form 10 June 2013
Dobhal and others: Terminus retreat and mass change of Chorabari Glacier 971