Doping effects of ZrO2 nanoparticles on the superconducting properties of Bi-2212 tapes
Upload
independentCategory
view
3download
0
NANO EXPRESS
Influence of Cobalt Doping on the Physical Propertiesof Zn0.9Cd0.1S Nanoparticles
Sonal Singhal • Amit Kumar Chawla •
Hari Om Gupta • Ramesh Chandra
Received: 10 September 2009 / Accepted: 28 October 2009 / Published online: 17 November 2009
� to the authors 2009
Abstract Zn0.9Cd0.1S nanoparticles doped with 0.005–
0.24 M cobalt have been prepared by co-precipitation
technique in ice bath at 280 K. For the cobalt concentration
[0.18 M, XRD pattern shows unidentified phases along
with Zn0.9Cd0.1S sphalerite phase. For low cobalt concen-
tration (B0.05 M) particle size, dXRD is *3.5 nm, while
for high cobalt concentration ([0.05 M) particle size
decreases abruptly (*2 nm) as detected by XRD. How-
ever, TEM analysis shows the similar particle size
(*3.5 nm) irrespective of the cobalt concentration. Local
strain in the alloyed nanoparticles with cobalt concentra-
tion of 0.18 M increases *46% in comparison to that of
0.05 M. Direct to indirect energy band-gap transition is
obtained when cobalt concentration goes beyond 0.05 M.
A red shift in energy band gap is also observed for both the
cases. Nanoparticles with low cobalt concentrations were
found to have paramagnetic nature with no antiferromag-
netic coupling. A negative Curie–Weiss temperature of
-75 K with antiferromagnetic coupling was obtained for
the high cobalt concentration.
Keywords Cobalt doping � Paramagnetism �Quantum confinement
Introduction
Semiconductor nanoparticles have generated great funda-
mental and technical interests due to novel size-tunable
properties and, consequently, in potential applications as
optoelectronic devices and biomedical tags [1–5]. In the
last two decades, the main efforts have been focused on the
preparation of different colour-emitting binary or core–
shell nanoparticles with different particle sizes [6–9].
However, the tuning of physical and chemical properties by
changing the particle size could cause problems in many
applications, in particular, if unstable small particles (less
than 2 nm) are used [10]. Recent advances have led to the
exploration of tunable optical properties by changing their
constituent stoichiometries in mixed ternary nanoparticles
[11]. The introduction of transition metal (TM) into non-
magnetic semiconductors provide another possible way for
generation of diluted magnetic semiconductors (DMS) [3,
12]. DMS can play a vital role in the field of spintronics
because of its ability to accommodate electron charge and
its spin degrees of freedom into single matter and their
interplay can explore new functionality [13]. There are
contradictory reports on magnetic behaviour of these
materials such as many people have reported presence of
ferromagnetism in DMS systems, whereas some reported
its absence [12–15]. Continuous attempts are being made to
synthesize sulphide nanomaterials with controlled sizes,
shapes, and phase purity by various chemical routes [16–
18]. The advantages of chemical routes over other syn-
thesis methods are: (a) easier control of the oxidation
states, (b) ability to make nanostructures of different sizes
and shapes, (c) relatively cheap. Wang et al. [7] reported
the one-dimensional nanocomposites of CdS/ZnS. Mehta
et al. [18] synthesized the ZnS nanoparticles via facile
CTAB aqueous micellar solution rout. It has been found
S. Singhal � A. K. Chawla � R. Chandra (&)
Nanoscience Laboratory, Institute Instrumentation Center,
Indian Institute of Technology Roorkee, Roorkee 247667, India
e-mail: [email protected]; [email protected]
S. Singhal � H. O. Gupta
Department of Electrical Engineering, Indian Institute
of Technology Roorkee, Roorkee 247667, India
123
Nanoscale Res Lett (2010) 5:323–331
DOI 10.1007/s11671-009-9483-7

that nanocrystals with dopants inside their crystal lattice
can exhibit different properties from those with ones on
their surface [19]. However, experimental data is still
lacking on the fundamental question of whether different
dopant positions inside nanocrystals can affect physical
properties of doped nanocrystals. Homogeneously substi-
tutional doping is one of the most important goals for
achieving novel physical properties in TM-doped nano-
sized semiconductors [20, 21].
In nanoparticles the systematic tuning of their band gap
can be controlled by alloy formation as well as by size
variation. Sung et al. and Yang et al. demonstrated that
for undoped ternary nanoparticles, energy band gap can
be tuned as a function of their composition including
Zn1-xCdxSe [22–24] and CdSe1-xTex [25]. As an II–VI
semiconductor, Zn1-xCdxS is considered to be a promising
host material. Zhong et al. [26] and Bhargava et al. [27]
studies reveal that Mn-doped ZnS nanoparticles show
significant increase in luminescence intensity and is due to
the strong interaction of d electrons of Mn2? with s–p
electrons of the host nanocrystalline Zn. Zielinski et al.
[28] and Seong et al. [29] reported that the sp–d exchange
interactions in Co2?-doped II–VI semiconductors are much
larger than those in the Mn2?-doped counterparts. In this
study, cobalt-doped Zn0.9Cd0.1S alloyed (Zn0.9Cd0.1S: yCo)
nanoparticles with different cobalt doping concentrations
were prepared by the co-precipitation method. With the aid
of structural, magnetic and quantitative analyses, we
demonstrated that the dopants are embedded within the
nanoparticles. The relationship of physical properties of
Zn0.9Cd0.1S: yCo nanoparticles to the doping amount is
explored systematically.
Experimental
Cobalt-doped Zn0.9Cd0.1S alloyed nanoparticles were syn-
thesized using the co-precipitation method without capping
ligand or surfactant. Requisite amounts of 0.5 M zinc
nitrate, 0.05 M cadmium nitrate and appropriate molar
amount of cobalt nitrate aqueous solution were mixed
thoroughly. 0.5 M sodium sulphide aqueous solution was
added into the above mixture drop by drop along with
continuous stirring at 280 K in ice bath. The particles were
then centrifuged, rinsed with distilled water and dried in a
hot air oven at 320 K. A series of Zn0.9Cd0.1S alloyed
nanoparticles doped with cobalt concentrations of 0.0,
0.005, 0.01, 0.015, 0.025, 0.05, 0.12, 0.18 and 0.24 M were
prepared. Doping concentrations of cobalt were determined
by Electron Probe Micro Analyzer (Cameca SX 100). The
particle size, shape and orientations of the nanoparticles
were determined by transmission electron microscope (FEI
TECNAI-G2). X-ray analysis was performed using a
Bruker D8 Advance diffractometer with Cu Ka target
(k = 1.54056 A) radiation. Optical absorption was mea-
sured in the 200–800 nm wavelength range using UV–Vis–
NIR spectrophotometer (Varian Cary 5000). Magnetic
measurements were taken with superconducting quantum
interference device (SQUID) magnetometer (QD MPMS-
XL).
Results and Discussions
Determination of phase composition, structure and particle
size are very important for the discussions on the physical
properties. EPMA analysis determines the cobalt concen-
tration in the doped nanoparticles. Obtained cobalt values
(y) in molar amount are found lower than the cobalt con-
centrations in the starting solution for all the samples and
are shown in Table 1. Figure 1 shows the XRD patterns of
the Zn0.9Cd0.1S: yCo alloyed nanoparticles. Broad diffrac-
tion peaks in all the patterns were in agreement with the
characteristics of nanosized materials. It can be seen that
the nanoparticles with cobalt concentration (B0.18 M)
exhibited a sphalerite structure with (111), (220) and (311)
orientations, which was consistent with the result that ZnS
exist in sphalerite structure at low temperature [27, 30].
However, the (111) diffraction peak of undoped sample
i.e., Zn0.9Cd0.1S shifted to a lower angle from 28.6� to
28.45� from the standard Sphalerite structure of ZnS [31].
This shift towards lower angle is believed to result from the
incorporation of Cd ions into the ZnS lattice, and the larger
ionic radius of Cd2? as compared to that of Zn2? (Cd2?:
0.97 A, Zn2?: 0.74 A). Crystallite size was estimated from
the full width at half maximum of the major XRD peak
using the Scherrer equation [32]. Here, we found that for
Zn0.9Cd0.1S: yCo samples the calculated average size is
*3.5 nm when the cobalt concentration in nanoparticles is
less than or equal to 0.05 M. For the sample with cobalt
concentration of 0.18 M, the average particle size decrea-
ses abruptly to *2 nm. Cobalt concentration greater than
0.18 M produces a greater amount of distortion in the
lattice and the XRD pattern shows unidentified phases
along with Zn0.9Cd0.1S sphalerite phase. In order to find out
the extent of strain that have been induced in the lattice due
to cobalt incorporation, strain analysis has also been carried
out. Local strain is calculated by making use of Scherrer
formula of Dk versus k (the scattering vector k = (4p/
k)Sinh) [33]. The three peaks of (111), (220) and (311)
were fitted linearly to obtain the local strain values. Cal-
culated values of local strain are shown in Table 1. On the
left axis of Fig. 2, local strain values are shown with var-
iation in molar cobalt concentration. It can be seen that the
crystallinity of doped nanoparticles (see Fig. 1) is fairly
good as the local strain values are smaller when the cobalt
324 Nanoscale Res Lett (2010) 5:323–331
123

concentration in the nanoparticles is less than 0.12 M.
Increasing cobalt concentration up to 0.18 M caused the
abrupt rise in local strain values, giving rise to large dis-
tortion in the lattice and thus degrades the crystallinity. At
cobalt concentration of 0.24 M, it was not possible to
calculate the strain values, as the XRD spectra shows the
unidentified orientation along with the (111), (220) and
(311) orientations. It can also be observed from Fig. 1 that
there is a slight shift in the XRD peak position towards
higher angles with increase in cobalt concentration,
resulting in change in the lattice constant. On the right axis
of Fig. 2, lattice constant of Zn0.9Cd0.1S: yCo nanoparticles
for different cobalt concentrations are shown. Lattice
constants decrease with increase in the cobalt concentra-
tion. Singh et al. [14] have reported the similar dependence
of the lattice constant on cobalt doping in ZnO matrix.
Moreover, this also reflects that Co2? ions were substituted
without changing the sphalerite structure. This is quite
expected as the ionic radii of the Co2? in the tetrahedral
coordination are nearly the same as that of zinc site [14].
As a result the unit cell parameters do not vary signifi-
cantly with increase in doping concentration. The same is
observed in Fig. 2 for the ones (cobalt concentration B
0.05 M) having lower local strain. From Fig. 2, it is also
observed that the lattice constant of doped nanoparticles
does not vary significantly where the local strain values are
lower. However, lattice constant suffers a sudden change
when cobalt concentration is greater than 0.05 M, reason
for this sudden change in lattice constant can again be
attributed to the elevated local strain induced by large
amount of cobalt doping.
The particle size, shape and orientation of the cobalt-
doped Zn0.9Cd0.1S nanoparticles were also determined by
transmission electron microscopy. Electron diffraction
pattern at different regions on the TEM grid for each
sample were taken. We did not find any other diffraction
rings that cannot be indexed by sphalerite structure. Fig-
ure 3a and c shows the TEM image for the nanoparticles
with cobalt concentrations of 0.05 and 0.18 M,
respectively. TEM images shows nearly spherical particles
and having average particle size of *3.5 nm for both the
samples. Figure 3b and d shows the selected area electron
Table 1 Cobalt molar
concentrations in starting
solution, y analysed from
EPMA, average particle size,
local strain, lattice constant as
obtained by XRD, and energy
band gap as determined by
UV–Vis measurements
Molar Cobalt
in starting solution
y of Zn1-x
CdxS: yCo
dXRD
(nm)
Local
strain
Lattice constant
(A)
Band gap
(eV)
0.005 0.0045 3.8 0.0425 5.391 3.81
0.010 0.0077 3.8 0.0428 5.387 3.76
0.015 0.0091 3.6 0.0432 5.384 3.71
0.025 0.0122 3.5 0.0524 5.376 3.66
0.050 0.0202 3.1 0.0876 5.364 3.60
0.12 0.04 2.2 0.1012 5.38 3.29
0.18 0.078 2.0 0.128 5.33 3.09
0.24 Unknown phase appeared
10 20 30 40 50 60
(311)(220)
*
* Unknown phase
0.24 M
0.18 M0.12 M0.05 M
0.025 M0.015 M
0.01 M0.005 M
Inte
nsi
ty (
a.u
.)
2 Theta (Degree)
Undoped
(111)
Fig. 1 X-ray diffraction patterns of Zn0.9Cd0.1S: yCo (undoped, 0.005,
0.01, 0.015, 0.025, 0.05, 0.12, 0.18 and 0.24 M) nanoparticles
0.00 0.05 0.10 0.15 0.20
0.04
0.06
0.08
0.10
0.12
0.14
Molar Cobalt Concentration
Lo
cal S
trai
n
5.32
5.34
5.36
5.38
5.40
5.42
Lattice co
nstan
t (Å)
Fig. 2 Variation in local strain and lattice constant with cobalt
concentration in Zn0.9Cd0.1S: yCo (0.005, 0.01, 0.015, 0.025, 0.05,
0.12 and 0.18 M) nanoparticles
Nanoscale Res Lett (2010) 5:323–331 325
123
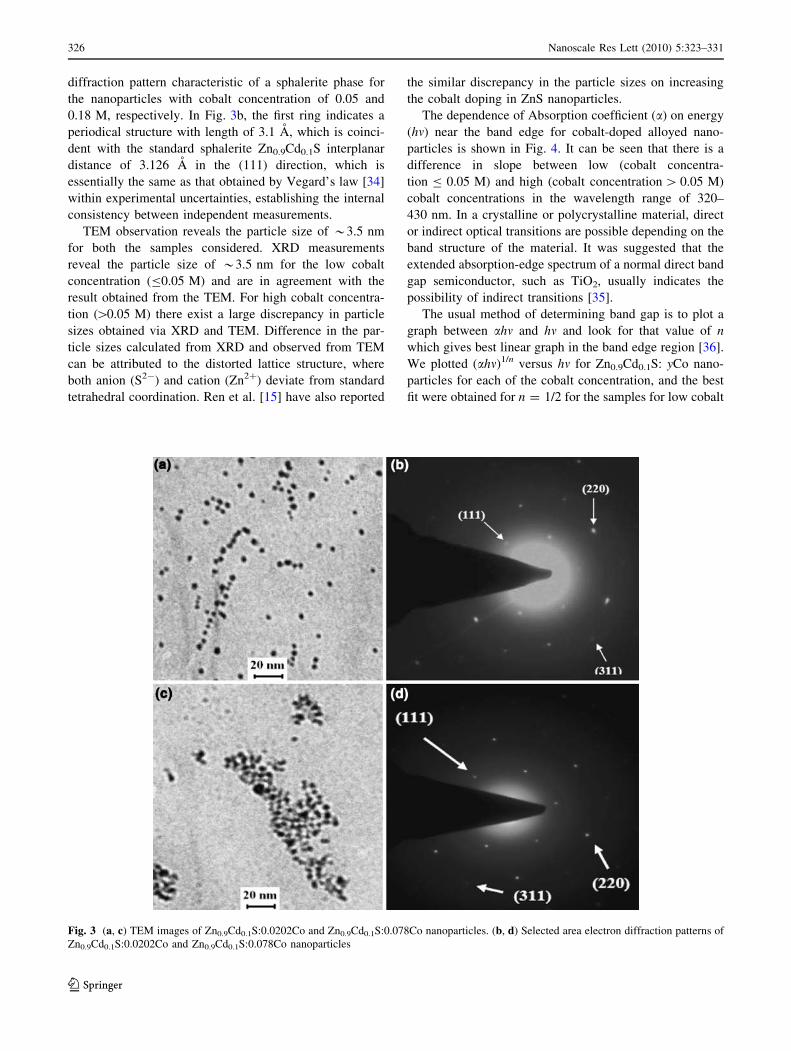
diffraction pattern characteristic of a sphalerite phase for
the nanoparticles with cobalt concentration of 0.05 and
0.18 M, respectively. In Fig. 3b, the first ring indicates a
periodical structure with length of 3.1 A, which is coinci-
dent with the standard sphalerite Zn0.9Cd0.1S interplanar
distance of 3.126 A in the (111) direction, which is
essentially the same as that obtained by Vegard’s law [34]
within experimental uncertainties, establishing the internal
consistency between independent measurements.
TEM observation reveals the particle size of *3.5 nm
for both the samples considered. XRD measurements
reveal the particle size of *3.5 nm for the low cobalt
concentration (B0.05 M) and are in agreement with the
result obtained from the TEM. For high cobalt concentra-
tion ([0.05 M) there exist a large discrepancy in particle
sizes obtained via XRD and TEM. Difference in the par-
ticle sizes calculated from XRD and observed from TEM
can be attributed to the distorted lattice structure, where
both anion (S2-) and cation (Zn2?) deviate from standard
tetrahedral coordination. Ren et al. [15] have also reported
the similar discrepancy in the particle sizes on increasing
the cobalt doping in ZnS nanoparticles.
The dependence of Absorption coefficient (a) on energy
(hm) near the band edge for cobalt-doped alloyed nano-
particles is shown in Fig. 4. It can be seen that there is a
difference in slope between low (cobalt concentra-
tion B 0.05 M) and high (cobalt concentration [ 0.05 M)
cobalt concentrations in the wavelength range of 320–
430 nm. In a crystalline or polycrystalline material, direct
or indirect optical transitions are possible depending on the
band structure of the material. It was suggested that the
extended absorption-edge spectrum of a normal direct band
gap semiconductor, such as TiO2, usually indicates the
possibility of indirect transitions [35].
The usual method of determining band gap is to plot a
graph between ahm and hm and look for that value of n
which gives best linear graph in the band edge region [36].
We plotted (ahm)1/n versus hm for Zn0.9Cd0.1S: yCo nano-
particles for each of the cobalt concentration, and the best
fit were obtained for n = 1/2 for the samples for low cobalt
Fig. 3 (a, c) TEM images of Zn0.9Cd0.1S:0.0202Co and Zn0.9Cd0.1S:0.078Co nanoparticles. (b, d) Selected area electron diffraction patterns of
Zn0.9Cd0.1S:0.0202Co and Zn0.9Cd0.1S:0.078Co nanoparticles
326 Nanoscale Res Lett (2010) 5:323–331
123

concentration (B0.05 M) indicating a direct transition. For
the high cobalt concentration ([0.05 M) the best fit was
obtained for n = 2, giving an evidence of an indirect
transition. The appearance of change in gradients in the
absorbance spectra at higher cobalt concentration might be
caused by the deviation of lattice structure from undoped
sample.
In the case of alloyed nanoparticles, the band gap
energies are determined by their size and composition i.e.,
quantum confinement effect [37] and alloying effect [34].
In bulk CdS–ZnS alloyed crystals their composition
(x)-dependent band gap energies (Eg(x)) can be expressed
by Vegard’s Law [34]:
Eg xð Þ ¼ Eg ZnSð Þ þ Eg CdSð Þ � Eg ZnSð Þ � b� �
xþ bx2
ð1Þ
where Eg(ZnS) and Eg(CdS) are the band gap energies for
bulk ZnS and CdS, respectively, and b is the bowing
parameter and has the value 0.61 [34, 38]. For Zn1-xCdxS
nanoparticles with particle size of 3.5 nm, Cd composition
of 0.05 M, the band gap energy for the host system i.e.,
Zn0.9Cd0.1S can be calculated using Eq. (1). Brus showed
that semiconductor nanoparticles with a particle radius
significantly smaller than the exciton Bohr radius exhibit
strong size-dependent optical properties due to the strong
quantum confinement effect (QCE) [37]:
Eg ¼ E0g þ
h2
8lR2� 1:8e2
4peRð2Þ
where Eg0 is the energy band gap for the bulk material, R
is the radius of the nanoparticle calculated from XRD data,
1/l = 1/me ? 1/mh (me and mh being the electron and hole
effective masses, respectively), e is the dielectric constant
and e is the electronic charge. Here the electron effective
mass (me), hole effective mass (mh) and dielectric constant
(e) for ZnS are 0.25 m0, 0.51 m0 and 5.2 e0, respectively
[39]. Corresponding values for CdS are 0.19 m0, 0.8 m0 and
5.7 e0 [39]. By substituting these values in Eq. 2, size-
dependent band gap energy value of 4.005 and 2.97 eV for
ZnS and CdS, respectively, are obtained. Therefore, instead
of using 3.6 eV for ZnS and 2.38 eV for CdS [40],
4.005 eV for ZnS nanoparticles and 2.97 eV for CdS
nanoparticles are plugged into Eq. 1 and the resulting
composition (x)-dependent band gap energy of 3.84 eV is
obtained for undoped Zn0.9Cd0.1S alloyed nanoparticles.
Figure 5a shows the direct band gap of the Zn0.9Cd0.1S:
yCo alloyed nanoparticles for the low cobalt concentration
(B0.05 M). The energy band gap for undoped sample
(Eg = 3.87 eV) obtained from UV–Vis measurements was
in agreement with the composition-dependent quantum
confined energy band gap (Eg = 3.84 eV). The direct
energy band gap, 3.81, 3.76, 3.71, 3.66 and 3.60 eV, cor-
responding to cobalt concentrations of 0.005, 0.01, 0.015,
0.025 and 0.05 M, respectively are obtained. Indirect
energy band gap for the high cobalt concentration
([0.05 M) is shown in Fig. 5b. Energy band gap of 3.29
and 3.09 eV is obtained for the cobalt concentrations of
0.12, and 0.18 M. It can also be observed that there is a
decrease in energy band gap values with increase in cobalt
concentration. This red shift of the energy band gap with
increasing cobalt concentration is interpreted as mainly due
to the sp–d exchange interactions between the band elec-
trons and the localized d electrons of the Co2? ions
substituting host ions and is consistent with the reported
results [41], giving an additional evidence of cobalt
substitution.
Figure 6a and b shows the field-dependent magnetiza-
tion (M–H) curves of nanoparticles with cobalt concen-
trations of 0.05 and 0.18 M, respectively, at 5, 50, 100 and
300 K temperatures. The curves show no hysteresis and no
remanence, indicating no ferromagnetism for both the
samples. Kang et al. [42] have reported ferromagnetic
character of cobalt-doped ZnS powder presenting identical
X-ray diffraction patterns but prepared using high tem-
perature route. However, Ren et al. [15] have reported a
paramagnetic behaviour of cobalt-doped ZnS nanoparti-
cles. It can be observed from Fig. 6 that the magnetic
moment (M) increases with increase in external field (H),
typical feature of paramagnetic behaviour. According to
Langevin model of paramagnetism [43], it is a system
where localized non-interacting electronic magnetic
moments on the atomic sites are randomly oriented as a
result of their thermal energy. From the M–H measure-
ments, it is clear that even at 5 K the sample shows hys-
teresis curve with almost zero coercivity which rules out
the possibility of ferromagnetic ordering. Since thermal
Ab
sorb
ance
(a.
u.)
280 330 380 430 480 530 580
Wavelength (nm)
Co 0.005 M
Co 0.01 M
Co 0.015 M
Co 0.025 M
Co 0.05 M
Co 0.12 M
Co 0.18 M
Fig. 4 Absorption spectra of Zn0.9Cd0.1S: yCo (0.005, 0.01, 0.015,
0.025, 0.05, 0.12 and 0.18 M) nanoparticles
Nanoscale Res Lett (2010) 5:323–331 327
123

agitations are little at 5 K, the Co2? ions can get coupled
antiferromagnetically and thus could give rise to antifer-
romagnetic coupling. For the sake of comparison M–H
measurements of undoped sample were also taken at 5 and
300 K and are shown in Fig. 6c. The pure Zn0.9Cd0.1S
sample exhibited, as expected, a diamagnetic behaviour.
No difference is observed between the magnetizations
measured at 5 and 300 K for the undoped sample.
Temperature dependence of magnetization of nanopar-
ticles with cobalt concentrations of 0.05 and 0.18 M in a
field of 500 Oe are shown in Fig. 7a and b, respectively. It
can be observed from Fig. 7 that both the samples show a
very small magnetic moment for the temperature range
from 300 to 70 K but as the temperature falls below 70 K
3.2 3.4 3.6 3.8 4.0 4.20.0
0.1
0.2
0.3
0.4
0.5
0.025 M
( αh
ν)2
Undoped
0.005 M0.01 M
0.015 M
0.05 M
(a)
2.5 3.0 3.5 4.0 4.50.2
0.4
0.6
0.8
1.0
1.2
(αh
ν )1/
2
hν (eV)
Co 0.12 MCo 0.18 M
(b)
hν (eV)
Fig. 5 a (ahm)2 versus hm plots of Zn0.9Cd0.1S: yCo nanoparticles for
undoped, 0.005, 0.01, 0.015, 0.025 and 0.05 M. b (ahm)1/2 versus hmZn0.9Cd0.1S: yCo nanoparticles for 0.12 and 0.18 M
-80.0k -40.0k 0.0 40.0k 80.0k-1.5
-1.0
-0.5
0.0
0.5
1.0
1.5
Mag
net
ic M
om
ent
M (
emu
/gm
)
External Field H (Oe)
5 K
50 K
100 K
300 K
(a)
-80.0k -40.0k 0.0 40.0k 80.0k
-3
-2
-1
0
1
2
3
Mag
net
ic M
om
ent
M (
emu
/gm
)
5 K50 K200 K300 K
(b)
-80k -40k 0 40k 80k-0.04
-0.02
0.00
0.02
0.04
Mag
net
ic M
om
ent
(em
u/g
m)
5 K
300 K
(c)
External Field H (Oe)
External Field H (Oe)
Fig. 6 Magnetization versus applied magnetic field measured at 5,
50, 100 and 300 K. a 0.05 M cobalt concentration, b 0.18 M cobalt
concentration, c Magnetization versus applied magnetic field for
undoped sample at 5 and 300 K
328 Nanoscale Res Lett (2010) 5:323–331
123

the paramagnetic properties dominates and the magneti-
zation increases. Inset in Fig. 7a and b displayed the
inverse susceptibility (v-1) as a function of temperature
with cobalt concentrations of 0.05 and 0.18 M, respec-
tively. The result is consistent with the Curie–Weiss
equation [43]:
v ¼ C=ðT þ hÞ ð3Þ
where v is the magnetic susceptibility, C is the paramag-
netic Curie constant and h is the Curie–Weiss temperature.
It can be observed from the inset of Fig. 7a that the curve
passes through the origin indicating nanoparticles (with
0.05 M cobalt concentration) are paramagnetic in nature,
giving no evidence for antiferromagnetic coupling. How-
ever, the plot of v-1 versus T (with cobalt concentration of
0.18 M) in the inset of Fig. 7b does not passes through the
origin. Extrapolation of the linear part of this curve gives
an intercepts on the negative temperature axis around
-75 K (Curie–Weiss temperature, h), indicating the anti-
ferromagnetic exchange between cobalt magnetic moments
[15]. The reason for this can be attributed to the increased
number of Co2? ions in the Zn0.9Cd0.1S lattice which gave
fairly possible opportunity to interact. This has also been
verified by plotting the curve between vT and T, where T is
the temperature and is shown in Fig. 8. It can be observed
that vT increases with increasing temperature, a typical
signature of antiferromagnetic behaviour [44].
Bouloudein et al. [44] have considered in their study that
the ferromagnetism in DMS is originated from the
exchange interaction between free delocalized carriers and
the localized d spins of the cobalt ions. Presence of free
carriers is therefore necessary for the appearance of fer-
romagnetism. Free carriers can be induced either by doping
or by defects or by cobalt ions in another oxidation state
like Co3?. Above explanation suggests that our samples
have limited number of impurities or defects, which may
explain the absence of free carriers and consequently the
ferromagnetism.
The most direct and immediate evidence for the alloying
process for undoped Zn0.9Cd0.1S nanoparticles can be
probed from the XRD peak position and the energy band
gap obtained from UV–Vis measurement, found in con-
sistent with the Vegard’s law, indicating the homogeneous
distribution of ZnS and CdS in the alloyed nanocrystals.
We also believe that there is no signature of CoS or other
impurity phases in our samples. XRD does not show any
detectable signal of Co or CoS, which means that the
content of CoS or Co in the samples is at most less than 5%
(5% is the detection limit of XRD). TEM diffraction pat-
tern also supports our argument as we did not find any
other diffraction rings in our TEM diffraction pattern that
0 50 100 150 200 250 300 350
0.0
0.1
0.2
0.3
0.4
0 100 200 3000
4
8
12
χ−−11
(10
5 O
e g
ram
/em
u)
Temperature (K)χ(1
0-4
em
u/O
e g
ram
)
Temperature (K)
(a)
0.0
0.2
0.4
0.6
0.8
1.0
-200 -100 0
0
2
4
6(b)
χ(1
0-4
em
u/O
e g
ram
)
0 50 100 150 200 250 300 350
Temperature (K)
100 200 300
χ−−11
(10
5 O
e g
ram
/em
u)
Temperature (K)
Fig. 7 Temperature-dependent magnetic mass susceptibility mea-
sured under a magnetic field of 500 Oe. Inset: inverse susceptibility as
a function of temperature: a 0.05 M cobalt concentration, b 0.18 M
cobalt concentration
0.0004
0.0005
0.0006
0.0007 (b)
χχT(e
mu
K/O
e g
ram
)
Temperature (K)
0 50 100 150 200 250 300 3500.00015
0.00020
0.00025
0.00030(a)
0 50 100 150 200 250 300 350
Fig. 8 Variation of vT with temperature. a 0.05 M cobalt concen-
tration, b 0.18 M cobalt concentration
Nanoscale Res Lett (2010) 5:323–331 329
123
cannot be indexed by sphalerite structure. Also, if there is
even a trace amount of ferromagnetic Co in the precipi-
tates, the sample will exhibit ferromagnetism. Nanoparti-
cles with low cobalt concentration are paramagnetic at 5 K,
while the nanoparticles with high cobalt concentrations
give rise to antiferromagnetism coupling, but the ferro-
magnetism did not appear at all. This eliminates the pos-
sibility of ferromagnetic cobalt existing in the samples. In
this study, we found that the physical properties of
Zn0.9Cd0.1S: yCo nanoparticles produced at different cobalt
concentration are obviously different. Low cobalt concen-
tration samples (B0.05 M) have less distortion of the
tetrahedral coordination of Co2? ions and direct band
gap absorption, while high cobalt concentration samples
([0.05 M) have more distortion of the tetrahedral coordi-
nation of Co2? and indirect band gap absorption.
Conclusions
In summary, we have presented the synthesis of
Zn0.9Cd0.1S: yCo alloyed nanoparticles from a solution-
based synthetic route. Structural, optical and magnetic
characterizations confirm that the cobalt doping is substi-
tutional for zinc cations in the host lattice. The doping
concentration in the alloyed nanoparticles can be divided
into two distinct regions, low (B0.05 M) and high
([0.05 M) cobalt concentration corresponding to the Co2?
molar percentage in the starting solution. Accordingly the
structural, optical and magnetic properties were found
distinctively different. A red shift in the energy band gap is
found with increasing cobalt concentration. Cobalt-doped
Zn0.9Cd0.1S nanoparticles are found to have paramagnetic
nature for the nanoparticles with cobalt concentration of
0.05 M (low cobalt concentration). Nanoparticles with
cobalt concentration of 0.18 M (high cobalt concentration)
found to have antiferromagnetic coupling with negative
Curie–Weiss temperature of -75 K. These findings have
important implications for the optical and the magnetic
materials, where the physical properties get significantly
affected on increasing the doping.
Acknowledgements One of the authors, Amit Kumar Chawla,
thanks CSIR, New Delhi for the award of research associate. The
financial support by DST [Grant No. SR/S5NM-32/2005] New Delhi
is gratefully acknowledged.
References
1. S.J. Pearton, D.P. Norton, K. Ip, Y.W. Heo, T. Steiner, J. Vac Sci.
Technol. 22, 932 (2004)
2. A.H. Macdonald, P. Shiffer, N. Samarth, Nat. Mater. 4, 195
(2005)
3. H. Ohno, Science 281, 951 (1998)
4. C.Q. Zhu, P. Wang, X. Wang, Y. Li, Nanoscale Res. Lett. 3, 213
(2008)
5. W. Luan, H. Yang, N. Fan, S.T. Tu, Nanoscale Res. Lett. 3, 134
(2008)
6. D. Jiang, L. Cao, G. Su, W. Liu, H. Qu, Y. Sun, B. Dong, Mater.
Chem. Phys. 44, 2792 (2009)
7. L. Wang, H. Wei, Y. Fan, X. Liu, J. Zhan, Nanoscale Res. Lett. 4,
558 (2009)
8. M. Protiere, P. Reiss, Nanoscale Res. Lett. 1, 62 (2006)
9. D. Jiang, L. Cao, W. Liu, G.S.H. Qu, Y. Sun, B. Dong, Nanoscale
Res. Lett. 4, 78 (2009)
10. X. Zhong, Y. Feng, Res. Chem. Intermed. 34, 287 (2008)
11. R. Sethi, L. Kumar, A.C. Pandey, J. Nanosci. Nanotechnol. 9,
1 (2009)
12. R. Sanz, J. Jensen, G.G. Dıaz, O. Martınez, M. Vazquez, M.H.
Velez, Nanoscale Res. Lett. 4, 878 (2009)
13. H. Shi, Y. Duan, Nanoscale Res. Lett. 4, 480 (2009)
14. P. Singh, R.N.G. Deepak, A.K. Pandey, D. Kaur, J. Phys. Con-
dens. Matter. 20, 315005 (2008)
15. G. Ren, Z. Lin, C. Wang, W. Liu, J. Zhang, F. Huang, J. Liang,
Nanotechnology 18, 035705 (2007)
16. C. Yan, J. Liu, F. Liu, J. Wu, K. Gao, D. Xue, Nanoscale Res.
Lett. 3, 473 (2008)
17. H. Peng, B. Liuyang, Y. Lingjie, L. Jinlin, Y. Fangli, C. Yunfa,
Nanoscale Res. Lett. 4, 1047 (2009)
18. S.K. Mehta, S. Kumar, S. Chaudhary, K.K. Bhasin, M. Gradz-
ielski, Nanoscale Res. Lett. 4, 17 (2009)
19. J. Antony, S. Pendyala, A. Sharma, X.B. Chen, J. Morrison,
L. Bergman, Y. Qiang, J. Appl. Phys. 97, 10D307 (2005)
20. P.V. Radovanovic, D.R. Gamelin, J. Am. Chem. Soc. 123, 12207
(2001)
21. F.V. Mikulec, M. Kuno, M. Bennati, D.A. Hall, R.G. Griffin,
M.G. Bawendi, J. Am. Chem. Soc. 122, 2532 (2000)
22. Y.M. Sung, Y.J. Lee, K.S. Park, J. Am. Chem. Soc. 128, 9002
(2006)
23. H. Lee, H. Yang, P.H. Holloway, J. Lumin. 126, 314 (2007)
24. S.A. Santangelo, E.A. Hinds, V.A. Vlaskin, P.I. Archer, D.R.
Gamelin, J. Am. Chem. Soc. 129, 3973 (2007)
25. R.E. Bailey, S.M. Nie, J. Am. Chem. Soc. 125, 7100 (2003)
26. X.H. Zhong, Y.Y. Feng, W. Knoll, M.Y. Han, J. Am. Chem. Soc.
125, 13559 (2003)
27. R.N. Bhargava, D. Gallagher, X. Hong, A. Nurmikko, Phys. Rev.
Lett. 72, 416 (1994)
28. M. Zielinski, C. Rigaux, A. Lemaitrie, A. Mycielskin, Phys. Rev.
B 53, 674 (1996)
29. M.J. Seong, H. Alawadhi, I. Miotkowski, A.K. Ramdas, Phys.
Rev. B 63, 125208 (2001)
30. S.W. Lu, B.I. Lee, Z.L. Wang, W. Tong, B.A. Wagner, W. Park,
C.J. Summmers, J. Lumin. 92, 73 (2001)
31. S. Singhal, A.K. Chawla, H.O. Gupta, R. Chandra, J. Nanopart.
Res. (2009). doi:10.1007/s11051-009-9687-x
32. B.D. Cullity, S.R. Stock, Elements of X-Ray Diffraction, 3rd edn.
(Prentice Hall, Upper Saddle River, 2001), p. 170
33. D. Son, D.R. Jung, J. Kim, T. Moon, C. Kim, B. Park, Appl. Phys.
Lett. 90, 101910 (2007)
34. J. Singh, Optoelectronics an introduction to materials and devi-ces (Macgraw Hill, New Delhi, 1996)
35. R. Zallen, M.P. Moret, Solid State Commun. 137, 154 (2006)
36. J. Tauc (ed.), Amorphous and Liquid Semiconductor (Plenium
Press, New York, 1974), p. 159
37. L.E. Brus, J. Chem. Phys. 80, 4403 (1984)
38. S.M. Sze, Physics of Semiconductor Devices (Wiley, New York,
1969)
39. H. Ohde, M. Ohde, F. Bailey, H. Kim, C.M. Wai, Nano Lett.
2, 721 (2002)
330 Nanoscale Res Lett (2010) 5:323–331
123

40. A. Goudarzi, G.M. Aval, R. Sahrai, H. Ahmadpoor, Thin Solid
Films 516, 4953 (2008)
41. N. Kumbhoikar, V.V. Nikesh, A. Kshirsagar, S. Mahamuni,
J. Appl. Phys. 88, 6260 (2000)
42. T. Kang, J. Sung, W. Shim, H. Moon, J. Cho, Y. Jo, W. Lee, B.
Kim, J. Phys. Chem. C 113, 5352 (2009)
43. B.D. Cullity, C.D. Graham, Introduction to Magnetic Materials(Addison-Wesley, Reading, 1972)
44. M. Bouloudenine, N. Viart, S. Colis, J. Kortus, A. Dinia, Appl.
Phys. Lett. 87, 052501 (2005)
Nanoscale Res Lett (2010) 5:323–331 331
123
Copyright © 2022 FDOKUMEN