
Exploration of Iron and Cobalt Core-Shell Nanoparticles via ...
101
Wright State University Wright State University CORE Scholar CORE Scholar Browse all Theses and Dissertations Theses and Dissertations 2006 Exploration of Iron and Cobalt Core-Shell Nanoparticles via Exploration of Iron and Cobalt Core-Shell Nanoparticles via Thermal and Microwave Polyol Synthesis Thermal and Microwave Polyol Synthesis Hope M. Klukovich Wright State University Follow this and additional works at: https://corescholar.libraries.wright.edu/etd_all Part of the Chemistry Commons Repository Citation Repository Citation Klukovich, Hope M., "Exploration of Iron and Cobalt Core-Shell Nanoparticles via Thermal and Microwave Polyol Synthesis" (2006). Browse all Theses and Dissertations. 54. https://corescholar.libraries.wright.edu/etd_all/54 This Thesis is brought to you for free and open access by the Theses and Dissertations at CORE Scholar. It has been accepted for inclusion in Browse all Theses and Dissertations by an authorized administrator of CORE Scholar. For more information, please contact [email protected].
-
Upload
khangminh22 -
Category
Documents
-
view
0 -
download
0
Transcript of Exploration of Iron and Cobalt Core-Shell Nanoparticles via ...
Wright State University Wright State University
CORE Scholar CORE Scholar
Browse all Theses and Dissertations Theses and Dissertations
2006
Exploration of Iron and Cobalt Core-Shell Nanoparticles via Exploration of Iron and Cobalt Core-Shell Nanoparticles via
Thermal and Microwave Polyol Synthesis Thermal and Microwave Polyol Synthesis
Hope M. Klukovich Wright State University
Follow this and additional works at: https://corescholar.libraries.wright.edu/etd_all
Part of the Chemistry Commons
Repository Citation Repository Citation Klukovich, Hope M., "Exploration of Iron and Cobalt Core-Shell Nanoparticles via Thermal and Microwave Polyol Synthesis" (2006). Browse all Theses and Dissertations. 54. https://corescholar.libraries.wright.edu/etd_all/54
This Thesis is brought to you for free and open access by the Theses and Dissertations at CORE Scholar. It has been accepted for inclusion in Browse all Theses and Dissertations by an authorized administrator of CORE Scholar. For more information, please contact [email protected].

EXPLORATION OF IRON AND COBALT CORE-SHELL NANOPARTICLES VIA THERMAL AND MICROWAVE POLYOL SYNTHESIS
A thesis submitted in partial fulfillment of the requirements for the degree of
Master of Science
By
HOPE MARIE KLUKOVICH B.A., University of Nevada Las Vegas, 2002
2006 Wright State University

ii
WRIGHT STATE UNIVERSITY
SCHOOL OF GRADUATE STUDIES
October 26, 2006
I HEREBY RECOMMEND THAT THE THESIS PREPARED UNDER MY SUPERVISION BY Hope Marie Klukovich ENTITLED Exploration of Iron and Cobalt Core-shell Nanoparticles via Thermal and Microwave Polyol Synthesis BE ACCEPTED IN PARTIAL FULFILLMENT OF THE REQUIREMENTS FOR THE DEGREE OF Master of Science .
______________________________ Eric Fossum, Ph.D. Thesis Director ______________________________ Kenneth Turnbull, Ph.D. Department Chair Committee on Final Examination _________________________________ David A. Grossie, Ph.D. _________________________________ Eric Fossum, Ph.D. _________________________________ Vladomir Katovic, Ph.D. __________________________________ Joseph F. Thomas, Jr. Ph.D. Dean of the School of Graduate Studies

iii
ABSTRACT
Klukovich, Hope Marie M.S., Department of Chemistry, Wright State University, 2006. Exploration of Iron and Cobalt Core-shell Nanoparticles via Thermal and Microwave Polyol Synthesis.
Thermal and microwave polyol methods were investigated in the synthesis of various
iron and cobalt core-shell nanoparticles. The reaction involved 1 mmol of an Fe+2 or Co+2
salt, bis-acetylacetanato [(Acac)2] iron (II), cobalt (Acac)2 or iron (II) acetate along with
1 mmol of a surfactant capping agent. The salt was reduced with 2 mmol of a 1,2 diol.
When 1,2-hexadecanediol solid was used as a reducing agent, it was dissolved along with
the metal salt and capping agent in octyl ether. When 1,2-hexanediol liquid was used as
the reducing agent, it was also the solvent, and octyl ether was eliminated. For reactions
in which octyl ether acted as the solvent, the capped nanoparticles were precipitated using
ethanol. For reactions in which the solvent also acted as the reducing agent, the particles
precipitated after nucleation and supersaturation of the polyol solvent/reducing agent.
The effects of reducing agent, capping agent, and heating mechanism were investigated.
The thermal polyol method was investigated to reproduce published results and compared
against results from the microwave polyol method. Development of a new microwave
polyol method was investigated using solvents with higher dielectric constants than those
used in the thermal polyol method. Products were characterized using FT-IR, and Powder
X-ray Diffraction (XRD) to determine bond breakage and formation and crystal structure.
AFM and TEM were used for some products to determine size and morphology.

iv
TABLE OF CONTENTS
I. INTRODUCTION.......................................................................................................1
1.1 Background/Driving-force for Research.......................................................1
1.2 Nanotechnology ............................................................................................4
1.3 The Polyol Method .......................................................................................9
1.4 Microwave Overview...................................................................................15
1.4.1 Laboratory Use of Microwaves ....................................................16
1.4.2 Specific Microwave Effects..........................................................19
1.5 Microwave Polyol........................................................................................20
1.6 Magnetite (Fe3O4) and Cobalt Ferrite (CoFe2O4) ........................................22
II. EXPERIMENTAL PROCEDURES .........................................................................27
2.1 X-Ray Powder Diffraction (XRD)...............................................................27
2.2 Transmission Electron Microscopy (TEM) .................................................28
2.3 Atomic Force Microscopy (AFM)...............................................................29
2.4 Fourier Transform Infrared (FT-IR) Spectroscopy......................................30
2.5 Thermal Polyol Reactions............................................................................30
2.6 Microwave Polyol Reactions .......................................................................32
III RESULTS AND DISCUSSION...............................................................................34
3.1 Research Overview ......................................................................................34
3.2 Thermal Polyol Core-shell Nanoparticle Synthesis.....................................36

v
3.3 Fe0 Core-shell Nanoparticle Synthesis Attempts: Thermal and Microwave ..............................................................................41
3.3.1 Capping Agent Concentration Investigation of Fe0 Thermal Polyol Method ..................................................................................................44 3.3.2 Iron Oxidation State Investigation via Thermal Polyol Method...47
3.3.3 Microwave Synthesis Attempt of Fe0 Core-shell Nanoparticles ..50 3.3.4 Solvent/Reducing Agent Investigation (1,2-hexanediol)..............54 3.3.5 Solvent/Reducing Agent Investigation (Polyethylene Glycol MW 600 g/mol) .............................................................................................59 3.3.6 Microwave Magnetite Synthesis With 1,2-hexanediol and Oleylamine Co-capping Agent ..............................................................63
3.4 Microwave Time Investigation ....................................................................70
3.4.1 TEM Size Comparison of Microwave Time Study ......................71
3.5 Microwave Polyol Co0 Core-shell Nanoparticle Synthesis Attempt ...........73
3.6 Thermal and Microwave Investigation of Cobalt Co-reactant ....................76
3.6.1 Microwave Polyol CoFe2O4 Core-shell Nanoparticle Synthesis ..78
IV CONCLUSIONS AND FUTURE WORK...............................................................82
V REFERENCES...........................................................................................................85
vi
LIST OF FIGURES
Figure Page
1. Figure 1.1 2,6-ditertiary butyl-4-methyl phenol ..................................................4
2. Figure 1.2 Common capping agents used in metal nanoparticle syntheses .........6 3. Figure 1.3 Structures of M+2 complexes with acetylacetonate and acetate ligands investigated in the polyol process ...........................................................10
4. Figure 1.4 Schematic of magnetite core-shell nanoparticle (top) and crystal lattice structure of magnetite61 (bottom) ..............................................................23
5. Figure 3.1 FT-IR spectrum from thermal magnetite core-shell nanoparticle product (top) and of oleic acid alone (bottom) ....................................................38 6. Figure 3.2 XRD pattern from thermal polyol magnetite core-shell nanoparticle
product (top) and ICDD database diffraction pattern of Fe3O4 with labeled Miller-index planes (bottom) ..........................................................................................40
7. Figure 3.3 FT-IR spectrum of thermal polyol Fe0 core-shell nanoparticle
product .................................................................................................................42
8. Figure 3.4 XRD pattern from thermal polyol Fe0 core-shell nanoparticle product with labeled Miller-index plane ...........................................................................43
9. Figure 3.5 FT-IR spectra comparison of different capping agent concentration
products prepared by thermal polyol Fe0 core-shell nanoparticle synthesis .......45 10. Figure 3.6 XRD pattern from three different capping agent concentration
products prepared by thermal polyol Fe0 core-shell nanoparticle synthesis .......46 11. Figure 3.7 FT-IR spectrum of the thermal polyol Fe0 core-shell nanoparticle
product prepared with FeBr3 ...............................................................................48 12. Figure 3.8 XRD pattern from thermal polyol Fe0 core-shell nanoparticle product
prepared with FeBr3.............................................................................................49
vii
LIST OF FIGURES (CONTINUED)
Figure Page
13. Figure 3.9 FT-IR spectrum of the microwave polyol Fe0 core-shell nanoparticle Product ................................................................................................................51 14. Figure 3.10 XRD pattern of microwave polyol Fe0 core-shell nanoparticle
product.................................................................................................................52 15. Figure 3.11 TEM image of particles produced from microwave polyol Fe0 core-shell nanoparticle synthesis .........................................................................53 16. Figure 3.12 FT-IR spectrum of the microwave polyol Fe0 core-shell nanoparticle
synthesis product prepared with 1,2-hexanediol...................................................55 17. Figure 3.13 XRD pattern from microwave polyol Fe0 core-shell nanoparticle
synthesis product prepared with 1,2-hexanediol .................................................56 18. Figure 3.14 TEM image of particles produced from microwave polyol Fe0
synthesis prepared with 1,2-hexanediol ..............................................................58 19. Figure 3.15 FT-IR spectrum of microwave polyol Fe0 core-shell nanoparticle
synthesis product prepared with PEG .................................................................60 20. Figure 3.16 XRD pattern of microwave polyol Fe0 core-shell nanoparticle
product prepared with PEG .................................................................................61 21. Figure 3.17 TEM image of particles produced from microwave polyol Fe0 iron
core-shell nanoparticle synthesis prepared with PEG .........................................62 22. Figure 3.18 (top) FT-IR spectrum of oleylamine and (bottom) FT-IR spectrum
from microwave polyol core-shell magnetite nanoparticle synthesis product prepared with 1,2-hexanediol and oleylamine co-capping agent ........................65
23. Figure 3.19 XRD pattern from microwave polyol magnetite core-shell
nanoparticle synthesis product prepared with 1,2-hexanediol and oleylamine co-capping agent.......................................................................................................66
24. Figure 3.20 Two AFM images of particles prepared via microwave polyol
magnetite core-shell nanoparticle synthesis with 1,2-hexanediol and oleylamine co-capping agent..................................................................................................68

viii
LIST OF FIGURES (CONTINUED) Figure Page 25. Figure 3.21 TEM image of particles prepared via microwave polyol magnetite
core-shell nanoparticle synthesis with 1,2-hexanediol and oleylamine co-capping agent ....................................................................................................................69
26. Figure 3.22 FT-IR spectra comparison of three different microwave reaction
times ....................................................................................................................71 27. Figure 3.23 TEM image of 10 min microwave reaction ....................................72
28. Figure 3.24 TEM image of 50 min microwave reaction ....................................72 29. Figure 3.25 XRD pattern of product from microwave polyol Co0 core-shell
nanoparticle synthesis..........................................................................................74 30. Figure 3.26 TEM image of particles produced from microwave polyol Co0 core-
shell nanoparticle synthesis .................................................................................75 31. Figure 3.27 XRD pattern of product from ambient thermal polyol CoFe2O4 core-
shell nanoparticle synthesis with labeled Miller-index planes............................77 32. Figure 3.28 XRD pattern of product from oxygen-free thermal polyol CoFe2O4
core-shell nanoparticle synthesis with labeled Miller-index planes....................78 33. Figure 3.29 XRD pattern of the product from microwave polyol CoFe2O4 core-
shell nanoparticle synthesis .................................................................................80 34. Figure 3.30 TEM image of particles produced from microwave polyol CoFe2O4 core-shell nanoparticle synthesis ………………………………………………81
ix
LIST OF SCHEMES Scheme Page
1. Scheme 1.1 Bonding of the organic acid to the nanoparticle surface ................8
2. Scheme 1.2 Proposed metal reduction mechanism ...........................................11
3. Scheme 1.3 Mechanism of metal core-shell formation and precipitation from corresponding metal salt Ms...............................................................................12
4. Scheme 3.1 Proposed metal reduction mechanism for diols and metals
investigated ........................................................................................................35
x
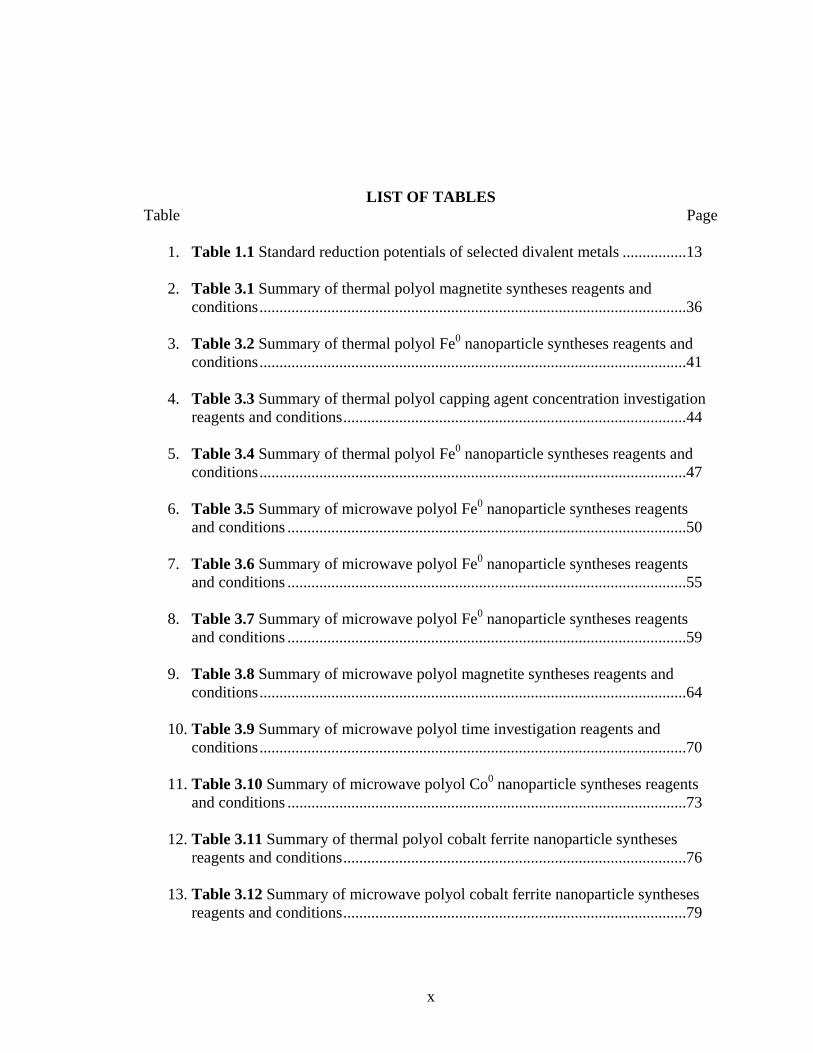
LIST OF TABLES Table Page
1. Table 1.1 Standard reduction potentials of selected divalent metals ................13
2. Table 3.1 Summary of thermal polyol magnetite syntheses reagents and conditions...........................................................................................................36
3. Table 3.2 Summary of thermal polyol Fe0 nanoparticle syntheses reagents and
conditions...........................................................................................................41
4. Table 3.3 Summary of thermal polyol capping agent concentration investigation reagents and conditions......................................................................................44
5. Table 3.4 Summary of thermal polyol Fe0 nanoparticle syntheses reagents and
conditions...........................................................................................................47
6. Table 3.5 Summary of microwave polyol Fe0 nanoparticle syntheses reagents and conditions ....................................................................................................50
7. Table 3.6 Summary of microwave polyol Fe0 nanoparticle syntheses reagents and conditions ....................................................................................................55
8. Table 3.7 Summary of microwave polyol Fe0 nanoparticle syntheses reagents and conditions ....................................................................................................59
9. Table 3.8 Summary of microwave polyol magnetite syntheses reagents and conditions...........................................................................................................64
10. Table 3.9 Summary of microwave polyol time investigation reagents and
conditions...........................................................................................................70
11. Table 3.10 Summary of microwave polyol Co0 nanoparticle syntheses reagents and conditions ....................................................................................................73
12. Table 3.11 Summary of thermal polyol cobalt ferrite nanoparticle syntheses
reagents and conditions......................................................................................76
13. Table 3.12 Summary of microwave polyol cobalt ferrite nanoparticle syntheses reagents and conditions......................................................................................79

xii
ACKNOWLEDGMENTS
I would like to thank Dr. Eric Fossum, Department of Chemistry, Wright State
University, Dayton, Ohio, for his patience and guidance through this masters program.
He taught me more than I could have asked for about writing and even more about
organic chemistry. I would also like to thank Dr. Vladimir Katovic and Dr. David Grossie
for teaching me more than an organic chemist should know about inorganic chemistry.
The learning experience of my masters thesis would not have been complete without their
direction.
Great thanks also goes to my loving husband Steve. Without him complaining
about ROTC, I would have thought I had it worse than I did. Thank you for always
believing in me. I would also like to thank my mom and dad for being the better parents
than I was a kid. Dad, we miss you.
A special thanks goes to the United States Air Force for giving me the opportunity
to pursue my masters degree. Bill Harrison was instrumental in allowing the time and
money needed to complete this program. Dr. Chris Bunker and Dr. Elena Guliants
provided the best research project and environment I could have hoped for. Last but not
least, Barbra Harruff, Ryan Schwarb and Kyle Novak helped keep me sane and focused.

1
I. INTRODUCTION
1.1 Background/Driving-force for Research
Turbine engines convert the kinetic energy from a moving fluid into mechanical
energy by using the motion of the fluid to turn the fan blades of a rotor. The rotor is
connected to a device that does useful work in that it powers the aircraft forward.1 the
fluid that jet engines use is a hot, pressurized gas produced by the combustion of jet fuel.
When the gas escapes from the engine it drives a turbine that drives a compressor that
compresses the air entering the engine.1 By way of Newton’s third law, when the hot
compressed gas leaves the turbine engine at a high velocity it propels the jet in the
opposite direction of the escaping gas.
Jet fuel is an essential component for the combustion process. Current technology
does not allow for the complete separation of all the different hydrocarbons found in
aviation fuel; by some estimates there are over a thousand. These hydrocarbons are
mainly paraffins and aromatics. Based on the concentrations of the different components,
the fuel has different thermodynamic properties. For a fuel that contains mostly
aromatics, the density will be higher and the energy content by weight will be increased
relative to one that contains mostly paraffins or naphthalene.1
Different types of aviation fuel contain numerous ranges of carbon numbers and
molecular weights associated with the hydrocarbons. JP-8 is the grade of fuel most
commonly used by the Air Force for their aircraft. JP-8 is almost completely kerosene
with a ∆Hcomb of about -46.3kJ/g. This value can only be obtained experimentally due to
2
the highly complex mixture of hydrocarbons. The amount of heat released per gram of
fuel is very important because jets have strict weight limits to maintain. The more energy
they can get per unit of weight the better. One of the most desirable properties a jet fuel
can possess is a low carbon number. A low carbon number jet fuel equates to less weight,
and therefore the jet can carry a heavier payload. In kerosene based fuels the carbon
number ranges from about 8 to 16.1 Different specifications for jet fuels such as freeze
point (for high altitude), smoke point, or naphthalene concentration aid in determining the
carbon number of the fuel.1 The main way of separating the different carbon numbers is
based on the boiling point of the liquid as the boiling point is directly related to molecular
weight.
In the commercial aviation arena, the jet fuel that is used is called Jet-A. On the
military side of aviation the fuel used starts out as Jet-A, but an additive package
specifically tailored to military flying missions is added. This additive package changes
the fuel from Jet-A to JP-8. The additives are normally petroleum based and their
chemistries are highly specialized.1They are added in very small amounts; in the ppm
range. The additives typically found in JP-8 are an antioxidant, an electrical
conductivity/static dissipater, a corrosion inhibitor, and an ice inhibitor.1 There is a more
specialized type of JP-8 used in military aircraft known as JP-8 +100. The +100
designation denotes that the thermal stability additive has been added to increase the
thermal stability of the fuel by about 1000C.1 The JP-8 +100 fuel is mostly used for high
altitude and high mach missions such as those of the SCRAMJET aircraft. These types of
high stress missions require a fuel with a higher thermal stability.

3
Thermal stability is a measure of the amount of heat stress a fuel can withstand
before it begins to do damage to the aircraft. Thermal instability leads to the formation of
materials such as peroxides, soluble gums and insoluble particulate matter that can coat
the inside surfaces of an engine. Not much is known about these instability reactions.
However, it is believed that most of them are multi-step oxidation reactions. The
reactants are thought to be sulfur and nitrogen containing compounds as well as organic
acids and reactive olefins.1 Trace contaminant metals may act as catalysts for these
reactions.
In addition to powering the engine through combustion, fuel also acts as a heat
sink for the heat generated by the aircraft’s engine and other moving parts. Because an
aircraft does not have a radiator like a car, the fuel is used to remove the potentially
damaging heat by acting as a heat exchange medium. The heating of the fuel can initiate
reactions that can leave harmful deposits on the inside of the engine.1 Thus, the issue of
thermal stability becomes an important and limiting factor for aircraft.
It is difficult to measure thermal stability because it is an intangible parameter.
There are many indirect ways of measuring thermal stability such as smoke point and,
more commonly, freeze point. There is a strong correlation with lowering the freeze point
of the fuel and increasing the thermal stability. Differential scanning calorimetry (DSC)
has been used to investigate thermal stability by studying phase transitions and transition
enthalpies.2
Dissolved oxygen in fuel decreases thermal stability because it triggers a chain of
oxidation reactions, which produce harmful build up on engine parts such as the fuel
nozzle. If the fuel nozzle becomes clogged, it becomes difficult to create the correct
4
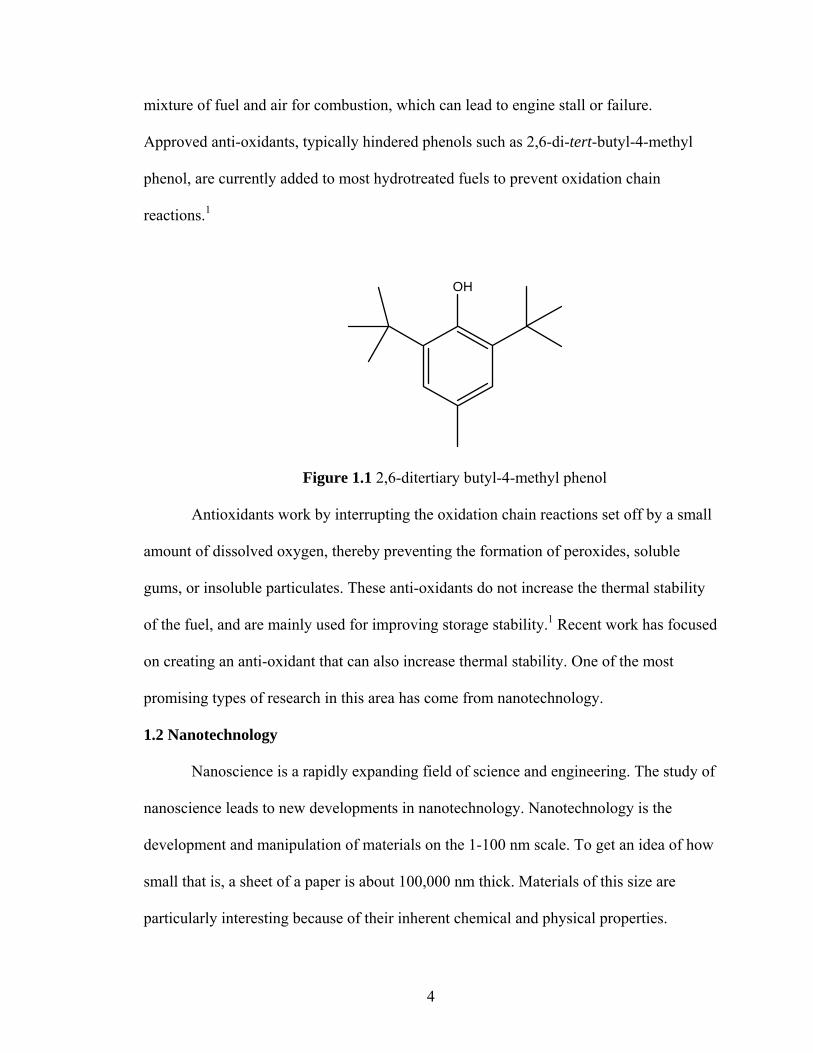
mixture of fuel and air for combustion, which can lead to engine stall or failure.
Approved anti-oxidants, typically hindered phenols such as 2,6-di-tert-butyl-4-methyl
phenol, are currently added to most hydrotreated fuels to prevent oxidation chain
reactions.1
OH
Figure 1.1 2,6-ditertiary butyl-4-methyl phenol
Antioxidants work by interrupting the oxidation chain reactions set off by a small
amount of dissolved oxygen, thereby preventing the formation of peroxides, soluble
gums, or insoluble particulates. These anti-oxidants do not increase the thermal stability
of the fuel, and are mainly used for improving storage stability.1 Recent work has focused
on creating an anti-oxidant that can also increase thermal stability. One of the most
promising types of research in this area has come from nanotechnology.
1.2 Nanotechnology
Nanoscience is a rapidly expanding field of science and engineering. The study of
nanoscience leads to new developments in nanotechnology. Nanotechnology is the
development and manipulation of materials on the 1-100 nm scale. To get an idea of how
small that is, a sheet of a paper is about 100,000 nm thick. Materials of this size are
particularly interesting because of their inherent chemical and physical properties.
5
Because of a high surface-to-volume ratio, nanoparticles are very sensitive to surface
environments. The aim of nanotechnology is to better understand these properties and
find new ways of utilizing them.
The relatively new field of nanotechnology is attempting to solve the problems
associated with dissolved oxygen in jet fuel. Nanomaterials have been the focus of a great
deal of study because they possess interesting optical, electrical, magnetic and chemical
properties.3 These interesting properties are attributed to the fact that these materials
exhibit much different characteristics than when in bulk.3 For example, because these
particles have a large surface area relative to the number of atoms they contain, there is a
notable effect on the cohesive interactions between particles. The increase in cohesive
interactions has been shown to decrease the melting temperature as the diameter of the
nanoparticle decreases.4,5 Particles that possess such a small diameter are in an
intermediate state between bulk and molecular states.6 Due to the vast interface between
the nanoparticle and the surrounding medium, the medium can have a profound influence
on the physical and chemical properties of the nanoparticle making it well suited for
chemically selective sensing.5 Advances in facile synthesis techniques for ordered
nanostructures are essential for producing novel nanodevices.
There are many different methods of producing nanoparticles such as
sonochemical, micellular, coprecipitation and microemulsion, and laser pyrolysis.7 Most
often, metal nanoparticles are formed in the presence of surfactants, which bond to the
surface of the particles, or “cap” the particles. Thiols have been used most extensively for
coating metals and metal oxides.8 Carboxylic acids such as oleic acid and amines such as
oleylamine are of much interest as capping agents. These capping agents are useful in the
6
fabrication of metal nanoparticles because of their lubrication, catalysis, and corrosion
resistance properties.8,9 These surfactants play a very important role in the successful
formation of certain metal nanoparticles such as cobalt. It is difficult to prepare Co
nanoparticles without surfactant materials because the attractive forces between the
particles are large.10
OH
O
NH2
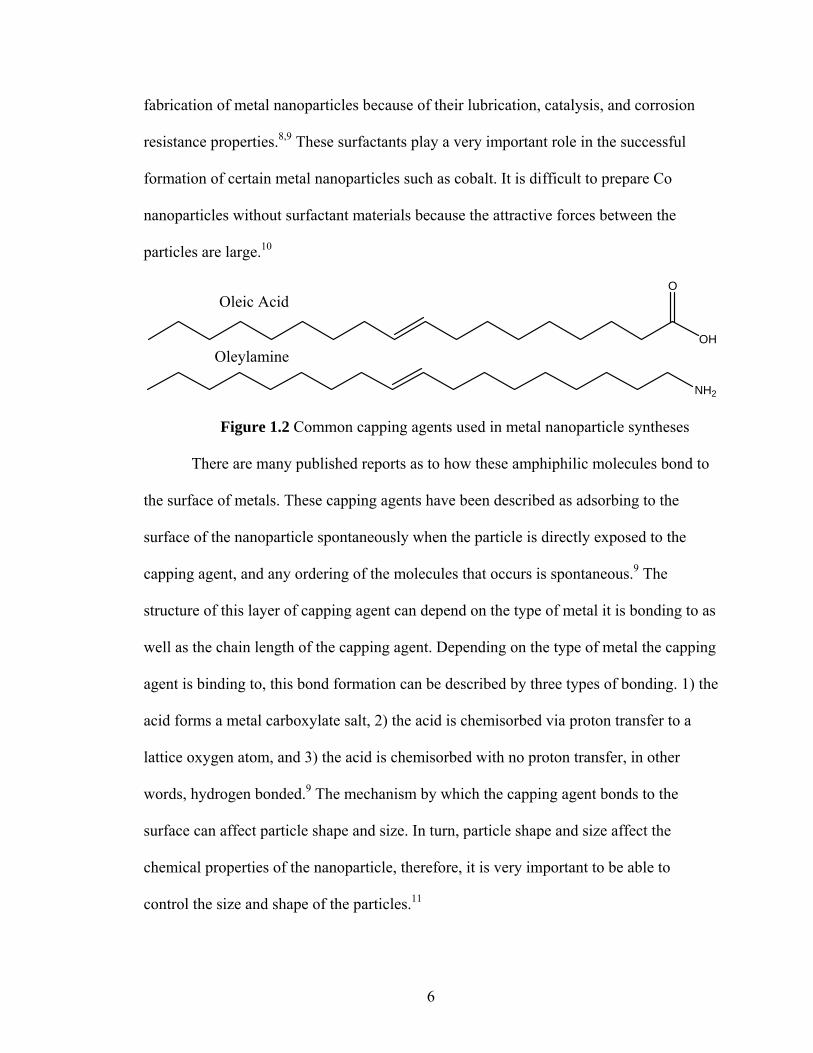
Figure 1.2 Common capping agents used in metal nanoparticle syntheses
There are many published reports as to how these amphiphilic molecules bond to
the surface of metals. These capping agents have been described as adsorbing to the
surface of the nanoparticle spontaneously when the particle is directly exposed to the
capping agent, and any ordering of the molecules that occurs is spontaneous.9 The
structure of this layer of capping agent can depend on the type of metal it is bonding to as
well as the chain length of the capping agent. Depending on the type of metal the capping
agent is binding to, this bond formation can be described by three types of bonding. 1) the
acid forms a metal carboxylate salt, 2) the acid is chemisorbed via proton transfer to a
lattice oxygen atom, and 3) the acid is chemisorbed with no proton transfer, in other
words, hydrogen bonded.9 The mechanism by which the capping agent bonds to the
surface can affect particle shape and size. In turn, particle shape and size affect the
chemical properties of the nanoparticle, therefore, it is very important to be able to
control the size and shape of the particles.11
Oleic Acid
Oleylamine

7
The capping agents bond to the surface of various metals differently. For
example, on silver surfaces, the carboxylate is bound to the surface through both oxygen
atoms.8 It has been reported that an ionic bond exists between the carboxylic acid head
group and the metallic ions on the surface of iron oxide nanoparticles.8 The FT-IR region
which indicates a chemical bond between the organic acid and the metal surface has been
formed is the v(C=O) stretching mode. This band is observed at 1706 cm-1 for
nonadecanoic acid, but after it has bonded to a metal substrate, the v(C=O) stretching is
observed in two bands at 1593 and 1440 cm-1.8 These two bands correspond to the
symmetric and asymmetric v(C=O) stretches, respectively. The presence of both of these
vs(C=O) and va(C=O) stretching modes indicates that a portion of the carboxylate head-
groups are bonded to the metal surface at an angle. There are also two bands in the 2850-
2960 cm-1 region that are associated with the CH2 symmetric and asymmetric stretching.8
These bands can also be used to verify that the capping agent is still present after
reaction. If only the symmetric stretching, vs(C=O) is observed in the form of a single
band at around 1404 cm-1, this indicates the organic acid is bonded to the surface of the
metal via a bridged metal-oxygen-carbon-oxygen-metal bond.8,12
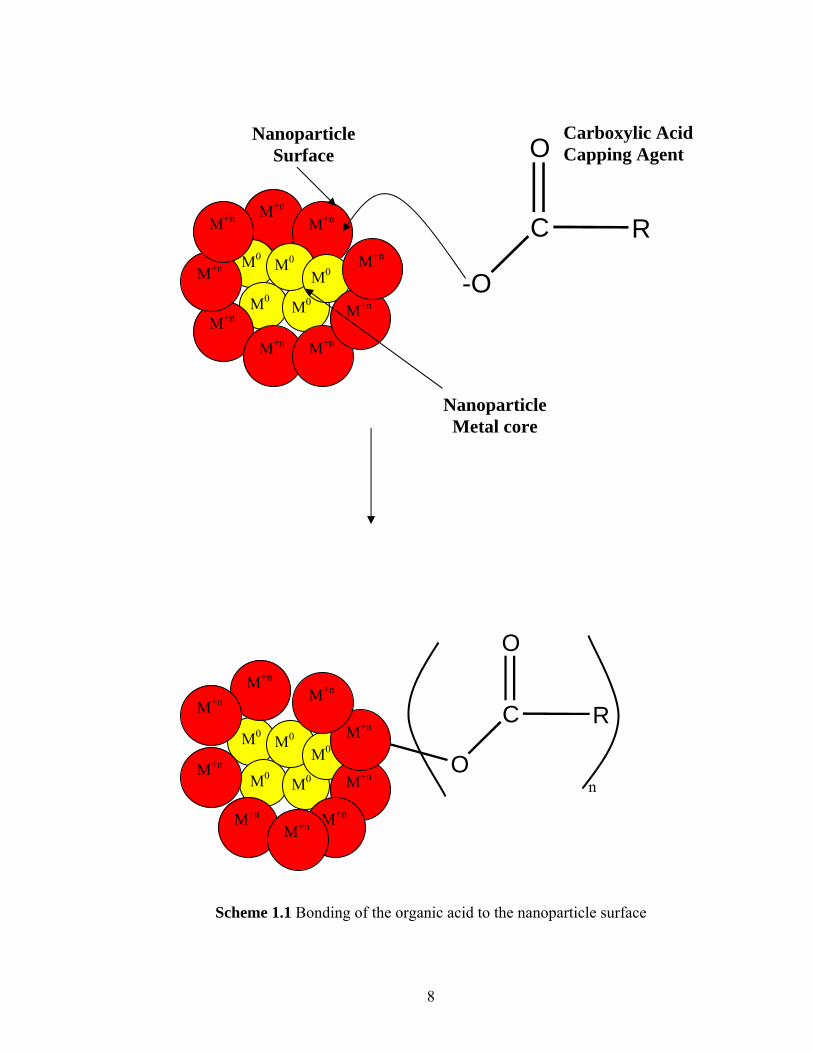
8
Scheme 1.1 Bonding of the organic acid to the nanoparticle surface
Nanoparticle Metal core
Carboxylic Acid Capping Agent
M+n M+n
M0
M0 M0
M0 M0
Nanoparticle Surface O
C R
-O
M0
M0 M0
M0 M0
O
C R
O
M+n M+n M+n
M+n
M+n M+n
M+n
M+n
M+n
M+n M+n
M+n
M+n
M+n
M+n M+n
n
9
1.3 The Polyol Method
The polyol method was developed in the 1980s, by Fievet et al., for the
preparation of finely divided metal powders of easily reducible metals.13 The method
involves reduction of a metal salt with a diol, typically ethylene glycol, diethylene glycol,
or a mixture of both.14 Tetraethylene glycol has also been used extensively. A
simultaneous reduction of the metal species and oxidation of the polyol solvent occur.15
The diol acts as the reducing agent as well as the solvent for the reaction.
One advantage of using ethylene glycol is its reducing power.16 The reducing
power of ethylene glycol has been investigated by analyzing the volatile compounds
produced from its oxidation.14 It has been shown that the reducing action of ethylene
glycol is not the same for all metals.14 For example, Ni metal particles have been
prepared from Ni(OH)2 at the boiling point of ethylene glycol, whereas Pd particles can
be prepared from Pd(NO3)2 at room temperature.15
One of the least understood aspects of the polyol method is the electrochemistry
involved. Linear sweep voltammetry has been used to study the electrochemical behavior
of ethylene glycol, and to determine the reduction potential of different transition metals
in it at room temperature.15 The electrochemical window of ethylene glycol (0.4 M
LiNO3) was found to lie between –0.82 and 2 V for a Pt electrode, and between –1.15 and
1.65 V for a glassy carbon electrode.15 The slight differences in these domains indicate
different kinetics for oxidation and reduction based on the nature of the electrode.15
According to Bonet et al., ethylene glycol was observed to oxidize at potentials more
positive than those of the metal reduction potentials, however completely reduced metals
were produced. This was explained by the fact that the measured potentials are the sum of
10
the thermodynamic potential and overpotential. They found that the potential becomes
more negative as the temperature increases.15
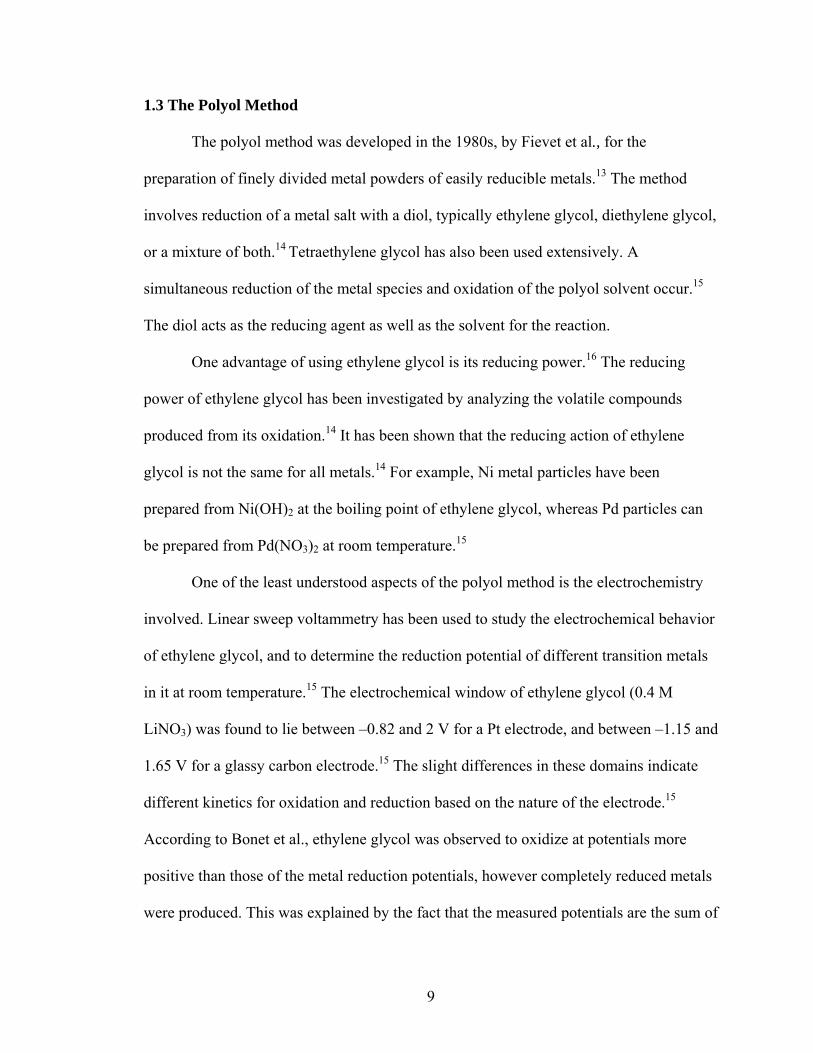
The metal salt must be soluble in the diol, so the metal acetate or acetylacetonate
is generally used. Even the less soluble hydroxide and oxide forms of Co, Ni or Cu have
been completely reduced.14
OO
O OO
O
M
O
OM
Figure 1.3 Structures of M+2 complexes with acetylacetonate and acetate ligands investigated in the polyol process
The solution is heated until boiling, and a complete reduction of the metal can be
achieved within a few hours.13 The earlier work with this process produced finely divided
metal powders with micro scale dimensions. Subsequent work with the polyol process
has made it an accepted method for preparing nano scale materials. The polyol process
has also been extended to include the use of thiols. This variant on the method produces
nanowires rather than the spherical nanoparticles produced by the diols.17 Alloys have
also been produced via this method with atomic level mixing.18
The polyol mechanism is poorly understood, but it is thought to occur via the
ethylene glycol being oxidized to the diacetyl.15,19,20
Bis-acetylacetonato M(II) Tetrahedral
Metal (II) acetate
11
H2C CH2
OH
HO
H2C CH2
OH
HO
+
O
H
+
O
H
+
Reaction (1)
O
H
O
H
M(II)
O O
+ +
Reaction (2)
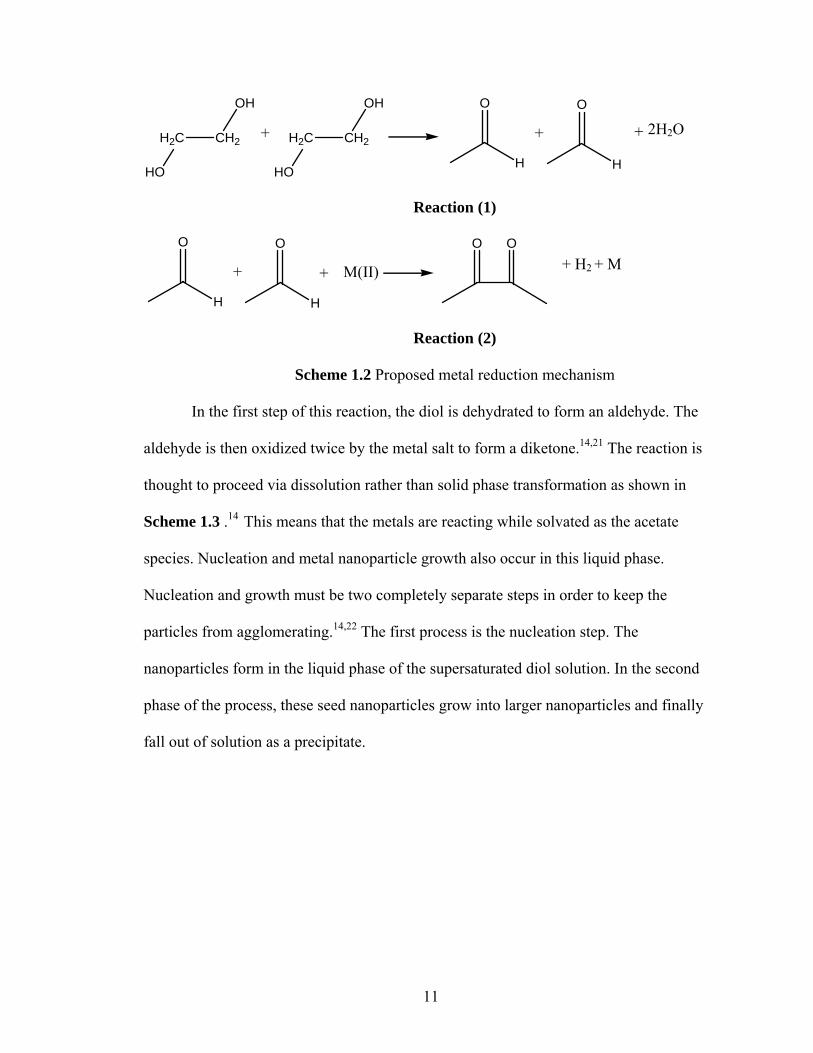
Scheme 1.2 Proposed metal reduction mechanism
In the first step of this reaction, the diol is dehydrated to form an aldehyde. The
aldehyde is then oxidized twice by the metal salt to form a diketone.14,21 The reaction is
thought to proceed via dissolution rather than solid phase transformation as shown in
Scheme 1.3 .14 This means that the metals are reacting while solvated as the acetate
species. Nucleation and metal nanoparticle growth also occur in this liquid phase.
Nucleation and growth must be two completely separate steps in order to keep the
particles from agglomerating.14,22 The first process is the nucleation step. The
nanoparticles form in the liquid phase of the supersaturated diol solution. In the second
phase of the process, these seed nanoparticles grow into larger nanoparticles and finally
fall out of solution as a precipitate.
2H2O
+ H2 + M
12
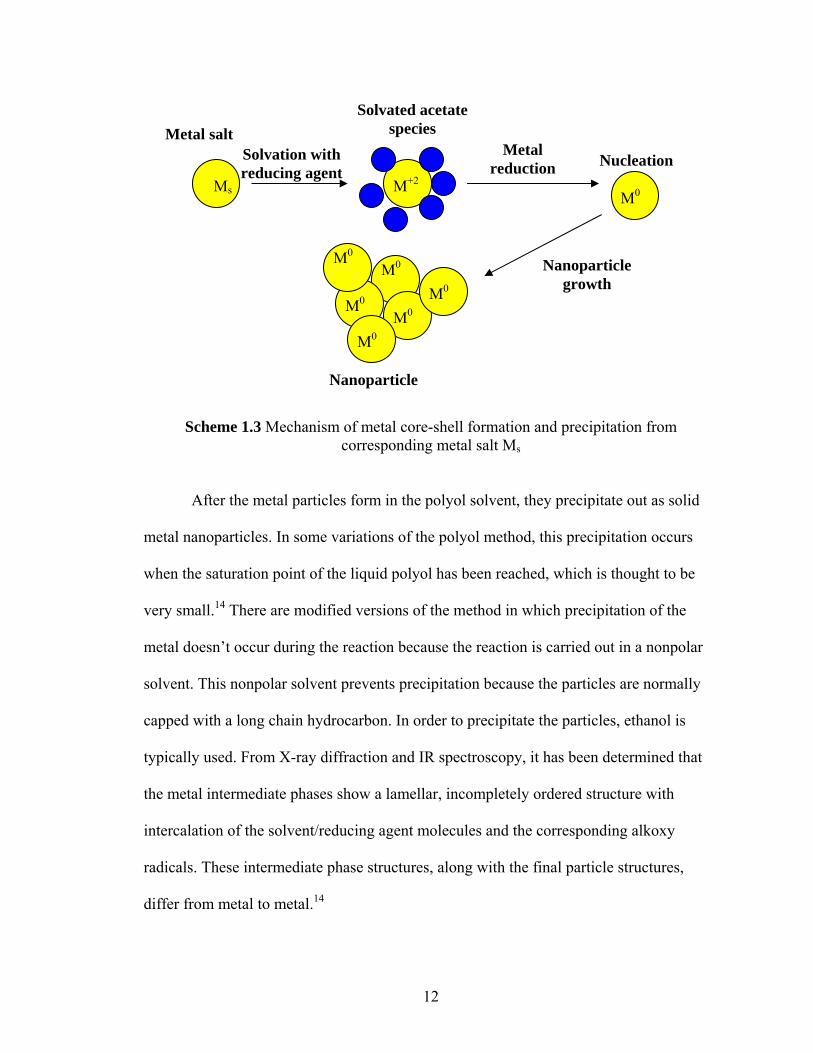
Scheme 1.3 Mechanism of metal core-shell formation and precipitation from corresponding metal salt Ms
After the metal particles form in the polyol solvent, they precipitate out as solid
metal nanoparticles. In some variations of the polyol method, this precipitation occurs
when the saturation point of the liquid polyol has been reached, which is thought to be
very small.14 There are modified versions of the method in which precipitation of the
metal doesn’t occur during the reaction because the reaction is carried out in a nonpolar
solvent. This nonpolar solvent prevents precipitation because the particles are normally
capped with a long chain hydrocarbon. In order to precipitate the particles, ethanol is
typically used. From X-ray diffraction and IR spectroscopy, it has been determined that
the metal intermediate phases show a lamellar, incompletely ordered structure with
intercalation of the solvent/reducing agent molecules and the corresponding alkoxy
radicals. These intermediate phase structures, along with the final particle structures,
differ from metal to metal.14
Ms M+2 M0
M0 M0
M0
M0
M0
M0
Solvation with reducing agent
Solvated acetate species
Metal reduction
Nanoparticle growth
Nucleation
Nanoparticle
Metal salt

13
Temperature plays a big role in the reaction because it influences the rate of
reaction by controlling diffusion of the intermediate phase of the metal and likewise the
reduction of the metal. Temperature also influences the reduction potential of the
ethylene glycol along with the breaking and formation of chemical bonds.23 The standard
reduction potentials of some common metals not bound by a particular ligand are listed in
Table 1.1. Ligands do affect the standard reduction potentials of metals. The polyol
method reduces metals bound by ligands such as acetate and acetylacetonate. It is
generally accepted that ligands contribute to a negative shift in the standard redox
potentials of metals because the ligand binding inhibits electron transfer to the metal
center.24
Reduction Potential (E°)
Co+2 Co0 –0.28 V
Fe+2 Fe0 –0.447 V
Fe+3 Fe0 –0.037 V
Table 1.1 Standard reduction potentials of selected divalent metals
Controlling the size of the nanoparticles is essential, and this is another reason the
polyol method works very well for this type of synthesis. In order to produce a uniform
size of nanoparticle, it is very important to reduce the occurrence of coagulation of the
individual particles. The polyol used in the reaction can help avoid coagulation because,
it can be adsorbed and produce steric stabilization which in turn inhibits agglomeration of
the particles during growth.22 After the nuclei have been created in the liquid phase of the
solvent the metal crystal growth initiates on these nuclei to form the nanoparticle. As
long as the metal is provided slowly by the reduction, the process will produce uniform

14
sized particles.14 The metal species is reduced relatively slowly throughout the course of
the reaction due to shifts in the equilibrium caused by growth of the metallic phase.
Particle size and shape can be easily directed with the polyol method.
Temperature, amount of metal precursor and the application of an external magnetic field
(when ferromagnetic metals are used) are just a few factors that govern the polyol
reaction and can influence particle size and shape. For instance, if the temperature is
increased, the size of the particles normally decreases, as a result of more nuclei being
formed in a shorter amount of time, allowing the intermediate metal phase to diffuse
more rapidly.14 When the ratio of metal precursor to polyol is increased, the particle size
increases due to the fact that the number of nuclei formed during the nucleation step at a
certain temperature is independent of the amount of metal salt introduced to the system.
If the number of particles is constant, but more metal is available, the particle sizes will
increase.14
Another reason the polyol method works well for synthesizing nanoparticles is
because it is not as susceptible to impurities as are other methods. The level of impurities
in the metal precursor hydroxide form of cobalt, Co(OH)2 , such as Ca, Fe, or Na, have
been found to be much lower compared to a solid-gas reduction which relies on the
chemical removal of oxygen from an oxide. In part, this may be due to the polyol’s
relative inability to reduce these to the pure metals. For example, Ca and Na
contaminants were reduced by almost two orders of magnitude using the polyol method
verses solid-gas reduction.14 However, a significant draw back associated with the polyol
method is the possibility of the final product containing a noteworthy weight percent of
15
carbon which results from the reaction taking place in the liquid phase in the polyol
solvent.14
1.4 Microwave Overview
Electromagnetic waves contain both magnetic and electric field components. The
electric constituent applies a force on charged particles causing them to move within the
electric field. The more rapidly the particles move, the more the particles become
polarized. At the molecular level, polarization involves distortion of the electron cloud
surrounding a molecule or physical rotation of molecular dipoles.25 Microwaves are
electromagnetic waves. Most commercial laboratory microwaves use a 2.45 GHz
frequency corresponding to a 12.2 cm wavelength range, between infrared and radiowave
wavelengths.23 The forces in these waves change direction at a rate of approximately 2.4
x 109 times per second.23 Most material exposed to microwaves can not respond fast
enough to these changes in wave direction which induces friction, which, in turn,
produces heat.
In order for the microwaves to be effective heat sources, the material that the
microwaves are being applied to must be able to couple with the microwave energy. In
other words, the material should be able to efficiently convert electromagnetic energy
into heat at a given frequency and temperature. This is known as the dielectric loss
constant ε”.23 A dielectric material is one which allows charge to be stored and no dc
conductivity is observed between plates.25 A dielectric material would act as a capacitor
when placed between two electrodes. The heating rate dependence on the presence of a
dielectric field is:
Tan δ= ε’/ε” (23) (1.1)
16
Where ε’ is the measure of the molecule’s ability to be polarized in an electric field.23 The
dielectric heating rates rely on Tan δ, which itself is dependent on frequency,
temperature, physical state and composition.23
The volume of the material and the geometry of the microwave cavity and the
reaction vessel exposed to the microwaves are all important factors in heating rate. Tan δ
is related to penetration depth by:
Dp= λo "/' εε (23)
If the volume is increased, the waves experience an absorbance loss. Dp is the penetration
depth of the incident waves and λo is the wavelength of the microwave.23 2.45 GHz is the
frequency most often used because of its penetration depth in most laboratory samples.26
Because the microwave field is not homogeneous in the sample, uneven field distribution
can have an effect on chemical reactions taking place in the microwave. This
inconsistency in the energy can lead to hot spots in the sample if the energy generation is
faster than heat transfers.27 These hot spots lead to the unusual temperature profiles
witnessed in microwave heating.
1.4.1 Laboratory Use of Microwaves:
When compared to thermal heating, microwave heating has many benefits in
organic synthesis, such as rapid volumetric heating, higher reaction rates, higher reaction
selectivity, higher product yield and energy saving.28 In conventional thermal heating,
heat transfers depend on the thermal conductivity, temperature difference across the
materials and convection currents.27 Microwave heating removes all these variables
because in microwave heating, the energy source of the microwaves are not in direct
(1.2)

17
contact with the reaction solution, so the heat produced is via dielectric heating. This can
lead to completely different temperature profiles.25
One factor that plays a role in microwave heating is superheating in the presence
of a large number of ions.23 Electrolytes affect the ability of the material to couple with
microwaves efficiently. Electrolytes generally have a large dipole moment which allows
them to convert microwave energy to heat better than less polar molecules. When the
solvent component of a reaction mixture is able to efficiently couple with the microwave
energy, the heating rate is dramatically increased. This type of heating is not really any
different than thermal heating, because with thermal heating, the solvent is being heated
and in-turn heating the reactants. The only difference would be the rate at which the
reaction was brought up to temperature; this leads to reduced energy consumption. If a
non-polar solvent is used for the reaction, and the reactants dissolved in the solvent are
able to couple with the microwave energy effectively (i.e. they are good electrolytes), the
heating is markedly different from thermal heating. When the reactants themselves are
absorbing the microwave energy, heating becomes even faster and more efficient.23 It
would be ideal to use a solvent that has a low dielectric loss and use reactants that have
high dielectric loss constants.
The use of nonpolar solvents can affect the reaction mechanism because, when
using microwave heating, there would be less coupling of the microwave energy with the
solvent. This would allow the reactants to absorb the microwave energy and transfer the
energy to the solvent instead of the solvent transferring the energy to the metal salt being
reduced, similar to traditional thermal heating. It has been shown that the magnitude of
the perceived microwave effects decreases with increasing solvent polarity.29
18
Conventionally, organic synthesis has been carried out under conductive heating
conditions. The reaction vessel is placed in contact with the heat source, and the materials
inside are heated through convection. This is an inefficient way to transfer heat because it
depends on the thermal conductivity of the glassware and the solvent.26 Microwaves
penetrate the glass surface of reaction vessels. The glassware does not interact with the
microwaves and therefore does not undergo dielectric heating, and most organic solvents
used have large Dp values. Therefore, the maximum temperature of the reaction mixture
can be achieved within the entire reaction vessel as opposed to just the outer portion with
conventional heating. This has been confirmed using IR imaging.30 This dielectric
heating can produce different temperature profiles during the reaction and can lead to
different chemical product distributions from the reaction.25 These differences in product
yields may be due to the possibility that certain isomers produced during thermal heating
may not be stable under microwave super heating, and therefore a different isomer ratio
is observed.30
During microwave heating, if there is inefficient mixing of the solution, boundary
effects can have an impact on the reaction progress. This is another reason for the
different temperature profiles observed during microwave reactions as opposed to
thermal heating reactions. A phenomenon known as nucleate boiling occurs at the surface
of a reaction vessel and its rate is governed by the temperatures at the surface and
availability of nucleation sites.30 Nucleate boiling is not observed in microwave reactions.
During a microwave reaction, the temperature at the surface of the reaction vessel is
lower than the internal temperature, therefore a steady state boiling point is achieved at a
higher temperature.30 The higher steady state boiling points observed in the microwave

19
reactions are influenced by the wetting properties of the solvent, the power input, surface
condition and surface tension.30 It has been shown that organic solvents can superheat by
13-26 °C above the normal boiling point at atmospheric pressure which indicates the
importance of the wetting properties of the solvent.23 These different temperature zones
can lead to control of kinetic vs. thermodynamic isometric ratios of the products.23
1.4.2 Specific Microwave Effects:
There have been debates for years over the question of microwaves causing
chemistry that is unique only to microwave energy. The overwhelming evidence points to
the fact that there are no known unique microwave effects. Most rate enhancement effects
that have been reported are simply due to poor temperature control and monitoring.23 A
more detailed survey of microwave reactions revealed that they are governed by the same
fundamental principles of thermodynamics and kinetics as reactions using thermal heat
sources.25 The region of electromagnetic energy that microwaves operate in can only
affect molecular rotation, not its structure.26 Microwaves contain about
2.39 X 10⁻⁴ kcal/mol of photons.23 The energy contained in these photons is very low
when compared with the energy to cleave a molecular bond which is typically 80-120
kcal/mol.26 It is safe to assume that microwaves will not affect the molecular structure of
materials within the reaction vessel. Therefore no unique chemistry should be attributed
solely to microwaves themselves. Molecular activation such as that in photochemistry
could only be achieved by the species in solution somehow storing the microwave energy
and giving rise to an activated state. The microwave energy would either have to be
stored in the vibrational energy of the molecule by e.g. an antenna group or by alignment
of molecules.23 This activated state could only be achieved through a step-by-step

20
accumulation of energy from the microwaves. This possibility can be ruled out because
of a fast relaxation time.27
It is easy to understand why microwave effects have been credited with rate
enhancements. Because steady state boiling is achieved during microwave heating, the
reaction proceeds at a much higher temperature than it would with conductive heating. A
superheating effect of 300C leads to a rate enhancement of about 8 fold.30 There is also a
significant reduction in the time it takes to reach the steady state boiling temperature
using microwaves. A 10-50 fold reduction in time could be achieved using microwave
versus conventional heating.30 Only reaction rates that are enhanced by 100-1000 fold at
atmospheric temperatures can be attributed to microwave effects.30
Rate enhancements when using microwave energy have been reported for a
number of organic syntheses. These accelerated reactions are a result of material-wave
interactions, which lead to thermal effects.29 Any type of specific microwave effect can
always be explained by a more conventional thermal effect. When reactions have been
carried out under carefully monitored reaction conditions, no specific microwave effects
have been found, but an accurate comparison to thermal heating is difficult to attain.27
1.5 Microwave Polyol
Komarneni was the first to report metallic powders produced via a microwave
polyol method.31, 32 Microwave synthesis is an optimal method for preparing
nanoparticles via the polyol method. The metallic particles that are produced during the
polyol reaction are excellent receptors for microwave energy which leads to even more
rapid heating of the solution.19 When these metallic particles are exposed to microwave
radiation it can create localized superheated regions in the solvent. This phenomenon is

21
known as The Maxwell-Wagner effect, or interfacial polarization.33 This effect occurs
when particles that couple well with the microwaves are in contact with nonconducting
materials. These hot spots speed up the reactions between the metal particle and the
organic substrate.25 The localized super heated regions produced could be similar to what
is observed in sonochemical methods.27, 34 Smaller sample sizes or stirring the sample
while in the microwave oven can help lessen the effect of these hot spots, but this can
lead to other problems.27 The localized super heated regions make for a more rapid
synthesis of organometalic nanoparticles, and also allows for the formation of even
smaller nanoparticles. These smaller particles are formed because in the super heated
regions, the reaction rate of the organic coating with the metal surface is increased, thus
the particle is not allowed to grow very large before it is capped.
Another reason microwave synthesis is an ideal method for the polyol synthesis is
because polyol solvents such as ethylene glycol have a large dipole moment.16 The
dielectric constant for ethylene glycol at 25°C is 41.4.34 This high dielectric constant
allows the solvent to couple extremely well with the electromagnetic waves and leads to
much faster heating of the solvent. These high boiling point solvents are also well suited
for microwave synthesis because they are known to prevent arcing. Arcing is known to
cause degradation of solvents in microwave-assisted reactions. The high weight percent
of carbon, sometimes associated with the polyol method, can be linked to this arcing
phenomenon.19
The microwave polyol synthesis has many advantages over the conventional
heating polyol synthesis. The localized hot spots created by the microwave synthesis
produce much smaller particles than are produced in conventional heating which
22
normally produces micron sized particles.13 Under microwave radiation, solvents undergo
significant overheating, the consequence of which is that a metal ion can be reduced to its
zero oxidation state via the previous proposed mechanism.31 With conventional heating,
only the most easily reducible metals can be converted to metal powders.13 Microwave
heating allows for metals such a Fe+2 to be reduced.35 As discussed before, the microwave
heating reduces impurities in the product, and the reaction time is reduced from hours to
minutes. One disadvantage of the microwave synthesis is that it tends to produce more
agglomerated particles than some other methods such as sonochemical.19
1.6 Magnetite (Fe3O4) and Cobalt Ferrite (CoFe2O4)
Magnetite nanoparticles can be readily synthesized via the polyol method. During
the reaction of iron salts with a 1,2 diol, air can be sparged through the reaction to
produce magnetite nanoparticles.
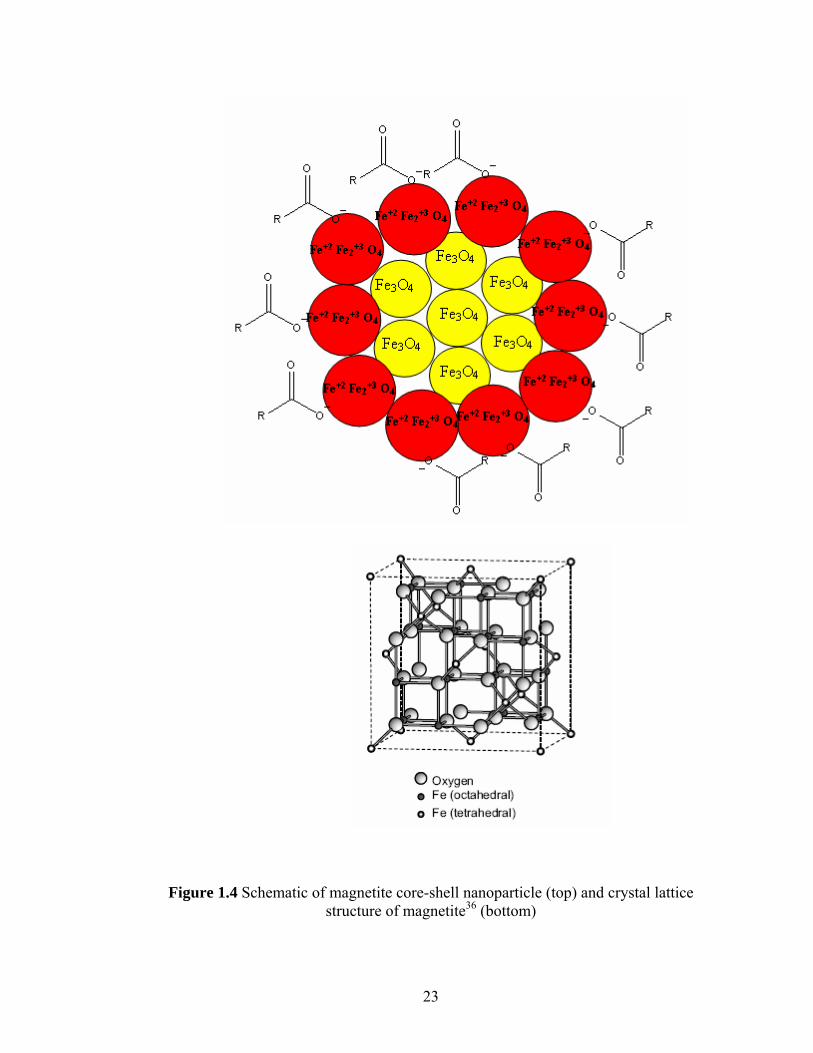
23
Figure 1.4 Schematic of magnetite core-shell nanoparticle (top) and crystal lattice structure of magnetite36 (bottom)

24
Magnetite is a fairly common iron oxide. It is a member of the spinel group,
which has the general formula AB2O4. In magnetite A is Fe+2 and B is Fe+3.37 Oxygen
forms a fcc closed packing and the Fe cations occupy the interstitial tetrahedral sites and
octahedral sites.38,39 The tetrahedral sites contain Fe(III) and the octahedral sites contain
both Fe(II) and Fe(III).40 These octahedral sites contribute to magnetite’s interesting
properties, because the electrons can flow between the Fe+2 and Fe+3 ions in these sites at
room temperature.38 This transfer of electrons creates an electric vector which generates a
magnetic field.37
Ferrite nanoparticles are of great interest in the scientific community because of
their potential application in ferrofluids, magnetic fluids, magnetic recording media, and
magnetic resonance imaging.41, 42 Magnetite particles can also be coated to aid in clinical
medicine.38 The crystallinity of magnetite nanoparticles can strongly affect their magnetic
properties, therefore it is very important to be able to produce high quality magnetite
nanoparticles.7 Most of the intriguing and beneficial properties that magnetite possesses
are only accessible if the particles are on the 20 nm range, because at this size they can
have superparamagnetic properties.38 This superparamagnetic behavior arises from the
infinitely small coercivity brought on by the negligible energy barrier in the hysteresis of
the magnetization loop of the particles as predicted by Cloch and Neel.41 The term
“superparamagnetic” means that these particles are attracted to a magnetic field, but
when removed from the field, they retain no residual magnetism.43 This means that these
particles can be introduced to a magnetic field without agglomerating once the field is
removed, and this can be advantageous in drug delivery.

25
Through variation of the divalent cations contained in ferrite molecules, their
magnetic properties can be finely tuned. Cobalt ferrite particles have been studied
extensively because of their ferromagnetic properties.44 Due to different strengths of
magnetic interactions at lattice sites, CoFe2O4 nanoparticles possess very different
magnetic properties than magnetite.45 The differences in magnetic properties between
magnetite and cobalt ferrite have been attributed to the spin-orbital couplings at the Co+2
and Fe+2 sites in the crystal lattice.45 CoFe2O4 nanoparticles have been shown to display
much better magnetic characteristics than Fe3O4.
Our research group is developing highly reactive core-shell nanoparticles that can
alter the thermal stability of jet fuel via targeted chemical reactions. At the center of the
nanoparticles that are being created is an iron core. The iron core has a zero charge. It is
completely reduced and therefore highly reactive to oxygen. This iron core cannot be
exposed to the atmosphere therefore it must be protected. During the reaction to form the
nanoparticles, oleic acid is added which serves as a surfactant and a capping agent. The
capping agent helps to control the particle size and shape, as well as increasing its
stability and solubility in organic media. This amphiphilic coating can be taken advantage
of as a delivery mechanism for the iron into the hydrocarbon rich environment of jet fuel.
Jet fuel acts as a coolant for the heat generated by the aircraft engine. The
temperature of the fuel begins to rise as more heat is transferred to it from the engine.
Once the fuel reaches a certain temperature, which has yet to be determined, it is believed
that the oleic acid can become permeable to the dissolved oxygen in solution. The ability
of Fe0 nanoparticles to remove dissolved oxygen has been investigated by studying the
lifetime of pyrene in a hexane solution. The long lifetimes of pyrene above ~1100C
26
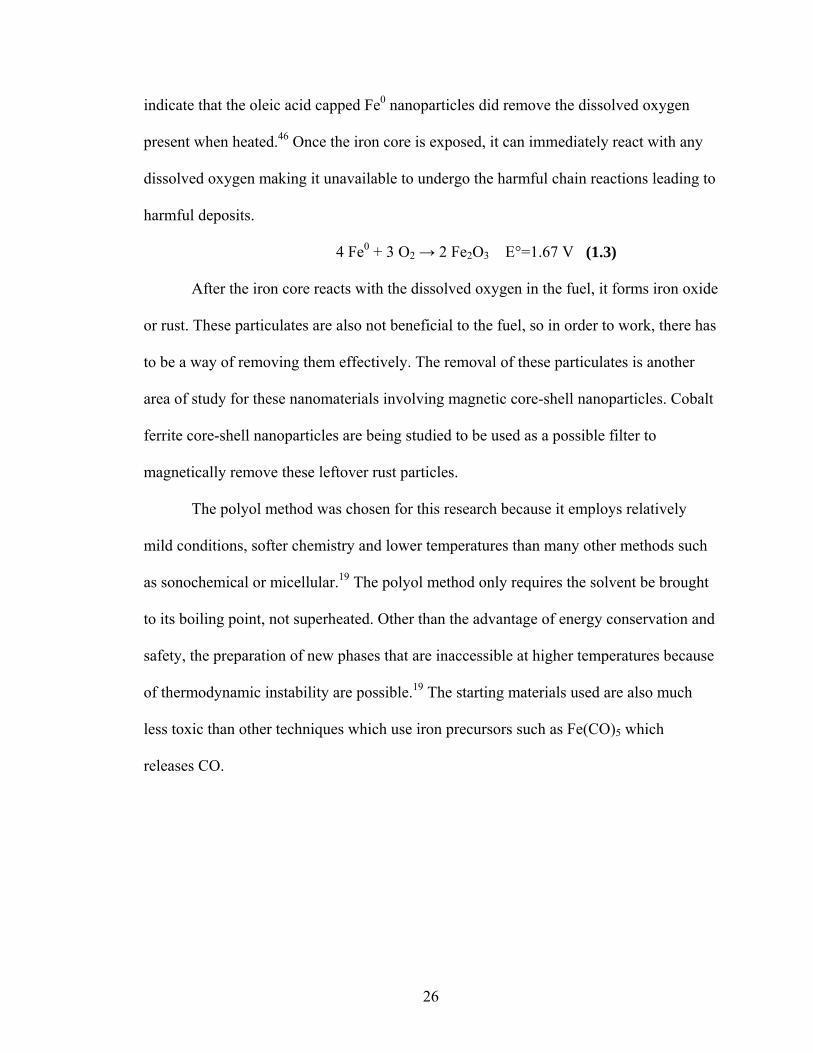
indicate that the oleic acid capped Fe0 nanoparticles did remove the dissolved oxygen
present when heated.46 Once the iron core is exposed, it can immediately react with any
dissolved oxygen making it unavailable to undergo the harmful chain reactions leading to
harmful deposits.
4 Fe0 + 3 O2 → 2 Fe2O3 E°=1.67 V
After the iron core reacts with the dissolved oxygen in the fuel, it forms iron oxide
or rust. These particulates are also not beneficial to the fuel, so in order to work, there has
to be a way of removing them effectively. The removal of these particulates is another
area of study for these nanomaterials involving magnetic core-shell nanoparticles. Cobalt
ferrite core-shell nanoparticles are being studied to be used as a possible filter to
magnetically remove these leftover rust particles.
The polyol method was chosen for this research because it employs relatively
mild conditions, softer chemistry and lower temperatures than many other methods such
as sonochemical or micellular.19 The polyol method only requires the solvent be brought
to its boiling point, not superheated. Other than the advantage of energy conservation and
safety, the preparation of new phases that are inaccessible at higher temperatures because
of thermodynamic instability are possible.19 The starting materials used are also much
less toxic than other techniques which use iron precursors such as Fe(CO)5 which
releases CO.
(1.3)

27
II. EXPERIMENTAL PROCEDURES
2.1. X-Ray Powder Diffraction (XRD)
During the course of this research, powder XRD was used to determine the
different phases of iron present in the products of each experiment. It was used for
compositional analysis and as a probe into the structure of the product. XRD has been
widely used for investigating the structural properties of crystals, amorphous samples and
layered systems.47 By comparing the position of the peaks in the diffracted beam to the
standards provided by the International Center for Diffraction Data (ICDD), the unknown
phases present in each sample can be identified.48
After the phase of the material was determined, the XRD patterns were then used
to investigate the structural nature of the material, for example, the size and crystallinity
of the particles. A material’s structure can be either crystalline or amorphous. Crystalline
materials have sharp peaks in their XRD patterns while amorphous materials have more
diffuse peaks because of fluctuations in the lattice parameters. When it comes to
amorphous nanomaterials, smaller sized particles also produce broader peaks in the XRD
patterns, however, based on peak width, XRD patterns can be used to estimate size in
nanomaterials The peaks are broader for smaller sized nanoparticles even if the particle is
highly crystalline because, as the particle size decreases, the crystal lattice becomes less
aligned, leading to broadening of the XRD pattern.

28
The XRD analysis in this work was performed on a Bruker AXS D8 Advance
diffractometer equipped with a type KFL Cu 2K source with a 1.54 Å wavelength and a
Sol-X detector. Powdered samples were pulverized with a mortar and pestle and placed
on a 50 mm zero background silicon single crystal sample holder and pressed into a thin
layer using a Fisherbrand Pre-Cleaned Microscope Slide. The sample holder was then
placed in the D8 Advance for XRD analysis. The more wax-like samples were smeared
onto the sample holder using a cotton swab wetted with a drop of n-hexane until a thick
enough layer was deposited.
To ensure a clean, complete fingerprint, spectra were obtained in continuous scan
mode over a 2θ range of 5° to 85°, with a speed of 5 sec/step, and a diffracted angle
increment of 0.05°. A continuous scan option, in which the X-ray source and the X-ray
detector continuously repeat the 2θ range, was used on all scans to provide further
refining of the X-ray data points. Upon completion of the X-ray sample run, the data
were analyzed in the EVA program, which has a built-in diffraction pattern library to
compare the sample’s diffraction pattern to the diffraction patterns in the ICDD database.
2.2 Transmission Electron Microscopy (TEM)
Transmission Electron Microscopy (TEM) was used in this work to determine the
size, shape and arrangement of the particles produced from some of the reactions. The
TEM analysis done for this work was performed by the Materials and Manufacturing Lab
at the Air Force Research Lab by Pam Lloyd and Lt Melissa Ingram and by Dr. Sun’s
group at Clemson University. To obtain TEM images, a Hitachi HD2000 STEM system
was used. The solid samples were dispersed in a chloroform solution using a sonocating
bath. The samples were transferred onto custom carbon-coated 300 mesh copper grids for
29
TEM imaging. The use of carbon-coated grids ensures that the background will be of low
density and have little contrast in the TEM image.
When analyzing a TEM image, both light and dark areas will be visible. The
lighter areas are areas where the material is less dense and more electrons have passed
through. The darker areas are where the material has greater electron density and fewer
electrons have been transmitted through. The material the electrons are passing through
in this work is both the organic coating as well as the core nanoparticle. This light and
dark contrast can be reversed if the instrument is in the Z-contrast mode. Because
inorganic particles, such as iron oxides, tend to be dense agglomerations of atoms with
relatively higher atomic weights than organic materials, they will impede the flow of
electrons through the sample. The less dense areas of the material, such as the organic
coating, will allow more electrons to penetrate; therefore we should only see the iron
oxide core on a TEM image. From the TEM images, one can determine the size, shape
and arrangement of the inorganic particles in the sample.
2.3 Atomic Force Microscopy (AFM)
AFM images obtained in this work were done on a multimode Nanoscope IIIA
Microscope, manufactured by Digital Instruments Veeco Metrology Group. The AFM
was operated in Tapping Mode using an N-type phosphorus-doped silicone tip. The
diameter of the tip was between 10-20 nm. AFM specimens were prepared by drip
coating a 1mg/mL sample solution onto small silicone wafer chips followed by drying in
air.
30
2.4 Fourier Transform Infrared (FT-IR) Spectroscopy
The FT-IR spectrometer used in this work was a Perkin Elmer System 2000 FT-
IR. To prepare the powdered samples for analysis, a small quantity of purified KBr was
added to the pulverized powdered sample and pressed into a pellet. The waxy samples
were prepared for analysis by smearing a thin layer on KBr salt plates with a cotton swab
moistened with n-hexane. The sample chamber was purged with nitrogen during analysis
for all samples unless otherwise noted. Each spectrum consisted of 16 scans with 1.0 cm-1
resolution.
2.5 Thermal Polyol Core-shell Nanoparticle Synthesis
Attempts were made to reproduce the results of a published iron oxide core-shell
nanoparticle synthesis.33, 49 From the literature, the process was adapted slightly from two
different papers. All reagents were purchased from Sigma Aldrich and used without any
further purification. The amounts of reagents used were roughly the following ratios
unless otherwise noted: 1 mmol of the iron source (254 mg iron (II) acetylacetonate) to 2
mmol of the reducing agent (517 mg 1,2-hexadecanediol); 1 mmol of capping agent (320
µL oleic acid); 20 mL of solvent. The oleylamine used in published reports was left out
because the literature indicated that it was only used because it bound to the Pt more
readily than the oleic acid, and the goal of the experiment was to create Fe nanoparticles,
not FePt nanoparticles.36
The reagents were added to a two neck round bottom flask. To ensure proper
mixing of reagents, samples were placed in a Solid State/Ultrasonic FS-28 Sonocating
Bath for approximately 30 min. The brownish yellow liquid was placed in a heating
manifold with a condenser attached. The heating manifold was turned on and the liquid
31
reached approximately 280°C, and it remained at that temperature for 30 min. Air was
sparged through the reaction flask throughout the reaction to promote the formation of
magnetite particles. Small gaseous emissions were noted during the reaction which
decreased the temperature almost 10°C every emission. It isn’t clear what caused these
emissions. The flask was removed from the heat and allowed to cool. The black liquid
was then separated into two vials and approximately 20 mL of ethanol was added to each
vial to precipitate the product.
It was apparent that a precipitate began to form immediately, as the solutions
became opaque and cloudy. The vials were then left to sit over night. The precipitates
were a dark brown color and the supernatant was a clear, pale brown. Products were
centrifuged in an Eppendorf Centrifuge 5804 counter balanced with a centrifuge tube
containing DI water. The solutions were typically centrifuged for 30 minutes at 5000 rpm
for every wash step. Washes consisted of sonicating in ethanol three times and a final
sonication in n-hexane. The solution fractions were typically discarded after centrifuging
leaving a brown powder insoluble in both ethanol and n-hexane. The product was dried
under a nitrogen flow.
After successful synthesis of magnetite nanoparticles, the same procedure was
used to synthesize Fe0 nanoparticles. In-order to produce Fe0 particles, oxygen had to be
removed, thus the reaction mixture was sparged with nitrogen for 30 min prior to heating.
Nitrogen was sparged through the vessel through out the reaction. The resulting solid was
a dark brown wax. These products were washed and centrifuged as in the previous
procedure, but these products were soluble in n-hexane. The product was dried under a

32
nitrogen flow. This procedure was repeated using microwave heating. The products from
each heat source were compared.
2.6 Microwave Polyol Core-shell Nanoparticle Synthesis
The procedures for the microwave reactions were adapted from the thermal polyol
reactions. The amounts of reagents used were roughly the following ratios unless
otherwise noted: 1 mmol of the iron source (254 mg iron (II) acetylacetonate, or 174 mg
iron (II) acetate ) to 2 mmol of the reducing agent ( 517 mg 1,2-hexadecanediol or 20 mL
of liquid polyol solvent); 1 mmol of capping agent (320 µL oleic acid); 20 mL of solvent.
However, neither the Pt co-reactant nor the oleylamine co-capping agent reported in the
literature were used unless otherwise noted. The reagents were added to a round bottom
flask. To ensure proper mixing of reagents, samples were placed in a Solid
State/Ultrasonic FS-28 Sonocating Bath for approximately 30 min. The brownish yellow
liquid was placed in a CEM Discover Microwave Synthesis Workstation equipped with a
condenser column with a nitrogen line fed through it. The reaction mixture was sparged
with nitrogen for 30 min prior to turning on the microwave. A stir bar was also added to
the flask and the stir plate on the microwave was turned on. The temperature was set at
270°C. Depending on the solvent/reducing agent used, the temperature did not always
reach 270°C in the course of the reaction. The temperature was controlled automatically
through power adjustment. The maximum power (300W) was applied to the microwave
cavity until the set temperature was reached. Nitrogen was sparged during the reaction
(air was never used for the microwave reactions).
Once the set time in the microwave had elapsed, the flask was removed from the
microwave and allowed to cool. The liquid was then separated into two vials and
33
approximately 20 mL of ethanol was added to each vial to precipitate the product and left
to sit over night. Products were centrifuged in an Eppendorf Centrifuge 5804 counter
balanced with a centrifuge tube containing DI water. The solutions were typically
centrifuged for 30 minutes at 5000 rpm for every wash step. Washes consisted of
sonicating in ethanol 3 times and a final sonication in n-hexane. The ethanol solution
fractions were discarded after centrifuging leaving a black wax soluble in n-hexane. The
product was dried under a nitrogen flow. All variations to these procedures have been
summarized in Tables 3.1 – 3.12.
The application of microwave energy involving metal powders seems to have
obvious drawbacks, but it has been shown that this synthetic procedure can be performed
safely and successfully.50 One possible problem with producing metal nanoparticles in a
microwave is the possibility of arcing. This arching can cause a degradation of the
solvent and lead to high levels of carbon in the resulting products. Mingos and Whittaker
have shown that the used of high boiling point alcohols in microwave reactions can
prevent this arcing.50 Alcohols seem to prevent arcing because of their significant
dielectric loss tangent. This large loss tangent leads to a decrease in electric field strength
and thus induced voltages in the metal.50
34
III. RESULTS AND DISSCUSSION
3.1 Research Overview
The main purpose of this research was to produce different types of iron and
cobalt core-shell nanoparticles capped with oleic acid (along with other possible capping
agents) via thermal and microwave polyol methods. One of the main parameters that was
changed during the course of the investigation into the thermal polyol and microwave
polyol processes was the choice of solvent/reducing agent. The microwave polyol solvent
was changed during the course of this exploration from a non-polar ether to a relatively
polar 1,2-hexanediol. The change was made to examine the difference between the three
types of heating: 1) conventional thermal heating 2) microwave heating with a non-polar
solvent 3) microwave heating with a polar solvent (which should mimic the products of
conventional thermal heating). The following scheme represents our proposed polyol
mechanisms, based on the literature,15,19,20 for the 1,2 diols and divalent metals
investigated.
35
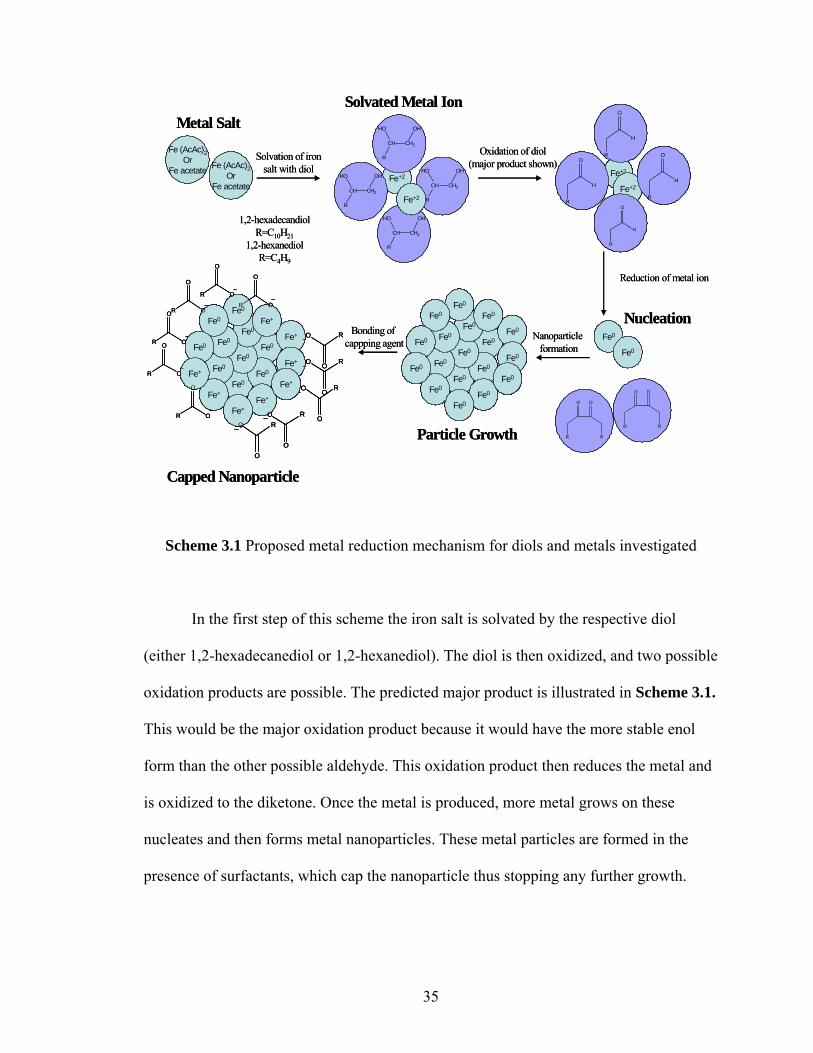
Scheme 3.1 Proposed metal reduction mechanism for diols and metals investigated
In the first step of this scheme the iron salt is solvated by the respective diol
(either 1,2-hexadecanediol or 1,2-hexanediol). The diol is then oxidized, and two possible
oxidation products are possible. The predicted major product is illustrated in Scheme 3.1.
This would be the major oxidation product because it would have the more stable enol
form than the other possible aldehyde. This oxidation product then reduces the metal and
is oxidized to the diketone. Once the metal is produced, more metal grows on these
nucleates and then forms metal nanoparticles. These metal particles are formed in the
presence of surfactants, which cap the nanoparticle thus stopping any further growth.
Fe (AcAc)2Or
Fe acetateFe+2
CH CH2
OH
R
HO
CH CH2
OH
R
HO
CH CH2
OH
R
HO
CH CH2
OH
R
HO
Fe+2
Fe (AcAc)2Or
Fe acetate Fe+2
Fe+2
O
H
R
O
H
RO
H
R
O
H
R
Fe0
Fe0
O
R
O
R
O
R
O
R
Fe0
Fe0
Fe0
Fe0
Fe0
Fe0
Fe0 Fe0
Fe0
Fe0
Fe0Fe0
Fe0
Fe0
Fe0
Fe0
Fe0
Fe0
R
O
OFe0
Fe0
Fe0
Fe0
Fe0
Fe0
Fe0 Fe+
Fe+
Fe+
Fe+Fe0
Fe0
Fe0
Fe+
Fe+
Fe+
Fe+
R
O
O
R
O
O
R
O
OR
O
OR
O
O
R
O
O
R
O
O
R
O
O
R
O
O
R
O
O
Solvation of iron salt with diol
Oxidation of diol (major product shown)
Reduction of metal ion
Nanoparticle formation
Bonding of cappping agent
Metal SaltSolvated Metal Ion
Nucleation
Particle Growth
Capped Nanoparticle
1,2-hexadecandiolR=C10H21
1,2-hexanediolR=C4H9
Fe (AcAc)2Or
Fe acetateFe+2
CH CH2
OH
R
HO
CH CH2
OH
R
HO
CH CH2
OH
R
HO
CH CH2
OH
R
HO
Fe+2
Fe (AcAc)2Or
Fe acetate Fe+2
Fe+2
O
H
R
O
H
RO
H
R
O
H
R
Fe+2
Fe+2
O
H
R
O
H
RO
H
R
O
H
R
Fe0
Fe0
O
R
O
R
O
R
O
R
Fe0
Fe0
Fe0
Fe0
Fe0
Fe0
Fe0 Fe0
Fe0
Fe0
Fe0Fe0
Fe0
Fe0
Fe0
Fe0
Fe0
Fe0Fe0
Fe0
Fe0
Fe0
Fe0
Fe0
Fe0 Fe0
Fe0
Fe0
Fe0Fe0
Fe0
Fe0
Fe0
Fe0
Fe0
Fe0
R
O
OFe0
Fe0
Fe0
Fe0
Fe0
Fe0
Fe0 Fe+
Fe+
Fe+
Fe+Fe0
Fe0
Fe0
Fe+
Fe+
Fe+
Fe+
R
O
O
R
O
O
R
O
OR
O
OR
O
O
R
O
O
R
O
O
R
O
O
R
O
O
R
O
O
R
O
OFe0
Fe0
Fe0
Fe0
Fe0
Fe0
Fe0 Fe+
Fe+
Fe+
Fe+Fe0
Fe0
Fe0
Fe+
Fe+
Fe+
Fe+Fe0
Fe0
Fe0
Fe0
Fe0
Fe0
Fe0 Fe+
Fe+
Fe+
Fe+Fe0
Fe0
Fe0
Fe+
Fe+
Fe+
Fe+
R
O
O
R
O
O
R
O
OR
O
OR
O
O
R
O
O
R
O
O
R
O
O
R
O
O
R
O
O
Solvation of iron salt with diol
Oxidation of diol (major product shown)
Reduction of metal ion
Nanoparticle formation
Bonding of cappping agent
Metal SaltSolvated Metal Ion
Nucleation
Particle Growth
Capped Nanoparticle
1,2-hexadecandiolR=C10H21
1,2-hexanediolR=C4H9

36
3.2 Thermal Polyol Magnetite Core-shell Nanoparticle Synthesis
The first set of experiments was conducted to reproduce published results of
nanoscale magnetite particle synthesis under conventional thermal heating conditions.33,49
These conditions are summarized in Table 3.1
Sample # Type Capping
Agent Reducing Agent Solvent Metal Salt Variation
1 Fe w/ O2 oleic acid 1,2-hexadecanediol octyl ether Fe (Acac)2
2 Fe w/ O2 oleic acid 1,2-hexadecanediol octyl ether Fe (Acac)2 reduction
by ¼
3 Fe w/ O2 oleic acid 1,2-hexadecanediol octyl ether Fe (Acac)2
solution fraction
investigated
4 Fe w/ O2 oleic acid 1,2-hexadecanediol octyl ether Fe (Acac)2 Repeat of #1,2 and 3
Table 3.1 Summary of thermal polyol magnetite syntheses reagents and conditions
The first reaction, using thermal heating, produced a brown powdered product.
FT-IR was performed to identify the characteristic features that are associated with
capped nanoparticles. Figure 3.1 shows the FT-IR spectra of the product from the
magnetite core-shell nanoparticle synthesis and oleic acid, respectively. The v(C=O)
stretch at 1710 cm-1 in the oleic acid spectrum is not present in the FT-IR spectrum of the
magnetite product, this is common to all acids used to cap nanoparticles.29 The FT-IR
spectrum of the product shows the two signature bands at 1600 cm-1 and 1480 cm-1 that
correspond to the vs(C=O) and va(C=O) stretching modes and indicate that the oleic acid
bonded to the surface of the metal particle. It has been suggested that surfactants such as
oleic acid bond to the surface of iron oxide nanoparticles via ionic bonds, in other words,
as the oleate species.12 All other bands below 2000 cm-1 are due to the v(C-C) stretch,
v(C-O) stretches, CH2 deformations and other motions that are too complex to assign51,52
37
and match those from the oleic acid spectrum, indicating the oleic acid chain is still
present.
The IR bands in the 2850-2960 cm-1 region arise from the CH2 symmetric and
asymmetric stretching, respectively,12,29,52 of the oleic acid carbon chain. The small band
at 3003 cm-1 is due to the v(C-H) mode of the C-H bond adjacent to the C=C bond of the
oleic acid, and the very small peak at around 1650 cm-1 is from this v(C=C) mode.52 A
broad v(O-H) stretch at 3400 cm-1 is present as well. This is attributed to hydrogen-
bonded hydroxyl groups.51,53 The v(O-H) stretch in the FT-IR spectrum of the magnetite
product at 3400cm-1 is more pronounced than in the oleic acid FT-IR. This feature is very
common in the FT-IR spectra acquired on polyol products. The two bands at 2400 cm-1
and 2390 cm-1 are from CO2 because the chamber was not purged with nitrogen prior to
acquiring the spectrum.
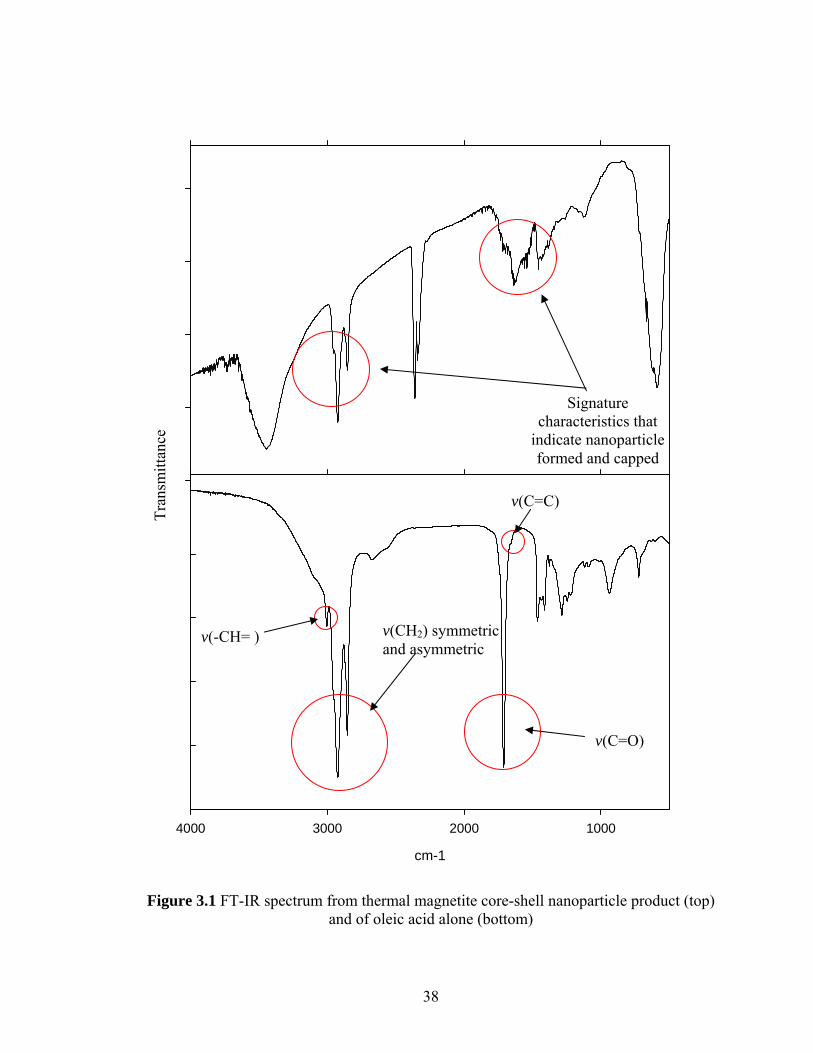
38
Tran
smitt
ance
cm-1
1000200030004000
Figure 3.1 FT-IR spectrum from thermal magnetite core-shell nanoparticle product (top) and of oleic acid alone (bottom)
Signature characteristics that
indicate nanoparticle formed and capped
v(C=O)
v(-CH= )
v(C=C)
v(CH2) symmetric and asymmetric
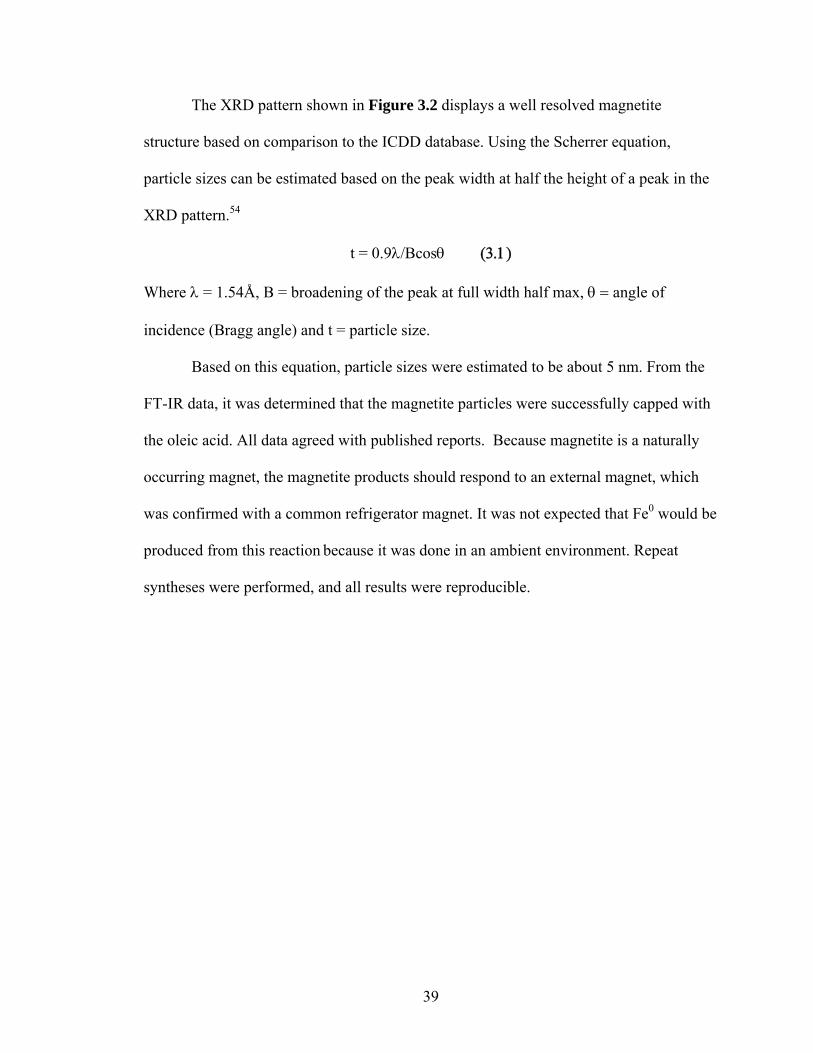
39
The XRD pattern shown in Figure 3.2 displays a well resolved magnetite
structure based on comparison to the ICDD database. Using the Scherrer equation,
particle sizes can be estimated based on the peak width at half the height of a peak in the
XRD pattern.54
t = 0.9λ/Bcosθ (3.1)
Where λ = 1.54Å, B = broadening of the peak at full width half max, θ = angle of
incidence (Bragg angle) and t = particle size.
Based on this equation, particle sizes were estimated to be about 5 nm. From the
FT-IR data, it was determined that the magnetite particles were successfully capped with
the oleic acid. All data agreed with published reports. Because magnetite is a naturally
occurring magnet, the magnetite products should respond to an external magnet, which
was confirmed with a common refrigerator magnet. It was not expected that Fe0 would be
produced from this reaction because it was done in an ambient environment. Repeat
syntheses were performed, and all results were reproducible.
40
2θ
10 20 30 40 50 60 70
10 20 30 40 50 60 70
Figure 3.2 XRD pattern from thermal polyol magnetite core-shell nanoparticle product (top) and ICDD database diffraction pattern of Fe3O4 with labeled Miller-index planes
(bottom)
(220)
(311)
(400) (511)
(440)
Magnetite Fe3O4
41
3.3 Fe0 Core-shell Nanoparticle Synthesis Attempts: Thermal and Microwave After the published results of core-shell magnetite nanoparticles had been
repeated, and reproducibility established, syntheses of Fe0 core-shell nanoparticle were
attempted. Table 3.2 summarizes reaction conditions for these reactions.
Sample # Type Capping
Agent Reducing Agent Solvent Metal Salt Variation
1 Fe w/N2 oleic acid 1,2-hexadecanediol octyl ether Fe (Acac)2
N2 rather than air
2 Fe w/ N2 oleic acid 1,2-hexadecanediol octyl ether Fe (Acac)2
capping agent concentration reduced by ½
3 Fe w/ N2 oleic acid 1,2-hexadecanediol octyl ether Fe (Acac)2
capping agent concentration reduced by ¼
4 Fe w/ N2 oleic acid 1,2-hexadecanediol octyl ether Fe (Acac)2
Repeat of #1,2,and3
Table 3.2 Summary of thermal polyol Fe0 nanoparticle syntheses reagents and conditions
It was believed that removal of oxygen from the reaction vessel could produce a
fully reduced iron metal core via the polyol technique. There are published reports of
Co+2 becoming fully reduced to Co0 via similar polyol techniques at temperatures over
160°C.51 While the reduction potential of Co+2 to Co0 is –0.28 V, and Fe+2 to Fe0 has a
slightly more negative reduction potential of –0.447 V, it was hypothesized that Fe0 may
be produced via similar techniques. The product of this synthesis was a black waxy
material whereas powders were produced from the magnetite syntheses. Figures 3.3 and
3.4 display the FT-IR spectrum and XRD pattern, respectively, of the product from the
first Fe+2 to Fe0 attempt.
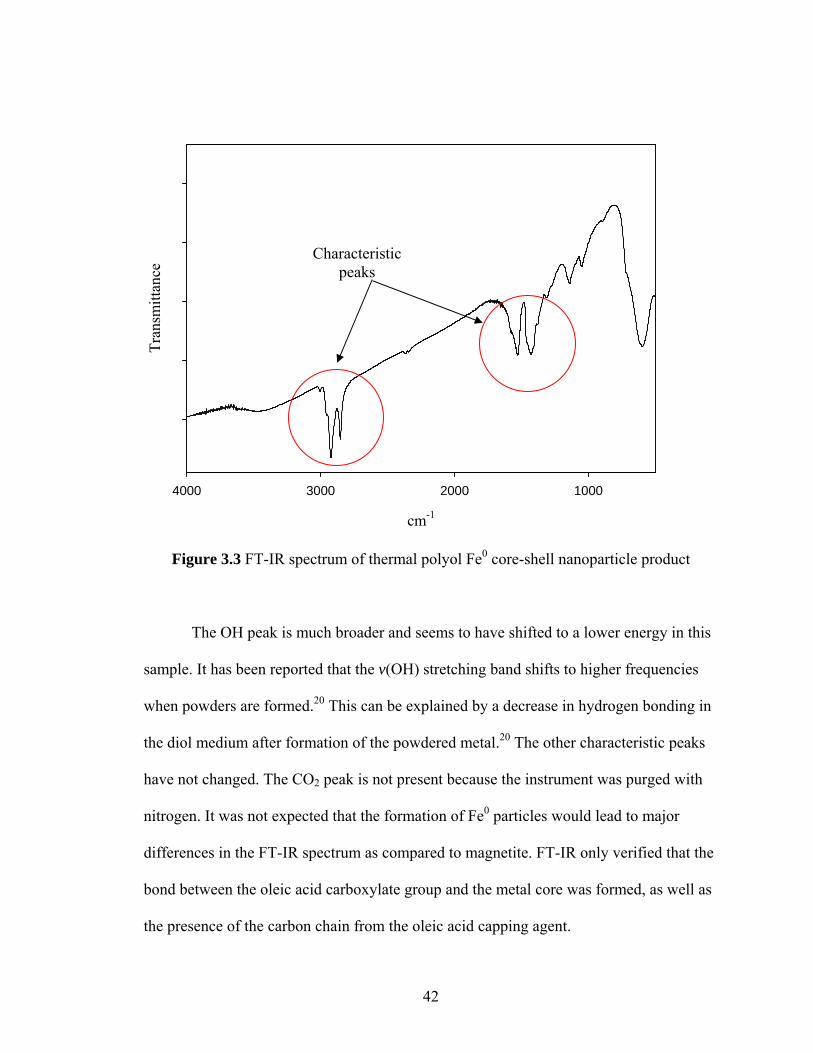
42
cm-1
1000200030004000
Tran
smitt
ance
Figure 3.3 FT-IR spectrum of thermal polyol Fe0 core-shell nanoparticle product
The OH peak is much broader and seems to have shifted to a lower energy in this
sample. It has been reported that the v(OH) stretching band shifts to higher frequencies
when powders are formed.20 This can be explained by a decrease in hydrogen bonding in
the diol medium after formation of the powdered metal.20 The other characteristic peaks
have not changed. The CO2 peak is not present because the instrument was purged with
nitrogen. It was not expected that the formation of Fe0 particles would lead to major
differences in the FT-IR spectrum as compared to magnetite. FT-IR only verified that the
bond between the oleic acid carboxylate group and the metal core was formed, as well as
the presence of the carbon chain from the oleic acid capping agent.
Characteristic peaks
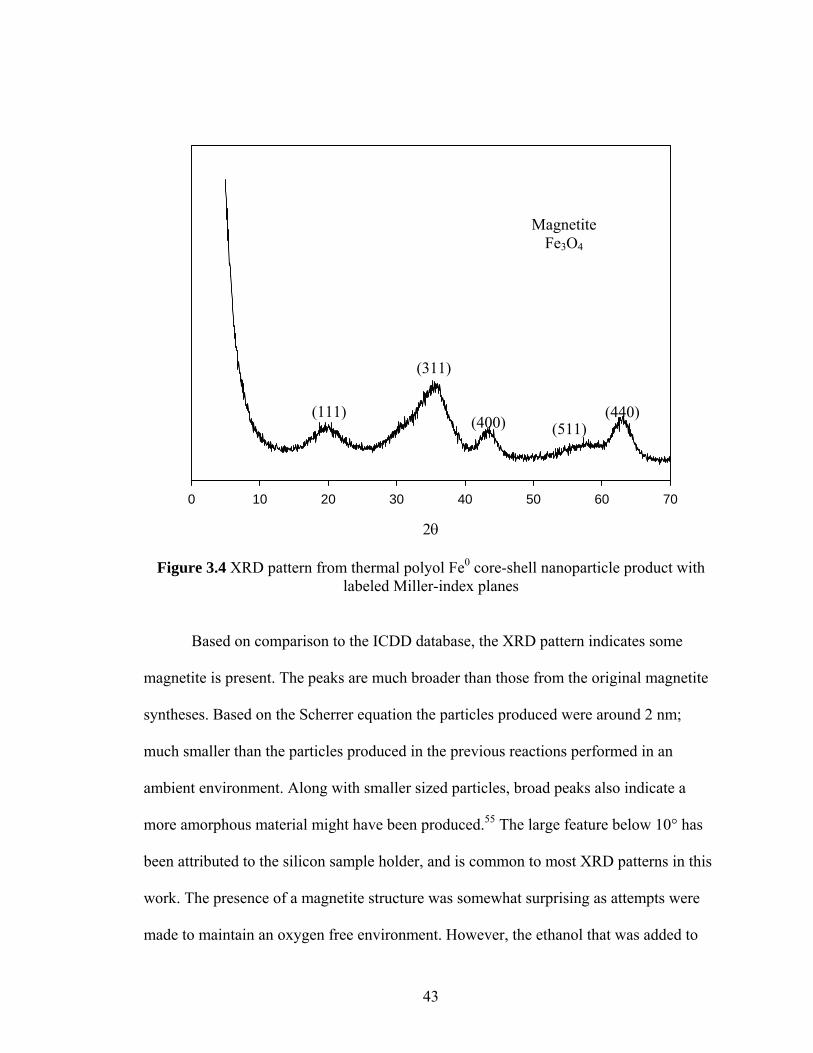
43
2θ
0 10 20 30 40 50 60 70
Figure 3.4 XRD pattern from thermal polyol Fe0 core-shell nanoparticle product with labeled Miller-index planes
Based on comparison to the ICDD database, the XRD pattern indicates some
magnetite is present. The peaks are much broader than those from the original magnetite
syntheses. Based on the Scherrer equation the particles produced were around 2 nm;
much smaller than the particles produced in the previous reactions performed in an
ambient environment. Along with smaller sized particles, broad peaks also indicate a
more amorphous material might have been produced.55 The large feature below 10° has
been attributed to the silicon sample holder, and is common to most XRD patterns in this
work. The presence of a magnetite structure was somewhat surprising as attempts were
made to maintain an oxygen free environment. However, the ethanol that was added to
(111)
(311)
(400) (511) (440)
Magnetite Fe3O4
44
precipitate the nanoparticles was not degassed and may have contained sufficient
dissolved oxygen to oxidize the product. Therefore, it cannot be concluded that Fe0 was
produced, but it cannot be ruled out either. Evidence of Fe0 in an XRD pattern would
consist of one large peak at approximately 45°.48 This feature is not present in this XRD
pattern. Repeat syntheses were performed with similar results.
3.3.1 Capping Agent Concentration Investigation of Fe0 Thermal Polyol Method
This investigation was done to determine if the capping agent concentration could
affect the ability to produce Fe0 core-shell nanoparticles via the polyol method. Table 3.3
summarizes the reaction conditions and reagents.
Sample # Type Capping
Agent Reducing Agent Solvent Metal Salt Variation
1 Fe w/N2
oleic acid 1,2-hexadecanediol octyl ether Fe (Acac)2
N2 rather than air
2 Fe w/ N2
oleic acid 1,2-hexadecanediol octyl ether Fe (Acac)2
capping agent
concentration reduced by ½
3 Fe w/ N2
oleic acid 1,2-hexadecanediol octyl ether Fe (Acac)2
capping agent
concentration reduced by ¼
Table 3.3 Summary of thermal polyol capping agent concentration investigation reagents and conditions
The FT-IR spectra of the three different capping agent concentrations (1 mmol,
0.5 mmol, and 0.75 mmol) are shown in Figure 3.5. Comparing the three FT-IR spectra,
the ratios of the vs(C=O) and va(C=O) stretching modes to the vs(-CH2) and va(-CH2)
stretching appeared to decrease as the capping agent concentration was reduced with the
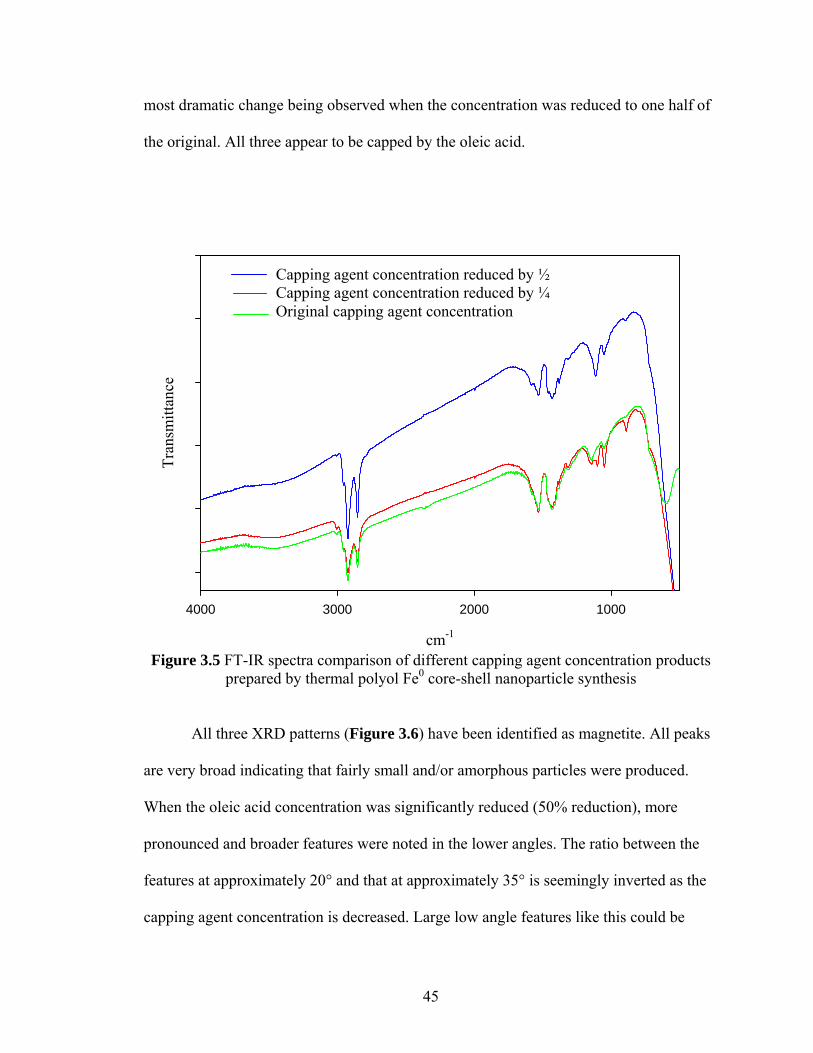
45
most dramatic change being observed when the concentration was reduced to one half of
the original. All three appear to be capped by the oleic acid.
cm-1
1000200030004000
Tran
smitt
ance
Figure 3.5 FT-IR spectra comparison of different capping agent concentration products
prepared by thermal polyol Fe0 core-shell nanoparticle synthesis
All three XRD patterns (Figure 3.6) have been identified as magnetite. All peaks
are very broad indicating that fairly small and/or amorphous particles were produced.
When the oleic acid concentration was significantly reduced (50% reduction), more
pronounced and broader features were noted in the lower angles. The ratio between the
features at approximately 20° and that at approximately 35° is seemingly inverted as the
capping agent concentration is decreased. Large low angle features like this could be
Capping agent concentration reduced by ½ Capping agent concentration reduced by ¼ Original capping agent concentration
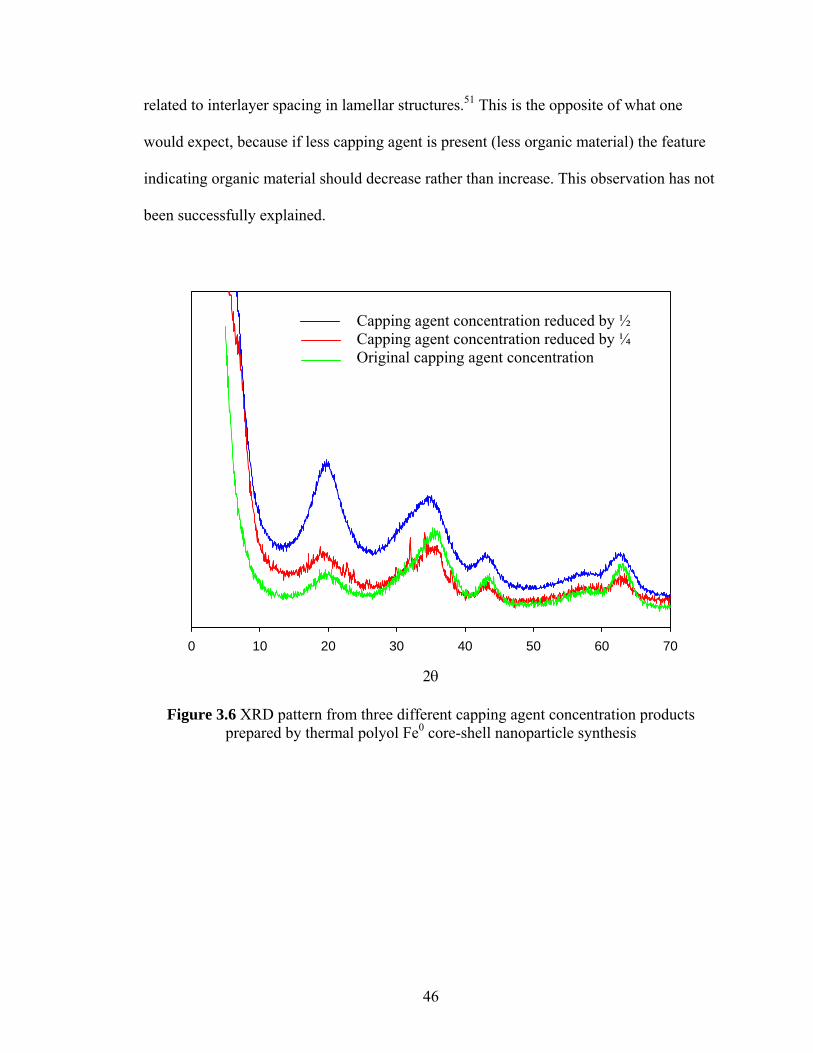
46
related to interlayer spacing in lamellar structures.51 This is the opposite of what one
would expect, because if less capping agent is present (less organic material) the feature
indicating organic material should decrease rather than increase. This observation has not
been successfully explained.
2θ
0 10 20 30 40 50 60 70
Figure 3.6 XRD pattern from three different capping agent concentration products prepared by thermal polyol Fe0 core-shell nanoparticle synthesis
Capping agent concentration reduced by ½ Capping agent concentration reduced by ¼ Original capping agent concentration
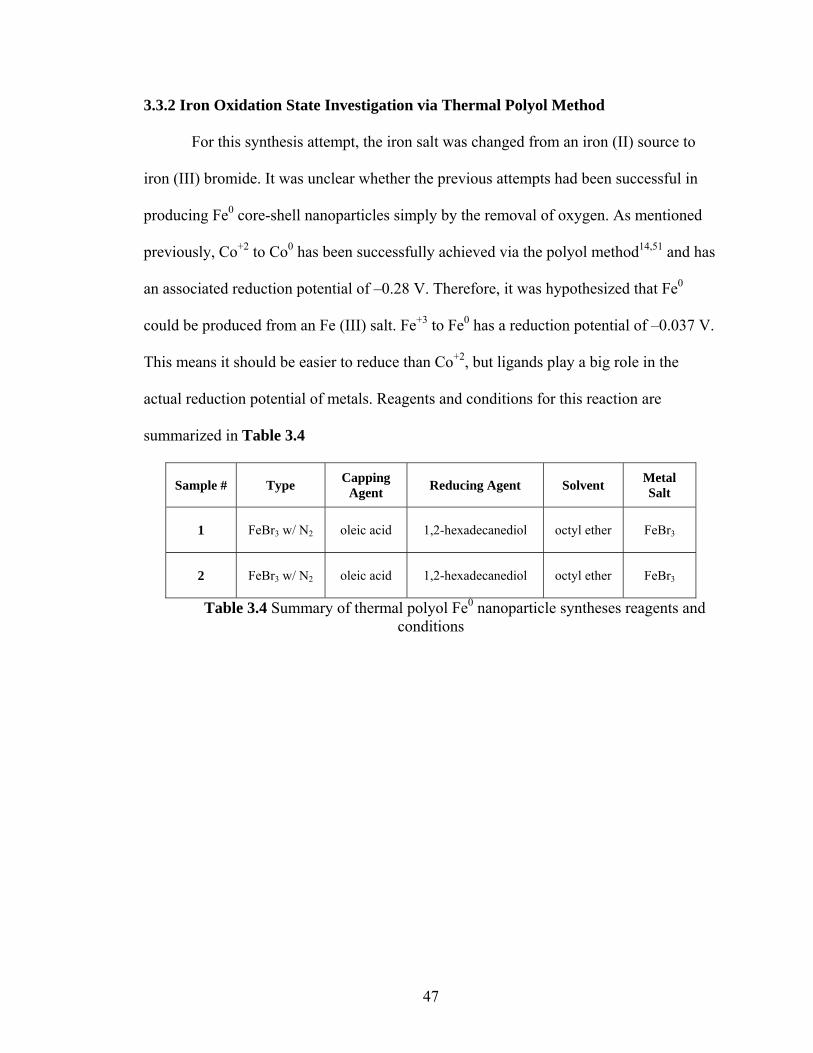
47
3.3.2 Iron Oxidation State Investigation via Thermal Polyol Method
For this synthesis attempt, the iron salt was changed from an iron (II) source to
iron (III) bromide. It was unclear whether the previous attempts had been successful in
producing Fe0 core-shell nanoparticles simply by the removal of oxygen. As mentioned
previously, Co+2 to Co0 has been successfully achieved via the polyol method14,51 and has
an associated reduction potential of –0.28 V. Therefore, it was hypothesized that Fe0
could be produced from an Fe (III) salt. Fe+3 to Fe0 has a reduction potential of –0.037 V.
This means it should be easier to reduce than Co+2, but ligands play a big role in the
actual reduction potential of metals. Reagents and conditions for this reaction are
summarized in Table 3.4
Sample # Type Capping Agent Reducing Agent Solvent Metal
Salt
1 FeBr3 w/ N2 oleic acid 1,2-hexadecanediol octyl ether FeBr3
2 FeBr3 w/ N2 oleic acid 1,2-hexadecanediol octyl ether FeBr3
Table 3.4 Summary of thermal polyol Fe0 nanoparticle syntheses reagents and conditions
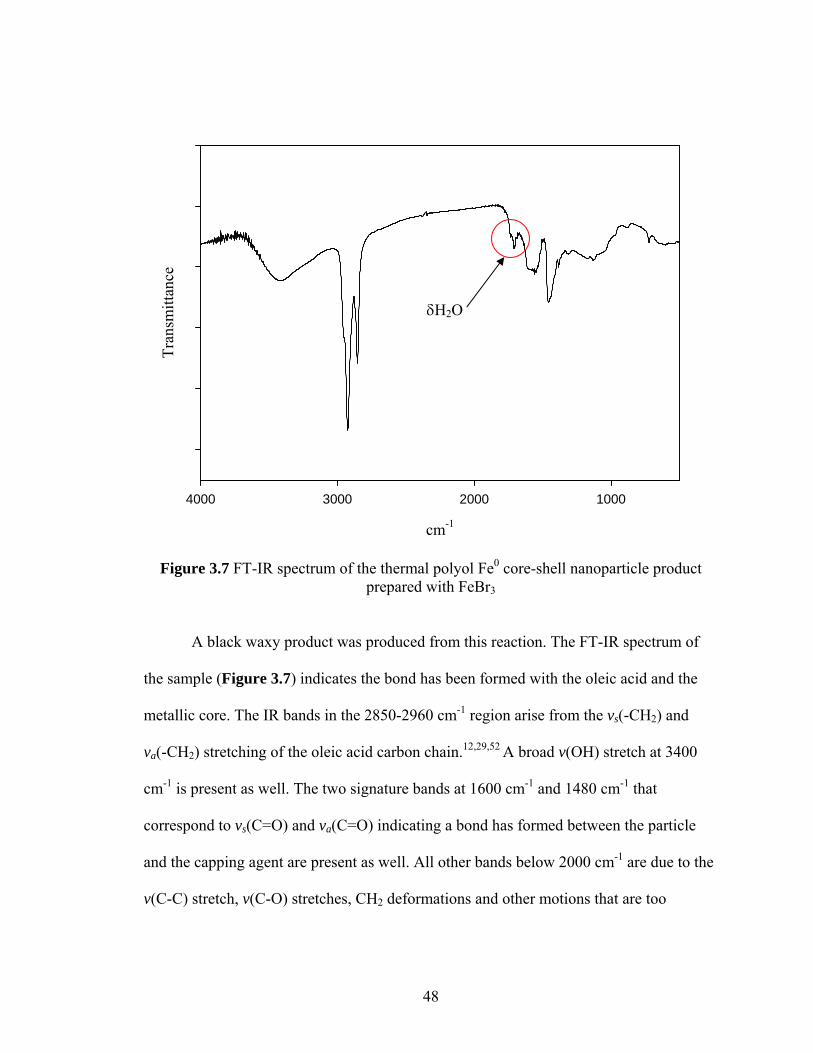
48
cm-1
1000200030004000
Tran
smitt
ance
Figure 3.7 FT-IR spectrum of the thermal polyol Fe0 core-shell nanoparticle product prepared with FeBr3
A black waxy product was produced from this reaction. The FT-IR spectrum of
the sample (Figure 3.7) indicates the bond has been formed with the oleic acid and the
metallic core. The IR bands in the 2850-2960 cm-1 region arise from the vs(-CH2) and
va(-CH2) stretching of the oleic acid carbon chain.12,29,52 A broad v(OH) stretch at 3400
cm-1 is present as well. The two signature bands at 1600 cm-1 and 1480 cm-1 that
correspond to vs(C=O) and va(C=O) indicating a bond has formed between the particle
and the capping agent are present as well. All other bands below 2000 cm-1 are due to the
v(C-C) stretch, v(C-O) stretches, CH2 deformations and other motions that are too
δH2O
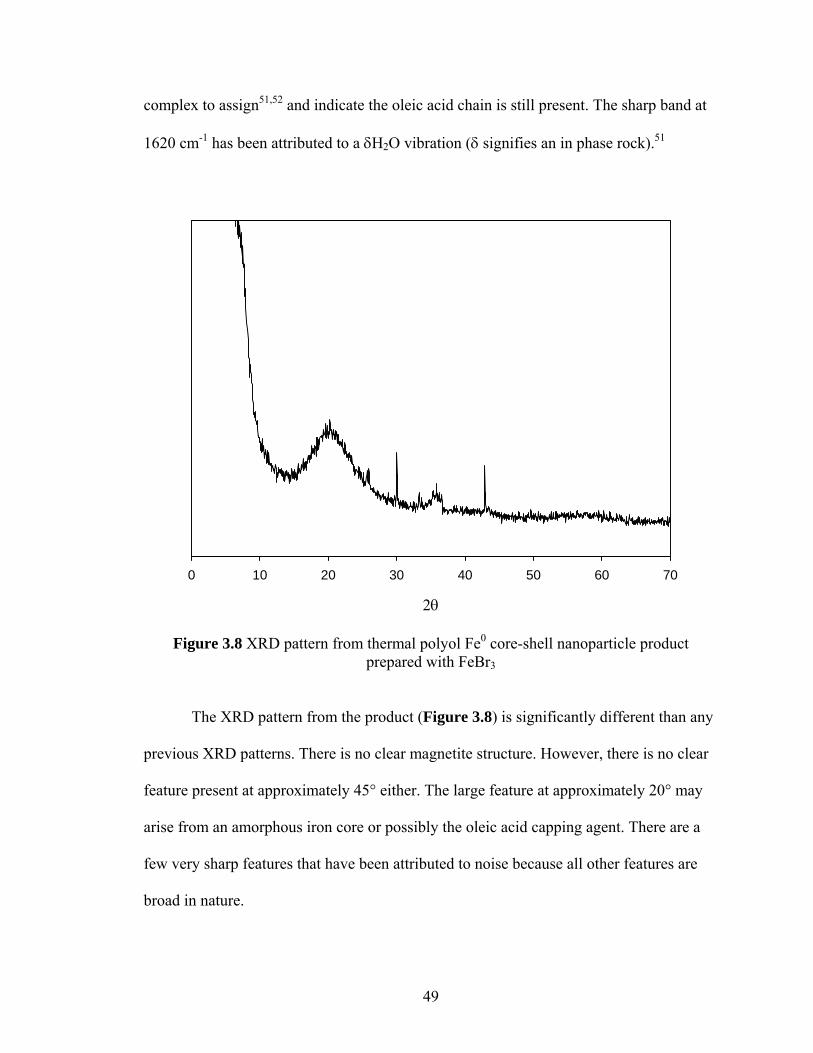
49
complex to assign51,52 and indicate the oleic acid chain is still present. The sharp band at
1620 cm-1 has been attributed to a δH2O vibration (δ signifies an in phase rock).51
2θ
0 10 20 30 40 50 60 70
Figure 3.8 XRD pattern from thermal polyol Fe0 core-shell nanoparticle product prepared with FeBr3
The XRD pattern from the product (Figure 3.8) is significantly different than any
previous XRD patterns. There is no clear magnetite structure. However, there is no clear
feature present at approximately 45° either. The large feature at approximately 20° may
arise from an amorphous iron core or possibly the oleic acid capping agent. There are a
few very sharp features that have been attributed to noise because all other features are
broad in nature.

50
3.3.3 Microwave Synthesis Attempt of Fe0 Core-shell Nanoparticles
Based on published reports, higher temperatures seem to facilitate the reduction of
metal salts via the polyol technique.15,51 Microwave energy was investigated for possible
higher reaction temperatures in localized hot spots analogous to those seen in
sonochemical reactions. Sonochemical methods have been successful in producing
amorphous Fe0 core-shell nanoparticles.46 The sonochemical method of producing these
Fe0 particles relies on localized hot spots created by acoustic cavitations in the
hydrocarbon solvent. Therefore, the microwave polyol technique was applied in attempts
to produce Fe0 core-shell nanoparticles. A summary of reagents used in the microwave
syntheses are listed in Table 3.5.
Sample # Type Capping agent Reducing agent Solvent Metal Salt Variation
MW1 Fe oleic acid 1,2-hexadecanediol octyl ether Fe (Acac)2
microwave heat source
(30min)
MW2 Fe oleic acid 1,2-hexadecanediol octyl ether Fe (Acac)2
Repeat of MW1
MW3 Fe oleic acid 1,2-hexadecanediol octyl ether Fe (Acac)2
Repeat of MW1
MW4 Fe oleic acid 1,2-hexadecanediol octyl ether Fe (Acac)2
Repeat of MW1
MW5 Fe oleic acid 1,2-hexadecanediol octyl ether Fe (Acac)2
Repeat of MW2
Table 3.5 Summary of microwave polyol Fe0 nanoparticle syntheses reagents and conditions
Unfortunately, the octyl ether has a very low dielectric constant, and does not
absorb microwave energy efficiently enough to achieve the temperatures reached during
thermal heating. Thermal heating brought the temperature of the solution to its boiling
point; 270°C, while microwave heating only achieved 190°C.

51
cm-1
1000200030004000
Tran
smitt
ance
Figure 3.9 FT-IR spectrum of the microwave polyol Fe0 core-shell nanoparticle product
The product of this reaction was a black waxy solid. The FT-IR spectrum from
the microwave polyol Fe0 core-shell nanoparticle synthesis (Figure 3.9) indicates that the
oleic acid has bonded to the metal surface. The ratio of the vs(C=O) and va(C=O) bands to
the vs(-CH2) and va(-CH2) bands is much higher in this spectrum than in previous spectra.
This could indicate that a larger concentration of oleic acid is bonded to the surface of the
particles. The v(OH) stretch is very broad and shifted to lower energies, similar to the
thermal polyol Fe0 particle attempt (Figure 3.3).

52
2θ
0 10 20 30 40 50 60 70
Figure 3.10 XRD pattern of microwave polyol Fe0 core-shell nanoparticle product
As is evident from the XRD pattern of this product (Figure 3.10), magnetite was
again formed. However, the peaks in the XRD are a lot sharper than the thermal Fe0 core-
shell nanoparticle synthesis attempt (Figure 3.4); more similar to the produces from the
thermal magnetite syntheses (Figure 3.2). Again, these sharp peaks indicate the presence
of a more crystalline structure. Also, larger particles were possibly produced.

53
Figure 3.11 TEM image of particles produced from microwave polyol Fe0 core-shell nanoparticle synthesis
TEM was employed to verify that spherical nanoparticles were produced from
this synthesis. The TEM image (Figure 3.11) indicates that fairly mono-dispersed
spherical particles were produced. The particles are in the 3-15 nm size range, which are
larger than the thermal Fe0 estimated particle size, which could explain why the peaks in
the XRD pattern are sharper than the thermal Fe0 product XRD pattern. After this initial

54
synthesis attempt failed to definitively produce Fe0, repeat syntheses were performed, but
similar results were obtained.
3.3.4 Solvent/Reducing Agent Investigation (1,2-hexanediol)
Microwave energy was investigated because the localized hot spots produced
during microwave syntheses could possibly facilitate the creation of an amorphous Fe0
core-shell nanoparticle. However, the dioctyl ether solvent has a very low dielectric
constant, and therefore did not couple well with the microwaves. The bulk solution did
not reach the temperatures that were reached in thermal heating (190°C vs. 270°C).
Because the solvent was not being heated, this meant the solvated iron salt was absorbing
the microwave energy. It has been reported that localized superheated regions, induced
from the interactions of microwave radiation with a metal powder, can enhance the yield
of a specific reaction without a significant change in the average temperature.56
Unfortunately, the desired results were not achieved with this set of reaction conditions.
Therefore, it was postulated that changing to a more polar solvent could produce
different results. Most polyol reactions from the literature use the polyol as the solvent
and the reducing agent. The most commonly used polyols are ethylene glycol and
tetraethylene glycol. Up to this point a solid diol reducing agent was used and dissolved
in an ether solvent. For the next set of experiments 1,2-hexanediol was chosen as the
new solvent/reducing agent because it has a much higher dielectric constant and should
be able to reach temperatures similar to those observed with thermal heating. Capping
agent and iron salt were also changed during the course of these experiments, but there
was no observed difference in the product’s characteristics based on these variations. To
the best of our knowledge there are no published reports utilizing this solvent/reducing
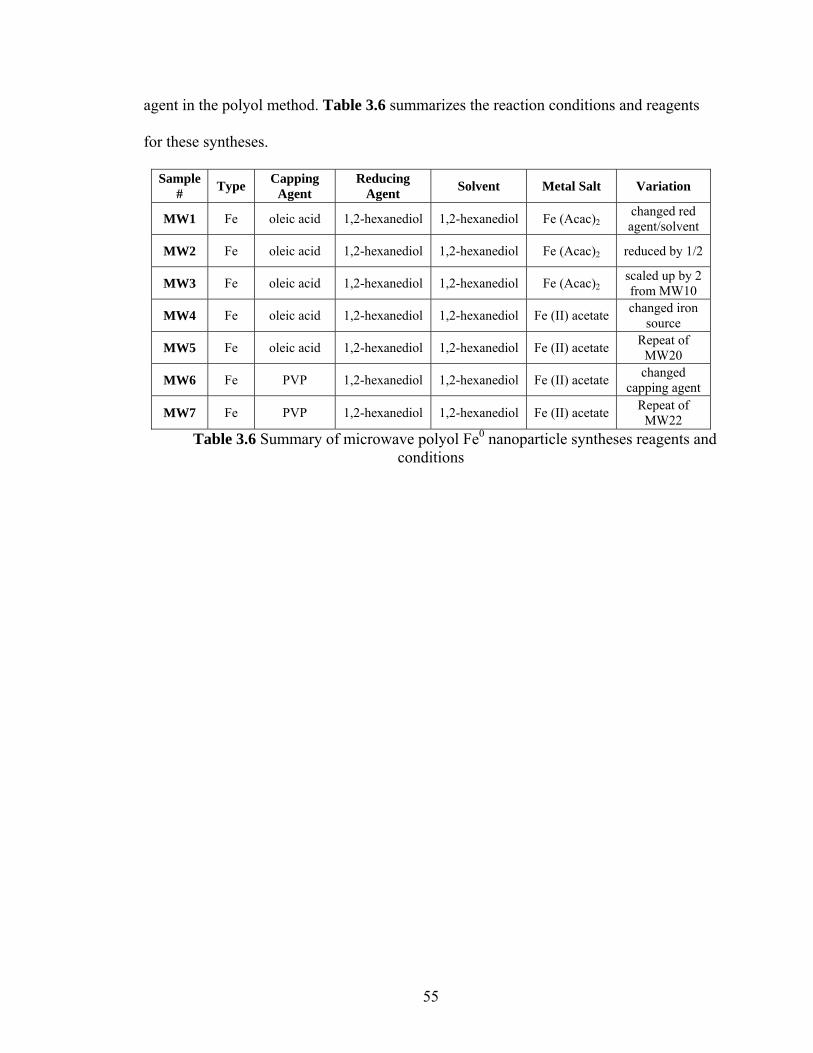
55
agent in the polyol method. Table 3.6 summarizes the reaction conditions and reagents
for these syntheses.
Sample # Type Capping
Agent Reducing
Agent Solvent Metal Salt Variation
MW1 Fe oleic acid 1,2-hexanediol 1,2-hexanediol Fe (Acac)2 changed red agent/solvent
MW2 Fe oleic acid 1,2-hexanediol 1,2-hexanediol Fe (Acac)2 reduced by 1/2
MW3 Fe oleic acid 1,2-hexanediol 1,2-hexanediol Fe (Acac)2 scaled up by 2 from MW10
MW4 Fe oleic acid 1,2-hexanediol 1,2-hexanediol Fe (II) acetate changed iron source
MW5 Fe oleic acid 1,2-hexanediol 1,2-hexanediol Fe (II) acetate Repeat of MW20
MW6 Fe PVP 1,2-hexanediol 1,2-hexanediol Fe (II) acetate changed capping agent
MW7 Fe PVP 1,2-hexanediol 1,2-hexanediol Fe (II) acetate Repeat of MW22
Table 3.6 Summary of microwave polyol Fe0 nanoparticle syntheses reagents and conditions

56
cm-1
1000200030004000
Tran
smitt
ance
Figure 3.12 FT-IR spectrum of the microwave polyol Fe0 core-shell nanoparticle synthesis product prepared with 1,2-hexanediol
The product of this synthesis was a tan powder. The FT-IR spectrum of the
product prepared with 1,2-hexanediol (Figure 3.12) resembled the FT-IR spectra from
the samples that were sparged with air during thermal heating (Figure 3.1). The v(OH)
stretch at 3400 cm-1 is very prevalent, and similar to the v(OH) stretch in the other spectra
of powders rather than waxes. There are a few features around 1000cm-1 that have been
attributed to v(C-O) stretches. These features along with the very pronounced OH peak
are possibly due to residual diol in the sample. The other characteristic peaks such as the
vs(-CH2) and va(-CH2) peaks in the 2850-2960 cm-1 region, and the two signature bands at
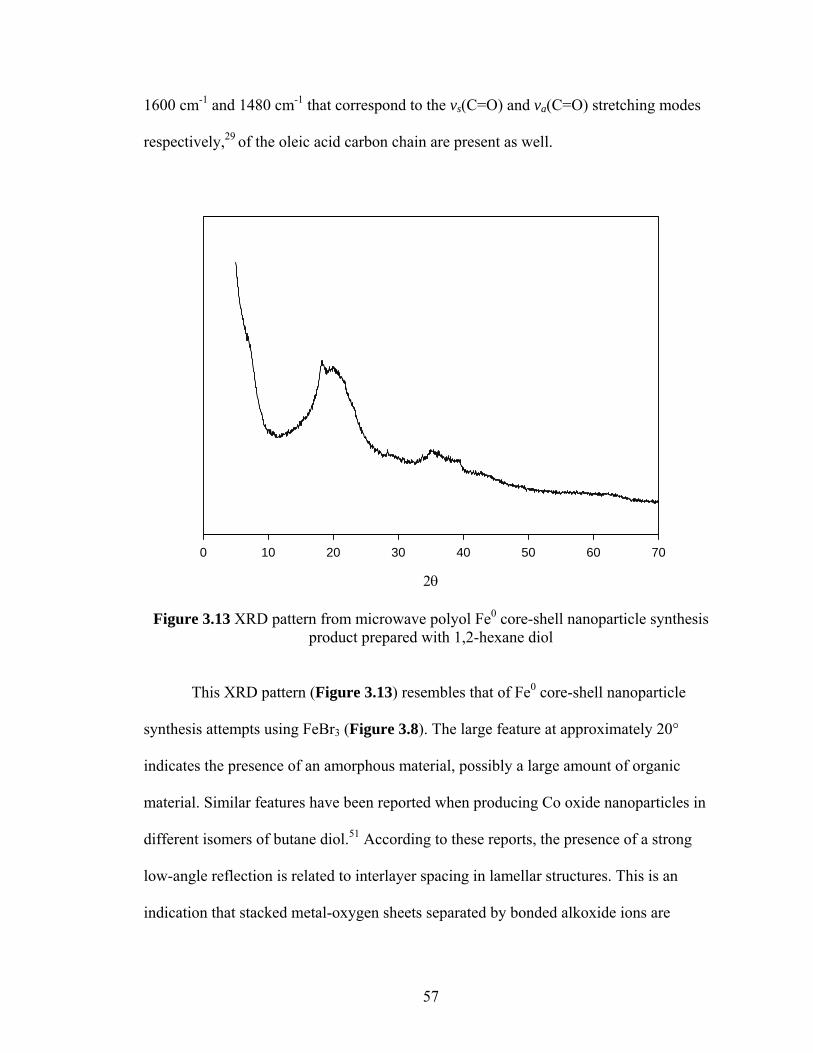
57
1600 cm-1 and 1480 cm-1 that correspond to the vs(C=O) and va(C=O) stretching modes
respectively,29 of the oleic acid carbon chain are present as well.
2θ
0 10 20 30 40 50 60 70
Figure 3.13 XRD pattern from microwave polyol Fe0 core-shell nanoparticle synthesis product prepared with 1,2-hexane diol
This XRD pattern (Figure 3.13) resembles that of Fe0 core-shell nanoparticle
synthesis attempts using FeBr3 (Figure 3.8). The large feature at approximately 20°
indicates the presence of an amorphous material, possibly a large amount of organic
material. Similar features have been reported when producing Co oxide nanoparticles in
different isomers of butane diol.51 According to these reports, the presence of a strong
low-angle reflection is related to interlayer spacing in lamellar structures. This is an
indication that stacked metal-oxygen sheets separated by bonded alkoxide ions are

58
present.51 This feature could also be attributed to residual diol in the sample which is
further supported by the FT-IR data. Even though there was no clear structure based on
the XRD pattern, TEM (Figure 3.14) indicates nanoparticles were produced.
Figure 3.14 TEM image of particles produced from microwave polyol Fe0 synthesis prepared with 1,2-hexanediol
The TEM image of the particles from this synthesis indicates that a fairly wide
range of sizes were produced. The particles appear to be spherical and range from
59
4 to 20 nm in diameter. After these new results were attained, additional syntheses were
performed and similar results were achieved.
3.3.5 Solvent/Reducing Agent Investigation (Polyethylene Glycol MW 600 g/mol)
In this set of experiments, PEG MW 600 g/mol was investigated as a possible
reducing agent/solvent for the microwave polyol method of synthesizing Fe0 core-shell
nanoparticles from an iron salt. Table 3.7 summarizes the reaction conditions and
reagents used in these syntheses.
Sample # Type Capping Agent Reducing Agent Solvent Metal Salt
MW1 Fe oleic acid PEG PEG Fe (Acac)2
MW2 Fe oleic acid PEG PEG Fe (Acac)2
Table 3.7 Summary of microwave polyol Fe0 nanoparticle syntheses reagents and conditions
To our knowledge, there have not been any published reports of this particular
PEG being used as a solvent/reducing agent for this method. The FT-IR spectrum of the
product (Figure 3.15) did show the two characteristic vs(C=O) and va(C=O) stretching
modes indicating that the particles had been capped with the oleic acid. The v(C=O)
stretch at 1710 cm-1 is absent from the spectrum, which also indicates the particles were
capped with the oleic acid. There are numerous features around 1000cm-1 that have been
attributed to the v(C-C) stretch, v(C-O) stretches, CH2 deformations and other motions
that are too complex to assign51,52. These features along with the very pronounced v(OH)
peak are possibly due to residual diol in the sample.
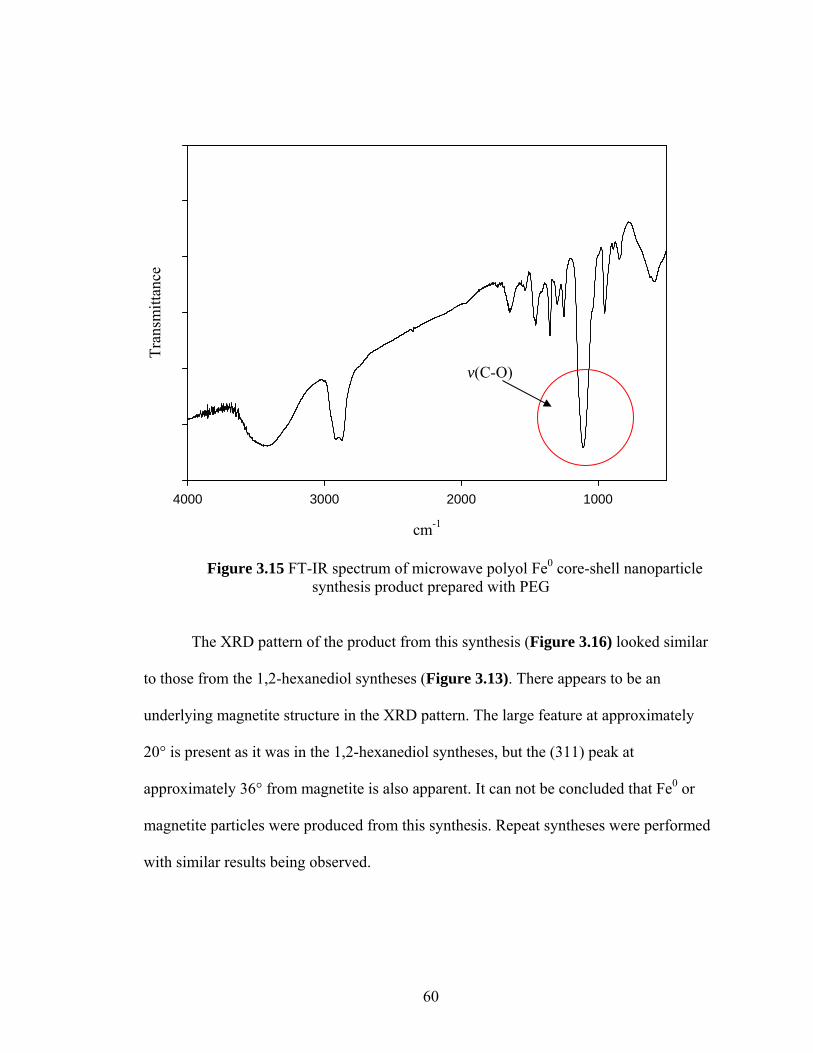
60
cm-1
1000200030004000
Tran
smitt
ance
Figure 3.15 FT-IR spectrum of microwave polyol Fe0 core-shell nanoparticle synthesis product prepared with PEG
The XRD pattern of the product from this synthesis (Figure 3.16) looked similar
to those from the 1,2-hexanediol syntheses (Figure 3.13). There appears to be an
underlying magnetite structure in the XRD pattern. The large feature at approximately
20° is present as it was in the 1,2-hexanediol syntheses, but the (311) peak at
approximately 36° from magnetite is also apparent. It can not be concluded that Fe0 or
magnetite particles were produced from this synthesis. Repeat syntheses were performed
with similar results being observed.
v(C-O)
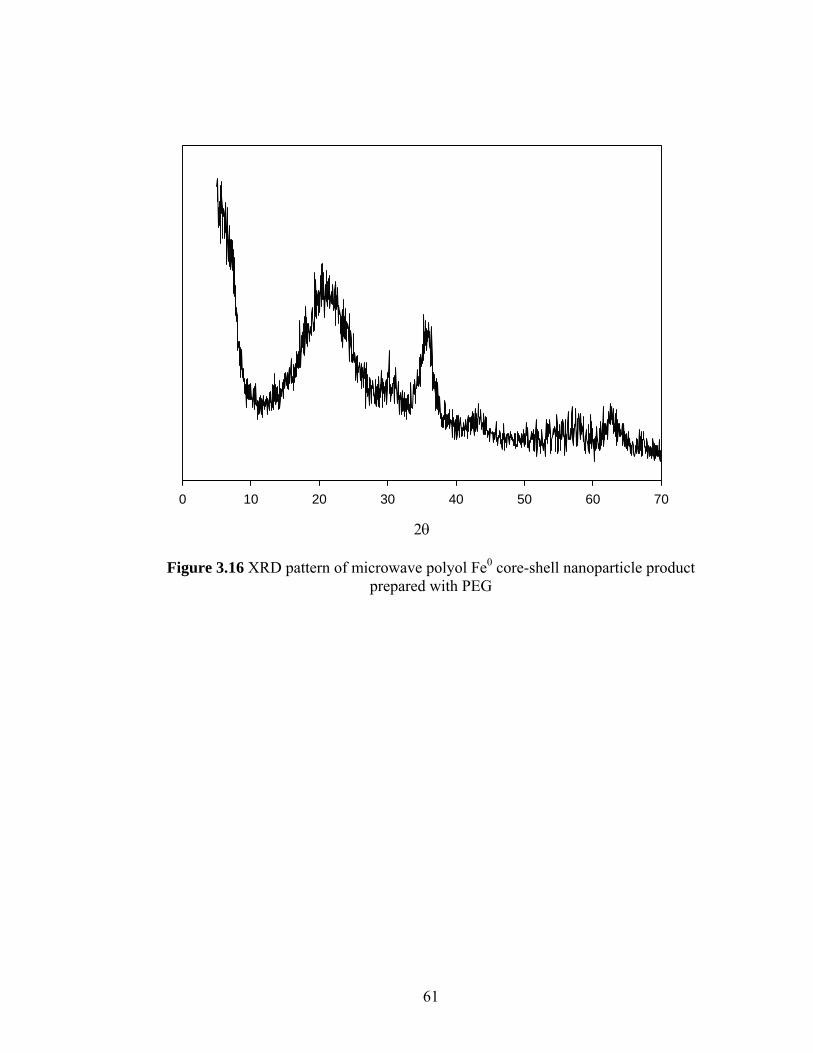
61
2θ
0 10 20 30 40 50 60 70
Figure 3.16 XRD pattern of microwave polyol Fe0 core-shell nanoparticle product prepared with PEG

62
Figure 3.17 TEM image of particles produced from microwave polyol Fe0 iron core-shell nanoparticle synthesis prepared with PEG
Based on the TEM image (Figure 3.17) of the nanoparticles formed during this
reaction, it appears that the particles are larger than the previous samples (10-20 nm). It
also appears that there is much more agglomeration of the particles. It has been reported
that particles produced in ethylene glycol possibly contain the diol along with capping

63
agent in their organic shell.20 There are also reports of higher molecular weight PEG
(MW 3000 g/mol) used as a capping agent for particles produced via microwave polyol.11
3.3.6 Microwave Magnetite Synthesis With 1,2-hexanediol and Oleylamine Co-capping Agent
Up to this point, it was concluded that magnetite core-shell nanoparticles had
been produced from thermal and microwave heating for the polyol method. These
nanoparticles were produced by following a published procedure that involved 1,2-
hexadecanediol dissolved in a long chain ether as the solvent/reducing agent. During the
course of the investigation into the polyol technique, 1,2-hexanediol proved to be an
interesting solvent/reducing agent. A disadvantage to 1,2-hexanediol vs. the ether was the
difficulty in removing the high boiling point diol from the precipitate. A benefit was the
elimination of the precipitation step with ethanol.
It was unclear if 1,2-hexanediol had succeeded in producing Fe0 particles, because
techniques such as X-ray photoelectron spectroscopic (XPS) technique, which has been
used in the literature to characterize amorphous iron nanoparticles8, was not available.
However, it was clear that magnetite core-shell nanoparticles had not been produced with
1,2-hexanediol. In order to try to reproduce the magnetite core-shell nanoparticles, the
co-capping agent oleylamine was used as per the original magnetite procedure.33,49 It has
been reported that the use of oleic acid and oleylamine together yields a greater amount
of magnetite particles than either one alone.57 The bonding of oleylamine to the magnetite
particle has been explained by its coordination to Fe (III) on the surface of the magnetite
particle. 57 Table 3.8 summarizes the reagents and reaction conditions.
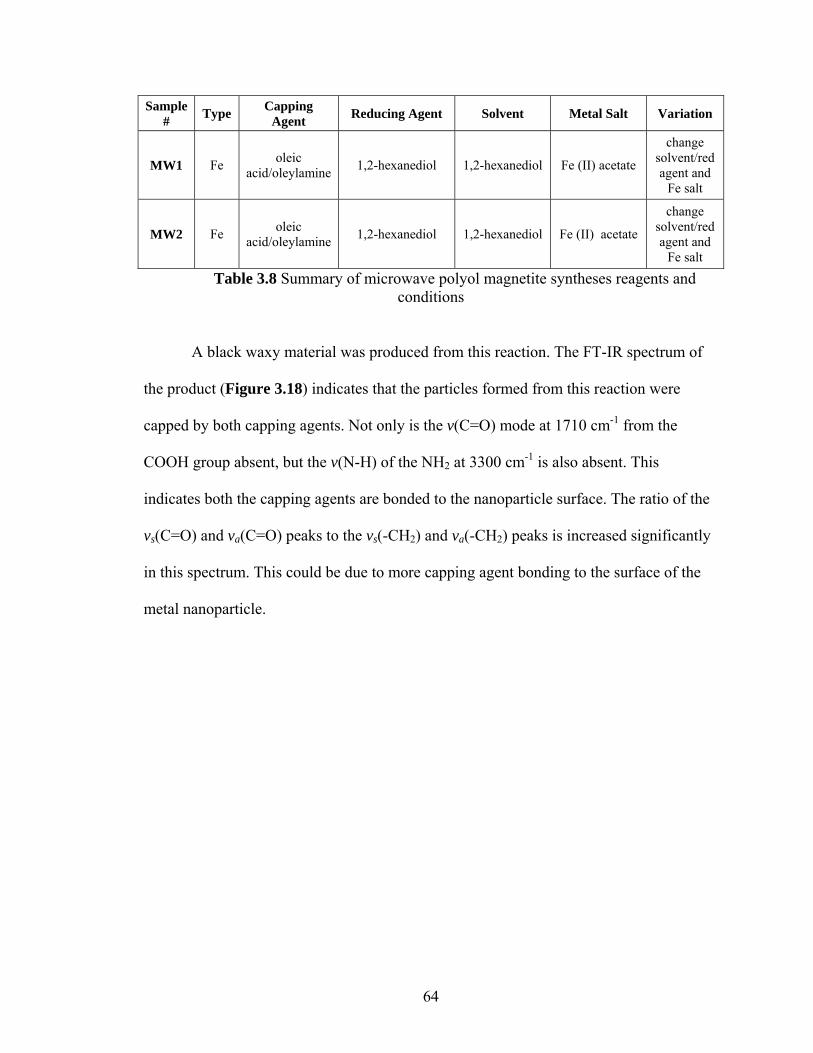
64
Sample # Type Capping
Agent Reducing Agent Solvent Metal Salt Variation
MW1 Fe oleic acid/oleylamine 1,2-hexanediol 1,2-hexanediol Fe (II) acetate
change solvent/red agent and
Fe salt
MW2 Fe oleic acid/oleylamine 1,2-hexanediol 1,2-hexanediol Fe (II) acetate
change solvent/red agent and
Fe salt
Table 3.8 Summary of microwave polyol magnetite syntheses reagents and conditions
A black waxy material was produced from this reaction. The FT-IR spectrum of
the product (Figure 3.18) indicates that the particles formed from this reaction were
capped by both capping agents. Not only is the v(C=O) mode at 1710 cm-1 from the
COOH group absent, but the v(N-H) of the NH2 at 3300 cm-1 is also absent. This
indicates both the capping agents are bonded to the nanoparticle surface. The ratio of the
vs(C=O) and va(C=O) peaks to the vs(-CH2) and va(-CH2) peaks is increased significantly
in this spectrum. This could be due to more capping agent bonding to the surface of the
metal nanoparticle.
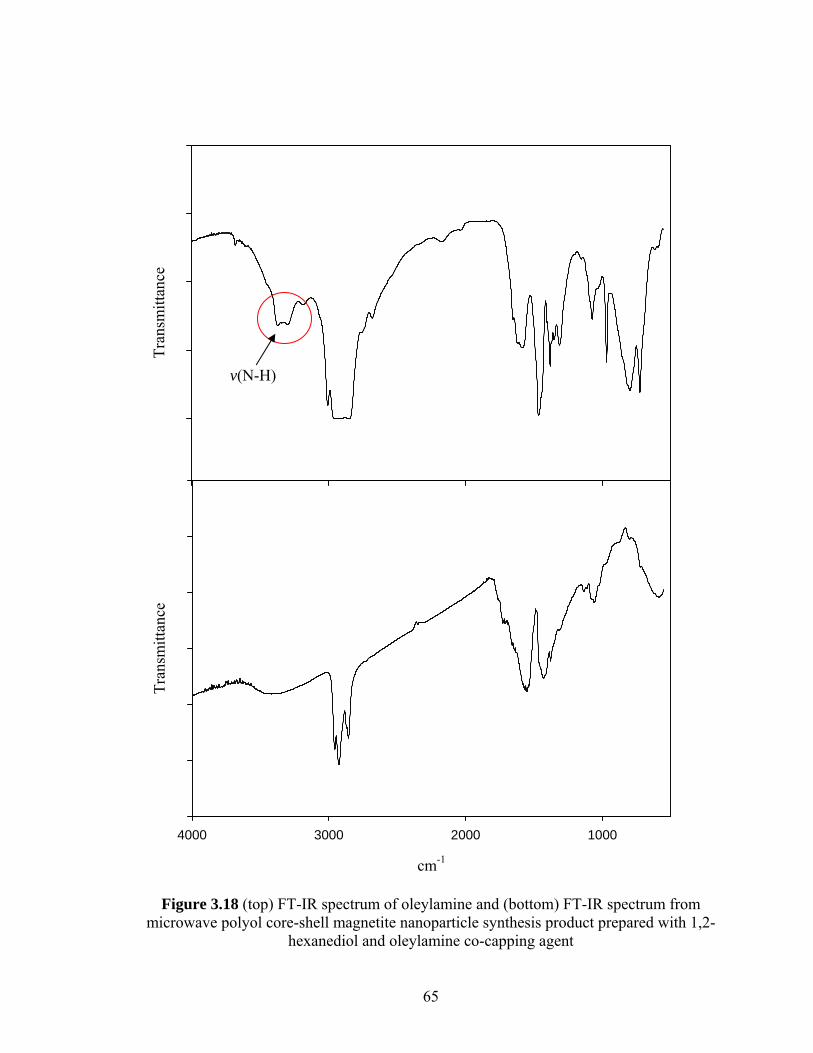
65
cm-1
1000200030004000
Tran
smitt
ance
Tran
smitt
ance
Figure 3.18 (top) FT-IR spectrum of oleylamine and (bottom) FT-IR spectrum from microwave polyol core-shell magnetite nanoparticle synthesis product prepared with 1,2-
hexanediol and oleylamine co-capping agent
v(N-H)

66
The XRD pattern (Figure 3.19) indicates a magnetite structure. There is a
difference in the magnetite XRD pattern produced from this reaction vs. the magnetite
XRD patterns produced previously (Figure 3.2 and Figure 3.10). There is a large broad
feature at approximately 20°. This feature could be attributed to a large amount of
organic molecules present or a lamellar structure. This was the first time this solvent was
successfully removed, and the first instance of microwave heating producing magnetite
with 1,2-hexanediol.
2θ
0 10 20 30 40 50 60 70
Figure 3.19 XRD pattern from microwave polyol magnetite core-shell nanoparticle synthesis product prepared with 1,2-hexanediol and oleylamine co-capping agent

67
AFM and TEM analysis were performed on the sample (Figure 3.20 and Figure
3.21). Both indicate that spherical particles were formed. Based on these images, the
particle sizes ranged from 9 –to 20 nm in diameter, which is in agreement with particle
size estimates based on the XRD pattern. Repeat syntheses were performed with similar
results.
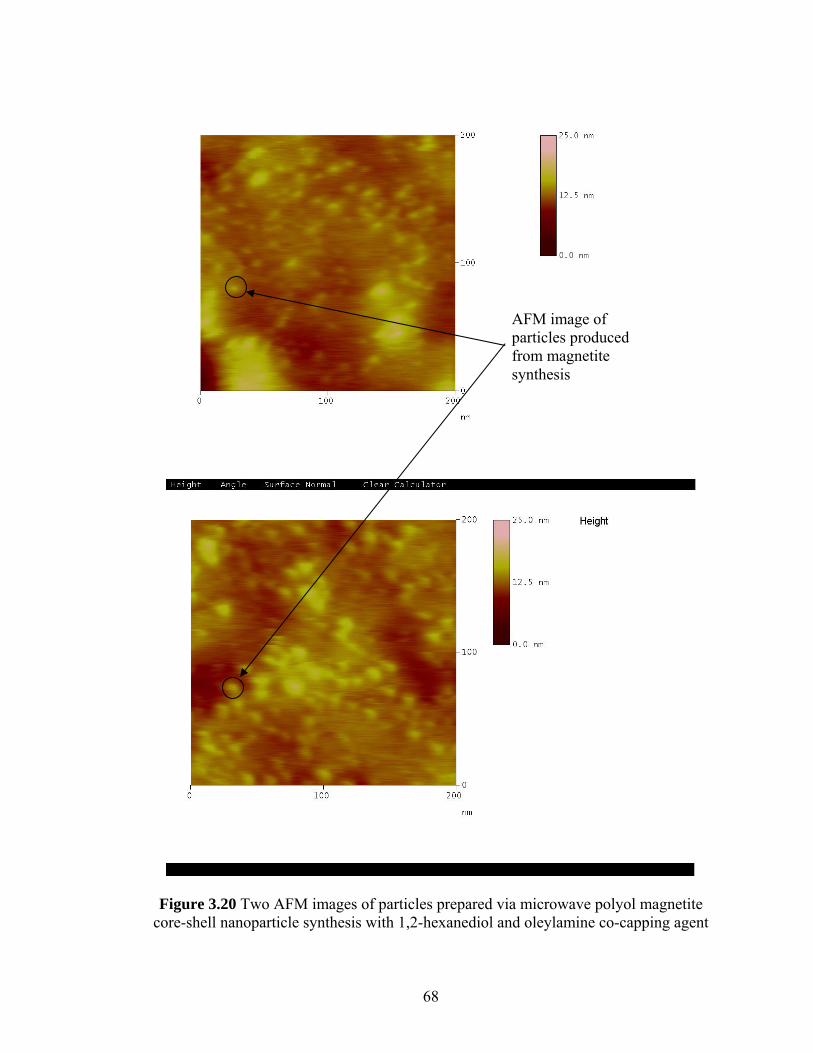
68
Figure 3.20 Two AFM images of particles prepared via microwave polyol magnetite core-shell nanoparticle synthesis with 1,2-hexanediol and oleylamine co-capping agent
AFM image of particles produced from magnetite synthesis
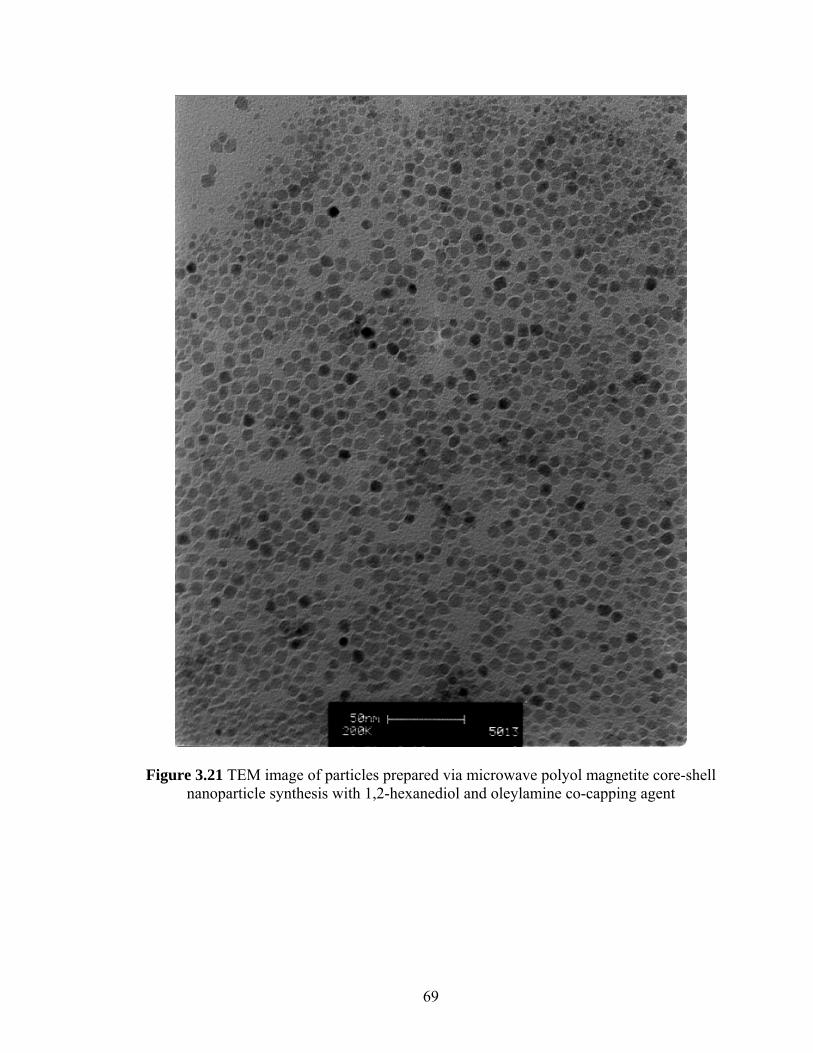
69
Figure 3.21 TEM image of particles prepared via microwave polyol magnetite core-shell nanoparticle synthesis with 1,2-hexanediol and oleylamine co-capping agent

70
3.4 Microwave Time Investigation
To investigate the effect of time spent in the microwave, three identical reactions
were performed varying only the reaction time. The reagents and reaction conditions are
summarized in Table 3.9.
Sample # Type Capping
Agent Reducing Agent Solvent Metal Salt Variation
MW1 Fe oleic acid 1,2-hexadecanediol octyl ether Fe (Acac)2
increased to 50min
MW2 Fe oleic acid 1,2-hexadecanediol octyl ether Fe (Acac)2
reduced time to 20min
MW3 Fe oleic acid 1,2-hexadecanediol octyl ether Fe (Acac)2
reduced time to 10min
Table 3.9 Summary of microwave polyol time investigation reagents and conditions
Figure 3.22 depicts the FT-IR spectra comparison of the products from the three
microwave heating times, and they seem to show that the longer reaction times resulted
in materials that displayed weaker bands in their FT-IR spectra. The XRD patterns from
these reaction products were all similar, and all showed a magnetite structure.
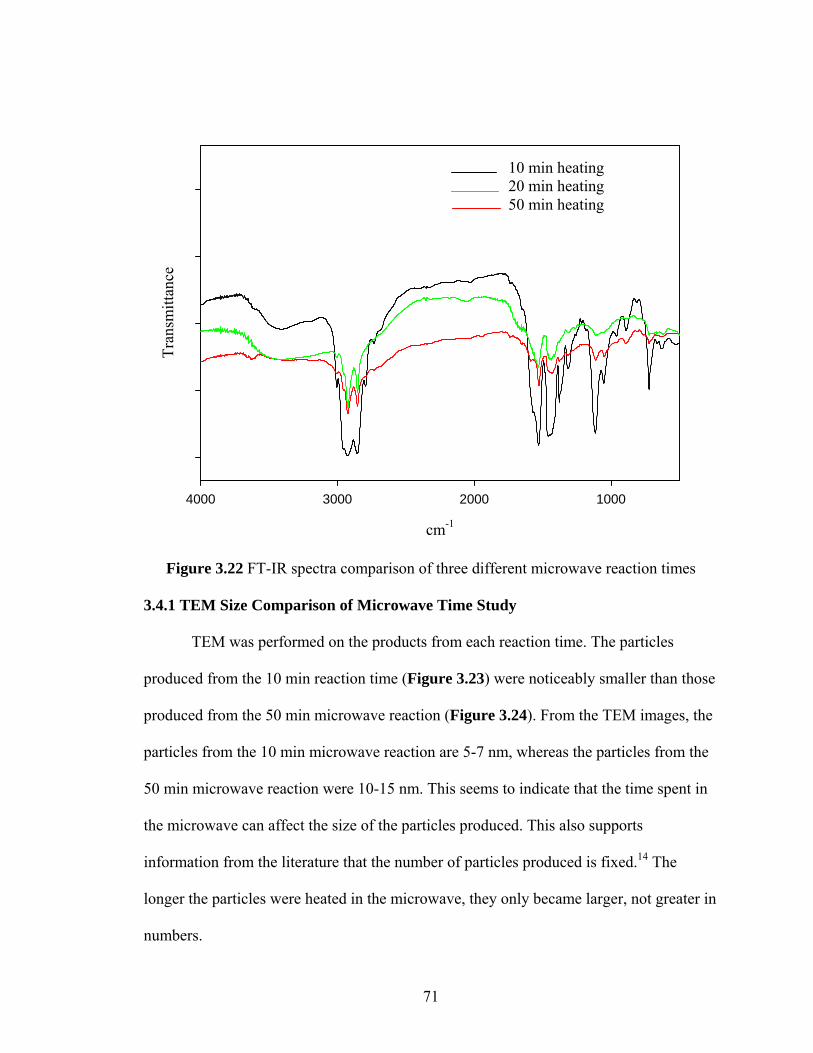
71
cm-1
1000200030004000
Tran
smitt
ance
Figure 3.22 FT-IR spectra comparison of three different microwave reaction times
3.4.1 TEM Size Comparison of Microwave Time Study
TEM was performed on the products from each reaction time. The particles
produced from the 10 min reaction time (Figure 3.23) were noticeably smaller than those
produced from the 50 min microwave reaction (Figure 3.24). From the TEM images, the
particles from the 10 min microwave reaction are 5-7 nm, whereas the particles from the
50 min microwave reaction were 10-15 nm. This seems to indicate that the time spent in
the microwave can affect the size of the particles produced. This also supports
information from the literature that the number of particles produced is fixed.14 The
longer the particles were heated in the microwave, they only became larger, not greater in
numbers.
10 min heating 20 min heating 50 min heating
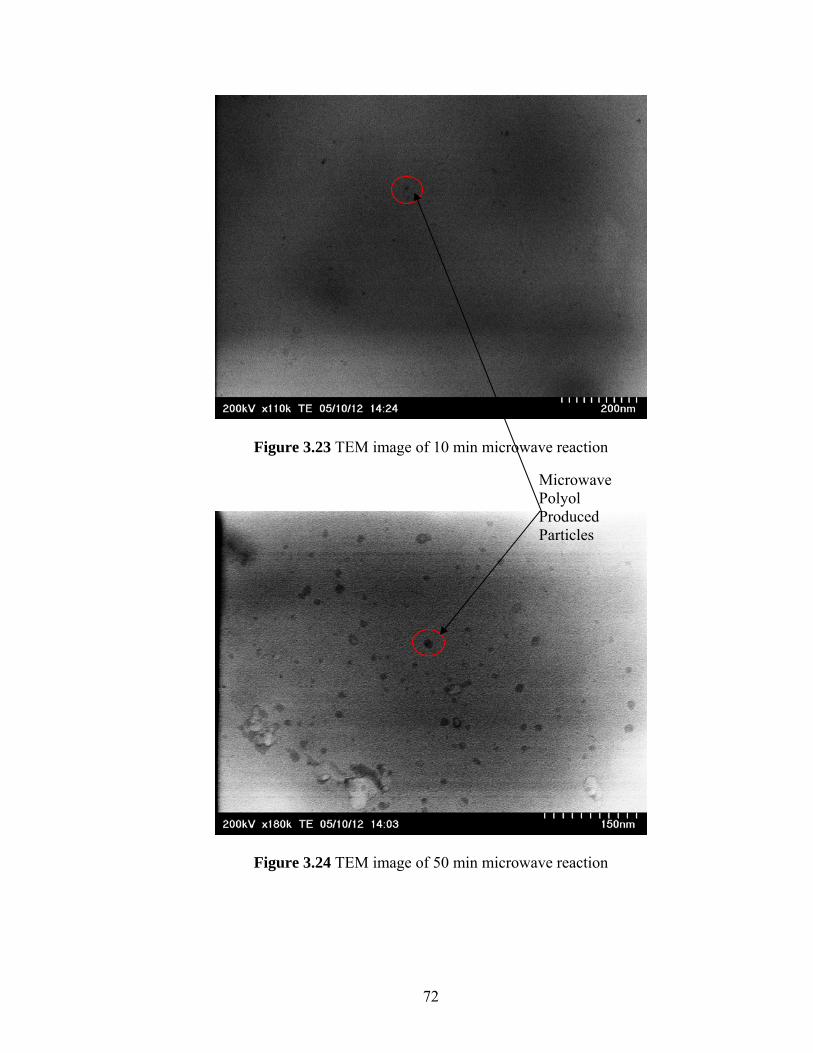
72
Figure 3.23 TEM image of 10 min microwave reaction
Figure 3.24 TEM image of 50 min microwave reaction
Microwave Polyol Produced Particles
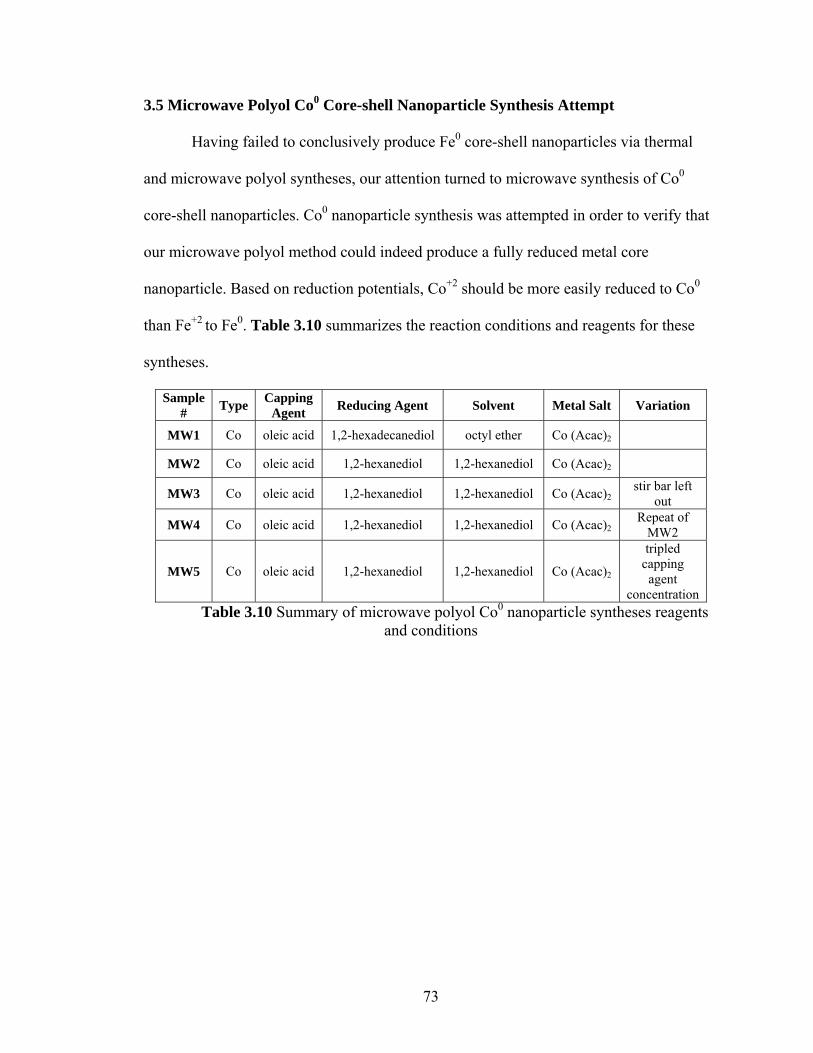
73
3.5 Microwave Polyol Co0 Core-shell Nanoparticle Synthesis Attempt
Having failed to conclusively produce Fe0 core-shell nanoparticles via thermal
and microwave polyol syntheses, our attention turned to microwave synthesis of Co0
core-shell nanoparticles. Co0 nanoparticle synthesis was attempted in order to verify that
our microwave polyol method could indeed produce a fully reduced metal core
nanoparticle. Based on reduction potentials, Co+2 should be more easily reduced to Co0
than Fe+2 to Fe0. Table 3.10 summarizes the reaction conditions and reagents for these
syntheses.
Sample # Type Capping
Agent Reducing Agent Solvent Metal Salt Variation
MW1 Co oleic acid 1,2-hexadecanediol octyl ether Co (Acac)2
MW2 Co oleic acid 1,2-hexanediol 1,2-hexanediol Co (Acac)2
MW3 Co oleic acid 1,2-hexanediol 1,2-hexanediol Co (Acac)2 stir bar left
out
MW4 Co oleic acid 1,2-hexanediol 1,2-hexanediol Co (Acac)2 Repeat of
MW2
MW5 Co oleic acid 1,2-hexanediol 1,2-hexanediol Co (Acac)2
tripled capping agent
concentration Table 3.10 Summary of microwave polyol Co0 nanoparticle syntheses reagents
and conditions
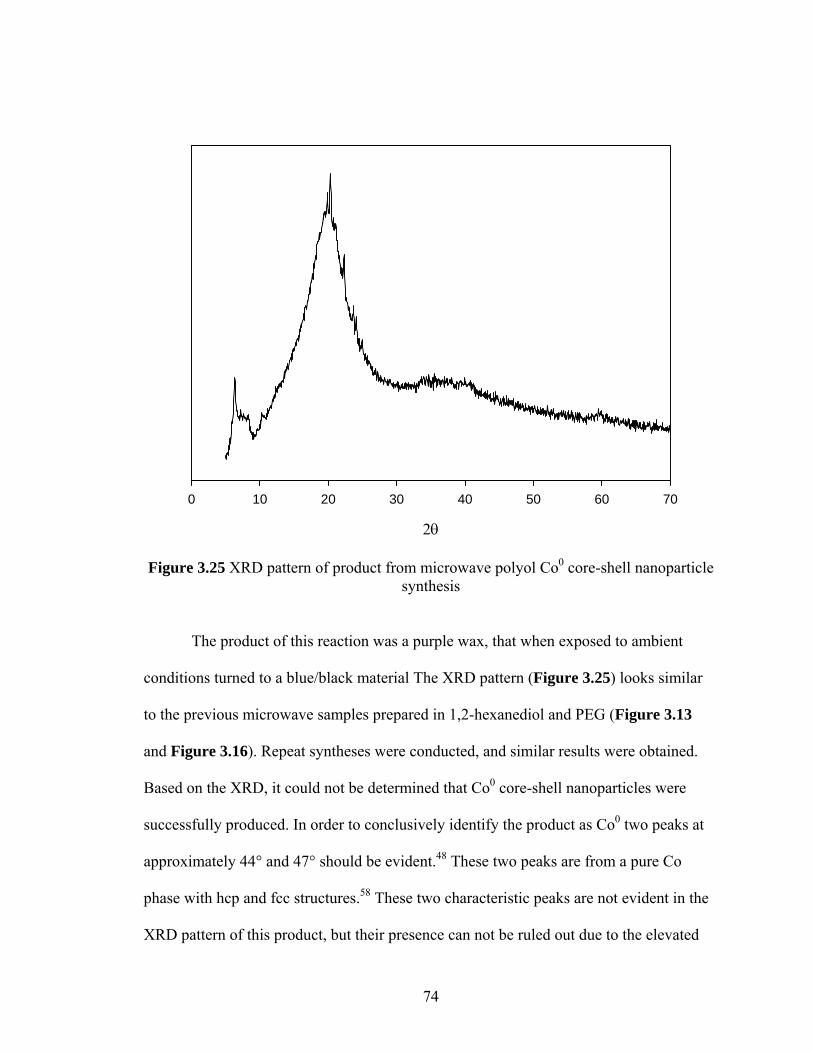
74
2θ
0 10 20 30 40 50 60 70
Figure 3.25 XRD pattern of product from microwave polyol Co0 core-shell nanoparticle synthesis
The product of this reaction was a purple wax, that when exposed to ambient
conditions turned to a blue/black material The XRD pattern (Figure 3.25) looks similar
to the previous microwave samples prepared in 1,2-hexanediol and PEG (Figure 3.13
and Figure 3.16). Repeat syntheses were conducted, and similar results were obtained.
Based on the XRD, it could not be determined that Co0 core-shell nanoparticles were
successfully produced. In order to conclusively identify the product as Co0 two peaks at
approximately 44° and 47° should be evident.48 These two peaks are from a pure Co
phase with hcp and fcc structures.58 These two characteristic peaks are not evident in the
XRD pattern of this product, but their presence can not be ruled out due to the elevated
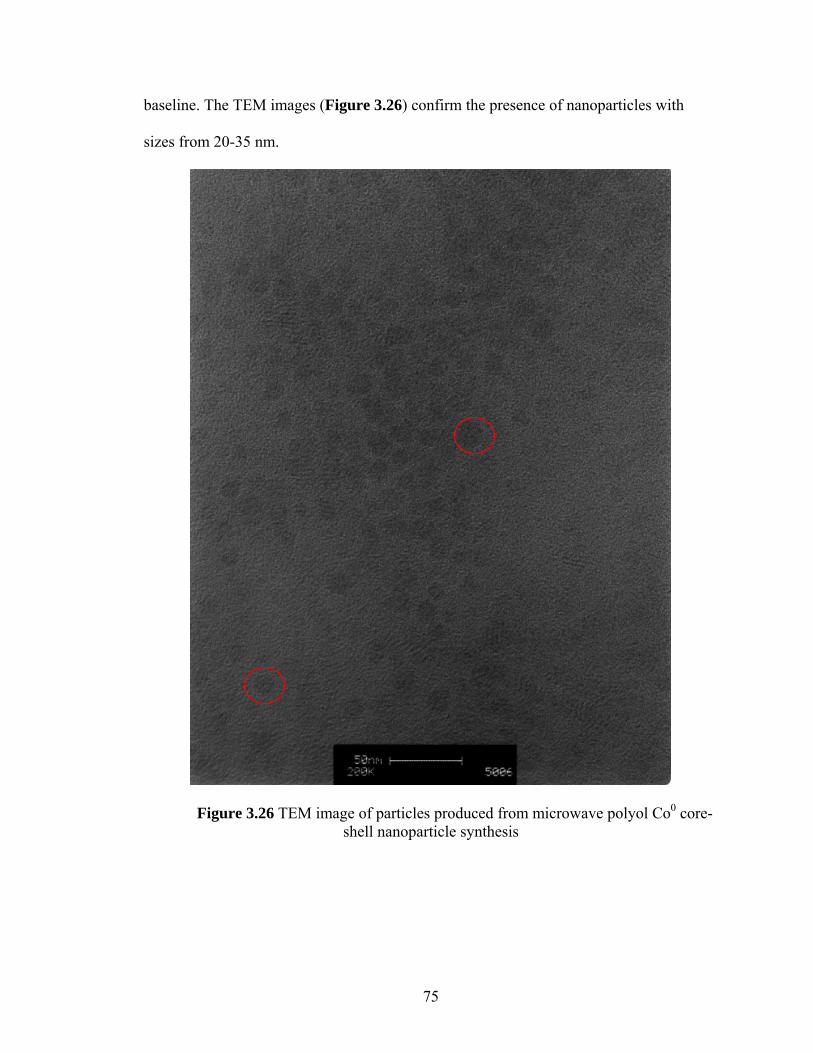
75
baseline. The TEM images (Figure 3.26) confirm the presence of nanoparticles with
sizes from 20-35 nm.
Figure 3.26 TEM image of particles produced from microwave polyol Co0 core-shell nanoparticle synthesis
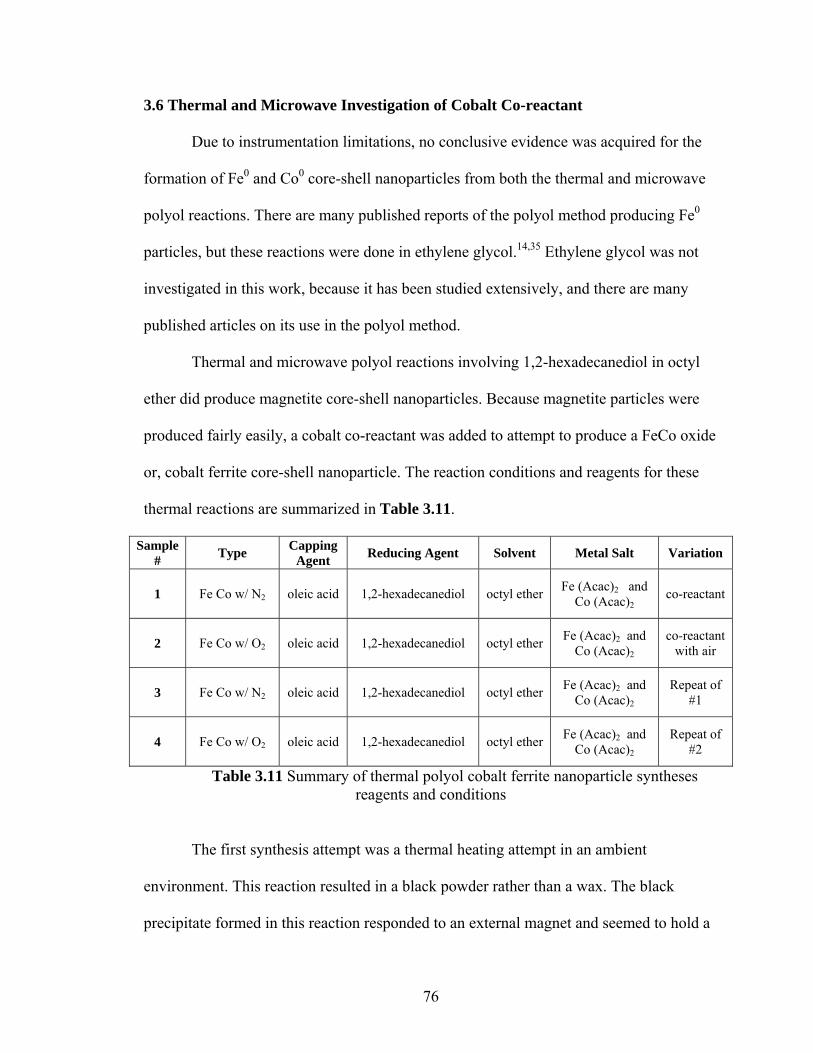
76
3.6 Thermal and Microwave Investigation of Cobalt Co-reactant
Due to instrumentation limitations, no conclusive evidence was acquired for the
formation of Fe0 and Co0 core-shell nanoparticles from both the thermal and microwave
polyol reactions. There are many published reports of the polyol method producing Fe0
particles, but these reactions were done in ethylene glycol.14,35 Ethylene glycol was not
investigated in this work, because it has been studied extensively, and there are many
published articles on its use in the polyol method.
Thermal and microwave polyol reactions involving 1,2-hexadecanediol in octyl
ether did produce magnetite core-shell nanoparticles. Because magnetite particles were
produced fairly easily, a cobalt co-reactant was added to attempt to produce a FeCo oxide
or, cobalt ferrite core-shell nanoparticle. The reaction conditions and reagents for these
thermal reactions are summarized in Table 3.11.
Sample # Type Capping
Agent Reducing Agent Solvent Metal Salt Variation
1 Fe Co w/ N2 oleic acid 1,2-hexadecanediol octyl ether Fe (Acac)2 and Co (Acac)2
co-reactant
2 Fe Co w/ O2 oleic acid 1,2-hexadecanediol octyl ether Fe (Acac)2 and Co (Acac)2
co-reactant with air
3 Fe Co w/ N2 oleic acid 1,2-hexadecanediol octyl ether Fe (Acac)2 and Co (Acac)2
Repeat of #1
4 Fe Co w/ O2 oleic acid 1,2-hexadecanediol octyl ether Fe (Acac)2 and Co (Acac)2
Repeat of #2
Table 3.11 Summary of thermal polyol cobalt ferrite nanoparticle syntheses reagents and conditions
The first synthesis attempt was a thermal heating attempt in an ambient
environment. This reaction resulted in a black powder rather than a wax. The black
precipitate formed in this reaction responded to an external magnet and seemed to hold a
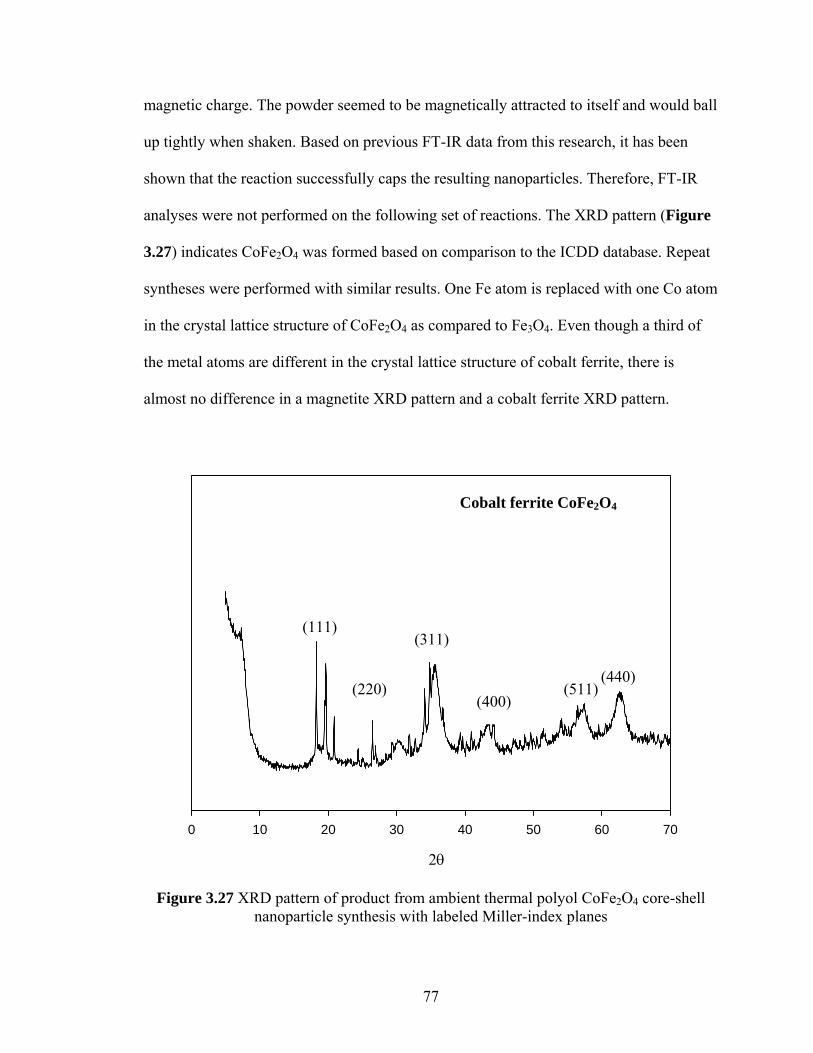
77
magnetic charge. The powder seemed to be magnetically attracted to itself and would ball
up tightly when shaken. Based on previous FT-IR data from this research, it has been
shown that the reaction successfully caps the resulting nanoparticles. Therefore, FT-IR
analyses were not performed on the following set of reactions. The XRD pattern (Figure
3.27) indicates CoFe2O4 was formed based on comparison to the ICDD database. Repeat
syntheses were performed with similar results. One Fe atom is replaced with one Co atom
in the crystal lattice structure of CoFe2O4 as compared to Fe3O4. Even though a third of
the metal atoms are different in the crystal lattice structure of cobalt ferrite, there is
almost no difference in a magnetite XRD pattern and a cobalt ferrite XRD pattern.
2θ
0 10 20 30 40 50 60 70
Figure 3.27 XRD pattern of product from ambient thermal polyol CoFe2O4 core-shell nanoparticle synthesis with labeled Miller-index planes
(400) (440)
(511)
(311)
(220)
(111)
Cobalt ferrite CoFe2O4
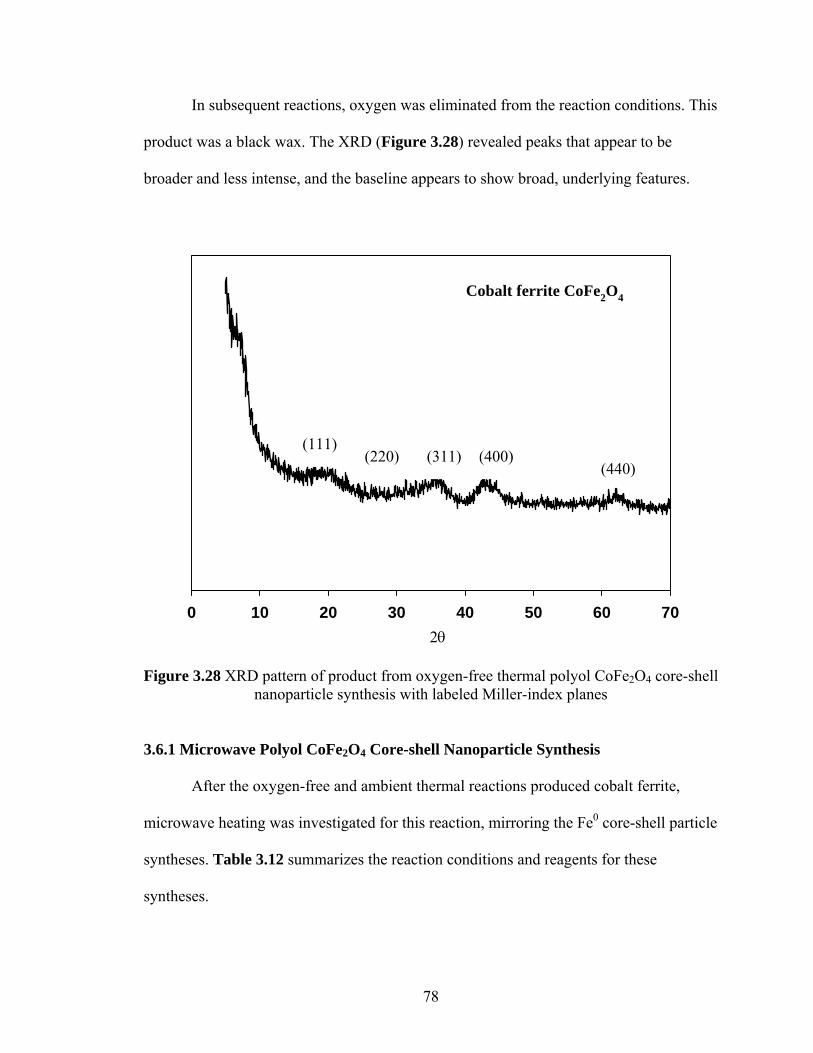
78
In subsequent reactions, oxygen was eliminated from the reaction conditions. This
product was a black wax. The XRD (Figure 3.28) revealed peaks that appear to be
broader and less intense, and the baseline appears to show broad, underlying features.
2θ0 10 20 30 40 50 60 70
Cobalt ferrite CoFe2O4
(311) (400) (440)(111)
Figure 3.28 XRD pattern of product from oxygen-free thermal polyol CoFe2O4 core-shell nanoparticle synthesis with labeled Miller-index planes
3.6.1 Microwave Polyol CoFe2O4 Core-shell Nanoparticle Synthesis
After the oxygen-free and ambient thermal reactions produced cobalt ferrite,
microwave heating was investigated for this reaction, mirroring the Fe0 core-shell particle
syntheses. Table 3.12 summarizes the reaction conditions and reagents for these
syntheses.
(440) (400) (311)
(111) (220)

79
Sample # Type Capping Agent
Reducing Agent Solvent Metal
Salt Variation
MW1 FeCo oleic acid 1,2-hexadecane diol
octyl ether
Fe (Acac)2 and Co (Acac)2
co-reactant
MW2 FeCo oleic acid 1,2-hexadecane diol
octyl ether
Fe (Acac)2 and Co (Acac)2
Repeat of MW1
Table 3.12 Summary of microwave polyol cobalt ferrite nanoparticle syntheses reagents and conditions
As with all microwave reactions, the reaction was performed under oxygen-free
conditions. There was a low product yield and very little sample was available. The XRD
pattern of the dark waxy product from this synthesis (Figure 3.29) is very noisy, and
resembles that of the oxygen free thermal polyol cobalt ferrite synthesis (Figure 3.28).
TEM was run on this sample, and Energy Dispersive X-ray (EDX) was used to confirm
the presence of both Co and Fe. From the TEM (Figure 3.30), the particle size seems
similar the magnetite particles (Figure 3.21) and the Co0 synthesis particles (Figure
3.26); around 20-25 nm. Repeat syntheses were performed and similar results were
achieved.

80
2θ
0 10 20 30 40 50 60 70
Figure 3.29 XRD pattern of the product from microwave polyol CoFe2O4 core-shell nanoparticle synthesis
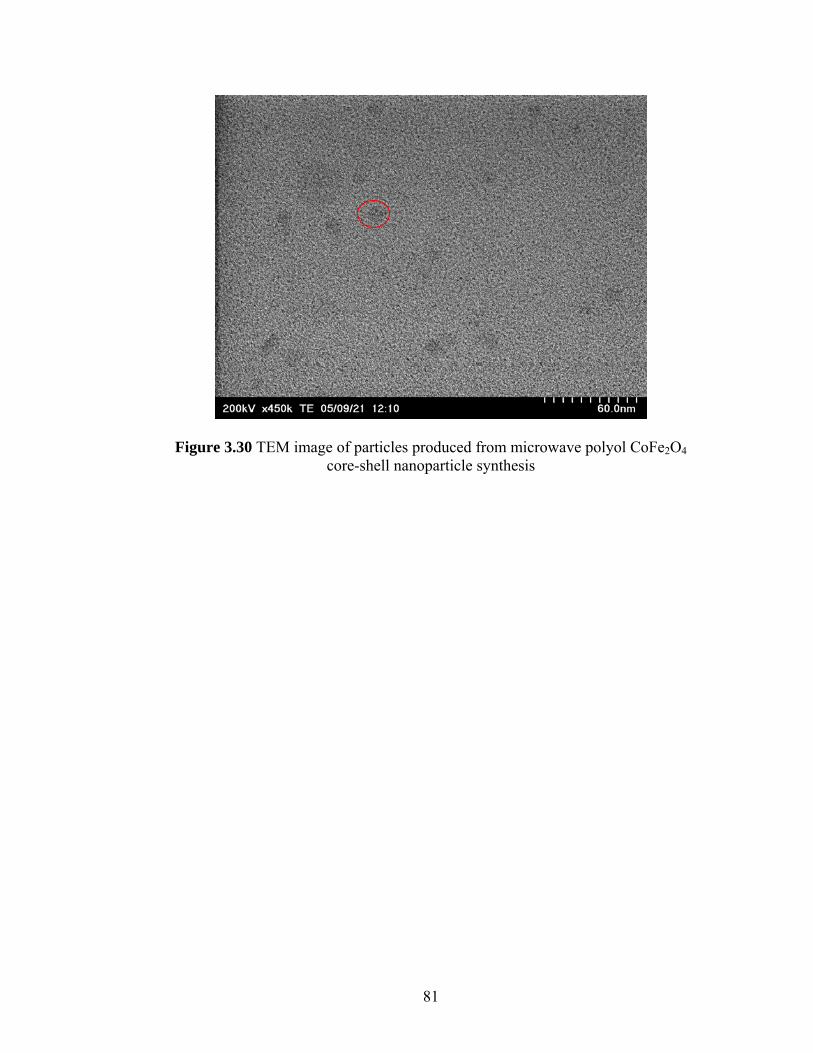
81
Figure 3.30 TEM image of particles produced from microwave polyol CoFe2O4 core-shell nanoparticle synthesis

82
IV CONCLUSIONS AND FUTURE WORK
In this study, both thermal and microwave polyol methods were investigated for the
synthesis of iron, cobalt and iron-cobalt core-shell nanoparticles. Magnetite core-shell
nanoparticles were synthesized via thermal heating based on published results. Attempts
were made to synthesize Fe0 core-shell nanoparticles via the same reaction by
maintaining oxygen-free conditions. However, magnetite was again produced as
confirmed by XRD analysis. It was also confirmed through FT-IR spectroscopic analysis
that the oleic acid capping agent had formed a bond with the magnetite core. Microwave
heating was then employed in an attempt to produce Fe0 core-shell nanoparticles, because
it was thought that localized hot spots created in the microwave could facilitate
amorphous Fe0 particle formation. However, magnetite was again produced, but the XRD
pattern indicated the presence of smaller particles (around 2 nm) and possibly more
amorphous particles.
Having produced only magnetite core-shell nanoparticles with both thermal and
microwave polyol reactions using 1,2-hexadecanediol dissolved in octyl ether, two
different polyol solvent/reducing agents were investigated. In order to reach higher
reaction temperatures, 1,2-hexanediol and PEG MW 600 g/mol were chosen because they
possess a large enough dielectric constant to efficiently absorb microwave energy. The
syntheses performed with these two polyol solvents/reducing agents yielded products
with significantly altered XRD patterns which displayed strong low-angle reflections that
might be related to interlayer spacing in lamellar structures. Conspicuously absent was
83
the large peak at approximately 45°, which is an indicator of Fe0. FT-IR was again used
to confirm the presence of the capping agent on the metal core. TEM was used to confirm
the formation of submicron-sized particles. Based on this information, it could not be
determined that Fe0 had been formed at any point in the reaction.
Microwave assisted reactions performed with 1,2-hexanediol did not produce a
magnetite structure. Therefore, the synthesis of a magnetite core-shell nanoparticle using
1,2-hexanediol was carried out, but facilitated by the addition of an oleylamine co-
capping agent. A magnetite core-shell nanoparticle was prepared successfully and its
structure was verified using XRD.
Microwave assisted Co0 core-shell nanoparticle synthesis was attempted and the XRD
pattern from the product had the same strong low-angle reflection as the previous Fe0
synthesis attempts with 1,2-hexanediol and PEG. The two large peaks at approximately
44° and 47°,which indicate Co0, were not evident in the XRD pattern. Therefore, it could
not be determined if Co0 was produced.
The synthesis of Fe0 core-shell nanoparticles was again attempted. The oxidation state
of the iron precursor was changed for this synthesis from Fe (II) to Fe (III). Based on the
reduction potentials of Fe (II) and Fe (III), Fe (III) is much easier to reduce than Fe (II) or
even Co (II). The XRD patterns from the products of the syntheses exhibited identical
features to those from the Fe0 attempt with 1,2-hexanediol and PEG as well as the Co0
synthesis. However, it could still not be concluded that Fe0 had been produced.
Other parameters such as capping agent concentration, microwave time, and the
addition of a cobalt co-reactant were investigated. The capping agent concentration
appeared to have a limited effect on the particles produced, but the time spent in the

84
microwave seemed to have a significant effect on particle size. Longer reaction times
afforded larger particles. A 10 min microwave reaction time produced particles in the 5-7
nm range, whereas the particles from the 50 min microwave reaction were 10-15 nm.
When a cobalt co-reactant was introduced to the reaction, a cobalt ferrite structure was
produced. All syntheses produced submicron particles with a protective surfactant layer.
Future avenues for this work could include the synthesis of human body-soluble,
magnetic cobalt core-shell nanoparticles for use in drug delivery and resonance imaging.
This could be facilitated by coating the particles with a protein. Because of the milder
conditions provided by the microwave assisted polyol method, degradation of the protein
capping agent might possibly be avoided. Also, the electrochemistry of the reduction
mechanism of diols other than ethylene glycol could be investigated using linear sweep
voltammetry.

85
V REFFERENCES
(1) Bacha, J. et al. Aviation Fuels Technical Review (FTR-3), Chevron Business and Real Estate Services Creative Center, San Ramon, CA, 2000 (2) Zabarnick, S.; Widmor, N. Energy and Fuels 2001, 15, 1447-1453 (3) Sun, S.; Murray, C.B. J. Appl. Phy. 1999, Vol. 85 No. 8, 4325-4330 “Synthesis of monodisperse cobalt nanocrystals and their assembly into magnetic superlattices” (4) Hyeon, T.; Lee, S.S.; Park, J.; Chung, Y.; Bin Na, H. J. Am. Chem Soc. 2001, 123, 12798-12801 (5) Pongkitwitoon, S. Thermodynamics of Mixing for Nano-Particle Binary Mixing; The Department of Materials Science and Engineering, Penn State, PA (6) Wautelet, M.; Dauchot, J. P.; Hecq, M. Nanotechnology 2000, 11, 6-9 (7) Li, Z.; Chen, H.; Bao, H.; Gao, M. Chem. Matter. 2004, Vol. 16 No. 8, 1391-1393 “One-Pot Reaction to Synthesize Water-Soluble Magnetite Nanocrystals” (8) Kataby, G.; Cojocaru, M.; Prozorov, R.; Gedanken. A. Langmuir 1999, 15, 1703-1708 “Coating Carboxylic Acids on Amorphous Iron Nanoparticles” (9) Allara, D.; Nuzzo, R. Langmuir 1985, 1, 45-52 “Spontaneously Organized Molecular Assemblies. 1. Formation, Dynamics, and Physical Properties of n-Alkanoic Acids Adsorbed from Solution on an Oxidized Aluminum Surface” (10) Wu, N.; Fu, L.; Su, M.; Aslam, M.; Wong, K. C.; Dravid, V. P. Nano Letters 2004, Vol 4 No. 2, 383-386 “Interaction of Fatty Acid Monolayers with Cobalt Nanoparticles” (11) Harpeness, R. et al. J. Colloid Interface Sci. 2005, 287, 678-684 “Controlling the agglomeration of anisotropic Ru nanoparticles by the microwave-polyol process” (12) Shafi, K. et al. Langmuir 2001, 17, 5093-5097 “Sonochemical Synthesis of Functionalized Amorphous Iron Oxide Nanoparticles”

86
(13) Grisaru, H.; Palchik, O.; Slifkin, M.A.; Weiss, A.M.; Gedanken, A. Ingor. Chem. 2003, 42, 7148-7155 “Microwave-Assisted Polyol Synthesis of CuInTe2 and CuInSe2 Nanoparticles” (14) Fievet, F., Lagier, J.P.; Figlarz, M. MRS Bull 1989, 29-34 “Preparing Monodisperse Metal Powders in Micrometer and Submicrometer Sizes by the Polyol Process” (15) Bonet, F. et al. Solid State Ionics 1999, 126, 337-348 “Electrochemical reduction of noble metal species in ethylene glycol at platinum and glassy carbon rotating disk electrodes” (16) Palchik, O.; Kerner, R.; Gedanken, A.; Weiss, A.M; Slifkin, M. A.; Palchik. V. J. Mater. Chem. 2001,11, 874-878 “Microwave-assisted polyol method for the preparation of CdSe “nanoballs”” (17) Ying-Jie Zhu; Xian-Luo Hu Materials Letters 2004, 58, 1517-1519 “Microwave-assisted polythiol reduction method: a new solid-liquid route to fast preparation of silver nanowires” (18) Kurihara, L.K.; Chow, G. M.; Schoen, P.E. Nanostructured Materials 1995, Vol. 5 No. 6, 607-613 “Nanocrystaline Metallic Powders and Films Produced by the Polyol Method” (19) Kerner, R.; Palchik, O.; Gedanken, A. Chem. Mater. 2001, 13, 1413-1419 “Sonochemical and Microwave-Assisted Preparations of PbTe and PbSe. A comparative study.” (20) Bonet, F.; Tekai-Elhsissen, K.; Vijaya Sarathy, K. Bull. Mater. Sci. 2000, Vol. 23 No. 3, 165-168 “Study of interaction of ethylene glycol/PVP phase on noble metal powders prepared by polyol process” (21) Sun, J. et al. J. Matlet. 2005, “Mechanism of preparing ultrafine copper powder by polyol process” (22) Viau, G.; Fievet-Vincent, F.; Fievet, F. Solid State Ionics 1996, 84, 259-270 “Nucleation and Growth of Bimetallic CoNi and FeNi Monodisperse Particles Prepared in Polyols” (23) Galema S.A. Chemical Society Reviews 1997, 26, 233-238 “Microwave Chemistry” (24) Echegoyen, L. et al. Inorg. Chem. 1993, 32, 572-577 “Formation of Cryptatium Species in Solution: Electrochemistry of Bipyridl-, Bipyrimidyl-, and Bithiazole-Based Cryptates”

87
(25) Gabriel, C.; Gabriel, S.; Grant, E.H.; Halstead, B.S.J; Mingos, D.M.P. Chemical Society Reviews 1998, 27, 213-223 “Dielectric Parameters Relevant to Microwave Dielectric Heating” (26) Hayes, B. L. Microwave Synthesis: Chemistry at the Speed of Light; CEM Publishing, 2002 (27) Berlan, J. Radiat. Phys. Chem. 1995, Vol. 45 No.4, 581-589 “Microwaves in chemistry: another way of heating reaction mixtures” (28) Xian-Luo Hu; Ying-Jie Zhu; Shi-Wei Wang Materials Chemistry and Physics 2004, 88, 421-426 “Sonochemical and microwave-assisted synthesis of linked single-crystalline ZnO rods” (29) Loupy, A. et al. Pure Appl. Chem. 2001, Vol. 73 No.1, 161-166 “Reactivity and Selectivity Under Microwaves in Organic Chemistry. Relation with Medium Effects and Reaction Mechanisms” (30) Mingos, D.M.P. Res. Chem. Intermed. 1994, Vol 20 No.1, 85-91 “The Applications of Microwaves in Chemical Syntheses” (31) Harpeness, R.; Gedanken, A. Langmuir 2004, 20, 3431-3434 “Microwave Synthesis of Core-Shell Gold/Palladium Bimetallic Nanoparticles” (32) Komarneni, S.; Pidugu, R.; Li, Q. H.; Roy, R. J. Mater. Res. 1995, 10, 1687 (33) Caddick, S. Tetrahedron 1995, Vol.51 No. 38, 10403-10432 “Microwave Assisted Organic Reactions” (34) Komarneni, S.; Li, D.; Newalkar, B.; Katsuki, H.; Bhalla, A.S. Langmuir 2002, 18, 5959-5962 “Microwave-Polyol Process for Pt and Ag Nanoparticles” (35) Komarneni, S.; Katsuki, H.; Li, D.; Bhalla, A. J. Phys. Condens. Matter. 2004, 16, S1305-S1312 “Microwave-polyol process for metal nanophases” (36) Sun, S. et al. J. Phys. Chem. B 2003, 107, 5419-5425 “Controlled Synthesis and Assembly of FePt Nanoparticles” (37) The mineral Magnetite Amethyst Galleries, Inc. (2006) http://mineral.galleries.com/minerals/OXIDES/MAGNETIT/magnetit.htm (38) Sun, S.; Zeng, H. J. Am. Chem. Soc. 2002, 124, 8204-8205 “Size-Controlled Synthesis of Magnetite Nanoparticles” (39) Cornell, R. M.; Schwertmann, U. The Iron Oxides: Structure, Properties, Reactions, Occurrence and Uses VCH: New York, 1996, pp28-29

88
(40) Hou, Y. et al. J. Phys. Chem. B 2005, 109, 4845-4852 “Inorganic Nanocrystal Self-Assembly via the Inclusion Interaction of β-Cyclodextrins: Toward 3D Spherical Magnetite” (41) Kang, Y.S.; Risbud, S.; Rabolt, J.F.; Stroeve, P. Chem. Mater. 1996, 8, 2209-2211 “Synthesis and Characterization of Nanometer-Size Fe3O4andγ-Fe2O3 Particles” (42) Cao, X.; Gu, L. Nanotechnology 2005, 16, 180-185 “Spindly cobalt ferrite nanocrystals: preparation, characterization and magnetic properties” (43) Mallinson, J.C. The Foundations of Magnetic Recording; Academic: Berkeley, 1987; Chapter 3 (44) Neveu, S.; Bee, A.; Robineau, M.; Talbot, D. J. Colloid and Interface Sciences 2002, 255, 293-298 “Size-Selective Chemical Synthesis of Tartrate Stabilized Cobalt Ferrite Ionic Magnetic Fluid” (45) Song, Q.; Zhang, Z. J. J. Phys. Chem. B 2006, 110, 11205-11209 “Correlation between Spin-Orbital Coupling and the Superparamagnetic Properties in Magnetite and Cobalt Ferrite Spinel Nanocrystals” (46) Bunker, C.; Karnes, J. J. Am. Chem. Soc. 2004, 126, 10852-10853 “Low Temperature Stability and High Temperature Reactivity of Iron-Based Core-Shell Nanoparticles” (47) Waser, Rainer (Ed.) Nanoelectronics and Information Technology: Advanced Electronic Materials and Novel Devices. Wiley-VCH GmbH & Co. KGaA, Germany. (2003) pg 276 (48) BRUKER AXS, D8 X-Ray Diffractometer User’s manual Vol. 1 Karlsruhe, West Germany, 2002-2003 (49) Liu, C.; Wu, X.; Klemmer, T.; Shukla, N.; Yang, X.;Weller, D. J. Phys. Chem. B 2004, Vol. 108 No. 20, 6121-6123 “Polyol Process Synthesis of Monodispersed FePt Nanoparticles” (50) Whittaker, A.G.; Mingos, D.M.P. J. Chem. Soc., Dalton Trans, 2000, 1521-1526 “Arcing and other microwave characteristics of metal powders in liquid systems” (51) Larcher, D.; Sudant, G.; Patrice, R.; Tarascon, J.M. Chem. Mater. 2003, 15, 3543-3551 “Some Insights on the Use of Polyols-Based Metal Alkoxides Powders as Precursors for Tailored Metal-Oxides Particles”
89
(52) Shukla, N.; Liu, C.; Jones, P.M.; Weller, D. Journal of Magnetism and Magnetic Materials, 2003, 266, 178-184 “FTIR study of surfactant bonding to FePt nanoparticles” (53) Yoon, S. et al. Mater. Res. Soc. Symp. Proc. 2005, 848, FF3.35.1-5 “The preparation of Ni nano particles by the chemically controlled polyol process” (54) Klug, H.; Alexander, H.L. X-ray Diffraction Procedures; Wiley: New York, 1962; p 125 (55) Ennas, G. et al. Chem. Mater. 2004, 16, 5659-5663 “Influence of Metal Content on Size, Dispersion, and Magnetic Properties of Iron-Cobalt Alloy Nanoparticles Embedded in Silica Matrix” (56) Stuerga, D.; Gaillard, P. Tetrahedron 1996, Vol. 52 No. 15, 5505-5510 “Microwave heating as a new way to induce localized enhancements of reaction rate. Non-Isothermal and heterogeneous kinetics.” (57) Sun, S. et al. J. Am. Chem. Soc. 2004, 126, 273-279 “Monodisperse MFe2O4 (M=Fe, Co, Mn) Nanoparticles” (58) Li, T.; Yang, S.; Huang, L.; Gu, B.; Du, Y.; Nanotechnology 2004, 15, 1479-1482 “A novel process from cobalt nanowire to Co3O4 nanotube”