Inflation and corporate investment in selected OECD countries in the years 1960-2005 – an...
29
1 Inflation and corporate investment OECD countries – an empirical analysis Piotr Ciżkowicz*, Andrzej Rzońca ** This version: December 2010 Abstract: Theoretical models point at various channels of the impact of inflation on corporate investment. This article attempts to answer the question what are the direction and strength of this possible impact examining the relationship between corporate investment and inflation on the sample of 21 OECD countries in the years 1960-2005. The obtained negative relationship, statistically and economically significant, proves robust to changes in the specification of the estimated equation, estimators, frequency of variables used in the study and analysed period. Moreover, the results obtained suggest nonlinear character of this relationship: marginal effect on corporate investment is higher at inflation rates between 3 and 5.5 per cent. These results suggest that the impact of inflation on corporate investment dynamics may be the source of nonlinear nature of the relationship between GDP growth and inflation identified in previous empirical studies. Finally, taking into account the direct impact of inflation on investment, variables approximating the cost of capital utilisation prove to be statistically insignificant determinants of corporate investment. JEL classification: C23, D22, D81, E22, E31, E44 Key words: investment, inflation, panel data * Warsaw School of Economics, [email protected] , **National Bank of Poland, [email protected]
Transcript of Inflation and corporate investment in selected OECD countries in the years 1960-2005 – an...

1
Inflation and corporate investment OECD countries
– an empirical analysis
Piotr Ciżkowicz*, Andrzej Rzońca **
This version: December 2010
Abstract: Theoretical models point at various channels of the impact of inflation on corporate
investment. This article attempts to answer the question what are the direction and strength of
this possible impact examining the relationship between corporate investment and inflation on
the sample of 21 OECD countries in the years 1960-2005. The obtained negative relationship,
statistically and economically significant, proves robust to changes in the specification of the
estimated equation, estimators, frequency of variables used in the study and analysed period.
Moreover, the results obtained suggest nonlinear character of this relationship: marginal effect
on corporate investment is higher at inflation rates between 3 and 5.5 per cent. These results
suggest that the impact of inflation on corporate investment dynamics may be the source of
nonlinear nature of the relationship between GDP growth and inflation identified in previous
empirical studies. Finally, taking into account the direct impact of inflation on investment,
variables approximating the cost of capital utilisation prove to be statistically insignificant
determinants of corporate investment.
JEL classification: C23, D22, D81, E22, E31, E44
Key words: investment, inflation, panel data
* Warsaw School of Economics, [email protected],
**National Bank of Poland, [email protected]

2
1. Introduction
As a result of the global financial crisis which entered its severe stage in 2008, the
mitigation of the consequences of the crisis, not only through very low interest rates but also
by means of other non-standard tools, has been perceived for the past two years as the biggest
challenge for monetary policy. At that time, it could seem that the role of the central bank
involving price stability aimed at limiting the costs of inflation receded into the background.
In the second half of 2010, however, at least some emerging economies have recorded signs
of growing inflationary pressure.
Despite the signs of building this pressure, central banks may be prevented from
tightening their monetary policy by fears of discouraging corporate investment and, as a
result, prolonging the period of recovery from the economic slowdown. Central banks have to
compare this risk with another possible risk which has been given less focus in public
discussions since the outbreak of the global financial crisis, i.e. the negative impact of
inflation on corporate investment. This impact will be addressed in the article.
Theoretical models point at various channels through which inflation can affect
corporate investment. These channels are not, however, analysed in one consistent model.
Meanwhile, the direction of this impact may differ across channels depending on the level of
inflation rate. Additionally, complex interactions are possible between them. These limitations
of the theory provide a background for strictly empirical research on the response to the
general question whether inflation has any significant impact on corporate investment and
what the direction and the strength of this possible impact are.
The present article attempts to answer the above question. Empirical studies have
given relatively little attention to complex analysis of this relationship. Instead, they have
focused on the analysis of particular channels of inflation impact on corporate investment.
The aggregate impact of inflation on corporate investment was analysed mainly as an
additional aspect of the studies on the influence of inflation on economic growth. The rest of
the article is structured as follows:
Section 2 presents the main channels of the impact of inflation on corporate
investment, as indicated by the theory and findings of empirical research on particular
impact channels.
Section 3 presents the range of the sample analysed in this article and reasons for its
selection.
Section 4 analyses the relationship between inflation and investment based on simple
descriptive statistics.
Section 5 is devoted to the estimation of a number of panel models analysing the
strength and direction of the impact of inflation on corporate investment.
Section 6 presents the analysis performed in order to evaluate the robustness of results.
Section 7 summarises major conclusions following from the study.
3
2. Channels of the impact of inflation on corporate investment1
The key channels of the impact of inflation on corporate investment are connected
with the following market imperfections2:
(i) asymmetry of information,
(ii) uncertainty and
(iii) nominal rigidities in the tax systems.
Asymmetry of information between economic agents in the process of investment
financing causes three kinds of problems: adverse selection (see Akerlof, 1970), moral hazard
(see Jaffee and Russell, 1976) and costly state verification (see Townsend 1979; Gale and
Hellwig, 1985). These consequences may lead to credit rationing, which limits the possibility
for enterprises to obtain capital for investment, even if expected return on investment exceeds
the costs of capital employment. Even if fully anticipated, inflation exacerbates the
consequences of information asymmetry and hampers the development of financial
institutions. Inflation, as a result of e.g. regulations determining the value of nominal interest
rate, may reduce the real rate of return on savings (see e.g. Barnes et al., 1999 or Boyd et al.,
2001), and, consequently, discourage people from saving and stimulate them to take out loans,
including persons incapable of paying them back (see e.g. Boyd et al., 1996). Moreover, it
constitutes a tax imposed on the real value of enterprises‟ own funds, the investment of which
is often a condition for obtaining external funding (see e.g. Boyd and Smith, 1998 or Huybens
and Smith, 1999). A decline in enterprises‟ own funds resulting from that may be, at the same
time, exacerbated by enterprises‟ decisions aimed at avoiding this tax (see e.g. Smith and van
Egteren, 2005). Inflation does not only reduce firms propensity to gather own funds but also
their ability to do so, as it reduces profit margins above the unit cost3. At the same time,
inflation introduces additional “noise” to investment project assessment by lenders, thus
hindering the identification of profitable projects (see e.g. De Gregorio and Sturzenegger,
1994; Baum et al., 2004). Finally, inflation may enhance the moral hazard among financial
institutions themselves. They may hope that their potential losses will be at least partially
financed by the government, for which it will be difficult to evaluate to what extent they are
the result of exposure to the financing of risky projects and to what extent they result from
unstable economic conditions, mirrored in growing inflation, beyond control of financial
institutions (see e.g. McKinnon, 1991; De Gregorio, 1996).
In the light of both the theories and empirical studies, changes in inflation within the
range of its very low values do not affect the extent of financial intermediation, yet after
exceeding a certain low threshold, further rise in inflation hinders its growth; all the negative
effects of inflation on the development of the financial sector become apparent when inflation
is moderate (see e.g. Boyd et al., 2001; Rousseau and Wachtel, 2002 or Khan et al., 2006).
Moreover, in the developed countries the negative impact of inflation on the financial sector
and, consequently, on corporate investment becomes apparent at lower inflation levels than in
the developing countries (see e.g. Cuadro et al., 2003). Higher capital per person employed in
1 This chapter summarizes main findings from the literature review presented in Ciżkowicz et al. (2010). 2 In case of no market imperfections the direction of inflation‟s impact on investment depends on technical
assumptions that do not easily yield to unambiguous empirical verification. For the review the impact of inflation
on capital accumulation in general equilibrium and monetary search models with no market imperfections see
Ciżkowicz et al. (2009). 3 At this point, the theory might seem ambiguous (see on the one hand, e.g. Rotemberg, 1983; Head et al., 2006
or Russell et al., 2002, and, on the other hand, Ball and Romer, 1993 or Tommasi, 1994), yet the results of
empirical studies indicate a rather negative impact of inflation on profit margins (see e.g. Batini et al., 2000;
Banerjee et al., 2001; Banejree et al. 2007, or Banerjee and Russell, 2005).

4
the former ones forces enterprises to engage higher own funds in the financing of investments
whose value is sensitive to changes in inflation (see e.g. Hamid and Singh, 1992; Boyd and
Smith, 1998).
The second important channel of inflation impact on corporate investment it its effect
on uncertainty as to the future value of variables which are of importance for investment
decisions made by enterprises. The impact of inflation on investment through uncertainty
depends on two, generally disjunctive, relationships.
On the one hand, it is the function of the impact of inflation on uncertainty about
variables forming the basis for enterprises to formulate their assessment of future return on
investment. Conclusions drawn from the review of theoretical and empirical literature are
unequivocal: inflation, even within the range of low and moderate values, constitutes an
important source of uncertainty. By increasing relative price variability (see e.g. Nautz and
Scharff, 2006 or Banerjee et al. 2007, Caporale et al., 2010), inflation makes it difficult for
entrepreneurs to assess what is worth manufacturing and what is not, as well as reduces the
number of contracts and shortens the average period of contract duration (see e.g. Reagan and
Stulz, 1993 and Guerrero 2005). By escalating uncertainty about future inflation (see e.g. Ball
and Cecchetti, 1991; Evans, 1991; Evans and Wachtel, 1993), inflation increases uncertainty
about the level of interest rates and about that part of future tax burdens affecting, directly or
indirectly, the cost of capital utilisation which depends on inflation. Finally, it intensifies the
uncertainty stemming from relative price variability as long as nominal price rigidities emerge
(Friedman, 1977).
On the other hand, the impact of inflation on investment through its effect on
uncertainty is determined by the relation of investment and uncertainty. Although intuitively
we are inclined to conclude that the higher the uncertainty, the lower the propensity of
enterprises to embark on new investment, this relationship is not unambiguous in the light of
the theory (see, on the one hand, e.g. Hartman, 1972; Abel, 1983; Lee and Shin, 2000 and, on
the other hand, McDonald and Siegel, 1987 or Abel et. al, 1996). Conclusions derived from
models are the function of adopted assumptions whose adequacy to reality is, in some cases,
questionable (Dixit and Pindyck, 1994). The majority of empirical studies indicate, however,
that a rise in inflation leading to growing uncertainty accompanying investment decisions of
enterprises reduces their propensity to invest (see e.g. Ferderer, 1993; Serven and Solimano,
1993 or Pindyck and Solimano, 1993; Kalckreuth, 2000; Byrne and Davis, 2004; Fisher,
2009).
The third important channel of inflation impact on corporate investment is the
interaction between inflation and the tax system. If it is not fully indexed, inflation affects the
cost of capital utilisation. It may also differentiate this cost, depending on the type of capital
asset (length of depreciation period) or the structure of investment financing (see e.g.
Feldstein et al., 1978). As a result, this leads to a change in both the level and direction of
capital allocation. However, the sign and the strength of this impact depend on many
assumptions concerning, inter alia, detailed solutions of the tax system (see e.g. Sorensen,
1986; Cohen et al., 1999), free capital flow (see, on the one hand, Hartman 1980, and, on the
other hand, Desai and Hines, 1997) or the manner the government uses additional (stemming
from lack of full indexation) tax revenues (see e.g. Bullard and Russell, 2004). Consequently,
they cannot be unambiguously identified on the grounds of the theory. However, models
unequivocally suggest that changes in inflation through interactions with the tax system are
not neutral for investment decisions made by enterprises.
Empirical studies do not unequivocally identify the direction and strength of the
impact of inflation on investment through interactions with the tax system, either. The main

5
reason for such ambiguity is the fact that a major part of empirical studies is strongly linked to
the assumptions of particular theoretical models (see e.g. Feldstein 1980; Chirinko, 1987;
Bullard and Russell, 2004). The dependence of arbitrary assumptions adopted in those models
is transferred to the results of empirical analyses.
All the three channels of inflation impact on investment are interrelated. For example,
uncertainty is one of the reasons for market incompleteness and, consequently, their level of
development, connected with the relationship of inflation and asymmetry of information,
becomes increasingly significant for the economy. On the other hand, imperfection of
financial markets related to information asymmetry deepens the acuteness of the uncertainty.
Finally, the effects of both uncertainty and asymmetry of information may be enhanced by the
interaction between inflation and the tax system. Despite such relationships, we are not
familiar with any study which would analyse the impact of inflation on investment through all
the channels within one, internally coherent model.
These limitations of the theory provide room for a purely empirical study on the joint
impact of inflation on investment. The empirical literature so far has not focused on this issue
sufficiently. This issue was analysed, so to speak, „by the way‟ when studies were carried out
on the impact of inflation on economic growth as one of the possible channels of this impact
(see e.g. Fischer, 1993; Bruno, 1993; Barro, 1995; Andres and Hernando, 1997).
3. Selection of the sample and data sources
Our analysis of the impact of inflation on corporate investment has been based on an
annual panel data covering the period of 1960-2005 and the sample of 21 OECD developed
countries4.
The study has not taken into account the years 2006-2009, as this was the period of
strong turmoil in the analysed countries. This brought about major fluctuations in fundamental
variables addressed in this article. In the countries examined, this period was marked by both
a strong rise in investment amidst low inflation (2006), a considerable fall in investment
amidst relatively high inflation (2008) and a deep fall in investment amidst low inflation
(2009). These data constitute one but not unique piece of evidence corroborating the fact that
in the years of the crisis and in the period immediately preceding it the relationships between
macroeconomic variables become disturbed. However, we have concluded it is far too early to
isolate those disturbances or assess their durability.
In none of the countries selected for the analysis the annual inflation measured by the
CPI growth exceeded 30% which is a moderate level in accordance with the classification
suggested by Dornbusch and Fischer (1991). The sample narrowing the scope of analysis to
the impact of inflation on investment within the range of its low and moderate values was
selected for two reasons.
First, analysis based on a sample in which some countries experienced episodes of
very high inflation might lead to errors in generalising the results obtained. Temple
(2000) indicates that in samples consisting of countries experiencing different inflation
levels, the relationship between inflation and other economic variables may strongly
depend on few outliers.
4 Australia, Austria, Belgium, Canada, Denmark, Finland, France, Germany, Greece, Ireland, Italy, Japan,
Norway, the Netherlands, New Zealand, Portugal, Spain, Sweden, Switzerland, the United Kingdom and the
United States of America.
6
Second, the studies analyzing inflation-growth nexus published to date suggest that a
potential threshold value the excess of which would significantly change the
dependence of corporate investment on inflation should rather be sought at the
moderate inflation level (see e.g. Ghosh and Phillips, 1998; Khan and Senhadij, 2001;
Kremer et al.; 2010, Espinoza et al., 2010; Omay and Kan, 2010)
The data we analyse are obtained from the OECD Economic Outlook Database. The
study focuses on the annual real dynamic of fixed gross capital formation in the corporate
sector (inv_corp) and the annual percentage change of the CPI index5
( ). Due to the lack of
complete data, the number of observations for which both values are available is 912. In the
case of panel model estimation, the size of the sample is smaller and depends on the set of
explanatory variables used in a given model.
4. Simple descriptive statistics
Table 1 presents frequency distribution of inflation and investment growth rates. The
data presented suggest that the share of the number of cases of negative annual investment
growth rate in the total number of cases for a given inflation range was a growing function of
inflation: for observations in which inflation did not exceed 3%, the negative investment
growth rate appeared, on average, in 20% of cases, whereas in the case of inflation ranging
between 15% and 20%, it was registered twice as often.
[Table 1 here]
Table 2 compares the mean and the median of both variables for the subsamples,
classified according to growing inflation value. This comparison indicates that potential
relationship between inflation and investment dynamics is negative: the higher the average
inflation level, the lower the average growth rate of investment.
[Table 2 here]
Simple statistics presented above, even though suggesting a negative correlation
between inflation and investment growth rate, do not form the basis for drawing conclusions
about the strength or statistical significance of this relation. They fail to explain, for example,
whether the relationship between inflation and investment is maintained when the effect of
other variables which determine investment dynamics is taken into account. Therefore, the
following section analyses the relationship between inflation and investment growth based on
the estimation of multidimensional panel models.
5. Panel models of corporate investment
5 In the case of the United Kingdom, with no CPI data available for the whole period, the Retail Price Index
(RPI) was applied, as published in the on-line database of the UK Office for National Statistics.

7
When selecting the specification of the model, we opted for an approach based on
reduced model estimation.
On the one hand, we are not aware of any theoretical model accounting for all the impact
channels described in Section 2 that could constitute the basis for estimating a structural
model. It is true that an estimation of several structural models, each of them taking into
account a number of the existing channels of influence, could be an alternative to a
reduced model. However, this would not allow us to account for the interactions between
individual channels, and would also preclude a consistent assessment of their relative
significance. Therefore, it would be impossible to achieve the main benefit that structural
models should provide, namely, a clear and consistent interpretation of results.
On the other hand, the purpose of this study is to identify the direction and strength of the
combined impact of inflation on corporate investment, which is the resultant of all the
previously described effects, rather than the identification of particular mechanisms and
fine-tuning them to the best theoretical model.
Drawing on the estimation of reduced models is quite common in empirical research on the
determinants of investment (cf. the articles described in Section 2, and, e.g. Leahy and
Whited, 1995; Guiso and Parigi, 1999; Chirinko et al., 1999; Pelgrin et al., 2002).
The selection of explanatory variables, in addition to the annual inflation rate, was
made on the basis of conclusions from theoretical and empirical studies devoted to the
determinants of investment:
The first two variables we selected are meant to approximate changes in the cost of capital
utilisation. Although economists come across serious problems with empirical verification
of the dependency of investment on the cost of capital (see e.g. Blanchard, 1986 or
Baddeley, 2003 for a review), it has a strong theoretical basis (e.g. Jorgenson, 1963;
Tobin, 1969).
- The first variable is the relative price of capital goods (rel_cost), expressed as the
natural logarithm of the relation of the deflator of investment in the private enterprise
sector to the GDP deflator. The variable shows how the prices of capital goods
purchased by enterprises change against the prices of other goods and services.
- The second variable is the nominal long-term interest rate (ir). Obviously, the cost of
capital depends on the real, rather than nominal interest rate. In most empirical
research, however, the real interest rate is determined in a simplified manner, i.e. by
subtracting the current inflation rate from the nominal interest rate. As in the analysed
model the rate of inflation is already present as a separate explanatory variable,
including it for the second time as a discounting factor would distort the interpretation
and relevance assessment of the relationship between inflation and investment. In turn,
the calculation of the real interest rate in a correct way consisting in accounting for the
expected, rather than current inflation, is not possible due to the lack of relevant data.
The third variable is the real GDP growth (gdp), which allows us to account for so called
accelerator effect. The results of most empirical studies prove that this variable is a
significant and robust determinant of investment, and its significance in explaining the
volatility of investment processes is greater than the significance of any measure of the
cost of capital (cf. e.g. Chirinko, 1993; Baddley, 2003)).
8
The last variable is the growth rate of public investment (inv_pub). The direction of its
impact on the growth rate of business investment is ambiguous6. On the one hand, the
impact of government investment on private capital formation depends on the purpose to
which public funds are allocated. For example, government investment that focus on
providing adequate infrastructure may increase the relative attractiveness of investing in a
given country or region, thus supporting private investment. On the other hand, regardless
of the type of public investment, it implies (with the level of other expenses unchanged)
either higher taxes or bigger liabilities incurred by the state, which in turn should limit
enterprises‟ propensity or ability to invest.
Some authors (e.g. Easterly and Rebelo,1993; Serven, 1998) suggest to incorporate into
the investment models variables measuring the size of the public sector (e.g. the
expenditure-to-GDP ratio) or the degree of imbalances in public finances (e.g. debt-to-
GDP or deficit-to-GDP ratio). However, the main impact of these values on private
investment occurs through the interest rate channel, which has already been included in
the model.
In the base model we decided to adopt a specification in which corporate investment is a
function of current explanatory variables. The literature presents specifications with very
different delay structures. For example, Chirinko et al. (1999) analyse a model in which
investment in a given year depends on the cost of capital utilisation in as many as six previous
years, while Pelgrin et al. (2002) draw on an analysis of the current influence of investment
determinants. The impact of an arbitrarily chosen term structure on the estimation results has
been presented in the section devoted to the robustness analysis.
We started the estimation of the investment model with the following functional form:
ititititititit irtrelpubinvgdpfcorpinv ),cos_,_,,(_ (1)
where the growth rate of corporate investment (inv_corp) is a linear function of the inflation
rate ( ) and the set of control variables; is a error term and subscripts i = 1, ..., 21 and t =
1, ..., 46 identify, respectively, the cross-sectional and temporal dimensions of the data.
We started by testing the hypothesis of non-stationarity of the variables selected for
the model, using the test proposed by Pesaran (2005)7. The results summarised in Table 3,
indicate that in the case of the analysed variables the null hypothesis of non-stationarity of all
time series occurring within the individual variables should be rejected in favour of the
alternative hypothesis whereby a significant part of those series is stationary8.
[Table 3 here]
6 For example, Voss (2002) confirmed the effect of public investment crowding out private investment in the US and Canadian economies. In turn, Argimon et al. (1997), as well as Lopez (2001), point to the opposite effect
(the so-called crowding-in) in the case of public infrastructural investment in 14 developed OECD countries and
in Spain, respectively. In the context of panel models of investment, Pindyck and Solimano (1993) demonstrated
that the size of public investment has a negative and significant impact on private investment both in developed
OECD countries and in the developing ones. 7 Broad overview of stationarity testing methods and discussion of the related issues can be found, for example,
in the article by Breitung and Pesaran (2005). 8 This is obviously not tantamount to the proposition that all the series within the given variable are stationary.
This is one of the limitations of the stationarity tests of panel data

9
The rejection of the hypothesis of non-stationarity of variables included in the analysis
allows us to proceed with the estimation of the model. The first approach uses a pooled
estimator (OLS). Thus model (1) assumes the following form:
ititititititit irtrelpubinvgdpcorpinv 543210 cos___ (2)
Functional form (2) ignores the possibility of individual effects, i.e. specific characteristics of
a given country (such as differences in the quality of institutions, access to natural resources,
etc.) that are not included in the model but affect the dependent variable. In case this
assumption is not true, the estimator is biased, hence it is regarded in the literature as the first
approximation, rather than the final form of the model. The estimation results of equation 2
presented in column (1) of Table 4 show a statistically and economically significant negative
effect of inflation on corporate investment: an increase in the inflation rate by 1 p.p. leads to a
decline in investment growth by 0.18 p. p. in the same year. The effect of the investment
accelerator is also significant: an increase in the GDP growth rate by 1 percentage point leads
to a rise in investment growth by 2.12 percentage points. The results also indicate that in the
surveyed countries public investment crowds out corporate investment: the increase in the
growth of the former by 1 p.p. results in decrease of the latter by 0.17 p.p. In contrast, the
impact of cost variables, i.e. the relative price of capital and the long-term interest rate, proved
to be insignificant9.
In the next step we waived the assumption of no systematic differences between
countries. Thus, we estimated:
a fixed effects model (FE), which assumes homogeneous coefficients of the explanatory
variables but allows for different constant term for particular countries;
ititititititiit irtrelpubinvgdpcorpinv 54321 cos___ (3)
where i is a constant term for a country with index i,
and a random effects model (RE), in which individual effects are treated as random values
and are included in the error term;
ititititititit irtrelpubinvgdpcorpinv 543210 cos___ (4)
where iititv .
The estimation results of thus defined models are presented in columns (2) and (3),
respectively, of Table 4. The FE of inflation is still negative, slightly smaller in absolute terms
than in the case of OLS estimator, but statistically insignificant at 10%. In turn, results for the
RE model indicate the significance of this coefficient estimates at the level below 5% and its
value similar to the OLS estimates. Conclusions concerning the impact of other variables on
corporate investment dynamics do not differ from those formulated on the basis of OLS
estimation results.
[Table 4 here]
9 In the case of parameters for the last two variables, 95% confidence interval is wide enough to cover both
positive and negative values, hence it is impossible to determine the consistency of the sign of estimates with the
economic theory.

10
The discrepancy between the FE and RE coefficient of inflation leads to the question
which of the estimators “better” describes the analysed relationship. Unfortunately, the set of
tests designed to answer this question does not provide a clear conclusion (see Table 4):
the critical value of the Wald test for the FE model indicates that the fixed effects
introduced to the model are statistically significant;
Breusch-Pagan test for the RE model indicates on zero variance of random effects;
Hausman test, directly examining the differences between FE and RE coefficients,
confirms that the RE estimates are characterised by a smaller variance than obtained by
the FE estimator.
Therefore, the results of the tests reveal that the RE estimator provides more precise
estimates, yet random effects explain a very small part of the variability of the error term.
The correctness of interpretations of the estimates obtained hitherto depends
additionally on the fulfilment of two assumptions: homoscedasticity and no autocorrelation of
the error term (from the same time periods between individual countries, as well as between
different periods for the same country). Applied tests indicate that the null hypothesis of
homoscedasticity (Wald test), no cross country correlation (Breusch-Pagan test) and no
autocorrelation of error term (Wooldrige test) should be rejected10
.
In the case when previously mentioned assumptions are violated, a panel-corrected standard
errors (PCSE) estimator proposed by Beck and Katz (1995) can be applied. The results of the
PCSE estimation are presented in column (1) of Table 5. The impact of inflation on corporate
investment growth is negative and statistically significant at the level of 10%. The strength of
this effect is similar as in the case of previous models. The value and significance of
coefficient of GDP growth and public investment growth practically do not change, either.
Finally, there are no apparent signs of the impact of cost variables on enterprises‟ investment
decisions.
The consistency of the estimators presented above may be affected by endogeneity
problem stemming from potential correlation between regressors and error term. To control
for this possibility we used instrumental variables (IV) method. Columns (2) of Table 5
presents the estimation results of the FE model obtained with two-step generalized method of
moments (IV/GMM2S)11
. Inflation, GDP growth and public investment growth were
considered as endogenous variables12
, whereas the first lags of analyzed variables were
adopted as instruments. Consistency of the GMM2S estimator depends on the validity of the
instruments used. To test for this we applied Hansen‟s J-test of overidentifying restrictions.
The joint null hypothesis is that the instruments are uncorrelated with the error term and that
the excluded instruments are correctly excluded from the estimated equation. The test statistic
(p-value = 0.33) indicates that the null hypothesis can not be rejected13
.
10 Fo all three tests respective p-values were lower than 0.001 . 11 Standard errors and statistics are robust to the presence of heteroskedasticity and autocorrelation. 12 The endogeneity is not an issue in case of remaining control variables. To verify this we used standard
endogeneity test defined as the difference of two Sargan-Hansen statistics (for the equation with the smaller and
larger set of instruments, respectively). Results are not presented but are available on request. 13 It should be stressed that even in this case GMM2S estimator may be subject to weak instrument problem
meaning that excluded instruments are only weakly correlated with the endogenous regressors (see Stock et al.,
2002). If the assumption that error term has IID distribution is dropped, relevant weak instruments test is
Kleibergen and Paap (2006) Wald rank F statistic which in analyzed model equals F= 1.01. Unfortunately in
case of applied specification critical values for this test are not available.
11
[Table 5 here]
The results of the estimation indicate that both in the case of inflation and the growth
of GDP, the direction of their impact on investment remained unchanged. As regards
inflation, the absolute value and precision of its coefficient‟s estimate rose significantly as
compared to previous models. The coefficients of cost variables do not allow a convincing
interpretation of the impact of those variables on investment growth: while the estimated
parameter for the interest rate, though statistically significant at 5%, is positive, the parameter
at the relative cost of capital is not significantly different from zero.
In the analysed model, it has so far been assumed that the impact of inflation on
corporate investment is linear, i.e. independent of the initial level of inflation. However, the
conclusions of theoretical and empirical research discussed in Section 2 suggest that this
relationship may be of a more complicated, nonlinear nature. To investigate such a possibility,
we used two methods.
First, we conducted an analysis of changes in the coefficients determining the impact
of inflation on investment dynamics in equation (2) which were estimated with the rolling
regression technique. For this purpose, observations available in the sample were sorted
according to the increasing rate of inflation, and then a multiple estimation of model (2)
(using OLS estimator) was estimated starting from the first 100 observations and adding one
observation at each subsequent step. Figure 1 shows how the values and a 95% confidence
intervals of the estimated coefficient of inflation change, as the sample expands with
subsequent observations. Coefficient estimate in the initial part of the sample is unstable: it
turns permanently negative if the highest value of inflation in the sample runs at a level of at
least 2.5%, reaching statistical significance for samples where the highest level of inflation is
not lower than 3.5%. The scale of the impact of inflation on investment dynamics depends on
the range of its value. As the scope of the sample is extended by observations where the
inflation ranges from about 3% to around 5.5%, the point value of the estimates decreases (the
strength of the relationship increases), reaching the minimum value of approximately -0.8.
Expanding the sample by observations with higher inflation values (over 5.5%) leads to a
gradual increase in the estimates (weakening of the relationship), up to the value of -0.18,
which is the result of model estimation for the entire sample.
[Figure 1 here]
Thus, the observations made suggest that the impact of inflation on investment is
nonlinear, and its strength depends on the range of the initial value of inflation. Changes in
the range of values smaller than 2.5% do not produce a clear response of corporate
investment. In turn, an increase (decrease) from the level above 3.0% leads to a decrease
(increase) in investment growth. In addition, the response to the same change in inflation is
significantly stronger if the initial value of inflation lies in the range of 3.0-5.5% than when it
is above 5.5%. Such character of the examined relationship also indicates that its direction
and strength do not depend critically on the presence in the sample of observations with high
inflation (in relation to the sample‟s average). On the contrary, their inclusion in the sample
weakens the strength of the negative impact of inflation on investment. This conclusion
contrasts with the one formulated in studies examining the effects of inflation on the rate of
economic growth. For example, in the study by Bruno and Easterly (1998), the exclusion of
countries with inflation above 40% from the sample rendered the negative relationship
between inflation and growth estimated on the entire sample insignificant.

12
Second, we conducted a re-estimation of model (1) extending the set of explanatory
variables with an interactive variable π_3_5.5. The aim of this extension was to answer the
question whether the dependence of the strength of inflation impact on investment from the
initial level of inflation, established with the use of the rolling regression analysis, was
statistically significant. The interactive variable was defined as:
5.5 0.3;
5.5 3.0 ;05.5_3_
ititit
itit
it (5)
We adopted this interval on the basis of estimates obtained by the rolling regression
method, thus performed selection is obviously still arbitrary in nature. Analysis of the
inflation threshold could be performed using panel threshold model proposed by Hansen
(1999), however it may be severely biased due to endogeneity of regressors observed in
analyzed model. The purpose of our analysis is however not to identify precisely the threshold
values, but rather to determine whether the nonlinearity observed from the results of the
rolling regression is significant for the estimated relationship.
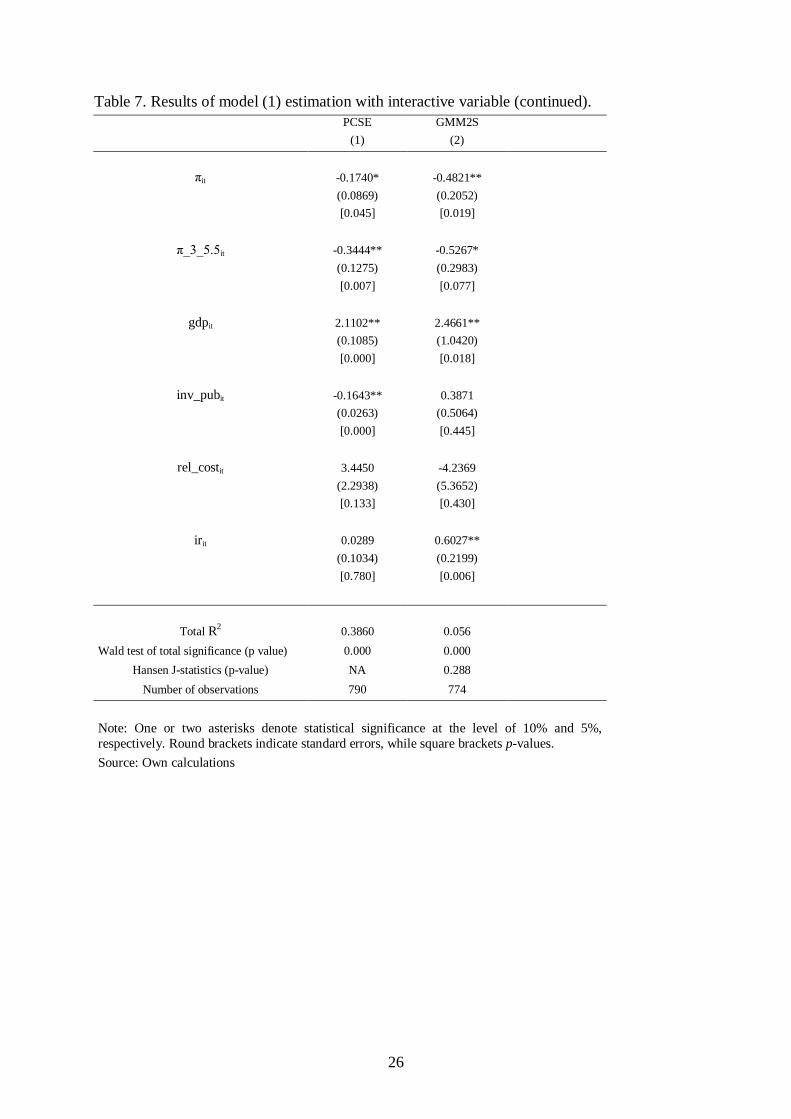
The results of the estimation of model (1) extended by the interactive variable are
presented in Tables 6 and 7. In case of inflation, GDP growth and public investment growth
both the coefficient estimates and its standard errors do not differ significantly from the
values obtained for the model without an interactive variable. In turn, the coefficient of the
variable π_3_5.5it fluctuates, depending on the estimator, in the range of -0.28 to -0.53 and,
in each case, is statistically significant at the level of 10%. This means that if the initial level
of inflation ranges between 3 and 5.5%, the impact of inflation changes on corporate
investment growth is two to three times higher than in a situation where inflation runs outside
that range.
These results suggest that the impact of inflation on corporate investment dynamics
may be the source of nonlinear nature of the relationship between GDP growth and inflation
identified in previous empirical studies.
[Table 6 here]
[Table 7 here]
6. Robustness of results
In the case of a study based on the reduced model, before final conclusions as to the
relationship analysed can be drawn, it is necessary to analyse the robustness of the obtained
results to changes in the structure of the sample, set of explanatory variables, specification of
the equation, etc. As revealed by studies devoted to the relationship between inflation and
economic growth, the accuracy and strength of conclusions formulated on the basis of models
devoid of this type of analysis can easily be questioned. For example, Levine and Zervos
(1993) demonstrated that the exclusion of Nicaragua and Uganda only from the analysed large
sample of countries rendered the relationship between inflation and growth estimated on the
whole sample no longer significant.
In the first stage, we examined how a change in the assumption about the temporal
structure of the relationship between inflation and investment will change the results. To this
end, we reformulated model (1) replacing the current values of regressors with their values
lagged by one year, while maintaining the current values of those variables which proved

13
statistically significant in previous specifications. The delayed response of investment to
changes in their main determinants may reflect the specificity of the decision-making process
and also that of production and installation of capital goods. In addition, we expanded the set
of regressors with a delayed explained variable, which allow us to take into account a possible
inertia specific for investment projects, which had been hitherto ignored. The modified model
had the following form:
ititititititititititit irtrelpubinvpubinvgdpgdpbinvfcorpinv ),cos_,_,_,,,,,_(_ 111 (6)
The estimation of autoregressive model (6) with the use of "classical" methods (i.e.
OLS, FE and RE) may biased results14
. In order to eliminate this problem, considering a
relatively small number of countries in our study, we applied a procedure for correcting the
bias of the FE estimator proposed by Bun and Kiviet (2002) and then modified for the
analysis of unbalanced panels by Bruno (2005).
Column (2) of Table 8 presents the results obtained using this method (biased-
corrected least square dummy variable, LSDVC) and column (1) gives the assessments
obtained with the use of the classical FE estimator. Their comparison shows that the addition
of delayed inflation resulted in shifting the main thrust of the impact from the current variable
onto the delayed variable. The direction and strength of the effect remained consistent with
the results obtained on the basis of previous models. Such a change might suggest that the
inflation impulse is transmitted to the decisions of enterprises with some delay. In the case of
GDP and public investment growth, their main impact on corporate investment occurs
through changes in current values. Also the impact of the delayed growth of corporate
investment on its current value was significant, which may confirm the inertia of investment
processes.
[Table 8 here]
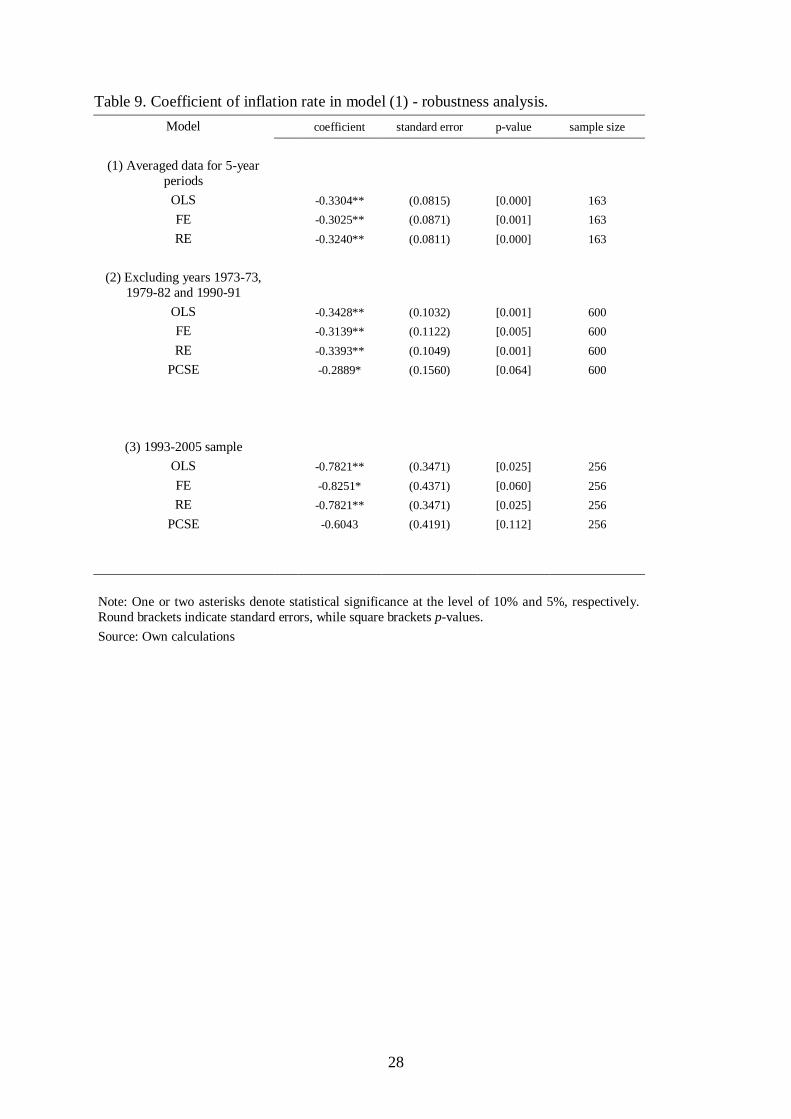
In the next step, the re-estimation of model (1) was carried out using the averaged
values for five years non-overlapping periods. This modification allows us to see if the
obtained results do not critically depend on the apparent short-term correlations between the
analysed variables. The averaging of the data, though not devoid of weaknesses (cf. e.g.
Hendry and Ericsson, 1991), is a method often used in testing hypotheses based on
macroeconomic panel data, with the usually adopted averaging horizon of five years (cf. e.g.
Ghosh and Phillips, 1998; Levine et al., 2000, Blanchard and Wolfers, 2000, Rousseau and
Wachtel, 2002; Gruben and McLeod, 2003; Bowdler and Nunziata, 2007).
The results of the estimation of model (1) for thus defined panel are presented in
Table 9 (Regression 1)15
. The estimation was carried out on the basis of "classical" estimators
(OLE, FE and RE). Due to the lack of an adequate number of observations, the GMM2S and
the PCSE estimator were omitted. Regardless of the estimation method, the impact of
inflation on investment is negative and statistically significant at the level of 5%. At the same
14 This was first pointed out by Nickell (1981), in the context of the FE estimator. 15 The reported result for this and following robustness tests are restricted to respective coefficient of inflation,
its standard errors, p-values and number of observations. The remaining results did not change substantially what
allows to maintain previously formulated conclusions.
14
time, the absolute value of the estimated coefficient is about two times higher than in the case
of corresponding estimates made on annual data. This can be attributed to the "averaging" of
the nonlinear effect observed when the correlation is estimated on annual data.
[Table 9 here]
The next step of the robustness analysis was to determine whether the estimated
relationship between inflation and corporate investment depended critically on the inclusion
in the sample of observations for years in which oil crises occurred. Supply shocks associated
with oil prices could be responsible for the apparent correlation of inflation and investment, as
they were accompanied by a simultaneous acceleration of price growth and weakening of
economic growth (this effect, however, is at least partially controlled in previously estimated
equations by including the GDP growth rate as a control variable). In order to examine
whether this effect is significant for the analysed relationship, the model was re-estimated by
removing observations for 1973-1975, 1979-1982 and 1990-1992 from the sample. Another
possible approach would be to extend the set of control variables with oil prices (or oil price
growth), yet the response of economies to the same price changes can vary between countries
and periods. For example, the scale of changes in oil prices seen over the past decade was
comparable with the changes in the periods of oil crises, even though the impact of these
shocks on the economies of the developed countries proved very limited.
The estimation results of model (1) on a reduced sample are presented in Table 9
(regression 2). The exclusion of years marked by oil crises from the sample did not change the
sign and the significance of the relationship between inflation and investment estimated on the
entire data set. The response of investment, however, turned out to be about two times
stronger than in the case of results obtained in the case of the model estimated for the entire
sample. The increase in the parameter estimate is again a reflection of the nonlinearity
characteristic of the inflation-investment relationship. In the years of oil crises the average
level of inflation in the surveyed countries was among the highest in the whole examined
period, and the results accounting for this nonlinearity indicated that inflation changes in the
range of high (in the context of the analysed sample) values had a relatively smaller impact on
investment growth than inflation changes in the range of 3-5.5%.
Another important test of robustness of the results received so far was the re-
estimation of the model on the sample covering the years 1993-2005. During this period,
central banks in many of the analysed countries embarked on pursuing a monetary policy
based on direct inflation targeting. Such narrowing of the sample helps assess whether, after
the changed regime of monetary policy pursuit, the conclusions about the impact of inflation
on investment drawn on the basis of the entire period remained in force.
The results of the estimation carried out on a sample narrowed down to the period
1993-2005 are presented in Table 9 (regression 3). Except for the estimate obtained using the
PCSE estimator, the coefficient of inflation in equation (1) is negative and statistically
significant at the level of at least 10%. The values of estimated parameters are, in absolute
terms, several times higher than in the case of results obtained for the model estimated for the
entire sample. In part, the higher estimates probably result from the nonlinear relationship
between inflation and investment growth. In the years 1992-2005, the average inflation in the
examined countries was significantly lower than in the years 1960-1991 and, as demonstrated
by the results accounting for this nonlinearity, changes in inflation in its lower range have a
relatively greater impact on corporate investment than its changes in the higher range.
15
7. Summary and conclusions
In this article, we have analysed the relationship between the growth of corporate
investment and inflation in 21 OECD countries in 1960-2005, i.e. in the case when inflation
did not exceed its moderate levels. The main conclusions from this analysis are as follows:
The relationship between inflation and investment in the analyzed group of countries was
negative and statistically significant. This result was obtained irrespective of the
estimators applied. It is also robust to changes in the specification of the estimated
equation, data frequency and the period considered in the study.
The resulting relationship is nonlinear in nature. At very low values of inflation (below
2.5%), the relationship is unstable. The increase in inflation in the range above 3.0% has a
negative impact on investment. Moreover, the marginal impact of inflation is the greatest
when it is in the range of approximately 3.0-5.5% and decreases with further inflation rise.
The negative relationship between inflation and investment is therefore not limited only to
the range of high inflation values and a given inflation rate may have a particularly strong
negative impact on corporate investment when the initial level of inflation is low. These
results suggest also that the impact of inflation on corporate investment dynamics may be
the source of nonlinear nature of the relationship between GDP growth and inflation
identified in recent empirical studies.
The variables approximating the cost of capital utilisation, such as the long-term interest
rate or the relative cost of capital are not statistically significant determinants of
investment, if the direct impact of inflation is controlled in the model. In turn, the rate of
economic growth (positive impact) and the scale of investment undertaken by the public
sector (negative impact) have an impact on corporate investment that is significant and
robust to various changes in model specification. Therefore, this is a result consistent with
the results of other empirical studies, which indicate that the significance of “quantitative”
variables (such as demand growth, production capacity utilisation, etc.) in explaining the
volatility of investment processes is greater than it is true for any measures of the cost of
capital.
The obtained results suggest that the risk of negative impact of growing inflation on corporate
investment should be treated as a counterbalance to the fears that the tightening of monetary
policy may discourage firms from investing and, as a result, prolong the period of recovery
from the economic slowdown.

16
Bibliography:
Abel A. B., 1983. Optimal Investment under Uncertainty. American Economic Review 72 (1):
228-233
Abel A. B., Dixit A.K., Eberly J., Pindyck R.S., 1996. Options, the Value of Capital, and
Investment. Quarterly Journal of Economics 111(3): 753-77
Akerlof G. A., 1970. The Market for 'Lemons': Quality Uncertainty and the Market
Mechanism. Quarterly Journal of Economics 84(3): 488-500
Andres J., Hernando I., 1997. Does Inflation Harm Economic Growth? Evidence for the
OECD. NBER Working Papers 6062
Argimon I., Gonzalez-Paramo J., Roldan J., 1997. Evidence of Public Spending Crowding-
Out from a Panel of OECD Countries. Applied Economics 29(8): 1001-10
Baddeley M. C., 2003. Investment Theories and Analysis. Palgrave Macmillan: London
Ball L., Cecchetti S., 1991. Inflation and Uncertainty at Short and Long Horizons. NBER
Reprints 1522
Ball L., Romer D., 1993. Inflation and the Informativeness of Prices. NBER Working Papers
4267
Banerjee A., Cockerell L., Russell B., 2001. An I(2) Analysis of Inflation and the Markup.
Journal of Applied Econometrics 16(3): 221-240
Banerjee A., Mizen P., Russell B., 2007. Inflation, Relative Price Variability and the Markup:
Evidence from the United States and the United Kingdom. Economic Modelling, 24(1): 82-
100
Banerjee A., Russell B., 2005. Inflation and Measures of the Markup. Journal of
Macroeconomics 27(2): 289-306
Barnes M., Boyd J. H., Smith B.D., 1999. Inflation and Asset Returns. European Economic
Review 43(4-6): 737-754
Barro R. J., 1995. Inflation and Economic Growth. NBER Working Papers 5326
Batini N., Jackson B., Nickell S., 2000. Inflation Dynamics and the Labour Share in the UK.
Bank of England Monetary Policy Committee Unit Discussion Papers 02
Baum Ch. F., Caglayan M., Ozkan N., 2004. The Second Moments Matter: The Response of
Bank Lending Behavior to Macroeconomic Uncertainty. Computing in Economics and
Finance 172
Beck N., Katz J., 1995. What To Do (and Not To Do) with Time-Series Cross-Section Data.
American Political Science Review 89: 634–47
Blanchard O., 1986. Comments and Discussion, Brookings Papers on Economic Activity 86:
153-156
Blanchard O., Wolfers J., 2000. The Role of Shocks and Institutions in the Rise of European
Unemployment: The Aggregate Evidence. Economic Journal 110(462): C1-33
Bowdler C., Nunziata L., 2007. Trade Union Density and Inflation Performance: Evidence
from OECD Panel Data. Economica 74(293): 135-159

17
Boyd J. H., Choi S., Smith B.D., 1996. Inflation, Financial Markets, and Capital Formation.
Federal Bank of St. Louis Review 11
Boyd J. H., Levine R., Smith B. D., 2001. The Impact of Inflation on Financial Sector
Performance. Journal of Monetary Economics 47(2): 221-248
Boyd J. H., Smith B. D., 1998. Capital Market Imperfections in a Monetary Growth Model,
Economic Theory 11: 241–273
Breitung J., Pesaran M. H., 2005. Unit Roots and Cointegration in Panels. IEPR Working
Papers 05-32
Bruno G., 2005. Approximating the Bias of the LSDV Estimator for Dynamic Unbalanced
Panel Data Models. CESPRI Working Papers 159
Bruno M., 1993. Inflation and Growth in an Integrated Approach. NBER Working Papers
4422
Bruno M., Easterly W., 1998. Inflation Crises and Long-Run Growth. Journal of Monetary
Economics 41(1): 3-26
Bullard J., Russell S., 2004. How Costly is Sustained Low Inflation for the U.S. Economy?
Federal Reserve Bank of St. Louis Review 5: 35-68
Bun M., Kiviet J., 2002. On the Diminishing Returns of Higher-order Terms in Asymptotic
Expansions of Bias. Tinbergen Institute Discussion Papers 02-099/4
Byrne J. P., Davis E. P., 2004. Permanent and Temporary Inflation Uncertainty and
Investment in the United States. Economics Letters 85(2): 271-277
Caporale G. M., Onorante L., Paesani P., 2010. Inflation and Inflation Uncertainty in the Euro
Area European Central Bank Working Paper Series 1229
Chirinko R. S., 1987. The Ineffectiveness of Effective Tax Rates on Business Investment : A
Critique of Feldstein's Fisher-Schultz Lecture. Journal of Public Economics 32(3): 369-387
Chirinko R. S., 1993. Business Fixed Investment: A Critical Survey of Modeling Strategies,
Empirical Results and Policy Implications. Journal of Economic Literature 31: 1875-1911
Chirinko R. S., Fazzari S. M., Meyer A. P., 1999. How Responsive Is Business Capital
Formation To Its User Cost?: An Exploration With Micro Data. Journal of Public Economics,
74(1): 53-80
Ciżkowicz P., Hołda M., Rzońca A., 2009. Inflation and Investment in Monetary Growth
Models. Bank and Credit 40(6): 9-40
Ciżkowicz P., Hołda M., Rzońca A., 2010. Inflation and Corporate Investment: A Critical
Survey. Bank and Credit 41(6): 5-44
Cohen D., Hassett K. A., Hubbard R. G., 1999. Inflation and the User Cost of Capital: Does
Inflation Still Matter? NBER Working Papers 6046
Cuadro L., Gallego H., Herrero A., 2003. Why Do Countries Develop More Financially Than
Others? The Role Of The Central Bank And Banking Supervision. Finance 0304006
De Gregorio J., 1996. Inflation, Growth, and Central Banks: Theory and Evidence. World
Bank Policy Research Working Paper Series 1575
De Gregorio J., Sturzenegger F., 1994. Credit Markets and the Welfare Costs of Inflation.
NBER Working Papers 4873
18
Desai M, Hines J. Jr, 1997. Excess Capital Flows and the Burden of Inflation in Open
Economies. NBER Working Papers 6064
Dixit A. K., Pindyck R. S., 1994. Investment under Uncertainty Princeton: Princeton
University Press
Dornbusch R., Fischer S., 1991. Moderate Inflation. World Bank Policy Research Working
Paper 807
Easterly W., Rebelo S., 1993. Fiscal Policy and Economic Growth: An Empirical
Investigation. Journal of Monetary Economics 32: 417-458
Evans M., 1991. Discovering the Link between Inflation Rates and Inflation Uncertainty.
Journal of Money, Credit and Banking 23(2): 169-84
Evans M., Wachtel P., 1993. Inflation Regimes and the Sources of Inflation Uncertainty.
Federal Reserve Bank of Cleveland Proceedings: 475-520
Espinoza R., Prasad A., Leon H., 2010. Estimating The Inflation-Growth Nexus - A Smooth
Transition Model. IMF Working Papers 10/76
Feldstein M., 1980. Inflation, Tax Rules, and Investment: Some Econometric Evidence.
NBER Working Papers 0577
Feldstein M., Green J.R., Sheshinski E., 1978. Inflation and Taxes in a Growing Economy
with Debt and Equity Finance. Journal of Political Economy 86(2): 53-70
Ferderer J. P., 1993. The Impact of Uncertainty on Aggregate Investment Spending: An
Empirical Analysis. Journal of Money, Credit and Banking 25(1): 30-48
Fischer S., 1993. The Role of Macroeconomic Factors in Growth. NBER Working Papers
4565
Friedman M., 1977. Noble Lecture: inflation and Unemployment. Journal of Political
Economy 85: 451-72
Fisher G., 2009. Investment Choice and Inflation Uncertainty, London School of Economics,
mimeo
Gale D., Hellwig M., 1985., Incentive Compatible Debt Contracts: the One Period Problem.
Review of Economic Studies 52: 647-663
Ghosh A., Phillips S., 1998. Warning: Inflation May Be Harmful to Your Growth. IMF Staff
Papers 45(4)
Gruben W. C., McLeod D., 2003. The Openness-Inflation Puzzle Revisited. Federal Reserve
Bank of Dallas Center for Latin America Working Papers 0203
Guerrero F., 2005. The Adverse Effects of High Inflation-Induced Uncertainty on Capital
Accumulation, mimeo
Guiso L., Parigi G., 1999. Investment And Demand Uncertainty. Quarterly Journal of
Economics 114(1): 185-227
Hamid J., Singh A., 1992. Corporate Financial Structure in Developing Countries. World
Bank Papers 1
Hansen B.E., 1999. Threshold Effects in Non-Dynamic Panels: Estimation, Testing, and
Inference. Journal of Econometrics 93: 345-368
Hartman R., 1972. The Effect of Price and Cost Uncertainty on Investment. Journal of
Economic Theory 5: 258-266
19
Hartman R., 1980. Taxation and the Effects of Inflation on the Real Capital Stock in an Open
Economy. NBER Reprints 0117
Head A., Kumar A., Lapham B., 2006. Market Power, Price Adjustment, and Inflation.
Queen's University Department of Economics Working Papers 1089
Hendry D. F., Ericsson N. R., 1991. An Econometric Analysis of U.K. Money Demand in
'Monetary Trends in the United States and the United Kingdom' by Milton Friedman and
Anna Schwartz. American Economic Review 81(1): 8-38
Huybens E., Smith B.D., 1999. Inflation, Financial Markets and Long-Run Real Activity.
Journal of Monetary Economics 43(2): 283-315
Jaffee D., Russel T., 1976. Imperfect Information, Uncertainty, and Credit Rationing,
Quarterly Journal of Economics 81: 651-666
Jorgenson D. J., 1963. Capital Theory and Investment Behavior. American Economic Review
53(2): 247–259
Kalckreuth von U., 2000. Exploring the Role of Uncertainty for Corporate Investment
Decisions in Germany, Deutsche Bundesbank Research Centre Discussion Paper Series.
Economic Studies 05.
Khan S., Senhadij A., 2001. Treshold effects in the relationship between inflation and growth.
IMF Staff Papers 48(1): 1-21
Khan S., Senhadji A. , Smith B. D., 2006. Inflation And Financial Depth, Macroeconomic
Dynamics 10(02): 165-182
Kleibergen F., Paap R., 2006. Generalized Reduced RankTests Using the Singular Value
Decomposition. Journal of Econometrics 133: 97-126
Kremer S., Bick A., Nautz D., 2010. Inflation and growth: new evidence from a dynamic
panel threshold analysis. Freie Universitat Berlin Discussion Papers 2009/09
Leahy J. V., Whited T. M., 1995. The Effect of Uncertainty on Investment: Some Stylized
Facts. NBER Working Papers 4986
Lee J., Shin K., 2000. The role of variable input in the relationship between investment and
uncertainty. American Economic Review 90(3): 667-680
Levine R., Loayza N., Beck T., 2000. Financial Intermediation and Growth: Causality and
Causes. Journal of Monetary Economics 46(1): 31-77
Levine R., Zervos S., 1993. Looking at the Facts : What We Know About Policy and Growth
From Cross-Country Analysis. World Bank Policy Research Working Paper Series 1115
Lopez D. M., 2001. Linking Public Investment to Private Investment. The Case of the Spanish
Regions. Economic Working Papers at Centro de Estudios Andaluces E2001/04
McDonald R.L., Siegel D., 1987. The Value of Waiting to Invest. NBER Working Papers
1019
McKinnon R., 1991. The Order of Economic Liberalization: Financial Control in the
Transtition to Market Economy. Baltimore: John Hopkins University Press
Nautz D., Scharff J., 2005. Inflation and Relative Price Variability in a Low Inflation
Country: Empirical Evidence for Germany. German Economic Review 6(4): 507-523
Nickell S. J., 1981. Biases in Dynamic Models with Fixed Effects. Econometrica 49(6): 1417-
26

20
Omay T., Kan E. O., 2010. Re-examining the Threshold Effects in the Inflation–Growth
Nexus with Cross-sectionally Dependent Non-linear Panel: Evidence from Six Industrialized
Economies. Economic Modelling 27(5): 997-1005
Pelgrin F., Schich S., de Serres A. , 2002. Increases in Business Investment Rates in OECD
Countries in the 1990s: How Much Can be Explained by Fundamentals? OECD Economics
Department Working Papers 327
Pesaran M. H., 2005. A Simple Panel Unit Root Test in the Presence of Cross Section
Dependence. Cambridge Working Papers in Economics 0346
Pindyck R. S., Solimano A., 1993. Economic Instability and Aggregate Investment. NBER
Working Papers 4380
Reagan P., Stulz R., 1993. Contracting Costs, Inflation, and Relative Price Variability.
Journal of Money, Credit and Banking 25(3): 585-601
Rotemberg J., 1983. Aggregate Consequences of Fixed Costs of Price Adjustment: Sticky
Prices and Disequilibrium Adjustment in a Rational Model of the Inflationary Process.
American Economic Review 73(3): 433-36
Rousseau P. L., Wachtel P., 2002. Inflation Thresholds and the Finance-Growth Nexus.
Journal of International Money and Finance 21(6): 777-793
Russell B., Evans J., Preston B., 2002. The Impact of Inflation and Uncertainty on the
Optimum Markup Set by Firms. European University Institute Economics Working Papers
2002/02
Serven L., 1998. Macroeconomic Uncertainty and Private Investment in Developing
Countries - An Empirical Investigation. World Bank Policy Research Working Paper Series
2035
Serven L., Solimano A., 1993. Economic Adjustment and Investment Performance in
Developing Countries: The Experience of the 1980s, in: Serven, Solimano A. [eds.] Striving
for Growth after Adjustment. Washington D.C.: World Bank
Smith R. T., van Egteren H. , 2005. Inflation, Investment and Economic Performance: The
Role of Internal Financing. European Economic Review 49(5): 1283-1303
Sorensen P., 1986. Taxation, Inflation, and Asset Accumulation in a Small Open Economy.
European Economic Review 30(5): 1025-1041
Stock J.H., Wright J.H., Yogo M., 2002. A Survey of Weak Instruments and Weak
Identification in Generelized Method of Moments. Journal of Business and Economic
Statistics 20(4): 518-29
Temple J., 2000. Inflation and growth: stories short and tall. Journal of Economic Surveys
14(4): 395-426
Tobin J., 1969. A General Equilibrium Approach to Monetary Theory. Journal of Money,
Credit and Banking 1(1): 15-29
Tommasi M., 1994. Inflation and the Informativeness of Prices Microeconomic Evidence
from High Inflation. UCLA Economics Working Papers 718
Townsend R., 1979. Optimal Contracts and Competitive Markets with Costly State
Verification. Journal of Economic Theory 21: 265-93
Voss G. M., 2002. Public and Private Investment in the United States and Canada. Economic
Modelling 19(4): 641-664

21
Table 1. Frequency distribution of inflation and corporate investment growth.
Inflation Investment growth
<-5 -5-0 0-5 5-10 10-20 >20 negative positive Total
<3 3.0 5.2 10.5 11.1 6.6 1.2 8.11 29.39 37.5
3-5 2.4 3.4 4.8 7.1 4.1 0.6 5.81 16.56 22.4
5-10 3.6 3.7 5.6 5.2 4.6 1.1 7.35 16.45 23.8
10-15 2.1 1.1 2.4 2.1 1.6 0.3 3.18 6.46 9.6
15-20 0.7 1.1 1.3 0.3 0.8 0.1 1.76 2.53 4.3
>20 0.7 0.9 0.6 0.1 0.2 0.0 1.54 0.88 2.4
Total 12.4 15.4 25.2 25.9 17.9 3.3 27.74 72.26 100.0
Source: Own calculations
Table 2. Mean and median of inflation and corporate investment growth.
Inflation
Number of
observations
Inflation Investment growth
Mean Median Mean Median
<3 342 1.8 2.0 5.2 5.1
3-5 204 3.9 3.8 4.5 5.3
5-10 217 7.1 6.8 4.2 4.5
10-15 88 12.1 11.8 3.2 3.5
15-20 39 17.0 16.9 1.9 2.2
>20 22 23.6 23.1 -1.9 -1.7
All observations 912 5.7 4.0 4.3 4.6
Source: Own calculations

22
Table 3. Results of panel stationarity test by Pesaran (2005).
Variable t-statistic p-value
Without trend
inv_corpit -10.234 0.000
πit -9.636 0.000
gdpit -10.890 0.000
inv_pubit -12.315 0.000
rel_costit -1.382 0.083
irit -4.628 0.000
With trend
inv_corpit -9.112 0.000
πit -8.151 0.000
gdpit -9.404 0.000
inv_pubit -11.069 0.000
rel_costit -2.231 0.013
irit -2.275 0.011
Source: Own calculations

23
Table 4. Results of model (1) estimation on entire sample.
OLS FE RE
(1) (2) (3)
πit -0.1829** -0.1162 -0.1648**
(0.0704) (0.0774) (0.0721)
[0.010] [0.113] [0.022]
gdpit 2.1238** 2.2345** 2.1570**
(0.0973) (0.1039) (0.0986)
[0.000] [0.000] [0.000]
inv_pubit -0.1657** -0.1646** -0.1654**
(0.0242) (0.0243) (0.0241)
[0.000] [0.000] [0.000]
rel_costit 2.2930 -3.6822 0.5402
(1.8260) (2.9675) (2.1065)
[0.210] [0.215] [0.798]
irit 0.0620 0.0887 0.0607
(0.0859) (0.0952) (0.0887)
[0.471] [0.352] [0.494]
Total R2 0.3902 0.3821 0.3894
Within R2 NA 0.4120 0.3966
Between R2 NA 0.2864 0.2411
Wald test of total significance (p value) 0.000 0.000 0.000
Wald test of total significance of fixed
effects (p value) NA 0.044 NA
LR Breusch-Pagan test of random effects
(p value) NA NA 0.752
Hausman specification test (p value) NA 0.431
Number of observations 790 790 790
Note: One or two asterisks denote statistical significance at the level of 10% and 5%,
respectively. Round Round brackets indicate standard errors, while square brackets p-values.
Source: Own calculations

24
Table 5. Results of model (1) estimation on entire sample (continued).
PCSE GMM2S
(1) (2)
πit -0.1472* -0.3578*
(0.0870) (0.2042)
[0.091] [0.080]
gdpit 2.0910** 2.5309**
(0.1084) (0.9372)
[0.000] [0.007]
inv_pubit -0.1670** 0.2865
(0.0264) (0.4215)
[0.000] [0.497]
rel_costit 3.1294 -5.7543
(2.3302) (5.2487)
[0.179] [0.273]
irit 0.0172 0.5124**
(0.1037) (0.1772)
[0.868] [0.004]
Total R2 0.3736 0.1542
Wald test of total significance (p value) 0.000 0.000
Hansen J-statistics NA 0.330
Number of observations 790 774
Note: One or two asterisks denote statistical significance at the level of 10% and 5%, respectively.
Round brackets indicate standard errors, while square brackets p-values.
Source: Own calculations

25
Table 6. Results of model (1) estimation with interactive variable.
OLS FE RE
(1) (2) (3)
πit -0.2123** -0.1471* -0.1913**
(0.0711) (0.0784) (0.0730)
[0.003] [0.061] [0.009]
π_3_5.5it -0.3320** -0.2874** -0.3108**
(0.1285) (0.1304) (0.1285)
[0.010] [0.028] [0.016]
gdpit 2.1474** 2.2480** 2.1806**
(0.0974) (0.1038) (0.0988)
[0.000] [0.000] [0.000]
inv_pubit -0.1628** -0.1621** -0.1625**
(0.0241) (0.0242) (0.0241)
[0.000] [0.000] [0.000]
rel_costit 2.4671 -2.9542 0.6618
(1.8206) (2.9784) (2.1285)
[0.176] [0.322] [0.756]
irit 0.0821 0.1051 0.0807
(0.0860) (0.0953) (0.0891)
[0.34] [0.270] [0.365]
Total R2 0.3953 0.3885 0.3945
Within R2 NA 0.4050 0.4038
Between R2 NA 0.2652 0.2142
Wald test of total significance (p value) 0.000 0.000 0.000
Wald test of total significance of fixed effects (p value) NA 0.066 NA
LR Breusch-Pagan test of random effects (p value) NA NA 0.752
Hausman specification test (p value) NA 0.431
Number of observations 790 790 790
Note: One or two asterisks denote statistical significance at the level of 10% and 5%,
respectively. Round brackets indicate standard errors, while square brackets p-values.
Source: Own calculations
26
Table 7. Results of model (1) estimation with interactive variable (continued).
PCSE
(1) GMM2S
(2)
πit -0.1740* -0.4821**
(0.0869) (0.2052)
[0.045] [0.019]
π_3_5.5it -0.3444** -0.5267*
(0.1275) (0.2983)
[0.007] [0.077]
gdpit 2.1102** 2.4661**
(0.1085) (1.0420)
[0.000] [0.018]
inv_pubit -0.1643** 0.3871
(0.0263) (0.5064)
[0.000] [0.445]
rel_costit 3.4450 -4.2369
(2.2938) (5.3652)
[0.133] [0.430]
irit 0.0289 0.6027**
(0.1034) (0.2199)
[0.780] [0.006]
Total R2 0.3860 0.056
Wald test of total significance (p value) 0.000 0.000
Hansen J-statistics (p-value) NA 0.288
Number of observations 790 774
Note: One or two asterisks denote statistical significance at the level of 10% and 5%,
respectively. Round brackets indicate standard errors, while square brackets p-values.
Source: Own calculations

27
Table 8. Results of model (6) estimation.
FE LSDVC
(1) (2)
inv_corpit-1 0.0870** 0.1154**
(0.0359) (0.0084)
[0.015] [0.000]
πit 0.0430 0.0422
(0.1048) (0.0343)
[0.681] [0.123]
π t-1 -0.309** -0.3137**
(0.1162) (0.1136)
[0.008] [0.006]
gdpit 2.0444** 2.0475**
(0.1104) (0.0627)
[0.000] [0.000]
gdp t-1 0.3259** 0.2577**
(0.1411) (0.0862)
[0.021] [0.003]
inv_pubit -0.1895** -0.1903**
(0.0245) (0.0084)
[0.000] [0.000]
inv_pub t-1 -0.0423* -0.0377
(0.0247) (0.0278)
[0.087] [0.175]
rel_cost t-1 -0.9369 -2.0411**
(3.0498) (0.3999)
[0.759] [0.000]
ir t-1 0.1988** 0.2313**
(0.0955) (0.0331)
[0.038] [0.000]
Total R2 0.4227 NA
Within R2 0.4227 NA
Inter-group R2 0.3198 NA
Number of observations 770 790
Note: One or two asterisks denote statistical significance at the level of 10% and 5%,
respectively. Round brackets indicate standard errors, while square brackets p-values.
Source: Own calculations
28
Table 9. Coefficient of inflation rate in model (1) - robustness analysis.
Model coefficient standard error p-value sample size
(1) Averaged data for 5-year
periods
OLS -0.3304** (0.0815) [0.000] 163
FE -0.3025** (0.0871) [0.001] 163
RE -0.3240** (0.0811) [0.000] 163
(2) Excluding years 1973-73,
1979-82 and 1990-91
OLS -0.3428** (0.1032) [0.001] 600
FE -0.3139** (0.1122) [0.005] 600
RE -0.3393** (0.1049) [0.001] 600
PCSE -0.2889* (0.1560) [0.064] 600
(3) 1993-2005 sample
OLS -0.7821** (0.3471) [0.025] 256
FE -0.8251* (0.4371) [0.060] 256
RE -0.7821** (0.3471) [0.025] 256
PCSE -0.6043 (0.4191) [0.112] 256
Note: One or two asterisks denote statistical significance at the level of 10% and 5%, respectively.
Round brackets indicate standard errors, while square brackets p-values.
Source: Own calculations

29
Figure 1. Coefficient of inflation rate in equation (1) based on OLS rolling regression
estimation.
Source: Own calculations
-4.0
-3.5
-3.0
-2.5
-2.0
-1.5
-1.0
-0.5
0.0
0.5
1.0
1.5
2.0
2.5
3.0
0.9 1.4 1.9 2.2 2.5 2.8 3.3 3.9 4.5 5.4 6.3 7.4 9.2 11.0 15.2
Co
eff
icie
nt
of
infl
ati
on
ra
te a
nd
95
%
co
nfi
de
nc
e in
terv
al
Highest inflation value in the sample
Sample size extended by 1 observation from 50 to 790(observations in order of growing inflation rate)
Coeff icient estimate 95% conf idence interval