Inflammation-associated lysophospholipids as ligands for CD1d-restricted T cells in human cancer
42
doi:10.1182/blood-2008-04-149831 Prepublished online June 5, 2008; Amitabha Mazumder, David H Vesole, Sundar Jagannath and Madhav V Dhodapkar David H Chang, Haiteng Deng, Phillip Matthews, Joseph Krasovsky, Govind Ragupathi, Radek Spisek, T cells in human cancer Inflammation associated lysophospholipids as ligands for CD1d restricted (4217 articles) Neoplasia (5012 articles) Immunobiology Articles on similar topics can be found in the following Blood collections http://bloodjournal.hematologylibrary.org/site/misc/rights.xhtml#repub_requests Information about reproducing this article in parts or in its entirety may be found online at: http://bloodjournal.hematologylibrary.org/site/misc/rights.xhtml#reprints Information about ordering reprints may be found online at: http://bloodjournal.hematologylibrary.org/site/subscriptions/index.xhtml Information about subscriptions and ASH membership may be found online at: digital object identifier (DOIs) and date of initial publication. the indexed by PubMed from initial publication. Citations to Advance online articles must include final publication). Advance online articles are citable and establish publication priority; they are appeared in the paper journal (edited, typeset versions may be posted when available prior to Advance online articles have been peer reviewed and accepted for publication but have not yet Copyright 2011 by The American Society of Hematology; all rights reserved. 20036. the American Society of Hematology, 2021 L St, NW, Suite 900, Washington DC Blood (print ISSN 0006-4971, online ISSN 1528-0020), is published weekly by For personal use only. by guest on May 30, 2013. bloodjournal.hematologylibrary.org From
Transcript of Inflammation-associated lysophospholipids as ligands for CD1d-restricted T cells in human cancer

doi:10.1182/blood-2008-04-149831Prepublished online June 5, 2008;
Amitabha Mazumder, David H Vesole, Sundar Jagannath and Madhav V DhodapkarDavid H Chang, Haiteng Deng, Phillip Matthews, Joseph Krasovsky, Govind Ragupathi, Radek Spisek, T cells in human cancerInflammation associated lysophospholipids as ligands for CD1d restricted
(4217 articles)Neoplasia � (5012 articles)Immunobiology �
Articles on similar topics can be found in the following Blood collections
http://bloodjournal.hematologylibrary.org/site/misc/rights.xhtml#repub_requestsInformation about reproducing this article in parts or in its entirety may be found online at:
http://bloodjournal.hematologylibrary.org/site/misc/rights.xhtml#reprintsInformation about ordering reprints may be found online at:
http://bloodjournal.hematologylibrary.org/site/subscriptions/index.xhtmlInformation about subscriptions and ASH membership may be found online at:
digital object identifier (DOIs) and date of initial publication. theindexed by PubMed from initial publication. Citations to Advance online articles must include
final publication). Advance online articles are citable and establish publication priority; they areappeared in the paper journal (edited, typeset versions may be posted when available prior to Advance online articles have been peer reviewed and accepted for publication but have not yet
Copyright 2011 by The American Society of Hematology; all rights reserved.20036.the American Society of Hematology, 2021 L St, NW, Suite 900, Washington DC Blood (print ISSN 0006-4971, online ISSN 1528-0020), is published weekly by
For personal use only. by guest on May 30, 2013. bloodjournal.hematologylibrary.orgFrom

Inflammation associated lysophospholipids as ligands for CD1d restricted T cells in human cancer David H. Chang1, Haiteng Deng2, Phillip Matthews1, Joseph Krasovsky1, Govind Ragupathi4, Radek Spisek1, Amitabha Mazumder5, David H. Vesole5, Sundar Jagannath5, Madhav V. Dhodapkar1,3,6,7 1Laboratory of Tumor Immunology and Immunotherapy, 2Proteomics Resource Center, 3Chris Browne Center for Immunologic Diseases, The Rockefeller University; 4Department of Medicine, Memorial Sloan Kettering Cancer Center, New York, NY, 5St. Vincent’s Cancer Center, New York, NY; 6Section of Hematology, Yale University; 7Program in Hematologic Malignancies, Yale Cancer Center, New Haven, CT 06520 Section: Immunobiology Key words: Glycolipids, inflammation, innate immunity, multiple myeloma, natural killer T cells Correspondence: Madhav V. Dhodapkar, MD; Section of Hematology; Yale University 333 Cedar Street; New Haven, CT 06510 Email: [email protected]
Blood First Edition Paper, prepublished online June 5, 2008; DOI 10.1182/blood-2008-04-149831
Copyright © 2008 American Society of Hematology
For personal use only. by guest on May 30, 2013. bloodjournal.hematologylibrary.orgFrom

Abstract:
CD1d restricted T cells have been implicated in the pathogenesis of several chronic
inflammatory states. However the nature of the specific ligands recognized by these
cells in vivo in patients with inflammatory or malignant diseases remains unknown. We
took a biochemical approach to directly isolate and characterize the nature of CD1d
binding ligands from the plasma of myeloma patients. Characterization of these ligands
revealed several lysophosphatidylcholine (LPC) species. Human LPC-CD1d dimer
binding cells are TCRαβ+ T cells but predominantly Vα24-Vβ11-. Cytokine secretion by
LPC specific T cells is skewed towards IL13 secretion; and the frequencies of these
cells are increased in myeloma patients relative to healthy donors. These data identify a
distinct population of human CD1d-restricted T cells specific for inflammation associated
lysolipids and suggest a novel mechanism for inflammation mediated immune regulation
in human cancer.
For personal use only. by guest on May 30, 2013. bloodjournal.hematologylibrary.orgFrom

Introduction
In contrast to CD4 and CD8+ T cells that recognize peptide ligands in the context of
major histocompatibility complex (MHC) class I and II molecules, a distinct subset of T
cells recognize lipid antigens in the context of CD1d molecules on antigen presenting
cells1,2. Broadly, two distinct types of CD1d restricted T cells have been identified3. One
subset of CD1d-restricted T cells, also known as invariant or type I natural killer T (NKT)
cells, express an invariant T cell receptor (iTCR: Vα24/Vβ11 in humans and Vα14 in
mice) and NK markers such as CD1612,4. However particularly in humans, many CD1d
restricted T cells lack iTCR and have been termed type II NKT cells5,6. Most of the early
work on CD1d restricted T cells was based on the recognition of a synthetic ligand α-
galactosyl ceramide (α-GalCer), by iNKT cells 4. Recent studies have shown that type I
NKT cells can recognize some microbial glycolipids, and self antigens such as
isoglobotrihexosylceramide (iGb3) (reviewed in Brutkiewicz)7. The nature of antigens
specifically recognized by type II NKT cells is less clear and limited to sulfatide and non-
lipidic small molecules 8,9. Binding of CD1d molecules to phospholipids has also been
demonstrated10-13. However, whether these molecules are commonly recognized by
populations of human T cells is not known.
Several studies have suggested an important role for CD1d restricted T cells in the
regulation of chronic inflammatory states. For example, type I NKT cells can promote
allergen induced asthma and atherosclerosis, and can mediate protection against some
autoimmune states in mice 1. Cancer is intricately linked to inflammation. NKT cells
For personal use only. by guest on May 30, 2013. bloodjournal.hematologylibrary.orgFrom

have been implicated in both immune surveillance and immune regulation in cancer,
attributed to type I and II NKT cells respectively 1,14. In some setting, GD3 and tumor
derived glycosphingolipids have been implicated as ligands for iNKT cells15,16. However
the nature of the specific ligands recognized by either type I or II NKT cells in
inflammation or cancer in humans remains unclear.
Multiple myeloma (MM) is a plasma cell tumor wherein both the innate and adaptive
limbs of the immune response are able to recognize cancer cells17. In prior studies, we
have shown that clinical progression in myeloma is associated with dysfunction of type I
NKT cells 18. In order to identify the nature of CD1d binding ligands in human myeloma,
we took a biochemical approach to directly isolate and characterize the CD1d binding
lipids from the plasma of these patients. Here we show that CD1d binding ligands
isolated from myeloma patients that are recognized by human T cells are inflammation
associated lysophospholipids.
For personal use only. by guest on May 30, 2013. bloodjournal.hematologylibrary.orgFrom

Materials and Methods
Plasma and cells from patient and healthy donors
Peripheral blood mononuclear cells (PBMC) were obtained from healthy donors (buffy
coats from New York Blood Center) and from myeloma patients following informed
consent approved by the institutional review board of the Rockefeller University and St.
Vincent’s Cancer Center. Blood mononuclear cells were isolated by density gradient
centrifugation using Ficoll-Paque (Amersham Biosciences, Upsala, Sweden). Plasma
was harvested from the top of the gradient and cryopreserved until use for lipid
isolation. Samples from myeloma patients were collected under the auspices of a
protocol for collection of samples for research approved by IRB at St. Vincents and
Rockefeller.
Reagents
All lipid products were purchased from Avanti lipids (Alabaster, AL), dissolved in
chloroform at 10 mg/ml and stored at -20ºC as storage stock. To prepare 1 mg/ml
working stock, phospholipids were first diluted 1:5 with 100% DMSO, then 1:2 with
water. All phospholipid compounds were stored in either amber glass vials or
siliconized Eppendorf tubes covered with aluminum foil (to minimized light exposure).
Anti-Vα24-FITC and anti-Vβ11-PE antibodies were purchased from Immunotech
(Fullerton, CA). CD1d-DimerX and most fluorochrome-conjugated antibodies were
purchased from BD Biosciences (San Jose, CA). Anti-CD8-PE-Texas-Red, anti-CD19-
For personal use only. by guest on May 30, 2013. bloodjournal.hematologylibrary.orgFrom

PE-Cy5.5, and anti-CD4-PacificBlue antibodies were purchased from Invitrogen
(Carlsbad, CA). The α-galactosyl-ceramide (α-GalCer) was kindly provided by Kirin
Breweries (Tokyo, Japan).
Isolation of bulk lipids from plasma:
Extraction of bulk lipids was performed based on the method of Bligh and Dyer 19.
Plasma (50 ml) was mixed 1:1 with PBS, stirred in a beaker while adding ammonium
sulfate (Fisher) slowly until saturation at room temperature, and transferred and stirred
continuously overnight at 4ºC for protein precipitation. The mixture was centrifuged at
1000g for 1 hour at 4ºC to pellet the solid precipitates, and liquid mixture was then
collected, frozen, and lyophilized using freeze-dry system (Labconco, Kansas City, MO).
The lyophilized powder was then extracted sequentially with three combinations of
organic solvents (chloroform:methanol:water at 2:1:0, 1:2:0, 10:10:1). The three extracts
were pooled and organic solvents removed using rotary evaporator. The extract was
then redissolved in 5 ml of water and stored frozen in aliquots at -20ºC until use.
Mass Spectrometry Analysis
Lipid samples from extracts and elutes were desalted, cleaned and concentrated using
micro-C18 ZipTip (Millipore). The lipids were eluted from ZipTip with 2 µl aqueous
acetonitrile solution containing 50% acetonitrile (v/v) and 0.1% formic acid, and loaded
into a GlassTip (New Objective). The analysis was performed using an Applied
Biosystems QSTAR QqTOF mass spectrometer operated in both positive and negative
For personal use only. by guest on May 30, 2013. bloodjournal.hematologylibrary.orgFrom

modes. Ions of interest were selected and subsequently dissociated by collision for
analysis of the ionic fragments.
Cross-linking CD1d-DimerX to beads and elution of lipids
The crosslinking of CD1d-DimerX to magnetic beads was done based on
manufacturer’s protocol. In brief, Dynabeads M-280 (sheep anti-mouse IgG from
Invitrogen) were washed twice in PBS, resuspended in PBS/BSA at 1 μg Dimer to
1~2x10⁷ beads ratio, and incubated overnight at 4ºC with constant rotation. Then,
Dimer-Beads were washed twice with 0.2 M triethanolamine, pH 8.2, and crosslinked
with freshly prepared 5.4 mg/ml dimethyl pimelimidate dihydrochloride (Sigma) at room
temperature with constant rotation for 30 min. The crosslinking was stopped by
resuspending in 1 ml of 50 mM Tris, pH 7.5 and incubated for 15 min with rotational
mixing, and washed thrice with 1 PBS/BSA before stored at the original volume of
beads. As a control, some Dynabeads were processed through the same procedure as
above but without CD1d-DimerX. For ligand loading, 200 μl of crosslinked beads were
washed thrice with PBS while bulk extract was diluted 60:40 with DMSO. At the end of
wash, beads were mixed with 125 μl of bulk lipid extract and incubated overnight at
37ºC. For elution, ligand-loaded beads were washed once with ice-cold PBS, then
mixed with 0.1 M citrate at pH 2.0, incubated for 10 min at 37ºC. CD1d conjugated
beads not loaded with lipid ligands were used as additional controls. The lipid elute was
then collected after magnetic separation and saved for analysis. The beads were
washed thrice in PBS and saved for next use.
For personal use only. by guest on May 30, 2013. bloodjournal.hematologylibrary.orgFrom

Loading of CD1d dimers and detection of CD1d-lipid reactive T cells
The loading and staining using CD1d DimerX was done based on manufacturer’s
protocol. For loading with α-GalCer (as positive control), 1 μl of DimerX (0.5 mg/ml)
was mixed with 1 μl of 10 molar excess α-GalCer (20 μg/ml). For loading with
lysophosphatidylcholine (LPC), 1 mg/ml LPC was first diluted to 80:20 with water (0.8
mg/ml), then mixed 1:1 with CD1d-DimerX for the final concentration of 50-400 μM. The
loading of all other phospholipids was done in equimolar ratio to LPC. The unloaded
dimer control was prepared by mixing CD1d-DimerX with the carrier only. The dimer-
mix was incubating overnight at 37ºC and stored at 4ºC before use. For some
experiments, mixtures of defined lipids at different ratios (e.g. LPC and PC) were
concurrently loaded onto CD1d. For some experiments, bulk lipids from myeloma or
healthy donor plasma were directly used to load CD1d dimers. For some experiments,
CD1d dimerX was preincubated with defined lipid ligands (1:1 ratio) for 4 hours at 37ºC
as described above. After 4 hours, 10 molar excess of α-GalCer or carrier control was
added and mixed before incubating overnight at 37ºC.
For staining human T cells with loaded CD1d dimer, T cells were first washed twice in
PBS then stained with dead cell exclusion dye (Live/Dead Aqua dead cell stain kit,
Invitrogen) for 15 min as recommended by the manufacturer. Cells were then washed
twice in wash buffer (PBS with 0.5% BSA), blocked with blocking buffer (wash buffer
with 0.1 mg/ml human IgG whole molecules (Jackson lab) at a concentration of about
1~3 million cells per 40 μl for 10 min at room temp. Dimer-staining mix was then
prepared by first diluting CD1d-Dimer-mix at 0.5 μg of CD1d-DimerX to 10 μl of blocking
For personal use only. by guest on May 30, 2013. bloodjournal.hematologylibrary.orgFrom

buffer, then added to blocked cells at 1:5 ratio. Cells were then stained for about 30
minutes to 1 hour at room temperature in the dark. After dimer staining, cells were
washed twice with wash buffer, blocked with 10% rat serum in PBS for 5 min at room
temp (1~3 million in 25 μl) and then stained with anti-mouse-IgG1-APC or PE (clone
X56 from BD) at 1:1 ratio for the final dilution of 1:500 of Ab for 15-30 minutes on ice.
Cells were then washed twice with wash buffer, and stained with additional markers.
Typically, the following antibodies were used for staining: anti-Vα24-FITC, anti-Vβ11-
PE, anti-CD3-PE, anti-CD3-Alexa700, anti-CD56-PECy7, anti-CD8-PE-TexasRed, anti-
CD4-PacBlue, anti-CD19-PECy5.5. For some experiments, cells were also stained with
anti-TCRαβ-PE and anti-TCRγδ-PE. For acquisition using BD-LSR II, the cells were
resuspended in wash buffer and data acquired directly. For acquisition using BD-
Calibur, staining with 7-AAD was utilized for excluding dying cells.
Expansion of Lyso-PC specific T cells
PBMC were separated into CD14+ and CD14- fractions using CD14 magnetic beads
(Miltenyi Biotec). CD14+ monocytes were used for dendritic cell culture and cultured in
either 1% plasma or in serum-free Aim-V media (Invitrogen) in the presence of GMCSF
and IL4 as previously described20. CD14- PBMC were similarly cultured in either RPMI
1640 (Cellgro) with 5% pooled human serum (Labquip, NY) or in Aim-V medium. For
some experiments, expansion of invariant NKT cells using α-GalCer loaded DCs was
performed as previously described21. For loading LysoPC, immature DCs on day 5 of
culture were cultured for 48 hours in the presence of 20 μg/ml of LPC (LPC-C18-1). For
the expansion of LPC specific T cells, DCs were cultured with responder CD14- cells
For personal use only. by guest on May 30, 2013. bloodjournal.hematologylibrary.orgFrom

(DC:responder ratio of 1:10 to 1:20) in media supplemented weekly with 50 U/ml of IL-2
(Chiron). For some experiments, the cocultures were setup in serum free conditions,
without or with supplementation with 20 μg/ml of LPC. After 1-2 weeks of coculture, the
presence of LPC specific T cells was monitored by flow cytometry, as described above.
Activation of human invariant NKT (iNKT) cells by immobilized CD1d-DimerX:
The loading of CD1d dimers with defined lipids or α-GalCer, was performed as specified
above. After overnight incubation, lipid loaded CD1d dimer, or unloaded CD1d dimer as
control, was diluted in PBS at a ratio of 1 μg of CD1d dimer to 100 μl of PBS, added to a
96-well U-bottom plate, centrifuged at 300g at room temperature and incubated at 37ºC
for about 4 to 6 hours. The Dimer-PBS mixture was removed just before adding purified
iNKT cells (0.5-1 x10⁶ cells / well). Culture supernatants were harvested after 40~48
hours of culture and analyzed for the presence of interferon-γ by ELISA following the
manufacturer’s protocol (Biosource International).
Detection of cytokine production by CD1d-LysoPC+ T cells
CD3+ CD1d-LPC+Va24- T cells (> 95% purity) were obtained from cultures of human T
cells described above, by flow sorting using BD FACSAria cell-sorting system. As a
control, CD3+ CD1d-LysoPC- Vα24- T cells were also sorted. For stimulation with PMA
and ionomycin, sorted cells (CD1d-LysoPC+ or CD1d-LysoPC-) were plated at
concentration of 5-10 x 104 cells in 100 μl of fresh culture media (RPMI with 5% pooled
human serum), and stimulated with PMA (500 ng/ml) and ionomycin (1 μM) in a 96-well
U bottom plate. For stimulation with immobilized anti-CD3, CD1d-LPC+ sorted cells
For personal use only. by guest on May 30, 2013. bloodjournal.hematologylibrary.orgFrom

were plated at 104 cells/ 100 μl of fresh culture media in anti-human-CD3 antibody-
coated or control plate (BD Biosciences) as suggested by the manufacturer. For some
experiments, T cells were depleted of CD1d-LPC+ cells or mock-depleted by sorting,
prior to plating at 1x10⁶ cells per 200 μl in anti-human-CD3 antibody-coated or control
plates. For some experiments, sorted 5 x 10⁴ LysoPC-CD1d dimer+ T cells were
cultured with CD1d expressing cell line (C1rd cells; kindly provided by Dr Mark Exley,
Boston), or mock transfected control cells at a T cell: APC ratio of 1:10, as described6,
with or without prior pulsing with 40 μg/ml of LPC-C181, with 5 ng/ml PMA and 5 U/ml
IL2 in Aim-V media . After 40-48 hours of co-culture, supernatants were harvested and
the presence of cytokines was measured by Luminex analysis with human cytokine
detection kits from Upstate-Millipore, as described 22. In some experiments, IL-17 was
detected by an ELISA kit following manufacturer’s protocol (eBioscience).
Statistics:
Comparison of data between groups was performed using Mann Whitney test.
Significance was analyzed with two sided p values <0.05.
For personal use only. by guest on May 30, 2013. bloodjournal.hematologylibrary.orgFrom

Results:
In order to identify the nature of CD1d binding lipids in the plasma of myeloma patients,
bulk lipids from these samples were obtained by chloroform/methanol (C/M)
extraction19. Analysis of bulk lipids by electrospray ionization mass spectrometry (ESI-
MS) revealed the presence of many species in the extracts from both patients tested
(Figure 1a). In order to identify the CD1d binding fraction, we first loaded the bulk lipids
onto CD1d dimer conjugated to magnetic beads and then eluted the bound fragments
as described under methods. Magnetic beads not conjugated with CD1d were used as
a control. Another control was CD1d conjugated beads not treated with lipids that did
not yield any contaminating lipids in the beads themselves (data not shown). Although
the mass spectra in bulk lipids from both patients differed and included several lipid
species as expected, the eluates from CD1d conjugated beads in both patients were
remarkably similar (Figure 1b). The most abundant ions were observed at m/z 496,
520, 522, 524 and 544. To further validate the enrichment of these ions, the samples
eluted from beads alone or CD1d-conjugated beads were spiked with C14-LysoPC (m/z
468) as an internal standard, and analyzed by ESI-MS. These data again confirmed the
relative enrichment of previously identified species in the elutes from CD1d-conjugated
beads (Figure 1c). The MS/MS spectrum of ions at m/z 496.33 is displayed in Figure
1d. It shows a major fragment at m/z 184. The m/z of this fragment corresponds to the
head group of phosphatidylcholine. Indeed, the other fragments observed at m/z 60, 86,
and 104 are also typical dissociation products of phosphatidylcholine23,24. The same
samples were also analyzed in ESI-negative mode. An ion at m/z 480.28 was observed
For personal use only. by guest on May 30, 2013. bloodjournal.hematologylibrary.orgFrom

that corresponds to the [M-15]- species observed at m/z 496.33 in positive mode. The
[M-15]- species was formed by the loss of the methyl group from phosphatidylcholine.
The MS/MS of 480.28 is displayed in Figure 1e. A major fragment was observed at m/z
255 that matches to one of the fatty acid anions in phosphatidylcholine according to the
general rules of fragmentation of phopholipid in negative mode. The molecular weight of
palmitic acid is 256, suggesting that one side chain of phosphatidylcholine at m/z 496.3
for [M+H]+ or 480.28 for [M-15]- is palmitic acid. Therefore, we conclude that the major
ion binding to CD1d molecule is hexadecanoly-sn-glycero-3-phosphocholine (Figure
1f). To determine the regioisomer of this lysophospholipid species, we examined the
MS/MS of the sodiated hexadecanoly-sn-glycero-3-phosphocholine at m/z 518.32 and
found that the intensity of a fragment at m/z 104 is more abundant than that at m/z 147
demonstrating that species we identified in this work is 1-hexadecanoly-2-hydroxy-sn-
glycero-3-phosphocholine (LPC)24. The analysis of other species identified in these
studies revealed that they were all LPC species with different acyl chains (16:0, 18:0,
18:1, 18:2, 20:4) (Table 1). To further confirm our results, authentic 1-hexadecanoly-2-
hydroxy-sn-glycero-3-phosphocholine was purchased and analyzed using tandem mass
spectrometry. Fragmentation patterns of authentic 1-hexadecanoly-2-hydroxy-sn-
glycero-3-phosphocholine were identical to what we observed in the present work (not
shown). Therefore the great majority of CD1d binding lipids isolated from the plasma of
myeloma patients were LPC species, which are structurally distinct from ceramides. The
isolation of LPC from myeloma plasma is consistent with prior studies showing that
levels of this lipid in myeloma is much higher than in healthy donors25. Consistent with
For personal use only. by guest on May 30, 2013. bloodjournal.hematologylibrary.orgFrom

this, when bulk lipids from myeloma patients were loaded onto CD1d dimer, the staining
for human T cells was better than that seen with lipids from healthy donors (Figure 1g).
Several species of LPC exist in vivo depending on the properties of the acyl chain26. We
focused on two of the species (C16:0 and C18:1) identified in our experiments. In order
to confirm the findings with elution experiments, we loaded equimolar quantities of LPC
(C16:0 and C18:1) and PC on CD1d dimer and compared their subsequent binding to
cultures of human T cells (Figure 2a). CD1d dimers loaded with LPC showed clear
staining for human T cells. Staining with C18:1 LPC was generally superior to that with
C16:0 (Figure 2a), and this species was used in subsequent experiments. The
efficiency of staining with LPC loaded CD1d dimers was dependent on the dose of LPC
used to load the dimer and evident at a dose of 50-100 μM (Figure 2b). As an irrelevant
MHC molecule, MHCI tetramer coincubated with LPC or PC did not stain these T cells.
In cultures of human T cells, the predominant population stained with LPC-CD1d was
TCRαβ+ and a subset of Vα24-Vβ11- CD3+ T cells, which consisted predominantly of
CD4+, but also CD8+ T cells (Figure 2c). In contrast to CD1d-LPC, CD1d dimer loaded
with α-GalCer clearly stained Vα24+ T cells in these cultures. Equimolar loading of
CD1d with the parent lipid, PC led to minimal staining. However the addition of
increasing concentration of PC to LPC led to dose dependent inhibition of staining of T
cells, which is consistent with the capacity of PC to bind CD1d 12,13 and/or interfere with
the capacity of LPC to load CD1d and stain type II NKT cells (Figure 2d). Together
these data show that LPC loaded onto CD1d can bind a distinct population of human T
cells.
For personal use only. by guest on May 30, 2013. bloodjournal.hematologylibrary.orgFrom

In order to further evaluate the ability of LPC to bind CD1d, we took advantage of the
ability of α-GalCer to load CD1d and of the loaded CD1d dimer to stain Vα24+Vβ11+ T
cells (also termed type I or iNKT cells) with high mean fluorescence intensity (MFI)
(Figure 2e). When LPC (400 μM) was coincubated with α-GalCer (20 μM) for loading
CD1d dimer, there was mild reduction in the intensity of staining, but iNKT cells could
still be stained (Figure 2e). However when CD1d dimers were preincubated with LPC
prior to loading of α-GalCer, it clearly reduced the intensity of staining for iNKT cells,
suggesting that under these conditions, LPC could competitively inhibit the loading of α-
GalCer on CD1d (Figure 2f). Culture of purified human iNKT cells with immobilized
CD1d-dimer-α-GalCer normally leads to a rapid release of cytokines like interferon-γ21.
However, when these CD1d molecules were preincubated with LPC prior to α-GalCer,
their ability to induce interferon-γ from purified iNKT cells was inhibited, which further
supported the observed capacity of preloading with LPC to inhibit α−GalCer dependent
activation of iNKT cells (Figure 2g). Notably, immobilized CD1d dimer loaded with LPC
alone elicited little IFNγ from Vα24+Vβ11+ T cells, which is consistent with Vα24-Vβ11- T
cells being the predominant population stained with these reagents. Interestingly,
preloading with PC under these conditions did not alter GalCer mediated iNKT staining
and activation. This is somewhat surprising in view of the interference of LysoPC
dependent staining of a different type of NKT cells (type II NKT cells) by concurrent
addition of PC (Figure 2d). However it is consistent with the possibility that the
recognition of CD1d by type I versus type II NKT cells may differ, and/ or that the
For personal use only. by guest on May 30, 2013. bloodjournal.hematologylibrary.orgFrom

structural aspects of LPC loading into CD1d (which has not yet been examined) may
differ from that of PC27.
Next we examined whether human LPC specific T cells could be expanded in culture.
Culture of human T cells in 5% pooled human serum with both unpulsed DCs, as well
as those pulsed with LPC led to expansion of LPC specific T cells in culture (Figure 3a,
3b). Although this was initially surprising, we realized that several studies have shown
the presence of LPC in normal human serum 25,28,29. The presence of LPC in lipids from
5% PHS was confirmed by MALDI analysis (data not shown), which is consistent with
prior studies 25,28,29. Therefore we repeated these co-cultures in serum free media. In
this setting, the expansion of LPC specific T cells in the presence of unpulsed DCs was
abrogated and specific expansion of LPC specific T cells could be demonstrated only in
the presence of the specific ligand (Figure 3c, 3d). These data demonstrate the
feasibility of ligand dependent expansion of human LPC specific T cells in culture.
In order to characterize the functional properties of these cells, we sorted CD1d-LPC+
CD3+ T cells and compared their cytokine profile in response to stimulation by
PMA/ionomycin, relative to CD1d-LPC- CD3+ T cells (Figure 4a). Vα24- CD1d-LPC+ T
cells secreted higher levels of several cytokines including IL13, IL5, IL8 and IFNγ in
response to PMA/ionomycin, relative to CD1d-LPC- control CD3+ T cells (Figure 4a).
Next, we compared the capacity of these sorted T cells to secrete IL13 and IFNγ in
response to plate bound anti-CD3. Vα24- CD1d-LPC+ T cells secreted more IL13
relative to CD1d-LPC- control T cells under these conditions (Figure 4b). Interestingly,
For personal use only. by guest on May 30, 2013. bloodjournal.hematologylibrary.orgFrom

depletion of this subpopulation from these cultures led to significant decline in the anti-
CD3 mediated secretion of IL13, compared to mock sorted or undepleted cells,
suggesting that this subpopulation of T cells may be a major producer of IL13 in these
cultures (Figure 4c). LPC specific T cells also secreted IL13 in response to LPC loaded
CD1d expressing antigen presenting cells (APCs), suggesting that they can respond to
ligand specific stimulation by secretion of this cytokine (Figure 4d).
Prior studies have documented that sera from myeloma patients contain much higher
levels of LPC, as well as higher palmitic / linoleic acid ratio, relative to healthy controls25.
This may help explain the facile loading of bulk lipids from myeloma patients but not
healthy donors, on CD1d dimer that we observed. Therefore we tested whether the
frequency of LPC specific T cells was altered in human myeloma. CD1d multimers
loaded with LPC (versus PC or unloaded CD1d dimer as a control) were used to stain
fresh human PBMCs from healthy donors or myeloma patients (Figure 5a, 5b). The
frequency of CD1d-LPC+ T cells was increased in myeloma patients relative to healthy
controls. These cells lack the expression of invariant T cell receptor. Therefore MM
patients have an increase in a distinct population of CD1d restricted T cells relative to
healthy controls.
For personal use only. by guest on May 30, 2013. bloodjournal.hematologylibrary.orgFrom

Discussion:
In this study we have identified a novel subset of human CD1d restricted T cells that
recognize lysophosphatidylcholine (LPC). LPC is generated by the action of
phospholipase A2 on phosphatidylcholine (PC). It is a major constituent of oxidized low
density lipoprotein (LDL) in atherosclerotic plaques, and elevated levels of
lysophospholipids have been observed in allergic and autoimmune inflammation,
asthma and human cancer, including in multiple myeloma 25,26,30,31. Therefore the
findings made in this study may apply to the putative role for CD1d restricted T cells in
diverse inflammatory states.
Staining of human T cells with LPC loaded CD1d dimers was inhibited in the presence
of PC. However, in contrast to LPC, CD1d dimers loaded with PC did not stain human T
cells. Although binding of some T cell lines to murine CD1d molecules with PC or PI
species has been observed, these ligands have not been shown to be recognized by
bulk populations of human or murine T cells 10-13,32-34. These lipids may however play
important chaperone like roles in intracellular assembly of CD1 molecules 13. Our data
are consistent with a model wherein the recognition of CD1d by these T cells may
depend on the balance between PC and LPC, suggested to be a sensitive indicator of
inflammation35. These studies therefore support the hypothesis that some CD1d
restricted cells may serve as a cellular sensor system for the detection of inflammation
in tissues. In this regard, it is notable that several species of LPC exist in vivo 26, and the
For personal use only. by guest on May 30, 2013. bloodjournal.hematologylibrary.orgFrom

differences in acyl chains may lead to different functional consequences36. Inflammation
is a common feature of many human cancers and can lead to high levels of several
species of LPC or related ligands in the malignant tissue 26. Therefore the generation of
LPC may be a mechanism by which inflammation might paralyze innate immunity
against cancer18.
Majority of cells that bind LPC loaded CD1d dimers in humans were Vα24-Vβ11- T cells
3. Such CD1d restricted T cells have been termed as Type II NKT cells. It is of interest
that the cytokine profile of these cells after TCR based stimulation is somewhat skewed
towards IL13. Indeed, IL13 was the only cytokine detected after ligand specific
stimulation in culture. Type II NKT cells have been implicated in suppressing tumor
immune surveillance in mice in an IL13 dependent manner in settings where the release
of such ligands (e.g. release of platelet activating factor, a structurally similar lipid, after
UV induced injury) might occur in vivo 14,37. IL13 producing type II NKT cells have also
been observed in the involved tissues in patients with ulcerative colitis38. The
preferential production of IL13 by LPC specific T cells is also of interest, because these
cytokines have been implicated in promoting tumor growth, fibrosis and angiogenesis in
malignant tissues and inflammation39,40. Specific targeting of these cells may therefore
provide novel approaches to regulate inflammation and innate immunity in the clinic.
LPC is also known to be a major target of naturally occurring antibodies that recognize
oxidized LDL and molecular motifs on dying cells41. Interestingly, recent studies have
begun to implicate such autoreactive B cells as preferred targets of transformation in
For personal use only. by guest on May 30, 2013. bloodjournal.hematologylibrary.orgFrom

human B cell tumors42. Therefore the detection of increased levels of LPC specific T
cells in myeloma patients may be of additional and more direct relevance to the
pathogenesis of myeloma. Further studies are needed to evaluate the potential role of
lipid antigens in driving the origin of B cell tumors, and to evaluate lipid reactive T cells
in related B cell tumors, particularly chronic lymphocytic leukemia.
For personal use only. by guest on May 30, 2013. bloodjournal.hematologylibrary.orgFrom

Acknowledgments:
This work is supported in part by funds from the National Institutes of Health
(CA106802, CA109465, Rockefeller CTSA), Damon Runyon Cancer Research Fund,
and Dana Foundation. DHC is a Human Immunology Fellow of the Dana Foundation /
CRI-Irvington Institute. We thank Ralph M. Steinman for his mentorship, Philip
Livingston and Kavita M. Dhodapkar for discussions about this paper, Judy Adams for
help with figures; Arlene Hurley, RN, for help with clinical aspects; John Gathuru for
technical assistance; and members of Dhodapkar lab for many helpful discussions. The
authors report no financial conflicts of interest.
For personal use only. by guest on May 30, 2013. bloodjournal.hematologylibrary.orgFrom

Author Contributions:
DHC performed research, analyzed data, helped write and prepare manuscript.
HD, PM, JK, GR, RS performed some aspects of research.
AM, DV, SJ performed clinical research.
MVD designed research, analyzed data, wrote paper.
For personal use only. by guest on May 30, 2013. bloodjournal.hematologylibrary.orgFrom

References:
1. Godfrey DI, Kronenberg M. Going both ways: Immune regulation via CD1d-dependent NKT cells. J Clin Invest. 2004;114:1379-1388. 2. Van Kaer L. NKT cells: T lymphocytes with innate effector functions. Curr Opin Immunol. 2007;19:354-364. 3. Godfrey DI, MacDonald HR, Kronenberg M, Smyth MJ, Van Kaer L. NKT cells: what's in a name? Nat Rev Immunol. 2004;4:231-237. 4. Taniguchi M, Harada M, Kojo S, Nakayama T, Wakao H. The regulatory role of Valpha14 NKT cells in innate and acquired immune response. Annu Rev Immunol. 2003;21:483-513. 5. Exley MA, Tahir SM, Cheng O, et al. A major fraction of human bone marrow lymphocytes are Th2-like CD1d-reactive T cells that can suppress mixed lymphocyte responses. J Immunol. 2001;167:5531-5534. 6. Kenna T, O'Brien M, Hogan AE, et al. CD1 expression and CD1-restricted T cell activity in normal and tumour-bearing human liver. Cancer Immunol Immunother. 2007;56:563-572. 7. Brutkiewicz RR. CD1d ligands: the good, the bad, and the ugly. J Immunol. 2006;177:769-775. 8. Jahng A, Maricic I, Aguilera C, Cardell S, Halder RC, Kumar V. Prevention of autoimmunity by targeting a distinct, noninvariant CD1d-reactive T cell population reactive to sulfatide. J Exp Med. 2004;199:947-957. 9. Van Rhijn I, Young DC, Im JS, et al. CD1d-restricted T cell activation by nonlipidic small molecules. Proc Natl Acad Sci U S A. 2004;101:13578-13583. 10. Joyce S, Woods AS, Yewdell JW, et al. Natural ligand of mouse CD1d1: cellular glycosylphosphatidylinositol. Science. 1998;279:1541-1544. 11. Gumperz JE, Roy C, Makowska A, et al. Murine CD1d-restricted T cell recognition of cellular lipids. Immunity. 2000;12:211-221. 12. Giabbai B, Sidobre S, Crispin MD, et al. Crystal structure of mouse CD1d bound to the self ligand phosphatidylcholine: a molecular basis for NKT cell activation. J Immunol. 2005;175:977-984. 13. De Silva AD, Park JJ, Matsuki N, et al. Lipid protein interactions: the assembly of CD1d1 with cellular phospholipids occurs in the endoplasmic reticulum. J Immunol. 2002;168:723-733. 14. Terabe M, Swann J, Ambrosino E, et al. A nonclassical non-Valpha14Jalpha18 CD1d-restricted (type II) NKT cell is sufficient for down-regulation of tumor immunosurveillance. J Exp Med. 2005;202:1627-1633. 15. Wu DY, Segal NH, Sidobre S, Kronenberg M, Chapman PB. Cross-presentation of disialoganglioside GD3 to natural killer T cells. J Exp Med. 2003;198:173-181. 16. Sriram V, Cho S, Li P, et al. Inhibition of glycolipid shedding rescues recognition of a CD1+ T cell lymphoma by natural killer T (NKT) cells. Proc Natl Acad Sci U S A. 2002;99:8197-8202.
For personal use only. by guest on May 30, 2013. bloodjournal.hematologylibrary.orgFrom

17. Dhodapkar MV. Harnessing host immune responses to preneoplasia: promise and challenges. Cancer Immunol Immunother. 2005;54:409-413. 18. Dhodapkar MV, Geller MD, Chang D, et al. A reversible defect in natural killer T cell function characterizes the progression of premalignant to malignant multiple myeloma. J Exp Med. 2003;197:1667-1676. 19. Bligh EG, Dyer WJ. A rapid method of total lipid extraction and purification. Can J Biochem Physiol. 1959;37:911-917. 20. Dhodapkar KM, Banerjee D, Connolly J, et al. Selective blockade of the inhibitory Fc{gamma} receptor (Fc{gamma}RIIB) in human dendritic cells and monocytes induces a type I interferon response program. J Exp Med. 2007;204:1359-1369. 21. Chang DH, Liu N, Klimek V, et al. Enhancement of ligand dependent activation of human Natural Killer T cells by Lenalidomide: Therapeutic Implications. Blood. 2006;108:618-621. 22. Spisek R, Kukreja A, Chen LC, et al. Frequent and specific immunity to the embryonal stem cell-associated antigen SOX2 in patients with monoclonal gammopathy. J Exp Med. 2007;204:831-840. 23. Han X, Gross RW. Electrospray ionization mass spectroscopic analysis of human erythrocyte plasma membrane phospholipids. Proc Natl Acad Sci U S A. 1994;91:10635-10639. 24. Murphy RC, Fiedler J, Hevko J. Analysis of nonvolatile lipids by mass spectrometry. Chem Rev. 2001;101:479-526. 25. Sasagawa T, Okita M, Murakami J, Kato T, Watanabe A. Abnormal serum lysophospholipids in multiple myeloma patients. Lipids. 1999;34:17-21. 26. Mills GB, Moolenaar WH. The emerging role of lysophosphatidic acid in cancer. Nat Rev Cancer. 2003;3:582-591. 27. Godfrey DI, Rossjohn J, McCluskey J. The fidelity, occasional promiscuity, and versatility of T cell receptor recognition. Immunity. 2008;28:304-314. 28. Takatera A, Takeuchi A, Saiki K, Morisawa T, Yokoyama N, Matsuo M. Quantification of lysophosphatidylcholines and phosphatidylcholines using liquid chromatography-tandem mass spectrometry in neonatal serum. J Chromatogr B Analyt Technol Biomed Life Sci. 2006;838:31-36. 29. Raffelt K, Moka D, Sullentrop F, Dietlein M, Hahn J, Schicha H. Systemic alterations in phospholipid concentrations of blood plasma in patients with thyroid carcinoma: an in-vitro (31)P high-resolution NMR study. NMR Biomed. 2000;13:8-13. 30. Okita M, Gaudette DC, Mills GB, Holub BJ. Elevated levels and altered fatty acid composition of plasma lysophosphatidylcholine(lysoPC) in ovarian cancer patients. Int J Cancer. 1997;71:31-34. 31. Mehta D, Gupta S, Gaur SN, Gangal SV, Agrawal KP. Increased leukocyte phospholipase A2 activity and plasma lysophosphatidylcholine levels in asthma and rhinitis and their relationship to airway sensitivity to histamine. Am Rev Respir Dis. 1990;142:157-161. 32. Rauch J, Gumperz J, Robinson C, et al. Structural features of the acyl chain determine self-phospholipid antigen recognition by a CD1d-restricted invariant NKT (iNKT) cell. J Biol Chem. 2003;278:47508-47515. 33. Fischer K, Scotet E, Niemeyer M, et al. Mycobacterial phosphatidylinositol mannoside is a natural antigen for CD1d-restricted T cells. Proc Natl Acad Sci U S A. 2004;101:10685-10690. 34. Agea E, Russano A, Bistoni O, et al. Human CD1-restricted T cell recognition of lipids from pollens. J Exp Med. 2005;202:295-308.
For personal use only. by guest on May 30, 2013. bloodjournal.hematologylibrary.orgFrom

35. Fuchs B, Schiller J, Wagner U, Hantzschel H, Arnold K. The phosphatidylcholine/lysophosphatidylcholine ratio in human plasma is an indicator of the severity of rheumatoid arthritis: investigations by 31P NMR and MALDI-TOF MS. Clin Biochem. 2005;38:925-933. 36. McCarthy C, Shepherd D, Fleire S, et al. The length of lipids bound to human CD1d molecules modulates the affinity of NKT cell TCR and the threshold of NKT cell activation. J Exp Med. 2007;204:1131-1144. 37. Moodycliffe AM, Nghiem D, Clydesdale G, Ullrich SE. Immune suppression and skin cancer development: regulation by NKT cells. Nat Immunol. 2000;1:521-525. 38. Fuss IJ, Heller F, Boirivant M, et al. Nonclassical CD1d-restricted NK T cells that produce IL-13 characterize an atypical Th2 response in ulcerative colitis. J Clin Invest. 2004;113:1490-1497. 39. Wynn TA. IL-13 effector functions. Annu Rev Immunol. 2003;21:425-456. 40. Aspord C, Pedroza-Gonzalez A, Gallegos M, et al. Breast cancer instructs dendritic cells to prime interleukin 13-secreting CD4+ T cells that facilitate tumor development. J Exp Med. 2007;204:1037-1047. 41. Binder CJ, Silverman GJ. Natural antibodies and the autoimmunity of atherosclerosis. Springer Semin Immunopathol. 2005;26:385-404. 42. Lanemo Myhrinder A, Hellqvist E, Sidorova E, et al. A new perspective: molecular motifs on oxidized LDL, apoptotic cells, and bacteria are targets for chronic lymphocytic leukemia antibodies. Blood. 2008;111:3838-3848.
For personal use only. by guest on May 30, 2013. bloodjournal.hematologylibrary.orgFrom

Figure Legends:
Figure 1. Isolation and identification of CD1d binding lipids from myeloma patient plasma 1a and 1b– ESI-Mass spectra of lipid species from bulk extracts (1a) and CD1d-conjugated bead eluents (1b) from plasma of two myeloma patients (MM1 and MM2). 1c – ESI-Mass spectra of eluents from beads only control and CD1d-beads, spiked with a LPC species (LPC-C14, m/z 368, arrow) as an internal reference. Data shown are representative of findings on 4 separate patients. 1d and 1e – Tandem mass spectra (MS/MS) of major species observed for eluents of myeloma patient studied in figure 1c. Figure 1f is MS/MS of 496.3 of [M+H]+ and figure 1g is MS/MS of 480.3 of [M-15]-. 1f– Structure of 1-hexadecanoly-2-hydroxy-sn-glycero-3-phosphocholine, or Lysophosphatidylcholine (LPC) – C16:0. 1g. Bulk lipids isolated from myeloma patients or healthy donors were used to load CD1d dimers and stain cultures of human T cells as described under methods. Numbers represent percent cells in the quadrant. Figure 2. Binding of CD1d-dimer molecules loaded with lysophosphatidylcholine (LysoPC) to a subpopulation of CD3+ T cells. 2a – CD1d-dimers loaded with two species of LPC (LPC-C16 and LPC-C18:1) stained a unique population of CD3+ T cells: FACS dot plots of CD1d-dimers loaded with vehicle control (-), 400 μM of two species of LPC-(C16 and C18:1) or PC, or 20 μM of α-GalCer, and used to stain cultured human PBMC. Numbers in the quadrant correspond to percent cells out of total CD3+ cells and data shown are gated for live cells. The staining is representative of 4 individual donors. 2b. CD1d dimers were loaded with different concentrations of C18:1 LPC, prior to staining of human T cell cultures as described above. As controls, T cells were also stained with MHC-I tetramer cultured with 400 μM of LPC or PC. Numbers in the quadrant correspond to percent cells out of total CD3+ cells and data shown are gated for live cells. 2c – Phenotype of CD1d-LPC-C18:1+ cells: FACS dot plots of staining of CD1d-LPC-C181 (as in fig 2a) but plotted against different markers – TCRαβ, Vα24, and Vβ11 as indicated. Data for the staining of Vα24+ cells in these cultures with CD1d-αGalCer is
For personal use only. by guest on May 30, 2013. bloodjournal.hematologylibrary.orgFrom

shown as a control. Bottom panel shows FACS dot plot gated for CD1d-LPC-C18:1+ T cell population for the proportion of CD4+/CD8+/double-negative subpopulations. 2d. CD1d dimers were loaded with either 400 μM of LysoPC or PC alone, or with a mixture of LysoPC and PC as indicated, prior to use for staining T cells as in Fig 2a. 2e. Histogram plots of staining of iNKT cells by CD1d dimers loaded with α-GalCer (20 μM), LPC, PC or the combination of α-GalCer with PC or LPC. Numbers represent mean fluorescent intensity of staining. 2f Competition between LPC and α-GalCer for binding to iNKT cells: Histogram overlay plots comparing mean fluorescence shifts between CD1d-dimer loaded with vehicle control (light gray solid), positive control (α-GalCer, dark gray solid), and LPC- C18:1, or PC (open curves). Competition was setup by first loading CD1d dimer with vehicle control, LPC-C18:1, or PC, for 4 hours, then loading with vehicle control or α-GalCer. Ligand loaded CD1d-dimers were then used to stain iNKT cells. Data are representative of 4 similar experiments. 2g – Differential iNKT stimulation by ligand-loaded and immobilized CD1d-dimer: Polyclonal populations of Vα24+ T cells were isolated using magnetic beads from cultures expanded in vitro using α-GalCer. Purified Vα24+ T cells were cultured for 40 to 48 hours in plates with immobilized CD1d dimer, loaded with vehicle control or α-GalCer with or without preincubation with control, PC or LPC as competing ligands as described under methods. PHA was used as positive control. The level of IFN-γ in the supernatant was monitored using by ELISA. * p<0.05. Data are representative of 3 similar experiments. Figure 3 Expansion of human CD1d-LPC+ T cells in culture 3a – Expansion of CD1d-LPC+ cells in serum-containing media: Representative FACS plot showing the presence of LPC specific T cells in freshly isolated PBMCs or after co-culture with DC pulsed with or without LPC in culture media with 5% pooled human serum. Numbers in the quadrant correspond to percent cells out of total CD3+ cells, and data shown are gated for live cells. 3b – Summary of experiments (n=8) with unpulsed-DC or LPC-pulsed DC in serum-containing culture media. Each dot corresponds to percent of CD1d-LPC+ cells per total CD3+ cells, and each line corresponds to data before and after two-week expansion. 3c – Expansion of CD1d-LPC+ cells in serum-free media: Representative FACS plot showing the presence of LPC specific T cells in freshly isolated PBMCs or after coculture with DC pulsed with or without LPC in serum free media. Numbers in the quadrant correspond to percent cells out of total CD3+ cells and data shown are gated for live cells.
For personal use only. by guest on May 30, 2013. bloodjournal.hematologylibrary.orgFrom

3d – Summary of experiments (n=4) with unpulsed DC or LPC pulsed DCs in serum-free media. Each dot corresponds to percent of CD1d-LPC+ cells per total CD3+ cells, and each line corresponds to data before and after one-week expansion. Figure 4. Cytokine secretion by CD1d-LPC+ T cells. 4a – T cell subsets were flow-sorted as indicated for CD1d-LPC+ and CD1d-LPC- cell population and stimulated with PMA and ionomycin. The supernatant was harvested and analyzed for the presence of IL13, IL5, IL8, IL17, IFN-γ, and IL4 by Luminex, IL17 by ELISA. The data shown are for each donor (n=8) for each cytokine. Significant p values: IL13-0.001; IL5-0.003; IL8-0.02; IFNγ-0.049. 4b– Differential expression of IL13 and IFN-γ by CD1d-LysoPC+ T cells following anti-CD3 stimulation: CD3+CD1d-LysoPC+ and CD3+CD1d-LPC- were flow sorted as indicated in fig 3e and stimulated by plate immobilized anti-CD3 antibodies or control. Secretion of IL-13 and IFN-γ were monitored by Luminex after 40-48 hours of culture. Data shown are average (+/- SD) of 4 experiments. * p<0.05 4c – Decline in anti-CD3 stimulated IL13 secretion in human PBMCs following the depletion of CD1d-LysoPC+ cells: Cultured human PBMC were either mock-depleted or depleted of CD1d-LysoPC+ cells by flow sorting. The cells were then stimulated with anti-CD3 , and the production of IL13 monitored by Luminex. Data shown are average (+/- SD) of 3 experiments. * p<0.05 4d – Secretion of IL13 in response to LysoPC stimulation. Cultured PBMC were flow sorted as indicated in Fig 3e. CD1d-LysoPC+ and CD1d-LysoPC- T cells were then stimulated with LysoPC pulsed CD1d-expressing cell line (or unpulsed cells, as well as CD1d negative control cells as a control) in serum-free media for 40-48 hours. Secretion of IL13 was monitored by Luminex. Data shown are average (+/- SD) of 3 similar experiments. * p<0.05 Figure 5 Detection of CD1d-LPC+ T cells in multiple myeloma patients. 5a – Representative FACS dot plots of a healthy donor and a myeloma patient stained with CD1d-dimer loaded with vehicle control or LPC. The number in the quadrant corresponds with the percent of cells out of total CD3+ cells. Data shown are gated for live cells. 5b – Summary of percent of CD1d-LPC+ cells out of total CD3+ for healthy donors (n=22) and multiple myeloma patients (n=11). Each dot corresponds to one donor. Horizontal bars represent means. * p<0.05
For personal use only. by guest on May 30, 2013. bloodjournal.hematologylibrary.orgFrom

Table 1 Various species of Lyso-phosphatidylcholine identified by MS/MS
Ion m/z Composition [M+H]+ 496.32 2-16:0-lyso
[M+Na]+ 518.32 2-16:0-lyso [M+H]+ 520.32 2-18:2-lyso [M+H]+ 522.34 2-18:1-lyso [M+H]+ 524.34 2-18:0-lyso
[M+Na]+ 542.31 2-18:2-lyso [M+H]+ 544.31 2-20:4-lyso
[M+Na]+ 566.33 2-20:4-lyso
For personal use only. by guest on May 30, 2013. bloodjournal.hematologylibrary.orgFrom

Relative Intensity
m/z, amu
Relative Intensity
520
664
620
496
708
544
752
797
MM1
450 550 650 750 850
496
520
54 4
522
MM1
Relative Intensity
Relative Intensity
m/z, amu
450 550 650 750 850
758
520
652
627
544
659
496
576
674
464
512
684
730
838
889
MM2
450 550 650 750 850
496
520
544
522
MM2
1a
1b
For personal use only. by guest on May 30, 2013. bloodjournal.hematologylibrary.orgFrom

m/z, amu100 200 300 400 500 600
255.21
480.28
191.00
224.05
Relative Intensity
100 200 300 400 500 600
184
104
496
478
86 313
258
60 166
m/z, amu
Relative Intensity
Beads only CD1d-Dimer-Beads
m/z, amu
2.0e4
1.0e5
2.0e5
460 500 540 580
520
496
468
544 4.0e4
1.0e5
2.0e5
460 500 540 580
520
544
496
568522
566
468
m/z, amu
Relative Intensity
1c
1d
1e
LysoPC-C16 OP
O
O-
ON+
O
OOH
1f
For personal use only. by guest on May 30, 2013. bloodjournal.hematologylibrary.orgFrom
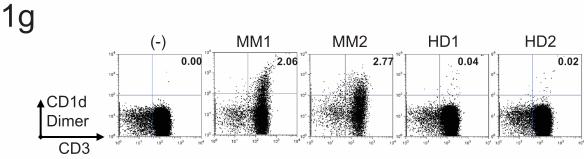
(-) HD1MM1 HD2MM20.00 0.04 0.022.772.06
CD3
CD1dDimer
1g
For personal use only. by guest on May 30, 2013. bloodjournal.hematologylibrary.orgFrom

(-) LPC-C16 LPC-C18:1 PC0.01 0.21 0.51 0.01 0.10
0.03 0.46 0.53 0.00
αGC
CD1d-Dimer +
LPC
CD3
CD1dDimer
0.53 0.00
Vα24 Vβ11
62
29
8
CD4
CD8
TCRαβ
0.51
2a
2c
2b
CD3
CD1dDimer
(-) 50μM 100μM 200μM 400μMLPC
0.01 0.10 0.23 0.19 0.36
CD3
MHC ITetramer
0.01 0.01 0.01
CD1d-Dimer + αGalCer
Vα24
CD1d-Dimer +
LPC
CD3
(-) LPC PC
For personal use only. by guest on May 30, 2013. bloodjournal.hematologylibrary.orgFrom

PC/ αGCLPC/ αGC
2e
CD1d-Dimer
count
2d
CD3
CD1dDimer
LPC +
0.150.19 0.12 0.040.08
50μM PC25μM PC 100μM PC 200μM PC 400μM PC
CD3
CD1dDimer
(-) LPC
0.170.01
PC
0.01
(-) GC LPC LPC+GC PC PC+GC
CD1d-Dimer
count
11.4 806 45.4 420 11.1 911
2f
For personal use only. by guest on May 30, 2013. bloodjournal.hematologylibrary.orgFrom

2g
0
2
4
6
8
1st Ligand: - PC LPC - PC LPC2nd Ligand: - - - αGC αGC αGC PHA
Interferon-γSecretionBy iNKT (ng/ml)
*
For personal use only. by guest on May 30, 2013. bloodjournal.hematologylibrary.orgFrom

CD3
CD1d(-)
CD3
CD1d-LPC
Fresh2-week culture
DC(-) DC(LPC)0.01 0.01 0.00
0.06 0.95 1.21
0.0
0.3
0.6
0.9
1.2
1.5
1.8
d 0 d 7 d 14 d 0 d 7 d 14 d 0 d 7 d 14 d 0 d 7 d 14
DC (-) DC LPC DC (-) DC LPC
CD1d-LPC iNKT
% of
CD3+
cells
3a
3b
For personal use only. by guest on May 30, 2013. bloodjournal.hematologylibrary.orgFrom

3c
3d
0
0.2
0.4
0.6% of
CD3+
cells
Day 0 7 0 7
AimVDC(-) DC(LPC)
0.01
0.39
0.02
0.03CD3
CD1d(-)
CD3
CD1d-LPC
Fresh
0.00
0.03
1week-culture in AimVDC(-) DC(LPC)
For personal use only. by guest on May 30, 2013. bloodjournal.hematologylibrary.orgFrom

4a
0
500
1000
1500
2000
2500
3000
CD1d-LPC - + - + - + - +Cytokines: IL8 IL5 IL17 IL4
0
2000
4000
6000
8000
10000
12000
CD1d-LPC - + - +Cytokines: IL13 IFN γ
cytokine
Secretion
(pg/ml)
cytokine
Secretion
(pg/ml)
For personal use only. by guest on May 30, 2013. bloodjournal.hematologylibrary.orgFrom

4c
0
500
1000
1500
2000
CD1d-LPC + - + - + - + -anti-CD3 + + - - + + - -
IL13 IFN γ
4bcytokineSecretion(pg/ml)
*
0
2000
4000
6000
Mock-depleted
CD1d-LPC+depleted
α-CD3 Control
IL13Secretion(pg/ml)
*
For personal use only. by guest on May 30, 2013. bloodjournal.hematologylibrary.orgFrom

4d
0
500
1000
1500
2000
2500
Antigen (-) LPC (-) LPC (-) LPC (-) LPC
Responder T cells: CD1d-LPC+ CD1d-LPC- CD1d-LPC+ CD1d-LPC-
IL13Secretion(pg/ml)
*
CD1d+ APC CD1d- Control APCAPC
For personal use only. by guest on May 30, 2013. bloodjournal.hematologylibrary.orgFrom

CD3
CD1dDimer
HD(-) LPC
MM(-) LPC
0.01 0.07 0.03 0.65
0.0
0.2
0.4
0.6
0.8
CD1d-αGC+
Healthy Donors(n=22)
CD1d-LPC+ CD1d-αGC+
MM patients (n=11)
CD1d-LPC+
p < 0.001
% of
CD3+
5b
5a
For personal use only. by guest on May 30, 2013. bloodjournal.hematologylibrary.orgFrom