FOR RESTRICTED CIRCULATION S S (DEAP) : 1/99
93
RBI LIBRARY FOR RESTRICTED CIRCULATION S S (DEAP) : 1/99 JUNE 1999
-
Upload
khangminh22 -
Category
Documents
-
view
0 -
download
0
Transcript of FOR RESTRICTED CIRCULATION S S (DEAP) : 1/99

RBI L
IBRA
RY
FOR RESTRICTED CIRCULATION S S (DEAP) : 1/99
JUNE 1999

Previous RBI Staff S tudiesStaff Study No. Subject Author Month / Year
S S (DEAP):1/91 Money Market Mutual Funds (MMMFs) in the USA
S. J. Salvi May 1991
S S (DEAP):2/91 India's Balance of Payments during the Four Decades of Planning
K. R. Holla August 1991
S S (DEAP):l/92 Incidence of Interest Cost on Private Corporate Sector
J. M. Lopez April 1992
S S (DEAP):2/92 Import Intensity in the Indian Economy Vidya Pitre May 1992
S S (DEAP):3/92 Measurement of Inflation Rate : Wholesale Price Index - Revised and Old Series
D. Singh June 1992
S S (DEAP):4/92 Small Scale Industry in India - Its Employment Potential and Productivity
Rajan Goyal June 1992
S S (DEAP):5/92 Credit-Deposit Ratio : Current Status and Future Correction
Rashmi Mehrotra June 1992
S S (DEAP):6/92 Employment, Output and Productivity Trends in India's Small-Scale Industry
Deepak Gupta August 1992
S S (DEAP):7/92 The Role of IMF in External Debt Management in the 'Eighties
A. Prasad August 1992
S S (DEAP):8/92 Surveillance and IMF R. Kannan August 1992
S S (DEAP):9/92 Issue of Instability in Money Demand Analysis : A Perspective
B. K. Bhoi October 1992
S S (DEAP):10/92 Dryland Farming in India - New Thrusts and Prospects
N.K. Inamdar and A.V. Bhuleshkar
October 1992
S S (DEAP):ll/92 Countertrade : A Potential Threat to Multilateralism
B. K. Bhoi November 1992
S S (DEAP):12/92 Industrial Sickness - Issues and Options Deepak Gupta November 1992
S S (DEAP):13/92 Money, Output and Prices : Causality Issues and Evidence
Narendra Jadhav, Himanshu Joshi and Partha Ray
November 1992
S S (DEAP):14/92 Financial Reform and Economic Adjustment in Japan
J. R. Majhee December 1992
S S (DEAP):15/92 Industrialisation in Assam G. T. Vellu December 1992
S S (DEAP):16/92 Industrial Growth and Employment : An Analysis of Labour Absorption in Manufacturing Sector in India
D. Ajit December 1992
S S (DEAP):17/92 Farm Input Subsidies and State Finance (A Case Study of Maharashtra and Uttar Pradesh)
Rashmi Mehrotra December 1992
S S (DEAP):l/93 Developments in the Primary Capital Market During the Eighties and Early Nineties
B. M. Misra March 1993
S S (DEAP):2/93 Quarterly Estimates of GDP : 1970-71 to 1990-91
R. K. Das April 1993
S S (DEAP):3/93 A Short-Term Forecasting Model for India's GDP
S. L. Shetty and Tarlok Singh
June 1993
S S (DEAP):4/93 The Financial Rehabilitation of Public Sector Commercial Banks : Some Conceptual and Policy Aspects
Suman K. Bery September 1993

BUDGET DEFICIT IN INDIA: A PRIMER ON MEASUREMENT
R. K. P ATTN AIK, S. M. PILLAI and SANGEETA DAS’\njJ
The p aper has been designed to fo rm u la te a fe w purpose specific m easures of budget d e fic it inIndia fo r analysing the emerging fisca l developm ents. Due to non a v a ila b ili ty o f da ta in respect o f C) »
Local Governments, the analysis is restricted only to Central and S ta te Governments. The s tu d y has«-----------'
w orked ou t tim e series data for fisca l years 1951 through 1999 for the existing deficit measures. I t has also made some a ttem pt to analyse the PSBR. The stu dy reveals th a t the levels of Grqss Fiscal D eficit (GFD) relative to Gross D om estic Product (GDP) were unsustainable during the '&tg}itie$ as there w as large accum ulation of debt which w a s incurred a t a re la tive ly high rate. T he'^ rgQ J$K£ K^ ^ _ *^ 4 of GFD w ith a siza b le com ponent o f m onetised defic it resulted in excess liq u id ity in the\$ 4j£ t e t i j ^
w h ich in turn has rendered challenges fo r the a tta in m e n t o f the m on etary p o lic y objectW&Ztifc price s ta b i l i ty . S tru ctu ra l d e fic it p redom in a ted the f is c a l s y s te m because o f large f isc a l drag.The im p lica tio n o f th is trend is th a t higher econom ic g ro w th by i ts e lf m a y n o t a u to m a tic a lly reduce defic it. Furthermore, as revealed by the measure o f fisca l stance and f isc a l im pulse, the Government pursued an expansionary fiscal po licy during the 'eighties and m o stly a contractionary fisca l p o lic y during the 'n ineties so far. G iven the borrow ing and taxa tion p ow ers ve s te d w ith the Centre there is a large elem ent of dependence by the S tate Governm ents on the Centre fo r resources.
INTRODUCTION
Reflecting a paradigm shift from the conventional approach of 'single m easure' to the contemporary approach of 'series of m easures', several m easures of budget deficit are currently in discussion and use. In recent years, contemporaneous with the world wide development, it has been widely recognised by the academicians and policy makers in India that a correct measurement of budget deficit is one of the crucial pre-requisites not only to assess the impact of fiscal stance but also for prudent macroeconomic management. Following the publication by Rangarajan et al (1989) which is truly a watershed research effort in the measurement of budget deficit, while discussing the fiscal developments in India, since early 'nineties, a few alternative concepts of budget deficit are widely used. Most of these efforts are, however, restricted to Central Government only and the analysis of the State Governments has not been adequately covered. As a result, the issue of measurement of budget deficit has remained some what underdeveloped and to that extent its analytical significance has not been adequately appreciated in term s of the coverage, usage and analysis.
Recognising this, the present paper has been designed to formulate a few purpose- specific measures which are relevant in the Indian context for analysing the emerging fiscal development. In this context it may be noted that the present paper on methodological issues owes substantially to the paper published by Rangarajan et al (1989); however, in terms of coverage, usage and analysis the scope of the paper has been broadened.* Dr. R.K. Pattnaik is Director, Internal Debt Management Cell, Shri S.M. Pillai is Director and
Smt. Sangeeta Das is Assistant Adviser in the Department of Economic Analysis and Policy. The authors are grateful to Dr. A. Vasudevan and Dr. R. Kannan for their valuable comments. The views expressed are those of the authors and not of the Bank. Computational assistance received from Smt. U.R. Vaidya, Shri. P.A. Shinde and Shri T.R. Vasave is gratefully acknowlfJ

Against the above backdrop, while presenting a 'p rim er' on the measurement of budget deficit in India the objectives have been to (a) analyse some of the concepts which are widely used in contemporary literature but have remained unexplored in India, (b) formulate certain new measures keeping in view the constitutional and accounting practices followed in India, and (c) work out time series data for fiscal years 1951 through 1999 for the existing measures as the same is not available systematically and consistently; emphasis has also been given to provide the data base for the underlying expenditures and receipts of these deficit measures.
The remainder of the paper is organised as follows: Section II presents a review of literature on the methodological issues in the measurement of budget deficit. Section III provides a conceptual framework on the basis of which alternative measures of deficit have been designed and developed in Indian fiscal system. Seetion IV sets out an assessment of the magnitude and implications of these deficit indicators. The major findings by way of concluding observations are presented in Section V.
2

SECTION II
REVIEW OF LITERATURE
The literature on the measurement of budget deficit is prolific and varied. Over the years, a sizeable research effort has been undertaken to examine the underlying issues on this subject. Moreover, in the face of large and persistent deficit during the 'eighties there has been a revival of interest on the topic resulting in a further expansion of the existing body of literature. Notwithstanding these developments, selection of an ap p rop ria te m easure of deficit is still beset w ith difficulties. Recognising this, Tanzi (1993) observes:
"A deficit is like an elephant; one always recognises it when one sees it, even though it may be difficult to measure or design it in a way that is satisfactory to everybody or for every purpose/'
The large body of literature on the measurement of budget deficit has been system atically docum ented in four pioneering surveys viz. (i) B linder and Solow (1974), (ii) H eller et al (1980), (iii) Blejer and Chu (1988), and (iv) Blejer and Cheasty (1991 and 1993). Apart from these surveys, some of the research efforts of individual authors which are worth mentioning are: Chelliah (1973), Chand (1977), Boskin (1982), Buiter (1983 and 1985), P iper and Eisner (1989), Eisner (1989), Blanchard (1990), Kotlikoff (1984 and 1986) and Mackenzie (1989). The underlying issues on m easurem ent of deficit which have been highlighted in these research works may be broadly classified as follows: (a) analysis of a set of purpose-spe- cific deficit indicators reflecting the shift in emphasis from the 'single measure' to 'series of measures'; which includes, the simple budgetary derivative m easures as well as fiscal stance and fiscal impulse measures; (b) analysis of the methodological issues, which includes, the budgetary accounting system and classification procedures; coverage and dimension of Government and the distinction between budgetary and non-budgetary operations while estim ating deficit. These issues are discussed in detail in the following paragraphs.
Analysis of purpose specific deficit indicators
In the absence of a common standardised accounting rule, each country follows a typical conventional measure peculiar to its own budgetary practice1. In respect of cross-country comparison, however, the International M onetary Fund (IMF) has been using the concept of overall deficit which is akin to the fiscal deficit or borrowing requirem ents of the Government. Chelliah (1973) has nam ed it as 'public debt concept of deficit'. According to this concept, a Government deficit represents the portion of expenditure and lending which exceeds receipts from revenues, (foreign) grants and loan repayments and which the Government covers by undertaking obligations for future repaym ent a n d /o r running down its liquidity holdings (IMF 1986). While the budget deficit defined thus, is an useful indicator, there are several limitations on which the policy-oriented economists have been concerned for a long time. This problem was further aggravated during the 'eighties on ac
3

coun t of large m acroeconom ic im balances. W ith the ra p id d e te rio ra tio n in the m acroeconom ic balance, the issue of sustainab ility of b u d g e t deficit has becom e pertinent. C onsequently , the conventional deficit tu rned ou t to be seriously inad equate to exam ine the im pact of deficit on the economy and sustainability related issues. In this context a few concepts w hich have ga ined currency are: p im ary deficit, operational deficit, and quasi-fiscal deficit (Blejer and Cheasty 1991). It was also recognised that the conventional deficit m ay be a m isleading indicator of the th rust of the fiscal policy, unless it is decom posed into its cyclical and structural components. O ver the last tw o decades, this concern has led to the developm ent of various techniques, w hich has been docum ented by Blinder and Solow (1974) and H eller et al (1986). Some of the notable con tribu tions su rveyed by B linder and k>low (1974) are: full em ploym en t su rp lu s by Brow n (1956); fiscal leverage by 4usgrave (1964); w eighted full em ploym ent surplus by Brown (1956) and Gramlich 1966); w eighted average surp lus by H ansen (1969) and Blinder and Solow (1974), and w eighted initial surplus by O akland (1969). Thereafter, Chand (1973) analysed three national m easures viz. U nited States' Full Em ploym ent Balance (FEB), Federal Republic of G erm any's cyclically neutral balance (CNB) and Dutch budget im pulse (BI). H e lle r et al, b e s id e s d isc u ss in g fu ll e m p lo y m e n t b a lan ce m e a su re an d w eigh ted s tan d a rd ised su rp lu s m easures, have also evalua ted som e quan tita tive m easures re lating to the stance and th ru st of fiscal policy tha t have been developed by in ternational agencies, such as In ternational M onetary F und (IMF) and O rganisation for Economic Cooperation and D evelopm ent (OECD).
It is pertinen t to note tha t despite such a vast body of literature on fiscal stance measures, there is some controversy w hether these m easures can be designed w ithou t taking a position on w hether the macroeconom ic structure of the econom y is Keynesian, neo-classical or Ricardian. Furtherm ore, w hile it is conceptually feasible to construct macroeconomic model free fiscal stance and fiscal im pulse measures, it appears that inform ation requirem ents are m any and hence the art of constructing these m easu res rev o lv es a ro u n d u sin g sh o rtcu ts an d com prom ises. F o llow ing Prem chand (1993) a set of alternative deficit indicators which are presently in d iscussion and use in the contem porary literature are set ou t in Exhibit J.
Methodological Issues
A part from form ulating a set of alternative concepts of deficit as discussed in the preceding paragraphs the researchers have also em phasised on the m ethodological issues. For exam ple, Boskin (1988) in his w ork on the U.S. federal G overnm ent deficit has argued th a t the item s w hich are excluded from it can have significant m acroeconom ic effects and certain other item s have no t been properly m easured; Buiter (1985) has a rg u ed for a balance shee t approach to calculate deficit; and Kotlikoff (1984) has proposed a concept called economic deficit. The im portant areas w hich are discussed in this context are (a) accounting system and classification procedures, (b) dim ension and com position of the G overnm ent and (c) distinction betw een budgetary and non-budgetary operations. A brief discussion on these aspects is set o u t in the follow ing paragraphs.
4

Exhibit 1Alternative Budget Balance Concepts
Deficit Indicators Description1. Overall Balance
2. Overall Balance w ithout grants3. Foreign balance
4. Domestic balance5. O perational deficit
6. Prim ary deficit
7. C urrent deficit/Surplus
8. Consolidated Coverage
9. Cyclically neutral balance
10. Cyclical effect of the budget
11. Base year balance12. Structural budget
13. Full em ploym ent balance
14. Liquidity balance
15. Perm anent balance
16. Generational balance
G overnm ent Expenditure minus G overnm ent revenue plus G rantsOverall balance minus grantsGovernment foreign expenditure minus G o v e rn m e n t re v e n u e fro m fo re ig n sourcesOverall balance minus foreign balanceOverall balance minus inflationary part of interest paym entsOverall balance minus all interest paym entsG overnm ent c u rren t rev en u es minus current Expenditures(a) w ith rest of public sector(b) w ith quasi-fiscal accounts of
Central bankG overnm ent expenditure minus cyclically corrected G overnm ent revenueO verall balance minus cyclical neutral balance of the budgetN orm al year balanceCyclical effect of budget plus base-year balanceFull employment Government expenditure minus full em ploym ent revenueO vera ll ba lance m inus n e t dom estic non-bank borrow ing minus net foreign borrow ingPresent value of all G overnm ent balan ces m inus p re s e n t v a lu e o f a ll sources of G overnm ent assets (assets, taxes etc.)P resent value of taxes of an average m em ber of his generation for the rem a in d e r of h is life m inus p re s e n t value of transfers he will receive
5

(a) Accounting System and Classification Procedure
While measuring budget deficit one of the major concerns has been the absence of any uniform accounting rules and practices across the countries. Thus, the adoption of a particular measure is conditioned by the budgetary and accounting procedures followed in a particular country. The differences in the budgetary system and accounting procedures are reflected in the classification of budgetary transactions as well as periodicity in reporting. While classifying the budgetary transactions there are tw o basic approaches viz. G overnm ent debt criterion™and public policy criterion . These two criteria while draw ing a line below and above the budget follow the same classification for most of the budgetary transactions; however, they differ for three types of transactions viz. a) net lending3 (b) external grants4 and (c) debt service . This divergence in approach has led to significant discrepancies in the size of conventional deficit.
A nother area of conceptual variation is the choice betw een cash and accrual accounting which has been discussed in detail by Blejer and Cheasty (1991), Heller et al (1986) and Levin (1993). The two most prevalent Government deficit measures are those prescribed by United Nations (1968) and the International Monetary Fund (1986),w hich are on accrual and cash basis, respectively, (Easterly et al, 1991). In practice, deficit m easures, how ever, lie som ewhere in betw een the complete cash and complete accrual measures. Even in countries which use cash deficit concept, interest paym ents are usually m easured as they accrue, rather than when actually paid (Blejer and Cheasty, 1991). Furtherm ore, difficulties in the m easurem ent of deficit arise w hen attempts are m ade to reconcile the cash and accrual concepts on account of 'arrears '7. In this context D iam ond et al (1988), argued that given the accounting conventions, the presence of 'arrears' may lead to an underestimation of expenditure and correspondingly the impact of Government operations and the size of the fiscal problem facing a country. Moreover, since 'arrears' can be viewed as a form of 'forced saving' to the Government, the Government's borrowing requirement may also be underestimated, resulting in a distorted picture of the sources of credit expansion in an economy.
It is argued by M ansoor (1988) that the problems in measurem ent also aggravate w hen the G overnm ent em barks on p rivatisa tion of public en terp rises th rough disinvestment. In such a situation he observes that the balance sheet approach on the lines suggested by Buiter (1983 and 1985) w ould be more appropriate which w ould take care of the changes in public sector net worth.
(b) Composition of Public Sector
The recent literature em phasises on the deficit of the public sector as a whole which takes into account economic activities of the Central Government, Provincial Government, Local Governm ent and Public Enterprises. In this context the public sector borrowing requirem ent (PSBR) has been widely used (World Bank 1988). At
6

the operational level, however, there are difficulties in defining the scope of the Government for purpose of measuring fiscal deficit because Governments frequently perform operations that are usually carried out in other sectors and also non-Gov- ernm ent agents may be used as instrum ents of Government policy. Recognising this, Blejer and Cheasty (1991), remark that two important aspects are to be distinguished which have a bearing on the proper measurement of the budgetary balance. First, the enterprises that comprise the public sector m ust be selected and second that portion of their operations which has a fiscal impact m ust be identified . While discussing these aspects Stella (1993) observes that public ownership is not a sufficient criterion for distinguishing Government enterprises from private firms. On the contrary, the distinction should be based both on behaviour of enterprises and on their impact on public finance. The discussions on these aspects also cover some of the specific issues such as accrual and cash accounting in public enterprises and netting out of subsidies and tax elements in the enterprise pricing.
Recognising that in many developing countries important quasi-fiscal activities are carried out by the financial public sector institutions, including the Central bank, a large and growing body of literature has emerged on the subject matter of quasifiscal deficit. Some of the im portant research efforts in this respect are: Robinson and Stella (1988), Blejer and Cheasty (1991), A nand and W ijnbergen (1988) and Rocha and Saldanha (1992). In all these research efforts a case has been m ade.for consolidating Central Bank quasi-fiscal operations with those of the Government in order to obtain a deficit measure that will provide a more complete information of the size of the deficit. Another area of extending the coverage of public sector is to include the public financial institutions in the coverage of PSBR. The special nature of the public finance institutions and their relation to public sector deficit is discussed in Leviatan (1993).
(c) Inter-Temporal Budget Constraint of Public Sector
Fiscal developments during the 'eighties have added a completely new dimension to the issue of measurement by focusing the attention towards balance sheet based deficit m easures to exam ine the in ter-tem poral budget constraints (Blejer and Cheasty, 1991 and Buiter 1983 and 1985). This is also otherw ise know n as net worth concept of budget deficit. This has raised a number of methodological issues relating to valuation changes, privatisation proceeds, social insurance program me and guaranteed debt. Some of the im portant research efforts in this regard are: Eisner and Piper (1986), Eisner (1986), Boskin et al (1987) and Kotlikoff (1988 and 1989).
From the above discussion it may be concluded that even though budget deficit has a central role in macroeconomic analysis, yet, a seemingly straight forward concept is difficult to design. Accordingly, the contem porary literature has deemphasised the use of a single measure of deficit and has recommended a family
7

of m easures each w ith its advantages and disadvantages. In addition to the identification of a series of m easures, the research efforts have also focused on the methodological issues relating to accounting and classification procedures, coverage of public sector and tem poral dim ension of Governm ent operations.
Ind ian Experience
The concept of budget deficit or deficit financing as it is popularly know n, has occupied a unique p t e m -tiie designing of fiscal policy and planning in India. Like m any developing economies, in India also, researchers and policy makers relied on the single m easure approach of deficit. D uring the 'eighties, however, contem poraneous w ith the w orld w ide developm ent there has been a fundam ental shift from the conventional approach of single m easure to the series of m easures approach. In this context the research efforts of Rangarajan et al (1989) m ay be truly called as 'epoch making'. In their pioneering work, a range of deficit indicators w ere conceptualised an d w orked o u t for the C entral G overnm ent. Subsequently, some of these deficit indicators were published in the publications of Reserve Bank of India and Government of India. Extending the coverage of the Government, Reserve Bank of India also published a series of deficit indicators for the State Governments and also for the Government Sector (Central and State Governments combined together).
In the context of fiscal stabilisation program me since July 1991, 'fiscal deficit ' (akin to the IMF concept of overall deficit discussed earlier) has become an important fiscal variable and crucial policy target of the Central Government (Chelliah 1993). There has been a debate am ong economists regarding the m erit and usefulness of this deficit indicator as well as the definitional issues; some of the important contributors in this respect are G ulati (1994 and 1995), Gill (1993), Mody (1991, 1992 and 1994) Subba Rao (1994) and K hundrakpam (1996). Gulati (ibid) has expressed reservations against the treatm ent of proceeds from the disinvestment of equity holdings of public sector units as part of receipts in the estimation of fiscal deficit. His contention is that if the strict definition of fiscal deficit was adhered to, the official estim ate of fiscal deficit is underestim ated. M ody (ibid) questioned the validity of treating recoveries of loans and proceeds of public sector disinvestment as part of receipts. He in tu rn argued that recoveries and disinvestment on the contrary w ould reduce the financial assets which in turn increase net financial liability of the Government. The official definition, which takes into account these two components in the receipt side is, therefore, underestim ated to that extent. Subba Rao (ibid) has criticised the inadequacy of fiscal deficit in the context of high Inflationary scenario and its inappropriateness to assess the efficiency of the current fiscal policy. K hundrakpam (ibid) evaluated the alternative measures of Government deficit in India w ith special emphasis on the impact of inflation on budget deficit. According to him fiscal deficit in the official estimates is overestimated on account of the impact of inflation and therefore, may not be a true guide for evaluating fiscal adjustm ent program m es.
8

Another area of controversy relates to the definition of primary deficit (RBI, 1993 and Government of India, 1993). The debate centres around the treatment of 'interest receipts' while defining the gross prim ary deficit. It is pertinent to note that the research efforts relating to the measurement of deficit mostly relate to Central Government. Moreover, as most of the State Governments have not yet introduced alternative m easures in their respective budget documents, this concept is yet to take formal shape. Similarly, the concept of 'structural deficit' which has w ide international applicability has not been systematically developed in the Indian context. The importance of this concept has, however, been recognised in the Reserve Bank of India Annual Report 1993-94, which observes:
"An increasing structural deficit, though has the effect in the short-run of promoting growth and employment, would at the same time tend to bring into the open the rigidities in the fiscal system. Tentative technical exercises show that in the case of India, the cyclical component of the deficit of the Central Government is low, and structural deficit predominates".
Another concept called operational deficit which is more often used in the context of high inflation scenario has also not gained much popularity in Indian context. On the contrary, the concept has been argued to be of no merit in Indian context essentially because of the adm inistered nature of interest rates (Joshi and Little, 1992). The present study, therefore, has been organised to formulate a few purpose specific m easures w hich are relevant in the Indian context. In this context the emphasis has been on (a) estimating structural and cyclical deficit, operational deficit and PSBR, (b) designing a few deficit measures considering the inter-Govern- mental resource transfers. In this respect some of the m easures which have im mense analytical significance but not generally discussed have also been examined. In order to explain these issues a conceptual framework has been designed in the following Section.
9

SECTION III
CONCEPTUAL FRAMEWORK
W hile designing a 'primer' on the m easurem ent of budget deficit the three essential elem ents considered are: (a) level of Government, (b) purpose of analysis and (c) accounting framework. India being a federal setup w ith different layers of G overnm ents (Central, State and Local Governments), in principle, the estimation of alternative m easures should cover all these levels separately and also in their combined position . D ue to n on -availab ility of d a ta in respect of Local Governments, the analysis in the present s tudy is restricted only to Central and State Governments. K eeping in view the em erging fiscal developm ents the purpose of analysis in the present study is confined to the following issues: (a) origin and sources of budget deficit, (b) inter-G ovem m ental resource transfers (c) im pact of deficit on debt, Inflation, balance of paym ents, savings and investm ent, and (d) sustainability of deficit. The budget accounting fram ew ork is comm on for both the Central and State Governm ents. The C onstitu tion , how ever, has g iven separate powers to Central and State G overnm ents in term s of im posing taxes and borrow ings9.
A detailed discussion on the budgetary system is set out in Exhibit 2 and the summ ary position of the budgetary transactions is presented in Exhibit 3. Against the above backdrop a few alternative m easures of deficit are in order which are comm on for the Central as w ell as State Governm ents.
10

Exhibit 2
____________________Indian Budgetary System and Practice____________________
Under Article 112 of the Constitution, a statement of estimated receipts and expenditure of the Government of India has to be laid before Parliament and for the State Governments in the State legislature in respect of the financial year which runs from April 1, to March 31. This statement titled "Annual Financial Statement" (AFS) is the main budget document. The estimates of receipts and disbursements in the AFS and of expenditure in the demand for grants are shown according to the accounting classification prescribed under the Article 150 of the Constitution. The AFS shows the receipts and payments of Government under the three parts in which Government accounts are kept, (i) Consolidated Fund; (ii) Contingency Fund and (iii) Public Account. All revenues received by Government, loans raised by it and also its receipts from recoveries of loans granted by it, form the Consolidated Fund. The Contingency Fund is an imprest placed at the disposal of the President to incur urgent unforeseen expenditure. Besides the normal receipts and expenditure of Government which relate to the Consolidated fund, certain other transactions enter Government account, in respect of which, Government acts more as a banker, viz. transactions relating to provident funds, small savings collections, other deposits etc. The moneys thus received are kept in the account called Public Account.
Under the Constitution of India, Budget has to distinguish expenditure on revenue account from other expenditure. Accordingly, the Government Budget comprises (a) Revenue Budget and (b) Capital Budget. Revenue Budget consists of the revenue receipts of the Government v/hich mainly include tax revenues and interest and dividends on investments made by the Government. Revenue expenditure is for normal running of the Government. Broadly speaking, expenditure which does not result in the creation of assets is treated as revenue expenditure with the exception of grants given to the State Governments. Capital Budget consists of capital receipts and disbursements. Capital receipts consist of non-debt components and debt components. The non-debt item is the recovery of loans disbursed in the past by the Government. The disinvestment proceeds also form part of non-debt capital receipts. The debt portion comprises internal debt (market borrowings), other liabilities (small savings, reserve funds and deposits etc.) and external borrowings. Capital disbursements consist of capital expenditure on acquisition of assets and loans and advances to State Governments. The transactions in the Public Account which include small savings, Provident Fund, deposits and reserve funds are also covered in the Capital Budget.
11
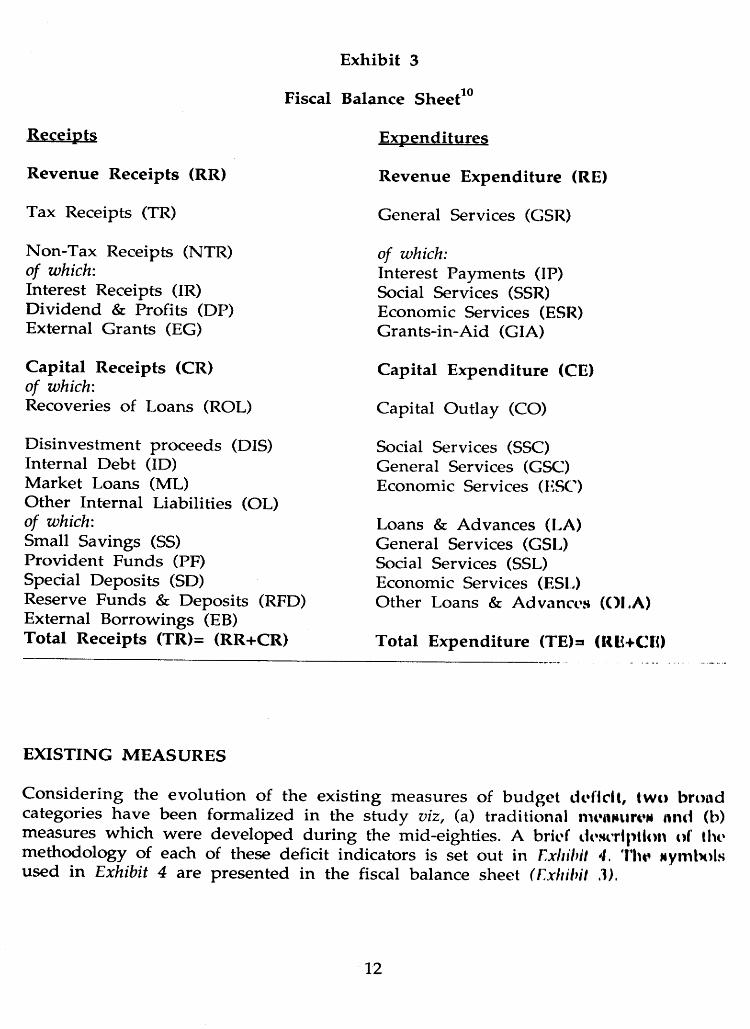
E xhib it 3
Fiscal Balance S heet10
RfcCgipte E xpend itu res
R evenue R eceip ts (RR)
Tax Receipts (TR)
N on-Tax Receipts (NTR) of which:Interest Receipts (IR)D ividend & Profits (DP)External G rants (EG)
C ap ita l R eceip ts (CR)of which:Recoveries of Loans (ROL)
D isinvestm ent proceeds (DIS) Internal D ebt (ID)M arket Loans (ML)O ther In ternal Liabilities (OL) of which:Small Savings (SS)Provident Funds (PF)Special D eposits (SD)Reserve F unds & D eposits (RFD) External B orrow ings (EB)T otal R eceip ts (TR)= (RR+CR)
R evenue E xpend itu re (RE)
G eneral Services (GSR)
of which:Interest Paym ents (IP)Social Services (SSR)Economic Services (ESR) G rants-in-A id (GIA)
C ap ita l E xpend itu re (CE)
C apital O utlay (CO)
Social Services (SSC)G eneral Services (GSC)Economic Services (ESC)
Loans & A dvances (LA)G eneral Services (GSL)Social Services (SSL)Economic Services (ESL)O ther Loans & A dvances (OLA)
T otal E xpend itu re (TE)=* (RLfCK)
EXISTING M EASURES
C onsidering the evo lu tion of the existing m easures of b u d g e t deficit, tw o brood categories have been form alized in the s tudy viz , (a) traditional nnntfiumi and (b) m easures w hich w ere developed during the mid-eighties. A brief do.Hcription of the m ethodology of each of these deficit indicators is set out in Exhibit 4. The sym bols used in Exhibit 4 are p resen ted in the fiscal balance sheet (Exhibit ,1).
12

E xhibit 4
Concepts and Measurement of Existing Deficit Measures
D eficit Indicators (1)
Expenditures(2)
Receipts(3)
M easurement(4)
Traditional Measures
1. Revenue Deficit (RD)2. Capital Account Deficit (CAD)3. Conventional Budget
Deficit (CD)114. Monetised Deficit (MD)
RECE=CO+LA
TE=RE+CE*
RRCR
TR=RR+CR*
RD=RE-RRCAD=CE-CR
CD=TE-TR=RD+CAD*
Measure of Recent Origin
5. Gross Fiscal Deficit (GFD)12 TE-ROL=RE+CO+(LA-ROL)=RE+CO+NL
RR+DIS GFD=(TE-ROL)-(RR+DIS)=(RE+CE-ROL)-(RR+DIS)=(RE+CO+LA-ROL)-(RR+DIS) =(RE+CO+NL) -(RR+DIS) =(RD+CO+NL-DIS)
6. Primary Deficit (PD) (a) PD1
TE-ROL-IP =(RE-IP)+ [CO+(LA-ROL)l =(RE-IP)+ (CO+NL)
RR+DIS PD1 =(RE-ROL-IP) -(RR+DIS)=I(RE-IP)+(CO+LA-ROL)]-(RR+DIS)=[(RE-IP)+(CO+NL)l-(RR+DIS)
(b) PD2 TE-ROL-IP=(RE-IP)+ [(CO+LA-ROL) 1= (RE-IP)+(CO+NL)
(RR-IR)+DIS PD2=(TE-ROL-IP) -[(RR-IR)+DISJ =(RE-IP)+[CO+(LA-ROL)l -[ (RR-IR) +DISJ=[ (RE-IP)+ (CO+NL)]-[(RR-lR)+DIS]
7. Net Fiscal Deficit (NFD) TE - NL=(RE+CE)-(LA-ROL) = (RE+CE)-NL
RR+DIS NFD=(TE-NL)-(RR+DIS) =[(RE+CE)-(LA-ROL)] -(RR+DIS)=[(RE+CE)-NL1 - (RR+DIS)
8. Net Primary Deficit (NPD) TE-NL-IP=(RE-IP)+[CE-(LA-ROL)]=(RE-IP)+(CE-NL)
(RR-IR)+DIS NPD=(TE-NL-IP)- [(RR-IR)+DIS1 =[(RE-IP)+CE-(LA-ROL)] -[(RR-IR)+DIS1=[(RE-IP)+ (CE-NL)M(RR-IP)+DIS]
9. Primary Revenue Balance (PRB)PRB1PRB2
RE - IP RE - IP
RRRR-IR
PRB1=(RE-I P)-RR=RD-IP PRB2=(RE-IP)-(RR-IR)=RD-NIP
* : Since m onetised deficit is essentially a financing item of the Central Government's budgetary gap its measurement through expenditure and receipts approach is not applicable.
Note: Explanation of the notation used in this exhibit is set out in Exhibit 3.
13

The concept and m easu rem en t of the existing m easures becom e self-explanatory follow ing the details set ou t in Exhibit 4. N evertheless, further discussion on the m easurem ent aspects of gross fiscal deficit and prim ary deficit along with the definition of m onetised deficit is presented in the follow ing paragraphs.
Monetised Deficit (MD)
It has been recognised by the Comm ittee to Review the W orking of the M onetary System (Chairm an: Prof. Sukham oy C hakravarty) that there are tw o basic lim itations of the conventional deficit viz.: (a) budgetary deficit defined as such does not reveal the full ex tent of the G overnm ent's reliance on RBI credit and (b) to the extent T reasury Bills are held outside the RBI, the concept tends to overstate the m onetary im pact of the fiscal operation. Accordingly, it recom m ended a m odification in the concept of b u d g e ta ry deficit to include the en tire RBI crcd it to the G overnm ent to capture the m onetary im pact of the fiscal operations13. M onetised deficit is thus denoted by the net RBI credit to the Central Government. Presently, this is defined as the sum of increase in the RBI's holdings of G overnm ent of India dated securities and Treasury Bills and rupee coins and the Ways and Means A dvances to C entral G overnm ent by the Reserve Bank, ad justed for changes in cash balances w ith the Reserve Bank.
Composition and Financing of GFD
W ith the d isc o n tin u a tio n of the au to m atic m o n e tisa tio n of the b u d g e t d efic it th rough the in s tru m en t of ad hoc T reasury Bills w ith effect from the fiscal year 1997-98, the system of conventional deficit has been d iscontinued and the gross fiscal deficit has been introduced in the budget as the benchm ark for assessing the fiscal perform ance.
The analytical advantage of GFD is its com prehensiveness in the presentation of the overall bo rrow ing requ irem en ts position of the G overnm ent. This apart, the GFD can be decom posed into Revenue Deficit (RD), Capital O utlay (CO) and N et Lending (NL) w hich reflects the utilisation of the borrow ed funds by the G overnment. On account of the change in the system of accounting of loans to States and UTs against net Small Savings collections w ith effect from April 1, 1999# these figures do not from p art of GFD. The financing of GFD reveals the extent of G overnm ent borrow ings from different sources viz. external and internal which include non-banking and banking and the level of monetisation of G overnm ent borrowing. It is pertinent to note that the decom position and financing of GFD taken together reflect the sources and uses of borrow ed funds at the disposal of the Government.
Composition of Primary Deficit
There has been an indication in the Economic Survey, 1995-96 that PD (GFD-IP) m ay be decom posed into its consum ption (PDC) and investm ent (PDI) components. Thus,
14
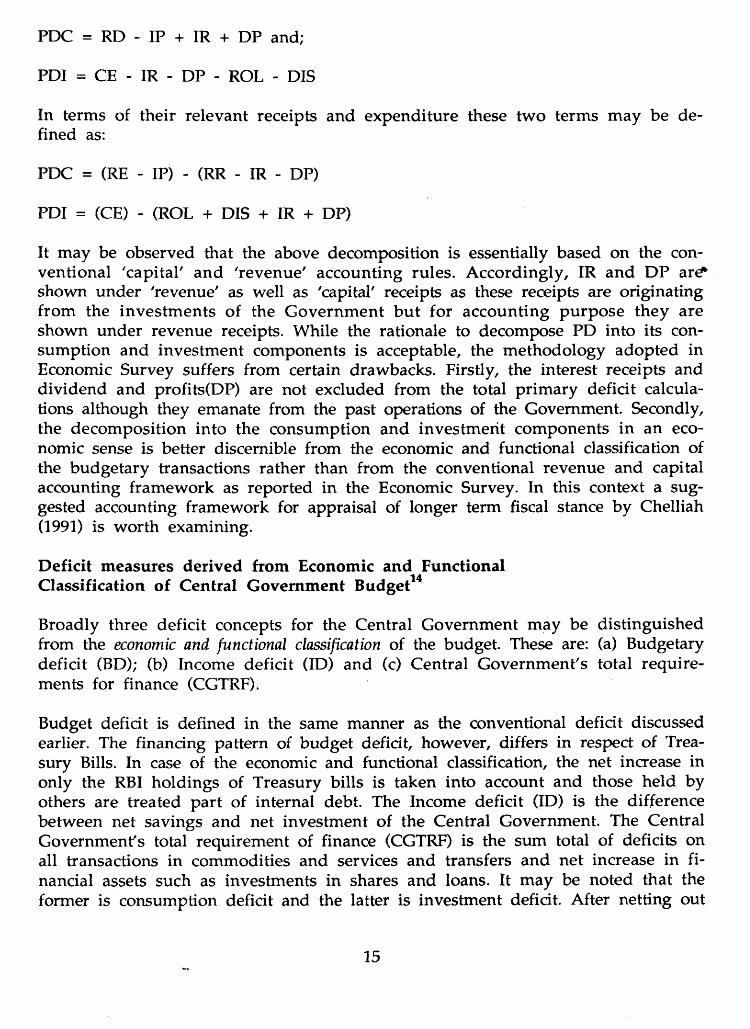
PDC = RD - IP + IR + DP and;
PDI = CE - IR - DP - ROL - DIS
In terms of their relevant receipts and expenditure these tw o terms m ay be defined as:
PDC = (RE - IP) - (RR - IR - DP)
PDI = (CE) - (ROL + DIS + IR + DP)
It may be observed that the above decomposition is essentially based on the conventional 'capital' and 'revenue' accounting rules. A ccordingly, IR and DP ar£* shown under 'revenue' as well as 'capital' receipts as these receipts are originating from the investm ents of the G overnm ent bu t for accounting purpose they are shown under revenue receipts. While the rationale to decompose PD into its consum ption and investm ent components is acceptable, the methodology adopted in Economic Survey suffers from certain drawbacks. Firstly, the interest receipts and dividend and profits(DP) are not excluded from the total prim ary deficit calculations although they emanate from the past operations of the Government. Secondly, the decom position into the consum ption and investm ent com ponents in an economic sense is better discernible from the economic and functional classification of the budgetary transactions rather than from the conventional revenue and capital accounting framework as reported in the Economic Survey. In this context a suggested accounting framework for appraisal of longer term fiscal stance by Chelliah (1991) is worth examining.
Deficit measures derived from Economic and Functional Classification of Central Government Budget14
Broadly three deficit concepts for the Central Government may be distinguished from the economic and functional classification of the budget. These are: (a) Budgetary deficit (BD); (b) Income deficit (ID) and (c) Central G overnm ent's total requirements for finance (CGTRF).
Budget deficit is defined in the same manner as the conventional deficit discussed earlier. The financing pattern of budget deficit, however, differs in respect of Treasury Bills. In case of the economic and functional classification, the net increase in only the RBI holdings of Treasury bills is taken into account and those held by others are treated part of internal debt. The Income deficit (ID) is the difference between net savings and net investm ent of the Central Government. The Central Government's total requirement of finance (CGTRF) is the sum total of deficits on all transactions in commodities and services and transfers and net increase in financial assets such as investments in shares and loans. It may be noted that the former is consumption deficit and the latter is investment deficit. After netting out
15
interest components from CGTRF the primary deficit (PD) may be worked out and decomposed w ith its consum ption and investment component.
CONTEMPORARY DEFICIT INDICATORS
Notwithstanding the analytical significance of the GFD and PD, these two concepts do not throw much light on the behavioural decomposition of the deficit. Also the liqu id ity im pact, and as such the inflationary im pact of budget deficit rem ain som ew hat unexplained. Furtherm ore, GFD and PD need to be extended to cover the public sector for a better understanding of liquidity and public policy m easures. Accordingly, a few concepts which can capture the above aspects are discussed in the following paragraphs.
Structural and Cyclical deficit
It is im portant to ascertain whether budget deficit is caused by cyclical factors that have a transitory effect or by structural changes in the economy that have a du rable impact. This categorisation is useful for separating the cyclical influences on the budget balances em anating from the difference betw een actual and potential output from those which are structural. Following the IMF methodology cyclically neutral balance, fiscal stance and fiscal im pulse have been worked out. Similarly, the structural and cyclical deficit are worked out on the basis of methodology followed by OECD. The detailed methodologies of these tw o approaches are set out in Technical Appendix 1.
Operational Deficit.
O perational deficit (OD) which is also know n as inflation adjusted deficit is defined as gross fiscal deficit minus that part of the interest paym ents that compensate debt holders for actual inflation. Alternatively, it is equal to the primary deficit plus the real component of interest payments. The advocates of this concept do recognise the technical difficulties while calculating the real interest payments such as choice of inflation indices, and the situation when interest rates#are negative in real terms. In this study GDP deflator has been used to arrive at the real interest payments. Thus, OD = PD + IP/GDPDEF where GDPDEF is the GDP deflator and is w orked ou t taking the ratio of GDP at current prices to constant prices. The concept of operational deficit so defined has been restricted to the Central Governm ent only.
Liquidity Balance15
The measure of liquidity balance is represented by the net bank credit to the Governm ent sector.
16

Liquidity Balance (LB) = Total F inancing of G overnm ent Sector - N on-bankBorrowing
= Net Banking Sector Credit to Government Sector = [Net RBI Credit to Government Sector + N et Other Bank
ing Sector Credit to Government Sector]
Government Sector Borrowing Requirement (GSBR)
In Indian context public sector deficit has not been studied in its totality because of statistical problems. There is a paucity of information on local Governments and public sector enterprises. Therefore, the Government Sectors Borrowing Requirement (GSBR) has been used as a proxy for Public Sector Borrowing Requirem ents (PSBR). In this context, the present study has developed a database on PSBR and GSBR. The data on PSBR are taken from the Economic Survey of Government of India which include budgetary transactions of the Central Government, State Governments and Union Territories including internal and external budgetary resources of public sector undertakings for their Plans. The data on GSBR have been worked out on the lines worked out in the Reserve Bank of India publications. The detailed methodology is presented in Technical Appendix 2.
INTER-GOVERNMENTAL TRANSACTIONS
The PSBR captures the budgetary constraints of the entire public sector and, therefore, is a useful tool for macroeconomic policy and liquidity management. It does not, however, reveal budgetary transactions between different segments of the Government Sector which have crucial importance in a federal setup like India. The resource flow from the Central Government to State Governments and vice versa is a matter of controversy in the Centre- State financial relations. In this context, it would be useful to derive the budgetary balance for the Central and State Governments taking into account the resource flow before the federal transfers. It may be noted that State Resource Gap (SRG) and Basic Resource Gap (BRG) have been developed in the context of State Governments16. A similar approach has been followed in this study to frame certain deficit indicators taking into account the resources transfer of the Central Government.
State's Resource Gap (SRG)
State's Resource Gap (SRG) = [(RE-IPC)+(CD-DID-RLC)] -[(RR-NSGFC) + (CR-LAC)]
where,RR = Revenue Receipts CR = Capital ReceiptsNSGFC = Non - Statutory Grants from Centre LAC = Loans and Advances from Centre RE = Revenue Expenses
17

IPC = Interest Payments to Centre CD = Capital Disbursement DID = Discharge of Internal Debt RLC = Repayment of Loan from Centre
Basic Resource Gap (BRG)
Three variants of Basic Resource Gap have been developed by Pattnaik et al (1994) viz. BRG1, BRG2 and BRG3.
BRG1 = [(TE)-(OTAR + ONTR)]BRG2 = (TE) - [ (OTAR+ONTR) + (ID-ML) + (PFS+RFD+OCR)]BRG3 = (TE) - [(OTAR+ONTR+SCT+SGFC) + (ID-ML)+(PFS+RFD+OCR)] where,
' TE = Aggregate Expenditure OTAR = States Own Tax Receipts ONTR = States Own Non-Tax Receipt ID = Internal Debt ML = Market LoanPFS = Small Savings Provident Fund etc.RFD = Reserve Funds and Deposits OCR = Other Capital Receipts SCT = Share in Central Taxes SGFC = Statutory Grants from Centre
These concepts have the analytical advantage in m easuring the fiscal stress and fiscal dependency of the State Governments [Pattnaik et al (1994)].
Centre's Deficit before Federal Transfers
Three variants of Centre's deficit before federal transfers have been formulated in this study. These are (a) Revenue Deficit Before Federal Transfers (RDBFT), (b) Capital Account Deficit Before Federal Transfers (CDBFT) and (c) Overall DeficitBefore Federal Transfers (ODBFT). The definition of these three deficit indicatorsare given below:
(a) Revenue Deficit before Federal Transfers (RDBFT):(RE - GIA) - (RR - IR) or RD - (GIA- IR)
(b) Capital Account Deficit before Federal Transfers (CADBFT):(CE - LA) - (CR - ROL) or CAD - NL
(c) Overall Deficit before Federal Transfer (ODBFT):[(RE - GIA) + (CE - LA)] - [(RR - IR) + (CR - ROL)]= ODBFT = (RDBFT + CADBFT)
Explanations of the notations used is set out in Exhibit 3.
18

ADVANTAGE OF A TAXONOMY OF DEFICIT INDICATORS
A summary presentation of the deficit indicators explained above in terms of their purpose, level of Government and period of data presentation is set out in Exhibit5. An issue in this context is whether there exists any analytical superiority of one deficit indicator over the other. It may be mentioned that these deficit indicators are mainly contextual. It is, therefore, difficult to discuss the advantage or disadvantage of one concept over the other. As alluded to earlier, these deficit indicators are purpose specific, and the usage of these indicators should be in conformity with the objective for which the analysis has been undertaken. Thus, there lies the advantage in having a series of measures as discussed above than that of a single measure of deficit as the former throw much deeper analytical insights into the assessment of fiscal and macroeconomic management.

EXHIBIT 5 : TAXONOMY OF BUDGET DEFICIT INDICATORSMeasures of deficit
(1)
Purpose
(2)
Level of Government(3)
Period of Data Presentation(4)
1. Conventional Deficit
2. Monetised Deficit
3. Revenue Deficit
Uncovered Gap\ Monetisation Impact
Monetary Impact of Fiscal Operation
Dis-savings of the Government
CentreStatesCombinedGovernment
CentreStates
CentreStatesCombinedGovernment
1950 - 1997 1970 - 1999 1970 - 1997
1951 - 1999 1970 - 1999
1950 - 1999 1970 - 1999 1970 - 1999
4. Gross Fiscal Deficit
5. Government Sector Borrowings Requirement
6. Primary Deficit and Primary Revenue Balance, Net Fiscal Deficit and Net Primary Deficit
Macroeconomic impact of budget deficit
To examine the effects of Government Sector deficits on macroeconomic variables.
Sustainability of deficit
CentreStates
CombinedGovernment
CentreStatesCombinedGovernment
1950 - 1999 1970 - 1999
1970 - 1999
1950 - 1999 1970 - 1999 1970 - 1999
7. Revenue Deficit, Capital Account Deficit and Overall Deficit Before Federal Transfers
8. State Resource Gap and Basic Resource Gap
9. Fiscal Stance, Fiscal Impulse, Cyclical and Structural Deficit
10. Operational Deficit
11. Income Deficit
12. Central Governments Total Requirement of Finance (CGTRF)
13. Liquidity Balance
Inter-Governmental Transfers
Fiscal Dependency and fiscal stress
Autonomous and discretionary effects on Budget Deficit to examine the behavioural decomposition of deficit and growth implications of deficit.
To net out effects of inflation on budget deficit.
Centre
States
CentreCombinedGovernment
CentreCombinedGovernment
To measure saving-investment Centre gap and expansionary effects of the government budgetary operations.
To measure the deficit arising Centre out of Government's net transactions in commodities, services, transfers and transactions in financial assets.
To capture the liquidity impact Centre of the budgetary operations of States the Government sector.
1950 - 1999
1970 - 1996
1970 - 1997 1970 - 1997
1970 - 1997 1970 ~ 1997
1970 1998
1970 199H
1970 19VH 1970 1998
20

SOURCES, RECONCILIATION AND COVERAGE OF DATA
As mentioned earlier, one of the prime objectives of this study is to generate a consistent and comparable time series data for the deficit indicators in the Indian context for undertaking inter-temporal analysis. This requires not only a comprehensive understanding of data base but also a large amount of data reconciliation. Some of these aspects are set out below.
Sources of data mostly relate to the publications of Reserve Bank of India (RBI) and Government of India (GOI) viz. (i) Articles on Central Government Finances and State Government Finances, published in various issues of RBI Bulletin, (ii) Report on Currency and Finance, RBI, (iii) Combined Finance Accounts of Government of India, (iv) Finance Accounts of Government of India, (v) Economic Survey of Government of India and (vi) Budget Documents of Central and State Governments.
It may be noted that there were two major accounting and classification changes in the budget in 1974-75 and in 1986-87; besides the minor changes that had taken place in many other years17. Due to non-availability of detailed data, it is not possible to make a complete adjustment in the time series, however, broad adjustments have been made to make the data consistent and comparable for the purpose of study. In respect of the Central Government, the areas of adjustments relate to financing of conventional deficit, miscellaneous capital receipts, classification and discharge of debt, netting of contra entries, and treatment of external grants and market borrowings18. As regards the State Governments the accounting classification changes during 1974-75 and 1986-87 did not affect the aggregate fiscal variables in the revenue and capital accounts as these data continue to be reported consistently in the RBI documents. The problem relating to State Governments lies in the coverage of the State Governments. On account of coverage changes and reorganisation of States it is difficult to adjust the State Governments data from 1950-51. Therefore, in this study the State Governments data (unlike the Central Government data which are from 1950-51) cover the period 1970-1999. Consequently, the Government sector data (Central and State combined) also cover the same period. Furthermore, the GDP series used in the study are with the base 1980-81.
21

SECTION IV
EMPIRICAL ANALYSIS
The empirical analysis covers the magnitude of the fiscal imbalances of the Central and State Governments separately as well as of the Government sector as a whole. It also examines implications of such imbalances on the economy and budget following the categorisation of deficit indicators set out in the Exhibit 5 in the preceding Section.
RD, CAD, CD and MD
According to the conventional paradigm the revenue account should generate adequate surplus to finance capital expenditure and capital account deficit (if any) is only m eant for financing capital expenditure. The crucial assumption in this regard is that capital expenditure is self balancing and self lim iting.19 In conformity with the above mentioned budgetary principle, the Central as well as the State Governm ents m aintained, by and large, surpluses in their revenue account; the trend in revenue surplus continued in respect of the Central G overnm ent till 1978-79 and for the State Governments upto 1986-87 and for the Government sector till 1981-82 (Appendix Tables 1,2 and 3). Correspondingly, the capital account was in deficit, reflecting a 'm irror im age'. Thus, the conventional deficit of the Central G overnm ent during the period 1950-1979 ranged between 0.04 per cent (1950-51) and 3.64 per cent (1957-58). It is pertinen t to note that the deficit in the year 1957-58 is unusual of the trend and thus w hile presenting the budget the Finance M inister observed "The proposal I have made will still leave the overall deficit for the year at a level somewhat higher than I would consider safe". In respect of the State Governments the deficit ranged betw een 0.04 per cent (1974-75) and 0.66 per cent (1980-81). Reflecting the trends in the Central and State Governments the conventional deficit of the Governm ent Sector also varied in the range of 0.10 per cent (1976-77) and 2.48 per cent (1980-81). The deterioration in the revenue account of the Central and State Governm ents during the 'eighties w as on account of sharp rise in revenue expenditure (Appendix Table 4 and 5). The large gap in revenue account in all levels of G overnm ent also continued during the 'nineties so far. C orrespondingly, there has been a surplus in the capital account m ainly due to cut backs in capital expenditure. The monetised deficit, which reflects the liquidity impact of the budget deficit, deteriorated during the 'eighties on an average of 2.2 per cent of GDP as against 1.1 per cent of GDP in the 'seventies (Appendix Table 1). This deterioration in the monetised deficit eroded the efficacy of monetary policy in controlling inflation. The monetised deficit was, however, contained considerably to below 1 per cent of GDP during the period 1991-95 from the level of 2.75 per cent d u rin g 1990-91. The la test tren d , how ever, is a m atte r of serious concern as m onetised deficit du ring 1995-96 reached a peak level of Rs.19,855 crore or 1.77 per cent of GDP and after coming dow n to Rs.1,934 crore (0.15 per cent of GDP) in 1996-97 shot up to Rs.12,914 crore (0.91 per cent of GDP) in 1997-98.
22

GFD/GSBR/PSBR
Gross fiscal deficit (GFD), Government Sector Borrowing requirements (GSBR) and Public Sector Borrowing Requirements (PSBR) are concepts used for m easuring the total borrowing requirements of Centre and State Governments, Government Sector and Public Sector, respectively. The borrowing requirements of the Central Governm ent w hich w ere, on an average, below 5 per cent of GDP du ring the period 1950-1980 (on a five-yearly average basis) increased to 8.2 per cent during the second half of the 'eighties. The borrow ing requirem ents of the State G overnm ents which were in the neighbourhood of 2 per cent during the 'seventies deteriorated to 3 per cent of GDP during the 'eighties. Correspondingly, the GSBR which was about 5 per cent d u rin g the 'seventies deterio ra ted to 8.5 per cent d u rin g the 'eighties (Table 1 and Appendix Table 6,7 and 8). It is pertinent to note that such large borrowings were necessitated because of huge revenue deficit which is evident in decomposition of GFD (Appendix Table 9 and 10). These borrowings were financed by high cost borrow ed funds as evident in the financing pattern of the GFD (Appendix Table 11 and 12) concomitant with the trends in GSBR, the Public Sector Borrow ing requirem ents (PSBR) also assum ed larger p roportion of GDP during the latter half of the 'eighties as compared with the levels during the seventies (Appendix Table 13). For example, during the latter half of 'eighties PSBR as proportion of GDP, on an average, was about 13 per cent as against around 6 per cent during the 'seventies.
Large and grow ing GFD of the G overnm ent sector w ith a sizable com ponent of m onetised deficit, resulted in a sharp rise in m onetary grow th which was much higher than real economic grow th and thus generating severe dem and pressure. Moreover, the rising GFD and GSBR has resulted in large outstanding debt of the Centre, States and G overnm ent sector. For example, the outstanding liabilities of Central Government increased sharply from Rs.13,379 crore or about 31 per cent of GDP as on end-M arch 1970 to Rs.40,251 crore or 35 per cent as on end-M arch 1980 and further to Rs.2,39,849 crore or 52.5 per cent as on end-M arch 1990. Similarly, the ou ts tand ing liabilities of the State G overnm ents relative to GDP has show n sharp increase (Table 2). A part from generating a high level of debt, the increasing borrow ing requirem ents of the Governm ent Sector during the 'eighties has also p u t pressure on the in terest rate despite the G overnm ents' a ttem pt to borrow in a captive market and from the Reserve Bank of India. Consequently, the interest rate on Government borrowings has shown a sharp rise, the nominal rates on select instrum ents are indicated in Table 3. These rates w ould be m uch higher if fiscal concessions would be taken into account. Large volume of debt along with high rates of in terest has p u t pressure on the budget in term s of large interest payments. As a result interest burden defined as the ratio of interest paym ents to revenue receipts have gone up considerably for all levels of Government (Table 2). Recognising the adverse implications of large borrowings (GFD), the Central Governm ent undertook the fiscal stabilisation measures in July 1991. Consequently, the level of GFD relative to GDP was brought down from its levels in the past except
23
for the bad performance in 1993-94. Since the State Governments are not committed to any fiscal corrections and consolidation, the level of GFD continued at about 3 per cent of GDP; the GSBR, how ever show ed some im provem ent because of Central G overnm ent action in reducing GFD. N otw ithstanding the reduction in GFD of the Central Government and GSBR, the persistence of revenue deficit in all levels of G overnm ent is a m atter of serious concern as it not only reflects the dissavings of G overnm ent sector bu t also m isutilisation of high cost borrow ed funds.
Primary Deficit: PD1, PD2 and NPD
It has been recognised that in the Indian context there is no unanim ity of view regarding the definition of prim ary deficit that is derived from GFD (RBI, 1993). Accordingly, as mentioned earlier, the present study has conceptualised three concepts of prim ary deficit for the Central, States and Government Sector viz. PD1, PD2 and NPD. The trends in PD1, PD2 and NPD of the Central and State Governm ents are set out in Appendix Table 14 through 17. It may be observed that primary balance in any of its variants and for any level of Government depicts a perm anent deficit feature. The persistence of prim ary deficit is clearly evident in the five yearly average trends also (Table 1). For example, in respect of the Central Government PD1, PD2 and NPD, as proportion of GDP, on an average, rose from the levels of 2.01 per cent, 3.26 per cent and 1.58 per cent, respectively, during the period 1970-75 to 4.83 per cent, 6.62 per cent and 3.80 per cent, respectively, during the period 1985-90. It may be noted that the increase has been more than double w ithin two decades. Rapid surge has also been observed in the five- yearly average trends of the State Governments and Government sector (Table 1). As a part of the fiscal stabilisation programme the Central Government undertook the compression of non-interest expenditure. Consequently all the variants of primary deficit are seen to decline over their past levels (Table 1). Similar trend has also been noticed in respect of State Governments though the magnitude of decline has not been sharp. Reflecting the action of the Central Government there has been a substantial decline in the primary deficit of the Government sector. For example, net prim ary deficit has declined by about 2 percentage points from the 1990-91 level and the average level for the latter half of 'eighties. It is pertinent, however, to note that the continuation of deficit in the prim ary balance is a matter of concern as the sustainability of the fiscal policy is seriously questioned.
Primary Revenue Balance: PRB1 and PRB2
In recent years and particularly during the first half of 'nineties the revenue deficit (RD) continued to increase and contributed increasingly to the gross fiscal deficit. It is, therefore, recognised that containing fiscal deficit and more importantly revenue deficit to a sustainable level is essential so that interest payments do not result in large scale pre-em ption of revenue receipts. In this context, there is a need not only to achieve a prim ary surplus derived from GFD but also a primary revenue
24

surplus derived from revenue deficit, which could be adequate enough to meet the entire interest obligations. The trends in PRB1 (revenue deficit minus interest payments) and PRB2 (revenue deficit minus net interest paym ents) for the Central, State and Government Sector are set out in Tables 18, 19 and 19A, respectively. It may be observed that the PRB1 and PRB2 relative to GDP have deteriorated for the Central, State and Government sector during the 'eighties. The deterioration in prim ary revenue balance d u ring the 'e igh ties has been reflected in the low er amount of primary revenue surplus which was not sufficient to absorb the interest payments. Analysis reveals that during the 'seventies, the PRB1 and PRB2 of all levels of Governm ent financed the entire interest expenditures (Table 2). D uring the latter half of the 'eighties, however, the extent of PRB1 financing interest payments deteriorated to the range of 23 to 50 per cent and PRB2 turned out to be negative in the range of 48 to 68 per cent in respect of Central Government. In the case of State Governments a surplus has been m aintained in both the cases (PRB1 and PRB2), however, the magnitude of surplus decelerated during the latter half of 'eighties and the same trend continued during the 'nineties so far (Table 2).
N et Fiscal Deficit
The concept of net fiscal deficit measures the borrowing requirem ents in the absence of the lending operation of the Government. The empirical results indicate that concomitant with the growth in gross fiscal deficit, the net fiscal deficit of the Central Governm ent also sustained sharp increases from 1.9 per cent during the 'seventies to 4.3 per cent in the 'eighties and 4.5 per cent during the 'nineties so far (Table 1 & Appendix Table 20). A similar trend has also been noticed in respect of State Governments (Table 1 and Appendix Table 21). The net fiscal deficit of the State Governments which remained below 1 per cent on an average during the 'seventies relative to GDP increased to around 1.35 per cent during the 'eighties. The underlying trend thus reflects that even after deducting expenditures on loans and advances the net fiscal deficit still continues to grow; this is an indication of larger borrowing requirements essentially to meet the committed expenditures particularly interest payments.
C entre's Deficit Before Transfers: RDBFT, CADFT and ODBFT
The net fiscal deficit of the Central Government reflects partly the issues relating to inter-Governmental transactions and its im pact on the budgetary balance as it does not cover the grants-in-aid to the State Governments. Given the magnitude of the problem, it is, however, important to examine the full impact of the inter-Gov- ernm ental transactions on the budget. This is more so, as there is an argum ent that inter-Governm ental transfers have contributed to the deterioration in the finances of the Central Government. Accordingly, Revenue Deficit Before Federal Transfers (RDBFT), Capital Account Deficit Before Federal Transfers (CADBFT), O verall D eficit Before Federal Transfers (ODBFT) have been designed in the present study to examine these issues.
25

The em pirical analysis reveals that the revenue account was in surp lus position before transfers to State Governments, during the period 1950-1980. Thereafter, the revenue account was in a deficit even before federal transfers (Table 4 and Appendix Table 22). It is pertinent to note that the surplus before federal transfers were not adequate enough to m eet the net transfers to the State G overnm ents. Thistrend indicates large provisions for the direct expenditures of the Central Government, the grow th of which was not com m ensurate w ith the grow th in revenues. Consequently, there was an elem ent of implicit borrow ing to meet these expenditures even during the period of revenue surplus. The position steadily deteriorated and the revenue account was in the 'red ' even before federal transfers. Thus, borrow ings w ere necessitated for all types of expenditures in the revenue account. The capital account w here loans and advances to States form the basic elem ent of transfers also show ed more or less same trend (Table 4 and A ppendix Table 23). In the capital account, how ever, the G overnm ent has large m anoeuverability in generating surplus through cut backs in capital expenditure. This aspect is quite visible in the m agnitude of generating surplus by compressing capital outlay. Notw ithstanding this m anoeuverability, it has not been possible to fully finance the capital transfer to the State Governments from the CADBFT. On account of relatively larger surplus in the capital account before transfer, the overall deficit before transfers (ODBFT) continued to rem ain surp lus ‘through the period of 'fifties to 'nineties so far (Table 4 and Appendix Table 24). However, these surpluses before transfer were lower than the am ount of transfers from Centre to States. The analysis thus reveals that it is not the resource flow from the Centre to States which is responsible for large budgetary gap of the former, rather it is the outcome of poorexpenditure m anagem ent given the stagnation on the revenue side.
State Resource GAP (SRG) and Basic Resource Gap (BRG)
SRG and BRG are the two deficits indicators exclusively m easuring the budgetary gap of the State Governm ents taking into account the inter-Governm ent transfers. The empirical findings reveal that States' Resources Gap, financed by non-statutory transfers from the Centre (such as non-statutory grants and loans) and Ways and Means Advances from RBI, as a proportion of States' expenditure (total expenditure minus in terest paym ents and repaym ents to Centre) which, on an average, was around 14 per cent in the 'seventies increased to over 18 per cent in the 'eighties (Table 5 and A ppendix Table 25). G iven the level of expenditure, this upw ard trend reflected steady rise in transfer of resources from Centre to the State Governments in the financing of SRG. This trend has reversed in the 'nineties with transfer of resources to States from the Centre show ing declining trend, an inevitable outcome of fiscal correction measures undertaken by the Centre. For instance, the SRG as a proportion to its expenditure during the period 1991-96, averaged 15.6 per cent as against 18.1 per cent in the latter half of the 'eighties, reflecting the steady deterioration in the resource transfers from the Centre (Table 5).
The BRG, on the other hand, m easures the fiscal requirem ents, fiscal dependency
26

and fiscal stress20, The fiscal requirements of the State Governments are reflected by the size of the expenditure which as a proportion to GDP, on an average, amounted to 17.2 per cent during the 'nineties (1990-96) as against 16.8 per cent during the 'eighties and 13.6 per cent during the 'seventies. Given the level of expenditure, fiscal dependency measured in terms of BRG1 (where the entire devolution and transfers from the Centre and capital receipts and market borrowings are treated as exogenous) showed deterioration from 58.7 per cent in the early 'seventies to 55.7 per cent in the 'eighties and further to 54.5 per cent in the 'nineties reflecting the reduced flow of resources from the Centre (Table 5 and Appendix Table 26). The fiscal dependency ratio measured by BRG2 (where excluding capital receipts, devolution and transfers from the Centre, and market borrowings are treated as exogenous), and BRG3 (where devolution and capital receipts are treated as endogenous while transfers from Centre and market borrowings as exogenous) also showed more or less the same trend indicating reduced flow of resources from the Centre (Appendix Table 27 and 28). This is also evident from the fiscal stress ratio (BRG3/BRG1) which on an average stood at 51 per cent both during the 'seventies and 'eighties and reduced by one percentage point to 50 per cent in the 'nineties (Table 5).
The observed trends in SRG and BRG taken together reveal two broad implications for the finances of the States: (a) there has been large reliance on exogenous sources of resources on which States do not have statutory control and (b) absence of perceptible improvement in States resources in relation to the growing expenditure requirements. Given the deceleration in the flow of resource transfers from the Centre because of the fiscal consolidation, the State Governments have to manage their budgets w ith less reliance on Central transfers. Therefore, the underlying solution to the problem is the not the large flow of resources from the Central Government but augmentation of States' resources and prioritisation of expenditure.
Structural and Cyclical Deficit and Government Fiscal Stance
In order to examine the origin of the fiscal deficit in India, the present study has estimated the structural and cyclical deficits using the OECD methodology. The estimation and empirical findings are set out in Technical Appendix 3. While estimating the structural and cyclical components of gross fiscal deficit the year 1977- 78 has been considered as the base year as the actual output in this year was close to the trend output. The calculations show that the growing fiscal deficit of the Central Government originated from large mismatch between receipts and expenditures as reflected in the higher expenditure elasticity (1.217) in relation to the revenue elasticity (1.088) [Table 6]. Besides, there are structural rigidities in the system which were reflected in the predominance of fiscal drag (Appendix Table 29). Consequently, the structural deficit which averaged around 4 percent during the 'seventies, increased to 7 per cent in the first half of the 'eighties and further to about 9 per cent during the latter half of the 'eighties with a peak level of 9.75 per cent in 1986-87 (Table 7 and Appendix Table 29); on account of the predomi-
27

nance of the structural deficit the impact of the cyclical deficit has been minimal. A similar exercise for the primary deficit (GFD minus net interest payments) has been set out in Table 30. It may, therefore, be noted that a move to a highergrowth scenario may not necessarily absorb the deficit.
Apart from estimating the structural and cyclical components, the study has evaluated the fiscal stance to examine whether Government policy is expansionary or contractionary. The estimation of fiscal stance and fiscal impulse for both the Central Government and the Government sector as a whole are presented in Appendix Table 31. Calculations reveal that the fiscal impulse for the Central Government during a larger part of the 'eighties was expansionary and during the reform period it has been mostly contractionary. A similar trend is also visible for the Government sector.
Operational Deficit
Analysis reveals that there has been a sharp fall in the operational deficit in relation to GDP in the recent past (Appendix Table 32). For example, operational deficit (derived from net interest payments) relative to GDP is placed at 2.7 per cent in 1996-97 as compared with 3.9 per cent in 1994-95 and about 4.5 per cent during the period 1991-95. This proportion was about 7 per cent in 1990-91 and around 7.5 per cent during the latter part bf the 'eighties. Given the near stagnation in the revenue receipts, sharp reduction in operational deficit im plies overcorrection of expenditures, particularly in the capital account. Thus, the presentstudy establishes the importance of operational deficit in Indian context which wasrejected by Joshi et al (1994) by stating that 'use of operational deficit would seem to have no merit7. The present study shows that the extent of reduction in the operational deficit which is sharper than the reduction in the GFD indicates that the Government resorted to the soft option of reducing capital expenditure in order to correct fiscal imbalances.
28

SECTION V
CONCLUDING OBSERVATIONS
With the resurgence of interest on budget deficit in recent years, a correct measurement of budget deficit has assumed crucial importance not only for assessing the stance of fiscal policy but also for the overall macroeconomic management. It has been widely recognised that no single indicator provides all information about the fiscal situation. Therefore, while evaluating the fiscal position of the Government it is instructive as well as interesting to look at a range of them to counter balance the shortcoming of each one. Accordingly, several measures of deficit are currently in use reflecting a paradigm shift from the traditional approach of single measure. It is, however, pertinent to note that there is a trade-off between simplicity and comprehensiveness while making a choice among the deficit indicators and the degree and intensity of the trade-off depends essentially on the purpose for which the deficit indicator is used.
Contemporaneous with world wide development alternative concepts of deficits have also been discussed in the Indian context. Much progress, however, has not been made in terms of their coverage and application. The present study is an attempt in this direction. A brief account of the major findings of the study is set out below.
The revenue account gap which broadly reveals the magnitude of the dissavings of the Government was kept within a surplus position till 1979-80 in respect of Central Government, while in respect of State Government this trend was maintained upto 1987-88 and for the Government sector as a whole till 1982-83. Thereafter, revenue deficit continued to show sharp deterioration and became endemic in the system. The study reveals that the levels of GFD relative to GDP were unsustainable during the 'eighties as there was large accumulation of debt which were incurred at a relatively high rate. The burden of debt has thus become a serious concern of the Government particularly in terms of large revenue outgo to finance burgeoning interest payments. The commitments in the budget for such high levels of interest payments have put pressure on the Government budget to allocate resources for income generating expenditure, particularly capital outlay. Apart from this, the persistently large size of GFD with a sizeable component of monetised deficit resulted in excess liquidity in the system which in turn has rendered difficult the attainment of the monetary policy objective of price stability. Analysis reveals that historically there has been a primary deficit (in all its variants) at all levels of Government which necessitated borrowings not only for the current operations but also for debt servicing of the Government. Furthermore, although primary revenue balance (revenue deficit minus interest payments) of Central, State and Government sector continued to remain in surplus the amount so generated showed sharp deterioration in the 'eighties and 'nineties so far and has not been sufficient enough to meet the interest obligations. This development seri
29

ously questions the sustainability of fiscal policy because one of the crucial precondition of having primary surplus which could meet the entire interest obligation is yet to be attained.
While tracing the origin of the fiscal deficit by decomposing it into structural and cyclical components, it was found that structural deficit predom inated the fiscal system because of large fiscal drag. The implication of this trend is that higher economic grow th by itself may not automatically reduce deficit. Furthermore, as revealed by the measure of fiscal stance and fiscal impulse, the Government pursued an expansionary fiscal policy during the 'eighties and mostly a contractionary fiscal policy during the 'nineties. Given the borrowing and taxation powers vested with the Centre there is a large element of dependence by the State Governments on the Centre for resources. Analysis in the study, however, reveals that although transfer of resources have their impact on the deficit position of each layer of the Government it is not the sole influencing factor. The analysis of deficit indicators before federal transfer in case of the Central Government and the deficit concepts SRG and BRG of the State Governments reveals that there is a large order of mismatch in the receipts and expenditures of both the levels of Government even without the inter-Governmental transactions. On account of the persistence of the mismatch in the receipts and expenditures of the Central Government there has been a compulsion to follow the soft option of over correcting the discretionary expenditures. This has been reflected in the sharp decline in the levels of operational deficit relative to GDP.
Taking into account the major findings of the Study discussed above some of the policy recommendations by way of concluding remarks are discussed in the following paragraphs.
It is suggested that while undertaking the fiscal consolidation the Government should not confine itself for targeting the levels of GFD alone. There is a need to examine the composition and financing of GFD. It is, therefore, imperative that policy initiative should be undertaken not only to bring down the level of revenue deficit to 'zero ' but also to contain the system of m onetisation of GFD at the desired level.
In addition to the containm ent of GFD and its m onetisation, it should be the endeavour of the Government during the medium-term to generate adequate surplus in the overall account as well as in the revenue account of the primary balance to ensure sustainability in the fiscal policy. While undertaking policy initiatives to achieve primary surplus the structural rigidities in the revenue side need to be corrected along with expenditure moderation. Any expenditure correction without removing the structural rigidities would be counter productive because of large fiscal drag. The study, therefore, suggests further strengthening of the fiscal reform measures in the taxation which would dampen the burgeoning fiscal drag. In this context augmentation of revenue assumes crucial importance rather than
30

across-the-board cut backs in expenditure as this would lead "to overcorrection of expenditure which has been evident at present. From the point of view of public policy as well as liquidity management the study strongly recommends the concept of public sector borrowing requirement (PSBR) as gross fiscal deficit (GFD) has the limitation of not capturing the budgetary impact of the entire public sector. Given the fiscal consolidation of the Central Government it is recommended that the fiscal federalism issues are required to be examined in the context of deficit indicators developed in this study. This exercise will be helpful in identifying the areas of expenditure management and resource augmentation.
In the context of the conduct of monetary policy, emphasis should be given to assessment of fiscal deficit and monetisation of fiscal deficit. The Union budget for 1997-98 recognised this issue and the am ount of monetisation was indicated therein. However, in the subsequent budget of the Central Government the figure was not reported. In the interest of smooth conduct of monetary policy it is suggested that the Union Budget should continue to publish the monetisation of fiscal deficit and all efforts should be made to adhere to the budgeted figure.
The Public Sector Borrowing Requirements (PSBR) and Quasi-fiscal Deficit (QFD) have gained prominence in recent years. This aspect has also been recognised by the Reserve Bank of India in its Annual Report for 1995-96 as mentioned earlier. However, the present study has not fully developed this concept as there is difficulty in getting data on Central and State Public Sector Undertakings (PSUs). Nevertheless, it is imperative that Government of India and Reserve Bank of India and also the Planning Commission should independently or jointly make efforts to develop and analyse this concept. At least from the financial angle, from the liquidity point of view, the concept of PSBR should be developed by the Reserve Bank and G overnm ent of India. Though the im portance of QFD has been recognised by the Reserve Bank in its Annual Report (1996-97), there has been no study to empirically measure this concept. The study therefore, recommends that RBI should undertake such a study in its Development Research Group.
31

Notes
1. The budgetary system followed by various countries may be classified as (i) British budgetary and accounting system, (b) French budgetary and accounting system (c) US budgetary and accounting system and (d) Latin American budgetary and accounting system. For a detailed discussion of the British system, see Brittain (1960), Premchand (1966 and 1983) and Diamond et al (1986); for French system, see Diamond et al(1986); for US system, see United Nations (1952) and for Latin American system, see United Nations (1965).
2. According to Blejer and Cheasty (1991) under the Government debt criterion the deficit equals the difference between total public debt outstanding at the beginning and at the end of the year; whereas under the public policy criterion the budgetary transactions are deficit determining and are classified as revenue and expenditure instead of financing. Furthermore, the Government debt criterion is advantageous for liquidity management whereas the public policy criterion is useful for public policy.
3. The two main international sources of budget statistics - IMF and the UN - differ in their treatment of net lending; the former showing it above the line, for policy reasons, and the latter classifying it as a financing item.
4. The Government debt criterion includes external grants with other Government revenues, whereas under public policy criterion grants are added to items under foreign financing as 'below the line' item.
5. Public policy criterion suggests the inclusion of amortisation as 'above the line' item and the corresponding deficit would be Government's gross borrowing requirements.
6. Cash deficit is based on the Government expenditure for which cash has been disbursed during the fiscal year and actual cash revenues received. Accrual deficit on the other hand attempts to capture the actual net resource pre-emption of the Government regardless of whether or not transactions have actually been paid for.
7. 'Arrears' may be on the expenditure as well as on the receipts side. Expenditure arrears indicate delays in a Government's payments to its suppliers and creditors, Revenue arrears to the Government indicate the case of tax levied but not collected and loan repayments which are due to the Government.
8. The criterion used in IMF (1986) to distinguish between General Government and non-finan- cial public enterprises is neither legal nor institutional; it is rather the nature of the activities they perform. While drawing the operational distinction between 'public' and 'private' a common criterion is the simple ownership principle which states that any enterprise is considered 'public' if direct and indirect Government participation in its equity exceeds 50 per cent.
9. The Constitution of India provides respective taxation powers for the Central and State Governments and also the provisions for tax sharing from Centre to States. Under Article 270 of the Constitution, the net proceeds of taxes on income other than corporation tax and those on agricultural income and under Article 272 net proceeds of Union Excise Duties are to be distributed between the Unions and the States. For more details see Bagchi et al (1992). Article 292 and 293 of the Constitution of India vested the borrowing powers with the Central and State Government respectively. Constitutionally the State Government can borrow only within the territory of India.
10. The fiscal balance sheet shown in this Study is for illustrative purpose only. Most of the items in the fiscal balance sheet are common to Central and State Governments. There are,
32

however, some differences in the budgetary transactions. For example, external grants are applicable only for Central Government. In respect of State Governments, after transfers from the Central Government, grants-in-aid is shown as a non-tax receipt item. Loans and advances from Central Government is shown as part of the capital receipts of the State Governments.
11. The sources of financing of conventional budgetary deficit differ with the type of Government. In case of the Central Government, the budgetary deficit was financed by running down of Government's cash balances with the Reserve Bank and/or borrowing from the Reserve Bank through the issue of ad hoc Treasury bills and other 91-day Treasury bills which may be on tap, auction or rediscounted. The normal cash balance which the Central Government is stipulated to maintain with the RBI is a minimum of Rs.50 crore. When the deficit is more than the cash balances, the Government resorts to borrowing from RBI by issuing ad hoc Treasury bills. This system has been discontinued with effect from the fiscal year 1997-98 and replaced with a system of Ways and Means Advances (WMA) with the signing of an Agreement by the Government of India and the Reserve Bank. Under this Agreement the temporary mismatches between the Centre's receipts and expenditures would be met through Ways and Means Advances which would have to be vacated within the stipulated period. In respect of the State Government, the overall deficit is financed by drawing down the Government's cash balances and/or Ways and Means Advances (WMA) from Reserve Bank of India.
12. The gross fiscal deficit (GFD), in the Government of India budget document, is termed as fiscal deficit in its abbreviated form and is defined as the excess of aggregate expenditure (revenue and capital) over revenue receipts (including grants and non-debt capital receipts). The non-debt capital receipts include recoveries of loans and advances by the Government and disinvestment proceeds.
13. Report of the Committee to Review the Working of the Monetary System, RBI, 1985, pg.152 and Economic Survey (1986-87), Government of India, pg. 86-87.
14. The economic classification of the Central Government budget, involves assessing the expenditures and receipts of the Central Government including those of Railways and Posts and Telecommunications by significant economic categories adopting the methodology used in the national accounting system. Such classification facilitates a meaningful understanding of the economic impact of the Centre's budgetaiy operations. Under economic classification, budgetary transactions are broadly categorised into Central Government final outlays, capital formation out of budgetary resources, savings of the Central Government and income generation by the Central Government. The functional classification of the Central Government budget integrates the budgetary outlay with Plan outlay. This classification broadly divides the budgetary transactions into developmental and non-developmental expenditures which help in analysing how much Central Government is allocating to different functions or purposes in accordance with the priorities laid down in the Plan. The Government of India has been preparing an economic classification and economic and functional classification of the budget since 1957-58 and 1967-68, respectively.
15. According to IMF (1986) liquidity balance may be defined as Government borrowings from the banking system and drawing down of the Government's domestic cash balances. This concept can be adjusted to measure Government impact on the money supply by adding profits received from the Central bank, less Government interest payments to the banking system, plus any Government sale of foreign exchange to the banking system (reflecting the excess of Government receipts from abroad, including the drawing down of foreign assets over Government expenditure abroad). To measure Government impact only on 'high powered' or reserve money, which provides the base for monetary expansion, Government im
33

pact on the money supply is adjusted to include Government financing from deposit money banks (IMF, 1986). In the present study, the liquidity balance concept worked out is to measure the money supply impact of government deficit (IMF, 1986).
16. For definitional and methodological aspects of States Resource Gap (SRG), see article on "Finances of State Governments: 1995-96", Reserve Bank of India Bulletin, December 1995. For detailed discussions on Basic Resource Gap (BRG), see "Resource Gap of the State Governments, Measurement and Analysis," Pattnaik et al, (1994).
17. For detailed reference with regard to revised classification in 1974-75 and 1986-87, see Finances of Government of India, Published in May 1974 issue of RBI Bulletin and Budget documents of 1986-87 and 1987-88, respectively.
18. Conventional deficit for the period 1950-1956 has been adjusted to the present practice of taking 91-day Treasury bills as financing item and not as an item of capital receipts. The miscellaneous receipts (i.e. transfer of cash between England and India) which have been shown as a separate item for fiscal year 1950 through 1965 are adjusted under capital receipts. In conformity with latest budgetary practice discharge of internal and external debt are netted out both from receipts and expenditure. Following the recommendations of the 'Second Report of the Team of Reforms in the Structure of Budget and Accounts', the figures shown under permanent debt, financing debt and other unfunded debt have been replaced with market loans, Treasury bills and Provident Funds. According to the latest budgetary account- ing practice (following the classification changes in 1986-87) in the revenue side, the major departure is the netting out of the receipts of commercial departments from its expenditures. A consistent time series data on this line are available for the period 1979-1997. For earlier years, to the extent detailed data are available in Finance Accounts of Government of India, the commercial department figures have been netted out. Thus, the revenue receipts and revenue expenditure figures are not same as the earlier published figures for the years 1951- 1978. Similarly, in the capital account, certain entries in the form of repayments are netted out. The details of the securities issued to IMF is only available for the period 1979-1997. Since for the earlier years the information on securities issued to IMF is not separately available it has not been netted out from the capital expenditure and capital receipts. This item for the year 1950-1978 has remained as a part of capital expenditure and also a part of GFD. Following the latest budgetary practice external grants have been taken as receipts item under revenue receipts.
19. Capital expenditure is self-limiting because the expenditure ceases once the asset is created. It is self-financing because the productive asset is expected to create a stream of income which will liquidate the expenditure incurred (Vithal, 1996).
20. See Pattnaik et al (1994) for definitional aspects of fiscal requirements, fiscal dependency and fiscal stress.
34

References
1. Alesina, Alberto and Roberto Perotti (1995), The Political Economy of Budget Deficit', IMF Staff Papers, Vol 42, No.l, March.
2. Anand, R and Van Wijnbergen, S (1988), 'Inflation and the Financing of Government Expenditure: An Introductory Analysis with an Application to Turkey', The World Bank Economic Review, Vol.3, No.l (January).
3. Bagchi, Amaresh and Tapas Sen (1992) 'Budgetary Trends in Plan Financing in the States', State Finances in India, Amaresh Bagchi, I.C. Bajaj and William A Byrd (Eds.) NIPFP.
4. Barro, Robert J. (1989), The Ricardian Approach to Budget Deficit', Journal of Economic Perspective, Vol.3, No.2, Spring.
5. Bernheim, B. Douglas (1989), 'A Neoclassical Perspective on Budget Deficit', Journal of Economic Perspective, Vol.3, No.2, Spring.
6. Blanchard, Oliver (1990), The Sustainability of Fiscal Policy: New Answer to Old Questions', OECD Economic Studies No.15.
7. Blejer, Mario I and Adrienne Cheasty (1993), How to Measure the Fiscal Deficit, International Monetary Fund.
8. Blejer, Mario I. and Ke-Young Chu,(1988) Measurement of Fiscal Impact: Methodological Issues, International Monetary Fund, Occasional Paper, No.59, June.
9. Blinder, Alan S and Robert M, Solow, (1974), 'Analytical Foundations of Fiscal Policy' in The Economics of Public Finance (Eds.) by Alan S. Blinder et al. Washington, Brookings Institution.
10. Boskin, Michael J. (1986) 'Federal Government Deficit: Some Myths and Realities' The American Economic Review, Vol. 72 No.2, May.
11. Brittain, H. (1960), The British Budgetary System, London: Allen and Unwin.
12. Brown, Cary E. (1956), 'Fiscal Policy in the Thirties: A Reappraisal', American Economic Review, Vol.46, December.
13. Buiter, Willem H.(1983), 'Measurement of Public Sector Deficit and it implications for Policy Evaluation and Design', IMF Staff Papers, Vol. 30 No.2 June.
14. Buiter, Willem H. and Urjit K. Patel (1992), 'Debt, Deficits and Inflation: An Application to the Public Finance of India', Journal of Public Economics, No.47.
15. ______ (1985), 'Guide to Public Sector Debt and Deficit', Economy Policy, November.
16. _______ (1977), 'Summary Measures of Fiscal Influence', IMF Staff Papers, Vol. 24, No.2 July.
17. Chelliah, Raja J (1973), 'Significance of Alternative Concepts of Budget Deficit', IMF Staff Papers, November 20(3), p. 741-84.
18 . _________ (1991), 'The Growth of Indian Public debt - Dimension of the Problem andCorrective Measures', IMF Working Paper, No.WP/91-72.
35

19. Diamond, Jack and Christian Schiller (1983), 'Government Arrears in Fiscal Adjustment Programme', Measurement of Fiscal Impact: Methodological Issues, Occasional Paper 59, Mario I Blejer and Ke-young Chu (Eds.), IMF, June.
20. Diamond, Jack and Christian Schiller (1993), 'Government Arrears in Fiscal Adjustment Programme', in How to Measure the Fiscal Deficit, Blejer and Cheasty, IMF.
21. Easterly, William and Klaus Schmidt-Hebbel (1991), 'The Macroeconomics of Public sector Deficits', World Bank Working Paper, October.
22. Eisner, Robert and Paul J.Piper (1984) 'A New View of the Federal Debt and BudgetDeficit' The American Economic Review, Vol.4, No.l March.
23. Eisner, Robert (1988) 'Deficit, Monetary Policy and Real Economic Activity' in The Economics of Public Debt, Kenneth Arrow and Micheal Boskin (Eds), The Macmillun Press.
24. Eisner, Robert (1989), 'Budget Deficit: Rhetoric and Reality', Journal of Economic Prospective, Vol. 3 No.2, Spring.
25. Gill, K.S., (1991), 'Budget Deficit of the Central Government', Economic and Political Weekly, Vol. 25 Nos. 1 and 2 January 5-12.
26. Gramlich, Edward M. (1966), The Behavior and Adequacy of United States Federal Budget,1952-1964', Yale Economic Essays, Vol.6, Spring.
27. Government of India, The Economic Survey - various issues.
28. Gulati, IS, (1991), 'Reducing the Fiscal Deficit: Soft and Hard Options', Economic and Political Weekly, July 20.
29. _______ (1994), 'Calculating the Fiscal Deficit: A note on Certain Capital Receipts', Economicand Political Weekly, Vol. XXIX No.21, May 21.
30. Hansen, Bent (1969), 'Fiscal Policy in Seven Countries 1955-66'. Organization for Economic Co-operation and Development (OECD), Paris.
31. Heller, Peter.S, Richard D, Hass and Ahsan S. Mansur (Eds), (1986), 'A Review of the Fiscal Impulse Measure', IMF Occasional Paper, No.44, May.
32. Heller, Walter (1967), New Dimension of Political Economy, New York.
33. International Monetary Fund (1986), A Manual on Government Finance Statistics.
34. Joshi, Vijay and IMD Little (1994), India: Macroeconomics and Political Economy 1964-1991, Oxford University Press.
35. Kotlikoff, Laurence J. (1984), 'Economic Impact of Deficit Financing', IMF Staff Papers, Vol. 31, September.
36. ______ (1986), 'Deficit Delusion', The Public Interest, No.84, Summer.
37. Khundrakpam, J.K. (1996), 'Alternate Measures of Deficit and Inflation Impact' Reserve Bank of India Occasional Papers, March.
36

38. Leviatan, Oded (1993), The Cash Deficit: Rationale and Limitations' in How to Measure TheFiscal Deficit, Blejer Mario I. and Adrienne Cheasty (Eds.).
39. Levin, Jonathan (1993), The Cash Deficit: Rationale and Limitations' How to Measure theFiscal Deficit, by Blejer Mario I. and Adrienne Cheasty (Eds.), IMF.
40. Leibfritz, Willi, Deborah Roseveave and Paul Vanden Noord (1994), 'Fiscal Policy, Government Debt and Economic Performance', Organisation for Economic Co-operation and Development (OECD) - Economic Department Working Papers No.144.
41. Mackenzie, G.A. (1989), 'Are All Summary Indicators of the Stance of Fiscal Policy Misleading?', IMF Staff Papers, Volume 36, December.
42. Mansoor Ali M., (1988), 'The Budgetary Impact of Privatisation', Measurement of Fiscal Impact: Methodological Issues, Occasional Paper 59, IMF, June.
43. ______ (1991), 'The Measurement of Fiscal Deficit: Analytical and Methodological Issues',Journal of Economic Literature, December.
44. _______ (1993), 'Budgeting Impact of Privatisation' in How to Measure the Fiscal Deficit,(Eds.) Blejer Mario I. and Andrienne Cheasty (Eds.), International Monetary Fund.
45. Mody, R.J.,(1992), 'Fiscal Deficit and Stabilisation Policy', Economic and Political Weekly, February 15.
46. ______ (1994) 'Calculating the Fiscal Deficit', Economic and Political Weekly, September 17.
47. Musgrave, Richard, A (1989) Public Finance in Theory and Practice, New York.
48. Noord, Paul Van den (1993), 'Estimating the Structural Component of General Government Balance: A Sensitivity Analysis', OECD WL/tg 93.31.
49. Oakland, William H. (1969), 'Budgetary Measures of Fiscal Performance', Southern Economic Journal, Vol.35.
50. Pattnaik, R.K., R.D. Bangar, S.M. Pillai and Rekha Sharma (1994), 'Resource Gap of StateGovernments: Measurement and Analysis', Reserve Bank of India Occasional Papers,December.
51. Premchand, A. (1993) Public Expenditure Management, IMF.
52. Rangarajan C., Anupam Basu and Narendra Jadhav (1989), 'Dynamics of Interaction BetweenGovernment Deficit and Domestic Debt in India', Reserve Bank of India Occasional Papers, Vol.10, No.3, September.
53. Reserve Bank of India, 'Annual Report7 - various issues;
54. ______ 'Finances of Central Governments', RBI Bulletin - various issues.
55. ______ 'Finances of State Governments', RBI Bulletin - various issues.
56. ______ (1985), Report of the Committee to Review the Working of the Monetary System.
57. ______ Report on Currency and Finance, - various issues.
37

58. Robinson, David J. and Peter Stella (1993), 'Amalgamating Central Bank and Fiscal Deficit7 in 'How to Measure Fiscal Deficit', Mario I., Blejer and Adrienne Cheasty (Eds.),IMF.
59. Rocha, Roberto and Fernando Saldana (1992), 'Fiscal and Quasi-Fiscal Deficits, Nominal and Real: Measurement and Policy Issues'. World Bank Working Paper, WPS 919, June.
60. Seshan A (1987), T he Burden of Domestic Public Debt in India', Reserve Bank of India Occasional Paper, Vol. 8, N o.l, June.
61. Subbarao, D (1994), 'Calculating the Fiscal Deficit', Economic and Political Weekly, August27.
62. Tanzi, Vito; Mario I. Blejer and Mario O. Teijeiro (1993), 'Effects of Inflation on Measurement of Fiscal Deficit: Conventional Versus Operational Measures' in How to Measure the Fiscal Deficit, Mario I Blejer and Adrienne Cheasty (Eds.), IMF.
63. United Nations, (1952), Government Accounting and Budget Execution (New York).
64. _______ (1965a), Latin America's Experience in the use of the Public Sector Budget as anInstrument of Development Planning (Mimeograph, Copenhagen, 1965 and 1965b), A Manual for Programme and Performance Budgeting, New York.
65. ________ (1965b), A Manual for Programme and Performance Budgeting, New York.
66. Vithal, B.P.R. (1996), 'Debt Servicing and Budgetary Structure', Economic and Political Weekly, February 10.
67. World Bank (1988), World Development Report.
38

Technical Appendix 1
A. Cyclically Neutral Balance (CNB), Fiscal Stance and Fiscal Impulse IMF Methodology
The IMF measure of fiscal stance has been designed to work out the cyclically neutral budget (CNB). This measure has also the advantage of assessing whetherfiscal stance is expansionary or contractionary. Following the methodology set outby Heller et al (1986) the basic algebra to derive the fiscal impulse in Indian context is explained below:
B = <ro Y? - goYP) - K or - Y>1 - Fis ........................................................................ (i)where, B = Gross Fiscal Deficit (GFD)r0 = R0/Y0 = The ratio of GFD receipts ( ly to GDP (YJ of the base yearg0 = G0/Y0 = The ratio of GFD expenditure ([G„) to GDP (Y0) of the base yearR0 and G0 corresponds to the receipts and expenditures of GFD Yp = Nominal potential output Y = Nominal actual output FIS = Measure of fiscal stance
Thus, the Gross Fiscal Deficit (GFD) can be decomposed into three elements viz.,
(a) [r0Yp - g0Yp] = Base year surplus(b) [r0 (Yp - Y)] = Cyclical component and(c) FIS = Fiscal stance.
The item (a) and (b) may be merged together to define the cyclically neutral budget (CNB)
Eq. (1) may be rewritten asB = (r0Y - g0Yp) - FIS = Bn - FIS .................................................................. (2)where, Bn is the cyclically neutral budget.FIS may be worked out as the difference between Bn and B.Fiscal impulse (FI) may be worked out as the first difference of FISi.e. FI = AFIS = (AG - g0AYp) - (AR - r AY) = - A B - g0AYp + r0AY... (3)
If AFIS < 0, the fiscal stance is contractionary and if AFIS > 0 the fiscal stance is expansionary.
The IMF methodology discussed above is based on the following assumptions: (1) The base year is chosen to be a period when actual and potential output in real terms are assumed to be roughly equivalent; while calculating the potential output, trend output has been taken as a proxy, (2) Nominal tax revenues are unit elastic with respect to actual nominal income; and (3) Government expenditures are unit elastic with respect to potential output at current prices. Thus, Government expen
39

diture is termed cyclically neutral if it increases proportionately w ith increases in nominal potential output.
The cyclically neutral budget is calculated under the unitary elasticities of expenditure and revenue with respect to potential and actual output respectively, not because the assumption is realistic but because defining the cyclically adjusted budget in this fashion has the effect of allocating the contribution of automatic stabilizers to the fiscal impulse.
A principal advantage of this approach is the simplicity of estimation. There are, however, certain limitations which are to be noted. For example, the elasticities of revenue and expenditure are em pirical m atters and are not equal to 'un ity ' in most countries. Furthermore, the fiscal impulse will not only include the effect of changes in fiscal policy and the subsequent effect of automatic stabilisers but also the effect of structural changes in the economy.
B. Structural and Cyclical Deficit: OECD M ethodology
The OECD methodology makes a distinction between discretionary budget changes and built-in-stability as a prelude to define structural budget balance operationally. The built-in stabilizer component of the budget balance is self-cancelling in nature as the revenues w ould automatically rise as the economy moves to higher growth path. This is also otherwise known as the cyclical component of the Government's budgetary balance which is taken as the difference between receipts and expenditures that would result solely on account of deviation of actual output from potential ou tpu t of a year. The rem aining part of the budgetary balance is structural which takes into account, inter alia, the effects of discretionary policy actions as well as the responsiveness of Government's budgetary transactions to the change in potential output. Thus, the structural deficit persists even if the economy moves to a higher growth path. The methodology to decompose budget deficit into its cyclical and structural component has been set out by Price and Miller (1984). Following their basic algebra the estimation procedure in a simplified way in the Indian context is presented below:
Estim ation Procedure
The following steps are involved while working out the structural deficit.
S tep 1: Choice of Deficit Indicators. In the p resen t s tudy G ross Fiscal Deficit (GFD) and Primary Deficit (PD), defined as GFD minus net interest payments, are considered.
Step 2: Estimation of potential output. In the present study GDP at current m arket prices is taken as the actual ou tpu t (Yt) and the trend ou tpu t (Yt ) is considered as the potential output. The basic equation in this respect is:
40
Log GDP = ax + bjt (4)
Step 3: Estimation of revenue and expenditure elasticity with respect to output. In the present study these elasticities are estimated for GFD and PD. The relevantequations for these estimates are set out below:
Expenditure Elasticity (EgY)log GFDE = a2 + b2 log GDP .................................................................................. (5)
log PDE = a3 + b3 log GDP ...................................................................................... (6)
The coefficients b2 and b3 are ex p en d itu re e lastic ities for GFD and PD, respectively.
Revenue Elasticity (E Y)
log GFDR = a4 + b4 log GDP ................................................................................... (7)
log PDR = a5 + b. log GDP ...................................................................................... (8)
The coefficients b4 and b5 are revenue elasticities for GFD and PD, respectively.
Step 4: Choice of base year. Base year is an important variable in the calculation of structural deficit since the base year balance is a part of structural balance along with discretionary policy action and fiscal drag. In this study base year is calculated as that year when the relative difference between the real actual GDP(RGDP) and real potential GDP (PRGDP) is zero or near zero.
Thus, Base year Yo = RGDP - PRGDP ........................ .............................................. (9)
Step 5: Estimation of base year receipts (Ro), base year expenditure (Go) and baseyear Balance (A).Thus, A = Go- RoIn this study R = GFDR and PDR and G = GFDE and PDE .J o o o o o o
Step 6: Having worked out the base year balance (A) the next step is to work out the discretionary policy action. The balance arising out of\discretionary policy action (B) is the difference between discretionary policy induced revenues andexpenditureB = (Gdt - Rdt) ......... ............................................................................................. (10)The relevant equations to derive Gdt and Rdt are presented as
vGdt = Gt - Gat................................................................................................................ (11)and Rdt = Rt - Ral ...................................................................................................... (12)where, Gt and Rt are the actual expenditure and receipts of the chosen deficit indicators i.e. expenditure and receipts of GFD and PD, Gat and Rat are expenditure
41

and receipts of deficit indicators which are responsive to change in output (Y).
Thus, Gat = G0 + g0. E Y(Yt-Y0) .............................................................................. (13)and Rat =Rq + r0. EY (Yt - Y0) ............................................................................... (14)where, g0 = G0/Y and r0 = R0/Y.
Step 7: Next step is the estimation of fiscal drag (K) which is the product of potential change in output (F) and the built-in-budget balance (C). Taking the potential (trend) level of output (Yt‘) in year 't' as worked out in Step 2 and assuming 'r' to be exponential rate of growth (ert) of the trend output (Yt‘), the potential change in output may be measured as:
Yt - Y0 = (Yt - Yt) + (Y; - Y0) ................................................................... ... (15)Yt - Y0 = (Y0 ert - Y0) ...................................................................................... (16)Thus F = Y0 (ert - 1) .......................... ............................................................ (17)
The built-in-budget balance (C) is the result of the passive policy which holds the tax rates and expenditure programmes unchanged. The estimation of 'C' is done as follows:
C = (g0.E Y - r0.E Y) ......................................................................................... (18)Thus fiscal drag K = C.F ............................................................................. (19)= [(g,EgY) - (r0.EY)] [Y0(ert - 1)].................................................................... (20)
The discussions on fiscal drag are set out in detail in Heller (1967) and Musgrave (1989); The equation for structural balance (SD) may be written as:
SD = A + B + K= (G0 - R0) + (G d t- Rdt) + [(g0.E Y) - (r0. EY)]. [Y0 (ert- 1)].......... (21)
The cyclical balance (CD) built-in-stabiliser may be worked out as follows:
Kg0.E Y) - (r0.E Y)]. (Y,- Y)1 ............................................................................. (22)
The estimation of structural balance is, however, surrounded by large margins of uncertainty (Noord 1993). This is because of limitations in projecting actual output, estimating the size and future growth of potential output and the degree to which elimination of the output gap would translate into enhanced tax revenues and reduced expenditure.
42

Technical Appendix 2
Methodology to work out the Combined Gross Fiscal Deficit of the Centre and States
Conceptually the combined gross Fiscal Deficit (GFD) of the Centre and States may be defined as the summation of combined revenue deficit, combined capital outlay and combined net lending. The calculation of combined GFD as well as financing of the same are set out below.
Step 1: Combined Tax Revenue (i + ii)
(i) Gross Tax Receipts of the Centre as per Central Budget Documents.
(ii) States' Own Tax Revenue (i.e. Total Tax Revenue of the States minus States' share in Central Taxes as reported in the Central Budget Documents).
Step 2: Combined Non-Tax Revenue (i + ii)
(i) Centre's, non-tax revenue minus interest receipts from the States as reported in the Union Government Finance Accounts/Central Budget Documents.
(ii) States' non-tax revenue excluding grants received from Centre.
Step 3: Combined Revenue Receipts (Step 1 + Step 2)
Step 4: Combined Revenue Expenditure (i + ii)
(i) Centre's revenue expenditure minus Centre's grants to States.
(ii) States' revenue expenditure minus interest payments to Centre (i.e. interest receipts from the States as reported in the U nion G overnm ent Finance Accounts/Central Budget Documents).
Step 5: Combined Revenue Deficit (Step 4 - Step 3)
Step 6: Combined Capital Outlay (i + ii)
(i) Capital outlay of the Centre
(ii) Capital outlay of the States
Step 7: Combined Loans and Advances (i + ii)
(i) Total Loans and Advances by Centre minus Loans and Advances to States
43
(ii) Total Loans and Advances by the States
Step 8: Combined Recovery of Loans
(i) Total Recovery of Loans by Centre minus Recovery of Loans from States as reported in Central Budget Documents.
(ii) Recovery of Loans by States.
Step 9: Combined Net Lending (Step 7 - Step 8)
Step 10: Combined GFD (Step 5 + Step 6 - Step 9)
Step 11: Financing of Combined GFD (i+ii+iii)
(i) Total C ap ita l R eceipts of the C entre minus [Recovery of Loans + Disinvestment of equity holdings of Public Sector Enterprises, if any].
(ii) Capital Receipts of the States minus [Discharge of Internal Debt + Repayments of Loans to Centre + Recovery of Loans and Advances + Remittances (net)] minus [Loans and Advances by Centre to States - Recovery of Loans from States as reported in the Central Budget Documents].
(iii) Combined Conventional Deficit of Centre and States.
Combined Primary Deficit and Net Primary Deficit
Once the combined GFD is worked out Primary Deficit (PD) and N et Primary Deficit (NPD) may be worked out as follows:
Combined PD1 = Combined GFD minus Combined Interest Payments.
Combined Interest Payments = Interest Payments of the Centre plus Interest Payments of the States minus Interest Payments of the States to Centre.
Combined PD2 = Combined GFD minus Combined Net Interest Payments.
Combined Net Interest payments = Net Interest Payments of the Centre plus Net Interest Payments of States.
Net Primary Deficit = Net Primary Deficit of Centre plus Net Primary Deficit of States.
44

Technical A ppendix 3
Regression Results
I. Selection of Base Year
LRGDP = 11.3340 + 0.0458 t ...................................................................................... (1)(633.39) (43.31)
R2= 0.9868
Where : RGDPP = Log values of Real GDP
The difference between the actual and fitted values was observed to be the minimum in the year 1977-78. Hence 1977-78 has been taken as the base year (t^.
II. Estimation of Potential GDP (Yt ) O utput[Step (2) in Technical Appendix 1]
LNGDP = 10.1724 + 0.1372 t ...................................................................................... (2)(80.20) (24.28)
DW = 1.41 R2= 0.9958 SE = 0.0428
The trend output is taken as the potential output.
III. Estimation of Income Elasticity of Expenditure (EgY)[Step 3 in Technical Appendix 1]
(a) Central Governm ent (Fiscal Deficit)
1. LGFDE = - 4.4563 + 1.2174 LNGDP - 0.3242D ................................................ (3)(-16.77) (54.48) (- 5.95)
DW = 1.4076 R2 = 0.9958 SE = 0.0786
D = Dum m y variable applied for the period 1991-97 to capture the im pact of fiscal reform measures.
2. LGFDE = -1.3952 + 0.4092 LNGDP + 0.6638 LGFDE (-1) -0.1364 D ..... (4)(-2.24) (2.57) (5.06) (-2.59)
SE = 0.0563 R2 = 0.9979 Durbin's h = - 1.67
45

LGFDE (-1) indicates one year lag of the dependent variable to estimate the Long- run Elasticity.
The formula used to estimate the Long run GFD Expenditure Elasticity is
LEE = [ d , / ( l - d 2)] ................................................................................ (5)
where d, = Beta Coefficient of LNGDP, d 2 = Beta Coefficient of LGFDE (-1)
Long Run Expenditure Elasticity based on equation (4)
LGFDE = 1.217 .............................. ................................................................................... (6)
(b) Primary Deficit (PD)
1. LPDE = -4.1113 + 1.1753 LNGDP - 0.4217 D ............................................... (7)(-13.45) (45.72) (-6.73)
DW = 1.3492 SE = 0.0904 RJ = 0.9937
2. LPDE = -1.2327 + 0.3952 LNGDP + 0.6585 LPDE(-l) -0.1714 D ............... (8)(-2.11) (2.58) (5.02) (-2.67)
SE = 0.0627 R2 = 0.9970 D urbin 's h = - 0.86
3. Long Run Expenditure Elasticity of prim ary deficit based on equation (7)
LPDE = 1.1572 .................................................................................................. ................. (9)
(c) Government Sector (GSBR).
1. LGSBRE = 3.6563 + 1.1992 LNGDP -0.2236................................................... (10)(-17.86) (69.65) (-5.27)
DW = 1.2955 SE = 0.0601 R2 = 0.9974
LGSBRE = Log value of GSBR Expenditure
2. LGSNRE =-0.6148 + 0.2353 LNGDP + 0.8054 LGSBRE (-1) -0.0675D......... (11)(-1.43) (1.78) (7.26) (-2.23)
SE = 0.0339 R2 = 0.9991 Durbin's h = -0.064
46

Long Run Expenditure Elasticity of Government Sector based on equation 9(a)
LGSBR = 1.2091 ............................................................................................................ (12)
IV. Estimation of Income Elasticity of Receipts (E Y)[Step 3 in Technical Appendix 1]
(a) Central Government (Fiscal Deficit)
1. LGFDR = -3.6201 + 1.1089 LNGDP -0.1328 D ...................................................... (13)(-15.88) (57.83) (-2.84)
DW = 1.4364 SE = 0.0674 R2 = 0.9966
LGFDR = Log values of GFD Receipts.
2. LGFDR = -1.6946 + 0.5690 LNGDP + 0.4772 LGFDR (-1) -0.0519D ......... (14)(-3.10) (3.66) (3.37) (-1.22)
SE = 0.53922 R2 = 0.9978 Durbin's h = -0.8091
Long Run Elasticity of Receipts based on equation 8(a)
LGFDR = 1.0884 ................................. ................................................................... (15)
(b) Central Government (Primary Deficit)
1. LPDR = -3.620 + 1.1090 LNGDP -0.1328 D ...................................................... (16)(-15.88) (57.83) (02.84)
DW = 1.44 SE = 0.0674 R2 = 0.9966
2. LPDR = -1.7006 + 0.5694 LNGDP + 0.4774 LPDR(-l) -0.0520 D ................ (17)(-3.06) (3.55) (3.25) (-1.21)
SE = 0.0541 R2 = 0.9978 Durbin's h = -0.8462
Long Run Elasticity of receipts of primary deficit based on equation
LPDR = 1.0895 ......................................................................................................... (18)
47

(c) Government Sector (GSBR) Elasticity of Receipts
1. LGSBRR = -3.2424 + 1.1408 LGDP -0.1342 ................................................. (19)(-15.79) (66.03) (-3.15)
DW = 1.2239 SE = 0.0604 R2 = 0.9972
2. LGSBRR = -0.7153 + 0.3117 LNGDP + 0.7207 LGSBRR (-1) -0.0355D.......... (20)(-2.09) (2.73) (7.16) (-1.59)
SE = 0.0325 R2 = 0.9991 Durbin's h = - 0.5630
Long Run Elasticity of Receipts based on equation (10a)
LGSBRR = 1.1160 .......................................................................................................... (21)
Note: Figures in brackets in the above equations are Y values.
48

Table 1 : Five Yearly Average Trends of Existing Deficit Indicators
(as percentage to GDP)Year RD CAD CD GFD GPD-1 GPD-2 NPD PRB-1 PRB-2
1 2 3 4 5 6 7 8 9 10
CENTRE
1970-75 -0.31 1.31 1.00 3.44 2.01 3.26 1.58 -1.74 -0.491975-80 -0.32 1.35 1.03 4.64 2.86 4.17 1.57 -2.11 -0.801980-85 1.11 0.08 1.19 6.26 4.06 5.52 2.95 -1.10 0.361985-90 2.58 -0.51 2.07 8.21 4.83 6.62 3.80 -0.80 0.991990-91 3.47 -1.35 2.12 8.33 4.32 5.95 3.35 -0.55 1.081991-96 3.04 -2.00 1.04 6.08 1.62 3.36 1.66 -1.42 0.321996-97 2.56 -1.52 1.03 5.23 0.57 2.30 0.71 -2.10 -0.37
STATES
1970-75 -0.04 0.15 0.11 2.21 1.32 1.79 1.00 -0.93 -0.461975-80 -1.21 1.06 -0.14 2.07 1.20 1.75 0.52 -2.08 -1.521980-85 -0.43 0.96 0.53 2.94 1.98 2.54 1.35 -1.39 -0.831985-90 0.26 -0.35 -0.09 3.15 1.73 2.30 1.37 -1.16 -0.581990-91 0.99 -1.00 -0.01 3.51 1.89 2.34 1.55 -0.62 -0.181991-96 0.70 -0.88 -0.18 3.01 0.94 1.55 1.03 -1.22 -0.601996-97 1.26 -0.71 0.55 2.93 0.93 1.57 1.27 -0.74 -0.10
COMBINED
1970-75 -0.35 1.59 1.11 4.50 2.80 3.90 2.58 -2.05 -0.951975-80 -1.53 3.32 0.89 5.40 3.29 4.60 2.09 -3.63 -2.321980-85 0.67 0.85 1.72 7.60 5.05 6.46 4.30 -1.88 -0.471985-90 2.84 -0.86 1.98 9.44 5.55 7.01 5.16 -1.06 0.401990-91 4.46 -2.35 2.11 10.00 5.34 6.45 4.89 -0.21 0.911991-96 3.73 -2.87 0.86 7.60 2.36 3.58 2.69 -1.50 -0.291996-97 3.82 -2.24 1.58 6.85 1.36 2.56 1.98 -1.67 -0.47
(-) : Indicates surplus.
49

T a b le 2 : D e b t a n d I n t e r e s t B u r d e n
( p e r c e n t )
Y e a r D e b t /G D P IP /R R P R B 1 / IP P R B 2 /N IP
C e n tre S ta te s C o m b in e d C e n t r e S ta te s C o m b in e d C e n t re S ta te s C o m b in e d C e n t re S ta te s C o m b in e d
1 2 3 4 5 6 7 8 9 10 11 12 13
197 0 -7 5 30 .6 2 19 .49 3 5 .8 6 17 .15 10 .20 11 .35 122 .67 106 .70 121 .71 2 72 .7 0 119 .73 159 .72
1 97 5 -8 0 31 .6 9 17 .83 3 6 .7 9 17 .79 8 .0 8 11 .39 120 .55 2 3 8 .7 6 175 .08 2 13 .3 8 502 .50 3 05 .3 8
1 98 0 -8 5 38 .2 0 17 .85 4 3 .1 2 2 2 .9 4 8.11 1 3 3 1 50 .52 148 .48 7 6 .29 -4 8 .3 5 233 .21 50 .51
1 98 5 -9 0 50 .2 4 2 0 .6 6 56 .3 3 3 0 .3 7 11 .03 18 .44 23 .11 84 .5 0 2 7 .6 7 -6 8 .0 7 7 5 .9 8 -16 .91
1990 -91 52 .8 5 2 0 .5 9 5 9 .6 5 3 9 .1 2 13 .02 23 .6 3 1 3 .66 3 8 .6 6 4 .5 0 -4 5 .3 8 15 .09 -25 .51
1 99 1 -9 6 5 1 .1 6 19 .7 0 5 8 .3 8 4 4 .9 4 14 .99 2 6 .5 4 32 .0 5 63 .2 8 2 8 .7 7 -1 1 .8 8 4 3 .0 6 6 .6 4
1 9 9 6 -9 7 4 8 .6 6 19 .0 2 5 6 .2 8 4 7 .1 0 16 .73 2 8 .4 4 45 .1 0 3 7 .0 0 3 0 .4 2 12 .62 7 .4 2 10 .9 7
50

Table 3 : Interest Rates on Selected Financial Assets
(per cent per annum)
Coupon Rates on Central Government Securities Coupon Rates on State Government Securities
YearEndingMarch
Short-Term (Below
5 years)
Medium- Term (Between
5 and 10 years)
Long-Term (Over
10 years)
Medium-Term (Between
5 and 10 years)
Long-Term (Over
10 years)
1974-75 5.25 5.00 6.25
1975-76 — 5.00 6.50
1976-77 — 5.50 6.50
1977-78 — 5.50 6.50
1978-79 — 6.00 6.75
1979-80 — 6.25 7.00
1980-81 — 6.50 7.50
1981-82 6.00 6.75 8.00
1982-83 6.25 7.25 9.00
1983-84 — 7.75 10.00
1984-85 — 7.75-8.50 9.50-10.50 — 9.00
1985-86 — 9.00-9.50 10.50-11.50 — 9.75
1986-87 — 10.00-10.50 11.30-11.50 — 11.00
1987-88 — 10.50 11.00-11.50 — 11.00
1988-89 — 10.00-10.50 11.00-11.50 — 11.50
1989-90 — 10.50 11.00-11.50 — 11.50
1990-91 — 10.50-10.75 11.25-11.50 — 11.50
1991-92 — 10.50-11.00 11.25-12.50 — 11.50-12.50
1992-93 — 12.00-12.75 — — 13.00
1993-94 12.00-12.75 12.50-13.40 — — 13.50
1994-95 11.00 11.55-12.71 — — 12.50
1995-96 13.25-13.73 13.25-14.00 — — 14.00
1996-97 13.40-13.72 13.55-13.85 — — 13.75-13.85
1997-98 10.85-12.14 11.15-13.05■ ■ ■
— 12.30-13.05
51

Table 4 : Five Yearly Average Trends of Central Government Deficits before Federal Transfer
(per cent)
FiscalYear
RevenueDeficitBefore
FederalTransfer
CapitalDeficitBefore
FederalTransfer
OverallDeficitBeforeFederalTransfer
Grants-in-Aid
Loans and
Advances less
Recoveries
InterestReceipts
NetTransfers
(5+6-7)
RDBFT/Net
RevenueTransfer
CDBFT/Net
CapitalTransfer
ODBFT/Net
TotalTransfer
% to GDP % to CDP % to GDP % to GDP % to GDP % to GDP % to GDP % to CDP % %
1 2 3 4 5 6 7 8 9 10 11
1950-55 -0.49 -0.31 -0.80 0.36 1.34 0.42 1.28 -1645.44 -6.01 -167.92
1955-60 -0.53 -0.03 -0.55 0.85 2.22 0.67 2.41 223.94 8.21 -219.56
1960-65 -1.01 -1.38 -2.39 1.22 2.56 0.93 2.84 84.45 -52.87 -127.09
1965-70 -0.63 -1.31 -1.94 1.38 2.49 1.31 2.56 425.31 -55.07 -131.18
1970-75 -0.69 -0.37 -1.06 1.64 1.68 1.25 2.06 255.79 -22.52 -205.22
1975-80 -1.06 -1.24 -2.30 2.05 2.59 1.31 3.33 169.61 -45.81 -153.34
1980-85 0.51 -2.45 -1.93 2.05 2.53 1.46 3.12 -82.88 -96.91 -170.52
1985-90 1.86 -3.33 -1.48 2.51 2.82 1.79 3.55 -1131.20 -119.87 -337.36
1990-91 2.61 -3.95 -1.34 2.48 2.60 1.63 3.46 -306.79 -151.76 -258.57
1991-96 2.43 -3.69 -1.26 2.34 1.69 1.74 2.30 -472.35 -216.13 -236.29
1996-97 2.44 -3.12 -0.67 1.84 1.59 1.73 1.71 -2169.21 -195.73 -253.41
52

Table 5 : Fiscal Dependency and Fiscal Stress
(per cent)
FiscalYear
BRG 1/TE BRG 2/TE BRG 3/TE BRG 3 / BRG 1
SRG/SRGEXP
1970-71 60.40 51.72 34.25 56.70 14.081971-72 63.53 55.14 37.93 59.69 18.421972-73 59.82 50.12 33.66 56.27 17.541973-74 58.04 47.76 31.77 54.74 14.261974-75 51.45 42.13 22.20 43.14 7.371975-76 50.19 42.60 22.08 43.99 6.161976-77 50.58 40.82 22.24 43.96 8.431977-78 52.59 45.31 27.44 52.17 14.951978-79 53.97 48.97 33.18 61.47 22.361979-80 54.59 47.53 27.08 49.61 17.331980-81 56.39 44.39 25.94 46.01 16.431981-82 54.44 45.94 27.70 50.88 18.591982-83 54.38 41.39 23.68 43.54 14.511983-84 55.54 45.86 29.29 52.75 18.941984-85 57.82 46.27 29.96 51.81 19.421985-86 55.77 49.54 30.99 55.57 20.421986-87 56.31 46.63 28.25 50.17 16.951987-88 56.47 47.91 29.57 52.36 17.951988-89 55.19 48.91 31.13 56.40 19.391989-90 54.51 46.52 27.36 50.21 15.601990-91 56.54 47.79 29.24 51.72 18.251991-92 55.10 45.09 27.19 49.36 16.241992-93 55.80 46.18 26.72 47.89 14.931993-94 53.96 46.23 28.21 52.28 15.831994-95 52.69 44.56 27.88 52.90 16.301995-96 53.25 45.57 27.20 51.08 14.87
Memorandum Item
Average
1970-75 58.65 49.37 31.96 54.11 14.331975-80 52.39 45.04 26.40 50.24 13.851980-85 55.71 44.77 27.31 49.00 17.581985-90 55.65 47.90 29.46 52.94 18.061990-91 56.54 47.79 29.24 51.72 18.251991-96 54.16 45.53 27.44 50.70 15.64
53

Table 6 : Regression Results
(A) Central Government
Depen- Cons- dent tant
Variable
Independent Varaiables Tests of Statistics
LogNGDP
LogGFDE
(-1)
LogGFDR
(-1)
LogPDE(-1)
LogPDR(-1)
D R2 dw se h Longrun
Elasticity
Log -1.3952 GFDE (-2.24)
0.4092 (2.5 7)
0.6638(5.06)
-0.1364(-2.57)
0.9979 2.49 0.0563 -1.67 1.217
Log -1.6946 GFDR (-3.10)
0.5690(3.66)
0.4772 (3.3 7)
-0.0519(-1.22)
0.9978 2.39 0.0539 -0.8091 1.088
Log -1.2327 PDE (-2.11)
0.3952(2.58)
0.6585(5.02)
-0.1714 (-2.67)
0.9970 2.41 0.0627 -0.86 1.157
Log -1.7006 PDR (-3.06)
0.5694(3.55)
0.4774(3.25)
-0.0520(-1.21)
0.9978 2.41 0.0541 -0.8462 1.089
(B) Government Sector
DependentVariable
Constant Independent Variables Tests of Statistics
LogNGDP
LogGSBRE
(-1)
LogGSBRR
(-1)
D R2 dw se h Longrun
Elasticity
LogGSBRE
-0.6148(-1.43)
0.2353(1.78)
0.8054(7.26)
-0.0675(-2.23)
0.9991 2.03 0.0339 -0.064 1.209
LogGSBRR
-0.7153(-2.09)
0.3117(2.73)
0.7207(7.16)
-0.0355(-1.59)
0.9991 2.27 0.0325 -0.5630 1.116
Figures in brackets are Y values
54

Table 7 : Five Yearly Average Trends of Structural and Cyclical Deficits
(Per centage to GDP)
FiscalYear
Central Government Government Sector
StructuralDeficit
(SD)
CyclicalDeficit(CD)
StructuralDeficit
(SD)
CyclicalDeficit(CD)
1 2 3 4 5
1970-75 2.82 0.62 3.69 0.81
1976-80 4.74 -0.09 5.52 -0.12
1980-85 6.64 -0.38 8.10 -0.49
1986-90 8.87 -0.65 10.30 -0.86
1990-91 8.74 -0.40 10.53 -0.53
1991-96 6.58 -0.36 8.32 -0.47
1996-97 5.26 -0.26 — —
Note: For methodology used in the estimation, see foot note of Appendix Tables Nos. 29 & 30 and Technical Appendix 1.
55
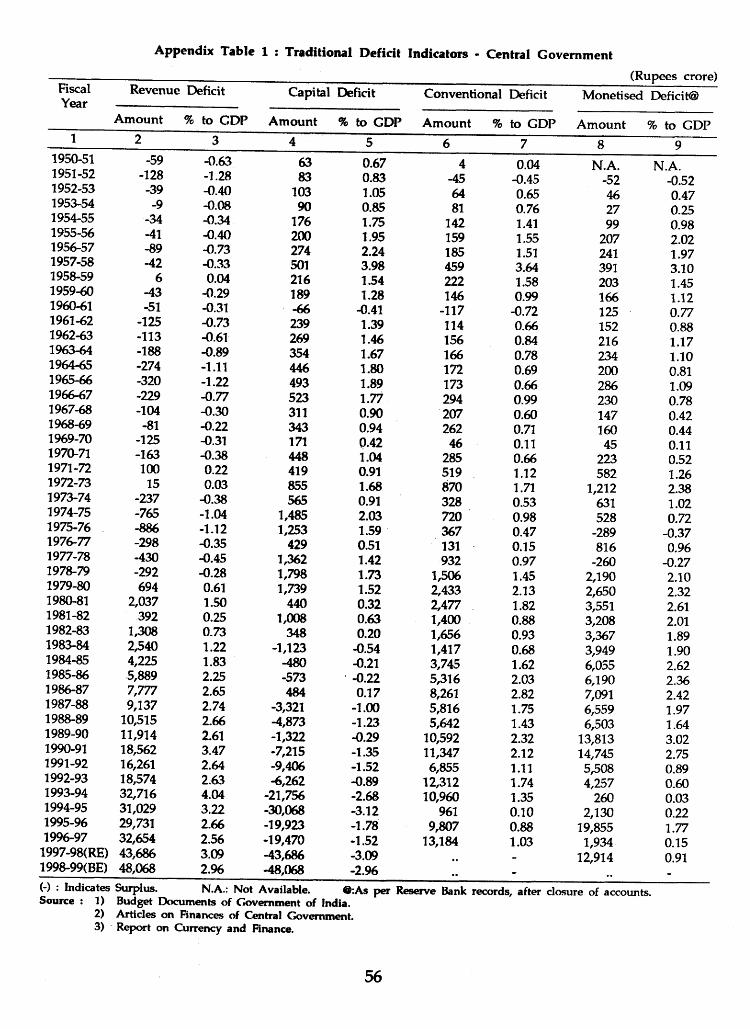
Appendix Table 1 : Traditional Deficit Indicators - Central Government(Rupees crore)
FiscalYear
Revenue Deficit Capital Deficit Conventional Deficit Monetised Deficit®
Amount % to CDP Amount % to GDP Amount % to GDP Amount % to GDP1 2 3 4 5 6 7 8 9
1950-51 -59 -0.63 63 0.67 4 0.04 N.A. N.A.1951-52 -128 -1.28 83 0.83 -45 -0.45 -52 -0.521952-53 -39 -0.40 103 1.05 64 0.65 46 0.471953-54 -9 -0.08 90 0.85 81 0.76 27 0.251954-55 -34 -0.34 176 1.75 142 1.41 99 0.981955-56 -41 -0.40 200 1.95 159 1.55 207 2.021956-57 -89 -0.73 274 2.24 185 1.51 241 1.971957-58 -42 -0.33 501 3.98 459 3.64 391 3.101958-59 6 0.04 216 1.54 222 1.58 203 1.451959-60 -43 -0.29 189 1.28 146 0.99 166 1.121960-61 -51 -0.31 -66 -0.41 -117 -0.72 125 0.771961-62 -125 -0.73 239 1.39 114 0.66 152 0.881962-63 -113 -0.61 269 1.46 156 0.84 216 1.171963-64 -188 -0.89 354 1.67 166 0.78 234 1.101964-65 -274 -1.11 446 1.80 172 0.69 200 0.811965-66 -320 -1.22 493 1.89 173 0.66 286 1.091966-67 -229 -0.77 523 1.77 294 0.99 230 0.781967-68 -104 -0.30 311 0.90 207 0.60 147 0.421968-69 -81 -0.22 343 0.94 262 0.71 160 0.441969-70 -125 -0.31 171 0.42 46 0.11 45 0.111970-71 -163 -0.38 448 1.04 285 0.66 223 0.521971-72 100 0.22 419 0.91 519 1.12 582 1.261972-73 15 0.03 855 1.68 870 1.71 1,212 2.381973-74 -237 -0.38 565 0.91 328 0.53 631 1.021974-75 -765 -1.04 1,485 2.03 720 0.98 528 0.721975-76 -886 -1.12 1,253 1.59 367 0.47 -289 -0.371976-77 -298 -0.35 429 0.51 131 0.15 816 0.961977-78 -430 -0.45 1,362 1.42 932 0.97 -260 -0.271978-79 -292 -0.28 1,798 1.73 1,506 1.45 2,190 2.101979-80 694 0.61 1,739 1.52 2,433 2.13 2,650 2.321980-81 2,037 1.50 440 0.32 2,477 1.82 3,551 2.611981-82 392 0.25 1,008 0.63 1,400 0.88 3,208 2.011982-83 1,308 0.73 348 0.20 1,656 0.93 3,367 1.891983-84 2,540 1.22 -1,123 -0.54 1,417 0.68 3,949 1.901984-85 4,225 1.83 -480 -0.21 3,745 1.62 6,055 2.621985-86 5,889 2.25 -573 -0.22 5,316 2.03 6,190 2.361986-87 7,777 2.65 484 0.17 8,261 2.82 7,091 2.421987-88 9,137 2.74 -3,321 -1.00 5,816 1.75 6,559 1.971988-89 10,515 2.66 -4,873 -1.23 5,642 1.43 6,503 1.641989-90 11,914 2.61 -1,322 -0.29 10,592 2.32 13,813 3.021990-91 18,562 3.47 -7,215 -1.35 11,347 2.12 14,745 2.751991-92 16,261 2.64 -9,406 -1.52 6,855 1.11 5,508 0.891992-93 18,574 2.63 -6,262 -0.89 12,312 1.74 4,257 0.601993-94 32,716 4.04 -21,756 -2.68 10,960 1.35 260 0.031994-95 31,029 3.22 -30,068 -3.12 961 0.10 2,130 0.221995-96 29,731 2.66 -19,923 -1.78 9,807 0.88 19,855 1.771996-97 32,654 2.56 -19,470 -1.52 13,184 1.03 1,934 0.15
1997-98(RE) 43,686 3.09 -43,686 -3.09 12,914 0.911998-99(BE) 48,068 2.96 -48,068 -2.96 •• -( - ) . In d ic a te s S u r p lu s . N .A . : N o t A v a i la b le . ® :A s p e r R e s e rv e B a n k re c o r d s , a f t e r c lo s u r e o f a c c o u n ts .S o u rc e : 1 ) B u d g e t D o c u m e n ts o f G o v e r n m e n t o f In d ia .
2 ) A r t ic le s o n F in a n c e s o f C e n t r a l G o v e r n m e n t .3 ) R e p o r t o n C u r r e n c y a n d F in a n c e .
56

Appendix Table 1 A : Income Deficit and Central Government's Total Requirement of Finance (CGTRF)
(Rupees crore)
Fiscal YearIncome Deficit Central Government's Total
Requirement of Finance
Amount % to GDP Amount % to GDP
1 2 3 4 5
1970-71 116 0.27 1,317 3.051971-72 328 0.71 1,568 3.391972-73 230 0.45 2,151 4.221973-74 198 0.32 24 0.041974-75 311 0.42 2,360 3.221975-76 214 0.27 3,197 4.061976-77 226 0.27 4,026 4.741977-78 57 0.06 3,793 3.951978-79 126 0.12 5,078 4.871979-80 1,297 1.13 6,298 5.511980-81 1,904 1.40 5,060 3.721981-82 1,445 0.90 8,732 5.471982-83 2,026 1.14 10,734 6.031983-84 3,043 1.47 13,331 6.421984-85 5,087 2.20 17,579 7.601985-86 8,999 3.43 22,251 8.481986-87 8,757 2.99 27,195 9.281987-88 10,254 3.08 28,229 8.471988-89 12,777 3.23 32,059 8.101989-90 13,278 2.91 36,179 7.921990-91 19,103 3.57 43,458 8.111991-92 17,061 2.77 35,826 5.811992-93 20,276 2.87 39,909 5.651993-94 33,100 4.08 60,528 7.471994-95 28,211 2.93 56,753 5.891995-96 26,520 2.37 59,845 5.351996-97 (RE) 26,202 2.05 66,340 5.201997-98 (BE) 30,524 2.16 68,847 4.86
Source : Economic and Functional Classification of Government of India, various issues.
57

Appendix Table 2 : Traditional Deficit Indicators - State Governments
(Rupees crore)
FiscalVonr
Revenue Deficit Capital Deficit Conventional Deficit Gross Fiscal Deficit
Amount % to GDP Amount % to GDP Amount % to GDP Amount % to GDP
1 2 3 4 5 6 7 8 9
1970-71 19 0.04 122 0.28 141 0.33 901 2.091971-72 -6 -0.01 295 0.64 289 0.62 1,050 2.271972-73 70 0.14 -484 -0.95 -414 -0.81 1,349 2.641973-74 117 0.19 108 0.17 225 0.36 1,470 2.371974-75 -395 -0.54 426 0.58 31 0.04 1,243 1.701975-76 -972 -1.23 897 1.14 -75 -0.10 1,102 1.401976-77 -1,097 -1.29 1,049 1.24 -48 -0.06 1,515 1.781977-78 -1,020 -1.06 1,249 1.30 229 0.24 2,038 2.121978-79 -1,136 -1.09 126 0.12 -1,010 -0.97 2,643 2.541979-80 -1,548 -1.35 1,736 1.52 188 0.16 2,873 2.511980-81 -1,486 -1.09 2,383 1.75 897 0.66 3,713 2.731981-82 -1,379 -0.86 2,399 1.50 1,020 0.64 4,063 2.541982-83 -888 -0.50 1,708 0.96 820 0.46 4,986 2.801983-84 -210 -0.10 771 0.37 561 0.27 6,359 3.061984-85 923 0.40 515 0.22 1,438 0.62 8,198 3.541985-86 -654 -0.25 -1,034 -0.39 -1,688 -0.64 7,521 2.871986-87 -170 -0.06 836 0.29 666 0.23 9,269 3.161987-88 1,088 0.33 -1,022 -0.31 66 0.02 11,220 3.371988-89 1,807 0.46 -2,187 -0.55 -380 -0.10 11,672 2.951989-90 3,682 0.81 -3,521 -0.77 161 0.04 15,433 3.381990-91 5,309 0.99 -5,381 -1.00 -72 -0.01 18,787 3.511991-92 5,651 0.92 -5,495 -0.89 156 0.03 18,900 3.061992-93 5,114 0.72 -6,943 -0.98 -1,829 -0.26 20,891 2.961993-94 3,813 0.47 -3,351 -0.41 462 0.06 20,596 2.541994-95 6,156 0.64 -10,624 -1.10 -4,468 -0.46 27,697 2.87
1995-96 8,201 0.73 -11,050 -0.99 -2,850 -0.25 . 31,426 2.811996-97 16,114 1.26 -9,072 -0.71 7,042 0.55 37,444 2.931997-98(RE) 19,636 1.39 -16,394 -1.16 3,242 0.23 51,049 3.611998-99(BE) 25,635 1.58 -22,403 -1.38 3,232 0.20 59,277 3.65
(~) : Indicates surplus.Source : Budget Documents of State Governments.
58

Appendix Table 3 : Traditional Deficit Indicators - Centre and States Combined
(Rupees crore)
FiscalV oa r
Revenue Deficit Capital Deficit Overall Deficit Gross Fiscal Deficit
Amount % to GDP Amount % to GDP Amount % to GDP Amount % to GDP
1 2 3 4 5 6 7 8 9
1970-71 -144 -0.33 571 1.32 426 0.99 1,962 4.551971-72 94 0.20 715 1.55 808 1.75 2,439 5.271972-73 85 0.17 371 0.73 456 0.89 2,255 4.421973-74 -120 -0.19 673 1.09 553 0.89 2,610 4.21
1974-75 -1,160 -1.58 1,911 2.61 751 1.03 2,974 4.061975-76 -1,859 -2.36 2,149 2.73 292 0.37 3,599 4.571976-77 -1,396 -1.64 1,478 1.74 83 0.10 4,521 5.331977-78 -1,450 -1.51 2,612 2.72 1,161 1.21 4,686 4.881978-79 -1,428 -1.37 1,924 1.85 496 0.48 5,976 5.741979-80 -854 -0.75 3,475 3.04 2,621 2.29 7,407 6.481980-81 551 0.41 2,823 2.08 3,374 2.48 10,780 7.931981-82 -987 -0.62 3,407 2.13 2,420 1.51 10,607 6.641982-83 420 0.24 2,056 1.15 2,476 1.39 11,116 6.241983-84 2,330 1.12 -352 -0.17 1,978 0.95 15,971 7.691984-85 5,148 2.23 35 0.02 5,183 2.24 22,013 9.521985-86 5,235 2.00 -1,607 -0.61 3,628 1.38 22,172 8.45
1986-87 7,607 2.60 1,320 0.45 8,927 3.05 30,789 10.511987-88 10,225 3.07 -4,343 -1.30 5,882 1.77 32,432 9.731988-89 12,322 3.11 -7,060 -1.78 5,262 1.33 35,887 9.071989-90 15,596 3.41 -4,843 -1.06 10,753 2.35 43,135 9.441990-91 23,871 4.46 -12,596 -2.35 11,275 2.11 53,580 10.001991-92 21,912 3.55 -14,900 -2.42 7,011 1.14 45,850 7.431992-93 23,688 3.36 - 1̂3,205 -1.87 10,483 1.49 52,403 7.421993-94 36,529 4.51 -25,106 -3.10 11,422 1.41 70,952 8.751994-95 37,185 3.86 -40,692 -4.22 -3,507 -0.36 71,640 7.441995-96 37,930 3.39 -30,973 -2.77 6,957 0.62 77,671 6.941996-97 48,768 3.82 -28,542 -2.24 20,226 1.58 87,438 6.85
1997-98(RE) 63,321 4.47 -60,080 -4.24 3,242 0.23 116,028 8.20
1998-99(BE) 73,703 4.53 -70,471 -4.34 3,232 0.20 129,975 8.00
(-) : Indicates surplus.Source : Budget Documents of State Governments and the Government of India.
59

Appendix Table 4 : Receipts and Expenditure of Traditional Indicators - Central Government
(Rupees crore)
F is c a lY e a r
R e v e n u eR e c e ip ts
R e v e n u eE x p e n d i t u r e
C a p i t a lR e c e ip ts
C a p i t a lD is b u r s e m e n ts
A g g re g a teR e c e ip ts
A g g r e g a teD is b u r s e m e n ts
A m o u n t % to G D P
A m o u n t % to G D P
A m o u n t % to G D P
A m o u n t % t o G D P
A m o u n t % to G D P
A m o u n t % to G D P
1 2 3 4 5 6 7 8 * 9 10 11 12 13
1950-51 406 4.33 347 3.70 74 0.79 137 1.46 480 5.12 484 5.171951-52 510 5.12 382 3.83 122 1.22 205 2.06 632 6.34 587 5.891952-53 435 4.45 396 4.05 55 0 3 6 158 1.62 490 5.01 554 5.671953-54 416 3.91 407 3.83 103 0.97 193 1.81 519 4.88 600 5.641954-55 456 4.53 422 4.19 235 2.33 411 4.08 691 6.86 833 8.271955-56 481 4.69 441 4.30 199 1.94 399 3.89 680 6.63 840 8.191956-57 563 4.61 474 3.88 260 2.13 534 4 .37 823 6.74 1,008 8.251957-58 673 5.34 631 5.01 263 2.09 764 6.06 936 7.43 1 3 9 5 11.071958-59 670 4 .77 676 4.82 565 4.03 781 5 3 7 1,235 8.80 1,457 10.381959-60 779 5.27 736 4.98 641 4.33 830 5.61 • 1,420 9.60 1 3 6 6 10.591960-61 877 5.41 826 5.10 968 5.97 902 5 5 7 1 ,845 11.39 1 ,728 10.671961-62 1,037 6.04 912 5.31 729 4.24 968 5.64 1,766 10.28 1,880 10.941962-63 1,427 7.72 1 3 1 4 7.11 956 5 .17 1,225 6 .63 2 3 8 3 12.90 2 3 3 9 13.741963-64 1,846 8.69 1,658 7.81 1,166 5.49 1 3 2 0 7.16 3 ,012 14.18 3 ,178 14.961964-65 2,081 8.40 1,807 7.30 1 3 5 7 5 .48 1,803 7.28 3,438 13.88 3,610 14.581965-66 2 3 4 5 8.97 2,025 7.75 1,403 5.37 1,896 7.25 3,748 14.34 3,921 15.001966-67 2,500 8.45 2,272 7.68 1,829 6.19 2 3 5 2 7.95 4 3 2 9 14.64 4,624 15.641967-68 2,586 7.47 2,482 7.17 1,719 4 .97 2,030 5 .87 4 3 0 5 12.44 4 3 1 2 13.041968-69 2 ,793 7.62 2,712 7.39 1 3 8 3 4.32 1,926 5.25 4 3 7 6 11.93 4,638 12.651969-70 3 ,067 7.59 2,942 7.28 1,935 4.79 2,106 5.21 ‘ 5 ,002 12.39 5,048 12.501970-71 3 ,342 7.74 3,179 7.37 2,046 4.74 2,494 5.78 5 3 8 8 12.48 5,673 13.141971-72 3,868 8.36 3,968 8.58 2 3 0 5 5.42 2,924 6.32 6 3 7 3 13.78 6,892 14.901972-73 4,523 8.87 4 3 3 8 8.90 2,464 4.83 3 3 1 9 6.51 6,987 13.70 7,857 15.401973-74 5,014 8.09 4,777 7.70 2,876 4.64 3,441 5 3 5 7,890 12.72 8,218 13.251974-75 6,442 8.80 5,677 7.75 2,774 3.79 4 ,259 5.82 9,216 12.58 9,936 13.571975-76 7,864 9.98 6,978 8.86 4,148 5.27 5,401 6.86 12,012 15.25 12 3 7 9 15.721976-77 8,568 10.09 8,270 9.74 4,958 5.84 5 3 8 7 6.35 13326 15.93 13,657 16.091977-78 9,538 9.93 9 ,108 9.48 5,036 5.24 6 3 9 8 6.66 143 74 15.17 153 06 16.141978-79 10,974 1 0 3 3 10,682 10.25 6,286 6.03 8,084 7.76 17,260 16.57 18,766 18.011979-80 11,109 9.71 11,803 10.32 5,420 4.74 7,159 6.26 1 63 29 14.45 18,962 16.581980-81 1 2 3 7 3 9.10 14,410 10.59 7,918 5.82 8 3 5 8 6.15 20,291 14.92 22,768 16.741981-82 15,016 9.40 15,408 9.64 8 3 4 9 5.54 9,857 6.17 23,865 14.94 25,265 15.811982-83 17,434 9.79 18,742 1 0 3 2 11,701 6 3 7 12,049 6.76 29,135 16.36 30,791 17.291983-84 19,711 9 3 0 22,251 10.72 14,406 6.94 13,283 6.40 34,117 16.43 353 34 17.121984-85 23,466 10.14 27,691 11.97 16,421 7.10 15,941 6.89 39,887 17.24 43,632 18.861985-86 28,035 10.69 33,924 12.94 193 15 7 3 7 18,742 7.15 4 73 50 18.06 52,666 20.081986-87 33,083 11.29 40,860 13.95 2 1 3 7 2 7.36 22,056 7 3 3 54,655 18.66 62,916 21.481987-88 37,037 11.12 46,174 13.86 25,408 7.63 22,087 6.63 62,445 18.74 68,261 20.491988-89 43391 11.01 54,106 13.67 29,878 7 3 5 25,005 6.32 73,469 18.56 79,111 19.991989-90 52,296 11.45 64,210 14.06 30,020 6.57 28,698 6.28 82316 18.02 92,908 20.341990-91 54,954 10.26 7 3 3 1 6 13.73 38,997 7.28 31,782 5 .93 93,951 1 7 3 4 ' 105,298 19.661991-92 66,031 10.71 82,292 13.34 3 8 3 2 8 6.25 29,122 4.72 104359 16.95 111,414 18.061992-93 74,128 10.50 92,702 13.13 36,178 5.12 29,916 4.24 110306 15.63 122,618 17.371993-94 75,453 9.31 108,169 13.34 55,440 6.84 33,684 4.15 130,893 16.14 141,853 17.501994-95 91,083 9.45 122,112 12.67 68,695 7.13 38,627 4.01 159,778 16.58 160,739 16.681995-96 110,130 9.84 139,860 12.50 5 8 3 3 8 5.21 38,415 3.43 168,468 15.06 178,275 15.931996-97 126,279 9.89 158,933 12.45 61344 4.82 42,074 3 .29 187323 14.71 201,007 15.741997-98 (RE ) 1 38314 9.79 182,200 12.87 96,731 6.83 53,045 3.75 235,245 16.62 235,245 16.621998-99 (BE ) 161,994 9.97 210,062 12.92 105,933 6.52 57,865 3 3 6 267,927 16.48 267,927 16.48
Source: 1) Budget Documents of Government of India.2) Articles on Finances of Central Government.
60

Appendix Table 5 : Receipts and Expenditure of Traditional Deficit Indicators - State Governments
(Rupees crore)
F is c a lY e a r
R e v e n u eR e c e ip ts
R e v e n u eE x p e n d it u r e
C a p i ta lR e c e ip ts
C a p i ta lD is b u r s e m e n ts
A g g re g a teR e c e ip ts
A g g re g a teD is b u r s e m e n ts
A m o u n t % to G D P
A m o u n t % to G D P
A m o u n t % to G D P
A m o u n t % to G D P
A m o u n t % to G D P
A m o u n t % to G D P
1 2 3 4 5 6 7 8 9 10 11 12 13
1970-71 3371 7.81 3,390 7.85 1,662 3.85 1,784 4.13 5,033 11.66 5,174 11.99
1971-72 4,045 8.74 4,039 8.73 1,836 3.97 2,131 4.61 5381 12.71 6,170 13.34
1972-73 4,912 9.63 4,982 9.77 2,781 5.45 2,297 4 5 0 7,693 15.08 7,279 14.27
1973-74 5,552 8.95 5,669 9.14 2,450 3.95 2 55 8 4.13 8,002 12.90 8,227 13.27
1974-75 6,432 8.78 6,037 8.24 2,151 2.94 2 5 7 7 3 5 2 8 58 3 11.72 8,614 11.76
1975-76 7,938 10.08 6,966 8.84 2,417 3.07 3314 4.21 10355 13.15 10,280 13.05
1976-77 9,037 10.65 7,940 9.35 2,852 3.36 3,901 4.60 11389 14.00 11341 13.95
1977-78 9,931 10.34 8,911 9.28 3,100 3.23 4 34 9 4 5 3 13,031 1356 13,260 13.80
1978-79 11,647 11.18 10,511 10.09 5,052 4.85 5,178 4.97 16,699 16.03 15,689 15.06
1979-80 13,629 11.92 12,081 10.56 4,105 3.59 5,841 5.11 17,734 1551 17,922 15.67
1980-81 16,294 11.98 14,808 10.89 5,473 4.02 7,856 5.78 21,767 16.00 22,664 16.66
1981-82 18,454 11.55 17,075 10.69 5,695 3.56 8,094 5.07 24,149 15.12 25,169 15.75
1982-83 21,125 11.86 20,237 1136 6,796 3.82 8304 4.77 27,921 15.67 28,741 16.13
1983-84 24,014 11.57 23,804 11.47 8,966 4 3 2 9,737 4.69 32,980 15.89 33541 16.16
1984-85 27,426 11.86 28,349 12.25 10,993 4.75 11508 4.97 38,419 16.61 3 93 57 17.23
1985-86 33,424 12.75 32,770 12 JO 13,131 5.01 12,097 4.61 465 55 17.75 4 4 3 6 7 17.11
1986-87 38,226 13.05 38,056 12.99 12,892 4.40 13,728 4.69 51,118 17.45 51,784 17.68
1987-88 44,000 13.21 45,088 135 3 15,806 4.74 14,784 4.44 59,806 17.95 59,872 17.97
1988-89 50,421 12.74 52,228 13.20 17,037 4.30 14,850 3.75 67,458 17.04 67,078 16.95
1989-90 56,535 12.38 60,217 13.18 20,086 4.40 16565 3.63 76,621 16.77 76,782 16.81
1990-91 66,467 12.41 71,776 13.40 24,693 4.61 19312 3.61 90,732 16.94 90,660 16.93
1991-92 80,535 13.06 86,186 13.97 27,237 4.42 21,743 3 5 3 108388 1 7 5 7 108544 17.60
1992-93 91,091 12.90 96,205 13.63 30,073 4.26 23,129 3.28 121,164 17.16 119335 16.90
1993-94 105,564 13.02 109,376 13.49 28,623 3 5 3 25,272 3.12 134,187 1655 134,648 16.61
1994-95 122,284 12.69 128,440 13.33 43,738 4 5 4 33,114 3.44 166,022 17.23 161554 16.77
1995-% 136,803 12.23 145,004 12.96 43,630 3.90 32580 2.91 180,434 16.13 177584 15.87
1996-97 152,836 11.97 168,950 13.23 42,891 3.36 33319 2.65 195,727 15.33 202,769 15.88
1997-98(RE) 177,084 12.51 196,719 13.90 593 88 4.20 42,994 3.04 236,471 16.71 239,713 16.93
1998-99(BE) 203,176 12.50 228,811 14.08 67355 4.14 44,952 2.77 270531 16.64 273,763 16.84
Source : Budget Documents of State Governments.
61
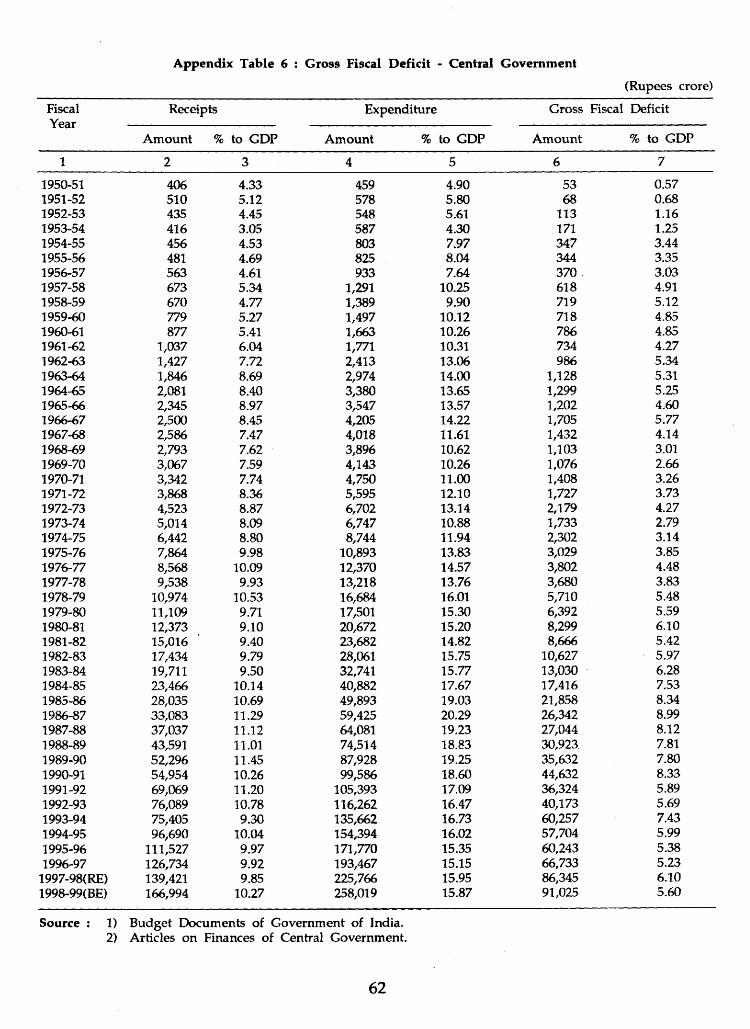
Appendix Table 6 :: Gross Fiscal Deficit - Central Government
(Rupees crore)
FiscalYear
Receipts Expenditure Gross Fiscal Deficit
Amount % to GDP Amount % to GDP Amount % to GDP
1 2 3 4 5 6 7
1950-51 406 4.33 459 4.90 53 0.571951-52 510 5.12 578 5.80 68 0.681952-53 435 4.45 548 5.61 113 1.161953-54 416 3.05 587 4.30 171 1.251954-55 456 4.53 803 7.97 347 3.441955-56 481 4.69 825 8.04 344 3.351956-57 563 4.61 933 7.64 370 3.031957-58 673 5.34 1,291 10.25 618 4.911958-59 670 4.77 1,389 9.90 719 5.121959-60 779 5.27 1,497 10.12 718 4.851960-61 877 5.41 1,663 10.26 786 4.851961-62 1,037 6.04 1,771 10.31 734 4.271962-63 1,427 7.72 2,413 13.06 986 5.341963-64 1,846 8.69 2,974 14.00 1,128 5.311964-65 2,081 8.40 3,380 13.65 1,299 5.251965-66 2,345 8.97 3,547 13.57 1,202 4.601966-67 2,500 8.45 4,205 14.22 1,705 5.771967-68 2,586 7.47 4,018 11.61 1,432 4.141968-69 2,793 7.62 3,896 10.62 1,103 3.011969-70 3,067 7.59 4,143 10.26 1,076 2.661970-71 3,342 7.74 4,750 11.00 1,408 3.261971-72 3,868 8.36 5,595 12.10 1,727 3.731972-73 4,523 8.87 6,702 13.14 2,179 4.271973-74 5,014 8.09 6,747 10.88 1,733 2.791974-75 6,442 8.80 8,744 11.94 2,302 3.141975-76 7,864 9.98 10,893 13.83 3,029 3.851976-77 8,568 10.09 12,370 14.57 3,802 4.481977-78 9,538 9.93 13,218 13.76 3,680 3.831978-79 10,974 10.53 16,684 16.01 5,710 5.481979-80 11,109 9.71 17,501 15.30 6,392 5.591980-81 12,373 9.10 20,672 15.20 8,299 6.101981-82 15,016 9.40 23,682 14.82 8,666 5.421982-83 17,434 9.79 28,061 15.75 10,627 5.971983-84 19,711 9.50 32,741 15.77 13,030 6.281984-85 23,466 10.14 40,882 17.67 17,416 7.531985-86 28,035 10.69 49,893 19.03 21,858 8.341986-87 33,083 11.29 59,425 20.29 26,342 8.991987-88 37,037 11.12 64,081 19.23 27,044 8.121988-89 43,591 11.01 74,514 18.83 30,923 7.811989-90 52,296 11.45 87,928 19.25 35,632 7.801990-91 54,954 10.26 99,586 18.60 44,632 8.331991-92 69,069 11.20 105,393 17.09 36,324 5.891992-93 76,089 10.78 116,262 16.47 40,173 5.691993-94 75,405 9.30 135,662 16.73 60,257 7.431994-95 96,690 10.04 154,394 16.02 57,704 5.991995-96 111,527 9.97 171,770 15.35 60,243 5.381996-97 126,734 9.92 193,467 15.15 66,733 5.23
1997-98(RE) 139,421 9.85 225,766 15.95 86,345 6.101998-99(BE) 166,994 10.27 258,019 15.87 91,025 5.60
Source : 1) Budget Documents of Government of India.2) Articles on Finances of Central Government.
62

Appendix Table 7 : Gross Fiscal Deficit - State Governments
(Rupees crore)FiscalYear
Receipts Expenditure Gross Fiscal Deficit
Amount % to GDP Amount % to GDP Amount % to GDP1 2 3 4 5 6 7
1970-71 3,371 7.81 4,272 9.90 901 2.09
1971-72 4,045 8.74 5,095 11.01 1,050 2.271972-73 4,912 9.63 6,261 12.28 1,349 2.64
1973-74 5,552 8.95 7,022 11.32 1,470 2.37
1974-75 6,432 8.78 7,675 10.48 1,243 1.701975-76 7,938 10.08 9,040 11.48 1,102 1.40
1976-77 9,037 10.65 10,552 12.43 1,515 1.78
1977-78 9,931 10.34 11,969 12.46 2,038 2.12
1978-79 11,647 11.18 14,290 13.72 2,643 2.54
1979-80 13,629 11.92 16,502 14.43 2,873 2.51
1980-81 16,294 11.98 20,007 14.71 3,713 2.73
1981-82 18,454 11.55 22,517 14.09 4,063 2.54
1982-83 21,125 11.86 26,111 14.66 4,986 2.80
1983-84 24,014 11.57 30,373 14.63 6,359 3.06
1984-85 27,426 11.86 35,624 15.40 8,198 3.54
1985-86 33,424 12.75 40,945 15.61 7,521 2.87
1986-87 38,226 13.05 47,495 16.21 9,269 3.16
1987-88 44,000 13.21 55,220 16.57 11,220 3.37
1988-89 50,421 12.74 62,093 15.69 11,672 2.95
1989-90 56,535 12.38 71,968 15.75 15,433 3.38
1990-91 66,467 12.41 85,254 15.92 18,787 3.51
1991-92 80,535 13.06 99,435 16.12 18,900 3.06
1992-93 91,091 12.90 111,982 15.86 20,891 2.96
1993-94 105,564 13.02 126,160 15.56 20,596 2.54
1994-95 122,284 12.69 149,981 15.57 27,697 2.87
1995-96 136,803 12.23 168,229 15.03 31,426 2.81
1996-97 152,836 11.97 190,280 14.90 37,444 2.93
1997-98(RE) 177,084 12.51 228,133 16.12 51,049 3.61
1998-99(BE) 203,176 12.50 262,453 16.15 59,277 3.65
Source : Budget Documents of State Governments.
63
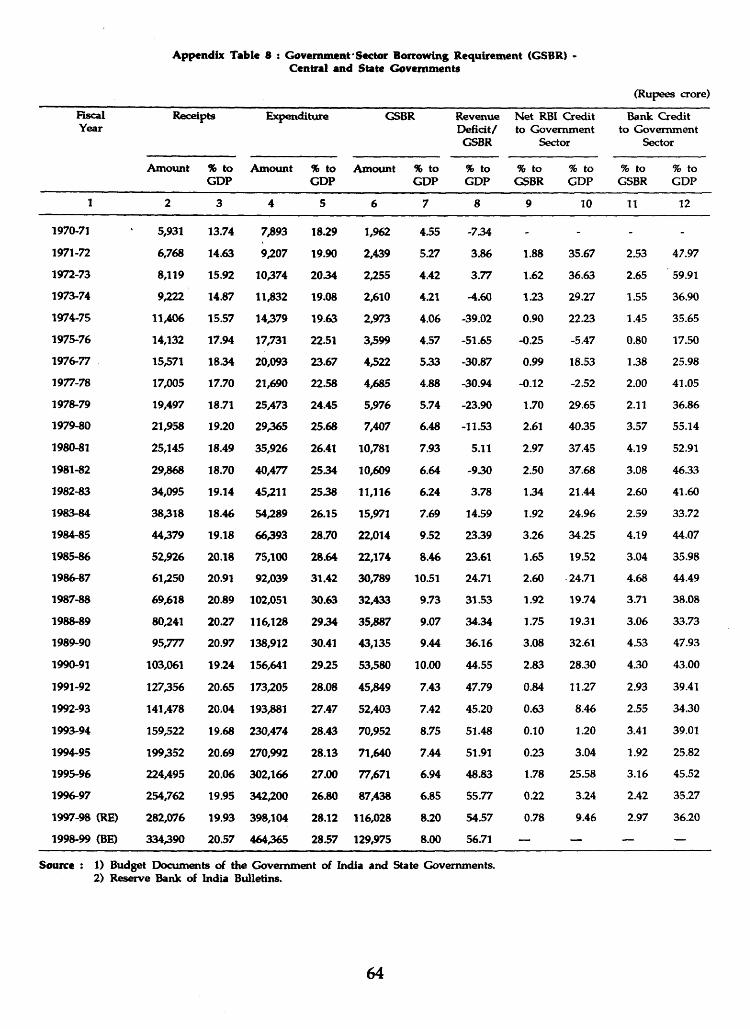
A p p e n d ix T a b le 8 : G o v e r n m e n t ' S e c to r B o r r o w in g R e q u i r e m e n t (G S B R ) - C e n t r a l a n d S ta te G o v e r n m e n ts
(Rupees crore)
F is c a lY e a r
R e c e ip ts E x p e n d i t u r e G S B R R e v e n u eD e f i c i t /
G S B R
N e t R B I C r e d i t t o G o v e r n m e n t
S e c to r
B a n k C r e d i t t o G o v e r n m e n t
S e c to r
A m o u n t % t o G D P
A m o u n t % to G D P
A m o u n t % t o G D P
% t o G D P
% to G S B R
% t o G D P
% to G S B R
% to G D P
1 2 3 4 5 6 7 8 9 10 11 12
1970 -71 5 ,931 13 .7 4 7 ,8 9 3 18 .2 9 1 ,962 4 .5 5 - 7 3 4 - - - -
1 97 1 -7 2 6 ,7 6 8 14 .6 3 9 ,2 0 7 19 .9 0 2 ,4 3 9 5 .2 7 3 .8 6 1 .8 8 3 5 .6 7 2 .5 3 4 7 .9 7
1 9 7 2 -7 3 8 ,1 1 9 15 .9 2 1 0 3 7 4 2 0 3 4 2 ,2 5 5 4 .4 2 3 .7 7 1 .6 2 3 6 .6 3 2 .6 5 5 9 .91
1 9 7 3 -7 4 9 ,2 2 2 14 .8 7 1 1 ,8 3 2 1 9 .0 8 2 ,6 1 0 4 .2 1 -4 .6 0 1 .2 3 2 9 .2 7 1 .5 5 3 6 .9 0
1 9 7 4 -7 5 1 1 ,4 0 6 15 .5 7 1 4 3 7 9 1 9 .6 3 2 ,9 7 3 4 .0 6 -3 9 .0 2 0 .9 0 2 2 .2 3 1 .4 5 3 5 .6 5
1 9 7 5 -7 6 14 ,1 32 1 7 .9 4 17 ,731 22 .51 3 ,5 9 9 4 .5 7 -5 1 .6 5 -0 .2 5 -5 .4 7 0 .8 0 17 .5 0
1 9 7 6 -7 7 15 ,571 1 8 .3 4 2 0 ,0 9 3 2 3 .6 7 4 3 2 2 5 3 3 -3 0 .8 7 0 .9 9 18 .53 1 .38 2 5 .9 8
1 9 7 7 -7 8 17 ,0 05 17 .7 0 2 1 ,6 9 0 2 2 .5 8 4 ,6 8 5 4 .8 8 -3 0 .9 4 -0 .1 2 -2 .5 2 2 .0 0 4 1 .0 5
1 9 7 8 -7 9 19 ,4 9 7 18 .71 2 5 ,4 7 3 2 4 .4 5 5 ,9 7 6 5 .7 4 -2 3 .9 0 1 .7 0 2 9 .6 5 2 .11 3 6 .8 6
1 9 7 9 -8 0 2 1 ,9 5 8 19 .2 0 2 9 3 6 5 2 5 .6 8 7 ,4 0 7 6 .4 8 -1 1 .5 3 2 .61 4 0 .3 5 3 .5 7 5 5 .1 4
1980 -81 2 5 ,1 4 5 18 .4 9 3 5 ,9 2 6 26 .41 10 ,781 7 .9 3 5 .11 2 .9 7 3 7 .4 5 4 .1 9 52 .91
1 9 8 1 -8 2 2 9 ,8 6 8 18 .7 0 4 0 ,4 7 7 2 5 3 4 10 ,6 09 6 .6 4 -9 .3 0 2 .5 0 3 7 .6 8 3 .0 8 4 6 .3 3
1 9 8 2 -8 3 3 4 ,0 9 5 19 .1 4 45 ,211 2 5 3 8 1 1 ,1 1 6 6 .2 4 3 .7 8 1 3 4 2 1 .4 4 2 .6 0 41 .6 0
1 9 8 3 -8 4 3 8 ,3 1 8 1 8 .4 6 5 4 ,2 8 9 2 6 .1 5 15 ,971 7 .6 9 1 4 .5 9 1 .92 2 4 .9 6 2 .5 9 3 3 .7 2
1 9 8 4 -8 5 4 4 ,3 7 9 19 .1 8 6 6 3 9 3 2 8 .7 0 22 ,0 1 4 9 .5 2 2 3 3 9 3 .2 6 3 4 .2 5 4 .1 9 4 4 .0 7
1 9 8 5 -8 6 5 2 ,9 2 6 2 0 .1 8 7 5 ,1 0 0 2 8 .6 4 2 2 ,1 7 4 8 .4 6 23 .61 1 .6 5 1 9 .5 2 3 .0 4 3 5 .9 8
1 9 8 6 -8 7 6 1 ,2 5 0 20 .91 9 2 ,0 3 9 3 1 .4 2 3 0 ,7 8 9 10 .51 24 .71 2 .6 0 24 .71 4 .6 8 4 4 .4 9
1 9 8 7 -8 8 6 9 ,6 1 8 2 0 .8 9 102 ,05 1 3 0 .6 3 3 2 ,4 3 3 9 .7 3 3 1 .5 3 1 .9 2 1 9 .7 4 3 .71 3 8 .0 8
1 9 8 8 -8 9 80 ,241 2 0 .2 7 1 16 ,1 2 8 2 9 3 4 3 5 ,8 8 7 9 .0 7 3 4 .3 4 1 .75 19.31 3 .0 6 3 3 .7 3
1 9 8 9 -9 0 9 5 ,7 7 7 2 0 .9 7 1 38 ,9 1 2 30 .41 4 3 ,1 3 5 9 .4 4 3 6 .1 6 3 .0 8 32 .61 4 .5 3 4 7 .9 3
199 0 -91 103 ,06 1 1 9 .2 4 156 ,641 2 9 .2 5 5 3 3 8 0 10 .0 0 4 4 .5 5 2 .8 3 2 8 .3 0 4 .3 0 4 3 .0 0
1 9 9 1 -9 2 1 2 7 3 5 6 2 0 .6 5 1 73 ,2 0 5 2 8 .0 8 4 5 ,8 4 9 7 .4 3 4 7 .7 9 0 .8 4 11 .2 7 2 .9 3 39 .41
1 9 9 2 -9 3 1 41 ,4 7 8 2 0 .0 4 193 ,881 2 7 .4 7 5 2 ,4 0 3 7 .4 2 4 5 .2 0 0 .6 3 8 .4 6 2 .5 5 3 4 .3 0
1 9 9 3 -9 4 1 59 ,52 2 19 .6 8 2 3 0 ,4 7 4 2 8 .4 3 7 0 ,9 5 2 8 .7 5 5 1 .4 8 0 .1 0 1 .20 3 .41 39 .0 1
1 9 9 4 -9 5 1 9 9 3 5 2 2 0 .6 9 2 7 0 ,9 9 2 2 8 .1 3 7 1 ,6 4 0 7 .4 4 51 .91 0 .2 3 3 .0 4 1 .9 2 2 5 .8 2
1 9 9 5 -9 6 2 2 4 ,4 9 5 2 0 .0 6 3 0 2 ,1 6 6 2 7 .0 0 77 ,6 71 6 .9 4 4 8 .8 3 1 .78 2 5 .5 8 3 .1 6 4 5 .5 2
1 9 9 6 -9 7 2 5 4 ,7 6 2 19 .9 5 3 4 2 ,2 0 0 2 6 .8 0 8 7 ,4 3 8 6 .8 5 5 5 .7 7 0 .2 2 3 .2 4 2 .4 2 3 5 .2 7
1 9 9 7 -9 8 (R E ) 2 8 2 ,0 7 6 19 .9 3 3 9 8 ,1 0 4 2 8 .1 2 1 16 ,0 2 8 8 .2 0 5 4 .5 7 0 .7 8 9 .4 6 2 .9 7 3 6 .2 0
1 9 9 8 -9 9 (B E ) 3 3 4 3 9 0 2 0 .5 7 4 6 4 3 6 5 2 8 .5 7 1 29 ,9 7 5 8 .0 0 56 .71 — — — —
S o u rc e : 1 ) B u d g e t D o c u m e n ts o f th e G o v e r n m e n t o f I n d ia a n d S ta te G o v e rn m e n ts . 2 ) R e s e rv e B a n k o f I n d ia B u l le t in s .
64

Appendix Table 9 : Decomposition of Gross Fiscal Deficit - Central Government
(Rupees crore)
F is c a lY e a r
R e v e n u eD e f i c i t
C a p i t a lO u t la y
N e tL e n d in g
D is in v e s tm e n t o f e q u i t y h o ld in g i n p u b l i c s e c to r
e n te rp r is e s
G ro s s F is c a l D e f ic i t
( 2 + 3 + 4 -5 )
P e r c e n ta g e t o G ro s s F is c a l D e f i c i t
R e v e n u eD e f i c i t
C a p i t a lO u t la y
N e tL e n d in g
D is in v e s t m e n t
i n P S U s
1 2 3 4 5 6 7 8 9 10
1950 -51 -5 9 71 41 - 53 -1 1 1 3 2 1 3 3 .9 6 7 7 3 6 —1 9 5 1 -5 2 -1 2 8 1 18 7 8 — 6 8 -1 8 8 .2 4 17 3 .5 3 114 .71 —1 95 2 -5 3 -3 9 3 9 113 — 1 13 -3 4 .5 1 34 .51 1 0 0 .0 0 —1 9 5 3 -5 4 -9 25 155 — 171 -5 .2 6 14 .6 2 9 0 .6 4 —1 95 4 -5 5 -3 4 91 2 9 0 — 3 4 7 -9 .8 0 2 6 .2 2 8 3 .5 7 —1 9 5 5 -5 6 -41 1 29 2 5 6 — 3 4 4 -1 1 .9 2 3 7 .5 0 7 4 .4 2 —1 9 5 6 -5 7 -8 9 2 75 184 — 3 7 0 -2 4 .0 5 7 4 .3 2 4 9 .7 3 —1 9 5 7 -5 8 -4 2 4 3 5 2 25 — 6 18 -6 .8 0 7 0 3 9 36 .4 1 —1 95 8 -5 9 6 4 0 2 311 — 7 1 9 0 .8 3 55 .91 4 3 .2 5 —1 95 9 -6 0 -4 3 3 4 2 4 19 — 7 1 8 -5 .9 9 4 7 .6 3 5 8 3 6 —1960 -61 -51 4 0 5 4 32 — 7 8 6 -6 .4 9 5 1 .5 3 5 4 .9 6 —1 96 1 -6 2 -1 2 5 4 38 421 — 7 34 -1 7 .0 3 5 9 .6 7 5 7 3 6 —1 9 6 2 -6 3 -1 1 3 5 8 4 5 15 — 9 8 6 -1 1 .4 6 5 9 .2 3 5 2 .2 3 —1 9 6 3 -6 4 -1 8 8 8 15 501 — 1 ,1 2 8 -1 6 .6 7 7 2 .2 5 44 .41 —1 96 4 -6 5 -2 7 4 9 4 7 6 26 — 1 ,2 9 9 -2 1 .0 9 7 2 .9 0 4 8 .1 9 —1 9 6 5 -6 6 -3 2 0 6 9 6 8 2 6 — 1 ,2 0 2 -2 6 .6 2 5 7 .9 0 6 8 .7 2 —1 9 6 6 -6 7 -2 2 9 9 4 6 9 88 — 1 ,7 0 5 -1 3 .4 3 5 5 .4 8 5 7 .9 5 —1 96 7 -6 8 -1 0 4 o o o 8 70 — 1 ,4 3 2 - 7 2 6 46 .51 6 0 .7 5 — .
1 96 8 -6 9 -81 4 28 7 5 6 — 1 ,1 0 3 - 7 3 4 3 8 .8 0 6 8 .5 4 —1 9 6 9 -7 0 -1 2 5 6 4 8 5 53 — 1 ,0 7 6 -1 1 .6 2 6 0 .2 2 5 1 3 9 —1 97 0 -71 -1 6 3 9 4 3 6 2 9 — 1 ,4 0 9 -1 1 .5 7 6 6 .9 3 4 4 .6 4 —
1 9 7 1 -7 2 100 1 ,1 1 7 5 10 — 1 ,7 2 7 5 .7 9 6 4 .6 8 2 9 .5 3 —1 9 7 2 -7 3 15 9 75 1 ,1 8 9 — 2 ,1 7 9 0 .6 9 4 4 .7 5 5 4 .5 7 —1 9 7 3 -7 4 -2 3 7 1 ,0 0 9 961 — 1 ,7 3 3 -1 3 .6 8 5 8 .2 2 5 5 .4 5 —1 97 4 -7 5 -7 6 5 1 ,631 1 ,4 3 7 — 2 ,3 0 3 -3 3 .2 2 7 0 .8 2 6 2 .4 0 —1 9 7 5 -7 6 -8 8 6 2 ,2 5 0 1 ,665 — 3 ,0 2 9 -2 9 .2 5 7 4 .2 8 5 4 .9 7 —1 9 7 6 -7 7 -2 9 8 1 ,8 6 9 2 ,2 3 0 — 3 ,8 0 1 -7 .8 4 4 9 .1 7 5 8 .6 7 —1 9 7 7 -7 8 -4 3 0 2 ,2 4 4 1 ,8 6 7 — 3 ,6 8 1 -1 1 .6 8 6 0 .9 6 5 0 .7 2 —1 9 7 8 -7 9 -2 9 2 2 ,4 1 8 3 ,5 8 4 — 5 ,7 1 0 -5 .11 4 2 3 5 6 2 .7 7 —1 97 9 -8 0 6 9 4 2 ,4 3 9 3 ,2 5 9 — 6 ,3 9 2 10 .8 6 3 8 .1 6 5 0 .9 9 —1 98 0 -81 2 ,0 3 7 3 ,0 7 3 3 ,1 8 9 — 8 ,2 9 9 2 4 .5 5 3 7 .0 3 3 8 .4 3 —1 98 1 -8 2 3 92 4 ,1 9 9 4 ,0 7 5 — 8 ,6 6 6 4 .5 2 4 8 .4 5 4 7 .0 2 —1 98 2 -8 3 1 ,3 0 8 4 ,6 6 5 4 ,6 5 4 — 10 ,6 2 7 1 2 3 1 4 3 .9 0 4 3 .7 9 —1 9 8 3 -8 4 2 ,5 4 0 5 ,2 3 0 5 ,2 6 0 — 13 ,0 3 0 19 .4 9 4 0 .1 4 4 0 3 7 —1 9 8 4 -8 5 4 ,2 2 5 6 ,7 4 7 6 ,4 4 4 — 1 7 ,4 1 6 2 4 .2 6 3 8 .7 4 3 7 .0 0 —1 9 8 5 -8 6 5 ,8 8 9 7 ,6 5 4 8 ,3 1 4 — 2 1 ,8 5 7 2 6 .9 4 3 5 .0 2 3 8 .0 4 —1 9 8 6 -8 7 7 ,7 7 7 9 ,2 5 9 9 ,3 0 6 — 2 6 3 4 2 2 9 .5 2 3 5 .1 5 3 5 .3 3 —1 9 8 7 -8 8 9 ,1 3 7 9 ,2 9 4 8 ,6 1 3 — 2 7 ,0 4 4 3 3 .7 9 3 4 3 7 3 1 .8 5 —1 9 8 8 -8 9 1 0 ,5 1 5 1 0 ,2 5 5 10 ,1 53 — 3 0 ,9 2 3 3 4 .0 0 3 3 .1 6 3 2 .8 3 —1 9 8 9 -9 0 1 1 ,9 1 4 11 ,8 08 1 1 ,9 1 0 — 3 5 ,6 3 2 3 3 .4 4 3 3 .1 4 3 3 .4 3 —1990 -91 1 8 ,5 6 2 12 ,1 30 1 3 ,9 4 0 — 4 4 ,6 3 2 4 1 .5 9 2 7 .1 8 3 1 .2 3 —1 9 9 1 -9 2 16 ,261 11 ,4 0 0 1 1 ,7 0 2 3 ,0 3 8 3 6 3 2 5 4 4 .7 7 3 1 3 8 32 .2 1 8 3 61 9 9 2 -9 3 1 8 ,5 7 4 13 ,6 19 9 ,941 1,961 4 0 ,1 7 3 4 6 .2 4 3 3 .9 0 2 4 .7 5 4 .8 81 9 9 3 -9 4 3 2 ,7 1 6 13 /2 30 14 ,2 63 -4 8 6 0 ,2 5 7 5 4 .2 9 2 1 .9 6 2 3 .6 7 -0 .0 81 9 9 4 -9 5 3 1 ,0 2 9 14 ,891 17 ,391 5 ,6 0 7 ® 5 7 ,7 0 4 5 3 .7 7 25 .8 1 3 0 .1 4 9 .7 21 9 9 5 -9 6 2 9 ,7 3 1 14 ,0 99 17 ,811 1 ,3 9 7 ® 6 0 ,2 4 4 4 9 3 5 2 3 .4 0 2 9 .5 6 2 3 21 9 9 6 -9 7 3 2 ,6 5 4 1 4 ,1 9 5 2 0 ,3 3 9 4 5 5 6 6 ,7 3 3 4 8 .9 3 2 1 .2 7 3 0 .4 8 0 .6 81 9 9 7 -9 8 (R E ) 4 3 ,6 8 6 1 8 ,6 8 0 2 4 ,8 8 6 9 0 7 8 6 3 4 5 5 0 .5 9 2 1 .6 3 2 8 .8 2 1 .0 51 9 9 8 -9 9 (B E ) 4 8 ,0 6 8 2 3 ,2 7 5 2 4 ,6 8 2 5 ,0 0 0 9 1 ,0 2 5 52 .81 2 5 .5 7 2 7 .1 2 5 .4 9
@ : I n c lu d e s b o n u s s h a re s R s . 5 3 0 c r o r e a n d R s .1 ,0 3 5 c r o r e i n 1 9 9 4 -9 5 a n d 1 9 9 5 -9 6 , r e s p e c t iv e ly . S o u rc e : 1 ) B u d g e t D o c u m e n ts o f G o v e r n m e n t o f I n d ia .
2 ) A r t ic le s o n F in a n c e s o f C e n t r a l G o v e r n m e n t .
65

Appendix Table 10 : Decomposition of Gross Fiscal Deficit - State Governments
(Rupees crore)
FiscalYear
RevenueDeficit
CapitalOutlay
NetLending
GrossFiscalDeficit(2+3+4)
Percentage to Gross Fiscal Deficit
Revenue Capital Net Deficit Outlay Lending
1 2 3 4 5 6 7 8
1970-71 19 556 326 901 2.11 61.71 36.181971-72 -6 668 388 1,050 -0.57 63.62 36.951972-73 70 741 538 1,349 5.19 54.93 39.881973-74 117 984 369 1,470 7.96 66.94 25.101974-75 -395 1,110 528 1,243 -31.78 89.30 42.481975-76 -972 1,404 670 1,102 -88.20 127.40 60.801976-77 -1,097 1,655 957 1,515 -72.41 109.24 63.171977-78 -1,019 1,854 1,203 2,038 -50.00 90.97 59.031978-79 -1,135 2,287 1,491 2,643 -42.94 86.53 56.411979-80 -1,548 2,675 1,746 2,873 -53.88 93.11 60.771980-81 -1,485 3,200 1,998 3,713 -39.99 86.18 53.81
1981-82 -1,379 3,589 1,853 4,063 -33.94 88.33 45.611982-83 -888 3,719 2,155 4,986 -17.81 74.59 43.22
1983-84 211 * 4,277 1,871 6,359 3.32 67.26 29.42
1984-85 924 4,911 2,363 8,198 11.27 59.90 28.82
1985-86 -654 5,453 2,722 7,521 -8.70 72.50 36.19
1986-87 -170 6,277 3,162 9,269 -1.83 67.72 34.111987-88 1,088 6,654 3,478 11,220 9.70 59.30 31.00
1988-89 1,807 7,078 2,787 11,672 15.48 60.64 23.881989-90 3,682 7,964 3,787 15,433 23.86 51.60 24.54
1990-91 5,309 9,223 4,255 18,787 28.26 49.09 22.65
1991-92 5,651 10,096 3,153 18,900 29.90 53.42 16.68
1992-93 5,114 10,655 5,122 20,891 24.48 51.00 24.52
1993-94 3,812 12,450 4,334 20,596 18.51 60.45 21.04
1994-95 6,156 17,351 4,190 27,697 22.23 62.65 15.13
1995-96 8,201 18,495 4,730 31,426 26.10 58.85 15.05
1996-97 16,114 17,540 3,791 37,444 43.03 46.84 10.12
1997-98 (RE) 19,636 23,958 7,455 51,049 38.47 46.93 14.60
1998-99 (BE) 25,635 24,412 7,230 59,277 43.25 41.18 12.20
(-) : Indicates Surplus.Source : Budget Documents of State Governments.
66

Appendix Table 11 : Financing of Gross Fiscal Deficit - Central Government
(Rupees crore)
F is c a lY e a r
E x te rn a lF in a n c e
In t e r n a l F in a n c e T o ta lI n t e r n a lF in a n c e(3 + 4 + 5 )
T o ta l F in a n c e
G ro s s F is c a l D e f ic i t (2 + 6 )
P e rc e n ta g e to T o ta l F in a n c e / G ro s s F is c a l D e f ic i t
M a r k e tB o r r o w
in g s
O th e rL ia b i l i t ie s
C o n v e n t io n a lD e f ic i t
E x te rn a lF in a n c e
M a r k e tB o r r o w in g s
O th e rL ia b i l i t ie s
C o n v e n t io n a l
D e f ic i t
T o ta lIn t e r n a lF in a n c e
1 2 3 4 5 6 7 8 9 10 11 12
1950 -51 4 -11 56 4 49 53 7 .55 -2 0 .7 5 105 .66 7 .5 5 9 2 .451951 -52 58 -3 4 -6 9 -4 5 10 68 85 .29 -5 0 .0 0 •■101.47 -6 6 .1 8 14.711952 -53 29 -5 25 64 84 113 25 .6 6 -4 .4 2 22 .12 56 .6 4 7 4 .3 4195 3 -54 -1 -3 7 128 81 172 171 -0 .5 8 -2 1 .6 4 74 .85 47 .3 7 100 .581954 -55 - - 2 05 142 3 4 7 3 47 0 .00 0 .00 59 .0 8 40 .9 2 100 .001 95 5 -5 6 -1 3 5 150 160 3 4 5 3 4 4 -0 .2 9 10 .17 43 .6 0 46.51 100 .29195 6 -57 8 78 99 185 3 62 3 70 2 .1 6 21 .0 8 26 .7 6 50 .00 97 .8 41957 -58 25 69 65 459 593 6 18 4 .0 5 11 .17 10 .52 7 4 .2 7 95 .951 95 8 -59 1 90 2 0 6 101 2 22 529 7 19 26 .4 3 28 .6 5 1 4 .05 30 .8 8 73 .5 71959 -60 178 112 2 58 170 5 40 718 24 .7 9 15 .60 3 5 .9 3 23 .68 75 .211960 -61 2 47 72 5 84 -1 1 7 539 7 86 31 .4 2 9 .1 6 74 .30 -1 4 .8 9 68 .581961 -62 2 49 65 3 05 115 4 85 7 34 3 3 .9 2 8 .8 6 41 .5 5 15 .67 66 .081962 -63 2 93 97 4 40 156 693 9 86 29 .72 9 .84 4 4 .6 2 15 .82 70 .281 96 3 -64 321 191 4 49 167 807 1 ,128 2 8 .4 6 16 .93 3 9 .8 0 14 .80 71 .5 41964 -65 4 85 108 5 34 172 814 1 ,299 37 .3 4 8.31 41.11 13 .24 62 .6 61 96 5 -6 6 4 82 124 4 23 173 7 20 1 ,202 40 .1 0 10 .32 3 5 .1 9 14 .39 5 9 .901 96 6 -6 7 7 05 93 6 12 2 95 1 ,000 1 ,705 41 .3 5 5 .45 3 5 .8 9 17 .30 5 8 .651967 -68 601 94 531 2 06 831 1 ,432 41 .9 7 6 .5 6 3 7 .08 14 .39 58 .031968 -69 4 77 79 2 85 2 62 626 1 ,103 4 3 .2 5 7 .1 6 2 5 .8 4 23 .7 5 56 .75196 9 -70 5 44 143 3 43 4 6 532 1 ,076 50 .56 13 .29 3 1 .8 8 4 .2 8 49 .4 41970 -71 3 32 144 6 47 2 86 1 ,077 1 ,409 23 .5 6 10 .22 45 .9 2 20 .3 0 76 .4 41971 -72 3 4 7 298 562 520 1 ,380 1 ,727 20 .0 9 17 .26 32 .5 4 30.11 79 .911972 -73 2 93 4 87 109 870 1 ,466 1 ,759 1 6 .66 2 7 .69 6 .2 0 4 9 .4 6 8 3 .3 41 97 3 -7 4 -1 ,3 0 0 4 72 2 ,2 3 3 3 28 3 ,0 3 3 1 ,733 -75 .01 27 .2 4 128 .85 18 .93 175 .011974 -75 551 481 551 720 1 ,752 2 ,303 23 .9 3 2 0 .89 23 .9 3 3 1 .2 6 76 .0 71 97 5 -76 1 ,072 4 5 6 1 ,135 3 66 1 ,957 3 ,0 2 9 35 .3 9 15 .05 3 7 .4 7 12 .08 64.611 97 6 -77 1 ,0 0 6 8 45 1 ,820 130 2 ,7 9 5 3 ,801 26 .4 7 2 2 .23 47 .8 8 3 .4 2 73 .531 97 7 -78 3 7 4 1 ,185 1 ,188 9 34 3 ,3 0 7 3 ,681 10 .16 3 2 .1 9 3 2 .2 7 25 .3 7 89 .8 41 97 8 -79 3 8 4 1 ,653 2 ,1 6 7 1 ,506 5 ,3 2 6 5 ,710 6 .7 3 2 8 .95 37 .95 26 .3 7 9 3 .2 71 97 9 -80 5 84 2 ,001 1 ,3 7 4 2 ,433 5 ,808 6 ,392 9 .1 4 3 1 .3 0 2 1 .5 0 3 8 .0 6 90 .8 61980 -81 1 ,281 2 ,6 7 9 1 ,862 2 ,4 7 7 7 ,018 8 ,299 15 .44 3 2 .2 8 22 .4 4 29 .8 5 8 4 .5 61981 -82 9 64 2 ,9 1 3 3 ,3 8 9 1 ,400 7 ,702 8 ,6 6 6 11 .12 33.'61 39.11 16 .16 88 .881982 -83 1 ,258 3 ,771 3 ,9 4 2 1 ,656 9 ,3 6 9 1 0 ,627 11 .84 35 .4 9 37 .0 9 15 .58 88 .1 61 98 3 -84 1 ,338 4 ,0 3 8 6 ,2 3 7 1 ,417 11 ,692 13 ,030 10 .27 3 0 .9 9 4 7 .8 7 1 0 .87 8 9 .731 98 4 -8 5 1 ,452 4 ,0 9 5 8 ,1 2 4 3 ,7 4 5 15 ,9 64 17 ,4 16 8 .3 4 23.51 46 .6 5 21 .5 0 91 .6 61 98 5 -8 6 1 ,449 4 ,8 8 4 10 ,209 5 ,315 20 ,4 08 21 ,8 57 6 .63 22 .3 5 46 .71 24 .3 2 9 3 3 71 98 6 -87 2 ,0 2 4 5 ,532 10 ,525 8 ,261 24 ,3 18 26 ,3 42 7 .6 8 21 .0 0 3 9 .9 6 31 .3 6 92 .321987 -88 2 ,8 9 3 5 ,862 12 ,473 5 ,8 1 6 24 ,151 27 ,0 44 10 .70 21 .6 8 46 .1 2 21.51 89 .3 01988 -89 2 ,4 6 0 8 ,4 1 8 14 ,403 5 ,642 28 ,4 63 30 ,9 23 7 .9 6 27 .22 46 .5 8 18 .25 92 .0 41 98 9 -90 2 ,5 9 5 7 ,4 0 4 15 ,041 10 ,592 3 3 ,0 3 7 35 ,6 32 7 .28 20 .7 8 42 .21 29 .7 3 92 .721990 -91 3 ,181 8 ,001 22 ,1 03 11 ,3 47 41 ,451 44 ,6 32 7 .13 17 .93 49 .5 2 2 5 .4 2 92 .8 71 99 1 -92 5 ,421 7 ,5 1 0 16 ,539 6 ,855 3 0 ,9 0 4 36 ,3 25 14 .92 20 .6 7 45 .5 3 18 .87 85 .081 99 2 -93 5 ,3 1 9 3 ,6 7 6 18 ,8 66 12 ,312 3 4 ,8 5 4 40 ,1 73 13 .24 9 .15 4 6 .9 6 3 0 .6 5 8 6 .7 61 99 3 -9 4 5 ,0 7 4 2 8 ,5 3 7 15 ,6 86 10 ,9 60 55 ,1 83 60 ,2 57 8 .42 47 .3 6 2 6 .0 3 18 .19 9 1 .581994 -95 5 ,1 4 6 2 0 ,1 0 5 31 ,4 92 961 52 ,5 58 57 ,7 04 8 .92 34 .8 4 5 4 .58 1 .67 9 1 .081 99 5 -9 6 3 18 3 3 ,0 8 7 17 ,031 9 ,8 0 7 59 ,9 25 60 ,2 43 0 .5 3 5 4 .92 2 8 .2 7 16 .28 9 9 .4 71 99 6 -9 7 2 ,9 8 7 2 0 ,0 0 6 3 0 ,5 5 6 1 3 ,184 6 3 ,7 4 6 66 ,7 33 4 .48 2 9 .5 3 4 5 .7 9 1 9 .7 6 9 5 .5 21 99 7 -9 8 (R E ) 1 ,202 4 2 ,4 8 4 40 ,3 35 2 ,3 2 4 85 ,1 43 86 ,3 45 1 .39 4 9 .2 0 46 .71 2 .6 9 98 .611 99 8 -9 9 (B E ) 2 ,3 3 7 4 8 ,3 2 6 4 0 ,3 6 2 - 8 8 ,6 88 91 ,025 2 .5 7 53 .0 9 4 4 .3 4 - 9 7 .4 3
S o u rc e : 1 ) B u d g e t D o c u m e n ts o f G o v e r n m e n t o f In d ia .2 ) A r t ic le s o n F in a n c e s o f C e n t r a l G o v e rn m e n t .
67

Appendix Table 12 : Financing of Gross Fiscal Deficit - State Governments
(Rupees crore)
F is c a lY e a r
L o a n s f r o m th e
C e n tre
C o n v e n t io n a lD e f ic i t
M a r k e tB o r r o w
in g s
O th e r G ro s s S ta te s ' F is c a l C a p i ta l D e f ic i t
R e c e ip ts (2 + 3 + 4 + 5 )
P e rc e n ta g e to G ro s s F is c a l D e f ic i t
L o a n s f r o m th e
C e n tre
C o n v e n t io n a lD e f ic i t
M a r k e tB o r r o w
in g s
O th e r S ta te s ' C a p i ta l
R e c e ip ts
1 2 3 4 5 6 7 8 9 10
1970-71 371 141 109 280 901 41 .18 15 .65 12 .10 3 1 .08
1971 -72 391 2 89 104 2 66 1 ,050 37 .2 4 2 7 5 2 9 .9 0 2 5 .3 3
1972 -73 1 ,260 -4 1 4 135 368 1 ,349 93 .40 -3 0 .6 9 10.01 27 .28
1973 -74 6 19 2 25 163 463 1 ,470 42.11 1 5 3 1 11 .09 31 .5 0
1974 -75 570 31 215 4 2 7 1 ,243 45 .8 6 2 .49 17 .30 3 4 3 5
1975 -76 532 -7 5 273 372 1 ,102 48 .28 -6 .81 2 4 .7 7 33 .7 6
1976 -77 727 -4 8 183 653 1 ,515 47 .99 -3 .1 7 12 .08 43 .1 0
1977 -78 1 ,121 229 182 5 06 2 ,038 55 .00 11 .24 8 .93 2 4 .83
1978 -79 2 ,361 -1 ,0 1 0 180 1 ,112 2 ,643 8 9 3 3 -3 8 2 1 6.81 42 .0 7
1979 -80 1 ,866 188 185 634 2 ,873 64 .95 6 .5 4 6 .4 4 22 .07
1980 -81 1 ,564 897 199 1,053 3 ,713 42 .12 24 .16 5 .3 6 28 .3 6
1981 -82 1 ,999 1 ,020 3 39 705 4 ,063 49 .2 0 25 .10 8 .34 17 .35
1982 -83 1 ,999 5 20 3 93 2 ,0 7 4 4 ,9 8 6 40 .09 10 .43 7 .88 41 .6 0
1 98 3 -84 2 ,7 3 5 561 563 2 ,5 0 0 6 ,359 43 .01 8 .8 2 8 .8 5 39 .31
1984 -85 3 ,5 8 0 1 ,438 693 2 ,487 8 ,198 43 .67 17 .54 8 .45 3 0 .3 4
1985 -86 5 ,7 5 7 1 ,688 1 ,010 -9 3 4 7 ,521 76 .55 22 .44 13 .43 -1 2 .4 2
1986 -87 4 ,7 8 6 6 66 1 ,147 2 ,670 9 ,269 51 .63 7 .19 12 .37 28.81
1987 -88 5 ,8 3 6 6 6 1 ,523 3 ,795 11 ,220 52 .01 0 5 9 13 5 7 33 .82
1988 -89 6 ,6 8 8 -3 8 0 1 ,973 3 ,391 11,672 5 7 .30 -3 .2 6 16 .90 29 .0 5
198 9 -90 7 ,9 1 7 161 2 ,2 9 8 5 ,0 5 7 15 ,433 5 1 3 0 1 .04 14 .89 32 .7 7
1990 -91 9 ,9 7 8 -7 2 2 ,5 5 6 6 ,325 18 ,787 53 .11 - 0 3 8 13.61 33 .6 7
1991 -92 9 ,375 156 3 ,3 0 5 6 ,064 18 ,900 49 .60 0 .83 17 .49 32 .0 8
1992 -93 8 ,9 2 2 -1 ,8 2 9 3 ,500 10,298 20 ,891 42 .71 -8 .7 5 16 .75 49 .2 9
1 99 3 -9 4 9 ,533 462 3 ,6 2 0 6 ,981 20 ,5 9 6 46 .29 2 .2 4 17 .58 33 .8 9
1994 -95 14 ,760 -4 ,4 6 8 4 ,0 7 5 13,330 27 ,6 97 53 .29 -1 6 .1 3 14.71 48 .1 3
1 99 5 -9 6 16 ,569 2 ,651 6 ,1 0 0 8 ,915 34 ,2 35 48 .40 7 .7 4 17 .82 88 .87
1996 -97 7 ,5 4 7 -7 ,041 6 ,5 1 5 30 ,4 23 37 ,4 44 20 .1 6 -1 8 .8 0 17 .40 61 .15
199 7 -98 (R E ) 24 ,261 -3 ,2 4 2 7 ,134 22 ,8 96 51 ,0 49 4 7 5 2 - 6 3 5 13 .97 4 4 .8 5
1 99 8 -99 (B E ) 28 ,691 -3 ,23 2 7 ,5 0 6 2 6 ^ 1 2 5 9 ,2 7 7 48 .4 0 -5 .4 5 12 .66 4 4 3 9
(- ) : In d ic a te s S u r p lu s .S o u rc e : B u d g e t D o c u m e n ts o f S ta te G o v e rn m e n ts .
68

A p p e n d ix T a b le 1 3 : O v e r a l l B u d g e t a r y B a la n c e o f C e n t r a l a n d S ta te G o v e r n m e n t a n d U n io n T e r r i t o r i e s ( i n c l u d i n g e x t r a - b u d g e ta r y r e s o u r c e s o f P u b l i c S e c to r U n d e r t a k in g s f o r f i n a n c in g t h e i r P la n s )
(R u p e e s c ro re )
F is c a lY e a r
E x p e n d i t u r e R e c e ip ts P S B R(2 -4 )
P S B R /G D P
F in a n c e d b y
A m o u n t % t o G D P A m o u n t % t o G D P D o m e s t i c N e t B u d g e t a r y C a p i t a l E x te r n a l D e f i c i t
R e c e ip ts A s s is ta n c e
1 2 3 4 5 6 7 8 9 10
1 9 7 0 -7 1 8 ,2 0 7 19 .01 6 ,0 6 4 1 4 .0 5 2 ,1 4 3 4 .9 6 1 3 3 7 3 8 2 4 2 4
1 9 7 1 -7 2 9 ,8 7 5 2 1 .3 5 7 ,0 3 6 15 .2 1 2 ,8 3 9 6 .1 4 1 ,5 7 7 6 2 2 6 4 0
1 9 7 2 -7 3 1 1 ,2 4 2 2 2 .0 4 8 ,0 7 5 1 5 .8 3 3 ,1 6 7 6 .2 1 2 ,0 1 5 4 0 0 8 52
1 9 7 3 -7 4 1 2 ,2 5 2 1 9 .7 6 8 ,9 8 6 1 4 .4 9 3 ,2 6 6 5 .2 7 2 ,2 3 1 4 9 2 5 4 3
1 9 7 4 -7 5 1 5 ,6 8 9 2 1 .4 2 1 1 ,7 6 0 1 6 .0 6 3 ,9 2 9 5 3 6 2 ,4 8 0 7 5 8 691
1 9 7 5 -7 6 1 8 ,9 3 3 2 4 .0 4 1 4 ,0 9 5 1 7 .9 0 4 ,8 3 8 6 .1 4 3 ,0 9 4 1 ,7 5 7 -1 3
1 9 7 6 -7 7 2 1 ,1 9 6 2 4 .9 7 1 5 ,7 5 9 1 8 .5 6 5 ,4 3 7 6 .4 0 3 ,9 1 0 1 3 9 3 1 34
1 9 7 7 -7 8 2 3 ,1 2 7 2 4 .0 7 1 7 ,1 0 7 17 .81 6 ,0 2 0 6 .2 7 4 3 0 4 7 0 0 1 ,0 1 6
1 9 7 8 -7 9 2 7 ,4 4 7 2 6 .3 4 2 0 ,0 5 4 1 9 .2 5 7 3 9 3 7 .1 0 6 ,0 4 9 7 1 3 631
1 9 7 9 -8 0 3 1 ,1 1 7 27 .2 1 2 2 ,5 4 5 19 .71 8 ,5 7 2 7 .5 0 5 ,0 2 1 8 9 0 2 ,6 6 1
1 9 8 0 -8 1 3 6 ,8 4 5 2 7 .0 9 2 4 ,5 6 3 1 8 .0 6 1 2 ,2 8 2 9 .0 3 7 ,1 6 1 1 ,6 7 0 3 ,4 5 1
1 9 8 1 -8 2 4 3 ,7 3 8 2 7 .3 8 3 0 ,4 2 5 1 9 .0 4 1 3 3 1 3 8 3 3 9 ,4 9 3 1 3 0 1 2 ,5 1 9
1 9 8 2 -8 3 5 2 ,7 4 7 29 .61 3 5 ,7 9 6 2 0 .1 0 16 ,9 51 9 .5 2 1 3 ,0 1 2 1 ,5 9 1 2 3 4 9
1 9 8 3 -8 4 6 0 ,8 2 9 2 9 .3 0 4 0 ,9 8 9 1 9 .7 5 1 9 ,8 4 0 9 .5 6 1 6 ,0 9 4 1 ,6 1 1 2 ,1 3 5
1 9 8 4 -8 5 7 2 ,8 2 5 3 1 .4 8 4 7 ,0 9 8 2 0 3 6 2 5 ,7 2 7 1 1 .1 2 1 8 ,7 6 5 1 ,8 5 7 5 ,1 0 5
1 9 8 5 -8 6 8 3 ,9 6 1 3 2 .0 2 5 6 ,7 7 3 2 1 .6 5 2 7 ,1 8 8 1 0 3 7 2 1 ,8 9 9 1 ,8 5 0 3 ,4 3 9
1 9 8 6 -8 7 1 0 0 ,7 9 0 34 .4 1 6 4 ,8 2 3 2 2 .1 3 3 5 ,9 6 7 1 2 .2 8 2 4 ,4 3 9 2 3 7 8 9 ,1 5 0
1 9 8 7 -8 8 1 1 2 ,1 6 9 3 3 .6 6 7 3 ,4 8 5 2 2 .0 5 3 8 ,6 8 4 11 .61 2 9 ,4 1 5 3 ,7 6 5 5 ,5 0 4
1 9 8 8 -8 9 1 3 0 ,0 4 8 3 2 .8 6 8 5 ,7 1 4 2 1 .6 6 5 6 ,5 6 3 1 4 .2 9 3 6 ,1 7 2 3 ,0 6 0 5 ,1 0 2
1 9 8 9 -9 0 1 5 8 ,1 0 7 34 .6 1 1 0 3 ,1 1 5 2 2 .5 7 7 2 3 9 3 1 5 .8 5 4 0 ,8 1 2 3 3 6 7 1 0 ,6 1 3
199 0 -91 1 7 6 ,5 4 8 3 2 .9 7 1 1 0 ,6 0 7 2 0 .6 5 65 ,9 4 1 1 2 3 1 5 0 ,1 9 2 4 ,2 6 3 1 1 ,4 8 6
1 9 9 1 -9 2 1 9 9 ,3 7 0 3 2 .3 2 1 3 3 3 3 4 2 1 .7 0 6 5 ,5 3 6 1 0 .6 3 5 2 ,2 8 4 6 ,1 7 1 7 ,0 8 1
1 9 9 2 -9 3 2 2 4 ,6 8 8 3 1 .8 3 1 5 3 ,1 9 5 2 1 .7 0 7 1 ,4 9 3 1 0 .1 3 5 2 ,9 6 9 5 ,9 8 4 1 2 ,5 4 0
1 9 9 3 -9 4 2 5 8 ,4 5 9 3 1 .8 8 1 6 9 ,8 3 2 2 0 .9 5 8 8 ,6 2 7 1 0 .9 3 7 0 ,2 1 6 5 ,9 3 4 1 2 ,4 7 7
1 9 9 4 -9 5 3 00 ,8 8 1 3 1 .2 3 2 0 2 ,3 1 0 2 1 .0 0 9 8 ,5 7 1 1 0 .2 3 9 6 /2 4 7 4 ,6 1 9 -2 ,2 9 5
1 9 9 5 -9 6 3 4 0 ,3 1 0 30 .4 1 2 4 1 ,4 2 8 2 1 .5 8 9 8 ,8 8 2 8 .8 4 7 2 ,1 1 9 1 ,4 5 6 2 5 3 1 0
1 9 9 6 -9 7 (R E ) 3 8 4 ,2 3 6 3 0 .0 9 2 6 7 ,1 9 6 2 0 .9 2 1 1 7 ,0 4 0 9 .1 7 9 9 3 7 0 3 ,7 8 8 1 3 ,8 8 2
1 9 9 7 -9 8 (B E ) 4 4 5 ,1 9 3 3 1 .4 5 3 1 6 ,9 5 7 2 2 3 9 1 2 8 ,2 3 6 9 .0 6 1 2 0 3 8 8 3 3 3 6 4 3 1 2
Source : Economic Survey, Government of India, various issues.
69

Appendix Table 14 : Primary Deficit (PD) - Central Government
(Rupees crore)
F is c a lY e a r
R e c e ip ts (P D 1 ) E x p e n d i t u r e (P D 1 , P D 2 )
P r im a r y D e f i c i t 1 (4 -2 )
R e c e ip t;s (P D 2 ) P r im a r y D e f i c i t 2 (4 -8 )
A m o u n t % t o G D P A m o u n t % to G D P A m o u n t % to G D P A m o u n t % t o G D P A m o u n t % to G D P
1 2 3 4 5 6 7 8 9 10 11
195 0 -51 4 0 6 4 .3 3 3 9 3 4 .2 0 -1 3 -0 .1 4 371 3 .9 6 22 0 .2 31 9 5 1 -5 2 510 5 .1 2 5 08 5 .1 0 -2 -0 .0 2 4 73 4 .7 5 3 5 0 .3 51 9 5 2 -5 3 4 35 4 .4 5 4 7 7 4 .8 8 42 0 .4 3 3 9 3 4 .0 2 8 4 0 .8 61 9 5 3 -5 4 4 1 6 3 .91 509 4 .7 8 93 0 .8 7 371 3 .4 9 138 1 .301 9 5 4 -5 5 4 5 6 4 .5 3 7 20 7 .1 5 2 6 4 2 .6 2 4 04 4 .01 3 1 6 3 .1 41 9 5 5 -5 6 481 4 .6 9 7 34 7 .1 6 2 53 2 .4 7 4 2 3 4 .1 2 311 3 .0 31 9 5 6 -5 7 5 63 4 .61 8 34 6 .8 3 271 2 .2 2 4 9 0 4 .01 3 4 4 2 .8 21 9 5 7 -5 8 6 73 5 .3 4 1 ,17% 9 .31 5 00 3 .9 7 5 8 6 4 .6 5 5 87 4 .6 61 9 5 8 -5 9 6 70 4 .7 7 1 ,253 8 .9 3 5 83 4 .1 5 5 7 0 4 .0 6 6 83 4 .8 71 9 5 9 -6 0 7 79 5 .2 7 1 ,3 2 7 8 .9 7 548 3 .7 0 665 4 .5 0 6 62 4 .4 8196 0 -61 8 77 5 .41 1 ,475 9 .1 0 5 98 3 .6 9 7 46 4 .6 0 7 29 4 .5 01 9 6 1 -6 2 1 ,0 3 7 6 .0 4 1 ,562 9 .0 9 525 3 .0 6 8 93 5 .2 0 6 69 3 .8 91 9 6 2 -6 3 1 ,4 2 7 7 .7 2 2 ,1 7 3 11 .7 6 7 4 6 4 .0 4 1 ,2 7 4 6 .9 0 8 99 4 .8 71 9 6 3 -6 4 1 ,8 4 6 8 .6 9 2 ,701 12 .72 8 55 4 .0 3 1 ,602 7 .5 4 1 ,0 9 9 5 .1 71 9 6 4 -6 5 2 ,081 8 .4 0 3 ,0 6 9 12 .39 9 8 8 3 .9 9 1 ,8 2 4 7 .3 7 1 ,2 4 5 5 .0 31 9 6 5 -6 6 2 ,3 4 5 8 .9 7 3 ,1 8 2 12 .1 7 8 3 7 3 .2 0 2 ,0 3 7 7 .7 9 1 ,1 4 5 4 .3 81 9 6 6 -6 7 2 ,5 0 0 8 .4 5 3 ,7 4 7 12 .6 7 1 ,2 4 7 4 .2 2 2 ,1 2 2 7 .1 8 1 ,6 2 5 5 .5 01 9 6 7 -6 8 2 ,5 8 6 7 .4 7 3 ,521 1 0 .1 7 9 3 5 2 .7 0 2 ,161 6 .2 4 1 ,3 6 0 3 .9 31 9 6 8 -6 9 2 ,7 9 3 7 .6 2 3 ,3 7 3 9 .2 0 5 80 1 .5 8 2 ,2 7 8 6.21 1 ,095 2 .9 91 9 6 9 -7 0 3 ,0 6 7 7 .5 9 3 ,5 8 3 8 .8 7 5 1 6 1 .28 2 ,4 7 2 6 .1 2 1 ,111 2 .7 5197 0 -71 3 ,3 4 2 7 .7 4 4 ,1 4 4 9 .6 0 8 02 1 .8 6 2 ,7 6 7 6 .41 1 ,3 7 7 3 .1 91 97 1 -7 2 3 ,8 6 8 8 .3 6 4 ,9 2 5 10 .65 1 ,0 5 7 2 .2 9 3 ,2 6 9 7 .0 7 1 ,6 5 6 3 .5 81 97 2 -7 3 4 ,5 2 3 8 .8 7 5 ,9 2 6 11 .62 1 ,403 2 .7 5 3 ,8 1 0 7 .4 7 2 ,1 1 6 4 .1 51 9 7 3 -7 4 5 ,0 1 4 8 .0 9 5 ,8 6 5 9 .4 6 851 1 .3 7 4 ,2 7 8 6 .9 0 1 ,5 8 7 2 .5 61 97 4 -7 5 6 ,4 4 2 8 .8 0 7 ,7 4 3 10 .5 7 1 ,301 1 .78 5 ,6 6 6 7 .7 4 2 ,0 7 7 2 .8 41 9 7 5 -7 6 7 ,8 6 4 9 .9 8 9 ,6 6 5 12 .2 7 1 ,801 2 .2 9 6 ,9 3 0 8 .8 0 2 ,7 3 5 3 .4 71 9 7 6 -7 7 8 ,5 6 8 10 -09 10 ,8 82 12 .82 2 ,3 1 4 2 .7 3 7 ,4 6 3 8 .7 9 3 ,4 1 9 4 .0 31 9 7 7 -7 8 9 ,5 3 8 9 .9 3 11 ,5 72 12 .05 2 ,0 3 4 2 .1 2 8 ,0 9 7 8 .4 3 3 ,4 7 5 3 .6 21 9 7 8 -7 9 1 0 ,9 7 4 10 .5 3 14 ,7 00 14 .11 3 ,7 2 6 3 .5 8 9 ,5 4 7 9 .1 6 5 ,1 5 3 4 .9 51 9 7 9 -8 0 1 1 ,1 0 9 9 .71 15 ,2 09 13 .30 4 ,1 0 0 3 .5 9 9 ,7 4 9 8 .5 3 5 ,4 6 0 4 .7 71 98 0 -8 1 1 2 ,3 7 3 9 .1 0 1 8 ,0 6 8 1 3 .2 8 5 ,6 9 5 4 .1 9 1 0 ,5 7 8 7 .7 8 7 ,4 9 0 5 .511 98 1 -8 2 1 5 ,0 1 6 9 .4 0 2 0 ,4 8 7 12 .82 5 ,471 3 .4 2 12 ,801 8 .01 7 ,6 8 6 4 .811 9 8 2 -8 3 1 7 ,4 3 4 9 .7 9 2 4 ,1 2 3 13 .5 4 6 ,6 8 9 3 .7 6 14 ,5 82 8 .1 9 9 ,541 5 .3 61 9 8 3 -8 4 19 ,7 11 9 .5 0 2 7 ,9 4 6 1 3 .4 6 8 ,2 3 5 3 .9 7 1 7 ,0 4 3 8 .21 1 0 ,9 0 3 5 .2 51 98 4 -8 5 2 3 ,4 6 6 10 .1 4 3 4 ,9 0 8 15 .0 9 1 1 ,4 4 2 4 .9 5 19 ,5 03 8 .4 3 1 5 ,4 0 5 6 .6 61 9 8 5 -8 6 2 8 ,0 3 5 10 .69 42 ,3 81 16 .1 6 1 4 ,3 4 6 5 .4 7 2 3 ,4 4 0 8 .9 4 18 ,941 7 .2 21 9 8 6 -8 7 3 3 ,0 8 3 11 .2 9 5 0 ,1 7 9 17 .1 3 1 7 ,0 9 6 5 .8 4 2 7 ,7 3 0 9 .4 7 2 2 ,4 4 9 7 .6 61 98 7 -8 8 3 7 ,0 3 7 1 1 .12 5 2 ,8 3 0 15 .8 6 1 5 ,7 9 3 4 .7 4 3 1 ,2 8 2 9 .3 9 2 1 ,5 4 8 6 .4 71 9 8 8 -8 9 43 ,5 91 11.01 6 0 ,2 3 6 15 .22 1 6 ,6 4 5 4 .21 3 6 ,6 1 0 9 .2 5 2 3 ,6 2 6 5 .9 71 9 8 9 -9 0 5 2 ,2 9 6 11 .45 7 0 ,171 15 .3 6 1 7 ,8 7 5 3 .91 4 3 ,8 2 2 9 .5 9 2 6 ,3 4 9 5 .7 71990 -91 5 4 ,9 5 4 10 .2 6 7 8 ,0 8 8 14 .5 8 2 3 ,1 3 4 4 .3 2 4 6 ,2 2 4 8 .6 3 3 1 ,8 6 4 5 .9 51 99 1 -9 2 6 9 ,0 6 9 11 .2 0 7 8 ,7 9 7 12 .78 9 ,7 2 8 1 .58 5 8 ,1 3 6 9 .4 3 2 0 ,6 61 3 .3 51 99 2 -9 3 7 6 ,0 8 9 10 .78 8 5 1 8 7 12 .0 7 9 ,0 9 8 1 .29 6 3 ,6 0 2 9 .01 2 1 ,5 8 5 3 .0 61 9 9 3 -9 4 7 5 ,4 0 5 9 .3 0 9 8 ,9 2 1 12 .2 0 2 3 ,5 1 6 2 .9 0 6 0 ,3 2 7 7 .4 4 3 8 ,5 9 4 4 .7 61 99 4 -9 5 9 6 ,6 9 0 1 0 .0 4 1 10 ,3 3 4 11 .45 1 3 ,6 4 4 1 .42 8 0 ,8 9 3 8 .4 0 2 9 ,4 41 3 .0 61 9 9 5 -9 6 1 1 1 ,5 2 7 9 .9 7 1 21 ,72 5 10 .88 1 0 ,1 9 8 0 .91 9 3 ,1 0 8 8 .3 2 2 8 ,6 1 7 2 .5 61 9 9 6 -9 7 1 2 6 ,7 3 4 9 .9 2 1 3 3 ,9 8 9 10 .4 9 7 ,2 5 5 0 .5 7 1 04 ,6 2 8 8 .1 9 2 9 3 6 1 2 .3 01 9 9 7 -9 8 (R E ) 1 39 ,421 9 .8 5 1 60 ,0 6 6 11.31 2 0 ,6 4 5 1 .4 6 1 14 ,0 9 4 8 .0 6 4 5 ,9 7 2 3 .2 51 9 9 8 -9 9 (B E ) 1 6 6 ,9 9 4 10 .2 7 1 83 ,0 1 9 11 .2 6 1 6 ,0 2 5 0 .9 9 1 39 ,04 0 8 .5 5 4 3 ,9 7 9 2 .71
S o u rc e : 1 ) B u d g e t D o c u m e n ts o f G o v e r n m e n t o f I n d ia .2 ) A r t ic le s o n F in a n c e s o f C e n t r a l G o v e r n m e n t .
70

A p p e n d ix T a b le 1 5 : P r im a r y D e f i c i t (P D ) - S ta te G o v e r n m e n ts
(Rupees crore)
F is c a lY e a r
R e c e ip ts (P D 1 ) E x p e n d itu r e (P D 1 , P D 2 )
P r im a r y D e f ic i t 1 R e ce ip t:s (P D 2 ) P r im a r y D e f ic i t 2
A m o u n t % t o G D P A m o u n t % t o G D P A m o u n t % to G D P A m o u n t % to G D P A m o u n t % t o G D P
1 2 3 4 5 6 7 8 9 10 11
1970 -71 3 ,371 7 .81 3 ,8 7 4 8 .9 8 503 1 .1 7 3 ,1 8 8 7 .39 6 8 6 1 .59
1971 -72 4 ,0 4 5 8 .7 4 4 ,6 3 9 10 .03 5 94 1 .28 3 ,831 8 .2 8 808 1 .75
1 97 2 -73 4 ,9 1 2 9 .6 3 5 ,791 1 1 3 5 8 79 1 .72 4 ,6 7 2 9 .1 6 1 ,1 1 9 2 .1 9
1 9 7 3 -7 4 5 ,5 5 2 8 .9 5 6 ,4 7 0 10 .4 3 9 1 8 1 .4 8 5 ,2 2 4 8 .42 1 ,2 4 6 2 .01
1 97 4 -7 5 6 ,4 3 2 8 .7 8 7 ,1 3 6 9 .7 4 7 04 0 .9 6 6 ,1 0 3 8 .3 3 1 ,033 1.41
1 97 5 -7 6 7 ,9 3 8 10 .08 8 ,352 10 .60 4 14 0 .5 3 7 ,561 9 .6 0 791 1 .00
1 97 6 -7 7 9 ,0 3 7 10 .65 9 ,795 11 .54 7 58 0 .8 9 8 ,5 4 2 10 .0 6 1 ,253 1 .48
197 7 -78 9 ,931 10 .34 11 ,1 47 11 .60 1 ,2 1 6 1 .27 9 ,441 9 .8 3 1 ,706 1 .78
197 8 -79 11 ,6 47 11 .18 13 ,3 37 12 .80 1 ,690 1 .62 11 ,0 26 10 .58 2 ,311 2 .2 2
1 97 9 -8 0 13 ,6 29 11 .92 15 ,560 13.61 1,931 1 .69 12 ,932 11.31 2 ,6 2 8 2 .3 0
1980 -81 16 ,2 94 11 .98 18 ,782 13.81 2 ,4 8 8 1 .83 15 ,4 70 11 .3 7 3 ,3 1 2 2 .4 4
198 1 -82 18 ,4 54 11 .55 2 1 ,0 7 7 13 .19 2 ,6 2 3 1 .64 1 7 ,6 3 7 11 .0 4 3 ,4 4 0 2 .15
198 2 -8 3 2 1 ,1 2 5 11 .86 2 4 ,4 0 6 13 .70 3 ,281 1 .84 20 ,1 33 11 .30 4 ,2 7 3 2 .4 0
198 3 -8 4 2 4 ,0 1 4 11 .57 2 8 ,4 1 0 13 .69 4 ,3 9 6 2 .1 2 2 2 ,8 4 3 11 .00 5 ,5 6 7 2 .6 8
198 4 -85 2 7 ,4 2 6 11 .8 6 3 3 ,1 5 8 14 .33 5 ,7 3 2 2 .4 8 2 6 ,1 6 0 11.31 6 ,9 9 8 3 .0 2
1 98 5 -8 6 3 3 ,4 2 4 12 .75 3 8 ,0 0 5 14 .49 4 ,581 1 .75 3 2 ,0 5 9 12 .22 5 ,9 4 6 2 .2 7
198 6 -8 7 3 8 ,2 2 6 13 .05 4 3 ,3 9 4 14.81 5 ,1 6 8 1 .76 3 6 ,5 3 8 12 .47 6 ,8 5 6 2 .3 4
198 7 -8 8 4 4 ,0 0 0 13.21 50 ,3 22 15 .10 6 ,3 2 2 1 .90 4 2 ,0 5 3 12 .62 8 ,2 6 9 2 .4 8
1 98 8 -89 50 ,421 12 .74 56 ,1 58 14 .19 5 ,7 3 7 1 .45 48 ,0 3 4 12 .14 8 ,1 2 4 2 .0 5
1 98 9 -90 56 ,5 35 12 .38 64 ,7 82 14 .18 8 ,2 4 7 1.81 53 ,901 11 .80 10 ,881 2 .3 8
1990 -91 6 6 ,4 6 7 12.41 7 6 ,5 9 9 14 .30 10 ,1 32 1 .89 6 4 ,0 6 4 11 .9 6 12 ,5 35 2 .3 4
1 99 1 -9 2 80 ,5 35 13 .0 6 88 ,491 14 .35 7 ,9 5 6 1 .29 7 5 ,2 1 5 12 .1 9 1 3 ,2 7 6 2 .1 5
199 2 -9 3 91 ,091 12 .90 98 ,7 72 13 .99 7,681 1 .09 8 7 ,1 53 12 .35 11 ,6 19 1 .65
1 99 3 -9 4 105 ,56 4 13 .02 110 ,35 9 13.61 4 ,7 9 5 0 .5 9 100 ,83 9 12 .44 9 ,5 2 0 1 .1 7
1 99 4 -9 5 122 ,28 4 12 .69 130 ,568 13 .55 8 ,2 8 4 0 .8 6 116 ,91 9 12 .13 13 ,6 49 1 .42
1 9 9 5 -9 6 136 ,80 3 12 .23 146 ,29 7 13 .07 9 ,4 9 4 0 .85 131 ,01 0 11.71 15 ,2 87 1 .3 7
1 9 9 6 -9 7 1 5 2 ,8 3 6 11 .97 164 ,70 5 12 .90 11 ,8 69 0 .9 3 144 ,66 5 11 .3 3 2 0 ,0 4 0 1 .5 7
1 99 7 -9 8 (R E ) 1 77 ,08 4 12.51 196 ,89 7 13.91 19 ,813 1 .40 169 ,93 9 12.01 2 6 ,9 5 8 1 .90
1 99 8 -9 9 (B E ) 2 0 3 ,1 7 6 12 .50 2 26 ,0 5 4 13.91 22 ,8 78 1.41 1 96 ,29 7 12 .08 2 9 ,7 5 7 1 .83
Source : Budget Documents of State Governments.
71

Appendix Table 16 : Net Primary Deficit (NPD) - Central Government(Rupees Crore)
FiscalYear
Receipts Expenditure Net Primary Deficit
Amount % to GDP Amount % to GDP Amount % to GDP1 2 3 4 5 6 7
1950-51 371 3.96 352 3.76 -19 -0.201951-52 473 4.75 430 4.31 -43 -0.431952-53 393 4.02 364 3.72 -29 -0.301953-54 371 2.72 354 2.60 -17 -0.121954-55 404 4.01 430 4.27 26 0.261955-56 423 4.12 504 4.91 81 0.791956-57 490 4.01 616 5.04 126 1.031957-58 586 4.65 948 7.53 362 2.871958-59 570 4.06 942 6.71 372 2.651959-60 665 4.50 908 6.14 243 1.641960-61 746 4.60 1,043 6.44 297 1.831961-62 893 5.20 1,141 6.64 248 1.441962-63 1,274 6.90 1,658 8.97 384 2.081963-64 1,602 7.54 2,200 10.36 598 2.821964-65 1,824 7.3 7 2,443 9.86 619 2.501965-66 2,037 7.79 2,356 9.01 319 1.221966-67 2,122 7.18 2,759 9.33 637 2.151967-68 2,161 6.24 2,651 7.66 490 1.421968-69 2,278 6.21 2,617 7.14 339 0.921969-70 2,472 6.12 3,030 7.50 558 1.381970-71 2,767 6.41 3,515 8.14 748 1.731971-72 3,269 7.07 4,415 9.54 1,146 2.481972-73 3,810 7.47 4,737 9.29 927 1.821973-74 4,278 6.90 4,904 7.91 626 1.011974-75 5,666 7.74 6,306 8.61 640 0.871975-76 6,930 8.80 8,000 10.16 1,070 1.361976-77 7,463 8.79 8,652 10.19 1,189 1.401977-78 8,097 8.43 9,705 10.10 1,608 1.671978-79 9,547 9.16 11,116 10.67 1,569 1.511979-80 9,749 8.53 11,950 10.45 2,201 1.921980-81 10,578 7.78 14,879 10.94 4,301 3.161981-82 12,801 8.01 16,412 10.27 3,611 2.261982-83 14,582 8.19 19,469 10.93 4,887 2.741983-84 17,043 8.21 22,686 10.93 5,643 2.721984-85 19,503 8.43 28,464 12.30 8,961 3.871985-86 23,440 8.94 34,067 12.99 10,627 4.051986-87 27,730 9.47 40,873 13.95 13,143 4.491987-88 31,282 9.39 44,217 13.27 12,935 3.881988-89 36,610 9.25 50,083 12.65 13,473 3.401989-90 43,822 9.59 58,261 12,75 14,439 3.161990-91 46,224 8.63 64,148 11.98 17,924 3.351991-92 58,136 9.43 67,095 10.88 8,959 1.451992-93 63,602 9.01 75,246 10.66 11,644 1.651993-94 60,327 7.44 84,658 10.44 24,331 3.001994-95 96,690 10.04 108,740 11.29 12,050 1.251995-96 111,527 9.97 122,333 10.93 10,806 0.971996-97 126,734 9.92 135,756 10.63 9,022 0.711997-98 (RE) 139,421 9.85 160,507 11.34 21,086 1.491998-99 (BE) 166,994 10.27 186,292 11.46 19,298 1.19
Source: 1) Budget Documents of Government of India.2) Articles on Finances of Central Government.
72

Appendix Table 17 : Net Primary Deficit (NPD) - State Governments
(Rupees crore)
FiscalYear
Receipts Expenditure Net Primary Deficit
Amount % to GDP Amount % to GDP Amount % to GDP
1 2 3 4 5 6 7
1950-51 371 3.96 352 3.76 -19 -0.20
1970-71 3,188 7.39 3,548 8.22 360 0.83
1971-72 3,831 8.28 4,251 9.19 420 0.91
1972-73 4,672 9.16 5,252 10.30 580 1.14
1973-74 5,224 8.42 6,101 9.84 877 1.41
1974-75 6,103 8.33 6,608 9.02 505 0.69
1975-76 7,561 9.60 7,682 9.75 121 0.15
1976-77 8,542 10.06 8,838 10.41 296 0.35
1977-78 9,441 9.83 9,943 10.35 502 0.52
1978-79 11,026 10.58 11,845 11.37 819 0.79
1979-80 12,932 11.31 13,815 12.08 883 0.77
1980-81 15,470 11.37 16,784 12.34 1,314 0.97
1981-82 17,637 11.04 19,224 12.03 1,587 0.99
1982-83 20,133 11.30 22,251 12.49 2,118 1.19
1983-84 22,843 11.00 26,118 12.58 3,275 1.58
1984-85 26,160 11.31 30,793 13.31 4,633 2.00
1985-86 32,059 12.22 35,283 13.45 3,224 1.23
1986-87 36,538 12.47 40,232 13.73 3,694 1.26
1987-88 42,053 12.62 46,845 14.06 4,792 1.44
1988-89 48,034 12.14 53,370 13.48 5,336 1.35
1989-90 53,901 11.80 60,994 13.35 7,093 1.55
1990-91 64,064 11.96 72,344 13.51 8,280 1.55
1991-92 75,215 12.19 85,338 13.84 10,123 1.64
1992-93 87,153 12.35 93,650 13.27 6,497 0.92
1993-94 100,839 12.44 106,027 13.08 5,188 0.64
1994-95 116,919 12.13 126,378 13.12 9,459 0.98
1995-96 131,011 11.71 141,566 14.38 10,555 0.94
1996-97 144,665 11.33 160,914 14.84 16,249 1.27
1997-98 (RE) 169,940 12.01 189,442 13.38 19,503 1.38
1998-99(BE) 196,297 10.45 216,824 13.34 20,527 1.26
Source : Budget Documents of State Governments.
73

Appendix Table 18 : Primary Revenue Balance (PRB) - Central Government
(Rupees crore)F is c a lY e a r
R e c e ip ts (P R B l) E x p e n d it u r e ( P R B l, P R B 2 )
P r im a r y R e v e n u e B a la n c e 1 (4 -2 )
R e c e ip ts (P R B 2 ) P r im a r y R e v e n u e B a la n c e 2 (4 -8 )
A m o u n t % t o G D P A m o u n t % t o G D P A m o u n t % t o G D P A m o u n t % t o G D P A m o u n t % t o G D P1 2 3 4 5 6 7 8 9 10 11
1 95 0 -51 4 0 6 4 3 3 281 3 .0 0 -1 2 5 - 1 3 3 371 3 .9 6 -9 0 -0 .9 61 9 5 1 -5 2 5 1 0 5 .1 2 3 1 2 3 .1 3 -1 9 8 -1 .9 9 4 7 3 4 .7 5 -161 -1 .6 21 9 5 2 -5 3 4 3 5 4 .4 5 3 2 5 3 3 3 -1 1 0 -1 .1 3 3 9 3 4 .0 2 -6 8 -0 .7 01 9 5 3 -5 4 4 1 6 3 .91 3 29 3 .0 9 -8 7 -0 .8 2 371 3 .4 9 -4 2 -0 .3 91 9 5 4 -5 5 4 5 6 4 .5 3 3 39 3 3 7 -1 1 7 -1 .1 6 4 04 4 .01 -6 5 -0 .6 51 9 5 5 -5 6 481 4 .6 9 3 5 0 3 .41 -1 3 1 -1 .2 8 4 2 3 4 .1 2 -7 3 -0 .711 9 5 6 -5 7 5 63 4 .61 3 7 5 3 .0 7 -1 8 8 -1 .5 4 4 90 4 .0 1 -1 1 5 -0 .9 41 9 5 7 -5 8 6 73 5 .3 4 5 13 4 .0 7 -1 6 0 -1 .2 7 5 8 6 4 .6 5 -7 3 -0 .5 81 9 5 8 -5 9 6 7 0 4 .7 7 5 40 3 .8 5 -1 3 0 -0 .9 3 5 70 4 .0 6 -3 0 -0 .2 11 9 5 9 -6 0 7 7 9 5 .2 7 4 6 6 3 .1 5 -3 1 3 -2 .1 2 6 65 4 .5 0 -1 9 9 -1 .3 51960 -61 8 7 7 5 .41 6 38 3 .9 4 -2 3 9 -1 .4 8 7 46 4 .6 0 -1 0 8 -0 .6 71 9 6 1 -6 2 1 ,0 3 7 6 .0 4 7 03 4 .0 9 -3 3 4 -1 .9 4 8 93 5 .2 0 -1 9 0 -1 .111 9 6 2 -6 3 1 ,4 2 7 7 .7 2 1 ,0 7 4 5 .81 -3 5 3 -1 .91 1 ,2 7 4 6 .9 0 -2 0 0 -1 .0 81 9 6 3 -6 4 1 ,8 4 6 8 .6 9 1 3 8 5 6 .5 2 -461 -2 .1 7 1 ,6 0 2 7 .5 4 -2 1 7 -1 .0 21 96 4 -6 5 2 ,081 8 .4 0 1 ,4 9 6 6 .0 4 -5 8 5 -2 .3 6 1 ,7 2 4 6 .9 6 -2 2 8 -0 .9 21 9 6 5 -6 6 2 ,3 4 5 8 .9 7 1 ,6 6 0 6 .3 5 -6 8 5 -2 .6 2 2 ,0 3 7 7 .7 9 -3 7 7 -1 .4 41 9 6 6 -6 7 2 ,5 0 0 8 .4 5 1 ,8 1 4 6 .1 3 -6 8 6 -2 .3 2 2 ,1 2 2 7 .1 8 -3 0 8 -1 .0 41 9 6 7 -6 8 2 ,5 8 6 7 .4 7 1 ,985 5 .7 4 -6 0 1 -1 .7 4 2 ,161 6 .2 4 -1 7 6 -0 .511 9 6 8 -6 9 2 ,7 9 2 7 .61 2 ,1 8 9 5 .9 7 -6 0 3 -1 .6 4 2 ,2 7 8 6 .21 -8 9 -0 .2 41 9 6 9 -7 0 3 ,0 6 7 7 .5 9 2 3 8 2 5 .9 0 -6 8 5 -1 .7 0 2 ,4 7 2 6 .1 2 -9 0 -0 .2 21970 -71 3 ,3 4 2 7 .7 4 2 ,5 7 3 5 .9 6 -7 6 9 -1 .7 8 2 ,7 6 7 6 .41 -1 9 4 -0 .4 51 97 1 -7 2 3 ,8 6 8 8 .3 6 3 ,2 9 8 7 .1 3 -5 7 0 -1 .2 3 3 ,2 6 9 7 .0 7 2 9 0 .0 61 9 7 2 -7 3 4 ,5 2 3 8 .8 7 3 ,7 6 2 7 .3 8 -761 -1 .4 9 3 ,8 1 0 7 .4 7 -4 8 -0 .0 91 9 7 3 -7 4 5 ,0 1 4 8 .0 9 3 ,8 9 5 6 .2 8 -1 ,1 1 9 -1 .8 0 4 ,2 7 8 6 .9 0 -3 8 3 -0 .6 21 9 7 4 -7 5 6 ,4 4 2 8 .8 0 4 ,6 7 6 6 .3 8 -1 ,7 6 6 -2 .41 5 ,6 6 6 7 .7 4 -9 9 0 -1 .3 51 9 7 5 -7 6 7 ,8 6 4 9 .9 8 5 ,7 5 0 7 .3 0 -2 ,1 1 4 -2 .6 8 6 ,9 3 0 8 .8 0 -1 ,1 8 0 -1 .5 01 9 7 6 -7 7 8 ,5 6 8 1 0 .0 9 6 ,7 8 2 7 .9 9 -1 ,7 8 6 -2 .1 0 . 7 ,4 6 3 8 .7 9 -6 8 1 -0 .8 01 9 7 7 -7 8 9 ,5 3 8 9 .9 3 7 ,4 6 2 7 .7 7 -2 ,0 7 6 -2 .1 6 8 ,0 9 7 8 .4 3 -6 3 5 -0 .6 61 97 8 -7 9 1 0 ,9 7 4 10 .5 3 8 ,6 9 8 8 3 5 -2 ,2 7 6 -2 .1 8 9 ,5 4 7 9 .1 6 -8 4 9 -0 .811 9 7 9 -8 0 1 1 ,1 09 9.71 9 ,511 8 3 2 -1 ,5 9 8 -1 .4 0 9 ,7 4 9 8 .5 3 -2 3 8 -0 .211980 -81 12 ,3 73 9 .1 0 1 1 ,8 0 6 8 .6 8 -5 6 7 -0 .4 2 1 0 ,5 7 8 7 .7 8 1 ,228 0 .9 01 98 1 -8 2 1 5 ,0 1 6 9 .4 0 12 ,2 13 7 .6 4 -2 ,8 0 3 -1 .7 5 12 ,801 8 .01 -5 8 8 -0 .3 71 98 2 -8 3 17 ,4 34 9 .7 9 1 4 ,8 0 4 8 3 1 -2 ,6 3 0 -1 .4 8 1 4 ,5 82 8 .1 9 2 2 2 0 .1 21 9 8 3 -8 4 19 ,711 9 .5 0 1 7 ,4 5 6 8.41 -2 ,2 5 5 -1 .0 9 1 7 ,0 4 3 8 .21 4 13 0 .2 01 9 8 4 -8 5 2 3 ,4 6 6 1 0 .1 4 2 1 ,7 1 7 9 3 9 -1 ,7 4 9 -0 .7 6 1 9 ,5 0 3 8 .4 3 2 ,2 1 4 0 .9 61 9 8 5 -8 6 2 8 ,0 3 5 1 0 .6 9 2 6 ,4 1 2 1 0 .0 7 -1 ,6 2 3 -0 .6 2 2 3 ,4 4 0 8 .9 4 2 ,9 7 2 1 .131 9 8 6 -8 7 3 3 ,0 8 3 11 .2 9 3 1 ,6 1 4 1 0 .7 9 -1 ,4 6 9 -0 .5 0 2 7 ,7 3 0 9 .4 7 3 ,8 8 4 1 .331 9 8 7 -8 8 3 7 ,0 3 7 11 .1 2 3 4 ,9 2 3 10 .4 8 -2 ,1 1 4 -0 .6 3 3 1 ,2 8 2 9 .3 9 3 ,6 4 1 1 .0 91 9 8 8 -8 9 4 3 ,5 9 1 11 .01 3 9 ,8 2 8 1 0 .0 6 -3 ,7 6 3 -0 .9 5 3 6 ,6 1 0 9 .2 5 3 ,2 1 8 0 .811 98 9 -9 0 5 2 ,2 9 6 11 .4 5 4 6 ,4 5 3 1 0 .1 7 -5 ,8 4 3 -1 .2 8 4 3 ,8 2 2 9 .5 9 2 ,631 0 .5 81 990 -91 5 4 ,9 5 4 1 0 .2 6 5 2 ,0 1 8 9 .71 -2 ,9 3 6 -0 .5 5 4 6 ,2 2 4 8 .6 3 5 ,7 9 4 1 .0 81 99 1 -9 2 66 ,0 31 10.71 5 5 ,6 9 6 9 .0 3 -1 0 3 3 5 -1 .6 8 5 5 ,0 9 8 8 .9 3 5 98 0 .1 01 9 9 2 -9 3 7 4 ,1 2 8 10 .5 0 6 1 ,6 2 7 8 .7 3 -1 2 ,5 0 1 -1 .7 7 61 ,6 41 8 .7 3 -1 4 0 .0 01 9 9 3 -9 4 7 5 ,4 5 3 9 .31 7 1 ,4 2 8 8.81 -4 ,0 2 5 -0 .5 0 6 0 3 7 5 7 .4 5 1 1 ,0 53 1 .3 61 9 9 4 -9 5 9 1 ,0 8 3 9 .4 5 7 8 ,0 5 2 8 .1 0 -1 3 ,0 3 1 -1 .3 5 7 5 ,2 8 6 7 .81 2 ,7 6 6 0 .2 91 9 9 5 -9 6 1 1 0 ,1 3 0 9 .8 4 8 9 ,8 1 6 8 .0 3 - 2 0 3 1 4 -1 .8 2 91 ,711 8 .2 0 -1 ,8 9 5 -0 .1 71 9 9 6 -9 7 1 26 ,2 7 9 9 .8 9 9 9 ,4 5 5 7 .7 9 -2 6 ,8 2 4 -2 .1 0 1 04 ,1 7 3 8 .1 6 -4 ,7 1 8 - 0 3 71 9 9 7 -9 8 (R E ) 1 3 8 ,5 1 4 9 .7 9 1 16 ,5 0 0 8 .2 3 -2 2 ,0 1 4 -1 .5 6 1 1 3 ,1 8 7 8 .0 0 3 3 1 3 0 .2 31 9 9 8 -9 9 (B E ) 1 6 1 ,9 9 4 9 .9 7 1 35 ,0 6 2 8 .31 -2 6 ,9 3 2 -1 .6 6 1 3 4 ,0 4 0 8 .2 5 1 ,022 0 .0 6
Source : 1) Budget Documents of Government of India.2) Articles on Finances of Central Government.
74

Appendix Table 19 : Primary Revenue Balance (PRB) - State Governments
(Rupees crore)
F is c a lY e a r
R e c e ip ts (P R B 1 ) E x p e n d it u r e (P R B 1 , P R B 2 )
P r im a r y R e v e n u e B a la n c e 1 (4 -2 )
R e c e ip ts (P R B 2 ) P r im a r y R e v e n u e B a la n c e 2 (4 -8 )
A m o u n t % t o G D P A m o u n t % to G D P A m o u n t % to G D P A m o u n t % to G D P A m o u n t % to G D P
1 2 3 4 5 6 7 8 9 10 11
1970 -71 3 ,371 7 .81 2 ,9 9 2 6 .9 3 -3 7 9 -0 .8 8 3 ,1 8 8 7 .3 9 -1 9 6 -0 .4 5
1971 -72 4 ,0 4 5 8 .7 4 3 ,5 8 3 7 .7 5 -4 6 2 -1 .0 0 3 ,831 8 .2 8 -2 4 8 -0 .5 4
1 97 2 -7 3 4 ,9 1 2 9 .6 3 4 ,5 1 2 8 .85 -4 0 0 -0 .7 8 4 ,6 7 2 9 .1 6 -1 6 0 -0 .31
1 9 7 3 -7 4 5 ,5 5 2 8 .9 5 5 ,1 1 7 8 .2 5 -4 3 5 -0 .7 0 5 ,2 2 4 8 .4 2 -1 0 7 -0 .1 7
197 4 -7 5 6 ,4 3 2 8 .7 8 5 ,4 9 8 7 .51 -9 3 4 -1 .2 8 6 ,1 0 3 8 .33 -6 0 5 -0 .8 3
1 9 7 5 -7 6 7 ,9 3 8 10 .0 8 6 ,2 7 8 7 .9 7 -1 ,6 6 0 -2 .11 7 ,561 9 .6 0 -1 ,2 8 3 -1 .6 3
1 9 7 6 -7 7 9 ,0 3 7 10 .65 7 ,1 8 3 8 .4 6 -1 ,8 5 4 -2 .1 8 8 ,5 4 2 10 .0 6 -1 ,3 5 9 -1 .6 0
1 97 7 -7 8 9 ,931 10 .3 4 8 ,0 8 9 8 .4 2 -1 ,8 4 2 -1 .9 2 9 ,441 9 .8 3 -1 ,3 5 2 -1 .41
1 97 8 -7 9 1 1 ,6 4 7 1 1 .18 9 ,5 5 8 9 .1 7 -2 ,0 8 9 -2 .0 0 1 1 ,0 2 6 10 .58 -1 ,4 6 8 -1 .41
1 97 9 -8 0 13 ,6 29 11 .92 11 ,1 39 9 .7 4 -2 ,4 9 0 -2 .1 8 12 ,9 32 11.31 -1 ,7 9 3 -1 .5 7
1980 -81 1 6 ,2 9 4 11 .9 8 13 ,5 83 9 .9 9 -2 ,711 -1 .9 9 15 ,4 70 11 .3 7 -1 ,8 8 7 -1 .3 9
1 98 1 -8 2 18 ,4 54 11 .55 15 ,6 35 9 .7 9 -2 ,8 1 9 -1 .7 6 17 ,6 37 11 .0 4 -2 ,0 0 2 -1 .2 5
1 98 2 -8 3 2 1 ,1 2 5 11 .8 6 18 ,5 32 10 .4 0 -2 ,5 9 3 -1 .4 6 20 ,1 3 3 11 .3 0 -1 ,60 1 -0 .9 0
1 98 3 -8 4 2 4 ,0 1 4 11 .57 21 ,841 10 .52 -2 ,1 7 3 -1 .0 5 22 ,8 4 3 11.00 -1 ,0 0 2 -0 .4 8
1 98 4 -8 5 2 7 ,4 2 6 11 .86 2 5 ,8 8 3 11 .1 9 -1 ,5 4 3 -0 .6 7 2 6 ,1 6 0 11.31 -2 7 7 -0 .1 2
1 9 8 5 -8 6 3 3 ,4 2 4 12 .75 29 ,8 30 11 .3 7 -3 ,5 9 4 -1 .3 7 3 2 ,0 5 9 12 .2 2 -2 ,2 2 9 -0 .8 5
1 9 8 6 -8 7 3 8 ,2 2 6 13 .05 3 3 ,9 5 5 11 .59 -4 ,27 1 -1 .4 6 3 6 ,5 3 8 1 2 .4 7 -2 ,5 8 3 -0 .8 8
1 98 7 -8 8 4 4 ,0 0 0 13.21 4 0 ,1 9 0 12 .0 6 -3 ,8 1 0 -1 .1 4 4 2 ,0 5 3 12 .6 2 -1 ,8 6 3 -0 .5 6
1 98 8 -8 9 50 ,4 21 12 .7 4 4 6 ,2 9 3 11 .70 -4 ,1 2 8 -1 .0 4 4 8 ,0 3 4 12 .1 4 -1 ,74 1 -0 .4 4
1 98 9 -9 0 5 6 ,5 3 5 12 .3 8 53 ,031 11.61 -3 ,5 0 4 -0 .7 7 53 ,901 11 .8 0 -8 7 0 -0 .1 9
199 0 -91 6 6 ,4 6 7 12 .41 63 ,121 11 .79 -3 ,3 4 6 -0 .6 2 6 4 ,0 6 4 11 .9 6 -9 4 3 -0 .1 8
1 99 1 -9 2 8 0 ,5 3 5 13 .06 7 5 ,2 4 2 12 .20 -5 ,2 9 3 -0 .8 6 7 5 ,2 1 5 1 2 .19 2 7 0.001 99 2 -9 3 91 ,091 12 .90 8 2 ,9 9 5 1 1 .7 6 -8 ,0 9 6 -1 .1 5 8 7 ,1 5 3 1 2 .35 -4 ,1 5 8 -0 .5 9
1 99 3 -9 4 1 05 ,5 6 4 13 .02 9 3 ,5 7 6 11 .54 -1 1 ,9 8 8 -1 .4 8 100 ,83 8 12 .44 -7 ,2 6 2 -0 .9 0
1 99 4 -9 5 1 22 ,2 8 4 12 .69 109 ,02 7 11 .32 -1 3 ,2 5 7 -1 .3 8 116 ,91 9 12 .13 -7 ,8 9 2 -0 .8 2
1 9 9 5 -9 6 1 36 ,8 0 3 12 .2 3 123 ,07 2 11.00 -1 3 ,7 31 -1 .2 3 1 31 ,0 1 0 11 .71 -7 ,9 3 8 -0 .71
1 9 9 6 -9 7 1 5 2 ,8 3 6 11 .9 7 143 ,37 4 11 .23 -9 ,4 6 2 -0 .7 4 1 44 ,66 5 11 .33 -1 ,2 9 1 -0 .1 0
1 9 9 7 -9 8 (R E ) 1 77 ,0 8 4 12 .51 1 65 ,4 8 4 11 .6 9 -1 1 ,6 0 0 -0 .8 2 1 6 9 ,9 3 9 12.01 -4 ,4 5 5 -0 .31
1 9 9 8 -9 9 (B E ) 2 0 3 ,1 7 6 12 .50 1 92 ,4 1 2 11 .84 -1 0 ,7 6 4 -0 .6 6 1 96 ,2 9 7 12 .08 -3 ,8 8 5 -0 .2 4
(-) : Indicates Surplus.Source : Budget Documents of State Governments.
75

A p p e n d ix T a b le 1 9 A : P r im a r y D e f i c i t a n d P r im a r y R e v e n u e B a la n c e -C e n t r e a n d S ta te s C o m b in e d
(Rupees crore)
F is c a lY e a r
G ro s s P r im a r y D e f ic i t 1 G ro s s P r im a r y D e f ic i t 2
N e t P r im a r y D e f ic i t
P r im a r y R e v e n u e B a la n c e 1
P r im a r y R e v e n u e B a la n c e 2
A m o u n t % to G D P A m o u n t % to G D P A m o u n t % to G D P A m o u n t % to G D P A m o u n t % t o G D P1 2 3 4 5 6 7 8 9 10 11
1 970 -71 1 ,2 1 0 2 .8 0 1 ,7 1 6 3 .9 8 1 ,1 0 8 2 .5 7 -8 9 6 -2 .0 8 -3 9 0 -0 .9 0
1 97 1 -7 2 1 ,608 3 .4 8 2 ,1 2 6 4 .6 0 1 ,566 3 .3 9 -7 3 7 -1 .5 9 -2 1 9 -0 .4 7
1 97 2 -7 3 1 ,3 8 8 2 .7 2 1 ,962 3 .8 5 1 ,5 0 7 2 .9 5 -7 8 2 -1 .5 3 -2 0 8 -0 .41
1 9 7 3 -7 4 1 ,5 6 2 2 .5 2 2 ,2 4 0 3 .61 1 ,5 0 3 2 .4 2 -1 ,1 6 8 -1 .8 8 -4 9 0 -0 .7 9
1 97 4 -7 5 1 ,803 2 .4 6 2 ,5 3 9 3 .4 7 1 ,145 1 .5 6 -2 ,3 3 1 -3 .1 8 -1 ,5 9 5 -2 .1 8
1 9 7 5 -7 6 2 ,1 3 4 2 .71 2 ,9 9 4 3 .8 0 1 ,191 1.51 -3 ,3 2 4 -4 .2 2 -2 ,4 6 4 -3 .1 3
1 97 6 -7 7 2 ,7 6 2 3 .2 5 3 ,8 7 6 4 .5 7 1 ,485 1 .75 -3 ,1 5 5 -3 .7 2 -2 ,041 -2 .4 0
1 97 7 -7 8 2 ,8 0 6 2 .9 2 4 ,1 4 9 4 .3 2 2 ,1 1 0 2 .2 0 -3 ,3 3 0 -3 .4 7 -1 ,9 8 7 -2 .0 7
1 97 8 -7 9 3 ,6 3 0 3 .4 8 5 ,0 8 7 4 .8 8 2 ,3 8 8 2 .2 9 -3 ,7 7 4 -3 .6 2 -2 ,3 1 7 -2 .2 2
1 97 9 -8 0 4 ,6 6 5 4 .0 8 6 ,2 3 0 5 .4 5 3 ,0 8 3 2 .7 0 -3 ,5 9 6 -3 .1 4 -2 ,031 -1 .7 8
1980 -81 7 ,8 1 7 5 .7 5 9 ,5 7 0 7 .0 4 5 ,6 1 5 4 .1 3 -2 ,4 1 2 -1 .7 7 -6 5 9 -0 .4 8
1 98 1 -8 2 6 ,8 4 8 4 .2 9 9 ,0 0 4 5 .6 4 5 ,1 9 8 3 .2 5 -4 ,7 4 6 -2 .9 7 -2 ,5 9 0 -1 .6 2
1 98 2 -8 3 6 ,4 8 2 3 .6 4 9 ,3 1 7 5 .2 3 7 ,0 0 5 3 .9 3 -4 ,2 1 4 -2 .3 7 -1 ,3 7 9 -0 .7 7
1 9 8 3 -8 4 10 ,4 42 5 .0 3 13 ,052 6 .2 9 8 ,9 1 8 4 .3 0 -3 ,1 9 9 -1 .5 4 -5 8 9 -0 .2 8
1 9 8 4 -8 5 15 ,1 50 6 .5 5 18 ,802 8 .1 3 13 ,5 94 5 .8 8 -1 ,7 1 5 -0 .7 4 1 ,9 3 7 0 .8 4
1 9 8 5 -8 6 13 ,5 49 5 .1 7 17 ,6 80 6 .7 4 13 ,851 5 .2 8 - 3 3 8 8 -1 .2 9 7 4 3 0 .2 8
1 9 8 6 -8 7 2 0 ,1 4 8 ■ 6 .8 8 24 ,4 83 8 .3 6 16 ,8 37 5 .7 5 -3 ,0 3 4 -1 .0 4 1 ,301 0 .4 4
1 98 7 -8 8 1 9 ,4 2 7 5 .83 23 ,9 85 7 .2 0 1 7 ,7 2 7 5 .3 2 -2 ,7 8 0 -0 .8 3 1 ,778 0 .5 3
1 9 8 8 -8 9 19 ,431 4 .91 25 ,0 42 6 .3 3 18 ,8 09 4 .7 5 -4 ,1 3 4 -1 .0 4 1 ,4 7 7 0 .3 7
1 98 9 -9 0 22 ,6 0 3 4 .9 5 29 ,3 00 6 .41 2 1 ,5 3 2 4 .71 -4 ,9 3 6 -1 .0 8 1 ,761 0 .3 9
1990 -91 2 8 ,5 8 5 5 .3 4 3 4 ,5 6 0 6 .4 5 2 6 ,2 0 4 4 .8 9 -1 ,1 2 4 -0 .21 4 ,851 0 .91
1 99 1 -92 1 4 ,8 5 7 2 .41 2 4 ,5 63 3 .9 8 1 9 ,0 8 4 3 .0 9 -9 ,081 -1 .4 7 6 25 0 .1 0
1 9 9 2 -9 3 1 5 ,9 7 6 2 .2 6 2 4 ,5 8 4 3 .4 8 18,141 2 .5 7 -1 2 ,7 4 0 -1 .8 0 -4 ,1 7 2 -0 .5 9
1 9 9 3 -9 4 2 7 ,9 39 3 .4 5 3 8 ,2 1 4 4 .71 2 9 ,5 1 9 3 .6 4 -6 ,4 8 4 -0 .8 0 3 ,791 0 .4 7
1 99 4 -9 5 19 ,3 14 2 .0 0 2 9 ,3 3 7 3 .0 4 2 1 ,5 1 8 2 .2 3 -1 5 ,1 4 1 -1 .5 7 -5 ,1 2 6 -0 .5 3
1 99 5 -9 6 1 8 ,7 9 7 1 .68 2 9 ,9 18 2 .6 7 2 1 ,3 7 6 1.91 -2 0 ,9 4 4 -1 .8 7 -9 ,8 3 3 -0 .8 8
1 99 6 -9 7 1 7 ,3 5 0 1 .36 32 ,661 2 .5 6 2 5 ,2 7 0 1 .98 -2 1 ,3 2 0 -1 .6 7 -6 ,0 0 9 -0 .4 7
1 9 9 7 -9 8 (R E ) 3 7 ,0 8 7 2 .6 2 51 ,5 65 3 .6 4 4 0 ,5 8 9 2 .8 7 -1 5 ,6 2 0 -1 .1 0 -1 ,1 4 2 -0 .0 8
1 9 9 8 -9 9 (B E ) 3 9 ,3 7 2 2 .4 2 5 3 ,4 09 3 .2 9 3 9 ,8 2 5 2 .4 5 -1 6 ,9 0 0 -1 .0 4 -2 ,8 6 3 -0 .1 8
(-) : Indicates surplus.Source: Budget Documents of the Government of India and State Governments.
76

Appendix Table 20 : Net Fiscal Deficit (NFD) - Central Government(Rupees crore)
FiscalYear
Receipts Expenditure Net Fiscal Deficit
Amount % to GDP Amount % to GDP Amount ‘Vo to GDP
1 2 3 4 5 6 7
1950-51 406 4.33 418 4.46 12 0.131951-52 510 5.12 500 5.02 -10 -0.101952-53 435 4.45 435 4.45 0 0.001953-54 416 3.91 432 4.06 16 0.151954-55 456 4.53 513 5.09 57 0.571955-56 481 4.69 569 5.55 88 0.861956-57 563 4.61 715 5.85 152 1.241957-58 673 5.34 1,066 8.46 393 3.121958-59 670 4.77 1,078 7.68 408 2.911959-60 779 5.27 1,078 7.29 299 2.021960-61 877 5.41 1,231 8.33 354 2.191961-62 1,037 6.04 1,350 11.05 313 1.821962-63 1,427 7.72 1,898 13.38 471 2.551963-64 1,846 8.69 2,473 12.97 627 2.951964-65 2,081 8.40 2,754 10.99 673 2.721965-66 2,345 8.97 2,721 12.30 376 1.441966-67 2,500 8.45 3,217 10.65 717 2.421967-68 2,586 7.47 3,148 9.07 562 1.621968-69 2,793 7.62 3,140 9.79 347 0.951969-70 3,067 7.59 3,590 10.20 523 1.291970-71 3,342 7.74 4,121 9.55 779 1.801971-72 3,868 8.36 5,085 10.99 1,217 2.631972-73 4,523 8.87 5,513 10.81 990 1.941973-74 5,014 8.09 5,786 9.33 772 1.251974-75 6,442 8.80 7,307 9.98 865 1.181975-76 7,864 9.98 9,228 11.72 1,364 1.731976-77 8,568 10.09 10,140 11.94 1,572 1.851977-78 9,538 9.93 11,351 11.82 1,813 1.891978-79 10,974 10.53 13,100 12.57 2,126 2.041979-80 11,109 9.71 14,242 12.45 3,133 2.741980-81 12,373 9.10 17,483 12.85 5,110 3.761981-82 15,016 9.40 19,607 12.27 4,591 2.871982-83 17,434 9.79 23,407 13.14 5,973 3.351983-84 19,711 9.50 27,481 13.24 7,770 3.741984-85 23,466 10.14 34,438 14.89 10,972 4.741985-86 28,035 10.69 41,579 15.86 13,544 5.161986-87 33,083 11.29 50,119 17.11 17,036 5.821987-88 37,037 11.12 55,468 16.65 18,431 5.531988-89 43,591 11.01 64,361 16.26 20,770 5.251989-90 52,296 11.45 76,018 16.64 23,722 5.191990-91 54,954 10.26 85,646 15.99 30,692 5.731991-92 69,069 11.20 93,691 15.19 24,622 3.991992-93 76,089 10.78 106,321 15.06 30,232 4.281993-94 75,405 9.30 121,399 14.97 45,994 5.671994-95 96,690 10.04 137,003 14.22 40,313 4.181995-96 111,527 9.97 153,959 13.76 42,432 3.791996-97 126,734 9.92 173,128 13.56 46,394' 3.631997-98 (RE) 139,421 9.85 200,880 14.19 61,459 4.341998-99 (BE) 166,994 10.27 233,337 14.36 66,343 4.08
( - ) : I n d ic a te s S u r p lu s .S o u rc e : 1 ) B u d g e t D o c u m e n ts o f G o v e r n m e n t o f In d ia .
2 ) A r t i c le s o n F in a n c e s o f C e n t r a l G o v e r n m e n t .
77

Appendix Table 21 : Net Fiscal Deficit (NFD) - State Governments
(Rupees crore)FiscalYear
Receipts Expenditure Net Fiscal Deficit
Amount % to GDP Amount % to GDP Amount % to GDP1 2 3 4 5 6 7
1970-71 3,371 7.81 3,946 9.14 575 1.331971-72 4,045 8.74 4,707 10.18 662 1.431972-73 4,912 9.63 5,722 11.22 810 1.591973-74 5,552 8.95 6,653 10.73 1,101 1.781974-75 6,432 8.78 7,147 9.76 715 0.981975-76 7,938 10.08 8,370 10.63 432 0.551976-77 9,037 10.65 9,595 11.30 558 0.661977-78 9,931 10.34 10,765 11.21 834 0.871978-79 11,647 11.18 12,798 12.28 1,151 1.101979-80 13,629 11.92 14,756 12.90 1,127 0.991980-81 16,294 11.98 18,009 13.24 1,715 1.261981-82 18,454 11.55 20,664 12.93 2,210 1.381982-83 21,125 11.86 23,956 13.45 2,831 1.59
1983-84 24,014 11.57 28,081 13.53 4,067 1.96
1984-85 27,426 11.86 33,259 14.38 5,833 2.521985-86 33,424 12.75 38,223 14.58 4,799 1.83
1986-87 38,226 13.05 44,333 15.13 6,107 2.08
1987-88 44,000 13.21 51,743 15.53 7,743 2.32
1988-89 50,421 12.74 59,305 14.98 8,884 2.24
1989-90 56,535 12.38 68,180 14.92 11,645 2.55
1990-91 66,467 12.41 80,999 15.12 14,532 2.71
1991-92 80,535 13.06 96,282 15.61 15,747 2.55
1992-93 91,091 12.90 106,860 15.14 15,769 2.23
1993-94 105,564 13.02 121,827 15.03 16,263 2.01
1994-95 122,284 12.69 145,791 15.13 23,507 2.44
1995-96 136,803 12.23 163,498 14.61 26,695 2.39
1996-97 152,837 11.97 186,490 14.60 33,653 2.64
1997-98 (RE) 177,084 12.51 220,677 15.59 43,593 3.08
1998-99 (BE) 203,176 12.50 253,223 13.58 50,047 3.08
Source : Budget Documents of State Governments.
78
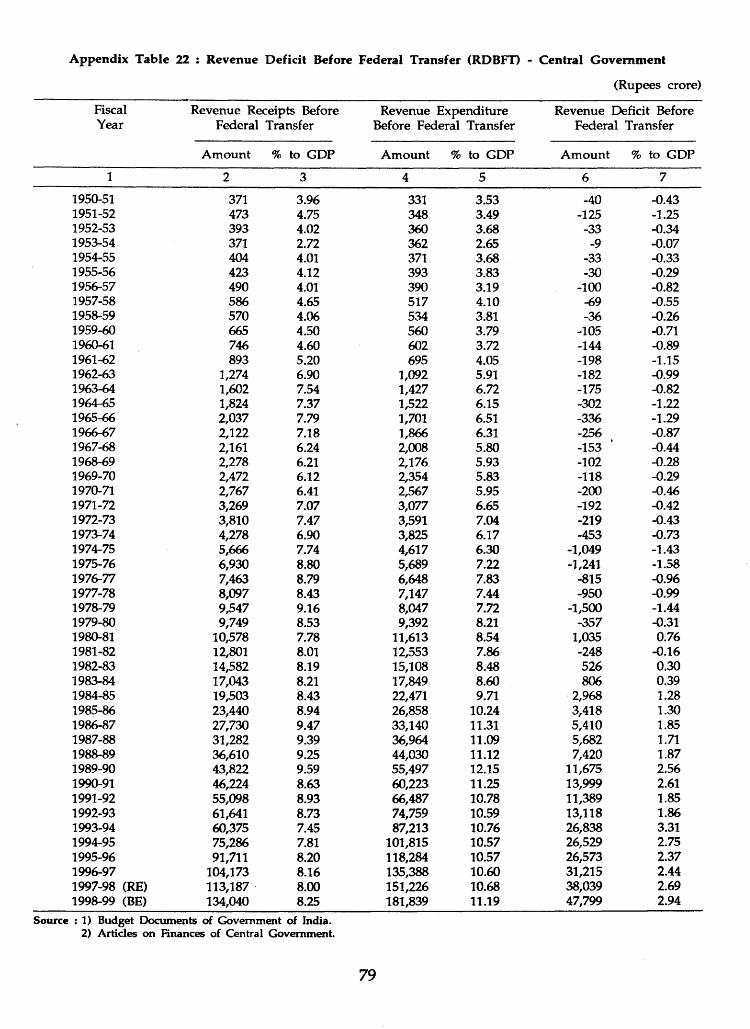
Appendix Table 22 : Revenue Deficit Before Federal Transfer (RDBFT) - Central Government
(Rupees crore)
FiscalYear
Revenue Receipts Before Federal Transfer
Revenue Expenditure Before Federal Transfer
Revenue Deficit Before Federal Transfer
Amount 1% to GDP Amount % to GDP Amount % to GDP
1 2 3 4 5 6 7
1950-51 371 3.96 331 3.53 -40 -0.431951-52 473 4.75 348 3.49 -125 -1.251952-53 393 4.02 360 3.68 -33 -0.341953-54 371 2.72 362 2.65 -9 -0.071954-55 404 4.01 371 3.68 -33 -0.331955-56 423 4.12 393 3.83 -30 -0.291956-57 490 4.01 390 3.19 -100 -0.821957-58 586 4.65 517 4.10 -69 -0.551958-59 570 4.06 534 3.81 -36 -0.261959-60 665 4.50 560 3.79 -105 -0.711960-61 746 4.60 602 3.72 -144 -0.891961-62 893 5.20 695 4.05 -198 -1.151962-63 1,274 6.90 1,092 5.91 -182 -0.991963-64 1,602 7.54 1,427 6.72 -175 -0.821964-65 1,824 7.37 1,522 6.15 -302 -1.221965-66 2,037 7.79 1,701 6.51 -336 -1.291966-67 2,122 7.18 1,866 6.31 -256 -0.871967-68 2,161 6.24 2,008 5.80 -153 -0.441968-69 2,278 6.21 2,176 5.93 -102 -0.281969-70 2,472 6.12 2,354 5.83 -118 -0.291970-71 2,767 6.41 2,567 5.95 -200 -0.461971-72 3,269 7.07 3,077 6.65 -192 -0.421972-73 3,810 7.47 3,591 7.04 -219 -0.431973-74 4,278 6.90 3,825 6.17 -453 -0.731974-75 5,666 7.74 4,617 6.30 -1,049 -1.431975-76 6,930 8.80 5,689 7.22 -1,241 -1.581976-77 7,463 8.79 6,648 7.83 -815 -0.961977-78 8,097 8.43 7,147 7.44 -950 -0.991978-79 9,547 9.16 8,047 7.72 -1,500 -1.441979-80 9,749 8.53 9,392 8.21 -357 -0.311980-81 10,578 7.78 11,613 8.54 1,035 0.761981-82 12,801 8.01 12,553 7.86 -248 -0.161982-83 14,582 8.19 15,108 8.48 526 0.301983-84 17,043 8.21 17,849 8.60 806 0.391984-85 19,503 8.43 22,471 9.71 2,968 1.281985-86 23,440 8.94 26,858 10.24 3,418 1.301986-87 27,730 9.47 33,140 11.31 5,410 1.851987-88 31,282 9.39 36,964 11.09 5,682 1.711988-89 36,610 9.25 44,030 11.12 7,420 1.871989-90 43,822 9.59 55,497 12.15 11,675 2.561990-91 46,224 8.63 60,223 11.25 13,999 2.611991-92 55,098 8.93 66,487 10.78 11,389 1.851992-93 61,641 8.73 74,759 10.59 13,118 1.861993-94 60,375 7.45 87,213 10.76 26,838 3.311994-95 75,286 7.81 101,815 10.57 26,529 2.751995-96 91,711 8.20 118,284 10.57 26,573 2.371996-97 104,173 8.16 135,388 10.60 31,215 2.441997-98 (RE) 113,187 8.00 151,226 10.68 38,039 2.691998-99 (BE) 134,040 8.25 181,839 11.19 47,799 2.94
Source : 1) Budget Documents of Government of India.2) Articles on Finances of Central Government.
79

Appendix Table 23 : Capital Account Deficit Before Federal Transfer (CADBFT) - Central Government
(Rupees crore)
FiscalYear
Capital Receipts Before Federal Transfer
Capital Disbursements Before Federal Transfer
Capital Account Deficit Before Federal Transfer
Amount % to GDP Amount % to GDP Amount % to GDP
1 2 3 4 5 6 7
1950-51 50 0.53 72 0.77 22 0.231951-52 113 1.13 118 1.18 5 0.051952-53 49 0.50 39 0.40 -10 -0.101953-54 90 0.85 25 0.24 -65 -0.611954-55 205 2.04 91 0.90 -114 -1.131955-56 184 1.79 128 1.25 -56 -0.551956-57 185 1.51 241 1.97 56 0.461957-58 159 1.26 435 3.45 276 2.191958-59 497 3.54 402 2.86 -95 -0.681959-60 572 3.87 342 2.31 -230 -1.551960-61 903 5.57 405 2.50 -498 -3.071961-62 620 3.61 438 2.55 -182 -1.061962-63 830 4.49 584 3.16 -246 -1.331963-64 962 4.53 815 3.84 -147 -0.691964-65 1,127 4.55 947 3.82 -180 -0.731965-66 1,029 3.94 696 2.66 -333 -1.271966-67 1,410 4.77 945 3.20 -465 -1.571967-68 1,225 3.54 666 1.92 -559 -1.621968-69 841 2.29 428 1.17 -413 -1.131969-70 1,030 2.55 648 1.60 -382 -0.951970-71 1,123 2.60 942 2.18 -181 -0.421971-72 1,208 2.61 1,117 2.41 -91 -0.201972-73 1,309 2.57 975 1.91 -334 -0.651973-74 1,405 2.27 1,009 1.63 -396 -0.641974-75 1,582 2.16 1,630 2.23 48 0.071975-76 2,662 3.38 2,250 2.86 -412 -0.521976-77 3,671 4.32 1,870 2.20 -1,801 -2.121977-78 2,748 2.86 2,243 2.33 -505 -0.531978-79 4,204 4.03 2,418 2.32 -1,786 -1.711979-80 3,959 3.46 2,439 2.13 -1,520 -1.331980-81 5,822 4.28 3,073 2.26 -2,749 -2.021981-82 7,266 4.55 4,199 2.63 -3,067 -1.921982-83 8,971 5.04 4,665 2.62 -4,306 -2.421983-84 11,540 5.56 5,558 2.68 -5,982 -2.881984-85 13,671 5.91 6,747 2.92 -6,924 -2.991985-86 16,542 6.31 7,655 2.92 -8,887 -3.391986-87 18,081 6.17 9,259 3.16 -8,822 -3.011987-88 21,228 6.37 9,294 2.79 -11,934 -3.581988-89 25,281 6.39 10,255 2.59 -15,026 -3.801989-90 25,040 5.48 11,808 2.58 -13,232 -2.901990-91 33,285 6.22 12,130 2.27 -21,155 -3.951991-92 32,507 5.27 11,399 1.85 -21,108 -3.421992-93 29,822 4.22 13,619 1.93 -16,203 -2.301993-94 49,249 6.07 13,230 1.63 -36,019 -4.441994-95 62,350 6.47 14,891 1.55 -47,459 -4.931995-96 51,833 4.63 14,098 1.26 -37,735 -3.371996-97 54,004 4.23 14,195 1.11 -39,809 -3.121997-98 (RE) 87,252 6.16 18,680 1.32 -68,572 -4.841998-99 (BE) 96,025 5.91 23,275 1.43 -72,750 -4.48
Source : 1) Budget Documents of Government of India.2) Articles on Finances of Central Government.
80

Appendix Table 24 : Overall Deficit Before Federal Transfer (ODBFT) - Central Government(Rupees crore)
FiscalYear
Overall Receipts Before Federal Transfer
Overall Disbursements Before Federal Transfer
Overall Deficit Before Federal Transfer
Amount % to GDP Amount % to GDP Amount % to GDP
1 2 3 4 5 6 7
1950-51 421 4.49 403 4.30 -18 -0.191951-52 586 5.88 466 4.68 -120 -1.201952-53 442 4.52 399 4.08 -43 -0.441953-54 461 4.33 387 3.64 -74 -0.701954-55 609 6.05 462 4.59 -147 -1.461955-56 607 5.92 521 5.08 -86 -0.841956-57 675 5.53 631 5.16 -44 -0.361957-58 745 5.91 952 7.56 207 1.641958-59 1,067 7.60 936 6.67 -131 -0.931959-60 1,237 8.36 902 6.10 -335 -2.261960-61 1,649 10.18 1,007 6.22 -642 -3.961961-62 1,513 8.81 1,133 6.60 -380 -2.211962-63 2,104 11.39 1,676 9.07 -428 -2.321963-64 2,564 12.07 2,242 10.56 -322 -1.521964-65 2,951 11.92 2,469 9.97 -482 -1.951965-66 3,066 11.73 2,397 9.17 -669 -2.561966-67 3,532 11.94 2,811 9.51 -721 -2.441967-68 3,386 9.78 2,674 7.73 -712 -2.061968-69 3,119 8.50 2,604 7.10 -515 -1.401969-70 3,502 8.67 3,002 7.43 -500 -1.241970-71 3,890 9.01 3,509 8.13 -381 -0.881971-72 4,477 9.68 4,194 9.07 -283 -0.611972-73 5,119 10.04 4,566 8.95 -553 -1.081973-74 5,683 9.17 4,834 7.80 -849 -1.371974-75 7,248 9.90 6,247 8.53 -1,001 -1.371975-76 9,592 12.18 7,939 10.08 -1,653 -2.101976-77 11,134 13.12 8,518 10.03 -2,616 -3.081977-78 10,845 11.29 9,390 9.77 -1,455 -1.511978-79 13,751 13.20 10,465 10.04 -3,286 -3.151979-80 13,708 11.99 11,831 10.35 -1,877 -1.641980-81 16,400 12.06 14,686 10.80 -1,714 -1.261981-82 20,067 12.56 16,752 10.49 -3,315 -2.071982-83 23,553 13.22 19,773 11.10 -3,780 -2.121983-84 28,583 13.77 23,407 11.28 -5,176 -2.491984-85 33,174 14.34 29,218 12.63 -3,956 -1.711985-86 39,982 15.25 34,513 13.16 -5,469 -2.091986-87 45,811 15.64 42,399 14.47 -3,412 -1.161987-88 52,510 15.76 46,258 13.88 -6,252 -1.881988-89 61,891 15.64 54,285 13.72 -7,606 -1.921989-90 68,862 15.07 67,305 14.73 -1,557 -0.341990-91 79,509 14.85 72,353 13.51 -7,156 -1.341991-92 87,605 14.20 77,886 12.63 -9,719 -1.581992-93 91,463 12.96 88,378 12.52 -3,085 -0.441993-94 109,624 13.52 100,443 12.39 -9,181 -1.131994-95 137,636 14.29 116,706 12.11 -20,930 -2.171995-96 143,544 12.83 132,383 11.83 -11,161 -1.001996-97 158,177 12.39 149,583 11.71 -8,594 -0.671997-98 (RE) 200,439 14.16 169,906 12.00 -30,533 -2.161998-99 (BE) 230,065 14.15 205,114 12.62 -24,951 -1.54
S o u rc e : 1 ) B u d g e t D o c u m e n ts o f G o v e r n m e n t o f In d ia .2 ) A r t ic le s o n F in a n c e s o f C e n t r a l G o v e r n m e n t .
81

Appendix Table 25 : States' Resource Gap (SRG) and its Financing
(Rupees crore)
FiscalYear
Expenditure Receipts States'ResourceGap
Financing of States' Resource Gap
Plan Non-Plan Loans from Ways Grants Non- the Centre and
Statutory adjusted for Means Grants debt Advances
servicing
1 2 3 4 5 6 7 8
1970-71 4,142 3,559 583 270 148 -27 192
1971-72 4,912 4,007 905 612 120 -65 238
1972-73 6,119 5,046 1,073 653 137 790 -507
1973-74 6,741 5,780 961 633 152 67 109
1974-75 7,570 7,012 558 46 488 31 -7
1975-76 8,830 8,286 544 198 510 -156 -8
1976-77 10,365 9,491 874 465 520 -30 -81
1977-78 11,648 9,907 1,741 710 564 299 168
1978-79 13,868 10,767 3,101 1,423 525 1,408 -255
1979-80 16,177 13,374 2,803 1,571 256 924 52
1980-81 20,419 17,065 3,354 2,060 207 777 310
1981-82 22,921 18,660 4,261 2,240 203 1,123 695
1982-83 26,298 22,483 3,815 2,626 290 1,722 -823
1983-84 30,472 24,701 5,771 3,336 361 1,836 238
1984-85 35,959 28,976 6,983 3,956 261 2,012 754
1985-86 40,549 32,269 8,280 4,849 534 4,051 -1,154
1986-87 46,138 38,316 7,822 5,423 453 2,056 -110
1987-88 53,526 43,919 9,607 6,540 464 2,688 -85
1988-89 60,162 48,495 11,667 7,494 989 2,989 195
1989-90 69,052 58,282 10,770 6,330 646 3,530 264
1990-91 81,914 66,963 14,951 9,373 689 4,799 90
1991-92 97,711 81,842 15,869 12,035 770 2,852 212
1992-93 107,327 91,299 16,028 14,396 724 1,092 -183
1993-94 120,258 101,226 19,032 18,022 954 19 38
1994-95 145,273 121,588 23,685 19,343 527 4,149 -333
1995-96 160,264 136,426 23,838 19,531 598 3,709 0
(-) Indicates repayments of Ways and Means Advances.Source : Budget Documents of the State Governments.
82
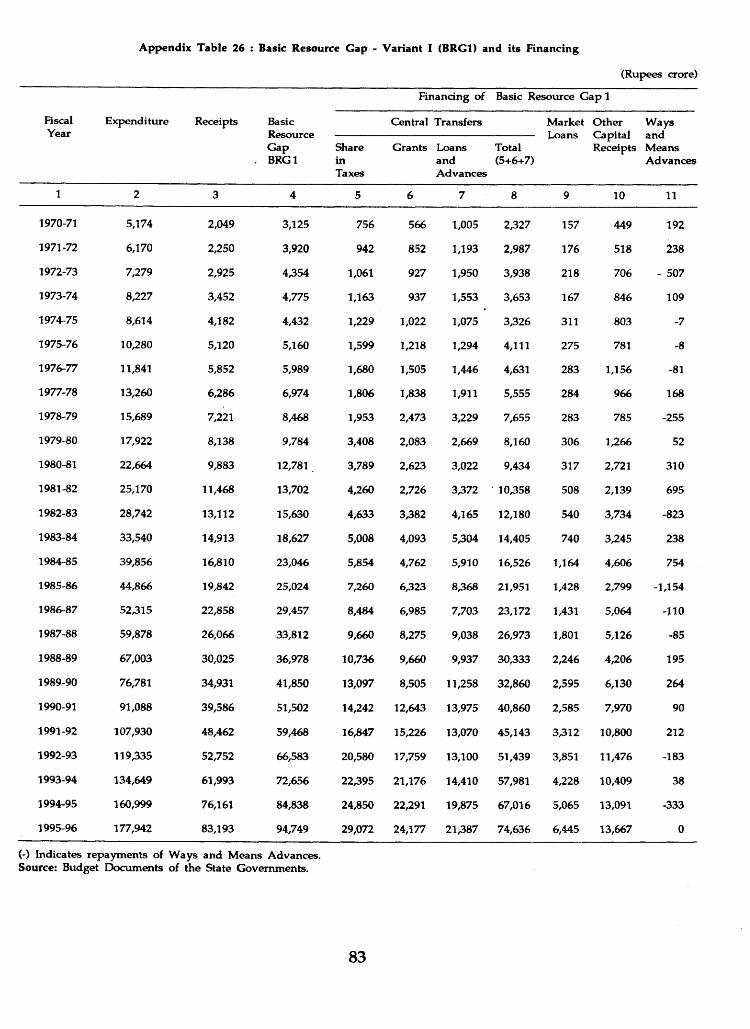
Appendix Table 26 : Basic Resource Cap - Variant I (BRC1) and its Financing
(Rupees crore)
F is c a lY e a r
E x p e n d i t u r e R e c e ip ts B a s ic R e s o u rc e G a p
. B R G l
F in a n c in g o f B a s ic R e s o u rc e G a p 1
C e n t r a l T ra n s fe r s M a r k e tL o a n s
O th e rC a p i t a lR e c e ip ts
W a y sa n dM e a n sA d v a n c e s
S h a reinT a x e s
G ra n ts L o a n sa n dA d v a n c e s
T o ta l(5 + 6 + 7 )
1 2 3 4 5 6 7 8 9 10 11
1970 -71 5 ,1 7 4 2 ,0 4 9 3 ,1 2 5 7 5 6 5 66 1 ,0 0 5 2 ,3 2 7 1 57 4 4 9 192
1 9 7 1 -7 2 6 ,1 7 0 2 ,2 5 0 3 ,9 2 0 9 42 8 52 1 ,193 2 ,9 8 7 1 76 5 18 2 38
1 9 7 2 -7 3 7 ,2 7 9 2 ,9 2 5 4 ,3 5 4 1 ,061 9 2 7 1 ,9 5 0 3 ,9 3 8 2 1 8 7 06 - 5 0 7
1 9 7 3 -7 4 8 ,2 2 7 3 ,4 5 2 4 ,7 7 5 1 ,1 6 3 9 3 7 1 ,553 3 ,6 5 3 1 67 8 4 6 109
1 9 7 4 -7 5 8 ,6 1 4 4 ,1 8 2 4 ,4 3 2 1 ,2 2 9 1 ,022 1 ,075 3 ,3 2 6 311 8 03 -7
1 9 7 5 -7 6 1 0 ,2 8 0 5 ,1 2 0 5 ,1 6 0 1 ,5 9 9 1 ,218 1 ,2 9 4 4 ,111 2 7 5 781 -8
1 9 7 6 -7 7 11 ,841 5 ,8 5 2 5 ,9 8 9 1 ,6 8 0 1 ,505 1 ,4 4 6 4 ,631 2 8 3 1 ,1 5 6 -81
1 9 7 7 -7 8 13 ,2 60 6 ,2 8 6 6 ,9 7 4 1 ,8 0 6 1 ,838 1 ,911 5 ,5 5 5 2 8 4 9 66 168
1 9 7 8 -7 9 1 5 ,6 8 9 7 ,221 8 ,4 6 8 1 ,9 5 3 2 ,4 7 3 3 ,2 2 9 7 ,6 5 5 2 8 3 7 85 -2 5 5
1 9 7 9 -8 0 17 ,9 22 8 ,1 3 8 9 ,7 8 4 3 ,4 0 8 2 ,0 8 3 2 ,6 6 9 8 ,1 6 0 3 0 6 1 ,2 6 6 52
198 0 -81 2 2 ,6 6 4 9 ,8 8 3 12 ,781 3 ,7 8 9 2 ,6 2 3 3 ,0 2 2 9 ,4 3 4 3 1 7 2 ,721 3 1 0
1 9 8 1 -8 2 2 5 ,1 7 0 1 1 ,4 6 8 13 ,7 0 2 4 ,2 6 0 2 ,7 2 6 3 ,3 7 2 • 1 0 ,3 58 508 2 ,1 3 9 6 95
1 9 8 2 -8 3 2 8 ,7 4 2 1 3 ,1 1 2 15 ,6 3 0 4 ,6 3 3 3 ,3 8 2 4 ,1 6 5 12 ,1 8 0 5 40 3 ,7 3 4 -8 2 3
1 9 8 3 -8 4 3 3 ,5 4 0 1 4 ,9 1 3 1 8 ,6 2 7 5 ,0 0 8 4 ,0 9 3 5 ,3 0 4 14 ,4 05 7 40 3 ,2 4 5 2 38
1 9 8 4 -8 5 3 9 ,8 5 6 1 6 ,8 1 0 2 3 ,0 4 6 5 ,8 5 4 4 ,7 6 2 5 ,9 1 0 1 6 ,5 2 6 1 ,1 6 4 4 ,6 0 6 7 54
1 9 8 5 -8 6 4 4 ,8 6 6 1 9 ,8 4 2 2 5 ,0 2 4 7 ,2 6 0 6 ,3 2 3 8 ,3 6 8 21 ,9 51 1 ,428 2 ,7 9 9 -1 ,1 5 4
1 9 8 6 -8 7 5 2 ,3 1 5 2 2 ,8 5 8 2 9 ,4 5 7 8 ,4 8 4 6 ,9 8 5 7 ,7 0 3 2 3 ,1 7 2 1 ,431 5 ,0 6 4 -1 1 0
1 9 8 7 -8 8 5 9 ,8 7 8 2 6 ,0 6 6 3 3 ,8 1 2 9 ,6 6 0 8 ,2 7 5 9 ,0 3 8 2 6 ,9 7 3 1 ,801 5 ,1 2 6 -8 5
1 9 8 8 -8 9 6 7 ,0 0 3 3 0 ,0 2 5 3 6 ,9 7 8 1 0 ,7 3 6 9 ,6 6 0 9 ,9 3 7 3 0 ,3 3 3 2 ,2 4 6 4 ,2 0 6 195
1 9 8 9 -9 0 76 ,7 81 34 ,9 31 4 1 ,8 5 0 1 3 ,0 9 7 8 ,5 0 5 11 ,2 58 3 2 ,8 6 0 2 ,5 9 5 6 ,1 3 0 2 64
199 0 -91 9 1 ,0 8 8 3 9 ,5 8 6 5 1 ,5 0 2 14 ,2 42 12 ,6 43 13 ,9 75 4 0 ,8 6 0 2 ,5 8 5 7 ,9 7 0 90
1 9 9 1 -9 2 1 0 7 ,9 3 0 4 8 ,4 6 2 5 9 ,4 6 8 1 6 ,8 4 7 1 5 ,2 2 6 13 ,0 70 4 5 ,1 4 3 3 ,3 1 2 10 ,8 0 0 2 12
1 9 9 2 -9 3 1 1 9 ,3 3 5 5 2 ,7 5 2 6 6 ,5 8 3 2 0 ,5 8 0 1 7 ,7 5 9 1 3 ,1 0 0 5 1 ,4 3 9 3 ,8 5 1 1 1 ,4 7 6 -1 8 3
1 9 9 3 -9 4 1 3 4 ,6 4 9 6 1 ,9 9 3 7 2 ,6 5 6 2 2 /3 9 5 2 1 ,1 7 6 1 4 ,4 1 0 57 ,981 4 ,2 2 8 1 0 ,4 0 9 3 8
1 9 9 4 -9 5 1 6 0 ,9 9 9 76 ,1 61 8 4 ,8 3 8 2 4 ,8 5 0 22 ,2 91 1 9 ,8 7 5 6 7 ,0 1 6 5 ,0 6 5 13 ,0 91 -3 3 3
1 9 9 5 -9 6 1 7 7 ,9 4 2 8 3 ,1 9 3 9 4 ,7 4 9 2 9 ,0 7 2 2 4 ,1 7 7 2 1 ,3 8 7 7 4 ,6 3 6 6 ,4 4 5 1 3 ,6 6 7 0
(-) Indicates repayments of Ways and Means Advances.Source: Budget Documents of the State Governments.
83

Appendix Table 27 : Basic Resource Gap - Variant II (BRG2) and its Financing
(Rupees crore)
F in a n c in g o f B a s ic R e s o u rc e G a p 2
F is c a lY e a r
E x p e n d i t u r e R e c e ip ts B a s ic R e s o u r ces G a p B R G 2
C e n t r a l T ra n s fe r s M a r k e tL o a n s
W a y sa n dM e a n sA d v a n c e s
S ta te s ' O w n T a x a n d N o n - T a x
C a p i t a lR e c e ip ts
T o ta l(3 + 4 )
S h a reinT a x e s
G ra n ts L o a n sa n dA d v a n c e s
T o ta l( 7 + 8 + 9 )
1 2 3 4 5 6 7 8 9 10 11 12
1 970 -71 5 ,1 7 4 2 ,0 4 9 4 4 9 2 ,4 9 8 2 ,6 7 6 7 56 5 6 6 1 ,0 0 5 2 3 2 7 1 57 192
1 9 7 1 -7 2 6 ,1 7 0 2 ,2 5 0 5 1 8 2 ,7 6 8 3 ,4 0 2 9 4 2 8 52 1 ,1 9 3 2 ,9 8 7 1 76 2 38
1 9 7 2 -7 3 7 ,2 7 9 2 ,9 2 5 7 0 6 3 ,631 3 ,6 4 8 1 ,061 9 2 7 1 ,9 5 0 3 ,9 3 8 2 1 8 -5 0 7
1 9 7 3 -7 4 8 ,2 2 7 3 ,4 5 2 8 4 6 4 ,2 9 8 3 ,9 2 9 1 ,1 6 3 9 3 7 1 ,5 5 3 3 ,6 5 3 1 6 7 109
1 9 7 4 -7 5 8 ,6 1 4 4 ,1 8 2 8 0 3 4 ,9 8 5 3 ,6 2 9 1 ,2 2 9 1 ,0 2 2 1 ,0 7 5 3 3 2 6 3 11 -7
1 9 7 5 -7 6 1 0 ,2 8 0 5 ,1 2 0 781 5 ,901 4 ,3 7 9 1 ,5 9 9 1 ,2 1 8 1 ,2 9 4 4 ,1 1 1 2 7 5 -8
1 9 7 6 -7 7 1 1 ,841 5 ,8 5 2 1 ,1 5 6 7 ,0 0 8 4 ,8 3 3 1 ,6 8 0 1 ,5 0 5 1 ,4 4 6 4 ,6 3 1 2 83 -81
1 9 7 7 -7 8 1 3 ,2 6 0 6 ,2 8 6 9 6 6 7 ,2 5 2 6 ,0 0 8 1 ,8 0 6 1 ,8 3 8 1 ,911 5 ,5 5 5 2 8 4 168
1 9 7 8 -7 9 1 5 ,6 8 9 7 ,221 7 8 5 8 ,0 0 6 7 ,6 8 3 1 ,9 5 3 2 ,4 7 3 3 ,2 2 9 7 ,6 5 5 2 83 -2 5 5
1 9 7 9 -8 0 1 7 ,9 2 2 8 ,1 3 8 1 ,2 6 6 9 ,4 0 4 8 ,5 1 8 3 ,4 0 8 2 ,0 8 3 2 ,6 6 9 8 ,1 6 0 3 0 6 52
1 98 0 -81 2 2 ,6 6 4 9 ,8 8 3 2 ,721 1 2 ,6 0 4 1 0 ,0 6 0 3 ,7 8 9 2 ,6 2 3 3 ,0 2 2 9 ,4 3 4 3 1 7 3 10
1 9 8 1 -8 2 2 5 ,1 7 0 1 1 ,4 6 8 2 ,1 3 9 1 3 ,6 0 7 1 1 ,5 6 3 4 ,2 6 0 2 ,7 2 6 3 3 7 2 1 0 3 5 8 5 08 6 95
1 9 8 2 -8 3 2 8 ,7 4 2 1 3 ,1 1 2 3 ,7 3 4 1 6 ,8 4 6 1 1 ,8 9 6 4 ,6 3 3 3 ,3 8 2 4 ,1 6 5 1 2 ,1 8 0 5 4 0 -8 2 3
1 9 8 3 -8 4 3 3 ,5 4 0 1 4 ,9 1 3 3 ,2 4 5 1 8 ,1 5 8 15 ,3 82 5 ,0 0 8 4 ,0 9 3 5 3 0 4 1 4 ,4 0 5 7 4 0 2 38
1 9 8 4 -8 5 3 9 ,8 5 6 1 6 ,8 1 0 4 ,6 0 6 2 1 ,4 1 6 1 8 ,4 4 0 5 ,8 5 4 4 ,7 6 2 5 ,9 1 0 1 6 ,5 2 6 1 ,1 6 4 7 5 4
1 9 8 5 -8 6 4 4 ,8 6 6 1 9 ,8 4 2 2 ,7 9 9 22 ,6 41 2 2 ,2 2 5 7 ,2 6 0 6 3 2 3 8 3 6 8 2 1 ,9 5 1 1 ,4 2 8 -1 ,1 5 4
1 9 8 6 -8 7 5 2 ,3 1 5 2 2 ,8 5 8 5 ,0 6 4 2 7 ,9 2 2 2 4 ,3 9 3 8 ,4 8 4 6 ,9 8 5 7 ,7 0 3 2 3 ,1 7 2 1 ,431 -1 1 0
1 9 8 7 -8 8 5 9 ,8 7 8 2 6 ,0 6 6 5 ,1 2 6 3 1 ,1 9 2 2 8 ,6 8 6 9 ,6 6 0 8 ,2 7 5 9 ,0 3 8 2 6 ,9 7 3 1 ,801 -8 5
1 9 8 8 -8 9 6 7 ,0 0 3 3 0 ,0 2 5 4 ,2 0 6 34 ,2 31 3 2 ,7 7 2 1 0 ,7 3 6 9 ,6 6 0 9 ,9 3 7 3 0 3 3 3 2 ,2 4 6 1 95
1 9 8 9 -9 0 76 ,7 81 3 4 ,9 3 1 6 ,1 3 0 41 ,0 61 3 5 ,7 2 0 1 3 ,0 9 7 8 ,5 0 5 1 1 ,2 5 8 3 2 ,8 6 0 2 ,5 9 5 2 6 4
1 99 0 -9 1 9 1 ,0 8 8 3 9 ,5 8 6 7 ,9 7 0 4 7 ,5 5 6 4 3 ,5 3 2 1 4 ,2 42 1 2 ,6 4 3 1 3 ,9 7 5 4 0 ,8 6 0 2 ,5 8 5 9 0
1 9 9 1 -9 2 1 07 ,9 3 0 4 8 ,4 6 2 1 0 ,8 0 0 5 9 ,2 6 2 4 8 ,6 6 8 1 6 ,8 4 7 1 5 ,2 2 6 1 3 ,0 7 0 4 5 ,1 4 3 3 3 1 2 2 12
1 9 9 2 -9 3 1 1 9 ,3 3 5 5 2 ,7 5 2 1 1 ,4 7 6 6 4 ,2 2 8 5 5 ,1 0 7 2 0 ,5 8 0 1 7 ,7 5 9 1 3 ,1 0 0 5 1 ,4 3 9 3 ,851 -1 8 3
1 9 9 3 -9 4 1 3 4 ,6 4 9 6 1 ,9 9 3 1 0 ,4 0 9 7 2 ,4 0 2 6 2 ,2 4 7 2 2 ,3 9 5 2 1 ,1 7 6 1 4 ,4 1 0 57 ,9 81 4 ,2 2 8 3 8
1 9 9 4 -9 5 1 6 0 ,9 9 9 7 6 ,1 6 1 13 ,091 8 9 ,2 5 2 7 1 ,7 4 7 2 4 ,8 5 0 22 ,2 91 1 9 ,8 7 5 6 7 ,0 1 6 5 ,0 6 5 -3 3 3
1 9 9 5 -9 6 1 7 7 ,9 4 2 8 3 ,1 9 3 1 3 ,6 6 7 9 6 ,8 6 0 8 1 ,0 8 2 2 9 ,0 7 2 2 4 ,1 7 7 2 1 3 8 7 7 4 ,6 3 6 6 ,4 4 5 0
(-) Indicates repayments of Ways and Means Advances.Source: Budget Documents of the State Governments.
84
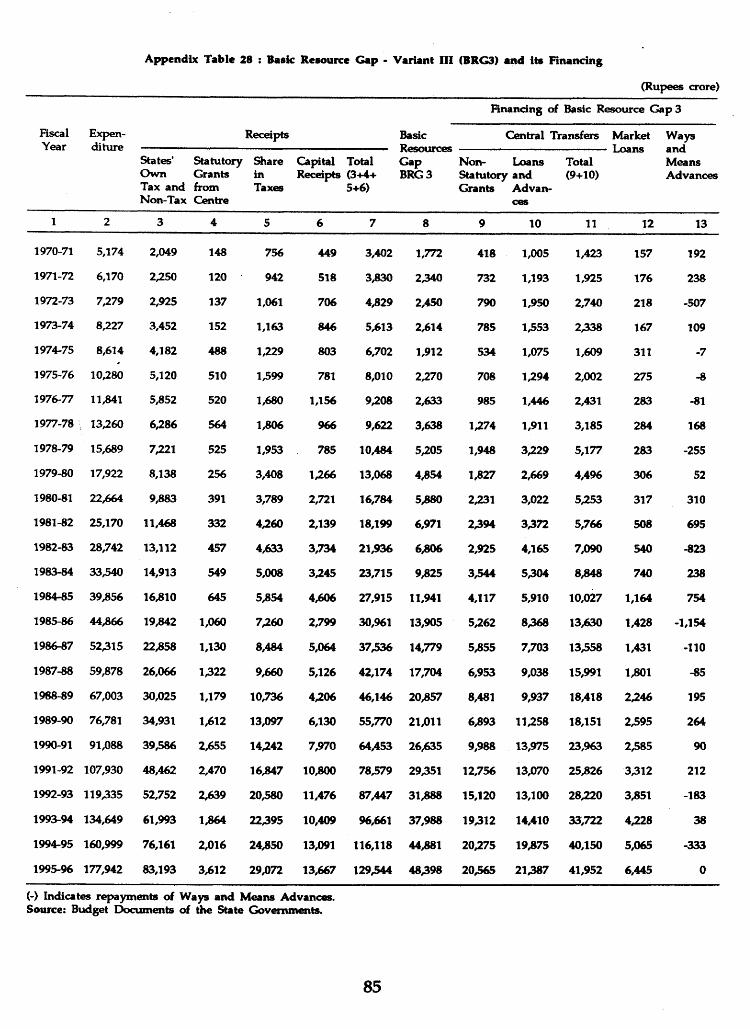
Appendix Table 28 : Basic Resource Gap - Variant III (BRG3) and its Financing
(Rupees crore)
F in a n c in g o f B a s ic R e s o u r c e G a p 3
F is c a lY e a r
E x p e n d i t u r e
R e c e ip ts B a s ic R e s o u rc e s G a p B R G 3
C e n t r a l T r a n s fe r s M a r k e tL o a n s
W a y sa n dM e a n sA d v a n c e s
S ta te s ' O w n T a x a n d N o n - T a x
S ta t u t o r yG r a n t sf r o mC e n t r e
S h a rei nT a x e s
C a p i t a l T o ta l R e c e ip ts ( 3 + 4 +
5 + 6 )
N o n - L o a n s S ta t u t o r y a n d G r a n t s A d v a n
c e s
T o t a l( 9 + 1 0 )
1 2 3 4 5 6 7 8 9 1 0 11 12 13
1 9 7 0 -7 1 5 ,1 7 4 2 ,0 4 9 1 4 8 7 5 6 4 4 9 3 ,4 0 2 1 ,7 7 2 4 1 8 1 ,0 0 5 1 ,4 2 3 1 5 7 1 9 2
1 9 7 1 -7 2 6 ,1 7 0 2 ,2 5 0 1 2 0 9 4 2 5 1 8 3 ,8 3 0 2 ,3 4 0 7 3 2 1 ,1 9 3 1 ,9 2 5 1 7 6 2 3 8
1 9 7 2 -7 3 7 ,2 7 9 2 ,9 2 5 1 3 7 1 ,0 6 1 7 0 6 4 3 2 9 2 ,4 5 0 7 9 0 1 ,9 5 0 2 ,7 4 0 2 1 8 -5 0 7
1 9 7 3 -7 4 8 ,2 2 7 3 ,4 5 2 1 52 1 ,1 6 3 8 4 6 5 ,6 1 3 2 ,6 1 4 7 8 5 1 3 5 3 2 3 3 8 1 6 7 1 09
1 9 7 4 -7 5 8 ,6 1 4 4 ,1 8 2 4 8 8 1 ,2 2 9 8 0 3 6 ,7 0 2 1 ,9 1 2 5 3 4 1 ,0 7 5 1 ,6 0 9 3 11 -7
1 9 7 5 -7 6 1 0 ,2 8 0 5 ,1 2 0 5 1 0 1 ,5 9 9 781 8 ,0 1 0 2 ,2 7 0 7 0 8 1 ,2 9 4 2 ,0 0 2 2 7 5 -8
1 9 7 6 -7 7 11 ,8 41 5 ,8 5 2 5 2 0 1 ,6 8 0 1 ,1 5 6 9 ,2 0 8 2 ,6 3 3 9 8 5 1 ,4 4 6 2 ,4 3 1 2 8 3 -8 1
1 9 7 7 -7 8 \ 1 3 ,2 6 0 6 ,2 8 6 5 6 4 1 ,8 0 6 9 6 6 9 ,6 2 2 3 ,6 3 8 1 ,2 7 4 1 ,9 1 1 3 ,1 8 5 2 8 4 1 6 8
1 9 7 8 -7 9 1 5 ,6 8 9 7 ,2 2 1 5 2 5 1 ,9 5 3 7 8 5 1 0 ,4 8 4 5 ,2 0 5 1 ,9 4 8 3 ,2 2 9 5 ,1 7 7 2 8 3 -2 5 5
1 9 7 9 -8 0 1 7 ,9 2 2 8 ,1 3 8 2 5 6 3 ,4 0 8 1 ,2 6 6 1 3 ,0 6 8 4 ,8 5 4 1 3 2 7 2 ,6 6 9 4 ,4 9 6 3 0 6 52
1 9 8 0 -8 1 2 2 ,6 6 4 9 ,8 8 3 3 91 3 ,7 8 9 2 ,7 2 1 1 6 ,7 8 4 5 ,8 8 0 2 ,2 3 1 3 ,0 2 2 5 ,2 5 3 3 1 7 3 1 0
1 9 8 1 -8 2 2 5 ,1 7 0 1 1 ,4 6 8 3 3 2 4 ,2 6 0 2 ,1 3 9 1 8 ,1 9 9 6 ,9 7 1 2 3 9 4 3 3 7 2 5 ,7 6 6 5 0 8 6 9 5
1 9 8 2 -8 3 2 8 ,7 4 2 1 3 ,1 1 2 4 5 7 4 ,6 3 3 3 ,7 3 4 2 1 ,9 3 6 6 3 0 6 2 ,9 2 5 4 ,1 6 5 7 ,0 9 0 5 4 0 -8 2 3
1 9 8 3 -8 4 3 3 ,5 4 0 1 4 ,9 1 3 5 4 9 5 ,0 0 8 3 ,2 4 5 2 3 ,7 1 5 9 ,8 2 5 3 3 4 4 5 3 0 4 8 3 4 8 7 4 0 2 3 8
1 9 8 4 -8 5 3 9 ,8 5 6 1 6 ,8 1 0 6 4 5 5 ,8 5 4 4 ,6 0 6 2 7 ,9 1 5 11 ,9 41 4 ,1 1 7 5 ,9 1 0 1 0 ,0 2 7 1 ,1 6 4 7 5 4
1 9 8 5 -8 6 4 4 ,8 6 6 1 9 ,8 4 2 1 ,0 6 0 7 ,2 6 0 2 ,7 9 9 3 0 ,9 6 1 1 3 ,9 0 5 5 ,2 6 2 8 3 6 8 1 3 ,6 3 0 1 ,4 2 8 -1 ,1 5 4
1 9 8 6 -8 7 5 2 3 1 5 2 2 ,8 5 8 1 ,1 3 0 8 ,4 8 4 5 ,0 6 4 3 7 ,5 3 6 1 4 ,7 7 9 5 3 5 5 7 ,7 0 3 1 3 3 5 8 1 ,4 3 1 -1 1 0
1 9 8 7 -8 8 5 9 ,8 7 8 2 6 ,0 6 6 1 3 2 2 9 ,6 6 0 5 ,1 2 6 4 2 ,1 7 4 1 7 ,7 0 4 6 ,9 5 3 9 ,0 3 8 1 5 ,9 9 1 1 3 0 1 -8 5
1 9 8 8 -8 9 6 7 ,0 0 3 3 0 ,0 2 5 1 ,1 7 9 1 0 ,7 3 6 4 ,2 0 6 4 6 ,1 4 6 2 0 3 5 7 8 ,4 8 1 9 ,9 3 7 1 8 ,4 1 8 2 ,2 4 6 1 95
1 9 8 9 -9 0 7 6 ,7 8 1 3 4 ,9 3 1 1 ,6 1 2 1 3 ,0 9 7 6 ,1 3 0 5 5 ,7 7 0 2 1 ,0 1 1 6 3 9 3 1 1 ,2 5 8 1 8 ,1 5 1 2 3 9 5 2 6 4
1 9 9 0 -9 1 9 1 ,0 8 8 3 9 ,5 8 6 2 ,6 5 5 1 4 ,2 4 2 7 ,9 7 0 6 4 ,4 5 3 2 6 ,6 3 5 9 ,9 8 8 1 3 ,9 7 5 2 3 ,9 6 3 2 3 8 5 9 0
1 9 9 1 -9 2 1 0 7 ,9 3 0 4 8 ,4 6 2 2 ,4 7 0 1 6 ,8 4 7 1 0 ,8 0 0 7 8 ,5 7 9 2 9 3 5 1 1 2 ,7 5 6 1 3 ,0 7 0 2 5 3 2 6 3 3 1 2 2 1 2
1 9 9 2 -9 3 1 1 9 ,3 3 5 5 2 ,7 5 2 2 ,6 3 9 2 0 ,5 8 0 1 1 ,4 7 6 8 7 ,4 4 7 3 1 3 8 8 1 5 ,1 2 0 1 3 ,1 0 0 2 8 ,2 2 0 3 3 5 1 -1 8 3
1 9 9 3 -9 4 1 3 4 ,6 4 9 6 1 ,9 9 3 1 ,8 6 4 2 2 ,3 9 5 1 0 ,4 0 9 9 6 ,6 6 1 3 7 ,9 8 8 1 9 3 1 2 1 4 ,4 1 0 3 3 ,7 2 2 4 ,2 2 8 3 8
1 9 9 4 -9 5 1 6 0 ,9 9 9 7 6 ,1 6 1 2 ,0 1 6 2 4 ,8 5 0 13 ,0 91 1 1 6 ,1 1 8 4 4 3 8 1 2 0 ,2 7 5 1 9 3 7 5 4 0 ,1 5 0 5 ,0 6 5 -3 3 3
1 9 9 5 -9 6 1 7 7 ,9 4 2 8 3 ,1 9 3 3 ,6 1 2 2 9 ,0 7 2 1 3 ,6 6 7 1 2 9 ^ 4 4 4 8 3 9 8 2 0 3 6 5 2 1 3 8 7 4 1 ,9 5 2 6 ,4 4 5 0
(-) Indicates repayments of Ways and Means Advances.Source: Budget Documents of the State Governments.
85

Appendix Table 29 : Structural and Cyclical Deficit of Central Government and Government Sector
(Percentage to GDP)
C e n t r a l G o v e r n m e n t G o v e r n m e n t S e c to r
F is c a l S t r u c t u r a l C y c l ic a l B a se Y e a r F is c a l D is c r e S t r u c t u r a l C y c l ic a l B a se Y e a r F is c a l D is c r e Y e a r D e f ic i t D e f i c i t B a la n c e D r a g t io n a r y D e f ic i t D e f ic i t B a la n c e D r a g t io n a r y
( A + K + B ) F is c a l ( A + K + B ) F is c a l
(S D ) (C D )P o l ic y P o l i c y
( A ) ( K ) (B ) (S D ) (C D ) ( A ) ( K ) (B )
1 2 3 4 5 6 7 8 9 10 11
1971 2 3 8 0 .8 8 8 .5 3 -8 .1 5 2 .01 3 3 9 1 .1 5 1 0 .8 6 -1 0 .6 8 3 .2 21 972 3 .2 1 0 .5 2 7 .9 6 -6 .9 1 2 .1 7 4 .5 8 0 .6 9 1 0 .1 3 -9 .0 6 3 .51
1 973 3 .9 7 0 3 1 7 .21 - 5 3 5 2 3 0 4 .0 2 0 .4 0 9 .1 9 -7 .2 7 2 .1 0
1 974 2 .1 7 0 .6 2 5 .9 3 -3 .8 8 0 .1 2 3 3 9 0 .8 2 7 .5 6 -5 .0 9 0 .9 2
197 5 2 3 7 0 .7 8 5 .0 2 -2 .6 3 -0 .0 3 3 .0 4 1 .02 6 .4 0 -3 .4 4 0 .0 9
1 9 7 6 3 .4 1 0 .4 3 4 .6 7 -1 .7 4 0 .4 8 4 .0 0 0 5 7 5 .9 5 -2 .2 8 0 .3 3
1 9 7 7 4 .4 0 0 .0 8 4 3 3 -0 .8 6 0 .9 3 5 .2 2 0 .1 0 5 .5 2 -1 .1 3 0 .8 3
1978 3 .8 3 0 .0 0 3 .8 3 0 .0 0 0 4 .8 8 0 .0 0 4 .8 8 0 .0 0 0
1979 5 .8 2 - 0 3 4 3 .5 3 0 .8 0 1 .49 6 .1 8 -0 .4 5 4 .5 0 1 .0 5 0 .6 3
1 98 0 6 .21 -0 .6 2 3 .2 2 1 3 7 1 .42 7 3 0 -0 .8 2 4 .1 0 2 .0 6 1 .1 4
1981 6 .4 9 - 0 3 9 2 .71 2 .1 3 1 .65 8 .4 4 -0 .51 3 .4 5 2 .8 0 2 .2
1 982 5 .6 7 -0 .2 4 2 3 0 2 .61 0 .7 5 6 .9 6 - 0 3 2 2 .9 3 3 .4 2 0 .61
1 9 8 3 6 3 9 -0 .4 2 2 .0 7 3 .1 5 1 .1 6 6 .7 9 -0 .5 5 2 .6 3 4 .1 3 0 .0 3
1 9 8 4 6 .6 0 - 0 3 2 1 .7 7 3 3 1 1 3 1 8 .11 -0 .4 2 2 .2 6 4 .6 0 1 .2 6
1 98 5 8 .0 3 -0 .5 0 1 .5 9 3 .9 7 2 .4 7 1 0 .1 8 -0 .6 6 2 .0 3 5 .21 2 .9 4
1 98 6 8 .9 2 -0 .5 8 1 .4 0 4 3 4 3 .1 7 9 .2 2 -0 .7 6 1 .7 9 5 .6 9 1 .7 4
1 9 8 7 9 .7 5 -0 .7 6 1 .2 6 4 .7 4 3 .7 5 11 .5 0 -0 .9 9 1 .6 0 6 .2 2 3 .6 8
1 9 8 8 8 .9 3 -0 .8 1 1 .1 0 5 .0 3 2 .7 9 1 0 .8 0 -1 .0 6 1 .41 6 .6 0 2 .7 9
1989 8 3 9 -0 .5 8 0 .9 3 5 .0 7 2 3 9 9 .8 3 -0 .7 6 1 .1 8 6 .6 5 2 .0 0
1 9 9 0 8 3 4 -0 .5 4 0 .81 5 .2 3 2 3 1 1 0 .1 5 -0 .71 1 .0 3 6 .8 5 2 .2 8
1991 8 .7 4 -0 .4 0 0 .6 9 5 .2 7 2 .7 7 10 .5 3 -0 .5 3 0 .8 8 6 .91 2 .7 5
1992 6 .2 6 - 0 3 7 0 .6 0 5 3 8 0 .2 8 7 .9 2 -0 .4 9 0 .7 6 7 .0 6 O i l l
1 9 9 3 6 .0 9 - 0 3 9 0 .5 2 5 .5 2 0 .0 5 7 .9 5 -0 .5 2 0 .6 6 7 .2 3 0 .0 5
1 9 9 4 7 .9 8 -0 .4 6 0 .4 6 5 .6 8 1 .8 4 9 .4 6 -0 .6 0 0 .5 8 7 .4 4 1 .4 3
199 5 6 3 8 -0 .2 8 0 3 9 5 .61 0 3 8 8 .4 4 - 0 3 6 0 .5 0 7 .3 5 0 .6 0
199 6 6 .1 8 -0 .2 8 0 3 4 5 .6 8 0 .1 5 7 .81 - 0 3 6 0 .4 3 7 .4 5 -0 .0 7
199 7 5 .2 6 -0 .2 6 0 .2 9 5 .7 3 -0 .7 8 — — — — —
N o te : (1 ) M e t h o d o l o g y u s e d i n t h e e s t im a t i o n o f S t r u c t u r a l a n d C y c l i c a l D e f i c i t i s t h e o n e a d o p t e d b y O E C D (s e e T e c h n ic a l A p p e n d ix 1 ).
(2 ) B a se Y e a r s e le c te d f o r e s t im a t io n is 1 9 7 7 -7 8 .(3 ) E x p e n d i t u r e a n d R e c e ip ts u s e d i n d ie e s t im a te s a r e G ro s s F is c a l D e f i c i t E x p e n d i t u r e a n d R e c e ip ts .(4 ) E s t im a te s a r e b a s e d cm lo n g - r u n e la s t ic i t y .
S o u rc e : B u d g e t D o c u m e n ts o f t h e G o v e r n m e n t o f I n d ia a n d S ta te G o v e r n m e n ts .
86

(Percentage to GDP)
Appendix Table 30 : Structural and Cyclical Deficit (Primary Deficit) of Central Government
FiscalYear
StructuralDeficit
(A+K+B)(SD)
CyclicalDeficit
(CD)
Base Year Balance
(A)
FiscalDrag
(K)
DiscretionaryFiscalPolicy
(B)1 2 3 4 5 6
1971 2.72 0.47 8.05 -4.38 -0.951972 3.30 0.28 7.51 -3.72 -0.501973 3.98 0.16 6.81 -2.98 0.151974 2.22 0.34 5.60 -2.09 -1.291975 2.42 0.42 4.74 -1.41 -0.911976 3.24 0.23 4.41 -0.93 -0.241977 3.98 0.04 4.09 -0.46 0.351978 3.62 0.00 3.62 0.00 0.001979 5.13 -0.18 3.34 0.43 1.361980 5.11 -0.34 3.04 0.85 1.231981 5.72 -0.21 2.55 1.15 2.021982 4.94 -0.13 2.18 1.40 1.361983 5.58 -0.23 1.95 1.70 1.941984 5.42 -0.17 1.67 1.89 1.861985 6.93 -0.27 1.50 2.14 3.291986 7.53 -0.31 1.33 2.33 3.881987 8.07 -0.41 1.19 2.55 4.331988 6.90 -0.44 1.04 2.71 3.151989 6.28 -0.31 0.88 2.73 2.681990 6.06 -0.29 0.76 2.81 2.491991 6.17 -0.22 0.65 2.83 2.681992 3.55 -0.20 0.56 2.89 0.091993 3.27 -0.21 0.49 2.97 -0.191994 5.06 -0.25 0.43 3.05 1.571995 3.26 -0.15 0.37 3.01 -0.121996 2.95 -0.15 0.32 3.06 -0.431997 2.07 -0.14 0.28 3.08 -1.29
N o te : (1 ) M e th o d o lo g y u s e d in th e e s t im a t io n o f S t r u c tu r a l a n d C y c l ic a l d e f ic i t i s th e o n e a d o p te d b y O E C D (see T e c h n ic a l A p p e n d ix 1 ).
(2 ) B ase Y e a r s e le c te d f o r e s t im a t io n i s 1 9 7 7 -7 8 .(3 ) E x p e n d i t u r e a n d R e c e ip ts u s e d i n th e e s t im a te s a re t h a t o f P r im a r y D e f ic i t o f th e C e n t r a l G o v e rn m e n t .(4 ) E s t im a te s a re b a s e d o n lo n g - t e rm e la s t ic i ty .
S o u rc e : B u d g e t D o c u m e n ts o f th e G o v e r n m e n t o f In d ia .
87

Appendix Table 31 : Fiscal Stance and Fiscal Im pulse - Central Government and Governm ent Sector
(Percentage to GDP)
FiscalYpar
Central Government Government Sector
Cyclically Neutral Budget Balance
FiscalStance
FiscalImpulse
Cyclically Neutral Budget Balance
Fiscal Stance FiscalImpulse
1 2 3 4 5 6 7
1971 -3.95 -0.68 — -5.08 -0.54 —
1972 -4.12 -0.38 0.27 -4.12 1.15 1.78
1973 -3.92 0.35 0.77 -3.92 0.50 -0.60
1974 -2,73 0.06 -0.28 -2.73 1.48 1.29
1975 -2.95 0.20 0.17 -2.95 -7.01 -9.75
1976 -4.13 -0.28 -0.50 -4.13 0.44 7.48
1977 -4.29 0.19 0.49 -4.29 1.04 0.68
1978 -3.79 0.04 -0.14 -3.79 1.09 0.19
1979 -4.42 1.06 1.10 -4.42 1.31 0.33
1980 -4.42 1.17 0.22 -4.42 2.06 0.94
1981 -3.44 2.66 2.00 -3.44 4.49 3.28
1982 -3.50 1.92 -0.41 -3.50 3.14 -0.80
1983 -4.15 1.82 0.10 -4.15 2.09 -0.81
1984 -3.62 2.65 1.28 -3.62 4.07 2.65
1985 -4.19 3.33 1.06 -4.19 5.32 1.86
1986 -4.04 4.29 1.53 -4.04 4.42 -0.32
1987 -4.28 4.71 0.97 -4.28 6.23 2.54
1988 -4.11 4.01 -0.15 -4.11 5.63 0.17
1989 -3.53 4.28 1.07 -3.53 5.53 0.95
1990 -3.83 3.97 0.31 -3.83 5.62 0.95
1991 -3.60 4.74 1.58 -3.60 6.41 1.90
1992 -3.77 2.12 -2.30 -3.77 3.66 -2.19
1993 -3.86 1.84 -0.02 -3.86 3.57 0.42
1994 -3.96 3.56 2.20 -3.96 4.89 1.99
1995 -3.46 2.64 -0.44 -3.46 4.62 0.56
1996 -3.77 2.13 -0.19 -3.77 3.68 -0.39
1997 -3.73 1.27 -0.67 — — —N o t e : (1 ) M e t h o d o lo g y u s e d i n t h e e s t im a t io n o f C y c l i c a l l y N e u t r a l B u d g e t B a la n c e , F is c a l S ta n c e a n d F is c a l Im p u ls e i s t h e
o n e a d o p t e d b y I M F (s e e T e c h n ic a l A p p e n d i x 1 ).(2 ) B a se Y e a r s e le c te d f o r e s t im a t io n i s 1 9 7 7 -7 8 .(3 ) E x p e n d i t u r e a n d R e c e ip ts u s e d i n t h e e s t im a te s a r e G ro s s F is c a l D e f i c i t E x p e n d i t u r e a n d R e c e ip ts .(4 ) E s t im a te s a r e b a s e d o n lo n g - r u n e la s t ic i t y .
S o u r c e : B u d g e t D o c u m e n t s o f t h e G o v e r n m e n t o f I n d ia a n d S ta te G o v e r n m e n ts .
88

Appendix Table 32 ; Operational Deficit of the Centre and Government Sector
(Rupees crore)FiscalYear
Centre Combined
Operational Deficit 1
OD1 as a % of GDP
Operational Deficit 2
OD2 as a % of GDP
Operational Deficit 1
OD1 as a % of GDP
Operational Deficit 2
OD2 as a % of GDP
1 2 3 4 5 6 7 8 9
1970-71 2,212 5.13 1,450 3.36 2,959 6.86 2,288 5.30
1971-72 2,546 5.50 1,814 3.92 3,455 7.47 2,822 6.10
1972-73 2,955 5.79 2,242 4.40 3,122 6.12 2,548 5.00
1973-74 2,346 3.78 1,834 2.96 3,338 5.38 2,867 4.62
1974-75 2,753 3.76 2,404 3.28 3,500 4.78 3,169 4.33
1975-76 3,607 4.58 3,167 4.02 4,288 5.44 3,884 4.93
1976-77 4,409 5.19 3,957 4.66 5,239 6.17 4,784 5.64
1977-78 4,230 4.40 3,749 3.90 5,313 5.53 4,865 5.06
1978-79 6,303 6.05 5,876 5.64 6,677 6.41 6,242 5.99
1979-80 6,647 5.81 6,496 5.68 7,712 6.74 7,538 6.59
1980-81 8,299 6.10 8,299 6.10 10,780 7.93 10,780 7.93
1981-82 8,376 5.24 8,577 5.37 10,265 6.43 10,461 6.55
1982-83 10,026 5.63 10,461 5.87 10,409 5.84 10,842 6.09
1983-84 11,952 5.76 12,552 6.05 14,728 7.09 15,315 7.38
1984-85 15,771 6.82 16,862 7.29 20,123 8.70 21,129 9.13
1985-86 19,421 7.41 20,911 7.97 19,375 7.39 20,715 7.90
1986-87 22,948 7.83 24,913 8.50 26,883 9.18 28,474 9.72
1987-88 22,334 6.70 24,743 7.43 26,988 8.10 28,896 8.67
1988-89 24,321 6.15 27,549 6.96 28,278 7.14 30,873 7.80
1989-90 26,709 5.85 30,967 6.78 32,818 7.18 36,183 7.92
1990-91 32,774 6.12 37,590 7.02 39,794 7.43 43,089 8.05
1991-92 20,118 3.26 26,780 4.34 26,964 4.37 32,878 5.33
1992-93 20,276 2.87 28,271 4.00 29,088 4.12 34,565 4.90
1993-94 35,602 4.39 45,709 5.64 42,087 5.19 48,972 6.04
1994-95 26,726 2.77 37,835 3.93 39,831 4.13 46,633 4.84
1995-96 26,296 2.35 39,618 3.54 36,626 3.27 44,079 3.94
1996-97 17,632 1.38 33,837 2.65 — — — —
Source : Budget Documents of the Government of India and State Governments.
89

Appendix Table 33 : Liquidity Balance of Government Sector (Net Bank Credit to Government)
' (Rupees crore)
Net Bank Credit to Government
FiscalYear
Net RBI Credit to Government Other Banks'
Credit to Govt
Total Bank
Credit to Govt (6+8)
Credit to Centre
% to GDP
Credit to States
% to GDP
Credit to Govt
% to GDP
% to GDP
% to GDP
1 2 3 4 5 6(2+4)
7 8 9 10(6+8)
11
1971-72 582 1.26 288 0.62 870 1.88 300 0.65 1,170 2.53
1972-73 1,212 238 -386 -0.76 826 1.62 525 1.03 1351 2.65
1973-74 631 1.02 133 0.21 764 1.23 199 0.32 963 1.55
1974-75 528 0.72 133 0.18 661 0.90 399 0.54 1,060 1.45
1975-76 -289 -037 92 0.12 -197 -0.25 827 1.05 630 0.80
1976-77 816 0.96 22 0.03 838 0.99 337 0.40 1,175 1.38
1977-78 -260 -0.27 142 0.15 -118 -0.12 2,041 2.12 1,923 2.00
1978-79 2,190 2.10 -418 -0.40 1,772 1.70 431 0.41 2,203 2.11
1979-80 2,650 2.32 339 0.30 2,989 2.61 1,095 0.96 4,084 3.57
1980-81 3,551 2.61 487 0.36 4,038 2.97 1,666 1.22 5,704 4.19
1981-82 3,208 2.01 789 0,49 3,997 2.50 918 0.57 4,915 3.08
1982-83 3,367 1.89 -984 -0.55 2383 1.34 2,241 1.26 4,624 2.60
1983-84 3,949 1.90 38 0.02 3,987 1.92 1398 0.67 5385 2.59
1984-85 6,055 2.62 1,485 0.64 7,540 3.26 2,161 0.93 9,701 4.19
1985-86 6,190 236 -1,862 -0.71 4328 1.65 3,650 1.39 7,978 3.04
1986-87 7,091 2.42 516 0.18 7,607 2.60 6,092 2.08 13,699 4.68
1987-88 6,559 1.97 -157 -0.05 6,402 1.92 5,948 1.79 12350 3.71
1988-89 6,503 1.64 425 . 0.11 6,928 1.75 5,177 1.31 12,105 3.06
1989-90 13,813 3.02 255 0.06 14,068 3.08 6,608 1.45 20,676 4.53
1990-91 14,745 2.75 420 0.08 15,165 2.83 7,877 1.47 23,042 4.30
1991-92 5,508 0.89 -340 -0.06 5,168 0.84 12,902 2.09 18,070 2.93
1992-93 4,257 0.60 176 0.02 4,433 0.63 13,542 1.92 17,975 2.55
1993-94 260 0.03 591 0.07 851 0.10 26,829 3.31 27,680 3.41
1994-95 2,130 0.22 48 0.00 2,178 0.23 16323 1.69 18,501 1.92
1995-96 19,855 1.77 16 0.00 19,871 1.78 15,488 1.38 35359 3.16
1996-97 1,934 0.15 898 0.07 2,832 0.22 28,206 2.21 31,038 2.43
1997-98 (P) 12,914 0.91 -1,936 -0.14 10,979 0.78 31,021 2.19 42,000 2.97
P : ProvisionalSource : Reserve Bank Of India, Bulletin.

m »m'< m « ' r * - f ’ ■*- ' % €€^ < e - ^ - 1 ’
■ ■ ■ - .-• . .,'■•■•. • ;. :;v