Inflammation and tissue repair markers distinguish the nodular sclerosis and mixed cellularity...
9
Inflammation and tissue repair markers distinguish the nodular sclerosis and mixed cellularity subtypes of classical Hodgkin’s lymphoma A Birgersdotter * ,1,5 , KRN Baumforth 2,5 , A Porwit 3 , J Sjo ¨ berg 4 , W Wei 2 , M Bjo ¨ rkholm 4 , PG Murray 2 and I Ernberg 1 1 Department of Microbiology, Tumor Biology and Cell Biology, Karolinska Institutet, Stockholm SE-171 77, Sweden; 2 School of Cancer Sciences, Cancer Research UK Institute for Cancer Studies, University of Birmingham, Birmingham, UK; 3 Department of Pathology, Karolinska University Hospital Solna and Karolinska Institutet, Stockholm SE-171 77, Sweden; 4 Division of Hematology, Department of Medicine, Karolinska University Hospital Solna and Karolinska Institutet, Stockholm SE-171 77, Sweden BACKGROUND: Classical Hodgkin’s lymphoma (cHL), although a malignant disease, has many features in common with an inflammatory condition. The aim of this study was to establish the molecular characteristics of the two most common cHL subtypes, nodular sclerosis (NS) and mixed cellularity (MC), based on molecular profiling and immunohistochemistry, with special reference to the inflammatory microenvironment. METHODS: We analysed 44 gene expression profiles of cHL whole tumour tissues, 25 cases of NS and 19 cases of MC, using Affymetrix chip technology and immunohistochemistry. RESULTS: In the NS subtype, 152 genes showed a significantly higher expression, including genes involved in extracellular matrix (ECM) remodelling and ECM deposition similar to wound healing. Among these were SPARC, CTSK and COLI. Immunohistochemistry revealed that the NS-related genes were mainly expressed by macrophages and fibroblasts. Fifty-three genes had a higher expression in the MC subtype, including several inflammation-related genes, such as C1Qa, C1Qb and CXCL9. In MC tissues, the C1Q subunits were mainly expressed by infiltrating macrophages. CONCLUSIONS AND INTERPRETATIONS: We suggest that the identified subtype-specific genes could reflect different phases of wound healing. Our study underlines the potential function of infiltrating macrophages in shaping the cHL tumour microenvironment. British Journal of Cancer (2009) 101, 1393 – 1401. doi:10.1038/sj.bjc.6605238 www.bjcancer.com Published online 22 September 2009 & 2009 Cancer Research UK Keywords: Hodgkin’s lymphoma; gene expression; wound healing; microenvironment Classical Hodgkin’s lymphoma (cHL), although a malignant disease, has many features in common with an inflammatory condition. cHL often presents with symptoms of fever, night sweats, itching, lymphadenopathy and splenomegaly. Laboratory findings include neutrophilia, eosinophilia, lymphocytopenia and altered serum phase reactants. Classical Hodgkin’s lymphoma is characterised by the presence of Hodgkin’s Reed – Sternberg (H-RS) cells. The H-RS cells originate from transformed pre- apoptotic germinal centre B-cells that have lost their capacity to express a high-affinity B-cell receptor (Kuppers et al, 1994; Brauninger et al, 2006). The H-RS cells constitute only a small minority (B1%) of the cell population of the tumour. The inflammatory cellular infiltrate in the cHL tumour tissue is heterogeneous, consisting of lymphocytes, macrophages, eosino- phils, mast cells, plasma cells and fibroblasts. There is evidence that these infiltrating cells are involved in a reactive inflammatory process creating an environment that allows and probably promotes the survival of H-RS cells (Poppema and van den Berg, 2000; Aldinucci et al, 2002). In cHL, cytokines and chemokines operate in a complex interaction, which seems to be important for the pathogenesis of cHL (Re et al, 2005). Several studies indicate that the release of biologically active mediators from H-RS cells, such as cytokines (e.g., interleukin (IL) 13), has an important function in the pathophysiology of cHL (Skinnider et al, 2001; Trieu et al, 2004). On the basis of morphology, cHL is divided into four subtypes: nodular sclerosis (NS), mixed cellularity (MC), lymphocyte rich and lymphocyte depleted. Ninety percent of cHL cases belong to the MC or NS subtype. The composition of the tumour tissue differs between the NS and MC subtypes. Nodular sclerosis subtype is usually associated with eosinophilia and high numbers of CD4-positive T cells. Nodular sclerosis also has a characteristic desmoplasia and displays a distinct extracellular matrix (ECM) deposition. Mixed cellularity is often characterised by the presence of epithelioid macrophages. Earlier gene expression studies of Revised 30 June 2009; accepted 14 July 2009; published online 22 September 2009 *Correspondence: Dr A Birgersdotter, Department of Microbiology, Tumour and Cell Biology, Karolinska Institutet, Box 280, Stockholm SE-171 77, Sweden; E-mail: [email protected] 5 These authors contributed equally to this work British Journal of Cancer (2009) 101, 1393 – 1401 & 2009 Cancer Research UK All rights reserved 0007 – 0920/09 $32.00 www.bjcancer.com Molecular Diagnostics
Transcript of Inflammation and tissue repair markers distinguish the nodular sclerosis and mixed cellularity...

Inflammation and tissue repair markers distinguish the nodularsclerosis and mixed cellularity subtypes of classical Hodgkin’slymphoma
A Birgersdotter*,1,5, KRN Baumforth2,5, A Porwit3, J Sjoberg4, W Wei2, M Bjorkholm4, PG Murray2
and I Ernberg1
1Department of Microbiology, Tumor Biology and Cell Biology, Karolinska Institutet, Stockholm SE-171 77, Sweden; 2School of Cancer Sciences, CancerResearch UK Institute for Cancer Studies, University of Birmingham, Birmingham, UK; 3Department of Pathology, Karolinska University Hospital Solna andKarolinska Institutet, Stockholm SE-171 77, Sweden; 4Division of Hematology, Department of Medicine, Karolinska University Hospital Solna andKarolinska Institutet, Stockholm SE-171 77, Sweden
BACKGROUND: Classical Hodgkin’s lymphoma (cHL), although a malignant disease, has many features in common with an inflammatorycondition. The aim of this study was to establish the molecular characteristics of the two most common cHL subtypes, nodularsclerosis (NS) and mixed cellularity (MC), based on molecular profiling and immunohistochemistry, with special reference to theinflammatory microenvironment.METHODS: We analysed 44 gene expression profiles of cHL whole tumour tissues, 25 cases of NS and 19 cases of MC, usingAffymetrix chip technology and immunohistochemistry.RESULTS: In the NS subtype, 152 genes showed a significantly higher expression, including genes involved in extracellular matrix (ECM)remodelling and ECM deposition similar to wound healing. Among these were SPARC, CTSK and COLI. Immunohistochemistryrevealed that the NS-related genes were mainly expressed by macrophages and fibroblasts. Fifty-three genes had a higher expressionin the MC subtype, including several inflammation-related genes, such as C1Qa, C1Qb and CXCL9. In MC tissues, the C1Q subunitswere mainly expressed by infiltrating macrophages.CONCLUSIONS AND INTERPRETATIONS: We suggest that the identified subtype-specific genes could reflect different phases of woundhealing. Our study underlines the potential function of infiltrating macrophages in shaping the cHL tumour microenvironment.British Journal of Cancer (2009) 101, 1393–1401. doi:10.1038/sj.bjc.6605238 www.bjcancer.comPublished online 22 September 2009& 2009 Cancer Research UK
Keywords: Hodgkin’s lymphoma; gene expression; wound healing; microenvironment
��������������������������������������������������������
Classical Hodgkin’s lymphoma (cHL), although a malignantdisease, has many features in common with an inflammatorycondition. cHL often presents with symptoms of fever, nightsweats, itching, lymphadenopathy and splenomegaly. Laboratoryfindings include neutrophilia, eosinophilia, lymphocytopenia andaltered serum phase reactants. Classical Hodgkin’s lymphoma ischaracterised by the presence of Hodgkin’s Reed–Sternberg(H-RS) cells. The H-RS cells originate from transformed pre-apoptotic germinal centre B-cells that have lost their capacity toexpress a high-affinity B-cell receptor (Kuppers et al, 1994;Brauninger et al, 2006). The H-RS cells constitute only a smallminority (B1%) of the cell population of the tumour. Theinflammatory cellular infiltrate in the cHL tumour tissue is
heterogeneous, consisting of lymphocytes, macrophages, eosino-phils, mast cells, plasma cells and fibroblasts. There is evidencethat these infiltrating cells are involved in a reactive inflammatoryprocess creating an environment that allows and probablypromotes the survival of H-RS cells (Poppema and van den Berg,2000; Aldinucci et al, 2002). In cHL, cytokines and chemokinesoperate in a complex interaction, which seems to be important forthe pathogenesis of cHL (Re et al, 2005). Several studies indicatethat the release of biologically active mediators from H-RS cells,such as cytokines (e.g., interleukin (IL) 13), has an importantfunction in the pathophysiology of cHL (Skinnider et al, 2001;Trieu et al, 2004).
On the basis of morphology, cHL is divided into four subtypes:nodular sclerosis (NS), mixed cellularity (MC), lymphocyte richand lymphocyte depleted. Ninety percent of cHL cases belong tothe MC or NS subtype. The composition of the tumour tissuediffers between the NS and MC subtypes. Nodular sclerosissubtype is usually associated with eosinophilia and high numbersof CD4-positive T cells. Nodular sclerosis also has a characteristicdesmoplasia and displays a distinct extracellular matrix (ECM)deposition. Mixed cellularity is often characterised by the presenceof epithelioid macrophages. Earlier gene expression studies of
Revised 30 June 2009; accepted 14 July 2009; published online 22September 2009
*Correspondence: Dr A Birgersdotter, Department of Microbiology,Tumour and Cell Biology, Karolinska Institutet, Box 280, StockholmSE-171 77, Sweden;E-mail: [email protected] These authors contributed equally to this work
British Journal of Cancer (2009) 101, 1393 – 1401
& 2009 Cancer Research UK All rights reserved 0007 – 0920/09 $32.00
www.bjcancer.com
Mo
lecu
lar
Dia
gn
ost
ics
whole-tissue cHL tumour biopsies have identified possibleprognostic markers as well as genes affected by the Epstein– BarrVirus (EBV) (Devilard et al, 2002; Sanchez-Aguilera et al, 2006;Baumforth et al, 2008).
The primary aim of this study was to establish the molecularcharacteristics of the two major cHL subtypes, NS and MC, usinggene expression profiling and immunohistochemistry.
To visualise the cell type(s) expressing the subtype-specificgenes, the same tumours were analysed by immunohistochemistry.Our results indicate that macrophages have an important functionin shaping the tumour microenvironment in cHL.
MATERIALS AND METHODS
Patients
Diagnostic lymph node biopsies from cHL patients were collectedfrom 1994 to 2004 at the Department of Pathology and Cytology,Karolinska University Hospital Solna, Sweden (n¼ 32) and obtainedfrom the Children’s Cancer and Leukaemia Group (CCLG), UK(n¼ 10). Of the Swedish samples, one NS and one MC tumour wasarrayed twice, making the number of tumour gene expressionprofiles 44. The median age of all patients was 20 years (range; 6–90);the median age of NS patients was 17 (range; 13–69), and it was 52for MC patients (range; 6–90). The male/female ratio was 16 : 6 in theNS group and 14 : 5 in the MC group. Of 41 of 42 tumours analysedfor EBV status, 17 were EBV-positive. These included 7 of 24 analysedNS tumours and 10 of 18 analysed MC tumours.
This study was performed with ethics approval from the SouthBirmingham Research Ethics Committee (LREC no. 0844) andfrom the Karolinska Institutet Research Ethics Committee North(approval number 01-004).
Samples
Fragments of fresh lymph node biopsies were snap-frozen in liquidnitrogen and stored at �801C. The cHL cases were diagnosedaccording to the criteria of the WHO classification (Jaffe et al,2001). Routine morphological and immunohistochemical staining(CD30, CD20, CD3, CD15, ALK-1), which were necessary toestablish diagnosis, were carried out on paraffin sections. EBVexpression was investigated by immunohistochemistry (latentmembrane protein 1) and in situ hybridisation (EBV encodedRNA) as described earlier (Axdorph et al, 1999).
Morphological evaluation
A comprehensive evaluation of the morphology and infiltration byvarious cell types was performed on 28 of 42 tumours by one of us(AP). The degree of eosinophilia and the number of H-RS cellswere determined by the random selection of 10 consecutive highpower fields (HPFs) in haematoxylin –eosin-stained paraffinsections. In each HPF, the number of eosinophils or H-RS cellswas determined and the sum for 10 HPF was calculated. Thebiopsies were then classified as low eosinophilia (o50 eosinophils/10 HPF), medium eosinophilia (50– 120 eosinophils/10 HPF) orhigh eosinophilia (4120 eosinophils/10 HPF). The number ofH-RS cells was detected by CD30 immunohistochemistry andclassified as few (o5 H-RS cells/10 HPFs), medium (5–10 H-RScells/10 HPFs) or many (410 H-RS cells/10 HPFs).
The numbers of infiltrating macrophages were evaluated on thebasis of CD68 staining and/or morphology and the tumours weredivided into two groups: with high and low macrophage counts.
The degree of fibrosis was classified into four groups based onmorphology and reticulin staining (Gordon-Sweet); 0 for nofibrosis, 1 for slight fibrosis, 2 for advanced fibrosis, 3 for highlyadvanced fibrosis (Table 1).
RNA preparation and evaluation
RNA extraction from biopsies was performed either with theUltraspec-II RNA isolation system (Biotecx, Houston, TX, USA)according to the manufacturer’s protocol or with the QiagenRNeasy minikit (Valencia, CA, USA) with a minor modification,that is, the amount of lysis buffer was increased to 500 ml.
Microarrays
The labelling and hybridisation were performed according to thestandard Affymetrix protocols at the KI Microarray Core Facility,Novum, Huddinge, Sweden (http://www.bea.ki.se/affymetrix/) orat Cancer Research UK (CRUK), Birmingham University, Birming-ham, UK. Two different array Affymetrix designs were used: theU133þ 2 and the human genome focus (HGF) arrays containing8793 genes (including internal controls). The probe sets in the HGFarrays are a subset of those present on the U133þ 2 arrays, whichmakes them comparable.
Bioinformatics
We used the Affymetrix GCOS (Santa Clara, CA, USA) software toconvert the CEL files into absolute statistical signals and thesamples were scaled to the average signal of 100. The first step inthe analysis was to assess the quality reports. Our inclusion criteriawere as follows: average present call above 40% for all the genes,background o90, background s.d. o2, scaling factor o2 anddegradation of GAPDH as measured by 30/50-end probes ratio o2.All samples passed four out of five criteria and were thus includedin the further analysis.
The software used to analyse the gene expression patterns in NSand MC tumours were as follows: the Gene Expression Dynamics
Table 1 Summary of the evaluation of fibrosis and number of cells
Subtype Fibrosis Eosinophilia MacrophagesCohortnumber
1 MC 0 35 Low SWE42 MC 1 2 High SWE73 MC 2 6 High SWE94 MC 1 10 High SWE315 MC 2 19 Low SWE326 MC 0 15 Low SWE337 MC 0 5 High SWE348 MC 2 5 High SWE359 MC 1 31 High SWE3710 MC 2 3 High SWE3811 MC 1 26 High SWE4112 MC 1 74 Low SWE4213 MC 0 14 High SWE4314 MC 0 5 High SWE5015 NS 2 154 Low SWE4416 NS 3 108 Low SWE4517 NS 1 40 High SWE4618 NS 3 142 High SWE4719 NS 2 30 High SWE4820 NS 2 15 Low SWE4921 NS 1 27 High SWE5122 NS 3 39 Low SWE5223 NS 2 73 High SWE5324 NS 1 90 High SWE5525 NS 2 214 Low SWE5626 NS 3 161 Low SWE5827 NS 1 4 High SWE5928 NS 2 25 High SWE60
Abbreviations: MC¼mixed cellularity; NS¼ nodular sclerosis.
Molecular profile of Hodgkin’s lymphoma infiltrate
A Birgersdotter et al
1394
British Journal of Cancer (2009) 101(8), 1393 – 1401 & 2009 Cancer Research UK
Mo
lecu
lar
Dia
gn
ostic
s
Inspector (GEDI), the Significant Analysis of Microarrays (SAM,http://www-stat.stanford.edu/~tibs/SAM/) and the dChip software(www.dChip.org). GEDI is a Matlab freeware program that usesself-organising maps (SOMs) to translate high-dimensional datainto a 2D mosaic (http://www.childrenshospital.org/research/ingber/GEDI/GEDIhome.htm).
The Gene Expression Dynamics Inspector is population-basedrather than gene-based, and is thus fit to analyse large amounts ofdata. Each tile of the mosaic represents an individual SOM clusterand is colour-coded to represent over- and under-expression of thegenes in a cluster, thus identifying the underlying gene pattern(Eichler et al, 2003).
The CEL files were converted and normalised using the robustmultichip average method and quintile normalisation beforefurther analysis (Irizarry et al, 2003). The SAM software was usedfor the identification of differentially expressed genes (using 1.7 asa fold change cutoff, and 5% false discovery rate) (Tusher et al,2001). We used SAM to investigate the correlation between geneexpression and fibrosis or eosinophilia (for 28 of the samples), anddChip 1.3 was used for cluster analysis.
Fisher’s exact test was applied for statistical analysis of thecorrelation between morphological/immunohistochemical studiesand gene expression analysis.
Real-time – PCR
For selected genes, the real-time quantitative (RT)–PCR wasperformed to validate the microarray results. The same RNAsamples from 22 of the tumours were used as templates for c-DNAreaction in the Reverse Transcription System (Promega, Madison,WI, USA).
Taqman gene expression assays (Applied Biosystems, FosterCity, CA, USA) were used with pre-made primers and FAM-MGBprobes for secreted protein acidic and rich in cysteins (SPARC)(Hs00234160), CCL22 (Hs0017080), CXCL9 (Hs0017065), CCL17(Hs0017074) and C1QB (Hs00608019). Two different types ofcontrols were included: b-actin was used as an internal control andEBV Namalwa DNA was used as a standard (Enbom et al, 2001).
Validation of microarray results usingimmunohistochemistry
Immunohistochemistry was performed as described earlier usingDako’s Envision kit (K5007, Dako, Glostrup, Denmark) (Reynoldset al, 2002). The following antibodies were used: SPARC (AON-5031, Haematologic Technologies Inc., Essex, Vermont, USA),osteoblast-specific factor 2 (OSF2) (ab14041, Abcam, Cambridge,UK), C1Q (A0136, Dako), CXCL9 (AF392, R&D Systems Inc.,Abingdon, UK), AIM (3805, ProSci Inc., Poway, CA, USA) andcathepsin K (CTSK) (ab37259, Abcam).
Dilutions used in the experiments were as follows: SPARC1 : 100, OSF2 1 : 100, C1Q 1 : 200, AIM 1 : 100 and CTSK 1 : 50.
Of the 44 tumours analysed earlier by microarrays, paraffinblocks from 28 samples were available for immunohistochemicalanalysis.
The results were scored without knowledge of the geneexpression results and the samples were arbitrarily divided intogroups according to the level of protein expression and/or thepatterns of distribution of positive cells (Table 2).
RESULTS
Gene expression profiling discriminated between cHLsubtypes
Gene expression profiles of 25 NS and 19 MC cHL samples werevisualised and compared using the GEDI software (Figure 1). GeneExpression Dynamics Inspector allows the comparison of profiles
based on the direct visual detection of transcriptome patterns.Such intuitive ‘gestalt’ perception promotes the visualisationand discovery of interesting relationships. Figure 1B and Cshow that gene expression differs between the NS and MCsubtypes of cHL. Figure 1D shows a cluster of active genes specificto NS tumours. When overlapping the MC and NS GEDI maps,no distinctive pattern could be seen besides the lack of NS‘specific’ genes in MC samples (Figure 1E). Thus, the MCgene expression profile seems to be partly defined by the lowexpression of NS ‘specific’ genes. Alternatively, the gene expressionpatterns in MC cases might be more heterogeneous (i.e., thevariation within the MC group of samples is higher than withinthe NS group).
The SAM software was used for the identification of differen-tially expressed genes (using 1.7 as a fold change cutoff, and5% false discovery rate). Significant Analysis of Microarraysrevealed that 152 genes had a higher relative expression in theNS cHL, whereas 53 genes had a higher expression in the MCsamples. The high number of NS-related genes and the findingthat MC is characterised by the lack of these genes fit well withthe abovementioned results of the GEDI analysis. Selecteddifferentially expressed genes are given in Table 3 and the list ofall genes that differed is provided in Supplementary Table 1. Itshould be mentioned that genes coding for ECM and for proteinsinvolved in ECM remodelling: collagen 1 (COLI), collagen III(COLIII), lumican (LUM), laminin-b1 (LAMB1), metallomatrix-proteinase 2 (MMP2), CTSK, connective tissue growth factor(CTGF), SPARC and OSF2 were characteristic for the NS cHL(Table 3). Moreover, some genes involved in inflammation,including CCL17, CCL22 and interleukin 9 (IL9) showed higherexpression in NS samples. Several of these genes are associatedwith late inflammatory responses in wound healing. The genescharacteristic for MC samples included inflammatory molecules:C1q subunits C1Qa and C1Qb, CXCL9, CD5L, erythropoietinreceptor and apolipoprotein C1. Other MC-related genes areknown to be associated with cytotoxic T cells: CD8, GRZA andGRZK. Cluster analysis clearly showed a division between the twosubgroups (Figure 2A).
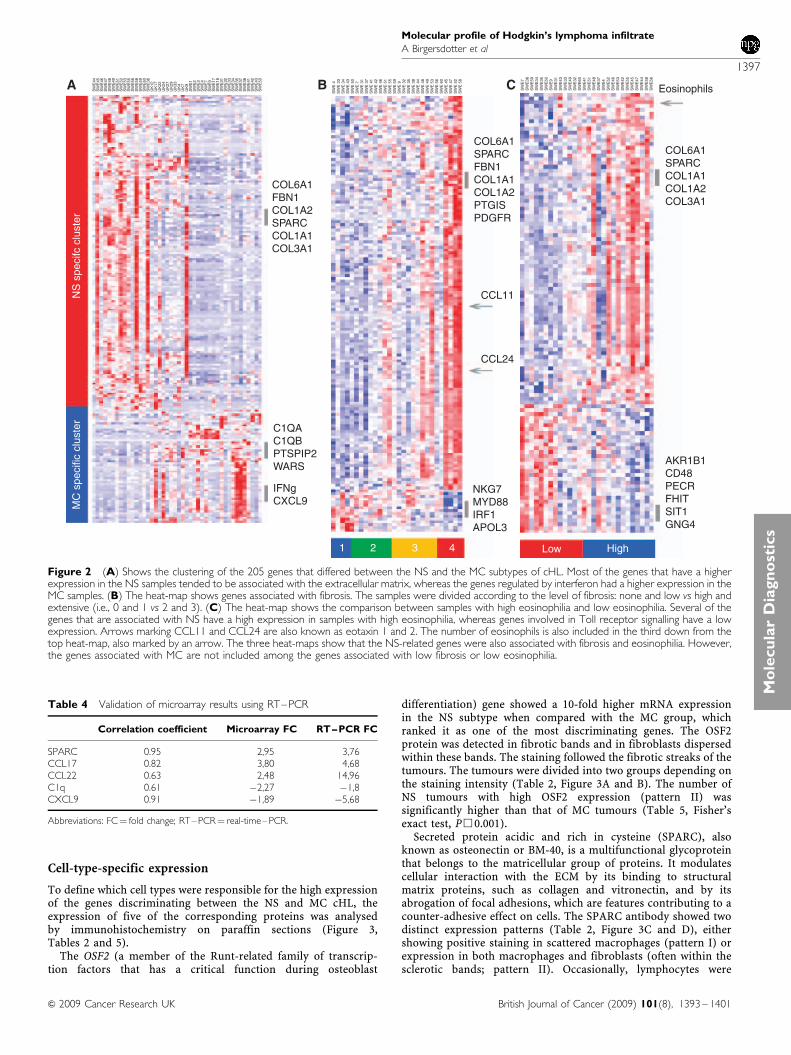
The expression levels of five genes (SPARC, CCL17, CCL22,CXCL9 and C1Qb) were validated using real-time –PCR (RT–PCR), which showed a good correlation with the microarrayexpression values (Table 4).
Table 2 Immunohistochemical patterns of studied gene productexpression
OSF2Group I Low stainingGroup II Strong positive staining in fibrotic bands and fibroblasts
SPARCGroup I Low number of macrophages positiveGroup II High staining in macrophages and fibroblasts
CTSKGroup I Low stainingGroup II High staining in macrophages and fibroblastsGroup II Extensively high staining in macrophages, fibroblasts and lymphocytes
C1QGroup I Positive in lymphocytes, low in macrophagesGroup II Positive in lymphocytes and up to 50% of macrophagesGroup III Positive in lymphocytes and 50–100% or macrophages
CXCL9Group I No/low number of cellsGroup II Positive in lymphocytesGroup III Positive in macrophages and lymphocytes
Molecular profile of Hodgkin’s lymphoma infiltrate
A Birgersdotter et al
1395
British Journal of Cancer (2009) 101(8), 1393 – 1401& 2009 Cancer Research UK
Mo
lecu
lar
Dia
gn
ost
ics
Comparison of gene expression, cellular infiltrate anddegree of fibrosis
Twenty-eight of the tumours were further examined to establishthe relationship between various gene expression patterns, thefrequency of different infiltrating cell types and the degree offibrosis (Table 1). Each histopathological variable was correlatedwith gene expression separately for each of the two subtypes. It hasbeen reported earlier that eosinophilia and fibrosis are associatedwith the NS subtype, so we wanted to analyse whether thedifference seen between MC and NS was purely due to a differencein fibrosis or a difference in tissue eosinophilia. Indeed, fibrosiswas weakly associated and eosinophilia was associated with NS inour material (Fisher’s exact test, P-value 0.057 and 0.054,respectively). There was no difference between the subtypesregarding the level of macrophage infiltration.
The level of fibrosis was denoted as low (0 for no fibrosis, 1 forslight fibrosis) or high (2 for advanced fibrosis and 3 for veryadvanced fibrosis) (Table 1). Comparison of samples with low andhigh fibrosis using the SAM software gave 144 genes withsignificantly different expression. The cluster analysis (Figure 2)showed that the NS-related genes were also associated with bothfibrosis and tissue eosinophilia. Many of these genes were ECMrelated. However, the MC-related genes were not associated withlow fibrosis or low tissue eosinophilia. Only one MC-related gene,GZMK, could be identified from the cluster analysis heat-map asassociated with no fibrosis (Figure 2B). Comparison of sampleswith high and low eosinophilia (below 70 and above 70/10 HPF)using the SAM software yielded 116 differentially expressed genes.Of the 32 genes that were associated with low tissue eosinophilia,five did overlap with the MC-related genes: IRF3, GZMK, PRF1,NKG7 and APOL3.
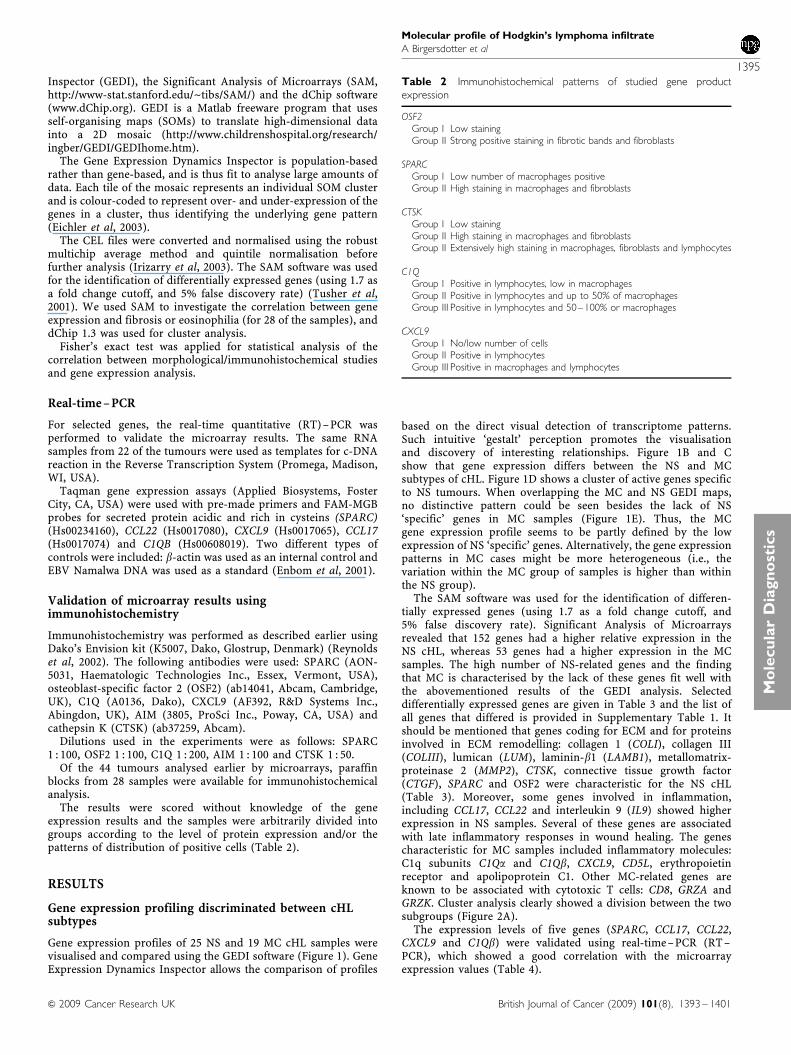
1106
483
139MC vs NS overlapNS vs MC overlapMC samplesNS samplescHL average
Figure 1 Gene expression profiles of cHL tumour samples visualised by the GEDI software. Genes with similar expression levels were grouped within thesame tile; the red tiles represent highly expressed genes, yellow tiles intermediate expression and dark blue tiles represent genes with low expression. Thecolour bar on the lower right shows the signal intensities represented by different colours. Map (A) shows all included tumours, and maps (B) and (C) showsamples divided according to the histopathological subtype. Maps (D) and (E) visualise the NS vs MC and MC vs NS comparisons. Map (D) shows a clusterof genes that have a higher expression in the NS subtype. However, a similar cluster is lacking in the (E) map.
Table 3 Selected genes differentially expressed in the NS and MC subtypes of cHLa
Gene symbol Description FC (NS/MC) FDR
ECM subunitsOSF2 Osteoblast-specific factor 1264 300 0COL3A1 Collagen, type III, a1 782 520 0COL1A1 Collagen, type I, a1 646 430 0LUM Lumican 527 060 0COL1A2 Collagen, type I, a2 421 190 0LAMB1 Laminin, b1 332 030 0
ECM remodelling genesSPARC Secreted protein, acidic, cysteine-rich (osteonectin) 294 540 0CTGF Connective tissue growth factor 258 620 0CTSK Cathepsin K (pycnodysostosis) 229 730 0MMD Monocyte to macrophage differentiation-associated 175 870 2,00E-04
Inflammation-associated genesCCL17 Chemokine (C-C motif) ligand 17 378 390 0CCL22 Chemokine (C-C motif) ligand 22 248 330 0
ReceptorsCD5L CD5 antigen-like (scavenger receptor cysteine-rich family) �197 472 0ECGF1 Endothelial cell growth factor 1 (platelet-derived) �190 512 0EPOR Erythropoietin receptor �188 608 0
IFNg-regulated genesC1QB Complement component 1, q subcomponent, b-polypeptide �227 169 0CXCL9 Chemokine (C-X-C motif) ligand 9 �189 251 0C1QA Complement component 1, q subcomponent, a-polypeptide �185 839 0IRF6 Interferon regulatory factor 6 �175 377 0
Abbreviations: cHL¼ classical Hodgkin’s lymphoma; ECM¼ extracellular matrix; FC¼ fold change; FDR¼ false discovery rate; MC¼mixed cellularity; NS¼ nodular sclerosis.aFull list is provided in Supplementary Table 1.
Molecular profile of Hodgkin’s lymphoma infiltrate
A Birgersdotter et al
1396
British Journal of Cancer (2009) 101(8), 1393 – 1401 & 2009 Cancer Research UK
Mo
lecu
lar
Dia
gn
ostic
s
Cell-type-specific expression
To define which cell types were responsible for the high expressionof the genes discriminating between the NS and MC cHL, theexpression of five of the corresponding proteins was analysedby immunohistochemistry on paraffin sections (Figure 3,Tables 2 and 5).
The OSF2 (a member of the Runt-related family of transcrip-tion factors that has a critical function during osteoblast
differentiation) gene showed a 10-fold higher mRNA expressionin the NS subtype when compared with the MC group, whichranked it as one of the most discriminating genes. The OSF2protein was detected in fibrotic bands and in fibroblasts dispersedwithin these bands. The staining followed the fibrotic streaks of thetumours. The tumours were divided into two groups depending onthe staining intensity (Table 2, Figure 3A and B). The number ofNS tumours with high OSF2 expression (pattern II) wassignificantly higher than that of MC tumours (Table 5, Fisher’sexact test, P&0.001).
Secreted protein acidic and rich in cysteine (SPARC), alsoknown as osteonectin or BM-40, is a multifunctional glycoproteinthat belongs to the matricellular group of proteins. It modulatescellular interaction with the ECM by its binding to structuralmatrix proteins, such as collagen and vitronectin, and by itsabrogation of focal adhesions, which are features contributing to acounter-adhesive effect on cells. The SPARC antibody showed twodistinct expression patterns (Table 2, Figure 3C and D), eithershowing positive staining in scattered macrophages (pattern I) orexpression in both macrophages and fibroblasts (often within thesclerotic bands; pattern II). Occasionally, lymphocytes were
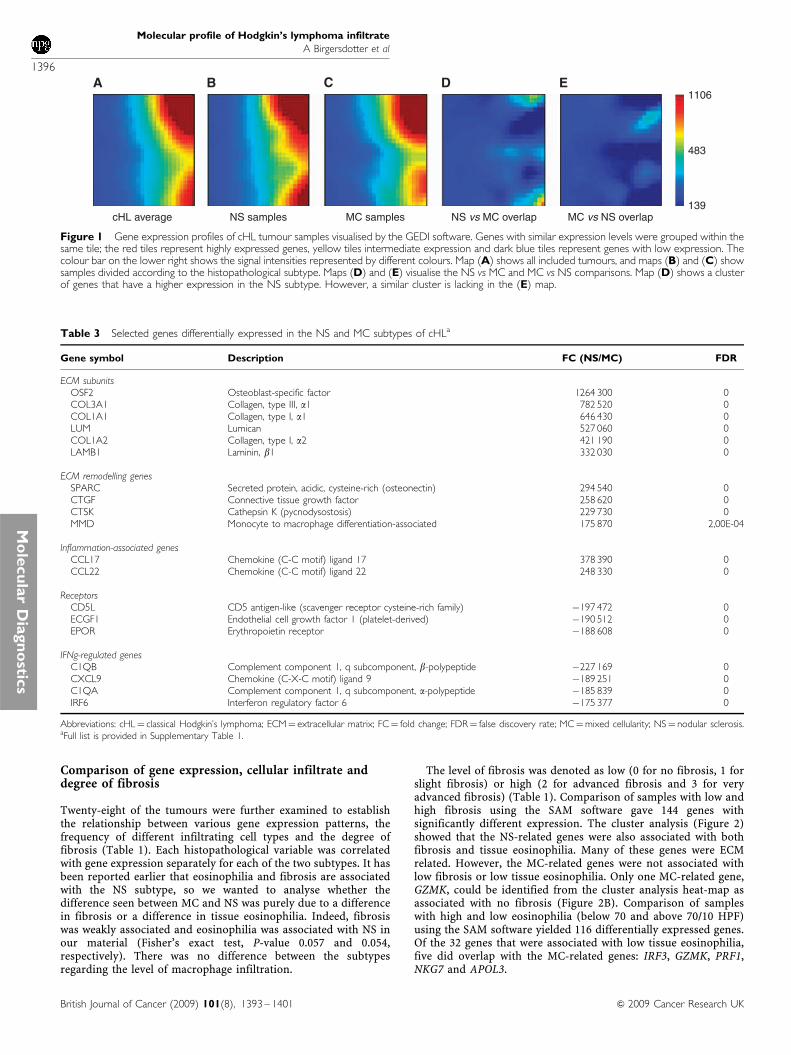
Eosinophils
COL6A1SPARCCOL1A1COL1A2COL3A1
COL6A1SPARCFBN1COL1A1COL1A2PTGISPDGFR
COL6A1FBN1COL1A2SPARCCOL1A1COL3A1
NS
spe
cifc
clu
ster
C1QAC1QBPTSPIP2WARS
IFNgCXCL9
1 2 3 4
CCL11
CCL24
NKG7MYD88IRF1APOL3
AKR1B1CD48PECRFHITSIT1GNG4
Low High
MC
spe
cific
clu
ster
A B C
Figure 2 (A) Shows the clustering of the 205 genes that differed between the NS and the MC subtypes of cHL. Most of the genes that have a higherexpression in the NS samples tended to be associated with the extracellular matrix, whereas the genes regulated by interferon had a higher expression in theMC samples. (B) The heat-map shows genes associated with fibrosis. The samples were divided according to the level of fibrosis: none and low vs high andextensive (i.e., 0 and 1 vs 2 and 3). (C) The heat-map shows the comparison between samples with high eosinophilia and low eosinophilia. Several of thegenes that are associated with NS have a high expression in samples with high eosinophilia, whereas genes involved in Toll receptor signalling have a lowexpression. Arrows marking CCL11 and CCL24 are also known as eotaxin 1 and 2. The number of eosinophils is also included in the third down from thetop heat-map, also marked by an arrow. The three heat-maps show that the NS-related genes were also associated with fibrosis and eosinophilia. However,the genes associated with MC are not included among the genes associated with low fibrosis or low eosinophilia.
Table 4 Validation of microarray results using RT–PCR
Correlation coefficient Microarray FC RT–PCR FC
SPARC 0.95 2,95 3,76CCL17 0.82 3,80 4,68CCL22 0.63 2,48 14,96C1q 0.61 �2,27 �1,8CXCL9 0.91 �1,89 �5,68
Abbreviations: FC¼ fold change; RT–PCR¼ real-time–PCR.
Molecular profile of Hodgkin’s lymphoma infiltrate
A Birgersdotter et al
1397
British Journal of Cancer (2009) 101(8), 1393 – 1401& 2009 Cancer Research UK
Mo
lecu
lar
Dia
gn
ost
ics

positive. The expression pattern II was seen more often in NS cases(Table 5, Fisher’s exact test, P¼ 0.0047)
Cathepsin K, encoded by the CTSK gene, is a protease involvedin bone resorption. Three staining patterns were found using the
CTSK antibody (Table 2, Figure 3E, F and G). Pattern I showed lowexpression in a few scattered macrophages, pattern II had a strongexpression seen mostly in macrophages and pattern III had thehighest expression, which was seen in fibroblasts, macrophages
Figure 3 Cell-type-specific expression of selected gene products revealed by immunohistochemistry. The immunohistochemistry patterns summarised inTable 2 are illustrated. (A) Pattern I of OSF2 expression showing a positive staining around a vessel in an MC case. (B) Pattern II of OSF2 expressionshowing an extensive positive staining in fibrotic streaks surrounding nodules in an NS case. (C) Pattern I of SPARC expression showing positive staining inoccasional macrophages in an MC case. (D) Pattern II of SPARC expression showing positive staining in macrophages and fibroblasts in an NS case.(E) Pattern I of CTSK expression showing occasional positive lymphocytes in an MC case. (F) Pattern II of CTSK expression with positive staining inmacrophages and occasional lymphocytes in an MC case. (G) Pattern III of CTSK expression showing positive macrophages, occasional lymphocytes andfibroblasts in an NS case. (H) Pattern I of C1Q expression showing positive staining in a few lymphocytes and occasional macrophages in an NS case.(I) Pattern II of C1Q expression showing positive staining in macrophages in an NS case. (J) Pattern III of C1Q expression with many positive macrophagesin an MC case. (K) Pattern I of CXCL9 expression with very scarce positive cells as shown in an NS case. (L) Pattern II of CXCL9 expression with smallclusters of positive lymphocytes as shown in an NS case. (M) Pattern III of CXCL9 expression showing positive lymphocytes, macrophages and H-RS cells inan MC case.
Table 5 Frequency of various immunohistochemical patterns of studied gene products in NS and MC cHL
ProteinPattern
ProteinPattern
ProteinPattern
ProteinPattern
ProteinPattern
OSF2, N¼ 23 I II SPARC, N¼ 20 I II CTSK, N¼ 20 I II III C1Q, N¼ 28 I II III CXL9, N¼ 24 I II III
MC 15 15 0 13 9 4 13 8 5 0 17 2 3 11 14 0 4 10NS 8 1 7 7 0 7 7 0 3 4 11 1 7 1 10 7 2 1
Abbreviations: cHL¼ classical Hodgkin’s lymphoma; MC¼mixed cellularity; NS¼ nodular sclerosis.
Molecular profile of Hodgkin’s lymphoma infiltrate
A Birgersdotter et al
1398
British Journal of Cancer (2009) 101(8), 1393 – 1401 & 2009 Cancer Research UK
Mo
lecu
lar
Dia
gn
ostic
s
and in a few lymphocytes. Pattern III was seen more often in NSsamples (Table 5, Fisher’s exact test P¼ 0.0017). In some tumours,positive vessels and a few H-RS cells were found. There wasvariation in the staining patterns in both the MC and NS groups.In certain tumours, high numbers of positive macrophages wereevenly distributed in the tissue. In other samples, the positivemacrophages clustered around fibrotic bands or ECM deposits.
C1Q is a subcomponent of complement 1 (C1), which recognisesand binds to the heavy chain of IgG or IgM, and initiates theclassical complement pathway. The antibody against C1Qrecognised both subunits-a and -b. Macrophages and lymphocyteswere positive in most samples. There was no difference in thelymphocyte staining between the subtypes. Three C1Qstaining patterns could be distinguished, depending on thenumbers of stained macrophages (Table 2, Figure 3H, J and K).Vessels were also positive in a fraction of tumours. Thestaining pattern III, with most stained macrophages, wassignificantly more frequent in the MC group (Table 5, Fisher’sexact test P¼ 0.0067). In some MC cases, virtually all macrophages
were stained. These samples were obtained from the oldest patientsin the study.
Chemokine (C-X-C motif) ligand 9 (CXCL9) is a small cytokinebelonging to the CXC chemokine family that is also known asMonokine induced by g-interferon. Antibody to the CXCL9 proteinstained lymphocytes, macrophages and, in some cases, H-RS cells.Three patterns were found: occasional positive staining inlymphocytes (I), positive staining in lymphocytes only (II) andpositive staining in lymphocytes and macrophages (III) (Table 2,Figure 3L, M and N). Pattern III was found mainly in the MC group(Table 5, Fisher’s exact test P¼ 0.0003).
We also stained for the CD5L/AIM protein, a soluble 38–40 kDaglycoprotein, also known as Spa, which was expressed bymacrophages and eosinophils. The number of positive cells didnot vary according to cHL subtype (data not shown).
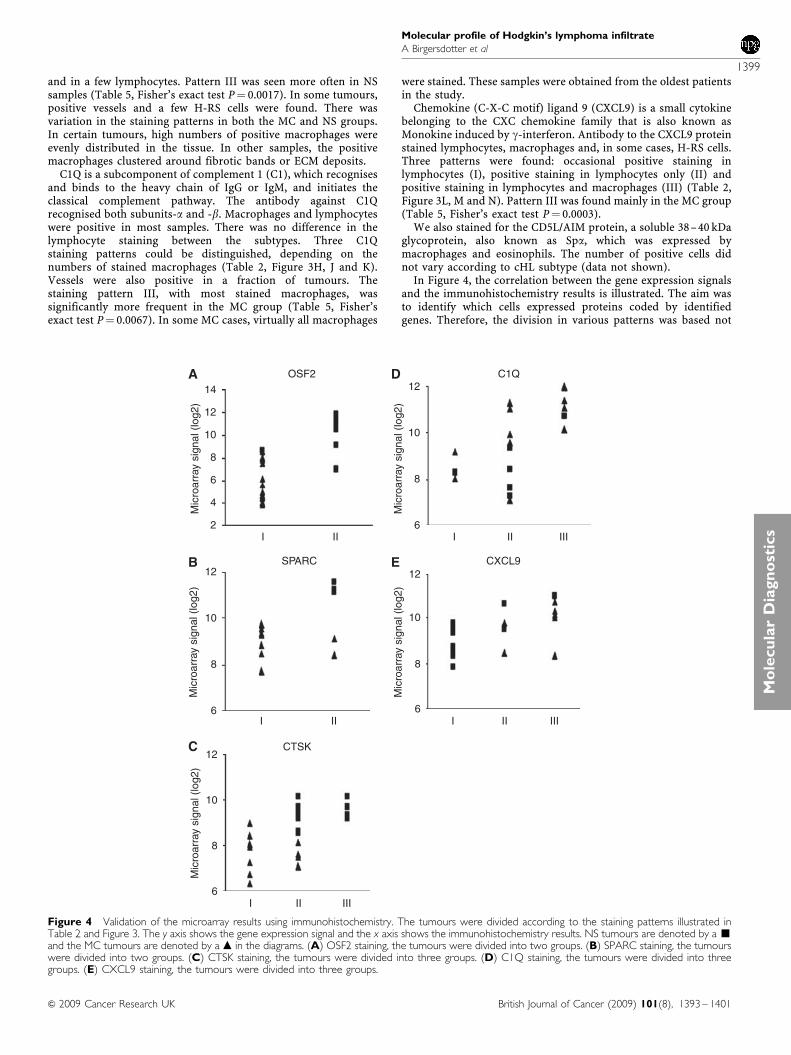
In Figure 4, the correlation between the gene expression signalsand the immunohistochemistry results is illustrated. The aim wasto identify which cells expressed proteins coded by identifiedgenes. Therefore, the division in various patterns was based not
OSF2 C1Q
Mic
roar
ray
sign
al (
log2
)
Mic
roar
ray
sign
al (
log2
)M
icro
arra
y si
gnal
(lo
g2)
Mic
roar
ray
sign
al (
log2
)M
icro
arra
y si
gnal
(lo
g2)
14 12
10
8
6I II III
12
10
8
6
4
2I II
I II
CTSK
I II III
12
10
8
6
12
10
8
6
SPARC CXCL912
10
8
6I II III
A D
B
C
E
Figure 4 Validation of the microarray results using immunohistochemistry. The tumours were divided according to the staining patterns illustrated inTable 2 and Figure 3. The y axis shows the gene expression signal and the x axis shows the immunohistochemistry results. NS tumours are denoted by a ’and the MC tumours are denoted by a m in the diagrams. (A) OSF2 staining, the tumours were divided into two groups. (B) SPARC staining, the tumourswere divided into two groups. (C) CTSK staining, the tumours were divided into three groups. (D) C1Q staining, the tumours were divided into threegroups. (E) CXCL9 staining, the tumours were divided into three groups.
Molecular profile of Hodgkin’s lymphoma infiltrate
A Birgersdotter et al
1399
British Journal of Cancer (2009) 101(8), 1393 – 1401& 2009 Cancer Research UK
Mo
lecu
lar
Dia
gn
ost
ics
only on the number of cells or the strength of positive staining, butalso on which cell types were positive. In some cases, the combinedexpression of two cell types might have the same expression levelas one cell type in other cases.
DISCUSSION
With our combined approach of gene expression profiling andin situ analysis of tumour sections, we have advanced theunderstanding of molecular differences that define the two majorsubtypes of cHL. The difference in the gene expression profilebetween NS and MC at the tissue level is dominated by an apparentmimic of different phases of the normal wound-healing process.These differences relate primarily to the phenotypes of theinfiltrating macrophages and fibroblasts. Our data suggest thatmost macrophages in the NS subtype might display the so-calledM2 phenotype because of their ECM remodelling profile, whereasthose infiltrating MC tumours are similar to cytotoxic macro-phages found in other types of lymphomas (Dave et al, 2004; deJong et al, 2009).
Many NS-related genes were associated with extracellulardeposition and some of the MC-related genes were associatedwith cytotoxic T cells and IFNg signalling, also in line with earlierpublications (Teruya-Feldstein et al, 1999). Our results suggest thatthese ECM depositions in part mimic the wound-healing processes.Wound healing can be divided into three different phases: theinflammatory phase, the proliferative phase and the remodellingphase. The inflammatory phase is characterised by an increase ofstimulated epithelial and endothelial cells producing cytokines andchemokines that recruit and activate neutrophils, macrophages,T cells, B cells and eosinophils. In the subsequent proliferativephase, macrophages are activated leading to degradation of thecontemporary ECM, myofibroblasts produce new ECM compo-nents (especially collagen III) and endothelial cells form new bloodvessels. This is followed by a remodelling and maturation phasewhen collagen fibres become more organised (collagen I replacescollagen III), blood vessels are normalised and scar tissue iseliminated (Weinberg, 2007). The inflammatory components of thegene expression pattern in MC are similar to those of theinflammatory wound-healing phase, whereas NS resembles theproliferative/tissue remodelling phase.
More than 200 genes showed subtype-specific expression in NSand MC cHL. Most of these genes showed a higher expression inthe NS subtype, whereas about 50 had a higher expression in theMC cHL. Several of the NS-related genes were regulated by TGFband/or IL-13. For example, the high expression of COLI wasspecific for NS, whereas COLIII was higher in NS than in MC. Thepromoter of COLI contains a TGFb-responsive STAT6-binding site(Buttner et al, 2004; Bhogal et al, 2005).
The differences in expression of subtype-related gene productswere seen primarily in macrophages and fibroblasts. However, thelevel of macrophage infiltration was heterogeneous within bothcHL subtypes. In certain tumours, macrophages positive for NS-related genes, such as cathepsin K, were evenly scatteredthroughout the tissue, whereas in other samples they clustered
around ECM deposits. It has been postulated that fibroblasts takeover the wound-healing process in an inflammatory environmentwhere TGFb is predominant, leading to an excess of fibrosissimilar to that seen in the proliferative and tissue remodellingphases of wound healing (Provenzano et al, 2005). Tissue growthfactor-b is also associated with the polarisation of macrophagesinto the so-called M2 phenotype associated with tissue-remodel-ling activities (Mantovani et al, 2002; Sica et al, 2008).
Our results suggest that the NS-related macrophage activity ofECM remodelling is not present in the MC subtype of cHL. This issupported by the increased STAT1 phosphorylation, CXCL9expression and the expression of C1Q subunits, which are allcontrolled by IFNg, a cytokine that has earlier been reported to beincreased in the MC subtype (Teruya-Feldstein et al, 1999). It hasearlier been shown that STAT1 activation in macrophages is linkedto prognosis in cHL (Sanchez-Aguilera et al, 2006). The level ofTAMs has been indicated to have poor prognostic impact on anumber of cancers, including breast cancer and follicularlymphomas (Leek et al, 1996; Dave et al, 2004; Shunyakov et al,2004; Sanchez-Aguilera et al, 2006). In a mouse model, it wasshown that STAT1 is activated and that the CXCL9 andC1Q subunits are expressed in TAMs (Biswas et al, 2006). TheC1Q subunits are membrane-bound molecules that are associatedwith increased phagocytic activity in macrophages (Porta et al,2007).
The H-RS cells are thought to orchestrate the composition of thetumour tissue by secreting inflammatory proteins and cytokinesand thereby controlling the infiltration of reactive cells. Theinfiltration of non-malignant cells such as eosinophils and mastcells has been reported to predict the outcome in cHL (Axdorphet al, 2001; Molin et al, 2002). Various reactive cells couldcontribute to malignancies such as cHL by releasing extracellularproteases, proangiogenic factors and chemokines (Coussens andWerb, 2002; Chiu et al, 2007). In view of the lack of an animal or invitro model system for cHL, it is difficult to study whether themicroenvironment affects the H-RS cells or vice versa. One couldhypothesise that the malignant H-RS cell is responsible for themorphological differences characteristic of the subtypes, and thusthe expression of factors produced by the H-RS cells should differbetween the subtypes. Some minor subtype-specific differences inthe profiles of the H-RS cells have been reported. PhosphorylatedSTAT6 is more commonly found in the H-RS cells of the NSsubtype compared with the MC cHL (Skinnider et al, 2002).Expression of certain kinases vary between the H-RS cells in thetwo subtypes depending on the EBV status (Renne et al, 2007).However, the gene expression profiles of the H-RS cells isolated bylaser capture showed no significant differences related to cHLsubtype or EBV status (Karube et al, 2006).
Taken together, inflammatory or wound healing-related pro-grammes, where fibroblasts and macrophages have a dominantfunction, seem to distinguish between the NS and MC cHLsubtypes.
Supplementary Information accompanies the paper on BritishJournal of Cancer website (http://www.nature.com/bjc)
REFERENCES
Aldinucci D, Poletto D, Nanni P, Degan M, Gloghini A, Di Francia R, RussoS, Carbone A, Pinto A, Gattei V (2002) Hodgkin and Reed-Sternberg cellsexpress functional c-kit receptors and interact with primary fibroblastsfrom Hodgkin’s disease-involved lymph nodes through soluble andmembrane-bound stem cell factor. Br J Haematol 118: 1055 – 1064
Axdorph U, Porwit-MacDonald A, Grimfors G, Bjorkholm M (2001) Tissueeosinophilia in relation to immunopathological and clinical character-istics in Hodgkin’s disease. Leuk Lymphoma 42: 1055 – 1065
Axdorph U, Porwit-MacDonald A, Sjoberg J, Grimfors G, Ekman M, WangW, Biberfeld P, Bjorkholm M (1999) Epstein-Barr virus expression inHodgkin’s disease in relation to patient characteristics, serum factorsand blood lymphocyte function. Br J Cancer 81: 1182 – 1187
Baumforth KR, Birgersdotter A, Reynolds GM, Wei W, Kapatai G, FlavellJR, Kalk E, Piper K, Lee S, Machado L, Hadley K, Sundblad A, Sjoberg J,Bjorkholm M, Porwit AA, Yap LF, Teo S, Grundy RG, Young LS, ErnbergI, Woodman CB, Murray PG (2008) Expression of the Epstein-Barr
Molecular profile of Hodgkin’s lymphoma infiltrate
A Birgersdotter et al
1400
British Journal of Cancer (2009) 101(8), 1393 – 1401 & 2009 Cancer Research UK
Mo
lecu
lar
Dia
gn
ostic
s
Virus-encoded Epstein-Barr Virus nuclear antigen 1 in Hodgkin’slymphoma cells mediates up-regulation of CCL20 and the migration ofregulatory T cells. Am J Pathol 173: 195 – 204
Bhogal RK, Stoica CM, McGaha TL, Bona CA (2005) Molecular aspects ofregulation of collagen gene expression in fibrosis. J Clin Immunol 25:592 – 603
Biswas SK, Gangi L, Paul S, Schioppa T, Saccani A, Sironi M, Bottazzi B,Doni A, Vincenzo B, Pasqualini F, Vago L, Nebuloni M, Mantovani A,Sica A (2006) A distinct and unique transcriptional program expressedby tumor-associated macrophages (defective NF-kappaB and enhancedIRF-3/STAT1 activation). Blood 107: 2112 – 2122
Brauninger A, Schmitz R, Bechtel D, Renne C, Hansmann ML, Kuppers R(2006) Molecular biology of Hodgkin’s and Reed/Sternberg cells inHodgkin’s lymphoma. Int J Cancer 118: 1853 – 1861
Buttner C, Skupin A, Rieber EP (2004) Transcriptional activation of thetype I collagen genes COL1A1 and COL1A2 in fibroblasts by interleukin-4: analysis of the functional collagen promoter sequences. J Cell Physiol198: 248 – 258
Chiu A, Xu W, He B, Dillon SR, Gross JA, Sievers E, Qiao X, Santini P,Hyjek E, Lee JW, Cesarman E, Chadburn A, Knowles DM, Cerutti A(2007) Hodgkin lymphoma cells express TACI and BCMA receptors andgenerate survival and proliferation signals in response to BAFF andAPRIL. Blood 109: 729 – 739
Coussens LM, Werb Z (2002) Inflammation and cancer. Nature 420:860 – 867
Dave SS, Wright G, Tan B, Rosenwald A, Gascoyne RD, Chan WC, FisherRI, Braziel RM, Rimsza LM, Grogan TM, Miller TP, LeBlanc M, GreinerTC, Weisenburger DD, Lynch JC, Vose J, Armitage JO, Smeland EB,Kvaloy S, Holte H, Delabie J, Connors JM, Lansdorp PM, Ouyang Q,Lister TA, Davies AJ, Norton AJ, Muller-Hermelink HK, Ott G, Campo E,Montserrat E, Wilson WH, Jaffe ES, Simon R, Yang L, Powell J, Zhao H,Goldschmidt N, Chiorazzi M, Staudt LM (2004) Prediction of survival infollicular lymphoma based on molecular features of tumor-infiltratingimmune cells. N Engl J Med 351: 2159 – 2169
de Jong D, Koster A, Hagenbeek A, Raemaekers J, Veldhuizen D,Heisterkamp S, de Boer JP, van Glabbeke M (2009) Impact of the tumormicroenvironment on prognosis in follicular lymphoma is dependent onspecific treatment protocols. Haematologica 94: 70 – 77
Devilard E, Bertucci F, Trempat P, Bouabdallah R, Loriod B, Giaconia A,Brousset P, Granjeaud S, Nguyen C, Birnbaum D, Birg F, Houlgatte R,Xerri L (2002) Gene expression profiling defines molecular subtypes ofclassical Hodgkin’s disease. Oncogene 21: 3095 – 3102
Eichler GS, Huang S, Ingber DE (2003) Gene Expression DynamicsInspector (GEDI): for integrative analysis of expression profiles.Bioinformatics 19: 2321 – 2322
Enbom M, Strand A, Falk KI, Linde A (2001) Detection of Epstein-Barrvirus, but not human herpesvirus 8, DNA in cervical secretions fromSwedish women by real-time polymerase chain reaction. Sex Transm Dis28: 300 – 306
Irizarry RA, Bolstad BM, Collin F, Cope LM, Hobbs B, Speed TP (2003)Summaries of Affymetrix GeneChip probe level data. Nucleic Acids Res 31: e15
Jaffe ES, Harris N, Stein H, Vardiman JW (2001) Pathology and Genetics ofTumours of Haematopoietic and Lymfoid Tissues: IARC Press:Lyon
Karube K, Ohshima K, Suzumiya J, Kawano R, Kikuchi M, Harada M (2006)Gene expression profile of cytokines and chemokines in microdissectedprimary Hodgkin and Reed-Sternberg (HRS) cells: high expression ofinterleukin-11 receptor alpha. Ann Oncol 17: 110 – 116
Kuppers R, Rajewsky K, Zhao M, Simons G, Laumann R, Fischer R,Hansmann ML (1994) Hodgkin disease: Hodgkin and Reed-Sternbergcells picked from histological sections show clonal immunoglobulin generearrangements and appear to be derived from B cells at various stages ofdevelopment. Proc Natl Acad Sci USA 91: 10962 – 10966
Leek RD, Lewis CE, Whitehouse R, Greenall M, Clarke J, Harris AL (1996)Association of macrophage infiltration with angiogenesis and prognosisin invasive breast carcinoma. Cancer Res 56: 4625 – 4629
Mantovani A, Sozzani S, Locati M, Allavena P, Sica A (2002) Macrophagepolarization: tumor-associated macrophages as a paradigm for polarizedM2 mononuclear phagocytes. Trends Immunol 23: 549 – 555
Molin D, Edstrom A, Glimelius I, Glimelius B, Nilsson G, Sundstrom C,Enblad G (2002) Mast cell infiltration correlates with poor prognosis inHodgkin’s lymphoma. Br J Haematol 119: 122 – 124
Poppema S, van den Berg A (2000) Interaction between host T cells andReed-Sternberg cells in Hodgkin lymphomas. Semin Cancer Biol 10:345 – 350
Porta C, Subhra Kumar B, Larghi P, Rubino L, Mancino A, Sica A (2007)Tumor promotion by tumor-associated macrophages. Adv Exp Med Biol604: 67 – 86
Provenzano PP, Alejandro-Osorio AL, Valhmu WB, Jensen KT, Vanderby JrR (2005) Intrinsic fibroblast-mediated remodeling of damaged collage-nous matrices in vivo. Matrix Biol 23: 543 – 555
Re D, Kuppers R, Diehl V (2005) Molecular pathogenesis of Hodgkin’slymphoma. J Clin Oncol 23: 6379 – 6386
Renne C, Hinsch N, Willenbrock K, Fuchs M, Klapper W, Engert A, KuppersR, Hansmann ML, Brauninger A (2007) The aberrant coexpression ofseveral receptor tyrosine kinases is largely restricted to EBV-negative casesof classical Hodgkin’s lymphoma. Int J Cancer 120: 2504 – 2509
Reynolds GM, Billingham LJ, Gray LJ, Flavell JR, Najafipour S, Crocker J,Nelson P, Young LS, Murray PG (2002) Interleukin 6 expression byHodgkin/Reed-Sternberg cells is associated with the presence of ‘B’symptoms and failure to achieve complete remission in patients withadvanced Hodgkin’s disease. Br J Haematol 118: 195 – 201
Sanchez-Aguilera A, Montalban C, de la Cueva P, Sanchez-Verde L,Morente MM, Garcia-Cosio M, Garcia-Larana J, Bellas C, Provencio M,Romagosa V, de Sevilla AF, Menarguez J, Sabin P, Mestre MJ, Mendez M,Fresno MF, Nicolas C, Piris MA, Garcia JF (2006) Tumor microenviron-ment and mitotic checkpoint are key factors in the outcome of classicHodgkin lymphoma. Blood 108: 662 – 668
Shunyakov L, Ryan CK, Sahasrabudhe DM, Khorana AA (2004) Theinfluence of host response on colorectal cancer prognosis. Clin ColorectalCancer 4: 38 – 45
Sica A, Larghi P, Mancino A, Rubino L, Porta C, Totaro MG, Rimoldi M,Biswas SK, Allavena P, Mantovani A (2008) Macrophage polarization intumour progression. Semin Cancer Biol 18(5): 349 – 355
Skinnider BF, Elia AJ, Gascoyne RD, Patterson B, Trumper L, Kapp U, MakTW (2002) Signal transducer and activator of transcription 6 isfrequently activated in Hodgkin and Reed-Sternberg cells of Hodgkinlymphoma. Blood 99: 618 – 626
Skinnider BF, Elia AJ, Gascoyne RD, Trumper LH, von Bonin F, Kapp U,Patterson B, Snow BE, Mak TW (2001) Interleukin 13 and interleukin 13receptor are frequently expressed by Hodgkin and Reed-Sternberg cellsof Hodgkin lymphoma. Blood 97: 250 – 255
Teruya-Feldstein J, Jaffe ES, Burd PR, Kingma DW, Setsuda JE, Tosato G(1999) Differential chemokine expression in tissues involved byHodgkin’s disease: direct correlation of eotaxin expression and tissueeosinophilia. Blood 93: 2463 – 2470
Trieu Y, Wen XY, Skinnider BF, Bray MR, Li Z, Claudio JO, Masih-Khan E,Zhu YX, Trudel S, McCart JA, Mak TW, Stewart AK (2004) Solubleinterleukin-13Ralpha2 decoy receptor inhibits Hodgkin’s lymphomagrowth in vitro and in vivo. Cancer Res 64: 3271 – 3275
Tusher VG, Tibshirani R, Chu G (2001) Significance analysis of microarraysapplied to the ionizing radiation response. Proc Natl Acad Sci USA 98:5116 – 5121
Weinberg RA (ed) (2007) The biology of cancer. Garland Science, Taylorand Francis Group, LLC: New York
Molecular profile of Hodgkin’s lymphoma infiltrate
A Birgersdotter et al
1401
British Journal of Cancer (2009) 101(8), 1393 – 1401& 2009 Cancer Research UK
Mo
lecu
lar
Dia
gn
ost
ics