Bostock's Misperceived Quest to Distinguish Title VII's Meaning
Upload
independentCategory
view
1download
0
B R A I N R E S E A R C H X X ( 2 0 0 8 ) X X X – X X X
BRES-38045; No. of pages: 13; 4C: 4, 5, 6, 8
ava i l ab l e a t www.sc i enced i r ec t . com
www.e l sev i e r. com/ l oca te /b ra in res
ARTICLE IN PRESS
Research Report
Early decreases in alpha and gamma band power distinguishlinguistic from visual information during spokensentence comprehension
Roel M. Willemsa,⁎, Robert Oostenvelda, Peter Hagoorta,b,c
aF. C. Donders Centre for Cognitive Neuroimaging, Radboud University Nijmegen, P.O. Box 9101, 6500 HB Nijmegen, The NetherlandsbMax Planck Institute for Psycholinguistics, Wundtlaan 1, 6525 XD Nijmegen, The NetherlandscNijmegen Institute for Cognition and Information, Radboud University Nijmegen, P.O. Box 9104, 6500 HE Nijmegen, The Netherlands
A R T I C L E I N F O
⁎ Corresponding author. Fax: +31 243610989.E-mail address: [email protected]
0006-8993/$ – see front matter © 2008 Elsevidoi:10.1016/j.brainres.2008.04.065
Please cite this article as: Willems, R.M.visual information during spoken sente
A B S T R A C T
Article history:Accepted 16 April 2008
Language is often perceived together with visual information. This raises the question onhow the brain integrates information conveyed in visual and/or linguistic format duringspoken language comprehension. In this study we investigated the dynamics of semanticintegration of visual and linguistic information by means of time-frequency analysis of theEEG signal. A modified version of the N400 paradigm with either a word or a picture of anobject being semantically incongruous with respect to the preceding sentence context wasemployed. Event-Related Potential (ERP) analysis showed qualitatively similar N400 effectsfor integration of either word or picture. Time-frequency analysis revealed early specificdecreases in alpha and gamma band power for linguistic and visual informationrespectively. We argue that these reflect a rapid context-based analysis of acoustic (word)or visual (picture) form information. We conclude that although full semantic integration oflinguistic and visual information occurs through a commonmechanism, early differences inoscillations in specific frequency bands reflect the format of the incoming information and,importantly, an early context-based detection of its congruity with respect to the precedinglanguage context.
© 2008 Elsevier B.V. All rights reserved.
Keywords:LanguageVisualEEGOscillationFrequencyMeaning
1. Introduction
Language is often perceived in the presence of concomitantsemantic information. For instance, linguistic utterances oftentakeplacewith referencetoobjects in theenvironment.Considersomeone showing his friend the features of a new car. Thespeaker will perhaps talk about improvements to the engine ofthe vehicle, while at the same time showing the engine to thelistener.Here, the co-occurrence of language andvisual informa-tion is an important feature of the way themessage is conveyedby the speaker as well as how it is understood by the listener. A
u.nl (R.M. Willems).
er B.V. All rights reserved
, et al., Early decreases ince comprehension, Bra
consequence of this common co-occurrence is that the braincontinuously has to integrate streams of information conveyedthrough different modalities during language comprehension.Importantly, as in the example above, such integration has tohappen at a semantic level. That is, there is noway inwhich theform properties of the visual information and of the spokenlanguage overlap. Here we investigated the possibility that suchintegration can be distinguished neurally in terms of differencesin changes in power in specific frequency bands.
Previous research indicates that integration of visual andlinguistic information at this level of processing taxes over-
.
n alpha and gamma band power distinguish linguistic fromin Res. (2008), doi:10.1016/j.brainres.2008.04.065

2 B R A I N R E S E A R C H X X ( 2 0 0 8 ) X X X – X X X
ARTICLE IN PRESS
lapping neural correlates. Several studies employing theevent-related potential (ERP) technique show that an incon-gruous picture of an object evokes a qualitatively similar N400effect as compared to an anomalousword (the N400 is thoughtto reflect semantic integration load of an itemwith respect to aprevious context; see below). For instance, Ganis et al. (1996)presented sentences that either endedwith aword or a picturethat could be anomalous or not. Similar N400 effects werefound to anomalous words and pictures. The scalp distribu-tion for the anomalous pictures was more frontal than for theanomalous words. Nigam and colleagues (Nigam et al., 1992)also found similar N400 effects for pictures and words, but didnot find a difference in scalp distribution. However, this mightbe due to the limited number of electrodes that they recordedfrom, which did not cover the frontal part of the brain.Federmeier and Kutas (2001) found a correlation between theamplitude of the N400 effect and the semantic fit of a picturewith respect to the preceding part of a sentence. Again, therewas a frontal scalp distribution for the effects. Additionally,they observed an N300 effect to the anomalous pictures. Someother ERP studies have investigated the processing of visualinformation following a visual context instead of a languagecontext. West and Holcomb (2002) for instance presented aseries of pictures forming a simple story. The last picture waseither a congruous or an incongruous ending of the story.Incongruous pictures elicited increasedN300 andN400 effects,with a maximal distribution over centro-frontal electrodes.Sitnikova et al. (2003) had congruous or incongruous objectsappear in video clips of real-world events. They observed anN400 effect for the incongruous objects with a fronto-centralmaximum in the scalp distribution. Ganis and Kutas (2003)had congruous or incongruous objects appear in still images ofreal-world events. An increased negativity strongly resem-bling the N400 was observed for the incongruous as comparedto the congruous objects. Finally, in an earlier report of the ERPanalysis of part of the data presented in this paper, we foundthat incongruous pictures and words evoke similar N400effects and lead to overlapping activations in left inferiorfrontal cortex (Willems et al., in press; see also Özyürek et al.,2007; Willems et al., 2007).
In summary, ERP studies manipulating the semantic fit ofpictures in relation to a (sentence) context report similar N400amplitudes and onset latencies as found for integration ofsemantic information conveyed through a word. Moreover,integration of information from pictures and words into asentence context leads to overlapping activations in leftinferior frontal cortex.
From these and other findings it has been claimed thatdespite differences in representational format, integration oflinguistic and non-linguistic semantic information withlanguage recruits the same neural mechanisms. In line withthis, Hagoort and colleagues showed that integration of twotypes of knowledge (lexical semantic knowledge and generalknowledge of the world) during sentence comprehensionfollows the same neural time course and recruits an over-lapping neural locus (Hagoort et al., 2004; Hagoort and vanBerkum, 2007). However, it was also found that integration ofthese information types can be distinguished in terms ofdifferences in frequency band power of the EEG (Hagoort et al.,2004). Specifically, the world knowledge violations led to an
Please cite this article as: Willems, R.M., et al., Early decreases ivisual information during spoken sentence comprehension, Bra
increase in gamma band power that was not observed forsemantic violations. Here we investigated whether analogousto Hagoort et al., visual and linguistic information also elicitdifferent responses in the frequency domain.
Time-frequency analysis can reveal effects that go unno-ticed in the time-locked ERP, due to the averaging of the signalin ERP analysis. In several domains of cognitive neuroscienceit has proven to be fruitful to study frequency-specific changesin power to specific cognitive events (see e.g. Engel et al., 2001;Tallon-Baudry, 2003; Herrmann et al., 2004b; Jensen et al.,2007). However, analysis in the time-frequency domainremains less well studied in the neurocognition of language(but see Bastiaansen and Hagoort, 2006 for a recent review).
To investigate the issue of frequency-specific effectsrelated to linguistic and visual semantic processing duringsentence comprehension, we employed the N400 paradigm. Aword with a meaning that is incongruous with respect to apreceding part of the sentence leads to a more negativedeflection in the ERP around 400 ms after word onset (Kutasand Hillyard, 1980). This effect is labeled the N400 effect andhas become a well-established indicator of semantic integra-tion of for instance a word into a preceding context (see Kutasand Van Petten, 1994 for review; Brown et al., 2000). Incontrast, the oscillatory correlates of semantic processingare not well established. Semantic processing has been linkedto increases in power in the theta band (around 4–6 Hz) bysome (Bastiaansen et al., 2005) and by decreases in power inthe alpha band (around 10 Hz) by others (Rohm et al., 2001).
Relevant for the present paper are two recent studies inwhich an N400 paradigm was used to assess oscillatorycorrelates of semantic processing during sentence compre-hension (Hald et al., 2006; Davidson and Indefrey, 2007). Haldand colleagues observed an increase in theta band (3–5 Hz)power after a semantic incongruity. This was interpreted asreflecting an increased difficulty in lexical selection in the caseof a semantically incongruous word (Hald et al., 2006).Interestingly, also an early (50–200 ms after presentation ofthe critical word) decrease in power in the gamma band (35–45 Hz) was observed. This effect was tentatively linked to theabsence of integration or ‘unification’ at the sentence level inthe incongruous condition. That is, in the case of a semanticincongruity unification of all words of the sentence into acoherent whole is rendered impossible, leading to the gradualbuilt-up of gamma power to be halted (Hald et al., 2006).
Davidson and Indefrey (2007) observed a similarly lateincrease in theta power (3–7 Hz) after a semantic violation. Noother differences were observed, but it should be noted thatthe gamma band was not analyzed in that study.
Here we investigated similarities or differences betweenoscillatory correlates of integration of information conveyedlinguistically (words) or visually (pictures) during spokensentence comprehension. To do this, we adapted the N400paradigm to modulate semantic load of either a spoken word,a picture or of both. Participants listened to spoken sentencesin which a critical word was presented which could be eithersemantically congruous or incongruous with respect to thepreceding part of the sentence. Together with the criticalword, a picture was presented which could also be congruousor incongruous (Table 1). Therewere four conditions: 1) Correctcondition (Picture congruous, Word congruous) 2) Language
n alpha and gamma band power distinguish linguistic fromin Res. (2008), doi:10.1016/j.brainres.2008.04.065
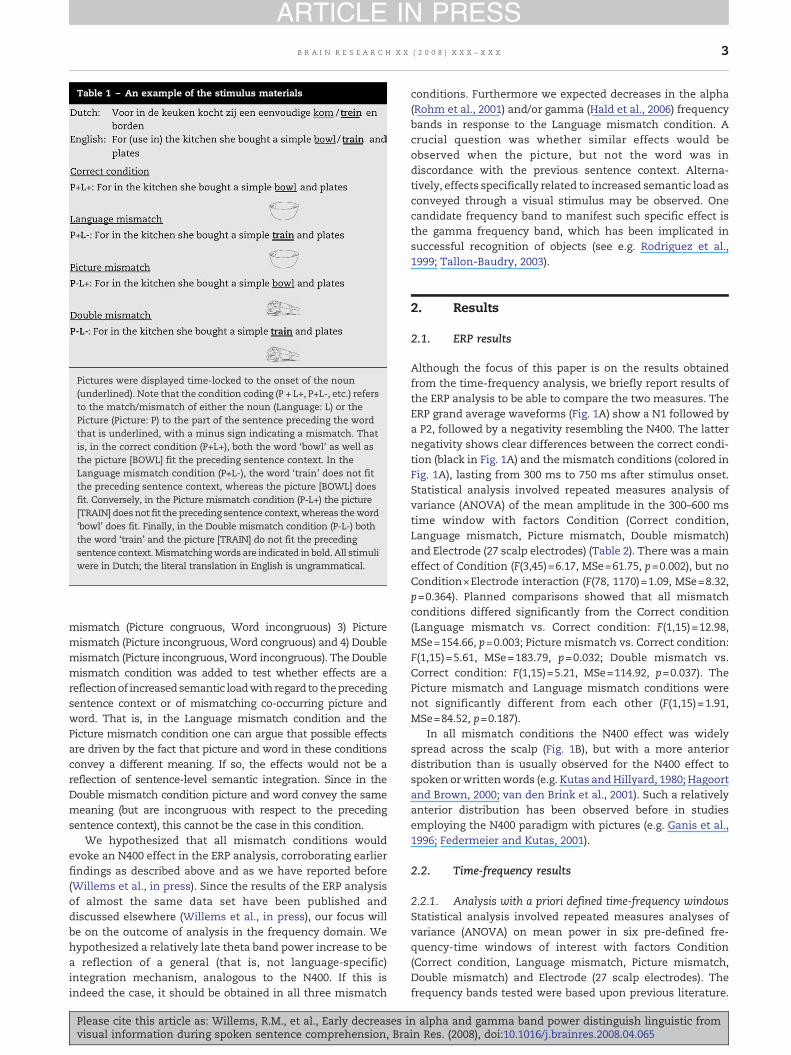
Table 1x – An example of the stimulus materials
Pictures were displayed time-locked to the onset of the noun(underlined). Note that the condition coding (P + L+, P+L-, etc.) refersto the match/mismatch of either the noun (Language: L) or thePicture (Picture: P) to the part of the sentence preceding the wordthat is underlined, with a minus sign indicating a mismatch. Thatis, in the correct condition (P+L+), both the word ‘bowl’ as well asthe picture [BOWL] fit the preceding sentence context. In theLanguage mismatch condition (P+L-), the word ‘train’ does not fitthe preceding sentence context, whereas the picture [BOWL] doesfit. Conversely, in the Picture mismatch condition (P-L+) the picture[TRAIN] doesnot fit the preceding sentence context, whereas theword‘bowl’ does fit. Finally, in the Double mismatch condition (P-L-) boththe word ‘train’ and the picture [TRAIN] do not fit the precedingsentence context.Mismatchingwords are indicated in bold. All stimuliwere in Dutch; the literal translation in English is ungrammatical.
Table 1 – An example of the stimulus materials
3B R A I N R E S E A R C H X X ( 2 0 0 8 ) X X X – X X X
ARTICLE IN PRESS
mismatch (Picture congruous, Word incongruous) 3) Picturemismatch (Picture incongruous, Word congruous) and 4) Doublemismatch (Picture incongruous,Word incongruous). The Doublemismatch condition was added to test whether effects are areflectionof increasedsemantic loadwith regard to theprecedingsentence context or of mismatching co-occurring picture andword. That is, in the Language mismatch condition and thePicture mismatch condition one can argue that possible effectsare driven by the fact that picture and word in these conditionsconvey a different meaning. If so, the effects would not be areflection of sentence-level semantic integration. Since in theDouble mismatch condition picture and word convey the samemeaning (but are incongruous with respect to the precedingsentence context), this cannot be the case in this condition.
We hypothesized that all mismatch conditions wouldevoke an N400 effect in the ERP analysis, corroborating earlierfindings as described above and as we have reported before(Willems et al., in press). Since the results of the ERP analysisof almost the same data set have been published anddiscussed elsewhere (Willems et al., in press), our focus willbe on the outcome of analysis in the frequency domain. Wehypothesized a relatively late theta band power increase to bea reflection of a general (that is, not language-specific)integration mechanism, analogous to the N400. If this isindeed the case, it should be obtained in all three mismatch
Please cite this article as: Willems, R.M., et al., Early decreases ivisual information during spoken sentence comprehension, Bra
conditions. Furthermore we expected decreases in the alpha(Rohm et al., 2001) and/or gamma (Hald et al., 2006) frequencybands in response to the Language mismatch condition. Acrucial question was whether similar effects would beobserved when the picture, but not the word was indiscordance with the previous sentence context. Alterna-tively, effects specifically related to increased semantic load asconveyed through a visual stimulus may be observed. Onecandidate frequency band to manifest such specific effect isthe gamma frequency band, which has been implicated insuccessful recognition of objects (see e.g. Rodriguez et al.,1999; Tallon-Baudry, 2003).
2. Results
2.1. ERP results
Although the focus of this paper is on the results obtainedfrom the time-frequency analysis, we briefly report results ofthe ERP analysis to be able to compare the two measures. TheERP grand average waveforms (Fig. 1A) show a N1 followed bya P2, followed by a negativity resembling the N400. The latternegativity shows clear differences between the correct condi-tion (black in Fig. 1A) and the mismatch conditions (colored inFig. 1A), lasting from 300 ms to 750 ms after stimulus onset.Statistical analysis involved repeated measures analysis ofvariance (ANOVA) of the mean amplitude in the 300–600 mstime window with factors Condition (Correct condition,Language mismatch, Picture mismatch, Double mismatch)and Electrode (27 scalp electrodes) (Table 2). There was a maineffect of Condition (F(3,45)=6.17, MSe=61.75, p=0.002), but noCondition×Electrode interaction (F(78, 1170)=1.09, MSe=8.32,p=0.364). Planned comparisons showed that all mismatchconditions differed significantly from the Correct condition(Language mismatch vs. Correct condition: F(1,15)=12.98,MSe=154.66, p=0.003; Picture mismatch vs. Correct condition:F(1,15)=5.61, MSe=183.79, p=0.032; Double mismatch vs.Correct condition: F(1,15)=5.21, MSe=114.92, p=0.037). ThePicture mismatch and Language mismatch conditions werenot significantly different from each other (F(1,15)=1.91,MSe=84.52, p=0.187).
In all mismatch conditions the N400 effect was widelyspread across the scalp (Fig. 1B), but with a more anteriordistribution than is usually observed for the N400 effect tospoken orwrittenwords (e.g. Kutas andHillyard, 1980; Hagoortand Brown, 2000; van den Brink et al., 2001). Such a relativelyanterior distribution has been observed before in studiesemploying the N400 paradigm with pictures (e.g. Ganis et al.,1996; Federmeier and Kutas, 2001).
2.2. Time-frequency results
2.2.1. Analysis with a priori defined time-frequency windowsStatistical analysis involved repeated measures analyses ofvariance (ANOVA) on mean power in six pre-defined fre-quency-time windows of interest with factors Condition(Correct condition, Language mismatch, Picture mismatch,Double mismatch) and Electrode (27 scalp electrodes). Thefrequency bands tested were based upon previous literature.
n alpha and gamma band power distinguish linguistic fromin Res. (2008), doi:10.1016/j.brainres.2008.04.065

Fig. 1 – A) Averaged event-related potentials time-locked to the onset of the critical word. Presented are the waveforms fromelectrodes FC5 (left), Fz (upper), FC6 (right) and Cz (lower) of all four conditions. The increased negativity of the colored lines(Mismatch conditions) as compared to the black line (Correct condition) is clearly visible. Negative is plotted upwards.Waveforms are low-pass filtered for illustration purposes only. B) Scalp topographies of the N400 effects in the 300-600 msrange for the Language mismatch-Correct condition (left), Picture mismatch-Correct condition (middle) and Doublemismatch-Correct condition (right) comparisons. Note the more anterior distribution than is normally observed for the N400effect elicited by spoken or written words.
4 B R A I N R E S E A R C H X X ( 2 0 0 8 ) X X X – X X X
ARTICLE IN PRESS
We tested for effects in the theta band (4–6 Hz) (Bastiaansenet al., 2005; Hald et al., 2006; Davidson and Indefrey, 2007),alpha band (8–12 Hz) (Rohm et al., 2001) and the lower gammaband (40–50Hz) (Hagoort et al., 2004; Hald et al., 2006). SeparateANOVAs were conducted in early (0–300 ms) and late (350–750ms) time windows. The results are summarized in Table 3.In the case of a main effect of Condition or Condition×Elec-trode interaction, planned comparisons were performed totest for differences between each mismatch condition vs theCorrect condition as well as between the Picture mismatchcondition and the Language mismatch condition. The factorElectrodewas always significant and is not reported in the text(see Table 3). Fig. 2 shows Time-Frequency representations ofeach single condition; Fig. 3 shows Time-Frequency represen-tations of differences between conditions.
In the early theta cluster (4–6 Hz, 0–300 ms) there was nosignificant main effect of Condition (F(3,45)=1.13, MSe=82.39,p=0.322). The Condition×Electrode interaction was marginallysignificant (F(78,1170)=1.839, MSe=10.89, p=0.080). Plannedcomparisons showed a trend towards statistical significancefor a power increase in the Double mismatch vs. Correctcondition comparison only (F(1,15)=3.74, MSe=34.47, p=0.072).
Please cite this article as: Willems, R.M., et al., Early decreases ivisual information during spoken sentence comprehension, Bra
In the late theta cluster (4–6 Hz, 0–300ms) there was amaineffect of Condition (F(3,45)=4.70, MSe=20.10, p=0.017) but noCondition×Electrode interaction (F(78,1170)=1.47, MSe=104.43, p=0.183). Planned comparisons revealed that allmismatch conditions evoked significantly stronger power ascompared to the correct condition (Language mismatch vs.Correct condition: F(1,15)=9.23, MSe=29.99, p=0.008; Picturemismatch vs. Correct condition: F(1,15)=22.76, MSe=11.93,p<0.001; Double mismatch vs. Correct condition: F(1,15)=9.44,MSe=20.46, p=0.008). Effects were maximal over Frontalelectrode sites for all comparisons (Figs. 3A, B and C). TheLanguage mismatch and Picture mismatch condition did notdiffer significantly from each other (F<1).
In the early alpha cluster (8–12 Hz, 0–300 ms), there was amarginally significant main effect of Condition (F(3,45)=2.90,MSe=32.95, p=0.071) but no Condition×Electrode interaction(F<1). Planned comparisons showed that the Double mis-match condition elicited significantly less alpha power ascompared to the Correct condition (F(1,15)=4.54, MSe=13.19,p=0.050). The effect was maximal over centro-posteriorelectrodes (Fig. 3C). The Language mismatch condition wasnot statistically different from the Correct condition (F(1,15)=
n alpha and gamma band power distinguish linguistic fromin Res. (2008), doi:10.1016/j.brainres.2008.04.065

Table 3 – Results of time-frequency analysis in a priori defined
Frequency Factor
Theta (4–6 Hz) Condition 1.Electrode 33Cond×Electrode 1.Planned comparisonsLanguage mismatch vs. Correct 2.Picture mismatch vs. Correct condition <1Double mismatch vs. Correct condition 3.Picture mismatch vs. Language mismatch <1
Alpha (8–12 Hz) Condition 2.Electrode 13Cond×Electrode <1Planned comparisonsLanguage mismatch vs. Correct 3.Picture mismatch vs. Correct condition 1.Double mismatch vs. Correct condition 4.Picture mismatch vs. Language mismatch 5.
Gamma (40–50 Hz) Condition 3.Electrode 3.Cond×Electrode <1Planned comparisonsLanguage mismatch vs. Correct 1.Picture mismatch vs. Correct condition 4.Double mismatch vs. Correct condition <1Picture mismatch vs. Language mismatch 13
Analysis involved repeated measures analysis of variance (ANOVA) on mchosen on the basis of previous literature (i.e. Rohm et al., 2001; HagoortIndefrey, 2007). Data from the theta band (4-6 Hz), alpha band (8-12 Hz) anand late (350-750 ms) time windows in ANOVAs with factors Condition (Cmismatch) and Electrode (27 levels, see Experimental procedures sectionmismatch condition and the Correct condition as well as a direct comparHuynh–Feldt correction for violation of the sphericity assumption was apreported.
Table 2 – Results of the ERP analysis
Factor F MSe P
Condition F(3,45) = 6.17 61.75 0.002Electrode F(26,390) = 15.98 353.02 < 0.001Condition × Electrode F(78,1170) = 1.09 8.32 0.364
Planned comparisonsLanguage mismatch vs. Correctcondition
F(1,15) = 12.98 154.66 0.003
Picture mismatch vs. Correctcondition
F(1,15) = 5.61 183.79 0.032
Double mismatch vs. Correctcondition
F(1,15) = 5.21 114.92 0.037
Picture mismatch vs. Languagemismatch
F(1,15) = 1.91 84.52 0.187
Analysis involved repeated measures analysis of variance (ANOVA)on the mean amplitude in the 300-600 ms time- window withfactors Condition (Correct condition, Language mismatch, Picturemismatch, Double mismatch) and Electrode (27 levels, seeExperimental Methods section). Planned comparisons involvedtesting for differences between each mismatch condition and theCorrect condition as well as between the Picture mismatchcondition and the Language mismatch condition. Huynh-Feldtcorrection for violation of the sphericity assumption was applied(Huynh and Feldt, 1976), but original degrees of freedomare reported.
5B R A I N R E S E A R C H X X ( 2 0 0 8 ) X X X – X X X
ARTICLE IN PRESS
Please cite this article as: Willems, R.M., et al., Early decreases ivisual information during spoken sentence comprehension, Bra
3.28, MSe=32.95, p=0.093), neither did the Picture mismatchcondition differ from the Correct condition (F(1,15)=1.05,MSe=18.80, p=0.321). Importantly, however, the Languagemismatch evoked significantly less alpha power as the Picturemismatch condition (F(1,15)=5.08, MSe=63.90, p=0.040).Again, the effect was maximal over centro-posterior electro-des (Fig. 3D).
In the late alpha cluster (8–12 Hz, 350–750 ms) there was nomain effect of Condition (F(3, 45)=1.73, MSe=34.60, p=0.202) ora Condition×Electrode interaction (F<1).
In the early gamma cluster (40–50 Hz, 0–300 ms), there wasa main effect of Condition (F(3,45)=3.63, MSe=0.28, p=0.023)but no Condition×Electrode interaction (F<1). Planned com-parisons showed that only the Picturemismatch condition ledto a significant decrease in power compared to the Correctcondition (F(1,15)=4.87, MSe=0.36, p=0.043). Moreover, thePicture mismatch condition was significantly different fromthe Language mismatch condition (F(1,15)=13.62, MSe=0.41,p=0.002). The scalp distribution shows two maxima, oneover left and one over right frontal electrodes, which is arather unusual distribution (Fig. 3B). Inspection of the meanpower differences of this comparison from the two electrodesin which the effect was maximal showed that the effect isconsistent over participants in electrode FC6, and can there-fore not be attributed to an artifact present in only some of the
time-frequency clusters
Early (0–300 ms) Late (350–750 ms)
F MSe df p F MSe P
13 82.39 3, 45 0.322 4.70 20.10 0.017.71 2902.45 <0.001 60.42 97.68 <0.001839 10.89 78, 1170 0.080 1.47 104.43 0.183
21 87.86 1, 15 0.158 9.23 29.99 0.0081, 15 ns 22.76 11.93 <0.001
74 34.47 1, 15 0.072 9.44 20.46 0.0081, 15 ns <1 ns
90 32.95 3, 45 0.071 1.73 34.60 0.202.78 139.92 26, 390 <0.001 15.49 85.82 <0.001
78, 1170 ns <1 ns
28 32.95 1, 15 0.09305 18.80 1, 15 0.3254 13.19 1, 15 0.05008 63.90 1, 15 0.04063 0.28 3, 45 0.023 1.07 0.27 0.36501 45.02 26, 390 0.013 3.15 40.59 0.008
78, 1170 ns 1.32 0.22 0.200
41 0.76 1, 15 0.25487 0.36 1, 15 0.043
1, 15 ns.62 0.41 1, 15 0.002
ean power in six pre-defined frequency-time windows of interest,et al., 2004; Bastiaansen et al., 2005; Hald et al., 2006; Davidson andd the lower gamma band (40-50 Hz) were analyzed in early (0-300 ms)orrect condition, Language mismatch, Picture mismatch, Double
). Planned comparisons involved testing for differences between eachison between Picture mismatch and Language mismatch conditions.plied (Huynh and Feldt, 1976), but original degrees of freedom are
n alpha and gamma band power distinguish linguistic fromin Res. (2008), doi:10.1016/j.brainres.2008.04.065

Fig. 3 – Average time-frequency representations of Language mismatch-Correct condition (A), Picture mismatch-Correctcondition (B), Double mismatch-Correct condition (C) and Picture mismatch-Language mismatch condition (D). This figureshows the difference in power in all analyzed frequency bands between the two respective conditions. Time-frequency clusters(defined a priori based upon previous literature) in which the particular mismatch differed from the Correct condition areindicated with a red square. Displayed is the average power difference over all electrodes. Scalp topographies of significantdifferences between conditions are also displayed. Note the difference in scaling between lower and higher frequencies.
Fig. 2 – Time-frequency representations of all conditions. This figure shows power increases/decreases in response tocritical word/picture (at time=0) with respect to baseline in all analyzed frequency bands. Power is normalized with respect topower in the −350 to 0 ms time window in each frequency band by computing the relative change (percent signal change)as compared to the baseline condition for each frequency band separately. That is, baseline correction involved subtractingthe mean of the baseline of that specific frequency band from the measured value and dividing this number by the meanpower in the baseline (value−baseline/baseline). Therefore, the values in the figure represent percentage power change ascompared to baseline. It was made sure that no post-stimulus activation was included in the baseline period due toconversion into the frequency domain. Although instructive, this figure does not clearly illustrate the differences betweenconditions. These are displayed in Fig. 3.
6 B R A I N R E S E A R C H X X ( 2 0 0 8 ) X X X – X X X
ARTICLE IN PRESS
Please cite this article as: Willems, R.M., et al., Early decreases in alpha and gamma band power distinguish linguistic fromvisual information during spoken sentence comprehension, Brain Res. (2008), doi:10.1016/j.brainres.2008.04.065
7B R A I N R E S E A R C H X X ( 2 0 0 8 ) X X X – X X X
ARTICLE IN PRESS
participants’ data. However, the power differences at elec-trode T7 were much less consistent over participants and theeffect is mostly due to one outlier in the data. It seems that theeffect observed on electrode T7 in the Picture mismatch vs.Correct condition comparison (Fig. 3B) is best explained as anartifact that was not detected in the artifact detectionprocedure. Note that an ANOVA without the data fromelectrode T7 yielded similar results: a main effect of Condition(F(3,45)=3.76, MSe=0.30, p=0.026) and a significant differencebetween Picture mismatch and Correct condition (F(1,15)=4.32, MSe=0.323, p=0.054) as well as between Picture mis-match and Language mismatch (F(1,15)=14.00, MSe=0.37,p=0.002) (Fig. 3D).
In the late gamma cluster (40–50 Hz, 350–750) there was nomain effect of Condition (F(3,45)=1.07, MSe=0.27, p=0.365) or aCondition×Electrode interaction (F(78,1140)=1.32, MSe=0.22,p=0.20).
In summary, first,weobserved late increases in thetapower(4–6Hz, 350–750ms) in allmismatchconditionsas compared tothe Correct condition. Second, the Doublemismatch conditiondiffered significantly from the Correct condition in the earlyalpha cluster (8–12 Hz, 0–300 ms) and the Language mismatchvs Correct condition showed a trend towards a strongerdecrease in the Language mismatch condition. Importantly, adirect comparison between Language mismatch and Picturemismatch revealed that the decrease in alpha power in theearly time window is significantly stronger in the Languagemismatch condition as compared to the Picture mismatchcondition. Finally, we observed a significant decrease in powerin the early gamma cluster in the Picture mismatch conditionas compared to the Correct condition as well as compared tothe Language mismatch condition.
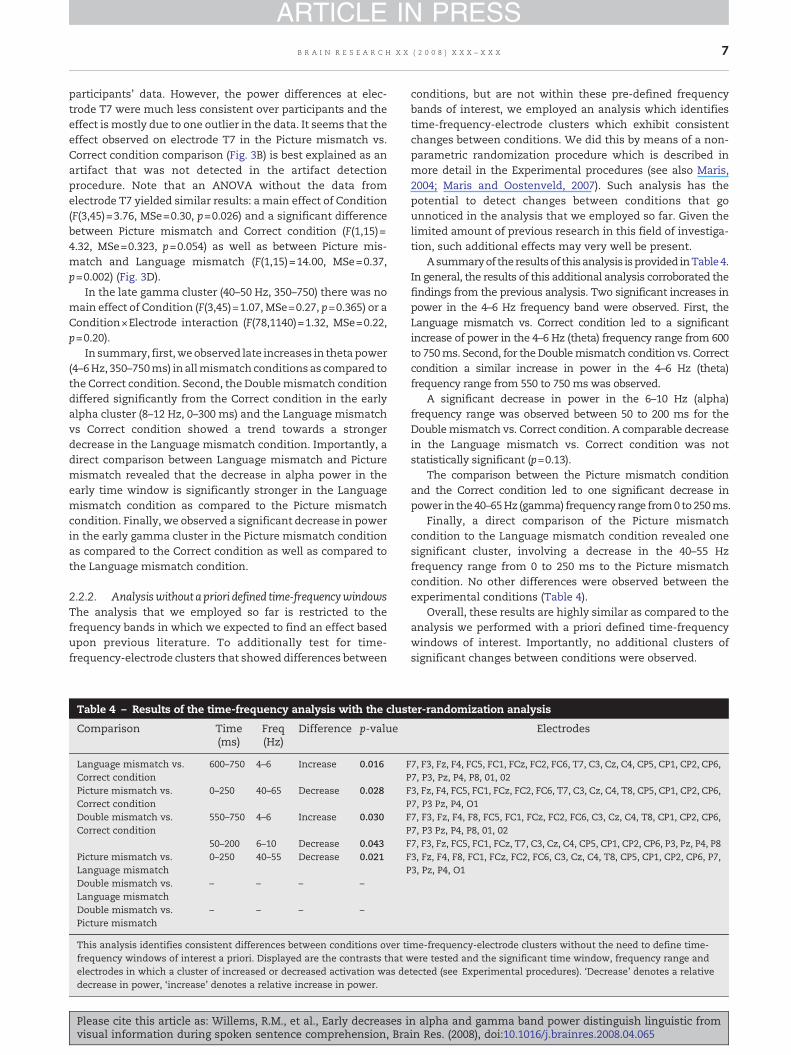
2.2.2. Analysiswithout a priori defined time-frequencywindowsThe analysis that we employed so far is restricted to thefrequency bands in which we expected to find an effect basedupon previous literature. To additionally test for time-frequency-electrode clusters that showed differences between
Table 4 – Results of the time-frequency analysis with the clus
Comparison Time(ms)
Freq(Hz)
Difference p-value
Language mismatch vs.Correct condition
600–750 4–6 Increase 0.016 FP
Picture mismatch vs.Correct condition
0–250 40–65 Decrease 0.028 FP
Double mismatch vs.Correct condition
550–750 4–6 Increase 0.030 FP
50–200 6–10 Decrease 0.043 FPicture mismatch vs.Language mismatch
0–250 40–55 Decrease 0.021 FP
Double mismatch vs.Language mismatch
– – – –
Double mismatch vs.Picture mismatch
– – – –
This analysis identifies consistent differences between conditions over tifrequency windows of interest a priori. Displayed are the contrasts that welectrodes in which a cluster of increased or decreased activation was dedecrease in power, ‘increase’ denotes a relative increase in power.
Please cite this article as: Willems, R.M., et al., Early decreases ivisual information during spoken sentence comprehension, Bra
conditions, but are not within these pre-defined frequencybands of interest, we employed an analysis which identifiestime-frequency-electrode clusters which exhibit consistentchanges between conditions. We did this by means of a non-parametric randomization procedure which is described inmore detail in the Experimental procedures (see also Maris,2004; Maris and Oostenveld, 2007). Such analysis has thepotential to detect changes between conditions that gounnoticed in the analysis that we employed so far. Given thelimited amount of previous research in this field of investiga-tion, such additional effects may very well be present.
Asummaryof the resultsof thisanalysis isprovided inTable4.In general, the results of this additional analysis corroborated thefindings from the previous analysis. Two significant increases inpower in the 4–6 Hz frequency band were observed. First, theLanguage mismatch vs. Correct condition led to a significantincrease of power in the 4–6 Hz (theta) frequency range from 600to 750ms. Second, for the Doublemismatch condition vs. Correctcondition a similar increase in power in the 4–6 Hz (theta)frequency range from 550 to 750 ms was observed.
A significant decrease in power in the 6–10 Hz (alpha)frequency range was observed between 50 to 200 ms for theDoublemismatch vs. Correct condition. A comparable decreasein the Language mismatch vs. Correct condition was notstatistically significant (p=0.13).
The comparison between the Picture mismatch conditionand the Correct condition led to one significant decrease inpower in the40–65Hz (gamma) frequency range from0 to 250ms.
Finally, a direct comparison of the Picture mismatchcondition to the Language mismatch condition revealed onesignificant cluster, involving a decrease in the 40–55 Hzfrequency range from 0 to 250 ms to the Picture mismatchcondition. No other differences were observed between theexperimental conditions (Table 4).
Overall, these results are highly similar as compared to theanalysis we performed with a priori defined time-frequencywindows of interest. Importantly, no additional clusters ofsignificant changes between conditions were observed.
ter-randomization analysis
Electrodes
7, F3, Fz, F4, FC5, FC1, FCz, FC2, FC6, T7, C3, Cz, C4, CP5, CP1, CP2, CP6,7, P3, Pz, P4, P8, 01, 023, Fz, F4, FC5, FC1, FCz, FC2, FC6, T7, C3, Cz, C4, T8, CP5, CP1, CP2, CP6,7, P3 Pz, P4, O17, F3, Fz, F4, F8, FC5, FC1, FCz, FC2, FC6, C3, Cz, C4, T8, CP1, CP2, CP6,7, P3 Pz, P4, P8, 01, 027, F3, Fz, FC5, FC1, FCz, T7, C3, Cz, C4, CP5, CP1, CP2, CP6, P3, Pz, P4, P83, Fz, F4, F8, FC1, FCz, FC2, FC6, C3, Cz, C4, T8, CP5, CP1, CP2, CP6, P7,3, Pz, P4, O1
me-frequency-electrode clusters without the need to define time-ere tested and the significant time window, frequency range andtected (see Experimental procedures). ‘Decrease’ denotes a relative
n alpha and gamma band power distinguish linguistic fromin Res. (2008), doi:10.1016/j.brainres.2008.04.065

8 B R A I N R E S E A R C H X X ( 2 0 0 8 ) X X X – X X X
ARTICLE IN PRESS
As described below,we suspected that the early decreases inalpha/gamma frequency band would be modulated by theamount of prediction which develops over the time course ofthe experiment.We tested for a linear correlation between itemorder and effect size in the early (0–300 ms) gamma range (40–50 Hz) between Picture mismatch and the Correct condition, aswell as in the early (0–300 ms) window in the alpha frequencyband (8–12 Hz) comparing the Language mismatch vs Correctcondition and the Double mismatch vs Correct condition. Nostatistically significant correlations between effect size anditem position were observed (all pN0.25), indicating that theeffect size in the alpha and gamma clusters did not increase ordecrease over the course of the experiment. Neither didanalyzing the effect sizes in four separate time-bins reveal aneffect of item order (see Experimental procedures for details).
3. Discussion
We investigated whether visual and linguistic informationpresented during language comprehension can be distin-guished in terms of changes in power in specific frequencybands of the EEG signal. To increase semantic load of eitherword and/or picture during sentence comprehension weemployed a modified version of the N400 paradigm in whicheither a word, a picture, or both word and picture could besemantically incongruous with respect to the preceding partof the sentence. Indeed, we found that early decreases inpower in the alpha and gamma frequency bands werespecifically related to linguistic or visual information load.Beforewe discuss these specific effects, it should be noted thatwe replicated earlier findings of similar N400 effects for allthree experimental conditions. That is, qualitatively similarN400 effects were observed regardless of the format (linguisticor visual) in which incongruous semantic information wasconveyed. For discussion of the theoretical implication of thisfinding we refer to two recent papers from our lab (i.e. Hagoortand van Berkum, 2007; Willems et al., in press). An increase intheta power was observed for all mismatch conditions. It istempting to interpret the theta power increase as anoscillatory counterpart of the N400 effect. Analogous to the
Fig. 4 – Time-frequency representation of the averaged Event-Rerepresentation of the ERP difference waves between two conditioLanguage mismatch-Correct condition (A), Picture mismatch-Cor(C) and the Picture mismatch-Languagemismatch condition (D). T4 Hz is clearly visible. TFRs were created by applying the same aused in the time-frequency analysis of the single trial data.
Please cite this article as: Willems, R.M., et al., Early decreases ivisual information during spoken sentence comprehension, Bra
hypothesized role of the N400, theta increases may reflectincreases in semantic integration load. That is, the harder it isto integrate information into a context representation, thestronger the theta power increase. Indeed, conversion of theERP difference waves into the time-frequency domain, showsan increase around 4 Hz, comparable to the theta increaseobserved in the frequency analysis (Fig. 4). This patternsuggests that an increase in theta power and the N400 effectmay reflect at least partially overlapping cognitive processes.However, previous findings of theta power increases duringlanguage comprehension suggest that the role of theta powerincreases may be broader than just semantic processing. Thatis, although theta increases have been implicated in semanticprocessing (Hagoort et al., 2004; Bastiaansen et al., 2005; Haldet al., 2006), they are also reported for increased syntacticprocessing (Bastiaansen et al., 2002) and working memoryoperations in general (e.g. Klimesch, 1999). This is not the casefor the N400 effect which is closely linked to semanticprocessing (Kutas and Van Petten, 1994; Brown et al., 2000).A viable possibility is that the theta increases observed hereare a reflection of increased (working) memory load, as wassuggested recently (Bastiaansen and Hagoort, 2006).
Specifically related to linguistic information, we observedan early (around 150 ms) decrease in alpha power in theDouble mismatch condition. Moreover, a direct comparisonbetween Language mismatch and Picture mismatch condi-tions showed that the decrease in alpha power was signifi-cantly stronger in the Language mismatch condition.However, this effect failed to reach significance in theLanguage mismatch condition vs Correct condition compar-ison. The alpha band has been claimed to be implicated ingeneral levels of attention or vigilance (Klimesch, 1999), insemantic processing in language tasks (Rohm et al., 2001) andin working memory processes (Jensen et al., 2002; Jokisch andJensen, 2007). It is however not directly evident how thisprevious literature can explain the decrease in alpha that weobserved. General effects of attention/vigilance or workingmemory are unlikely to have been different in the Languageand Double mismatch conditions compared to the Picturemismatch condition. Second, the occurrence of the effectseems to be too early to reflect a full semantic analysis of the
lated Potentials. This figure shows a time-frequencyns. Displayed are the TFRs of the difference waves of therect condition (B), Double mismatch-Correct conditionhemanifestation of the N400 as an increase in power aroundnalysis procedure for the averaged ERP difference waves as
n alpha and gamma band power distinguish linguistic fromin Res. (2008), doi:10.1016/j.brainres.2008.04.065

9B R A I N R E S E A R C H X X ( 2 0 0 8 ) X X X – X X X
ARTICLE IN PRESS
critical word in connection to the preceding context. Analternative explanation that we entertain here is that adecrease in alpha power reflects an early detection ofmismatch in the observed acoustic input based upon thepreceding sentence context. That is, in the Language mis-match condition as well as in the Double mismatch conditionthe incoming acoustic information from the mismatchingcritical word is different from the ‘correct’ or matching criticalword from the first phoneme on. It is hypothesized that arapid, context-based analysis of the acoustic information thatwas not in accordance with the preceding context is at thebasis of the alpha power decrease. This effect is reminiscent ofthe N200 effect that has been reported when the onset of aspoken word differs from the word onset of words that form acongruous completion (Hagoort and Brown, 2000; van denBrink et al., 2001).
Interestingly, Weiss and Rappelsberger (1998) observed aless wide-spread alpha band desynchronisation in reaction toauditory presented words as compared to visually presentedwords. Similarly, Krause and colleagues observed less strongdesynchronisation in the alpha frequency band to auditorypresented words as compared to visually presented words(Krause et al., 2006; see also Krause et al., 1997). In the light ofthe present findings, it is important to note that these studiessuggest that hearing language leads to different effects in thealpha frequency band as compared to reading language.Auditory language leads to less alpha band power ascompared to visually presented language. This may seem atodds with our present findings of a decrease in alpha bandpower for amismatchingword. However, it is possible that thedetection of a mismatch in acoustic form interferes with thestandard processing of an auditory presented word and leadsto a power decrease.
Our explanation implies that the upcoming word is at leastto some extent predicted. That is, detection of acoustic formwhich is not in accordance with the previous context,necessitates that another form was expected. Prediction hasbeen shown to play a role in language comprehension and toinfluence the N400 effect (DeLong et al., 2005; Van Berkumet al., 2005). There is some previous literature which suggeststhat decrease in alpha band power is sensitive to effects ofcontext on the processing of linguistic stimuli. For instance,Krause et al. (1999) observed a larger decrease to repetition ofthe same word as compared to the presentation of twodifferent words (see also Karrasch et al., 1998). Klimeschet al. (1990) observed strong effects of expectancy of words andnumbers on the amount of alpha band desynchronisation(Klimesch et al., 1990). That is, power decreases in alpha powerwere stronger when only words were presented as comparedto when words and numbers were randomly intermixed(Klimesch et al., 1990). Although this result indicates thatdecreases in alpha power are related to expectancy of an item,it should be noted that all stimuli in Klimesch et al. werepresented visually. That is, the relation to expectancy was notfound to be specific for auditory stimuli, as was the case in ourstudy. Finally, it has been found that the processing of a novel,unexpected stimulus leads to less synchronisation in thealpha frequency band between cortical areas in the cat ascompared to an expected stimulus (von Stein et al., 2000).Given these previous findings of an influence of expectancy/
Please cite this article as: Willems, R.M., et al., Early decreases ivisual information during spoken sentence comprehension, Bra
prediction on alpha power, we considered the effect ofprediction in our data. In the present study, the clozeprobability of the correct critical words (the amount ofparticipants that filled in the critical word in a pretest, seeExperimental procedures) was low (16% on average), so that itis unlikely that expectation was high for the critical words.Moreover, there was no correlation between the effect size ofLanguage mismatch minus Correct condition or of Doublemismatch minus Correct condition in the alpha cluster withthe order of items. Put differently, the size of the alphadecrease did not increase or decrease over the time course ofthe experiment. Such an effect might have been expected ifparticipants are able to predict the upcoming critical wordwhen they have become familiar with the set of critical words.However, an alternative explanation is that the languagesystemdoes predict upcoming words, but that the expectationis not stable over individuals (as reflected in low clozeprobabilities). Unfortunately, there is no way in which wecan test this assertion in the present study.
An early decrease in the gamma frequency band wasobserved for the Picture mismatch condition, both in compar-ison to the Correct condition as compared to the Languagemismatch condition. Therefore, this seems to be a specificeffect to increased semantic load for information conveyedvisually, as through a picture. Analogously to the alphadecrease, we interpret this finding as reflecting an earlydetection of a mismatch between visual information from thepicture and the preceding context. That this effect ismanifested in the gamma frequency band is in line with alarge body of literature showing successful object recognitionto be associated with gamma power increases (see e.g.Rodriguez et al., 1999; Tallon-Baudry, 2003). Our data extendthe role of gammaband oscillations in visual object processingto be also related to early detection of a mismatch ascompared to a preceding sentence context. That is, theseoscillations are not only sensitive to the presentation of anobject in isolation, but also to the semantic fit of that objectwith regard to a preceding (sentence) context. One may arguethat the effect occurs too early (around 125 ms) to be a viablecandidate of a context-based visual form analysis. Especiallythe onset of the effect at 0 ms (as determined in the cluster-randomization analysis) is very unlikely. This is however aconsequence of the necessary smearing over time as a resultof the moving time window used in conversion of the signalinto a time-frequency representation. Moreover, early indices(<150 ms) of a rough semantic analysis based on visual formproperties have been reported before in the ERP literature(Thorpe et al., 1996). That is, Thorpe and colleagues hadsubjects classify rich visual scenes (photographs) on the basiswhether an animal was present in the scene or not. It wasfound that within 150ms after picture onset, the ERP started todiverge based upon the presence or absence of an animal(Thorpe et al., 1996; VanRullen and Thorpe, 2001). Related tothis, it has been shown that the visual context in which a faceis presented modulates the ERP response 170 ms afterstimulus onset (Righart and de Gelder, 2006). Summarized,there is evidence from previous ERP literature that recognitionof objects in complex scenes as well as effects of context canhave an effect upon the ERP response within or around 150msafter stimulus presentation.
n alpha and gamma band power distinguish linguistic fromin Res. (2008), doi:10.1016/j.brainres.2008.04.065

10 B R A I N R E S E A R C H X X ( 2 0 0 8 ) X X X – X X X
ARTICLE IN PRESS
Interestingly, a recent study reports a similarly earlygamma decrease to an incongruous word (no pictures werepresented) (Hald et al., 2006). Stimuli were written sentences,presented word-by-word, as opposed to the spoken stimulusmaterials in the present study. In analogy to our explanationof the present gamma decrease, it is possible that an early,context-based visual analysis also occurs in the case of avisual word form. That is, in the case of written language, anearly context-based detection of visual word form mismatchmay have caused the early decrease in gamma band power inthe study by Hald et al. Such an explanation is indirectlysupported by the fact that an early decrease in alpha bandpower that we linked to acoustic mismatch (above), was notobserved in the Hald et al. study.
One reason to be cautious about the interpretation of thegamma decrease is that such decrease is not observed in theDouble mismatch condition. If the early gamma decrease inthe Picture mismatch condition reflects the context-baseddetection of an early mismatch of sentence context and visualform features of the picture, it is unclear why this effect isabsent in the Double mismatch condition. After all, also in theDouble mismatch condition the picture is not in accordancewith the preceding sentence context. A different explanationis that instead of being a picture-specific effect, the gammadecrease reflects an early detection of conflicting informationcoming from co-occurring critical word and picture regardlessof the previous context. Such an explanation is supported bythe recent finding that incongruous sound and picture of ananimal leads to reduced gamma frequency band activation ascompared to matching sounds and pictures (Yuval-Greenbergand Deouell, 2007). If this were the case, we would also expecta gamma decrease in the Language mismatch condition, inwhich co-occurring picture and word also convey differentinformation. This was not observed however.
A recent hypothesis links gamma power increases to a suc-cessful match between stored representations in memory andincoming stimulus information (Herrmann et al., 2004b). Forinstance, Herrmann and colleagues observed a gamma (30–40 Hz) increase in response to pictures of existing objects ascompared to nonsense objects, 90 ms after stimulus presenta-tion (Herrmannet al., 2004a). Fromthis itwas concluded that thesuccessfulmatchingof thestimuluspicturewith thepresenceofa representation of the object in long-termmemory is reflectedin increased gamma power over occipital electrodes. Alongthese lines, it may be the case that in the present study thesentence context primed expectation of a certain picture(cf. Engel et al., 2001). In the case of the Picture mismatchcondition, this expectation is violated which leads to a lack ofincrease in gamma power. This is in line with our explanationfor the decrease in gamma power in the Picture mismatchcondition. The fact that we did not observe differences in earlygamma power to a mismatching word in the Language mis-match condition however seems to contradict the hypothesisthat early gamma band increase is a reflection of matching ofincoming stimulus informationwitha long-termrepresentationindependent of input format (Herrmann et al., 2004b; Lenz et al.,2007). Given our findings, this model could be extended in thesense that it seems that the format of the incoming informationmakes a crucial difference. After all, no effects in the gammaband were observed in the Language mismatch condition.
Please cite this article as: Willems, R.M., et al., Early decreases ivisual information during spoken sentence comprehension, Bra
In conclusion, we hypothesize that the late increases intheta band power reflect general working memory processesrelated to the integration of semantic information into arepresentation of the sentence context. An early decrease inalpha band power most likely reflects early analysis of theacoustic input whichwas not in line with the acoustic input asexpected from the preceding sentence context. Finally, anearly decrease in gamma band power is tentatively explainedas reflecting detection of a mismatch of visual form featureson the basis of the preceding context. With regard to our mainquestion we conclude that semantic integration duringsentence comprehension is neurally implemented in a similarway regardless of the format the input is in. Early differencesin specific frequency bands however code for differences inthe way the incoming information is conveyed. Crucially,these early differences are context-dependent in that theyonly occur when the item is semantically incongruous withthe preceding (sentence) context. As such they are hypothe-sized to reflect an early, coarse semantic analysis based uponthe acoustic or visual form of the input.
As a final note wewant to point out that this study is one in aseries in the neurocognition of language that shows the value ofdoing complementary analyses in the time-frequency domainnext to more traditional ERP analysis. Qualitative differences inneural processing between visual and linguistic information thatcouldnot bedetected in thegrandaverageERPs,wereobserved ininduced changes in specific frequency bands. However, weacknowledge that firm interpretation of the results is hinderedby the lack of a considerable amount of studies in this field ofresearch. It will be a challenge for future EEG research onlanguage to employ frequency analysis to find a tighter explana-tion of the role of oscillations during language comprehension.
4. Experimental procedures
4.1. Stimulus materials
A total of 328 sentences (mean duration 3196 ms, range 2164–4184ms)were recorded in a sound attenuated roomat 44.1 KHz,spoken at a normal rate by a native Dutch female speaker. Halfof these sentencesdiffered inonecriticalword,whichwasneverin sentence final position. In each sentence a short context wasintroduced to which the critical word was congruous or not.Critical wordswere nouns that corresponded to names given bya separate groupof participants (n=32) to a large set of black andwhite line drawings. All critical words had a picture equivalentwith a naming consistency of 85% or higher. In total there were26 critical words with their picture equivalents. All words wereone syllable long and started with a plosive consonant. Everycritical word occurred equally often in a matching and in amismatching sentence context. The critical word in themismatching sentence always had a different onset consonantthan the critical word in the semantically correct sentence.Sentenceswerepretested inaclozeprobability test bya separateparticipant group (n=16). The percentage of participants thatgave the target word as response was taken as a measure of itscloze probability. Overall, the mean cloze probability was 16%for the semantically congruous criticalwords (range0–69%), and0% for the semantically incongruous critical words.
n alpha and gamma band power distinguish linguistic fromin Res. (2008), doi:10.1016/j.brainres.2008.04.065

11B R A I N R E S E A R C H X X ( 2 0 0 8 ) X X X – X X X
ARTICLE IN PRESS
4.2. Participants
Data of three participants in our original data set (Willemset al.,in press) had to be discarded because of excessive (muscle)artifacts in high frequency bands. Thesewere replaced by threenovel data sets, such that data of 16 participants went into theanalysis (mean age=22.8 years, range 18–34, 13 females). Allparticipants were healthy, right-handed (Oldfield, 1971), andhad Dutch as their mother tongue. None had any knownneurological history, hearing complaints and all had normal orcorrected-to-normal vision. Participants were paid for partici-pation. The local ethics committee approved the study and allparticipants signed informed consent in accordance with thedeclaration of Helsinki.
4.3. Procedure
Stimuli were presented using Presentation software (version9.13, http://www.neurobs.com/). Four stimulus lists of 164trials each were created in which only one item of everystimulus quartet (as in Table 1) was presented. Sentenceswerepseudo-randomized with the constraint that the same condi-tion occurred maximally two times in a row. Every listcontained an equal amount of stimuli from the four condi-tions (41 per condition). Pictures had varying sizes dependingupon the object they represented andweremaximally 8×8 cm(5°×5° visual angle; minimum height×width: 2.5 cm×7.5 cmand 7 cm×3 cm), shown at a viewing distance of 90 cm.Pictures were presented from the onset of the critical word tothe end of the sentence. A trial started with 600 ms blankscreen, followed by a spoken sentence and a picture, 1000 msblank screen and 2500 ms with a fixation cross on the screen.Participants were instructed to sit still in a comfortableposition and to blink only when the fixation cross waspresented. The session started with eight practice trialswhich contained different critical words than used in themain part of the experiment. Participants were told toattentively listen to and watch the stimuli about which theywould receive questions afterwards. At the end of the testsession, general questions about the stimuli were asked. Allparticipants had understood the manipulation in the materi-als and could provide examples of stimuli.
4.4. Recording
The electroencephalogram (EEG) was recorded from 27electrode sites across the scalp using an Electrocap with Ag/AgCl electrodes, each referred to the left mastoid. Electrodeswere placed on standard electrode sites (Fz, FCz, Cz, Pz, F3, F4,F8, F7, FP2, FC5, FC1, FC2, FC6, T7, T8, C3, C4, CP5, CP1, CP2, CP6,P7, P3, P4, P8, O1, O2). Vertical eyemovements and blinks weremonitored by means of two electrodes, one placed beneathand one above the left eye. Horizontal eye movements weremonitored by means of a left to right bicanthal montage.Activity over the right mastoid was recorded to determine ifthere were additional contributions of the experimentalvariables to the two presumably neutral mastoid sites. Nosuch differences were observed. Recordings were amplifiedwith BrainAmp DC amplifiers, using a hi-cut of 100 Hz and atime constant of 10 s. Impedances were kept below 5 kΩ for all
Please cite this article as: Willems, R.M., et al., Early decreases ivisual information during spoken sentence comprehension, Bra
channels. The EEG and EOG signals were recorded anddigitized using Brain Vision Recorder software (version 1.03),with a sampling frequency of 500 Hz.
4.5. Analysis
Analyses were done using the FieldTrip software package,which is an open-sourceMatlab toolbox designed for EEG/MEGdata analysis (http://www.ru.nl/fcdonders/fieldtrip/). Datawere filtered off-linewith a 70 Hz low-pass filter, re-referencedto the mean of the two mastoids and segmented from 600 msbefore to 1000 ms after the critical word. All segments werescreened for eye movements, electrode drifting, amplifierblocking andmuscle artifacts, leading to 32% of the trials to berejected, equally distributed over conditions (F<1), which iscomparable to the amount of trials analyzed in other studiesinvestigating oscillatory correlates of sentence comprehen-sion (Hagoort et al., 2004; Hald et al., 2006; Davidson andIndefrey, 2007).
For the ERP analysis, baseline correction was applied bysubtracting the mean of the pre-stimulus period from 150 msto the onset of the critical word. ERPs were created byaveraging all trial segments for each condition and subjectseparately. Statistical analysis was performed by employingrepeated measures analysis of variance (ANOVA) on themeanamplitude in the 300–600 ms time window with factorsCondition (4 levels; Correct condition, Language mismatch,Picture mismatch, Double mismatch) and Electrode (27 levels;Fp2, F7, F3, Fz, F4, F8, FC5, FC1, FCz, FC2, FC6, T7, C3, Cz, C4, T8,CP5, CP1, CP2, CP6, P7, P3, Pz, P4, P8, O1, O2). In the case of amain effect of Condition or Condition×Electrode interaction,subsequently, planned comparisons were performed to testfor differences between each mismatch condition and theCorrect condition as well as between the Language mismatchcondition and the Picture mismatch condition. Huynh–Feldtcorrection for violation of sphericity assumption was appliedwhen appropriate (Huynh and Feldt, 1976), but originaldegrees of freedom are reported (Table 2).
For the time-frequency analysis, the time-frequency repre-sentation (TFR) was computed for every trial using a multi-taper procedure (Mitra and Pesaran, 1999). Low (4–40 Hz) andhigh frequencies (40–70 Hz) were analyzed separately. For thelow frequencies a 500 ms sliding window with a singleHanning taper was used with no spectral smoothing. For thehigh frequencies, a 200 ms sliding window with threeorthogonal Slepian tapers was used with 10 Hz spectralsmoothing. Note that conversion into the frequency domainlimited the maximal time-point of a segment which could beestimated at 750 ms (low frequencies) and 900 ms (highfrequencies) after critical word onset. In the analysis, eachsegment was analyzed up to 750 ms after critical word onset.Average TFRswere computed by averaging single trial TFRs forevery condition and subject separately.
Subsequently, statistical analysis involved repeated mea-sures analysis of variance (ANOVA) on mean power in six apriori defined time-frequency windowswith factors Condition(4 levels; Correct condition, Language mismatch, Picturemismatch, Double mismatch) and Electrode (27 levels; Fp2,F7, F3, Fz, F4, F8, FC5, FC1, FCz, FC2, FC6, T7, C3, Cz, C4, T8, CP5,CP1, CP2, CP6, P7, P3, Pz, P4, P8, O1, O2). The a priori defined
n alpha and gamma band power distinguish linguistic fromin Res. (2008), doi:10.1016/j.brainres.2008.04.065

12 B R A I N R E S E A R C H X X ( 2 0 0 8 ) X X X – X X X
ARTICLE IN PRESS
frequency windows were based upon previous literature andincluded the theta band (4–6 Hz) (Bastiaansen et al., 2005; Haldet al., 2006; Davidson and Indefrey, 2007), alpha band (8–12 Hz)(Rohm et al., 2001) and the lower gamma band (40–50 Hz)(Hagoort et al., 2004; Hald et al., 2006). Separate ANOVAs wereconducted in early (0–300 ms) and late time windows (350–750 ms). In the case of a main effect of Condition orCondition×Electrode interaction, subsequently, planned com-parisons were performed to test for differences between eachmismatch condition and the Correct condition as well asbetween the Language mismatch condition and the Picturemismatch condition. Huynh–Feldt correction for violation ofsphericity assumption was applied when appropriate (Huynhand Feldt, 1976), but original degrees of freedom are reported.
Moreover, to test for significant differences betweenconditions in time-frequency-electrode clusters that wereoutside of the a priori defined time-frequency windows, thedata were analyzed using a cluster-randomization procedurewhich identifies consistent changes between conditions intime-frequency-electrode clusters. First, single-subject statis-tics were computed (two-sided t-test for the differencebetween two conditions for every electrode-time-frequencypoint). Consequently, group statistics involved a clusteringprocedure on the tresholded (tN1.96 and t<−1.96) single-subject statistics which identifies clusters of time-frequency-electrode points showing the same direction of effect (Maris,2004). To assess statistical significance of each cluster, thesum of all t-statistics in the cluster was computed. This waschosen as the cluster-level statistic (Maris and Oostenveld,2007). Second, significance of each cluster-level statistic wasassessed by comparing the cluster statistic to its randomiza-tion distribution which was created by 2500 random re-assignments of the single-subject statistics and zero. That is,in each randomization the single-subject statistics wererandomly re-assigned to zero or to their original value. Theactual cluster statistic was then compared to the randomiza-tion distribution obtained and significance was assessed byevaluating the cluster statistic to the p<0.05 significance level.Note that the validity of the inference drawn is not dependentupon the exact statistic (in this case sum of all t-statistics)chosen (as is explained in more detail in Maris and Oosten-veld, 2007). The choice for the sum of individual t-statistics isbased upon theoretical/modeling considerations (Maris, 2004;Maris and Oostenveld, 2007) as well as by practice in otherstudies employing a cluster-randomization procedure (e.g.Hald et al., 2006; Osipova et al., 2006; Davidson and Indefrey,2007; Medendorp et al., 2007; Tuladhar et al., 2007). This non-parametric procedure effectively controls the multiple com-parisons problem introduced by the massive univariateapproach taken (Maris and Oostenveld, 2007).
We tested the hypothesis that some effects may havedecreased/increased over the time course of the experiment(see Discussion section) in two ways. First, it was testedwhether there was a linear correlation between effect sizeand item order in three time-frequency windows inwhich suchcorrelation may have been expected (early time window (0–300 ms) in alpha frequency band (8–12 Hz) in Languagemismatch–Correct condition and Double mismatch–Correctcondition comparisons and early time window (0–300 ms) inthe gamma frequency band (40–50 Hz) in the Picturemismatch–
Please cite this article as: Willems, R.M., et al., Early decreases ivisual information during spoken sentence comprehension, Bra
Correct condition comparison). Second, data from each of thesethree time-frequency windows were split into four equal partsaccording to their occurrence in the experiment and subjectedto repeatedmeasures analysis of variance (ANOVA)with factorsTime (4 levels) and Electrode (27 levels). No effects of itemorder/time course of the experiment were found.
Acknowledgments
This research was supported by a grant from the NetherlandsOrganization for Scientific Research (NWO ‘Cognition’ pro-gram, grant no 051.02.040). Petra van Alphen is acknowledgedfor expertly voicing the sentences. We thank Marcel Bastiaan-sen for the valuable comments on an earlier version of ourmanuscript, Heidi Koppenhagen and Niels Schiller for provid-ing the naming consistency information of the line drawingsand two anonymous reviewers for their valuable commentson our manuscript.
R E F E R E N C E S
Bastiaansen, M.C., Hagoort, P., 2006. Oscillatory neuronaldynamics during language comprehension. Prog. Brain Res.159, 179–196.
Bastiaansen, M.C., van Berkum, J.J., Hagoort, P., 2002. Syntacticprocessing modulates the theta rhythm of the human EEG.NeuroImage 17 (3), 1479–1492.
Bastiaansen, M.C., van der Linden, M., Ter Keurs, M., Dijkstra, T.,Hagoort, P., 2005. Theta responses are involved inlexical-semantic retrieval during language processing. J. Cogn.Neurosci. 17 (3), 530–541.
Brown, C.M., Hagoort, P., Kutas, M., 2000. In: Gazzaniga, M.S.(Ed.), Postlexical integration processes in languagecomprehension: Evidence from brain-imaging research.The cognitive neurosciences. MIT Press, Cambridge, Mass,pp. 881–895.
Davidson, D.J., Indefrey, P., 2007. An inverse relation betweenevent-related and time-frequency violation responses insentence processing. Brain Res. 1158, 81–92.
DeLong, K.A., Urbach, T.P., Kutas, M., 2005. Probabilistic wordpre-activation during language comprehension inferred fromelectrical brain activity. Nat. Neurosci. 8 (8), 1117–1121.
Engel, A.K., Fries, P., Singer, W., 2001. Dynamic predictions:oscillations and synchrony in top-down processing. Nat. Rev.Neurosci. 2 (10), 704–716.
Federmeier, K.D., Kutas, M., 2001. Meaning and modality:influences of context, semantic memory organization, andperceptual predictability on picture processing. J. Exp. Psychol.:Learn. Mem. Cogn. 27 (1), 202–224.
Ganis, G., Kutas, M., 2003. An electrophysiological study of sceneeffects on object identification. Cogn. brain res. 16 (2), 123–144.
Ganis, G., Kutas, M., Sereno, M.I., 1996. The search for“common sense”: an electrophysiological study of thecomprehension of words and pictures in reading. J. Cogn.Neurosci. 8 (2), 89–106.
Hagoort, P., Brown, C.M., 2000. ERP effects of listening to speech:semantic ERP effects. Neuropsychologia 38 (11), 1518–1530.
Hagoort, P., van Berkum, J., 2007. Beyond the sentence given.Philos. Trans. R. Soc. Lond., B Biol. Sci. 362 (1481), 801–811.
Hagoort, P., Hald, L., Bastiaansen, M., Petersson, K.M., 2004.Integration of wordmeaning and world knowledge in languagecomprehension. Science 304 (5669), 438–441.
n alpha and gamma band power distinguish linguistic fromin Res. (2008), doi:10.1016/j.brainres.2008.04.065

13B R A I N R E S E A R C H X X ( 2 0 0 8 ) X X X – X X X
ARTICLE IN PRESS
Hald, L.A., Bastiaansen, M.C., Hagoort, P., 2006. EEG theta andgamma responses to semantic violations in online sentenceprocessing. Brain Lang. 96 (1), 90–105.
Herrmann, C.S., Lenz, D., Junge, S., Busch, N.A., Maess, B., 2004a.Memory-matches evoke human gamma-responses. BMCNeurosci. 5, 13.
Herrmann, C.S., Munk, M.H., Engel, A.K., 2004b. Cognitivefunctions of gamma-band activity: memory match andutilization. Trends Cogn. Sci. 8 (8), 347–355.
Huynh, H., Feldt, L., 1976. Estimation of the Box correction fordegrees of freedom from sample data in randomized block andsplitplot designs. J. Educ. Stat. 1, 69–82.
Jensen, O., Gelfand, J., Kounios, J., Lisman, J.E., 2002. Oscillations inthe alpha band (9–12 Hz) increase with memory load duringretention in a short-term memory task. Cereb. Cortex 12 (8),877–882.
Jensen, O., Kaiser, J., Lachaux, J.P., 2007. Human gamma-frequencyoscillations associated with attention and memory. TrendsNeurosci. 30 (7), 317–324.
Jokisch, D., Jensen, O., 2007. Modulation of gamma and alphaactivity during a working memory task engaging the dorsal orventral stream. J. Neurosci. 27 (12), 3244–3251.
Karrasch, M., Krause, C.M., Laine, M., Lang, A.H., Lehto, M., 1998.Event-related desynchronization and synchronization duringan auditory lexical matching task. Electroencephalogr. Clin.Neurophysiol. 107 (2), 112–121.
Klimesch, W., 1999. EEG alpha and theta oscillations reflectcognitive and memory performance: a review and analysis.Brain Res. Brain Res. Rev. 29 (2–3), 169–195.
Klimesch, W., Pfurtscheller, G., Mohl, W., Schimke, H., 1990.Event-related desynchronization, ERD-mapping andhemispheric differences for words and numbers. Int. J.Psychophysiol. 8 (3), 297–308.
Krause, C.M., Porn, B., Lang, A.H., Laine, M., 1997. Relative alphadesynchronization and synchronization during speechperception. Brain Res. Cogn. Brain Res. 5 (4), 295–299.
Krause, C.M., Astrom, T., Karrasch, M., Laine, M., Sillanmaki, L.,1999. Cortical activation related to auditory semantic matchingof concrete versus abstract words. Clin. Neurophysiol. 110 (8),1371–1377.
Krause, C.M., Gronholm, P., Leinonen, A., Laine, M., Sakkinen, A.L.,Soderholm, C., 2006. Modality matters: the effects of stimulusmodality on the 4-to 30-Hz brain electric oscillations during alexical decision task. Brain Res. 1110 (1), 182–192.
Kutas, M., Hillyard, S.A., 1980. Reading senseless sentences: brainpotentials reflect semantic incongruity. Science 207 (4427),203–205.
Kutas, M., Van Petten, C.K., 1994. In: Gernsbacher, M.A. (Ed.),Psycholinguistics electrified: Event-related brain potentialinvestigations. Handbook of psycholinguistics. AcademicPress, San Diego, CA, pp. 83–143.
Lenz, D., Schadow, J., Thaerig, S., Busch, N.A., Herrmann, C.S.,2007. What's that sound? Matches with auditory long-termmemory induce gamma activity in human EEG. Int. J.Psychophysiol. 64 (1), 31–38.
Maris, E., 2004. Randomization tests for ERP topographies andwhole spatiotemporal data matrices. Psychophysiology 41 (1),142–151.
Maris, E., Oostenveld, R., 2007. Nonparametric statistical testing ofEEG- and MEG-data. J. Neurosci. Methods 164 (1), 177–190.
Medendorp, W.P., Kramer, G.F., Jensen, O., Oostenveld, R.,Schoffelen, J.M., Fries, P., 2007. Oscillatory activity in humanparietal and occipital cortex shows hemispheric lateralizationand memory effects in a delayed double-step saccade task.Cereb. Cortex 17 (10), 2364–2374.
Mitra, P.P., Pesaran, B., 1999. Analysis of dynamic brain imagingdata. Biophys. j. 76, 691–708.
Please cite this article as: Willems, R.M., et al., Early decreases ivisual information during spoken sentence comprehension, Bra
Nigam, A., Hoffman, J.E., Simons, R.F., 1992. N400 tosemantically anomalous pictures and words. J. Cogn. Neu-rosci. 4 (1), 15–22.
Oldfield, R.C., 1971. The assessment and analysis of handedness:the Edinburgh inventory. Neuropsychologia 9 (1), 97–113.
Osipova, D., Takashima, A., Oostenveld, R., Fernandez, G., Maris,E., Jensen, O., 2006. Theta and gamma oscillations predictencoding and retrieval of declarative memory. J. Neurosci. 26(28), 7523–7531.
Özyürek, A., Willems, R.M., Kita, S., Hagoort, P., 2007. On-lineintegration of semantic information from speech and gesture:Insights from event-related brain potentials. J. Cogn. Neurosci.19 (4), 605–616.
Righart, R., de Gelder, B., 2006. Context influences early perceptualanalysis of faces-an electrophysiological study. Cereb. Cortex16 (9), 1249–1257.
Rodriguez, E., George, N., Lachaux, J.P., Martinerie, J., Renault, B.,Varela, F.J., 1999. Perception's shadow: long-distancesynchronization of human brain activity. Nature 397 (6718),430–433.
Rohm, D., Klimesch,W., Haider, H., Doppelmayr, M., 2001. The roleof theta and alpha oscillations for language comprehension inthe human electroencephalogram. Neurosci. Lett. 310 (2–3),137–140.
Sitnikova, T., Kuperberg, G., Holcomb, P.J., 2003. Semanticintegration in videos of real-world events: anelectrophysiological investigation. Psychophysiology 40 (1),160–164.
Tallon-Baudry, C., 2003. Oscillatory synchrony and human visualcognition. J. Physiol. Paris 97 (2–3), 355–363.
Thorpe, S., Fize, D., Marlot, C., 1996. Speed of processing in thehuman visual system. Nature 381 (6582), 520–522.
Tuladhar, A.M., ter Huurne, N., Schoffelen, J.M., Maris, E.,Oostenveld, R., Jensen, O., 2007. Parieto-occipital sourcesaccount for the increase in alpha activity with workingmemory load. Hum. Brain Mapp. 28 (8), 785–792.
Van Berkum, J.J.A., Brown, C.M., Zwitserlood, P., Kooijman, V.,Hagoort, P., 2005. Anticipating upcoming words in discourse:evidence from ERPs and reading times. J. Exp. Psychol.: Learn.Mem. Cogn. 31 (3), 443–467.
van den Brink, D., Brown, C.M., Hagoort, P., 2001.Electrophysiological evidence for early contextual influencesduring spoken-word recognition: N200 versus N400 effects.J. Cogn. Neurosci. 13 (7), 967–985.
VanRullen, R., Thorpe, S.J., 2001. The time course of visualprocessing: from early perception to decision-making. J. Cogn.Neurosci. 13 (4), 454–461.
von Stein, A., Chiang, C., Konig, P., 2000. Top-down processingmediated by interareal synchronization. Proc. Natl. Acad. Sci.U. S. A. 97 (26), 14748–14753.
Weiss, S., Rappelsberger, P., 1998. Left frontal EEG coherencereflects modality independent language processes. BrainTopogr. 11 (1), 33–42.
West, W.C., Holcomb, P.J., 2002. Event-related potentials duringdiscourse-level semantic integration of complex pictures.Cogn. brain res. 13 (3), 363–375.
Willems, R.M., Özyürek, A., Hagoort, P., 2007. When languagemeets action: the neural integration of gesture and speech.Cereb. Cortex 17 (10), 2322–2333.
Willems, R.M., Özyürek, A., Hagoort, P., in press. Seeing andhearing meaning: ERP and fMRI evidence of word versuspicture integration into a sentence context. J. Cogn. Neurosci.doi:10.1162/jocn.2008.20085.
Yuval-Greenberg, S., Deouell, L.Y., 2007. What you see is not(always) what you hear: induced gamma band responsesreflect cross-modal interactions in familiar object recognition.J. Neurosci. 27 (5), 1090–1096.
n alpha and gamma band power distinguish linguistic fromin Res. (2008), doi:10.1016/j.brainres.2008.04.065
Copyright © 2022 FDOKUMEN