Your WiFi Is Leaking: Inferring Private User Information ...

Inferring Adaptive Regulation Thresholds andAssociation Rules from Gene Expression Datathrough Combinatorial Optimization Learning
Ignacio Ponzoni, Francisco J. Azuaje, Juan Carlos Augusto, and David H. Glass
Abstract—There is a need to design computational methods to support the prediction of gene regulatory networks (GRNs). Such
models should offer both biologically meaningful and computationally accurate predictions which, in combination with other techniques,
may improve large-scale integrative studies. This paper presents a new machine-learning method for the prediction of putative
regulatory associations from expression data which exhibit properties never or only partially addressed by other techniques recently
published. The method was tested on a Saccharomyces cerevisiae gene expression data set. The results were statistically validated
and compared with the relationships inferred by two machine-learning approaches to GRN prediction. Furthermore, the resulting
predictions were assessed using domain knowledge. The proposed algorithm may be able to accurately predict relevant biological
associations between genes. One of the most relevant features of this new method is the prediction of adaptive regulation thresholds
for the discretization of gene expression values, which is required prior to the rule association learning process. Moreover, an important
advantage consists of its low computational cost to infer association rules. The proposed system may significantly support exploratory
large-scale studies of automated identification of potentially relevant gene expression associations.
Index Terms—Combinatorial optimization, genetic regulatory networks, machine learning, gene expression data, decision trees.
Ç
1 BACKGROUND
A gene regulatory network (GRN) aims to representhigh-level relationships that govern the rates at which
genes in the network are transcribed into mRNA. In thisway, genes can be viewed as nodes in this network whoseexpression levels (outputs) are controlled by other nodes(transcription factors). Nowadays, the inference, modeling,and simulation of GRNs is a fundamental topic infunctional genomics [1], [2]. Over the past few years,several statistical and artificial intelligence techniques havebeen proposed to carry out the reverse engineering of GRNsfrom monitoring and analyzing large-scale gene expressiondata [3], [4]. Clustering algorithms represented one of thefirst approaches to support the large-scale identification ofregulatory modules [5], [6]. Such an approach approxi-mated regulatory networks by 1) identifying groups ofcoexpressed genes and 2) analyzing relationships betweentheir regulatory regions and DNA binding motifs targetedby known transcription factors. A key limitation of thisapproach is that it assumes that coexpression is alwaysequivalent to regulation. Moreover, this method implies
symmetric relationships between the genes, which may notalways correspond to biological phenomena.
Within the area of machine learning, Boolean Networkswere one of the first models to be employed in GRNsinference [7], [8] and variations of this approach have beenpublished recently [9]. These models basically aim atinferring logical rules from a discretization of geneexpression time series. Even though these models can beeasily applied, they depend on arbitrary discretizations ofthe gene expression values [10], which impose strongassumptions and restrictions about the biological systemunder study.
Bayesian Networks have also provided the basis forseveral approaches to inferring GRNs [11], [12], [13]. Thesemethods employ conditional probabilistic distributions forgene interactions modeling. Despite the strong theoreticalrationale behind these approaches, the exponential explo-sion of the parameter space required for these models,together with the large quantity of data needed to makereliable inferences, reduces their capacity to infer complexGRNs by using gene expression data only. Since they areacyclic directed graphs, they cannot represent autoregula-tion or time-course regulation in a straightforward way [2].
From the area of evolutionary computing approaches[14], several methods were proposed. Ando et al. [15]presented an algorithm that combines genetic programmingwith the minimum least squares method. This techniqueinfers a differential equation system that represents regula-tion interactions between genes. Although this method maybe robust in statistical terms, the algorithm was only testedon small GRNs (10 genes) and the authors detectedimportant scalability limitations when applied to morecomplex data. Iba and Mimura [16] proposed an iterative
IEEE/ACM TRANSACTIONS ON COMPUTATIONAL BIOLOGY AND BIOINFORMATICS, VOL. 4, NO. 4, OCTOBER-DECEMBER 2007 1
. I. Ponzoni is with the Department of Computer Science and Engineering,Universidad Nacional del Sur, Av. Alem 1253, Bahıa Blanca, CP 8000,Argentina. E-mail: [email protected].
. F.J. Azuaje is with the Computer Science Research Institute and the Schoolof Computing and Mathematics, University of Ulster at Jordanstown,BT37 0QB, Newtownabbey, Co. Antrim, UK. E-mail: [email protected].
. J.C. Augusto and D.H. Glass are with the School of Computing andMathematics, University of Ulster at Jordanstown, BT37 0QB, New-townabbey, Co. Antrim, UK. E-mail: {jc.augusto, dh.glass}@ulster.ac.uk.
Manuscript received 14 Mar. 2006; revised 23 Aug. 2006; accepted 6 Nov.2006; published online 22 Jan.2007.For information on obtaining reprints of this article, please send e-mail to:[email protected], and reference IEEECS Log Number TCBB-0057-0306.Digital Object Identifier no. 10.1109/TCBB.2007.1049.
1545-5963/07/$25.00 � 2007 IEEE Published by the IEEE CS, CI, and EMB Societies & the ACM
This article has been accepted for inclusion in a future issue of this journal. Content is final as presented, with the exception of pagination.

inference approach based on a genetic algorithm (GA)whose learning process was guided by a molecularbiologist. The main goal was to allow the expert to performinteractive analysis and validation of the results based onthe introduction of new constraints until a GRN with a highlevel of predictive confidence was achieved. One of themost important drawbacks of this methodology is that itrequires the biologist to have a good understanding of thedynamics of the GA in order to select optimum learningparameters. Recently, Hallinan and Wiles proposed anevolutionary algorithm [17], which predicts GRNs based onthe Artificial Genome model presented by Reil [18]. Althoughthis model is more biologically plausible than traditionalmachine-learning methods and presents potentially usefulproperties, the network dynamics rely on synchronousupdating, which is biologically implausible. On the otherhand, when a more realistic asynchronous updating schemewas used, the dynamic behavior collapsed at a single pointattractor under almost all conditions [17].
Soinov et al. [10] approached the task of reconstructingGRNs as a classification problem. In summary, the authorsproposed the application of decision trees to infer classifiersthat may represent regulatory rules (relationships) betweengenes. They applied the C4.5 algorithm to infer the decisiontrees [19]. This method’s computational efficiency limita-tions are well known for classification problems withcontinuous-valued attributes [20], which is the case in theGRNs inference problem since the gene expression valuesare real numbers. Although this is a sound and concep-tually interesting approach, it may exhibit significantpredictive limitations when dealing with more complexGRNs (that is, networks that may consist of hundreds orthousands of genes).
Another important category of predictive approachesincludes several methods that are based on the detection ofmodules of genes significantly coexpressed under specificconditions [21], [22], [23]. Such modules allow both theapproximation of higher level network representations andmodule-specific relationships. This divide-and-conquerapproach is a useful option for achieving reliable predic-tions in the absence of larger amounts of expressionsamples. However, recent evidence suggests conflictingviews about the meaning and nature of functional modulesrepresented in GRNs [24]. For a more comprehensivereview of GRN inference methods, the reader is referredto [2], [25], and [26].
1.1 Proposed Approach
The method proposed in this paper addresses key limita-tions shown by data-driven whole-set GRNs predictionmethods. The main objective is to provide a user-friendly,biologically meaningful, and computationally efficientalgorithm to support the inference of complex putativeGRNs. We do not claim that data-driven machine-learningapproaches are sufficient to infer biologically meaningfulnetworks. However, such tools may provide significantevidence necessary to aid scientists in detecting andvalidating biologically relevant associations. Moreover, themethod proposed here neither makes strong statisticalassumptions nor applies arbitrary expression discretizationschemes (including adaptive thresholds for inferring
regulation rules). Thus, a new machine-learning algorithmbased on combinatorial optimization, from now on referredto as GRNCOP (abbreviated from Gene Regulatory Net-work inference by Combinatorial OPtimization), is as-sessed. This method infers association rules that representinteractions between genes, which are obtained from geneexpression data sets. The discovered rules may be used topredict the gene expression states of a gene in terms of thegene expression values of other genes and, in this way, aputative GRN may then be reconstructed by applying andcombining these rules.
Our approach offers several advantages in relation toexisting methods. First of all, it does not assume arbitraryand uniform gene expression value discretizations. Second,GRNCOP is not constrained by regulatory symmetryrelationships that are shown by clustering-based networkinference techniques. Third, the results can be easilyinterpreted since the association rules are derived frommodels that classify the different regulation states. Finally,the algorithm computes the potential interactions betweengenes with a low computational effort of Oðn2Þ, where n isthe number of genes in the GRN. Moreover, the newmethodology may in principle be adapted to other model-ing approaches, such as modular methods [21], [22], [23]and multisource-based prediction techniques [27].
GRNCOP aims at inferring different types of rules thatcapture relevant associations (that is, potential regulatoryrelationships) reflected in the expression values of the genes.In order to test this approach, GRNCOP was applied to themicroarray data sets presented by Spellman et al. [28] to infera GRN relevant to the yeast cell cycle. The results werestatistically validated. Moreover, the rules generated byGRNCOP were compared to relationships inferred by twoother published methods [10], [12]. Furthermore, biologicallyrelevant predictions were verified and potentially novelpredictions were assessed through literature searches and ananalysis of curated functional annotations derived from theSaccharomyces cerevisiae Genome Database (SGD).
The rest of this paper is organized as follows: Keydefinitions to interpret the regulatory rules and thecombinatorial optimization problem are introduced inSection 2, the new algorithm is explained in Section 3, andexperimental results obtained by GRNCOP are discussed inSection 4. A summary of contributions, future research, andconclusions are presented in Section 5.
2 SYSTEMS AND METHODS
2.1 Gene Expression Association Rules and GRNSInference
The time series encoded in a gene expression data set maybe represented by means of a gene expression data matrix,XX, where the rows and columns represent genes andsamples (experimental perturbations or conditions), respec-tively. In this way, each element xxij of XX contains theexpression value of gene i in the sample j.
Although the gene expression values belong to acontinuous range of the real numbers, it is possible todefine a finite expression state set for each gene by means ofa discretization procedure. Such a procedure is required inorder to encode the inputs to any combinatorial optimization
2 IEEE/ACM TRANSACTIONS ON COMPUTATIONAL BIOLOGY AND BIOINFORMATICS, VOL. 4, NO. 4, OCTOBER-DECEMBER 2007
This article has been accepted for inclusion in a future issue of this journal. Content is final as presented, with the exception of pagination.
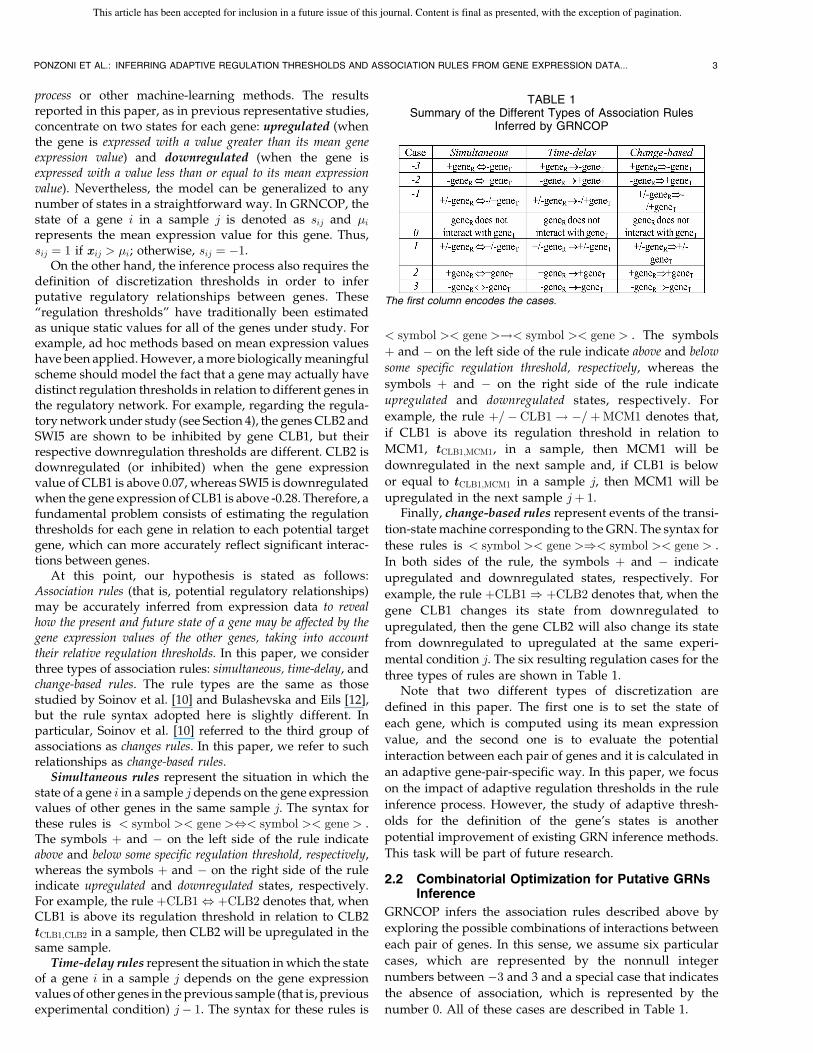
process or other machine-learning methods. The resultsreported in this paper, as in previous representative studies,concentrate on two states for each gene: upregulated (whenthe gene is expressed with a value greater than its mean geneexpression value) and downregulated (when the gene isexpressed with a value less than or equal to its mean expressionvalue). Nevertheless, the model can be generalized to anynumber of states in a straightforward way. In GRNCOP, thestate of a gene i in a sample j is denoted as sij and �irepresents the mean expression value for this gene. Thus,sij ¼ 1 if xxij > �i; otherwise, sij ¼ �1.
On the other hand, the inference process also requires thedefinition of discretization thresholds in order to inferputative regulatory relationships between genes. These“regulation thresholds” have traditionally been estimatedas unique static values for all of the genes under study. Forexample, ad hoc methods based on mean expression valueshave been applied. However, a more biologically meaningfulscheme should model the fact that a gene may actually havedistinct regulation thresholds in relation to different genes inthe regulatory network. For example, regarding the regula-tory network under study (see Section 4), the genes CLB2 andSWI5 are shown to be inhibited by gene CLB1, but theirrespective downregulation thresholds are different. CLB2 isdownregulated (or inhibited) when the gene expressionvalue of CLB1 is above 0.07, whereas SWI5 is downregulatedwhen the gene expression of CLB1 is above -0.28. Therefore, afundamental problem consists of estimating the regulationthresholds for each gene in relation to each potential targetgene, which can more accurately reflect significant interac-tions between genes.
At this point, our hypothesis is stated as follows:Association rules (that is, potential regulatory relationships)may be accurately inferred from expression data to revealhow the present and future state of a gene may be affected by thegene expression values of the other genes, taking into accounttheir relative regulation thresholds. In this paper, we considerthree types of association rules: simultaneous, time-delay, andchange-based rules. The rule types are the same as thosestudied by Soinov et al. [10] and Bulashevska and Eils [12],but the rule syntax adopted here is slightly different. Inparticular, Soinov et al. [10] referred to the third group ofassociations as changes rules. In this paper, we refer to suchrelationships as change-based rules.
Simultaneous rules represent the situation in which thestate of a gene i in a sample j depends on the gene expressionvalues of other genes in the same sample j. The syntax forthese rules is < symbol >< gene >,< symbol >< gene > .The symbols þ and � on the left side of the rule indicateabove and below some specific regulation threshold, respectively,whereas the symbols þ and � on the right side of the ruleindicate upregulated and downregulated states, respectively.For example, the rule þCLB1, þCLB2 denotes that, whenCLB1 is above its regulation threshold in relation to CLB2ttCLB1;CLB2 in a sample, then CLB2 will be upregulated in thesame sample.
Time-delay rules represent the situation in which the stateof a gene i in a sample j depends on the gene expressionvalues of other genes in the previous sample (that is, previousexperimental condition) j� 1. The syntax for these rules is
< symbol >< gene >!< symbol >< gene > . The symbols
þ and � on the left side of the rule indicate above and below
some specific regulation threshold, respectively, whereas the
symbols þ and � on the right side of the rule indicate
upregulated and downregulated states, respectively. For
example, the rule þ=� CLB1! �=þMCM1 denotes that,
if CLB1 is above its regulation threshold in relation to
MCM1, ttCLB1;MCM1, in a sample, then MCM1 will be
downregulated in the next sample and, if CLB1 is below
or equal to ttCLB1;MCM1 in a sample j, then MCM1 will be
upregulated in the next sample jþ 1.Finally, change-based rules represent events of the transi-
tion-state machine corresponding to the GRN. The syntax for
these rules is < symbol >< gene >)< symbol >< gene > .
In both sides of the rule, the symbols þ and � indicate
upregulated and downregulated states, respectively. For
example, the rule þCLB1) þCLB2 denotes that, when the
gene CLB1 changes its state from downregulated to
upregulated, then the gene CLB2 will also change its state
from downregulated to upregulated at the same experi-
mental condition j. The six resulting regulation cases for the
three types of rules are shown in Table 1.Note that two different types of discretization are
defined in this paper. The first one is to set the state of
each gene, which is computed using its mean expression
value, and the second one is to evaluate the potential
interaction between each pair of genes and it is calculated in
an adaptive gene-pair-specific way. In this paper, we focus
on the impact of adaptive regulation thresholds in the rule
inference process. However, the study of adaptive thresh-
olds for the definition of the gene’s states is another
potential improvement of existing GRN inference methods.
This task will be part of future research.
2.2 Combinatorial Optimization for Putative GRNsInference
GRNCOP infers the association rules described above by
exploring the possible combinations of interactions between
each pair of genes. In this sense, we assume six particular
cases, which are represented by the nonnull integer
numbers between �3 and 3 and a special case that indicates
the absence of association, which is represented by the
number 0. All of these cases are described in Table 1.
PONZONI ET AL.: INFERRING ADAPTIVE REGULATION THRESHOLDS AND ASSOCIATION RULES FROM GENE EXPRESSION DATA... 3
TABLE 1Summary of the Different Types of Association Rules
Inferred by GRNCOP
The first column encodes the cases.
This article has been accepted for inclusion in a future issue of this journal. Content is final as presented, with the exception of pagination.

In mathematical terms, the inference of the rules to
reconstruct a GRN can be expressed as the following
combinatorial optimization problem:
[nnii¼1
max��ii2P
��ð��ii; ��ðXX; iiÞÞ; ð1Þ
subject to:
. n ¼ number of genes in the microarray data set,
. m ¼ number of samples in the microarray data set,
. XX 2 <nxm, matrix with the gene expression data,
. P is the space of all vectors vv of dimension n suchthat vi 2 f�3;�2;�1; 0; 1; 2; 3g8i, i ¼ 1::n,
. ��ðXX; iÞ is the discretization function such that��ðXX; iÞ ¼ DDi and DDi 2 f�1; 1gnxm,
. �i 2 P is a classifier for DDi, and
. ��ð�i;DDiÞ is a performance function of �i as classifierof DDi.
From now on, the symbol � indicates the set of optimal
classifiers, � ¼ f�1; �2; . . . ; �ng. It is important to note that
the general optimization problem is the same for the three
types of rules. The only difference lies in the definition of
the discretization function �� because each type of rule is
based on different expression discretizations of XX.
3 ALGORITHMS
3.1 GRNCOP: Combinatorial OptimizationAlgorithm
The machine-learning process to obtain the rules consists of
three phases, one for each type of rule (see the left side of
Fig. 1). Phases 1 and 2 follow a similar processing principle
(see the right side of Fig. 1). The core of the algorithm is a
loop, where the vector of potential regulators ð�iÞ for a
gene i is calculated at each iteration. After n iterations, the
set of potential regulators corresponding to all the genes is
held in set �.Phases 1 and 2 differ in terms of the procedure applied to
calculate the discretization thresholds, which are required
for the discretization of the matrix XX and for obtaining the
discretization function ��ðXX; iÞ. Both procedures will beexplained in Section 3.2.
Note that, although computing the threshold is concep-tually a subroutine of the discretization procedure, thesetwo procedures are actually independent components in thealgorithm due to efficiency reasons. All of the regulationthresholds corresponding to each gene are calculatedsimultaneously, whereas the discretization of XX is calcu-lated in relation to each gene.
With respect to phase 3 (Fig. 2), the main difference withthe previous phases is the discretization procedure, whichis calculated only once. This is because the same discretematrix is common to all genes. The rationale behind thisdifference is further explained later. Therefore, the dis-cretization function has matrix XX as its unique argument.Consequently, only the procedure to obtain the optimum �ifor a gene i is calculated in each iteration. In this way, as wehave mentioned before, the procedure to calculate theoptimal solution � is the same for each type of rule.
3.2 Discretization Step: Function � Calculation
During discretization, the real numbers corresponding tothe gene expression values, which are held in matrix XX, aremapped to values �1 and 1 using the function ��ðXX; iÞ. Themain question at this point is how to define the discretiza-tion regulation thresholds for each gene in relation to theothers. A traditional approach consists of using the meanexpression value from a gene i in the sample set XX. Thissolution is easy to implement, but it represents a strongsimplification of reality because it assumes a uniqueputative regulation threshold for each gene with respectto the others. It is well known that the gene expressionvalue required by geneR to activate (or inhibit) a geneT1 isnot necessarily the same value required by the same geneR
to activate (inhibit) a geneT2. For this reason, we proposeapplying a more flexible and dynamic threshold-selectionpolicy which calculates a specific regulation threshold foreach pair of genes.
In particular, GRNCOP calculates the thresholds byapplying the same continuous-valued attribute discretiza-tion techniques as those used for classification algorithmsbased on decision trees. Basically, it considers eachexpression value shown by geneR in XX as a potentialthreshold for the discretization of geneR. A partition of thesample set XX into two subsets, namely, DoDo and UpUp, isgenerated for each gene and each candidate threshold, tt. DoDo
4 IEEE/ACM TRANSACTIONS ON COMPUTATIONAL BIOLOGY AND BIOINFORMATICS, VOL. 4, NO. 4, OCTOBER-DECEMBER 2007
Fig. 1. General schema of the GRNCOP algorithm. Dotted arcs indicate
the connection between the main program and the subroutine used for
phases 1 and 2 (gray box).
Fig. 2. Schema of the phase 3 subroutine corresponding to the
GRNCOP algorithm. The discretization step is shown outside of the
loop.
This article has been accepted for inclusion in a future issue of this journal. Content is final as presented, with the exception of pagination.

contains all samples where the geneR has an expressionvalue less than or equal to tt, whereas UpUp contains all of thesamples where the geneR has an expression value greaterthan tt. In other words, DoDo and UpUp represent sample sets inwhich the geneR has values equal to �1 and 1, respectively,on the basis of tt, which is the candidate discretizationregulation threshold for the geneR.
The next step consists of the calculation of the partitionentropy, which is a statistical indicator of the quality of athreshold tt as a discretization value for geneR with respectto another geneT. To further illustrate this concept, supposethat we are trying to infer the potential regulators for agiven geneT, then, for each geneR (potential regulator ofgeneT), we obtain a discretization of this gene’s expressionvalues, which can help us to infer whether or not the geneR
is actually a regulator of geneT. In numerical terms, thepartition entropy is 0 when all samples satisfy the sameassociation rule case (ideal situation from a predictiveviewpoint) and the partition entropy is 1 when the samplesbelong to both regulation scenarios in equal proportion(50 percent and 50 percent). Then, when the partitionentropy value associated with a discretization approximatesto 0, the threshold that generates this discretizationrepresents a better solution. Thus, such a threshold valueallows one to optimally detect potential significant relation-ships between geneT and geneR in terms of the associationrule cases. The entropy calculation is based on definitionsgiven in [29] and the partition entropy equation waspreviously applied by Kohani [30] as follows:
PEntropyPEntropyðR; tt;XXÞ ¼ DoDoj jXXj j EntropyEntropyðDoDoÞ þ UpUpj j
XXj j EntropyEntropyðUpUpÞ
ð2Þ
where
. R identifies the gene under consideration (potentialregulator),
. tt is the partition threshold,
. XX is the set of samples corresponding to the timeseries,
. DoDo is the subset of XX with the samples, where thegene expression value of the geneR is less than orequal to tt, and
. UpUp is the subset of XX with the samples where thegene expression value of the geneR is greater than tt.
Then, for each pair of genes, GRNCOP calculates thethreshold that minimizes the partition entropy using (2).After that, for each genei, the function ��ðXX; iÞ maps thecorresponding gene expression values in XX to the discretematrix DDi using the thresholds previously calculated. Thus,each gene i in the original matrix XX is associated with adiscrete matrix DDi.
This discretization policy for XX is used for bothsimultaneous and time-delay rules. However, a temporalshift for the vector encoding the expression values of geneiis required for the latter type. The time-delay rules predictthe situation when the state of a genei in a sample j dependson the gene expression values of its regulators in theprevious sample j� 1. In other words, these rules deter-mine the correlations between the expression value of a
genei in a sample j, XXi;j, and the values of the others genesin the previous sample, XXk;j�1, for k ¼ 1 . . .n. For thisreason, if XX 2 <nxm, then DDi 2 f�1; 1gnxðm�1Þ, where theith row of DDi corresponds to the discretization of genei inthe last m� 1 samples of XX, whereas the values of theremaining rows of DDi correspond to the discretization ofother genes in the first m� 1 samples of XX.
Finally, the discretization procedure for the change rulesis significantly different. The discretization goal in this caseis to obtain a matrix DD that represents the transition of eachgene between the upregulated and downregulated states intime. As explained in Section 2, because the state of a gene isdiscretizated using its mean expression value, the discreti-zation function ��ðXXÞ does not require a threshold for eachpair of genes. In this situation, we are only interested inidentifying the state changes of each gene. For this reason,only one matrix, DD, is generated which is common to allgenes. This discretization coincides with the change rulesmodeling presented by Soinov et al. [10].
3.3 Optimization Step: Function � and�i Calculation
As defined in (1), the optimization problem consists offinding a set of optimal �i which define potential associa-tion rules between i and the other genes (potentialregulators). Basically, �i is a vector that represents the setof potential regulators of the genei. Each component of thevector holds an integer value between �3 and 3, whichrepresents one of the seven regulatory cases shown inTable 1. Thus, �i (k) indicates the regulation case detectedbetween genek and genei, that is, �i is a gene expressionclassifier that represents the potential regulators for thegenei along with the characteristics of these potentialrelationships.
The next step is the definition of an objective function ��
for the selection of the optimal set of association rules.Taking into account that �i represents a classifier obtainedfrom the set of samples DDi, the optimum �i could becalculated by maximizing a typical classifier performancefunction. In particular, we use the following functionproposed by Carvalho and Freitas [31]:
��ð��ii;DDiiÞ ¼TPTP
ðTPTP þ FNFNÞ
� �� TNTN
ðFPFP þ TNTNÞ
� �; ð3Þ
where
. TPTP (True Positives) is the number of positiveassociation cases (see Table 1) of DDi correctlyclassified by �i,
. FNFN (False Negatives) is the number of positive casesof DDi incorrectly classified by �i,
. TNTN (True Negatives) is the number of negative casesof DDi classified correctly by �i, and
. FPFP (False Positives) is the number of negative casesof DDi incorrectly classified by �i.
In this formula, the first factor is usually known as thesensitivity of a classifier, whereas the second one is typicallyrecognized as specificity of a classifier. Both factors generatevalues between 0 and 1 and, so, ��ð�i;DDiÞ is always in thisrange too. The best classifier is obtained when ��ð�i;DDiÞ ¼ 1
PONZONI ET AL.: INFERRING ADAPTIVE REGULATION THRESHOLDS AND ASSOCIATION RULES FROM GENE EXPRESSION DATA... 5
This article has been accepted for inclusion in a future issue of this journal. Content is final as presented, with the exception of pagination.

because this represents the situation where all expressionassociation states were correctly classified, whereas��ð�i;DDiÞ ¼ 0 refers to the opposite case.
GRNCOP calculates �i using a constructive approach,which explores all possible combinations of values for itscomponents �i ðkÞ. In short, GRNCOP computes thesensitivity and specificity for each possible interaction casevalue (encoded by values ranging from �3 and 3) for each�iðkÞ and assigns the value that maximizes the product ofboth rates to �iðkÞ. After repeating this for each �i ðkÞ, withk ¼ 1 . . .n, the resulting �i maximizes (3).
It is important to stress the low computational effortrequired for GRNCOP to infer a putative GRN. Forexample, for a problem with n genes, the algorithm onlyneeds to calculate the metrics TP, FP, TN, and FN n times tofind the association rules relative to each gene. These fourmetrics can be calculated simultaneously for a gene. Takinginto account the fact that the sensitivity and the specificityare calculated with a computational complexity of OðnÞ,where n is the number of genes, the total runtime requiredto find the exact combinatorial solution to this problem isvery low, Oðn2Þ. That is, the calculation of the sensitivityand specificity values is repeated n times, one iteration pergene. This represents an improvement in relation toprevious research. For example, the C4:5 algorithm appliedby Soinov et al. [10] has a complexity of Oðn2 logðnÞÞ forproblems with continuous-valued attributes [32].
4 RESULTS AND DISCUSSION
The predictive performance of GRNCOP was tested usingthe microarray data in [22], which also includes data fromS. cerevisiae cell cultures [27]. These data were synchronizedby three different methods: cdc15, cdc28, and alpha-factors.Therefore, these three gene expression data sets may bedefined as statistically independent [10].
For the performance analysis of the proposed method,the same training and validation experiments used bySoinov et al. [10] and Bulashevska and Eils [12] wereanalyzed in order to achieve a fair comparison between thethree inference methods. The results reported here focus ongenes CLN1-3, CLB1-6, CDC28, MBP1, CDC53, CDC34,SKP1, SWI4-6, HCT1, CDC20, SIC1, and MCM1 in order toestablish comparisons with previous studies ([10], [12]);hence, n ¼ 21. The largest database, cdc15, was used as atraining set, that is, as the matrix X of the optimizationproblem. For the prediction of simultaneous rules, we usedall of the samples in cdc15, whereas, for the time-delay andchanges rules inference, we used adjacent equidistantsamples only.
All the data available was considered in the prediction ofsimultaneous rules, whereas only adjacent equidistantsamples were considered for inference of time-delay andchange-based rules. The accuracy of the rules obtained fromthe cdc15 training set was assessed by three differentvalidation procedures: a 10-fold stratified cross-validation[30] and independent tests using the cdc28 and alpha-factordata sets. Our choices of training and validation data sets,as well as validation procedures, were the same as thoseimplemented by Soinov et al. [10] and Bulashevska and Eils[12]. However, these studies differ in the sense that
Bulashevska and Eils did not carry out a 10-fold cross-validation test.
The association rules inferred by GRNCOP are summar-ized in Table 2. Only the rules that achieved the highestlevels of accuracy after the validation process are reported.All of the rules included in Table 2 reached an accuracyover 70 percent in each validation procedure and an overallmean accuracy higher than 80 percent, that is, taking intoaccount the average of the three validation tests. As aconsequence of this stringent evaluation, none of thechange-based rules detected from cdc15 passed the valida-tion test.
The last two columns of Table 2 indicate interactionrelationships that were also inferred by the methodsproposed by Soinov et al. [10] and Bulashevska and Eils[12], respectively, using the same data sets. The GRNcorresponding to the simultaneous rules inferred byGRNCOP is shown in Fig. 3. The nodes represent genes,and the arcs indicate the potential regulatory relationships.The direction of the arcs determines the direction of theputative regulatory interactions. In particular, the dottedarcs denote new potential relationships discovered exclu-sively by GRNCOP.
The accuracy values obtained for the classifiers proposedin the three studies are presented in Tables 3 and 4. Eachrow holds the mean accuracy value obtained by the rulesthat represent the set of potential interactions for aparticular gene. It is important to clarify that Bulashevskaand Eils [12] did not report results by applying 10-foldstratified cross-validation. They only carried out indepen-dent tests using the cdc28 and alpha-factor data sets.
In summary, all simultaneous rules inferred by thedecision-tree method [10] were also detected by GRNCOP,with the exception of the rules associated with genes MBP1,CDC34, and SKP1. Nevertheless, the simultaneous rules
6 IEEE/ACM TRANSACTIONS ON COMPUTATIONAL BIOLOGY AND BIOINFORMATICS, VOL. 4, NO. 4, OCTOBER-DECEMBER 2007
TABLE 2Candidate Association Rules Inferred by GRNCOP, Soinov
et al. (2003), and Bulashevska and Eils (2005) for S. cerevisiaeUsing the cdc15 Data Set from Spellman et al. (1998)
This article has been accepted for inclusion in a future issue of this journal. Content is final as presented, with the exception of pagination.

involving these genes are reported as “Questionable rules”by Soinov et al. [10] because these rules have a high 10-foldcross-validation accuracy on cdc15 data, but their accuracydecreases significantly with the cdc28 and alpha-factor datasets. For example, Soinov et al. reported that the accuracyestimated by 10-fold cross validation for the rule þMBP1,�SKP1 under “simultaneous” events is almost 92 percent,but the performance of the rule was not confirmed byestimations with cdc28 and alpha-factor test sets. In otherwords, the number of “FP” for this rule is high when cdc28and alpha-factor are used as test sets. Therefore, GRNCOPinferred all the highly accurate simultaneous rules obtainedby the decision-tree method [10].
Furthermore, the unquestionable simultaneous rulesdiscovered by Soinov et al. [10] also belong to the mostaccurate rule subset inferred by GRNCOP. Each unques-tionable simultaneous rule obtained by Soinov et al.’salgorithm was inferred by the GRNCOP with an accuracy ofapproximately 90 percent. It is important to note that thenumber of rules inferred by Soinov et al.’s algorithm isincreased by GRNCOP by 40.5 percent, with the sameoverall accuracy (the mean accuracy of the three validationtests was exactly equal to 84.93 percent for both methods).In other words, GRNCOP detects more association rulesthan Soinov et al.’s method with the same accuracy levels.
Although the Bulashevska and Eils’s method based onBayesian Networks infers several interaction relationshipsthat were not detected by GRNCOP, the emergence of manyof their rules may be explained by the relaxation of the
accuracy percentages required during the validation test, as
shown in Table 4, and not as a result of a better predictingability. From this table, it is clear that, both in [10] and inour work, a more conservative validation test was carriedout to decide the final set of association rules. Moreover, ifthe accuracy percentage is decreased to 60 percent,
GRNCOP obtained more rules, but an accuracy of at least70 percent was used in order to achieve a fair but stringentcomparison in relation to Soinov et al.’s experiments.
In addition, from Table 2, it is evident that several of therules inferred by GRNCOP and Soinov et al. [10] were notdetected by Bulashevska and Eils. Finally, it is important to
stress that, despite these differences, no major inconsisten-cies were found between the methods.
4.1 Biological Relevance of Results
The biological relevance of the inferred rules was estimatedby analyzing whether such interrelationships reflect keyfunctional properties relating to the different cell cycle
phases G1, S, G2, M, and M=G1. Genes CLN1 and CLN2transcribe G1 cyclins, whereas CLB5 and CLB6 transcribeB-cyclins. They share a similar expression pattern and attaintheir highest expression level during the G1 phase, whichcan be verified in the experimental data analyzed [34], [35],
[36]. This knowledge is consistent with the rules:
þ =� CLB6, þ=� CLB5;þ=� CLN1, þ=� CLB5;
þ =� CLN2, þ=� CLB5;þ=� CLB5, þ=� CLB6;
þ =� CLN1, þ=� CLB6;þ=� CLN2, þ=� CLB6;
þ =� CLB5, þ=� CLN1;þ=� CLN2, þ=� CLN1;
þ =� CLN1, þ=� CLN2:
In particular, the new rules inferred by GRNCOP,
þ =� CLN2, þ=� CLB5;þ=� CLB5, þ=� CLN1;
þ =� CLN1, þ=� CLN2;
are consistent with observations on the partial functionalredundancy existing among CLB5, CLN1, and CLN2,which have been reported by Epstein and Cross [37] andLevine et al. [38].
CLB1 and CLB2 are specific cyclins of the G2 phase and
there is a biological evidence that they are coexpressed inthis process [39]. Gene SWI5 is a transcription factor whose
PONZONI ET AL.: INFERRING ADAPTIVE REGULATION THRESHOLDS AND ASSOCIATION RULES FROM GENE EXPRESSION DATA... 7
TABLE 3Comparison between the Validation Test Results Obtained byGRNCOP and Soinov et al. (2003) for S. cerevisiae Using the
cdc15 Data Set from Spellman et al. (1998)
Fig. 3. GRN based on the simultaneous rules inferred by GRNCOP for
S. cerevisiae. Dotted arcs show potentially novel association rules for
CLN1, CLN2, CLB1, CLB5, and SWI4.
TABLE 4Comparison between the Validation Test Results Obtained byGRNCOP and Bulashevska and Eils (2005) for S. cerevisiae
Using the cdc15 Data Set from Spellman et al. (1998)
This article has been accepted for inclusion in a future issue of this journal. Content is final as presented, with the exception of pagination.

activation occurs during the G2 phase. These facts justifythe following rules:
þ =� CLB2, þ=� CLB1;þ=� SWI5, þ=� CLB1;
þ =� CLB1, þ=� CLB2;þ=� SWI5, þ=� CLB2;
þ =� CLB1, þ=� SWI5;þ=� CLB2, þ=� SWI5;
which are further supported by biological evidencepresented by Koranda et al. [40]. Furthermore, thetranscription of SWI5 is activated late in phase S and itspeak of mRNA concentration occurs during the G2 phase[41]. This information is consistent with the rule:þ=� CLB1! þ=� SWI5.
It is also well known that, in budding yeast, the G1
cyclins such as CLN1 and CLN2 are expressed in G1 and Sphases, whereas mitotic cyclins such as CLB1 and CLB2 areexpressed in G2 and M phases. Amon et al. [42] found thatthe CLBs play a central role in the transition from S toG2 phases, showing evidence that CLBs repress CLNs. Thisnegative regulation of CLNs may occur via the transcriptionfactor SWI4 because CLBs are necessary for G2 repression ofSCB-regulated genes like CLN1 and CLN2. On the otherhand, Andrews and Measday [43] present evidence that theCyclin/CDK complexes (CDC28/CLN1 and CDC28/CLN2) regulates CLB proteolysis. This data is consistentwith the inhibitory relationships inferred between G1 andG2-specific genes:
þ =� CLN1, �=þ CLB1;þ=� CLN2, �=þ CLB1;
þ =� CLB6, �=þ CLB1;þ=� CLN1, �=þ CLB2;
þ =� CLN2, �=þ CLB2;þ=� CLB2, �=þ CLN2;
þ =� SWI5, �=þ CLN2;
and the time-delay rule: þ=� CLB6! �=þ CLB1. Inparticular, the rules
þ =� CLN1, �=þ CLB1;þ=� CLN1, �=þ CLB2;
þ =� CLN2, �=þ CLB1;
and þ=� CLN2, �=þ CLB2 were only inferred byGRNCOP. The reader is referred to [39], [41], and [44] foradditional detailed information on the biological relevanceof these associations.
With regard to SIC1, it is well known that this gene is aninhibitor of CLB complexes and that it is active during theG1 phase inhibiting CLB1 and CLB2 [45]. This validates thesimultaneous rule: þ=� SIC1, �=þ CLB2. CDC20 istranscribed late in the S=G2 phase [36], whereas CLN1 isexpressed during the G1 phase. This explains its interactionwith CLN1, which may be represented by the ruleþ=� CDC20, �=þ CLN1. Printz et al. [46] presentedevidence that CLB2 stimulates the synthesis of CDC20and Chen et al. [47] described time delays between theexpression of CLB2 and the activation of CDC20. Thisfeature is captured by a new rule inferred by GRNCOP:þ=� CLB2! þ=� CDC20. This rule was not detected bythe methods compared with GRNCOP.
The protein SWI4 is a component of the SBF complex,which controls the expression of genes during phase G1 [48].This is in concordance with the inhibitory action of SWI4 onthe genes expressed in the G2 phase, as represented by the
rule þ=� SWI4, �=þ CLB1, and its activator role of thegenes expressed during the G1 phase, as revealed by the ruleþ=� SWI4, þ=� CLN2. Moreover, Igual et al. [48] showedexperimental evidence that the SWI4 regulates the transcrip-tion of gene CLN2, which is represented in one of thesimultaneous rules inferred by GRNCOP only. These ob-servations offer evidence of the biological relevance of theassociation rules inferred by GRNCOP.
Additionally, a functional annotation-driven analysis ofthe interacting pairs only predicted by GRNCOP (Table 2)further suggests its potential for making biologicallymeaningful predictions. Their curated Gene Ontology(GO) [49] annotations derived from the SGD (http://www.yeastgenome.org/) were processed to assess func-tional similarity between such pairs under the three GOhierarchies: Molecular Function (MF), Biological Process(BP), and Cellular Component (CC), as investigated else-where [50]. Only higher quality annotations were pro-cessed, that is, electronically inferred annotations were notconsidered.
All of the pairs exhibited relatively high functionalsimilarity values over all the GO hierarchies using theMarch 2005 release of the SGD. This stresses that these pairsare linked to common biological functions, pathways, andcellular localizations. With regard to the BP hierarchy, forexample, all of the similarity values were higher than 0.4,which is above the SGD mean similarity value. Only thepair SWI4-CLN2 showed null similarity under the MFhierarchy. All of the pairs showed CC similarity valuesabove 0.6, except for the pair CLB2-CDC20 (0.20). A closerlook at the GO annotations for these novel predictionsconfirms the relevance of these findings. For example, thepair CLN1-CLB1 is involved in regulation of cyclindependent proteins. Similarly, CLB2 is a known regulatorof cyclin dependent protein kinase activity, which waspredicted by GRNCOP as a regulator of CDC20. CDC20 isknown to be involved in cyclin catabolism.
5 CONCLUSIONS
In this paper, GRNCOP, a combinatorial optimizationalgorithm designed for the inference of putative GRNs,was presented. GRNCOP obtains an optimal classifier thatrepresents potential interaction relationships betweengenes. This classifier is attained in two sequentiallyexecuted main steps. First, a gene-specific discretization ofthe gene expression values is carried out, which can moreaccurately reflect the complexity of the regulatory relation-ships between pairs of genes. In a second stage, theassociation rules are inferred by means of a combinatorialexploration of the predictive relationships existing betweenthe discretized values.
This study does not claim that our or other data-drivenmachine learning approaches are sufficient to infer biologi-cally meaningful regulatory networks. However, such toolsmay offer significant evidence necessary to aid scientists inexploring and identifying biologically relevant associations.The method proposed here is also computationally efficient(that is, runtimes), it does not require arbitrary assumptionsabout the discretization of gene expression values, and it alsoproved to have a good predictive performance in the
8 IEEE/ACM TRANSACTIONS ON COMPUTATIONAL BIOLOGY AND BIOINFORMATICS, VOL. 4, NO. 4, OCTOBER-DECEMBER 2007
This article has been accepted for inclusion in a future issue of this journal. Content is final as presented, with the exception of pagination.
inference of a GRN for S. cerevisiae. The results obtained byGRNCOP were compared with the relationships inferred bytwo recently published methods [10], [12]. This comparisonreveals the efficacy of GRNCOP as a prediction tool. This isnot only because it detects a high percentage of the rulesinferred by the other methods, but also because it finds newrelevant relationships, which satisfied a stringent statisticalvalidation. Moreover, all interactions between genes inferredby GRNCOP are consistent with previous biological knowl-edge. It is also important to remark that the low computa-tional effort required by our method makes it suitable for theinference of complex GRN, involving thousands of genes.
As future work, we plan to extend our algorithm in orderto implement other types of inferable interaction relation-ships. The algorithm currently has the ability to inferpotential regulatory rules with one-to-one cardinality, thatis, rules where the precedent (left side of the rule) containsonly one gene. Biological phenomena may, of course,comprise relationships described by a “many-to-one”cardinality. Moreover, a variety of motifs may also befound, such as “one-to-many” relationships. Therefore, wewill incorporate the prediction of rules with highercardinality.
A related future direction concerns the manner in whichinferences of potential interactions are made. At present,our algorithm assesses each gene independently as apotential regulator for the target gene under consideration,that is, in determining whether geneR is a potentialregulator of geneT, we do not take into account geneR’srelationship with other regulators of geneT. This means thatit is possible that some direct interactions identified by ourapproach are, in fact, due to indirect relationships betweengenes. A first step to addressing this issue would be toinvestigate thresholds for both direct and indirect processesidentified by our approach in order to determine whetherthere is any redundancy in the GRN that has been inferred.
We also intend to integrate additional data sources suchas factor binding motifs and location analysis data, as wellas prior functional knowledge (for example, ontology-based) and network constraints such as topological con-straints. With respect to possible applications, we also planto test our method on data from other organisms such asmice. Finally, further comparisons with others methods andthe hybridization with modular techniques constituteanother long-term goal.
ACKNOWLEDGMENTS
Dr. Ponzoni did this work as a visiting researcher at theSchool of Computing and Mathematics, University of Ulster.The authors would like to express their acknowledgment tothe ANPCyT from Argentina for their economic supportgiven through Grant No. 11-12778 (Res. 117/2003) as part ofthe “Contrato de Prestamo BID 1728/OC-AR” and to theUniversidad Nacional del Sur for their economic supportgiven through Grants Res. CSU-598 and PGI 24/N019.
REFERENCES
[1] H. Bolouri and E.H. Davidson, “Modeling TranscriptionalRegulatory Networks,” BioEssays, vol. 24, pp. 1118-1129, 2002.
[2] M.P. Styczynski and G. Stephanopoulos, “Overview of Computa-tional Methods for the Inference of Gene Regulatory Networks,”Computers and Chemical Eng., vol. 29, pp. 519-534, 2005.
[3] H. De Jong, “Modeling and Simulation of Genetic RegulatorySystems: A Literature Review,” J. Computational Biology, vol. 9,pp. 67-103, 2002.
[4] C. Pridgeon and D. Corne, “Genetic Network Reverse-Engineer-ing and Network Size; Can We Identify Large GRNs?” Proc. 2004IEEE Symp. Computational Intelligence in Bioinformatics and Compu-tational Biology, pp. 32-36, Oct. 2004.
[5] J.L. De Risi, V.R. Iyer, and P.O. Broma, “Exploring the Metabolicand Genetic Control of Gene Expression on a Genomic Scale,”Science, vol. 278, pp. 680-686, 1997.
[6] M.B. Eisen, P.T. Spellman, P.O. Brown, and D. Botstein, “ClusterAnalysis and Display of Genome-Wide Expression Patterns,” Proc.Nat’l Academy of Sciences USA, vol. 95, pp. 14863-14868, 1998.
[7] S. Liang, S. Fuhrman, and R. Somogyi, “REVEAL, A GeneralReverse Engineering Algorithm for Inference of Genetic NetworkArchitectures,” Proc. Pacific Symp. Biocomputing, vol. 3, pp. 18-29,Jan. 1998.
[8] T. Akutsu, S. Miyano, and S. Buhara, “Identification of GeneticNetworks from a Small Number of Gene Expression Patternsunder the Boolean Network Model,” Proc. Pacific Symp. Biocom-puting, vol. 4, pp. 17-28, Jan. 1998 1999.
[9] S. Mehra, W.-S. Hu, and G. Karypis, “G: A Boolean Algorithm forReconstructing the Structure of Regulatory Networks,” MetabolicEng., vol. 6, pp. 326-339, 2004.
[10] L.A. Soinov, M.A. Krestyaninova, and A. Brazma, “TowardsReconstruction of Gene Networks from Expression Data bySupervised Learning,” Genome Biology, vol. 4, Article R6, 2003.
[11] N. Friedman, M. Linial, I. Nachman, and D. Peer, “Using BayesianNetworks to Analyze Expression Data,” J. Computational Biology,vol. 7, pp. 601-620, 2000.
[12] S. Bulashevska and R. Eils, “Inferring Genetic Regulatory Logicfrom Expression Data,” Bioinformatics, vol. 21, pp. 2706-2713, 2005.
[13] M. Zou and S.D. Conzen, “A New Dynamic Bayesian Network(DBN) Approach for Identifying Gene Regulatory Networks fromTime Course Microarray Data,” Bioinformatics, vol. 21, pp. 71-79,2005.
[14] A.E. Eiben and J.E. Smith, Introduction to Evolutionary Computing.Springer, 2003.
[15] S. Ando, E. Sakamoto, and H. Iba, “Evolutionary Modeling andInference of Gene Network,” Information Sciences, vol. 145, pp. 225-236, 2002.
[16] H. Iba and A. Mimura, “Inference of a Gene Regulatory Networkby Means of Interactive Evolutionary Computing,” InformationSciences, vol. 145, pp. 225-236, 2002.
[17] J. Hallinan and J. Wiles, “Evolving Genetic Regulatory NetworksUsing an Artificial Genome,” Proc. Second Asia-Pacific Bioinfor-matics Conf., 2004.
[18] T. Reil, “Dynamics of Gene Expression in an Artificial Genome:Implications for Biological and Artificial Ontogeny,” Proc. FifthEuropean Conf. Artificial Life, D. Floreano, F. Mondada, andJ.D. Nicoud, eds., pp. 457-466, 1999.
[19] J.R. Quinlan, C4.5: Programs for Machine Learning. MorganKaufmann, 1992.
[20] S. Ruggieri, “Efficient C4.5,” IEEE Trans. Knowledge and Data Eng.,vol. 14, pp. 438-444, 2002.
[21] J. Ihmels, G. Friedlander, S. Bergmann, O. Sarig, Y. Ziv, and N.Barkai, “Revealing Modular Organization in the Yeast Transcrip-tional Network,” Nature Genetics, vol. 31, pp. 370-377, 2002.
[22] E. Segal, M. Shapira, A. Regev, D. Pe’er, D. Botstein, D. Koller, andN. Friedman, “Module Networks: Identifying Regulatory Mod-ules and Their Condition-Specific Regulators from Gene Expres-sion Data,” Nature Genetics, vol. 34, pp. 166-176, 2003.
[23] P.H. Lee and D. Lee, “Inferring Genetic Regulatory Logic fromExpression Data,” Bioinformatics, vol. 21, pp. 2739-2747, 2005.
[24] B. Snel and M.A. Huynen, “Quantifying Modularity in theEvolution of Biomolecular Systems,” Genome Research, vol. 14,pp. 391-397, 2004.
[25] T. Schlitt and A. Brazma, “Modelling Gene Networks at DifferentOrganisational Levels,” FEBS Letters, vol. 579, pp. 1859-1866, 2005.
[26] T. Schlitt and A. Brazma, “Modelling in Molecular Biology:Describing Transcription Regulatory Networks at DifferentScales,” Philosophical Trans. Royal Soc. of London Series B, BiologicalSciences, vol. 361, no. 1467, pp. 483-494, 2006.
PONZONI ET AL.: INFERRING ADAPTIVE REGULATION THRESHOLDS AND ASSOCIATION RULES FROM GENE EXPRESSION DATA... 9
This article has been accepted for inclusion in a future issue of this journal. Content is final as presented, with the exception of pagination.

[27] C.-H. Yeang and T. Jaakkola, “Physical Network Models andMulti-Source Data Integration,” Proc. Seventh Ann. Int’l Conf.Research in Computational Molecular Biology, pp. 312-321, Apr. 2003.
[28] P.T. Spellman, G. Sherlock, M.Q. Zhang, V.R. Iyer, K. Andres, B.Eisen, P.O. Brown, D. Botstein, and B. Futcher, “ComprehensiveIdentification of Cell Cycle-Regulated Genes of the YeastSaccharomyces cerevisiae by Microarray Hybridization,” Molecu-lar Biology of the Cell, vol. 9, pp. 3273-3297, 1998.
[29] T. Mitchel, Machine Learning, chapter 3. WCB/McGraw-Hill, 1997.[30] R. Kohani, “Wrappers for Performance Enhancement and Ob-
livious Decision Graphs,” PhD dissertation, Computer ScienceDept., Stanford Univ., 1995.
[31] D.R. Carvalho and A.A. Freitas, “A Hybrid Decision Tree/GeneticAlgorithm Method for Data Mining,” Information Sciences, vol. 163,pp. 13-35, 2004.
[32] F. Provost, D. Jensen, and T. Oates, “Efficient ProgressiveSampling,” Proc. Fifth ACM SIGKDD Int’l Conf. KnowledgeDiscovery and Data Mining, Paper ID 442, Aug. 1999.
[33] R.J. Cho, M.J. Campbell, E.A. Winzeler, L. Steinmetz, A. Conway,L. Wodicka, T.G. Wolfsberg, A.E. Gabrielian, D. Landsman, D.J.Lockhart, and R.W. Davis, “A Genome-Wide TranscriptionalAnalysis of the Mitotic Cell Cycle,” Molecular Cell, vol. 2, pp. 65-73,1998.
[34] C. Kuhne and P. Linder, “A New Pair of B-Type Cyclins fromSaccharomyces cerevisiae that Function Early in the Cell Cycle,”European Molecular Biology Organization J., vol. 12, pp. 3437-3447,1993.
[35] K.C. Chen, A. Csikasz-Nagy, B. Gyorffy, J. Val, B. Novak, and J.J.Tyson, “Kinetic Analysis of a Molecular Model of the BuddingYeast Cell Cycle,” Molecular Biology of the Cell, vol. 11, pp. 369-391,2000.
[36] L.H. Hwang, L.F. Lau, D.L. Smith, C.A. Mistrot, K.G. Hardwick,E.S. Hwang, A. Amon, and A.W. Murray, “Budding Yeast CDC20:A Target of the Spindle Checkpoint,” Science, vol. 279, pp. 1041-1044, 1998.
[37] C.B. Epstein and F.R. Cross, “CLB5: A Novel B Cyclin fromBudding Yeast with a Role in S Phase,” Genes and Development,vol. 6, pp. 1695-1706, 1992.
[38] K. Levine, K. Huang, and F.R. Cross, “Saccharomyces cerevisiaeG1 Cyclins Differ in Their Intrinsic Functional Specificities,”Molecular and Cellular Biology, vol. 16, pp. 6794-6803, 1996.
[39] H. Althoefer, A. Schleiffer, K. Wassmann, A. Nordheim, and G.Ammerer, “McmI Is Required to Coordinate G2-Specific Tran-scription in Saccharomyces cerevisiae,” Molecular and CellularBiology, vol. 15, pp. 5917-5928, 1995.
[40] M. Koranda, A. Schleiffer, L. Endler, and G. Ammerer, “Forkhead-Like Transcription Factors Recruit NddI to the Chromatin of G2/M-Specific Promoters,” Nature, vol. 406, pp. 94-98, 2000.
[41] C.J. Loy, D. Lydall, and U. Surana, “NDDI, a High-DosageSuppressor of cdc28-I N, Is Essential for Expression of a Subset ofLate-S-Phase-Specific Genes in S. cerevisiae,” Molecular andCellular Biology, vol. 19, pp. 3312-3327, 1999.
[42] A. Amon, M. Tyers, B. Futcher, and K. Nasmyth, “Mechanismsthat Help the Yeast Cell Cycle Clock Tick: G2 Cyclins Tran-scriptionally Activate G2 Cyclins and Repress G1 Cyclins,” Cell,vol. 74, pp. 993-1007, 1993.
[43] B. Andrews and V. Measday, “The Cyclin Family of BuddingYeast: Abundant Use of a Good Idea,” Trends in Genetics, vol. 14,pp. 66-72, 1998.
[44] B. Schneider, E. Patton, S. Lanker, M. Mendenhall, C. Wittenberg,B. Futcher, and M. Tyers, “Yeast GI Cyclins Are Instable in GIPhase,” Nature, vol. 395, pp. 86-89, 1998.
[45] J.H. Toyn, A.L. Johnson, J.D. Donovan, W.M. Toone, and L.H.Johnston, “The Swi5 Transcription Factor of Saccharomycescerevisiae Has a Role in Exit from Mitosis through Induction ofthe Cdk-Inhibitor SicI in Telophase,” Genetics, vol. 145, pp. 85-96,1997.
[46] S. Prinz, E.S. Hwang, R. Visintin, and A. Amon, “The Regulationof Cdc20 Proteolysis Reveals a Role for the APC ComponentsCdc23 and Cdc27 during S Phase and Early Mitosis,” CurrentBiology, vol. 8, pp. 750-760, 1998.
[47] K.C. Chen, A. Csikasz-Nagy, B. Gyorffy, J. Val, B. Novak, and J.J.Tyson, “Kinetic Analysis of a Molecular Model of the BuddingYeast Cell Cycle,” Molecular Biology of the Cell, vol. 11, pp. 369-391,2000.
[48] J.C. Igual, W.M. Toone, and L.H. Johnston, “A Genetic ScreenReveals a Role for the Late G1-Specific Transcription Factor Swi4pin Diverse Cellular Functions Including Cytokinesis,” J. CellScience, vol. 110, pp. 1647-1654, 1997.
[49] “The Gene Ontology Consortium: Creating the Gene OntologyResource: Design and Implementation,” Genome Research, vol. 11,pp. 1425-1433, 2001.
[50] H. Wang, F.J. Azuaje, O. Bodenreider, and J. Dopazo, “GeneExpression Correlation and Gene Ontology-Based Similarity: AnAssessment of Quantitative Relationships,” Proc. IEEE 2004 Symp.Computational Intelligence in Bioinformatics and ComputationalBiology, pp. 25-31, 2004.
Ignacio Ponzoni received the BSc degree incomputer science from the Universidad Nacionaldel Sur, Bahıa Blanca, Argentina, in 1996 andthe PhD degree in computer science from theUniversidad Nacional del Sur in 2001. Hereceived a fellowship from the National Councilof Scientific and Technological Research ofArgentina (CONICET) in 1996. He is a lecturerin the Department of Computer Science andEngineering at the Universidad Nacional del Sur,
and a scientific researcher at Planta Piloto de Ingenierıa Quımica, whichis a National Research Institute of CONICET. His research interestsfocus mainly on computational intelligence applied to chemicalengineering problems and bioinformatics. With his academic work, hehas contributed 11 journal publications and more than 20 internationalconference/workshop publications. He is a member of the ACM.
Francisco J. Azuaje received the BSc degree in electronic engineeringfrom Simon Bolivar University, Caracas, Venezuela, in 1995, the MScdegree in policy and management of technological innovation from theCentral University of Venezuela in 1996, and the PhD degree in artificialintelligence and medical informatics from the University of Ulster,Jordanstown, United Kingdom. Before joining the University of Ulster asa reader in 2002, he was a lecturer in the Department of ComputerScience at Trinity College, Dublin, Ireland. He has published extensivelyin journals, books, and conference proceedings related to the areas ofbioinformatics, artificial intelligence, and medical informatics. He is aneditorial board member of the IEEE Transactions on Nanobioscience,BioMedical Engineering OnLine, Cancer Informatics, and the OnlineJournal of Bioinformatics. He has coedited three books in the areas ofbiomedical informatics and systems biology. He coadministers the IEEEForum on Bioinformatics and Systems Biology. He is a senior memberof the IEEE.
Juan Carlos Augusto is a lecturer at theUniversity of Ulster, Jordanstown, United King-dom. His research interests focus mainly onArtificial Intelligence (AI), particularly the subar-ea of temporal reasoning (TR). Since writing hisPhD thesis (1998), he has explored diverseareas of application for the concept of temporalreasoning and its relevance for dynamic sys-tems. With his academic work, he contributed 16journal/edited volumes/book chapter publica-
tions and more than 30 international conference/workshop publications.He has also been actively involved in the organization of scientificevents, participating in more than 20 of them as the chair/cochair or asteering or program committee member.
David H. Glass received the degree in pure andapplied mathematics, the PhD degree in theore-tical atomic physics, and the MA degree inphilosophy from the Queen’s University ofBelfast in 1994, 1997, and 2000, respectively.After completing the PhD, he continued to carryout research on the theory of laser interactionswith atoms and molecules. He has been alecturer in the School of Computing and Mathe-matics at the University of Ulster since 2000,
where he has carried out research in the field of artificial intelligence,including work on probabilistic reasoning and possibilistic logic.
10 IEEE/ACM TRANSACTIONS ON COMPUTATIONAL BIOLOGY AND BIOINFORMATICS, VOL. 4, NO. 4, OCTOBER-DECEMBER 2007
This article has been accepted for inclusion in a future issue of this journal. Content is final as presented, with the exception of pagination.
Copyright © 2022 FDOKUMEN