Industry Internship and Report on
98
Industry Internship and Report on A STUDY ON WORKING CAPITAL MANAGEMENT AT ANUGRAHA TOURS AND TRAVELS BY NISHMITHA N M 1NZ16MBA42 Submitted to DEPARTMENT OF MANAGEMENT STUDIES NEW HORIZON COLLEGE OF ENGINEERING, OUTER RING ROAD, MARATHALLI, BANGALORE In partial fulfillment of the requirements for the award of the degree of MASTER OF BUSINESS ADMINISTRATION Under the guidance of INTERNAL GUIDE EXTERNAL GUIDE Ms. KERENA ANAND M. DEVA RAO Senior Assistant Professor Anugraha Tours and Travels 2016-2018
-
Upload
khangminh22 -
Category
Documents
-
view
4 -
download
0
Transcript of Industry Internship and Report on

Industry Internship and Report on
A STUDY ON WORKING CAPITAL MANAGEMENT AT ANUGRAHA
TOURS AND TRAVELS
BY
NISHMITHA N M
1NZ16MBA42
Submitted to
DEPARTMENT OF MANAGEMENT STUDIES
NEW HORIZON COLLEGE OF ENGINEERING,
OUTER RING ROAD, MARATHALLI,
BANGALORE
In partial fulfillment of the requirements for the award of the degree of
MASTER OF BUSINESS ADMINISTRATION
Under the guidance of
INTERNAL GUIDE EXTERNAL GUIDE
Ms. KERENA ANAND M. DEVA RAO Senior Assistant Professor Anugraha Tours and Travels
2016-2018

CERTIFICATE
This is to certify that NISHMITHA N M bearing USN 1NZ16MBA42, is a bonafide student of
Master of Business Administration course of the Institute 2016-2018, autonomous program,
affiliated to Visvesvaraya Technological University, Belgaum. Internship report on “A STUDY
ON WORKING CAPITAL MANAGEMENT AT ANUGRAHA TOURS AND TRAVELS”
is prepared by her under the guidance of Ms. KERENA ANAND, in partial fulfillment of
requirements for the award of the degree of Master of Business Administration of Visvesvaraya
Technological University, Belgaum Karnataka.
Signature of Internal Guide Signature of HOD Signature of Principal

DECLARATION
I, NISHMITHA N M , hereby declare that the Internship report entitled “A STUDY ON
WORKING CAPITAL MANAGEMENT AT ANUGRAHA TOURS AND TRAVELS”
prepared by me under the guidance of Ms. KERENA ANAND , faculty of M.B.A Department,
New Horizon College of Engineering and external assistance by M. DEVA RAO, Proprietor
,ANUGRAHA TOURS AND TRAVELS.
I also declare that this Internship work is towards the partial fulfillment of the university
regulations for the award of the degree of Master of Business Administration by Visvesvaraya
Technological University, Belgaum.
I have undergone an industry internship for a period of Twelve weeks. I further declare that this
report is based on the original study undertaken by me and has not been submitted for the award
of a degree/diploma from any other University / Institution.
Signature of Student
Place: Bangalore
Date

ACKNOWLEDGEMENT
I take this opportunity to express my gratitude and profound thanks to our chairman DR.
MOHAN MANGHNANI and our respected Principal DR. MANJUNATHA.
I express my sincere thanks and deep sense of gratitude to our Head of Department DR.
SHEELAN MISRA and my Internal Guide Ms. KERENA ANAND, Department of
Management Studies for providing me with an opportunity to study and for her encouragement,
support and guidance to complete this project work successfully.
The internship opportunity I had with ANUGRAHA TOURS AND TRAVELS was a great
chance for learning and professional development. Therefore, I consider myself as a very lucky
individual as I was provided with an opportunity to be a part of it. I am also grateful for having a
chance to meet so many wonderful people and professionals who led me though this internship
period.
I express a deep sense of gratitude to my External Guide M. DEVA RAO, Proprietor, Augraha
Tours and Travels for taking part in useful decision and giving necessary advices and guidance
and arranged all facilities to make life easier. I choose this moment to acknowledge his
contribution gratefully.
Finally, I express my sincere thanks and deep sense of gratitude to my parents and friends for
giving timely advice in all the ways and in all aspects for doing the project
Name of the Student with USN
NISHMITHA N M
1NZ16MBA42

TABLE OF CONTENTS
Chapter
No.
Title
Page No.
Executive Summary
1
Theoretical background of the study
1-33
2
Industry and Company profile
34-56
3
Research Methodology
57-62
4
Data Analysis and Interpretation
63-78
5
Finding, Suggestions and Conclusion
79-81
6
Learning Experience
82
Bibliography
Annexure(s)

LIST OF TABLES
Table No.
Particulars
Page No.
Table - 4.1
Table showing working capital ratio of Anugraha Tours
and Travels
63
Table - 4.2
Table Showing Current ratio of Anugraha Tours and
Travels
65
Table - 4.3
Table showing Cash ratio of Anugraha Tours and
Travels
67
Table - 4.4
Table showing Fixed asset turnover ratio of Anugraha
Tours and Travels
69
Table - 4.5
Table showing Debtors turnover ratio of Anugraha
Tours and Travels
71
Table - 4.6
Table showing Asset turnover ratio of Anugraha Tours
and Travels
73
Table - 4.7
Table Showing Current asset to Total asset ratio of
Anugraha Tours and Travels
75
Table - 4.8
Table Showing Working Capital Turnover ratio of
Anugraha Tours and Travels
77

LIST OF CHARTS
Chart No.
Particulars
Page No.
Chart - 4.1
Chart showing working capital ratio of Anugraha Tours
and Travels
64
Chart - 4.2
Chart Showing Current ratio of Anugraha Tours and
Travels
66
Chart - 4.3
Chart showing Cash ratio of Anugraha Tours and
Travels
68
Chart - 4.4
Chart showing Fixed asset turnover ratio of Anugraha
Tours and Travels
70
Chart - 4.5
Chart showing Debtors turnover ratio of Anugraha
Tours and Travels
72
Chart - 4.6
Chart showing Asset turnover ratio of Anugraha Tours
and Travels
74
Chart - 4.7
Chart Showing Current asset to Total asset ratio of
Anugraha Tours and Travels
76
Chart - 4.8
Chart Showing Working Capital Turnover ratio of
Anugraha Tours and Travels
78

EXECUTIVE SUMMARY
It is compulsory for every student to take up a project work in an industry, besides it gives an
exposure of working atmosphere of the office, it also gives an experience, to apply the
theoretical knowledge that we have learnt, to the practical problems of the Industrial project that
they undertake.
Therefore, I have taken up the project at Anugraha Tours and Travels, and have undertaken the
study in Working Capital Management. This study will help the company in the better
management of its working capital and thus improve the performance of company.
The goal of working capital management is to ensure that a firm is able to continue its operations
and that it has sufficient ability to satisfy both maturing short-term debt and upcoming
operational expenses. The management of working capital involves managing inventories,
accounts receivable and payable, and cash. The objective of the study is to study the concept and
importance of working capital management, to study and analysis the working capital trend
through ratio analysis, to study the Liquidity position of Anugraha Tours and Travels, to suggest
measures for effective management of working capital,this study will help us to know the
financial position of the company and this study is to carry out a critical analysis of Anugraha
Tours and Travels working capital.The study of working capital is based on tools like ratio
analysis, statement of changes in working capital.
The financial statements (mainly balance sheet along with profit & loss accounts) are used to
work out various ratios which help us in better understanding the organization’s working capital
management. Ratio analysis is been done by studying the past performance of the organization
and by doing so other relevant details are also studiedThe analysis and interpretation has been
carried out by preparing tables and by using the graphs which is shown in pictorial
representation.

Scanned with CamScanner

Scanned with CamScanner
1
CHAPTER -1
THEORETICAL BACKGROUND OF THE STUDY
INTRODUCTION
Business concern needs finance to meet their requirement in the economic world. Any kind of
business activity depends on the finance. Hence, it is called as lifeblood of business organization.
Whether the business concerns are big or small, they need finance to fulfil their business
activities.
In the modern world, all the activities are concerned with the economic activities and very
particular to earning profit through any venture or activities. The entire business activities are
directly related with making profit. (according to the economic concept of factors of production,
rent given to landlord, wage given to labour interest given to capital and profit given to
shareholders or profiteers), a business concern needs finance to meet all the requirements. Hence
finance may be called as capital, investment, fund etc. but each term is having different meanings
and unique characters. Increasing the profit is the main aim of any kind of economic activity.
Finance is the lifeblood of every business activity without which the wheels of modern business
organization system cannot be greased.
MEANING OF FINANCE
Finance may be defined as the art and science of managing money. It includes financial service
and financial instruments. Finance also is referred as the provision of money at the time when it
is needed. Finance function is the procurement of funds and their effective utilization in business
concerns.
The concept of finance includes capital, funds, money, and amount. But each word is having
unique meaning. Studying and understanding the concept of finance become an important part of
the business concern.

2
DEFINITION OF FINANCE
According to khan and Jain, ―finance is the art and science of managing money‖.
According to Simon Andrade Finance is "Area of economic activity in which money is the basis
of the various embodiments, whether stock market investments, real estate, industrial,
construction, agricultural development, so on. ", and "Area of the economy in which we study
the performance of capital markets and supply and price of financial assets‖
According to Howard and Upton, ―finance may be defined as that administrative area or set of
administrative functions in an organization which relates with the arrangement of each and credit
so that the organization may have the means to carry out the objectives as satisfactorily as
possible.
TYPES OF FINANCE
Finance is one of the important and integral part of business concerns, hence, it plays a major
role in every part of the business activities. It is used in all the area of the activities under the
different names.
Finance can be classified into two major parts:

3
FINANCIAL MANAGEMENT
Finance management is managerial activity, which is concerned with planning and controlling
of the firm‘s financial Resources. It was a branch of economics till 1890, and as a separate
discipline, it is of recent origin. Still, it has no unique body of knowledge of its own, and draws
heavily on economics for its theoretical concepts even today. Finance is a scarce resource and it
has to be managed efficiency for the successful functioning of any company. Several companies
have come to grief mainly because of inefficient management of finance in spite of other
favourable conditions.
DEFINITION OF FINANCIAL MANAGEMENT
According to Solomon and Pringle Financial Managment, "is concerned with the efficient use of
an important economic resource, namely, capital funds."
AccordingTo Walker, "Financial Management is the application of planning and control
function to the finance functions."
SCOPE OF FINANCIAL MANAGEMENT
Financial management is one of the important part of overall management, which is directly
related with various functional departments like personnel, marketing and production. Financial
management covers wide area with multidimensional approaches. The following are the
important scope of financial management.
Financial management and economics
Economic concepts like micro and macroeconomics are directly applied with the financial
management approaches. Investment decisions, micro and macro environmental factors are
closely associated with the functions of financial manager. Financial management also uses the
economic equations like money value discount factor, economic order quantity etc. financial
economics is one of the emerging area, which provides immense opportunities to finance, and
economical areas.

4
Financial management and accounting
Accounting records includes the financial information of the business concern. hence, we can
easily understand the relationship between the financial management and accounting. In the
olden periods, both financial management and accounting are treated as a same decision. But
nowadays financial management and accounting discipline are separate and interrelated.
Financial management or mathematics
Modern approaches of the financial management applied large number of mathematical and
statistical tools and techniques. They are also called as econometrics. Economic order quantity,
discount factor, time value of money, present value of money, cost of capital structure theories,
dividend theories, ratio analysis and working capital analysis are used as mathematical and
statistical tools and techniques in the field of financial management.
Financial management and production management
Production management is the operational part of the business concern, with helps to multiple
the money into profit. Profit of the concern depends upon the production performance.
Production performance needs finance, because production department requires raw material,
machinery, wages, operating expenses etc. these expenditures are decided and estimated by the
financial department and the financial manager allocates the appropriate finance to production
department. The financial manager must be aware of the operational process and finance
required for each process of production activities.
Financial management and marketing
Produced goods are sold in the market with innovative and modern approaches. For this the
marketing department needs finance to meet their requirements. The financial management is
responsible to allocate the adequate finance to the marketing department. Hence, marketing and
financial management are interrelated and depends on each other‘s.
Financial management and human resource
Financial management is also related with human resource department, which provides
manpower to all the functional areas of the management. Financial manager should carefully
evaluate the requirement of manpower to each department and allocate the finance to the human
resource department as wages, salary, remuneration, commission, bonus, pension and other

5
monetary benefits to the human resource department. Hence, financial management is directly
related with human resource management.
WORKING CAPITAL MANAGEMENT
Working capital management Is a relationship between a firm's short-term assets and its
short-term liabilities. The working capital management is used to ensure that a firm is able to
continue its operations and it has sufficient ability to satisfy both short-term debt and upcoming
operational expenses. The management of working capital involves managing inventories,
accounts receivable and payable, and cash.
DEFINITION
According to Hoagland, ―Working capital is descriptive of that capital which is not fixed. But the
more common use of the working capital is to consider it as the difference between the book
value of the current assets and the current liabilities‖.
According to Field, Backer and Maillot, ―Working capital means a sum of current assets only‖.
According to Lincoln, Saliers, Stevens, ―Working capital means current assets less current
liabilities‖.
NATURE OF WORKING CAPITAL
Working capital management is concerned with the problems that arise in attempting to manage
the current assets, the current liabilities and the interrelationship that exists between them. The
term current assets refer to those assets, which in the ordinary course of business can be, or will
be, converted into cash within one year without undergoing a diminution in value and without
disrupting the operations of the firm. Current liabilities are those liabilities, which are intended,
at their inception, to be paid in the ordinary course of business, within a year, out of the current
assets or earnings of the concern. The goal of working capital management is to manage the
firm‘s current assets and liability in such a way that satisfactory level of working capital is

6
maintained. The interaction between current assets and current liabilities is, therefore, the main
theme of the theory of working management.
The working capital management may be defined as the management of firm‘s source and uses
of working capital in order to maximize the wealth of shareholders. The proper working capital
management requires both medium term planning (up to 3 years) and also the immediate
adoption to change arising due to fluctuations in operating levels of firm.
CLASSIFICATION OF WORKING CAPITAL
WORKING CAPITAL IS CLASSIFIED AS
1. ON THE BASIS OF CONCEPT
Gross Working Capital
Refers to the firm‘s investment in current assets. Current assets are the assets which can be
converted into cash within an accounting year and include cash, short-term securities, debtors,
bills receivable and stock.
Networking Capital
Refers to the difference between the current assets and current liabilities. Current liabilities are
those claims of outsiders, which are expected to mature for payment within an accounting year
On the basis of concept On the basis of time
Gross Working
Capital
Net Working
Capital Permanent or
Fixed Working
Capital
Temporary or
variable Working
Capital
Regular Working
Capital
Reserve Working
Capital Seasonal Working
Capital
Special Working
Capital

7
and include creditors, bills payable, and out-standing expenses. Net working capital can be
positive or negative. A positive net working Capital will arise when current assets exceed
current liabilities. A negative networking capital occurs when current liabilities are in excess of
current assets.
NET WORKING CAPITAL = CURRENT ASSETS – CURRENT LIABILITIES
Current assets Current liabilities
Cash Accounts Payable
Accounts Receivable Notes payable
Notes Receivable Accrued expenses
Marketable securities Taxes payable
Inventory short term loans
Prepaid expenses Bank overdraft
Total current assets Total current liabilities
2. ON THE BASIS OF TIME
Permanent or Fixed Working Capital:
Permanent or Fixed working capital is the minimum amount which is required to ensure effective
utilization of fixed facilities and for maintaining the circulation of current assets. It also refers to
the Hard core working capital. There is always a minimum level of current assets which is
continuously required by the enterprise to carry out its normal business operations. For example,
every firm has to maintain a minimum level or raw material, work-in-process, finished goods,
and cash balance. This minimum level of current assets is called permanent or fixed working
capital as this part of capital is permanently blocked in current assets.
The permanent working capital can be further be classified as:
(a) Regular Working Capital
(b) Reserve Working Capital

8
Regular working capital required to ensure circulation of current assets from cash to inventories,
from inventories to receivables and from receivables to cash and so on.
Reserve working capital is the excess amount over the requirement for regular working capital,
which may be provided for contingencies that may arise at unstated periods such as strikes, rise
in prices, depression, etc.
Temporary or Variable Working Capital
Temporary or variable working capital is the amount of working capital, which is required to
meet the seasonal demands and some special exigencies. Variable working capital can be further
classified as seasonal working capital and special needs. The capital required to meet the
seasonal needs of the enterprise is called seasonal working capital.
Special working capital is that part of working capital which is required to meet special
exigencies such as launching of extensive marketing campaigns for conducting research, etc.
FACTORS DETERMINING WORKING CAPITAL
The actual amount of working capital requirements differs from industry to industry and from
business unit to unit.
Nature of Industry
While determining the amount of working capital requirements, the financial executive has to
consider the nature of industry in which his company is operating. The business may be
manufacturing, trading or rendering a service. A trading unit dealing in the sale and purchase of
goods would require more of working capital.
Size of the business unit
Size of a business unit means its scale of operations. If a company is operating its business in
national and international markets, its working capital requirements would be regular than a
company operating in a local or state-level market.

9
Terms of purchase and sale
If an entrepreneur is buying its requirements such as raw materials, inventories etc. Strictly on a
cash basis, then his working capital requirements would be fairly large. On the other hand, if he
avails of credit facilities, his working capital requirements would be relatively lower. Similarly,
credit sales will require larger working capital while cash sales will require lower working
capital.
Inventory Turnover
If the inventory turnover is high, the working capital requirements will below. But if
inventories large and their turnover is slow, a company would require large working capital.
Importance of Labour
Industries which are capital-intensive will require lower working capital, while labour-intensive
industries will need a larger working capital.
Length of Processing Period
The longer the period of manufacturing the finished products, the greater would be the
requirements of working capital. On the other hand, a simple and short period process of
production will be required lower working capital.
Proportion of raw material to total costs
If a company is using costly raw materials, it will require a larger working capital. If raw
materials are cheap, then it would require a lower working capital.
Seasonal Variations
During the busy season, a business enterprise needs a larger, working capital while during the
slack season, it requires a lower working capital.
Changes in technology
Technological changes related to the manufacturing process have a sharp impact on the need for
large working capital.

10
Inflation
As a result of inflation in the economy, working capital requirements increase, whereas during
the time of a recession, it decreases.
Growth and Expansion
With the normal rate of expansion in the volume of business, the economy would require a larger
amount of working capital.
Profit Planning and control
The amount of working capital needed is decided by the management in accordance with its
policy profit planning and control.
INTERPRETATIONS OF WORKING CAPITAL CONCEPTS
There are two possible interpretations of the working capital concepts.
1. Balance sheet concept
There are two interpretations of working capital under the balance sheet concept working capital
is represented by the excess of current assets over current liabilities and is the amount normally
available to finance current operations. But, sometimes working capital is also used as a
synonym for gross or total current assets. In that case, the excess of current assets over current
liabilities is called the Net Working Capital.
However, there are certain arguments when it comes to supporting the above mentioned views of
working capital. Few economists‘ support that current assets should be considered as working
capital as the whole of it helps to earn profits and the management is more concerned with the
total current assets as they constitute the total funds available for operational purposes. On the
contrary, other economists argue that –
a. In the long run what matters is the surplus of current assets over current liabilities.
b. It is this concept, which helps creditors and investors to judge the financial soundness of
the enterprise.

11
c. What can always be relied upon to meet the contingencies, is the excess of current assets
over current liabilities since this amount is not to be returned and
d. This definition helps to find out the correct financial position of companies having the
same amount of current assets.
2. Operating Cycle Concept
Investment in working capital is influenced by four key events in the production and sales cycle
of the firm.
Purchase of the raw materials.
Payment of raw materials.
Sale of finished goods
Collection of cash for sales.
The cycle begins with the purchase of raw materials, which are paid for after a delay, which
represents the accounts payable period. The firm coverts the raw materials into finished goods
and then sells the same. The time lag between the purchase of raw materials and the sale of
finished goods is the inventory period. Customers pay their bills sometime after the sales. The
period that elapses between the date of sales and the date of collection of receivables in the
accounts receivable period.
Cash
Purchase
s Collections
Materials
Inventory
Accounts
Receivable
Sales
Finished
Inventory
Accounts
Payable
Production

12
The time that elapses between the purchase of raw material and the collection of cash for sales is
referred to as the operating cycle, whereas the time length between the payment of raw material
purchases and the collection of cash for sales is referred to as the accounts receivable period,
whereas the cash cycle is equal to the operating cycle less the accounts payable period.
CASH MANAGEMENT
Cash, the most liquid asset, is of vital importance to the daily operations like acquiring supplies,
resources, equipments etc., used in generating the products and services provided by the firm and
making payments like wages and salaries to the workers and managers, taxes to the government,
etc., of business firms. More fundamentally, cash is the medium of exchange, which allows
management to carry on the various activities of this business firms from day to day. While the
proportion of corporate assets held in the form of cash is very small its efficient management is
crucial to the solvency of the business because in a very important sense cash is the focal point of
funds flows in a business.
MOTIVES FOR HOLDING CASH
There are three possible motives of holding of cash
Transaction motive
Firms need cash to meet their transaction need. The collection of cash from sale of goods and
services, sale of assets and additional financing is not perfectly synchronized with the
disbursement of cash for purchase of goods and services, acquisition of capital assets and
meeting other obligations. Hence, some cash balance is required as a buffer.
Precautionary motive
There may be some uncertainty about the magnitude and timing of cash inflows from the sales to
goods and services, sale of assets and issuance of securities. Likewise, there may be uncertainty
about cash outflows on account of purchases and other obligations. To protect itself against such
uncertainties, a firm may required some cash balance.

13
Speculative motive
Firms would like to tap profit – making opportunities arising from fluctuations in commodity
prices, security prices, interest rates and foreign exchange rates. A cash – rich firm is better
prepared to exploit such bargains. Hence, firms which have such speculative leanings, may carry
additional liquidity. However, for most firms there reserve, borrowing capacity and marketable
securities would suffice to meet their speculative needs.
CASH BUDGETING
Cash budgeting or short term cash forecasting is the principle tool of cash management cash
budget, routinely prepared by business firms are helpful in
Estimating Cash requirements
Planning short term financing.
Schedule payments in connection with capital expenditure projects.
Planning purchases of materials,
Developing credit policies.
Checking the accuracy of long term forecasts.
Short term cast forecasting
Firms use multiple short term forecasts for varying lengths and detail, suited to meet different
needs. The point to be emphasized here is that the multiple formats used by the firms for cash
forecasting serves different purposes and should not be regarded as mutually exclusive. The
principle method of short term forecasting is the receipts and payments method.
Receipts and payment method.
The cash budget prepared under this method shows the timing and the magnitude of expected
cash receipts and cash payments over the forecast period. It includes all expected cash receipts
and cash payments irrespective of how they are classified in accounting.

14
RECEIVABLES MANAGEMENT
Receivable management refers to the decisions a business makes regarding its overall credit and
collection policies and the evaluation of individual credit applicants. Receivable management
proves for a firm both an asset and a problem of an asset because of the promise of a future cash
flow and a problem because of the need to obtain financing while waiting for the future cash
flow.
Trade credit is considered as an essential marketing tool, acting as a bridge for the movement of
goods through production and distribution stages to customers. A firm grants trade credit to
protect it sales from the competitors and to attract potential customers to buy its products on
favorable terms. This creation of credit and creating debtors result in creation of receivables.
Thus granting credit and creating debtors amounts to the blocking of the firms funds. The
interval between the date of sales and the date of payment that is the operating cycle has to be
financed out of working capital. This necessitates the firms to get funds from banks or other
sources. Thus, trade debtors or receivables represent investment. As substantial amounts are tied
up in trade debtors, it needs careful analysis and proper management.
Receivables
Receivables are defined as an asset account representing the claims of a firm against its
customers, which is the result of credit sales of goods / services in the ordinary course of
business. So receivables are the result of extension of credit facilities to the customers.
Purposes of receivables.
The purpose of receivables is directly related with the objectives of credit sales. The objectives
of credit sales are
Achieving growth in sales
By selling goods on credit, a firm will generally be in a position to sell more goods that if it
insisted on immediate cash payment.

15
Increase in profits
Increase in profits result in higher profits for the firm not only because of increase in volume of
sales but also because of the firm charging a higher margin of profit on credit sales as compared
to cash sales.
Meeting competition
A firm may have to resort to granting of credit to its customers because of similar facilities being
granted by the competing firms to avoid the loss of sales from customers who would buy
elsewhere if they did not receive the expected credit.
The overall objective of committing funds to accounts receivable is to generate a large flow of
operating revenue and hence profit than what would be achieved in the absence of no such
commitment.
Cost of maintaining receivable
The cost with respect to maintenance of receivables can be identified as follows.
1. Capital costs
Maintenance of accounts receivable results in blocking of the firms financial resources with
them. Thus is because there is a time lag between the sales of goods to customers and the
payment by them. The firm has therefore to arrange for additional funds to meet its own
obligations such as payment to employees, suppliers of raw materials, etc., while waiting for
payments for its customers, so to raise the additional funds so as to meet its requirements the
firm incurs a cost called capital cost.
2. Administration cost
The firm has to incur additional administrative costs for maintaining account receivable in the
form of salaries to the staff kept for maintaining accounting record related to customer and to
determine their credit worthiness.

16
3. Collection costs
This refers to the costs incurred by a firm for collection of payments from its credit customers.
4. Defaulting costs
Sometimes after making all the serious efforts to collect money from the defaulting customers,
the firm may not be able to recover the over dues because of the inability of the customers. Such
debts are treated as bad debts and have to be written off since they cannot be realized.
So creation of receivables is a double edged weapon. If it is created and administered well it may
result in increase in sales and hence profits, but if there is any complacence on the part of the
management in the administration of receivables, it will increase the chances of bad debts and
may cause overall decline in profits of the firm. Hence the management should formulate on
optimum credit policy for the efficient management and administration of receivables.
CREDIT POLICY
The term Credit policy refers to those decision variables that influence the amount of trade credit
that is, the investment in receivables.
Credit policy Variables
Credit Standards
Credit Period
Cash Discount
Collection Efforts.
A firm‘s credit policy as a matter of fact, determines the amount of risk a firm is willing to
undertake in its sales activities. The extent of risk and return involved in receivables is largely
based on the credit policy adopted by a firm. Broadly speaking credit policy of a firm can be of
the following two types.

17
a) Lenient (liberal) Credit Policy
b) Stringent Credit Policy
EFFECTS OF LENIENT (LIBERAL) CREDIT POLICY
INCREASE IN SALES
Liberal credit policy will result in increase in the sales of goods and services, due to the
availability of easy terms and standards of credit provided by a firm due to the customers.
INCREASE IN PROFIT
Increase in sales will ultimately result in the increase in profits of the organization.
Increase in cost of maintenance of receivables
Liberal credit policy demands more investment in receivables and bad debts. The various costs,
which may increase due to increase in the amount of receivable, are – capital costs
administration costs, collection costs and defaulting costs.
EFFECTS OF STRINGENT CREDIT POLICY
LESS SALES
As a stringent credit policy restricts the level of extension of credit to its customers it may result
in less sales because of the movement of the customers towards other competent firm in the
industry granting credit facilities on easy terms and standards.
LESS PROFIT
Decrease in the level of sales will ultimately result in the decrease in the level of profit also.
Decrease in cost of maintenance of receivables.

18
As in the case of stringent credit policy, the scope of credit creation is reduced, so there is an
overall reduction in the cost of their maintenance and the risk of bad debts are also reduced.
Thus a lenient credit policy and stringent credit policy approaches are both on two extremes.
Neither of them can therefore help in efficient receivables management. The trade off between
these two that is the optimum credit policy can give satisfactory results.
OPTIMUM CREDIT POLICY.
Having established the optimum credit policy and the terms of sales to be offered the firm must
evaluate the credit worthiness of individual credit applicants and consider the possibilities of bad
debts or scope of payments. In judging the credit worthiness of an applicant the three basic
factors – the three C‘s are character, capacity and collateral.
Character
It refers to the willingness of the customer to honour his obligations.
Capacity
Capacity refers to the customer to pay in time. It depends on the financial situation particularly
the working capital position and profitability of the debtor.
Collateral
Represents security offered by the firm in the form of mortgages.
The credit evaluation procedure involves three steps – obtaining information on the applicants,
analyzing this information to determine the applicants credit worthiness and making credit –
granting decision.

19
NEED FOR WORKING CAPITAL
Working capital gives an idea of the solvency of a concern. Its proper calculations provide to
the business, the right amount of cash to maintain regular outflow of in operation.
If proper cash balance is maintained the business can avail of the cash discount facilities
offered to it by suppliers. Besides, it enhances the image reputation of the concern.
The concern by maintaining an adequate amount of working capital is able to maintain a
sound bank credit, trade credit, and can escape insolvency, take advantage of cash discount
facility offered by suppliers by making prompt payment and bargain profitability in any
business transaction.
Besides, the basic objectives of financial management‘s object of maximizing shareholder‘s
wealth can be realized only when the concern continues to earn profits year after year.
Moreover, fixed assets cannot work without working capital.
ADEQUACY OF WORKING CAPITAL
Working capital should be adequate for the following reasons:
1. It protects a business from the adverse effects of shrinkage in the values of current assets.
2. It is possible to pay all the current obligation promptly and to take advantage of cash
discounts.
3. It ensures to greater extent the maintenance of a company‘s credit standing and provides for
such emergencies as strikes, floods, fire etc.
4. It permits the carrying of investments at a level that would enable a business to serve
satisfactorily the needs of its customers.
5. It enables a company to operate its business more efficiency because there is no delay in
obtaining materials etc., because of credit difficulties.
INADEQUACY OF WORKING CAPITAL
1. When working capital is adequate, a company faces following problems:
2. It stagnates growth becomes difficult for the firm to undertake profitable projects for no
availability of working capital funds.

20
3. Difficulty in implementing operation plan and achieving the firm‘s profit target.
4. Operating inefficiencies creep in which it becomes difficult even to meet day- to- day
commitments.
5. Fixed assets are not utilized efficiently thus the firm‘s profitability would deteriorate.
6. Paucity of working capital funds renders the firm unable to avail attractive credit
opportunities.
7. The firm loses its reputation when it is not in a portion to honor it short- term obligation
thereby lending to tight credit items.
DANGERS OF WORKING CAPITAL
Too much working capital is as dangerous as too little of it. Excessive working capital raises the
following problems:
1. Result in unnecessary accumulations of inventories. Thus, chance of inventories means
handling, waste, theft and losses increased.
2. Indication of defective credit policy and slack collection period. Consequently, it results in
higher incidents of bad debts, adversely affecting profits.
3. Makes the management complacent which degenerates in to managerial inefficiency.
4. The tendencies of accumulation inventories to make speculative profits, which tend to
liberalize the divided policy, make it difficult for the concern to cope in the future when it is
not able to make speculative profits.
5. A company may enjoy high liquidity and, at the same time, suffer from low profitability.
6. There may be an imbalance between liquidity and profitability.
7. A company may invest heavily in its fixed assets equipment‘s, which may not be justified by
actual sales and production.
EFFECTS OF INADEQUATE WORKING CAPITAL
1. A company cannot utilize its production capacity for the want of working capital.
2. The credit worthiness of the company is likely to be jeopardized because of lack of
liquidity.

21
3. Modernization of equipment and even routine and maintenance facilities may be difficult
to administer.
4. A company will not be able to pay dividend because of non-availability of funds.
5. A company may have to borrow funds at exorbitant rates of interest.
6. Its low liquidity may lead to low profitability in the same way as low profitability results
in low liquidity.
SOURCES OF WORKING CAPITAL FINANCE
The major sources, financing the working capital are:
1. Trade credit
2. Bank credit
3. Factoring of receivables
4. Commercial paper
SOME OF THE OTHER SOURCES OF THE WORKING CAPITAL
FINANCIAL ARE:
Long term financing:
Loans from financial institutions
Floating debentures
Accepting public deposits
Issue of shares
Raising funds by internal financing
Short – term financing
Short term bank loans
Commercial paper
Factoring of receivables
Spontaneous financing
Trade credit
Outstanding expenses

22
SCIENTIFIC APPROACH TO WORKING CAPITAL
In a simple study undertaken by A.K. Mukherjee of 20 central government undertakings
production non- homogenous products during the period 1947-1979, the following observation
were made.
Their overall investments represented 60% to 70% to the total current assets.
Considering the government policies regarding the size of inventory which was prescribed as
more that 6 months operational requirement the size of inventories was found to be much
more than the norms prescribed by the government.
Receivable represented 12% to 16% of the total current assets of the units. As a whole,
receivable position was not satisfactory.
Investments in cash and near- cash items represent 8% to 13% of the total current assets.
Overall investments in cash were found to be equal to one to 1 to 4 months operational which
showed poor liquidity.
WORKING CAPITAL CYCLE:
Cash flows in a cycle into, around and out of business. It is the business‘s life blood and every
manager‘s primary task is to help keep it flowing and to use the cash flow to generate profits. If a
business is operating profitability, then it should, in theory, generate cash surpluses.
If it doesn‘t generate surpluses, the business will eventually run out of cash and expire. Click
here for more information about the vital distinction between profit and cash flow.
There are two elements in the business cycle that absorb cash – inventory (stocks and work –in-
progress) and receivables (debtors owing you money). The main sources of cash are payables
your creditors) and equity and loans.

23
Each component of working capital (namely inventory, receivables and payables) has two
dimensions TIME and MONEY. When it comes to managing working capital – TIME IS
MONEY. If you can get money to move faster around the cycle (e.g. reduce inventory levels
relative to sales), the business will generate more cash or it will need to borrow less money to
fund working capital. As a consequence, you could reduce the cost of bank interest or you‘ll
have additional free money available to support additional sales growth or investment.
RATIOS
Ratio analysis is the process of determining and interpreting numerical relationships based on
financial statements. A ratio is a statistical yardstick that provides a measure of the relationship
between two variables or figures.
Ratio analysis is the process of examining and comparing financial information by calculating
meaningful financial statement figure percentages instead of comparing line items from each financial
statement.

24
RATIO ANALYSIS:
Ratio analysis is a widely used tool of financial analysis. It is defined as the systematic use of
ratios to interpret the financial statements so that the strengths and weaknesses of a firm as well
as its historical performance and current financial condition can be determined. The term ratio refers to
the numerical or quantitative relationship between two items/ variables.
This relationship can be expressed as:
1. Percentages, say, net profits are 25% of sales (assuming net profits of 25000 and sales of rest.
100000)
2. Fraction (net profit is one fourth of sales), and
3. Proportion of numbers (the relationship between net profits and sales is 1:4)
These alternative methods of expressing items which are related to each other are, for purpose of
financial analysis, referred to as ratio analysis. Ratios are relative figures reflecting the relationship
between variables. It concentrates on the inter-relationship among the figures appearing in the financial
statements. They enable analysis to draw conclusion regarding financial operations. Ratio analysis helps
us to analyze the past performance of the company and to make future projections.
MEANING OF RATIO ANALYSIS
This analysis is the most widely used tool of analysis. ―A ratio is a quotient of two numbers and is an
expression of relationship of two numbers and is an expression of relationship between figures or two
amounts.‖ It indicates a quantitative relationship which is used for a quantified judgment and decision
making or it can be defined as a ―the indicated quotient of two mathematical expressions‖ and as ―the
relationship between two or more things or figures, expressed mathematically, is known as financial
ratios.
25
TYPES OF RATIOS
List of Financial Ratios
Here is a list of various financial ratios. Take note that most of the ratios can also be expressed
in percentage by multiplying the decimal number by 100%. Each ratio is briefly described.
Profitability Ratios
1. Gross Profit Rate = Gross Profit ÷ Net Sales
Evaluates how much gross profit is generated from sales. Gross profit is equal to net sales (sales
minus sales returns, discounts, and allowances) minus cost of sales.
2. Return on Sales = Net Income ÷ Net Sales
Also known as "net profit margin" or "net profit rate", it measures the percentage of income
derived from dollar sales. Generally, the higher the ROS the better.
3. Return on Assets = Net Income ÷ Average Total Assets
In financial analysis, it is the measure of the return on investment. ROA is used in evaluating
management's efficiency in using assets to generate income.
4. Return on Stockholders' Equity = Net Income ÷ Average Stockholders' Equity
Measures the percentage of income derived for every dollar of owners' equity.
Liquidity Ratios
1. Current Ratio = Current Assets ÷ Current Liabilities
Evaluates the ability of a company to pay short-term obligations using current assets (cash,
marketable securities, current receivables, inventory, and prepayments).
2. Acid Test Ratio = Quick Assets ÷ Current Liabilities
Also known as "quick ratio", it measures the ability of a company to pay short-term obligations
using the more liquid types of current assets or "quick assets" (cash, marketable securities, and
current receivables).

26
3. Cash Ratio = ( Cash + Marketable Securities ) ÷ Current Liabilities
Measures the ability of a company to pay its current liabilities using cash and marketable
securities. Marketable securities are short-term debt instruments that are as good as cash.
4. Net Working Capital = Current Assets - Current Liabilities
Determines if a company can meet its current obligations with its current assets; and how much
excess or deficiency there is.
Management Efficiency Ratios
1. Receivable Turnover = Net Credit Sales ÷ Average Accounts Receivable
Measures the efficiency of extending credit and collecting the same. It indicates the average
number of times in a year a company collects its open accounts. A high ratio implies efficient
credit and collection process.
2. Days Sales Outstanding = 360 Days ÷ Receivable Turnover
Also known as "receivable turnover in days", "collection period". It measures the average
number of days it takes a company to collect a receivable. The shorter the DSO, the better. Take
note that some use 365 days instead of 360.
3. Inventory Turnover = Cost of Sales ÷ Average Inventory
Represents the number of times inventory is sold and replaced. Take note that some authors use
Sales in lieu of Cost of Sales in the above formula. A high ratio indicates that the company is
efficient in managing its inventories.
4. Days Inventory Outstanding = 360 Days ÷ Inventory Turnover
Also known as "inventory turnover in days". It represents the number of days inventory sits in
the warehouse. In other words, it measures the number of days from purchase of inventory to the
sale of the same. Like DSO, the shorter the DIO the better.
5. Accounts Payable Turnover = Net Credit Purchases ÷ Ave. Accounts Payable
Represents the number of times a company pays its accounts payable during a period. A low
ratio is favored because it is better to delay payments as much as possible so that the money can
be used for more productive purposes.
6. Days Payable Outstanding = 360 Days ÷ Accounts Payable Turnover

27
Also known as "accounts payable turnover in days", "payment period". It measures the average
number of days spent before paying obligations to suppliers. Unlike DSO and DIO, the longer
the DPO the better (as explained above).
7. Operating Cycle = Days Inventory Outstanding + Days Sales Outstanding
Measures the number of days a company makes 1 complete operating cycle, i.e. purchase
merchandise, sell them, and collect the amount due. A shorter operating cycle means that the
company generates sales and collects cash faster.
8. Cash Conversion Cycle = Operating Cycle - Days Payable Outstanding
CCC measures how fast a company converts cash into more cash. It represents the number of
days a company pays for purchases, sells them, and collects the amount due. Generally, like
operating cycle, the shorter the CCC the better.
9. Total Asset Turnover = Net Sales ÷ Average Total Assets
Measures overall efficiency of a company in generating sales using its assets. The formula is
similar to ROA, except that net sales is used instead of net income.
Leverage Ratios
1. Debt Ratio = Total Liabilities ÷ Total Assets
Measures the portion of company assets that is financed by debt (obligations to third parties).
Debt ratio can also be computed using the formula: 1 minus Equity Ratio.
2. Equity Ratio = Total Equity ÷ Total Assets
Determines the portion of total assets provided by equity (i.e. owners' contributions and the
company's accumulated profits). Equity ratio can also be computed using the formula: 1
minus Debt Ratio.
The reciprocal of equity ratio is known as equity multiplier, which is equal to total assets divided
by total equity.
3. Debt-Equity Ratio = Total Liabilities ÷ Total Equity
Evaluates the capital structure of a company. A D/E ratio of more than 1 implies that the
company is a leveraged firm; less than 1 implies that it is a conservative one.
4. Times Interest Earned = EBIT ÷ Interest Expense

28
Measures the number of times interest expense is converted to income, and if the company can
pay its interest expense using the profits generated. EBIT is earnings before interest and taxes.
Valuation and Growth Ratios
1. Earnings per Share = ( Net Income - Preferred Dividends ) ÷ Average Common Shares
Outstanding
EPS shows the rate of earnings per share of common stock. Preferred dividends is deducted from
net income to get the earnings available to common stockholders.
2. Price-Earnings Ratio = Market Price per Share ÷ Earnings per Share
Used to evaluate if a stock is over- or under-priced. A relatively low P/E ratio could indicate that
the company is under-priced. Conversely, investors expect high growth rate from companies
with high P/E ratio.
3. Dividend Pay-out Ratio = Dividend per Share ÷ Earnings per Share
Determines the portion of net income that is distributed to owners. Not all income is distributed
since a significant portion is retained for the next year's operations.
4. Dividend Yield Ratio = Dividend per Share ÷ Market Price per Share
Measures the percentage of return through dividends when compared to the price paid for the
stock. A high yield is attractive to investors who are after dividends rather than long-term capital
appreciation.
5. Book Value per Share = Common SHE ÷ Average Common Shares
Indicates the value of stock based on historical cost. The value of common shareholders' equity
in the books of the company is divided by the average common shares outstanding.
USES OF RATIO ANALYSIS:
The ratio analysis is one of the most powerful tools of financial analysis. It is used as a device to
analyze and interpret the financial health of enterprise. Thus, ratios have wide applications and
are of immense use today:

29
(a) Managerial Uses of Ratio Analysis:
1. Helps in decision-making:
Financial statements are prepared primarily for decision-making. But the information provided in
financial statements is not an end in itself and no meaningful conclusion can be drawn from these
statements alone. Ratio analysis helps in making decisions from the information provided in
these financial statements.
2. Helps in financial forecasting and planning:
Ratio Analysis is of much help in financial forecasting and planning. Planning is looking ahead
and the ratios calculated for a number of years work as a guide for the future. Meaningful
conclusions can be drawn for future from these ratios. Thus, ratio analysis helps in forecasting
and planning.
3. Helps in communicating:
The financial strength and weakness of a firm are communicated in a more easy and
understandable manner by the use of ratios. The information contained in the financial
statements is conveyed in a meaningful manner to the one for whom it is meant. Thus, ratios help
in communication and enhance the value of the financial statements.
4. Helps in co-ordination:
Ratios even help in co-ordination which is of utmost importance in effective business
management. Better communication of efficiency and weakness of an enterprise results in better
coordination in the enterprise.
5. Helps in Control:
Ratio analysis even helps in making effective control of the business. Standard ratios can be
based upon proforma financial statements and variances or deviations, if any, can be found by
comparing the actual with the standards so as to take a corrective action at the right time. The
weaknesses or otherwise, if any, come to the knowledge of the management which helps in
effective control of the business.
6. Other Uses:

30
These are so many other uses of the ratio analysis. It is an essential part of the budgetary control
and standard costing. Ratios are of immense importance in the analysis and interpretation of
financial statements as they bring the strength or weakness of a firm.
(b) Utility to Shareholders/Investors:
An investor in the company will like to assess the financial position of the concern where he is
going to invest. His first interest will be the security of his investment and then a return in the
form of dividend or interest. For the first purpose he will try to asses the value of fixed assets and
the loans raised against them. The investor will feel satisfied only if the concern has sufficient
amount of assets.
Long-term solvency ratios will help him in assessing financial position of the concern.
Profitability ratios, on the other hand, will be useful to determine profitability position. Ratio
analysis will be useful to the investor in making up his mind whether present financial position
of the concern warrants further investment or not.
(c) Utility to Creditors:
The creditors or suppliers extend short-term credit to the concern. They are interested to know
whether financial position of the concern warrants their payments at a specified time or not. The
concern pays short- term creditor, out of its current assets. If the current assets are quite
sufficient to meet current liabilities then the creditor will not hesitate in extending credit
facilities. Current and acid-test ratios will give an idea about the current financial position of the
concern.
(d) Utility to Employees:
The employees are also interested in the financial position of the concern especially profitability.
Their wage increases and amount of fringe benefits are related to the volume of profits earned by
the concern. The employees make use of information available in financial statements. Various
profitability ratios relating to gross profit, operating profit, net profit, etc. enable employees to
put forward their viewpoint for the increase of wages and other benefits.

31
(e) Utility to Government:
Government is interested to know the overall strength of the industry. Various financial
statements published by industrial units are used to calculate ratios for determining short-term,
long-term and overall financial position of the concerns. Profitability indexes can also be
prepared with the help of ratios. Government may base its future policies on the basis of
industrial information available from various units. The ratios may be used as indicators of
overall financial strength of public as well as private sector, in the absence of the reliable
economic information, governmental plans and policies may not prove successful.
(f) Tax Audit Requirements:
Section 44 AB was inserted in the Income Tax Act by the Finance Act, 1984. Under this section
every assesse engaged in any business and having turnover or gross receipts exceeding Rs. 40
lakh is required to get the accounts audited by a chartered accountant and submit the tax audit
report before the due date for filing the return of income under Section 139 (1). In case of a
professional, a similar report is required if the gross receipts exceed Rs 10 lakh.
Clause 32 of the Income Tax Act requires that the following accounting ratios should be given:
(i) Gross Profit/Turnover
(ii) Net Profit/Turnover
(iii) Stock-in-trade/Turnover
(iv) Material Consumed/Finished Goods Produced.
Further, it is advisable to compare the accounting ratios for the year under consideration with the
accounting ratios for the earlier two years so that the auditor can make necessary enquiries, if
there is any major variation in the accounting ratios.

32
LIMITATIONS OF RATIO ANALYSIS:
The ratio analysis is one of the most powerful tools of financial management.Though ratios are
simple to calculate and easy to understand, they suffer from some serious limitations:
1. Limited Use of a Single Ratio:
A single ratio, usually, does not convey much of a sense. To make a better interpretation a
number of ratios have to be calculated which is likely to confuse the analyst than help him in
making any meaningful conclusion.
2. Lack of Adequate Standards:
There are no well accepted standards or rules of thumb for all ratios which can be accepted as
norms. It renders interpretation of the ratios difficult.
3. Inherent Limitations of Accounting:
Like financial statements, ratios also suffer from the inherent weakness of accounting records
such as their historical nature. Ratios of the past are not necessarily true indicators of the future.
4. Change of Accounting Procedure:
Change in accounting procedure by a firm often makes ratio analysis misleading, e.g., a change
in the valuation of methods of inventories, from FIFO to LIFO increases the cost of sales and
reduces considerably the value of closing stocks which makes stock turnover ratio to be lucrative
and an unfavorable gross profit ratio.
5. Window Dressing:
Financial statements can easily be window dressed to present a better picture of its financial and
profitability position to outsiders. Hence, one has to be very careful in making a decision from
ratios calculated from such financial statements. But it may be very difficult for an outsider to
know about the window dressing made by a firm.
6. Personal Bias:
Ratios are only means of financial analysis and not an end in itself. Ratios have to be interpreted
and different people may interpret the same ratio in different ways.

33
7. Un-comparable:
Not only industries differ in their nature but also the firms of the similar business widely differ in
their size and accounting procedures, etc. It makes comparison of ratios difficult and misleading.
Moreover, comparisons are made difficult due to differences in definitions of various financial
terms used in the ratio analysis.
8. Absolute Figures Distortive:
Ratios devoid of absolute figures may prove distortive as ratio analysis is primarily a quantitative
analysis and not a qualitative analysis.
9. Price Level Changes:
While making ratio analysis, no consideration is made to the changes in price levels and this
makes the interpretation of ratios invalid.
10. Ratios no Substitutes:
Ratio analysis is merely a tool of financial statements. Hence, ratios become useless if separated
from the statements from which they are computed.
11. Clues not Conclusions:
Ratios provide only clues to analysts and not final conclusions. These ratios have to be
interpreted by these experts and there are no standard rules for interpretation.

34
CHAPTER- 2
INDUSTRY PROFILE
TRAVEL AND TOURISM INDUSTRY
Travel and tourism is the largest service industry in India. It provides heritage, cultural, medical,
business and sports tourism. The main objective of this sector is to develop and promote tourism,
maintain competitiveness of India as tourist destination and improve and expand existing tourism
products to ensure employment generation and economic growth. In this section, we provide
information about various tourist destinations, modes of travel, accommodation and approved
travel agents.
The Indian tourism industry has emerged as one of the key driver of growth among the services
sector in India. Tourism in India has significant potential considering the rich cultural and
historical heritage, variety in ecology, terrains and places of natural beauty spread across the
country. Tourism is also a potentially large employment generator besides being a significant
source of foreign exchange for the country. India's Foreign Exchange Earnings (FEEs) increased
by 17.6 per cent year-on-year in January 2018 over January 2017.
Market Size
India is the most digitally-advanced traveller nation in terms of digital tools being used for
planning, booking and experiencing a journey@@, India‘s rising middle class and increasing
disposable incomes has continued to support the growth of domestic and outbound tourism.
Domestic Tourist Visits (DTVs) to the States/Union Territories (UTs) grew by 15.5 per cent y-o-
y to 1.65 billion (provisional) during 2016 with the top 10 States/UTs contributing about 84.2 per
cent to the total number of DTVs, as per Ministry of Tourism.
Foreign Tourist Arrivals (FTAs) in India increased 8.4 per cent year-on-year to 1.06 million and
the number of FTAs on e-tourist visa increased 58.5 per cent to 2.40 lakh foreign tourist as per
Ministry of Tourism, Government of India.

35
India is expected to move up five spots to be ranked among the top five business travel market
globally by 2030, as business travel spending in the country is expected to treble until 2030 from
US$ 30 billion in 2015.#
International hotel chains will likely increase their expansion and investment plans in India, and
are expected to account for 50 per cent share in the Indian hospitality industry by 2022, from the
current 44 per cent.
Investments
The tourism and hospitality sector is among the top 10 sectors in India to attract the highest
Foreign Direct Investment (FDI). During the period April 2000-December 2017, the hotel and
tourism sector attracted around US$ 10.90 billion of FDI, according to the data released by
Department of Industrial Policy and Promotion (DIPP).
Government Initiatives
The Indian government has realised the country‘s potential in the tourism industry and has taken
several steps to make India a global tourism hub.
Some of the major initiatives planned by the Government of India to give a boost to the tourism
and hospitality sector of India are as follows:
The Government of India signed a loan agreement for US$ 40 million with the World
Bank for the Uttar Pradesh Pro-Poor Tourism Development Project aimed at developing
tourism facilities in the state.
Under Budget 2018-19, the government allotted Rs 1,250 crore (US$193.08 million) for
Integrated development of tourist circuits under Swadesh Darshan and Pilgrimage
Rejuvenation and Spiritual Augmentation Drive (PRASAD).
India is on a high growth path and with tourism-friendly policies initiated by the
government, we are optimistic that this will continue in the upcoming budget coupled
with sustained delivery on ground. The tourism industry is one of the largest and most
dynamic sectors globally, accounting for more than a third of the total service trade. The
UNWTO also expects the sector to provide 296 million jobs globally by 2019. Recent
tourism statistics reveal that both domestic and foreign tourism are on a robust growth

36
path. India's rising middle class and increasing disposable incomes have also contributed
to this continued growth in domestic and outbound tourism.
This is reiterated in the data shared by the Ministry of Tourism that from 2010 to 2015,
we saw an 8.7% increase in total outbound trips to 19.9 million in 2015. The inbound
tourist volume also grew at a Compound Annual Growth Rate (CAGR) of 6.8% during
2010-15.
The tourism industry of India is economically important and grows rapidly. The World
Travel & Tourism Council calculated that tourism generated INR6.4 trillion or 6.6% of
the nation‘s GDP in 2012. It supported 39.5 million jobs, 7.7% of its total employment.
The sector is predicted to grow at an average annual rate of 7.9% from 2013 to 2023.
This gives India the third rank among countries with the fastest growing tourism
industries over the next decade. India has a large medical tourism sector which is
expected to grow at an estimated rate of 30% annually to reach about 95 billion by 2015.
This paper discusses how India is emerging as a popular tourist destination in the world,
driven by the focus on innovation and creating value for tourists. It aimed change the
attitude and behavior toward foreign tourists by stressing on the aspect that a guest has
been held in high esteem in India since ancient times. It also examines the impact of
India‘s economic growth on tourism, Contributors to economic growth, Role of Tourism
industry in India‘s GDP, Foreign versus Domestic Tourists. The paper also explores that
there has been a tremendous growth in tourism in India because of the policies of the
government and support from all levels. Tourism is considered to be an economic
bonanza. It is a multi-segment industry. While gauging the positive economic effects of
tourism, we study its contribution to the generation of national income, expansion of
employment opportunities, rising of tax revenue, generation of foreign exchange .and
transformation of regional economy. Travel & Tourism is an important economic activity
in most countries around the world. As well as its direct economic impact, the industry
has significant indirect and induced impacts. Indian Tourism offers a potpourri of
different cultures, traditions, festivals, and places of interest. There are a lot of options for
the tourists. India is a country with rich cultural and traditional diversity. This aspect is

37
even reflected in its tourism. The different parts of the country offer wide variety of
interesting places to visit.
Keywords
Employment opportunities; Foreign versus domestic tourists; GDP; Tourism industry
Introduction
Throughout the world, tourism brings money to cities and countries. Tourism also
provides jobs for the local residents, further benefiting the destination. India has realized
the profits available from this sector. Thanks to its growing economy and promoting itself
as a culturally rich and diverse nation, India‘s tourism industry now brings billions of
dollars into the economy each year. The growth in the tourism industry is due to the rise
in the arrival of more and more foreign tourists and the increase in the number of
domestic tourists.
Words are few to explain the beauty of India. India is a country with diversified culture
and traditions. The natural beauty of India, festivals, dresses, heritage sites of India are
very popular among tourists. These things fascinate travelers to come here. India has so
many scenic blesses places like Kerala, Darjeeling, Goa, Kashmir, Shimla(I am just
having few names) and Manali. These places are very popular. These places are prime
attraction of travelers from across the world .There are also so many other places worth
visiting ., like Delhi Kutub Minar /Agra Tajmahal/Hyderabad Charminar and Salarjung
museum /Chennai a city of fine arts / Bangalore., Known as the Garden City for its lush
landscape, lakes and temperate climate, it aptly represents India‘s marriage of past and
present,/ kerala known as god‘s own country/ Kolkata was arguably second only to
London in administrative importance in the British Empire. Home of luminaries like
Rabindranath Tagore, Amartya Sen, Mother Teresa, and Satyajit Ray, the city is often
referred to as the ―cultural capital of India‖ etc. The Government of India has established
the Ministry of Tourism in order to boost Tourism in India. The Ministry of Tourism has
undertaken many projects to showcase India as a perfect Tourist destination and create a
visitor-friendly image of the country. The major steps taken by the Government were the
Atithi Devo Bhavah Campaign which gave a widespread message of ―honour your Guest
as he is always equivalent to God‖ and the Incredible India Campaign which was
incredibly successful in creating a colorful and a gorgeous image of our country as a

38
perfect holiday destination. Dr. K. Chiranjeevi, Hon‘ble Minister for State for Tourism
(IC) launched the Ministry of Tourism‘s Incredible India 2013 Calendar. The attractive
Calendar is based on the theme ―Find What You Seek‖ as part of Phase II of the
Incredible India campaign, which was launched during World [1].
Travel Mart (WTM), London 2012. This was mainly because of extensive Publicity
Campaigns in which the IT industry played a remarkable role.
Methodology
The present study is based on the secondary data published by various agencies and
organizations. The present study makes use of data and information provided by,
UNWTO, Ministry of Tourism, Ministry of Statistics and Programme Implementation,
Newspapers, Magazines, Books, Economic journals and Internet etc.
Initiatives by the government for tourism promotion
Hunar se rozgar’ programme: A special initiative was launched in 200910 for the
create ion of employable skills among youth belonging to economically weaker sections
of the society in the age group of 18- 25 years (upper age limit raised to 28 years in
November, 2010) with the basic objective to reduce the skill gap affecting the hospitality
and tourism sector and to ensure the spread of economic benefit of tourism to the poor.
The programme offers short duration courses of 6 to 8 weeks which are fully funded by
the Ministry of Tourism
Visa on arrival: Considering the importance of Visa facilities in enhancing tourist
inflow, the facility of „Long Term Tourist Visas‟ of five years duration with multiple
entries, carrying a stipulation of 90 days for each visit, has been introduced on a pilot
basis f or the nationals of the 18 selected countries. The findings of an evaluation study
conducted by this
Ministry has reinforced the belief that the presence of the facility of ―Visa on Arrival‖
(VoA) significantly influences the tourists'' travel plans to any country. During 2012, a
total number of 16,084 VoAs (Visa on Arrival) were issued as compared to 12,761 VoAs
during the corresponding period of 2011, thereby showing a growth of 26%. Efforts are
on to extend the VoA facility for the nationals of more countries

39
Types of tourism in india
India is a country which witnesses a lot of diversity pertaining to its ecology, mythology,
history, its geoCHARTical diversity in terms of mountains, planes and plateaus and also
the medicinal diversity teaching us the Science of Life (Ayurveda). India showcases a
variety of tourism options which includes Ecological Tourism, Pilgrimage Tourism,
Historical Tourism, Adventure Tourism, Medical Tourism and an upcoming Ayurveda
Tourism. So Tourism in India could be broadly classified on the basis of above
mentioned categories
Leisure tourism: Leisure time can be defined as ―free time‖, not doing any work. It is
that time to do things that you normally have no time for in your daily life. Leisure
tourism includes a holiday with the following:
Relaxation: Sleep, relax, reading, walk on the beach, taking a scenic drive o
Sport activities: hiking, swimming, surfing, running
Visit places of interest and local attractions Visiting friends and relatives
Shopping for goods that will be used by the tourist.
Business tourism: Business tourism can be defined as ―travel for the purpose of
business‖.
Business Tourism can be divided into three sections:-
(a) Trading for goods to be resold on a wholesale basis.
(b) Conduct business transactionseg. visiting a client, contract negotiations.
(c) Attending a conference, exhibition or event associated with their business.
Ecological tourism: The rich diversity in the flora and fauna with a blessing of the
beautiful natural attractions has encouraged Ecological Tourism in India. The forests
cover on the Andaman and Nicobar islands, Orissa, Meghalaya and the Malabar
Coast;the Kaziranga and Jim Corbette wildlife sanctuaries;the mountain ranges in North
India and the Hill Stations such as Shimla, Kulu, Manali, Ooty;the Paradise on Earth,

40
Kashmir, the beautiful beaches at Goa and the backwaters of Kerala and much more is
nothing but a feast for all nature lovers
Pilgrimage tourism: India has a very strong mythological background and is also known
as the LAND OF GODS AND GODDESS. India being the most culturally developed
country and the birthplace of many saints, poets and philosophers has marked growth in
Pilgrimage Tourism since ancient times itself. Kedarnath, Badrinath, Amarnath, the
Golden Temple at Amritsar, Dwarka, Dargahs and Masjids at Delhi and Ajmer, churches
and temples at Goa are some of the common tourists‘ attractions pertaining to Pilgrimage
tourism
Historical tourism: India is a land which gave birth to many legendary rulers and
warriors creating a glorious historical background. Every city or place in India has a story
to tell about its history. The common tourists‘ attractions for the same include the Taj
Mahal at Agra, the beautifully carved Ajanta Ellora and Khajuraho caves, the forts at
Delhi, Rajasthan and Maharashtra, one of the oldest and historical cities of India
―Madurai‖ and many more.
Medical tourism: Medical Tourism is an upcoming kind of tourism in India. Due to low
cost and efficient medication facilities more number of people all over the world
considers India to be a better option for medication purpose. The later part of the paper
studies Medical Tourism.
Ayurveda and yoga tourism: Ayurveda may be regarded as the ―Science of Life‖ which
was developed long ago in 600 BC. India has witnessed an overall growth in tourist
arrivals due to the upcoming; Ayurveda Tourism. The state of Kerala in South India is the
popular destination of Ayurveda Tourism. The main focus of Indian Yoga is nothing but
simple ‗yogasanas‘and meditation which rejuvenates one‘s mind, body and soul. There
are many Ashrams in India encouraging Yoga Tourism. The mountain ranges of the
Himalayas, Rishikesh, Kedarnath, Gangotri of northern India are some of the places
where one can get eternal peace and satisfy their spiritual quest and are the prefect
destinations for Yoga Tourism.
Adventure tourism: Due to its geoCHARTical diversity India is one of the finest places
for Adventure Tourism. Mountaineering, skiing, trekking in the ranges of Himalayas,
Camel safaris in Rajasthan, River rafting in the Ganges near Rishikesh, Rock climbing,

41
Wind rafting and much more of an adventure for every adventure lover is bestowed by
India upon its Tourists.
Sports tourism: Sports tourism refers to international travel either for viewing or
participating in a sporting event. Examples include international sporting events such as
the Olympics, world cup (soccer, rugby, and cricket), tennis, golf and Formula 1 Grand
Prix.
Wildlife tourism: Wildlife tourism is the observation of wild (non-domestic) animals in
their natural environment or in captivity. It includes activities such as photoCHARTy,
viewing and feeding of animals. This form of tourism offer tourists customized tour
packages and safaris and is closely associated with eco-tourism and sustainable-tourism.
Other minor forms of tourism include Slum tourism, Luxury tourism, Agritourism, Geo-
tourism, culinary tourism and many more. Tourism is also a profitable industry for the
following sectors: accommodation venues, tour guides, recreation, attractions, events and
conferences, food and beverage, transportation and the travel trade.
Tourist attractions in india
India is a country known for its lavish treatment to all visitors, no matter where they
come from. Its visitor-friendly traditions, varied life styles and cultural heritage and
colorful fairs and festivals held abiding attractions for the tourists. The other attractions
include beautiful beaches, forests and wild life and landscapes for eco-tourism; snow,
river and mountain peaks for adventure tourism; technological parks and science
museums for science tourism; centers of pilgrimage for spiritual tourism; heritage, trains
and hotels for heritage tourism. Yoga, Ayurveda and natural health resorts and hill
stations also attract tourists.
The Indian handicrafts particularly, jewelry, carpets, leather goods, ivory and brass work
are the main shopping items of foreign tourists. It is estimated through survey that nearly
forty per cent of the tourist expenditure on shopping is spent on such items.

42
Despite the economic slowdown, medical tourism in India is the fastest growing segment
of tourism industry, according to the market research report ―Booming Medical Tourism
in India‖.
The report adds that India offers a great potential in the medical tourism industry. Factors
such as low cost, scale and range of treatments provided in the country add to its
attractiveness as a medical tourism destination.
Domestic tourism flows in india
Domestic tourism continued to grow at a double-digit rate in 2012. The growth was
driven by rising numbers of people travelling across the country for pilgrimage, wildlife,
sightseeing, photoCHARTy and adventure sports holidays. Figure 1shows the total
contribution of travel and tourism to employment. Some of the other factors also include
wider economic growth of the country, rising disposable incomes, formal employment
with leave entitlement etc. Domestic tourism also witnessed growth due to increased
marketing efforts through television commercials, tour operators and agents of various
states highlighting the best tourism experiences on offer. Domestic tourism is expected to
grow at a CAGR of 11% in the forecast period in terms of number of trips. The number
of holiday takers overall is expected to increase at a CAGR of 5%, boosting domestic
tourism. Additionally, disposable incomes will rise, enabling locals to take more trips
annually. Furthermore, the weakness of the Indian rupee against the dollar and other
currencies will encourage locals to take trips within the country, where their purchasing
power will be stronger. (Over 30% Indian tourists are Gujarat‘s: Tourism ministry)
Gujarat comes in ninth place when it comes to attracting tourists from other Indian states
and it is nowhere among the top 10 with regards to foreign tourist visits. However, the
state takes the top slot when it comes to travelling outside, be it within the country or to
international locations, followed closely by Maharashtra. Both, Gujarat and Maharashtra
are front runners for offering tourists to domestic and international circuits. Of the overall
tourists from India visiting domestic as well as international destinations, nearly 30-40
per cent are from Gujarat. Considering this penchant of Guajarati‘s for travel, Gujarat

43
Chief Minister Narendra Modi had said during his visit to West Bengal, ―Gujarat was
never a tourist destination, but Guajarati‘s are the best tourists.‖ Apart from Gujarat and
Maharashtra, Delhi and West Bengal send the highest number of tourists to various
outside destinations. According to tourism ministry data, the number of outbound tourists
from India to international destinations increased by 6.7 per cent to 14.92 million in 2012
over the previous year. The ministry data also states that the total number of domestic
tourist visits in 2012 was 1.036 billion, that is to say over 1.036 billion domestic tourists
travelled to different parts of the country during 2012, up from 850 million travelers in
2011
Travel and tourism’s growth
Tourism is not only a growth engine but also an employment generator. According to the
Economic Survey 2011-12, the sector has the capacity to create large scale employment
both direct and indirect, for diverse sections in society, from the most specialized to
unskilled workforce. It provides 6-7 per cent of the world'' s total jobs directly and
millions more indirectly through the multiplier effect as per the UN''s World Tourism
Organization (UNWTO).
Completely skipping India because of so many incidents of rape and molestation that
came to light last year,‖ he said. The travel companies were hoping that because of the
rupee depreciation, inbound tourism would get a major boost in 2013. There is
Plummeting growth of Foreign Tourist Travels. However, as challenges persist, most are
now pinning their hopes on 2014. ―In the last one year, inbound tourism has not grown to
our expectations due to sluggish economic climate in source markets. We believe this
will change and Indian tour operators will reap the benefits of this revival. Another factor
that will help India is the depreciation of the rupee by 12 per cent, which will boost
inbound tourism in the 2014-15 seasons,‖ said Arup Sen, director (special projects), Cox
& Kings. There is a decreasing trend of GDP as compared to2010-11.Foreign exchange
earnings from tourism in 2013 grew 2.2 per cent to $18.1 billion, compared to a growth
of seven percent in the previous years.

44
Travel and tourism’s contribution to GDP
Travel and tourism play an important role in India‘s economy; compared with other
nations, India ranks 14th in the world in terms of its tourism sector‘s contribution to the
GDP. At time of publication, the World Travel and Tourism Council predict India will
sustain the fifth largest amount of growth in the tourism sector of any country. Tourism
can offer direct and indirect aid to a nation‘s economy. Direct benefits include economic
support for hotels, retail shops, transportation services, entertainment venues and
attractions, while indirect benefits include government spending on related infrastructure,
plus the domestic spending of Indians employed in the tourism sector. The share of
Travel & Tourism spending or employment in the equivalent economy-wide concept in
the published national income accounts or labour market statistics.
Table 1 shows Travel & Tourism Total Contribution to GDP in 2014.
India - Travel & Tourism Total
Contribution to GDP - 6.8(% share)in 2014
YEAR Value Change,%
2014 6.8 3.03%
2013 6.6 1.54%
2012 6.5 -1.52%
2011 6.6 1.54%
2010 6.5 -2.99%
2009 6.7 -6.94%
2008 7.2 0.00%
2007 7.2 1.41%
2006 7.1 1.43%

45
2005 7 -19.54%
2004 8.7 -1.14%
2003 8.8
Table 1: India - Travel & Tourism Total Contribution to GDP - 6.8(% share) in 2014.
In India, Visitor exports are compared with exports of all goods and services Domestic Travel &
Tourism spending is compared with GDP Government individual Travel & Tourism spending is
compared with total government spending Internal Travel & Tourism consumption is compared
with total internal consumption (i.e. total domestic spending plus total export). Table 2 shows
Travel & Tourism Total Contribution to GDP in local currency units in 2014 in India. Leisure
Travel & Tourism contribution to GDP is compared with total GDP Business Travel & Tourism
contribution to GDP is compared with total GDP Travel & Tourism capital investment spending
is compared with all fixed investment spending
YEAR Value
2014 8,488.30
2013 7,416.10
2012 6,385.10
2011 5,686.40
2010 4,768.50
2009 4,130.70
2008 4,014.10
2007 3,475.70
2006 2,953.60

46
2005 2,499.60
2004 2,738.80
2003 2,429.10
Table 2: India - Travel & Tourism Total Contribution to GDP – LCU (local currency units)
8,488.3 bn in 2014.
Impacts of tourism on the economy
Tourism can bring many economic and social benefits, particularly in rural areas and developing
countries, but mass tourism is also associated with negative effects. Tourism can only be
sustainable if it is carefully managed so that potential negative effects on the host community
and the environment are not permitted to outweigh the financial benefits. Tourism industry in
India has several positive and negative impacts on the economy and society. These impacts are
highlighted below.
Positive impacts
1. Generating Income and Employment: Tourism in India has emerged as an instrument
of income and employment generation, poverty alleviation and sustainable human
development. It contributes 6.23% to the national GDP and 8.78% of the total
employment in India. Almost 20 million people are now working in the India‘s tourism
industry.
2. Source of Foreign Exchange Earnings: Tourism is an important source of foreign
exchange earnings in India. This has favorable impact on the balance of payment of the
country. The tourism industry in India generated about US$100 billion in 2008 and that is
expected to increase to US$275.5 billion by 2018 at a 9.4% annual growth rate.
3. Preservation of National Heritage and Environment: Tourism helps preserve several
places which are of historical importance by declaring them as heritage sites. For

47
instance, the Taj Mahal, the Qutab Minar, Ajanta and Ellora temples, etc. would have
been decayed and destroyed had it not been for the efforts taken by Tourism Department
to preserve them. Likewise, tourism also helps in conserving the natural habitats of many
endangered species.
4. Developing Infrastructure: Tourism tends to encourage the development of multiple-
use infrastructure that benefits the host community, including various means of
transports, health care facilities, and sports centers, in addition to the hotels and high-end
restaurants that cater to foreign visitors. The development of infrastructure has in turn
induced the development of other directly productive activities.
5. Promoting Peace and Stability: Honey and Gilpin suggests that the tourism industry
can also help promote peace and stability in developing country like India by providing
jobs, generating income, diversifying the economy, protecting the environment, and
promoting cross-cultural awareness. However, key challenges like adoption of regulatory
frameworks, mechanisms to reduce crime and corruption, etc, must be addressed if
peace-enhancing benefits from this industry are to be realized.
Negative impacts
1. Undesirable Social and Cultural Change: Tourism sometimes led to the destruction of
the social fabric of a community. The more tourists coming into a place, the more the
perceived risk of that place losing its identity. A good example is Goa. From the late 60‘s
to the early 80‘s when the Hippy culture was at its height, Goa was a haven for such
hippies. Here they came in thousands and changed the whole culture of the state leading
to a rise in the use of drugs, prostitution and human trafficking. This had a ripple effect
on the country.
2. Increase Tension and Hostility: Tourism can increase tension, hostility, and suspicion
between the tourists and the local communities when there is no respect and
understanding for each other‘s culture and way of life. This may further lead to violence
and other crimes committed against the tourists. The recent crime committed against
Russian tourist in Goa is a case in point.
3. Creating a Sense of Antipathy: Tourism brought little benefit to the local community.
In most all-inclusive package tours more than 80% of travelers‘ fees go to the airlines,

48
hotels and other international companies, not to local businessmen and workers.
Moreover, large hotel chain restaurants often import food to satisfy foreign visitors and
rarely employ local staff for senior management positions, preventing local farmers and
workers from reaping the benefit of their presence. This has often created a sense of
antipathy towards the tourists and the government.
4. Adverse Effects on Environment and Ecology: One of the most important adverse
effects of tourism on the environment is increased pressure on the carrying capacity of
the ecosystem in each tourist locality. Increased transport and construction activities led
to large scale deforestation and destabilization of natural landforms, while increased
tourist flow led to increase in solid waste dumping as well as depletion of water and fuel
resources. Flow of tourists to ecologically sensitive areas resulted in destruction of rare
and endangered species due to trampling, killing, disturbance of breeding habitats. Noise
pollution from vehicles and public address systems, water pollution, vehicular emissions,
untreated sewage, etc. also have direct effects on bio-diversity, ambient environment and
general profile of tourist spots.
The contribution of the travel and tourism industry is expected to grow by 7.9% per
annum to ₹6115.5 billion (2.4% of GDP) by 2026.
According to the World Travel & Tourism Council (WTTC), the contribution of the
travel and tourism industry is expected to grow by 7.9% per annum to ₹ 6115.5 billion
(2.4% of GDP) by 2026. Keeping this in mind, we are hopeful that the upcoming Union
budget will provide a vital and much-needed boost to the sector.
Given the significant value contribution by the travel and tourism industry, a long-
pending expectation is that the sector be given industry, export and infrastructure status.
A key initiative that changed India's economic outlook in late 2016 was the move to
demonetisation, which impacted the travel sector as well. While organised players in the
sector, who were offering cashless modes of payment, have been able to cope with the
change, the larger issue is that of promoting digital payment solutions. We look forward
to the budget incorporating measures to help boost cashless transactions, in turn
facilitating seamless and easy online travel bookings and benefits for consumers.

49
Critical elements of infrastructure, enhanced connectivity and uniform tax reforms will
create significant impact in enhancing leisure, business and MICE Travel, and all
categories of specialised tourism in and out of the country.
The current challenges include high taxes on the sector, tourist safety (especially for
women travellers) and sanitation—budget 2017-18 offers scope to bridge these gaps.
Reinforcing the "Incredible India" brand through the creation of new tourist circuits, key
infrastructure and rail-roadway connectivity via a hub and spoke model would be mission
critical. This must be coupled with effective marketing communication to reiterate the
position of India as a top leisure and MICE destination.
With data highlighting the strong potential of women travellers—domestic as well as
inbound—there is an urgent need to look into their concerns of safety and security. This
should be a priority if India is to leverage this segment.
With the rapid growth of experiential travel, trends like homestays and village stays
would not only extend the market and include lesser known destinations, but also drive
volume growth. A valuable outcome is also the opportunity to simultaneously create
employment for middle/rural India and thus promote skill development. Budget outlay to
such innovative schemes would serve to further catalyse the tourism sector.
The current challenges include high taxes on the sector, tourist safety (especially for
women travellers) and sanitation—budget 2017-18 offers scope to bridge these gaps.
The Ministry of Tourism has highlighted an increase in Foreign Tourist Arrivals (FTAs)
by 13.5% year-on-year in September 2016, with Foreign Exchange Earnings (FEEs) from
tourism increasing 1491% year-on-year in August 2016—an extension of ETA/ e-visas
will serve well to add further momentum to this high potential inbound growth story.
This year the Railway Budget will be presented alongside the Union Budget and we are
hoping for the government to announce developments in terms of security and
modernisation and ensure a positive outlook for rail travel. We look forward to the
introduction of high-speed trains on popular routes in order to reduce travel time. The
development of airports in tier 1 & 2 cities will also benefit both the aviation industry and
travellers. We also anticipate a lowered GST on travel-related services and the
government investing heavily in the development of travel infrastructure.

50
Given that we live in an age of strong competition from global destinations, tax rates
should be on par with global standards to ensure a level playing field and to inject
viability into the sector. The standardisation/uniformity of taxes across states is also vital
in this context.
Indian tourism and allied industries have evolved as key drivers of development,
employment and contributors to the GDP. Tourism in India has significant and yet
underleveraged potential considering the country's rich historical, cultural, social and
geoCHARTical inheritance
I am hopeful that in the Union budget 2017, the government will work towards gaining
momentum in these areas and achieve its projected growth path in the coming year.
Road Ahead
India‘s travel and tourism industry has huge growth potential. The tourism industry is also
looking forward to the expansion of E-visa scheme which is expected to double the tourist inflow
to India. India's travel and tourism industry has the potential to expand by 2.5 per cent on the
back of higher budgetary allocation and low cost healthcare facility, according to a joint study
conducted by Assocham and Yes Bank.
Exchange Rate Used: INR 1 = US$ 0.015 as of January 4, 2018.
India is a large market for travel and tourism. It offers a diverse portfolio of niche tourism
products - cruises, adventure, medical, wellness, sports, MICE, eco-tourism, film, rural and
religious tourism. India has been recognised as a destination for spiritual tourism for domestic
and international tourists.
Total contribution by travel and tourism sector to India‘s GDP is expected to increase from US$
136.3 billion in 2015 to US$ 275.2 billion in 2025. India ranked third among 184 countries in
terms of travel & tourism‘s total contribution to GDP in 2016. Travel and tourism is the third
largest foreign exchange earner for India. Foreign exchange earnings (FEEs) in February 2018
were US$ 2.706 billion. The number of Foreign Tourist Arrivals (FTAs) in February 2018 was
1.05 million. A sum of US$ 27.693 billion was earned under foreign exchange through tourism

51
during calendar year 2017. The employment in the sector is expected to rise to 46.42 million by
2026. During calendar year 2017, 10.177 million foreign tourists have arrived in India. The
Government of India has set a target of 20 million foreign tourist arrivals (FTAs) by 2020 and
double the foreign exchange earnings as well.
The launch of several branding and marketing initiatives by the Government of India such as
‗Incredible India!‘ and ‗Athiti Devo Bhava‘ has provided a focused impetus to growth. The
Indian government has also released a fresh category of visa - the medical visa or M visa, to
encourage medical tourism in the country. Incredible India 2.0 campaign was launched in
September 2017. The Government of India is working to achieve 1 per cent share in world's
international tourist arrivals by 2020 and 2 per cent share by 2025.
The Government has also been making serious efforts to boost investments in tourism sector. In
the hotel and tourism sector, 100 per cent FDI is allowed through the automatic route. A five-
year tax holiday has been offered for 2, 3 and 4 star category hotels located around UNESCO
World Heritage sites (except Delhi and Mumbai). Total FDI received by Indian hotel & tourism
sector was US$ 10.90 billion between April 2000 and December 2017.India is a large market for
travel and tourism. It offers a diverse portfolio of niche tourism products - cruises, adventure,
medical, wellness, sports, MICE, eco-tourism, film, rural and religious tourism. India has been
recognized as a destination for spiritual tourism for domestic and international tourists.
o Tourism in India accounts for 9.6 per cent of the GDP and is the 3rd largest foreign
exchange earner for the country
o The tourism and hospitality sector‘s direct contribution to GDP in 2016, was US$ 71.53
billion
o During 2006–17E, direct contribution of tourism and hospitality to GDP is expected to
register a CAGR of 14.05 per cent
o The direct contribution of travel and tourism to GDP is expected to reach US$ 147.96
billion by 2027

52

53
COMPANY PROFILE
ANUGRAHA TOURS AND TRAVELS
Anugraha Tours and Travels is one of the leading tours operators based in Bangalore.The
company was established in the year 1997 by two young and experienced entrepreneurs -
Gautham .M and K. R. Sachidananda. The Bangalore office is centrally located, and is
easily accessible from Railway Station and Bus Stand. They provide transports ticketing
services. They provide luxury comfortable vehicles on contract or rental basis for a reasonable
rate.
Anugraha Tours and Travels was set up in March 1999 to solely cater to the growing demand
of a reliable taxi operator to the MNC‘s and the local industrialists.
Anugraha Tours and Travels provide all major transports ticketing services to make successful
journey to any destination..
The company provides 24hours service to its customers they ensure that their customers are
highly satisfied with the service. They ensure that their customers have a memorable trip every
time they travel with them.
The company has fleet of vehicles; including the state of art Air buses in its fold. They offer
their vehicles on contract and rental basis to their clients at reasonable prices.
They also cater to private sectors and multi-nationals, to aid their transportation facilities and
industrial undertakings. Accomplished workplace, prudent drivers, cleanliness, well-equipped
workshop and round the clock service. The staffs work on shifts - from the manager to the
laborer.

54
Anugraha Tours and Travels provide its customers a personal travel experience that goes
beyond the basic sight seeing tour.
Anugraha Tours and Travels provide their car rental service to the following few of the
MNC‘s:
Amphenol Interconnect (I) Ltd
EF Information Systems Pvt Ltd
Rohde & Schwarz Ltd
Fidelity Business Services India Pvt ltd
State Bank of India (LHO)
Central Bank of India
MPS Limited (Mac-Res)
FCI OEN Connectore Ltd
D S India Pvt Ltd
OEN India Ltd Cochin
they provide luxury comfortable vehicles on contract or rental basis for a reasonable rate and
the rental rates are as follows:
Car Rental:
Anugraha Tours and provide luxury vehicles on contract or rental basis and the charges for
such cars are given below.

55
VEHICLE
NAME
4HOURS
40 KMS
8HOURS 80
KMS
EXTRA
HOURS
EXTRA
KMS
INDICA NONA/C 550-00 1100-00 75-00 8-00
INDICA A/C 600-00 1200-00 100-00 8.50-00
SWIFT DIZAIR A/C 700-00 1400-00 125-00 11-00
TOYOTA ETIOES A/C 700-00 1400-00 125-00 11-00
INNOVA A/C .... 1900-00 150-00 13-00
TEMPO TRAVELER NON A/C .... 2000-00 200-00 14-00
TEMPO TRAVALER A/C .... 2500-00 250-00 15-00
Local Use :
Indica (4+1) Night 10 PM Driver Bata - Rs.200.00
Qualis (7+1) Night 10 PM Driver Bata - Rs.200.00
Innova (6+1) Night 10 PM Driver Bata - Rs.200.00
Outstation Use :
Indica (4+1) Night 10 PM Driver Bata - Rs.200.00
Qualis (7+1) Night 10 PM Driver Bata - Rs.200.00
Innova (6+1) Night 10 PM Driver Bata - Rs.200.00
Their Station Hire Charges (all new vehicles) min 300 Kms per day 24 hours service in
alternative new rate.

56
1. NIGHT OFTER 10pm drvier bata 300
1. Outstation per day 300kms minimam
VECHICAL NAME PER KMS
INDICA NONA/C 8-00
INDICA A/C 8.50-00
SWIFT DIZAIR A/C 11-00
TOYOTA ETIOES A/C 11-00
TOYOTA INNOVA A/C 13-00
TEMPO TRAVELER NON A/C 14-00
TEMPO TRAVALER A/C 15-00
Driver bata 6am to 10 pm-300
10pm to 6am -300
Out of state intrence fee and tol extra

57
CHAPTER-3
RESEARCH METHODOLOGY
Research methodology is a way to systematically solve the research problem. It may be
understood as a science of studying how research is done scientifically. The various steps that are
generally adopted by a researcher in studying research problem along with the logic behind
them. It is necessary for the researcher to know not only the research methods/ techniques but
also the methodology. The project deals with working capital of Tata Steel Ltd and SAIL and
there has been a lot of research already been done on the topic. I have tried to understand the
functioning of working capital and its impact on the company.
3.1 TYPE OF RESEARCH
This project ―A Study on Working Capital at Anugraha Tours and Travels‖ is considered as an
analytical research.
Analytical research is defined as the research in which, researcher has to use facts or information
already available and analyse these to make a critical evaluation of the facts, figures, data or
material.
3.2 PROBLEM STATEMENT
To analyse the working capital and financial position of the company.
Understanding the company‘s balance sheet of the Anugraha Tours and Travels
3.3 OBJECTIVES OF THE STUDY
To study the concept and importance of working capital management.
To study and analysis the working capital trend through ratio analysis.
To study the Liquidity position of Anugraha Tours and Travels.
To suggest measures for effective management of working capital.

58
3.4 SCOPE OF THE STUDY
This study will help us to know the financial position of the company.
This study is to carry out a critical analysis of Anugraha Tours and Travels working capital.
The study of working capital is based on tools like ratio analysis, statement of changes in
working capital.
3.5 SECONDARY SOURCES OF DATA
Annual report.
Websites of Anugraha Tours and Travels.
Review of previous reports related to the topic.
Study about the topic ‗Working Capital‘ from books.
Tools used: Ratio analysis.
3.6 LIMITATIONS OF THE STUDY
The biggest limitation with respect to the topic is that the project is based on the secondary
data.
The study is limited to the scope of data provided publicly.
The terms of credit policies have not been revealed due to the company rule and regulations.
The study is restricted to five years data of Anugraha Tours and Travels.
3.7 LITERATURE REVIEW
Marc Deloof (2003):States that Most firms have a large amount of cash invested in working
capital, as well as substantial amounts of short-term payables as a source of financing. For
instance, according to the National Bank of Belgium, in 1997 accounts receivable and
inventories were respectively 17% and 10% of total assets of all Belgian nonfinancial firms.
Accounts payable were 13% of total assets of these firms. It can be expected that the way in

59
which working capital is managed will have a significant impact on the profitability of firms.
Accordingly, for many firms working capital management (WCM) is a very important
component of their financial management. Firms may have an optimal level of working capital
that maximizes their value. On the one hand, large inventory and a generous trade credit policy
may lead to higher sales. Larger inventory reduces the risk of a stock-out.
Kesseven Padachi (2006): States that a well designed and implemented working capital
management is expected to contribute positively to the creation of a firm‘s value. The purpose of
this paper is to examine the trends in working capital management and its impact on firms‘
performance. The trend in working capital needs and profitability of firms are examined to
identify the causes for any significant differences between the industries. The dependent
variable, return on total assets is used as a measure of profitability and the relation between
working capital management and corporate profitability is investigated for a sample of 58 small
manufacturing firms, using panel data analysis for the period 1998 – 2003. The regression results
show that high investment in inventories and receivables is associated with lower profitability.
The key variables used in the analysis are inventories days, accounts receivables days, accounts
payable days and cash conversion cycle. A strong significant relationship between working
capital management and profitability has been found in previous empirical work. An analysis of
the liquidity, profitability and operational efficiency of the five industries shows significant
changes and how best practices in the paper industry have contributed to performance. The
findings also reveal an increasing trend in the short-term component of working capital
financing.
Sushma Vishnani and Bhupesh Kr. Shah (2007): States that liquidity and profitability are two
vital aspects of corporate business life. Liquidity measures the ability of a company to honour all
the maturing obligations. No firm can endure without liquidity. Profitability is the rate of return
on company‘s investment. An unwarranted high investment in current assets would reduce this
rate of return. Working capital management has thus, become a basic and broad aspect of
adjudicating the performance of a corporate entity. It is, therefore, essential to maintain an
adequate degree of liquidity for smooth running of the business operations. The liquidity should

60
be neither excessive nor inadequate. Excessive liquidity indicates accumulation of idle funds
which do not earn any profit for the firm and inadequate liquidity not only adversely affects the
credit worthiness of the firm but also disrupts the production process and impedes its earning
capacity to a great extent.
States that Working capital management (WCM) is the management of short-term financing
requirements of a firm. This includes maintaining optimum balance of working capital
components – receivables, inventory and payables – and using the cash efficiently for day-to-day
operations. Optimization of working capital balance means minimizing the working capital
requirements and realizing maximum possible revenues. Efficient WCM increases firms‘ free
cash flow, which in turn increases the firms‘ growthopportunities and return to shareholders.
Even though firms traditionally are focused on long term capital budgeting and capital structure,
the recent trend is that many companies across different industries focus on WCM efficiency.
Sonia Banos-Caballero, Pedro J. Garcıa-Teruel, Pedro Martınez-Solan (2009): This paper
analyses the determinants of Cash Conversion Cycle (CCC) for small- and medium-sized firms.
It has been found that these firms have a target CCC length to which they attempt to converge,
and that they try to adjust to their target quickly. The results also show that it is longer for older
firms and companies with greater cash flows. In contrast, firms with more growth opportunities,
and firms with higher leverage, investment in fixed assets and return on assets have a more
aggressive working capital policy.
David M Mathuva (2010): This paper examined the influence of working capital management
components on corporate profitability. A sample of 30 firms listed on the Nairobi Stock
Exchange for the periods 1993 to 2008 was used. Both the pooled OLS and the fixed effects
regression models were used. The key findings from the study were: (1) there exists a highly
significant negative relationship between the time it takes for firms to collect cash from their
customers (accounts collection period) and profitability (p<0.01). This means that more
profitable firms take the shortest time to collect cash from their customers. (2) there exists a

61
highly significant positive relationship between the period taken to convert inventories into sales
(the inventory conversion period) and profitability (p<0.01). this means that firms which
maintain sufficiently high inventory levels reduce costs of possible interruptions in the
production process and loss of business due to scarcity of products.
Amarjit Gill, Nahum Biger, Neil Mathur (2010):This paper investigates the relationship
between the working capital management and the firms‘ profitability for a sample of 88
American manufacturing companies listed on the New York Stock Exchange for the period of 3
years from 2005-2007. Management of working capital is an important component of corporate
financial management because it directly affects the profitability of the firms. Management of
working capital refers to management of current assets and of current liabilities. Researchers
have approached working capital management in numerous ways. While some studied the
impact of proper or optimal inventory management, others studied the management of accounts
receivables trying to postulate an optimal way policy that leads to profit maximization.
A.K. Sharma and Satish Kumar (2011): The main aim of this article is to examine the effect of
working capital on profitability of Indian firms. The findings of their study significantly depart
from the various international studies conducted in different markets. The results reveal that
working capital management and profitability is positively correlated in Indian companies. The
study further reveals that inventory of number of days and number of days‘ accounts payable are
negatively correlated with a firm‘s profitability, whereas number of days‘ accounts receivables
and cash conversion period exhibit a positive relationship with corporate profitability. The
present study contributes to the existing literature by examining the effect of working capital
management on profitability in the context of an emerging capital market such as India.
Bhaskar Bagchi, Jayanta Chakrabarti & Piyal Basu Roy (2012): The paper aims to explore
the effects of components of working capital management like cash conversion cycle (CCC), age
of inventory (AI), age of debtors (AD), age of creditors (AC), debt to total assets (DTA) and debt
equity ratio (DER) on profitability of FMCG firms. The profitability of firms is measured in

62
terms of return on total assets (ROTA) and return on investment (ROI). Working capital
management is considered to be a vital issue in financial management decision and it affects both
liquidity and profitability of the firm. The secondary data for analysis is retrieved from Prowess
Database of CMIE for ten-year period from 2000-01 to 2009-10. Apart from using Pearson‘s
correlation analysis, panel data regression analysis like pooled OLS model and fixed effect
LSDV model are employed in the study. Like previous authors, our study results show a sturdy
negative association between working capital management variables and firms‘profitability. The
results of our study also indicate the better explanatory power of fixed effect LSDV model than
that of pooled OLS model.
2.10 Gabriel Hawawini and Claude Viallet and Ashok Vora(2013): This paper states that the
concept of working capital requirement provides a convenient accounting measure of the amount
of capital a firm has tied up in its operating cycle, and may prove to be a better measure of a
firm‘s investment in its operating cycle than the traditional concept of net working capital. Most
nonfinancial firms have a substantial amount of cash tied up in their operating cycle in form of
net investment in working capital
.

63
CHAPTER-4
ANALYSIS AND INTERPRETATION
TABLE 4.1: Showing Net Working Capital Ratio of Anugraha Tours And Travels
Net working capital= current assets-current liabilities
Net working ratio= net working capital ÷ net assets
Year Net working ratio
2013 0.15
2014 0.24
2015 0.01
2016 (0.02)
2017 0.02
Analysis:
The above table shows that the company has made 0.15 net working ratio in the FY 13-14 and
0.24 in the FY14-15, 0.01 in the FY 15-16, (0.02) in the FY 16-17 and 0.02 in the FY 17-18
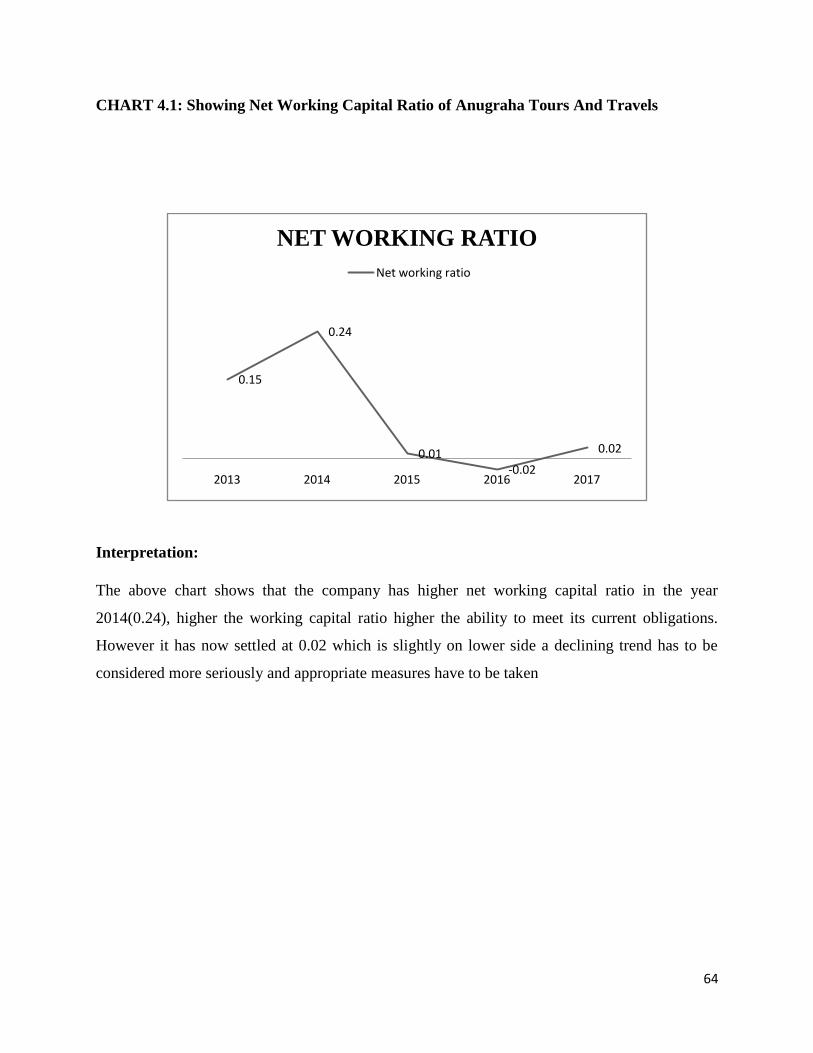
64
CHART 4.1: Showing Net Working Capital Ratio of Anugraha Tours And Travels
Interpretation:
The above chart shows that the company has higher net working capital ratio in the year
2014(0.24), higher the working capital ratio higher the ability to meet its current obligations.
However it has now settled at 0.02 which is slightly on lower side a declining trend has to be
considered more seriously and appropriate measures have to be taken
0.15
0.24
0.01-0.02
0.02
2013 2014 2015 2016 2017
NET WORKING RATIO
Net working ratio

65
TABLE 4.2: Showing Current Asset Ratio of Anugraha Tours And Travels
Current asset ratio= current assets/current liabilities
Year Current asset ratio
2013 1.51
2014 2.14
2015 1.02
2016 0.9
2017 1.09
Analysis:
The above table shows that the company has 1.51 current asset ratio in the FY 13-14 and 2.14 in
the FY14-15, 1.02 in the FY 15-16, 0.9 in the FY 16-17 and 1.09 in the FY 17-18.

66
CHART 5.2: Showing Current Asset Ratio of Anugraha Tours And Travels
Interpretation:
The above chart shows that the company had higher current ratio in the year 2014, higher the
current ratio higher the safety for the creditors. Which thenreached 0.9 in the year 2016.
However now it has reached 1.09 in the FY 2017.Thehigher the amount of current assets in
relation to current liabilities, higher the firm‘s ability to meet its current obligations. A ratio of
greater than one means that the firm has more current assets than current liabilities. The
conventional rule is to have a ratio of 2:1
2013 2014 2015 2016 2017
Current asset ratio 1.51 2.14 1.02 0.9 1.09
0
0.5
1
1.5
2
2.5
CURRENT RATIO

67
TABLE 5.3: Showing Cash Ratio of Anugraha Tours And Travels
cash ratio= cash ÷ current liabilities
year cash ratio
2013 0.41
2014 0.56
2015 0.27
2016 0.40
2017 0.75
Analysis:
The above table shows that the company has 0.41 current asset ratio in the FY 13-14 and 0.56 in
the FY14-15, 0.27 in the FY 15-16, 0.40 in the FY 16-17 and 0.75 in the FY 17-18.

68
CHART 5.3: Showing Cash Ratio of Anugraha Tours And Travels
Interpretation:
The above chart shows that the company has higher cash in the FY 2017(0.75) it shows that
more cash sitting idle with the company and the company has to put the cash up to use by
investing it.
0.41
0.56
0.27
0.4
0.75
0
0.1
0.2
0.3
0.4
0.5
0.6
0.7
0.8
2013 2014 2015 2016 2017
CASH RATIO
cash ratio
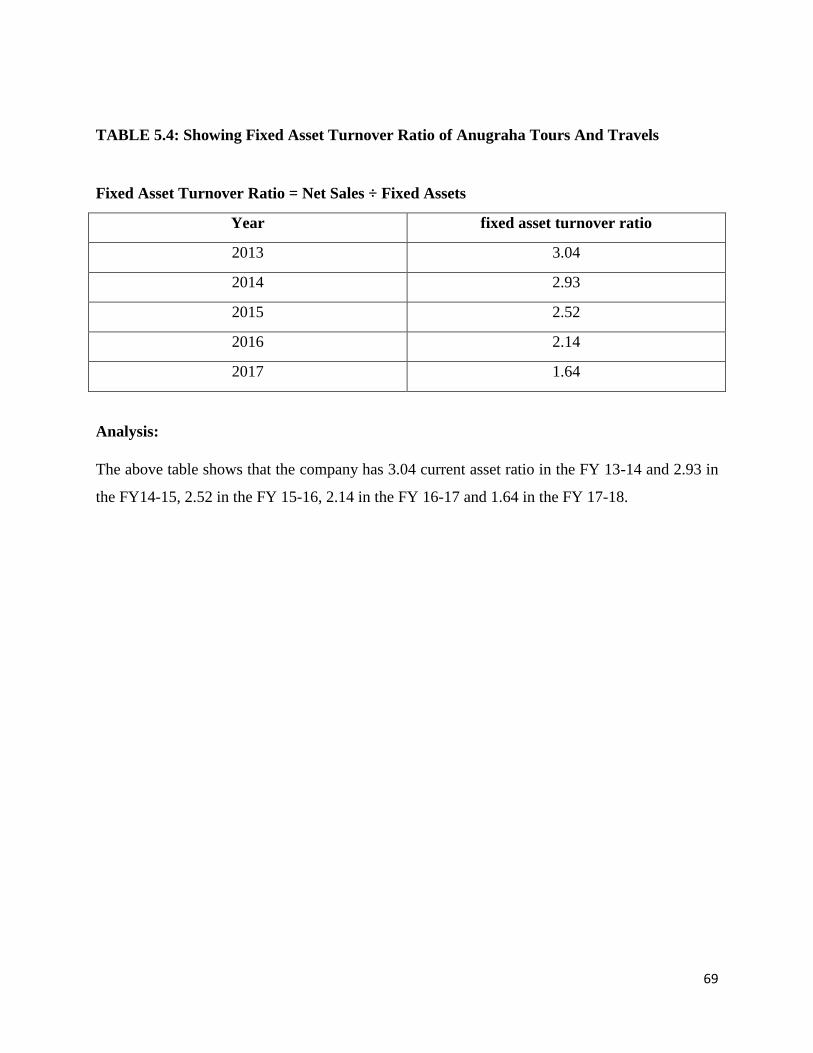
69
TABLE 5.4: Showing Fixed Asset Turnover Ratio of Anugraha Tours And Travels
Fixed Asset Turnover Ratio = Net Sales ÷ Fixed Assets
Year fixed asset turnover ratio
2013 3.04
2014 2.93
2015 2.52
2016 2.14
2017 1.64
Analysis:
The above table shows that the company has 3.04 current asset ratio in the FY 13-14 and 2.93 in
the FY14-15, 2.52 in the FY 15-16, 2.14 in the FY 16-17 and 1.64 in the FY 17-18.

70
CHART 5.4: Showing Fixed Asset Turnover Ratio of Anugraha Tours And Travels
Interpretation:
The above chart shows that the company has higher fixed asset turnover ratio in the year
2013(3.04) and has reached 1.64 in the FY 2017, higher the fixed asset turnover ratio, the better
because it indicates the business has less money tied up in fixed assets for each unit of currency
of sales revenue. A declining ratio may indicate that the business is over-invested in plant,
equipment, or other fixed assets. As there is a downward trend the company has to take
necessary measures.
0
0.5
1
1.5
2
2.5
3
3.5
year 2013 2014 2015 2016
FIXED ASSET TURNOVER
RATIO
fixed asset turnover ratio

71
TABLE 5.5: Showing Debtor’s Turnover Ratio of Anugraha Tours And Travels
Debtors Turnover Ratio = Total Sales ÷ Accounts Receivables
Year Debtors turnover ratio
2013 14.59
2014 13.86
2015 18.78
2016 17.25
2017 35.70
Analysis:
The above table shows that the company has 14.59 current asset ratio in the FY 13-14 and 13.86
in the FY14-15, 18.78 in the FY 15-16, 17.25 in the FY 16-17 and 35.70 in the FY 17-18.

72
CHART 5.5: Showing Debtor’s Turnover Ratio of Anugraha Tours And Travels
Interpretation:
The above chart shows that the company has higher ratio in the FY 2017, higher debtor turnover
ratio, the more efficient the management of the company.
0 10 20 30 40
2013
2014
2015
2016
2017
2013 2014 2015 2016 2017
Debtors turnover ratio 14.59 13.86 18.78 17.25 35.7
DEBTORS TURNOVER RATIO

73
TABLE 5.6: Showing Asset Turnover Ratio of Anugraha Tours And Travels
Asset Turnover Ratio = Sales ÷ Average Total Assets
Year Asset turnover ratio
2013 2.36
2014 2.08
2015 2.13
2016 1.75
2017 1.38
Analysis:
The above table shows that the company has 2.36 asset turnover ratio in the FY 13-14 and 2.08
in the FY14-15, 2.13 in the FY 15-16, 1.75 in the FY 16-17 and 1.38 in the FY 17-18.

74
CHART 5.6: Showing Asset Turnover Ratio of Anugraha Tours And Travels
Interpretation:
The above chart shows that the company has made higher ratio in the FY 2013(2.36) and has
reached 1.38 in the FY 2017. Higher the asset turnover ratio the more favourable and hence the
company has to make efficient use of the assets in order to gear up the trend.
2.36
2.08 2.13
1.75
1.38
0
0.5
1
1.5
2
2.5
2013 2014 2015 2016 2017
ASSET TURNOVER RATIO
Asset turnover ratio

75
TABLE 5.7: Showing Current Asset To Total Asset Ratio of Anugraha Tours And Travels
Current Asset To Total Asset Ratio = Current Asset ÷ Total Asset
Year Current Asset to total asset ratio
2013 0.22
2014 0.28
2015 0.15
2016 0.18
2017 0.16
Analysis:
The above table shows that the company has 0.22 current asset to total asset ratio in the FY 13-
14 and 0.28 in the FY14-15, 0.15 in the FY 15-16, 0.18 in the FY 16-17 and 0.16 in the FY 17-
18.

76
CHART 5.7: Showing Current Asset to Total Asset Ratio of Anugraha Tours And Travels
Interpretation:
The above chart shows CATAR, the company has higher ratio in the year 2014, n it has reached
0.16 in the FY 2017 however the company has kept an average of 20% of its current assets to
meet its current obligations.
0.22
0.28
0.150.18
0.16
0
0.05
0.1
0.15
0.2
0.25
0.3
2013 2014 2015 2016 2017
CURRENT ASSET TO TOTAL
ASSET RATIO
Current Asset to total asset ratio

77
TABLE 5.8: Showing Working Capital Turnover Ratio of Anugraha Tours And Travels
Working Capital Turnover Ratio = Sales ÷ Net Working Capital
Year Working capital turnover ratio
2013 31.35
2014 14.25
2015 566.188
2016 (136.34)
2017 100.48
Analysis:
The above table shows that the company has 31.35Working capital turnover ratio in the FY 13-
14 and 14.25 in the FY14-15, 566.188 in the FY 15-16, (136.34) in the FY 16-17 and 100.48 in
the FY 17-18.

78
CHART 5.8: Showing Working Capital Turnover Ratio of Anugraha Tours And Travels
Interpretation:
The above chart shows working capital turnover ratio, the company has higher ratio in the FY
2014(566.188), lower in the FY 2016(-136.34) and has reached 100.48 in the FY 2017. The firm
should maintain a steady working capital position. It should have adequate working capital to run
its business operations. Both excessive and inadequate working capital positions are dangerous
from a firm‟s point of view excessive working capital means holding costs and idle funds which
earns no profits for the firms. Paucity of working capital not only impairs firm‟s profitability but
also results in production inefficiencies and interruptions and also sales disruptions.
31.35 14.25
566.188
-136.34
100.48
-200
-100
0
100
200
300
400
500
600
700
2013 2014 2015 2016 2017
WORKING CAPITAL
TURNOVER RATIO
Current Asset to total asset ratio

79
CHAPTER-5
FINDINGS, SUGGESTIONS AND CONCLUSIONS
FINDINGS:
The company has higher net working capital ratio in the year 2014(0.24), higher the working
capital ratio higher the ability to meet its current obligations. However, it has now settled at 0.02
which is slightly on lower side a declining trend has to be considered more seriously and
appropriate measures have to be taken
The company had higher current ratio in the year 2014, higher the current ratio higher the safety
for the creditors. Which then reached 0.9 in the year 2016. However now it has reached 1.09 in
the FY 2017.Thehigher the amount of current assets in relation to current liabilities, higher the
firm‘s ability to meet its current obligations. A ratio of greater than one means that the firm has
more current assets than current liabilities. The conventional rule is to have a ratio of 2:1
The company has higher cash in the FY 2017(0.75) it shows that more cash sitting idle with the
company and the company has to put the cash up to use by investing it.
The company has higher fixed asset turnover ratio in the year 2013(3.04) and has reached 1.64 in
the FY 2017, higher the fixed asset turnover ratio, the better because it indicates the business has
less money tied up in fixed assets for each unit of currency of sales revenue. A declining ratio
may indicate that the business is over-invested in plant, equipment, or other fixed assets. As there
is a downward trend the company has to take necessary measures.
The company has higher ratio in the FY 2017, higher debtor turnover ratio, the more efficient the
management of the company.
The company has made higher ratio in the FY 2013(2.36) and has reached 1.38 in the FY 2017.
Higher the asset turnover ratio the more favourable and hence the company has to make efficient
use of the assets in order to gear up the trend.

80
SUGGESTIONS:
The declining trend of NWC has to be considered more seriously and appropriate measures have
to be taken. As working capital is very necessary to ensure that a firm is able to continue its
operations and it has sufficient ability to satisfy both short-term debt and upcoming operational
expenses.
Both excessive and inadequate working capital positions are dangerous from a firm‘s point of
view excessive working capital means holding costs and idle funds which earns no profits for the
firms. Paucity of working capital not only impairs firm‘s profitability but also results in
production inefficiencies and interruptions and also sales disruptions. Hence adequate working
capital has to be maintained.
The cash which is sitting idle has to be invested in assets which in return would help to generate
more sales and more working capital to meet its current obligations.
From the study we could find out that the company is not making efficient use of its assets hence
the company has to make efficient use of its assets in order to generate more sales which in turn
will lead to increased profit.
The company has to keep sufficient current assets with them in order to meet its current
obligations.

81
CONCLUSION:
Working capital management is concerned with the problems that arise in attempting to manage
the current assets, the current liabilities and the interrelationship that exists between them. The
term current assets refer to those assets, which in the ordinary course of business can be, or will
be, converted into cash within one year without undergoing a diminution in value and without
disrupting the operations of the firm
It is very necessary for all the firms to keep sufficient working capital to meet their day to day
operations. The company should have limited working capital not too less nor more. From the
above study we can say that the company has sufficient funds with them. The company should
invest more in their current assets in order to make efficient use of the cash. The company hold
more fixed assets and should ensure there is generating sufficient sales out of it.
Both excessive and inadequate working capital positions are dangerous from a firm‟s point of
view excessive working capital means holding costs and idle funds which earns no profits for the
firms. Paucity of working capital not only impairs firm‘s profitability but also results in
production inefficiencies and interruptions and also sales disruptions.

82
CHAPTER-6
LEARNING EXPERIENCE
An internship project report is an essential part of the study. This helps to know how the
organization functions and also to know how various interrelated department work together to
achieve their common goal and it helped to have a practical view to the problems, functions,
departments and their business operations.
It is compulsory for every student to take up a project work in an industry, besides it gives an
exposure of working atmosphere of the office, it also gives an experience, to apply the
theoretical knowledge that we have learnt, to the practical problems of the Industrial project that
they undertake.
This internship is generally plan to get a knowledge about the industry towards business
environment practically training given in which will get to know a clear picture to build up and
prepare for a future employee in an organization.
These 12weeks of internship was really so valuable and had got lots of opportunity to learn new
things from industry experts. This helped to gain more industry knowledge and to get acquainted
with the problem thus to know what, why, how the management principles is carried forward in
the organization process.
The internship project report helps to gain practical knowledge in the organization of Anugraha
Tours and Travels, Bangalore.
This report is an attempt made to understand the working capital of an organization as a whole
with the co-ordination of all functional departments, with giving respect to managerial aspect.

ANNEXURE
Balance sheet as on March 31 2013
ASSETS 31/12/2013
FIXED ASSETS
IMMOVABLE PROPERTIES 14480870.00
MOVABLE PROPERTIES 2563192.00
CURRENT ASSETS, LOANS AND
ADVANCES
A. CURRENT ASSETS
SUNDRY DEBTORS 3547733.63
RENTAL DEPOSITS 30000.00
CASH AT BANK 910853.78
CASH IN HAND 410631.12
21943280.53
LIABILITIES
PROPRIETOR'S CAPITAL
Mr. M. DEVA RAO CAPITAL 10678807.14
LOANS(LIABILITY)
A. SECURED LOANS 4631932.39
B. UNSECURED LOANS 2085000.00
ADVANCE FOR SALE OF UDUPI
PROPERTY 1300000.00
CURRENT LIABILITIES &
PROVISIONS
A. CURRENT LIABILITIES
SUNDRY CREDITORS 2568491.00
RENTAL DEPOSITS 530000.00
B. PROVISIONS 149050.00
21943280.53
Sales for the year 51792185.00

Balance sheet as on march 31 2014
ASSETS 31/12/2014
FIXED ASSETS
IMMOVABLE PROPERTIES 12628261
MOVABLE PROPERTIES 2678335
INVESTMENTS 106500
CURRENT ASSETS, LOANS AND
ADVANCES
A. CURRENT ASSETS
ADVANCE PAID TOWARDS
PROPERTY 1200000
SUNDRY DEBTORS 3234800.21
RENTAL DEPOSITS 30000.00
CASH AT BANK 1119852.58
CASH IN HAND 578405.12
21576153.91
LIABILITIES
PROPRIETOR'S CAPITAL
Mr. M. DEVA RAO CAPITAL 12747741.62
LOANS(LIABILITY)
A. SECURED LOANS 3726989.29
B. UNSECURED LOANS 2085000
CURRENT LIABILITIES &
PROVISIONS
A. CURRENT LIABILITIES
SUNDRY CREDITORS 2264745
RENTAL DEPOSITS 530000
B. PROVISIONS 221678
21576153.91
Sales for the year 44846257.42

Balance sheet as on march 31 2015
ASSETS 31/12/2015
FIXED ASSETS
IMMOVABLE PROPERTIES 15401176.00
MOVABLE PROPERTIES 2376635.00
CURRENT ASSETS, LOANS AND
ADVANCES
A. CURRENT ASSETS
SUNDRY DEBTORS 2390851.51
RENTAL DEPOSITS 30000.00
CASH AT BANK 753815.94
CASH IN HAND 98705.12
21051183.57
LIABILITIES
PROPRIETOR'S CAPITAL
Mr. M. DEVA RAO CAPITAL 12478529.18
LOANS(LIABILITY)
A. SECURED LOANS 3293576.39
B. UNSECURED LOANS 2085000.00
CURRENT LIABILITIES &
PROVISIONS
A. CURRENT LIABILITIES
SUNDRY CREDITORS 2321627.00
RENTAL DEPOSITS 530000.00
B. PROVISIONS 342451.00
21051183.57
Sales for the year 44895903.00

Balance sheet as on march 31 2016
ASSETS 31/12/2016
FIXED ASSETS
IMMOVABLE PROPERTIES 17324576.00
MOVABLE PROPERTIES 1526422.00
CURRENT ASSETS, LOANS AND
ADVANCES
A. CURRENT ASSETS
SUNDRY DEBTORS 2338184.72
RENTAL DEPOSITS 30000.00
CASH AT BANK 1690907.25
CASH IN HAND 93813.69
23003903.66
LIABILITIES
PROPRIETOR'S CAPITAL
Mr. M. DEVA RAO CAPITAL 14213438.72
LOANS(LIABILITY)
A. SECURED LOANS 2256656.94
B. UNSECURED LOANS 2085000.00
CURRENT LIABILITIES &
PROVISIONS
A. CURRENT LIABILITIES
SUNDRY CREDITORS 2472122.00
RENTAL DEPOSITS 1530000.00
B. PROVISIONS 446686.00
23003903.66
Sales for the year 40344669.00

Balance sheet as on march 31 2017
ASSETS 31/12/2017
FIXED ASSETS
IMMOVABLE PROPERTIES 18249576.00
MOVABLE PROPERTIES 916869.00
CURRENT ASSETS, LOANS AND
ADVANCES
A. CURRENT ASSETS
SUNDRY DEBTORS 882047.45
RENTAL DEPOSITS 30000.00
KUSHI CHITS Pvt Ltd 214600.00
CASH AT BANK 2366990.52
CASH IN HAND 60188.69
22720271.66
LIABILITIES
PROPRIETOR'S CAPITAL
Mr. M. DEVA RAO CAPITAL 16050575.60
LOANS(LIABILITY)
A. SECURED LOANS 1594227.06
B. UNSECURED LOANS 1835000.00
CURRENT LIABILITIES &
PROVISIONS
A. CURRENT LIABILITIES
SUNDRY CREDITORS 1655469.00
RENTAL DEPOSITS 1530000.00
B. PROVISIONS 55000.00
22720271.66
Sales for the year 31489184.00

BIBLIOGRAPHY
TEXT BOOKS
M.Y. Khan / P.K Jain, Financial Management Text, Problem’s Cases, 5TH
Edition, Tata
McGraw –Hill Publishing Company Limited, New Delhi, 2007.
Prasanna Chandra, Financial Management Theory and Practice, 5TH
Edition,
Tata McGraw –Hill Publishing Company Limited, New Delhi, 2001.
ARTICLES
Annual Report of Anugraha Tours and Travels.
WEBSITE
WWW.ANURAHAAGENCIES.COM
WWW.STUDYFINANCE.COM
WWW.MONEYCONTROL.COM