view - Internship Report
44
I Internship Report No.3/2019-20 Kengeri Post, Bangalore-Mysore Road, Bengaluru-560060 Phone: +91 80 26971000, Fax: +91 80 26971010, e-Mail: director[at]fpibangalore[dot]gov[dot]in Internship Report on ‘An Analysis of Public Debt Management in Karnataka’ Dhanalakshmi R January, 2020
-
Upload
khangminh22 -
Category
Documents
-
view
0 -
download
0
Transcript of view - Internship Report
I
Internship Report No.3/2019-20
Kengeri Post, Bangalore-Mysore Road, Bengaluru-560060
Phone: +91 80 26971000, Fax: +91 80 26971010,
e-Mail: director[at]fpibangalore[dot]gov[dot]in
Internship Report
on
‘An Analysis of Public Debt Management in Karnataka’
Dhanalakshmi R
January, 2020
II

III
ACKNOWLEDGEMENTS
I would like to express my profound gratitude to all those who have been instrumental in the
preparation of this report. I wish to place on record my deep gratitude to Sri Sujit Kumar
Chowdhury, Director, FPI, Government of Karnataka, for giving me this opportunity of
Internship at FPI and for his support in this project, which is a voluntary work undertaken out
of academic interest.
I would like to extend my indebtedness and gratitude to my mentor Dr. Anantha Ramu M.R.,
Consultant (Academic and Research) at FPI for his constant guidance, support and timely help.
His feedback was crucial and I am grateful to him for lending me time from his busy schedule
to help in this study.
I am deeply thankful to Prof. M.R. Narayana, Consultant (Academic and Research) at FPI for
his valuable suggestions and directions during this study.
I would like to express my gratitude to Prof. M. Indira, DOS in Economics and Co-operation,
Manasagangothri, University of Mysore, for referring me to this internship at FPI.
I am indebted to all the Librarians for ensuring that library facilities and internet facilities were
always available for the completion of this project and also for their invaluable help and co-
operation while conducting this study.
I am deeply thankful to all my fellow interns and also the research fellows at FPI for their
support and help at every juncture through exchange of ideas and views on the study.
I am thankful to the Officers and Staff at FPI who have shown tremendous co-operation and
support throughout the stay at the FPI campus.
As a final word, I would like to express my gratitude to all those who directly or indirectly
extended their cooperation and encouragement in bringing out this Project Report.
IV
TABLE OF CONTENTS
Letter of Transmittal..................................................................................................................II
Acknowledgement....................................................................................................................III
Table of Contents.....................................................................................................................IV
Abstract....................................................................................................................................VI
List of Abbreviations..............................................................................................................VII
List of Tables………...............................................................................................................IX
List of Figures....……...............................................................................................................X
1. Introduction............................................................................................................................1
1.1. Need for the Study.........................................................................................................1
1.2. Overview of Karnataka’s Public Debt...........................................................................2
1.3. Review of Literature......................................................................................................3
1.4. Research Gap.................................................................................................................4
1.5. Objectives of the Study.................................................................................................5
1.6. Research Methodology..................................................................................................5
1.7. Policy Framework for Public Debt Management in Karnataka....................................5
1.8. Limits on the Borrowing Powers of the State Government..........................................7
2. Trends and Patterns in Public Debt Position of Karnataka...................................................8
2.1. Structure and Composition of Karnataka’s Public debt................................................8
2.2. Growth of Public Debt in Karnataka: From 1990-91 to 2018-19...............................10
2.3. Debt-to-GSDP Ratio...................................................................................................11
2.4. Burden of Public Debt on the Government of Karnataka...........................................13
2.4.1. Interest Payments of the State..................................................................................13
2.4.2. IP/RR, IP/GSDP and IP/RE Ratio...........................................................................14
2.4.3. Outstanding Guarantees of Government of Karnataka............................................16
V
2.4.4. Off budget Borrowings..…………………………………………………………..18
3. Public Debt Management in Karnataka................................................................................20
3.1. Public Debt Management Strategies Followed by the Government of Karnataka......20
3.2. IMF-World Bank Guidelines for Public Debt Management, 2001.............................26
4. Impact of FRLs on Public Debt Indicators of Karnataka …………………………………28
5. Conclusion………………………….......…….....................................................................32
References……………………………………………………………………………………34
VI
ABSTRACT
This report aims at exploratory and descriptive analysis of Public Debt Management in
Karnataka. The economy of Karnataka was under fiscal distress in the 1990s. With mounting
pressure on the state’s finances, the Government of Karnataka resorted to a rule-based fiscal
correction and enacted KFRA, 2002. The study analyses the position of Karnataka’s public
debt, trends in various debt indicators and reviews public debt management strategies adopted
by the Government of Karnataka. The present study also aims at assessing the impact of FRLs
on debt indicators of Karnataka using the appropriate time series econometric technique.
Trend analysis revealed that there is a clear improvement in the state’s debt indicators and the
structural break analysis found that there is a significant change in the public debt indicators
of Karnataka in the reform period and that the debt indicators have moved in the expected
direction. The study further summarises the steps taken by the Government of Karnataka
towards its debt management. An attempt has also been made to look into the IMF-World Bank
Guidelines on Public Debt Management, 2001 and the state’s compliance with the same. The
government should strictly follow prudent debt management strategies to maintain debt at
sustainable levels in its efforts towards fiscal consolidation.
VII
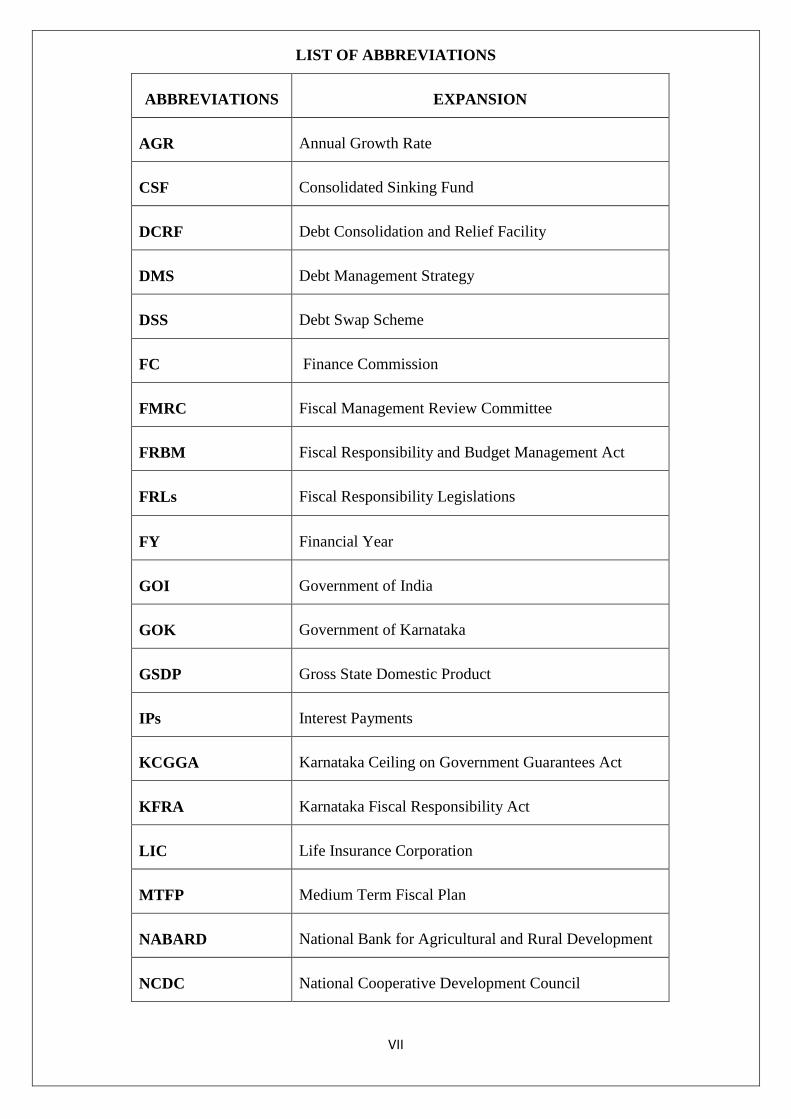
LIST OF ABBREVIATIONS
ABBREVIATIONS EXPANSION
AGR Annual Growth Rate
CSF Consolidated Sinking Fund
DCRF Debt Consolidation and Relief Facility
DMS Debt Management Strategy
DSS Debt Swap Scheme
FC Finance Commission
FMRC Fiscal Management Review Committee
FRBM Fiscal Responsibility and Budget Management Act
FRLs Fiscal Responsibility Legislations
FY Financial Year
GOI Government of India
GOK Government of Karnataka
GSDP Gross State Domestic Product
IPs Interest Payments
KCGGA Karnataka Ceiling on Government Guarantees Act
KFRA Karnataka Fiscal Responsibility Act
LIC Life Insurance Corporation
MTFP Medium Term Fiscal Plan
NABARD National Bank for Agricultural and Rural Development
NCDC National Cooperative Development Council
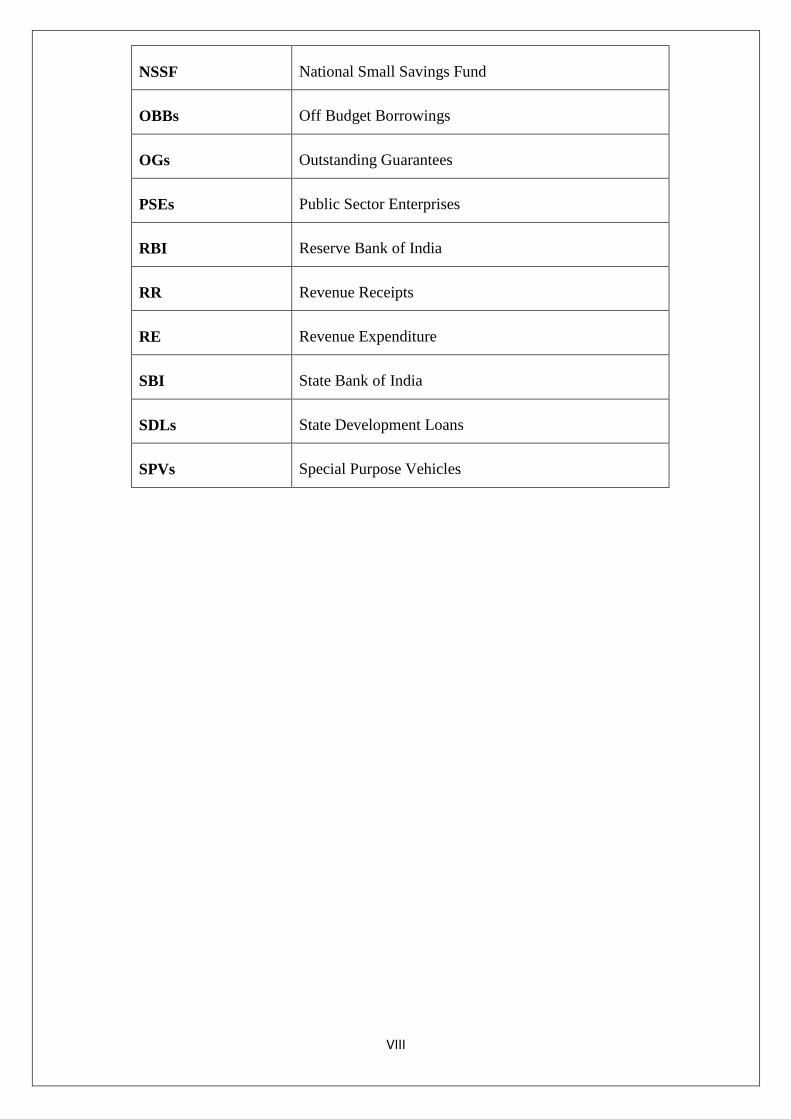
VIII
NSSF National Small Savings Fund
OBBs Off Budget Borrowings
OGs Outstanding Guarantees
PSEs Public Sector Enterprises
RBI Reserve Bank of India
RR Revenue Receipts
RE Revenue Expenditure
SBI State Bank of India
SDLs State Development Loans
SPVs Special Purpose Vehicles
IX
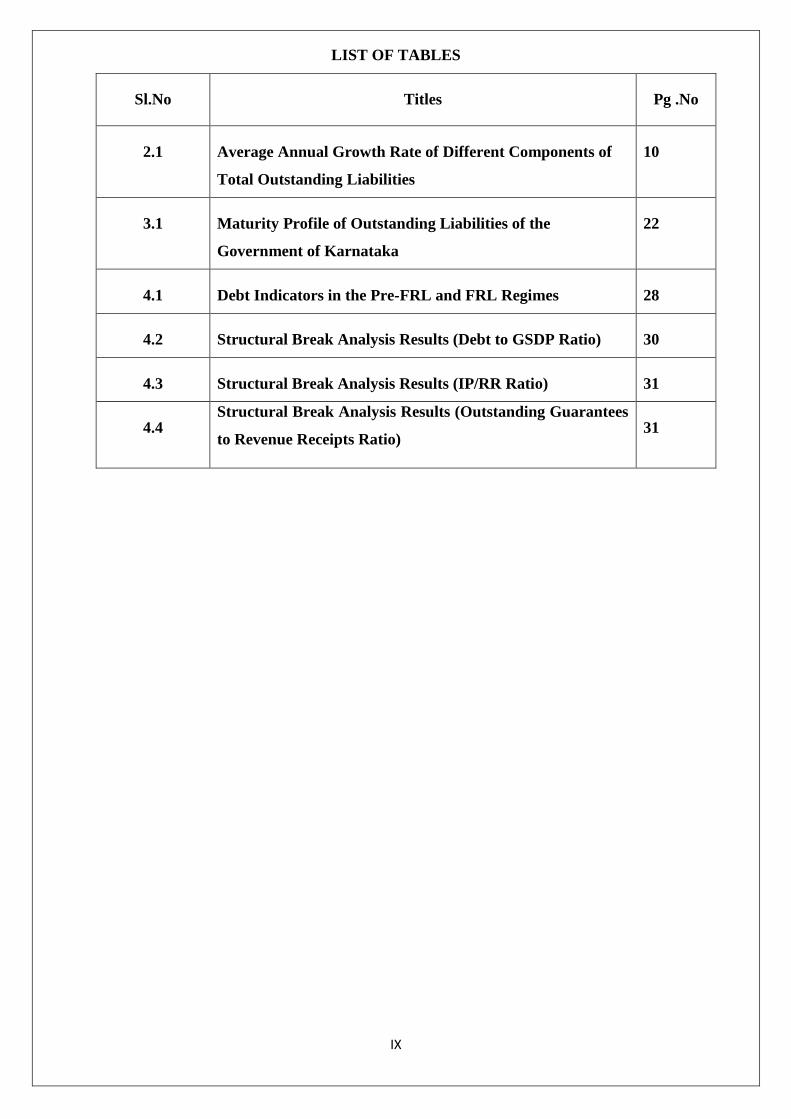
LIST OF TABLES
Sl.No Titles Pg .No
2.1 Average Annual Growth Rate of Different Components of
Total Outstanding Liabilities
10
3.1 Maturity Profile of Outstanding Liabilities of the
Government of Karnataka
22
4.1 Debt Indicators in the Pre-FRL and FRL Regimes 28
4.2 Structural Break Analysis Results (Debt to GSDP Ratio) 30
4.3 Structural Break Analysis Results (IP/RR Ratio) 31
4.4 Structural Break Analysis Results (Outstanding Guarantees
to Revenue Receipts Ratio) 31
X
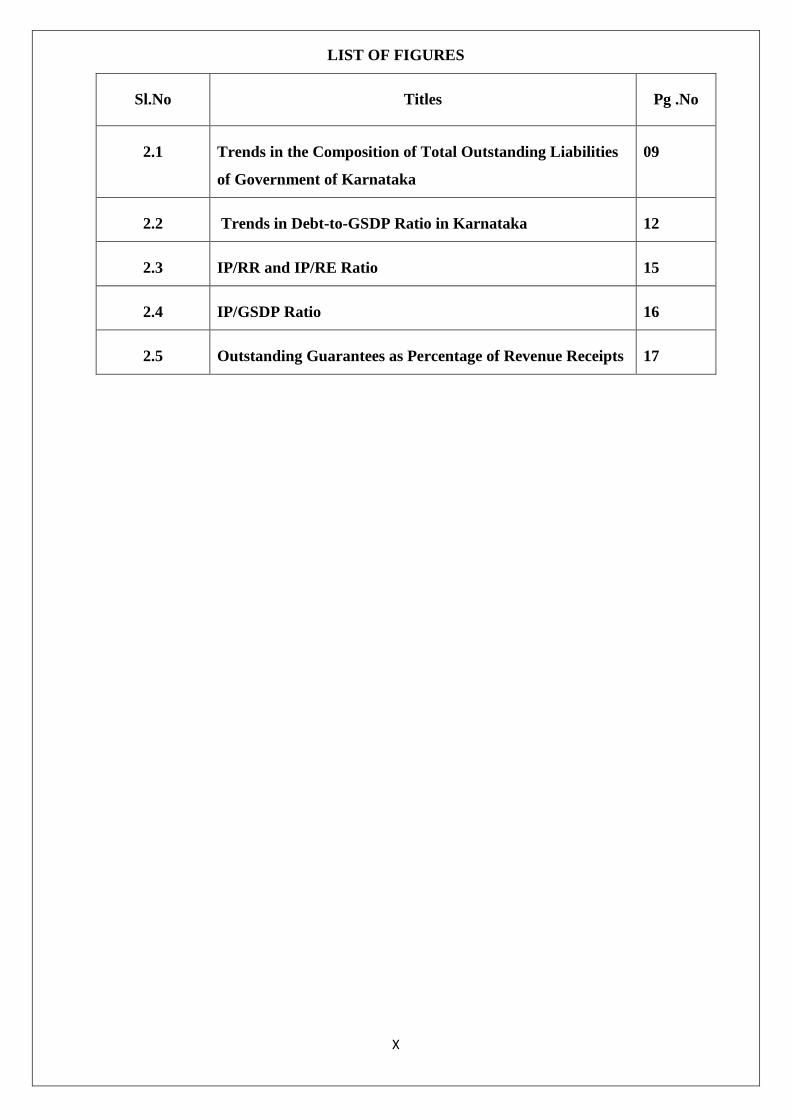
LIST OF FIGURES
Sl.No Titles Pg .No
2.1 Trends in the Composition of Total Outstanding Liabilities
of Government of Karnataka
09
2.2 Trends in Debt-to-GSDP Ratio in Karnataka 12
2.3 IP/RR and IP/RE Ratio 15
2.4 IP/GSDP Ratio 16
2.5 Outstanding Guarantees as Percentage of Revenue Receipts 17
- 1 -
An Analysis of Public Debt Management in Karnataka
1. INTRODUCTION
Public debt refers to all types of borrowings by governments to finance excess of expenditure
over revenue receipts and non-debt capital receipts. In other words, it refers to how much a
government owes to its lenders who can be individuals, businesses and even other
governments. In the present era, public debt has been regarded as a major tool of financing
government expenditure in both developed and developing countries. In the developing
countries, due to the low level of tax revenues, public debt assumes an even more important
role. The deficit budgets and financing of them by public debt are used as an anti-cyclical
device to secure economic stability in the advanced countries and as a mechanism to finance
economic development in the less developed economies. Since governments have an obligation
to maintain their debts at sustainable levels, a prudent debt management strategy has been put
in place by the governments. “Public debt management is the process of establishing and
executing a strategy for managing government’s debt in order to raise required amount of
funding, achieve its risk and cost objectives and to meet any other debt management goals that
a government may have set such as developing and maintaining an efficient market for
government securities” (GoI, 2015). As required by the legal acts passed by the Central
government from time to time, Government of Karnataka, like all other state governments in
India, has to ensure prudential debt management consistent with fiscal sustainability through
limits on state government’s borrowings and debts and deficits.
1.1. Need for the Study
Public debt management plays an important role in macro-economic policy. It is a well-
recognised fact that governments need efficient and effective public debt management as the
public debt portfolio is the largest portfolio in the economy and its impact can be felt across
generations. The debt position of the government is the indicator of the fiscal performance in
real terms because even a higher economic growth rate would lose importance if the level and
cost of public debt are not manageable. The sustainability of the budget, debt, and overall
financial stability also depend on the effectiveness of the debt management strategy. The
government is the largest borrower in any economy and remains continuously in the market.
The emergence of a large volume and variety of public debt in the spheres of its structure,
- 2 -
maturity pattern, servicing of debt, repayment etc. requires a proper debt management if the
objectives are to be realised in a planned and systematic manner. Therefore, a need was felt to
study the public debt position reflecting the composition, growth and burden of public debt in
Karnataka over the years and to analyse the debt management strategies followed by the
Government of Karnataka.
1.2. Overview of Karnataka’s Public Debt
Karnataka is one of the fast growing states in India which is on a mission to promote faster and
inclusive growth and the achievement of this mission largely depends on the status of the
finances of the state and its efforts towards fiscal consolidation. Karnataka’s relative fiscal
performance with reference to other states is considerably sound. The fiscal consolidation
efforts have been effective with all fiscal indicators contained well within stipulated limits of
KFRA, 2002.
A study of Karnataka’s fiscal experience since 1990-91 shows that the economy was quite
strong during the 1990s compared to other major states and also the national average and the
growth indicators were also strong. Irrespective of this, a fiscal crisis started appearing in the
state from 1995-96 onwards. The fiscal deficit escalated and debt servicing costs increased.
Decline in revenue receipts necessitated more borrowings. Such a situation could be attributed
to a number of reasons like increasing losses of PSEs, tacit subsidies in the social sector, slow
growth of tax and non-tax revenues and also the practice of OBBs on regular intervals to
finance loss-making PSUs and big infrastructure projects. The mounting pressure on state
revenue generating avenues and dependency on loans at the risk of a debt trap condition
convinced the state to formally adopt fiscal reform measures. The then elected government
took note of the degrading fiscal condition and brought out a white paper on state finances in
2000 to highlight the dismal reality of the state’s financial situation (GoK, 2001). The state
government also created structural bindings for fiscal management by the enactment of
necessary Fiscal Responsibility Legislations such as Karnataka Ceiling on Government
Guarantees Act, (KCGGA) 1999 and Karnataka Fiscal Responsibility Act, (KFRA) 2002 to
provide fiscal targets to the government. Subsequently, a series of debt management agendas
were undertaken and an administrative measure entitled MTFP was devised as an apparatus to
serve as a technical guide for the implementation of agendas and act as a performance
monitoring tool for reform yardsticks (World Bank, 2002). It was introduced in 2001 and has
been regularised till today.
- 3 -
Debt management reform was pursued by taking an important decision at the beginning of
reform itself that the government should shift from short-term/high cost loan (from market
sources) to long term/low cost loans from bilateral and multilateral agencies such as World
Bank (GoK, 2001). Thus, the practice of OBBs was purposefully discouraged by opting for
budgetary grants and restricting mounting debt servicing payments (GoK, 2002). There has
also been a structural shift in the composition of outstanding liabilities of the state since 2005-
06 and the share of internal debt (mostly comprising market borrowings) has been increasing
and the share of Central loans to the state has substantially come down. This could be attributed
to the guidelines put forward by the Twelfth Finance Commission which stipulated that the
Central government should not act an intermediary for future lending and allow the states to
approach the market directly. With the help of FRLs and successful implementation of MTFPs,
the fiscal deficit was reduced to 2.83% of the GSDP by 2004-05 and 2006-07 onwards, the
state has also ensured that outstanding debt as a percentage of GSDP doesn’t exceed the
stipulated KFRA target of 25% of GSDP, thereby achieving KFRA targets much ahead of the
timeline prescribed. With the amendments made in 2014 to KFRA (2002), OBBs were included
as a part of total liabilities. Thus, the State Government has been on the path of fiscal
consolidation ever since the passing of FRLs and has met the pre-conditions set for the states
to earn eligibility for participation in the Central government’s debt-swapping scheme and debt
relief measures which are meant to provide them relief in their indebtedness to the Centre.
1.3. Review of Literature
This section consists of prominent literature reviews pertaining to Public Debt Management. It
includes both national and international studies related to Public Debt Management.
Lakshmanan and Kausaliya (2015) in their paper on ‘Public Debt Management in India and
Related Issues’ have given a brief introduction to the evolution of Public Debt Management in
India and have discussed the international sovereign debt management experience. Also,
guidelines issued by IMF have been compared with Indian conditions. Their paper attempts to
review the debt management practices followed by the GoI while setting out the issues and
challenges to public debt management in India. The paper used unrestricted VAR framework
supported by two means t-test to test the impact of the availability of system liquidity and its
cost on the primary yield of G-Secs. Their analysis found that though borrowings of the
government are sovereign, along with many other factors, sudden shocks in short term factors
- 4 -
like availability of funds and the cost of such funds will have an impact on the yield of the G-
Secs in the primary market.
Yadav (2011) analysed the trends in the composition, growth and burden of public debt of state
governments using simple statistical tools. The time period of the study was from 1990 to 2010.
It was observed that by 2009-10, the dependence of state governments on Central loans had
decreased and reliance on market borrowings had increased. It was also found that the
Outstanding/SDP ratio shows fluctuations in the case of state governments during the study
period.
In the article ‘Analysis of Public Debt Management Practices and Its Relative Impact on Indian
Banks’ published by Zafar et al. (2015), the authors throw light on how the recent developments
in Indian financial markets have changed the dimensions of the debt market. The authors say
that the Central government securities occupy nearly 70% of the total debt market in India. The
Reserve Bank of India, despite tight liquidity conditions during 2012-13, conducted the
government’s market borrowing programme smoothly. In order to encourage savings in the
rising inflation period, the Reserve Bank issued inflation indexed bonds to risk-averse
investors. The study found that almost 31 per cent of the Central government market
borrowings were raised through the issuance of dated securities with maturity of 0-5, 10-15,
15-20 years and among these securities, investor demand was more for 0-5 and 10-15 years.
They also state that the weighted average yield of dated government securities declined and the
weighted average maturity increased.
Lakshmanan (2018) analysed the debt profile of Kerala State, its fiscal experience and also
fiscal correction measures adopted by the state to overcome fiscal instability. The author
reveals how the increasing debt and deficits have been a major problem in the state and that
the limitless accumulation of debt may finally end up causing debt insolvency. The paper
attempts a test of public debt solvency in Kerala, based on a univariate inter-temporal budget
constraint model. The data period is from 1980-81 to 2016-17. The paper also conducted
stationarity tests which showed that public debt is leading to insolvency in Kerala. The author
expresses concern that if the current policy is pursued continuously, the government may not
be able to service its debt in the long run.
1.4. Research Gap
While there have been numerous studies conducted for assessing the debt profile of the Central
government, very few such studies have been made at the state level to analyse the debt position
- 5 -
and debt management strategies of state governments. However, there are no recent studies
looking at the public debt scenario and public debt management strategies adopted by the
Government of Karnataka. Also, previous studies in this area do not consider the level of
compliance of Karnataka Government with the fiscal consolidation measures put forward by
various laws.
1.5. Objectives of the Study
1. To analyse the trends and patterns in the composition and growth of public debt in
Karnataka from 1990-91 to 2017-18.
2. To review the policy changes and their impact on public debt in Karnataka.
3. To analyse the public debt management strategies in Karnataka.
1.6. Research Methodology
The present study is exploratory and descriptive in nature. The study uses secondary data
available in the public domain and the time period covered for the study is from 1990-91 to
2017-18. The major databases explored for the study are:
Reserve Bank of India: Handbook of Statistics on State Government Finances
(2010)
Reserve Bank of India: State Finances: A Study of Budgets (For Various Years)
Status Paper on Government Debt (2017-18) published by Government of India,
Ministry of Finance, Department of Economic Affairs, Budget Division.
Government of Karnataka: Economic Survey ( 2017-18)
Government of Karnataka: Medium Term Fiscal Plans (For Various Years)
Government of Karnataka: Report of the Comptroller and Auditor General of India
on State Finances (March 2016)
In addition to the above sources, provisions of FRLs passed by the state government, reports
of the Twelfth, Thirteenth and Fourteenth Finance Commissions and also existing studies on
the subject were explored. The data thus collected have been processed to suit the needs of the
research. The study uses descriptive statistics and time series econometric techniques to analyse
the data.
- 6 -
1.7. Policy Framework for Public Debt Management in Karnataka
The government of Karnataka has taken effective measures from time to time to consolidate
its fiscal roadmap and to manage its public debt prudently. A brief summary of the FRLs in
Karnataka is presented below:
Karnataka Ceiling on Government Guarantees Act (KCGGA), 1999 provides that the
outstanding guarantees on 1st April of any year should not exceed 80% of the state’s revenue
receipts of the second preceding year. Since the enactment of this legislation, the prescribed
limit has never been breached by the state.
Karnataka Fiscal Responsibility Act (KFRA), 2002 was passed by the state following the
Union government’s initiative to pass an umbrella legislation called FRBM Act (2003), a rule-
based fiscal correction mechanism. The act provides that the fiscal deficit of the state doesn’t
exceed 3% of its GSDP and provides this be achieved by 2005-06 and also that the outstanding
debt as a percentage of GSDP doesn’t exceed 25% of GSDP. The state’s compliance with this
has been phenomenal and its fiscal deficit was 2.83% of the GSDP in 2004-05 itself and from
2006-07 onwards, its outstanding debt has remained below 25% of GSDP. In compliance with
KFRA (2002), the state has been presenting a Medium Term Fiscal Plan (MTFP) before the
Legislature every year, which includes medium-term fiscal objectives of the government, an
evaluation of the performance of the prescribed fiscal indicators in the previous year, the
strategic priorities of the state in managing its liabilities with conformity to fiscal management
principles and sets out four - year rolling targets i.e. Medium Term Fiscal Projections for four
years including the current year.
Following the guidelines of the Twelfth Finance Commission, after 2004-05, the Central
government stopped acting as an intermediary for future lending and this allowed the state to
approach the market directly and rely more on open market borrowings as against increased
dependence on Central loans and this reduced the burden of interest payments for the state
government. The Twelfth Finance Commission has also framed a scheme of debt waiver based
on fiscal performance linked to the reduction of revenue deficit and control of fiscal deficit of
the states. The quantum of debt write-off of the repayment was linked to absolute amount by
which the revenue deficit has reduced in each successive year during the award period. If the
revenue deficit is brought down to zero, the entire repayment during the award period of the
Twelfth Finance Commission will be written off. It was called Debt Consolidation and Relief
Facility (FPI, 2017). Karnataka has also gained benefit under this because of its outstanding
- 7 -
achievement in reducing its revenue deficit to nil and in improving the state’s fiscal
performance.
A Debt Swap Scheme (DSS) was formulated by the government of India realising the
mounting burden of interest payments on the states and to supplement their efforts towards
fiscal management. The scheme was in operation from 2002-03 to 2004-05. The scheme
capitalised on the current low interest regime, to enable states to prepay expensive loans
contracted from GoI with low coupon-bearing small savings and open market loans. This
scheme covered outstanding high cost loans with interest rate of 13% and above. Total debt
swapped under DSS for Karnataka during 2002-03 to 2004-05 was Rs. 5642 crore (FPI, 2017).
Amendments to KFRA (2002)
Karnataka Government amended KFRA, 2002 in the year 2009 and 2011. The fiscal deficit
target was hiked to 3.5% of GSDP as a counter recession measure. The target of debt ratio was
raised to 25.2% of the estimated GSDP to be achieved by March 2015. These amendments
were due to the adoption of the measures prescribed by GoI based on the Thirteenth Finance
Commission recommendations as a condition precedent to release specific grants and debt
relief measures to the state. In the year 2014, the act was amended to include OBBs that are to
be paid from the state’s budget in the definition of the term ‘Total Liabilities’ in order to
provide a true picture of the sustainability of debt.
1.8. Limits on the Borrowing Powers of the State Government
The Constitution of India has empowered the states under article 293, clause (1) to borrow
within India on the security of the Consolidated Funds of the respective states and also to give
guarantee to loans raised by their subordinate authorities or authorities created by the state
legislatures and from the Central governments (Mithani, 2019).
The Constitution has exclusively reserved the right to borrow abroad to the Central government
with a view to avoid adverse economic and political consequences arising from the freedom of
the states to borrow from abroad. Moreover, even the internal borrowing powers of the state
governments are subjects to limitations: 1) as may be imposed by the state legislatures 2) that
if the Central government has guaranteed an outstanding loan of the state or if the state owes a
debt to the Central Government, no fresh loan can be raised. The constitutional restrictions are
placed on the state’s internal borrowing power mainly with a view to avoid adverse monetary
and fiscal effects arising from competitive and also the unlimited borrowing power of the state.
- 8 -
In India, RBI keeps Central and State Government funds and co-ordinates the borrowings of
the Central and State Governments. It floats all State Governments’ loans. While deciding upon
the state governments’ market borrowings, the RBI consults the Planning Commission and the
Union Ministry of Finance.
2. TRENDS AND PATTERNS IN PUBLIC DEBT POSITION OF KARNATAKA
2.1. Structure and Composition of Karnataka’s Public Debt
Debt receipts are the main source of revenue for the state governments in India. As per the
budget calculations, public debt includes borrowings from internal sources, loans and advances
from the Central government and provident funds, small savings etc. It does not include non
interest bearing other obligations. For the purpose of analysis, the outstanding debt of
Karnataka is classified into
i) Total internal debt
ii) Loans and advances from the Central government
iii) Other liabilities
The components of total internal debt are market borrowings, special securities issued to
National Small Savings Fund, Ways and Means Advances from the RBI and loans from banks
and other financial institutions such as LIC, GIC, NABARD, NCDC, SBI and other banks.
Other liabilities include provident funds, reserve funds, deposits and advances and contingency
funds.
2.1.1. Trends in the Composition of Total Outstanding Liabilities of Government of
Karnataka from 1990-91 to 2018-19
The analysis of trends and patterns in the composition of public debt in Karnataka gives us a
picture of the share of each component of outstanding liabilities in the total liabilities figure,
how their shares have changed over three decades, and also helps us to link the role of various
policies in causing such structural shifts.
- 9 -
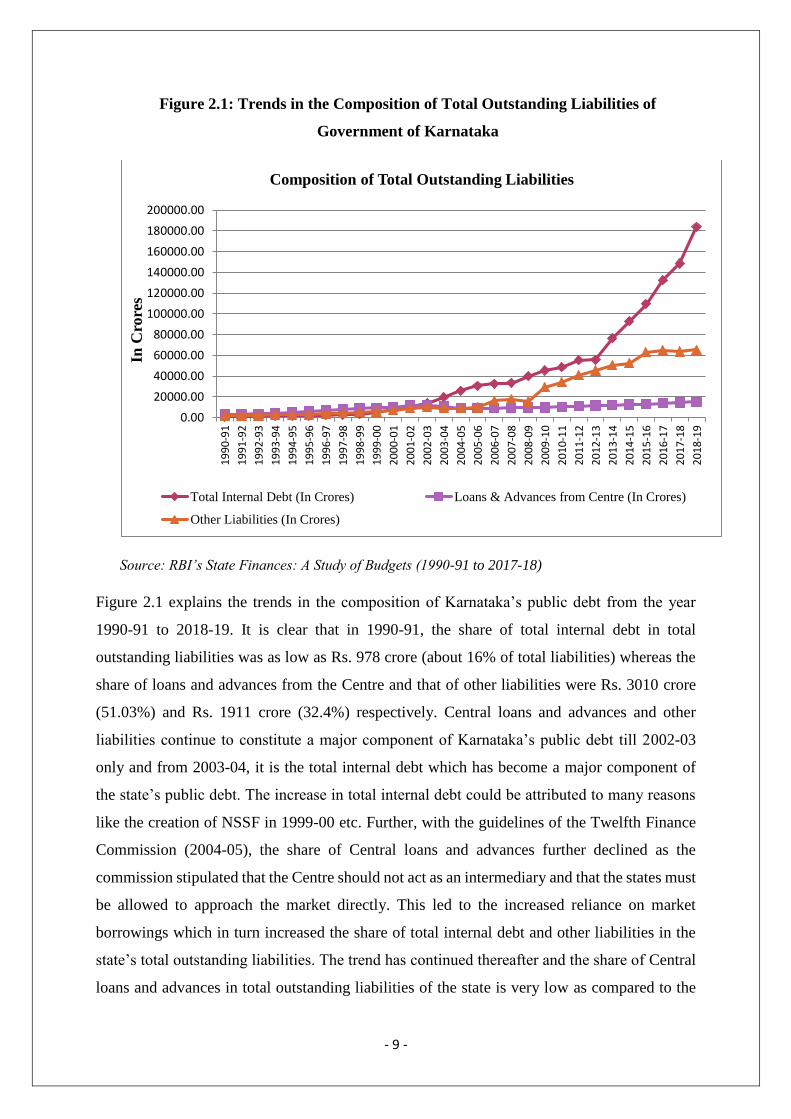
Figure 2.1: Trends in the Composition of Total Outstanding Liabilities of
Government of Karnataka
Source: RBI’s State Finances: A Study of Budgets (1990-91 to 2017-18)
Figure 2.1 explains the trends in the composition of Karnataka’s public debt from the year
1990-91 to 2018-19. It is clear that in 1990-91, the share of total internal debt in total
outstanding liabilities was as low as Rs. 978 crore (about 16% of total liabilities) whereas the
share of loans and advances from the Centre and that of other liabilities were Rs. 3010 crore
(51.03%) and Rs. 1911 crore (32.4%) respectively. Central loans and advances and other
liabilities continue to constitute a major component of Karnataka’s public debt till 2002-03
only and from 2003-04, it is the total internal debt which has become a major component of
the state’s public debt. The increase in total internal debt could be attributed to many reasons
like the creation of NSSF in 1999-00 etc. Further, with the guidelines of the Twelfth Finance
Commission (2004-05), the share of Central loans and advances further declined as the
commission stipulated that the Centre should not act as an intermediary and that the states must
be allowed to approach the market directly. This led to the increased reliance on market
borrowings which in turn increased the share of total internal debt and other liabilities in the
state’s total outstanding liabilities. The trend has continued thereafter and the share of Central
loans and advances in total outstanding liabilities of the state is very low as compared to the
0.00
20000.00
40000.00
60000.00
80000.00
100000.00
120000.00
140000.00
160000.00
180000.00
200000.001
99
0-9
1
19
91
-92
19
92
-93
19
93
-94
19
94
-95
19
95
-96
19
96
-97
19
97
-98
19
98
-99
19
99
-00
20
00
-01
20
01
-02
20
02
-03
20
03
-04
20
04
-05
20
05
-06
20
06
-07
20
07
-08
20
08
-09
20
09
-10
20
10
-11
20
11
-12
20
12
-13
20
13
-14
20
14
-15
20
15
-16
20
16
-17
20
17
-18
20
18
-19
In C
rore
s
Composition of Total Outstanding Liabilities
Total Internal Debt (In Crores) Loans & Advances from Centre (In Crores)
Other Liabilities (In Crores)
- 10 -
magnitude of total internal debt and other liabilities. As on 2018-19, the share of total internal
debt, Central loans and advances and other liabilities in total outstanding liabilities are Rs.
183930 crore (69.51%), Rs. 15210 crore (5.75%) and Rs. 65460 crore (24.74%) respectively.
The composition analysis of the total outstanding liabilities of Karnataka for the period 1990-
91 to 2018-19 indicates the following major trend:
i) The share of total internal debt which is raised by the state on its own has increased and
market borrowings have been the major contributor.
ii) In the period 1990-91 to 2005-06, Central loans were important, but afterwards, states
were allowed to raise loans from the market directly and consequently, the share of
Central loans and advances has declined and this has reduced the problem of state’s
indebtedness to the Centre.
2.2. Growth of Public Debt in Karnataka: From 1990-91 to 2018-19
A study of the growth of the state’s public debt becomes important in the context of the ever
increasing size of the government’s borrowings. Due to the paucity of internal resources, the
state government cannot sustain the large plan outlay; hence, it has to resort to public
borrowings. Here, what is important is not the mere increase in the size of state debt but its
effective utilisation for the production of assets, which will ultimately result in the generation
of additional revenue to the state.
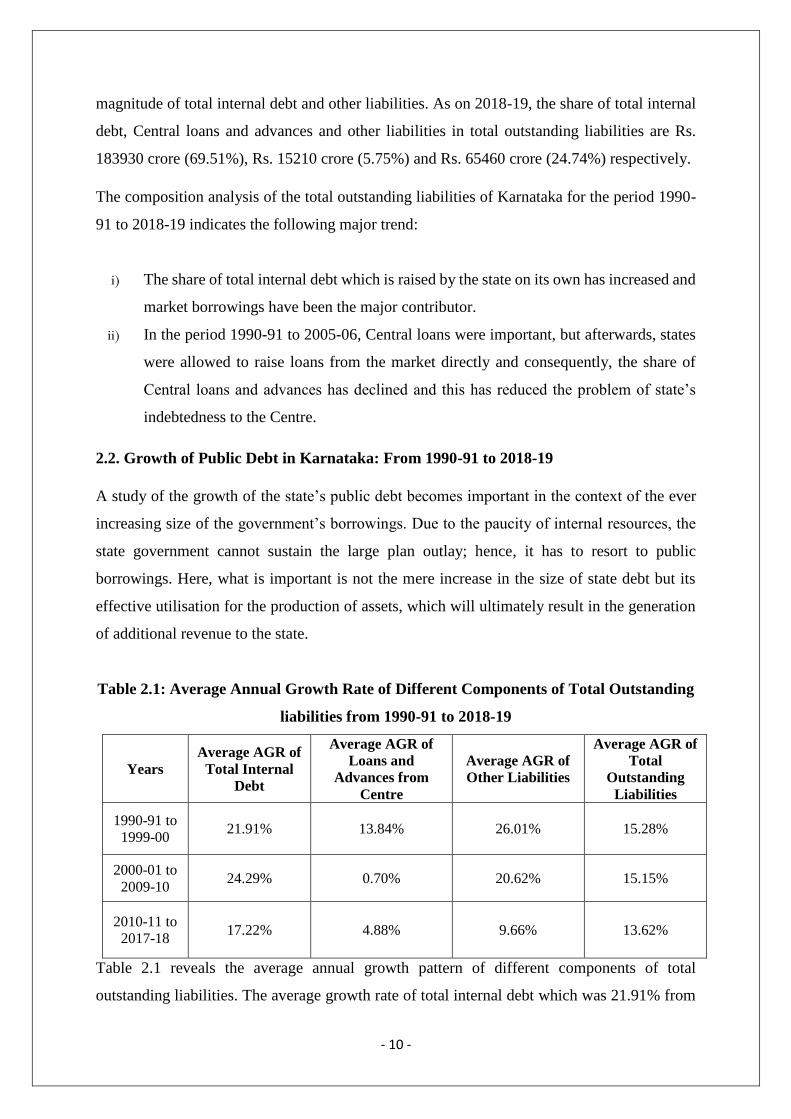
Table 2.1: Average Annual Growth Rate of Different Components of Total Outstanding
liabilities from 1990-91 to 2018-19
Years
Average AGR of
Total Internal
Debt
Average AGR of
Loans and
Advances from
Centre
Average AGR of
Other Liabilities
Average AGR of
Total
Outstanding
Liabilities
1990-91 to
1999-00 21.91% 13.84% 26.01% 15.28%
2000-01 to
2009-10 24.29% 0.70% 20.62% 15.15%
2010-11 to
2017-18 17.22% 4.88% 9.66% 13.62%
Table 2.1 reveals the average annual growth pattern of different components of total
outstanding liabilities. The average growth rate of total internal debt which was 21.91% from
- 11 -
1990-91 to 1999-2000, increased to 24.29% between 2000-01 and 2009-10. However, it saw a
gradual decline after 2010-11 and it was about 17% during 2010-11 to 2018-19. The growth
pattern of loans and advances from the Central government shows that the growth rate has
declined from 13.84% during the 1990s to 0.70% during 2000-01 to 2009-10. This drastic fall
was mainly on account of the state receiving the guidelines of the Twelfth Finance
Commission, due to which the growth rate followed a negative trend for a couple of years
between 2003-04 and 2006-07. From 2010-11 to 2017-18, the average annual growth rate of
Central loans and advances is 4.88%. A look at the other liabilities figure shows that the average
growth rate of other liabilities which was 26.01% during 1990-91 to 1999-2000, increased to
20.62% between 2000-01 and 2009-10. However, it gradually declined after 2010-11 and it
was about 9.66% during 2010-11 to 2018-19. Thus, with various components growing at
different rates, the average annual growth rate of total outstanding liabilities was about 15.28%
between 1990-92 and 1999-2000, 15.15% during 2000-01 and 2009-10 and 13.62% between
2010-11 and 2018-19.
2.3. Debt-to-GSDP Ratio
Debt to GSDP ratio is one of the rule-based fiscal discipline parameters. The growth of the
outstanding debt of Karnataka when expressed in relation to GSDP makes the analysis more
meaningful. The debt-to-GSDP ratio is the ratio of a state’s public debt to its GSDP. By
comparing what the state owes with what it produces, the debt-to-GSDP ratio indicates the
growth of the economy in real terms and also its ability to pay back its debts. The trends in
different components of Karnataka’s public debt as a ratio to GSDP from 1990-91 to 2018-19
are depicted in the following figure:
- 12 -
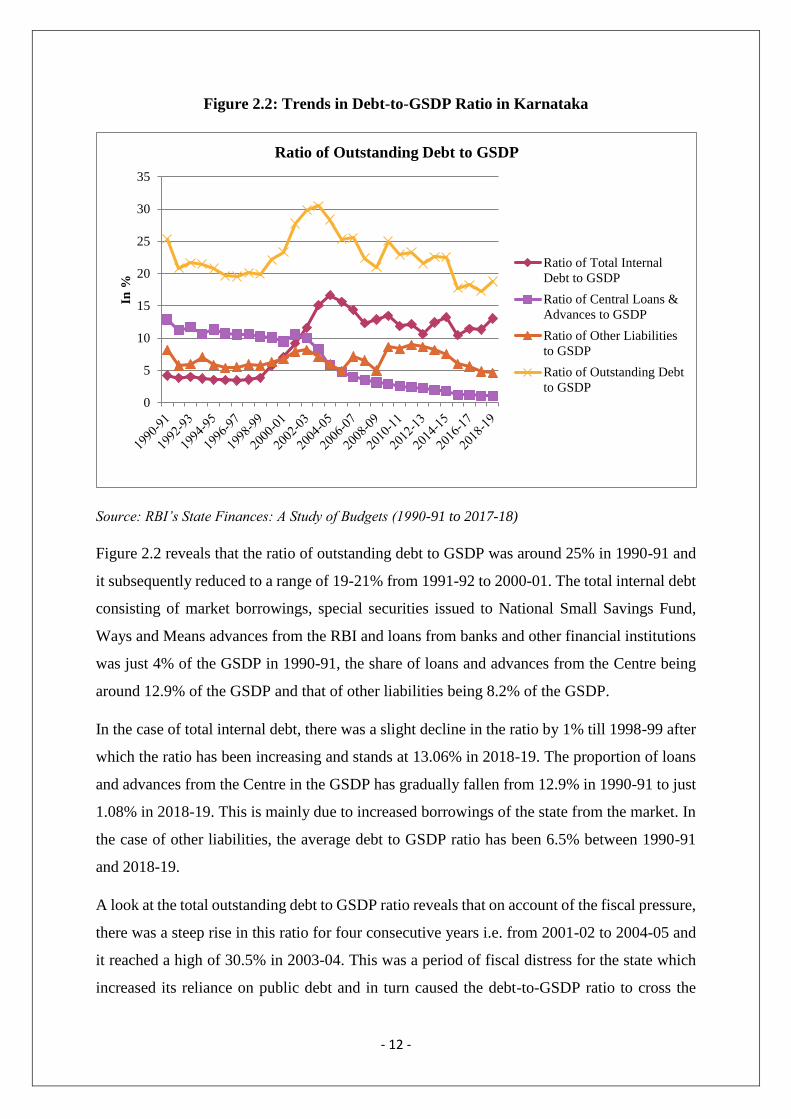
Figure 2.2: Trends in Debt-to-GSDP Ratio in Karnataka
Source: RBI’s State Finances: A Study of Budgets (1990-91 to 2017-18)
Figure 2.2 reveals that the ratio of outstanding debt to GSDP was around 25% in 1990-91 and
it subsequently reduced to a range of 19-21% from 1991-92 to 2000-01. The total internal debt
consisting of market borrowings, special securities issued to National Small Savings Fund,
Ways and Means advances from the RBI and loans from banks and other financial institutions
was just 4% of the GSDP in 1990-91, the share of loans and advances from the Centre being
around 12.9% of the GSDP and that of other liabilities being 8.2% of the GSDP.
In the case of total internal debt, there was a slight decline in the ratio by 1% till 1998-99 after
which the ratio has been increasing and stands at 13.06% in 2018-19. The proportion of loans
and advances from the Centre in the GSDP has gradually fallen from 12.9% in 1990-91 to just
1.08% in 2018-19. This is mainly due to increased borrowings of the state from the market. In
the case of other liabilities, the average debt to GSDP ratio has been 6.5% between 1990-91
and 2018-19.
A look at the total outstanding debt to GSDP ratio reveals that on account of the fiscal pressure,
there was a steep rise in this ratio for four consecutive years i.e. from 2001-02 to 2004-05 and
it reached a high of 30.5% in 2003-04. This was a period of fiscal distress for the state which
increased its reliance on public debt and in turn caused the debt-to-GSDP ratio to cross the
0
5
10
15
20
25
30
35
In %
Ratio of Outstanding Debt to GSDP
Ratio of Total Internal
Debt to GSDP
Ratio of Central Loans &
Advances to GSDP
Ratio of Other Liabilities
to GSDP
Ratio of Outstanding Debt
to GSDP
- 13 -
stipulated KFRA (2002) target of 25%. However, with a series of debt reforms and debt
management agendas, the situation came under control and the ratio was brought back to
22.37% in 2007-08. With an amendment made to KFRA (2002) in 2009, a one-time relaxation
was provided as one of the counter-recession measures by hiking the debt-to GSDP ratio to
25.2% of the GSDP, but the state was successful in maintaining a debt-to-GSDP ratio of less
than the prescribed numerical ceiling even during the period of recession. From 2010-11
onwards, the debt to GSDP ratio has never crossed the 25% ceiling and has fluctuated between
17-22% till date and as on 2018-19, the debt to GSDP ratio stands at 18.79%.
2.4. Burden of Public Debt on the Government of Karnataka
The burden of public debt has been a subject of acrimonious debate for any government.
Burden of public debt on any government refers to the burden of paying the annual interest
payments on government loans and also includes sacrifice and effects on the community
through a rise in taxation at the time of repayment (Bhatia, 2008). There have been several
discussions stressing the need for fixing a statutory limit to the government borrowing. This
opinion is based on the belief that governments have been borrowing excessively and that the
burden of public debt has been increasing day by day.
2.4.1. Interest Payments of the State
Payment of interest is a true money burden which is to be met from the current revenue. There
is a rising concern with the ever-increasing interest payments since this can cause a setback in
other developmental activities due to non-availability of funds. Debt and debt services
reduction, in parallel with the necessary policy changes, can smooth the path of reform,
improve the programmes’ credibility with private investors and contribute to fiscal adjustment
(Yadav, 2011). The financial crisis faced by the state in mid and late 1990s, particularly 1995-
96, was largely due to the rising burden of interest payments which increased the revenue
expenditure of the state. However, the trend has been changed with the enactment of FRLs and
other policy interventions of the Central government.
In Karnataka, the total interest payments of the state government were just Rs. 436 crore in
1990-91. But by 1999-2000, they increased to Rs. 2012 crore and the annual rate of growth of
interest payments reached up to 24%. Realising the mounting burden of interest payments, GoI
formulated a Debt Swap Scheme which was in operation from 2002-03 to 2004-05 and
supplemented the efforts of the states towards fiscal and debt management. It capitalised on
- 14 -
the prevailing low interest regime to enable states to prepay expensive loans contracted from
GoI with low coupon bearing small savings loans and open market loans. This scheme covered
outstanding high cost loans with an interest rate of 13% and above. Under this scheme, a total
debt of Rs. 5642 crore was swapped during 2002-03. This greatly contributed to a reduction in
the burden of interest payments for the state because prior to 2005-06, the share of loans and
advances from the Centre in total public debt was higher and most of it was swapped under this
scheme. After 2005-06, we see a gradual reduction in the burden of interest payments due to
the guidelines of the Twelfth Finance Commission which allowed the states to approach the
market directly to raise borrowings and this reduced the dependence on high cost Central loans
with interest rate as high as 13%. From 2005-06 onwards, the state is borrowing heavily from
the open market at a low interest rate of about 6-7% and this shift in the composition of public
debt has reduced the burden of interest payments for the state.
The Twelfth Finance Commission also framed a scheme of debt waiver based on fiscal
performance linked to the reduction of revenue deficit and fiscal deficit of the states.
Accordingly, the state received debt relief and interest relief of about Rs. 1430 crore and Rs.
1310 crore respectively under this facility. Thereafter, the growth of interest payments has been
moderate except for the year 2009-10 in which it reached its all-time high of 25.99% which
could be attributed to increased borrowings owing to the global economic slowdown. From
2010-11 to 2017-18, the average annual growth rate of interest payments has been 12.18%.
2.4.2. Interest Payments/Revenue Receipts Ratio, Interest Payments/ GSDP Ratio,
Interest Payments/Revenue Expenditure Ratio
The burden of interest payments on the state can be analysed meaningfully by expressing it in
relation to the state’s revenue receipts, revenue expenditure and the GSDP.
IP/RR Ratio
The government tries to fulfill its interest payments obligation from its revenue receipts and
IP/RR ratio is one such indicator which is important to understand the extent of burden of debt
on the government and what proportion of the state’s revenue receipts are available for other
expenditure. The Fourteenth Finance Commission stipulated that fiscal liabilities like interest
payments and stock of debt be linked to revenue receipts rather than GSDP. The IP/RR ratio of
the state averaged 12.4% between 1990-91 and 1999-2000. With the increasing debt burden,
this figure increased to 20% by 2002-03. However, it was stabilised at 10-12% till 2009-10
after which the average IP/RR ratio has been 9% till 2017-18. By maintaining an IP/RR ratio
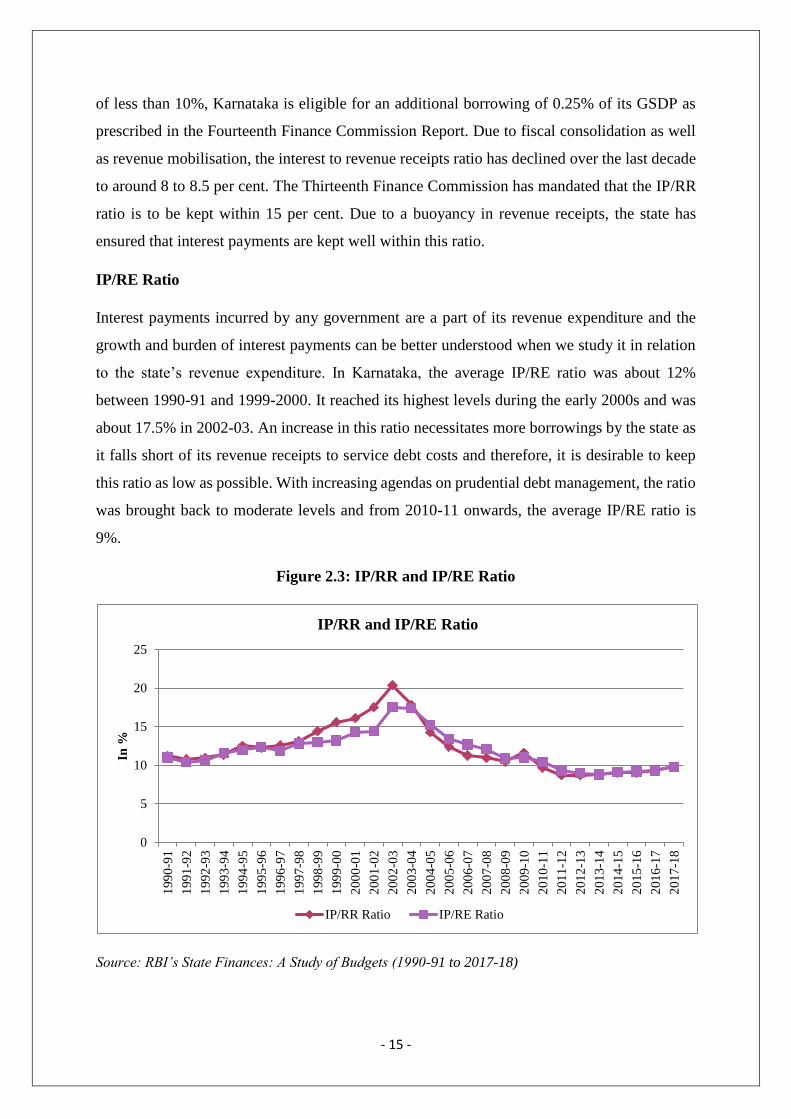
- 15 -
of less than 10%, Karnataka is eligible for an additional borrowing of 0.25% of its GSDP as
prescribed in the Fourteenth Finance Commission Report. Due to fiscal consolidation as well
as revenue mobilisation, the interest to revenue receipts ratio has declined over the last decade
to around 8 to 8.5 per cent. The Thirteenth Finance Commission has mandated that the IP/RR
ratio is to be kept within 15 per cent. Due to a buoyancy in revenue receipts, the state has
ensured that interest payments are kept well within this ratio.
IP/RE Ratio
Interest payments incurred by any government are a part of its revenue expenditure and the
growth and burden of interest payments can be better understood when we study it in relation
to the state’s revenue expenditure. In Karnataka, the average IP/RE ratio was about 12%
between 1990-91 and 1999-2000. It reached its highest levels during the early 2000s and was
about 17.5% in 2002-03. An increase in this ratio necessitates more borrowings by the state as
it falls short of its revenue receipts to service debt costs and therefore, it is desirable to keep
this ratio as low as possible. With increasing agendas on prudential debt management, the ratio
was brought back to moderate levels and from 2010-11 onwards, the average IP/RE ratio is
9%.
Figure 2.3: IP/RR and IP/RE Ratio
Source: RBI’s State Finances: A Study of Budgets (1990-91 to 2017-18)
0
5
10
15
20
25
199
0-9
1
199
1-9
2
199
2-9
3
199
3-9
4
199
4-9
5
199
5-9
6
199
6-9
7
199
7-9
8
199
8-9
9
199
9-0
0
200
0-0
1
200
1-0
2
200
2-0
3
200
3-0
4
200
4-0
5
200
5-0
6
200
6-0
7
200
7-0
8
200
8-0
9
200
9-1
0
201
0-1
1
201
1-1
2
201
2-1
3
201
3-1
4
201
4-1
5
201
5-1
6
201
6-1
7
201
7-1
8
In %
IP/RR and IP/RE Ratio
IP/RR Ratio IP/RE Ratio
- 16 -
IP/GSDP Ratio
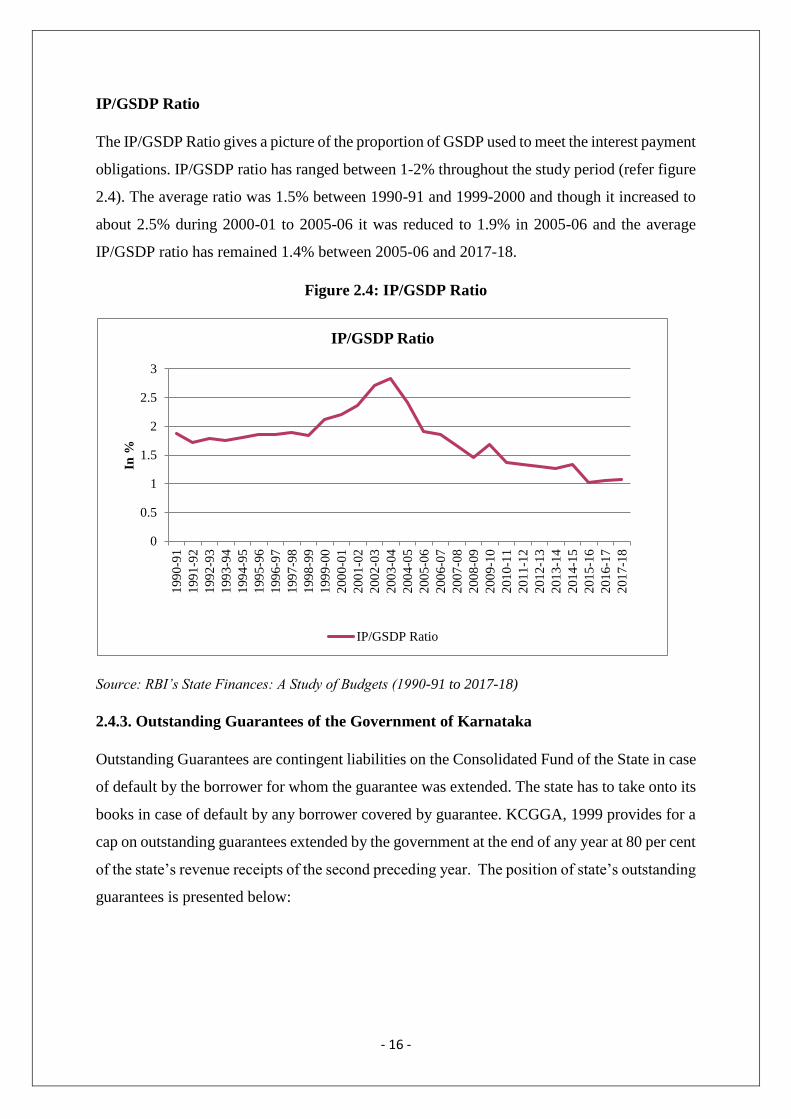
The IP/GSDP Ratio gives a picture of the proportion of GSDP used to meet the interest payment
obligations. IP/GSDP ratio has ranged between 1-2% throughout the study period (refer figure
2.4). The average ratio was 1.5% between 1990-91 and 1999-2000 and though it increased to
about 2.5% during 2000-01 to 2005-06 it was reduced to 1.9% in 2005-06 and the average
IP/GSDP ratio has remained 1.4% between 2005-06 and 2017-18.
Figure 2.4: IP/GSDP Ratio
Source: RBI’s State Finances: A Study of Budgets (1990-91 to 2017-18)
2.4.3. Outstanding Guarantees of the Government of Karnataka
Outstanding Guarantees are contingent liabilities on the Consolidated Fund of the State in case
of default by the borrower for whom the guarantee was extended. The state has to take onto its
books in case of default by any borrower covered by guarantee. KCGGA, 1999 provides for a
cap on outstanding guarantees extended by the government at the end of any year at 80 per cent
of the state’s revenue receipts of the second preceding year. The position of state’s outstanding
guarantees is presented below:
0
0.5
1
1.5
2
2.5
3
199
0-9
1
199
1-9
2
199
2-9
3
199
3-9
4
199
4-9
5
199
5-9
6
199
6-9
7
199
7-9
8
199
8-9
9
199
9-0
0
200
0-0
1
200
1-0
2
200
2-0
3
200
3-0
4
200
4-0
5
200
5-0
6
200
6-0
7
200
7-0
8
200
8-0
9
200
9-1
0
201
0-1
1
201
1-1
2
201
2-1
3
201
3-1
4
201
4-1
5
201
5-1
6
201
6-1
7
201
7-1
8
In %
IP/GSDP Ratio
IP/GSDP Ratio
- 17 -
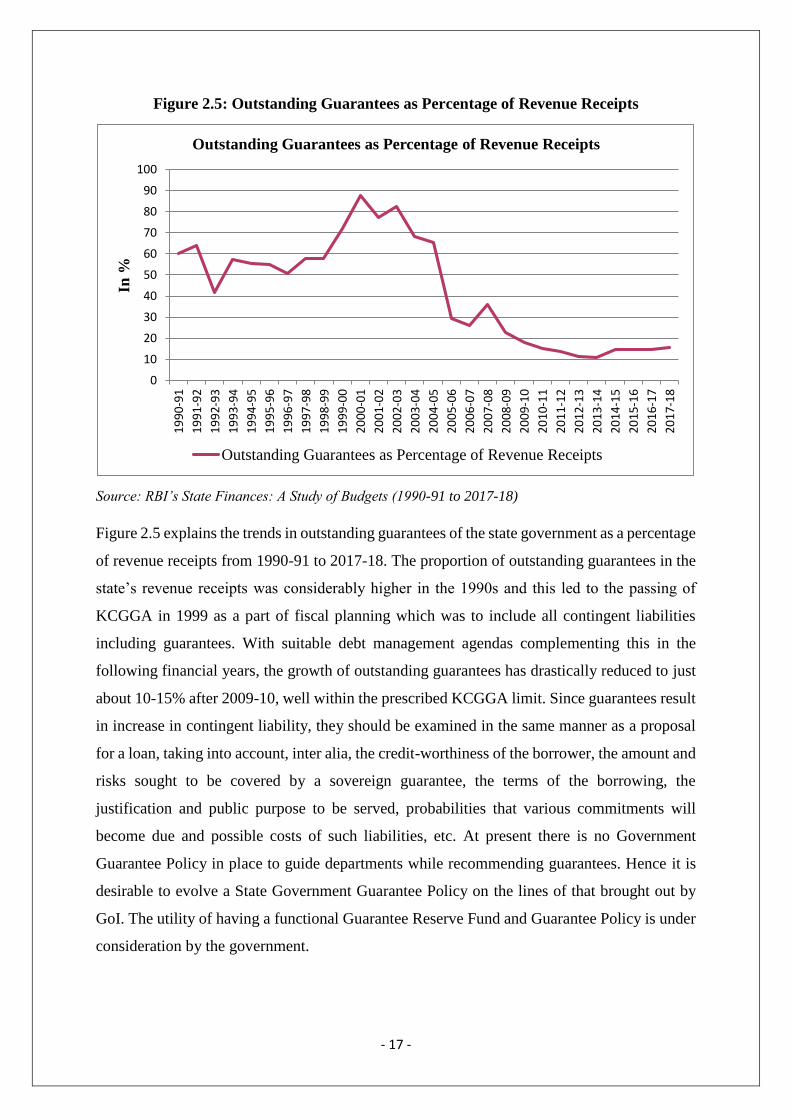
Figure 2.5: Outstanding Guarantees as Percentage of Revenue Receipts
Source: RBI’s State Finances: A Study of Budgets (1990-91 to 2017-18)
Figure 2.5 explains the trends in outstanding guarantees of the state government as a percentage
of revenue receipts from 1990-91 to 2017-18. The proportion of outstanding guarantees in the
state’s revenue receipts was considerably higher in the 1990s and this led to the passing of
KCGGA in 1999 as a part of fiscal planning which was to include all contingent liabilities
including guarantees. With suitable debt management agendas complementing this in the
following financial years, the growth of outstanding guarantees has drastically reduced to just
about 10-15% after 2009-10, well within the prescribed KCGGA limit. Since guarantees result
in increase in contingent liability, they should be examined in the same manner as a proposal
for a loan, taking into account, inter alia, the credit-worthiness of the borrower, the amount and
risks sought to be covered by a sovereign guarantee, the terms of the borrowing, the
justification and public purpose to be served, probabilities that various commitments will
become due and possible costs of such liabilities, etc. At present there is no Government
Guarantee Policy in place to guide departments while recommending guarantees. Hence it is
desirable to evolve a State Government Guarantee Policy on the lines of that brought out by
GoI. The utility of having a functional Guarantee Reserve Fund and Guarantee Policy is under
consideration by the government.
0
10
20
30
40
50
60
70
80
90
1001
99
0-9
1
19
91
-92
19
92
-93
19
93
-94
19
94
-95
19
95
-96
19
96
-97
19
97
-98
19
98
-99
19
99
-00
20
00
-01
20
01
-02
20
02
-03
20
03
-04
20
04
-05
20
05
-06
20
06
-07
20
07
-08
20
08
-09
20
09
-10
20
10
-11
20
11
-12
20
12
-13
20
13
-14
20
14
-15
20
15
-16
20
16
-17
20
17
-18
In %
Outstanding Guarantees as Percentage of Revenue Receipts
Outstanding Guarantees as Percentage of Revenue Receipts
- 18 -
2.4.4. Off budget Borrowings
Off budget borrowings are borrowings by PSUs, SPVs and other equivalent bodies where the
liability for repayment is on the state government. Thus debt servicing is through the budget.
From 2008-09 onwards, the state government has stopped allowing PSUs to raise funds through
OBBs. However, considering that the total liability to GSDP ratio had come down significantly
in the following years, and the state government was well advanced on the fiscal consolidation
road map to achieve the total liability to GSDP goal set in the KFRA and in the Thirteenth
Finance Commission report, it was proposed to allow OBBs in a limited manner. The quantum
of OBBs was, however, limited to the repayments of the previous OBBs. As a result, the total
amount of OBBs to be serviced by the state government would not change. In other words,
there would not be any addition on a net basis to the total stock of OBBs, and it would be
maintained at the same level as it was at the end of financial year 2009-10 (GoK, 2011). The
ratio of this total outstanding debt to GSDP is closely monitored and kept within the Thirteenth
Finance Commission targets. Since 2009-10, the state has been self imposing a ceiling on its
OBBs and has been relooking into it in view of the large funding requirements of several
agencies and other such SPVs for financing long gestation capital projects. An amendment to
KFRA, 2002 was carried out in February 2014 that ensured statutory compliance in reporting
of OBBs as part of the state’s own liabilities for working out the total liabilities (GoK, 2014).
This reporting of OBBs in the statement of its own liabilities has helped the state to reduce its
debt servicing burden and to understand its actual debt burden. Also, it is to the credit of the
government of Karnataka that its total liabilities inclusive of OBBs constitute less than 25% of
GSDP which is well within the fiscal target.
- 19 -
3. PUBLIC DEBT MANAGEMENT IN KARNATAKA
Public debt management refers to the policy formulation that seeks to achieve certain objectives
and the debt management strategies followed by any government are aimed at securing
government’s funding at all times at low cost over the medium/long-term while avoiding excess
risk and also to keep public debt at sustainable levels (GoI, 2015). Public debt management is
concerned with the decisions of forms of public debt, in terms of which new bonds are sold;
maturing debts are redeemed or refunded, the proportion in which different forms of public
debt should be issued, the pattern of maturities of debt and its ownership etc.
The debt management strategy for public debt revolves around three broad pillars - low cost in
medium term, risk mitigation and market development (GoI, 2015). Low cost objective is
attained by planned issuances and offer of appropriate instruments at lower cost in the medium
to long-term, taking into account market conditions and the preferences of various investor
segments. The risk analysis contains metrics such as average time to maturity, analysis of the
redemption profile, average time to re-fixing, percentage of outstanding debt maturing in next
12 months etc. Market development refers to broadening and diversification of the potential
investor base.
The government policy on public debt management focuses on the following principles:
i. greater reliance on domestic borrowings over loans and advances from the Centre,
ii. preference for market borrowings over instruments carrying administered interest rates,
iii. consolidation of the debt portfolio and
iv. development of a deep and wide market for government securities to improve liquidity
in the secondary market.
3.1. Public Debt Management Strategies Followed by the Government of Karnataka
In the present era, the emergence of a large volume and variety of public debt in the spheres of
its structure, maturity pattern, servicing of debt, repayment etc. requires a proper debt
management if the macroeconomic objectives are to be realised in a planned and systematic
manner. RBI’s Annual Reports on Public Debt Management discuss the prudent debt
management path followed by the Central and state governments in India and below are some
- 20 -
of the strategies being adopted by the government of Karnataka for maintaining its public debt
at prudent and sustainable levels (GoK, 2018):
A) Elongated Maturity Profile
B) Timing of borrowing
C) Adequate Revenue Surplus
D) Debt Consolidation Through Buybacks and Switching Operations
E) Creation of Consolidated Sinking Fund
F) Reduced Cost of Borrowings
A) Elongated Maturity Profile of Outstanding Debt
Maturity pattern of public debt refers to its redemption or repayment schedule and a study of
maturity profile of the state’s public debt indicates near to medium-term redemption pressure
for the government. It is usually an elongated maturity profile of dated securities that is
preferred and efforts to elongate the maturity profile of its debt portfolio is one of the widely
accepted strategies of public debt management. The maturity profile of the outstanding stock
of state government securities gives us an indication of the period when repayment obligations
are due and also the quantum of obligation.
The maturity pattern of state government securities has an impact on the debt management of
the state. This is because the repayment burden of the debt raised and its payment in future
depend on the maturity pattern of state government securities. Earlier during the 1990s, the
Karnataka government relied to a greater extent on long dated securities and the repayment
schedule hence was having repayment obligations of a longer period. Later, however, in the
early 2000s, the maturity profile of state government securities underwent a change and more
reliance on medium-term maturity pattern started being relied upon and hence the repayment
burden came closer and this resulted in the repayment burden coming earlier. Another change
that occurred was that states’ reliance and dependency on Central loans got reduced since 2005
and reliance on market borrowings increased and market borrowings’ share in total debt of
states increased and this increase is also associated with repayment schedule becoming closer
as the maturity profile shows reliance on medium-term borrowings being more and decline of
long dated securities. This shift in maturity profile is a feature of the debt position of the state
and has a bearing on the debt management policy.
- 21 -
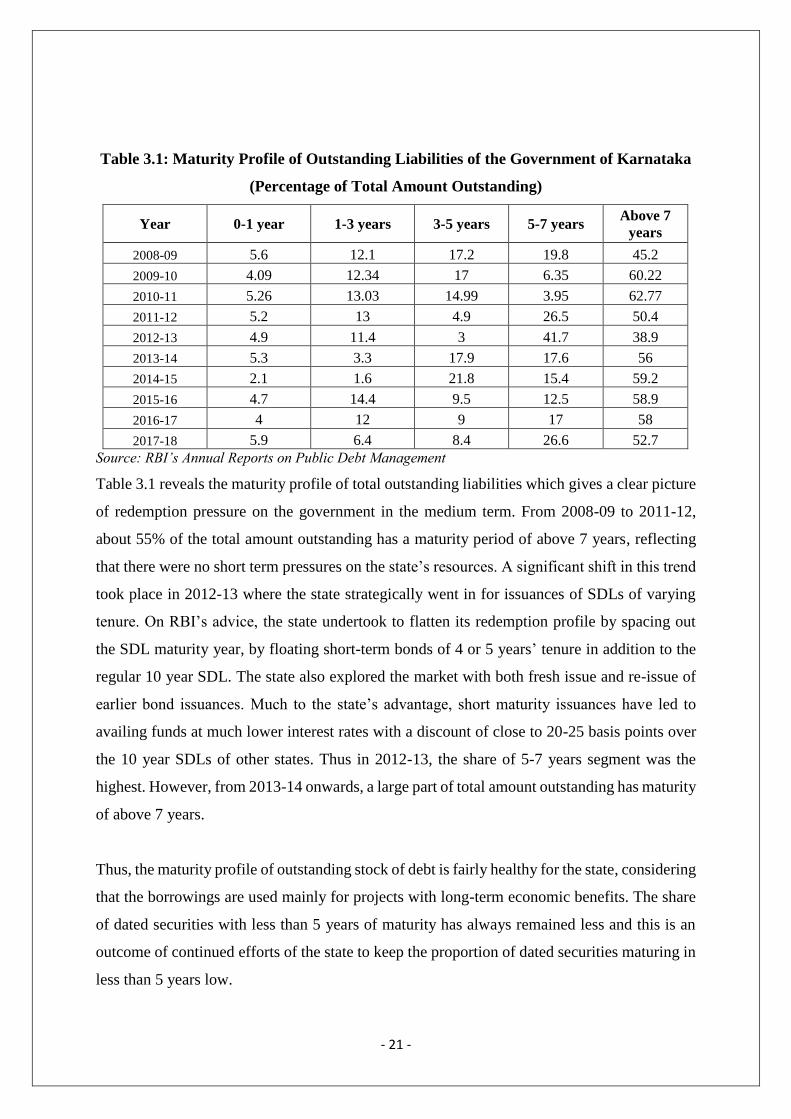
Table 3.1: Maturity Profile of Outstanding Liabilities of the Government of Karnataka
(Percentage of Total Amount Outstanding)
Year 0-1 year 1-3 years 3-5 years 5-7 years Above 7
years
2008-09 5.6 12.1 17.2 19.8 45.2
2009-10 4.09 12.34 17 6.35 60.22
2010-11 5.26 13.03 14.99 3.95 62.77
2011-12 5.2 13 4.9 26.5 50.4
2012-13 4.9 11.4 3 41.7 38.9
2013-14 5.3 3.3 17.9 17.6 56
2014-15 2.1 1.6 21.8 15.4 59.2
2015-16 4.7 14.4 9.5 12.5 58.9
2016-17 4 12 9 17 58
2017-18 5.9 6.4 8.4 26.6 52.7
Source: RBI’s Annual Reports on Public Debt Management
Table 3.1 reveals the maturity profile of total outstanding liabilities which gives a clear picture
of redemption pressure on the government in the medium term. From 2008-09 to 2011-12,
about 55% of the total amount outstanding has a maturity period of above 7 years, reflecting
that there were no short term pressures on the state’s resources. A significant shift in this trend
took place in 2012-13 where the state strategically went in for issuances of SDLs of varying
tenure. On RBI’s advice, the state undertook to flatten its redemption profile by spacing out
the SDL maturity year, by floating short-term bonds of 4 or 5 years’ tenure in addition to the
regular 10 year SDL. The state also explored the market with both fresh issue and re-issue of
earlier bond issuances. Much to the state’s advantage, short maturity issuances have led to
availing funds at much lower interest rates with a discount of close to 20-25 basis points over
the 10 year SDLs of other states. Thus in 2012-13, the share of 5-7 years segment was the
highest. However, from 2013-14 onwards, a large part of total amount outstanding has maturity
of above 7 years.
Thus, the maturity profile of outstanding stock of debt is fairly healthy for the state, considering
that the borrowings are used mainly for projects with long-term economic benefits. The share
of dated securities with less than 5 years of maturity has always remained less and this is an
outcome of continued efforts of the state to keep the proportion of dated securities maturing in
less than 5 years low.
- 22 -
B) Timing of Borrowings
The timing of the state government’s borrowings during any financial year indicates its debt
management strategy. Based on RBI’s request, the state has been estimating the timing of its
open market borrowings by communicating an advance indicative calendar for borrowings.
This enables the market to arrange for funds in advance while subscribing to SDLs. The state
in turn gets the benefit of favourable interest rates (GoK, 2015).
It has been observed in Karnataka that while monthly flow of state’s revenue receipts is more
or less uniform throughout the year, expenditure shows a clear surge in the last quarter of a
financial year, especially in the case of capital plan expenditure, indicating concentration of
expenditure in that period. This creates a scenario where there is sufficient cash available, from
out of the state’s own resources, to fund the expenditure in the first two quarters and it is only
felicitous that necessary resources, especially the borrowings, are raised in the third and fourth
quarter to meet the demand due to concentration of expenditure in the last few months of a
financial year. This has reduced the interest burden on the states. The government usually does
not avail market borrowings in the first two quarters of the financial year and the practice was
proposed to be continued in future subject to specific scenarios that may arise at such times. In
the state’s MTFP (2015-19), it is given that the borrowing requirement after the third quarter
of any financial year is re-assessed to arrive at the exact requirement of funds. If it is
necessitated, the state has been drawing down on its cash balance rather than borrowing more.
Though the state usually doesn’t borrow in the first two quarters, in 2017-18, borrowing was
resorted to during the last week of the second quarter to tide over the pressures arising out of
relatively lower GST revenues till the release of compensation (GoK, 2018). From the ensuing
year, it is expected that the borrowings will be resorted to only in the third and fourth quarters.
Accordingly, no borrowings were resorted to during the first half of 2018-19 because of the
sufficient cash position.
C) Adequate Revenue Surplus
Maintaining an adequate revenue surplus to finance the capital expenditure is one of the
strategies of a prudent debt management in Karnataka. The excess of revenue receipts over
revenue expenditure is available as revenue surplus. KFRA also mandates that the state should
maintain an adequate revenue surplus. The state’s revenue deficit was nil in 2006 itself and
thereafter it has continuously maintained a revenue surplus since the year 2004-05, ensuring
that the entire borrowings and revenue surplus are made available for capital expenditure only
- 23 -
and not for meeting current and consumption expenditure (GoK, 2013). An adequate revenue
surplus reduces the necessity to borrow and in turn reduces the debt burden. However, the
reduction of revenue surplus has been an area of concern. Revenue surplus relative to GSDP
has reduced from 1.8% in 2006-07 to around 0.5 – 1% in recent times. The drop in revenue
surplus may have a significant impact on financing of capital expenditure which would then
depend entirely on borrowings.
D) Debt Consolidation through Active Buybacks & Switches and Passive Re-issuances
Debt Consolidation means taking out a new loan to pay off a number of other liabilities. In
effect, multiple debts are combined into a single, larger piece of debt usually with more
favourable pay off terms. Debt consolidation efforts are undertaken whenever it appears that
the rollover risk is relatively high. Debt consolidation can be active and also passive. The state
has been adopting both active and passive measures. Active debt consolidation is carried out
through buybacks and switching operations also referred to as repurchase and conversion
activities. Buybacks or repurchases reduce redemption pressure on the government and
switching operations involve conversion of short-term securities into longer term securities to
avoid bunching of repayments in any given year. Passive debt consolidation is through
undertaking re-issuances i.e. increasing the issuance limit per security (GoI, 2017). Every year,
a certain portion of the state’s total issuances will be re-issuances. Re-issuances are carried out
to improve the liquidity of the state’s securities in the secondary market and this enhances the
liquidity of the G-sec market as a whole.
E) Creation of Consolidated Sinking Fund
CSFs are set up by the governments to provide a cushion to meet their repayment obligations
during times of fiscal stress. The government credits a fixed sum of money annually so that by
the time debt matures, the fund accumulates enough amount to pay off not only the principal
amount of the debt but also the interest payments on the loans as well (Bhatia, 2008). It also
enables market borrowing at reasonable cost. The CSF corpus has to be built out of annual
transfers from general sources of revenue from the budget. The CSF corpus of the states is
thereafter invested in GoI securities. RBI had been persistently advocating the need for creating
a fund and the Working Group of RBI has recommended that there is a necessity for states to
build up a minimum CSF corpus of 3-5% of the states’ liabilities within the next five years and
thereafter maintain it on a rolling basis. Hence the state decided to set up a CSF and contribute
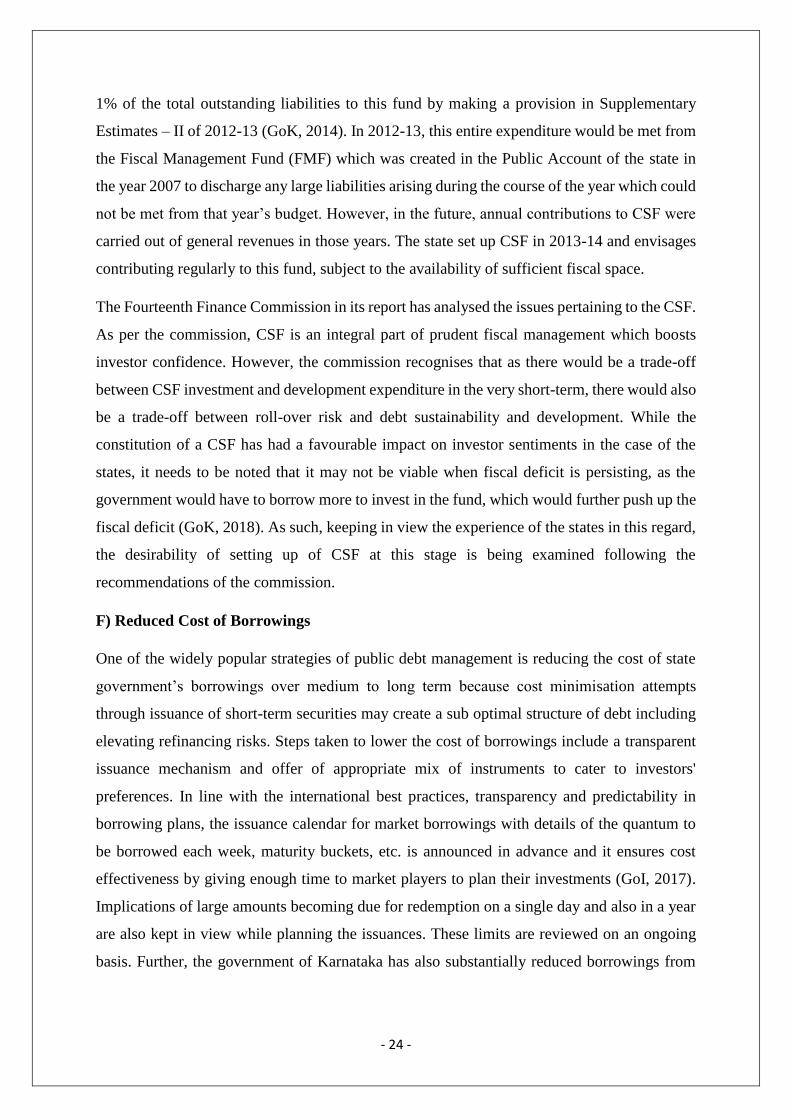
- 24 -
1% of the total outstanding liabilities to this fund by making a provision in Supplementary
Estimates – II of 2012-13 (GoK, 2014). In 2012-13, this entire expenditure would be met from
the Fiscal Management Fund (FMF) which was created in the Public Account of the state in
the year 2007 to discharge any large liabilities arising during the course of the year which could
not be met from that year’s budget. However, in the future, annual contributions to CSF were
carried out of general revenues in those years. The state set up CSF in 2013-14 and envisages
contributing regularly to this fund, subject to the availability of sufficient fiscal space.
The Fourteenth Finance Commission in its report has analysed the issues pertaining to the CSF.
As per the commission, CSF is an integral part of prudent fiscal management which boosts
investor confidence. However, the commission recognises that as there would be a trade-off
between CSF investment and development expenditure in the very short-term, there would also
be a trade-off between roll-over risk and debt sustainability and development. While the
constitution of a CSF has had a favourable impact on investor sentiments in the case of the
states, it needs to be noted that it may not be viable when fiscal deficit is persisting, as the
government would have to borrow more to invest in the fund, which would further push up the
fiscal deficit (GoK, 2018). As such, keeping in view the experience of the states in this regard,
the desirability of setting up of CSF at this stage is being examined following the
recommendations of the commission.
F) Reduced Cost of Borrowings
One of the widely popular strategies of public debt management is reducing the cost of state
government’s borrowings over medium to long term because cost minimisation attempts
through issuance of short-term securities may create a sub optimal structure of debt including
elevating refinancing risks. Steps taken to lower the cost of borrowings include a transparent
issuance mechanism and offer of appropriate mix of instruments to cater to investors'
preferences. In line with the international best practices, transparency and predictability in
borrowing plans, the issuance calendar for market borrowings with details of the quantum to
be borrowed each week, maturity buckets, etc. is announced in advance and it ensures cost
effectiveness by giving enough time to market players to plan their investments (GoI, 2017).
Implications of large amounts becoming due for redemption on a single day and also in a year
are also kept in view while planning the issuances. These limits are reviewed on an ongoing
basis. Further, the government of Karnataka has also substantially reduced borrowings from
- 25 -
relatively expensive sources of debt like NSSF, loans and advances from Central government
and has relied on open market borrowings which are less costly.
3.2. IMF-World Bank Guidelines for Public Debt Management, 2001 (Amended in 2003)
The IMF-World Bank Guidelines for Public Debt Management (the Guidelines), adopted in
2001 and amended in 2003, are a set of voluntary principles to assist debt managers in
improving their debt management practices and reducing financial vulnerability. An attempt
has been made to see whether the debt management practices adopted by the government of
Karnataka are in line with these guidelines and the same has been briefly summarised below:
Meaning and Objectives of Debt Management: The definition of Public Debt
Management in Karnataka and in India is taken from the IMF-World Bank’s definition
of public debt management and the objective of debt management (as envisaged in the
guidelines) to ensure that the government’s financing needs and its payment obligations
are met at the lowest possible cost over the medium to long run, consistent with a
prudent degree of risk is driving the state’s debt management policy.
Transparency: The guidelines state that the debt managers should openly formulate
and report debt management policies and should make the information on debt
management policies publicly available. The state has so far complied with this by
tabling before the legislature every year its MTFP document which includes the state’s
progress in various elements of fiscal and debt management. The Annual ‘Status Paper
on Government Debt also clarifies that the Centre and the states have ensured a
transparent issuance mechanism in lines with the international best practices. The state
announces in advance the issuance calendar for market borrowings with details of the
quantum to be borrowed each week, maturity buckets, etc.
Coordination with Monetary and Fiscal Policies: The guidelines explain how the
debt managers, fiscal policy advisors, and Central bankers should share an
understanding of the objectives of debt management, fiscal and monetary policies given
the interdependencies between their different policy instruments. Debt managers should
convey to fiscal authorities their views on the costs and risks associated with
government financing requirements and debt levels. Since the state governments in
India do not worry much about the monetary policies, we can assess the compliance of
the state with respect to fiscal policy which is stated in the MTFP documents. The
- 26 -
strategic priorities and key fiscal policies of the government of Karnataka and an
evaluation of their consistency and broad conformity to fiscal management principles
has been set out in Section 4 of KFRA, 2002.
Institutional Framework: The legal framework should clarify the authority to borrow
and to issue new debt, invest, and undertake transactions and the organisational
framework for debt management should be well specified. The state derives its
authority to raise borrowings from the Constitution itself with reasonable limitations
being placed on such authority. The RBI on agreement performs the debt management
operations of the state governments in India. The state has also constituted a FMRC as
required by KFRA, 2002 to review the fiscal and debt position of the state and advice
the Finance Minister on the remedial measures to be adopted to ensure adherence to the
parameters stipulated in KFRA.
Debt Management and Risk Management Strategy: The guidelines provide for a
debt management strategy that considers the financial and other risk characteristics of
the government’s cash flows. Debt managers should try to mitigate the risks associated
with government’s borrowings to the extent feasible by modifying the debt structure,
taking into account the cost of doing so. In Karnataka, it is ensured that the maturity
profile of the outstanding liabilities of the government is long as discussed in previous
section (section 3.1) which reflects the compliance with the established debt
management strategy of borrowing from long term sources.
Risk Management Framework for Contingent Liabilities: Debt managers should
consider the impact that contingent liabilities have on the government’s financial
position, including its overall liquidity, when making borrowing decisions. The
government of Karnataka has enacted KCGGA, 1999 to stipulate ceilings on the
government’s outstanding guarantees as a percentage of its revenue receipts and the
state has performed exceptionally well in the management of its outstanding guarantees
as discussed in the previous section (section 2.4.3). The inclusion of OBBs in the
statement of its total liabilities has reduced the risk associated with repayment
obligations.
Thus, the public debt management strategies followed in Karnataka have ensured conformity
to the standards put forward by the IMF-World Bank Guidelines for Public Debt Management
which are often regarded as the international benchmark for a prudent debt management policy.
- 27 -
4. IMPACT OF FISCAL RESPONSIBILITY LEGISLATIONS ON PUBLIC DEBT
INDICATORS OF KARNATAKA
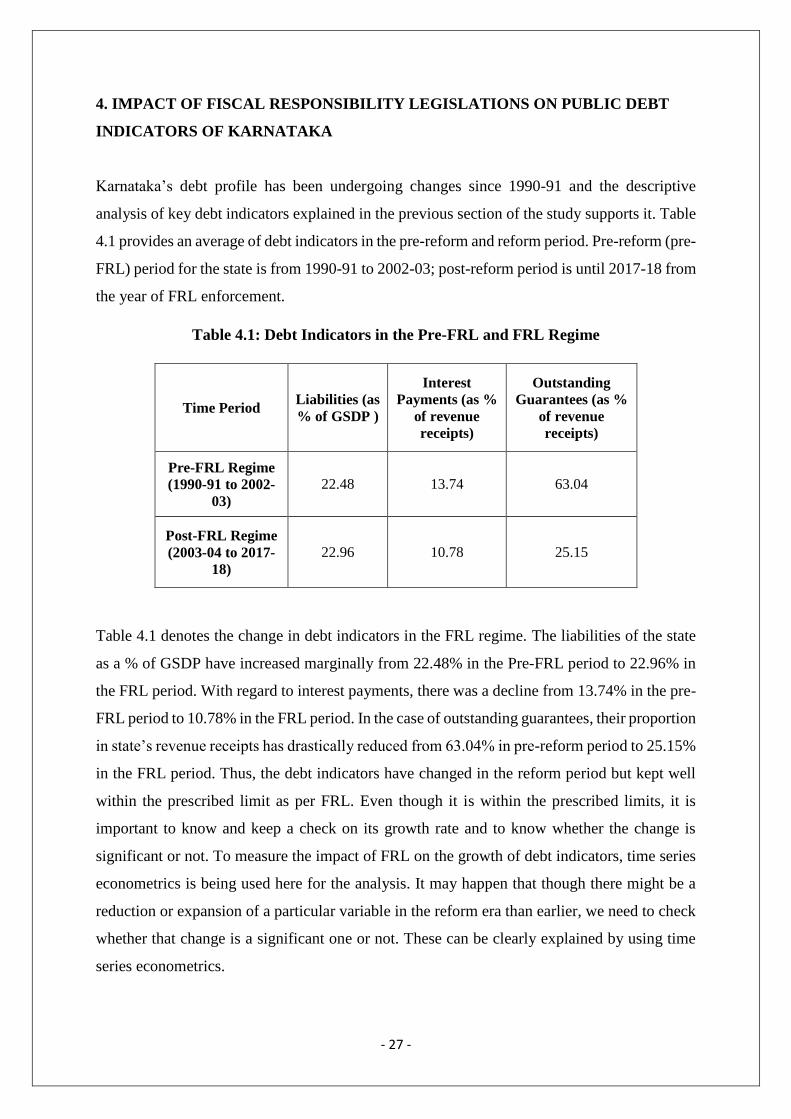
Karnataka’s debt profile has been undergoing changes since 1990-91 and the descriptive
analysis of key debt indicators explained in the previous section of the study supports it. Table
4.1 provides an average of debt indicators in the pre-reform and reform period. Pre-reform (pre-
FRL) period for the state is from 1990-91 to 2002-03; post-reform period is until 2017-18 from
the year of FRL enforcement.
Table 4.1: Debt Indicators in the Pre-FRL and FRL Regime
Time Period Liabilities (as
% of GSDP )
Interest
Payments (as %
of revenue
receipts)
Outstanding
Guarantees (as %
of revenue
receipts)
Pre-FRL Regime
(1990-91 to 2002-
03)
22.48 13.74 63.04
Post-FRL Regime
(2003-04 to 2017-
18)
22.96 10.78 25.15
Table 4.1 denotes the change in debt indicators in the FRL regime. The liabilities of the state
as a % of GSDP have increased marginally from 22.48% in the Pre-FRL period to 22.96% in
the FRL period. With regard to interest payments, there was a decline from 13.74% in the pre-
FRL period to 10.78% in the FRL period. In the case of outstanding guarantees, their proportion
in state’s revenue receipts has drastically reduced from 63.04% in pre-reform period to 25.15%
in the FRL period. Thus, the debt indicators have changed in the reform period but kept well
within the prescribed limit as per FRL. Even though it is within the prescribed limits, it is
important to know and keep a check on its growth rate and to know whether the change is
significant or not. To measure the impact of FRL on the growth of debt indicators, time series
econometrics is being used here for the analysis. It may happen that though there might be a
reduction or expansion of a particular variable in the reform era than earlier, we need to check
whether that change is a significant one or not. These can be clearly explained by using time
series econometrics.
- 28 -
Methodology
The time period considered for the analysis is from 1990-91 to 2017-18. Dummy variable
technique is being used. Structural change can be effectively captured using dummy variable
technique if the exact year of break is known.
To see if the FRL in Karnataka has had an impact on the debt indicators, consider the following
equation
ODt = α1+β1time +ut…….. (1)
In this equation, OD refers to outstanding debt (as % of GSDP), time is the independent
variable. Subscript ‘t’ indicates time. α, β & 𝑢t are the parameters to be estimated. Estimation
of equation (1) indicates how outstanding debt as % of GSDP has grown in the study period.
To see if there is a structural break, equation (1) needs to be modified as
ODt = α1+ β1time + β2FRL dummyt + ut …….. (2)
In equation (2), FRL dummy is the dummy variable introduced to capture the impact of FRL
on the debt indicator, say outstanding debt (as % of GSDP). The FRL came into force in the
year 2002-03 in Karnataka and in order to capture its impact, 2004-05 has been considered as
break year (with an assumption that its impact may not be immediate and takes a lag of one or
two years) for debt to GSDP ratio and IP/RR ratio whereas for outstanding guarantees to
revenue receipts ratio, 2001-02 was chosen as the break year since the FRL for outstanding
guarantees was enacted in 1999. Hence FRL dummy takes values of ‘1’ after the break year
and ‘0’ before that. β2 is a differential intercept which shows how much change has happened
in outstanding debt (as % of GSDP) after the FRL.
In order to include a possibility that the slope coefficient might also have changed and not just
the intercept, we introduce both differential intercept and differential slope dummies by
modifying equation (2) as follows
ODt = α1+ β1time + β2FRL dummyt + β3time × FRL dummyt + ut …….. (3)
β3 is the differential slope coefficient. Estimation of equation (3) helps to derive the changes or
growth in the debt indicators before and in the reform era.
Growth of Debt to GSDP ratio in Pre-FRL period
ODt = α1+ β1time + ut
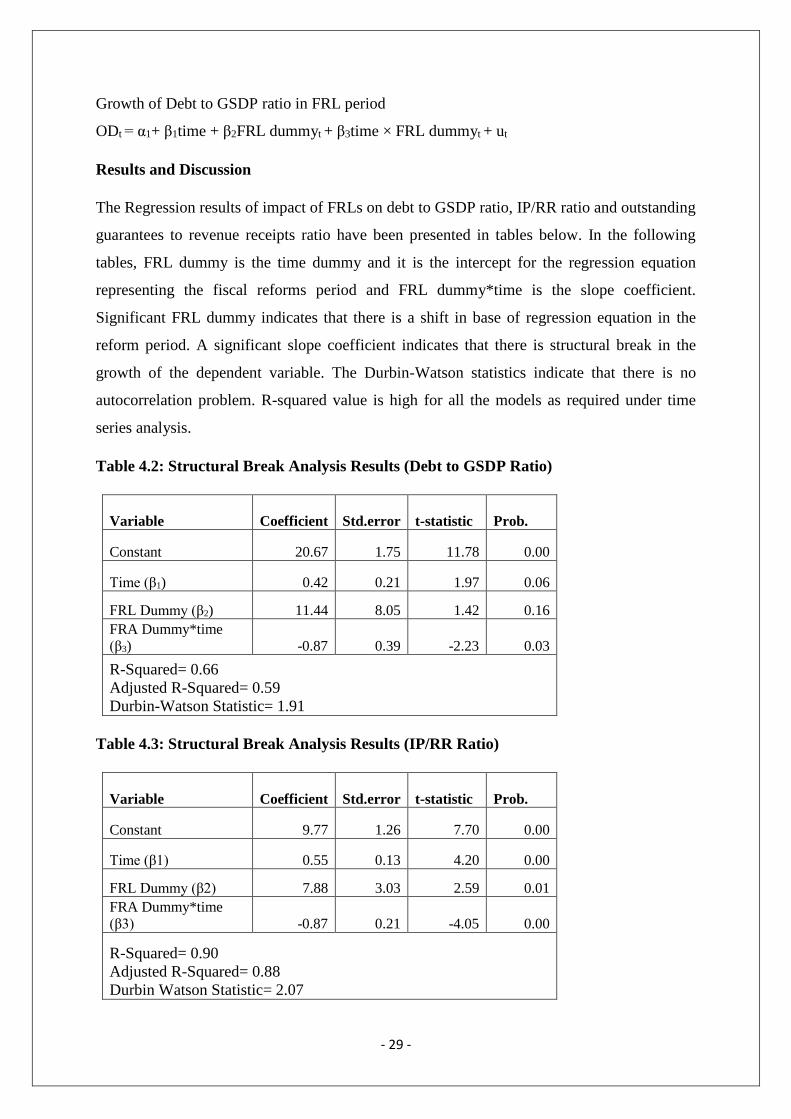
- 29 -
Growth of Debt to GSDP ratio in FRL period
ODt = α1+ β1time + β2FRL dummyt + β3time × FRL dummyt + ut
Results and Discussion
The Regression results of impact of FRLs on debt to GSDP ratio, IP/RR ratio and outstanding
guarantees to revenue receipts ratio have been presented in tables below. In the following
tables, FRL dummy is the time dummy and it is the intercept for the regression equation
representing the fiscal reforms period and FRL dummy*time is the slope coefficient.
Significant FRL dummy indicates that there is a shift in base of regression equation in the
reform period. A significant slope coefficient indicates that there is structural break in the
growth of the dependent variable. The Durbin-Watson statistics indicate that there is no
autocorrelation problem. R-squared value is high for all the models as required under time
series analysis.
Table 4.2: Structural Break Analysis Results (Debt to GSDP Ratio)
Variable Coefficient Std.error t-statistic Prob.
Constant 20.67 1.75 11.78 0.00
Time (β1) 0.42 0.21 1.97 0.06
FRL Dummy (β2) 11.44 8.05 1.42 0.16
FRA Dummy*time
(β3) -0.87 0.39 -2.23 0.03
R-Squared= 0.66
Adjusted R-Squared= 0.59
Durbin-Watson Statistic= 1.91
Table 4.3: Structural Break Analysis Results (IP/RR Ratio)
Variable Coefficient Std.error t-statistic Prob.
Constant 9.77 1.26 7.70 0.00
Time (β1) 0.55 0.13 4.20 0.00
FRL Dummy (β2) 7.88 3.03 2.59 0.01
FRA Dummy*time
(β3) -0.87 0.21 -4.05 0.00
R-Squared= 0.90
Adjusted R-Squared= 0.88
Durbin Watson Statistic= 2.07
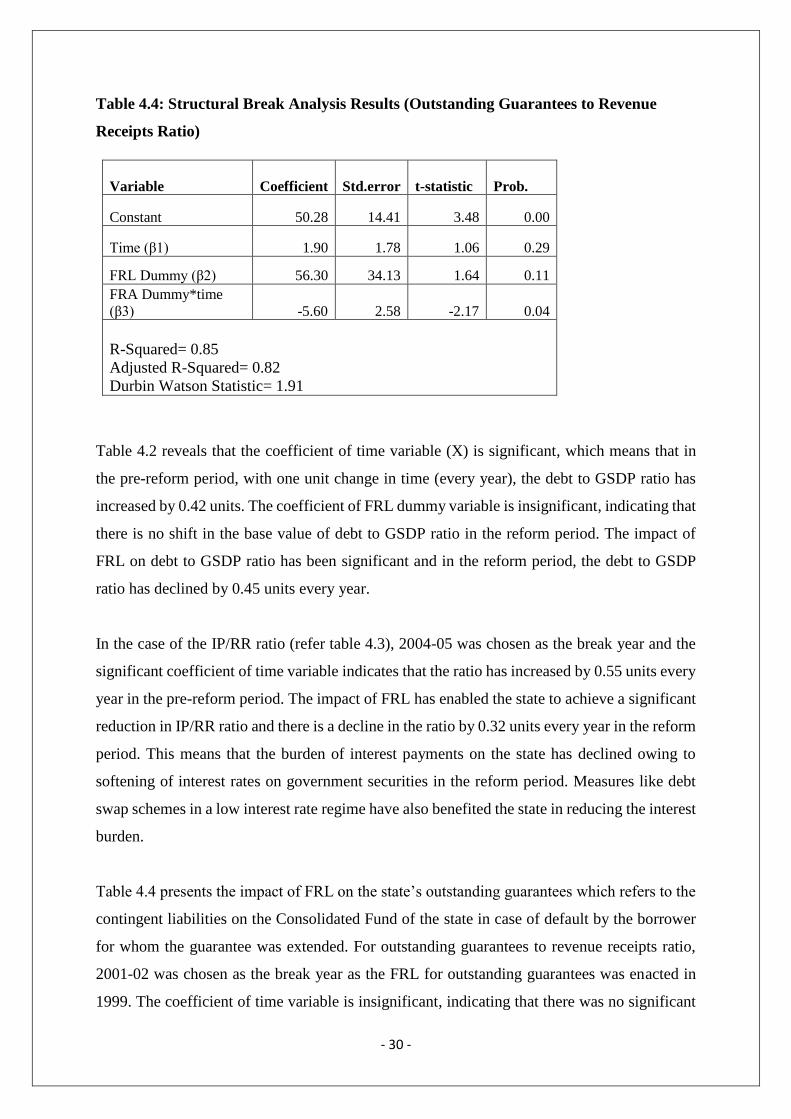
- 30 -
Table 4.4: Structural Break Analysis Results (Outstanding Guarantees to Revenue
Receipts Ratio)
Variable Coefficient Std.error t-statistic Prob.
Constant 50.28 14.41 3.48 0.00
Time (β1) 1.90 1.78 1.06 0.29
FRL Dummy (β2) 56.30 34.13 1.64 0.11
FRA Dummy*time
(β3) -5.60 2.58 -2.17 0.04
R-Squared= 0.85
Adjusted R-Squared= 0.82
Durbin Watson Statistic= 1.91
Table 4.2 reveals that the coefficient of time variable (X) is significant, which means that in
the pre-reform period, with one unit change in time (every year), the debt to GSDP ratio has
increased by 0.42 units. The coefficient of FRL dummy variable is insignificant, indicating that
there is no shift in the base value of debt to GSDP ratio in the reform period. The impact of
FRL on debt to GSDP ratio has been significant and in the reform period, the debt to GSDP
ratio has declined by 0.45 units every year.
In the case of the IP/RR ratio (refer table 4.3), 2004-05 was chosen as the break year and the
significant coefficient of time variable indicates that the ratio has increased by 0.55 units every
year in the pre-reform period. The impact of FRL has enabled the state to achieve a significant
reduction in IP/RR ratio and there is a decline in the ratio by 0.32 units every year in the reform
period. This means that the burden of interest payments on the state has declined owing to
softening of interest rates on government securities in the reform period. Measures like debt
swap schemes in a low interest rate regime have also benefited the state in reducing the interest
burden.
Table 4.4 presents the impact of FRL on the state’s outstanding guarantees which refers to the
contingent liabilities on the Consolidated Fund of the state in case of default by the borrower
for whom the guarantee was extended. For outstanding guarantees to revenue receipts ratio,
2001-02 was chosen as the break year as the FRL for outstanding guarantees was enacted in
1999. The coefficient of time variable is insignificant, indicating that there was no significant
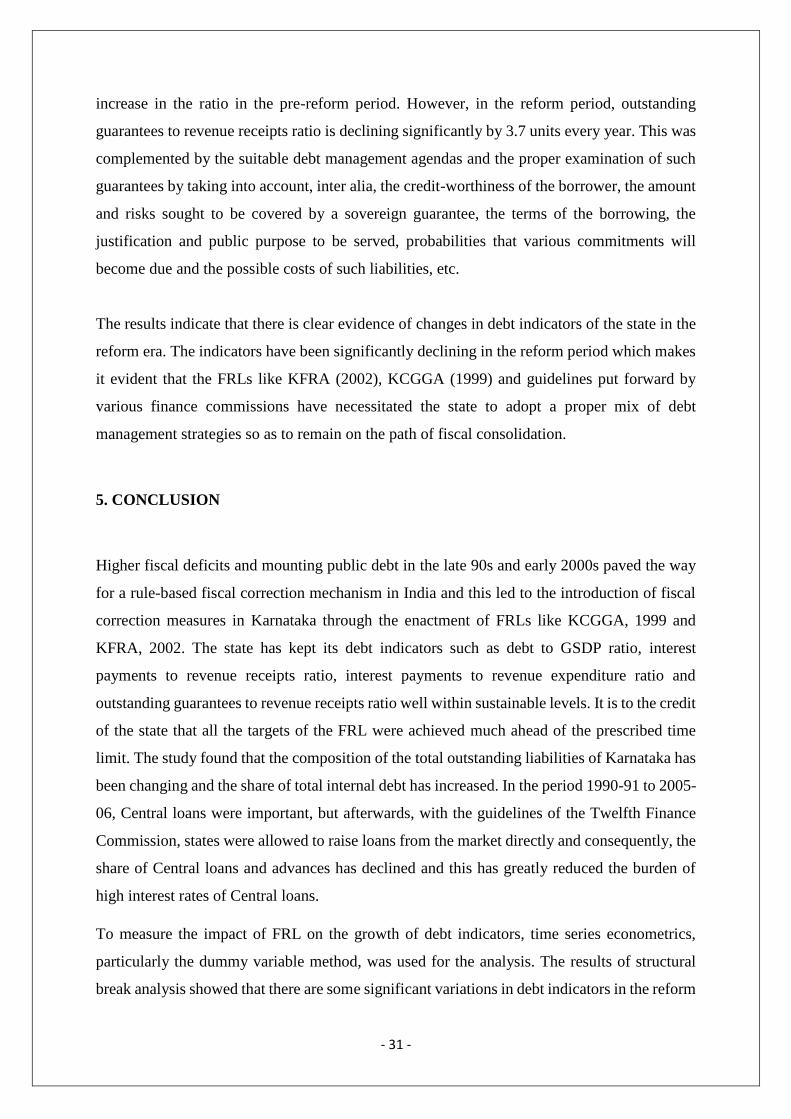
- 31 -
increase in the ratio in the pre-reform period. However, in the reform period, outstanding
guarantees to revenue receipts ratio is declining significantly by 3.7 units every year. This was
complemented by the suitable debt management agendas and the proper examination of such
guarantees by taking into account, inter alia, the credit-worthiness of the borrower, the amount
and risks sought to be covered by a sovereign guarantee, the terms of the borrowing, the
justification and public purpose to be served, probabilities that various commitments will
become due and the possible costs of such liabilities, etc.
The results indicate that there is clear evidence of changes in debt indicators of the state in the
reform era. The indicators have been significantly declining in the reform period which makes
it evident that the FRLs like KFRA (2002), KCGGA (1999) and guidelines put forward by
various finance commissions have necessitated the state to adopt a proper mix of debt
management strategies so as to remain on the path of fiscal consolidation.
5. CONCLUSION
Higher fiscal deficits and mounting public debt in the late 90s and early 2000s paved the way
for a rule-based fiscal correction mechanism in India and this led to the introduction of fiscal
correction measures in Karnataka through the enactment of FRLs like KCGGA, 1999 and
KFRA, 2002. The state has kept its debt indicators such as debt to GSDP ratio, interest
payments to revenue receipts ratio, interest payments to revenue expenditure ratio and
outstanding guarantees to revenue receipts ratio well within sustainable levels. It is to the credit
of the state that all the targets of the FRL were achieved much ahead of the prescribed time
limit. The study found that the composition of the total outstanding liabilities of Karnataka has
been changing and the share of total internal debt has increased. In the period 1990-91 to 2005-
06, Central loans were important, but afterwards, with the guidelines of the Twelfth Finance
Commission, states were allowed to raise loans from the market directly and consequently, the
share of Central loans and advances has declined and this has greatly reduced the burden of
high interest rates of Central loans.
To measure the impact of FRL on the growth of debt indicators, time series econometrics,
particularly the dummy variable method, was used for the analysis. The results of structural
break analysis showed that there are some significant variations in debt indicators in the reform
- 32 -
period and the state has achieved a reduction in debt to GSDP ratio, IP/RR ratio and outstanding
guarantees to revenue receipts ratio due to its efforts towards prudent liability management.
The debt management strategies adopted by the government of Karnataka are in line with the
international best practices and the state has ensured compliance with IMF-World Bank
Guidelines for Public Debt Management, 2001. The analysis of the maturity profile of state’s
outstanding liabilities revealed that the redemption pressure on the government of Karnataka
is relatively less in the short and medium term as the maturity period of most of the securities
of the government is above seven years. The state is also successful in maintaining an adequate
revenue surplus and has created a CSF to reduce its annual burden of debt repayment. The
inclusion of OBBs in the total liabilities of the government has reduced the risk and increased
the transparency of public debt management. The state has also been mindful of the timing of
its borrowings and has resorted to borrowings mostly in the last quarters of the financial year
so as to reduce the burden of interest payments.
Karnataka, being the first state in India to implement fiscal responsibility legislations, has
emerged as one of the best performing states in debt and fiscal management in India because
of its continued efforts. The government should strictly follow prudent debt management
strategies to maintain debt at sustainable levels in its efforts towards fiscal consolidation.
- 33 -
REFERENCES
1. Bhatia, H. L. (2008). Public Finance. New Delhi: Vikas Publishing House.
2. FPI (2017). Impact of Fiscal Rules on State Finances in India: A Comparative Study
of Southern States. Center for Financial Accountability and Decentralisation. Fiscal
Policy Institute, Bengaluru.
3. GoI (2015). Debt Management Strategy for India. New Delhi: Department of
Economic Affairs, Ministry of Finance, Govt. of India.
4. GoI (2018). Status Paper on Government Debt for 2017-18. Department of
Economic Affairs, Ministry of Finance, Govt. of India.
5. GoK (2001). Medium Term Fiscal Plan for Karnataka 2000-2001 to 2004-2005.
Finance Department, Govt. of Karnataka.
6. GoK (2002). Medium Term Fiscal Plan for Karnataka 2001-2002 to 2005-2006.
Finance Department, Govt. of Karnataka.
7. GoK (2011). Medium Term Fiscal Plan for Karnataka 2011-2012 to 2015-2016.
Finance Department, Govt. of Karnataka.
8. GoK (2013). Medium Term Fiscal Plan for Karnataka 2012-2013 to 2016-2017.
Finance Department, Govt. of Karnataka.
9. GoK (2014). Medium Term Fiscal Plan for Karnataka 2013-2014 to 2017-2018.
Finance Department, Govt. of Karnataka.
10. GoK (2015). Medium Term Fiscal Plan for Karnataka 2014-2015 to 2018-2019.
Finance Department, Govt. of Karnataka.
11. GoK (2018). Medium Term Fiscal Plan for Karnataka 2017-2018 to 2021-2022.
Finance Department, Govt. of Karnataka.
12. GoK (2018). Economic Survey 2017-18. Bangalore: Planning Department,
Government of Karnataka.
13. Gujarati, D. (2011). Econometric by Example. London: Palgrave Macmillan.
14. IMF-World Bank (2001). Guidelines for Public Debt Management.
www.worldbank.org/fps/guidelines.
15. Lakshmanan, L. (2018). Public Debt Solvency: An Analysis of Kerala State
Finances.
16. Lakshmanan, L. & Kausaliya, R. (2015). Public Debt Management in India and
Related Issues (No. id: 7255).
- 34 -
17. Mithani, D. M. (2019). Modern Public Finance: Theory and Policy. New Delhi:
Himalaya Publishing House.
18. RBI (2010). Handbook of Statistics on Indian States. Mumbai: Reserve Bank of
India.
19. RBI (2017). Annual Report on Public Debt Management. Mumbai: Reserve Bank
of India.
20. RBI (2017). State Finances - A Study of Budgets 2016-17. Mumbai: Reserve Bank
of India.
21. Sarkar (2015). World Bank’s Reformed Model of Development in Karnataka. ISEC
Working Paper-408, Institute of Social and Economic Change, Bengaluru.
22. World Bank (2002). India - Karnataka Economic Restructuring 1. ICR Review.
Report Number: ICRR11313. Operation Evaluation Department.
23. Yadav, P. A. (2011). Public Debt of the State Governments in India 1990 To 2010.
24. Zafar, S. T. (2015). Analysis of Public Debt Management Practices and Its Relative
Impact on Indian Banks.