Advances in pretreatment and analysis methods of aromatic ...
Upload
independentCategory
view
3download
0
Scale-Up of pH Controlled Pretreatment 77
Applied Biochemistry and Biotechnology Vol. 125, 2005
Copyright © 2005 by Humana Press Inc.All rights of any nature whatsoever reserved.0273-2289/05/125/0077/$30.00
77
*Author to whom all correspondence and reprint requests should be addressed.
Industrial Scale-Upof pH-Controlled Liquid
Hot Water Pretreatment of Corn Fiberfor Fuel Ethanol Production
NATHAN S. MOSIER,1,2 RICHARD HENDRICKSON,1
MARK BREWER,1 NANCY HO,1 MIROSLAV SEDLAK,1
RICHARD DRESHEL,3 GARY WELCH,3 BRUCE S. DIEN,4
ANDY ADEN,5 AND MICHAEL R. LADISCH*,1,2
1Laboratory of Renewable Resources Engineering,2Department of Agricultural and Biological Engineering,
Purdue University, 500 Central Drive, West Lafayette, IN 47907-2022,E-mail: [email protected]; 3Aventine Renewable Energy, Inc.,
PO Box 10, Pekin, IL 61554; 4USDA-NCAUR, 1815 N. University St.,Peoria, IL 61604; and 5National Renewable Energy Laboratory,
1617 Cole Boulevard, Golden, CO 80401
Received July 27, 2004, Revised October 5, 2004,Accepted November 23, 2004
Abstract
The pretreatment of cellulose in corn fiber by liquid hot water at 160°C anda pH above 4.0 dissolved 50% of the fiber in 20 min. The pretreatment alsoenabled the subsequent complete enzymatic hydrolysis of the remainingpolysaccharides to monosaccharides. The carbohydrates dissolved by thepretreatment were 80% soluble oligosaccharides and 20% monosaccharideswith <1% of the carbohydrates lost to degradation products. Only a minimalamount of protein was dissolved, thus enriching the protein content of theundissolved material. Replication of laboratory results in an industrial trialat 43 gallons per minute (163 L/min) of fiber slurry with a residence time of20 min illustrates the utility and practicality of this approach for pretreatingcorn fiber. The added costs owing to pretreatment, fiber, and hydrolysis areequivalent to less than $0.84/gal of ethanol produced from the fiber.Minimizing monosaccharide formation during pretreatment minimizedthe formation of degradation products; hence, the resulting sugars werereadily fermentable to ethanol by the recombinant hexose and by

78 Mosier et al.
Applied Biochemistry and Biotechnology Vol. 125, 2005
pentose-fermenting Saccharomyces cerevisiae 424A(LNH-ST) and ethanolo-genic Escherichia coli at yields >90% of theoretical based on the starting fiber.This cooperative effort and first successful trial opens the door for examiningthe robustness of the pretreatment system under extended run conditions aswell as pretreatment of other cellulose-containing materials using water atcontrolled pH.
Index Entries: Corn fiber; cellulose; ethanol; stillage; degradation prod-ucts; pretreatment.
IntroductionThe growth of fuel ethanol production in the United States from corn
has resulted in the proliferation of fiber-rich byproduct. This fiber is largelyin the kernel pericarp and is a major component of the byproduct of fuelethanol production, variously called distillers’ grains or corn gluten feed,depending on whether it is a product of dry or wet milling. These fiber-richbyproducts are sold as medium-protein animal feeds (18–30% protein) witha relatively low value of approx $75–$85/dry US ton (1). Although of rela-tively low value, this byproduct has a significant impact on the profitabilityof corn to ethanol production (2). As the industrial production capacity offuel ethanol has increased, there has not been a concurrent increase in thedemand for the animal feed byproduct to match the increased supply. Thishas resulted in a downward pressure on the selling price of this byproduct.These factors have been the focus of attention in research into alternativeuses or value-added products that could be produced from corn fiber (3–6).One possible use for corn fiber is as a source of fermentable sugars byhydrolyzing the cellulose fraction to glucose (2).
Wet milling currently accounts for approx 35% of the annual US pro-duction of fuel ethanol. Corn fiber derived from wet milling is approx 65%carbohydrates in the form of residual starch, cellulose, and hemicellulose(Table 1). Cellulose represents a potential source of fermentable glucose,if hydrolyzed, that would increase the yield of ethanol while also decreas-ing the amount of fiber byproduct per bushel of processed corn.
Cellulose is a highly recalcitrant, crystalline polymer that is resistantto hydrolysis by mineral acids or enzymes (7–9). Pretreatment is required todisrupt the plant cell wall structure and nanoscale structure of cellulose toimprove hydrolysis yields and efficiency (10–12). Liquid hot water hasbeen shown to effectively pretreat lignocellulosic biomass by partiallyhydrolyzing the hemicellulose and disrupting the lignin and cellulose struc-tures (13–17). By controlling the pH of the aqueous phase during pretreat-ment, the formation of monomeric sugars by hydrolysis of the solublehemicellulose oligosaccharides is restricted (10,14,18). Thus, further sugardegradation reactions that produce furfural and 5-hydroxymethylfurfural(HMF) and other products that are toxic to microbial fermentations arelimited (19–21). Generally, concentrations of furfural or HMF >1 mg/mLcause significant inhibition of fermentation. Optimized liquid hot waterpretreatments can produce pretreatment liquors below this threshold.

Scale-Up of pH Controlled Pretreatment 79
Applied Biochemistry and Biotechnology Vol. 125, 2005
Liquors from the pilot-scale pretreatment of corn fiber contained concentra-tions of furfural and HMF of <0.3 and <0.5 mg/mL, respectively.This represents <1% degradation of the total sugars.
Description of Pretreatment Process
The patented (18) corn fiber pretreatment process is illustrated in Fig. 1with the approximate mass flows as given in Table 2. The values in Table 2are calculated estimates based on measured total flow rate through thepretreatment coil (streams 1 + 2), estimated steam flow rate, and measuredmoisture and solids content of the centrifuge streams. Fiber was obtainedfrom a Vetter press. This fiber entered the pretreatment process at60% moisture (total weight basis) and was mixed with stillage with a com-position of 11% dissolved solids and 2% undissolved solids. Stillage is thebottoms from the distillation of the ethanol from the fermentation beer.Stillage was chosen as the pretreatment liquid because it does not addadditional water to the overall plant process. Additional water dilutes theplant throughput and increases the energy costs of drying and distillationas well as the load on the plant wastewater treatment facility. Stillage wasfound to be beneficial for the pretreatment process because protein andlactic acid in the stillage will buffer the slurry to pH 4.0 during pretreat-ment. Prior research has shown that maintaining the pH above 4.0 limitshydrolysis of polysaccharides (13–15). Because monosaccharide degrada-tion products, such as furfural and HMF, inhibit the ability of bacteria oryeast to ferment sugars to ethanol, limiting hydrolysis of the polysaccha-rides to monosaccharides during pretreatment prevents the formation ofthese toxins. At this time, there are few data on the effect of pretreatmenton the quality of the protein in the residual fiber, which would be sold asanimal feed.
Table 1Composition for Corn Fiber and Centrifuge Cake Undissolved Solids
From 16% (w/v) Solids Loading
Corn fiber (feed) Centrifuge cake (product)(% dry basis)a (% dry basis)
GlucanStarch 24 0.5Cellulose 14 33
Xylan/galactan 17 22Arabinan 11 5Protein 12 22Crude fat n/m 7Klason lignin 8 7Acetyl n/m 4Ash 0.4 0.4
an/m, not measured.
80 Mosier et al.
Applied Biochemistry and Biotechnology Vol. 125, 2005
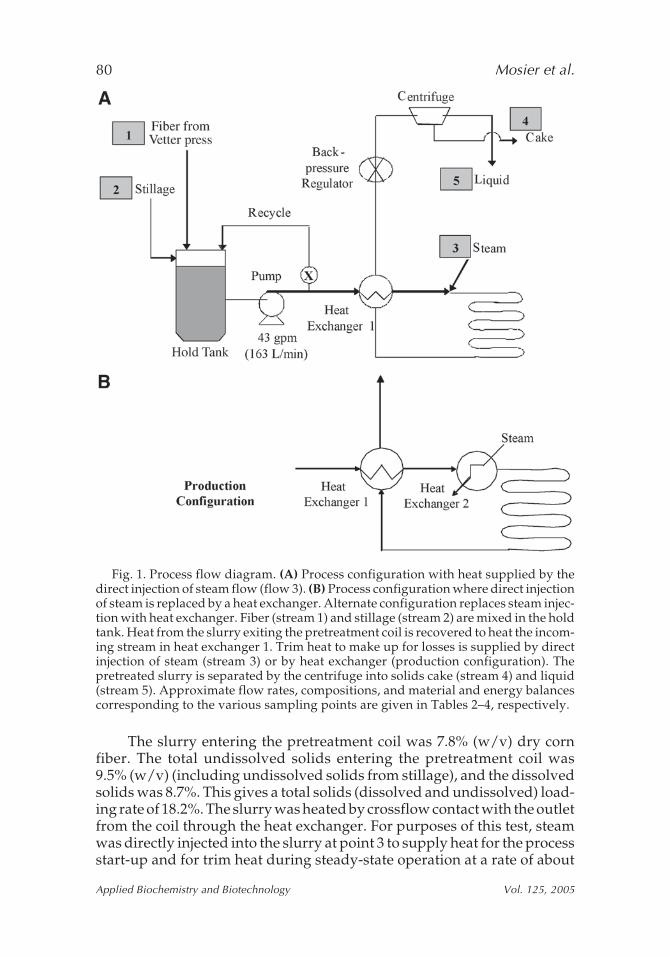
The slurry entering the pretreatment coil was 7.8% (w/v) dry cornfiber. The total undissolved solids entering the pretreatment coil was9.5% (w/v) (including undissolved solids from stillage), and the dissolvedsolids was 8.7%. This gives a total solids (dissolved and undissolved) load-ing rate of 18.2%. The slurry was heated by crossflow contact with the outletfrom the coil through the heat exchanger. For purposes of this test, steamwas directly injected into the slurry at point 3 to supply heat for the processstart-up and for trim heat during steady-state operation at a rate of about
Fig. 1. Process flow diagram. (A) Process configuration with heat supplied by thedirect injection of steam flow (flow 3). (B) Process configuration where direct injectionof steam is replaced by a heat exchanger. Alternate configuration replaces steam injec-tion with heat exchanger. Fiber (stream 1) and stillage (stream 2) are mixed in the holdtank. Heat from the slurry exiting the pretreatment coil is recovered to heat the incom-ing stream in heat exchanger 1. Trim heat to make up for losses is supplied by directinjection of steam (stream 3) or by heat exchanger (production configuration). Thepretreated slurry is separated by the centrifuge into solids cake (stream 4) and liquid(stream 5). Approximate flow rates, compositions, and material and energy balancescorresponding to the various sampling points are given in Tables 2–4, respectively.

Scale-Up of pH Controlled Pretreatment 81
Applied Biochemistry and Biotechnology Vol. 125, 2005
25 pounds mass (lbm) (12 kg) of steam/min. Steam injection was used toavoid the need to purchase or rent an additional heat exchanger for pur-poses of this test. However, at production scale, a second heat exchangerwill replace steam injection for the purposes of preserving the water bal-ance, avoiding dilution of the slurry, and reducing energy consumption.The impact of substituting steam with a heat exchanger is discussed as partof the economic analysis (see Economic Evaluation). Steam at 25 lbm/min(12 kg/min) adds 7.5% to the total volume of the slurry, thereby reducingfiber solids from 8.5 to 7.8%. The resulting flows are given in Table 2.
The slurry enters the coil, where it experiences an average retentiontime of 20 min at 320°F (160°C). This residence time is optimized residencetime as determined by batch pretreatment experiments carried out at thelaboratory scale using capped stainless steal tubes heated in a fluidizedsand bath as described in Materials and Methods. The slurry leaving thepretreatment coil is cooled to 212°F (100°C) by the incoming slurry thatenters the heat exchanger at 207°F (97°C). The pretreated slurry then passesthrough a Centrisys centrifuge (Kenosha, WI), resulting in a solids cakewith 74% moisture (Table 2) and a clear liquid with the composition shownin Table 3. Approximately 18% of the solubilized glucan found in the liquidwas hydrolyzed to glucose with the balance of glucans present as solubleoligosaccharides.
Table 2Nominal Mass Flow Rates
in Pretreatment Pilot-Scale Process Corresponding to Fig. 1A
Stream 1 Stream 2
Approximate flow rate Approximate flow rateTotal flow 9 gpm Total flow 34 gpmSolids 27 lbm/min Dissolved solids 32 lbm/minWater 41 lbm/min Undissolved solids 7 lbm/min
Water 258 lbm/min
Stream 1 + 2 Stream 3
Approximate flow rate Approximate flow rateTotal flow 43 gpm Water 25 lbm/minDissolved solids 32 lbm/min Pressure 150 psiUndissolved solids 33 lbm/minWater 299 lbm/min
Stream 4 Stream 5
Approximate flow rate Approximate flow rateTotal flow 115 lbm/min Total flow 275 lbm/minDissolved solids 10 lbm/min Dissolved solids 36 lbm/minUndissolved solids 20 lbm/min Undissolved solids 0 lbm/minWater 85 lbm/min Water 239 lbm/min

82 Mosier et al.
Applied Biochemistry and Biotechnology Vol. 125, 2005
Materials and Methods
Laboratory-Scale Pretreatment
Laboratory-scale scoping runs were carried out to narrow preferredtemperature/hold time for optimal pretreatment (i.e., maximum solubili-zation/minimum hydrolysis). Reactors were constructed from stainless teel tubes having a length of 4.5 in., an outside diameter of 1.0 in., and ameasured internal volume of 45 mL. These were filled with 33.75 mL ofslurry and heated to pretreatment temperatures in a fluidized sand bath.Swagelok 316 stainless steel caps were fitted onto each end of the tubes.The standard working volume for each tube was 33.75 mL to allow a25% headspace above the sample to permit thermal expansion of the liq-uid, which was kept in a liquid state. Fiber loadings varied between 2.6(7.8% loading) and 5.4 (16% loading) dry g/tube. Fiber was assumed tohave a specific gravity of 1.00 for the purposes of calculating the volume ofstillage required to fill each tube to 33.75 mL. Heat-up and temperaturecontrol of the reactors was achieved using a Tecam® SBL-1 fluidized sandbath and controller (Cole-Parmer, Vernon Hills, IL). The time required toheat the contents of the reactor tubes to the desired temperature was deter-mined by measuring the internal temperature of a water-filled reactor tubefitted with a thermocouple. A heat-up time of 5 min was required for thecontents of the tube to reach 320°F (160°C). The hold time was measuredfrom the time that the temperature plateaued. After the hold time at thedesired temperature was attained, the tubes were removed and quenchedin room temperature water. Internal reactor temperature dropped from320°F (160°C) to below 212°F (100°C) in <20 s when the tubes were sub-mersed in 10 L of water.
Table 3Composition of Dissolved Solids in Stillage and Centrifuge Liquor
Stillage Centrifuge liquor(mg/mL) (mg/mL)a
Glucan 7.1 20.2Glucose 0.3 5.8Xylan/galactan 0.9 8.5Xylose/galatose 1.1 1.1Arabinan 0.0 1.8Arabinose 1.0 2.7Acetic acid 0.0 0.4Lactic acid 10.4 12.2Glycerol 15.5 12.6HMF 0.0 0.4Furfural 0.0 0.32,3-Butanediol 3.4 n/m
an/m, not measured.

Scale-Up of pH Controlled Pretreatment 83
Applied Biochemistry and Biotechnology Vol. 125, 2005
Pilot-Scale Pretreatment
The scale-up runs were performed at Aventine Renewable Energy(Pekin, IL). Corn fiber and stillage were diverted from plant processinglines for use during the trial. Carbohydrate analyses of the various solidand liquid streams followed the laboratory analytical procedures devel-oped by the National Renewable Energy Laboratory (NREL) as describedbelow (22).
Collection and Comparison of Samples
Samples of the centrifuge cake, liquor, and uncentrifuged pretreat-ment slurry were collected while the pilot-scale pretreatment system oper-ated at steady state. These samples were then analyzed and comparedagainst laboratory-scale pretreatment samples for composition, enzymedigestibility, and fermentability of the resulting sugar-rich liquor.
Carbohydrate Analysis
Total glucan analysis of corn fiber was performed by the proceduredeveloped by Saha and Bothast (23). Corn fiber was treated in 4% sulfuricacid at 120°C for 1 h in an autoclave. The low lignin content of corn fibereliminates the need for the strong acid pretreatment of the NREL method(72% sulfuric acid for 2 h at 30°C), which actually can result in substantialloss of labile carbohydrates to degradation products (23). The dilute-acid-autoclaved fiber was adjusted to pH 5.0 using sodium hydroxide. Using a1:1 ratio mixture of Celluclast 1.5L and Novozyme 188 (Novozymes,Franklinton, NC) at a loading of 10 filter paper units (FPU)/g of dry fibersolids, the solids were hydrolyzed at 50°C in a shaker at 350 rpm for 120 h.The hydrolysate was analyzed by high-performance liquid chromatogra-phy (HPLC) utilizing an HPX-87H organic acid column (Bio-Rad, Her-cules, CA). This analytical column allows the concurrent analysis of liquidsamples for the presence of acetic and lactic acids as well as sugar degrada-tion products. Standardization curves were developed for all compoundsusing pure chemicals obtained from Sigma-Aldrich (St. Louis, MO).The glucan analyzed by this procedure represents the sum of starch andcellulose in the corn fiber. A second procedure using amylase was neces-sary to determine the starch content independently in order to account forstarch and cellulose separately.
Starch Analysis
Starch content of the solids was determined by hydrolysis of the fiberor the pretreated fiber with α-amylase (Sigma a45551) and amylo-glucosidase (Sigma a7420). A dry fiber solids mass of 5 g was mixed with70 mL of 50 mM Tris buffer (pH 7.0), α-amylase (6300 U/g of dry fibersolids), and amyloglucosidase (80 U/g of dry solids). The slurry was thenincubated in a shaker at 37°C, 150 rpm agitation for 119 h. The resultingmeasured glucose in the supernatant was converted into the equivalent

84 Mosier et al.
Applied Biochemistry and Biotechnology Vol. 125, 2005
mass of starch. Cellulose content was calculated by difference in which thestarch analysis was subtracted from the total glucan determined by acidpretreatment/enzyme hydrolysis described in the previous section.
Starch Hydrolysis and Fermentation
For Saccharomyces cerevisiae starch fermentations, 100 g of pretreatedhydrolysate, which was sterilized by autoclaving at 121°C for 15 min, wasplaced in a 125-mL Erlenmeyer flask and mixed with 8 mL of YP 10X stock(100 g/L of yeast extract and 200 g/L of peptone) and 10–100 µL of filter-sterilized glucoamylase (AMG300L from Novozymes, Bioindustrial A/S,Denmark; density of 1.2 g/mL, reported activity of 300 amyloglucosidaseunits/mL). The flask was inoculated with S. cerevisiae Y-2034 (ARS CultureCollection, Peoria, IL) to a beginning OD600nm of 0.1 and capped with arubber stopper that had been pierced with a 22-gage needle to allow for CO2exhaust. The culture was incubated at 32°C with agitation (120 rpm).The seed culture was grown for 18 h in YP medium supplemented with50 g/L of glucose and resuspended in basal YP medium prior to inocula-tion. The culture was sampled periodically for glucose and ethanol. Totalavailable glucose was determined by digesting samples with 2 N trifluoro-acetic acid (Sigma) at 100°C for 1 h followed by HPLC analysis of sugars.
Enzymatic Digestibility of Cellulose
Corn fiber before and after pretreatment was hydrolyzed using a blendof commercially available cellulase preparations. Into a 250-mL polypro-pylene bottle was placed 33.75 mL of corn fiber and stillage slurry withdeionized water to a total liquid volume of 100 mL. To this diluted slurrywas added a 1:1 mixture of Novozyme 188 and Celluclast 1.5L (Novozymes,Bioindustrial A/S) to give an enzyme loading of 10 FPU/g of fiber (drybasis), equivalent to 70 FPU/g of cellulose. Hydrolysis was carried out ina New Brunswick Scientific model G24 Environmental Incubator Shaker at50°C and 250 rpm.
Fermentation Using Xylose-Fermenting S. cerevisiae 424A(LNH-ST)
For ethanol production, 8 mL of seed culture S. cerevisiae 424A(LNH-ST)(24–26) was used to inoculate 100 mL of YEPD (YEP plus 2% glucose) in a300-mL baffled Erlenmeyer flask equipped with a side arm. The cultureswere incubated in a shaker at 30°C and 200 rpm and grown aerobicallyovernight (OD = 350–400 KU). The yeast was harvested by centrifuging(J-21 Beckman centrifuge) at 3000g for 5 min at room temperature.The supernatant was discarded, and the cells were transferred into a300-mL baffled Erlenmeyer flask containing 100 mL of hydrolysate supple-mented with 10 mL of 10% yeast extract. The initial cell mass concentrationprior to fermentation in each experiment was 8.5–9 g of dry wt/L. Theflasks were then sealed with Saran wrap to allow fermentation to be carriedout under largely anaerobic conditions. The cultures were placed in a shaker

Scale-Up of pH Controlled Pretreatment 85
Applied Biochemistry and Biotechnology Vol. 125, 2005
and incubated at 30 or 37°C. One milliliter of the fermentation mixture wasremoved at proper intervals to serve as a sample for monitoring thefermentation.
Scanning Electron Microscopy
Samples of corn fiber before and after pretreatment were mounted onstubs and sputter-coated with AuPd prior to imaging with a JEOL JSM-840scanning electron microscope using 5 kV of accelerating voltage. Digitalimages were captured using 1280 × 960 resolution and a 160-s dwell time.
Results and Discussion
Extraction and Saccharification of Starch
Nearly all of the insoluble starch on the fiber surface was dissolvedinto soluble maltodextrans by pretreatment at 160°C, as indicated by starchanalysis (Table 1) and scanning electron micrographs of the corn fiber beforeand after pretreatment (Fig. 2). Nearly 50% of the fiber solids was dissolvedduring pretreatment. The addition of a cellulase mixture increased solubi-lization to 70% in 2 h and nearly 80% within 24 h (Fig. 3). Glucose concentra-
Fig. 2. Scanning electron micrographs of (A,B) untreated corn fiber and (C,D) pre-treated corn fiber. Note that no starch granules were observed on the pretreated cornfiber. Magnification: (A) ×150; (B) ×1000; (C) ×150; (D) ×1000.

86 Mosier et al.
Applied Biochemistry and Biotechnology Vol. 125, 2005
tion plateaued at 50 mg/mL (data not shown) and corresponded to80% solids loss (Fig. 3).
Hydrolysis of corn fiber using amylase at conditions used for starchanalysis resulted in a yield of 20 to 24% of the total solids as soluble glucose.α-Amylase and glucoamylase hydrolysis of pretreated corn fiber from thecentrifuge cake that was washed with distilled, deionized water resulted ina yield of 0.5% of the total solids as soluble glucose (data not shown).By comparison, hydrolysis of the unwashed centrifuge cake with amylaseresulted in 8.8% of the total solids being hydrolyzed to glucose. The differ-ence between glucose hydrolyzed from the pretreated, unwashed cake andthe washed cake showed that soluble maltodextrans were present in theliquid from the centrifuge cake because washing was easily able to removethem. This conclusion is further confirmed by scanning electron micro-scopy of the fiber surfaces. Figure 2A,B shows starch particles on the sur-face of untreated fiber. After pretreatment the surface was smooth anddevoid of starch particles (Fig. 2C,D).
Fermentation of Solubilized Starch to EthanolThe solubilized starch was fermented to ethanol using S. cerevisiae
Y-2034. Simultaneous saccharification and fermentation was conducted atglucoamylase loadings of 0, 0.12, 0.24, 0.60, and 1.2 mg of enzyme prepara-tion/g of substrate. The fermentations were completed within 32 h and theyields varied from 93 to 103% based on available noncellulosic glucose;the higher than theoretical yield could be accounted for by the fermenta-tion of galactose. The starch dissolved from the corn fiber surface was shownto be readily fermented to ethanol.
Fig. 3. Solubilization of pretreated and untreated corn fiber by cellulase (Novozyme188 and Celluclast 1.5L in a 1:1 ratio, 10 FPU/g of dry corn fiber) at 50°C. Replicate runsat each condition are shown.

Scale-Up of pH Controlled Pretreatment 87
Applied Biochemistry and Biotechnology Vol. 125, 2005
Fig. 4. Cellulase (Novozyme 188 and Celluclast 1.5L in a 1:1 ratio, 10 FPU/g of drycorn fiber) hydrolysis of laboratory-pretreated corn fiber at 50°C.
Cellulose Digestion
The hydrolysis of corn fiber pretreated in the laboratory reaction tubesshowed that the initial rate of cellulose hydrolysis was 1.86 × 10⁻² g ofglucan/h/FPU of enzyme/g of total pretreated solids compared with0.93 × 10–2 g of glucan/h/FPU of enzyme/g of untreated solids during thefirst 5 h (Fig. 4). After 24 h, the extent of cellulose conversion was 47% foruntreated fiber compared with 58% for pretreated fiber. Pretreatmenteffectively reduced hydrolysis time for equivalent enzyme loadings. Simi-lar extents of hydrolysis of the pretreated fiber occurred in half the timerequired to achieve the same results as for untreated fiber.
The dissolved carbohydrates in the liquid from pretreated samplesincluded a significant fraction of oligosaccharides from hemicellulose.The supernatant of cellulase-digested pretreated solids contained onlytrace amounts of monomeric xylose. However, 4% sulfuric acid hydrolysis(27) of this liquid gave 10.8 g/L of xylose, showing that the liquid containedsignificant amounts of soluble xylooligosaccharides. After 72 h of cellulasehydrolysis, approx 70% of the remaining insoluble xylan in the pretreatedcorn fiber became soluble oligosaccharides, as determined by comparingthe results of the 4% acid hydrolysis of the supernatant from the cellulase-hydrolyzed pretreated solids (27) to the compositional analysis of the pre-treated solids (27). By contrast, much lower concentrations of soluble xylanoligosaccharides were found in the supernatant of the untreated fiber sol-ids digested with cellulase. These results suggest that the pretreatment alsopretreats the hemicellulose. It is possible that the pretreated hemicelluloseis more easily hydrolyzed to soluble xylan oligomers by the xylanase activ-

88 Mosier et al.
Applied Biochemistry and Biotechnology Vol. 125, 2005
ity in the enzyme mixture. The dissolution of hemicellulose allows rapidsaccharification of the insoluble cellulose fraction by cellulases followingpretreatment. The reduction in undissolved solids improves the solubleglucan recovery from the undissolved solids when pretreated solids arecentrifuged to remove free liquid owing to the reduced mass of solids thatwill trap residual liquid.
Fermentation of Cellulase Hydrolysate to EthanolPretreated fiber was hydrolyzed by cellulase enzymes and then fer-
mented using xylose-fermenting S. cerevisiae 424A(LNH-ST) and ethanol-ogenic Escherichia coli FBR16. The results from the xylose-fermenting S. cerevisiae426A(LNH-87) are shown in Fig. 5. The pretreated slurry prior to centrifu-gation was hydrolyzed with cellulase for 96 h at 50°C, followed by fermen-tation for 50 h at 30°C by yeast. A 90% or better theoretical yield of ethanolfrom all glucans (starch and cellulose) in the starting material was achievedwith 20 g/L of ethanol concentration formed. The combined results showthat furfural and HMF present in the pretreated and hydrolyzed material(<0.3 and <0.5 mg/mL, respectively) did not significantly inhibit the yeastfermentation. Although this strain of recombinant yeast is able to fermentboth xylose and glucose, xylose concentrations in the pretreatment liquidwere at the minimum levels required for fermentation (Fig. 5A). Spiking ofthe pretreatment liquid with xylose and fermentation with yeast (424A[LNH-ST]) showed that xylose was fermented as well as glucose (Fig. 5B), with ahigher ethanol yield and more rapid conversion occurring at pH 5.7 com-pared with pH 4.4 (Fig. 5B). However, extant xylanase activity present inthe enzyme mixture was not directly accounted for.
Corn fiber hydrolysate was also evaluated for fermentation usingE. coli strain FBR16. Xylan oligomers were completely hydrolyzed by treat-ing the hydrolysate with 3% (w/v) H2SO4 for 1 h at 121°C prior to fermen-tation. The mixture was neutralized to pH 6.5 with Ca(OH)2 and fermentedwith FBR16 as previously described (28) in pH-controlled minibioreactors.The fermentation was completed within 36 h, and the ethanol yield was84% of theoretical based on initial free arabinose, glucose, and xylose con-centrations (data not shown). The ethanol yield was improved to 97% oftheoretical by treating the hydrolysate with XAD4 resin as described byWeil et al. (29) to remove furfural and other inhibitory compounds. Theseresults illustrate that the low concentration of furfural and HMF will sig-nificantly inhibit fermentation by recombinant E. coli.
Effect of Fiber Loading on Soluble Glucan RecoveryThe corn fiber pretreatment process (see Fig. 1) separates liquid con-
taining solubilized starch (i.e., glucan) from the undissolved solids bycentrifugation. The fermentation system at, Aventine Renewable Energy,the wet-milling facility, was designed to remove undissolved solids beforethe sugars are fermented. Because centrifugation is not 100% efficient, someportion of the liquid will be entrapped in the solids cake (stream 4 in Fig. 1).

Scale-Up of pH Controlled Pretreatment 89
Applied Biochemistry and Biotechnology Vol. 125, 2005
Hence, the impact of fiber loading and centrifuge efficiency on liquidrecovery was calculated. Although tuning the centrifuge to produce a driercake may result in some solids exiting with the centrate (liquid), solidscarryover into the supernate from the centrifuge was insignificant underthe conditions used in our study.
Figure 6 illustrates the impact of fiber loading in the pretreatment stepon soluble glucan concentration recovered in the liquid stream from the
Fig. 5. Fermentation of cellulase-treated centrifuge cake (9% dry mass in liquid) andpretreatment liquid. Centrifuge cake in pretreatment liquid was treated with an equalmixture of Celluclast 1.5L and Novozyme 188 (50 FPU/mL) at a loading of 10 FPU/gof dry solids at 50°C for 96 h. After saccharification, the liquid was fermented withxylose-fermenting recombinant yeast (424A[LNH-ST]) at 30°C. Samples were collectedevery 3 h and analyzed by HPLC. (A) Two replicates of fermentation of liquid aftersaccharification; (B) fermentation of liquid after saccharification (pH 4.4) spiked withxylose to fermentable levels and liquid after saccharification spiked with xylose andpH adjusted to 5.7.

90 Mosier et al.
Applied Biochemistry and Biotechnology Vol. 125, 2005
centrifuge. The soluble glucan concentration corresponding to the trial run(one heat exchanger + steam injection at 7.8% fiber) matches the analyticalresults (glucan was 26.39 mg/mL = 2.6% in stream 5; Fig. 1). Steam injectionfor makeup heat slightly dilutes the glucan concentration. Hydrolyzing thepretreated material with cellulase increases the glucan concentration (twoheat exchangers + enzyme case in Fig. 6). The bases for these calculationsare as follows:
1. The concentration of soluble solids in the liquid entrapped in thesolids cake (stream 4) was equivalent to the concentrations in theliquid stream (stream 5). HPLC analysis of materials generated bythe pilot run confirm that this assumption is reasonable by usingglycerol as an internal standard for liquid from the centrifuge andliquid washed from the solids cake (Table 3). Glycerol concentra-tions in the two streams are similar.
2. All of the undissolved starch granules on the corn fiber werecompletely solubilized through pretreatment for all fiber loadings.This assumption adheres to the results from laboratory tests forloadings up to 16% fiber (Table 1 and Fig. 2).
3. Total undissolved solids were reduced by 50% through pretreat-ment for all fiber loadings. This assumption adheres to the resultsfrom laboratory tests for loadings up to 16% fiber. This assumptionmight not hold at higher loadings.
Fig. 6. Concentration of soluble glucan (starch) in pretreatment liquid as functionof initial fiber loading expressed as weight/volume × 100. Curves for steam injectionfor trim heat, two heat exchangers, and two heat exchangers plus cellulase treatmentare shown.
Scale-Up of pH Controlled Pretreatment 91
Applied Biochemistry and Biotechnology Vol. 125, 2005
4. All soluble glucans in the liquid stream (stream 5) were enzymati-cally hydrolyzed in postprocessing of the liquid. This includes casesin which amylases and/or cellulases were used.
5. Glucose from soluble glucan hydrolysis was fermented to ethanol at95% of theoretical yield. No other monosaccharides were assumedto be fermented, for purposes of evaluation of the economics of theprocess presented in the next section.
6. Unfermented dissolved solids were carried through distillation inthe stillage stream to be mixed with the pretreated solids, dried, andsold as animal feed.
Three simulations were run for fiber loadings between 8 and 28%.The first simulation was based on the system as operated in the pilot test:one heat exchanger for heat recovery followed by direct injection of steam(see schematic diagram in Fig. 1A). The second simulation was conductedfor a system with two heat exchangers to eliminate the diluting effect ofdirect injection of steam. The second heat exchanger was assumed to besupplied with 150 psi of saturated steam for makeup or trim heat. Theeffectiveness of this heat exchanger was assumed to be 85%; that is, 85% ofthe total enthalpy transferred from the steam to the pretreatment stream.The third simulation assumes that the pretreatment stream is treated withcellulase, which solubilizes an additional 45% of the remaining undissolvedsolids before centrifugation (Fig. 3); however, the percentage of solubiliza-tion might not be constant. This assumption is based on the laboratory datashown in Fig. 3. The additional 45% solubilization (72% total solubilizationof the inlet corn fiber) occurs at 2 h of cellulase treatment.
The results of increased fiber loading are illustrated in Fig. 7A, whichplots glucan recovery as a function of fiber loading for the two-heat-exchanger process configuration with and without cellulase hydrolysisprior to centrifugation. Both curves assume that the resulting centrifugecake has a moisture content of 60%. Higher fiber loading translates into alarger percentage of exit solids because both the amount of fiber and theliquid it holds become larger (stream 4 in Fig. 1A). The higher the solids thehigher percentage of the total liquid entrapped in that solids cake. It is inthis context that enzyme hydrolysis of cellulose (solids) will reduce themass of undissolved solids and result in higher recovery of soluble glucansin the liquid stream. Thus, a higher fiber loading must be followed byenzyme treatment of unhydrolyzed pretreated solids.
Figure 7B shows the calculation of the mass of soluble maltodextranrecovered vs the heat energy required to bring the pretreatment slurry toprocess temperature for a two-heat-exchanger process configuration(no exogenous water is added). These data show clear optimal conditionsfor each centrifuge cake moisture content if fermentable sugar recovery isto be maximized and energy consumption minimized. For the 74% mois-ture content case, the optimum is approx 22% (w/v) fiber loading; for the70% case, nearly 25%; and for the 60% case, 35%.

92 Mosier et al.
Applied Biochemistry and Biotechnology Vol. 125, 2005
The optimal economic fiber loading balances the decreased steamdemand and increased sugar concentration against decreased sugar recov-ery for increasing fiber loading. Enzyme treatment prior to centrifugationoffers a possible way to shift the optimum toward higher fiber loading.However, the economic benefit of this approach will be at least partiallyoffset by increased capital costs (holding tanks for saccharification) andoperational costs (enzyme).
Fig. 7. Calculated effect of fiber loading on the two-heat-exchanger pretreatmentprocess for (A) recovery of soluble glucan from the centrifuge in the liquid (stream 5)with 60% moisture cake with and without cellulase hydrolysis prior to centrifugationand (B) mass of glucans recovered per kilojoule of heat supplied for pretreatment forvarious centrifuge cake moisture contents (MC).

Scale-Up of pH Controlled Pretreatment 93
Applied Biochemistry and Biotechnology Vol. 125, 2005
Economic Evaluation
The simulation results for three different fiber loadings (w/v), includ-ing the fiber loading used for the pilot trial, were used to calculate andevaluate the economics of this pretreatment process for the production offuel ethanol. The full-scale economic evaluation was based around a pre-treatment line that could be integrated into the process at Aventine Renew-able Energy. Such a process handles 200 gpm (767 L/min) of slurry, whichis equivalent to 10,000 lbm/h (4500 kg/h) of corn fiber on a dry basis.Equipment costs were subjected to straight-line depreciation over a 10-yrtime frame. The cost of capital equipment and installation for the pretreat-ment process was estimated as $1.5 million based on information providedby Aventine that was obtained from equipment manufacturers.
Operational costs consist of fiber, stillage, steam, electricity, labor, andmaintenance. Fiber and stillage input costs are expressed as a compositenumber based on total solids (dry basis). The value of these solids wascalculated from the opportunity cost of these solids sold as corn gluten feed(dry basis). Unit costs are expressed in terms of cents per gallon of ethanolproduced from the glucose and soluble glucans present in the liquid streamfrom the centrifuge assuming 95% fermentation efficiency. Credits are cal-culated on the same basis, for which solids are defined as any componentthat is not fermented and sold as corn gluten feed of industry-standardquality. The electrical, maintenance, and labor costs were estimated usinga lumped sum of $0.191/gal of ethanol produced.
It was of interest to calculate the effect of increasing the ratio of fiberto stillage on the economics of the process. Three fiber loadings were exam-ined (case 1: 7.8% [w/v]; case 2: 16% [w/v]; and case 3: 28% [w/v]) with andwithout applying cellulase immediately prior to centrifugation. Treatmentusing cellulase is expected to increase the efficiency of the centrifuge byreducing the undissolved solids in the entering stream. Based on the labora-tory enzyme digestion results shown in Fig. 3, it was assumed thattreating with cellulase reduced the undissolved solids by 45%.
The amount of dissolved and undissolved solids consumed to formfermentation ethanol was calculated by difference based on the total dis-solved solids removed with the liquid (stream 5). All other remaining sol-ids are prorated at a value (cost) equivalent to $65/t, average value for corngluten feed (dry basis). Consequently, solids remaining after fermentationare being credited at $65/t against the cost of dissolved (in stillage) andundissolved (fiber) solids entering the process. Hence, the solids are thecombination of material in stream 4 and solids in steam 5 that remains afterfermentation.
An additional operational cost of cellulase enzyme at 10¢/gal of etha-nol produced was assumed and included in the net cost of production forthe cases in which cellulases were used. Downstream processing costs (dis-tillation, ethanol drying, and so on) were not included. The fiber-loadingsimulation was used to estimate the energy required in the form of 150 psi

94 Mosier et al.
Applied Biochemistry and Biotechnology Vol. 125, 2005
of saturated steam for heating the corn fiber/stillage slurry to the process-ing temperature. An energy cost of $5/106 BTU of energy was assumed.The amount of steam required to process 1 lbm of fiber shown on thebottom line of Table 4 is directly related to the solids loading into the pre-treatment coil and the assumption that 85% of the energy is transferredfrom the “cold” side of the heat exchanger to the “hot” side. The cost ofenergy per gallon of ethanol produced drops as the loading increases sim-ply because there is less water to be heated per lbm of fiber processed athigher loadings. The addition of cellulases increases the yield of ferment-able glucose per lbm of fiber processed, thus leading to the significantlylower energy cost per gallon of ethanol in these cases when compared to thesame loading without added cellulase (Table 4).
Table 5 shows the operational costs of the pretreatment processexpressed as cents per gallon of ethanol for three cases. The operationalcosts include the opportunity cost of the fiber as feedstock for additionalethanol, energy cost (steam) for the pretreatment, and a fixed labor andoverhead cost of 19.10¢/gal of ethanol. For case studies in which cellulaseis added, an additional operational cost of 10¢/gal of ethanol is added.The cost of amylase for hydrolysis of the maltodextran fraction will addseveral tens of cents per gallon of ethanol but are not shown in Table 5.These costs do not include capital costs or the energy savings for the reducedmass of fiber in the corn gluten feed driers. The operational costs for thepretreatment of corn fiber in a wet-milling plant is less than $1.00/gal ofethanol produced from the sugars derived from the pretreated corn fiber.Increasing the fiber loading from 8 to 16% decreases the operationalexpenses by more than 7¢/gal of ethanol when cellulase hydrolysis is notincluded in the process. Further increasing the fiber loading from 16 to28% reduces the operational expenses by only approx 2.5¢/gal owing tothe loss of liquid with the solids from the centrifuge.
Table 4Predicted Steam Demand for Three Case Typesa
Case 1 Case 2 Case 3(7.8% [w/v] fiber) (16% [w/v] fiber) (28% [w/v] fiber)
A A&C A A&C A A&C
Stillage mass 10.37 10.37 3.75 3.75 1.07 1.07 (lbm/lbm fiber)
Total mass 12.87 12.87 6.25 6.25 3.57 3.57 (lbm/lbm fiber)
Ethanol production 0.017 0.037 0.013 0.037 0.009 0.033 (gal/lbm fiber)
Steam demand 0.83 0.98 0.41 0.48 0.23 0.27 (lbm/lbm fiber)b
aCase A = glucan derived from starch, and case B = glucan derived from starch andcellulose. A, amylase alone; A&C, amylase + cellulase.
bAssumes 85% recovery of thermal energy.

Scale-Up of pH Controlled Pretreatment 95
Applied Biochemistry and Biotechnology Vol. 125, 2005
The net cost of solids per gallon of ethanol produced is constant at44.5¢/gal for all cases, because the same mass of sugar is required to pro-duce 1 gal of ethanol in all cases. The major savings in operational cost asthe solids loading is increased is in the energy required for pretreatment,which drops from 20¢/gal in the 7.8% (w/v) solids loading case to 12.6¢/galin the 16% (w/v) solids loading case and then increases to 3.5¢/gal in the28% (w/v) loading case. However, owing to the increasing solids load inthe centrifuge as the solids loading increases, the yields of glucose in theliquid stream drop from 83% in the 16% (w/v) loading case to 65% in the28% (w/v) loading case (Fig. 7B; no cellulase).
Although the amount of ethanol produced per pounds mass of fiberis significantly increased when the glucose from cellulase-digested cellu-lose is included (Table 5), the assumed cost of the enzyme at 10¢/gal ofethanol causes the operational expenses for these cases to be nearly thesame as the cases in which no cellulase was added for the same fiber loading.
The experimental results for cellulase digestion of the pretreated fibersuggest that lower enzyme loadings may result in significant improve-ments in fermentable glucose generation and recovery for less than 10¢/galof ethanol produced. Further examination of the effect of enzyme loadingon hydrolysis yields and rates is needed to optimize the process to generatethe lowest operational and capital costs for cellulase hydrolysis of pre-treated corn fiber for the production of fermentable sugars.
Conclusion
The pretreatment of corn fiber at a pH maintained at 4.0 was demon-strated at a pilot plant scale of 43 gal (163 L) of slurry (containing 18.2% dis-solved and insoluble solids)/min. The pretreatment results confirm
Table 5Operational Expenses Based on Simulation
of Corn Fiber Pretreatment at 200-gpm Scale (757 L/min)a
Case 1 Case 2 Case 3(7.8% [w/v] fiber) (16% [w/v] fiber) (28% [w/v] fiber)
A A&C A A&C A A&COperational (¢/gal (¢/gal (¢/gal (¢/gal (¢/gal (¢/gal expense ethanol) ethanol) ethanol) ethanol) ethanol) ethanol)
Net solids 44.5 44.5 44.5 44.5 44.5 44.5Steam heat @ 20.0 9.4 12.6 5.3 10.2 3.5
$5/106 BTUCellulase N/A 10.0 N/A 10.0 N/A 10.0Electric, 19.1 19.1 19.1 19.1 19.1 19.1
maintenance,and laborTotal $0.84 $0.83 $0.76 $0.79 $0.74 $0.77aA, amylase alone; A&C, amylase + cellulase. N/A, not applicable.

96 Mosier et al.
Applied Biochemistry and Biotechnology Vol. 125, 2005
laboratory data that this pretreatment process solubilizes nearly all of theresidual starch from the corn fiber surface while also producing residualundissolved solids that are completely digested by commercially availablecellulase preparations at a rate that is two times more rapid than untreatedfiber at the same enzyme loading of 10 FPU/g of fiber (dry basis). The effectof increasing the percentage of corn fiber in the slurry shows that higherloading increases the soluble glucan concentration and decreases the energyrequired per mass unit of corn fiber that is processed. However, recoveryof the soluble products through centrifugation becomes more difficultbecause a finite amount of the liquid will remain trapped in the undis-solved solids fraction. However, hydrolysis of the cellulose addresses thisdisadvantage by decreasing the total solids that are processed in the centri-fuge. Preliminary economic analysis shows that the operational cost of thispretreatment process is less than $0.84/gal of ethanol produced. Furtherwork is required to demonstrate longer-term operability of the pretreat-ment process as well as to determine applicable enzyme loading and addi-tional capital costs to include cellulase hydrolysis in the system and todetermine its likely impact on the economics.
Acknowledgments
We thank Dr. John Patterson and Meijuan Zang for internal review ofthe manuscript and helpful suggestions. This article is based on work sup-ported by NREL and the US Department of Energy under subcontractsZXE-9-18080-02 and ZCO-1-31023-01 “Building a Bridge to the EthanolIndustry,” the Indiana Department of Commerce, and the Great LakesGovernors’ Council.
References
1. Baker, A. “Feed Grains Database,” Economic Research Service: US Department ofAgriculture. http://www.ers.usda.gov/db/feedgrains/default.asp? ERSTab=3&freq=Monthly &Report=Commodity&data=PRICES (accessed March 11, 2005).
2. Gulati, M., Kohlmann, K., Ladisch, M. R., Hespell, R., and Bothast, R. J. (1996),Bioresour. Technol. 58, 253–264.
3. Singh, V., Moreau, R. A., Doner, L. W., Eckhoff, S. R., and Hicks, K. B. (1999), CerealChem. 76, 868–872.
4. Doner, L. W., Chau, H. K., Fishman, M. L., and Hicks, K. B. (1998), Cereal Chem. 75,408–411.
5. Wang, T., Hicks, K. B., and Moreau, R. (2002), J. Am. Oil Chem. Soc. 79, 1201–1206.6. Taylor, S. L. and King, J. W. (2000), J. Am. Oil Chem. Soc. 77, 687, 688.7. Ladisch, M. R., Lin, K. W., Voloch, M., and Tsao, G. T. (1983), Enzyme Microb. Technol.
5, 82–102.8. Mosier, N. S., Hall, P., Ladisch, C. M., and Ladisch, M. R. (1999), Adv. Biochem. Eng.
65, 24–40.9. Conner, A. H., Wood, B. F., Hill, C. G., and Harris, J. F. (1986), in Cellulose: Structure,
Modification, and Hydrolysis, Young, R. A. and Rowell, R. M., eds., Wiley, New York,pp. 281–296.
10. Mosier, N., Wyman, C., Dale, B., Elander, R., Lee, Y. Y., Holtzapple, M., and Ladisch,M. R. (2005) Bioresour. Technol. 96, 673–686.
Scale-Up of pH Controlled Pretreatment 97
Applied Biochemistry and Biotechnology Vol. 125, 2005
11. Hsu, T.-A. (1996), in Handbook on Bioethanol: Production and Utilization, Wyman, C. E.,ed., Taylor & Francis, Washington, DC, pp. 179–212.
12. Lin, K. W., Ladisch, M. R., Schaefer, D., Noller, C. H., Lechtenberg, V., and Tsao,G. T. (1981), AIChE Symp. Ser. 77, 102–106.
13. Weil, J. R., Sarikaya, A., Rau, S.-L., Goetz, J., Ladisch, C. M., Brewer, M., Hendrickson,R., and Ladisch, M. R. (1998), Appl. Biochem. Biotechnol. 73, 1–17.
14. Weil, J. R., Brewer, M., Hendrickson, R., Sarikaya, A., and Ladisch, M. R. (1998),Appl. Biochem. Biotechnol. 70–72, 99–111.
15. Weil, J., Sarikaya, A., Rau, S.-L., Goetz, J., Ladisch, C., Brewer, M., Hendrickson, R.,and Ladisch, M. R. (1997), Appl. Biochem. Biotechnol. 68, 21–40.
16. Bobleter, O. (1994), Prog. Polym. Sci. 19, 797–841.17. Mok, W. S.-L. and Antal, M. J. Jr. (1992), Ind. Eng. Chem. Res. 31, 1157–1161.18. Ladisch, M. R., Kohlmann, K., Westgate, P., Weil, J., and Yang, Y. (1998), US patent
5,846,787.19. Delgenes, J. P., Moletta, R., and Navarro, J. M. (1996), Enzyme Microb. Technol. 19,
220–225.20. Palmqvist, E. and Hahn-Hagerdal, B. (2000), Bioresour. Technol. 74, 25–33.21. Zaldivar, J., Martinez, A., and Ingram, L. O. (1999), Biotechnol. Bioeng. 65, 24–33.22. Ruiz, R. and Ehrman, T. (1996), LAP-002 NREL Analytical Procedure, National
Renewable Energy Laboratory, Golden, CO.23. Saha, B. C. and Bothast, R. J. (1999), Appl. Biochem. Biotechnol. 76, 65–77.24. Ho, N. W. Y., Chen, Z., and Brainard, A. P. (1998) Appl. Environ. Microbiol. 64, 1852–
1859.25. Ho, N. W. Y. and Tsao, G. T. US Patent Application no. 08148581, awarded August
1998, patent no. 5789210.26. Ho, N. W. Y., Chen, Z., Brainard, A. P., and Sedlak, M. (2000) ACS Symposium Series
767, 142–159.27. Ruiz, R. and Ehrman, T. (1996), LAP-014 NREL Analytical Procedure. National
Renewable Energy Laboratory, Golden, CO.28. Nichols, N. N., Dien, B. S., and Bothast, R. J. (2001), Appl. Biochem. Biotechnol. 56,
120–125.29. Weil, J. R., Dien, B., Bothast, R., Hendrickson, R., Mosier, N. S., and Ladisch, M. R.
(2002), Ind. Eng. Chem. Res. 41, 6132–6138.
Copyright © 2022 FDOKUMEN