Industrial Location Policy - World Bank Documents
149
SWP620 Industrial Location Policy The Indian Experience A. Uday Sekhar WORLD BANK STAFF WORKING PAPERS Number 620 Public Disclosure Authorized Public Disclosure Authorized Public Disclosure Authorized Public Disclosure Authorized
-
Upload
khangminh22 -
Category
Documents
-
view
2 -
download
0
Transcript of Industrial Location Policy - World Bank Documents

SWP620
Industrial Location PolicyThe Indian Experience
A. Uday Sekhar
WORLD BANK STAFF WORKING PAPERSNumber 620
Pub
lic D
iscl
osur
e A
utho
rized
Pub
lic D
iscl
osur
e A
utho
rized
Pub
lic D
iscl
osur
e A
utho
rized
Pub
lic D
iscl
osur
e A
utho
rized
WORLD BANK STAFF WORKING PAPERSNumber 620
Industrial Location PolicyThe Indian Experience
A. Uday Sekhar
INTERNATIO??EL MO'?-EARY FuNDJOINT MEH99Y
[A/AR 2'. 1984
INTEIRNATIONAL D:piiK FORrL'.E:O5i'JTrCTION i!JD DIVELCPIENT
WARlSl2NOTCN,'L .C. 2Ve91
The World BankWashington, D.C., U.S.A.
Copyright 0 1983The International Bank for Reconstructionand Development / THE WORLD BANK1818 H Street, N.W.Washington, D.C. 20433, U.S.A.
First printing October 1983All rights reservedManufactured in the United States of America
This is a working document published informally by the World Bank. Topresent the results of research with the least possible delay, the typescript hasnot been prepared in accordance with the procedures appropriate to formalprinted texts, and the World Bank accepts no responsibility for errors. Thepublication is supplied at a token charge to defray part of the cost ofmanufacture and distribution.
The views and interpretations in this document are those of the author(s) andshould not be attributed to the World Bank, to its affiliated organizations, or toany individual acting on their behalf. Any maps used have been preparedsolely for the convenience of the readers; the denominations used and theboundaries shown do not imply, on the part of the World Bank and its affiliates,any judgment on the legal status of any territory or any endorsement oracceptance of such boundaries.
The full range of World Bank publications is described in the Catalog of WorldBank Publications; the continuing research program of the Bank is outlined inWorld Bank Research Program: Abstracts of Current Studies. Both booklets areupdated annually; the most recent edition of each is available without chargefrom the Publications Sales Unit of the Bank in Washington or from theEuropean Office of the Bank, 66, avenue d'Iena, 75116 Paris, France.
A. Uday Sekhar is deputy manager of the Industrial Development Bank ofIndia and a consultant to the World Bank.
Library of Congress Cataloging in Publication Data
Sekhar, Uday.Industrial location policy.
(World Bank staff working papers ; no. 620)Bibliography: p.1. India--Industries--Location. I. Title. II. Series.
HC44o.D5S44 1983 338.6'042'0954 83-21774ISBN 0-8213-0273-6
ABSTRACT
The Government of India has been utilizing a wide-ranging setof measures to influence the location of industry. They are generallyintended to disperse industries from large metropolitan areasand to promote the development of less developed regions. Thispaper probes into the working and impact of individual location policies,and demonstrates certain serious deficiencies and lacunae in thejustification, design and implementation of many of them. These short-comings call for a thorough overhauling in the approach of the Governmenttowards industrial location policy. In particular, this paper recommendsthat whenever there is evidence that the existing concentration isinoptimal or inequitable, policy makers should operate with incentivesrather than controls, as this form of industrial location policyinstrument appears to provide the least damage to the economy whileachieving the locational objectives.
ACKNOWLEDGMENTS
The views expressed in this paper are personal and do not reflectthose of the institution in which I am employed. I wish to record mydeep indebtedness tco Rakesh Mohan, Professor Edwin Mills, Douglas Keare,Peter Townroe, Koichi Mera and other members of the former Urban andRegional Economics Division of the World Bank for their invaluableassistance in the preparation of this paper.

TABLE OF CONTENTS
SUMMARY ................................................................... viii
Chapter I -- INTRODUCTION ................................................ 1
Chapter II -- INDUSTRIAL LOCATION POLICIES IN INDIA .......................1. Policies Influencing Inter-State Distribution of Industry .. 15
i. IndustriaL Licensing ........................ 15ii. Location of Public Sector Plants ............................ 22iii. Distribution and Pricing Policies for Basic
Industrial Inputs ...................................... 31iv. State Government Incentives ................................. 35
2. Policies Influencing the Intra-Regional Distributionof Industry ............................................ 36
i. Policies to Encourage the Small Scale Sector ................ 37ii. IndustriaL Estate Program ................................... 43iii. Rural Industries Projects ................................... 49iv. Metropolitan Planning ....................................... 56v. Incentives to Develop Backward Districts .................... 59
Chapter III -- TRENDS 'IN INDIAN INDUSTRIAL LOCATION ...................... 691. Trends in the Inter-State Distribution of Industry ............... 692. Trends in the :Intra-Regional Distribution of Industry ............ 77
Chapter IV -- AN OVERALL ASSESSMENT OF INDUSTRIAL LOCATION POLICY ......... 911. Rationale of Industrial Location Policy . . 91
i. Resource ALlocation and Growth ............................... 92ii. Equity .................... ..... ...... ............... 96
2. Limitations of Industrial Location Policy . . 97
POSTCRIPT..102POSCRPT.................................................................101. National Committee on the Development of Backward Areas .......... 102
i. Policy Recommendations for Medium and LargeIndustries ............................................. 103
ii. Policy Recommendations for Small Industries,Anci:Llary Industries and Agro-Industries ............... 104
iii. Recommendations for Maximizing the Local Impact ofIndustrial Development ................................. 105
2. A Critique of lthe NCDBA Report ................................... 106
BIBLIOGRAPHY .............................................................. 109
APPENDIX I: Maximum and Minimum Values of Hirschman-Herfindahl andThei:L Indices .......................................... ll
APPENDIX II: A Shift-Shasre Analysis of Industrial Growth inthe lMajor Industrial States of India ................... 113

LIST OF TABLES
Table Page
1. Share of Manufacturing in GDP (7) in some DevelopingEconomies, 1977 2
2. Structure of the Indian Manufacturing Sector, 1974 4
3. Trend Growth Rates (7 per annum) in the Manufacturing 6Sector
4. Value Added in Factory Manufacturing Sectoras a Proportion of State NDP (7) 7
5. VAM/NDP For Each State Divided by VAM/NDP for All-India 8
6. Share of States in Total Value Added in FactoryManufacturing Sector (7) 10
7. Share of States in Total Factory Employment inManufacturing (7) 11
8. Distribution of Urban Employment and Population inNon-Household Industry by the Size of Cities,Towns, and Town Groups (TG)/Urban Agglomerations (UA) 12India, 1961 & 1971
9. Approved Licenses as a Percentage of LicenseApplications, 1959-66 18
10. Correlation Coefficients between State-WiseProportions of Licenses Approved and Indices ofState Development 20
11. Share of States in Cumulative Investment(Gross Block) in Central Public Undertakings (7) 24
12. Share of States in Annual Investment In CentralPublic Undertakings (7) 25
13. Correlation Coefficients Between State-Wise PerCapita Investment in Central Public Undertakings andIndicators of State Development 26
14. Distribution of Cumulative Public SectorInvestment (7) 28
15. Share of Employment in Central Public Undertakingsin Total Employment in Manufacturing and Mining (7) 29
16. Orders placed by Public Sector Undertakings to SmallScale Units as a Percentage of Output of Modern SmallScale Sector 30
17. Region-Wise Installed Capacity of Cement (%) 31
18. Share of Unregistered Sector in Value Added inManufacturing (%) 38
19. Employment and Output in Modern Small Scale Sector,1972 39
20. Percentage of Sheds Completed but not Functioning 46
21. Share of Industrial Estates in Industrial Employmentand Output (%) 50
22. Public Expenditure on Rural Industries Projects 53
23. Proportion of Saimple Units Availing of R.I.P.Assistance (%) 54
24. Estimated Public Sector Expenditure on Small ScaleIndustries 55
25. Share of Backward Districts in Area and Population,1971 60
26. Reimbursement of Central Investment Subsidy byGovernment of India (Rs.m) 62
27. Share of States and Union Territories in the CentralInvestment Subsidly Disbursed during 1972/73 to1978/79 63
28. Terms of Concess ional Finance for Units in BackwardDistrict/Areas, 1975 66
29. Trends in the Share (%) of Backward Districts inAssistance Sanctioned and Disbursed by the IndustrialDevelopment Bank of India, 1964/65 to 1980/81 67
30. Value Added per Employee (Rs. '000) in Industry 72
31. State Share in Value Added/State Share in Employmentin Factory Manufacturing Sector 73
32. Measures of State-Wise Concentration of Industry(Factory Sector) 74
33. Distribution of Industrial Employment in Cities,Towns, and Town Groups (TG)/Urban Agglomerations (UA),1961 & 1971 79
LIST OF FIGURES
Figure Page
1. Share of Backward Districts in Factory Employment(7), Maharashtra 86
2. Share of Backward Districts in Factory Employment(7), Haryana 87
3. Share of Backward Districts in Factory Employment(7), Punjab 88
4. Share of Backward Districts in Factory Employment(7), Andhra Pradesh 89
5. Share of Backward Districts in Factory Employment(.), Kerala 90
Map
1. Map of India 118
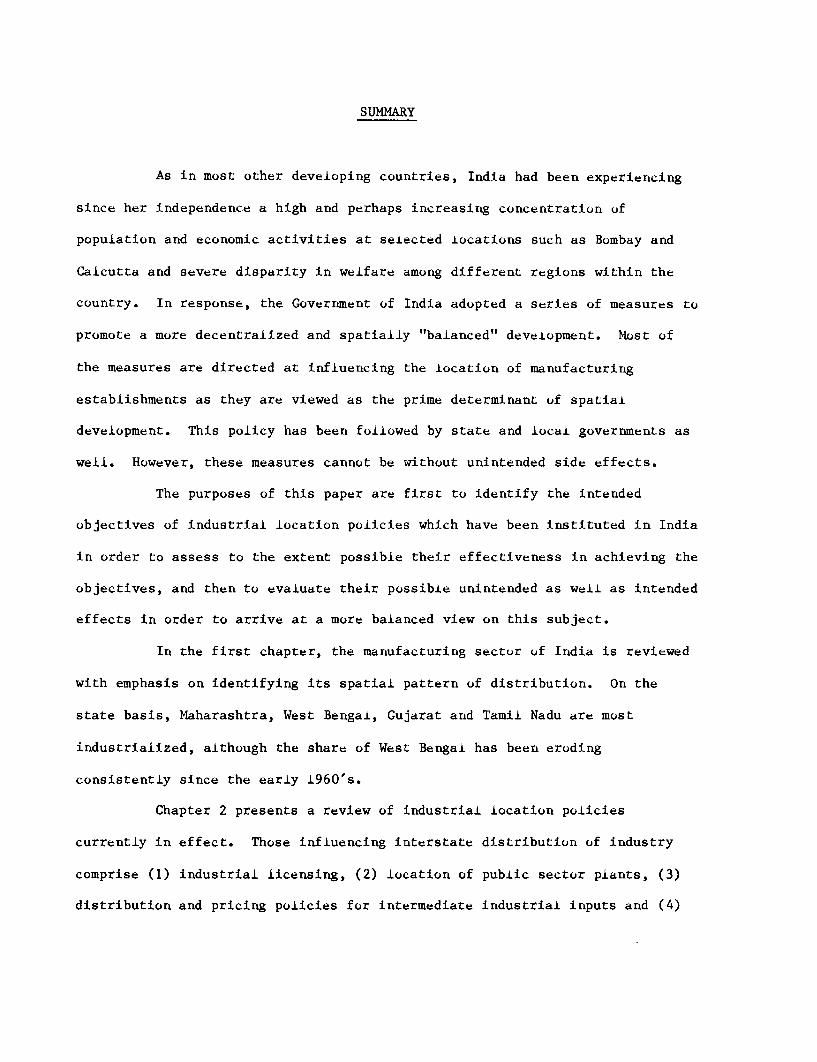
SUMMARY
As in most other developing countries, India had been experiencing
since her independence a high and perhaps increasing concentration of
population and economic activities at selected locations such as Bombay and
Calcutta and severe disparity in welfare among different regions within the
country. In response, the Government of India adopted a series of measures to
promote a more decentralized and spatially "balanced" development. Most of
the measures are directed at influencing the location of manufacturing
establishments as they are viewed as the prime determinant of spatial
development. This policy has been followed by state and local governments as
well. However, these measures cannot be without unintended side effects.
The purposes of this paper are first to identify the intended
objectives of industrial location policies which have been instituted in India
in order to assess to the extent possible their effectiveness in achieving the
objectives, and then to evaluate their possible unintended as well as intended
effects in order to arrive at a more balanced view on this subject.
In the first chapter, the manufacturing sector of India is reviewed
with emphasis on identifying its spatial pattern of distribution. On the
state basis, Maharashtra, West Bengal, Gujarat and Tamil Nadu are most
industrialized, although the share of West Bengal has been eroding
consistently since the early 1960's.
Chapter 2 presents a review of industrial location policies
currently in effect. Those influencing interstate distribution of industry
comprise (1) industrial licensing, (2) location of public sector plants, (3)
distribution and pricing policies for intermediate industrial inputs and (4)

state government incentives. Since 1951, the Central Government has been
authorized to license a new industrial establishment or a substantial
expansion. This instrument has been used to achieve a "balanced" regional
development. This policy orientation has been strengthened since 1965, and
since 1977 an explicit decision has been made to prohibit the setting up of
licensable industries within certain geographical limits of large metropolitan
cities with a population exceeding one million and urban agglomerations with a
population greater than half a million.
Location decisions of public sector plants are also an important
policy instrument, because many basic and capital goods are produced by the
public sector in India. The less developed states of Madhya Pradesh and Bihar
received large shares of investment, followed by Orissa and West Bengal.
Since location decisions were made on the basis of technical and economic
considerations as well as regional balance, it is impossible to isolate the
degree of regional consideration which went into location decisions, but an
analysis shows that the per capita cumulative investment in this sector has
been consistently negatively related to state per capita income and
undoubtedly it contributed to balancing the distribution of industry among
states.
With regard to the distribution of such basic commodities as cement,
steel and coal, "freight-pooling" is exercised by the Central Government so
that firms in every location may equally benefit from the provision of these
goods. This policy, as well as the preceding ones, disturts firms' locations
from the economically rational locations.
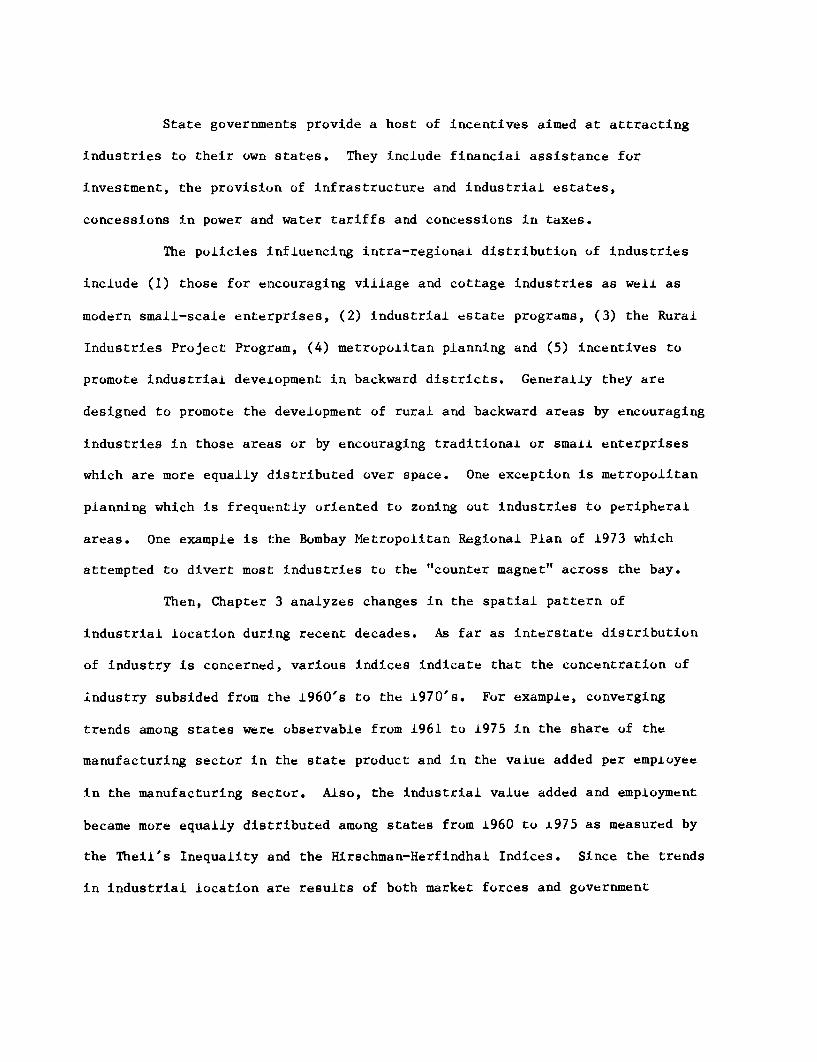
State governments provide a host of incentives aimed at attracting
industries to their own states. They include financial assistance for
investment, the provisioin of infrastructure and industrial estates,
concessions in power and water tariffs and concessions in taxes.
The policies Lnfluencing intra-regional distribution of industries
include (1) those for encouraging village and cottage industries as well as
modern small-scale enterprises, (2) industrial estate programs, (3) the Rural
Industries Project Program, (4) metropolitan planning and (5) incentives to
promote industrial development in backward districts. Generally they are
designed to promote the development of rural and backward areas by encouraging
industries in those areas or by encouraging traditional or small enterprises
which are more equally distributed over space. One exception is metropolitan
planning which is frequently oriented to zoning out industries to peripheral
areas. One example is the Bombay Metropolitan Regional Plan of 1973 which
attempted to divert most industries to the "counter magnet" across the bay.
Then, Chapter 3 analyzes changes in the spatial pattern of
industrial location during recent decades. As far as interstate distribution
of industry is concerned, various indices indicate that the concentration of
industry subsided from the 1960's to the 1970's. For example, converging
trends among states were observable from 1961 to 1975 in the share of the
manufacturing sector in the state product and in the value added per employee
in the manufacturing sector. Also, the industrial value added and employment
became more equally distributed among states from 1960 to 1975 as measured by
the Theil's Inequality and the Hirschman-Herfindhal Indices. Since the trends
in industrial location are results of both market forces and government
policy, it is not possible to conclude that the industrial location policies
have successfully narrowed disparities among states. However, there are good
reasons for speculating that some of the policies were instrumental in
narrowing the disparities.
The intra-regional distribution of industry was examined next. By
comparing the degree of concentration of industrial employment in 1961 and
1971 by grouping cities by size, the following conclusions were obtained: for
India as a whole, the employment in the household industry lost the degree of
concentration substantially from 1961 to 1971, due to a reduction of
concentration (relative to population) in the smaller classes of towns.
However, the non-household industry maintained its level of concentration
during the period. This means that the industrial policy apparently had not
resulted in any substantial shift of industry away from large cities to
smaller towns.
Chapter 4 presents an overall assessment of industrial location
policy. From the viewpoint of efficiency in resource allocation, one should
not expect a regionally balanced industrial development because natural
resources are not evenly distributed and there are economies of scale and
agglomeration in production processes. Industrial policies by the public
sector are needed for the provision of infrastructure because in principle
they cannot be provided adequately by the private sector and for correcting
externalities which arise in the form of congestion and pollution. However,
the former can best be provided by identifying gaps in infrastructure based on
the demand for infrastructure and the costs of providing it. Externalities
can best be dealt with by adjusting prices to reflect externalities.
Therefore, from the viewpoint of efficiency, the best set of measures to
correct inefficient locational distribution of industries operates via
readjustments in infrastructural investment and the prices charged for their
utilization. Direct industrial location policies such as licensing and input
rationing are poor substitutes. Even if the best solutions are not workable,
it would be advisable to operate through incentives and disincentives rather
than through controls, because the latter were crude devices and may lead to
extremely large efficiency loss in the national economy without being detected
by any observer.
A stronger argument may be made for industrial location policy for
the sake of spatial equity. However, as population and labor are mobile
within a country and particularly within a state, the need of achieving
spatial equity itself can be questioned.
In addition, there is serious doubt about the effectiveness of
industrial location policy in achieving spatial equity. One serious
limitation of locational control is that, contrary to expectations, controls
cannot induce industrialists to invest in non-viable areas. Therefore, if
licensing is utilized actively for locational purposes, the result will be a
decrease in investment in the restricted areas without a compensating increase
in the other areas. This involves not only a loss in efficiency, but also a
defeat of the objective of industrializing non-restricted areas.
This and other examples of serious inefficiencies generated by
industrial location policies imply that not enough thought has been given to
the rationale of these policies. Our exploration of their ramifications
reveals that a thorough overhauling is required in the approach toward
locational concentration of industry.

-1-
Chapter I
INTRODUCTION
Economic development, by its very nature, is a dynamic process
characterized by various types of "imbalances." Nowhere is this more striking
than in the spatial dimensions of growth, growth which tends to get
concentrated in certain regions within the economy and, in the case of
non-agricultural activities, at a few nodal metropolitan centers. Whether
this spatial "imbalance" is a "natural" and dynamically efficient (in the
Pareto sense) concomitant of the growth process or whether it is partly a
result of imperfectly functioning markets and externalities is a debatable
issue. The answer varies, of course, from country to country and must be
settled by empirical evidence. Even if spatial concentration is efficient,
one is still faced with the equity issue, which is extremely important in a
geographically large federal polity such as India. Motivated by these welfare
and efficiency considerations, the Indian government has been adopting a
series of measures to promote a more decentralized and "balanced" form of
development. In this study, we are only concerned with those measures
affecting the manufacturing sector. Our objective is to examine the various
explicit policies that have been used by the state to influence industrial
location and to assess their effects. But before embarking on a study of
these policies, it would be useful to set the stage by briefly surveying the
pattern of industrial growth in India.
The origins of modern industry in India can be traced as far back as
the nineteenth century. Even the diversification of the manufacturing sector
from its predominant emphasis on consumer goods started early in the twentieth
-2-
century when Jamshedji Tata succeeded in setting up a steel plant in 1911
against tremendous odds. Because of these early origins, the Indian
manufacturing sector at the time of independence in 1947 was already quite
large in comparison with other developing countries. After 1947, the era
of planned development began, and this gave further impetus to
industrialization. The State also took an active role in setting up
industries producing basic and capital goods, especially during the Second
Five-year Plan (1956-61).
However, despite these early traditions of entrepreneurship,
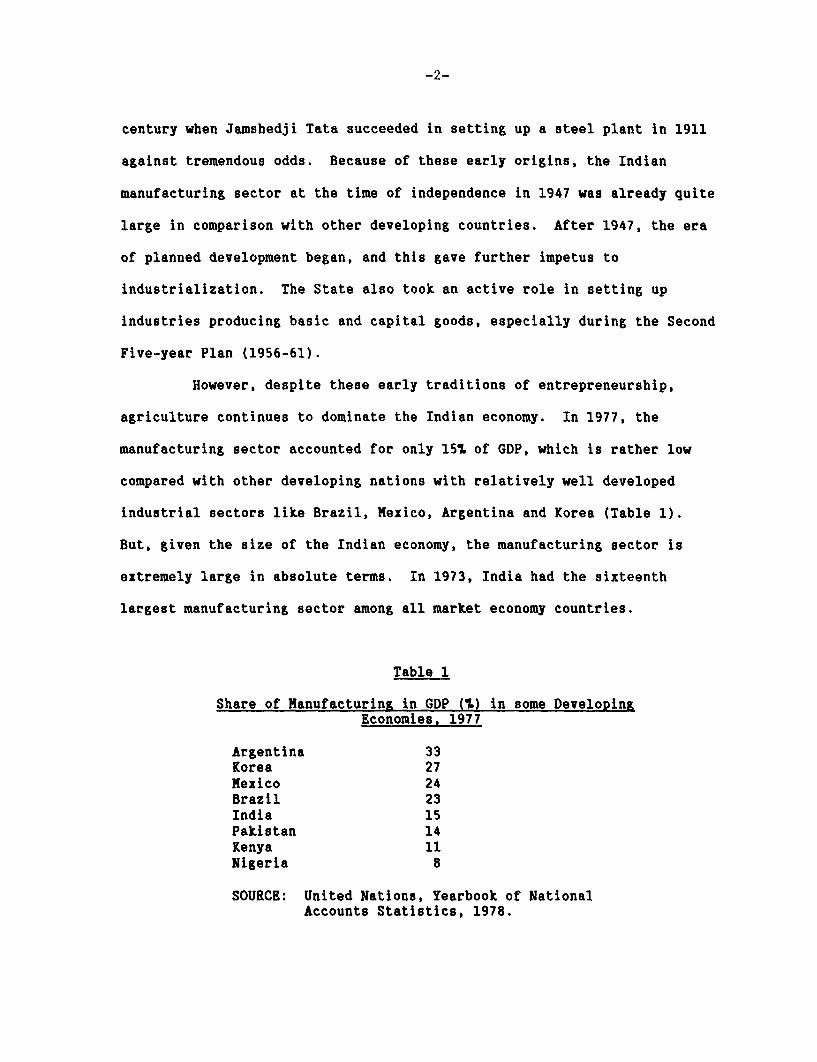
agriculture continues to dominate the Indian economy. In 1977, the
manufacturing sector accounted for only 157. of GDP, which is rather low
compared with other developing nations with relatively well developed
industrial sectors like Brazil, Mexico, Argentina and Korea (Table 1).
But, given the size of the Indian economy, the manufacturing sector is
extremely large in absolute terms. In 1973, India had the sixteenth
largest manufacturing sector among all market economy countries.
Table 1
Share of Manufacturing in GDP (C) in some DevelopingEconomies, 1977
Argentina 33Korea 27Mexico 24Brazil 23India 15Pakistan 14Kenya 11Nigeria 8
SOURCE: United Nations, Yearbook of NationalAccounts Statistics, 1978.
-3-
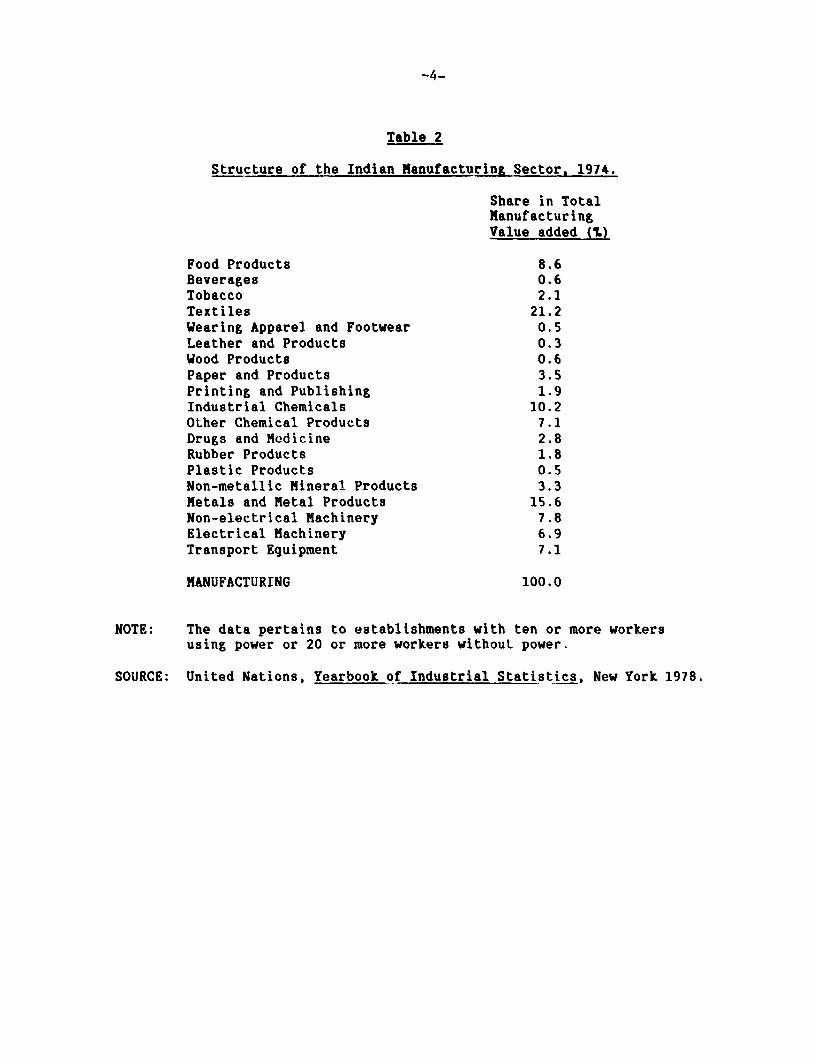
As Table 2 shows, the Indian manufacturing sector is quite
diversified, with capital goods constituting as much as 22% of value added
in manufacturing in 1974. The corresponding shares for consumer and
intermediate goods were 32% and 46% respectively. The institutional
milieu of Indian manufacturing displays an interesting diversity. The
most remarkable aspect is the importance of production by traditional and
small scale enterprise. The so-called "unregistered sector," consisting
predominantly of cottage and village industries utilizing traditional
techniques and employing household labor to a significant extent,
contributed more than a third of total value added in manufacturing in
1975. Small modern enterprises (which, in 1980, were defined as factories
with fixed capital value of less than Rs. two million) accounted for 16%.
In addition, there are imanufacturing units operated by the State, whose
output constituted only 12% of total manufacturing output in 1973.
However, this understates their real importance, since public sector units
are mainly engaged in tlhe production of certain critical items like steel
and various types of machinery and transport equipment. In comparison
with certain other deveLoping countries, foreign capital plays a
relatively minor role in the Indian industrial sector. Only 8.5% of total
paid-up capital in Indimn joint stock companies in 1969-70 originated from
foreign sources. Value added in foreign subsidiaries constituted only
about one tenth of total value added in manufacturing in the same year.
The remaining part of the manufacturing sector is, of course, the private
sector steered by domestic entrepreneurship.
-4-
Table 2
Structure of the Indian Manufacturing Sector, 1974.
Share in TotalManufacturingValue added (IL)
Food Products 8.6Beverages 0.6Tobacco 2.1Textiles 21.2Wearing Apparel and Footwear 0.5Leather and Products 0.3Wood Products 0.6Paper and Products 3.5Printing and Publishing 1.9Industrial Chemicals 10.2Other Chemical Products 7.1Drugs and Modicine 2.8Rubber Products 1.8Plastic Products 0.5Non-metallic Mineral Products 3.3Metals and Metal Products 15.6Non-electrical Machinery 7.8Electrical Machinery 6.9Transport Equipment 7.1
MANUFACTURING 100.0
NOTE: The data pertains to establishments with ten or more workersusing power or 20 or more workers without power.
SOURCE: United Nations, Yearbook of Industrial Statistics, New York 1978.
-5-
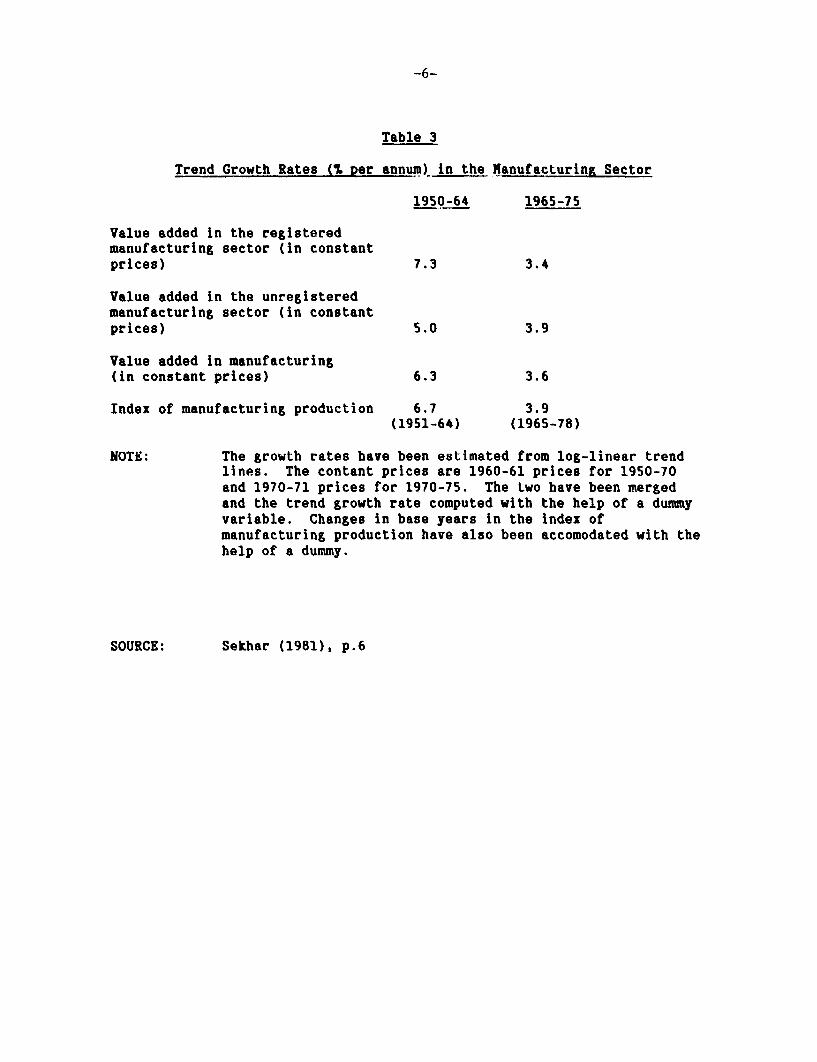
Table 3 shows the growth rates of value added in the registered
and unregistered manufaLcturing sectors and in the index of manufacturing
production during the periods 1951-64 and 1965-78. The major feature of
industrial development during Lhe post 1965 period that has attracted
attention is the slowdown in growth of the organized sector, which
declined sharply from 7.37 per annum to about 3.47 per annum in the two
periods. The deceleration of the unregistered manufacturing sector has
been more moderate, though significant. The net result has been that the
growth rate of real value added in the manufacturing sector as a whole
fell from 6.37 per annum in 1950-64 to 3.67 per annum during 1965-75.
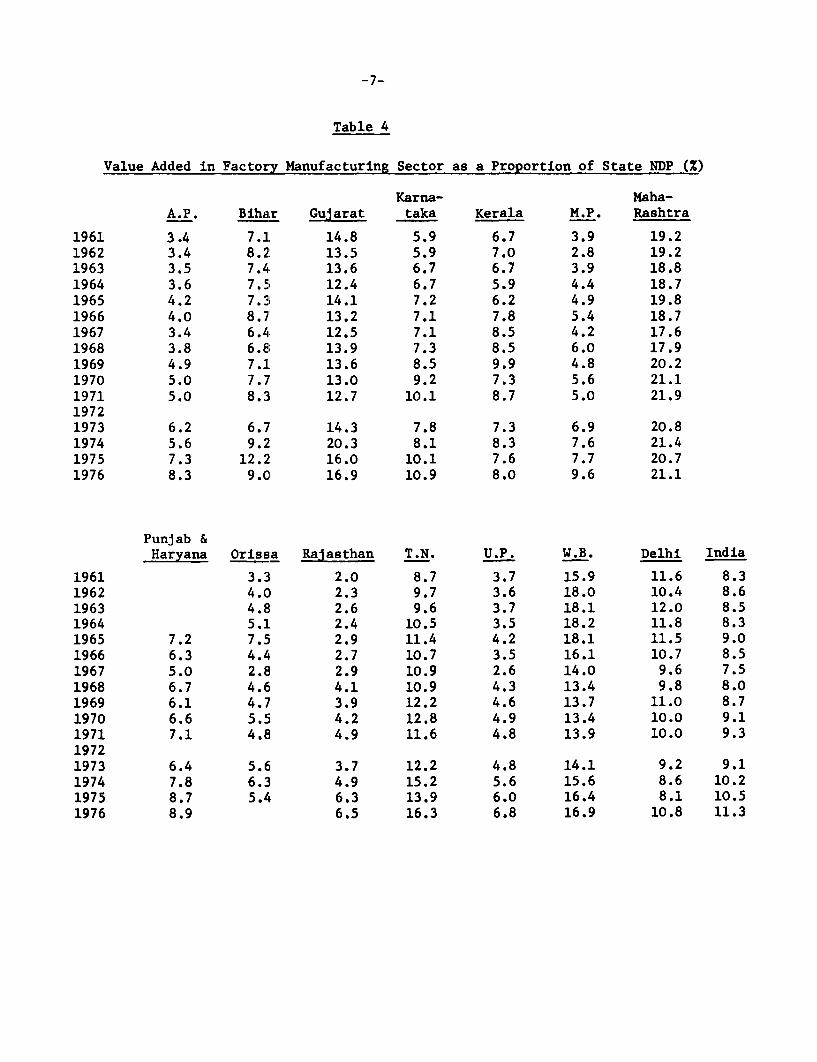
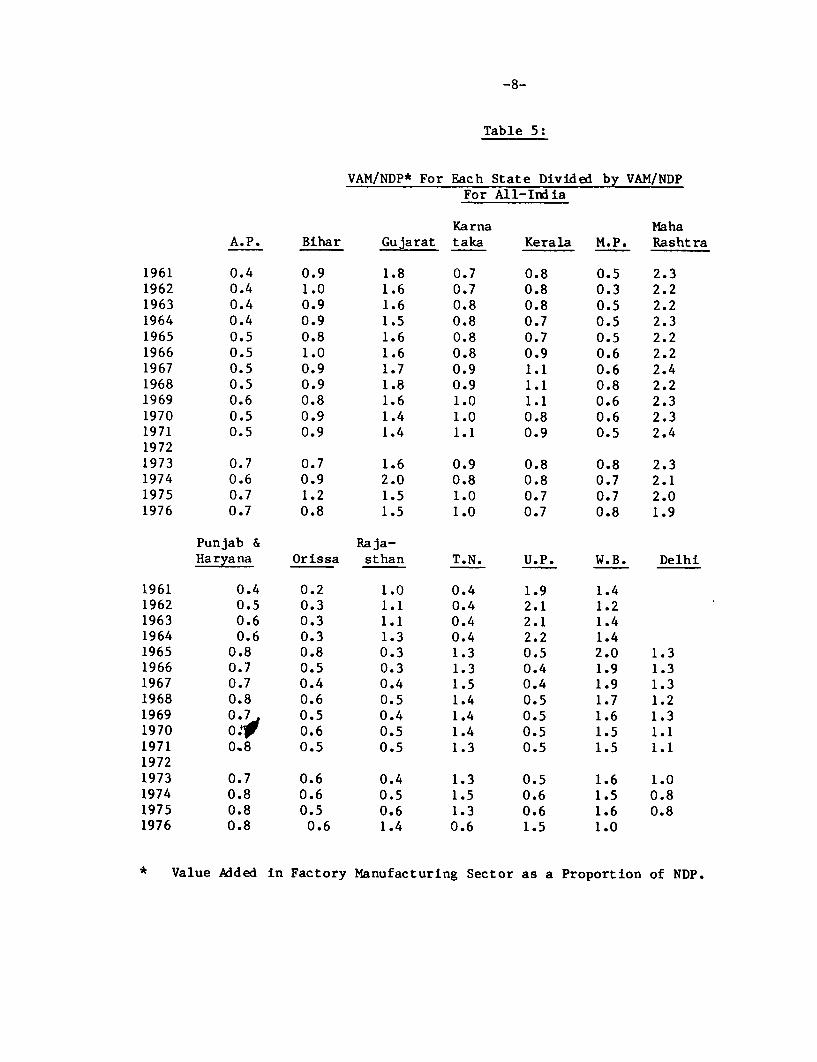
One of the striking characteristics of Indian industrial
development is its uneven geographical spread. In order to identify the
relative degree of industrialization of different states, we computed the
share of value added in the factory manufacturing sector in NDP for each
state (Tables 4 & 5). Comparing the ratios for 1976, one finds that
Maharashtra, West Bengal, Gujarat and Tamil Nadu were the industrial
leaders, in the sense that they had an above average manufacturing value
added/NDP (VAM/NDP) ratio. In 1961, also, these states (along with Delhi)
were relatively more industrialized (with the exception of Tamil Nadu).
However, during 1961-76, the manufacturing sectors of the other states
have been growing at a faster pace relative to NDP. As a result, a trend
towards equalization of state VAMP/NDP ratios is apparent.
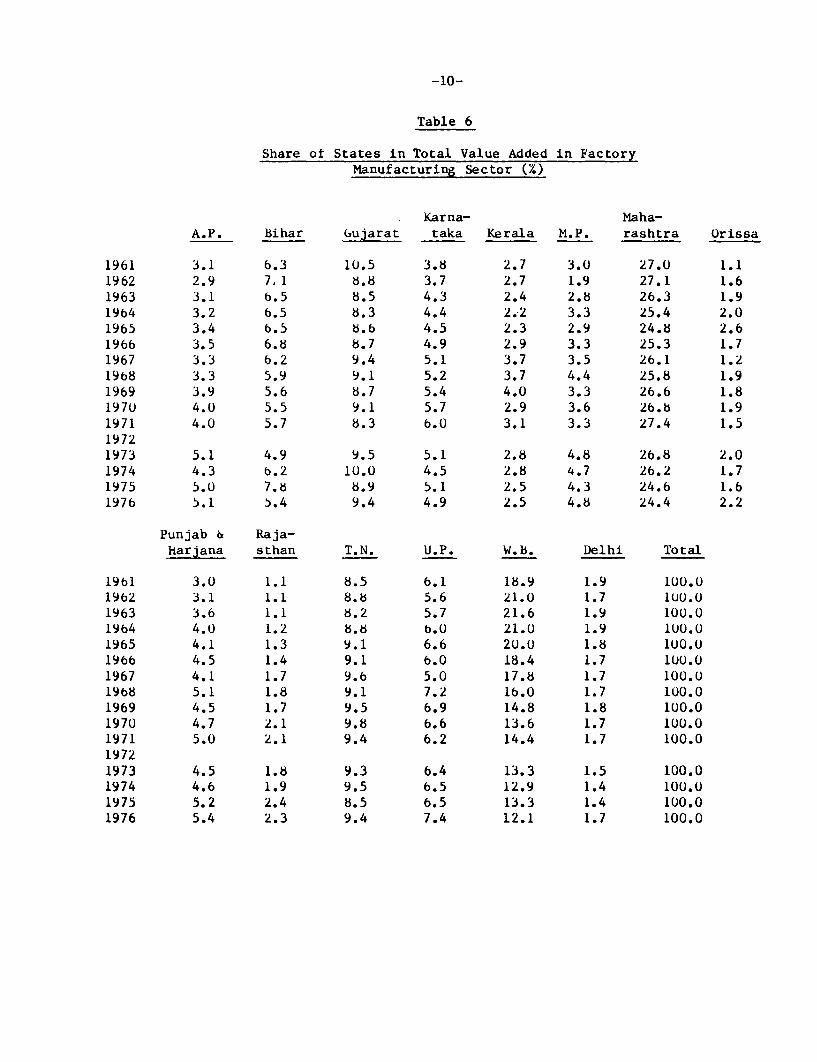
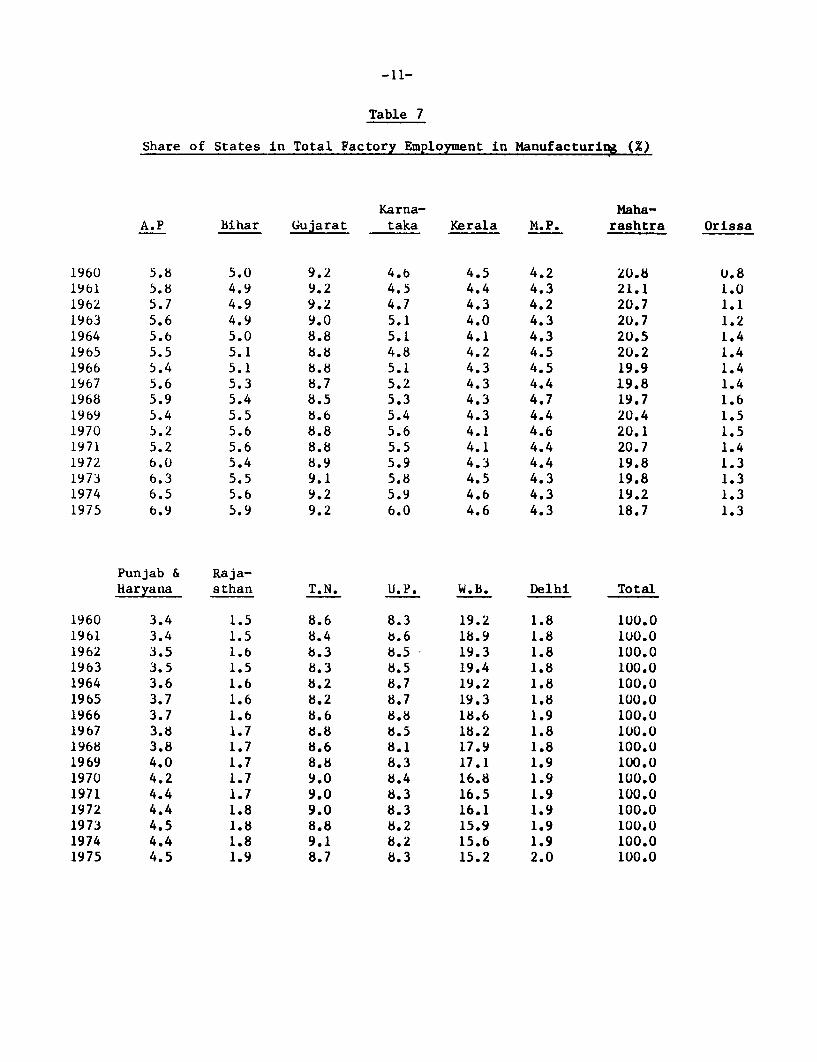
In 1976, Maharashtra, West Bengal, Gujarat, and Tamil Nadu
together accounted for about 557 of value added and 527 of employment in
the manufacturing sector (Tables 6 & 7). The contribution of Maharashtra
alone was about 257 of value added and 197 of employment. However, the
shares of these states hiave been falling since 1961, when they
contributed as much as two-thirds of value added and 587 of employment.
-6-
Table 3
Trend Growth Rates (. Rer annum) in the Manufacturinz Sector
1950-64 1965-75
Value added in the registeredmanufacturing sector (in constantprices) 7.3 3.4
Value added in the unregisteredmanufacturing sector (in constantprices) 5.0 3.9
Value added in manufacturing(in constant prices) 6.3 3.6
Index of manufacturing production 6.7 3.9(1951-64) (1965-78)
NOTE: The growth rates have been estimated from log-linear trendlines. The contant prices are 1960-61 prices for 1950-70and 1970-71 prices for 1970-75. The two have been mergedand the trend growth rate computed with the help of a dummyvariable. Changes in base years in the index ofmanufacturing production have also been accomodated with thehelp of a dummy.
SOURCE: Sekhar (1981), p.6
-7-
Table 4
Value Added in Factory Manufacturing Sector as a Proportion of State NDP (%)
Karna- Maha-A.P. BihaLr Gujarat taka Kerala M.P. Rashtra
1961 3.4 7.1 14.8 5.9 6.7 3.9 19.21962 3.4 8.2 13.5 5.9 7.0 2.8 19.21963 3.5 7.4 13.6 6.7 6.7 3.9 18.81964 3.6 7.5 12.4 6.7 5.9 4.4 18.71965 4.2 7.31 14.1 7.2 6.2 4.9 19.81966 4.0 8.7 13.2 7.1 7.8 5.4 18.71967 3.4 6.4 12.5 7.1 8.5 4.2 17.61968 3.8 6.8 13.9 7.3 8.5 6.0 17.91969 4.9 7.1 13.6 8.5 9.9 4.8 20.21970 5.0 7.7 13.0 9.2 7.3 5.6 21.11971 5.0 8.3 12.7 10.1 8.7 5.0 21.919721973 6.2 6.7 14.3 7.8 7.3 6.9 20.81974 5.6 9.2 20.3 8.1 8.3 7.6 21.41975 7.3 12.2 16.0 10.1 7.6 7.7 20.71976 8.3 9.C0 16.9 10.9 8.0 9.6 21.1
Punjab &Haryana Orissa Rajasthan T.N. U.P. W.B. Delhi India
1961 3.3 2.0 8.7 3.7 15.9 11.6 8.31962 4.0 2.3 9.7 3.6 18.0 10.4 8.61963 4.8 2.6 9.6 3.7 18.1 12.0 8.51964 5.1 2.4 10.5 3.5 18.2 11.8 8.31965 7.2 7.5 2.9 11.4 4.2 18.1 11.5 9.01966 6.3 4.4 2.7 10.7 3.5 16.1 10.7 8.51967 5.0 2.8 2.9 10.9 2.6 14.0 9.6 7.51968 6.7 4.6 4.1 10.9 4.3 13.4 9.8 8.01969 6.1 4.7 3.9 12.2 4.6 13.7 11.0 8.71970 6.6 5.5 4.2 12.8 4.9 13.4 10.0 9.11971 7.1 4.8 4.9 11.6 4.8 13.9 10.0 9.319721973 6.4 5.6 3.7 12.2 4.8 14.1 9.2 9.11974 7.8 6.3 4.9 15.2 5.6 15.6 8.6 10.21975 8.7 5.4 6.3 13.9 6.0 16.4 8.1 10.51976 8.9 6.5 16.3 6.8 16.9 10.8 11.3
-8-
Table 5:
VAM/NDP* For Each State Divided by VAM/NDPFor All-India
Karna MIahaA.P. Bihar Gujarat taka Kerala M.P. Rashtra
1961 0.4 0.9 1.8 0.7 0.8 0.5 2.31962 0.4 1.0 1.6 0.7 0.8 0.3 2.21963 0.4 0.9 1.6 0.8 0.8 0.5 2.21964 0.4 0.9 1.5 0.8 0.7 0.5 2.31965 0.5 0.8 1.6 0.8 0.7 0.5 2.21966 0.5 1.0 1.6 0.8 0.9 0.6 2.21967 0.5 0.9 1.7 0.9 1.1 0.6 2.41968 0.5 0.9 1.8 0.9 1.1 0.8 2.21969 0.6 0.8 1.6 1.0 1.1 0.6 2.31970 0.5 0.9 1.4 1.0 0.8 0.6 2.31971 0.5 0.9 1.4 1.1 0.9 0.5 2.419721973 0.7 0.7 1.6 0.9 0.8 0.8 2.31974 0.6 0.9 2.0 0.8 0.8 0.7 2.11975 0.7 1.2 1.5 1.0 0.7 0.7 2.01976 0.7 0.8 1.5 1.0 0.7 0.8 1.9
Punjab & Raja-Haryana Orissa sthan T.N. U.P. W.B. Delhi
1961 0.4 0.2 1.0 0.4 1.9 1.41962 0.5 0.3 1.1 0.4 2.1 1.21963 0.6 0.3 1.1 0.4 2.1 1.41964 0.6 0.3 1.3 0.4 2.2 1.41965 0.8 0.8 0.3 1.3 0.5 2.0 1.31966 0.7 0.5 0.3 1.3 0.4 1.9 1.31967 0.7 0.4 0.4 1.5 0.4 1.9 1.31968 0.8 0.6 0.5 1.4 0.5 1.7 1.21969 0.7 0.5 0.4 1.4 0.5 1.6 1.31970 0.1 0.6 0.5 1.4 0.5 1.5 1.11971 0.8 0.5 0.5 1.3 0.5 1.5 1.119721973 0.7 0.6 0.4 1.3 0.5 1.6 1.01974 0.8 0.6 0.5 1.5 0.6 1.5 0.81975 0.8 0.5 0.6 1.3 0.6 1.6 0.81976 0.8 0.6 1.4 0.6 1.5 1.0
* Value Added in Factory Manufacturing Sector as a Proportion of NDP.
-9-
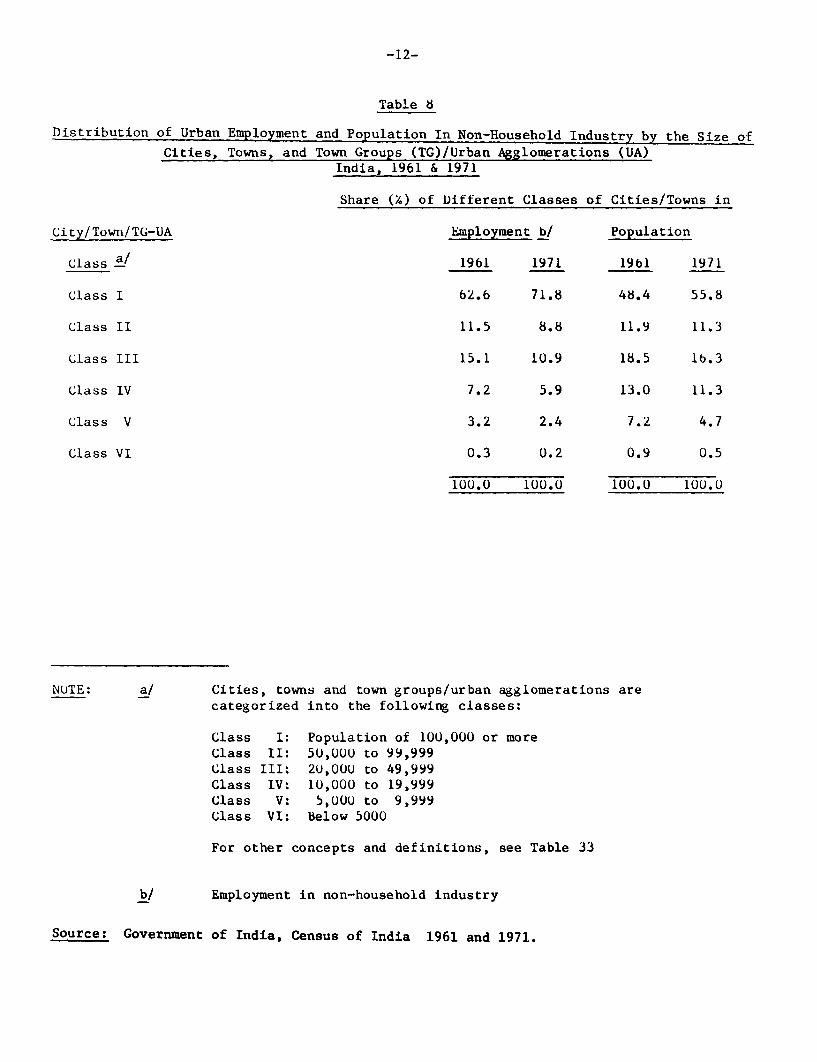
The distribution of industrial employment (in household and
non-household industry) among different classes of cities and towns in
1961 and 1971 is presented in Table 8. Factory industry is heavily
concentrated in cities with population exceeding 100,000 - cities which in
1971 employed over 70'S of factory workers.
We shall ana:lyze trends in industrial location in greater depth
later in this paper. Here, we have merely tried to present the marked
inter- and intrastate differences in industrialization which are the
motivating forces behind the design and implementation of locational
policies, to which we now turn our attention.
-10-
Table 6
Share of States in Total Value Added in FactoryManufacturing Sector (7.)
Karna- Maha-A.P. Bihar Gujarat taka Kerala M.P. rashtra Orissa
1961 3.1 6.3 10.5 3.8 2.7 3.0 27.0 1.11962 2.9 7, 8.8 3.7 2.7 1.9 27.1 1.61963 3.1 6.5 8.5 4.3 2.4 2.8 26.3 1.91964 3.2 6.5 8.3 4.4 2.2 3.3 25.4 2.01965 3.4 6.5 8.6 4.5 2.3 2.9 24.8 2.61966 3.5 6.8 8.7 4.9 2.9 3.3 25.3 1.71967 3.3 6.2 9.4 5.1 3.7 3.5 26.1 1.21968 3.3 5.9 9.1 5.2 3.7 4.4 25.8 1.91969 3.9 5.6 8.7 5.4 4.0 3.3 26.6 1.81970 4.0 5.5 9.1 5.7 2.9 3.6 26.b 1.91971 4.0 5.7 8.3 6.0 3.1 3.3 27.4 1.519721973 5.1 4.9 9.5 5.1 2.8 4.8 26.8 2.01974 4.3 b.2 10.0 4.5 2.8 4.7 26.2 1.71975 5.0 7.8 8.9 5.1 2.5 4.3 24.6 1.61976 5.1 5.4 9.4 4.9 2.5 4.8 24.4 2.2
Punjab & Raja-harjana sthan T.N. U.P. W.B. Delhi Total
1961 3.0 1.1 8.5 6.1 18.9 1.9 100.01962 3.1 1.1 8.8 5.6 21.0 1.7 100.01963 3.6 1.1 8.2 5.7 21.6 1.9 100.01964 4.0 1.2 8.8 b.0 21.0 1.9 100.01965 4.1 1.3 9.1 6.6 20.0 1.8 100.01966 4.5 1.4 9.1 6.0 18.4 1.7 100.01967 4.1 1.7 9.6 5.0 17.8 1.7 100.01968 5.1 1.8 9.1 7.2 16.0 1.7 100.01969 4.5 1.7 9.5 6.9 14.8 1.8 100.01970 4.7 2.1 9.8 6.6 13.6 1.7 100.01971 5.0 2.1 9.4 6.2 14.4 1.7 100.019721973 4.5 1.8 9.3 6.4 13.3 1.5 100.01974 4.6 1.9 9.5 6.5 12.9 1.4 100.01975 5.2 2.4 8.5 6.5 13.3 1.4 100.01976 5.4 2.3 9.4 7.4 12.1 1.7 100.0
-11-
Table 7
Share of States in Total Factory Employment in Manufacturing (X)
Karna- Maha-A.P Bihar Gujarat taka Kerala M.P. rashtra Orissa
1960 5.8 5.0 9.2 4.6 4.5 4.2 20.8 0.81961 5.8 4.9 9.2 4.5 4.4 4.3 21.1 1.01962 5.7 4.9 9.2 4.7 4.3 4.2 20.7 1.11963 5.6 4.9 9.0 5.1 4.0 4.3 20.7 1.21964 5.6 5.0 8.8 5.1 4.1 4.3 20.5 1.41965 5.5 5.1 8.8 4.8 4.2 4.5 20.2 1.41966 5.4 5.1 8.8 5.1 4.3 4.5 19.9 1.41967 5.6 5.3 8.7 5.2 4.3 4.4 19.8 1.41968 5.9 5.4 8.5 5.3 4.3 4.7 19.7 1.61969 5.4 5.5 8.6 5.4 4.3 4.4 20.4 1.51970 5.2 5.6 8.8 5.6 4.1 4.6 20.1 1.51971 5.2 5.6 8.8 5.5 4.1 4.4 20.7 1.41972 6.0 5.4 8.9 5.9 4.3 4.4 19.8 1.31973 6.3 5.5 9.1 5.8 4.5 4.3 19.8 1.31974 6.5 5.6 9.2 5.9 4.6 4.3 19.2 1.31975 6.9 5.9 9.2 6.0 4.6 4.3 18.7 1.3
Punjab & Raja-Haryana sthan T.N. U.P. W.B. Delhi Total
1960 3.4 1.5 8.6 8.3 19.2 1.8 100.01961 3.4 1.5 8.4 b.6 18.9 1.8 1U0.O1962 3.5 1.b 8.3 8.5 19.3 1.8 100.01963 3.5 1.5 8.3 8.5 19.4 1.8 100.01964 3.6 1.6 8.2 8.7 19.2 1.8 100.01965 3.7 1.6 8.2 8.7 19.3 1.8 100.01966 3.7 1.6 8.6 8.8 18.6 1.9 100.01967 3.8 1.7 8.8 8.5 18.2 1.8 100.01968 3.8 1.7 8.6 8.1 17.9 1.8 100.01969 4.0 1.7 8.8 8.3 17.1 1.9 100.01970 4.2 1.7 9.0 8.4 16.8 1.9 100.01971 4.4 1.7 9.0 8.3 16.5 1.9 100.01972 4.4 1.8 9.0 8.3 16.1 1.9 100.01973 4.5 1.8 8.8 8.2 15.9 1.9 100.01974 4.4 1.8 9.1 8.2 15.6 1.9 100.01975 4.5 1.9 8.7 8.3 15.2 2.0 100.0
-12-
Table 8
Distribution of Urban Employment and Population In Non-Household Industry by the Size of
Cities, Towns, and Town Groups (TG)/Urban Agglomerations (UA)India, 1961 & 1971
Share (.) of Different Classes of Cities/Towns in
City/Town/TG-UA Employment b/ Population
Class a/ 1961 1971 1961 1971
Class I 62.6 71.8 48.4 55.8
Class II 11.5 8.8 11.9 11.3
Class III 15.1 10.9 18.5 16.3
Class IV 7.2 5.9 13.0 11.3
Class V 3.2 2.4 7.2 4.7
Class VI 0.3 0.2 0.9 0.5
100.0 100.0 100.0 100.0
NuTE: a/ Cities, towns and town groups/urban agglomerations arecategorized into the following classes:
Class I: Population of 100,000 or moreClass II: 50,0UU to 99,999Class III: 2U,000 to 49,999Class IV: 10,000 to 19,999Class V: 5,000 to 9,999Class VI: Below 5000
For other concepts and definitions, see Table 33
b/ Employment in non-household industry
Source: Government of India, Census of India 1961 and 1971.
-13-
Chapter II
INDUSTRIAL LOCATION POLICIES IN INDIA
Before examining the content of the industrial location policies,
we shall aLtempt to throw some light on the factors that influenced the
policy-makers in adopting these measures. Unfortunately, these factors
are not clearly formulated in any of the policy documents, for example,
the five-year plans. The justifications for state intervention in
industrial location are couched in efficiency and equity terms, but there
is no precise idea about the trade-offs involved (wherever these exist).
This probably reflects, to a significant extent, a major weakness of the
theoretical development literature and its failure to develop an empirical
methodology to assess the most "desirable" spatial distribution of
industry.
However, a clear difference in motivation can be perceived
between policies influencing inter and intra regional distribution of
industry. In India, It is individual states that form the basis of
regionalization by the decision makers, though sometimes the
North-South-East-West divisions are also utilized. The original
demarcation of the states was on a linguistic basis, with a corresponding
cultural and ethnic homogeneity. Thus, strong sociological bonds tie the
inhabitants of each state together, and create effective demands for
receiving "just" shares of the national pie. The Indian Republic attained
independence only about three decades back, so that these demands can be
backed by arguments about unequal treatment during the colonial period.
The setting-up of infrastructure and transportation networks during
British rule was determined largely by political exigencies and the
colony-metropolis tracle relationship. This obviously meant that, at the
-14-
time of independence, the regions started with different infrastructural
endowments - a problem with which the new government had to come to
terms. Apart from these historical reasons, physical endowments and
various socio-economic factors are responsible for the diverging
performances of different regions. However, even in instances where these
factors dominate, it is politically infeasible to let these differences in
growth exceed certain limits in keeping with the character of the federal
polity. All these political and equity considerations have led the Indian
government to attempt to implement policies to promote a more balanced
inter-state distribution of industry.
Policies targeted at affecting intra-regional industrial location
have been motivated both by efficiency and welfare arguments. Efficiency
justifications have focused on the inoptimal distribution of
infrastructure and imperfectly functioning markets that have led to the
concentration of industry in certain metropolitan regions to the neglect
of smaller towns and backward areas. It is argued that the latter possess
industrial potential but have not developed because of insufficient
infrastructural investment, high risk aversion on the part of
entrepreneurs in the face of uncertainty, and imperfectly functioning
capital markets. Proponents of these policies also point out that
agglomeration economies and economies of scale have been exhausted in
certain cities, and their continued expansion implies inefficient resource
allocation. However, apart from these efficiency issues, equity factors
are also seen as extremely important justifications of policies such as
those encouraging the village and handicrafts industries that have
traditionally formed an important component of rural economic life. These
industries utilize highly labor-intensive techniques which may be able to
-15-
absorb some part of the under-employment that characterizes Indian
agriculture. It is felt that encouragement of modern small-scale
enterprises, which tencl to be concentrated in the metropolitan areas, will
promote a moro equitable distribution of income by increasing the returns
to small entrepreneurs.
All these efficiency and equity issues and their implications for
industrial location and policy will be explored at length in Chapter 4
where we draw lessons from the Indian experience with industrial location
policies. First, however, we look at those designed to promote a more
balanced inter-state distribution of industry.
1. Policies Influencing Inter-State Distribution of Industry
Chronologically arranged in order of their implementation, these
policies have been of the following kinds:
(i) Industrial licensing;
(ii) Location oDf Public Sector Plants;
(iii) Distribution and pricing policies for intermediate industrial
inputs; and
(iv) State Government incentives.
(i) Industrial Licensing
The basic attitude of the Government of India towards the
direction and character of industrial development is still epitomized by
the "Industrial Policy Rtesolution" (IPR) that was adopted in 1956. 1/ One
of the important objectives of industrial policy listed in the IPR is
1/ This replaced an earlier resolution formulated soon after independence.
-16-
balanced regional development.l/ The mechanism of implementing industrial
policy was the Industries (Development and Regulation) Act of 1951. This
Act provided the legislative framework for the licensing and regulation of
industrial investment. A licence from the Central Government was required
for the establishment of a 'new' industrial undertaking or for
'subsLantial expansion' of existing units. 2/
There is heuristic evidence that the state governments have tried
to influence the licensing authorities in order to attract industry. The
testimony of officials to the Estimates Committee (1967-68) illustrates
this:
"It has been sLated by the official representative of the
Ministry that 'Quite a number of states keep on representing that
their areas have not received adequate share of licenses' we have
no compulsive means of attracting people to particular areas. We
consider the applications as we receive them and provided the
location in a particular area is not too uneconomic, other things
being reasonably equal, we do give preference to the more
underdeveloped areas." 3/
1/ Other, perhaps more important, objectives are: rapid industrializationin conformity with plan priorities and targets, development of basicand capital goods industries, expansion of the public and co-operativesector, protection and encouragement of the small scale sector and thecurbing of monopoly in industry.
2/ The precise rules relating to the licensing system have varied overtime. It must also be noted that additional licenses were requiredfor imports of equipment. Furthermore, there are a number of otherGovernment controls, e.g. price and distribution controls. Freshinvestment involving the large business houses or foreigncollaboration were subjected to further scrutiny by special statutorycommittees.
3/ However, the correlation coefficient with per capita income is only0.07.
-17-
The Industrial Licensing Policy Inquiry Committee Report (1967)
also reported that "there have been cases where, because of persistent
pressure by the state authorities concerned, licenses have been granted
for location within those states. Our case studies show that there were
certain states which followed up applications for location in their
territories very systematically and persistently and these states were
often able to ensure that applicants for licenses within their territory
succeeded." (p. 113)
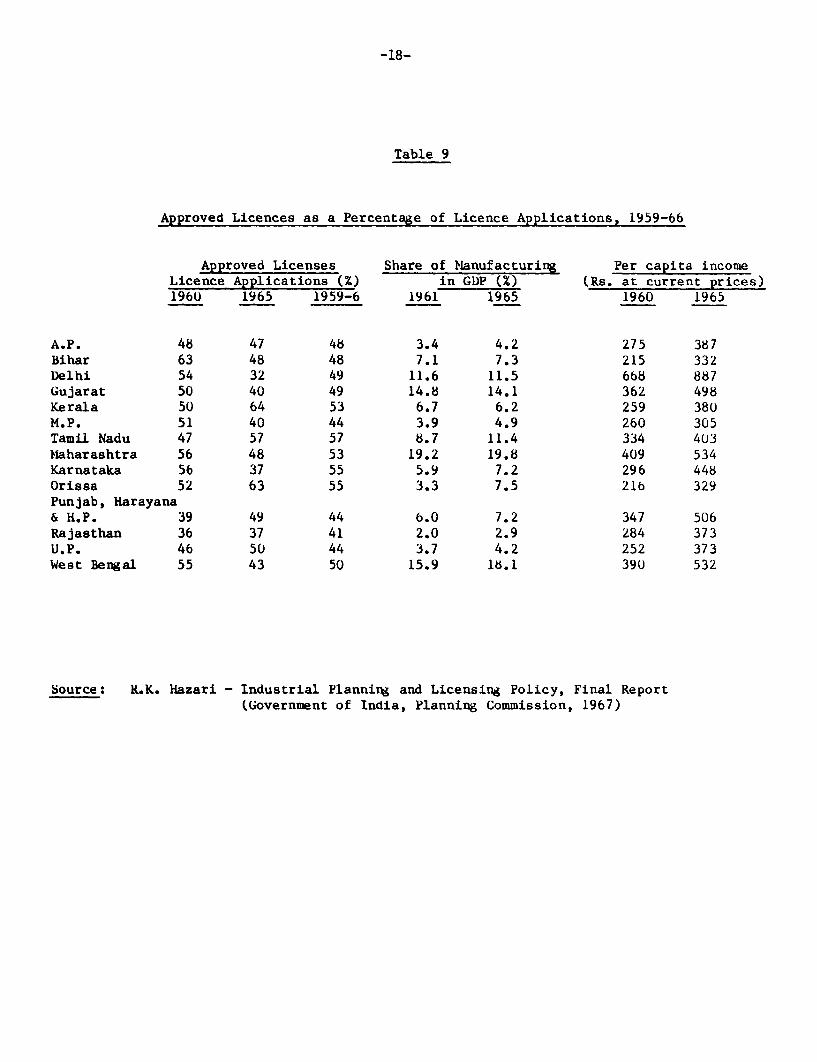
However, the actual weightage assigned to regional location by
the licensing authorities is a moot point. The Hazari report, which
examined industrial planning and licensing policy, contains information
relating to state-wise licensing applications and approvals for the-period
1959-66. This is presented in Table 9. In order to assess the importance
of the "balanced regional development" objective, we correlated these
approval ratios with an index of state industrial development, i.e., the
share of industry in GDI?. The correlation coefficient turned out to be
0.40. 1/ Now, this result cannot be interpreted from a purely regional
perspective. This is because the approval ratio Is a function of many
other variables, like the techno-economic character of license
applications, and the other industrial policy objectives including the
relationship with plan piriorities, encouragement of the public and
small-scale sector, and the curbing of monopoly. Despite these
qualifications, the positive correlation does Indicate that the "balanced
regional development" objective has not prevented the more advanced
industrial states from faring better in the licensing decision process.
1/ However, the correlation coefficient with per capita Income is only0.07
-18-
Table 9
Approved Licences as a Percentage of Licence Applications, 1959-66
Approved Licenses Share of MIanufacturing Per capita incomeLicence Applications (X) in GDP (%) (Rs. at current prices)1960 1965 1959-6 1961 1965 1960 1965
A.P. 48 47 48 3.4 4.2 275 387Bihar 63 48 48 7.1 7.3 215 332Delhi 54 32 49 11.6 11.5 6W8 887Gujarat 50 40 49 14.8 14.1 362 498Kerala 50 64 53 6.7 6.2 259 380M.P. 51 40 44 3.9 4.9 260 305Tamil Nadu 47 57 57 8.7 11.4 334 403Miaharashtra 56 48 53 19.2 19.8 409 534Karnataka 56 37 55 5.9 7.2 296 448Orissa 52 63 55 3.3 7.5 21b 329Punjab, Harayana& H.P. 39 49 44 6.0 7.2 347 506Rajasthan 36 37 41 2.0 2.9 284 373U.P. 46 50 44 3.7 4.2 252 373West Bengal 55 43 50 15.9 1i.1 390 532
Source: L.K. liazari - Industrial Planning and Licensing Policy, Final Report(Government of India, Planning Commission, 1967)
-19-
An important contributory factor - apart from techno-economic superiority
of the applications from the advanced states - could be that the big and
more established producers in these states had the resources to
successfully lobby for allocation of licenses. For example, it was
financially less burdensome for them to maintain liaison offices at New
Delhi for this purpose.
This general conclusion pertains to the period 1959-66 as a
whole. The period is too small to permit trend analysis. Nevertheless,
it is interesting to compute the relationship between license approvals
and state development separately for 1960 and 1965 and compare the two
years. The results are presented in Table 10. The picture for 1960 is
essentially the same as that for the period 1959-66 as a whole, the
license approval ratio having a significant positive correlation with the
level of state industrial development while being almost unrelated to
state per capita incomes. However, for 1965, there is a dramatic switch -
the approval ratio displays a significant negative correlation with state
industrial development, while continuing to show little relationship with
per capita income. Thisi may be indicative of an increased importance
assigned to the objective of allocating licenses on an equitable basis to
the states.

-20-
Table 10
Correlation Coefficients between State-Wise Proportionsof Licenses Approved and Indices of State Development
Correlation of state-wise "approvedlicenses as a proportion of licenseapplications" with
1960 1965 1959-66 3/
Value added in manufacturingGDP for States 0.44 -0.09 0.40
State per capita income 2/ -0.10 -0.50 0.07
Notes
1/ Certain small states and union territories havebeen left out for lack of data.
2/ In current prices.
3/ The indices of state development used in computingthe coefficients are the averages of 1960 and 1965.
-21-
However, it would be premature to reach a definitive conclusion until it
is possible to extend our licensing data beyond 1966.
In our discusslon of industrial licensing, we have focused only
on inter-state allocation of licenses. In 1971, another regional
dimension was added to the licensing criteria by the decision to prohibit
the setting up of licensable industries within certain geographical limits
of large metropolitan cities with a population exceeding one million, and
urban agglomerations with a population greater than 0.5 million as per the
1971 census. 1/ In 1980, it was decided that undertakings in a large
number of industries could increase their capacity by 257 over a five year
period without having tco apply for a licence. Moreover, undertakings in
certain industries "of importance to the national economy" and "engaged in
the production of articles of mass consumption" which had installed
capacities in excess of licensed capacity were permitted to regularize
these. Both these types of liberalizations were available even to
undertakings located in the metropolitan areas mentioned earlier which had
been barred from expanding under the 1977 policy. Moreover, this
locational policy was also relaxed in certain other cases including those
units exporting 1007 of their output.
1/ Earlier, in 1973, it had been decided that units normally exempt fromthe licensing requir,ement (for example, the small scale sector) wouldhave to apply for a license if they were located in these areas.
-22-
(ii) Location of Public Sector Plants
Soon after independence, in 1954, the ruling Congress party
adopted the resolution of "constructing a socialistic pattern of society"
in India. Since then, the industrial policy statements of the Indian
government have given considerable priority to the development of the
public sector. In 1972, public sector units contributed to 127. of total
value added in the manufacturing sector. The Indian goverment has
explicitly sought to restrict the production of many types of basic and
capital goods to the public sector. Therefore, the public sector is the
major supplier of items like iron and steel, heavy electricals, petroleum
products, shipping and railway equipment. V/
Direct public investment in manufacturing commenced on a large
scale during the Second Fivo-year plan (1951-61). Regional considerations
have always been quite important in the location of these units. For
example, the Third Five-year plan (1961-66) stated that "in the location
of public sector projects, the claims of relatively backward areas have
been kept in view wherever this could be done without giving up essential
technical and economic criteria. The location of several important
projects like the steel plants have been determined on the basis of expert
study and on economic considerations. But as they are situated in areas
which were hitherto industrially backward, the latter will benefit." (3rd
Five-year plan, p. 145)
1/ For example, in the early '70s, the share of the public sector wasover 90% of output of saleable pig iron, heavy electrical equipmentlike synchronous condensers, steam and hydro turbines, generators andalternators, ships and locomotive boilers.
-23-
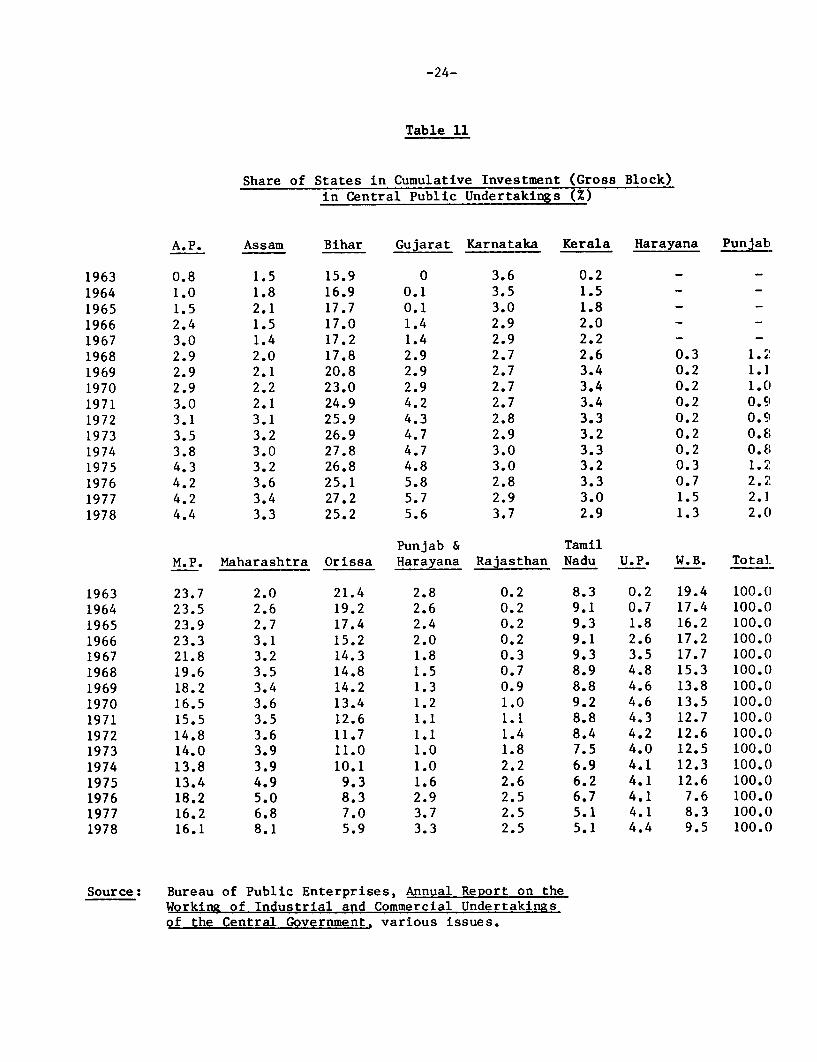
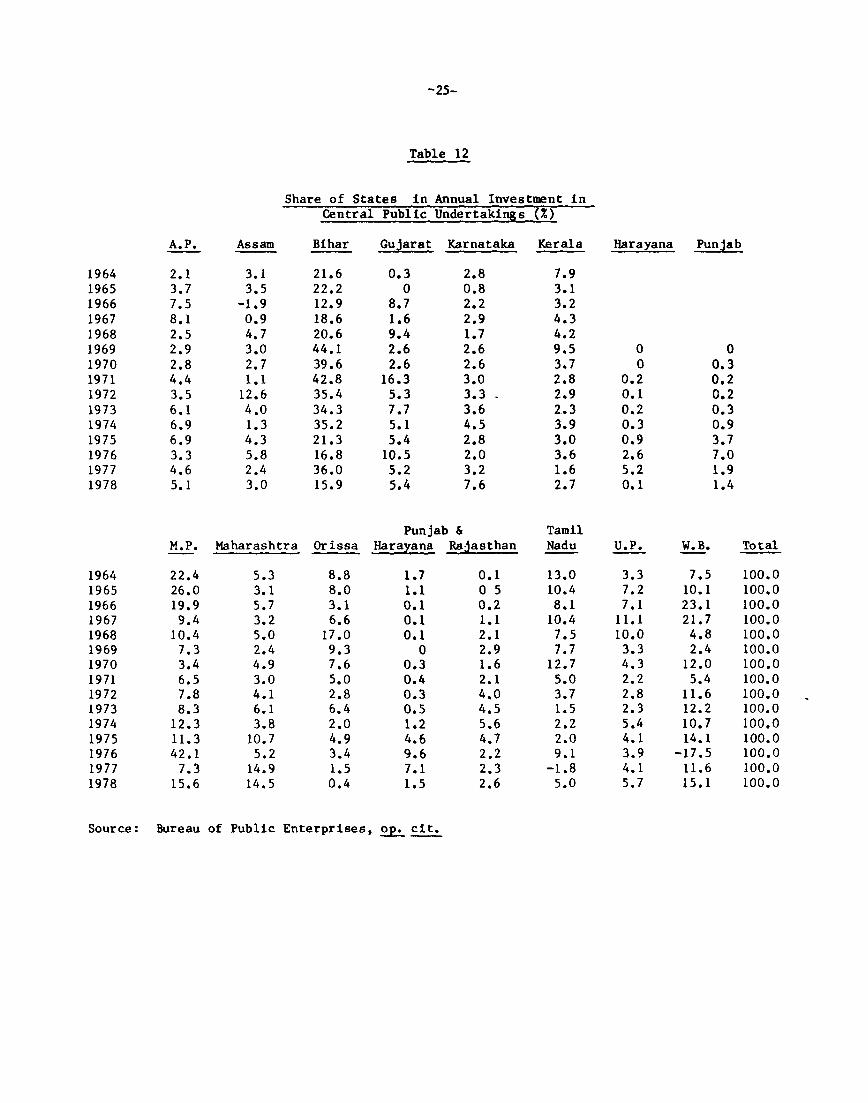
The shares of the states in cumulative and annual investment in
central public undertakings during 1963-78 are exhibited in Tables 11 and
12. In 1963, about 80* of this investment was concentrated in the four
states of Bihar, Nadhya Pradesh, Orissa and West Bengal. Since 1963, many
important public undertakings have come up in the other states, so that
the distribution across states has become somewhat more balanced. By
1978, the share of thet four states (just mentioned) in cumulative
investment had come down to 57*. We attempted an empirical test of the
importance of regional considerations in the location of public sector
units. Just as in evaluating industrial licensing, this was done by
correlating Investment in Central Government public sector undertakings
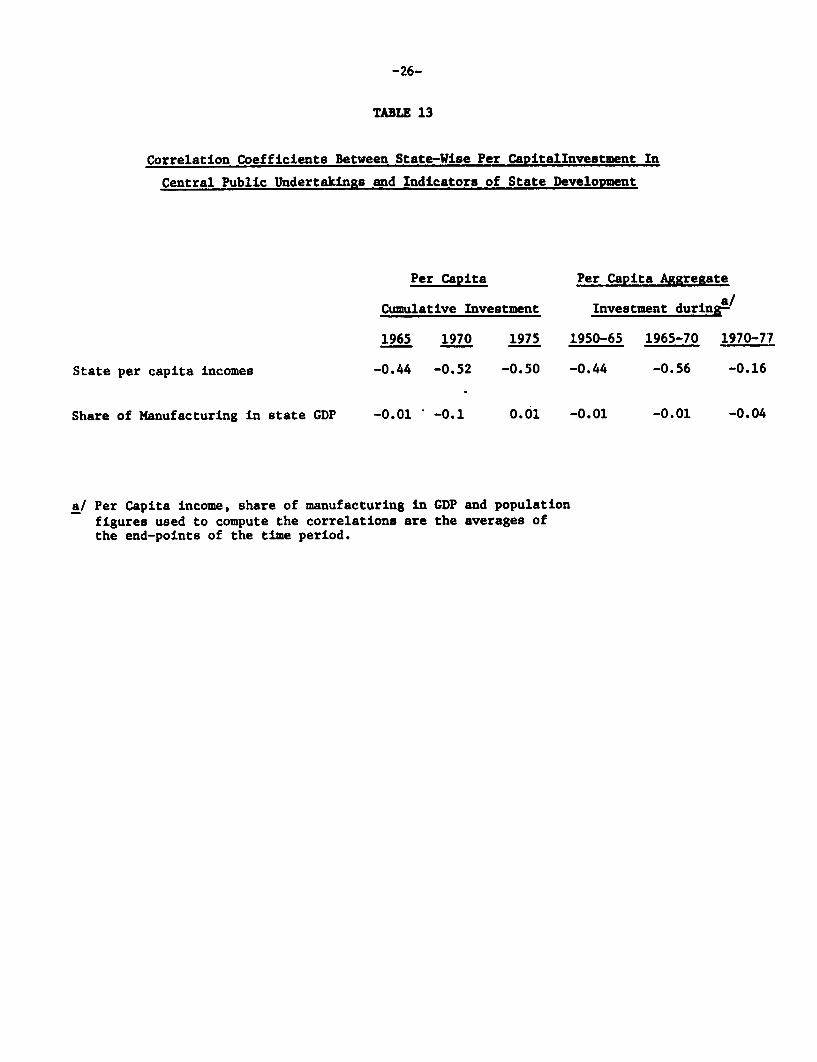
per capita for each state with indices of state backwardness like per
capita income and the share of manufacturing in state income. The results
are presented in Table 13.
It appears that before 1970, states with low per capita incomes
have been favored in their share of public sector projects. However, as
the just-cited quote from the Third Plan suggests, this result may be
explained by the plentiful supply of appropriate raw materials in the
backward states rather than explicit locational considerations. To
illustrate this, consider the composition of the public sector in the
major low-income states favored before 1970 - Bihar, Madhya Pradesh and
Orissa. One finds that in 1969, steel plants accounted for one-third of
cumulative investment in Bihar, two-thirds in Madhya Pradesh and 90% in
Orissa.
-24-
Table 11
Share of States in Cumulative Investment (Gross Block)in Central Public Undertakings (%)
A.P. Assam Bihar Gujarat Karnataka Kerala Harayana Punjab
1963 0.8 1.5 15.9 0 3.6 0.2 - -
1964 1.0 1.8 16.9 0.1 3.5 1.5 - -
1965 1.5 2.1 17.7 0.1 3.0 1.8 - -1966 2.4 1.5 17.0 1.4 2.9 2.0 - -1967 3.0 1.4 17.2 1.4 2.9 2.2 - -1968 2.9 2.0 17.8 2.9 2.7 2.6 0.3 1.21969 2.9 2.1 20.8 2.9 2.7 3.4 0.2 1.1
1970 2.9 2.2 23.0 2.9 2.7 3.4 0.2 1.0
1971 3.0 2.1 24.9 4.2 2.7 3.4 0.2 0.9
1972 3.1 3.1 25.9 4.3 2.8 3.3 0.2 0.9
1973 3.5 3.2 26.9 4.7 2.9 3.2 0.2 0.8
1974 3.8 3.0 27.8 4.7 3.0 3.3 0.2 0.81975 4.3 3.2 26.8 4.8 3.0 3.2 0.3 1.2
1976 4.2 3.6 25.1 5.8 2.8 3.3 0.7 2.2
1977 4.2 3.4 27.2 5.7 2.9 3.0 1.5 2.1
1978 4.4 3.3 25.2 5.6 3.7 2.9 1.3 2.0
Punjab & TamilM.P. Maharashtra Orissa Harayana Rajasthan Nadu U.P. W.B. Total
1963 23.7 2.0 21.4 2.8 0.2 8.3 0.2 19.4 100.0
1964 23.5 2.6 19.2 2.6 0.2 9.1 0.7 17.4 100.0
1965 23.9 2.7 17.4 2.4 0.2 9.3 1.8 16.2 100.0
1966 23.3 3.1 15.2 2.0 0.2 9.1 2.6 17.2 100.01967 21.8 3.2 14.3 1.8 0.3 9.3 3.5 17.7 100.0
1968 19.6 3.5 14.8 1.5 0.7 8.9 4.8 15.3 100.0
1969 18.2 3.4 14.2 1.3 0.9 8.8 4.6 13.8 100.0
1970 16.5 3.6 13.4 1.2 1.0 9.2 4.6 13.5 100.0
1971 15.5 3.5 12.6 1.1 1.1 8.8 4.3 12.7 100.0
1972 14.8 3.6 11.7 1.1 1.4 8.4 4.2 12.6 100.()1973 14.0 3.9 11.0 1.0 1.8 7.5 4.0 12.5 100.0
1974 13.8 3.9 10.1 1.0 2.2 6.9 4.1 12.3 100.0
1975 13.4 4.9 9.3 1.6 2.6 6.2 4.1 12.6 100.01976 18.2 5.0 8.3 2.9 2.5 6.7 4.1 7.6 100.01977 16.2 6.8 7.0 3.7 2.5 5.1 4.1 8.3 100.01978 16.1 8.1 5.9 3.3 2.5 5.1 4.4 9.5 100.0
Source: Bureau of Public Enterprises, Annual Report on theWorkinz of Industrial and Commercial Undertakingsof the Central Government- various issues.
-25-
Table 12
Share of States in Annual Investment inCentral Public Undertakings (%)
A.P. Assam Bihar Gujarat Karnataka Kerala Harayana Punjab
1964 2.1 3.1 21.6 0.3 2.8 7.91965 3.7 3.5 22.2 0 0.8 3.11966 7.5 -1.9 12.9 8.7 2.2 3.21967 8.1 0.9 18.6 1.6 2.9 4.31968 2.5 4.7 20.6 9.4 1.7 4.21969 2.9 3.0 44.1 2.6 2.6 9.5 0 01970 2.8 2.7 39.6 2.6 2.6 3.7 0 0.31971 4.4 1.1 42.8 16.3 3.0 2.8 0.2 0.21972 3.5 12.6 35.4 5.3 3.3 2.9 0.1 0.21973 6.1 4.0 34.3 7.7 3.6 2.3 0.2 0.31974 6.9 1.3 35.2 5.1 4.5 3.9 0.3 0.91975 6.9 4.3 21.3 5.4 2.8 3.0 0.9 3.71976 3.3 5.8 16.8 10.5 2.0 3.6 2.6 7.01977 4.6 2.4 36.0 5.2 3.2 1.6 5.2 1.91978 5.1 3.0 15.9 5.4 7.6 2.7 0.1 1.4
Punjab & TamilM.P. Maharashtra Orissa Harayana Rajasthan Nadu U.P. W.B. Total
1964 22.4 5.3 8.8 1.7 0.1 13.0 3.3 7.5 100.01965 26.0 3.1 8.0 1.1 0 5 10.4 7.2 10.1 100.01966 19.9 5.7 3.1 0.1 0.2 8.1 7.1 23.1 100.01967 9.4 3.2 6.6 0.1 1.1 10.4 11.1 21.7 100.01968 10.4 5.0 17.0 0.1 2.1 7.5 10.0 4.8 100.01969 7.3 2.4 9.3 0 2.9 7.7 3.3 2.4 100.01970 3.4 4.9 7.6 0.3 1.6 12.7 4.3 12.0 100.01971 6.5 3.0 5.0 0.4 2.1 5.0 2.2 5.4 100.01972 7.8 4.1 2.8 0.3 4.0 3.7 2.8 11.6 100.01973 8.3 6.1 6.4 0.5 4.5 1.5 2.3 12.2 100.01974 12.3 3.8 2.0 1.2 5.6 2.2 5.4 10.7 100.01975 11.3 10.7 4.9 4.6 4.7 2.0 4.1 14.1 100.01976 42.1 5.2 3.4 9.6 2.2 9.1 3.9 -17.5 100.01977 7.3 14.9 1.5 7.1 2.3 -1.8 4.1 11.6 100.01978 15.6 14.5 0.4 1.5 2.6 5.0 5.7 15.1 100.0
Source: Bureau of Public Enterprises, op. cit.
-26-
TABLE 13
Correlation Coefficients Between State-Wise Per CapitalInvestment In
Central Public Undertakinms and Indicators of State Development
Per Capita Per Capita Aggregate
Cumulative Investment Investment durinR
1965 1970 1975 1950-65 1965-70 1970-77
State per capita incomes -0.44 -0.52 -0.50 -0.44 -0.56 -0.16
Share of Manufacturing in state GDP -0.01 * -0.1 0.01 -0.01 -0.01 -0.04
a/ Per Capita income, share of manufacturing in GDP and populationfigures used to compute the correlations are the averages ofthe end-points of the time period.
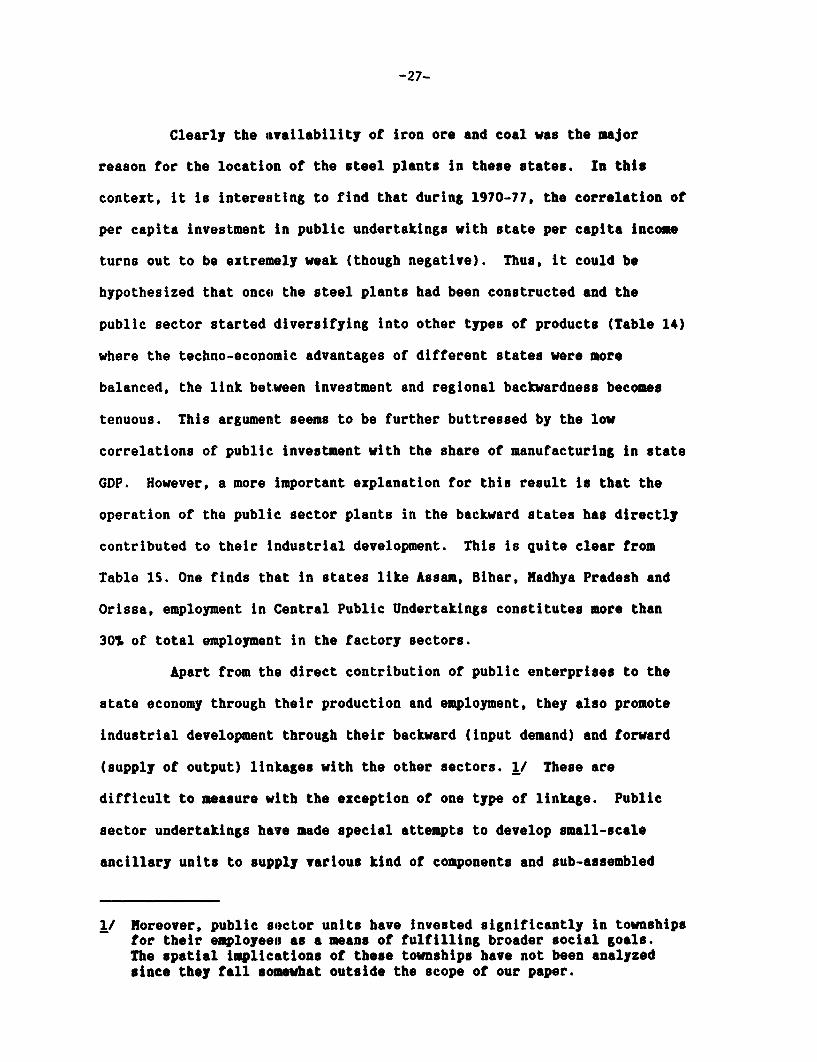
-27-
Clearly the availability of iron ore and coal was the major
reason for the location of the steel plants in these states. In this
context, it is interesting to find that during 1970-77, the correlation of
per capita investment in public undertakings with state per capita income
turns out to be extremely weak (though negative). Thus, it could be
hypothesized that once the steel plants had been constructed and the
public sector started diversifying into other types of products (Table 14)
where the techno-economic advantages of different states were more
balanced, the link between investment and regional backwardness becomes
tenuous. This argument seems to be further buttressed by the low
correlations of public investment with the share of manufacturing in state
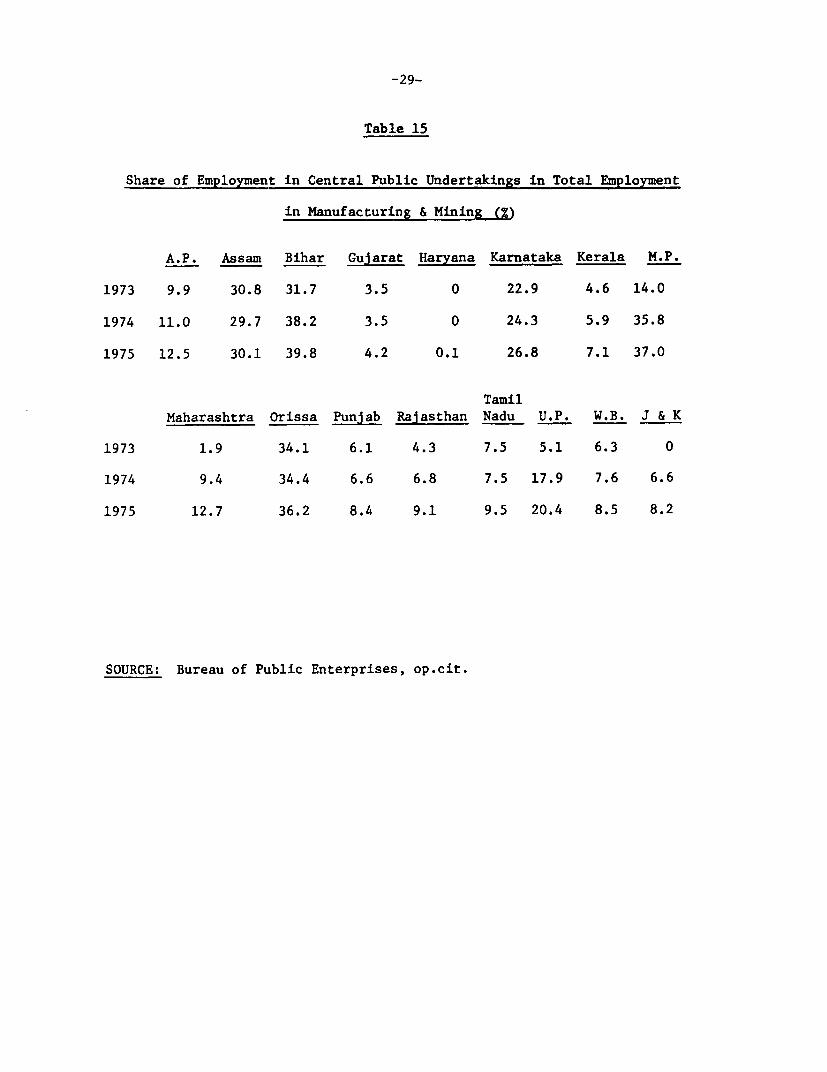
GDP. However, a more important explanation for this result is that the
operation of the public sector plants in the backward states has directly
contributed to their industrial development. This is quite clear from
Table 15. One finds that in states like Assam, Bihar, Madhya Pradesh and
Orissa, employment in Central Public Undertakings constitutes more than
307 of total employment in the factory sectors.
Apart from the direct contribution of public enterprises to the
state economy through their production and employment, they also promote
industrial development through their backward (input demand) and forward
(supply of output) linkages with the other sectors. 1/ These are
difficult to measure with the exception of one type of linkage. Public
sector undertakings have made special attempts to develop small-scale
ancillary units to suplply various kind of components and sub-assembled
1/ Moreover, public sector units have invested significantly in townshipsfor their employeeis as a means of fulfilling broader social goals.The spatial implications of these townships have not been analyzedsince they fall somewhat outside the scope of our paper.
-28-
Table 14
Distribution of Cumulative Public Sector Investment (7)
1965 1970 1977
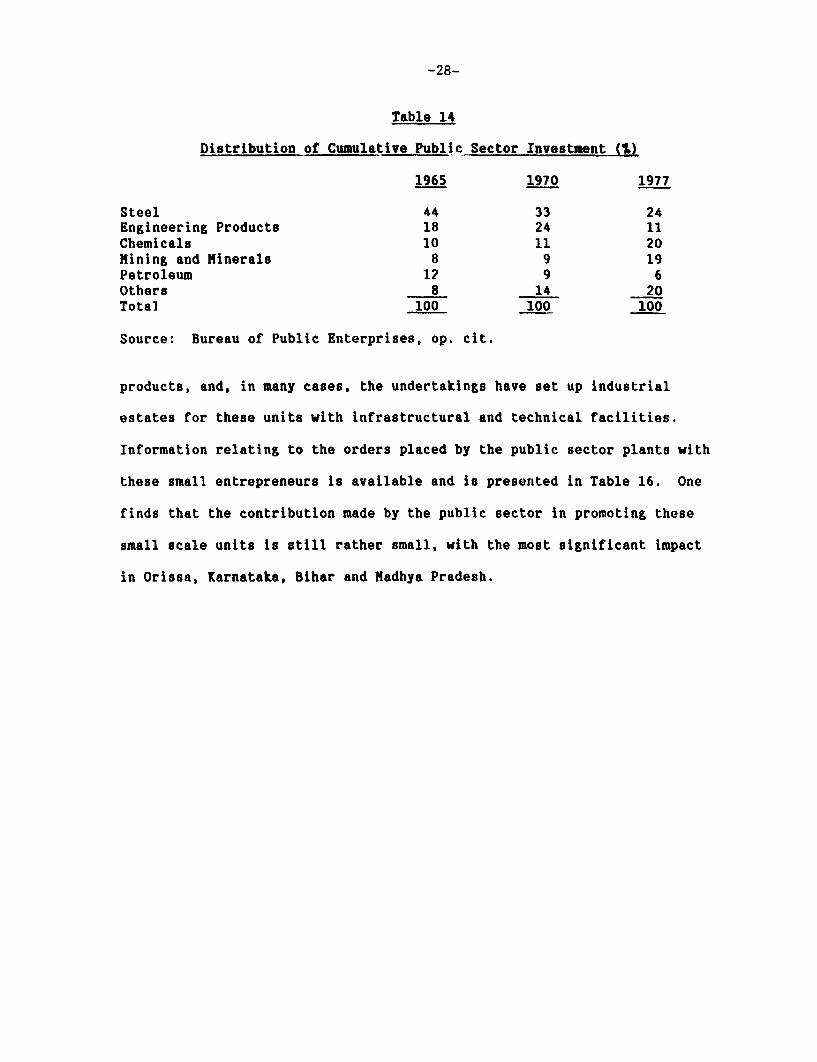
Steel 44 33 24Engineering Products 18 24 11Chemicals 10 11 20Mining and Minerals 8 9 19Petroleum 12 9 6Others 8 14 20Total 100 100 100
Source: Bureau of Public Enterprises, op. cit.
products, and, in many cases, the undertakings have set up industrial
estates for these units with infrastructural and technical facilities.
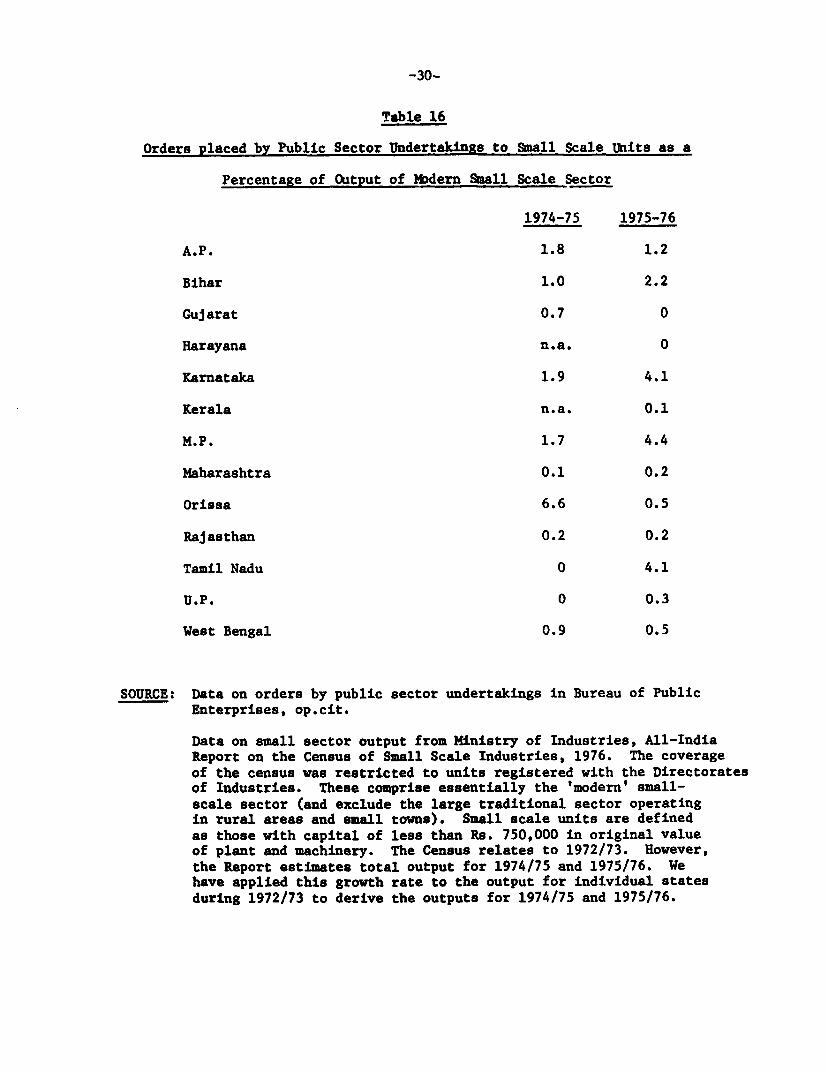
Information relating to the orders placed by the public sector plants with
these small entrepreneurs is available and is presented in Table 16. One
finds that the contribution made by the public sector in promoting these
small scale units is still rather small, with the most significant impact
in Orissa, Karnataka, Bihar and Madhya Pradesh.
-29-
Table 15
Share of Employment in Central Public Undertakings in Total Employment
in Manufacturing & Mining (%)
A.P. Assam Bihar Gujarat Haryana Karnataka Kerala M.P.
1973 9.9 30.8 31.7 3.5 0 22.9 4.6 14.0
1974 11.0 29.7 38.2 3.5 0 24.3 5.9 35.8
1975 12.5 30.1 39.8 4.2 0.1 26.8 7.1 37.0
TamilMaharashtra Orissa Punjab Rajasthan Nadu U.P. W.B. J & K
1973 1.9 34.1 6.1 4.3 7.5 5.1 6.3 0
1974 9.4 34.4 6.6 6.8 7.5 17.9 7.6 6.6
1975 12.7 36.2 8.4 9.1 9.5 20.4 8.5 8.2
SOURCE: Bureau of Public Enterprises, op.cit.
-30-
Table 16
Orders placed by Public Sector Undertakings to Small Scale Units as a
Percentage of Output of Mbdern Small Scale Sector
1974-75 1975-76
A.P. 1.8 1.2
Bihar 1.0 2.2
Gujarat 0.7 0
Harayana n.a. 0
Karnataka 1.9 4.1
Kerala n.a. 0.1
M.P. 1.7 4.4
Maharashtra 0.1 0.2
Orissa 6.6 0.5
Rajasthan 0.2 0.2
Tamil Nadu 0 4.1
U.P. 0 0.3
West Bengal 0.9 0.5
SOURCE: Data on orders by public sector undertakings in Bureau of PublicEnterprises, op.cit.
Data on small sector output from Ministry of Industries, All-IndiaReport on the Census of Small Scale Industries, 1976. The coverageof the census was restricted to units registered with the Directoratesof Industries. These comprise essentially the 'modern' small-scale sector (and exclude the large traditional sector operatingin rural areas and small towns). Small scale units are definedas those with capital of less than Rs. 750,000 in original valueof plant and machinery. The Census relates to 1972/73. However,the Report estimates total output for 1974/75 and 1975/76. Wehave applied this growth rate to the output for individual statesduring 1972/73 to derive the outputs for 1974/75 and 1975/76.
-31-
(iii) Distribution and Pricinz Policies for Basic Industrial Inouts
There are certain products that are crucial for the establishment
and operation of industrial projects; chief among these in the Indian
context are cement, steel and coal. As with any other comodity, regional
production of these inputs is determined by factors like the availability
of raw materials, transport costs and proximity to markets. The Indian
Government has followed a policy of control on the prices and distribution
of these cozmodities with the objective of regional equity. Given the
crucial nature of these products in industrialization, the official
justification is that states blessed with easy availability of these
inputs should not gain in relation to others.
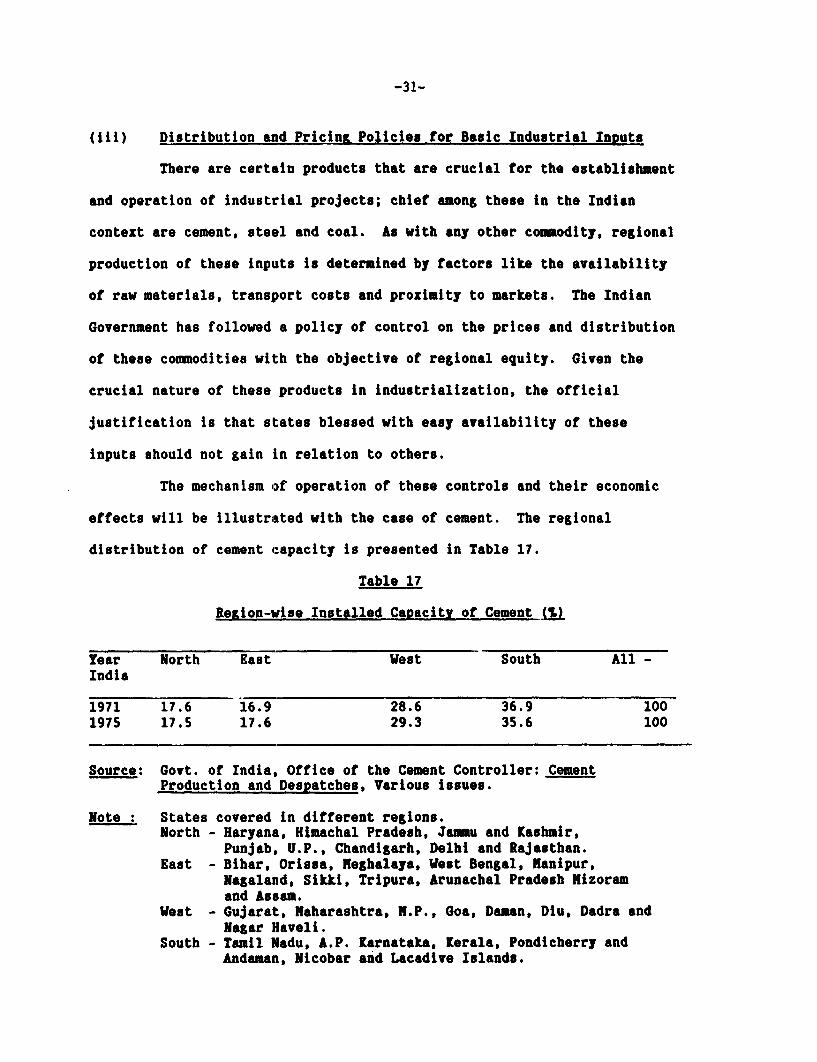
The mechanism Of operation of these controls and their economic
effects will be illustrated with the case of cement. The regional
distribution of cement capacity is presented in Table 17.
Table 17
Region-wise Installed Capacity of Cement jfl
Year North East West South All -India
1971 17.6 16.9 28.6 36.9 1001975 17.5 17.6 29.3 35.6 100
Source: Govt. of India, Office of the Cement Controller: CementProduction and Despatches, Various issues.
Note : States covered in different regions.North - Haryana, Himachal Pradesh, Jaiu and Kashmir,
Punjab, U.P., Chandigarh, Delhi and Rajasthan.East - Bihar, Orissa, Meghalaya, West Bengal, Manipur,
Nagaland, Sikki, Tripura, Arunachal Pradesh Mizoramand Assam.
West - Gujarat, Kaharashtra, M.P., Goa, Daman, Diu, Dadra andNagar Haveli.
South - Tamil Nadu, A.P. Karnataka, Kerala, Pondicherry andAndaman, Nicobar and Lacadive Islands.
-32-
Production of cement is concentrated in the Western and Southern
regions which accounted for almost two-thirds of cement capacity in 1971
and 1976. Furthermore, within these regions, there is considerable
variation in production by individual states. The price control exercised
by the Government to balance these regional variations takes the following
shape. In the first instance, the Government fixes the 'retention price'
- the price payable to the manufacturer. Second, through suitable
subsidies, railway freight charges for the transportation of cement to all
destinations are kept the same. Thus, the F.O.R. (free on rail) price of
cement is uniform in all parts of the country. However, the actual retail
prices vary according to the incidence of state taxes.
These prices and distribution controls have resulted in various
kinds of distortions of the market mechanism and led to certain
irrationalities in the industrial location process. The most important
effects are explored below. .
First, the "freight-pooling" arrangement has obvious implications
for the location of cement plants. Since transportation charges to
markets are the same irrespective of distance, entrepreneurs will locate
their plants in accordance with raw material availability - the major ones
being limestone, gypsum and coal. As a corollary, these controls lead to
the disappearance of natural protection in the form of transportation
charges that would have led to some development of cement capacity in
states less well-endowed with these raw materials.
Second, freight-pooling was introduced in 1966. Thus, cement
units set up earlier in proximity to markets have found themselves at a
disadvantage vis-a-vis new units.
-33-
Third, there is less of an incentive for the utilization of
substitutes for cement in "deficit" states. For instance, in the North
Eastern Region, states like Kashmir and other areas with plentiful timber
resources, the utilization of these is sub-optimal because of the
artificial lowering of cement prices.
Fourth, there is8 an excessive use of railway transport especially
to distant consuming areas. This is particularly important in the context
of frequent bottlonecks in transport that have affected Indian industrial
growth.
Fifth, a fiscal burden is imposed on the Government to the extent
that a subsidy has to be provided to support this freight equalization
mechanism.
Finally, the transportation subsidy reduces the scope for "split
location" of clinker and grinding plants, i.e. setting up of clinker
plants near raw materials and grinding plants at consuming centers. A
major advantage of this division is saving in transportation costs
(because of reductions in tonnage that needs to be transported) and
convenience in transportstion (clinker can be dispatched in bulk in open
wagons). Because of the subsidy on transport, these advantages are not
enough to outweigh the additional expenses involved in setting up grinding
facilities in consuming areas.
There has been it persistent shortage of cement in India despite
the ready availability of' essential raw materials. There is little doubt
that price and distribution controls are important reasons for this
phenomenon. Cement produc:ers have resented the "unremunerative" prices
-34-
fixed by the Government. 1/ Besides this, irrationalities in the location
of production and utilization of cement resulting from these controls have
also played their part.
It is not easy to assess the precise locational impact of the
freight equalization schemes without a detailed study of the regional
distribution of raw materials, markets and other factors influencing the
industrial location process and the policy changes and their linkage in
a general equilibrium context. It is obvious that, in the case of
cement, the concentration of capacity in the Southern and Western Regions
implies that freight equalization has benefited the Northern and Eastern
Regions. 2/ On the other hand, for steel and coal, the Eastern Region
which dominates in production has lost vis-a-vis the rest of India. A
careful analysis of these policies is urgently called for to eliminate
some of the resulting irrationalities and to gauge the extent of
efficiency loss in relation to the gains in regional equity.
1/ Recently, in February 1982, the Government introduced a policy ofpartial decontrol of the cement industry whereby units could sellcement output in excess of two-thirds of their capacity at free marketprices. In the short while that this policy has been in force,available information indicates that there has been a dramaticimprovement in the supply situation of cement. Moreover, a number ofcompanies have started diversifying into the production of cement inresponse to the increased profitability of this industry.
2/ For a detailed analysis, see National Council of Applied EconomicResearch. Cement Industry in India, 1979, New Delhi.
-35-
(iv) State Government Incentives
A variety of ilncentives are offered by individual states to
attract entrepreneurs to establish industries within their borders. There
are also state-level financial institutions and industrial development
agencies whose major taisk is the provision of industrial finance and
promotion of industry. The major incentives fall into three broad
categories: 1/
a. Reduction in capital cost and infrastructural expenditure
Provision of financial assistance (both in the form of loans and
equity); infrastructural facilities and availability of plots and sheds in
industrial estates; assistance in acquisition of land; and assistance in
the preparation of feasibility reports.
b. Incentives related to the prices and availability of inputs
Reductions in power tariffs and electricity duties; financial
assistance to units for setting up power generating sets; reduced water
rates; and assistance in the procurement of controlled raw materials.
c. Tax incentives
Concessions (on loans) for payment of sales taxes, octroi stamp
duties and property taxes.
These three types of incentives exist in almost every state.
However, the precise content of each incentive varies from state to
state. It would be interesting to determine the extent to which these
differences have influenced the decisions of entrepreneurs In plant
location. Unfortunately, there has been no research study of this nature
essentially because of the paucity of detailed information required for a
rigorous analysis. For example, one needs state-level data relating to
1/ The magnitude of the incentives are often increased further for smallscale units or units set up in "backward" districts.
-36-
land rents, location of estates, power tariffs, water rates, tax levels etc.
The task is also complicated by the fact that these incentives keep changing
over time for every state. A priori, it can be argued that if the Governments
of individual states were serious enough about industrialization within their
boundaries, they would not allow the overall attractiveness of their
incentives to fall much below those offered by other states. However,
"rationality" cannot always be taken for granted in Governmental decision
making. Moreover, there are other objective factors which influence the
offering of incentives - the budgetary position, for instance. Finally, it is
not merely the announcement of incentives but the actual effectiveness with
which they are implemented that will influence industrial location. Here
again, there is little doubt that the efficiency of the implementing agences
varies across states.
Finally, there is the similarity between state incentives and the
phenomenon of different developing countries competing with each other to
attract foreign investment. The advantages that are derived from
inter-country co-operation in this analogy may be of some relevance.
Otherwise, there is the danger that unhealthy competition between the state
Governments will unnecessarily drain state budgetary resources (in the form of
transfers to the private sector) with no net gain from a national viewpoint.
2. Policies Influencing the Intra-Regional Distribution of Industry
Having looked at the locational policies aimed at a more equitable
inter-state distribution of industry, we now turn our attention to those
affecting intra-regional industrial growth. Chronologically arranged in the
order of their implementation, these consist of:
(i) policies for encouraging (a) village and cottage industries and
(b) modern small scale enterprises;
-37-
(ii) the indusltrial estates program;
(iii) The Rural Industries Project Program;
(iv) metropolitan planning in the major cities;
(v) incentives to promote industrial development in backward
districts: (a) Central Government incentives, (b) Concessional
finance from all-India financial institutions and (c) State
Government incentives. 1/
(i) Policies to Encourage the Small Scale Sector
A major aspect of Indian industrial policy has been its emphasis on
encouraging the small scale sector. The reasons for this are summed up in the
following quote from the Industrial Policy Resolution of 1956:
'They (village and small scale enterprises) provide immediate large
scale employment, they offer a method of ensuring a more equitable
distribution of national income and they facilitate an effective mobilization
of resources of capital and skill which might otherwise remain unutilized.
Some of the problems that unplanned urbanization tends to create will be
avoided by the establishmaent of small centers of industrial production all
over the country.'
Thus, the desire to promote a decentralized form of development is
quite central in the rationale for supporting the small scale sector.
The small scale sector can conceptually be broken up into two
categories - the traditional village and cottage industries operating in the
rural and semi-urban areas and modern small scale enterprises. It is
extremely difficult to draw a precise dividing line between the small scale
sector and the rest of the manufacturing sector. The Government uses capital
investment as the criterion for defining the modern small sector. The precise
1/ We have described State Government incentives in an earlier section
-38-
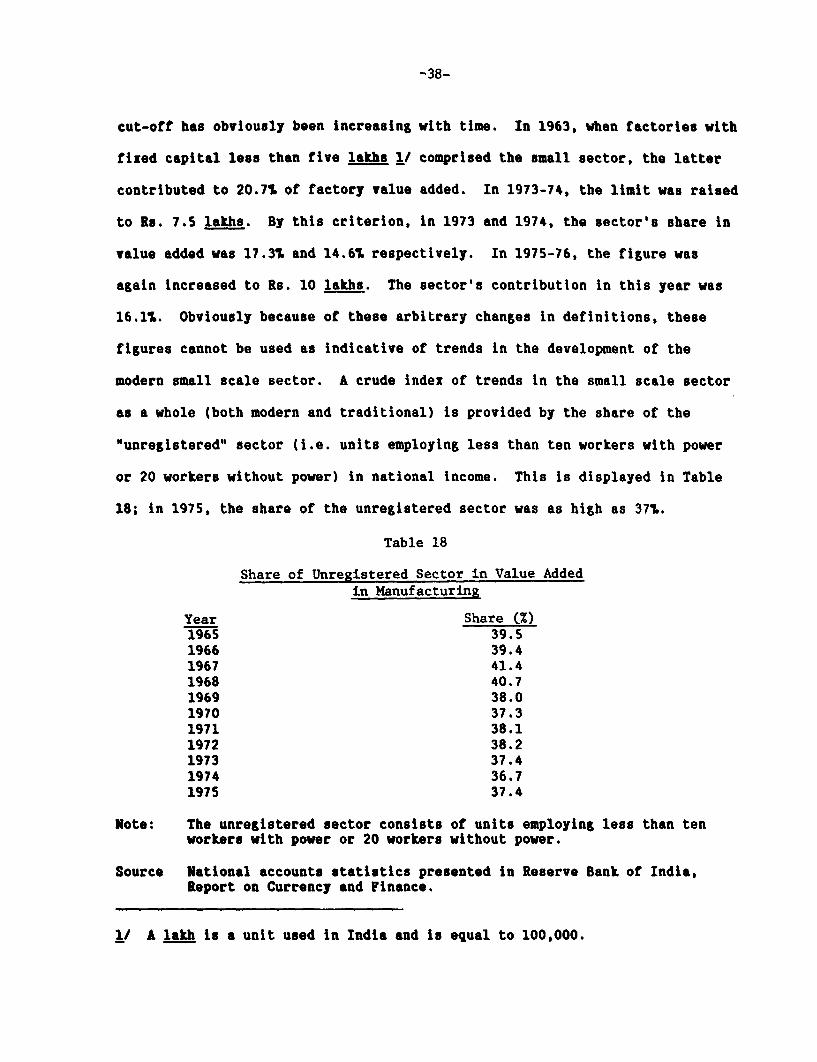
cut-ott has obviously been increasing with time. In 1963, when factories with
fixed capital less than five lakhs V/ comprised the small sector, the latter
contributed to 20.77 of factory value added. In 1973-74, the limit was raised
to Re. 7.5 lakhs. By this criterion, in 1973 and 1974, the sector's share in
value added was 17.37 and 14.67 respectively. In 1975-76, the figure was
again increased to Rs. 10 lakhs. The sector's contribution in this year was
16.17. Obviously because of these arbitrary changes in definitions, these
figures cannot be used as indicative of trends in the development of the
modern small scale sector. A crude index of trends in the small scale sector
as a whole (both modern and traditional) is provided by the share of the
"unregistered" sector (i.e. units employing less than ten workers with power
or 20 workers without power) in national income. This is displayed in Table
18; in 1975, the share of the unregistered sector was as high as 37t.
Table 18
Share of Unregistered Sector in Value Addedin Manufacturing
Year Share (%)1965 39.51966 39.41967 41.41968 40.71969 38.01970 37.31971 38.11972 38.21973 37.41974 36.71975 37.4
Note: The unregistered sector consists of units employing less than tenworkers with power or 20 workers without power.
Source National accounts statistics presented in Reserve Bank of India,Report on Currency and Finance.
I/ A lakh is a unit used in India and is equal to 100,000.

TABLE 19
Employment and Output in Modern Small Scale Sector, 1972
EMPLOYMENT GROSS OUTPUTRatio of Ratio of
Number Percentage small scale sector Value Percentage small scale sector to(000s) distribution to factory sector(%) (Rs.crs)-/distribution factory sector(%)
Food Products 131.2 7.9 1.9 152.3 5.9 4.5Beverages 4.6 0.3 2.3 7.4 0.3 1.4Hosiery & Readymade
garments 75.3 4.6 393.8 155.4 6.0 322.0Wood Products 94.7 5.7 125.5 102.6 3.9 81.9Paper Products,Printing, etc. 89.1 5.4 35.5 126.4 4.9 20.9
Leather Products 31.8 1.9 71.3 88.6 3.4 49.2Rubber & Plastic
Prods. 81.7 4.9 87.7 151.2 5.8 62.5Chemicals 159.0 9.6 49.5 346.7 13.3 15.1Glass & Ceramics 202.3 12.2 250.4 125.5 4.8 106.6Basic Metal Indus. 109.6 6.6 24.0 294.1 11.3 14.4Metal Products 300.1 18.2 170.8 469.1 18.0 87.9Machinery & parts 145.3 8.8 44.8 211.0 8.1 20.3Electrical &
Electronic Prods. 65.9 4.0 26.1 151.7 5.8 13.6Transport equip. 83.5 5.1 21.3 134.8 5.2 12.0Miscellaneous 40.0 2.4 - 62.7 2.4 -Repairing, servicing& job work 39.0 2.4 26.3 23.3 0.9 9.8
TOTAL 1653.2 100.0 31.3 2602.7 100.0 14.1
2/ Crore is a unit used in India and is equal to ten million.
SOURCE: Computed from Development Commissioner, Small Scale Industries (Ministry of Industry & Civil Supplies),All-India Report on the Census of Small Scale Industries (1976).
-40-
In sharp contrast to the concentration of traditional enterprises in
simple consumer goods production, modern small scale units are engaged in
manufacturing a wide variety of commodities (Table 19). In fact, basic
metals, metal products, machinery and transport equipment are the most
important activities, together accounting for 437 of employment and 487 of
gross output in this sector.
Despite the problems of definition, there is no doubt about the
critical importance of trends in the small sector in an analysis of Indian
industrial development. Within the small scale sector, it is the traditional
industries that dominate. Because of the labor-intensive character of
production in traditional enterprises, their share in employment is striking.
The 1971 census estimated that as much as 77.4* of the labor force in the
manufacturing sector was employed in household units. The most important
activities in traditional enterprises are textiles and textile products; in
1971, almost one-third of household workers were engaged in this activity.
Another indication of the significance of these industries is the estimate
that, in 1976, about 50* of total cloth output in the country was produced by
the decentralized sector, i.e., the non-mill sector where the utilization of
handlooms is quite common. Apart from textiles, other major household
industries are agro-processing (like the processing of cereals and pulses,
&ur 1/ and khandsari 1/), carpentry and blacksmiths, coir and coir products,
sericulture and handicrafts.
The Indian Constitution assigns major responsibility for development
of small scale industries to the State Governments. However, the Government
of India through the Small Scale Industries Development Organization (SSIDO),
renders advice and coordinates the state programs. The SSIDO also performs an
1/ Crude varieties of sugar.
-41-
industrial extension service to small scale enterprises by providing
access to improved technology and products and imparting training to them
in management, finance and marketing. Two other important agencies set up
by the Government of India to assist the Small Scale sector are the
National Small Industries Corporation (NSICO)and the Small Industry
Extension Training Institute (SIETI). The NSICO performs the following
duties:
1. it supplies machinery on a hire-purchase basis;
2. it acts as a contractor for Government orders;
3. it operates EPrototype Production and Training Centers;
4. it distributes scarce items on a bulk basis; and
5. it markets thle export of products produced by the small scale
sector.
The SIETI conducts research on small scale enterprises and provides
training to officers concerned with extension services.
These three organizations are primarily concerned with modern
small scale industries. Responsibility for household and village
industries 1/ is assigned at the Central Government to the Khadi and
Village Industries Comnission. At the State Government level, the
Director of Industries is in overall charge of development of all
industries (both large and small).
As we have stated earlier, the most important activities in
traditional enterprises are textiles and textile products most of which
are produced on handlooms. The All-India Handloom Board assists the
handloom textile industry through a variety of policies:
1/ Excluding textiles other than "khadi" (crude handspun cloth).
-42-
1. reservation of certain types of cotton textiles for production by
the handloom industry;
2. encouragement of co-operative societies;
3. loans to weavers to subscribe to the share capital of the
co-operatives;
4. supply of yarn to the co-operatives;
5. schemes for improvement of handlooms;
6. aid for marketing and rebates on sale of handloom cloth;
7. training facilities for weavers.
Especially after the nationalization of the major commercial
banks in 1967, the financial needs of the small scale sector are being
taken care of on a priority basis, with concessionary interest rates and
collateral. In the states, the State Financial Corporations make loan
capital available to small industry.
Finally, since 1978, a number of "District Industries Centers"
have been set up as district-level governmental organizations to oversee
the development of the small scale sector.
Up to this point, we have examined policies operating mainly
through Government expenditure on the small scale sector. However, many
of the policies are in the form of controls. For example, the licensing
system bans the production of certain items in large factories, reserving
them for the small sector. Moreover, small scale enterprises do not have
to go through the licensing system to set up new units or to expand
capacity. These sorts of restrictions are also important to protect the
handloom sector. As we pointed out, certain items of clothing are
reserved for production by handlooms. In addition, the Government also
directs spinning mills to allocate part of their yarn production to
satisfy the raw material requirements of the handloom sector.
-43-
Having examined the general state policies used to encourage the
small scale sector, Wv now turn our attention to policies specifically
targeted at the location of small scale units - namely, the industrial
estates program and tlhe rural industries projects program.
(ii) Industrial Estate Proaram
Industrial esstates have been defined as "a group of factories
constructed on an economic scale in suitable sites with facilities of
water, transport, electricity, steam, bank, post office, canteen, watch
and ward and first aid and provided with special arrangements for
technical guidance and common service facilities." 1/ The Indian
Government has taken the initiative of setting up industrial estates with
two objectives in mind. One is the encouragement of the small scale
sector, through the provision of various infrastructural facilities and
economic incentives which are essential characteristics of the industrial
estate. The second igi the dispersal of industry away from central
metropolitan regions through suitable location of the industrial estates
and their catalytic influence on economic activity in their area of
operation.
The industrial estates program was initiated in 1955, toward the
end of the First Five-Year Plan (1951-56). The first industrial estate to
commence operation was the one at Rajkot (in Gujarat). The program gained
signlficant momentum during the Second Five-Year Plan (1956-61). The Plan
made a provision of RE. lllm. for the construction of 110 industrial
estates, of which Rs. 104 m. was actually spent. By the end of the Plan,
67 estates were constructed of which 53 were actually functioning. In
l/ Alexander, P.C. Industrial Estates in India, Bombay: Asia PublishingHouse, 1963. In practice, an industrial estate does not have all
these characteristics
-44-
terms of factory sheds, 2077 had been completed though only 1049 were
operating The geographical distribution of the 119 estates sanctioned
during the First and Second Plans is as follows: 1/
Places with population of less than 20,000 25
Places with population of 20,000 - 50,000 25
Places with population of 50,000 - 100,000 21
Places with population of over 100,000 48
Total 119
The momentum of the industrial estates program was maintained
during the Third Plan (1961-66), which allocated Rs. 282 m. for this
purpose. The actual expenditure incurred during the plan amounted to Rs.
227 m., which was more than double the expenditure of the Second Plan
period. 2/ 216 estates were constructed during 1961-66, of which 145 were
actually functioning. The Third Plan placed a much greater emphasis on
utilization of industrial estates as an instrument for dispersal of
industry in towns and rural areas. For this purpose, the plan fostered
the idea of "rural Industrial estates," i.e., those in villages with less
than 5,000 inhabitants and located at a "sufficient" distance from large
cities and towns. The Plan also subdivided the other individual estates
into "urban" estates (in cities and towns with a population exceeding
50,000) and "semi-urban" estates (in small towns with population between
5,000 and 50,000). At the end of the Third Plan, out of the 198
functioning Industrial estates, 187 were rural, 307 were semi-urban and
V/ From Bandyopadhaya, 1969
2/ This comparison is unadjusted for prices.
-45-
52* were urban. During 1966-69 (which was the period of the three Annual
Plans ), Rs. 76 m was spent on industrial estates. In 1969, there were
285 functioning industrial estates of which 227 were rural, 327 semi-urban
and 467 urban.
During the mid-sixties, a number of evaluation studies were
undertaken to examine the working of the industrial estates during the
previous decade. 1/ 'rhese studies cast grave doubts on the extent to
which the industrial eastates program was achieving its twin goals of
promoting industrial development and industrial dispersal. This was
reflected in non-occupation of the constructed sheds and only partial
functioning of the occupled sheds. Table 20 shows that during the
sixties, more than 401L of the completed sheds were not operating. The
rural industrial estates fared the worst; in 1969, 50* of the completed
sheds were functioning. The estates in semi-urban areas did not fare much
better with only 57* of sheds operating. The urban industrial estates
performed much more satisfactorily; 767 of the completed sheds were
working in 1969. The reasons for this disquieting performance,
particularly of the rural and semi-urban industrial estates, have been
made clear by the evaluation studies.
The most important factor was the wrong choice of location for
the industrial estate. In many cases, careful techno-economic surveys
were not conducted to ascertain the suitability of the area in terms of
proximity to markets, availability of raw materials, labor, transportation
facilities, etc. For example, in their enthusiasm to promote the program,
1/ These included studies by the State Governments, the Central SmallIndustries Organization and the Estimates Committee (Lok Sabha).
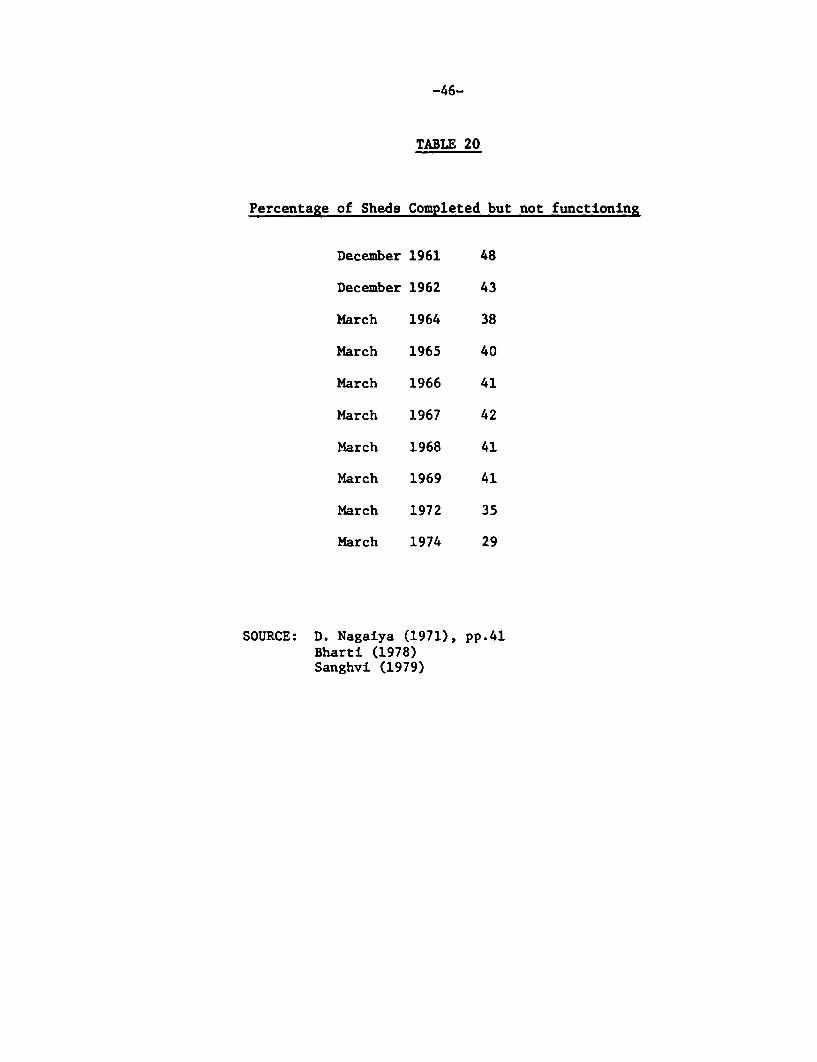
-46-
TABLE 20
Percentage of Sheds Completed but not functioning
December 1961 48
December 1962 43
March 1964 38
March 1965 40
March 1966 41
March 1967 42
March 1968 41
March 1969 41
March 1972 35
March 1974 29
SOURCE: D. Nagaiya (1971), pp.41Bharti (1978)Sanghvi (1979)
-47-
certain states decided to locate one or two estates in every district.
"In many of the states, it was considered a matter of political prestige
to locate an estate in each district as the district was not considered to
have come of age otherwise." 1/
Another case olf economic irrationality was the response to the
general advisability of locating the estates outside municipal limits in
order to encourage dispersal. While this made sense for cities and large
towns, some states decided to locate the estates two to four miles away
from the center even in the case of small towns. This inevitably resulted
in serious bottlenecks in transport facilities and the supply of other
essential inputs like water and electricity. There were many other cases
of poor pre-investment planning. After a critical examination of the
operation of the industrial estates program, the Estimates Committee noted
that "a little delay in the selection of a location in the beginning is a
small price compared to the waste of public funds and private resources
resulting from the wrong location of an industrial estate." 2/
The problems encountered in the choice of location reflect the
limitations of using industrial estates as tools in the industrialization
of backward areas. Merely setting up an estate in a backward region is
quite insufficient; there has to be coordinated provision of
infrastructural investments in transport, communications, power, water
supply, etc. Otherwise, it is quite unprofitable for entrepreneurs to set
up production units in rural and semi-urban areas. In fact, this has been
a major problem encountered in the implementation of the industrial
1/ Nagaiya, 1971, p. 66
2/ Government of India, Estimates Committee of the Third Lok Sabha, 106thReport, New Delhi, 1'966.
-48-
estates program. In some areas, the "District Industries Officers had to
practically plead with industrialists to set up industries in the newly
constructed estates." 1/
Another disconcerting feature of the performance of the program
has been the inordinate delay that has characterized the various stages of
implementation, like administrative approval of the scheme, land
acquisition, construction of sheds and other facilities, allocation and
occupation of sheds and the commencement of production. These have arisen
because of administrative inefficiency and poor coordination between the
various agencies involved.
The poor performance of the industrial estates program aroused a
great deal of concern, and policies followed since the mid sixties have
emphasized consolidation rather than expansion in the number of estates.
In contrast to the actual expenditure of Rs. 226 m. on the program during
the Third Plan, the estimated expenditure in the Fourth Plan (1969-74) was
only Rs. 157 m. (in current prices). While expenditure on industrial
estates amounted to 12, 19 and 24* of total expenditure on small scale
industries 2/ in the First, Second and Third Plans respectively, the share
during the Fourth Plan was only 16S. The outlay for the Fifth Plan
(1974-79) is Rs. 210 m., which is only 9.57 of total expenditure on small
scale industries. By 1975, there were 469 functioning estates of which
227. were rural, 297. semi-urbin and 49S urban.
However, the performance of the rural and semi-urban industrial
estates has still been rather unsatisfactory. In 1974, only 457 of the
V/ Nagaiya, 1971, p. 71
2/ i.e., expenditure on modern small scale industries, industrial estatesand rural industries projects.
-49-
completed sheds in rural estates were operating (the corresponding ratios
for urban and semi-urban estates were 817 and 667 respectively).
The impact of the industrial estates program can be assessed by
relating production and employment on the estates to overall trends in the
industrial sector. In comparison with the entire registered sector (i.e.,
factories employing more than ten workers with power or 20 workers without
power), output and employment on the estates are rather small (Table 21).
However, these shares have been gradually increasing over the sixties and,
in 1969, amounted to 1.0 and 1.6 percent respectively. By 1974, the share
in total output and employment had gone up further to 1.7% and 3.07.. The
Annual Surveys of Industries conducts yearly sample surveys for
enterprises employing between 10-49 workers (with power) or 50-99 workers
(without power). We can treat this "sample sector" as the modern
small-scale sector (in contrast with the traditional village and household
units that constitute the "unregistered" sector). The share of industrial
estates in sample sector output amounted to six percent in 1969. The
share in employment was more significant - nine percent in 1969 and 167 in
1974.
(iii) Rural Industries Projects
The Rural Industries Projects program was initiated in 1962-63 to
promote rural industrialization in certain parts of the country. This
objective is to be realized by "identification and moLivation of
prospective entrepreneurs, guiding them in selecting suitable products and
appropriate technology, lproviding them technical extension services and
helping them in obtaininlg their inputs including credit facilities, raw
materials and skilled labor." 1/ The program was to be coordinated with
1/ R.V. Rao, 1978, p. 31
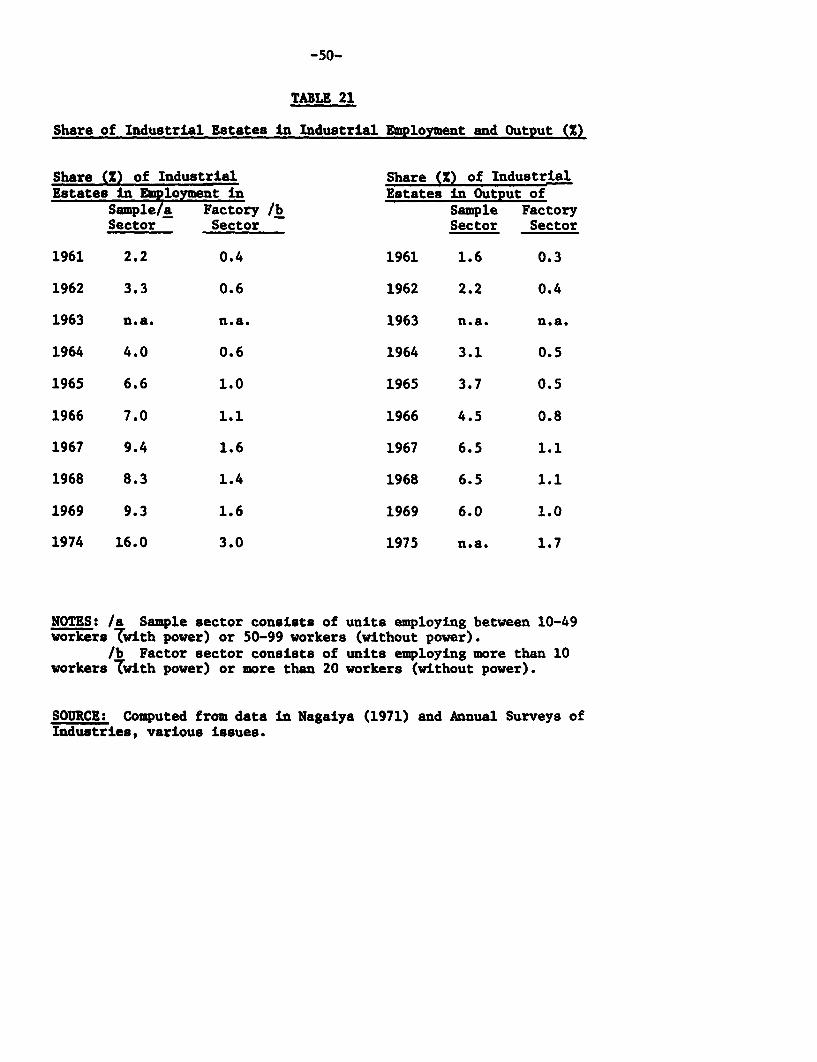
-50-
TABLE 21
Share of Industrial Estates in Industrial Employment and Output (X)
Share (Z) of Industrial Share (%) of IndustrialEstates in Employment in Estates in Output of
Sample/a Factory /b Sample FactorySector Sector Sector Sector
1961 2.2 0.4 1961 1.6 0.3
1962 3.3 0.6 1962 2.2 0.4
1963 n.a. n.a. 1963 n.a. n.a.
1964 4.0 0.6 1964 3.1 0.5
1965 6.6 1.0 1965 3.7 0.5
1966 7.0 1.1 1966 4.5 0.8
1967 9.4 1.6 1967 6.5 1.1
1968 8.3 1.4 1968 6.5 1.1
1969 9.3 1.6 1969 6.0 1.0
1974 16.0 3.0 1975 n.a. 1.7
NOTES: /a Sample sector consists of units employing between 10-49workers Twith power) or 50-99 workers (without power).
/b Factor sector consists of units employing more than 10workers Twith power) or more than 20 workers (without power).
SOURCE: Computed from data in Nagaiya (1971) and Annual Surveys ofIndustries, various issues.

-51-
other area development plans so as to achieve integrated regional
development. However, the rural industries projects (R.I.P.) program was
conceived essentially as a pilot scheme to gain experience and to identify the
crucial factors for promloting rural industrialization. Initially, the program
covered 49 areas each with a population of about 350,000. These areas were
chosen on the basis of the following criteria:
"(i) areas with favorable agricultural conditions and considerable
organized agricultural effort and also a heavy pressure of population.
(ii) areas with agriculture undertaken mainly under unirrigated
conditions and consiiderable need for additional employment;
(iii) areas with considerable under-employment because of unfavorable
natural conditions and lack of development potential;
(iv) tribal and otber backward areas;
(v) areas with large industrial projects established or to be
established; or
(vi) areas in the neighborhood of rural universities and institutes." 1/
During the Thircl Plan (1961-66), an expenditure of Rs. 48 m. was
incurred on the R.I.P. program, which constituted 2.27 of total public
expenditure on village and small scale industries (Table 22). In the Fifth
Plan (1974-79), planned eixpenditure had risen to Rs. 211 m., and the share to
3.97.
In 1969, the value of production in rural industries projects formed
only 1.1 and 0.27 of output in the sample and factory sectors respectively.
In 1973, these proportions were almost exactly the same (1.2 and 0.27).
Because of the labor-intensive nature of the products manufactured in the
rural industries projects and the technological processes utilized by them,
1/ O.P. Jain, 1975, p. 49
-52-
their contribution is much more significant in terms of employment - 13.1 and
2.3* in relation to sample and factory sector employment. By 1973, these
shares had risen to 15 and 2.87.
In the Fifth Plan (1974-79), the decision was taken to extend the
R.I.P. areas to entire districts, excluding towns with population exceeding
15,000 (1961 Census). 1/ By 1975-76, the number of R.I.P. projects had more
than doubled from the original 49 to 111.
In 1974, the Programme Evaluation Organisation (PEO) of the Planning
Commission conducted an evaluation or the working of the rural industries
projects. 2/ This study brought out a number of deficiencies in the working
of the program.
A key component of the program was an industrial potential survey of
the area to guide the priorities of assistance to dirferent types of
industrial units. However, the evaluation study found that the quality of
these surveys left much to be desired, and the actual pattern of units that
sprung up bore little relation to the "potential" as brought out in the
surveys.
There were various critical administrative inefficiencies. The State
Governments did not attach much priority to the implementation of the program
and the quality of staff assigned to administer the scheme was poor.
The P.E.O. tried to assess the impact of the R.I.P. program on
industrial development in the areas covered, by detailed investigations of a
large sample of industrial units in existence in these areas. The percentage
of units which availed themselves of the various components of assistance
1/ O.P. Jain, 1975, p. 49.
2/ Programme Evaluation Organisation, Planning Commission - Evaluation Studyof Rural Industries Projects, Govt. of India, 1978.

-53-
Table 22
Public Expenditure on Rural Industries Projects
Share in Total Publicexpenditure on village and
Actual expenditure. (Rs.m) small-scale industries (7).
Third Plan (1961-66) 48 2.2Annual Plan
Period (1966-69) 66 4.9
Fourth Plan (1969-74) 101 3.4
Fifth Plan (1974-79) 211 a/ 3.9
a/ Planned outlay
SOURCE : Planning Commission, Various Five Year Plan documents.
provided by the program is given in Table 23. One finds that with the
exception of loan assistance, the other components have only had a marginal
impact on the industrial units.
The principal objective of the R.I.P. Program is to promote
industrial development in the rural areas. However, a clear perspective is
lacking of both the character of rural industrialization to be promoted and
the economic viability of' such a strategy. In particular, there is
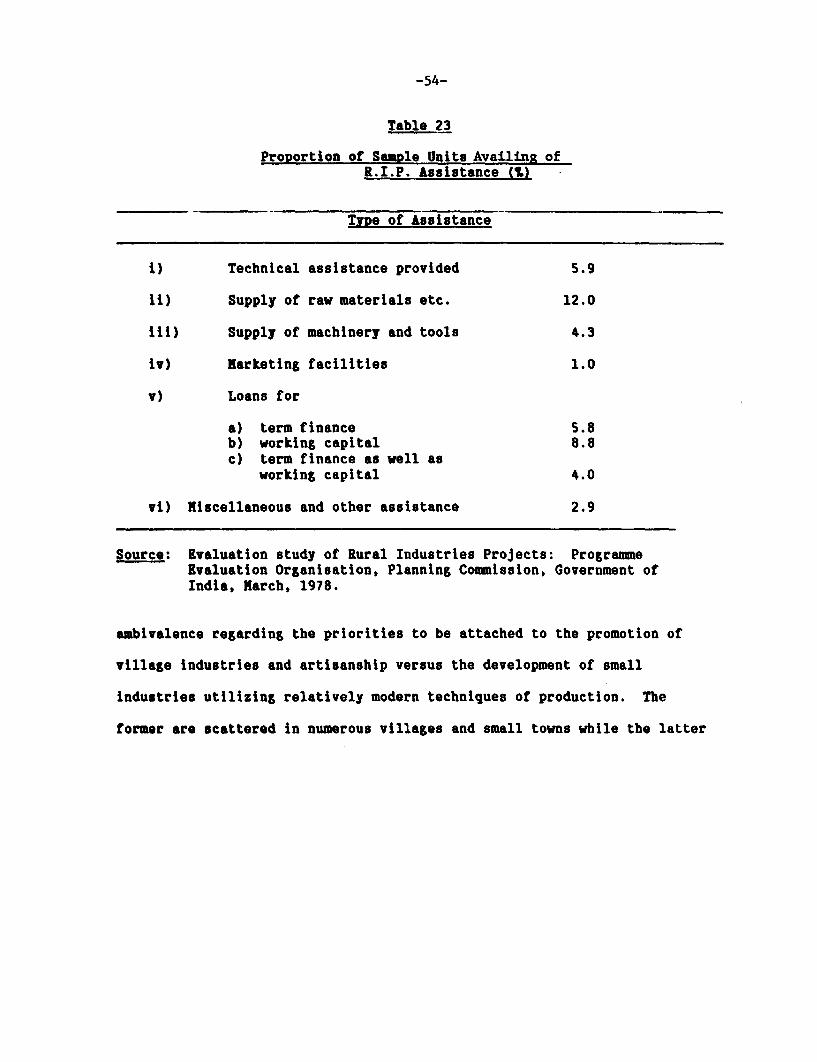
-54-
Table 23
Proportion of SaSUle Units Availing ofR.I.P. Assistance (1)
Type of Assistance
i) Technical assistance provided 5.9
ii) Supply of raw materials etc. 12.0
iii) Supply of machinery and tools 4.3
iv) Marketing facilities 1.0
v) Loans for
a) term finance 5.8b) working capital 8.8c) term finance as well as
working capital 4.0
vi) Miscellaneous and other assistance 2.9
Source: Evaluation study of Rural Industries Projects: ProgrammeEvaluation Organisation, Planning Commission, Government ofIndia, March, 1978.
ambivalence regarding the priorities to be attached to the promotion of
villase industries and artisanship versus the development of small
industries utilizing relatively modern techniques of production. The
former are scattered in numerous villages and small towns while the latter
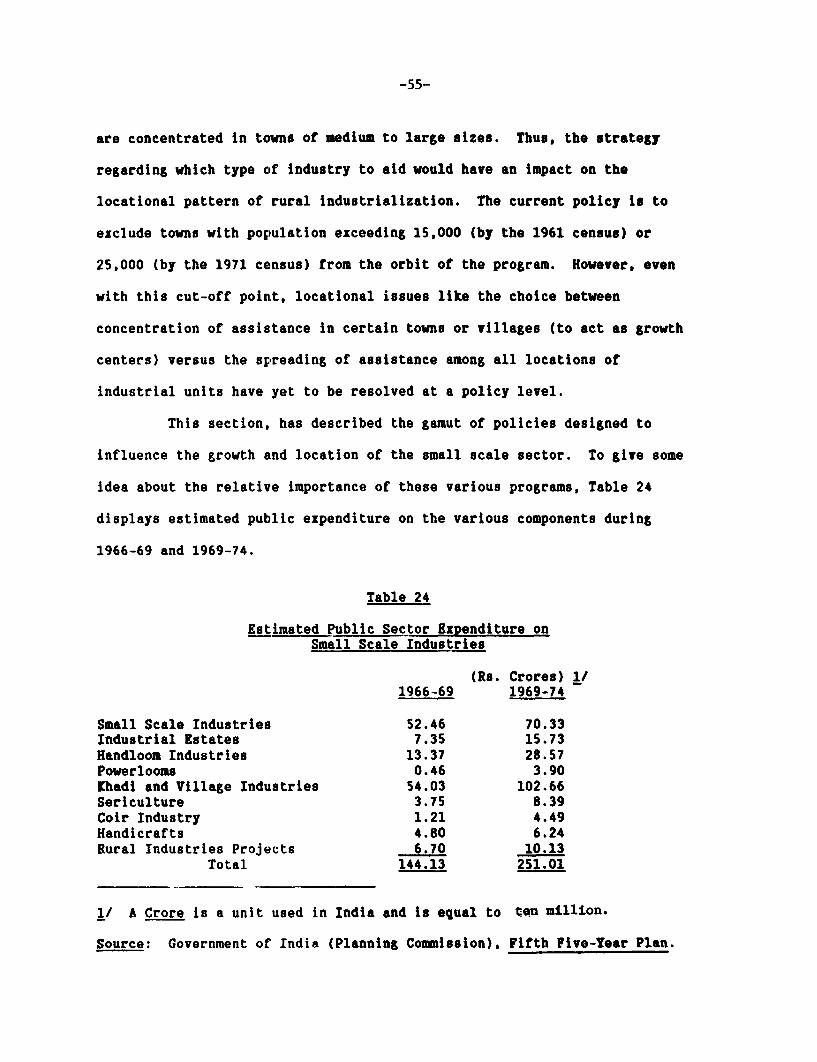
-55-
are concentrated in towns of medium to large sizes. Thus, the strategy
regarding which type of industry to aid would have an impact on the
locational pattern of rural industrialization. The current policy is to
exclude towns with population exceeding 15,000 (by the 1961 census) or
25,000 (by the 1971 ce!nsus) from the orbit of the program. However, even
with this cut-off point, locational issues like the choice between
concentration of assistance in certain towns or villages (to act as growth
centers) versus the spireading of assistance among all locations of
industrial units have yet to be resolved at a policy level.
This section, has described the gamut of policies designed to
influence the growth and location of the small scale sector. To give some
idea about the relative importance of these various programs, Table 24
displays estimated public expenditure on the various components during
1966-69 and 1969-74.
Table 24
Estimated Public Sector ExDenditure onSmall Scale Industries
(Rs. Crores) 1/1966-69 1969-74
Small Scale Industries 52.46 70.33Industrial Estates 7.35 15.73Handloom Industries 13.37 28.57Powerlooms 0.46 3.90[hadi and Village Industries 54.03 102.66Sericulture 3.75 8.39Coir Industry 1.21 4.49Handicrafts 4.80 6.24Rural rndustries Projects 6.70 10.13
Total 144.13 251.01
1/ A Crore is a unit used in India and is equal to ten million.
Source: Government of India (Planning Commission), Fifth Five-Year Plan.

-56-
(iv) Metropolitan Planning
Attempts at regional planning in India have been made essentially
in the context of metropolitan areas. While metropolitan plans exist for
most big towns and cities in India, the most well-established and
effective ones are those for Delhi, Bombay and Calcutta. Unfortunately,
we do not have the detailed data that would permit a study of their
operation and impact. Therefore, we shall restrict ourselves to a cursory
and descriptive look at these plans.
Delhi has the distinction of having been the object of the first
attempt at city planning. The Delhi Development Authority was established
in 1955 and prepared the "Delhi Master Plan" for the period 1962-81. V/
The plan indicated the directions for optimum socio-economic development
of the ci,ty. As far as the industrial development of Delhi was concerned,
the plan was in favor of restricting and controlling the process. The
growth of industrial workers during 1962-81 was to be limited to 257.
Industry was to be restricted in urban Delhi and deflected to the "ring
towns" of Ghaziabad, Faridabad, Ballabgarh, Gurgaon, Bahadurgarh and
Loni. Only small and medium-sized industries satisfying local consumption
needs and services would be considered for location in urban Delhi. The
Delhi Master Plan also recognized another level of spatial planning - the
"National Capital Region," consisting of the area (within a radius of 80
km) around Delhi and encompassing tehsils in the neighboring states of
Uttar Pradesh, Haryana and Rajasthan. The development of the "ring towns"
and the National Capital Region in synchronization with plans for the
Delhi urban area requires a high degree of coordination between the
1/ Delhi Development Authority, Delhi Master Plan, Vols. I & II, NewDelhi, 1961.

-57-
metropolitan organizat;ions of Delhi and those of neighboring states.
Unfortunately, this Was lacking for a number of years. However, recently,
serious attempts are being made to establish an effective political and
administrative apparatus for this purpose. 1/
The CalcuLta Metropolitan Planning Organisation was established
in 1961 and prepared the "Calcutta Metropolitan Regional Plan" in 1966. 2/
The plan was more in the nture of an "indicative" rather than a master
plan detailing the physical development of the Calcutta region. Another
distinctive feature was that "the Calcutta plan looks far beyond the
immediate environs of Calcutta and emphasizes the need for linking the
hierarchy of towns throughout the city's hinterland, which includes not
merely the whole of West Bengal but also the neighboring states and
territories, to establish a meaningful reciprocity between agriculture and
industry and to integrate the development of material and human
resources." 3/
The first major step towards metropolitan planning in Bombay was
taken in 1964 with the preparation of the Development Plan for Greater
Bombay. As far as industrial location was concerned, the thrust of the
Plan was to strongly discourage the coming up of new industrial units or
the expansion of existing ones in the Greater Bombay area. The state
Government accepted this as a general policy, but was quite lax in
permitting expansions of textile firms. However, in 1968, the Government
1/ See Town and Country Planning Organisation, National Capital RegionalPlan 1972.
2/ Calcutta Metropolitan Planning Organisation, Basic Development Planfor Calcutta Metropolitan District, Calcutta, 1966.
3/ Nisra et al., p. 136
-58-
reviewed this industrial location policy. A distinction was introduced
between 'conforming" and "non-conforming" zones. Units in the former would be
freely permitted to expand and a liberal attitude was adopted towards the
setting up of small-scale units.
The other major development was the setting up of the Gadgil
Comhittee in 1965 for recommending policies for development of the
Metropolitan Regions of Bombay-Panvel and Pune. On the recommendations of
this Committee, the Bombay Metropolitan Regional Plan was drafted 1/ and
formally adopted by the State Government in 1973. As far as industrial
location was concerned, dispersal and decentralization of industries were
accepted as the major policy goals. Industries were not to be encouraged in
certain areas (like the Kalyan-Ulhasnagar-Ambarnath and Thane-Kavesar
complexes) and would be diverted to new zones (like Nhava Sheva and Bhiwandi
and Bassein tehsils). Only consumer-oriented industries (satisfying local
consumption and service needs) would be allowed in Greater Bombay. These
industrial policies outlined in the plan were formalized by the State
Government of Maharashtra with the announcement of an "Industrial Location
Policy" in 1974. The Metropolitan region was divided into four zones with
restrictive policies for the central areas and more liberal ones for the
periphery. A system was introduced whereby new industrial units or existing
units wishing to expand operations or shift location in the Bombay
Metropolitan Region required "No Objection Certificatesm from the Commissioner
of Industries of the Government of Maharashtra.
I/ Bombay Metropolitan Regional Planning Board, Report of the Draft RegionalPlan of Bombay Metropolitan Region, Vols. I & II, 1970.
-59-
(v) Incentives to Develo2 Backward Districts
After 1979, a number of steps were initiated to promote the
industrial development of backward areas. The Planning Comission recomended
certain criteria for the identification of these backward regions consisting
of per capita agricultural production and industrial output, agricultural
workers, factory employees and other workers as a proportion of the
population, per capita consumption of electricity, and the length of surfaced
roads and railway mileage in relation to population. However, the states have
introduced their own -variations to these criteria. The definition of backward
areas varies accordinlg to the type of incentive (elaborated below). The
shares of those backward districts eligible for concessional finance in area
and population in indlvidual states and union territories in 1971 are listed
in Table 25. 1/ For India as a whole, these backward districts account for
607. of the population and 707. of area.
The policies adopted for encouraging industrial growth in the
backward districts operate through the following incentives:
(a) Capital InvesBtment Subsidy;
(b) Transport subsidy;
(c) Income tax concessions;
Cd) Concessional finance from all-India financial institutions; and
Ce) State Government incentives. 2/
1/ The correlation coefficient of these population shares of backwarddistricts in individual states with state per capita incomes in 1971 was0.54. Thus backward districts form a relatively larger segment ofpopulation in backward states.
2/ These have been described earlier.
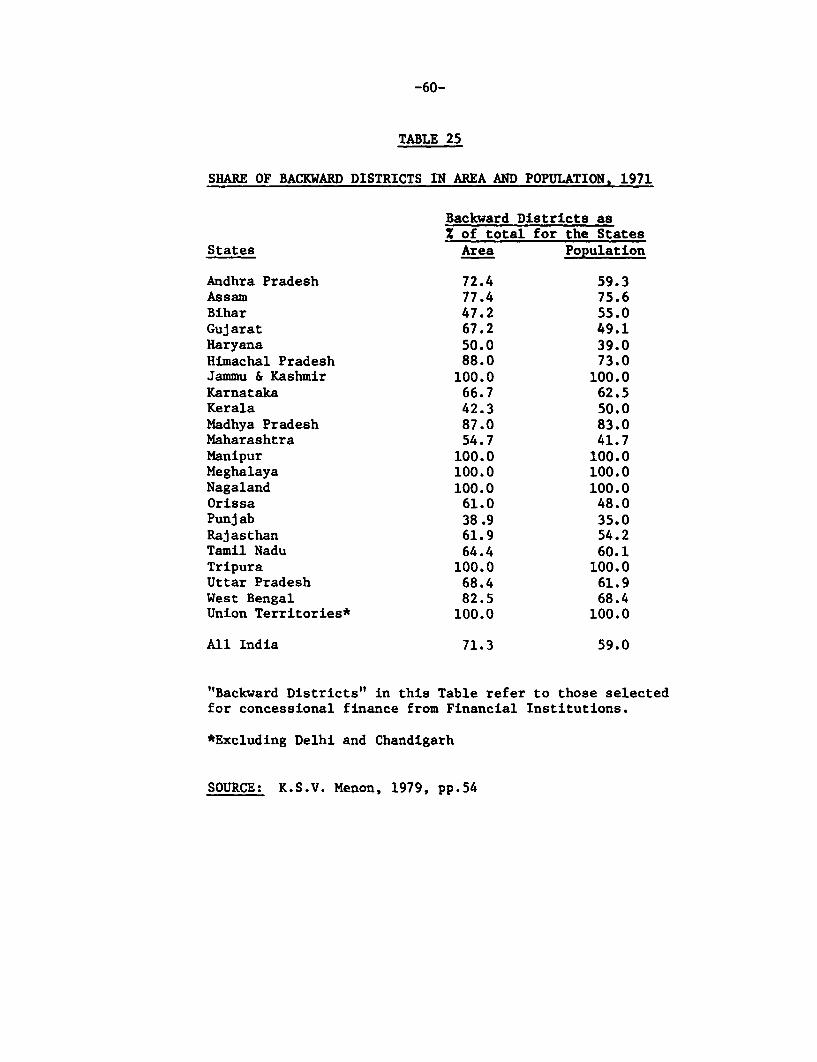
-60-
TABLE 25
SHARE OF BACKWARD DISTRICTS IN AREA AND POPULATION, 1971
Backward Districts as% of total for the States
States Area Population
Andhra Pradesh 72.4 59.3Assam 77.4 75.6Bihar 47.2 55.0Gujarat 67.2 49.1Haryana 50.0 39.0Himachal Pradesh 88.0 73.0Jammu & Kashmir 100.0 100.0Karnataka 66.7 62.5Kerala 42.3 50.0Madhya Pradesh 87.0 83.0Maharashtra 54.7 41.7Manipur 100.0 100.0Meghalaya 100.0 100.0Nagaland 100.0 100.0Orissa 61.0 48.0Punjab 38.9 35.0Rajasthan 61.9 54.2Tamil Nadu 64.4 60.1Tripura 100.0 100.0Uttar Pradesh 68.4 61.9West Bengal 82.5 68.4Union Territories* 100.0 100.0
All India 71.3 59.0
"Backward Districts" in this Table refer to those selectedfor concessional finance from Financial Institutions.
*Excluding Delhi and Chandigarh
SOURCE: K.S.V. Menon, 1979, pp.54

-61-
The Central Government capital investment subsidy scheme was
introduced in 1971. Under this scheme, new or expanding units in selected
backward districLs were entitled to a subsidy of ten percent of their total or
additional fixed capital investment. The ceiling on investment, eligible for
subsidy, was fixed at Rs. 5 m.; however, units with investments exceeding this
ceiling would also be considered at the discretion of the Government though
the maximum amount of subsidy would still be Rs. 500,000. In 1973, major
modifications were introduced. The rate of subsidy was raised to 157 and the
investment ceiling to Rs. 10 m. The discretionary clause for units with
investment exceeding this limit would still hold, subject to a subsidy limit
of Rs. 1.5 m.
One indicator of the progress of the scheme is provided by the
reimbursement of Central subsidy by the Government (Table 26). In the initial
years, the scheme did not evoke much response. However, from 1974-75 onwards,
there has been a significant and almost continuous increase in the
reimbursement of central subsidy. The state-wise picture of disbursement
during 1973-79 is depicted in Table 27. Four states consisting of Tamil Nadu,
Maharashtra, Gujarat and Karnataka account for over 427 of total disbursement
during 1973-79.
Simultaneously with the introduction of the capital investment
subsidy in 1971, a transport subsidy was also announced to aid industrial
development in hilly backward areas. Under this scheme, new industrial units
in the States or Union territories of Jammu and Kashmir, Assam, Manipu,
Meghalaya, Nagaland, Tripura, Arunachal Pradesh, Mizoram, Andamans and Nicobar
Islands, Lakshadweep, Himachal Pradesh and the hilly districts of U.P. were
eligible to a subsidy amounting to 501 of the transportation costs of both raw
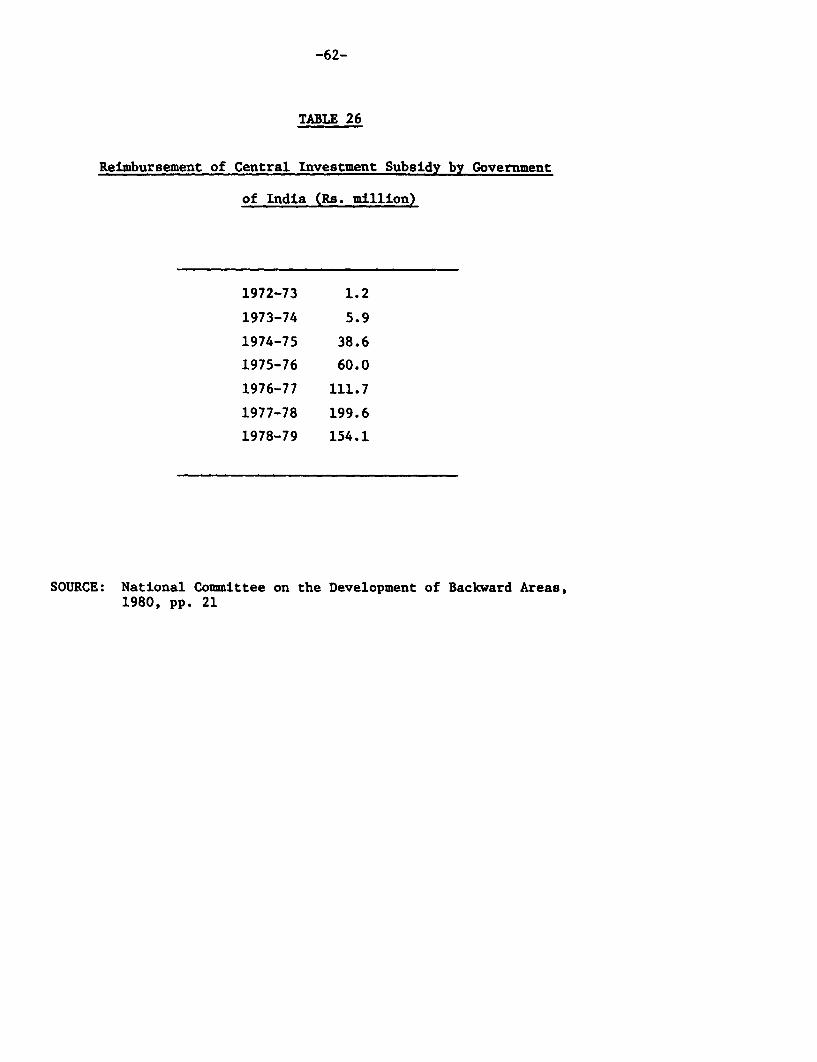
-62-
TABLE 26
Reimbursement of Central Investment Subsidy by Government
of India (Re. million)
1972-73 1.2
1973-74 5.9
1974-75 38.6
1975-76 60.0
1976-77 111.7
1977-78 199.6
1978-79 154.1
SOURCE: National Committee on the Development of Backward Areas,1980, pp. 21
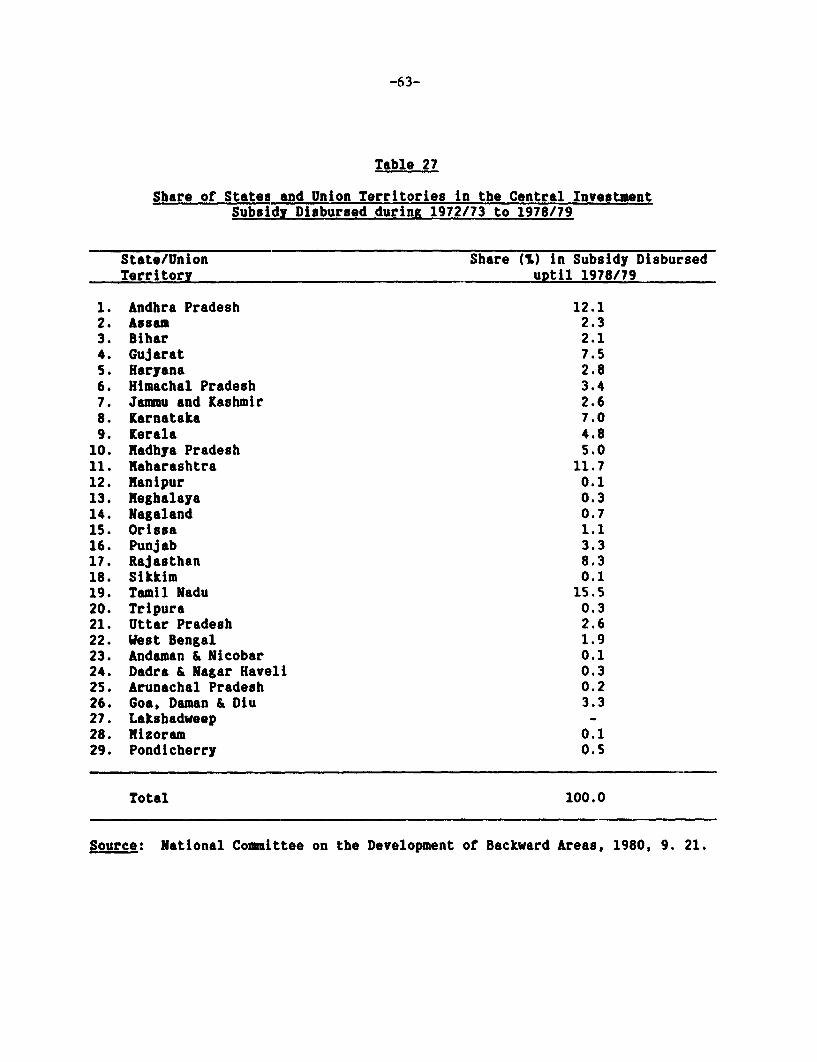
-63-
Table 27
Share of States and Union Territories in the Central InvestmentSubsidy Disbursed durin& 1972/73 to 1978/79
State/Union Share (%) in Subsidy DisbursedTerritory uDtil 1978/79
1. Andhra Pradesh 12.12. Assam 2.33. Bihar 2.14. Gujarat 7.55. Haryana 2.86. Himachal Pradesh 3.47. Jammu and Kashmir 2.68. Karnataka 7.09. Kerala 4.8
10. Madhya Pradesh 5.011. Naharashtra 11.712. Manipur 0.113. Meghalaya 0.314. Nagaland 0.715. Orissa 1.116. Punjab 3.317. Rajasthan 8.318. Sikkim 0.119. Tamil Nadu 15.520. Tripura 0.321. Uttar Pradesh 2.622. West Bengal 1.923. Andaman & Nicobar 0.124. Dadra & Nagar Haveli 0.325. Arunachal Pradesh 0.226. Goa, Daman & Diu 3.327. Lakshadweep -28. Mizoram 0.129. Pondicherry 0.5
Total 100.0
Source: National Committee on the Development of Backward Areas, 1980, 9. 21.
-64-
materials and finished goods. Expanding units are also eligible for this
subsidy for their expansion programs, provided that the increase in production
exceeds 257 of average annual output during the last three years.
During the first five years of its operation, the transport subsidy
scheme failed to make any impact on industrial development in these regions;
only two small claims (from Tripura) were received during these years. The
decision relating to the desirability of continuing the scheme is currently
under consideration by the Ministries of Industry and Finance.
One of the criticisms voiced against the transport subsidy scheme is
that it may lead manufacturers to substitute raw materials imported from
outside for those available locally, for example, to utilize cement instead of
timber in construction. This would adversely affect the objective of
promoting industries based on local resources. This criticism has remained
largely academic because of the poor response to the scheme.
Income tax concessions for new industrial units (including hotels) in
backward districts were announced in 1974. These units were allowed a
deduction of 207. of profits while computing taxable income. All projects
consencing operation after 1970 were eligible for this concession for a period
of ten years thereafter. Unfortunately, data pertaining to the number
availing themselves of these income tax concessions are not readily available.
In 1970, schemes of concessional finance for investment in backward
areas were introduced by the all-India financial institutions - the Industrial
Development Bank of India (IDBI), the Industrial Finance Corporation of India
(IFCI), the Industrial Credit and Investment Corporation of India (ICICI), the
Industrial Reconstruction Corporation of India and the National Small
Industries Corporation. These included direct assistance to industries as
well as refinance facilities for the state-level institutions. The precise
-65-
terms of the concessions (especially the rate of interest) have varied over
the years. Those prevailing in 1975 are summarized in Table 28.
Table 29 presents trends in assistance provided to units in backward
areas by the Industrial Development Bank of India (IDBI) which is the apex
development bank for industry in India. One finds that there has been an
impressive increase in the share of backward areas in sanctioned assistance
since 1970-71, with a corresponding lagged effect on disbursements. This
trend has been particularly noticeable after 1974-75. In 1980-81, almost half
of sanctioned assistance from IDBI was going to units in backward regions.
Even though these trends pertain only to assistance from IDBI, they would be
broadly reflective of trends in overall corporate sector investment. This is
because most medium and large projects in the corporate sector seek assistance
from one or more of the term-lending financial institutions operating in the
industrial sector; 1/ and IDBI is the largest of these institutions. 2/
Thus, the data appear to indicate that the capital investment subsidy
and the schemes of conce!ssional finance have had a significant impact on the
industrial development of backward regions. However, an important
qualification needs to be made before such a conclusion can be drawn. This
relates to the distribution of assistance among the 247 districts that qualify
for concessions. Only a small proportion of the districts have benefited from
these incentives. For instance, 15 districts account for over 567 of the
1/ During 1971-79, on average about half of corporate investment in theprivate sector was financed by these institutions. See IDBI, Report onDevelopment Banking in India, 1980-81, p. 2
2/ In 1980-81, for example, assistance sanctioned by IDBI (excluding exportfinance and subscription to shares and bonds of financial institutions)constituted 53* of total assistance sanctioned by all the term-lendingfinancial institutions operating in the industrial sector. See IDBI ODcit. pp. 1, 19.

TABLE 28
TERMS OF CONCESSIONAL FINANCE FOR UNITS IN BACKWARD DISTRICTS/AREAS, 1975
Rate of Interest Grace Period Amortisation Participation Underwriting Com-(Per Cent) (Years) Period in risk mission (per cent)
Name of Institution (Years) capital
Industrial Development 8.5 5 15 to 20 Relatively 1.25 for shares
Bank of India (10.25) (3) (10 to 12) heavily on (2.5)merits 0.75 for debentures
(1.5)Indus. Finance On rupee loans-- 9.5 5 15.to 18 Relatively 50 per cent of
Corp. of India (11.25) (3) (10 to 12) to a greater the normalOn foreign currency 10.5 extent onloans-- (11.5) merits
Indus. Credit and On rupee loans-- 8.5 5 20 -- 50 per cent of
Investment Corp. (10.25) (2 to 3) (12) the normalof India On foreign Currency
loans-- 9.5(10.5)
Indus. Reconstruction 7 -- -- -- --
Corp. of India (8.5)National Small Indus. 11 to 13 -- -- -- --
CoERoration* (13 to 15)
COMMITMENT CHARGE REFINANCING FACILITIES PROMOTERS' OTHER CONCESSIONSCONTRIBUTION
Industrial Development Reduced by 0.5 per To State Finance Cor-Bank of India cent or waived al- porations and Banks
together in excep- up to Rs. 30 lakhs attional cases 5.5 per cent
Industrial Finance Cor- 50 percent of the -- Lower than usual 50% reduction in other chargesporation of India normalIndustrial Credit and 50 percent of the -- Lower than usualInvest. Corp. of India normalIndustrial Reconstruc-tion Corporation of -- -- 7% (8.5%) interest on loans forIndia reconstructing/modernizing
IndustriesNational Small Indus- -- -- 10%(15%) interest on earnesttries Corporation money for supplying machinery and
NOTE: Figures in brackets indicate normal terms for advanced areas. equipment under the hire-purchaseSOURCE: M.D. Godbole, 1978, pp.72-73. scheme.
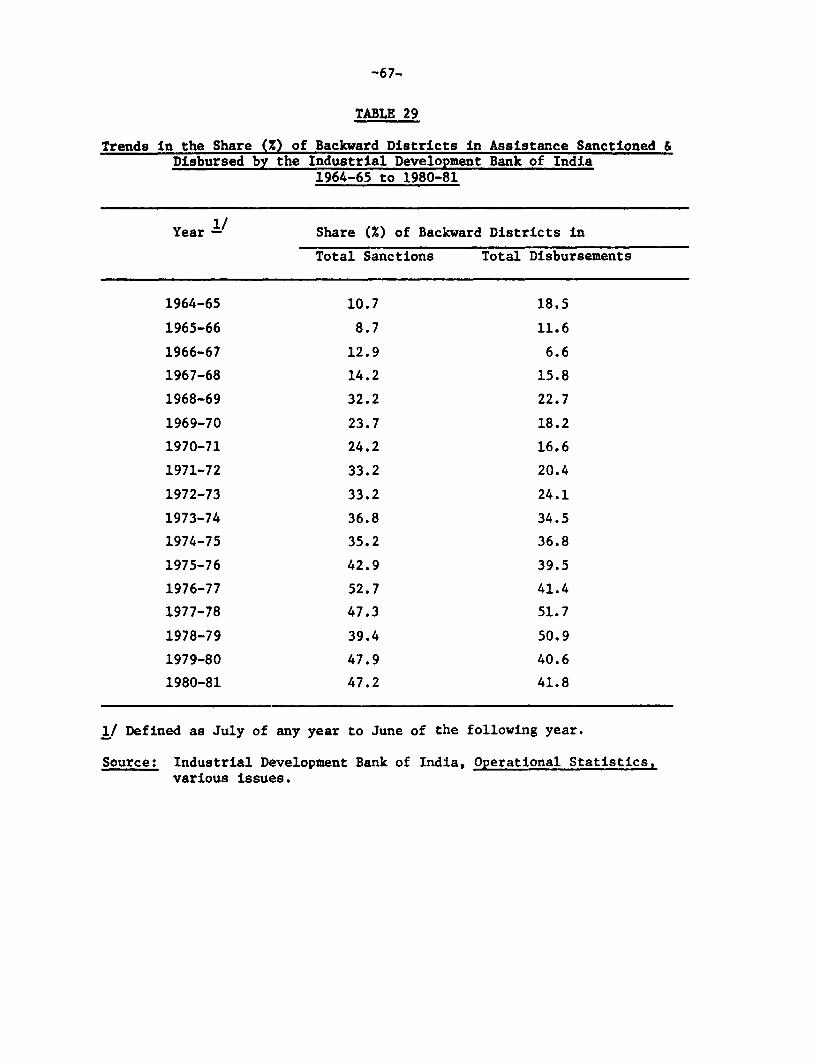
-67-
TABLE 29
Trends in the Share (Z) of Backward Districts in Assistance Sanctioned &Disbursed by the Industrial Development Bank of India
1964-65 to 1980-81
Year -/ Share (X) of Backward Districts in
Total Sanctions Total Disbursements
1964-65 10.7 18.5
1965-66 8.7 11.6
1966-67 12.9 6.6
1967-68 14.2 15.8
1968-69 32.2 22.7
1969-70 23.7 18.2
1970-71 24.2 16.6
1971-72 33.2 20.4
1972-73 33.2 24.1
1973-74 36.8 34.5
1974-75 35.2 36.8
1975-76 42.9 39.5
1976-77 52.7 41.4
1977-78 47.3 51.7
1978-79 39.4 50.9
1979-80 47.9 40.6
1980-81 47.2 41.8
1/ Defined as July of any year to June of the following year.
Source: Industrial Development Bank of India, Operational Statistics,various issues.

-68-
Central Investment subsidy disbursed up until 1978-79. 1/ Similarly, 22
districts received 497 of Lhe total disbursals of concessional finance by
thefinancial institutions. 2/ Data relating to IDBI disbursement of
concessional finance reveals that the Lop 50 districts accountted for about 70*
of this assistance as of December 1979. 3/ This concentration of investment
in certain districts is natural. Only a small number of the districts that
qualify for incentives possess thc potential for icii(ustrial growth in terms of
factors such as the availability of raw materials, infrastructure and
proximity to markets. Entrepreneurs will only locate their uniits in such
areas. Certain other limitations of these incentives for backward area
development will he elaborated on in the concluding chapLer 4, where we shall
provide a critique of the Indian experience with industrial location policy.
1/ NCDRA, 1980, p. 14
2/ NCDBA, Op cit,_p. 15
3/ N.R. Shenoy, and S.K. Guptya, Regional Pattern of IDBT's Assistance,published in IDBI, 1980, p. 278.
-69-
Chapter III
TRENDS IN INDIAN INDUSTRIAL LOCATION
In the last chapter, we described the various policies used by
the Indian Government to influence industrial location and their method of
operation. We have also attempted to throw some light on the effect of
each of these policies, to the extent permitted by data. On the basis of
our analysis, we find that the effectiveness of each of the locational
instruments has varied considerably. What, then has been the overall
impact of these policies on the inter- and intrastate distribution of
industry? An investigation of this issue involves an analysis of the
actual trends in the location of industry. These trends are the result of
both market forces and Governmental policy. The separation of these two
determinants is an analytically complex task, one which is ruled out
because of data constraints. In lieu of this, we shall merely present the
findings relating to the inter and intra-state trends in the distribution
of industry and draw some simple conclusions, which would at least be
useful as a background for more intensive studies to be conducted in a
future research project.
1. Trends in the Inter-State Distribution of Industry
We first examine trends in the inter-state distribution of
industry. The data that we have used comes mainly from the following
sources:
(a) the Annual Survey of Industries (ASI);
(b) statistics on factory labor collected under the
Factories Act, 1948 by the Labor Bureau;
-70-
(c) state income data from Central Statistical
Organisation, Monthly Abstract of Statistics, June
1979; and
(d) state population estimates from Institute of Applied
Manpower Research, Facts Book on Manpower, 1977.
The concepts, tabulation and time-frame utilized in these sources
constrain us in a number of ways.
First, the industrial data only relates to the factory sector -
i.e., units employing more than ten workers if using power or 20 workers
without power. The ASI is conducted in two parts. A Census is conducted
for units employing more than 50 workers with power or 100 workers without
power. The rest of the factory sector is covered on a sample basis.
Thus, the entire so-called "unregistered" sector, consisting of producing
units employing less than ten workers with power and 20 workers without
power, falls outside the ambit of these industrial and labor surveys.
Secondly, the ASI was launched only in 1960. Before 1960, a
"Census of Manufacturing Industries" was conducted annually only for about
half of industry groups into which all establishments were classified. A
"Sample Survey of Manufacturing Industries" covered the entire
manufacturing sector on a yearly basis, but, unfortunately, no state-wise
data were presented. Because of the absence of comprehensive regional
data, we have only analyzed trends since 1960.
Certain problems crop up because of creation of new states and
re-definition of state boundaries. Most of these alterations in
political sub-division occurred before 1960. However, in the
north-eastern region, there have been some changes after 1960. Since the
statistical documents are unclear about the handling of these alterations,
-71-
we have chosen to neglect the union territories and states in
north-eastern India. In any case, this region accounts for a very small
portion of industrial output and employment. The same kind of reasoning
justifies the exclusion of certain other minor states and union
territories.
In the introductory chapter of this paper, we looked at trends in
the levels of industrialization in the states and their shares in value
added and employment in the Indian manufacturing sector during 1961-76.
We tried to explore the differences between state shares in value added
and employment by examining the value added/employment ratios for states
and relating these to the all-India average (Tables 30 and 31). One finds
that, in 1975, value added per worker was higher than average for
Maharashtra, Bihar, Rajasthan, Orissa, Punjab and Haryana and
significantly lower than average for Kerala, Andhra Pradesh and Delhi. If
we look at the period 1961-75 (and, in particular, the decade 1961-71),
there seems to be a trend towards equalization of value added per employee
across states.
Variations in value added per employee across states and over
time are the result of many factors, such as capital intensity of
production, inherent labor productivity (owing to, say, skill levels) or
variations in product rnix of the manufacturing sector. Unless one
examines each of these in depth, it will not be possible to identify the
precise contributory factors to the trends noted above.
Finally, two iindices were computed in order to come to an overall
assessment about trends in state-wise concentration of industry (Table
32). These are Theil'El inequality index and the Hirschman-Herfindahl
index.
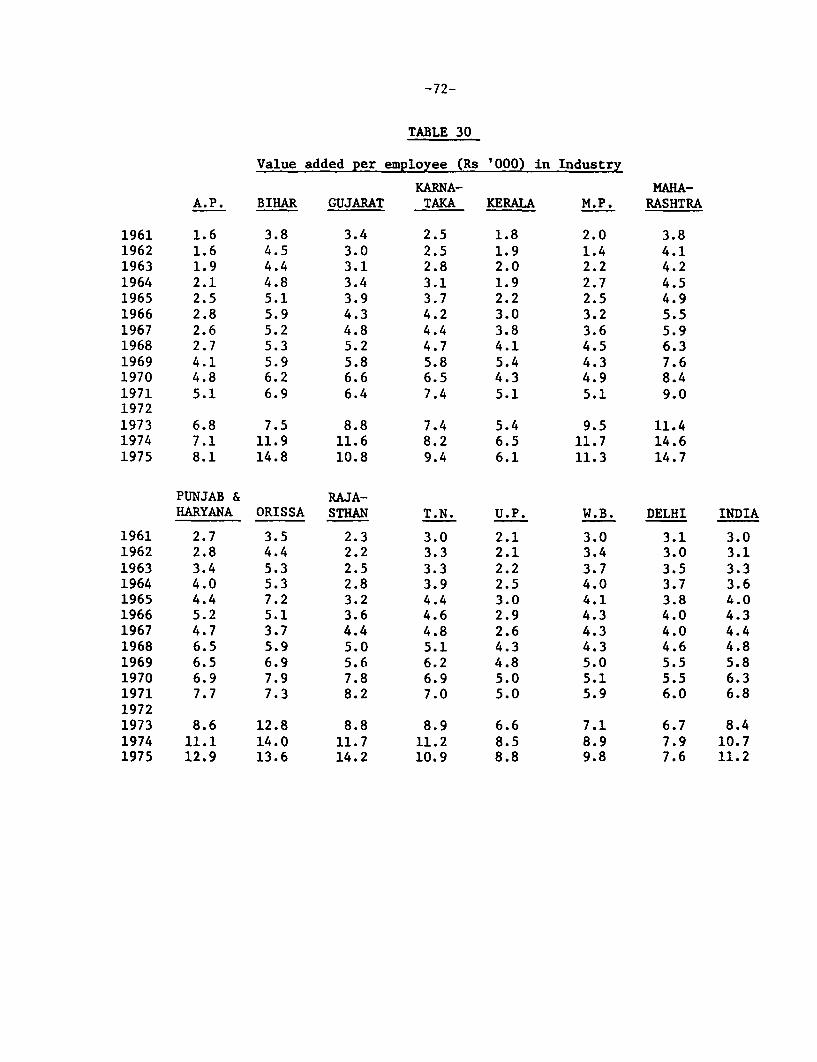
-72-
TABLE 30
Value added per employee (Rs '000) in Industry
KARNA- MAHA-A.P. BIHAR GUJARAT TAKA KERALA M.P. RASHTRA
1961 1.6 3.8 3.4 2.5 1.8 2.0 3.81962 1.6 4.5 3.0 2.5 1.9 1.4 4.11963 1.9 4.4 3.1 2.8 2.0 2.2 4.21964 2.1 4.8 3.4 3.1 1.9 2.7 4.51965 2.5 5.1 3.9 3.7 2.2 2.5 4.91966 2.8 5.9 4.3 4.2 3.0 3.2 5.51967 2.6 5.2 4.8 4.4 3.8 3.6 5.91968 2.7 5.3 5.2 4.7 4.1 4.5 6.31969 4.1 5.9 5.8 5.8 5.4 4.3 7.61970 4.8 6.2 6.6 6.5 4.3 4.9 8.41971 5.1 6.9 6.4 7.4 5.1 5.1 9.019721973 6.8 7.5 8.8 7.4 5.4 9.5 11.41974 7.1 11.9 11.6 8.2 6.5 11.7 14.61975 8.1 14.8 10.8 9.4 6.1 11.3 14.7
PUNJAB & RAJA-HARYANA ORISSA STHAN T.N. U.P. W.B. DELHI INDIA
1961 2.7 3.5 2.3 3.0 2.1 3.0 3.1 3.01962 2.8 4.4 2.2 3.3 2.1 3.4 3.0 3.11963 3.4 5.3 2.5 3.3 2.2 3.7 3.5 3.31964 4.0 5.3 2.8 3.9 2.5 4.0 3.7 3.61965 4.4 7.2 3.2 4.4 3.0 4.1 3.8 4.01966 5.2 5.1 3.6 4.6 2.9 4.3 4.0 4.31967 4.7 3.7 4.4 4.8 2.6 4.3 4.0 4.41968 6.5 5.9 5.0 5.1 4.3 4.3 4.6 4.81969 6.5 6.9 5.6 6.2 4.8 5.0 5.5 5.81970 6.9 7.9 7.8 6.9 5.0 5.1 5.5 6.31971 7.7 7.3 8.2 7.0 5.0 5.9 6.0 6.819721973 8.6 12.8 8.8 8.9 6.6 7.1 6.7 8.41974 11.1 14.0 11.7 11.2 8.5 8.9 7.9 10.71975 12.9 13.6 14.2 10.9 8.8 9.8 7.6 11.2
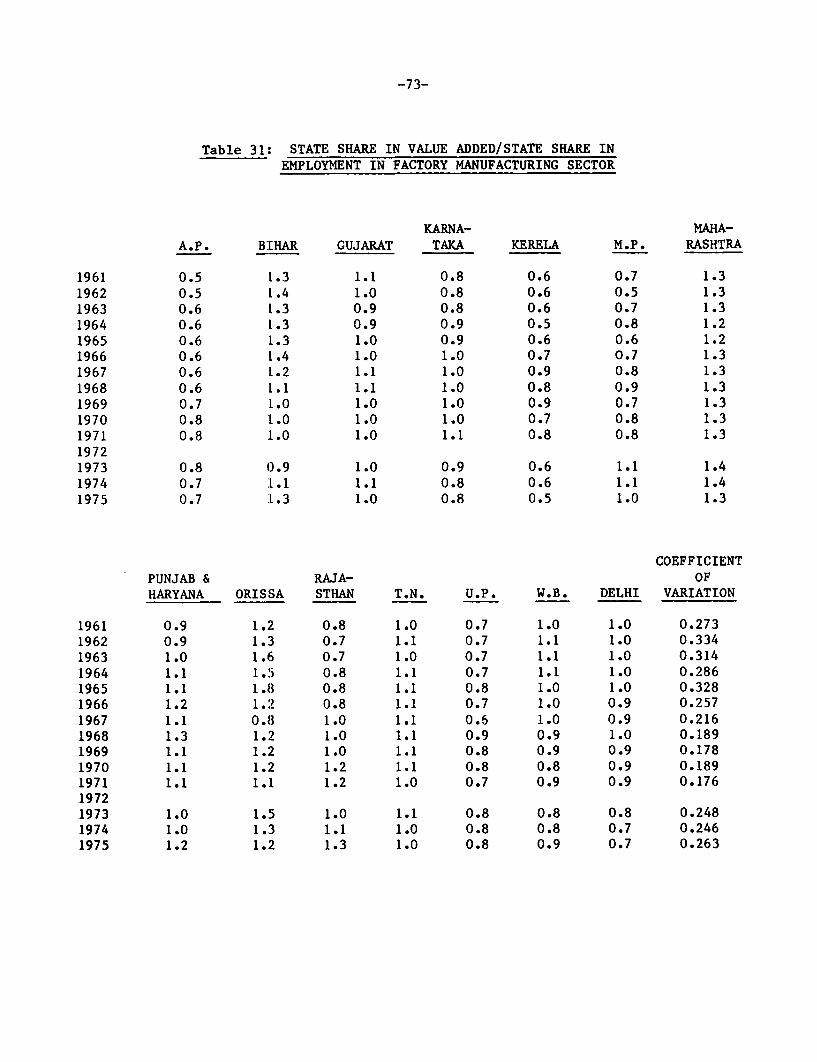
-73-
Table 31: STATE SHARE IN VALUE ADDED/STATE SHARE INEMPLOYMENT IN FACTORY MANUFACTURING SECTOR
KARNA- MAHA-A.P. BIHAR GUJARAT TAKA KERELA M.P. RASHTRA
1961 0.5 1.3 1.1 0.8 0.6 0.7 1.31962 0.5 1.4 1.0 0.8 0.6 0.5 1.31963 0.6 1.3 0.9 0.8 0.6 0.7 1.31964 0.6 1.3 0.9 0.9 0.5 0.8 1.21965 0.6 1.3 1.0 0.9 0.6 0.6 1.21966 0.6 1.4 1.0 1.0 0.7 0.7 1.31967 0.6 1.2 1.1 1.0 0.9 0.8 1.31968 0.6 1.1 1.1 1.0 0.8 0.9 1.31969 0.7 1.0 1.0 1.0 0.9 0.7 1.31970 0.8 1.0 1.0 1.0 0.7 0.8 1.31971 0.8 1.0 1.0 1.1 0.8 0.8 1.319721973 0.8 (.9 1.0 0.9 0.6 1.1 1.41974 0.7 L1.1 1.1 0.8 0.6 1.1 1.41975 0.7 1.3 1.0 0.8 0.5 1.0 1.3
COEFFICIENTPUNJAB & RAJA- OFHARYANA ORISSA STHAN T.N. U.P. W.B. DELHI VARIATION
1961 0.9 1.2 0.8 1.0 0.7 1.0 1.0 0.2731962 0.9 1.3 0.7 1.1 0.7 1.1 1.0 0.3341963 1.0 1.6 0.7 1.0 0.7 1.1 1.0 0.3141964 1.1 1.'5 0.8 1.1 0.7 1.1 1.0 0.2861965 1.1 1.8 0.8 1.1 0.8 1.0 1.0 0.3281966 1.2 1.2 0.8 1.1 0.7 1.0 0.9 0.2571967 1.1 0.83 1.0 1.1 0.6 1.0 0.9 0.2161968 1.3 1.:2 1.0 1.1 0.9 0.9 1.0 0.1891969 1.1 1.:2 1.0 1.1 0.8 0.9 0.9 0.1781970 1.1 1.2 1.2 1.1 0.8 0.8 0.9 0.1891971 1.1 1.1 1.2 1.0 0.7 0.9 0.9 0.17619721973 1.0 1.5 1.0 1.1 0.8 0.8 0.8 0.2481974 1.0 1.3 1.1 1.0 0.8 0.8 0.7 0.2461975 1.2 1.:2 1.3 1.0 0.8 0.9 0.7 0.263
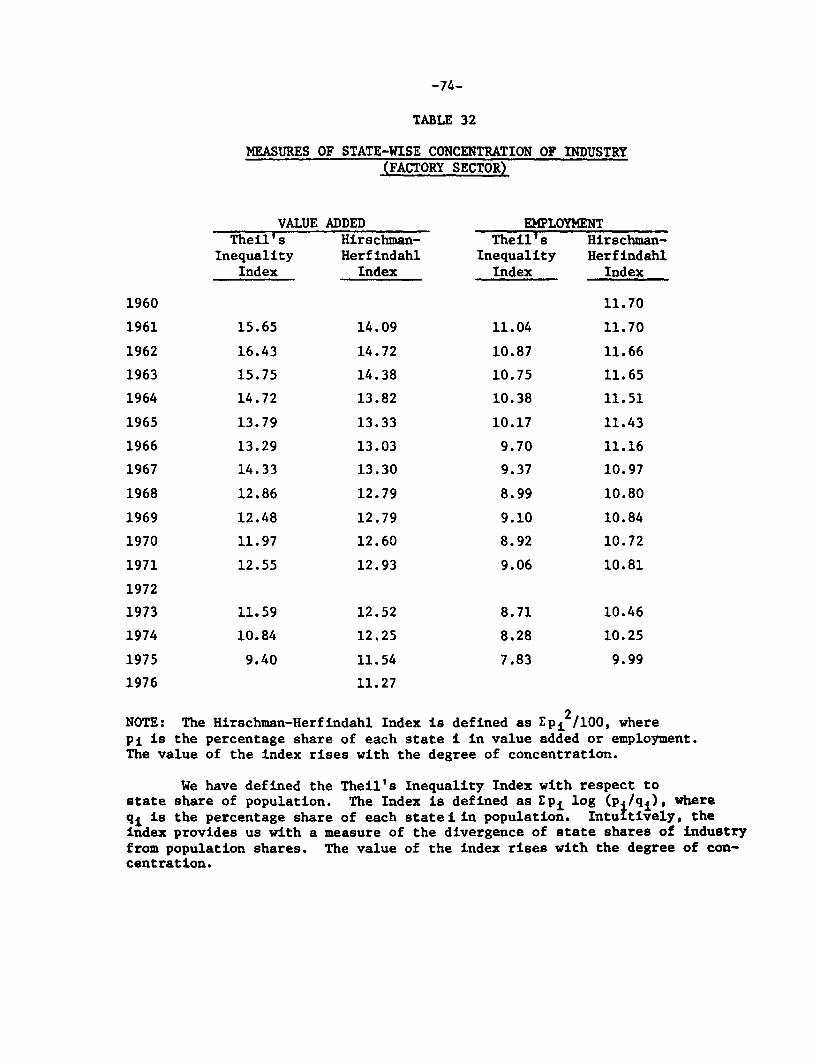
-74-
TABLE 32
MEASURES OF STATE-WISE CONCENTRATION OF INDUSTRY(FACTORY SECTOR)
VALUE ADDED EMPLOYMENTTheil's Hirschman- Theil's Hirschman-
Inequality Herfindahl Inequality HerfindahlIndex Index Index Index
1960 11.70
1961 15.65 14.09 11.04 11.70
1962 16.43 14.72 10.87 11.66
1963 15.75 14.38 10.75 11.65
1964 14.72 13.82 10.38 11.51
1965 13.79 13.33 10.17 11.43
1966 13.29 13.03 9.70 11.16
1967 14.33 13.30 9.37 10.97
1968 12.86 12.79 8.99 10.80
1969 12.48 12.79 9.10 10.84
1970 11.97 12.60 8.92 10.72
1971 12.55 12.93 9.06 10.81
1972
1973 11.59 12.52 8.71 10.46
1974 10.84 12.25 8.28 10.25
1975 9.40 11.54 7.83 9.99
1976 11.27
NOTE: The Hirschman-Herfindahl Index is defined as Ep 2/100, wherepi is the percentage share of each state i in value added or employment.The value of the index rises with the degree of concentration.
We have defined the Theil's Inequality Index with respect tostate share of population. The Index is defined as Epi log (p /qi), whereqi is the percentage share of each statei in population. Intuitively, theindex provides us with a measure of the divergence of state shares of industryfrom population shares. The value of the index rises with the degree of con-centration.
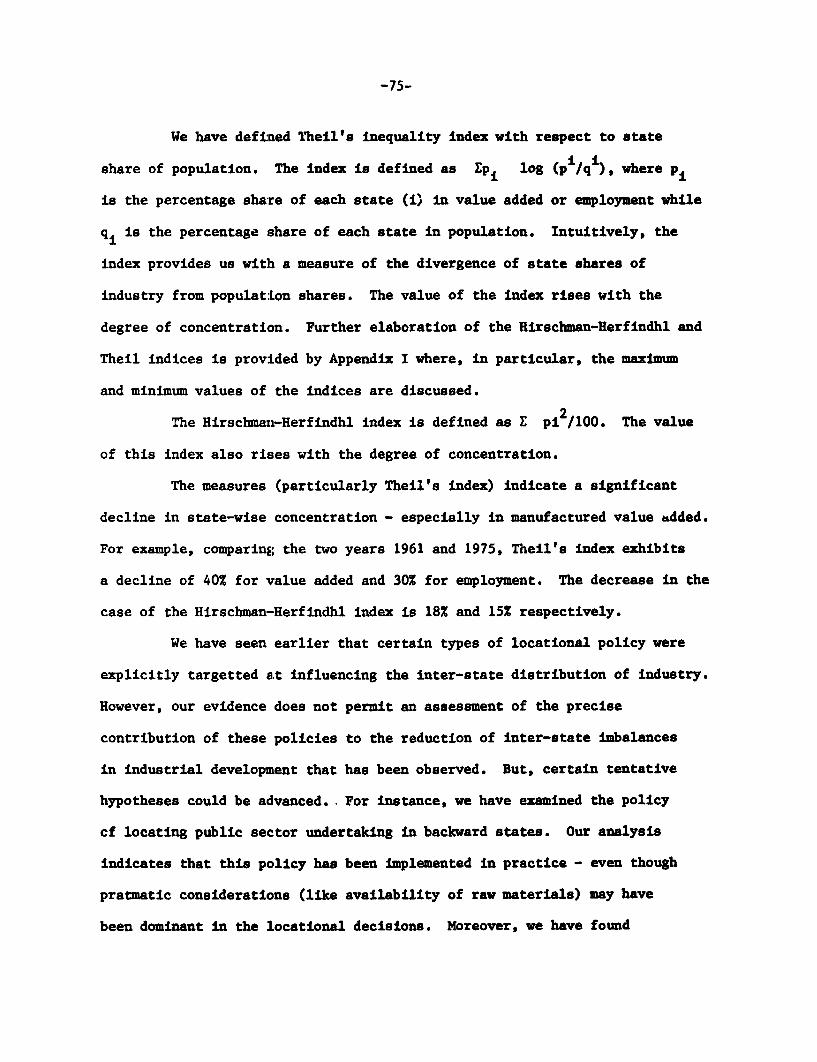
-75-
We have defined Tlheil's inequality index with respect to state
share of population. The index is defined as Ep log (pi/qi), where Pi
is the percentage share of each state (i) in value added or employment while
qi is the percentage share of each state in population. Intuitively, the
index provides us witlh a measure of the divergence of state shares of
industry from populatlon shares. The value of the index rises with the
degree of concentration. Further elaboration of the Hirschman-Herfindhl and
Theil indices is prov:Lded by Appendix I where, in particular, the maximum
and minimim values of the indices are discussed.
The Hirschmani-Herfindhl index is defined as E pi 2/100. The value
of this index also rises with the degree of concentration.
The measures (particularly Theil's index) indicate a significant
decline in state-wise concentration - especially in manufactured value added.
For example, comparing the two years 1961 and 1975, Theil's index exhibits
a decline of 40% for value added and 30% for employment. The decrease in the
case of the Hirschman-Herfindhl index is 18% and 15% respectively.
We have seen earlier that certain types of locational policy were
explicitly targetted at influencing the inter-state distribution of industry.
However, our evidence does not permit an assessment of the precise
contribution of these policies to the reduction of inter-state imbalances
in industrial developm,ent that has been observed. But, certain tentative
hypotheses could be advanced., For instance, we have examined the policy
cf locating public sector undertaking in backward states. Our analysis
indicates that this policy has been implemented in practice - even though
pratmatic considerations (like availability of raw materials) may have
been dominant in the locational decisions. Moreover, we have found
-76-
that these undertakings have had a significant impact on the industrial
development of the backward states. Our examination of the industrial
licensing system is somewhat inconclusive but suggests that, at least
after 1965, increased importance may have been assigned to the objective
of allocating licenses on an equitable basis among the states. Evidence
pertaining to the other major policies directly affecting inter-state
distribution of industry (like state government incentives, distribution
and price controls) does not warrant any conclusions regarding the
direction or magnitude of impact.
There are other types of Governmental policy which have
influenced inter-state distribution of industry even though this has not
been their immediate objective. For instance, considerations of regional
equity are extremely important when deciding on the inte;-state allocation
of tax revenue collected by the Central Government. Similarly, grants are
provided by the Central Government to the states, and the quantum of these
going to different states is also decided on, to a significant extent, by
equity considerations. These revenue transfers and grants are used for
both developmental (infrastructure, agriculture, transport, etc.) and
non-developmental (mainly drought and famine relief) purposes by the
states. To the extent that this expenditure influences economic
development in the states, there would also be a differential impact on
industrial growth through both supply and demand factors. We have not
examined these types of policies in this study since we are concerned only
with direct policies affecting industrial location.
However, in the last analysis, as we have emphasized earlier,
trends in industrial location are the result of both market forces and
Governmental policy. For instance, trends in inter-state variations in

-77-
factor prices, natural endowments and incomes are important explanatory
variables. Unless one studies these complex interdependencies, it would
not be possible to judge the magnitude of contribution of locational
policy to the reduction in inter-state imbalances.
2. Trends in Intra-Regional Distribution of Industry
We now turn Ito trends in the intra-regional distribution of
industry. The data used comes essentially from two sources:
(a) Population Census; and
(b) Labor Bureau Statistics
The Labor Bureau statiistics contains data only for the factory sector
while the population census also includes information for household
industry.
The population censuses of 1961 and 1971 contain information
relating to the population engaged in industry in different classes of
towns, cities and town groups/urban agglomerations categorized in the
following manner. 1/
Class I: Population of 100,000 or more
Class II: Population of 50,000 to 99.999
Class III: Population of 20,000 to 49,999
Class IV: Population of 10,000 to 19,999
Class V: Population of 5,000 to 9,999
Class VI: Population of below 5,000
The distinction between the concepts of "town group" and "urban
agglomeration" used in the 1961 and 1971 censuses is explained in the
notes to Table 33. This distinction obviously poses problems in comparing
1/ Unfortunately, the 1951 census contains this type of classificationonly for total population but not for industrial workers.
-78-
the two censuses. However, a much more serious problem of comparison is
the change in definition of "worker". Put briefly, the change consists of
the dichotomy of persons into "workers" and "non-workers" according to
labor time disposition in 1971, rather than gainful occupation
irrespective of time spent on it in 1961. The measurement of the
work-force engaged in household industry is especially sensitive to this
change in definition because a significant proportion of workers allocate
part of their time to agricultural activities. Moreover, this allocation
of time among different activities is a more important characteristic of
the smaller towns in comparison with the large ones. For these reasons,
one cannot draw strict conclusions regarding changes in the distribution
of industry between different sizes of urban groupings based on a
comparison of the 1961 and 1971 censuses. Furthermore, comparability is
also affected by the fact, that between the two censuses, towns move
between size classes because of population growth. For example, a number
of class III towns in 1961 became class II towns in 1971. Despite these
serious problems, we shall persist with comparisons of the two censuses
because of the absence of alternative data.
Table 33 contains data relating to the distribution of population
and industrial employment (in household and non-household industry) among
different classes of cities and towns in 1961 and 1971. The data is
presented for India as a whole and for the eight most important industrial
states. We have also computed the employment to population shares and the
Theil inequality indices (defined earlier).
The first thing to note is that, as one would expect, relative to
population, employment in household industry tends to be more concentrated
in the smaller classes of towns where the demand of the population for
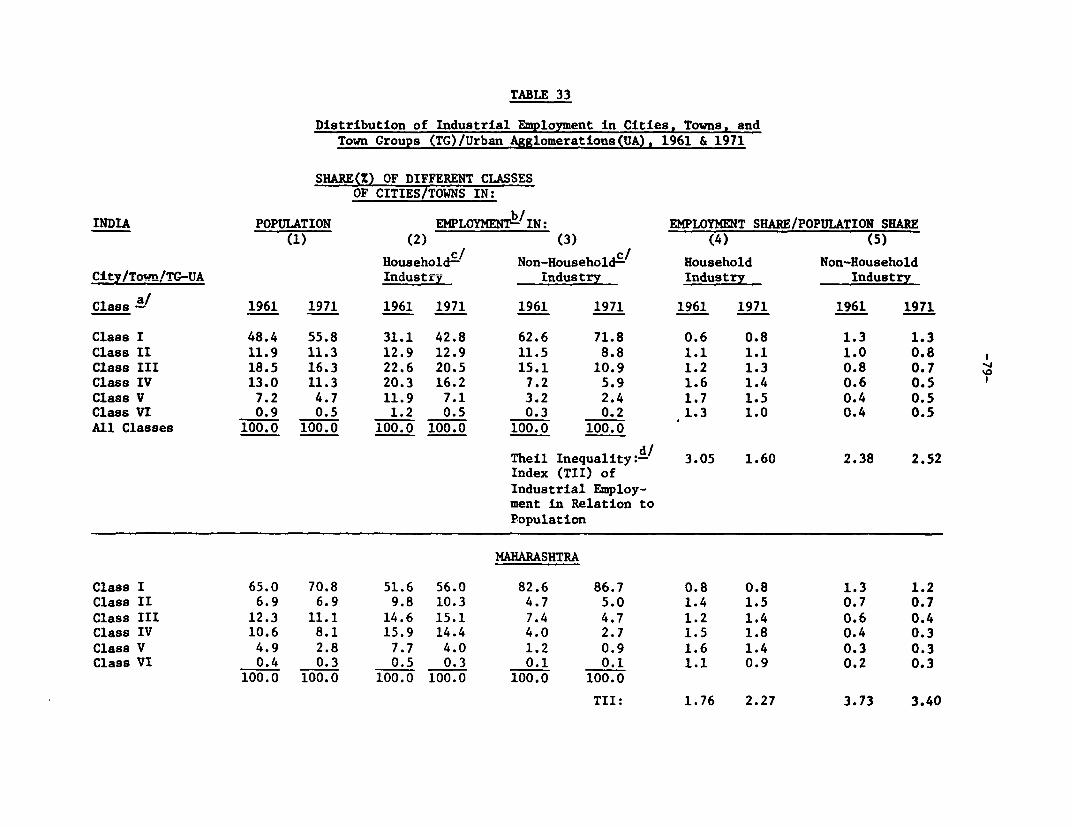
TABLE 33
Distribution of Industrial Employment in Cities, Towns, andTown Groups (TG)/Urban Agglomerations(UA), 1961 & 1971
SHARE(%) OF DIFFERENT CLASSESOF CITIES/TOWNS IN:
INDIA POPULATION EMPLOYMENT- IN: EMPLOYMENT SHARE/POPULATION SHARE(1) (2) (3) (4) (5)
C/ ~~~~C,Household-z Non-Household-/ Household Non-Household
City/Town/TG-UA Industry Industry Industry Industry
Class a/ 1961 1971 1961 1971 1961 1971 1961 1971 1961 1971
Class I 48.4 55.8 31.1 42.8 62.6 71.8 0.6 0.8 1.3 1.3Class II 11.9 11.3 12.9 12.9 11.5 8.8 1.1 1.1 1.0 0.8 1Class III 18.5 16.3 22.6 20.5 15.1 10.9 1.2 1.3 0.8 0.7 %Class IV 13.0 11.3 20.3 16.2 7.2 5.9 1.6 1.4 0.6 0.5 1Class V 7.2 4.7 11.9 7.1 3.2 2.4 1.7 1.5 0.4 0.5Class VI 0.9 0.5 1.2 0.5 0.3 0.2 1.3 1.0 0.4 0.5All Classes 100.0 100.0 100.0 100.0 100.0 100.0
Theil Inequality:- 3.05 1.60 2.38 2.52Index (TII) ofIndustrial Employ-ment in Relation toPopulation
MAHARASHTRA
Class I 65.0 70.8 51.6 56.0 82.6 86.7 0.8 0.8 1.3 1.2Class II 6.9 6.9 9.8 10.3 4.7 5.0 1.4 1.5 0.7 0.7Class III 12.3 11.1 14.6 15.1 7.4 4.7 1.2 1.4 0.6 0.4Class IV 10.6 8.1 15.9 14.4 4.0 2.7 1.5 1.8 0.4 0.3Class V 4.9 2.8 7.7 4.0 1.2 0.9 1.6 1.4 0.3 0.3Class VI 0.4 0.3 0.5 0.3 0.1 0.1 1.1 0.9 0.2 0.3
100.0 100.0 100.O 100.0 100.0 100.0
TII: 1.76 2.27 3.73 3.40
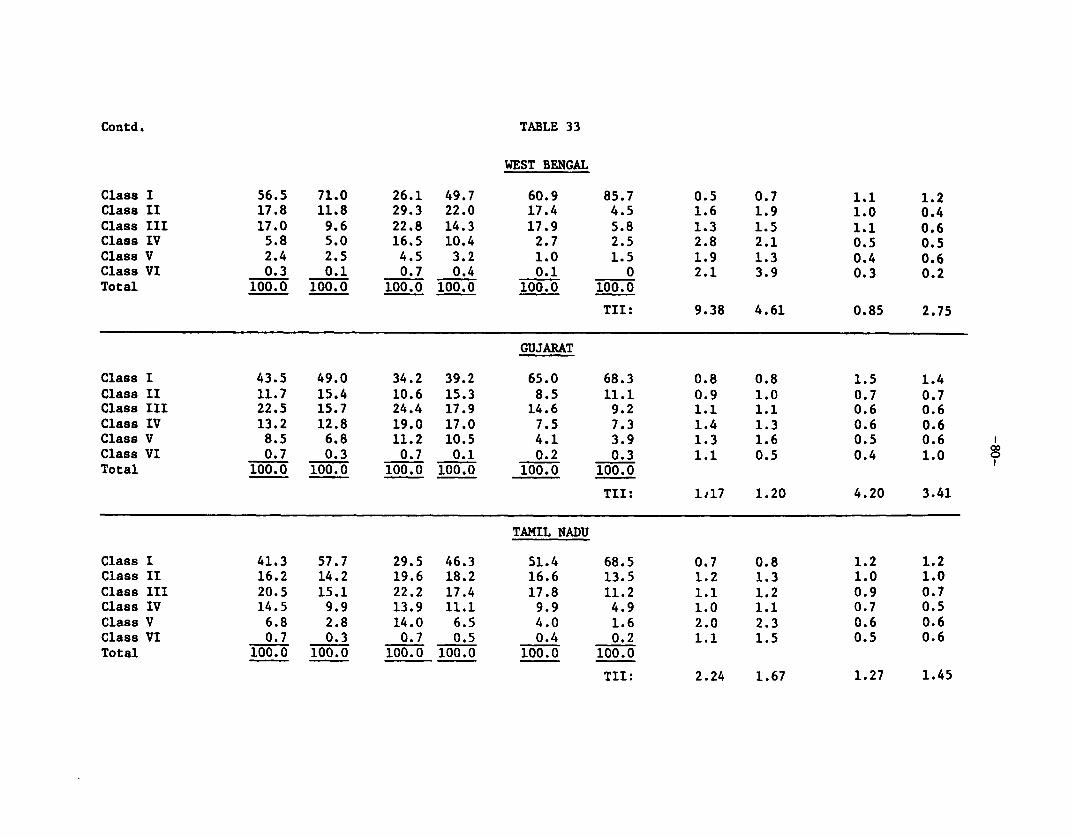
Contd. TABLE 33
WEST BENGAL
Class I 56.5 71.0 26.1 49.7 60.9 85.7 0.5 0.7 1.1 1.2
Class II 17.8 11.8 29.3 22.0 17.4 4.5 1.6 1.9 1.0 0.4
Class III 17.0 9.6 22.8 14.3 17.9 5.8 1.3 1.5 1.1 0.6
Class IV 5.8 5.0 16.5 10.4 2.7 2.5 2.8 2.1 0.5 0.5
Class V 2.4 2.5 4.5 3.2 1.0 1.5 1.9 1.3 0.4 0.6
Class VI 0.3 0.1 0.7 0.4 0.1 0 2.1 3.9 0.3 0.2
Total 100.0 100.0 100.0 100.0 100.0 100.0
TII: 9.38 4.61 0.85 2.75
GUJARAT
Class I 43.5 49.0 34.2 39.2 65.0 68.3 0.8 0.8 1.5 1.4
Class II 11.7 15.4 10.6 15.3 8.5 11.1 0.9 1.0 0.7 0.7
Class III 22.5 15.7 24.4 17.9 14.6 9.2 1.1 1.1 0.6 0.6
Class IV 13.2 12.8 19.0 17.0 7.5 7.3 1.4 1.3 0.6 0.6
Class V 8.5 6.8 11.2 10.5 4.1 3.9 1.3 1.6 0.5 0.6
Class VI 0.7 0.3 0.7 0.1 0.2 0.3 1.1 0.5 0.4 1.0
Total 100.0 100.0 100.0 100.0 100.0 100.0
TII: 1j17 1.20 4.20 3.41
TAMIL NADU
Class I 41.3 57.7 29.5 46.3 51.4 68.5 0.7 0.8 1.2 1.2
Class II 16.2 14.2 19.6 18.2 16.6 13.5 1.2 1.3 1.0 1.0
Class III 20.5 15.1 22.2 17.4 17.8 11.2 1.1 1.2 0.9 0.7
Class IV 14.5 9.9 13.9 11.1 9.9 4.9 1.0 1.1 0.7 0.5
Class V 6.8 2.8 14.0 6.5 4.0 1.6 2.0 2.3 0.6 0.6
Class VI 0.7 0.3 0.7 0.5 0.4 0.2 1.1 1.5 0.5 0.6
Total 100.0 100.0 100.0 100.0 100.0 100.0
TII: 2.24 1.67 1.27 1.45
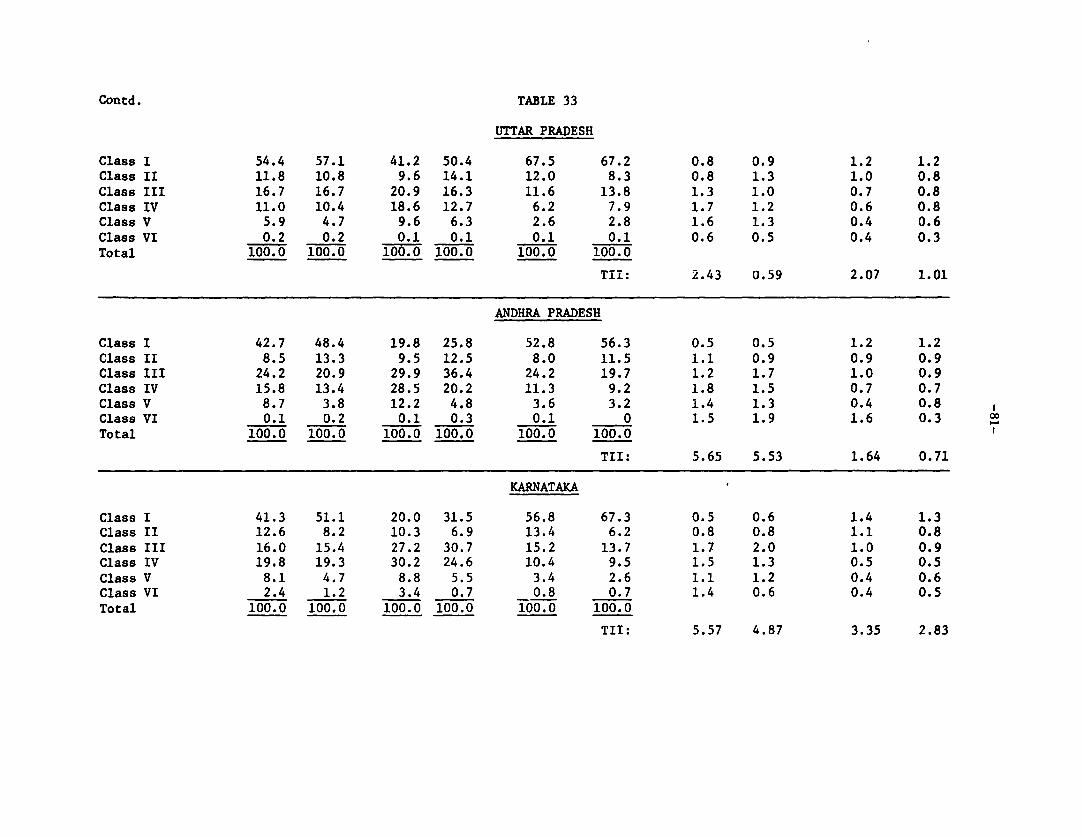
Contd. TABLE 33
UTTAR PRADESH
Class I 54.4 57.1 41.2 50.4 67.5 67.2 0.8 0.9 1.2 1.2Class II 11.8 10.8 9.6 14.1 12.0 8.3 0.8 1.3 1.0 0.8Class III 16.7 16.7 20.9 16.3 11.6 13.8 1.3 1.0 0.7 0.8Class IV 11.0 10.4 18.6 12.7 6.2 7.9 1.7 1.2 0.6 0.8Class V 5.9 4.7 9.6 6.3 2.6 2.8 1.6 1.3 0.4 0.6Class VI 0.2 0.2 0.1 0.1 0.1 0.1 0.6 0.5 0.4 0.3Total 100.0 100.0 100.0 100.0 100.0 100.0
TII: 2.43 0.59 2.07 1.01
ANDHRA PRADESH
Class I 42.7 48.4 19.8 25.8 52.8 56.3 0.5 0.5 1.2 1.2Class II 8.5 13.3 9.5 12.5 8.0 11.5 1.1 0.9 0.9 0.9Class III 24.2 20.9 29.9 36.4 24.2 19.7 1.2 1.7 1.0 0.9Class IV 15.8 13.4 28.5 20.2 11.3 9.2 1.8 1.5 0.7 0.7Class V 8.7 3.8 12.2 4.8 3.6 3.2 1.4 1.3 0.4 0.8Class VI 0.1 0.2 0.1 0.3 0.1 0 1.5 1.9 1.6 0.3Total 100.0 100.0 100.0 100.0 100.0 100.0
TII: 5.65 5.53 1.64 0.71
KARNATAKA
Class I 41.3 51.1 20.0 31.5 56.8 67.3 0.5 0.6 1.4 1.3Class II 12.6 8.2 10.3 6.9 13.4 6.2 0.8 0.8 1.1 0.8Class III 16.0 15.4 27.2 30.7 15.2 13.7 1.7 2.0 1.0 0.9Class IV 19.8 19.3 30.2 24.6 10.4 9.5 1.5 1.3 0.5 0.5Class V 8.1 4.7 8.8 5.5 3.4 2.6 1.1 1.2 0.4 0.6Class VI 2.4 1.2 3.4 0.7 0.8 0.7 1.4 0.6 0.4 0.5Total 100.0 1.0 100.0 100.0 100.0 100.0 100.0
TII: 5.57 4.87 3.35 2.83
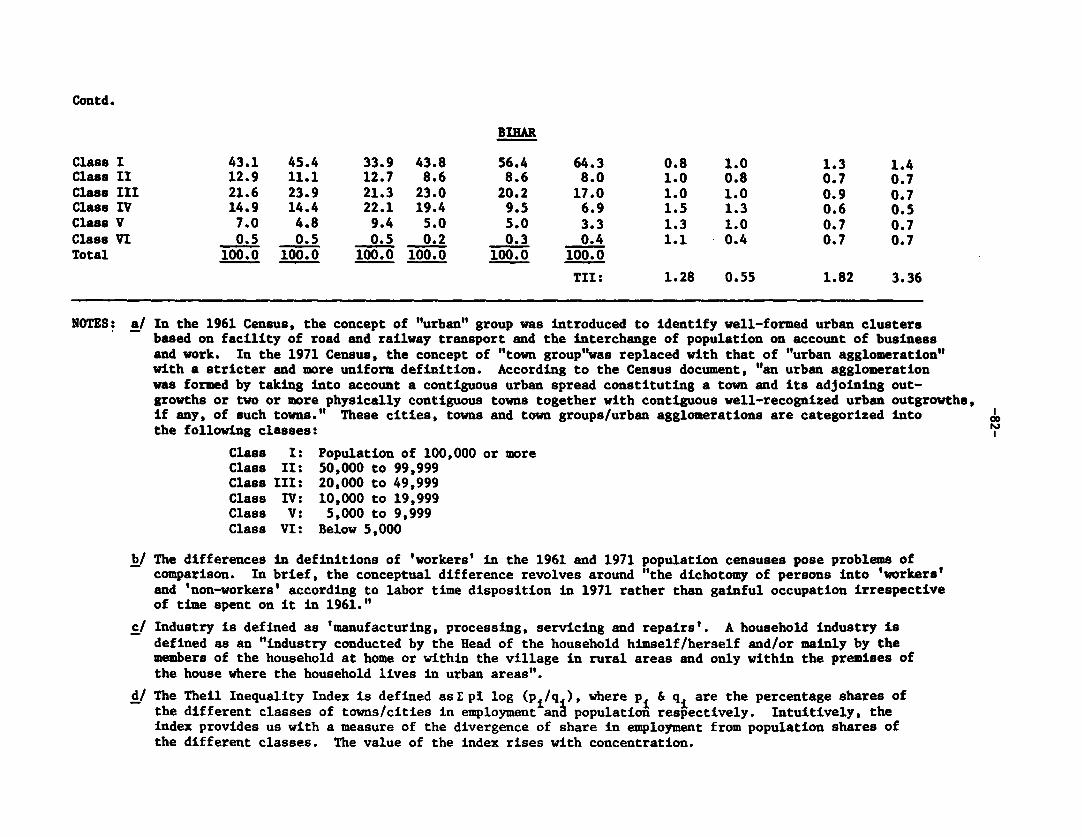
Contd.
BIHAR
Class I 43.1 45.4 33.9 43.8 56.4 64.3 0.8 1.0 1.3 1.4
Class II 12.9 11.1 12.7 8.6 8.6 8.0 1.0 0.8 0.7 0.7
Class III 21.6 23.9 21.3 23.0 20.2 17.0 1.0 1.0 0.9 0.7
Class IV 14.9 14.4 22.1 19.4 9.5 6.9 1.5 1.3 0.6 0.5
Class V 7.0 4.8 9.4 5.0 5.0 3.3 1.3 1.0 0.7 0.7
Class VI 0.5 0.5 0.5 0.2 0.3 0.4 1.1 0.4 0.7 0.7
Total 100.0 100.0 100.0 100.0 100.0 100.0
TII: 1.28 0.55 1.82 3.36
NOTES: a/ In the 1961 Census, the concept of "urban" group was introduced to identify well-formed urban clusters
based on facility of road and railway transport and the interchange of population on account of business
and work. In the 1971 Census, the concept of "town group"was replaced with that of "urban agglomeration"
with a stricter and more uniform definition. According to the Census document, "an urban agglomeration
was formed by taking into account a contiguous urban spread constituting a town and its adjoining out-
growths or two or more physically contiguous towns together with contiguous well-recognized urban outgrowths,
if any, of such towns." These cities, towns and town groups/urban agglomerations are categorized into O
the following classes:
Class I: Population of 100,000 or moreClass II: 50,000 to 99,999Class III: 20,000 to 49,999Class IV: 10,000 to 19,999Class V: 5,000 to 9,999Class VI: Below 5,000
b/ The differences in definitions of 'workers' in the 1961 and 1971 population censuses pose problems of
comparison. In brief, the conceptual difference revolves around "the dichotomy of persons into 'workers'
and 'non-workers' according to labor time disposition in 1971 rather than gainful occupation irrespective
of time spent on it in 1961."
c/ Industry is defined as 'manufacturing, processing, servicing and repairs'. A household industry is
defined as an "industry conducted by the Head of the household himself/herself and/or mainly by the
members of the household at home or within the village in rural areas and only within the premises of
the house where the household lives in urban areas".
d/ The Theil Inequality Index is defined as E pi log (pi/q ), where pi & qi are the percentage shares of
the different classes of towns/cities in employment ana population respectively. Intuitively, the
index provides us with a measure of the divergence of share in employment from population shares of
the different classes. The value of the index rises with concentration.
-83-
small quantities of simlple manufactured products are met by household
production units. 1/ The reverse is true of non-household industry where
economies of scale and t:echnological and infrastructural requirements
dictate location in the larger classes of cities and towns.
Comparing 1961 and 1971, we find markedly different trends in the
distribution of employment in household and non-household industry. For
household industry, the Theil inequality index for India as a whole
declines by almost 50% from 3.1 in 1961 to 1.6 in 1971. This reflects a
reduction of concentration (relative to population) of household industry
in the smaller classes of towns. Part of the reason for this may be
spurious, and may be connected with changes in the definitions of the work
force. As we have stated earlier, in smaller towns there is a greater
intermingling of industrial and other activities; in the 1971 Census,
their inclusion in the work force depends on their allocation of time,
whereas in the 1961 Census, gainful occupation (irrespective of time
disposition) is used to define "workers." Thus, there may be a downward
bias in the estimate of household industry workers in the smaller classes
of towns in the 1971 Census compared to the 1961. Apart from this
definitional reason, the phenomenon of household industry moving away the
smaller towns is a natural concomitant of the development process. As the
level of technology in household units improves, economies of scale become
more important and there is a shift to larger towns.
1/ In 1971, about 50% of household industry workers were operating intowns falling in classes II, III and IV. These towns accounted forabout 40% of the population which was relatively evenly distributedamong the three classes.
-84-
The Theil inequality index has also fallen significantly between
1961 and 1971 in West Bengal, Tamil Nadu, U.P., Karnataka and Bihar. It
has gone up for Maharashtra and remained roughly the same for Gujarat and
A.P.
For non-household industry, there is hardly any change in the
Theil inequality index; the index was 2.4 in 1961 and 2.5 in 1971. Thus,
between 1961 and 1971, industrial policy has not resulted in any
substantial shift of industry away from large cities and towns to the
smaller ones. However, it must be pointed out that this conclusion only
holds in the aggregate because the pattern varies for different states.
Between 1961 and 1971, the Theil inequality index rose significantly for
West Bengal and Bihar, fell considerably in Maharashtra, Gujarat, Uttar
Pradesh, Andhra Pradesh and Karnataka and remained approximately the same
in Tamil Nadu.
The analysis that we have been conducting thus far of
intra-regional industrial distribution ends at 1971, which is the year
when the last population census was conducted. However, as we have seen
earlier, certain important policies were introduced after 1970-71 to
promote the industrial development of backward areas. Fortunately,
district-wise data relating to factory employment exists for some states.
This data can be utilized to investigate whether these policies have had
any impact on industrial employment in the backward districts. The
different schemes described earlier adopted different definitions for
identifying the backward districts. In computing trends in the share of
backward districts in total factory employment, we have chosen those
qualifying for concessional finance, since these have been defined in the
broadest sense and encompass the set of districts eligible for the other
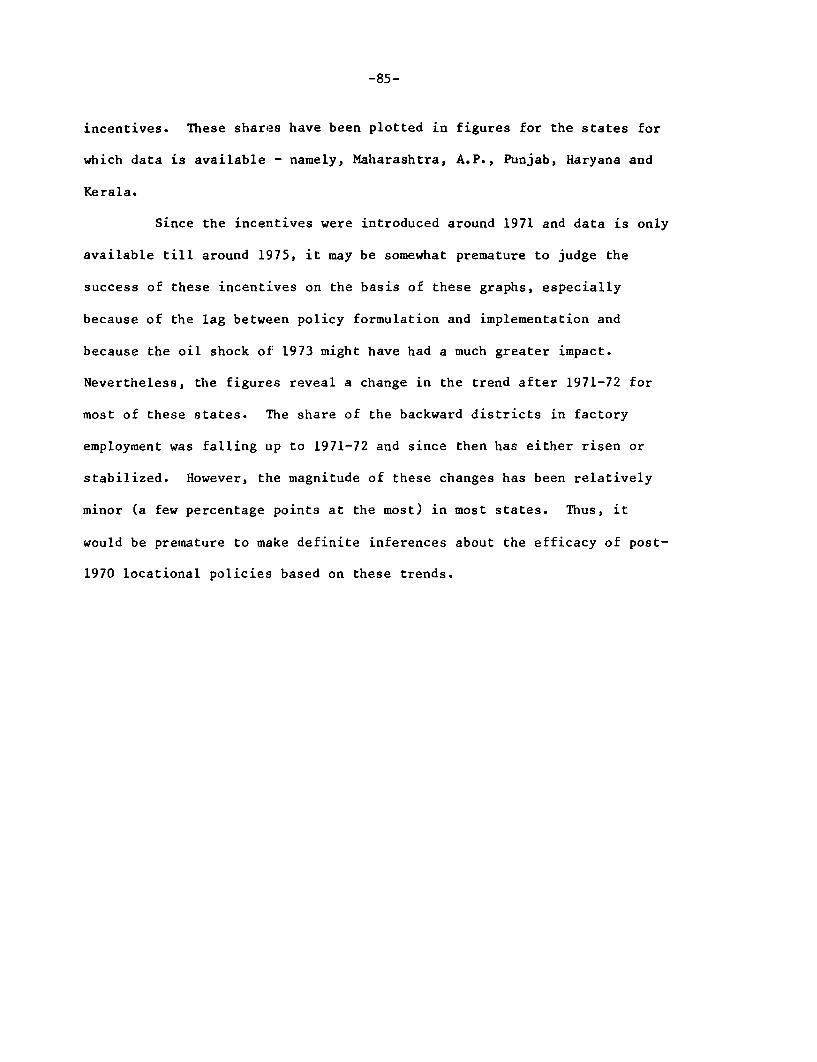
-85-
incentives. These shares have been plotted in figures for the states for
which data is available - namely, Maharashtra, A.P., Punjab, Haryana and
Kerala.
Since the incentives were introduced around 1971 and data is only
available till around 1975, it may be somewhat premature to judge the
success of these incentives on the basis of these graphs, especially
because of the lag between policy formulation and implementation and
because the oil shock of 1973 might have had a much greater impact.
Nevertheless, the figures reveal a change in the trend after 1971-72 for
most of these states. Ihe share of the backward districts in factory
employment was falling up to 1971-72 and since then has either risen or
stabilized. However, the magnitude of these changes has been relatively
minor (a few percentage points at the most) in most states. Thus, it
would be premature to make definite inferences about the efficacy of post-
1970 locational policies based on these trends.
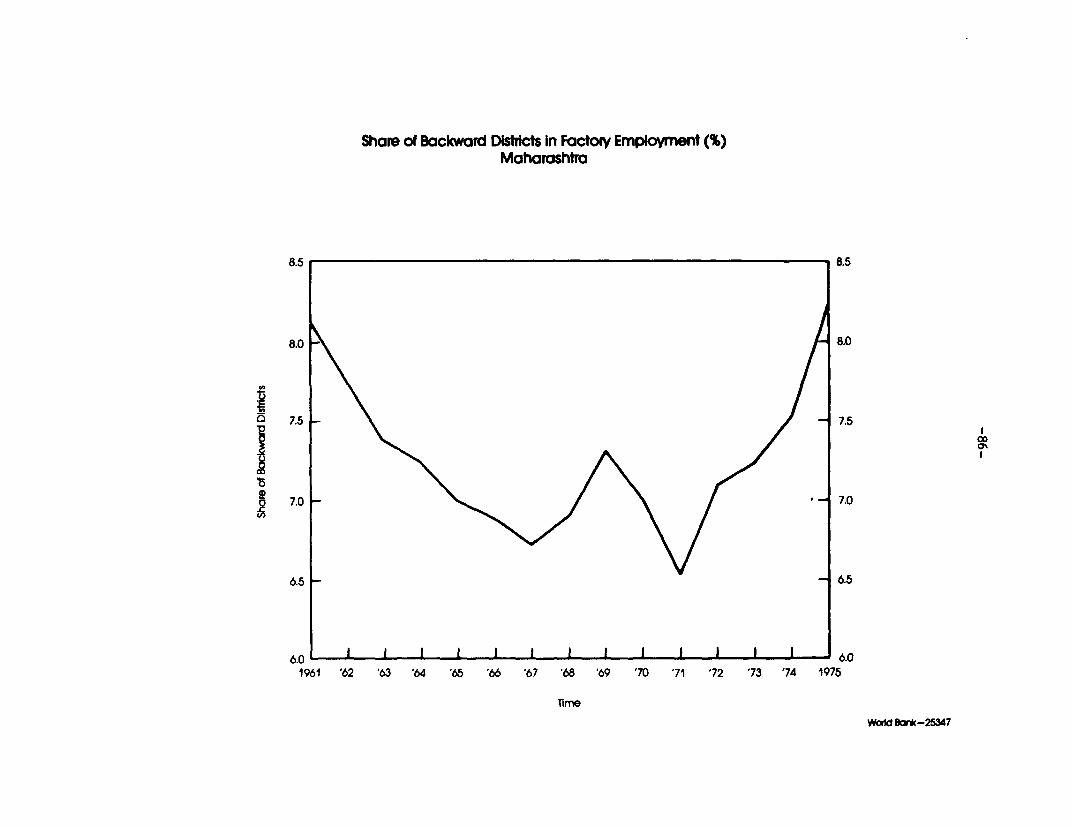
Share of Backward Disticts In Factory Employment (%)Maharashtra
8.5 85
8.0 8.0
7.5 ~~~~~~~~~~~~~~~~~~~~~~~~~~~~~~7.51g / ' 1 1XLD 7.0 ' 7.0
6.5 6.5
6.0 I 6.01961 '62 '63 '64 '65 '66 '67 '68 '69 '70 '71 '72 '73 '74 1975
Time
Woild Bcx*-25347

Share of Backward Districts In Factory Employment (%)Haryana
17.0 17.0
16.0 16.0
15.0 15.0
14.0 14.0
13.0 I I l l l 13.01965 '6 '67 68 '69 '70 '71 '72 '73 '74 '75 1976
Tir8e
'1dd SOM-25M4

Share of Backward Districts In Factory Employment (%)Punjab
15.0 15.0
14.0 - 14.0
13.0 13.0
12.0 12.0
11.0 11.0
10.0 109.
9.0 9.0
8.0 I 8.01964 '65 '66 '67 ' '69 '70 '71 '72 '73 '74 '75 1976
Wold Bank-25349
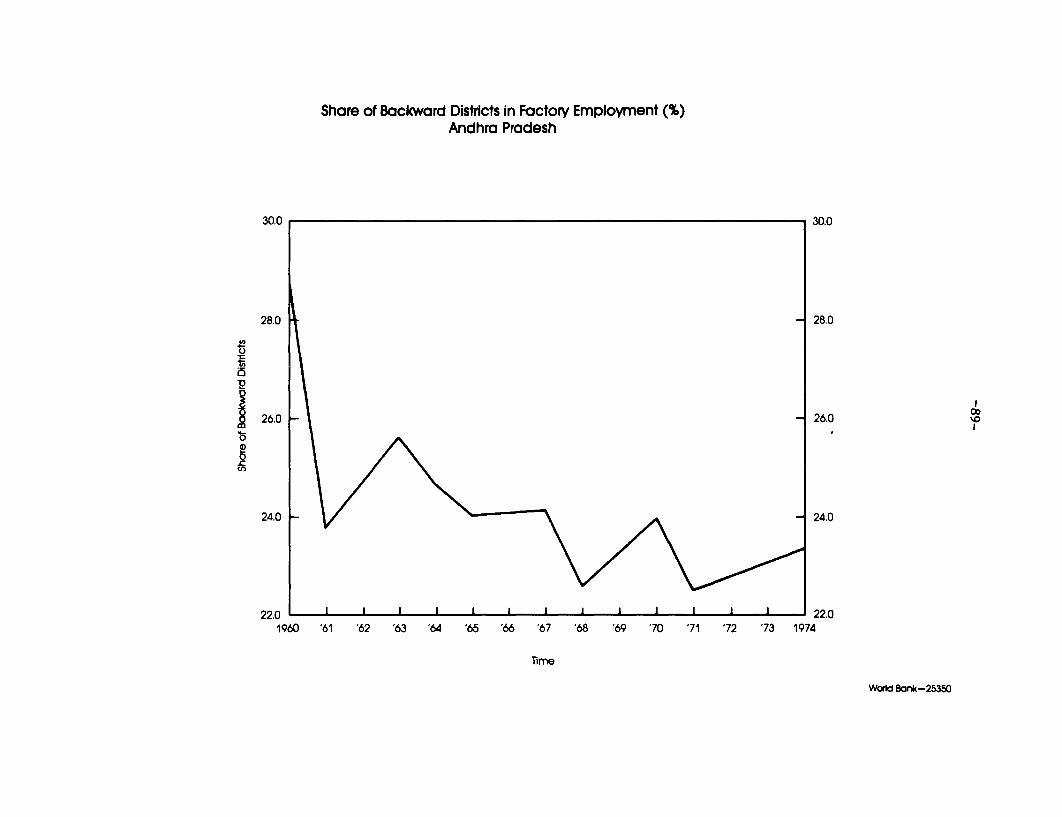
Share of Backward Districts in Factory Employment (%)Andhra Pradesh
30.0 130.0
28.0 28.0
26.0 26.0
24.0 24.0
22.0 22.01960 '61 '62 '63 '64 '65 '66 '67 '68 '69 '70 '71 '72 '73 1974
Time
Worid Bar*-25350
Share of Backward Districts In Factory Employment (%)Kerola
30.0 30.0
29.0 29.0
28.0 28.0
> 27.0 27.0
26.0 - 26.0
25.0 I I l 25.01963 '64 '65 '66 '67 '68 '69 70 '71 '72 '73 1974
Tine
fkdd Bon*-253S1

-91-
Chapter IV
AN OVERALL ASSESSMENT OF INDUSTRIAL LOCATION POLICY
In Chapter II, we examined the operation of the various types of
policies that have been pursued in India to directly influence industrial
location. Thereafter, Chapter III was devoted to an exploration of
statistical trends in the spatial distribution of industry that have
emerged as a result of market forces and the working of these policies.
In this concluding Chapter, we make an overall evaluation of industrial
location policy, which involves probing into the justifications and
rationale of these policies. It appears that these fundamental issues
have not been adequately sorted out by the policy makers. As a result,
critical deficiencies have emerged in the context of locational policies
that have been pursued so far, many of which have already been pointed out
in Chapter II.
1. Rationale of Industrial Location Policy
As we saw in Chapters I and III, there have been marked regional
disparities in industrial development in India. These disparities have
taken the form of sharp inter-state differences in industrial development
as well as the concentration of industry in certain metropolitan areas.
Now why should the Government take any remedial action relating
to these disparities? The answers can be grouped into two broad
categories:
i. the disparities are a result of inefficient resource
allocation and, in a dynamic context, will hinder further
industrial and economic growth; and
-92-
ii. these disparities are inequitable and therefore, in the
interest of social justice, should be curbed.
Let us examine each of these in detail.
(i) Resource Allocation and Growth
The location of industries is determined by a variety of
factors. On the supply side, the important ones are the availability of
raw materials, infrastructure (especially power and transport) and labor
(both skilled and unskilled). On the demand side, the crucial factor is
the size of the market for the commodity and its proximity to the
production site. We will not elucidate on the various theories of
location which have been developed because these are well known. However,
the crucial point to recognize is that it would be naive to expect
regionally balanced inudstrial growth in an economy. In the first
instance, natural resources are unevenly distributed and therefore,
industries utilizing these will tend to develop in an uneven fashion. The
tendency for industries to concentrate in large towns and cities can also
be easily explained in terms of economies of scale and agglomeration
economies. Thus it is natural to expect concentration of industry in
certain regions and metropolitan areas.
But, having said this, it must be recognized that there are
certain factors that could lead to this concentration exceeding "optimal"
levels. This may result in an inefficient resource allocation with
harmful implications of growth. Now, what are these factors?
A basic requirement for industrial growth is the availability of
infrastructure (power, water, transport, communications, etc.). The
natural economies of scale that characterize infrastructure sectors have
meant that these are operated by the public sector in most countries. The
-93-
Governments must ensure that the provision of infrastructure in every
location is in keeping with the current economic levels of different
regions and their growth prospects. This requires, on the one hand,
timely and flexible responses to regional requirements and careful
long-term planning on the other.
There are good reasons to believe that the provision of
infrastructure in India has not fulfilled these requirements. First, the
decision to undertake infrastructure investment has been more frequently
based on political judgment than sound economic analysis. Second,
resources for infrastructure investment are frequently supplied from other
than the beneficiaries; in the form of Central or State government grants.
The absence of a cost recovery system allows deviation of supply from
demand.
Apart from faulty allocation of infrastructural investment, there
are certain other factors that may lead to distortions in the location of
industries. First, there are certain externalities which private
entrepreneurs do not incorporate in their investment decisions. For
example, pollution and congestion that arise from setting up industrial
units in cities are social costs which entrepreneurs neglect. Thus, the
resulting concentration of industry in cities is inoptimal from a social
viewpoint because of tlhe divergence between private and social costs.
However, the introduction of measures to eliminate such externalities do
not necessarily lead to a reduction in concentration. It may, as Tolley
(1974) demonstrated, lead a big city to further expansion. Second, it is
argued that certain regions and metropolitan areas possess industrial
potential but entrepreneurs are not willing to invest there because of
high risk aversion on their part.
-94-
The extent to which these factors are important in the Indian
economy should be carefully studied before corrective policies are
undertaken. Unfortunately, there is a gross deficiency of research in
this important area and policies have been initiated without a sound
empirical base. In particular, it is surprising that there are no
satisfactory published studies which compare the industrial potential of
different sizes of cities and towns, and assess whether the provision of
physical and social infrastructure is in keeping with these
potentialities. 1/ To be sure, there are numerous industrial potential
surveys of towns, cities and regions 2/; but these tend to be mere
identification of possible industries that could be established. The
surveys are non-analytical in character and cannot be used as a basis for
making decisions regarding the precise allocation of scarce budgetary
resources for development of infrastructure in different cities and
towns.
Granting that the existing locational pattern of industry is
inoptimal because of the various factors outlined earlier, the question
arises as to the best policies for rectifying this. The best policies are
clearly those which tackle the root of the problem. As far as the
distribution of infrastructure is concerned, certain regions and
metropolitan areas should be identified where there is significant
industrial potential but which suffer from deficiencies in
1/ A few isolated studies do exist, for example, Kulkarni & Kulkarni(1968) and Ministry of Works& Housing (1977). However, these aremarred by serious lacunae. To illustrate, both the reports justreferred to concentrate on infrastructure provision and do not relateit to industrial potential.
2/ See, for example, I.D.B.I. et al. (1972), F.I.C.C.I (1977).
-95-
infrastructure. Adequate physical and social infrastructure should then
be provided to these areas. The user-charges for public services in
cities should be raisecl to reflect their true costs. This will not
necessarily reduce or increase in-migration to large cities. User-charges
are desirable not only as a way of rationing demand for services but also
for checking whether investments are justified based on revenues and costs
of increments in infrastructure. Further, the prices that industries in
large cities have to pay for the utilization of infrastructure should be
raised to incorporate externalities like pollution costs. From the
viewpoint of efficiency in the allocation of resources, the best set of
measures to correct inefficient locational distribution of industries
operates via readjustments in infrastructural investment and the prices
charged for their utilization. Direct industrial location policies such
as licencing and input rationing are poor substitutes for these measures.
However, if some of the latter are not workable (for example, large
increases in public transportation fares are often politically
infeasible), then, as a second-best solution, one may have to resort to
industrial location policies. However, even here, the choice of
instruments must be devised carefully. In particular, it would be
advisable to operate through incentives and disincentives rather than
through controls. This is because it is possible to fine tune the former
according to the extent of excess concentration of industry. For example,
taxation could be used as a substitute for increases in the prices charged
for the utilization of infrastructure. Controls are, by nature, crude
devices and also result in large discretionary powers being granted to
inflexible bureaucracies.
-96-
Industrial location policies operating via incentives would
probably also have to be utilized to induce entrepreneurs to invest in new
areas that have just been provided with the necessary infrastructure.
There is always a natural reluctance on the part of industrialists to
venture into new regions even though these may be profitable. Besides, it
takes some time for these enterprises to overcome certain initial problems
that arise from the newness of the region. Thus, analogous to the
"infant" industry argument in the theory of international trade, these
industries may have to be subsidized to some extent to get over these
initial problems. However, this should be done only for a limited period
and gradually phased out, otherwise the infants will never grow into
adults.
(ii) Equity
The other argument cited for industrial dispersal is that
regional "imbalances" in economic growth are inequitable. By influencing
the location of industries, the Government seeks to correct these
"imbalances" and thus promote a more equitable pattern of economic growth.
Two basic issues can be raised here. The first relates to the
basis for characterizing regional "imbalances" as inequitable. The second
is whether industrial location policies are the right instruments for
balanced regional growth. Let us take these issues in turn.
In the world economy today, there are marked differences between
the developed and less developed countries. The reasons for the evolution
of this international economic order are complex. Factor endowments,
technology, trade, entrepreneurial motivation, the role of the state and
good fortune have all played their roles. The same factors can also be
expected to operate within an individual economy. Thus, in all economies,

-97-
areas displaying rapid growth co-exist with those undergoing stagnation
and retardation. In the international economy, there are all sorts of
barriers to international migration so that one could decry the sharp
"north-south" division as inequitable to the extent that low income
populations are deprived of the opportunity of bettering themselves by
migrating. However, in an individual economy with free mobility, such an
argument is untenable. But, in the Indian context, strong sociological
bonds - resulting from cultural and ethnic homogeneity - tie the
inhabitants of individual states together. This inhibits the process of
inter-state migration as; an automatic mechanism for equalizing state
incomes. Thus, there is; something to be said for the equity argument at
the inter-state level. However, at the intra-state level, the relative
absence of obstacles to population migration from depressed to
comparatively prosperous regions weakens substantially the case for direct
state intervention to promote development in depressed geographical areas
based on equity considerations.
Now assuming that some corrective measures have to be adopted to
reduce these inter-state disparities in economic levels in the interest of
equity, is the location of industry the best measure? The answer is
negative. The experience with the policy in the past speaks eloquently
for this. We shall turn to this in the next section.
2. Limitations of Industrial Location Policy
The preceding analysis casts serious doubts on the fundamental
justifications for initiaLting direct measures to influence industrial
location. Without giving; adequate thought to these basic issues, a wide
range of industrial location policies have been pursued in India. Some of
these have had little effect on the geographical distribution of
industries. In general, most of the policies have resulted in a wastage
-98-
of resources and led to distortions in allocative efficiency and growth.
Let us expand on these observations and provide illustrations from Chapter
II.
First, we look at some policies operating through controls.
Consider the use of the licensing mechanism to promote industries in
backward regions. Now, the basic fact is that licensing can be used to
prevent industries from being set up in certain regions but cannot induce
industrialists to invest in non-viable areas. Therefore, if licensing is
utilized actively for locational purposes, the result will be a fall in
investment in the restricted regions without a compensating increase in
the others, thus defeating the basic objective. Moreover, by favoring
applications from certain states or backward regions over other more
viable propositions, a loss in efficiency results.
Policies to maintain a uniform price in all regions of basic
inputs like cement, iron and steel (through freight pooling arrangements)
have resulted in various distortions. For instance, producers of these
inputs located close to raw materials find themselves at an advantage
vis-a-vis those located in proximity to markets. Thus, ironically, these
policies encourage locational concentration in production of these inputs
which offset to some extent their broader impact on development of the
other industries. Even regarding the latter, the uniform-price policy
discourages the use of substitutes (for example, wood for cement) in areas
located far from the producers of these inputs. The other types of
distortions have been described in Chapter II.
There has been great disappointment regarding the lack of spread
effects of large public sector units on the local economy. However, this
-99-
is quite natural in an area characterized by low agricultural productivity
and poor infrastructural support (the state of Bihar, for example).
Furthermore, there has been concern about the setting up of inefficient
public sector units because of the importance given to location in
backward regions. But, in practice, as we have seen, techno-economic
considerations have been predominant in public sector location and, to
some extent, their location in low-income states is fortuitous.
Let us now look at the case of policies operating through the
market mechanism. The various types of incentives for setting up and
operating industrial units in backward districts have already been
described. The backward districts that are eligible for these concessions
have been defined in a very broad manner, for example, those that qualify
for concessional finance constitute more than two-thirds of the area of
India as a whole. It wouLd be naive to expect that, merely by virtue of
this broad definition, industrial development would be generated in all
these areas. Only a small handful of these districts possess the
environment (especially in terms of infrastructure) for industrial growth;
shrewd entrepreneurs would only venture into these few areas. They will
set up units in the other regions only under exceptional circumstances -
for example, the availability of a specific kind of raw material. This
sort of locational decision would be made even in the absence of
incentives. Thus, the taking up of concessions by these units represents
an inefficient use of Government expenditure.
To the extent that industrial development is only feasible in
towns and metropolitan areas of certain size, the question may be
legitimately raised whether the areas eligible for incentives should be
-100-
defined in terms of towns rather than districts. In practice, of course,
industry will typically congregate in the most viable towns of districts
defined as backward. However, defining backwardness in terms of districts
implies that certain viable but industrially under-developed towns in
"non-backward" districts are not benefited. Finally, another serious
criticism of concessional finance and the investment subsidy is that they
operate through cheapening the cost of capital. In a labor surplus
economy like India, this will add to distortions in factor markets.
The poor response to the transport subsidy scheme to encourage
industrial development in hilly backward regions is again a natural result
of the absence of basic preconditions for industrial growth in these
areas. Moreover, just as in the case of price equalization policies, the
transport subsidy could result in misallocation of resources by inducing
manufacturers to substitute raw materials from outside for those available
locally.
Finally, yet another example of the futility of industrial
location policies where preconditions for viability (especially proximity
to markets) and heavy infrastructural support (like transportation and
communications) are lacking is provided by the rural industrial estates
program. As we have seen, efforts were made to promote rural
industrialization by setting up rural industrial estates in remote areas.
The outcome, naturally, was that these estates performed very poorly as
reflected by low occupation rates of sheds. It proved to be extremely
difficult to attract small entrepreneurs to these estates. Thus, again,
there was enormous wastage of resources from the expenses incurred in
constructing these estates.
-101-
These are some examples of serious inefficiencies generated by
industrial location policies. They have arisen largely on account of not
enough thought being given to the rationale of these policies. Our
exploration of their ramifications reveals that a thorough overhauling is
required in the approach towards locational concentration of industry. In
particular, we have argued that wherever it is thought that this
concentration is inoptimal or inequitable, policy makers should operate
with incentives rather than controls. Of two typical forms of incentives,
financial incentives and infrastructure provisior, the latter has several
desirable properties. Iit provides long-lasting support for industrial
development and its benefits are received by all activities within the
service areas. Although infrastructure provision may be more costly than
the alternative, it would be more consistent with the development
objectives for which industrial location policies are maintained.
Incentives should be used sparingly to overcome lethargy or risk aversion
on the part of entrepreneurs toward locational shifts. If the current
battery of industrial location policies is allowed to continue
operating in an unmodified manner, there is the real danger that, instead
of correcting the inoptimality of industrial location, these policies will
add further to the distortions.
-102-
POSTSCRIPT
National Committee on the Development of Backward Areas
In November 1978, the Planning Commission set up a National
Committee on the Development of Backward Areas (NCDBA) to " formulate
appropriate strategies for effectively tackling the problems of backward
areas." 1/ To assist the NCDBA, a Working Group on Industrial Development
in Backward Areas was formed with instruction, among other things, "to
recommend programs and policy mesures for influencing and controlling the
locational pattern of industrial activity." 2/
The views of the NCDBA on industrial location policy were
submitted in October 1980 in their "Report on Industrial Dispersal". The
recommendations of the report are currently being considered by the
Government. The NCDBA report is an important policy document which may
result in significant modifications in industrial location policy.
Therefore, it is necessary for us to assess its recommendations in the
light of our study of the working of industrial location policies in India
The NCDBA makes the distinction between two sets of industries:
(i) medium and large industries; and
(ii) small, ancillary and agro - industries.
It recommends different types of policies for influencing the location of
each of these sets.
1/ NCDBA (1980), Page 197.
2/ NCDBA (1980), Page 198.
-103-
The major recommendations are summarized below.
(i) Policy Recommendatios for Medium and Large Industries
The NCDBA advocates the "growth center" concept for developing
these industries in backward areas. A hundred new industrial centers
should be identified and provided with sufficient infrastructure for
attracting industry. Three basic criteria have been used for selecting
these centers:
"1) They should have a population of 50,000 or more as per the 1971
census;
2) They should have less than 10,000 workers in non-household
manufacturing as per the 1971 census;
3) They should not be near existing centers.
Existing centers may be defined as all centers with a level of employment
in non-household manufacturing exceeding 10,000. Nearness may be defined
in terms of the following cut-off distance from each category of existing
centers:
Level of employment in non- Cut-off distance beyondhousehold manufacturing in which new centers shouldexisting centers be chosen
Over 150 thousand 150 kms.
50-150 thousand 100 kms.
25-5 thousand 75 kms.
10-25 thousand 50 kms. " 1/
1/ NCDBA (1980), pp. vi and vii.
-104-
Furthermore, to make allowances for disparities in industrial
development between states, the NCDBA recommends that these hundred
centers be allocated between industrially "developed" 1/ and "backward"
states 1/ in the ratio 30:70. Further preference may be shown to the
hilly states of Jammu & Kashmir and Himachal Pradesh and the states
(excluding Assam) and Union territories of the North-eastern Region by
allocating them ten of the 70 centers reserved for backward states. The
state-wise distribution of the centers should be proportional to area and
population (with equal weights for both).
Once the hundred industrial centers have been identified, the
NCDBA recommends tht an Industrial Development Authority (IDA) should be
established in each of them. The IDA should coordinate the efforts of the
various implementing agencies required for developing the center,
concentrating on the provision of infrastructure in the forms of power
supply, access to regional and national transport networks,
telecommunications, industrial estates, housing and urban infrastructure.
(ii) Policy Recommendations for Small Industries, Ancillary Industries and
Agro - Industries
The NCDBA is of the opinion that existing industrial estates in
the selected industrial centers should be rehabilitated and new estates
should be established in those centres which do not possess one already.
Moreover, to further decentralize industry, an additional 100 industrial
estates should be constructed in areas away from the industrial centers
identified above.
l/ These categories have been defined according to whether value addedper capita in manufacturing in a state exceeds or falls below thenational average.
-105-
As we noted in Chapter II, a number of "District Industries
Centers" (DICs) have been established since 1978 as district-level
governmental organizat:ions to oversee the development of the small scale
sector. The NCDBA reiterates its faith in the DICs as coordinating bodies
for assisting the sma]Ll scale sector. It also advocates more effective
implementation of existing Government policies like priority purchase of
small sector output, adequate provision and allotment of raw materials,
and technical and financial assistance.
The NCDBA feels that the rehabilitation of existing industrial
estates and the development of new ones will be made possible, among other
ways, through the encouragement of ancillary industries. It recommends
that the latter should be developed by exerting active pressure on public
and private sector medium and large units to promote ancillaries. These
should be provided with raw materials and the "mother" units should
guarantee the purchase of their output.
Agricultural development will generate the need for certain types
of industries like repairs, services and agro-processing industries. The
NCDBA recommends the encouragement of such industries through appropriate
policies.
(iii) Recommendations for Maximizing the Local Impact of Industrial
Development
Finally, the NCDBA advocates certain measures for maximizing the
impact of industrial development in backward areas on the local economy.
As far as unskilled labor is concerned, it recommends that the current
obligation of public sector units to recruit through the local employment
exchange should be continued and the possibility of extending this
requirement to private sector units should be considered whenever the
latter receive concessions for location in backward areas.

-106-
For skilled labor, the NCDBA feels that the establishment or improved
functioning of local training institutes would be necessary. Local
entrepreneurship should also be actively encouraged through
entrepreneurship development and training programs.
A Critique of the NCDBA Report
It is in regard to the location of medium and large industry that
the NCDBA has made innovative policy suggestions. In general, their
recommendations for small and ancillary industries seek to operate through
programs already being implemented. Therefore, we shall consider first
the suggestions for developing industrial centers to attract medium and
large industry.
There is a healthy recognition of agglomeration economies by
adoption of the growth center approach. As the report states:
"Left to itself, industry goes to urban areas because of the
availability of infrastructure and ready demand for products. ....
Public cannot ignore these advantages of agglomeration and any attempt to
distribute large and medium industry, at any rate, throughout the country
in small lots is bound to fail. Hence, the aim of policy must be to
develop viable industrial growth centers in backward regions." 1/
Furthermore, the NCDBA is correct in isolating insufficient infrastructure
in small towns and urban centers as a major inhibiting factor in their
industrialization.
However, there are certain problems with the criteria that the
NCDBA has used to identify the most viable industrial centers. The mere
utilization of the indices of population size and number of workers in
1/ NCDBA (1980), Page 80.
-107-
manufacturing will nolt give an accurate picture of the industrial
potential of particular towns. A proper assessment would involve thorough
techno-economic surveys to ascertain the raw material base, market size,
linkages with larger iindustrial centers, characteristics of the labor
force and existing availability of infrastructure. It is only on this
basis that non-industrialized towns can be arranged in some sort of
hierarchy of potential for industrial development. Therefore, the cut-off
point can be defined atccording to the availability of funds for
infrastructure developiment. In terms of these prerequisites for proper
identification of growrth centers, the NCDBA's criteria are far too
simplistic. Moreover, the NCDBA introduces the additional dimension of
inter-state equity by giving additional weightage to "backward states."
From a purely efficiency viewpoint, a national perspective is preferable
since intra-state disparities are just as marked as inter-state
differences in industrial development. However, as we pointed out in
Chapter 2, political realities make it imperative that economic
disparities across states be taken into account in all national policies.
In recommending the development of small and ancillary
industries, the NCDBA does not examine the critical issue of the
efficiency of the smaLl scale sector in relation to the medium and large
sector. Furthermore, iit is not at all obvious that modern small scale and
ancillary industries are more easily decentralized than medium and large
industries. In fact, the NCDBA does recognize the convenience of locating
ancillaries close to large "mother" units. Despite this, it recommends
that ancillary units should be located in industrial estates away from
industrial centers. It is clear that the lessons from the unsuccessful
experiment of developing semi-urban and rural industrial estates have not
been learned. Moreover, compelling public sector units to purchase from
-108-
small ancillary units where economic considerations dictate otherwise,
would mean that there is an implicit subsidy for developing these units.
This should be taken into account when implementing policies for promoting
ancillarization.
The NCDBA advocates the development of agro-based industries.
However, it fails to consider household and handicraft industries (which
are the most dispersed industries in the small sector) and to re-evaluate
the plethora of programs and policies that exist to assist these.
The process of economic development implies gradual integration
and homogenization of labor markets. The recommendation of the NCDBA that
units should be compelled to recruit from local areas militates against
this concomitant of economic growth. It implies discouragement of
migration and further segmentation of labor markets which is quite
retrogressive from the viewpoint of promoting growth.
The NCDBA's recommendations to promote training institutes and
entrepreneurship development and training programs are in the right
direction. However, here again, limited budgetary resources imply that
decisions regarding the location of new training centers should be
carefully taken, keeping a national perspective in mind.
-109-
BIBLIOGRAPHY
Alexander, P.C., Industrial Estates in India, Asia PublishingHouse, Bombay (1963).
Armstrong, H.W. and Taylor, J., Regional Economic Policy and itsAnalyses (1980).
Bandyopadhyaya, K., Industrialisation through Industrial Estates,Bookland Pvt. Ltd., Calcutta (1969).
Bhagwati, J.N. and Desai, P., India : Planning for Industrialisation,Oxford University Press (1970).
Bharti, R.K., Industrial Estates in Developing Economies, NationalPublic House, Delhi (1978).
Bombay Metropolitan Regional Planning Board, Regional Plan for BombayMetropolitan Region, 1970-91 (1974).
Bureau of Public Enterprises (Government of India), Annual Report onthe Working of Industrial and Commercial Undertakings of the CentralGovernment.
Calcutta Metropolitan Planning Organisation, Basic Development Planfor Calcutta Metropolitan District (1966).
Central Statistical Organisation (Government of India), StatisticalAbstract.
Delhi Development Authority, Delhi Master Plan, Vols. I & II (1961).
Federation of Indian Chambers of Commerce and Industry, IndustrialDevelopment Potential Survey of Selected Towns of India, Delhi (1977).
Godbole, M.D., Industrial Dispersal Policies, Himalaya PublishingHouse, Bombay (1978).
Hanson, A.H., The Process of Planning, Oxford University Press (1966).
Hazari, R.K., Industrial Planning and Licensing Policy, Final Report,Government of India, Planning commission (1967).
The Industrial Credit and Investment Corporation of India Ltd.,Attracting Industries to Developing Areas (1975).
Industrial Development Bank of India, et. al., Industrial PotentialSurveys of Various States and Union Territories (1972).
Industrial Development Bank of India, Industrial Development ofBackward Regions (1974;).
Industrial Development Bank of India/National Committee onDevelopment of Backward Areas, Seminar on Industrial Development ofBackward Areas, Bombay (1980).
Jain, O.P., Rural Industrialisation, Commercial Publications Bureau,Delhi (1974).
Kulkarni, G.S. and Kulkarni, A.P., Community Cost of IndustrialLocation at Bombay and Nasik, The State Industrial and InvestmentCorporation of Maharashtra LTD., Bombay (1968).
Menon, K.S.V., Development of Backward Areas through Incentives,Vidhya Vahini, Bombay (1979).
Ministry of Works & Housing, Government of India, Report of the TaskForce on Planning and Development of Small and Medium Towns and Cities,New Delhi (1977).
Mishra, R.P., Sundaram, K.V. and Prakasa Rao, V.L.S., RegionalDevelopment Planning in India, Vikas Publishing House, Delhi (1974).
Nagaiya, D., Industrial Estate Programme, Small Industry ExtensionTraining Institute, Hyderabad (1977).
National Committee on the Development of Backward Areas, Report onIndustrial Dispersal, Planning Commission, Government of India, New Delhi(1980).
Office of the Registrar General, Census of India (General EconomicTables), 1961 & 1971.
Planning Commission, Government of India, Report of the Working Groupon Identification of Backward Areas (1969).
Rao, R.V., Rural Industrialisation in India, Concept PublishingCompany, Delhi (1978).
Sanghvi, R.L, Role of Industrial Estates in a Developing Economy,Multi-tech publishing company, Bombay (1979).
Sekhar, A.U., Factors in India's Industrial Development 1965-75,Unpublished Ph.D. dissertation, Princeton University (1981).
Sundaram, K.V., Urban and Regional Planning in India, VikasPublishing House, Delhi (1977)
Theil, H., Economics and Information Theory, North-Holland PublishingCompany, Amsterdam (1967).
Tolley, G.S, "The Welfare Economics of City Bigness," Journal ofUrban Economics, 1., 321-345 (1974).
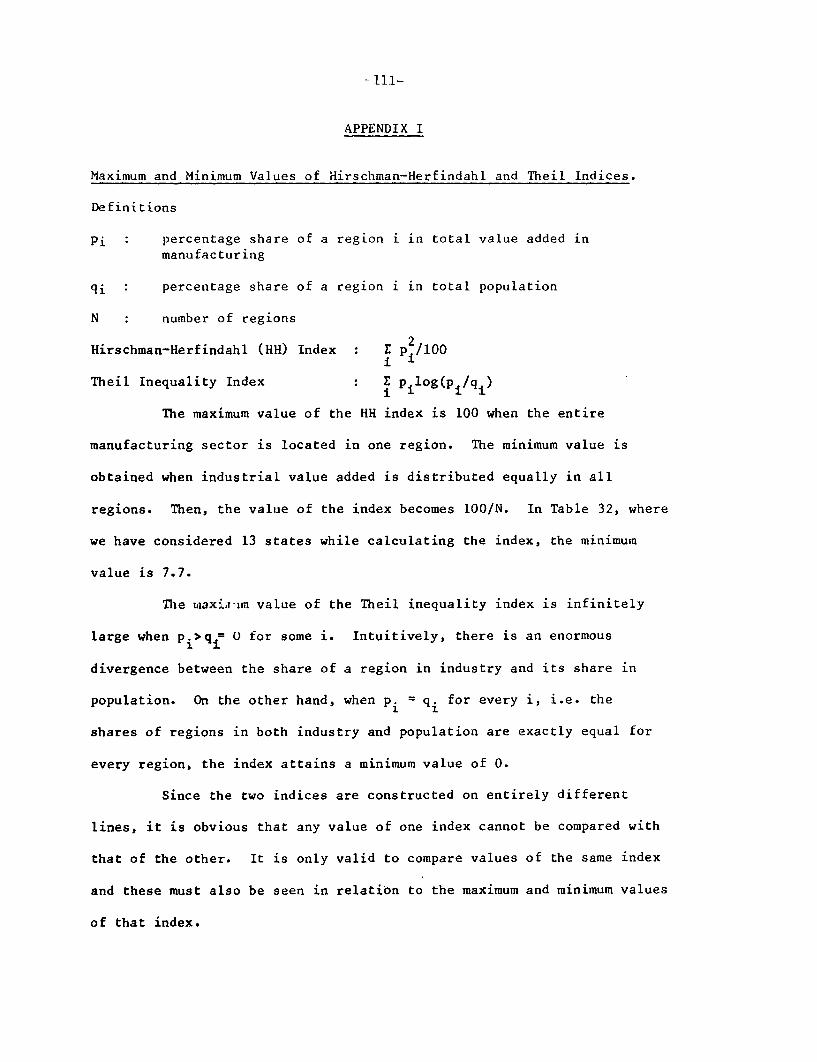
- 111-
APPENDIX I
Maximum and Minimum Values of Hirschman-Herfindahl and Theil Indices.
Definitions
Pi percentage share of a region i in total value added inmanufacturing
qi : percentage share of a region i in total population
N number of regions
Hirschman-Herfindahl (HH) Index E p2/100
Theil Inequality Index : E p log(p /qi)
The maximum value of the HH index is 100 when the entire
manufacturing sector is located in one region. The minimum value is
obtained when industrial value added is distributed equally in all
regions. Then, the value of the index becomes 100/N. In Table 32, where
we have considered 13 states while calculating the index, the minimum
value is 7.7.
The waxi.T-im value of the Theil inequality index is infinitely
large when p.>q= 0 for some i. Intuitively, there is an enormous
divergence between the share of a region in industry and its share in
population. On the other hand, when pi = qi for every i, i.e. the
shares of regions in both industry and population are exactly equal for
every region, the index attains a minimum value of 0.
Since the two indices are constructed on entirely different
lines, it is obvious that any value of one index cannot be compared with
that of the other. It is only valid to compare values of the same index
and these must also be seen in relation to the maximum and minimum values
of that index.

-112-
The Theil inequality index has certain advantages over the HH
index. The chief advantage relates to its "aggregation" properties. It
is beyond the scope of this appendix to elaborate on this; a detailed
explanation is provided in Theil (1967).
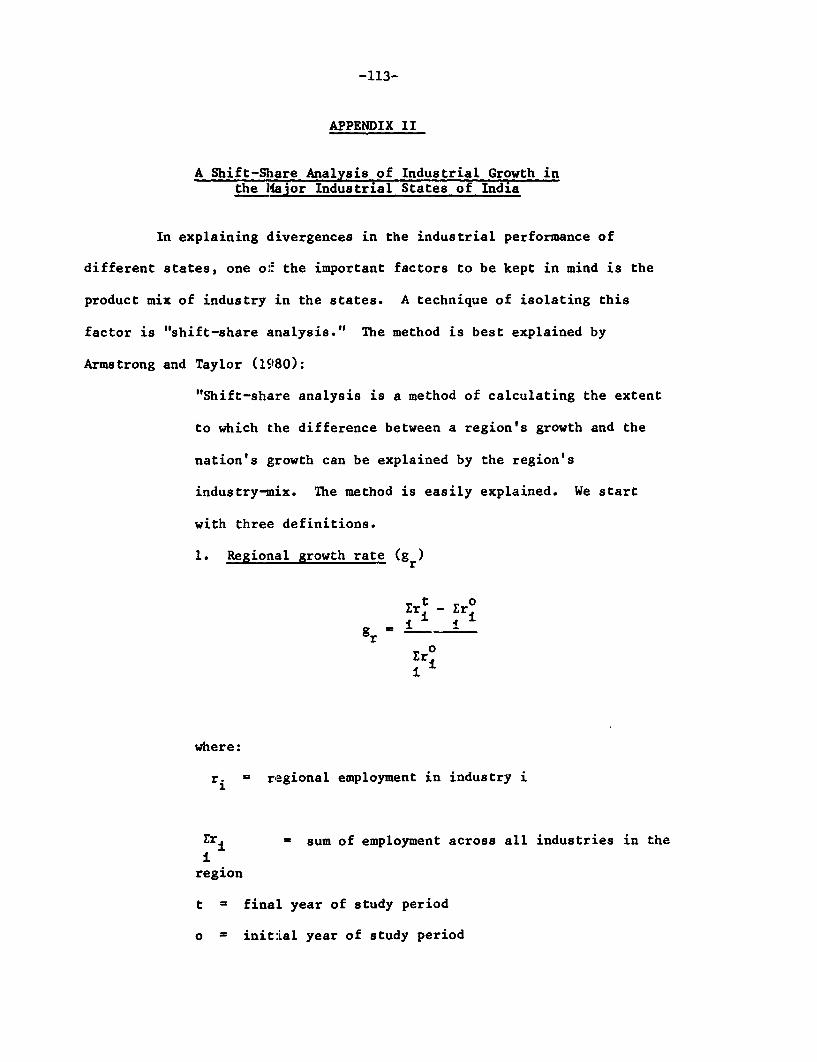
-113-
APPENDIX II
A Shift-Share Analysis of Industrial Growth inthe lMjor Industrial States of India
In explaining divergences in the industrial performance of
different states, one of the important factors to be kept in mind is the
product mix of industry in the states. A technique of isolating this
factor is "shift-share analysis." The method is best explained by
Armstrong and Taylor (1980):
"Shift-shaLre analysis is a method of calculating the extent
to which the difference between a region's growth and the
nation's growth can be explained by the region's
industry-muix. The method is easily explained. We start
with three definitions.
1. Regional growth rate (g r
Er t- Zr0
g m
Zr0
1ii
where:
r. = regional employment in industry i
Erl t sum of employment across all industries in the
region
t - finaL year of study period
o = initial year of study period
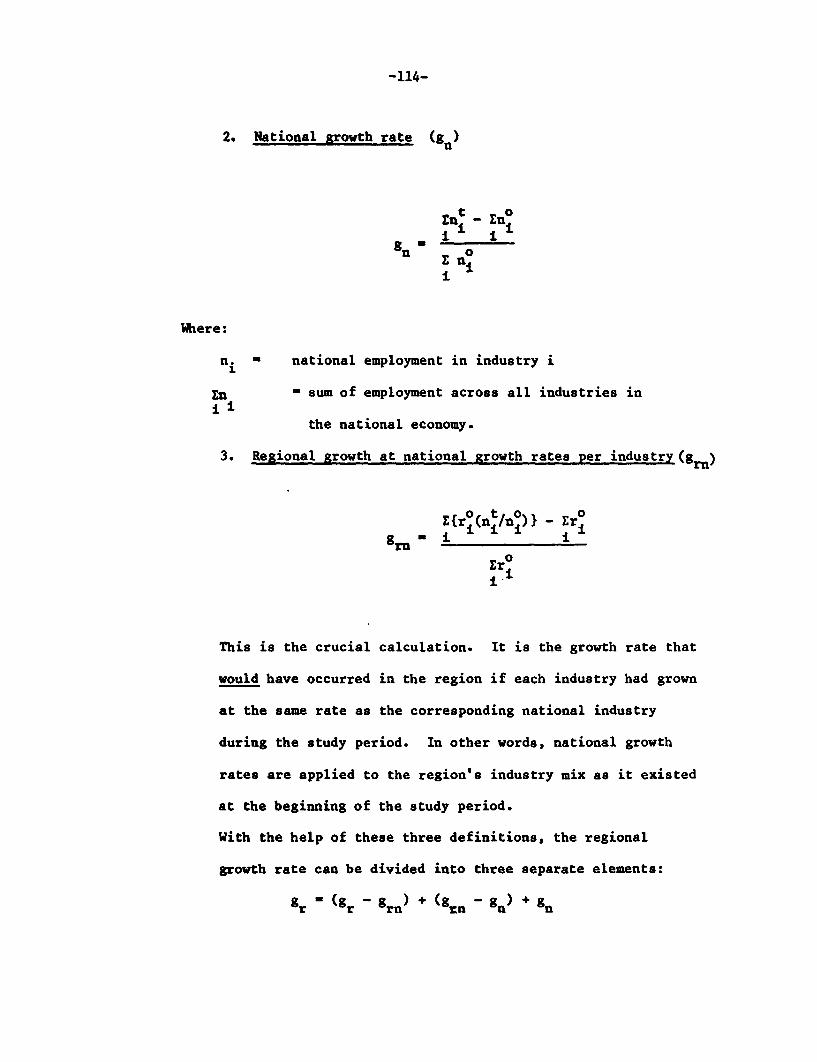
-114-
2. National growth rate (g )
t 0 nEnt - En0i i ±
gn 0niEn
Where:
ni - national employment in industry i
En - sum of employment across all industries in
the national economy.
3. Regional growth at national growth rates per industry(grn)
t{r (nt/no)} - Ero
grnEr0
This is the crucial calculation. It is the growth rate that
would have occurred in the region if each industry had grown
at the same rate as the corresponding national industry
during the study period. In other words, national growth
rates are applied to the region's industry mix as it existed
at the beginning of the study period.
With the help of these three definitions, the regional
growth rate can be divided into three separate elements:
gr (gr -grn) + (grn -gn) +gn

-115-
Taking the elements in reverse order, the third element
(gn) is the region's 'share' of national growth. The
faster the national growth in employment, the faster we
expect the region to grow. The second element (g -
g ) is tihe structural component. It is the difference
between:
(i) the rate at which we expected the region to grow (given
its industry mix and given national growth rates for each
industry:),
(ii) the national growth rate.
Thus, if the region possesses a 'favorable' industry mix we
would expect this element to be positive since g would
exceed gr in that case. If the region is endowed with an
'unfavora[ble' industry mix we would expect this element to
be negative since g would exceed g . Finally, the
first element (gr - grn ) is simply that part of the
region's growth that remains unexplained. It is a residual,
or a 'rag-bag' which can be given a wide variety of
interpretations. A positive residual (gr > grn ) means
that the region's growth rate exceeded the growth rate that
would have occurred if each industry in the region had grown
at the same rate as its national counterpart. A negative
residual (gr ' grn) means the reverse.I1l/
We carried out the shift-share decomposition for eight major
industrial states in India - namely, Maharashtra, West Bengal, Gujarat,
1/ pp. 301-302.
-116-
Tamil Nadu, Uttar Pradesh, Andhra Pradesh, Karnataka and Bihar - for the
period 1960-70. The results are presented in Table 1.
Before interpreting these results, we must point out certain
serious limitations of the shift-share method. 1/ First, the method
neglects inter-industry linkages and improperly assigns growth based on
these linkages into the residual rather than structural component.
Second, the results are sensitive to the level of industrial
disaggregation used in the computation. Third, the shift-share method is
essentially an accounting identity and not a theoretical model for
explaining growth differences - a task which is more elaborate and
problematic.
From Table 1, we find that the regional growth of industrial
employment during 1960-70 is markedly below national growth for West
Bengal and Andhra Pradesh. While industry-mix is the main explanatory
factor for Andhra Pradesh, residual factors are dominant in the case of
West Bengal. On the other hand, regional growth greatly exceeds national
growth for Karnataka and Bihar. The structural component dominates for
Bihar, whereas the divergence in Karnataka growth is essentially the
result of residual factors. For Maharashtra, Gujarat, Tamil Nadu and
Uttar Pradesh, there is not much of a difference between national and
regional growth (regional being smaller than national growth except in
Tamil Nadu). Whatever difference exists falls largely in the residual
component (with the exception of Gujarat).
To go to the next level and delve into the factors affecting the
structural and residual components involves intensive studies of
industrial growth in each state.
1/ These are elaborated in Armstrong and Taylor (1980), pp.3 05-3 0 8.
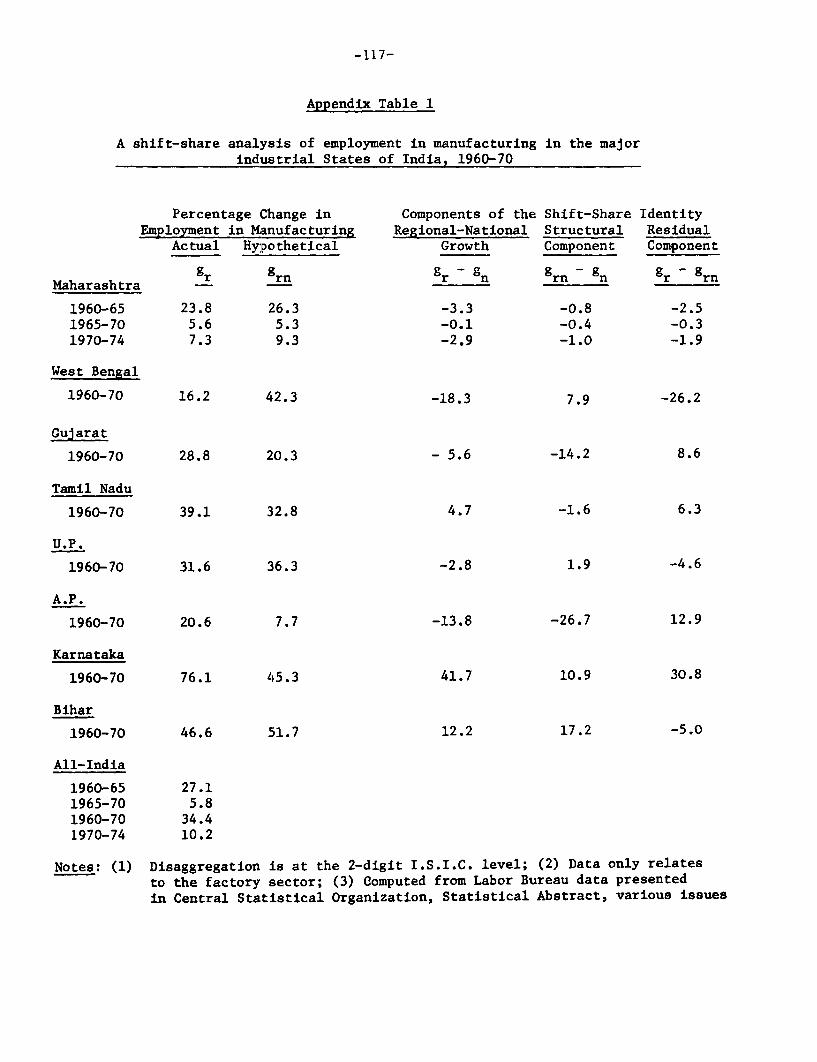
-117-
Appendix Table 1
A shift-share analysis of employment in manufacturing in the majorindustrial States of India, 1960-70
Percentage Change in Components of the Shift-Share IdentityEmployment in Manufacturing Regional-National Structural Residual
Actual Hylpothetical Growth Component Component
Maharashtra gr grn gr -gnn -gn gr -grn
1960-65 23.8 26.3 -3.3 -0.8 -2.51965-70 5.6 5.3 -0.1 -0.4 -0.31970-74 7.3 9.3 -2.9 -1.0 -1.9
West Bengal
1960-70 16.2 42.3 -18.3 7.9 -26.2
Gujarat
1960-70 28.8 20.3 - 5.6 -14.2 8.6
Tamil Nadu
1960-70 39.1 32.8 4.7 -1.6 6.3
U.P.
1960-70 31.6 :36.3 -2.8 1.9 -4.6
A.P.
1960-70 20.6 7.7 -13.8 -26.7 12.9
Karnataka
1960-70 76.1 45.3 41.7 10.9 30.8
Bihar
1960-70 46.6 51.7 12.2 17.2 -5.0
All-India
1960-65 27.11965-70 5.81960-70 34.41970-74 10.2
Notes: (1) Disaggregation is at the 2-digit I.S.I.C. level; (2) Data only relatesto the factory sector; (3) Computed from Labor Bureau data presentedin Central Statistical Organization, Statistical Abstract, various issues

World Bank Capital Utilization In Devekopent FinanceManufacturing: Colomba. Co p sPubUcations Isel. Malaysia, and the Examines the role of development
of Related Pblilippines Inance companies as mqjor mecha-Of Relate d Romeo M. Bautista. nbLs for assisting medium-saleInterest lHelen Hughes, David Lim, productive industriesm assesses teirpotential for aiding srmall enterprisesDavid Morawetz. and In meeting soeconomic obJectives
7rancdsco E. Thoumi of deveioping countries, andThe authors surveyed L 200 discusses the evoludon of Worldmanufacturing firms In four develop- Bank assistance to them.Ing countries to establish acta Sector Policy Paper. April 1976. 68levels of capital utlizadon. The Infor- 7 annexes). English,mation collected was the first and pages (including, annx sh.remains the only data base avallabie French, German, and Spanish.for the study of capital udlizadon. It Stock Mlos. PP-7601-E, PP-7601-F,was found that capital udlization Is PP-7601-G, PP-7601-S. $5.00.Automotve Industites In not as low as had been supposed.
Developing Countries The study is concened with factorsJack Baranson that cause differences In levels of Empiidcal Justfcatio forThe role of International corpora- capital udlizadon and the policies Inftnt Industry ProtectionTons, tle adaptation problems of that might be used to Increase IL Larry E. Westphaltheir affliates, and the impact of Oxford Uniuersity Prcss, 1982.288 Reviews the empirical evidenceeconomic pollcy on market structure. pages (Including bibliography, Index). available conceming the nature ofThe Johns Hopkins University Press, LC 81-9526. ISBtl 0-19-520268-6, the costs and beneflts of Infant1969. 120 pages (including statistical $22.00 hardcouer. Industry development and formsannexp. some hypotheses about policies topromote Infant industries. Based onLC 77-85339. ISBNt 0-8018-1086-8, Co Benflt Evaluation Of research conducted under the$3.00 (13.00) paperback. CSources of Industrbial Growth andSpanish: La industria automotriz en los LLDC lndwtrial Sctors Structual Change" research proJecLpalses en desarrollo. Editorial Tecnos, wch lasVe Fore World Bank Staff Working Paper (1o.197n. O nrhp445. March 1981. 38 page-s (Including320 pesetas. Garry G. Pursell references).
Describes a methodology for treating Stock No. WP-0445. $3.00.foreign capital for cross-secton cost-
A Bride Review of the beneflt studies when there Is Invest-World Lube Oils Industry ment by foreigners that is specific to Employment and Develop-A. Ceyhan, H. KNohl, a particular activity. llustrates the ment of Smal Enterprises
A.Cyharn . KhLmethodology by using the results DvdL odnL. Wijetilleke, and of a larger study of eighty-four David 1. Gordon,B.R. Choudhury manufacturing firns In the coordinating authorThis report assesses the structure, Ivory Coast. Examines the potential role of thebackground. and ouUook for the World Bank Staff Working Paper to. World Bank In encouraging develop-world lube oils Industry. Presents the 465, July 1981. 45 pages. Ing countries to assist smallhistorical and projected lube oils enterprises and suggests that em-demand and trends in rnanufacturing Stock No. WP-0465. $3.00. cient substtuton of labor for capitaitechnologies and production capacity is possible In a broad spectrum ofand provides an Indicave assess- small-scale manufacturing and otherment of the economics of lube oil activits that are able to absorb aproducton with detailed mnarket and rapidly growing labor force.econornic data. Sector Policy Paper. February 1978. 93energy Industries Report Series No. 1. pages (including 3 annexes). English,1982. 48 pages (including 13 annexes, FPrnch, and Spanish.references). Stock Mlos. PP-7803-E, PP-7803-l-,ISB11 0-8213-0054-7. $3.00. PP-7803-S. $5.00.
Estimating Total Factor MEW that an international safeguard codeProductivity Growth In a should be instituted to smooth theDeveloping Country Industrialization and process of ade ustnent to freer tradeAnne 0. Krueger and Growth-The Experiec ofBaran Tuncer Large Count ies World Bank Staff Working Paper Nlo.World Bank Staff Working Paper N1o. Hollis Chenery 453. April 1981. .30 pages (including422. October 1980. 64 pages (Includ- Discusses common elements of the ppeing references, appendix). experience of large developing coun- Stock lo. WP-0453. $3.00.Stock lo. WP-0422. S3.00. tries with industrialization, drawingon the World Bank's research project Industral Strateg for Late
on 'The Sources of Industrial Growthand Structural Change:. It was pre- Starters: The Experience
nEW sented to a conference of the Chinese of Kenya, TanzaniaAcademy of Science and is designed and Zambia
Financing Small-Scale to provide a comparative framework Ravi Gulhati andIndustry and Agriculture In for assessing the perforrnance of the Uday SekharChinese economy. It shows that.yDeveloping Countries: The despite Its unique features, China Asse the extent and natur ofMerits and Limitations of shares many characteristics with industrialization in three African' Commerclal Policies other large semi-industrial countries. countries. Summarizes the record ofDennis Anderson and Notes some Implications for trade industrial development during theFarida iKhambata policy and future growth. last twenty-flve years and exploressome of the issues facing theseA discussion of how two factors lead World Bank Staff Working Paper No. countries as they design futureto an unwillingness of financial 539. 1982. 38 pages. industrial policies.institutions to finance small-scale ISBN5 0-8213-0097-0. W3.00Pindustry and agriculture in developing World Bank Staff Working Paper No.countries: (a) controls In interest rates 457. May 1981. 63 pages (includingand (b) the initially high risks and Industrial Project Analysis: references, annex).administrative costs involved. Notes Case Studies Stock No. WP-045 7. $3.00.that most economists appeal for a rank H. Lamson-Scribner, Jr.relaxation of the controls, but showsthat this policy alone will not achieve Cases and exercises dealing withan efflcient flow of finance to small- flnancial and economic analysis, and Korean Industrlal Compe-scale activities. Draws on observa- project preparation and optimization. tence: Where It Came From
rons madeok dIuseverhal countries and World Bank (EDIJ, January 1977, xiii Larry E. Westphal,
outlines ways to reduce risks and + 211 pages. (Auallable from ILS, Yung W. Rhee, andadministrative costs over time. 1715 ConnecticutAuenue, N.W., Garry G. PursellWorld Bank Staff Working Paper (1o. Washigton, D.C. 20009, U.SA.) Discusses how K~orea has been able519. May 1982. 41 pages (includIng $5.00 paperback. to establish successfully an Indepen-
dent base of technological know-howreferences). and marketing expertise in manyISBN-0-8213-0007-5. $3.00. Industrial Prospects and sectors during the past flfteen years
Polides in the Developed and suggests how KNorea'sCou_tj_es experiences might be useful in
Fostering the Capital- Coun tess programming the development ofGoods Sector in LDCs: A Bea B other countries that are currently atSurvey of Evidence and Addresses the allegations that earlier stages of industrialization.Requirements increases in the import of manufac- World Bank Staff Working Paper (1o.Iloward Pack tured goods from developing coun- 469. July 1981. 76 pages (includingtries adversely affect the industrialWorld Bank Staff Working Paper (1o. sector in the developed countries references).376. Mfarch 1980. u + 59 pages and that growing protectionism In Stock (o. WP-0469. $3.00.376.clarchg 1980ces. v+5 ae the developed countries has mnade it(Including referenscs). necessary for developing countries toStock (1o. WP-03 76. $3.00. tum to domestic markets or to trade Macroeconomic Implica-
among themselves In order to sell tions of Factor Substitutiontheir manufactured goods. Argues l I P roce_s.sthat trade with the developing coun- m ndustral Proessestries actually benefits the developed Howard Packcountries, thiat rates of industrial World Bank Staff Working Paperprotecton should be lowered, and (1o. 377. March 1980. vii + 60 pages
(including bibliography).
Stock (1o. WP-0377. $3.00.

Made In Jamaica: The Mining Industry and Volume 1: The Planning ofThe Development of the the Developing Countries Industrld Investment Pr-Manufacturing Sector Rex Bosson and grams: A McthodoloayMahmood All Ayub Bension Varon David A. Kendrick andThis book, the first detailed study of An overview of the world's nonfuel Ardy J. StoutjesdijkJamaica's manufacturing sector. pro- mining Industry its structure and The analytical approach with specialvides a comprehensive assessment operation, and the major factors emphasis on the complications arls-of the important characteristics of bearing on them. ing from economies of scale; athe sector and of Its structure. It Oxford University Pres5, 1977; 2nd helpful introduction to linear andrelates the development of the sect.or Oxforning, Pres (includ mixed-integer programming, facilitat-during the past two decades, pnting, 1978. 304 pages (including ing understanding of subsequentdescribes the extent of protection 12 appendixes, bibliography, index). volumes in the series.provided to the sector in 1978, and LC 77-2983. ISBN 0-19-920096-3, The Johns Hopkins University Press,examines the prospects for growth of $29.50 hardcover; ISBN1 0-19-920099-8, 199 144 pags (ning indes).manufactured exports during the $14.95 paperback. 1979.144 pages (Including index).coming years. Policy recommenda- LC 78-8428. ISBN1 0-8018-2139-8,tions are made on the basis of French: L'industrie miniere dans le $18.50 (f9.75) hardcover; ISBN1this analysis. tiers monde. Economica, 1978. 0-8018-2152-5. $12.00 (f4.50)The Johns Hopkins Uniuersity Press, ISBN 2-7178-0030-1, 49 francs. paperback.1981. 144 pages. Spanish: La industria minera y los french: La programmation desLC 80-27765. ISBN 0-8018-2568-7, paises en desarrollo. Editorial Tecnos, investissements industriels: methode et$6.50 (f4.25) paperback. 1978. - etude de cas. Economica, 1981. (Com-
*ISB1 84-309-0779-3, 640 pesetas. bines translation of this book withManagerial Structures and that of the case study of the fertilizerPaagetice Structursndl industry in Volume 2, below.)Practices In Manufacturing lw582718089,6frnsEnterprises: A Yugoslav new ISBN 2- 7178-0328-9. 65 francs.
Case Study Occupational Structures Volume 2: The Planning ofMartin Schrenik of Industries nVolumen2:Th Plganning theExplores the managerial procedures Manuel Zymelman Investment Programs In tand practices that have evolved in FertUlzer IndustyYugoslavia's manufacturing Industriies Eighty-four tables profile the occupa- Armeane M. Choksi,under the Yugoslav system of 'self- tional composition of industries in Alexander Meeraus, andmanagement socialism," discusses each of twenty-six countries. Datathe inferences that can be drawn show the structure of employment by Ardy J. Stoutjesdijkfrom these observations regarding sectors and Industries for each coun- Discusses the main products andeconomic efficiency, and concludes try; cross-classify 120 occupations processes of relevance to fertilizerwith some observations on the with flfty-eight Industries; and provide production and a systematic descrip-strengths and weaknesses of this information about productivity (value tion of the planning problems thatparticular pluralistic system. added per person engaged), energy need to be addressed during the
consumption per person engaged, project identlflcation phase.World Bank Staff Working Paper No. and employment.455. May 1981. iv + 100 pages The Johns Hopkins University Pres(Including 4 appendixes). 1980; second printing, 1982. 211 pages. 1980. 320 pages.Stock (1o. WP-0455. $5.00. 15(BN 0-8213-0126-8. $20.00. LC 78-8436. ISBN1 0-8018-2138-X.
$25.00 (£13. 75) hardcover; ISBN(
Manufacture of Heavy The Planning of Investment 0-8018-2153-3p e15.00 (k6.25.Electrical Equipment in ProgramsDeveloping Countries Alexander Meeraus andAyhan rilingiroalu Ardy J. StoutjesdUijk editors Polides for IndustrialAnalyzes growth and competitive- Series comprising two volumes that Progress In Developingness, comparing prices and costs describe a systematic approach to Countrieswith those In the international investment planning, relying pri- John Cody, Helen Hughes,market. marily on mathematical program- and David Wall, editors
ming techniques. Includes bothThe Johns Hopkins Universitj Press, general methodological volumes and Analysis of the principal policy issues1969. 235 pages (Including studies dealing with specific that influence the course and pace of2 annexes). Industrial subsectors. industrialization in the developing
countries. The text organized alongLC 76-89962. ISBII 0-8018-1097-3, lines of govemmental administrative$5.50. (f3.25) paperback. responsibility for various industrial
policies, Includes chapters on trade,Spanish: Fabricac6n de equipo flnance, labor-technology relations.elEctrico pesado en los paises en taxation, licensing and other directdesarrollo. Editorial Tecnos, 1971.330 pesetas.
production contivos, public lw l th t d leenterprss InrasbuctuW and loca- Rapid LabwItesvedor Industry-agriculture linkage.Radan Lmoltesvand the Intenadonal environment Sml nduty In Deveos Deveiopment
U1g Contries Sone lmes The Case of the PiippinsOxrndn Uni9s235 paess 1i80l2nd Dennis Anderson Barend A. de Vries
bibitngraphy, 1 ndex). The role of small industries In the World Bank Staff Working Paper No.development process has been the 424. October 1980. 32 pages (includ-
LC 79-24786. ISBtl 0-19-520176-0, subject of a lare number of studies Ing references, 12 tables).$24.95 hardcouer; ISB15 0-19-520177-9, over the past thirty yeamI Th5 s paper$9.95 paperback. examines changes In the size struc- Stock No. WP-0424. S3.00.
ture of Industry, by regloru Itdlscusses entrepreneurship andargues that, while small and large Why the Emperors IMewflrms alike are highly responsive to Clothes Are Mlot Made in
FflIution Control In the growth of market the Colombia: A Case Study InSmo PaUlo traoil entrepreneurial response Is neither as LAtIn Amercan and East
Sao lMulo, Birazil: Costs, full nor as efficent as Is desirabil; Asian ManufacturPdand Effects on and It analyzes small Industry pro-
lodustrial Location grams and their reladon to zCpOVinod Thomas development policy. David MorawetzDiscusses the nature of the Industrial World Bank Staff Working Paper ho. Tocuses on the exports of a particu-air pollutlon pr,oblem In Sao Paulo, 518. 1982. 77 pages (Including lar commodLty (clothing) from a par-summarizes possible policy actions to references). (colomba) In an attempt to under-combat the problem, and presents a e ISBN 0-8213-0006-7. $3.00. stand why Latin America has been socost-benecit framework to analyze much less successful at exportingpollution-control polIkIes, manufactured goods to date thanWorld Bank SWtf Working Paper No. Small-Scale EnterprIses In East Asia. It is the flrst study to go501. oueonber 1981.127 pages (includ- Korea and Taiwao into great detail In examining theing annex. references). Sam P S. Ho price, and especially the nonprice,Stock No. WP-0501. $5.00. World Bank Staff Working Paper ho. Oxford Uninersoty Prcsss. 198.208
384. April 1980. ul + 151 paesOxodUuestjPm 9120
The Process of Industrial (including 4 appendlres). pages (including appendixes.DThelPopmento anmdustrh.ial38. 5.0.bibliography).Developmecot aiod Stock t10. WP-0384. $5.0. LC 81-9547. ISBN 0-19-520283-X,ANtemnatve Development $22.00 (f14.50) hardcouer.Strategies State ManmufacturtigBela Balassa Enterprise in a NixedWorld Bank Staff Working Paper ho. Economy. The Turish Case _ . OIcIdC t to tes438. October 1980. 42 pages Bertil Walstedt S_.scalle Sectu in tOm rbfl Vines(Including appendix). Traces the historic roots of 'etatism-'" Katrine Andeson Salto andStock ho. WP-0438. $3.00. and reviews the performance of six DeLano P Villanueva
major state Industries In Turkey. WIrd Bank Reprint Serks: Number 226.ReprinWd honm economic Devlopment and
Smill Enterprises and The Johns Hopkins Uniuersity Prcss, CuIturl Change. wi. 29, no. 3 (AprIl 18) .65140.Development Policy Ji the 1980. 354 pages (including appen- Seock rso. RP-0226. ,fc of charge.Phippine: A Case Study dixes, Index).Dennis Anderson and LC 78-21398. ISBN 0-8018-2226-2,Farlda Kharnbata $30.00 (f17.50) hardcouer;
oISB1 0-8018-2227-0, $13.50 (17.00)Presents an ex post evauation of th paprback.Small and Medium Industries Pro-grm Introduced In the Philippines In1974, and reassesses the assump-dons behind the programs. One of asers of case studis and surveysbeing financed by the World BanksRexamh Committee.
World Bank Staff Working Paper ho.468. July 1981,239 pages (Includingbibiography, annex).Stbck 10. WP-0468. $10.00.
The Bertaud Models A Mlodelk Dedgu thle St and Ser- Cie the Dewloplfor the Anali of Alter- vice fmot Allocation Procusm lllsW : Fbllcies owTheirtives for Low-income Shelter Leoios i frm roject Equitable and E_leitIn the Deveoingf Worid E periec Growth(Prepared by PADCO, Inc., In Laure E. Cooper Johannes P Linncollaboration with the staff of TMs ana"lss provides a framework In Deinetes tmo poltc iuesthe World Bank.) which to kIntify and trace the steps tVat arlse In the eforb to aat toThis model is a working tool for quired to Impleent the site and te growth of dties In developingtechnicians and pollcy cakers who are savkce plot alcatdon process. It is counties and discusses poicesresponsible for low-lncome settie- based on a survey of twelve urban desined to lncaae the effiency
rr ent projects. It ldendiles A adeoffs devebpment projects and two In. and equity of urban deveopmentLamng land .tusIentifhes tradeosl a depth projc studes. A detailed pic. Pdcul as covered indudeflrnogancda paaees. phsciWm4ad tr enrge of the factors assocd- urban emlynent. incrnefinancial parameters. ated with allocatng plots and the redistribution triough the llscalUrban Deuelopment Technical Paper relatonships and I n system tnport housing, andNlumber 2. December 1981. 15 pages of one factor to another. Potental social sevkes. The poliy Instru-(including 3 statIstical annexes). pnho o avoas and te a tents comnied Ing,ude pubikISSN 0253-3324. Stock lo. UD-W002. on howto amid thnam Identified p-i umdo$5.00. Urban Development Technical Paper and regulaion.
lumber 3. March 1982.30 pages OXford UnIuersIbj PW,. 1983. 240(Including annex). pages (Including bibliography, index).ISSn 0253-3324. Stock No. UD-0003. ISB1Y 0-19-5203828. $27.50 hardcover:$3.00. ISBN 019-520383-6, $12.50 paper-
back.
MEW MBEW lousing for Low-incomeUrban Families: Economics
Environmental Management Evuation of Sites and and Policy In theof Urban Solid Wastes in Servies Projects: The Developing WotidDeveloping Countries: A Experience from Lusaka, Orville 11 Grimes, Jr.Project Guide Zambia Analyzes the operation of urbanSandra J. Cointreau Michael Bamberger, housing markets in developing coun-This guide provides Inforrnation and Bishwapriya Sanyal. and tries to determine the kinds of dwell-procedures for planning and Impie- Nelson Valverde ings affordable by the urban poor.mentaion of solid-waste manage- This report presents the flndings of a The Johns Hopkins Uniuersity Pess,ment improvements. It Is designed to five-year evaluation of the Mrrst 1976. 190 pages (including statisticalfaclitate project preparation, Lusaka Upgrading and Sites and Ser- appendix. select bibliography, Index).appraisal, and Implementation of vices Project made possible through a LC 76-4934. ISBN 0-8018-1853-2.Bank-assisted solid-waste projects In cooperative research project sup- $18.50 (.9.50) hardcover;urban areas. Current Bank objectives, ported Jointy by the World Bank and ISB1 0-8018-1854-0, $8.95 (3.50)policies, and project requirements are the International Developmentsummarized. Research Centre of Canada. paperback.Urban Development Technical Paper World Bank Staff Working Paper Spanish: Vivienda para familias urbanasNumber 5. August 1982. 214 pages o. 548.1982.201 pages. de bajos ingresos: aspectos econ6micos(including 5 annexes). y de poiftica en el mundo en desarrollo.
3ISB1 0-8213-0115-2. $10.00. Editorial Tecnos, 1978.ISBII 0-8213-0063-6. ISSIY 0253-3324.$5.00 ISBlt 84-309-0778-5, 480 pesetas.
__________ ~NEWncw lRational Urbanization Policy
House Registration in Developing CountriesEvaluation of Shelter Handbook: A Model for Bertrand M. RenaudPrograms for the Urban Registering Houses and National urbanization policies InPoor Principal Findings Plots in Unplanned developing countries often attemptDouglas IH. Keare and Settlements without a full understanding of theScott Parris Saad Yahya fomres at work, to block the growth ofthe largest cities and to InduceThis report provides an evaluation of A manual for professionals and decentralization. This book takes afour sites and services and area administrators working In urban critical look at such policies and theirupgrading projects In El Salvador, the uncontrolled settlements In the third weak conceptual foundations andPhilippines, Senegal. and Zambia and world. Examines the problem of describes problems Inherent Inconfirms that Bank-supported urban registering of houses and plots In implementation. The coverage Isshelter projects have been remarkably unplanned setUements In the large comprehensive, and both global andsuccessful and recommendations are urban centers of the developing national trends are analyzed.made for future projects. countries. Oxford Uniuersily Press, 1982.192
World Bank Staff Working Paper Urban Development Technical Paper pages (including Index, appendixes).No. 547.1982.109 pages. Nfumber 4. June 1982. 75 pages LC 81-3999. ISB11 0-19-520264-3,ISB1l 0-8213-0114-4. $5.00. (including 3 appendixes). $16.95 hardcover, ISB1l 0-19-520265-1,
ISBN1 0-8213-0053-9. ISSN1 0253-3324. $7.95 paperback.
MEW $3.00. Also available in Korean from theKorea Research Institute for Human
Evaluation of Sites and Ser- Housing Settlements.vices Projects: The Evidence Revie vs the importance of housingfrom El Salvador withir~ the framework of urban O nrhpadEfcecMichaEl Sahberader development problems, and makes Ownership and Es dencyMichael Bamberger, recommendations for World Bank in Urban BusesEdgardo Gonzalez-Polio, and assistance in integrated urban Charles Feibel andUmnuay Sae-Hau planning. A. A. WaltersThis report presents the flndings of Sector Policy Paper. May 1975. World Bank Staff Working Paper N1o.a five-year evaluation of the first 75 pages (including 13 annexes). 3 71. February 1980. 19 pages (includ-El Salvador sites and services project EngiLsh, French, Spanish, and Arabic. Ing selected bibliography).rmade possible through a cooperativeresearch project supported joinUy by Stock Nos. PP-7506-E, PP-7506-P, Stock 11o. WP-03 71. $3.00.the World Bank and the IntemaaUonal PP-7506-S, PP-7506-A. $5.00.Development Resarch Centre ofCanada.
World Bank Staff Working Paperto. 549.1982. 233 pages.
ISBN1 0-8213-0116-0. $10.00.
The People of Bogota: Whbo Urban and Spatial mewThey Are, What They Earn,, Development In MexicoWhere They Live Ian Scott Urban Land Poicy IssuesRakesh Mohan Examines urbanization in a country ad OpportunitlesWorld Bank Staff Working Paper No. In which that process has been Harold B. Dunkerley,390. May 1980. 153 pages (including 2 particularly rapid and in which such coordinating editor, with theappendixes, bbilography).issues as provision ofjobs, shelter. sitneoappendixes, bibliography), public services. and mass transit are assistance ofStock No. WP-0390. $5.00. urgent. Also considers issues that Christine M. E. Whitehead
arise because of the size and form of Various authors with experience inthe system of large cities and the their respective flelds discuss major
Pirate Subdivisions and tile linkages between them: centraliza- problems of urban land: the risingMarket for Residential [lts tion rural-urban integration, and pat- cost the relation of different types ofin Bogota tems of interregional development. land tenure to equity and eMciency,Alan Carroll The study is relevant to other coun- the rationale for govemment interven-tries in which similar problems will tion and the forms It may take-taxa-World Bank Staff Working Paper No. undoubtedly become increasingly tionr acquisition and development of435. October 1980.116 pages (includ- urgent. land, regulation of land use, anding 2 appendixes, tables, references). The Johns Hopkins University Press, other forms of control. The analyses2982.344 ages Inclding aps.refine and illuminate many of theStock No. WP-0435. $5.00. 1982. 344 pages (Including maps. urban problems that confront
appendixes, bibliography, Index). developing countries and provideSites an SrvceLC 80-8023. ISBt1 0-8018-2499-0, practical guidelines for dealing withSites and Services ltrojeCtS $32.50 (f20.75) hardcover; them. Chapter authors are John M.
Urban Deuelopment Technical Paper ISBN 0-8018-2498-2, $9.50 (f6.75) Courtney William A. Doebele. HaroldNumber 1. April 1974. 47 pages (includ- paperback. B. Dunkerley, Malcolm D. Rivkiln.ing annex). English, French, and Donald C. Shoup, Alan A. Walters, andSpanish. Christine M.E. Whitehead.Stocknish.PP741-.-70F, Urban Economic and Plan- oxford University Press. 1983. AboutPtockPNos. P 0 Ping Models: Assessing the 208 pages.
PP-7401-S. $5.00. potential for Cities Inl LC 82 -2024 7. ISBHY 0-19-520403-4.Developing Countries $22.50 hardcouer.
The Transformation of Rakesh MohanUrban Housing: The Applies current urban modeling nprcmsExperience of Upgrading techniques to cities in developing The Ce of U itO 1In Cartagena countries. Problems intrinsic to the Devekqp" CountriesW. Paul Strassmann modeling of all urban areas are Johannes LinnIn urban development, it is now considered along with those particu- World Bank REprint Scries: Number 227.Often consideredlme ptic n d lar to cities In poor countries. Reprinted from economic Doelopment andefficient to upgrade the existing The Johns Hopkins University Ps, Cultura: Change. uol 30, no. (Aprilhousing stock than to replace It wiUt 1979. 192 pages (including bibliogra- Jnew construction. hiousing transfor. phy, author index). Stock No. Rt-0227. Free of chage.mation should not only be expected LC 78-8437. BN 0-8018-2141X, T c of Self-feIP hOustng:and tolerated, but should even be $7.50 (L525) paperback. T-eoy and Som Evidence from afostered as a means to increase Devrloping countryproduction in an important feld. to Developing countygenerate employment and to - Cmmanuel Jlmenezimprove equity in the distribution of NEW World Bank Reprint Series: Number 223.housing. This study shows how the Reprinted from Joumal ot Urban Economics.housing stock in Cartagena was The Urban Edge tol. No (P9822:205-28.upgraded during the 1970s by Herbert H. Werlin (Editor) Stock No. RP-0223. tree of cha,ge.owner-occupants and. to a lesser and George G. Wynneextent, by landlords. The principal Tbc Spatt structre of LUnconclusions are supported by exten. (Pubications Director) Am.erk Citiessive econometric tests and by This six-page newsletter Is published Gregory IL Ingram and Alan Carrollinterviews with local experts and for the World Bank by the Council for World Bank Reprint Series: Number 211.authorities. International Urban Liaison. It Is con- Reprinted hom Joumal of Urban Economics.
cemed with practical approaches to uol. 9. no. 2 (March 19811:2S7.73.The Johns Hopkins Universitag urban problems In developing Stock No. RP-0211. tree of charge.1982. 239 pages. countries.
LC 81-481076. ISB 0-8018-2805-8 Ten times a year. Engilsh, French,$22.50 hardcover. Spanish. Subscriptions at $20 a year
(plus $4 for overseas postage) can beobtained from CIUL, 818 18th StreetN1.W., Washington, D.C. 20006, U.S.A.

(

WORLD BANK PUBLICATIONSORDER FORM
SEND TO:WORLD BANK PUBLICATIONS WORLD BANK PUBLICATIONSRO. BOX 37525 or 66, AVENUE D'IENAWASHINGTON, D.C. 20013 75116 PARIS, FRANCEU.S.A.
Name:
Address:
Stock or ISBN # Author, Title Oty. Price Total
I~~~~~~~~~~~~~~~~~~~~~~~~~~~~~~~~~~~~~~~~~~~~~~
Sub-Total Cost:
Postage & handling fee for more than two free items ($1.00 each):
Total copies: _ _ Air mail surcharge ($2.00 each):
TOTAL PAYMENT ENCLOSED:
Make checks payable: WORLD BANK PUBLICATIONS
Prepayment on orders from individuals is requiested. Purchase orders are accepted from booksellers. library suppliers, libraries, and institutionsAll prices include cost of postage by the least expensive means. The prices and publication dates quoted in this Catalog are subject to changewithout notice.
No refunds will be given for items that cannot be filled. Credit will be applied towards future orders.No more than two free publications will be provided without charge. Requests for additional copies will be filled at a charge of US $1.00 per
copy to cover handling and postage costs.Airmail delivery will require a prepayment of US $2.00 per copy.Mail-order payment to the World Bank need not be in U.S. dollars, but the amount remitted must be at the rate of exchange on the dcay V.e
order is placed. The World Bank will also accept Unesco coupons.


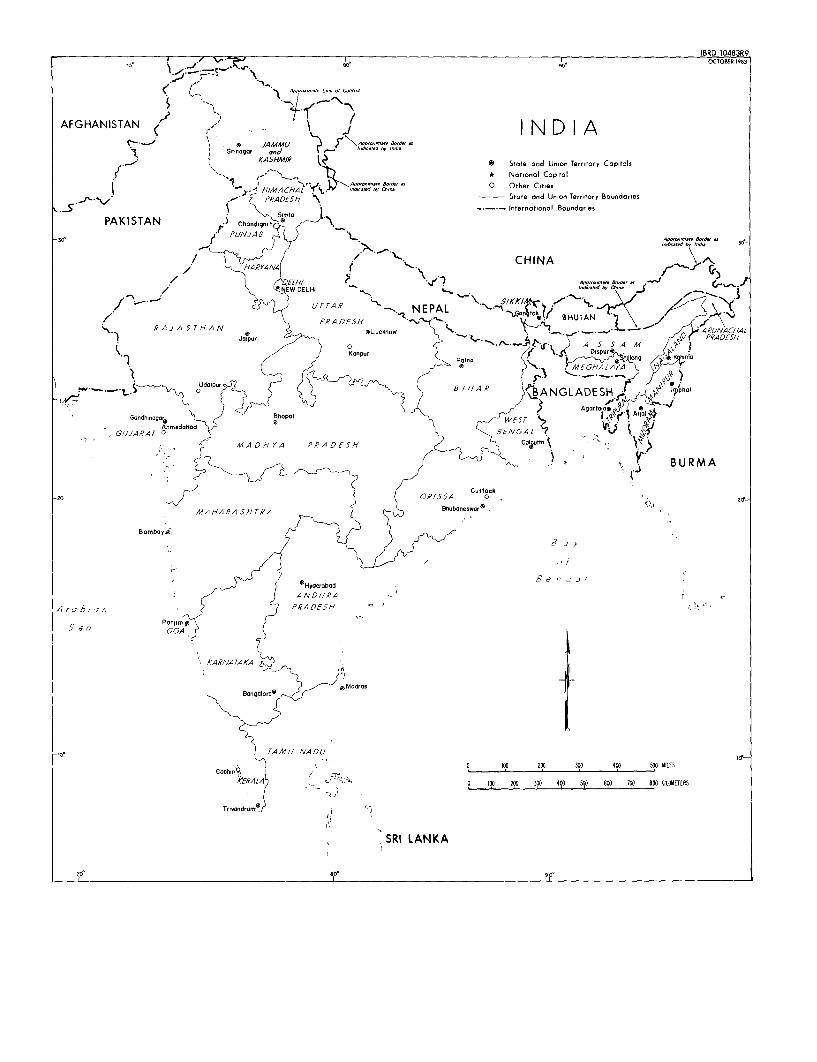
IBRD 10483R9ao. \ OCS > ^¢ ,l 0 90, (XTOC ER 1983
AFGHANISTAN N D I Ac- 0 rD J4MM/U 4b2,bndlc .n b L 2 Ind
t 8 S~~~~~rinogor rmd i4,,n yM,
jASHMIR f Stote and Union Terrtory C.piltls
* Notoonol Capital1 ,~~brL/.)~~N-AO"~~'~" by,any ~0 Other C,tie,s
_r ^to .>-/'hRMADESH *\1 IndleaLed Ly CLlm State ond Union Territory Boundaries
International Boundaries
PAKISTAN cho digoih
-30 PU/JNJAV B y Apptrnmrr a 5
/ HAPANA ~ . \CHINA
ELHI A-- Boyd r .EW DELHI tbdr d by L,ii 4
TTAR ' NEPAL KHUTAK// .e
PRA DESH ~ ~ ~ ~ ~ ~ ~ ~~~~~~~~~EEDS'> RA JA ST H AN rD * rLuckrow T . x°iRAEh
do'p.~ ~ ~ ~ ~ ~~~~~po,Bh A R j ANGL ADES
m pal ~~~~~~~~~~~~~~~~~~~~ Aall~A,l *
Ah_ndobo EN \GAZ
a _ .X t4 A D H t' A PRY A D ZS H
BURMA
~~47 I/< ~~~~~Cuttock-00 _'fiy/ St tt bh b swrzr* .RI A
MAHARA SHTRA r Bh.ub.n.owr
Bomboy D A* S
XJ~~~~~~~~~~~~~~~~~7 v~;
r~~~~ P D~~~~Hyderobod na
j ,/ j ~~A ND/-IA t A r a A' , a n RDZSH' *
SerOa POnvn,tD ;
KA//ANATAKCA .
, i
Cochingl |O 100 2tO 300 400 '00 YILESXkERAALA 0,l; lO 0 00 300 4 090 SOO 6 0700 800 ttlEOkETERS
C
Trivandrun, R-
SRI LANKA7! 0' A

HG 3881.5 .W57 W67 NO.620c.3
SEKHAR, UDAY.
INDUSTRIAL LOCATION POLICY:
DATE NAME AND EXTENSION ROOMNUBE
The World Bank
Headquarters European Office Tokyo Office U1818 H Street, N.W. 66, avenue d?6nal Kokusai Building
Washington, D.C. 20433, U.S.A. 75116 Paris, France 1-1 Marunouchi 3-chome
Telephone: (202) 477-1234 Telephone: (1) 723-54.21 Chiyoda-ku, Tokyo 100, Japan
Telex: WUI 64145 WORLDBANK Telex:.-842-620628 Telephone: (03) 214-5001
RCA 248423 WORLDBK Telex: 781-26838
Cable Address: INTBAFRADWASHINGTONDC
ISSN 0253-2115/ISBN 0-8213-0273-6