
INDUSTRIAL ENERGY TECHNOLOGY CONFERENCE
257
Fourteenth National INDUSTRIAL ENERGY TECHNOLOGY CONFERENCE April 22 & 23, 1992 JW Marriott Hotel Houston, Texas Focusing on Industry's Needs: Solving Today's Problems Planning for Tomorrow Profiting through Technology W.D. Turner Conference Director Technical Program Director Host Energy Systems Laboratory Department of Mechanical Engineering Texas A&M University Sponsors Texas Governor's Energy Office Electric Power Research Institute Houston Lighting & Power BASF Corporation Destec Energy, Inc. Dow Chemical U.S.A. Linde-Union Carbide Industrial Gases U.S. Department of Energy Center for Energy & Mineral Resources, TAMU Admission to Texas A&M University and any of its sponsored programs is open to qualified individuals regardless of race, color, religion, sex, age, national origin, or educationally unrelated handicaps. DISTRIBUTION OF THIS OOCUMENT IS UNLIMITED J
-
Upload
khangminh22 -
Category
Documents
-
view
1 -
download
0
Transcript of INDUSTRIAL ENERGY TECHNOLOGY CONFERENCE
Fourteenth National
INDUSTRIAL ENERGYTECHNOLOGY CONFERENCE
April 22 & 23, 1992JW Marriott Hotel
Houston, Texas
Focusing on Industry's Needs:Solving Today's Problems
Planning for TomorrowProfiting through Technology
W.D. TurnerConference Director
Technical Program Director
HostEnergy Systems Laboratory
Department of Mechanical EngineeringTexas A&M University
SponsorsTexas Governor's Energy OfficeElectric Power Research Institute
Houston Lighting & PowerBASF Corporation
Destec Energy, Inc.Dow Chemical U.S.A.
Linde-Union Carbide Industrial GasesU.S. Department of Energy
Center for Energy & Mineral Resources, TAMU
Admission to Texas A&M University and any of its sponsored programs is open to qualified individuals regardless of race, color, religion,sex, age, national origin, or educationally unrelated handicaps.
DISTRIBUTION OF THIS OOCUMENT IS UNLIMITED J
FOREWORD
A review of past Industrial Energy TechnologyConference (IETC) attendees demonstrates thatthis is a conference for energy users. For thisreason, the IETC is of major interest to everyprovider of a product or service to theindustrial and commercial energy consumer.The IETC is a vehicle for upper-level energymanagers, plant engineers, utilityrepresentatives, suppliers, and industrialconsultants to present and discuss novel andinnovative ideas on how to reduce costseffectively and improve utilization of resources.It is hoped that these proceedings may be usedas a reference in the near- and long-termimplementation of industrial energymanagement projects.
We at the Energy Systems Laboratory in theDepartment of Mechanical Engineering at
Texas A&M University express our appreci-ation to everyone who helped make thisconference a success. These include our spon-sors (the Texas Governor's Energy Office, theElectric Power Research Institute, HoustonLighting & Power, BASF Corporation, DestecEnergy, Inc., Dow Chemical U.S.A., Linde-Union Carbide Industrial Gases, U.S.Department of Energy, and the Center torEnergy and Mineral Resources at Texas A&MUniversity), the IETC Advisory Committeemembers who took time from their busyschedules to provide guidance and suggestions,the exhibitors who displayed the latest and mostadvanced equipment and related services, andall the authors, session chairs, and keynotespeakers who shared their knowledge andexperience.
Papers that arc printed here arc just as they were provided to the editor. Questions or comments shoujd be directed to the authorfs).
CONFERENCE STAFF
W.D. Turner, P.E.Conference Director andTechnical Program Chair
W.T. JohnstonExecutive Director
Susan SwansonConference Coordinator
Dawna RosenkranzRegistration
ADVISORY COMMITTEE
Anuni AmarnathEPRIGary EwyM.W. KelloggSteve JenkinsDestec Energy, Inc.Stan MatcekHouston Lighting & PowerBob OttoGovernor's Energy OfficeR.L. SellersUnion CarbideDaniel SteinmeyerMonsanto CompanyMalcolm VerdictMalcolm Verdict & Assoc.
Nicholas ChopeyChemical EngineeringDon HamiltonGulf States Utilities Co.Jim LanierCity of Austin Power&LightE.H. MergensEPRIPaul RaabeCentral Power & LightJoel SmithU.S. EPAPrank ThigpenJacobs Engineering
Jerry DuaneU.S. DOESteve JaegerGovernor's Energy OfficeTom Lowennerjj3-M CompanyKenneth NelsonDow Chemical U.S.A.Sidney ReynoldsTennessee Valley AuthorityRonald SmithGeneral MotorsMichael TurnerExxon Chemical
Table of Contents
Win, Win Strategies for Stability, Growth and Future Success
"Measuring and Understanding Energy Efficiency Changes in Manufacturing"Dwight K. French and Lynda T. Carlson, Energy Information Administration, andChristie Hall, Middle Tennessee State University 1
"EPRI's Industrial Energy Management Program"Ed Mergens and Leslie Niday, Electric Power Researaeh Institute 9
"The Energy Impact of Industrial Recycling and Waste Exchange"W. Curtis Phillips, State of North Carolina Energy Division 11
"Hoechst Celanese Energy Model"Bridget A. Fitzpatrick and Krishnan Gangadhar, Hoechst Celanese 18
"Industrial Energy Auditing: An Opportunity for Improving EnergyEfficiency and Industrial Competitiveness"Charles J. Glaser, U.S. Dept. of Energy 26
New Generation Sources And Transmission Issues
"A Summary of Utilities' Positions Regarding the Clean Air Act Amendments of 1990"Karl J. Nalepa, Public Utiltiy Commission of Texas 31
" Natural Gas as a Boiler Fuel of Choice in Texas"W. J. Kmetz. Public Utiltiy Commission of Texas 36
"Avoided Costs and Competitive Negotiations for Power from Qualifying Facilities in Texas"Sarut Panjavan and Ali Al-Jabir, Public Utility Commission of Texas 43
"Transmission Issues and Power Exchanges in Texas"Harold L. Hughes, Jr., Public Utiltiy Commission of Texas 51
"Reliable Gas Turbine Output: Attaining Temperature Independent Performance"James E. Neeley, Public Utility Commission of Texas,Sam Patton and Fred Holder, Patton Engineers 58
Superconductivity Applications/Super Collider
" Ensure Continuous Power to Critical Industrial Processes with the New Super-conducting Storage Device (SSD™)"Dr. Carel C. DeWinkel and Paul F. Koeppe, Superconductivity, Inc 63
Integrated Resource Planning at the PIJCT
"The Commission's Forecast 1992 Report: Important Resource Planning Issues"Parvis Adib, Public Utility Commission of Texas 68
"Streamlining the Certification Process for New Power Plants in Texas"Nat Treadway, Public Utility Commission of Texas 77
"Integrated Resource Planning: A Dialogue with ELCON"Nat Treadway and Gary Torrent, Public Utility Commission of Texas 85
"Strategic Rate Design: The Role of Industrial Tariffs"Jeffrey I. Rosenblum and Richard House, Public Utility Commission of Texas 9i
"Industrial Demand-Side Management in Texas"
Danielle Jaussaud, Public Utility Commission of Texas 98
Electrotechnology Research and Development in Universities
"Microwaves and Chemistry: The Catalyst of an Exciting Marriage"Dr. Jeff Wan, Queen's University, Canada 105" Impulse Drying of Paper: A Review of Recent Research"Dr. David I. Orloff, institute of Paper Science and Technology 110
"Volumetric in Situ Electrical Heating: An Unexploited Electrotechnology"J.E. Bridges, IIT Research Institute 117
"Microwave Enhanced Separation of Water-in-Oil Emulsions"Dr. C.S. Fang, University of Southwestern Louisiana, andPeter M.C. Lai, Industrial Technology Research Institute, Taiwan 125
"Chemical Applications of Electrohydraulic Cavitation for Hazardous Waste Control"Dr. Michael R. Hoffman, California Institute of Technology 132
"Membrane Separations Research"Dr. James R. Fair, University of Texas at Austin 136
Equipment/Process Improvement—Practical Applications, Part I
"Two Stage Vapor Compression Heat Pump with Solution Circuits: Cateringto Simultaneous Chilling and Water Heating Needs"Milind V. Rane, Energy Concepts Co., andReinhard Radermacher, University of Maryland 142
"Alternate Fuels: Is Your Waste Stream a Fuel Source?"Phil Coerper, Cleavei -Brooks 147
"Sryrene Purification and Recovery Using Freeze Crystallization" (Abstract Only)James A. Heist and Patrick J. Wrobel, FTC Acquisition Corp 150
"Gas Separation Membrane Use in the Refinery and PetrochemicalIndustries" (Abstract Only)Joe Vari, Hoechst Celanese 151
" Energy Efficiency in Cryogenic Fractionation through Distributive Distillation"C.R. Carradineand R.H. McCue, Stone & Webster Engineering Corp 152
Industrial Electrotechnnlogy for Environmental Improvement
"Acid/Base Recovery from Sodium Sulfate"Marilyn J. Niksa, ELTECH Research Corp 155
"Commercial Application of Freeze Crystallization"Dr. RobertG. Gorgol, HPD, Inc 161
"Electrochemical Ozone Production Technology for Industrial Wastewater Treatment"Mark Goodwin, ICI-Oxytech No Paper Submitted
"Advanced Oxidation Technology for Pulp Mill Effluent"J. Robert Hart, EPRI Pulp and Paper Office 167
"Industrial Gases as a Vehicle for Competitiveness"
James R. Dale, The BOC Group, Inc 170
Technologies for Implementing the Clean Air Act
"Controlling NOX to Obtain Offsets or Meet Compliance"John Mincy, Nalco Fuel Tech 173"Estimation and Reduction Methodologies for Fugitive Emissions from Equipment"Anthony Scataglia, Team, Inc 177
"NOX Dispatching in Plant Utility Systems Using Existing Tools"Ravi Nath and Jimmy D. Kumana, Linnhoff March, Inc 187
"Petroleum Coke: A Viable Fuel for Cogeneration"Raymond E. Dymond, The Pace Consultants, Inc 191
"VOC Emission Control with the Bray ton Cycle Pilot Plant Operations" (Abstract Only)
Joseph C. Enneking, NUCON International, Inc 198
Industry Utility Interface #2
"Demand Side Management (DSM) through Absorption Refrigeration Systems"Peter Y. Chaoand Deepak Shukla, TENSA Services, Inc., andAmmi Amarnath and Ed Mergens, EPRI 199"HL&P/Du Pont Cogeneration Project" (Abstract Only)H.H. Vadie, Houston Lighting & Power 208
"A Novel Approach to Determining Motor Load"Michael Brown, Georgia Tech Research Institute 209
"Process Integration Study of a Poultry Processing Plant"William A. Meffert, Georgia Tech Research Institute 214
Equipment/Process Improvement, Part II
"Environmental Protection through Energy Efficiency: Catalyzing New Opportunities"Joel B. Smith, U.S. EPA, and Andrew Silbiger, Bruce Co 219
i n
"Specifying Waste Heat Boilers"V. Ganapathy, ABCO Industries 220
"No Chemical, Zero Bleed Cooling Tower Water Treatment Process"Alden L. Coke, Aqua-Flo, Inc 225
"Steam Path Audits on Industrial Steam Turbines"
Douglas R. Mitchell, Encotech, Inc 229
Recent European Technology & Conservation Opportunities
"Energy Efficiency Improvement by Measurement and Control"Dr. Anders Martensson, Lund University, Sweden 236"Membrane Cells in Chlor Alkali Application" (Abstract Only)Dr. Klaus Lesker, Hoechst Uhde, GmbH, Germany 244
"Converting Petroleum Coke to Electricity"Anthony Pavone, SRI International 247
MEASURING AND UNDERSTANDING ENERGY EFFICIENCY CHANGES IN MANUFACTURING
Dwight K. French and Lynda T. CarlsonEnergy Information Administration
Christy A. HallMiddle Tennessee State University '
ABSTRACT
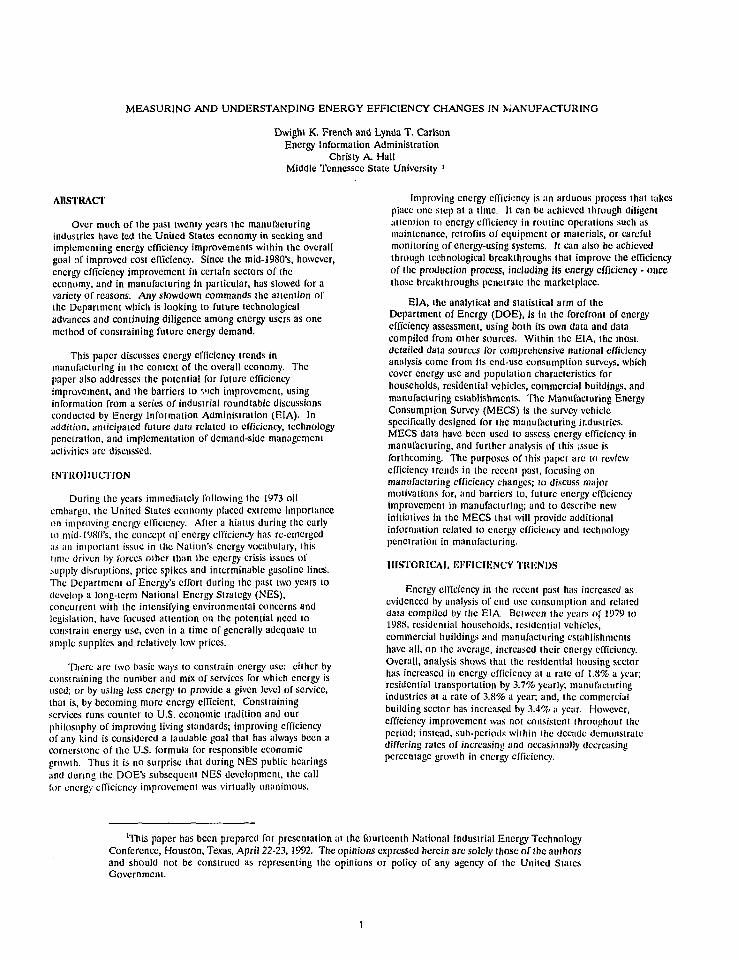
Over much of the past twenty years the manufacturingindustries have led the United States economy in seeking andimplementing energy efficiency improvements within the overallgoal of improved cost efficiency. Since the mid-1980's, however,energy efficiency improvement in certain sectors of theeconomy, and in manufacturing in particular, has slowed for avariety of reasons. Any slowdown commands the attention ofthe Department which is looking to future technologicaladvances and continuing diligence among energy users as onemethod of constraining future energy demand.
This paper discusses energy efficiency trends inmanufacturing in the context of the overall economy. Thepaper also addresses the potential for future efficiencyimprovement, and the barriers to s'ich improvement, usinginformation from a scries of industrial roundtablc discussionsconducted by Energy Information Administration (EIA). Inaddition, anticipated future data related to efficiency, technologypenetration, and implementation of demand-side managementactivities are discussed.
INTRODUCTION
During the years immediately following the 1973 oilembargo, the United States economy placed extreme importanceon improving energy efficiency. After a hiatus during the earlyto mid-l'JiSO's, the concept of energy efficiency has rc-emcrgedas an important issue in the Nation's energy vocabulary, thislime driven by forces olher than Ihc energy crisis issues ofsupply disruptions, price spikes and interminable gasoline lines.The Department of Energy's effort during the past two years todevelop a long-term National Energy Strategy (NES),concurrent with the intensifying environmental concerns andlegislation, have focused attention on the potential need toconstrain energy use, even in a time of generally adequate toample supplies and relatively low prices.
There arc two basic ways to constrain energy use: either byconstraining the number and mix of services for which energy isused; or by using less energy to provide a given level of service,that is, by becoming more energy efficient. Constrainingservices runs counter to U.S. economic tradition and ourphilosophy of improving living standards; improving efficiencyof any kind is considered a laudable goal that has always been acornerstone of the U.S. formula for responsible economicgrowth. Thus it is no surprise lhat during NES public hearingsand during the DOE's subsequent NES development, the callfor energy efficiency improvement was virtually unanimous.
Improving energy efficiency is an arduous process lhat takesplace one step at a time. It can be achieved through diligentattention to energy efficiency in routine operations such asmaintenance, retrofits of equipment or materials, or carefulmonitoring of energy-using systems. It can also be achievedthrough technological breakthroughs that improve the efficiencyof the production process, including its energy efficiency - oncethose breakthroughs penetrate the marketplace.
EIA, the analytical and statistical arm of theDepartment of Energy (DOE), is in the forefront of energyefficiency assessment, using both its own data and datacompiled from other sources. Within the EIA, the most,detailed data sources for comprehensive national efficiencyanalysis come from its end-use consumption surveys, whichcover energy use and population characteristics forhouseholds, residential vehicles, commercial buildings, andmanufacturing establishments. The Manufacturing EnergyConsumption Survey (MECS) is the survey vehiclespecifically designed for the manufacturing industries.MECS data have been used to assess energy efficiency inmanufacturing, and further analysis of this ;ssuc isforthcoming. The purposes of this paper are to reviewefficiency trends in the recent past, focusing onmanufacturing efficiency changes; 10 discuss majormotivations for, and barriers to, future energy efficiencyimprovement in manufacturing; and to describe newinitiatives in the MECS lhat will provide additionalinformation related to energy efficiency and technologypenetration in manufacturing.
HISTORICAL EFFICIENCY TRENDS
Energy efficiency in the recent past has increased asevidenced by analysis of end use consumption and relateddata compiled by the EIA. Between the years of 1979 to19S8, residential households, residential vehicles,commercial buildings and manufacturing establishmentshave all, on the average, increased their energy efficiency.Overall, analysis shows lhat the residential housing sectorhas increased in energy efficiency at a rate of 1.8% a year;residential transportation by 3.7% yearly; manufacturingindustries at a rate of 3.8% a year; and, the commercialbuilding sector has increased by 3.4% a year. However,efficiency improvement was not consistent throughout theperiod; instead, sub-periods wiihin ihc decade demonstratediffering rates of increasing and occasionally decreasingpercentage growth in energy efficiency.
'This paper has been prepared for presentation at the fourteenth National Industrial Energy TechnologyConference, Houston, Texas, April 22-23,1992. The opinions expressed herein are solely those of the authorsand should not be construed as representing the opinions or policy of any agency of the United SlatesGovernment.

Each sector covered by the energy consumption surveysis examined in turn. Discussion of each sector focuses onenergy consumption per individualized unit of measure, asan indicator of energy efficiency, and average percentchange in energy efficiency for the intervening periods.
RESIDENTIAL HOUSEHOLDS
Energy efficiency in residential households is measuredby consumption per square foot, as shown in Table 1. Thebroad category of "housing" is broken down into housingstructure and for each the average consumption per squarefoot is given. The consumption per square foot for thetotal of all housing structures can be found at the bottomof the table.
From these data, the average annual percentage change inenergy efficiency for the intervening lime periods can becalculated. The estimates of average annual percent change arcshown in Table 2. For all percent tables in this paper, positiveentries indicate decreases in consumption rales, i.e., efficiencyimprovements; negative entries indicate increases inconsumption rates, i.e., efficiency declines. The estimatesindicate that overall efficiency change was not constant. Thelargest efficiency increases occurred during the early 1980's. Inmore recent years, attention to efficiency may have diminishedalong with other energy concerns.
Tuble 1. Consumption Per Square Foot In ResidentialHouseholds (Thousand Ittu)
Household Structure
Single/Family DetachedSingle/Family AttachedBuilding Of 2-4 UnitsBuilding Of 5 + UnitsMobile HomeTotal
1980
58.5364.23101.3893.15103.5271.08
1982
54.4761.7087.0888.6784.8565.07
1984
57.2058.07S3.6987.4186.6866.81
1987
53.2052.1780.5180.5488.8262.69
Source: Energy Information Administration, Residential EnergyConsumption Survey
Tuhle 2. Average Annual Percent Decrease In ResidentialHousehold Energy Consumption Per Square Foot
Household Structure
Single/Family DetachedSingle/Family AttachedBuilding Of 2-4 UnitsBuilding Of 5 + UnilsMobile Home
Total
1980-1982
3.52.07.32.49.54.3
1982-1984
-2.53.02.00.7
• 1 . 1-1.3
1984-1987
2.43.51.32.7-0.82.1
Source: Energy Information Administraiion, Residential EnergyConsumption Survey
RESIDENTIAL VEHICLES
Fuel efficiency of residential vehicles is measured inmiles driven per gallon of fuel consumed. Fuel efficiency forthe entire licet and for several vehicle lype categories can befound in Table 3.
Once again by considering consecutive years ofcompiled data, average annual percent change in efficiency canbe computed for intervening time periods (Table 4). [In 1983,data were not available for vans or jeep-like vehicles; Ihereforc,for these vehicle types percent change in fuel efficiency is notavailable for (he 1983-1985 period.]
Although sustained and increasing growth in fuelefficiency is suggested, the small range of years for which datawere available, the differing level of detail by vehicle type, andother methodological changes in survey procedures limit theconclusions that can be drawn regarding growth in efficiency.
Table 3. Average On-Roud Miles Per Gallon For TheResidential Vehicle Stock
Type Of Vehicle 1988
Passenger CarVanJeep-Like VehiclePick-Up Truck
Fleet Total
16.0N/AN/A13.315.5
17.213.212.713.516.1
19.715.115.415.318.6
N/A: Not Available.Source: Energy Information Administration, Residential Energy
Consumption Survey.
Table 4. Average Annual Percent Chance In On-RoadMiles Per Gallon For The Residential VehicleStock
Type Vehicle 1983-1985 1985-1988
Passenger CarVan
Jeep-Like Vehicle'Pick-Up Truck
Fleet Total
3.6N/AN/A0.71.9
4.64.66.64.34.9
Source: Energy Information Administration, Residential EnergyConsumption Survey
COMMERCIAL BUILDINGS
Energy efficiency in commercial buildings is measuredas Biu consumed per square foot by principal building activity(Table 5). The estimate of average annual percent change inefficiency over all building types is slighlly larger in 1979-1983than in 1983-19S6 (Table 6). However, sampling variability andchanges in survey methodology may have been the causes.
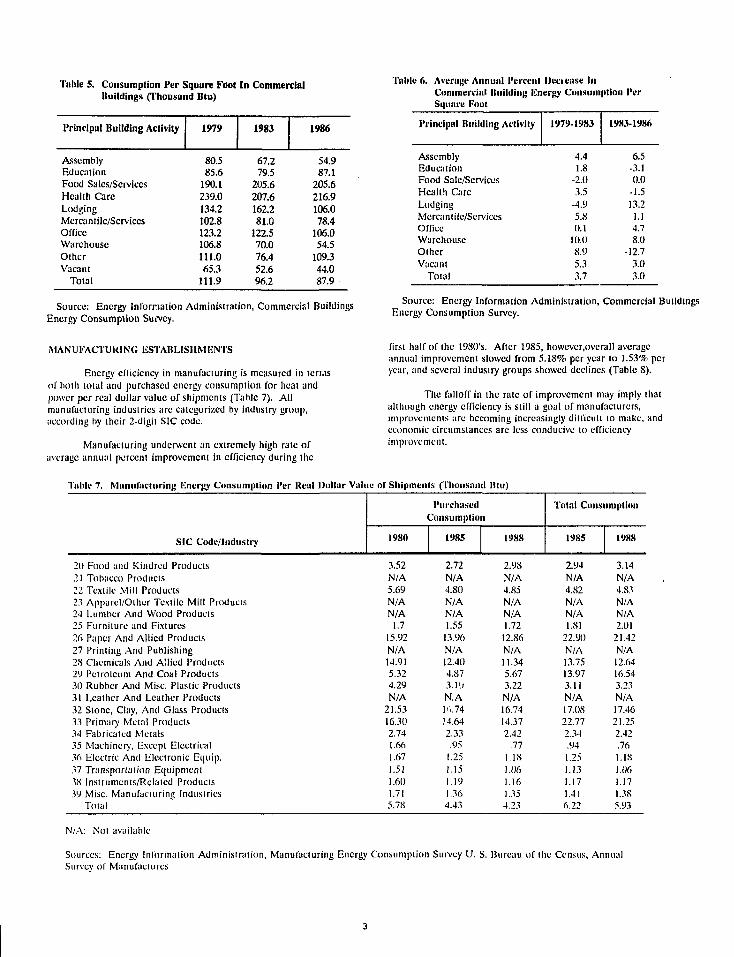
Table 5. Consumption Per Square Foot In CommercialBuildings (Thousand Btu)
Principal Building Activity
AssemblyEducationFood Sales/ServicesHealth CareLodgingMercantile/ServicesOfficeWarehouseOtherVacant
Total
1979
80.585.6
190.1239.0134.2102.8123.2106.8111.065.3
111.9
1983
67.279.5
205.6207.6162.281.0
122.570.076.452.696.2
1986
54.987.1
205.6216.9106.078.4
106.054.5
109.344.087.9
Source: Energy Information Administration, Commercial BuildingsEnergy Consumption Survey.
Table 6. Average Annual Permit Den ease InCommercial Ituildin^ iLiieriy Consumption PerSquare Font
Principal Huilding Activity
AssemblyEducationFood Sale/ServicesHealth CareLodgingMerca n t i Ic/Sc rviccsOfficeWarehouseOtherVacant
Total
1979-1983
4.41.8
-2.03.5
-4.95.80.1
10.08.95.33.7
1983-1986
6.5-3.10.0
-1.513.21.14.78.0
-12.73.03.0
Source: Energy Information Administration, Commercial BuildingsEnergy Consumption Survey.
MANUl'ACTUklNG USTAIIMSIIMGNTS
Energy efficiency in manufacturing is measured in ten.isof holh total and purchased energy consumption for heat andpower per real dollar value of shipments (Table 7). Allmanufacturing industries are categorized by industry group,according by their 2-digit SIC code.
Manufacturing underwent an extremely high rate ofaverage annual percent improvement in efficiency during the
first half of the 19S0's. After 1985, howcver.overall averageannual improvement slowed from 5.18% per year to 1.53% peryear, and several industry groups showed declines (Table S).
The falloff in the rate of improvement may imply thatalthough energy efficiency is still a goal of manufacturers,improvements are becoming increasingly difficult to make, andeconomic circumstances arc less conducive to efficiencyimprovement.
Table 7. Mniiul'actiirin}; Energy Consumption Per Ke:il Dollar Vali
SIC Code/Industry
e nr Shipments (Thousand Hlti)
PurchasedConsumption
1980 1985 1988
Total Consumption
1985 19KK
20 Food and Kindred Products21 Tobacco Products22 Textile Mill Products23 Apparel /Other Textile Mill Products24 Lumber And Wood Products25 Furniture and Fixtures26 Paper And Allied Products27 Printing And Publishing2S Chemicals And Allied Products29 Petroleum And Coal Products30 Rubber And Misc. Plastic Products31 Leather And Leather Products32 Stone, Clay, And Glass Products33 Primary Metal Products34 Fabricated Mt ia l s35 Machinery, Except Electrical36 Electric And Electronic Equip.37 Transportation Equipment38 Instruments/Related Products39 Misc. Manufaclurini; Industries
Total
3.52N/A5.69N/AN/A
1.715.92N/A14.915.324.29N/A
21.5316.302.741.661.671.511.601.715.78
2.72N/A4.80N/AN/A1.5513.96N/A12.404.873.10N.A1'..7414.642.33.95
1.251.151.191.364.43
2.98N/A4.85N/AN/A1.7212.86N/A11.345.673.22N/A16.7414.372.42
.771.181.061.161.354.23
2.94N/A4.82N/AN/A1.81
22.90N/A13.7513.973.11N/A17.0822.772.34.941.251.131.171.416.22
3.14N/A4.S3N/AN/A2.0121.42N/A12.6416.543.23N/A17.4621.252.42.761.18J.061.171.385.93
N/A: Not available
Sources: Energy Information Administration, Manufacturing Energy Consumption Survey L'. S. Bureau of the Census, AnnualSurvey of Manufactures
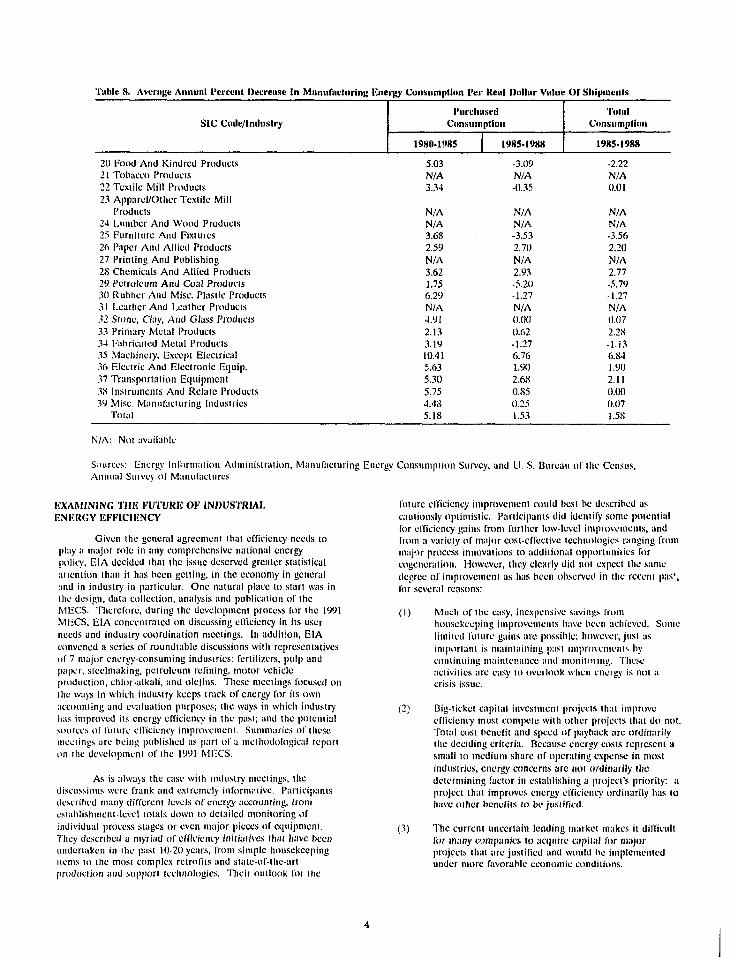
Table 8. Average Annuul l'crccnt Decren.se
SIC Code/Industry
In MiimifiH'tiirini; Energy Consumption 1'ti KenI Dollur Value
PurchasedConsumption
1980-1985 1985-1988
Or Shipments
TolnlConsumption
1985-198K
21) Food And Kindred Products21 Tobacco Products22 Textile Mill Products23 Apparel/Other Textile Mill
Products24 Lumber And Wood Products25 Furniture And Fixtures26 Paper And Allied Producls27 Printing And Publishing28 Chemicals And Allied Producls29 Petroleum And Coal Products30 Rubber And Misc. Plastic Products31 Leather And Leather Products32 Stone, Clay, And Glass Products33 Primary Mclal Products34 Fabricated Metal Producls35 Machinery, Except Electrical36 Electric And Electronic Equip.37 Transportation Equipment3S Instruments And Relate Products39 Misc. Manufacturing Industries
Total
5.03N/A3.34
N/AN/A3.682.59N/A3.621.756.29N/A4.912.133.1910.415.635.305.754.485.18
-3.09N/A-0.35
N/AN/A-3.532.70N/A2.93-5.20-1.27N/A0.(M)0.62-1.276.761.902.680.850.251.53
-2.22N/A0.01
N/AN/A-3.562.20N/A2.77-5.79-1.27N/A(1.072.2S-1.136.841.902.110.000.071.58
N/A: Not available
Sources: Energy Information Administration, Manufacturing Energy Consumption Survey, and U. S. Bureau of the Census,Annual Survey of Manufactures
EXAMINING THE FUTURE OF INDUSTRIALENERGY EFFICIENCY
Given the general agreement that efficiency needs toplay a major role in any comprehensive national energypolicy, E1A decided that the issue deserved greater statisticalattention than it has been getting, in the economy in generaland in industry in particular. One natural place to start was inHie design, data collection, analysis and publication of theMECS. Therefore, during the development process for the 1991MECS, EIA concentrated on discussing efficiency in its userneeds and industry coordination meetings. In addition, EIAconvened a series of roundlable discussions with representativesof 7 major energy-consuming industries: fertilizers, pulp andpaper, sleelmaking, petroleum refining, motor vehicleproduction, chlor-alkali, and olefins. These meetings focused onthe ways in which industry keeps track of energy for its ownaccounting and evaluation purposes; the ways in which industryhas improved its energy efficiency in the past; and the potentialsources of future efficiency improvement. Summaries of thesemeetings are heing published as part of a methodological reporton ihe development of the 1991 MECS.
As is always the case with industry meetings, thediscussions were frank and extremely informative. Participantsdescribed many different levels of energy accounting, fromesiahlishment-level totals down to detailed monitoring ofindividual process stages or even major pieces of equipment.They described a myriad of efficiency initiatives that have beenundertaken in the past 10-20 years, from simple housekeepingitems to the most complex retrofits and state-of-the-artproduction and support technologies. Their outlook for the
future efficiency improvement could best be described ascautiously optimistic. Participants did identify some potentialfor efficiency gains from further low-level improvements, andfrom a variety of major cost-effective technologies ranging frommajor process innovations to additional opportunities forcogencration. However, they clearly did not expect the samedegree of improvement as lias been observed in the recent pas'.,for several reasons:
(1) Much of the easy, inexpensive savings fromhousekeeping improvements have been achieved. Somelimited future gains are possible; however, just asimportant is maintaining past improvements bycontinuing maintenance and monitoring. Theseactivities are easy to overlook when energy is not acrisis issue.
(2) Big-ticket capital investment projects that improveefficiency must compete with other projects that do not.Total cost benefit and speed of payback are ordinarilythe deciding criteria. Because energy costs represent asmall to medium share of operating expense in mostindustries, energy concerns are not ordinarily thedetermining factor in establishing a project's priority: aproject that improves energy efficiency ordinarily has tohave other benefits to be justified.
(3) The current uncertain lending market makes it difficultlor many companies to acquire capital for majorprojects that arc justified and would be implementedunder more favorable economic conditions.

(4) Even when major capital projects are implemented,cost pressures cause tne company to cut corners tocomplete the project as inexpensively as possible.Energy savings are sometimes such a corner.
(5) Staff that have to do with energy use, whetherplanners, manners, engineering designers, ormaintenance, z< being cut back or eliminated aspart of the pro< .ss of making industry leaner andmore competitive. Many companies simply do nothave the time or people to design, install, maintain,and operate a new system for optimum energyperformance.
(6) Many process changes arc undertaken because oflegal requirements, such as the Clean Air Act,which supersede cost considerations. Some suchprojects, such as waste heat recovery and combustorretrofits, bring accompanying energy savings; others,such as the reformulation of gasoline, increaseenergy use.
Comprehensive data as well as understanding is needed toassess costs and energy benefits if DOE is to develop areasoned approach for encouraging and supportingcontinued improvement in energy efficiency under theseconditions. Accordingly, the EIA designed ihc 1991 MECSto collect additional data on components of manufacturingenergy use, penetration of slaic-of-thc-art technologies, andinvolvement in demand-side management programs.Examples of the questionnaire sections addressing theseissues arc given at the end of the paper.
To deal with the components of energy use, EIA isasking MECS rcspondenis to estimate the proportion of theconsumption of major energy sources devoted lo major enduse categories. The category lisl is obviously a compromiseamong the many versions of energy brcol:Jowns describedby industry. Data from this inquiry will provide bounds onthe potential effects of classes of efficiency improvements.
Also, EIA is asking MECS respondents to identifyif certain major state-of-the-art technologies, cither genericor specific to their particular industry', were in place during1991. Further questions could be asked regarding percent
penetration within an establishment, or if there arcpractical reasons why seemingly applicable technologies arcnot being used, but this level of questioning quicklybecomes onerously burdensome to rcspondenis and difficultto analyze usefully.
Finally, EIA is asking rcspondcnis to identifyparticipation in demand-side management, to assess thepenetration of these types of programs. These data willalso be useful for an upcoming EIA project to develop andpublish a periodic, comprehensive report on energyefficiency in the U.S. economy. The primary goals of theoverall project arc:
(1) lo d:vclop a single consistent concept of energyefficiency across all major energy-consumingsectors;
(2) to separate the effects of structural and behavioralchanges in the consuming sectors from effects dueto changes in efficiency as defined above;
(3) to produce benchmark measures of efficiencychange by sector, and perhaps a single globalefficiency change measure for the entire economy.If a meaningful overall measure could bedeveloped, it would serve as a benchmark index ofthe nation's progress in using energy in the mostresponsible manner possible.
SUMMARY
American industry has historically beer, in theforefront of the country's efforts to use energy asresponsibly as possible. With limited additional efficiencyimprovements available from routine maintenance activity,technology will play an ever-increasing role in industry'sfuture efforts to squeeze as much possible benefit from eachunit of energy consumption. It is important that when newtechnology is developed, marketed and implemented, it iswith energy efficiency as cither a primary objective or anaccompanying benefit, if at all possible. The provider, theuser, and the U.S. economy can all be long-term winnersunder such a strategy.

p Section IV - ESTIMATED PERCENT CONSUMPTION BY END USE
Reasonable Approximations are Acceptable - See Instructions
Energy sources can be consumed either directly, ithrough conversion lo steam and hot water in a berepresented by the single percent entry for bienergy Thus, the percentages entered for boiler ft.
End uses
(11
1 . Copy Section 1 line 12 coluiTin 12)quantity for electricity to column(21. Copv Section II column (9)quantities for the energy sourcesin columns 131 through (7)
Ft
lotelElectricity
Consumption
ici] (21
1.000 kWh
i equipment such as motors, furnaces, kilns, etc , or indirectlyi er. All indirect use of energy eources listed below areliler fuel. The remaining categories are to split out direct use ofel and all direct uses should sum to 100 percent.
Total CoalExcludingCoat Cnko
and Bretve
46] (31
Short Tons
Total NaturalGas
30] HI
1.000 cu ft
TotalDistillate Fuel
Oil andDiesel Fuel
«] (51Barrels
Total LPGandNGL
5*1 (61
Gallons
Hes>rJua!Fuel O.i
3Ti (7)
Barrels
2. For the columns with nonzero entries in ;UII» 1, r»port the approximate percentlgt of each energy source used for the following purposes.{Complete one column before staninp another./
A. IOILERS
1. Boiler fuel F,
B. DIRECT PROCESS USES
1. Process heating (e.g. kilns.lurnaces ovens '?
2. Process cooling and refrigeration \T~
3. Machine drive ic g . motors,pumps, etc associated wtthmanufacturing procussequipment! |7
4 . ElfClro-chemira: processes ^E
5. Other IPIease specify' any otheruses of energy in the 'Remarks'portion of the Questionnaire i (76
C. DIRECT NON-PROCESS USES
1. Facility hea; i p ventilation, andair conditronrntj .77
2. Facility lighting yjs
3. Facility support other than Cland C2 above le g . cooking,water heating office equipment) [79
4. Onsite transportation [BO
5. Conventional electricitygene'at'on ja i
G Ohe- 'Please specify any otheruips of energy m the 'Remarks' tportion of the Questionnaire I p.s
TOTAL •'.• an p-.irpo'.f*
TotalElectricity
Consumption
%
%
%
• /o
%
%
%
%
V.
%
%
100%
Total CoalExcludingCoal Coke
and Breeze
%
%
%
%
%
%
»/o
%
%
100%
Total NaturalGas
%
%
%
%
%
%
V,
%
•/o
%
100%
TotalDistillate Fuel
Oil andDiesel Fuel
%
%
%
%
%
%
V,
%
%
•/.
100%
Total LPGand NGL
%
%
%
%
%
%
%
V.
%
%
100%
Residua!Fuel Oil
%
%
%
%
%
%
%
%
%
100%
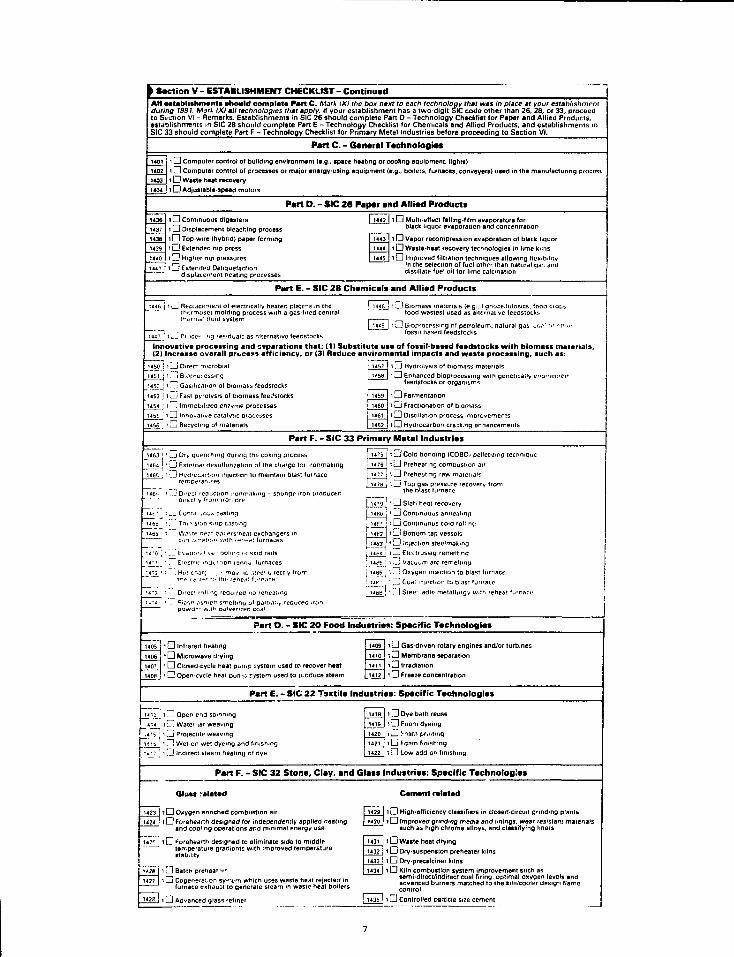
> Section V - ESTABLISHMENT CHECKLIST - ContinuedAH establishments should comptata Part C. Mark tX> the box next to each technology that was in place at your establishmentduring 1991. Mark (X) all technologies that apply. If your establishment has a two-digit SIC code other than 26. 28, or 33, proceedto Section Vt - Remarks. Establishments in SIC 26 should complete Part 0 - Technology Checklist for Paper and Allied Products,establishments in SIC 28 should complete Part E - Technology Checklist for Chemicals and Allied Products, and establishments inSIC 33 should complete Part F - Technology Checklist for Primary Metal Industries before proceeding to Section VI.
Part C. - General Technologies
1 0 Computer control of building environmtnt li.g., space heating or cooling equipment, lights)1 D Computer control of processes or major energy-using equipment (e.g.. boilers, furnaces, conveyers) used in the manufacturing processi G Wane h t i t r*cov«ry1 0 Adjustable-speed motes
Part D. - SIC 26 Paper and Alli.d Products
t G Continuous digestersl O Displacement bleaching process
1O Top-wire (hybrid) paper formingi G Extended nip press1G Higher nip pressures
i 3 Extended Deliquefacfiondisplacement heating processes
f H4? 1 t G Multi-effect falling-film evaporators forblack liquor evaporation and concentration
I G Vapor recompression evaporation of black liquori G Waste-heat recovery technologies in lime kilnsi O jmproved filtration techniques allowing flexibility
in the selection of fuel other than natural gar. anddistillate fuel oil for lime calcination
Part E. - SIC 28 Chamicali and Allied Product*
masel molding process with a gas-fired centralr.a! fluid system
food wastes) used
j Biop'ocessmg nf petroleum, naiura! gai> tofossil based feedstocks
Innovative processing and separations that; (1) Substitute use of fossil-based feedstocks with biomasi(2) Increase overall process efficiency, or (31 Reduce •nviromental impacts and waste processing, such
mati•*:
trials.
1 i 8>opiu:essinc;
' ; Gasification ol biomasb feedstocks
i _J Fast pyrolysis of biomass feeCstocks
t n Immobilrjeo en?yme processes— i .
' ! i Recycling ol materials
i ,_J Hydrolysis of biomasi: materialsi G Enhanced bioproccssmg wilh genetically e
feedstocks or organiims
3 Fermentation
i - I Fractionalion of biomass
1 [~1 Distillation process improvementsJ 146? i G Hydrocarbon cra:k.ng enhancements
Part F. - SIC 33 Primary Metal Industrial
1 j Dry quenching during the coking process
i; ! Extema' desulfunzation of the cha'ge tor ironmaking
i L3 Hyd'OLsrt.on injfcction to maintain blast furnace
ron produced146-.
T45r'
i46i> •
TO : •1 4 - 1 '
14?? ' 1
' i ~3 •
i i - t '
. J Direct recaii-tct'v '
.JCont.r
'""Ev-pr.~ EiRCt'l
7". HM! cr:
_ Direct. piasn
Dowclr
om"°onrS
j * castmci
.'in S>np cist
I f
o l
ooiinJif :ion i
' . • r n O .
mg requi
e>i sTieltth pulwer
re
ng
,.
n r
.-•
eo
nt j
-tfur
.^pe1
no re
o< pa
?ed coai
- sponge
naces
ails
•ices
<* rectly f
eatmg
I.aKy red
; u?b 11 O Cold bonding (COBOt (>elleti/ing techniqueI u76 • Q Prehea*mg comoustion airI 14?? 11 H3 PrehCiVing raw material?
! 1*28 j l , ! Top gas pressure recovery Jromthe blast furnace
i u^g^ ' Hi Slab heat recovery
UHO j O Continuous anne.'ilnui• 14£1J ' D Continuous cold rollmpI ]<p?J i L J Bottom tap vessels
14&3 J 1 G iniecUon steelmakmgi ub< i 1 I Electrusiay femeltinti! uf^J O Vacuuai arc remelnntjj i486, ' —J Oxygen injection to blast iur-iace
! isyi " ,1] Coa! inectto" IQ blast tumace
( 14BH 11 HJ Stee' ladie metaNmgy with reheat fn'nart1
Part D. - SIC 20 Food Industrial: Specific Tschnologias
Q Infrared healing
; D Microwave drying
1 G Closed-cycle heat pun.c system used tp recover h ta t1 G Open cycle heat pun-o system used to produce steam
1409
14
14
14
10
11
12
1G Gas-driven rotary engines and/or turbines
1G Membrane separation
i G Irradiation
i G Freeze concentration
Part E. - SIC 22 Tsxtila Industrial: Specific Technologies
ii_j i 3 Open end spinning
J _ " 2 1 J ' L J Wate-iar weaving
sj ' G Wet-on wet dyeing and finishing' ' i H Indireci steam heating of dye
i G Dye bath reuse
iGFoam dyeingt^J r-iatvi pr.ntinqI Q Fcsm finishingI G Low-add-on finishing
Part F. - SIC 32 Stone, Clay, and Glass Industries: Specific Technologies
Qlast related
J i G Oxygen enriched combustion airJ iGForehearth designed for mdependentfy applied heating
and cooling operations and minimal energy use
11 G ^urehearth designed to eliminate side to middlertn.perature gradients with improved temperaturesiaLi. lit y
i G Batch prehea*1^i G Cogeneralion sy-"fcm which uses waste heat rejected in
furnace ex haunt to generate steam in waste heat boilers
1 3 Advanced glass refiner
Cement related
1Q High-efficiency classifiers in closed-circuil grinding plants7 D Improved grinding medi* and linings, wear resistant maienals
cuch as high chrome alloys, and classifying liners
i G Waste heat drying
i G Dry-suspension preheater kilns
i G Drv-precatciner kilnsi G Kiln combustion system improvement such as
semi-direct/indirect COHI firing, optimal oxygen levels andadvanced burners matched to the kiln/cooler design flamecontrol
i G Controlled particle size cement

Part B. Energy Management Activities
1. Was your establishment involved in any formal programs (company, utility, or third-party sponsored! at any time betweenJanuary 1, 1989 and December 31, 1991 that were specifically targeted and designed to improve energy efficiency, reduceenergy costs, or promote the use of a different energy source?
Piocecd to Question 2.
2. Did your electric or natural gas utility sponsor programs designed to lower/adjust your e .ergy consumption or costs,timing, or promote the use of a different energy sejree lie., a Demand Side Management (DSM) programl at any timebetween January 1, 1989 and December 31. 1991? (Mark (XI one.) if the answer to this question is "Yes', proceed toQuestion 3. If the answer is no! 'Yes", proceed to the instructions before Question 4.
3 HI Establishment did not purcnase electricity or natural gas from a uMitd ^ ; Don't Know
3. If you answered "Yes" to Question 2, did your establishment participate in a utility sponsored program ?. any timebetween January 1, 1989 and December 31. 1991?
5~! lLJYcc. 2D lMo
I If \cu answered "Yes" to either Question 7 or Question 3, proceed to Question 4. If you answered "No" to hot':I Queslior, 1 and Question 3. proceed to Part C - General Technologies Checklist, on page 8
A. In what typeis, of energy efficiency activity(tes) was your establishment involved between January 1, 1989 andDecember 31 1991' (Mark (X> all that apply. Note that it is possible to have marks in both columns for any or ali of theactivities listed.'
Energy Efficiency Activities
m
a. Energy audits
Utility/SupplierSponsored Involvement
Involvement Through Own orOther (3rd Partyl Sponsorship
(31
1LJ
b. Direct electricity load control
c. Special rate schedule (e.g., interruptible or time-of-useld. Equipment installation or retrofit for the primary purpose of
improving energy efficiency affecting:
(1) Steam production (e.g., boilers, nozzles)
(2) Direct/indirect process heating
(3) Direct process cooling, refrigeration
(4) Direct machine drive (e.g., adjustable speed drives,motors, pumps)
(S) Facility heating, ventilation and air conditioning
(6) Facility lighting
. Equipment retrofit or installation for the primary purpose ofusing a different energy source (e.g., electrification)Exclude modifications made principally for energy efficiency
f. Standby generation program
Equipment rebates
Other (Specify) p
.D
1328 I >n
(..12)
1330 |
I 133; ;
[ I39B |
1333
139S
CONTINUE WITH PART C, ON PAGE 8. Page 7
EPRI'S INDUSTRIAL ENERGY MANAGEMENT PROGRAM
ED MERGENSMANAGEREPRI'S CHEMICALS & PETROLEUM OFFICEHOUSTON, TEXAS
LESLIE NIDAYOPERATIONS MANAGEREPRI'S AMP PROGRAMCOLUMBUS, OHIO
ABSTRACT
The loss of American industry jobs to foreigncompetition is made worse by national concernsover fuels combustion and other industrialactivity effects on our environment. Energyefficiency programs and new electrical processescan play a major role in restoring the environmentand in creating a stronger industrial sector inthe national economy. Since 1984 the ElectricPower Research Institute has been establishingindustry specific Centers and Offices nationwideto assist electric utilities and their customersin managing for a better use of energy. Hundredsof joint industry/utility projects are funded at alevel in excess of $10 million annually. Byproviding technical guidance and sponsoringresearch and development projects, these Centersand Offices are a key element in EPRI's role ofimproving the value of electricity to consumers.The specific contributions of this program and howindustry and utilities can jointly benefit fromits activities are discussed.
BACKGROUND
The rapid loss of competitiveness of Americanindustry in international markets is an extremelyserious problem with wide-ranging consequences forthe Nation's societal well-being, politicalinfluence, and security. There is nationalconcern about the combustion of fossil fuels andthe potential effect on our environment.Municipal planners and the public have becomeincreasingly aware of the potential inadequacy ofessential services such as water supply, sewagetreatment, waste disposal, resource recovery, andrecycling. New electric processes can play majorroles in the development of these essentialservices thus supporting national objectives for aclean environment and a strong economic future.
The Electric Power Research Institute (EPRI)recognizes that the management of energy use andthe environmental impacts of industrial activityare of national importance. To support EPRImembers and their industrial customers, the EPRIIndustrial Program seeks to develop anddemonstrate electric-based technologies that helpmeet the challenges facing U.S. industry.
Specific goals are to provide aninfrastructure for collaborative research,development, and technology transfer throughregional Centers and Offices; enhancing thedevelopment of electrotechnology applications inU.S. industry; and accelerating informationtransfer. Utilities/industry can participate inthe hundreds of RSD projects funded by EPRI eachyear; annual funding exceeds $10 r llion.
EPRI's industrial RSD focuses on three keyissues: productivity/efficiency, environmentalconcerns, and product quality.
To address the diverse technology needs ofindustry three sectors have been defined:
Materials Fabrication—machinery,transportation and equipment fabricationusing plastics, ceramics, composites, metals,and wood
Materials Production—metals, glass, andmining/minerals processing
Process Industries—food and agriculture, pulpand paper, textiles, chemicals, and petroleum
Efforts in each sector include research,development, and commercialization projects. Inaddition, the Program has identified a number ofnonmanufacturing challenges where significantsocietal benefits can be achieved throughapplication of industrial electrotechnologies.Under development are projects on municipal waterand sewage treatment and the safe disposal ofmedical waste.
RSD APPLICATION CENTERS/OFFICES
EPRI R&D Applications Centers/Officesfacilitate interaction between member utilitiesand industry; foster research, development, anddemonstration of coBt-effectiveelectrotechnologies; and offer educationalopportunities. Technical support, throughconsulting and publication services, plays asignificant role in the transfer of technologybetween the Centers, Offices, and utilities.
As well, the Centers and Offices leverageresources through collaborative funding; enhanceimpact through industrial participation; andestablish recognition and support from governmentagencies, universities, and trade associations.The Tailored Collaboration Program allows EPRI tomatch additional funds generated by utilities andcustomers to increase the size and scope ofproposed RSD projects.
The Environment and Energy Managementactivities support the Centers/Offices byadvancing cross-cutting technology and throughcoordination with other EPRI Programs/Divisionshaving related technical objectives.
Center for Materials Fabrication (CMFIOver 250,000 companies, mostly small and medium-sized, comprise the materials fabrication sector.These fabrication activities use ISO billion kwhper year at an average rate of 5.7* per kWh andgenerate over $8 billion in revenues. For thosecompanies, keeping abreast of developments andopportunities is often difficult. Investing inthe research and development to apply processdevelopments and equipment modification is oftenimpossible.
In recognition of these challenges, the EPRICenter for Materials Fabrication (CMF) was foundedin 1983 at Battelle Columbus to promote andencourage the adoption of efficienteleetrotechnologies in the fabrication sector.CMF focuses on machinery, transportation, andequipment fabrication technologies. Materialsunder evaluation at CMF include plastics,ceramics, composites, metals, and wood.Activities include heating, drying, and curingresearch and direct application such as thoseusing induction, infrared, microwave, and radiofrequency technologies. Especially significantare environmental challenges being addressedthrough new process development and end-of-the-pipe technologies. Recently complete/on-going R&Dprojects for CMF include: infrared-assistedfilament winding, microwave sintering of ceramics,transverse flux induction heating, dry processingof PC board, and the evaluation ofelectrotechnology applications program.
Center for Materials Product ion(CMP)The materials production sector consumes more than193 billion kWh per year, representing over 24% ofall industrial electricity use. At an industryaverage of 3.5C per kWh, this represents utilityrevenue of about $6 billion per year.
EPRI's Center for Materials Production (CMP)was established in 1984 at the Carnegie MellonResearch Institute and focused on metalsproduction. In 1989, CMP's scope was expanded toinclude glass and mining/minerals processing, withadditional emphasis on the foundry industry. In1989, a foundry office was established in Chicago,and a mining and minerals processing office openedin Denver with a branch office in Reno, Nevadadedicated to precious metals. Recentlycompleted/on-going R&D projects for CMP include:investment casting-microwave dewaxing, foundry IRsand reclamation, foundry plasma ladle refining,plasma cupola commercialization, and EAF dusttreatment commercialization-
Process Industry Qffices(ProiThe United States food and agriculture, textiles,chemicals, and petroleum industries consume 320billion kWh per year, almost as much electricityas the combined total of the materials productionand materials fabrication industries. At anindustry average of <K per kWh, the annual revenueto utilities exceeds $10 billion.
Opportunities for new applications includethe use of motor drives in place of steam turbinesand other nonelectric drives; cost effectiveapplications of heat pumps; innovative processessuch as freeze concentration, infrared, radiofrequency, and microwave; high-efficiency motors;and adjustable sr»=ed drives.
In 1990, Process Industry Offices (PIO) wereestablished to support key sectors of theindustry. The Textile Office is located at NorthCarolina State University in Raleigh, pulp andpaper activities are handled from the AtlantaOffice at the Institute of Paper, Science &Technology, Georgia Tech University, petroleum andchemicals at the University of Houston, and foodand agriculture in Palo Alto. Recentlycompleted/on-going R&D projects for PIO include:freeze concentration of dairy products,application of ultrasound in textile processing,advances in mechanical pulping, solvent recoveryby industrial heat pumps, and industrial processintegration/optimization case studies.
Environment and Energy ManagementThe efficient use of industrial
electrotechnologies extends beyond therequirements for manufacturing processes. Forexample, the public has become increasinglyconcerned about the potential inadequacy ofessential services such as a clean water supply,sewage treatment, waste disposal, and resourcerecovery/recycling. Electric-based technologiescan play major roles in helping to find cost-effective solutions to these problems. In theIndustrial Program, Environment and EnergyManagement activities are directed toward thefollowing areas:
Waste and Water Treatment.Electrotechnologiesoffer significant benefits in waste minimizationand treatment of waste. Particular opportunitiesinclude municipal water and sewage treatment, theprocess industries, and medical waste disposal.The Pulp & Paper Office is managing a waste watertreatment project using ozone. Twenty industrialcustomers of utilities are participating infunding and project direction.
Demand-Side Management (DSM). Implementationoptions include electrotechnologies, incentiverates, automation/flexible manufacturing systems,thermal energy storage, cogeneration, energymanagement systems, adjustable speed drives, high-efficiency motors, and use of off-peak power togenerate cooled storage in processes.
Buildings and Facilities.Thirteen percent of the electricity used byindustry is for lighting, space conditioning, andventilation. A number of opportunities exist forenergy efficiency improvements in this area. TheU.S. Department of Environmental Protection hasinitiated the cooperation of major corporations ina program to install more efficient lightingthrough a sponsored program called "Green Lights."
Analysis and Assessment.Identification of target markets forelectrotechnology applications in support ofutility customer service and marketing staff,could include scoping studies of specificindustries.
Recently completed/on-going RSD projectsinclude: evaluation of medical waste disposaloptions, electrotechnologies in municipal waterand sewage treatment plants, field evaluation ofadvanced reverse osmosis to recycle electroplatingwaste water, and cross divisional analysis andassessment of EPRI-developed technology forindustrial customer applications.
SUMMARY
As manufacturers in the United States striveto remain competitive in the world marketplace,electric utilities are placing new emphasis onpreserving and expanding their industrial loadbase. Manufacturers are looking for technologiesthat can increase productivity, lower costs, andimprove product quality. Coupled with thecreation of EPRI's industrial RSD ApplicationsCenters/Offices and their combined project totalof over $10 million annually, utilities are in abetter position to help customers identifytechnology opportunities. Since many of thesetechnologies are electricity driven, theirapplication creates a win-win situation for theutility, its customer, and EPRI. Industrialapplications of electrotechnologies cansignificantly reduce overall energy consumptionand environmental concerns and improveproductivity thus enhancing the competitiveness ofU.S. manufacturing industries. EPRI's IndustrialProgram provides the framework for that effort.
10
THE ENERGY IMPACT OF INDUSTRIAL RECYCLING AND WASTE EXCHANGE
W. CURTIS PHILLIPS, SYSTEMS ENGINEER/INDUSTRIAL PROJECT MANAGER, N.C. ENERGY DIVISION, RALEIGH, NC
ABSTRACT
Recycling and waste exchange, particularly inthe industrial sector, has a substantial positiveenergy impact and one that can often be accomplishedat little or no expense. Recycling saves energybecause the secondary materials being recycled are"pre-processed", and this requires lessmanufacturing operations than creating products fromvirgin materials. Process energy reductionpossible by recycling is estimated to be as high is952 for aluminum and 88% for plastics.
Industrial waste exchange is facilitated byhaving an independent agency to publicize andcoordinate materials availability and exchange. TheNorth Carolina Energy Division is a co-sponsor ofone such agency, the Southeast Waste Exchange inCharlotte, and has funded workshops on therecycling-energy connection and waste minimization.
Although the paper, plastic and glass familiarto residential recyclers are also exchanged at theIndustrial level, in addition, industrial wasteexchange deals extensively with solvents, oils,acids and alkalis and other specialty substances.
INDUSTRY AND INDUSTRIAL WASTE
U.S. industry produces ovn.r 12 billion tons ofwaste each year. According to the U.S. Office ofTechnology Assessment, the cost to industry ofhandling, cleaning and disposing of these wastes isestimated at about $45 billion per year. Problemsin handling some industrial wastes has contaminateddrinking water, caused families to relocate, led toliability suits, caused the loss of valuable landresources, and deepened the public distrust ofindustry and the regulatory process (1).
Energy Is an integral element in Industrialwastes. Many companies that generate wastematerials are also wasting valuable energy. Theenergy is accounted for in the embodied energy ofunused or poorly us^d raw materials, In the energycontent of the waste streams, and in the energyrequired to clean up and dispose of wastes.According to the U.S. DOE Office of IndustrialTechnologies, it Is estimated that three to fourquadrillion Btu (quads) could be saved annually IfIndustry were to reduce Its waste by 50 percent.Thus, industrial waste reduction and control isclearly linked to energy (and cost) savings.
WASTE CONTROL STRATEGIES
There are three primary strategies for handlingindustrial wastes. First, waste generation may bereduced by altering the feedstocks, products, and/orprocesses within the industrial facility. Second,wastes may be recycled or reused; either convertedto other useful products or used for energyproduction, "his reuse may take place on-site atthe original point of generation or at anotherlocation. Finally, wastes can be treated and
discarded to the environment. This last strategyis commonly referred to as "end-of-the-pipe"control of waste.
The "end-of-the-pipe" strategy has been themost commonly pursued method of pollution controlused by industry to date.This strategy seeks to convert waste to a moreenvironmentally benign form prior to disposal.Usually the level and effectiveness of theconversion is dictated by regulations from Federalor State governments, which set standards andprocedures for waste disposal. This strategy isthe least cost-effective method of meetingpollution control goals and fails to encourageinnovation in technology. In addition, thisapproach encourages Industry to keep silent oninternal pollution practices since Indicating thatemissions might be reduced carries the risk oftriggering more stringent regulation.
Waste reduction or minimization encompassesIn-plant practices that reduce, avoid, oreliminate the generation of Industrial wastesduring the design, manufacture, use and discardphases of product flow. Actions takan away fromthe waste recycling generating activity, Includingoff-site waste recycling or treatment of wastesafter they are generated are not considered wastereduction. Also, an action that merelyconcentrates the waste to reduce the volume ordilutes it to reduce the degree of hazard is notconsidered waste reduction. This definition Ismeant to be consistent with the goal of preventingthe generation of waste at its source rather thancontrolling, treating, or managing wastes afterits generation (2).
Of the various strategies, waste reduction iswidely considered the most effective and economiccontrol strategy since waste is not produced Inthe first place, and therefore does not requiretreatment or disposal. It ensures that more rawmaterial becomes product. More restrictiveenvironmental regulations, rising energy costs,and the requirement for more economic wastecontrol underlie the importance of developing andInvesting in technologies to reduce significantlythe generation of industrial wastes (1).
The hundreds of U.S. companies that haveinstituted waste reduction measures and haveachieved lowered production costs, Increasedprofits and reduced energy use and environmentalimpacts provide irrefutable evidence that wastereduction pays. The energy-waste minimizationlink of this strategy is emphasized by the factthat many common energy conservation techniques,such as Improved production monitoring andcontrol, preventive maintenance and optimizationof facility equipment operation often also resultsin reduced waste and the indirect energy reductionresulting therefrom.
The potential of waste minimization isimpressive. The Office of Technology Assessment(OTA) estimates that industry can reduce its
11

generation of hazardous wastes by as much as 50percent over five years (2). However, the fact thatthis reduction has not been realized In the fiveyears since the OTA report highlights the fact that,while technically and economically feasiblesolutions exist, there are many barriers to achievingwaste reduction. These barriers
include the lack of understanding of waste managementpractices, the lack of attention to waste reduction-as a cost cutting (and energy saving) activity, thelack of R&D on process redesign, the large varietyof production processes that require uniquesolutions, and the risks to industry associated withimplementing process and product changes (1).
To provide assistance to overcome thesebarriers, the U.S. Department of Energy hasinitiated the Industrial Waste Reduction Program.This program, outlined in the Industrial WasteReduction Program Plan (1) and Federal Legislativeand Regulatory Incentives and Disincentives ForIndustrial Waste Reduction (3), build's upon severalexisting activities to specifically focus on thedevelopment of technologies that reduce wastematerials within the Industrial sector. This effortnotwithstanding, because of the number and severityof the barriers to waste reduction, a substantialimpact in this area will take several years.
INDUSTRIAL RECYCLING AND WASTE EXCHANGE
A waste control strategy where an immediateimpact can be obtained Is industrial recycling andwaste exchange. While some technical analysis andprocess modifications may be required for on-slterecycling, In many cases another company that c muse the exisltng waste materials can be foundquickly. Users for even hazardous and contaminatedmaterials can often be found, yielding a ruducitonin disposal costs for the waste generator in<lreduced energy and dollar costs for raw materials onthe part of the waste us-r,
Industrial waste exchange is facilitated byhaving an independent agency to publicize andcoordinate materials availability and exchange. TheNorth Carolina Ener«y Division is a co-sponsor ofone such agency, the Southeast Waste Exchange .it theUniversity of North Carolina at Charlotte.
A waste exchange agency is an organization thatenables Industrial process wastes, by-products,surpluses, or materials that do not meetspecifications to be transferred from one company toanother company where they are used as processinputs. In addition, many waste exchange agenciescan provide assistance in waste minimizatluntechniques and quite often conduct workshops onwaste exchange and waste minimization. Most wasteexchange agencies operate on a regional basis, withthe size of the region determined by balancing theneed to make the area small enough to minimizetransportation costs while covering a large enougharea to provide a variety of industries. Host ofthese agencies use the term "waste exchange" .is anoun in their name, as in the Southeast WasteExchange, and hereafter the t-.;rn "waste exchange"will be used to describe agencies whose purpose Isfunctions listed above.
TYPES OF WASTE EXCHANGE
Waste exchanges differ according to whether ornot they actually handle materials. The mostcommon type of waste exchange does not handlematerials, but is only an informationclearinghouse. Waste-gene rat Ing companies informthe exchange about the quantity, composition, andlocation of the wastes they generate and thefrequency with which the wastes are available forexchange. Companies wishing to use wastes asprocess inputs supply similar information abouttheir needs. The required information is usuallysent to the exchange on a standard form, anexample of which is shown in Figure 1. A nominallisting fee is often required. The Inforra.it Ion onwastes available and wanted is published In theexchange's catalog, which typically appearsquarterly or bi-monthly and may be available freeor for a small charge. Waste-exchange catalogssometimes include a newsletter and advertisementsfor consultants and firms offering waste-handlingservices. To speed the flow of information,several waste exchanges have set up computerbulletin board systems (BBSes) to provide on-lineaccess via computers and modems to the latest dataon waste materials wanted or available. Thedatabase is continually updated, eliminating th?wait between catalog printings. TheEnergy/Recycling BBS (704-547-:>3O7) of theSoutheast Waste Exchange provides such access tosubscribers to the Waste Watcher, the exchange'sbi-monthly publication.
To protect company proprietary Information =sndto discourage possible government involvement,catalog (and BBS) listings are often confidential.A party interested in using available wastes orsupplying needed materials must MtMttj an inquiryto the exchange, which forwards the letter to thelisting company. The function of the Informationclearinghouse generally ends there; It Is up tothe listing company lo conl-tct the inquiring jurtyand negotiate an exchange, which may involve aone-time transfer, several transfers, or even thecontinuous transfer of wastes. The companies .iregenerally under no obligation to inform i.heclearinghouse of the results of the negotiation.They may even prefer to "keep a good deal quiet"from their competitors. Sometimes an Informationclearinghouse makes an active effort ;o findpossible users for available wastes, most of whichare not successfully exchanged simply by cataloglistings. (The California Waste "xchange., forexample, determines possible users and informsthem of appropriate materials available.) Thisfunction requ.res more than the usual smallpart-time staff (4).
The other type of waste exchange Is amaterials exchange thai, for a brokerage fee,actually takes possession of the wastes andparticipates in the negotiations. This type <>[exchange often actively seeks buyers for wastes.In some cases, the materials exchange performsminimal processing on the waste to wake it asuitable raw material for the buyer's use. Stillother companies, as their main line of business,reprocess wastes Into valuable ;M-oi1i..-ts forresale.
12

SOUTHEAST WASTE EXCHANGE
Urban biilliulaUNCC, Charloll*. N.C. 28223
Tti.phon.: (704) 547-2307
1. Company Name: __
2. Mailing Address: .
3. Company Contact:
5. Signature:
MATERIALS LISTING FORMSIC Code:
4. Titte:
6. Date: 7. Phone ( ) .
8. Check One Only: I ) MATERIAL AVAILABLE U MATERIAL WANTED
9. Classifications (review all first, then select one only that best describes your material):
I 1 ACIDSI I ALKALISI I OTHER INORGANIC CHEMICALS
I.I SOLVENTSI I OTHER ORGANIC CHEMICALSI I OILS AND WAXES
I I PLASTICS ANO RUBBERI 1 TEXTILES AND LEATHER1 I WOOD AND PAPER
LI METALS ANDMETAL SLUDGES
I ) MISCELLANEOUS
10. Material to be listed (main usable constituent, generic name):
11. The industrial process that generates this waste:
12. Main constituent (chemical formula):
13. Contaminants (highest to lowest, chemical formula): % %
14. Percentage by (check one): U VOLUME I I WET WEIGHT U DRY WEIGHT
15. Physical State:
16. Miscellaneous appropriate information (pH, toxicily, reactivity, color, particle size, flash point, total solids, purchase dale).
I SOL'NI AGGREGATE
I I SLURRYLI SOLID
; I SLUDGEI I DUST
I I CAKEIJ GAS
17. Potential or intended use:
18. Packaging: I I BULK [J DRUMS LJ PALLETS U BALES IJ OTHER
19. Present amount: 20. Frequency: U CONTINUOUS U VARIABLE a ONE TIME
21. Quantity thereafter: in I I lbs. LI tons U gal.LI Litres LI Cubic Meters
per: I j Day LJ Week IJ Month
22. Restrictions on amounts: L.i none LTJ minimum I I r.iaximum
23. Available to Interested Parties: IJ sample IJ lab analysis
I1 C.yd.LJ Other
LJ Quarter
Kg u Tonnes
independent analysis
24. For material wanted, acceptable geographic range (i.e., states, provinces, regions, countries):
25. For material available, if location of the material differs from the above mailing address, complete the following.
City State or Province Area Code
26. This listing Is: U CONFIDENTIAL CJ NON-CONFIDENTIAL (To expedite inquiries, the Exchange may give my nameand telephone number to inquirers.)
LISTING FEE:
$40 per company (unlimited listings) for six consecutive issues (published bimonthly).
Payment must be made in advance.
Please Include your check for $40 made payable to Southeast Waste Exchange.
FIGURE l. Typical Materials Listing Form Used by Waste Exchanges3
13
The second important characteristic of wasteexchanges is thetr status as public, nonprofitoperations orprofit-making businesses. Thischaracteristic i* not uncorrelated with thn first;most information clearinghouses are operated ani!subsidized by Jivi'.-immnt, chambers of commerce, ortrade associations, and most materials exchanges areprivate enterprises. It Is clear that little moneyis to be made by publishing a quarterly catalog, butmaterials brokerage fees do offer potential profits(4).
The third important characteristic of a wasteexchange is the types of material it handles.
TYPES OF MATERIALS HANDLED BY WASTE EXCHANGES
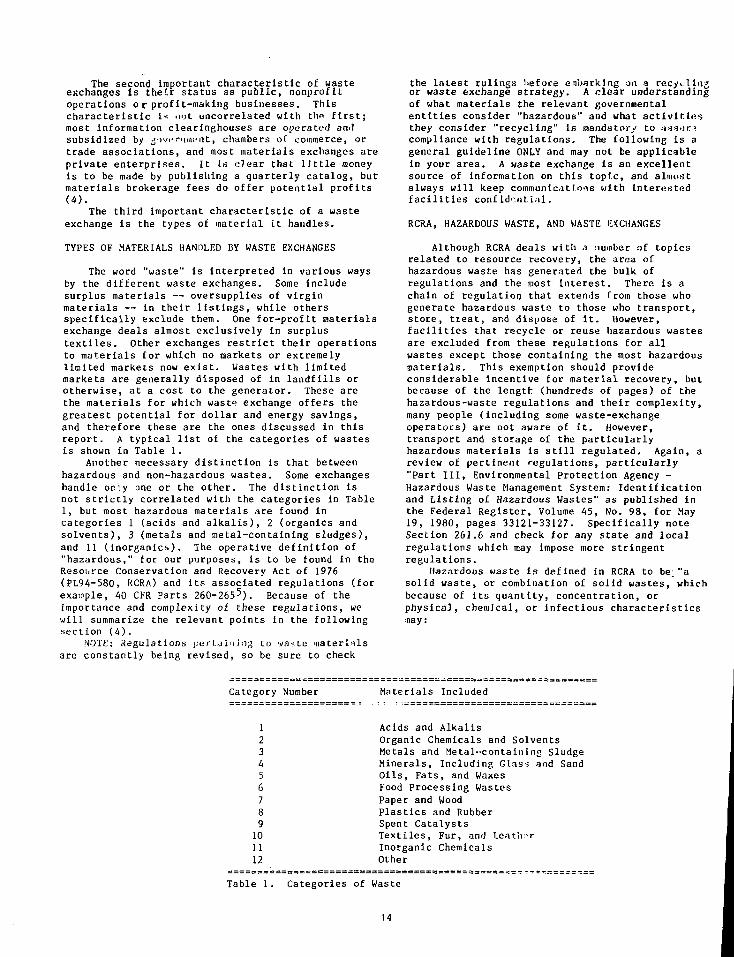
The word "waste" is interpreted in various waysby the different waste exchanges. Some includesurplus materials — oversupplies of virginmaterials — in their listings, while othersspecifically exclude them. One for-profit materialsexchange deals almost exclusively in surplustextiles. Other exchanges restrict their operationsto materials for which no markets or extremelylimited markets now exist. Wastes with limitedmarkets are generally disposed of in landfills orotherwise, at a cost to the generator. These arethe materials for which wast° exchange offers thegreatest potential for dollar and energy savings,and therefore these are the ones discussed in thisreport. A typical list of the categories of wastesis shown in Table 1.
Another necessary distinction is that betweenhazardous and non-hazardous wastes. Some exchangeshandle only :jne or the other. The distinction isnot strictly correlated with the categories in Table1, but most hazardous materials are found incategories 1 (acids and alkalis), 2 (organics andsolvents), 3 (metals and metal-containing sludges),and 11 (inorganics). The operative definition of"hazardous," for our purposes, is to be found in theResource Conservation and Recovery Act of 1976(PL9A-58O, RCRA) and its associated regulations (forexample, AO CFR Parts 260-2655). Because of theimportance and complexity of these regulations, wewill summarize the relevant points in the followingsection (4).
NOTK: Regulations perl.iin ing to 'vasle materialsare constantly being revised, so be sure to check
the latest rulings before embarking on a recyclingor waste exchange strategy. A clear understandingof what materials the relevant governmentalentities consider "hazardous" and what activitiesthey consider "recycling" is mandatory to Hss-ir>compliance with regulations. The following is ageneral guideline ONLY and may not be applicablein your area. A waste exchange is an excellentsource of information on this topic, and almostalways will keep communlc.itIons with interestedfacilities confidential.
RCRA, HAZARDOUS WASTE, AND WASTE EXCHANGES
Although RCRA deals with .3 number of topicsrelated to resource recovery, the area ofhazardous waste has generated the bulk ofregulations and the roost interest. There is achain of regulation that extends Trom those whogenerate hazardous waste to those who transport,store, treat, and dispose of it. However,facilities that recycle or reuse hazardous wastesare excluded from these regulations for allwastes except those containing the most hazardousmaterials. This exemption should provideconsiderable incentive for material recovery, butbecause of the length (hundreds of pages) of thehazardous-waste regulations and their complexity,many people (including some waste-exchangeoperators) are not aware of it. However,transport and storage of the particularlyhazardous materials is still regulated. Again, areview of pertinent regulations, particularly"Part III, Environmental Protection Agency -Hazardous Waste Management System: Identificationand Listing of Hazardous Wastes" as published inthe Federal Register, Volume 45, No. 98, for May19, 1980, pages 33121-33127. Specifically noteSection 261.6 and check for any state and localregulations which may impose more stringentregulations.
Hazardous waste Is defined in RCRA to be; "asolid waste, or combination of solid wastes, whichbecause of Its quantity, concentration, orphysical, chemical, or infectious characteristicsmay:
Category Number Materials Included
123A56789101112
Acids and AlkalisOrganic Chemicals and SolventsMetals and Metal-containing SludgeMinerals, Including Glass and SandOils, Fats, and WaxesFood Processing WastesPaper and WoodPlastics and RubberSpent CatalystsTextiles, Fur, and LentivrInorganic ChemicalsOther
Table 1. Categories of Waste
14
(A) cause, or significantly contribute to,an increase in mortality or an increasein serious irreversible, orincapacitating reversible, illness; or
(fi) pose a substantial present or potentialhazard to human health or theenvironment when improperly treated,stored, transported, or disposed of, orotherwise managed."
Subsequent regulations define criteria fordetermining if a waste is hazardous and, inaddition, list particularly hazardous materials forspecial consideration. These are ignitability,corrosivity, reactivity, and EP toxicity (toxicitydetermined by an extraction procedure). It has beenestimated that on the order of 20% of industrialwastes are hazardous according to these definitions,and many of them are listed as available inwaste-exchange catalogs. The hazardous nature ofthese wastes is extremely important in determiningthe benefits of exchanging them, because the costsof regulated disposal, storage, and treatment may beavoided by recycling (4).
WHAT CAN BE EXCHANGED?
The categories listed in Table 1 exemplify thebreadth of materials that can be exchanged.Although market research conducted by the SoutheastWaste exchange showed that user demand was greatestfor solvents, miscellaneous inorganic chemicals,alkalis and acids, success stories occur in all thecategories.
Acids and AlkalisWithin in the first category listed, "Acids and
Alkalis", a typical waste exchange listing will showdiverse offerings of different reagents containingdifferent impurities, and reagent concentrationsfrom 6% to 80%. The next important characteristicto note is the quantities available. Many wasteswithin this category will be available in largequantities, often tens of thousands of gallons permonth, increasing the chances for economicaltreatment. The final characteristic is that many ofthe wastes in this category are hazardous under RCRAregulations because they are corrosive (pH < 2 or pH> 12.5). This means that they cannot be disposed ofwithout prior treatment, such as neutralization andprecipitation. The cost of this treatment can besubstantial, offering considerable incentive toavoid disposal. Probably for this reason, in thelast year for which full data is available, theSoutheast Waste Exchange transferred more alkalis byvolume than any other material.
Successful waste transfers in this categoryinclude an ongoing exchange of 70 tons ofterephtahalic acid which saves the company $1,400 indisposal costs and generates earnings of $2,000. Inanother instance, a company earns $6,600 a year fromselling 220,000 pounds of phosphoric acid to abroker, and avoids $10,000 in disposal costs. Athird company estimates it saves $8,000 on disposalcosts a year through the transfer of 14,000 gallonsof waste caustic.
Organics Chemicals and SolventsEvery waste exchange has numerous listings in
the "Organics and Solvents" category. Although awide variety of materials are typically available,virtually all have one thing in common: they arecombustible and can be burned to recover 10,000-20,000 Btu/lb. Some of the materials in thecategory, in particular aromatic compounds ani?halogenated organics, are listed as hazardous.These therefore cannot be disposed of inlandfills, and their storage, transport, andincineration must be accompanied by variouspermits, manifests, and licenses.
Combustion of these materials is an acceptablemethod of disposal, but the temperature must behigh enough to insure complete destruction, andacid gases (in particular HC1 from decompositionof chlorinated organics) must be removed. Acidgas may be removed.by installing a scrubber oravoided by incinerating the wastes in a cementkiln. Cement kiln combustion can be acceptableeven for such highly toxic materials as PCBs(polychlorinaterl blphenyls), because thecombustion temperature is high and the alkalinecement neutralizes the HC1 (check your locality'sregulations to determine its acceptability in yourarea). The cost of combustion in a cement kiln isoften offset by the energy displaced, but theprocess can be economical even if this cost is notfully offset since substantial disposal costs canbe avoided.
The bulk of the waste exchange listings inthis category are for solvents of various types,and most are available in large quantities. Mostare not hazardous or are hazardous (flammable) butgenerally are not re n1..»ti"I if they are to bereused or recycled. Solvent recycling(distillation, steam stripping, extraction) almostalways provides more savings than costs.Companies in the business of solvent recyclingoften advertise in waste exchange publications.
In the last year for which full data isavailable, solvents ranked third (behind alkalisand plastics) in quantities of materialtransferred by the Southeast Waste Exchange.
Metals and Metal-containing SludgesTypical listings in this category are not
flammable, and, except for concentrated acidsolutions and certain wastes containing heavymetals like lead and cadmium, are not hazardous.Generally there are numerous acid solutions listed(from electroplating and cleaning processes) thatcontain small quantities of metal and many sludgesare often found. Surplus metals and scrap withestablished markets are occasionally found.
The acid solution-: c i i .if-, vn '>• "A • . u->d andreconcentrated with known technology. Many of thewastes available have higher concentrations ofmetals than tlie O'.ni' itrations in ores currentlybeing mined, and can be trr.'.il'.••" .-.•: ores. However,the quantities of waste are often too small tojustify a reclamation facility and thustransportation to a primary metal-producing plantis required (4).
Minerals, Including Glass and SandThere are often not many listings in this area
15

and the materials offered are generally of extremelylow value and are available in large quantities.Their production is usually not energy Intensive anddisposal in landfills is attractive because they arenot hazardous or combustible. Because of thematerials' low value, transport is not economical;however, if a local user can be found, disposal costscan be avoided and the energy required to mine thematerial saved. Waste exchanges are an excellentresource to determine if a local user of thesematerials is available (4).
Oils, Fats, and WaxesHost of the listings found in this category are
lubricating or hydraulic oils; all are combustible,with heats of combustion in the range of 19,000Btu/lb. Changes underway in Federal and Stateregulations governing the management of hazardouswastes under the Resource Conservation and RecoveryAct (RCRA) will affect generators, transporters,processors, marketers, and burners o£ oily waste,and will increase the attractiveness of recyclingand waste exchange (3).
Used lubricating oils can often be reclaimedwithout extensive processing. Oil and waterseparation and sedimentation and filtration may beall that is required to remove contaminants. Thenthe used oil can be burned as a fuel, or undergomore extensive treatment to refine them again("re-refine" them) into a replacement for virginlube-oil stock. The re-refining process has highercosts and higher revenues, but use as fuel has ahigher return on investment (4).
The re-refining process is the most effectivetreatment from an energy standpoint. It isestimated that re-refining of used crankcase oilsalone could save 13-76 x 1012 E'u/yr more oil thancombustion alone could save (5).
In the last year for which full data isavailable, the Southeast Waste Exchange facilitatedtransfers of 1,245,663 gallons of oils and waxes,valued at $249,268. Cost benefits related torecycling used oils can be measured by savings ondisposal costs (which will increase if the U.S.Environmental Protection Agency ultimately decidesto list used oil as hazardous waste), lower rawmaterials costs and energy savings. For example,one company transferred 8,800 gallons of hydraulicoils for a savings of $2,400 on disposal costs and asecond company benefited from an exchange ofhydraulic oil through savings of $1 ,S25 in rawmaterial expenses. In another ongoing exchange, awaste oil transfer saves the company $5,400 a yearin disposal costs.
Food Processing WastesTypically there are not a lot of listings In
this category. None of these materials are hazardousand their value is low. Since they are generallywet, their combustion value is only about 5,000Btu/lb. On-site combustion may be economicallyfeasible and bloconversion (including gasification)is becoming increasingly feasible using fermentationand anaerobic digestion.
Paper and WoodPaper and wood products have proven to be a
valuable waste material, whether used as a
manufacturing component or as an energy source.Recycling paper, tor example, uses one third lessenergy than is required to manufacture paper fromvirgin fibers. A survey of North Carolinamanufacturers revealed that next to solvents andmetal, paper and wood were the most commonlygenerated commercial waste streams.Unfortunately, these materials are frequentlyassociated with off-site disposal rather thanrecycling. However, an increased recognition ofthe value of recycling these products has led tomore available markets for these materials inrecent years.
Plastics and RubberDespite being unregulated in most areas,
plastic recycling has burgeoned over the past fewyears. Since plastics are petroleum products,recycling them can produce tremendous savings onboth energy and raw material costs. According toa study conducted in North Carolina a few yearsago, the production of plastic materials andsynthetics and industrial organic chemicalsconsumes about 56% or the total industrial energyused in North Carolina.
The options with plastics and rubber are many.Because of heating values as high as 20,000Btu/lb, plastics can often be burned economically(note that on combustion, PVC releases HC1 gas,which may have to be scrubbed from the stack gas).Thermoplastic scrap of a single material can oftenbe recycled back to the same material if it isclean or can be cleaned. Plastics separation istechnically feasible, but economic feasibilitymust be evaluated on a case by case basis.
Waste rubber chips can be burned directly orpyrolyzed, or its size can be reducedcryogenically or by the Gould mechanical processand use It as an extender for the originalcompound. Another attractive use is as areplacement for some of the asphalt in pavement.An asphalt-rubber mixture lasts considerablylonger than ordinary asphalt, providing a life-cycle savings when it is used.
In a recent year, the Southeast Waste Exchangegenerated $231,810 in ongoing cost benefits toindustry through the transfer of nearly six and ahalf million pounds of plastics and rubber.
Spent CatalystsThere are very few listings for this category
in most waste exchanges, probably because of thehigh value of the precious metals contained inmany catalysts. These are generally recovered in-house; however, if no use and no buyer can belocated, they can be offered through a wasteexchange (4).
Textiles, Fur and LeatherThis category is similar to "Paper and Wood"
in that these materials are nonhazardous andcombustible. Generally these materials are notburned, since a higher value use can usually befound. Textile nylon waste can otten beeconomically be recycled in a manner similar toplastict (becau- it Is in fact a thermoplasticmaterial) and savings from recycling can beconsiderable.
16
Inorganic ChemicalsThere is a tremendous variety of materials
offered in this category, varying greatly in bothvalue and quantity. Some are harmless and others,such as cyanide sludge, are extremely hazardous (4).
ENERGY IMPACT
In fact, industries are most interested in costsavings, and it matters very little whether thosesavings result from energy savings, reduced rawmaterial costs, reduced disposal costs or whatever.As has been shown, the costs savings potential ofrecycling and industrial waste exchange issubstantial.
Reviewing the magnitude of Industrial energyconsumption provides some estimate of the energysavings potential of recycling and waste exchange.According to the Office of Industrial Technologies,U.S. DOE, U.S. industry directly consumes nearly 23quads annually with another 7 quads of energyconsumed in electrical system losses. Manufacturingoperations use about 80 percent of the industrytotal; feedstocks, which can be Impacted by recyclingand waste exchange, account for about 5 quads ofthis. Four to seven quads of the industry total areused to produce and process raw materials that end upas waste, while two additional quads are used inwaste treatment and disposal. Recycling a.id wasteexchange can have an substantial impact in both ofthese areas. The fuel value of industrial wastes,including agricultural and forest wastes, isestimated to total 10 to 15 quads (1).
The exact costs and benefits (energy and other)of implementing recycling, waste exchange and wasteminimization technologies and practices are hard toobtain, and harder to verify, due to the proprietynature of plant operations and the uniqueenergy/process relationship in each process andproduct. However, an examination of one company'ssuccess provides some useful insights.
The 3M Corporation has been one of the leadersin the chemical Industry in pursuing a proactivewaste control program. Since 1975, it has pursuedpollution prevention efforts that by 1990 yieldedannual discharge reductions of 134,000 tons of airpollutants, 16,900 tons of water pollutants, 410,000tons of sludge, 1.65 billion gallons of wastewaterand energy savings equivalent to 250,000 barrels ofoil (6).
References
1. Industrial Waste Reduction Program, ProgramPlan, Office of Industrial Technologies, U.S.DOE (DOE/CE-0344, October 1991).
2. Serious Reduction of Hazardous Waste forPollution Prevention and IndustrialEfficiency, U.S. Office of TechnologyAssessment (OTA-ITE-317, 1986).
3. Federal Legislative and Regulatory Incentivesand Disincentives For Industrial WasteReduction, prepared by Energetics,Incorporated for the Office of IndustrialTechnologies, U.S. DOE (DOE/CE/4O762T-H3,October 1991).
4. Gaines, L.L., Industrial Waste Exchange: AMechanism of Saving Energy and Honey, preparedby Argonne National Laboratory for U.S.Department of Energy (ANL/CNSV-33, July 1982).
5. Brinkman, D.W., et al., Environmental,Resource Conservation, and Economic Aspects ofUsed Oil Recycling, Bartlesville EnergyTechnology
6. Pollution Prevention Pays: Status Report, 3MCorporation, St. Paul, Minnesota (1991).
17
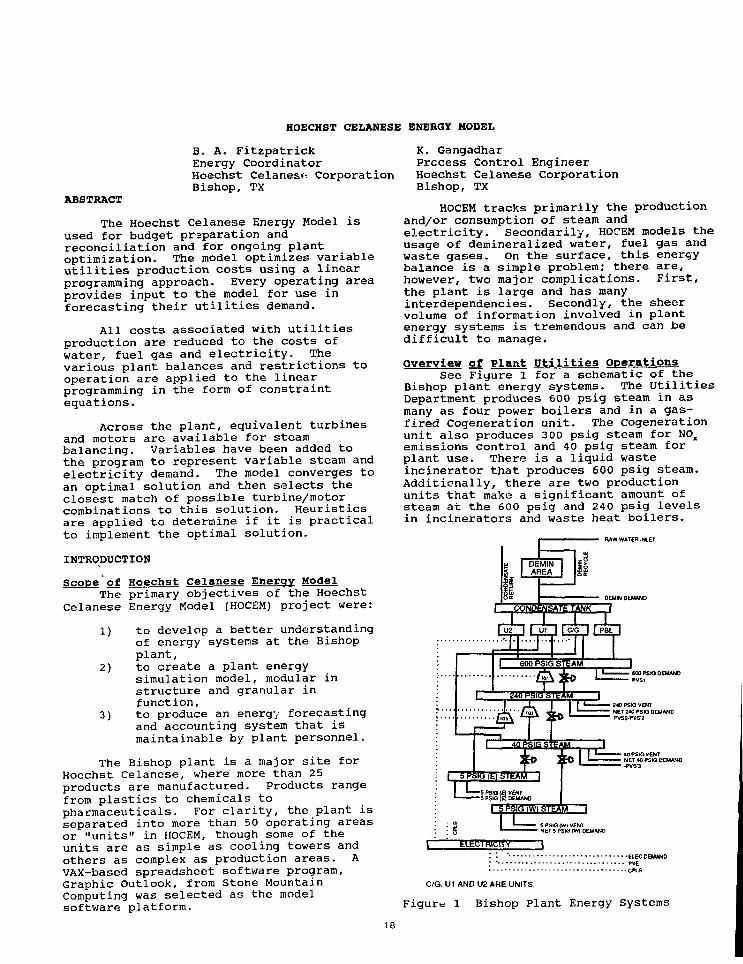
HOECHST CELANESE ENERGY MODEL
ABSTRACT
B. A. FitzpatrickEnergy CoordinatorHoechst Celanesf- CorporationBishop, TX
The Hoechst Celanese Energy Model isused for budget preparation andreconciliation and for ongoing plantoptimization. The model optimizes variableutilities production costs using a linearprogramming approach. Every operating areaprovides input to the model for use inforecasting their utilities demand.
All costs associated with utilitiesproduction are reduced to the costs ofwater, fuel gas and electricity. Thevarious plant balances and restrictions tooperation are applied to the linearprogramming in the form of constraintequations.
Across the plant, equivalent turbinesand motors are available for steambalancing. Variables have been added tothe program to represent variable steam andelectricity demand. The model converges toan optimal solution and then selects theclosest match of possible turbine/motorcombinations to this solution. Heuristicsare applied to determine if it is practicalto implement the optimal solution.
INTRODUCTION
Scope of Hoechst Celanese Energy ModelThe primary objectives of the Hoechst
Celanese Energy Model (HOCEM) project were:
1) to develop a better understandingof energy systems at the Bishopplant,
2) to create a plant energysimulation model, modular instructure and granular infunction,
3) to produce an energy forecastingand accounting system that ismaintainable by plant personnel.
The Bishop plant is a major site forHoechst Celanese, where more than 25products are manufactured. Products rangefrom plastics to chemicals toPharmaceuticals. For clarity, the plant isseparated into more than 50 operating areasor "units" in HOCEM, though some of theunits are as simple as cooling towers andothers as complex as production areas. AVAX-based spreadsheet software program,Graphic Outlook, from Stone MountainComputing was selected as the modelsoftware platform.
K. GangadharProcess Control EngineerHoechst Celanese CorporationBishop, TX
HOCEM tracks primarily the productionand/or consumption of steam andelectricity. Secondarily, HOCEM models theusage of demineralized water, fuel gas andwaste gases. On the surface, this energybalance is a simple problem; there are,however, two major complications. First,the plant is large and has manyinterdependencies. Secondly, the sheervolume of information involved in plantenergy systems is tremendous and can bedifficult to manage.
Overview of Plant Utilities OperationsSee Figure 1 for a schematic of the
Bishop plant energy systems- The UtilitiesDepartment produces 600 psig steam in asmany as four power boilers and in a gas-fired Cogeneration unit. The Cogenerationunit also produces 3 00 psig steam for NOX
emissions control and 40 psig steam forplant use. There is a liquid wasteincinerator that produces 600 psig steam.Additionally, there are two productionunits that make a significant amount ofsteam at the 600 psig and 240 psig levelsin incinerators and waste heat boilers.
RAW WATER INLET
DEMH DEMAND
- 600 PSfO DEMAND• PVSl
- 240 PSIG VENT* NET 240 PSIQ DEMAND" PVS2-PVS2
* 40PSIOVENT• NET 40 PSO DEMAND' -PVS3
• • & E C DEMAND• PVE•CM.S
C/G. U1 AND U2 ARE UNITS.
Figure 1 Bishop Plant Energy Systems
18
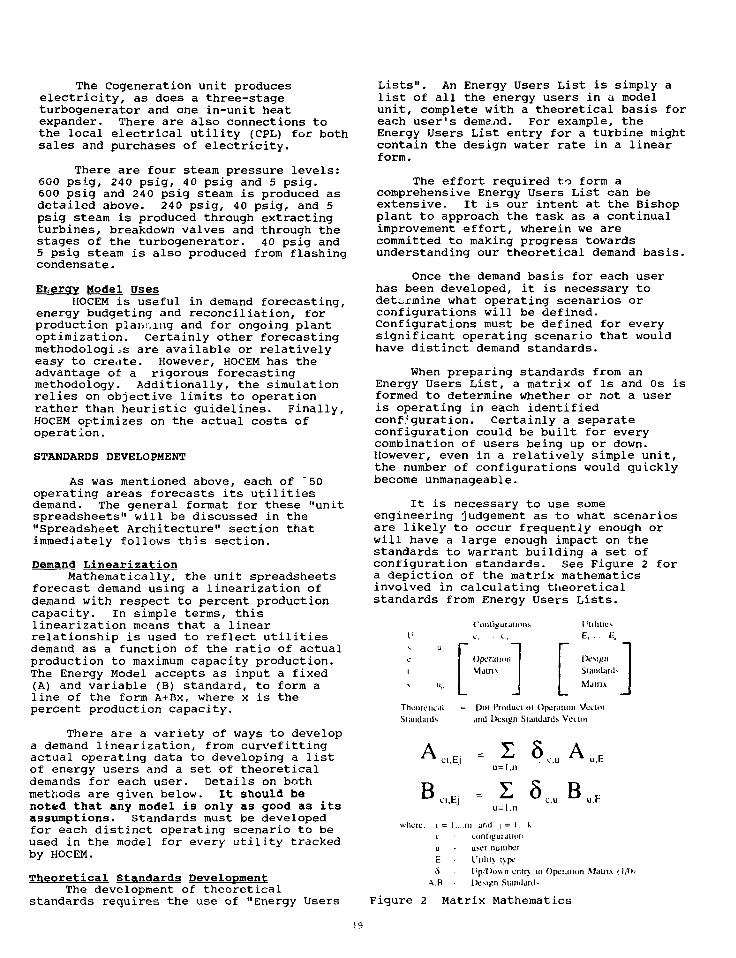
The Cogeneration unit produceselectricity, as does a three-stageturbogenerator and one in-unit heatexpander. There are also connections tothe local electrical utility (CPL) for bothsales and purchases of electricity.
There are four steam pressure levels:600 psig, 240 psig, 40 psig and 5 psig.600 psig and 24 0 psig steam is produced asdetailed above. 240 psig, 40 psig, and 5psig steam is produced through extractingturbines, breakdown valves and through thestages of the turbogenerator. 40 psig and5 psig steam is also produced from flashingcondensate.
Energy Model UsesHOCEM is useful in demand forecasting,
energy budgeting and reconciliation, forproduction planning and for ongoing plantoptimization. Certainly other forecastingmethodologies are available or relativelyeasy to create. However, HOCEM has theadvantage of a rigorous forecastingmethodology. Additionally, the simulationrelies on objective limits to operationrather than heuristic guidelines. Finally,HOCEM optimizes on the actual costs ofoperation.
STANDARDS DEVELOPMENT
As was mentioned above, each of '50operating areas forecasts its utilitiesdemand. The general format for these "unitspreadsheets" will be discussed in the"Spreadsheet Architecture" section thatimmediately follows this section.
Demand LinearizationMathematically, the unit spreadsheets
forecast demand using a linearization ofdemand with respect to percent productioncapacity. In simple terms, thislinearization means that a linearrelationship is used to reflect utilitiesdemand as a function of the ratio of actualproduction to maximum capacity production.The Energy Model accepts as input a fixed(A) and variable (B) standard, to form aline of the form A+Bx, where x is thepercent production capacity.
There are a variety of ways to developa demand linearization, from curvefittingactual operating data to developing a listof energy users and a set of theoreticaldemands for each user. Details on bothmethods are given below. It should benoted that any model is only as good as itsassumptions. Standards must be developedfor each distinct operating scenario to beused in the model for every utility trackedby HOCEM.
Theoretical Standards DevelopmentThe development of theoretical
standards requires the use of "Energy Users
Lists". An Energy Users List is simply alist of all the energy users in a modelunit, complete with a theoretical basis foreach user's demand. For example, theEnergy Users List entry for a turbine mightcontain the design water rate in a linearform.
The effort required to form acomprehensive Energy Users List can beextensive. It is our intent at the Bishopplant to approach the task as a continualimprovement effort, wherein we arecommitted to making progress towardsunderstanding our theoretical demand basis.
Once the demand basis for each userhas been developed, it is necessary todetermine what operating scenarios orconfigurations will be defined.Configurations must be defined for everysignificant operating scenario that wouldhave distinct demand standards.
When preparing standards from anEnergy Users List, a matrix of Is and 0s isformed to determine whether or not a useris operating in each identifiedconfiguration. Certainly a separateconfiguration could be built for everycombination of users being up or down.However, even in a relatively simple unit,the number of configurations would quicklybecome unmanageable.
It is necessary to use someengineering judgement as to what scenariosare likely to occur frequently enough orwill have a large enough impact on thestandards to warrant building a set ofconfiguration standards. See Figure 2 fora depiction of the matrix mathematicsinvolved in calculating theoreticalstandards from Energy Users Lists.
rN U ,
er
TheoreticalSlandanls
(Configurations
OperationMatrix
I'tilmesE, E
Dc-sijinSl.uiil.ml
Malnx
= Dot Product ill Operation Vecloiand Design Standards Vector
IM.Ej 8 Au=l,n
u.E
B u.Ej - I 5u=!.n
c.uB u.E
where, i = L. .ni and j = I. kL - configurationu - user numberE I'tilil) t>peiS t!p/Oo\\rr entn in Operation Matrix (
A.B - Design Standard*
Figure 2 Matrix Mathematics
19
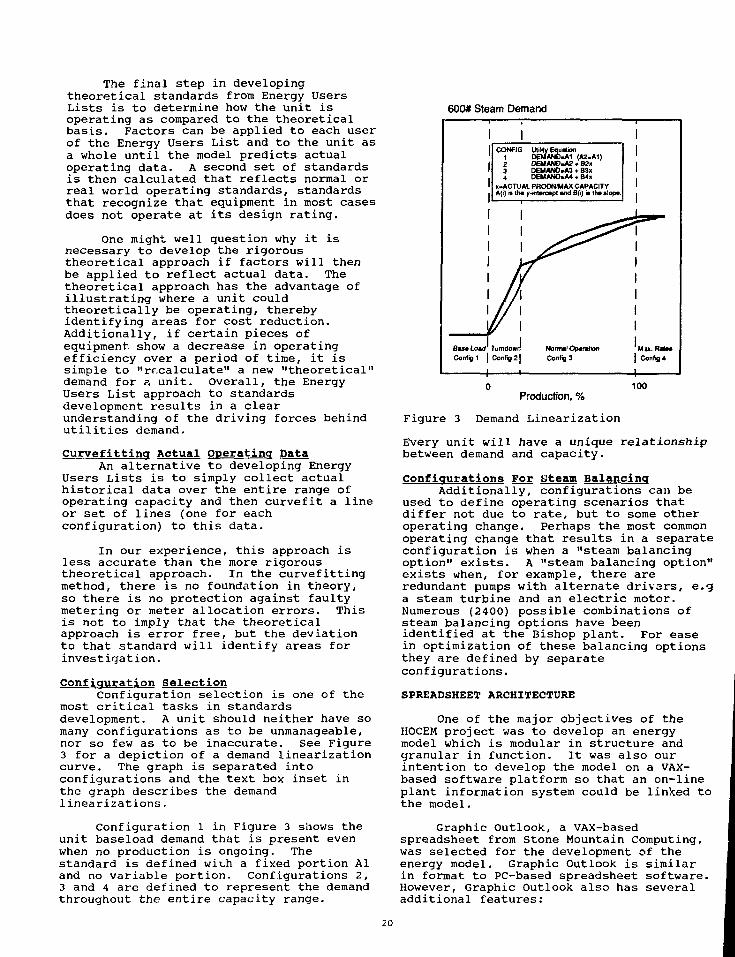
The final step in developingtheoretical standards from Energy UsersLists is to determine how the unit isoperating as compared to the theoreticalbasis. Factors can be applied to each userof the Energy Users List and to the unit asa whole until the model predicts actualoperating data. A second set of standardsis then calculated that reflects normal orreal world operating standards, standardsthat recognize that equipment in most casesdoes not operate at its design rating.
One might well question why it isnecessary to develop the rigoroustheoretical approach if factors will thenbe applied to reflect actual data. Thetheoretical approach has the advantage ofillustrating where a unit couldtheoretically be operating, therebyidentifying areas for cost reduction.Additionally, if certain pieces ofequipment show a decrease in operatingefficiency over a period of time, it issimple to "recalculate" a new "theoretical"demand for a unit. Overall, the EnergyUsers List approach to standardsdevelopment results in a clearunderstanding of the driving forces behindutilities demand.
Curvefitting actual Operating DataAn alternative to developing Energy
Users Lists is to simply collect actualhistorical data over the entire range ofoperating capacity and then curvefit a lineor set of lines (one for eachconfiguration) to this data.
In our experience, this approach isless accurate than the more rigoroustheoretical approach. In the curvefittingmethod, there is no foundation in theory,so there is no protection against faultymetering or meter allocation errors. Thisis not to imply that the theoreticalapproach is error free, but the deviationto that standard will identify areas forinvestigation.
Configuration SelectionConfiguration selection is one of the
most critical tasks in standardsdevelopment. A unit should neither have somany configurations as to be unmanageable,nor so few as to be inaccurate. See Figure3 for a depiction of a demand linearizationcurve. The graph is separated intoconfigurations and the text box inset inthe graph describes the demandlinearizations.
Configuration 1 in Figure 3 shows theunit baseload demand that is present evenwhen no production is ongoing. Thestandard is defined with a fixed portion Aland no variable portion. Configurations 2,3 and 4 are defined to represent the demandthroughout the entire capacity range.
600# Steam Demand
CONFIG Utility Equation1 DEMAN0.A1 (A2.A1)2 DEMAN0-A2 • S2«3 DEMAND-AS • B3x4 DEMANO-U * B4>
(.ACTUAL PRODN/MAX CAPACITYA{i) is th« y-im*io*pt and B(i) m th» slop*.
TurndownConfig 1 | Config 21
Norrral OperationConfig3
0 100
Production, %
Figure 3 Demand LinearizationEvery unit will have a unique relationshipbetween demand and capacity.
Configurations For Steam BalancingAdditionally, configurations can be
used to define operating scenarios thatdiffer not due to rate, but to some otheroperating change. Perhaps the most commonoperating change that results in a separateconfiguration is when a "steam balancingoption" exists. A "steam balancing option"exists when, for example, there areredundant pumps with alternate drivers, e.ga steam turbine and an electric motor.Numerous (2400) possible combinations ofsteam balancing options have beenidentified at the Bishop plant. For easein optimization of these balancing optionsthey are defined by separateconfigurations.
SPREADSHEET ARCHITECTURE
One of the major objectives of theHOCEM project was to develop an energymodel which is modular in structure andgranular in function. It was also ourintention to develop the model on a VAX-based software platform so that an on-lineplant information system could be linked tothe model.
Graphic Outlook, a VAX-basedspreadsheet from Stone Mountain Computing,was selected for the development of theenergy model. Graphic Outlook is similarin format to PC-based spreadsheet software.However, Graphic Outlook also has severaladditional features:
20
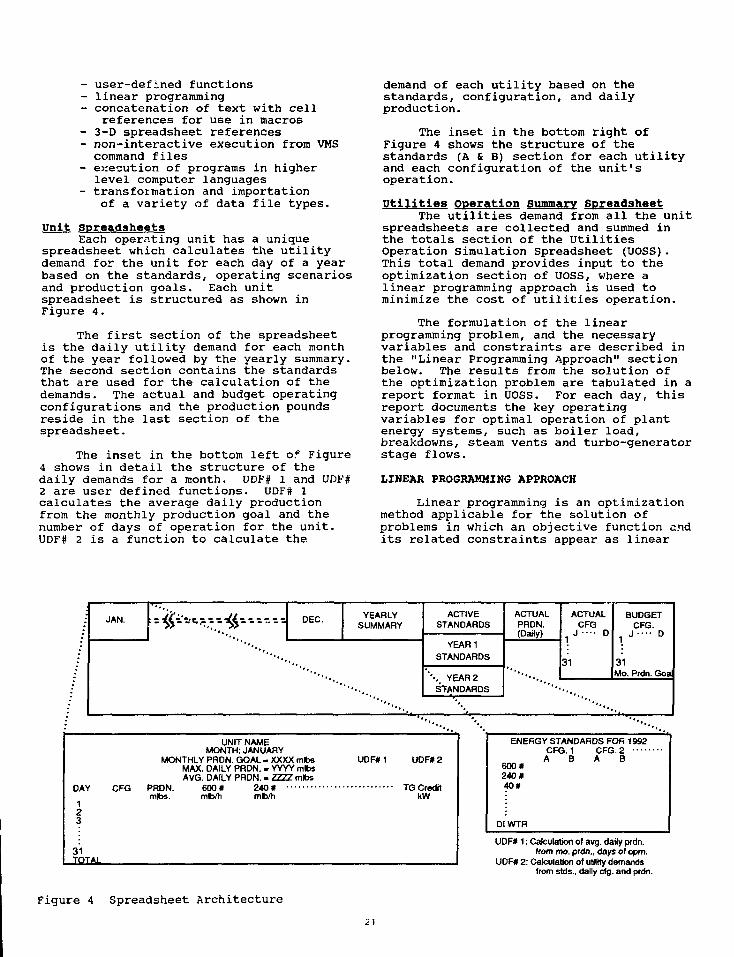
- user-defined functions- linear programming- concatenation of text with cell
references for use in macros- 3-D spreadsheet references- non-interactive execution from VMScommand files
- execution of programs in higherlevel computer languages
- transformation and importationof a variety of data file types.
Unit SpreadsheetsEach operating unit has a unique
spreadsheet which calculates the utilitydemand for the unit for each day of a yearbased on the standards, operating scenariosand production goals. Each unitspreadsheet is structured as shown inFigure 4.
The first section of the spreadsheetis the daily utility demand for each monthof the year followed by the yearly summary.The second section contains the standardsthat are used for the calculation of thedemands. The actual and budget operatingconfigurations and the production poundsreside in the last section of thespreadsheet.
The inset in the bottom left of Figure4 shows in detail the structure of thedaily demands for a month. UDF# 1 and UDF#2 are user defined functions. UDF# 1calculates the average daily productionfrom the monthly production goal and thenumber of days of operation for the unit.UDF# 2 is a function to calculate the
demand of each utility based on thestandards, configuration, and dailyproduction.
The inset in the bottom right ofFigure 4 shows the structure of thestandards (A & B) section for each utilityand each configuration of the unit'soperation.
Utilities Operation Summary SpreadsheetThe utilities demand from all the unit
spreadsheets are collected and summed inthe totals section of the UtilitiesOperation Simulation Spreadsheet (UOSS).This total demand provides input to theoptimization section of UOSS, where alinear programming approach is used tominimize the cost of utilities operation.
The formulation of the linearprogramming problem, and the necessaryvariables and constraints are described inthe "Linear Programming Approach" sectionbelow. The results from the solution ofthe optimization problem are tabulated in areport format in UOSS. For each day, thisreport documents the key operatingvariables for optimal operation of plantenergy systems, such as boiler load,breakdowns, steam vents and turbo-generatorstage flows.
LINEAR PROGRAMMING APPROACH
Linear programming is an optimizationmethod applicable for the solution ofproblems in which an objective function andits related constraints appear as linear
JAN. DEC.
* » ,
YEARLYSUMMARY
ACTIVESTANDARDS
YEAR1STANDARDS
\ YEAR 2ST-ANDARDS
ACTUALPRDN.(Daily)
ACTUALCFG
31
BUDGETCFG.
, J - - D
31Mo. Prdn. Goa
DAY
1
3
31TOTAL
CFG
UNIT NAMEMONTH: JANUARY
MONTHLY PRDN. GOAL - XXXX mlbsMAX. DAILY PRDN. - YYYY mlbsAVG. DAILY PRDN. - rm mlbs
PRDN. 600 # 240 #mlbs. mlb/h mto/h
UDF#1 UDF#2
TG CreditkW
UDF# 1: Calculation of avg. daily prdn.from mo. prdn., days oloprn.
UDF# 2: Calculation of utility demandsfrom stds., dally cfg. and prdn.
Figure 4 Spreadsheet Architecture
2J
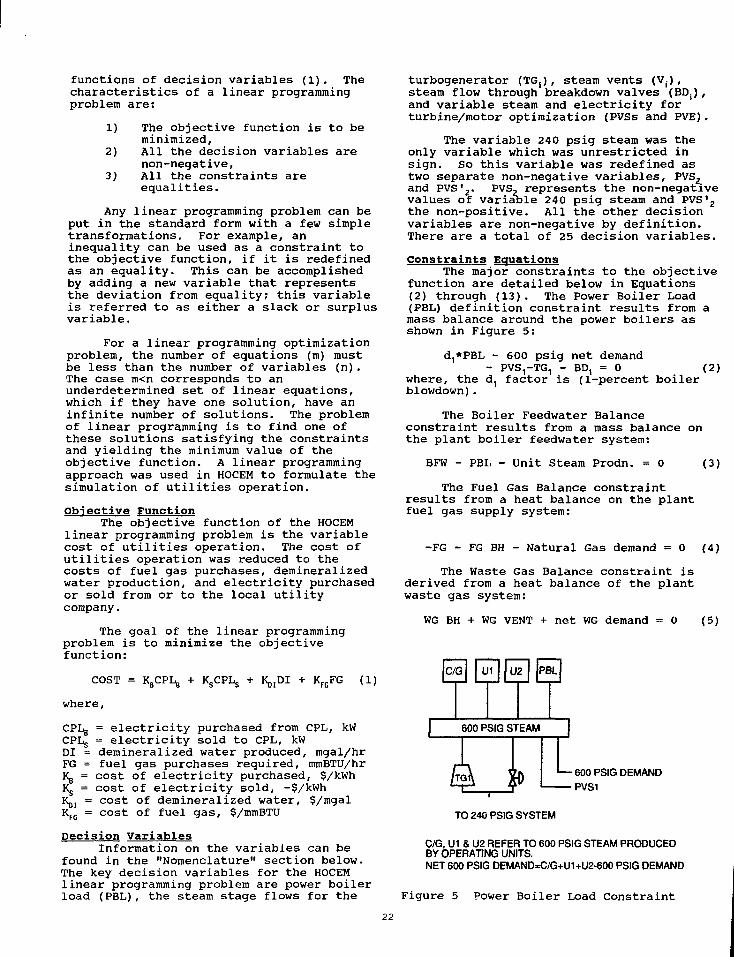
functions of decision variables (1). Thecharacteristics of a linear programmingproblem are:
1) The objective function is to beminimized,
2) All the decision variables arenon-negative,
3) All the constraints areequalities.
Any linear programming problem can beput in the standard form with a few simpletransformations. For example, aninequality can be used as a constraint tothe objective function, if it is redefinedas an equality. This can be accomplishedby adding a new variable that representsthe deviation from equality; this variableis referred to as either a slack or surplusvariable.
For a linear programming optimizationproblem, the number of equations (m) mustbe less than the number of variables (n).The case m<n corresponds to anunderdetermined set of linear equations,which if they have one solution, have aninfinite number of solutions. The problemof linear programming is to find one ofthese solutions satisfying the constraintsand yielding the minimum value of theobjective function. A linear programmingapproach was used in HOCEM to formulate thesimulation of utilities operation.
Objective FunctionThe objective function of the HOCEM
linear programming problem is the variablecost of utilities operation. The cost ofutilities operation was reduced to thecosts of fuel gas purchases, demineralizedwater production, and electricity purchasedor sold from or to the local utilitycompany.
The goal of the linear programmingproblem is to minimize the objectivefunction:
COST = KBCPL8 + KSCPLS + K^DI + KFGFG (1)
where,
CPLg = electricity purchased from CPL, kWCPLS = electricity sold to CPL, kWDI = demineralized water produced, mgal/hrFG = fuel gas purchases required, mmBTU/hrKB = cost of electricity purchased, $/kWhKs = cost of electricity sold, -$/kWhKp, = cost of demineralized water, $/mgalKFG = cost of fuel gas, $/mmBTU
Decision VariablesInformation on the variables can be
found in the "Nomenclature" section below.The key decision variables for the HOCEMlinear programming problem are power boilerload (PBL), the steam stage flows for the
turbogenerator (TGj), steam vents (Vr),steam flow through breakdown valves (BD;),and variable steam and electricity forturbine/motor optimization (PVSs and PVE).
The variable 240 psig steam was theonly variable which was unrestricted insign. So this variable was redefined astwo separate non-negative variables, PVS2and PVS'2. PVS, represents the non-negativevalues of variable 240 psig steam and PVS'2the non-positive. All the other decisionvariables are non-negative by definition.There are a total of 25 decision variables.
Constraints EquationsThe major constraints to the objective
function are detailed below in Equations(2) through (13). The Power Boiler Load(PBL) definition constraint results from amass balance around the power boilers asshown in Figure 5:
d.,*PBL - 600 psig net demand- PVS^TG, - BD, = 0 (2)
where, the d, factor is (1-percent boilerblowdown).
The Boiler Feedwater Balanceconstraint results from a mass balance onthe plant boiler feedwater system:
BFW - PBI, - Unit Steam Prodn. = 0 (3)
The Fuel Gas Balance constraintresults from a heat balance on the plantfuel gas supply system:
-FG - FG BH - Natural Gas demand = 0 (4)
The Waste Gas Balance constraint isderived from a heat balance of the plantwaste gas system:
WG BH + WG VENT + net WG demand = 0 (5)
600 PSIG DEMANDPVS1
TO 240 PSIG SYSTEM
C/G, U1 & U2 REFER TO 600 PSIG STEAM PRODUCEDBY OPERATING UNITS.NET 600 PSIG DEMAND.C/G+U1+U2-600 PSIG DEMAND
Figure 5 Power Boiler Load Constraint
22
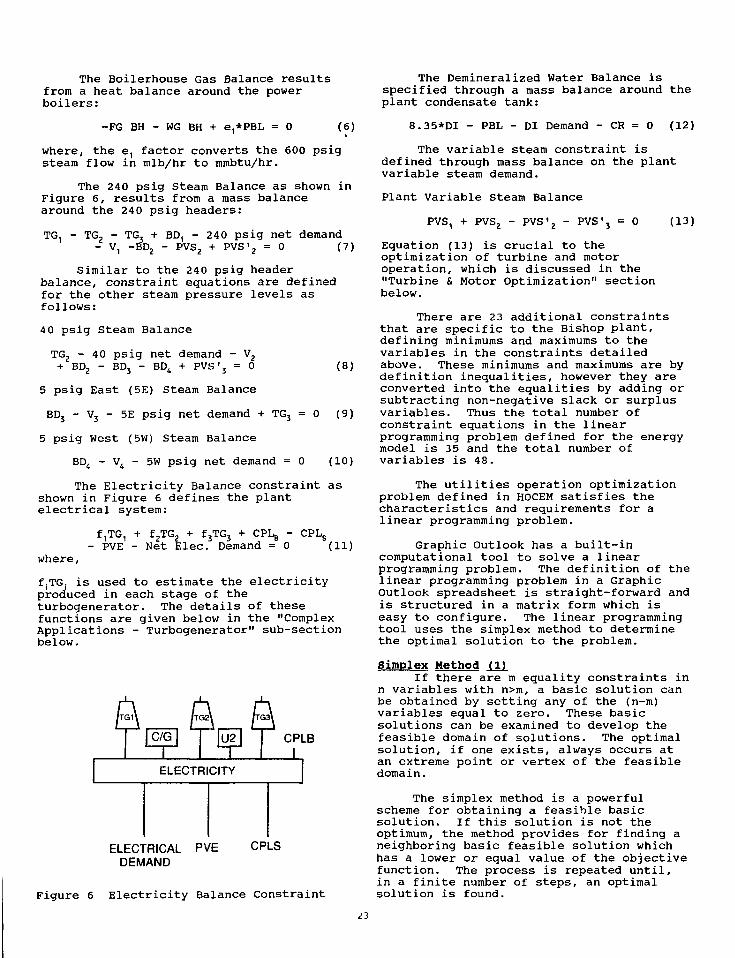
The Boilerhouse Gas Balance resultsfrom a heat balance around the powerboilers:
-FG BH - WG BH + e,*PBL = 0 (6)
where, the e, factor converts the 600 psigsteam flow in mlb/hr to mmbtu/hr.
The 240 psig Steam Balance as shown inFigure 6, results from a mass balancearound the 240 psig headers:
TG, - TG2 - TG3 + BD, - 240 psig net demand- V, -BD2 - PVS2 + PVS'2 = 0 (7)
Similar to the 240 psig headerbalance, constraint equations are definedfor the other steam pressure levels asfollows:
40 psig Steam Balance
TG2 - 40 psig net demand - V2BD BD BD + PVS ' 0BD2 - BD3 -
2
PVS ' 3 = 0(8)
5 psig East (5E) Steam Balance
BD3 - V3 - 5E psig net demand + TG3 = 0 (9)
5 psig West (5W) Steam Balance
BD4 - V4 - 5W psig net demand = 0 (10)
The Electricity Balance constraint asshown in Figure 6 defines the plantelectrical system:
f^G, + f2TG2 + fjTGj + CPL,, - CPLS- PVE - Net Elec. Demand = 0 (11)
where,
fjTG, is used to estimate the electricityproduced in each stage of theturbogenerator. The details of thesefunctions are given below in the "ComplexApplications - Turbogenerator" sub-sectionbelow.
ELECTRICAL PVE CPLSDEMAND
Figure 6 Electricity Balance Constraint
The Demineralized Water Balance isspecified through a mass balance around theplant condensate tank:
8.35*DI - PBL - DI Demand - CR = 0 (12)
The variable steam constraint isdefined through mass balance on the plantvariable steam demand.
Plant Variable Steam Balance
PVS, + PVS2 - PVS'2 - PVS'j = 0 (13)
Eguation (13) is crucial to theoptimization of turbine and motoroperation, which is discussed in the"Turbine & Motor Optimization" sectionbelow.
There are 2 3 additional constraintsthat are specific to the Bishop plant,defining minimums and maximums to thevariables in the constraints detailedabove. These minimums and maximums are bydefinition inequalities, however they areconverted into the equalities by adding orsubtracting non-negative slack or surplusvariables. Thus the total number ofconstraint equations in the linearprogramming problem defined for the energymodel is 3 5 and the total number ofvariables is 48.
The utilities operation optimizationproblem defined in HOCEM satisfies thecharacteristics and requirements for alinear programming problem.
Graphic Outlook has a built-incomputational tool to solve a linearprogramming problem. The definition of thelinear programming problem in a GraphicOutlook spreadsheet is straight-forward andis structured in a matrix form which iseasy to configure. The linear programmingtool uses the simplex method to determinethe optimal solution to the problem.
Simplex Method (l)If there are m equality constraints in
n variables with n>m, a basic solution canbe obtained by setting any of the (n-m)variables equal to 2ero. These basicsolutions can be examined to develop thefeasible domain of solutions. The optimalsolution, if one exists, always occurs atan extreme point or vertex of the feasibledomain.
The simplex method is a powerfulscheme for obtaining a feasible basicsolution. If this solution is not theoptimum, the method provides for finding aneighboring basic feasible solution whichhas a lower or equal value of the objectivefunction. The process is repeated until,in a finite number of steps, an optimalsolution is found.
Complex Applications-Turbogenerator
Scope of the Problem. Modelling theelectrical generation of the three-stageturbogenerator was one of the moredifficult tasks involved in modellingenergy systems at the Bishop plant. Aprevious engineering study had shown thatthe electrical production was quadratic insteam flow through each of the stages.Incorporating this quadratic functionalitywas an initial stumbling block in thedevelopment of the linear programmingapproach of HOCEM.
Problem Resolution. The quadratic wasimplemented in the Electricity Balanceconstraint, Equation (11), where thecoefficients (f,) of the stage flows weredefined as linear functions of therespective stage flows (TG() . The linearprogramming optimization was iterated,where the fs coefficients were recalculatedbetween iterations using the solutionvalues of TGf from the preceding iteration.In all cases, the solution converged withless than five iterations. Given thissuccess, the quadratic functions wereimplemented in the electricity balance withno loss of integrity.
Other Complications. Understandingand incorporating the electricity producedin the turbogenerator was not the onlyhurdle in successfully simulating itsoperation. It was also necessary tounderstand the steam stage flows and theirinterdependencies. Stage flows areincluded in a total of 11 constraint,equations, including Equations (2), (7),(8), (9), and (11) above.
TURBINE AND MOTOR BALANCING OPTIMIZATION
The turbine and motor optimizationfunction of HOCEM is perhaps its mostpowerful. Previously, turbine and motoroptimization was done in an iterativefashion, where the recommended combinationof turbines and motors resulted more fromintuition or heuristics than from arigorous optimization method.
From a programming standpoint, thesimplest approach for the optimization ofturbine and motor balancing would be totest every possible combination ofbalancing turbines and motors. However, aswas mentioned above, 2400 uniquecombinations have been identified atthe Bishop plant. Obviously, testing eachcombination would not be a viable option.
The balancing options at the Bishopplant consist of a number of steam turbinesand electric motors. The followingvariables were defined to represent theimpact of these options on variable steamand electricity demand:
PVS,PVS,
PVS'PVE
- increase in 600 psig demand,- increase in 240 psig demand,- decrease in 240 psig demand,- decrease in 40 psig demand,- increase in electricity demand.
Minimu.ns and maximums were determinedfor each variable and introduced asconstraints to the objective function. Theoptimal solution of the objective functiondetermines optimal values for the variablesteam and electricity.
It was then necessary to determinewhich of the 24 00 combinations most closelyrepresents the optimal solution. The totalpower required by each combination wascalculated as the equivalent kW of steampower extracted through the turbines(assuming a 55% efficiency) plus the kWrequired by the motors and was found to berelatively constant.
The differences between the values ofthe variables (PVSs and PVE) in the optimalsolution and in each combination werecalculated. The combination with theminimum sum of the absolute values of thesedifferences was selected as the optimalcombination. Recognizing that there iswork and cost involved in switching betweencombinations, heuristic guidelines wereapplied to determine if the recommendedcombination would be practical.
CONCLUSIONS
The Hoechst Celanese Energy Model is auseful tool for forecasting demand,reconciling usage and for ongoing plantoptimization. Its major strengths are:
- simulation precision resultingfrom a thorough understanding ofthe plant energy systems
- optimization based on actualcosts of operation
- automated optimization of turbineand motor balancingmodel flexibility due to modularstructure
- model accuracy due to granularityin unit spreadsheetsstraightforward design resultingin maintainabilityversatile software platform foruse in on-line plant optimization
NOMENCLATURE
The symbol "m" refers to 103
to 10s.and "mm" refers
BDj = breakdown valve steam flow, mlb/hrwhere,
i=l is 600 psig/240 psig valvei=2 is 240 psig/40 psig valvei=3 is 40 psig/5 psig East valvei=4 is 40 psig/5 psig West valve
24
CPL- = electricity purchased from CPL, kWCPLs = electricity sold to CPL, kWCR = unit condensate return, mlb/hrDI = demineralized water produced, mgal/hrf, = a,*TS, + b,where,
a and b are constants and the sum offj*TGj is the electricity produced inthe turbogenerator
FG = fuel gas purchases required, mmBTU/hrFG BH = Boilerhouse fuel gas demand,
mmBTU/hrPBL = power boiler load, mlb/hrPVS, = increase in 600 psig demand,
i iPVS, = increase in 240 psig demandPVS'2= decrease in 240 psig demand,PVS'3 = decrease in 40 psig demand,PVE = increase in electricity demand, kWTGj = steam flow through stage i of the
turbogenerator, mlb/hr
mlb/hrmlb/hrmlb/hrmlb/hr
where,i=l is 600 psig/240 psig stagei=2 is 240 psig/40 psig stagei=3 is 240 psig/5 psig East stage
V- = steam vent to the atmosphere, mlb/hrwhere,
i=l is 240 psig venti=2 is 40 psig venti=3 is 5 psig East venti=4 is 5 psig West vent
WG = unit Waste Gas production, mmBTU/hrWG BH = Boilerhouse waste gas demand,
mmBTU/hrWG VENT = waste gas to vent flare, mmBTU/hr
REFERENCES
1. Rao, S. S., Optimization: Theory andApplications. Wiley Eastern Limited, NewDelhi, 1984, pp. 86-133.
25
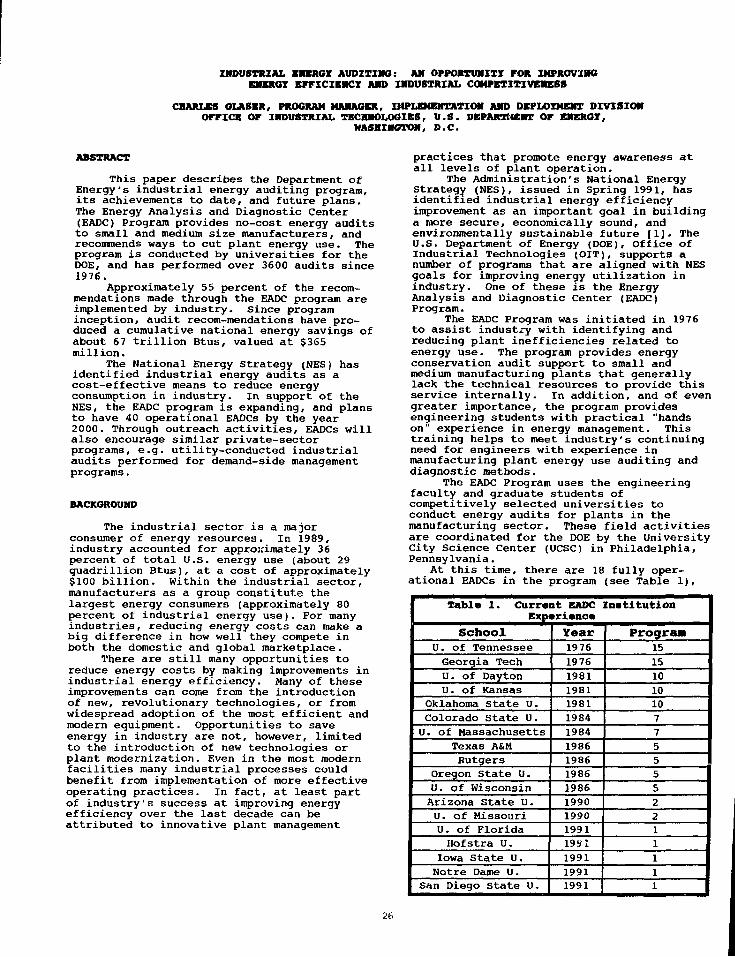
INDUSTRIAL ENERGY AUDITING: AN OPPORTUNITY FOR IMPROVINGENBRGX EFFICIENCY AND INDUSTRIAL COMPETITIVENESS
CHARLES GLASER, PROGRAM MANAGER, IMPLEMENTATION AND DEPLOYMENT DIVISIONOFFICE OF INDUSTRIAL TECHNOLOGIES, U.S. DEPARTMENT OF ENERGY,
WASHINGTON, D.C.
ABSTRACT
This paper describes the Department ofEnergy's industrial energy auditing program,its achievements to date, and future plans.The Energy Analysis and Diagnostic Center(EADC) Program provides no-cost energy auditsto small and medium size manufacturers, andrecommends ways to cut plant energy use. Theprogram is conducted by universities for theDOE, and has performed over 3600 audits since1976.
Approximately 55 percent of the recom-mendations made through the EADC program areimplemented by industry. Since programinception, audit recom-mendations have pro-duced a cumulative national energy savings ofabout 67 trillion Btus, valued at $365million.
The National Energy Strategy (NES) hasidentified industrial energy audits as acost-effective means to reduce energyconsumption in industry. In support of theNES, the EADC program is expanding, and plansto have 40 operational EADCs by the year2000. Through outreach activities, EADCs willalso encourage similar private-sectorprograms, e.g. utility-conducted industrialaudits performed for demand-side managementprograms.
BACKGROUND
The industrial sector is a majorconsumer of energy resources. In 1989,industry accounted for approximately 36percent of total U.S. energy use (about 29quadrillion Btus), at a cost of approximately$100 billion. Within the industrial sector,manufacturers as a group constitute thelargest energy consumers (approximately 80percent of industrial energy use). For manyindustries, reducing energy costs can make abig difference in how well they compete inboth the domestic and global marketplace.
There are still many opportunities toreduce energy costs by making improvements inindustrial energy efficiency. Many of theseimprovements can come from the introductionof new, revolutionary technologies, or fromwidespread adoption of the most efficient andmodern equipment. Opportunities to saveenergy in industry are not, however, limitedto the introduction of new technologies orplant modernization. Even in the most modernfacilities many industrial processes couldbenefit from implementation of more effectiveoperating practices. In fact, at least partof industry's success at improving energyefficiency over the last decade can beattributed to innovative plant management
practices that promote energy awareness atall levels of plant operation.
The Administration's National EnergyStrategy (NES), issued in Spring 1991, hasidentified industrial energy efficiencyimprovement as an important goal in buildinga more secure, economically sound, andenvironmentally sustainable future [1]. TheU.S. Department of Energy (DOE), Office ofIndustrial Technologies (OIT), supports anumber of programs that are aligned with NESgoals for improving energy utilization inindustry. One of these is the EnergyAnalysis and Diagnostic Center (EADC)Program.
The EADC Program was initiated in 1976to assist industry with identifying andreducing plant inefficiencies related toenergy use. The program provides energyconservation audit support to small andmedium manufacturing plants that generallylack the technical resources to provide thisservice internally. In addition, and of evengreater importance, the program providesengineering students with practical "handson" experience in energy management. Thistraining helps to meet industry's continuingneed for engineers with experience inmanufacturing plant energy use auditing anddiagnostic methods.
The EADC Program uses the engineeringfaculty and graduate students ofcompetitively selected universities toconduct energy audits for plants in themanufacturing sector. These field activitiesare coordinated for the DOE by the UniversityCity Science Center (UCSC) in Philadelphia,Pennsylvania.
At this time, there are 18 fully oper-ational EADCs in the program (see Table 1),
Table 1. Currant EADC InstitutionExparianca
SchoolU. of TennesseeGeorgia TechU. of DaytonU. of Kansas
Oklahoma State U.Colorado State U.U. of Massachusetts
Texas A&MRutgers
Oregon State U.u. of WisconsinArizona State U.U. of MissouriU. of FloridaHofstra U,
Iowa State U.Notre Dame U.
San Diego State U.
Year197619761981198119811984198419861986198619861990199019911961199119911991
Program15
15
10
1010
7
7
5
55
5221
1
1
11
26
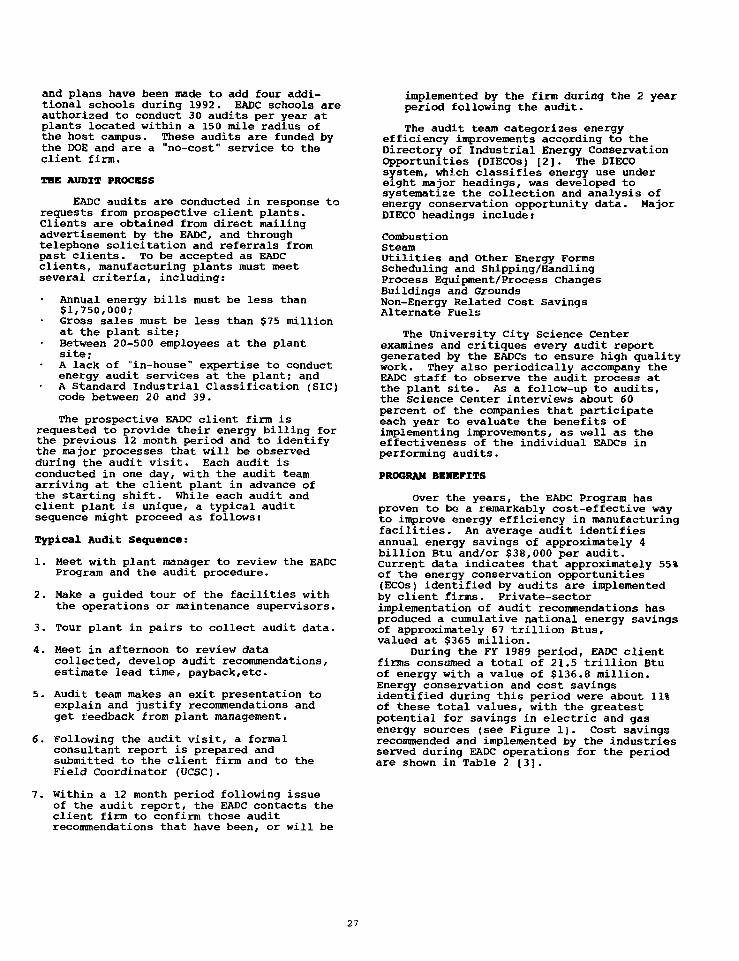
and plans have been made to add four addi-tional schools during 1992. EADC schools areauthorized to conduct 30 audits per year atplants located within a 150 mile radius ofthe host campus. These audits are funded bythe DOE and are a "no-cost" service to theclient firm.
THE AUDIT PROCESS
EADC audits are conducted in response torequests from prospective client plants.Clients are obtained from direct mailingadvertisement by the EADC, and throughtelephone solicitation and referrals frompast clients. To be accepted as EADCclients, manufacturing plants must meetseveral criteria, including:
Annual energy bills must be less than§1,750,000;Gross sales must be less than $75 millionat the plant site;Between 20-500 employees at the plantsite;A lack of "in-house" expertise to conductenergy audit services at the plant; andA Standard Industrial Classification (SIC)code between 20 and 39.
The prospective EADC client firm isrequested to provide their energy billing forthe previous 12 month period and to identifythe major processes that will be observedduring the audit visit. Each audit isconducted in one day, with the audit teamarriving at the client plant in advance ofthe starting shift. While each audit andclient plant is unique, a typical auditsequence might proceed as follows:
Typical Audit Sequence:
1. Meet with plant manager to review the EADCProgram and the audit procedure.
2. Make a guided tour of the facilities withthe operations or maintenance supervisors.
3. Tour plant in pairs to collect audit data.
4. Meet in afternoon to review datacollected, develop audit recommendations,estimate lead time, payback,etc.
5. Audit team makes an exit presentation toexplain and justify recommendations andget feedback from plant management.
6. Following the audit visit, a formalconsultant report is prepared andsubmitted to the client firm and to theField Coordinator (UCSC).
7. Within a 12 month period following issueof the audit report, the EADC contacts theclient firm to confirm those auditrecommendations that have been, or will be
implemented by the firm during the 2 yearperiod following the audit.
The audit team categorizes energyefficiency improvements according to theDirectory of Industrial Energy ConservationOpportunities (DIECOs) [2]. The DIECOsystem, which classifies energy use undereight major headings, was developed tosystematize the collection and analysis ofenergy conservation opportunity data. MajorDIECO headings include:
CombustionSteamUtilities and Other Energy FormsScheduling and Shipping/HandlingProcess Equipment/Process ChangesBuildings and GroundsNon-Energy Related Cost SavingsAlternate Fuels
The University City Science Centerexamines and critiques every audit reportgenerated by the EADCs to ensure high qualitywork. They also periodically accompany theEADC staff to observe the audit process atthe plant site. As a follow-up to audits,the Science Center interviews about 60percent of the companies that participateeach year to evaluate the benefits ofimplementing improvements, as well as theeffectiveness of the individual EADCs inperforming audits.
PROGRAM BENEFITS
Over the years, the EADC Program hasproven to be a remarkably cost-effective wayto improve energy efficiency in manufacturingfacilities. An average audit identifiesannual energy savings of approximately 4billion Btu and/or §38,000 per audit.Current data indicates that approximately 55%of the energy conservation opportunities(ECOs) identified by audits are implementedby client firms. Private-sectorimplementation of audit recommendations hasproduced a cumulative national energy savingsof approximately 67 trillion Btus,valued at $365 million.
During the FV 1989 period, EADC clientfirms consumed a total of 21.5 trillion Btuof energy with a value of §136.8 million.Energy conservation and cost savingsidentified during this period were about 11%of these total values, with the greatestpotential for savings in electric and gasenergy sources (see Figure 1). Cost savingsrecommended and implemented by the industriesserved during EADC operations for the periodare shown in Table 2 [3].
27
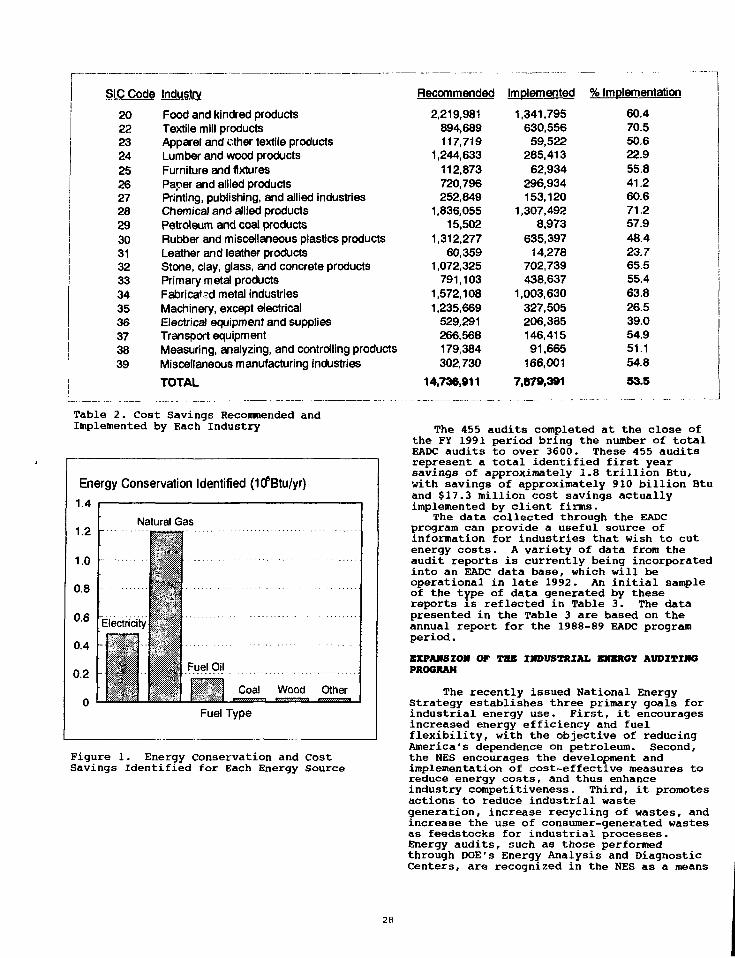
SIC Code Industry
20 Food and kindred products22 Textile mill products23 Apparel and ether textile products24 Lumber and wood products25 Furniture and fixtures26 Paper and allied products27 Printing, publishing, and allied industries28 Chemical and allied products29 Petroleum and coal products30 Rubber and miscellaneous plastics products31 Leather and leather products32 Stone, clay, glass, and concrete products33 Primary metal products34 Fabricated metal industries35 Machinery, except electrical36 Electrical equipment and supplies37 Transport equipment38 Measuring, analyzing, and controlling products39 Miscellaneous manufacturing industries
TOTAL
Recommended
2,219,981894,689117,719
1,244,633112,873720,796252,849
1,836,05515,502
1,312,27760,359
1,072,325791,103
1,572,1081,235,669
529,291266,568
S 179,384302,730
14,736,911
Implemented
1,341,795630,55659,522
285,41362,934
296,934153,120
1,307,4928,973
635,39714,278
702,739438,637
1,003,630327,505206,335146,41591,665
166,001
7,879,391
% Implementation
60.470.550.622.955.841.260.671.257.948.423.765.555.463.826.539.054.951.154.8
53.5
Table 2. Cost Savings Recommended andImplemented by Each Industry
Energy Conservation Identified (KfBtu/yr)
1.4
1.2
1.0
0.8
0.6
0.4
0.2
0
Natural Gas
fi
Electricity
Fuel Oil
Coal Wood Other
Fuel Type
Figure 1. Energy Conservation and CostSavings Identified for Each Energy Source
The 455 audits completed at the close ofthe FY 1991 period bring the number of totalEADC audits to over 3600. These 455 auditsrepresent a total identified first yearsavings of approximately 1.8 trillion Btu,with savings of approximately 910 billion Btuand $17.3 million cost savings actuallyimplemented by client firms.
The data collected through the EADCprogram can provide a useful source ofinformation for industries that wish to cutenergy costs. A variety of data from theaudit reports is currently being incorporatedinto an EADC data base, which will beoperational in late 1992. An initial sampleof the type of data generated by thesereports is reflected in Table 3. The datapresented in the Table 3 are based on theannual report for the 1988-89 EADC programperiod.
BXPAMSZON OF THE INDUSTRIAL ENERGX AUDITINGPROGRAM
The recently issued National EnergyStrategy establishes three primary goals forindustrial energy use. First, it encouragesincreased energy efficiency and fuelflexibility, with the objective of reducingAmerica's dependence on petroleum. Second,the NES encourages the development andimplementation of cost-effective measures toreduce energy costs, and thus enhanceindustry competitiveness. Third, it promotesactions to reduce industrial wastegeneration, increase recycling of wastes, andincrease the use of consumer-generated wastesas feedstocks for industrial processes.Energy audits, such as those performedthrough DOE's Energy Analysis and DiagnosticCenters, are recognized in the NES as a means
28
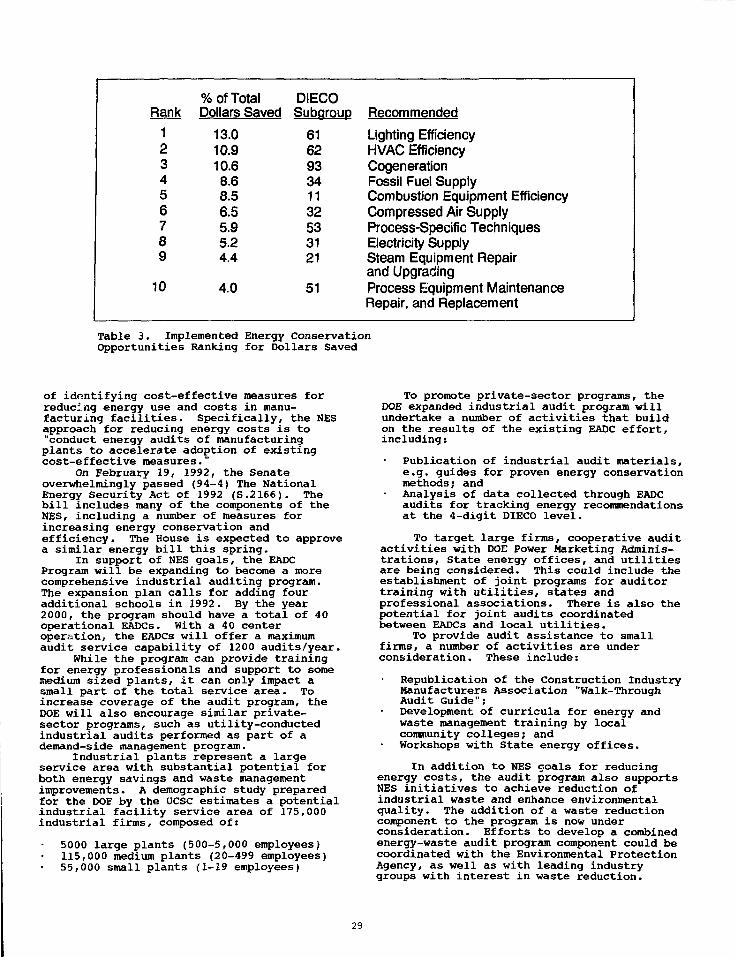
Rank
123456789
10
% of TotalDollars Saved
13.010.910.68.68.56.55.95.24.4
4.0
DIECOSubgroup
616293341132533121
51
Recommended
Lighting EfficiencyHVAC EfficiencyCogenerationFossil Fuel SupplyCombustion Equipment EfficiencyCompressed Air SupplyProcess-Specific TechniquesElectricity SupplySteam Equipment Repairand UpgradingProcess Equipment MaintenanceRepair, and Replacement
Table 3. Implemented Energy ConservationOpportunities Ranking for Dollars Saved
of identifying cost-effective measures forreducing energy use and costs in manu-facturing facilities. Specifically, the NESapproach for reducing energy costs is to"conduct energy audits of manufacturingplants to accelerate adoption of existingcost-effective measures."
On February 19, 1992, the Senateoverwhelmingly passed (94-4) The NationalEnergy Security Act of 1992 (S.2166). Thebill includes many of the components of theNES, including a number of measures forincreasing energy conservation andefficiency. The House is expected to approvea similar energy bill this spring.
In support of NES goals, the EADCProgram will be expanding to become a morecomprehensive industrial auditing program.The expansion plan calls for adding fouradditional schools in 1992. By the year2000, the program should have a total of 40operational EADCs. With a 40 centeroperation, the EADCs will offer a maximumaudit service capability of 1200 audits/year.
While the program can provide trainingfor energy professionals and support to somemedium sized plants, it can only impact asmall part of the total service area. Toincrease coverage of the audit program, theDOE will also encourage similar private-sector programs, such as utility-conductedindustrial audits performed as part of ademand-side management program.
Industrial plants represent a largeservice area with substantial potential forboth energy savings and waste managementimprovements. A demographic study preparedfor the DOE by the UCSC estimates a potentialindustrial facility service area of 175,000industrial firms, composed of:
5000 large plants (500-5,000 employees)115,000 medium plants (20-499 employees)55,000 small plants (1-19 employees)
To promote private-sector programs, theDOE expanded industrial audit program willundertake a number of activities that buildon the results of the existing EADC effort,including:
Publication of industrial audit materials,e.g. guides for proven energy conservationmethods; andAnalysis of data collected through EADCaudits for tracking energy recommendationsat the 4-digit DIECO level.
To target large firms, cooperative auditactivities with DOE Power Marketing Adminis-trations, State energy offices, and utilitiesare being considered. This could include theestablishment of joint programs for auditortraining with utilities, states andprofessional associations. There is also thepotential for joint audits coordinatedbetween EADCs and local utilities.
To provide audit assistance to smallfirms, a number of activities are underconsideration. These include:
Republication of the Construction IndustryManufacturers Association "Walk-ThroughAudit Guide";Development of curricula for energy andwaste management training by localcommunity colleges; andWorkshops with State energy offices.
In addition to NES coals for reducingenergy costs, the audit program also supportsNES initiatives to achieve reduction ofindustrial waste and enhance environmentalquality. The addition of a waste reductioncomponent to the program is now underconsideration. Efforts to develop a combinedenergy-waste audit program component could becoordinated with the Environmental ProtectionAgency, as well as with leading industrygroups with interest in waste reduction.
29
SUMURX
Establishing more extensive industrialenergy auditing must be a cooperative effort.While EADC activity provides a resource forinformation and experience on industrialauditing, it is not sufficient to accomnodatethe needs of the total industrial sector.Expanded efforts by utilities, states,consulting firms, and others can beencouraged through EADC information andindustrial audit training support. Theindustrial audit should provide not. onlyenergy conservation assistance, but processimprovements, alternatives for management ofindustrial waste, and improvements to supportenvironmental goals that will keep Americanindustry competitive in the world marketplace. DOE hopes to work closely with theprivate sector in this effort.
References
1. The National Energy Strategy: PowerfulIdeas for America, 1st Ed., U.S.Government Printing Office, Washington,D.C., 1991.
2. F. William Kirsch, Directory ofIndustrial Energy ConservationOpportunities, University City ScienceCenter, Philadelphia, PA, 1990.
3. F. William Kirsch, Energy Conserved andCosts Saved by Small and Medium-SizeManufacturers; 1988-89 EADC ProgramPeriod, University City Science Center,Philadelphia, PA, 1991.
30
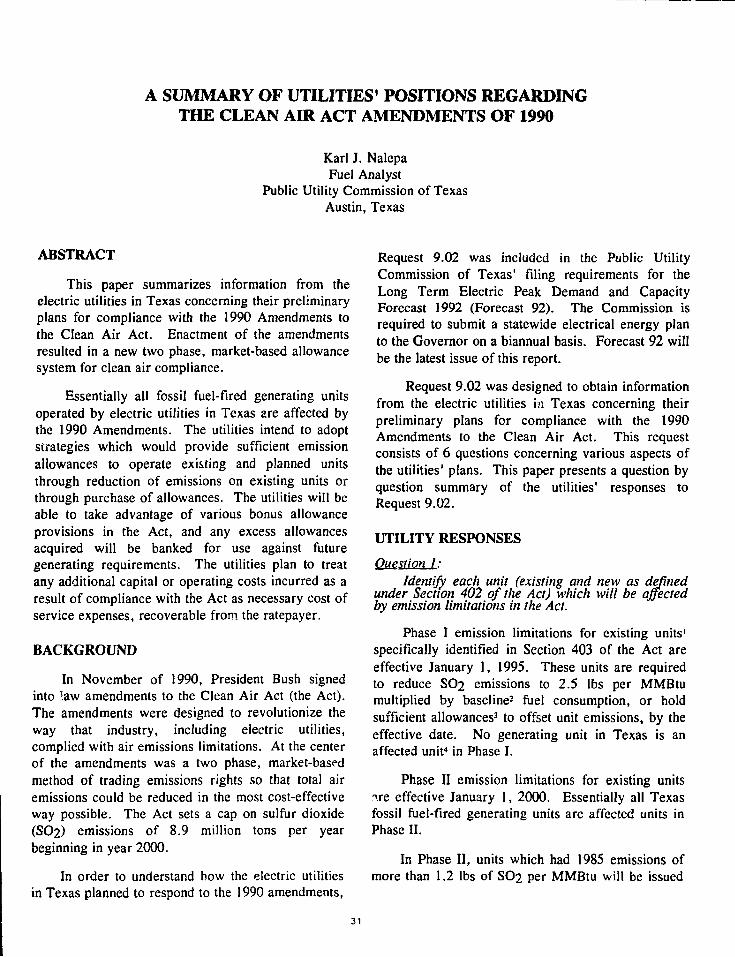
A SUMMARY OF UTILITIES' POSITIONS REGARDINGTHE CLEAN AIR ACT AMENDMENTS OF 1990
Karl J. NalepaFuel Analyst
Public Utility Commission of TexasAustin, Texas
ABSTRACT
This paper summarizes information from theelectric utilities in Texas concerning their preliminaryplans for compliance with the 1990 Amendments tothe Clean Air Act. Enactment of the amendmentsresulted in a new two phase, market-based allowancesystem for clean air compliance.
Essentially all fossil fuel-fired generating unitsoperated by electric utilities in Texas are affected bythe 1990 Amendments. The utilities intend to adoptstrategies which would provide sufficient emissionallowances to operate existing and planned unitsthrough reduction of emissions on existing units orthrough purchase of allowances. The utilities will beable to take advantage of various bonus allowanceprovisions in the Act, and any excess allowancesacquired will be banked for use against futuregenerating requirements. The utilities plan to treatany additional capital or operating costs incurred as aresult of compliance with the Act as necessary cost ofservice expenses, recoverable from the ratepayer.
BACKGROUND
In November of 1990, President Bush signedinto law amendments to the Clean Air Act (the Act).The amendments were designed to revolutionize theway that industry, including electric utilities,complied with air emissions limitations. At the centerof the amendments was a two phase, market-basedmethod of trading emissions rights so that total airemissions could be reduced in the most cost-effectiveway possible. The Act sets a cap on sulfur dioxide(SO2) emissions of 8.9 million tons per yearbeginning in year 2000.
In order to understand how the electric utilitiesin Texas planned to respond to the 1990 amendments,
Request 9.02 was included in the Public UtilityCommission of Texas' filing requirements for theLong Term Electric Peak Demand and CapacityForecast 1992 (Forecast 92). The Commission isrequired to submit a statewide electrical energy planto the Governor on a biannual basis. Forecast 92 willbe the latest issue of this report.
Request 9.02 was designed to obtain informationfrom the electric utilities in Texas concerning theirpreliminary plans for compliance with the 1990Amendments to the Clean Air Act. This requestconsists of 6 questions concerning various aspects ofthe utilities1 plans. This paper presents a question byquestion summary of the utilities' responses toRequest 9.02.
UTILITY RESPONSES
Question I:Identify each unit (existing and new as defined
under Section 402 of the Act) which will be affectedby emission limitations in the Act.
Phase I emission limitations for existing units'specifically identified in Section 403 of the Act areeffective January 1, 1995. These units are requiredto reduce SO2 emissions to 2.5 lbs per MMBtumultiplied by baseline2 fuel consumption, or holdsufficient allowances3 to offset unit emissions, by theeffective date. No generating unit in Texas is anaffected unit4 in Phase I.
Phase II emission limitations for existing unitsr\re effective January 1, 2000. Essentially all Texasfossil fuel-fired generating units are affected units inPhase II.
In Phase II, units which had 1985 emissions ofmore than 1.2 lbs of SO2 per MMBtu will be issued
31
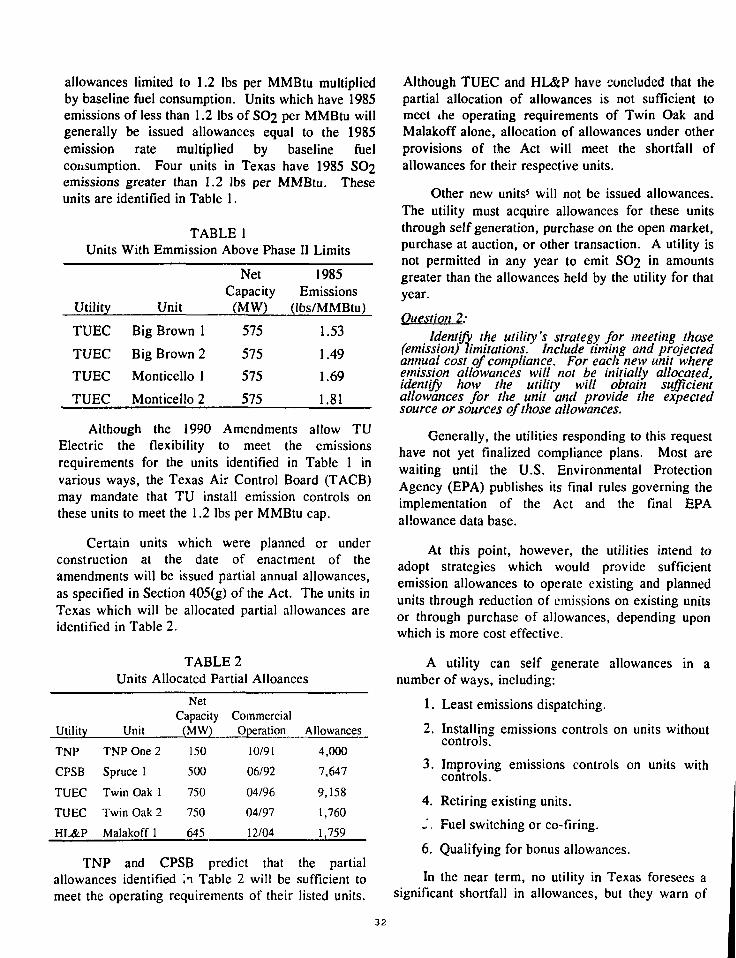
allowances limited to 1.2 lbs per MMBtu multipliedby baseline fuel consumption. Units which have 1985emissions of less than 1.2 lbs of SO2 per MMBtu willgenerally be issued allowances equal to the 1985emission rate multiplied by baseline fuelconsumption. Four units in Texas have 1985 SO2emissions greater than 1.2 lbs per MMBtu. Theseunits are identified in Table 1.
TABLE 1Units With Emmission Above Phase II Limits
Utility Unit
NetCapacity(MW)
1985Emissions
(ibs/MMBtu)
TUEC Big Brown 1 575 1.53
TUEC Big Brown 2 575 1.49
TUEC Monticellol 575 1.69
TUEC Monticello 2 575 1.81
Although the 1990 Amendments allow TUElectric the flexibility to meet the emissionsrequirements for the units identified in Table 1 invarious ways, the Texas Air Control Board (TACB)may mandate that TU install emission controls onthese units to meet the 1.2 lbs per MMBtu cap.
Certain units which were planned or underconstruction at the date of enactment of theamendments will be issued partial annual allowances,as specified in Section 405(g) of the Act. The units inTexas which will be allocated partial allowances areidentified in Table 2.
TABLE 2Units Allocated Partial Alloances
Utility
TNP
CPSB
TUEC
TUEC
HL&P
Unit
TNP One 2
Spruce 1
Twin Oak 1
Twin Oak 2
Malakoff 1
NetCapacity
(MW)
150
500
750
750
645
CommercialOperation
10/91
06/92
04/96
04/97
12/04
Allowances
4,000
7,647
9,158
1,760
1,759
TNP and CPSB predict that the partialallowances identified in Table 2 will be sufficient tomeet the operating requirements of their listed units.
Although TUEC and HL&P have concluded that thepartial allocation of allowances is not sufficient tomeet ihe operating requirements of Twin Oak andMalakoff alone, allocation of allowances under otherprovisions of the Act will meet the shortfall ofallowances for their respective units.
Other new units5 will not be issued allowances.The utility must acquire allowances for these unitsthrough self generation, purchase on the open market,purchase at auction, or other transaction. A utility isnot permitted in any year to emit SO2 in amountsgreater than the allowances held by the utility for thatyear.
Question 2:Identify the utility's strategy for meeting those
(emission) limitations. Include timing and projectedannual cost of compliance. For each new unit whereemission allowances will not be initially allocated,identify how the utility will obtain sufficientallowances for the unit and provide the expectedsource or sources of those allowances.
Generally, the utilities responding to this requesthave not yet finalized compliance plans. Most arewaiting until the U.S. Environmental ProtectionAgency (EPA) publishes its final rules governing theimplementation of the Act and the final EPAallowance data base.
At this point, however, the utilities intend toadopt strategies which would provide sufficientemission allowances to operate existing and plannedunits through reduction of emissions on existing unitsor through purchase of allowances, depending uponwhich is more cost effective.
A utility can self generate allowances in anumber of ways, including:
1. Least emissions dispatching.
2. Installing emissions controls on units withoutcontrols.
3. Improving emissions controls on units withcontrols.
4. Retiring existing units.
J. Fuel switching or co-firing.
6. Qualifying for bonus allowances.
In the near term, no utility in Texas foresees asignificant shortfall in allowances, but they warn of
32

several factors which could greatly influence the needand availability of allowances in the future. Thesefactors include:
1. Given any significant increase in oilconsumption due to gas availability or cost,additional allowances will be needed to meetexisting electrical demand.
2. Additional electrical capacity to meet futuregrowth will require associated allowances.
3. In order to meet the mandated 8.9 million tonannual limit on SO2 emissions, the EPA will"ratchet down" or decrease all basicallowance allocations on a pro rata basis.This "ratcheting down" may reach as high as10 percent across the board for all units.
4. Possible regulatory restrictions on themovement ofallowances between states.
Several utilities pointed out that other provisionsof the Act will result in financial impacts:
1. Title I will likely require emissions reductionsrelated to air quality nonattainment areas inTexas. Houston-Galveston, Dallas-FortWorth, Beaumont-Pt. Arthur, and El Paso areall classified as nonattainment for one ormore air pollutants.
2. Title II and current state laws could requireconversion of centrajly-fueled ileet vehicles toalternative fuels. Texas state law alreadyrequires designated vehicle fleets to convertto alternative fuel use. 50 percent of thevehicles in affected fleets must be convertedby September 1996.
3. Title III may require development andimplementation of emissions controls formajor sources of hazardous air pollutants.The EPA is required to complete a study byNovember 1993 of the hazards to publichealth as a result of emissions of hazardousair pollutants by electric utility generatingunits.
4. Title IV also contains NOx reduction andcontinuous emissions monitoring (CEM)requirements. For example, utilities estimatethat the capital costs to install CEM deviceswill be from 580,000 to $200,000 per unit.Operating costs for the CEM devices can be$30,000 to $75,000 per unit per year.
5. Title V includes comprehensive permittingrequirements and new permit fees. This titlerequires that the permitting fees that arecollected adequately reflect the costs of thepermitting program, and proposes as abenchmark fees of $25 per ton of regulatedpollutant.
Question 3:Explain how the utility will acquire the maximum
number of bonus allowances available to it under theAct. Identify each section of the Act under whichbonus allowances are available and discuss how theutility will qualify for the allowances. For example,how will the utility qualify under Sec. 4040 of theAct, which allocates bonus allowances for emissionsavoided through energy conservation and renewableenergy on a first-come-first-served basis.
Section 404(f). For emissions avoidedthrough energy conservation and renewableenergy programs implemented after January 1,1992, provides 300,000 bonus allowances.
This Section is intended to provide compensationto utilities in states which can avoid futurecombustion of fossil fuels and consequently reducefuture emissions.
TU Electric and the City of Austin believe tiiatthey will qualify for these bonus allowances under theconservation plans that are currently in place. Mostother utilities are unsure if the plans they operate willqualify under the guidelines established in the Act.Many believe that these conservation and renewablebonuses will be consumed by utilities that areaggressively pursuing demand side management andrenewable energy options in states that have a formalleast cost planning process.
Sections 405(hH2) and (3). For oiland gas-fired units whose average annual fuelconsumption during the period 1980 through1989 was less than 10 percent oil, providesannual bonus allowances equal to the unit'sbaseline fuel consumption multiplied by 0.050lbs per MMBtu beginning in year 2000.
This Section is intended to reward utilities whichhave low unit emissions as a result of burning naturalgas rather than oil or coal.
Most gas-fired units in Texas are eligible forthese standard bonus allowances, if the Governordoes not elect the bonuses under Section 406.
Section 406. Upon election of theGovernor of any State with a 1985 state-wideannual SO7 emissions rate equal to, or lessthan, 0.80 lbs per MMBtu, annual allocation inan amount equal to 125,000 multiplied by theunit's pro rata share of electricity generated incalendar year 1985 at units in all States eligiblefor the election. These allowances win beallocated annually from year 2000 through2009, and will be distributed in lieu of otherbonus allowance allocations for which the unitis eligible.
33
This Section is intended to provide compensationto utilities in states which have already invested toachieve comparatively low unit emissions.
Texas is eligible for the Section 406, or "CleanState" election, but the Governor has elected to deferher decision until a final allowance data base ispublished. More allowances would be allocated toTexas as a whole under Section 406 than underalternative bonus provisions in the Act.
However, GSU and EPE are allocated fewerallowances under Section 406 in Texas than underalternative bonus provisions. These utilities expect tobe compensated for "lost" Section 406 allowances.While WTU will also receive fewer allowances undera Section 406 election, the CSW system as a whole(which includes WTU, SWEPCO, and CPL in Texas)will receive more allowances under Section 406 thanalternative bonus provisions.
Louisiana is eligible for the Section 406 election,and its Governor has already made such an election.GSU, with a service area that includes Texas andLouisiana, is allocated more allowances in Louisianaunder Section 406 than under alternative bonusprovisions. New Mexico is also eligible for theSection 406 election, and its Governor, too, has madesuch an election. EPE, with a service area thatincludes Texas and New Mexico, is allocated moreallowances in New Mexico under Section 406 thanunder alternative bonus provisions.
Question 4:If the utility projects that it will generate excess
allowances as a result of its compliance strategy,explain if the utility plans to bank, sell, trade orotherwise dispose of the allowances.
If an affected utility emits SO2 withoutcorresponding allowances in a given year, the utilitywill be penalized $2,000 per ton, and the excessemissions must be offset in the next year.
Most utilities in Texas project that they will notgenerate a substantial number of excess allowances.However, because of the severe penalty for emittingSO2 without allowances, utilities will generally bankany excess allowances they may generate in order toinsure against unexpected emission control upsets andfor use by future units.
Question 5:Explain how the utility plans to treat compliance
costs and revenues on allowance sales, for rate-making purposes.
The utilities have not fully determined how theyplan to treat compliance costs and revenues.Generally, however, they will include any requiredconstruction costs related to compliance in plant inservice, and as such, will be subject to depreciation.This depreciation expense will be included in cost ofservice with the undepreciated balance of theconstruction costs included in rate base. AdditionalO&M expense will be included in cost of service.
GSU believes that if it ultimately makes someallowance sales, any gains or losses on such salesshould be shared appropriately between shareholdersand ratepayers. Ratepayers should receive somebenefit since they have paid compliance costs whichresult in having excess allowances available to besold. However, utility shareholders should receive alarge enough share of the gains to provide anincentive for utilities to trade emission allowances.
SWEPCO proposes that EPA's annual allocationof allowances to units in the rate base should belongto the ratepayer. When these allowances areconsumed by the unit, it is at no cost to the ratepayer.If the unit receives allowances in excess of its needs(including a reserve margin) that are sold, therevenue could be booked against fuel expenses. If aunit increased operating expenses to generateallowances for sale, the net revenue could be creditedto fuel.
Conversely, SWEPCO proposes that allowancesissued to units not in the rate base should belong tothe stockholder. When these allowances areconsumed, the cost could be booked to fuel expense.If a capital expenditure is made to generateallowances and the capital is not in the rate base, theadditional allowances should be the property of thestockholder.
Question 6:For each affected unit, provide the baseline fuel
consumption fMMBtu), as defined under Section 402of the Act. Also provide for each affected unit itsactual 1985 SO2 emissions rate fin lbs per MMBtu).
34
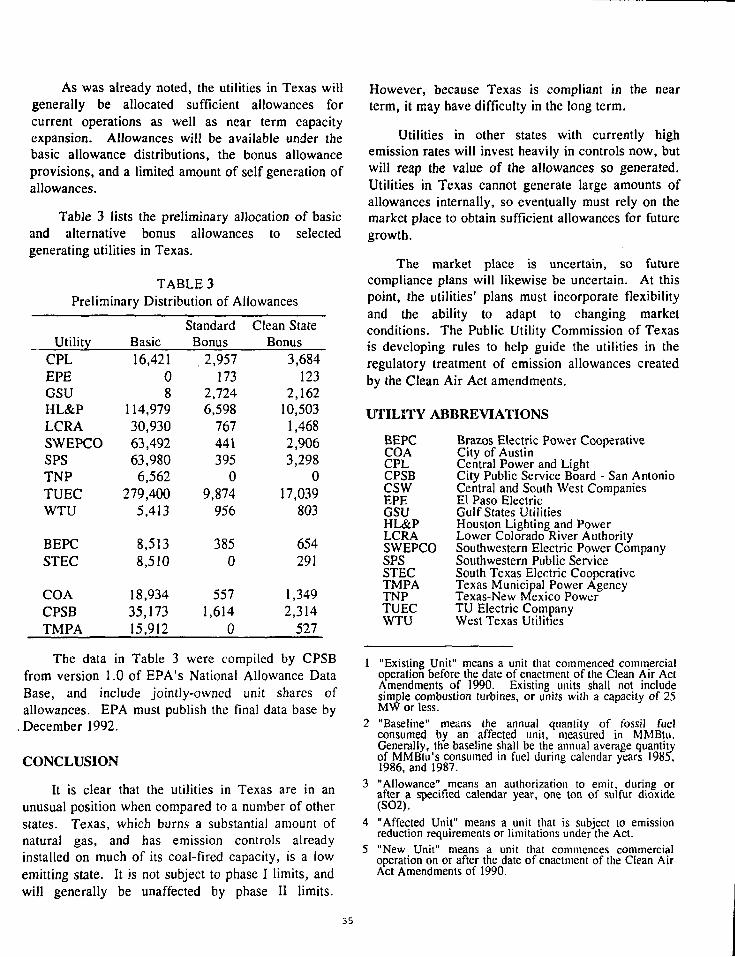
As was already noted, the utilities in Texas willgenerally be allocated sufficient allowances forcurrent operations as well as near term capacityexpansion. Allowances will be available under thebasic allowance distributions, the bonus allowanceprovisions, and a limited amount of self generation ofallowances.
Table 3 lists the preliminary allocation of basicand alternative bonus allowances to selectedgenerating utilities in Texas.
TABLE 3Preliminary Distribution of Allowances
UtilityCPLEPEGSUHL&PLCRASWEPCOSPSTNPTUECWTU
BEPCSTEC
COACPSBTMPA
Basic16,421
08
114,97930,93063,49263,9806,562
279,4005,413
8,5138,510
18,93435,17315,912
StandardBonus
2,957173
2,7246,598
767441395
09,874
956
3850
5571,614
0
Clean StateBonus
3,684123
2,16210,5031,4682,9063,298
017,039
803
654291
1,3492,314
527
The data in Table 3 were compiled by CPSBfrom version 1.0 of EPA's National Allowance DataBase, and include jointly-owned unit shares ofallowances. EPA must publish the final data base by
. December 1992.
CONCLUSION
It is clear that the utilities in Texas are in anunusual position when compared to a number of otherstates. Texas, which burns a substantial amount ofnatural gas, and has emission controls alreadyinstalled on much of its coal-fired capacity, is a lowemitting state. It is not subject to phase I limits, andwill generally be unaffected by phase II limits.
However, because Texas is compliant in the nearterm, it may have difficulty in the long term.
Utilities in other states with currently highemission rates will invest heavily in controls now, butwill reap the value of the allowances so generated.Utilities in Texas cannot generate large amounts ofallowances internally, so eventually must rely on themarket place to obtain sufficient allowances for futuregrowth.
The market place is uncertain, so futurecompliance plans will likewise be uncertain. At thispoint, the utilities' plans must incorporate flexibilityand the ability to adapt to changing marketconditions. The Public Utility Commission of Texasis developing rules to help guide the utilities in theregulatory treatment of emission allowances createdby the Clean Air Act amendments.
UTILITY ABBREVIATIONS
BEPC Brazos Electric Power CooperativeCOA City of AustinCPL Central Power and LightCPSB City Public Service Board - San AntonioCSW Central and South West CompaniesEPE El Paso ElectricGSU Gulf States UtilitiesHL&P Houston Lighting and PowerLCRA Lower Colorado River AuthoritySWEPCO Southwestern Electric Power CompanySPS Southwestern Public ServiceSTEC South Texas Electric CooperativeTMPA Texas Municipal Power AgencyTNP Texas-New Mexico PowerTUEC TU Electric CompanyWTU West Texas Utilities
"Existing Unit" means a unit that commenced commercialoperation before the date of enactment of the Clean Air ActAmendments of 1990. Existing units shall not includesimple combustion turbines, or units with a capacity of 25MW or less.
"Baseline" means the annual quantity of fossil fuelconsumed by an affected unit, measured in MMBtu.Generally, the baseline shall be the annual average quantityof MMBtu's consumed in fuel during calendar years 1985,1986, and 1987.
"Allowance" means an authorization to emit, during orafter a specified calendar year, one ton of sulfur dioxide(SO2).
"Affected Unit" means a unit that is subject to emissionreduction requirements or limitations under the Act."New Unit" means a unit that commences commercialoperation on or after the date of enactment of the Clean AirAct Amendments of 1990.
35
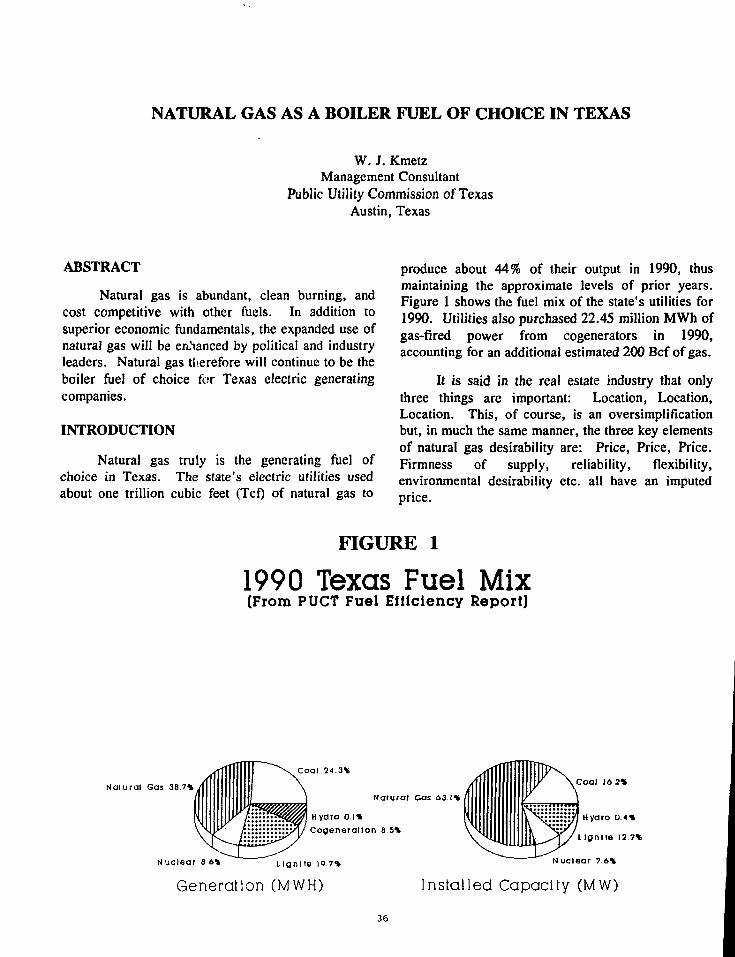
NATURAL GAS AS A BOILER FUEL OF CHOICE IN TEXAS
W. J. KmetzManagement Consultant
Public Utility Commission of TexasAustin, Texas
ABSTRACT
Natural gas is abundant, clean burning, andcost competitive with other fuels. In addition tosuperior economic fundamentals, the expanded use ofnatural gas will be enhanced by political and industryleaders. Natural gas therefore will continue to be theboiler fuel of choice for Texas electric generatingcompanies.
INTRODUCTION
Natural gas truly is the generating fuel ofchoice in Texas. The state's electric utilities usedabout one trillion cubic feet (Tcf) of natural gas to
produce about 44% of their output in 1990, thusmaintaining the approximate levels of prior years.Figure 1 shows the fuel mix of the state's utilities for1990. Utilities also purchased 22.45 million MWh ofgas-fired power from cogenerators in 1990,accounting for an additional estimated 200 Bcf of gas.
It is said in the real estate industry that onlythree things are important: Location, Location,Location. This, of course, is an oversimplificationbut, in much the same manner, the three key elementsof natural gas desirability are: Price, Price, Price.Firmness of supply, reliability, flexibility,environmental desirability etc. all have an imputedprice.
FIGURE 1
1990 Texas Fuel Mix(From PUCT Fuel Efficiency Report)
Kaiural Gas 38.7%
Nuclear a 6*
Coal 24.3%
Natural Gas 63 1%
Hydro 0.1%Coaeneration 8 5%
Coal 16 2%
l i g n i t e ]9.7%
Hydro 0.4%
Lignite 12.7%
Nuclear 7 6%
Generation (MWH) Installed Capacity (MW)
36
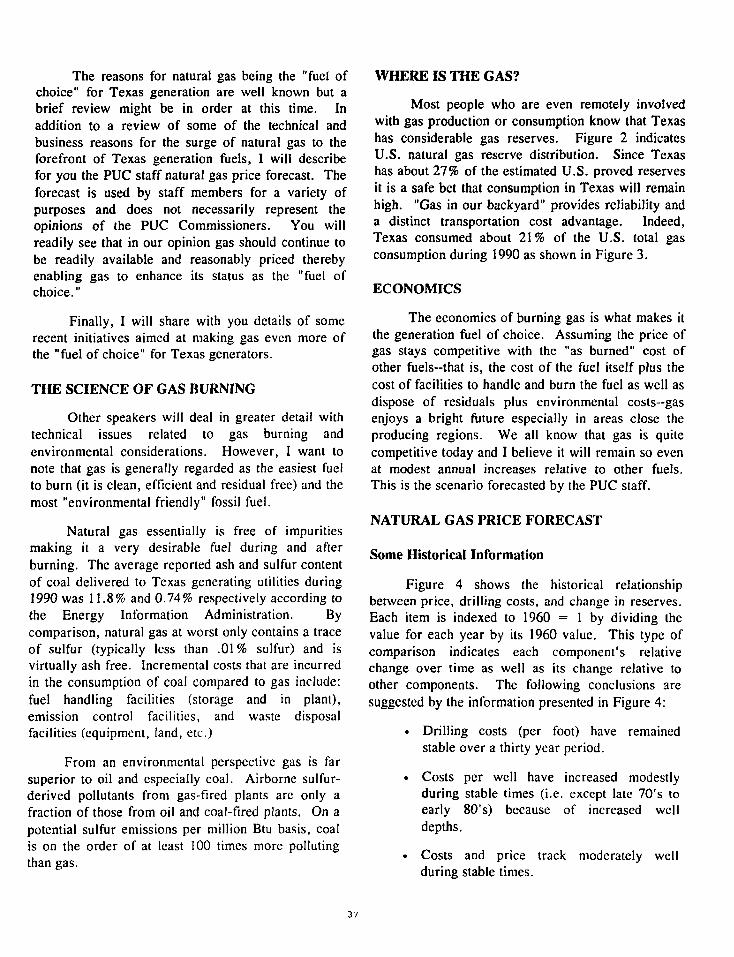
The reasons for natural gas being the "fuel ofchoice" for Texas generation are well known but abrief review might be in order at this time. Inaddition to a review of some of the technical andbusiness reasons for the surge of natural gas to theforefront of Texas generation fuels, I will describefor you the PUC staff natural gas price forecast. Theforecast is used by staff members for a variety ofpurposes and does not necessarily represent theopinions of the PUC Commissioners. You willreadily see that in our opinion gas should continue tobe readily available and reasonably priced therebyenabling gas to enhance its status as the "fuel ofchoice."
Finally, I will share with you details of somerecent initiatives aimed at making gas even more ofthe "fuel of choice" for Texas generators.
THE SCIENCE OF GAS BURNING
Other speakers will deal in greater detail withtechnical issues related to gas burning andenvironmental considerations. However, I want tonote that gas is generally regarded as the easiest fuelto burn (it is clean, efficient and residual free) and themost "environmental friendly" fossil fuel.
Natural gas essentially is free of impuritiesmaking it a very desirable fuel during and afterburning. The average reported ash and sulfur contentof coal delivered to Texas generating utilities during1990 was 11.8% and 0.74% respectively according tothe Energy Information Administration. Bycomparison, natural gas at worst only contains a traceof sulfur (typically less than .01% sulfur) and isvirtually ash free. Incremental costs that are incurredin the consumption of coal compared to gas include:fuel handling facilities (storage and in plant),emission control facilities, and waste disposalfacilities (equipment, land, etc.)
From an environmental perspective gas is farsuperior to oil and especially coal. Airborne sulfur-derived pollutants from gas-fired plants are only afraction of those from oil and coal-fired plants. On apotential sulfur emissions per million Btu basis, coalis on the order of at least 100 times more pollutingthan gas.
WHERE IS THE GAS?
Most people who are even remotely involvedwith gas production or consumption know that Texashas considerable gas reserves. Figure 2 indicatesU.S. natural gas reserve distribution. Since Texashas about 27% of the estimated U.S. proved reservesit is a safe bet that consumption in Texas will remainhigh. "Gas in our backyard" provides reliability anda distinct transportation cost advantage. Indeed,Texas consumed about 21% of the U.S. total gasconsumption during 1990 as shown in Figure 3.
ECONOMICS
The economics of burning gas is what makes itthe generation fuel of choice. Assuming the price ofgas stays competitive with the "as burned" cost ofother fuels-that is, the cost of the fuel itself plus thecost of facilities to handle and burn the fuel as well asdispose of residuals plus environmental costs—gasenjoys a bright future especially in areas close theproducing regions. We all know that gas is quitecompetitive today and I believe it will remain so evenat modest annual increases relative to other fuels.This is the scenario forecasted by the PUC staff.
NATURAL GAS PRICE FORECAST
Some Historical Information
Figure 4 shows the historical relationshipbetween price, drilling costs, and change in reserves.Each item is indexed to 1960 = 1 by dividing thevalue for each year by its 1960 value. This type ofcomparison indicates each component's relativechange over time as well as its change relative toother components. The following conclusions aresuggested by the information presented in Figure 4:
• Drilling costs (per foot) have remainedstable over a thirty year period.
• Costs per well have increased modestlyduring stable times (i.e. except lale 70's toearly 80's) because of increased welldepths.
• Costs and price track moderately wellduring stable times.
37
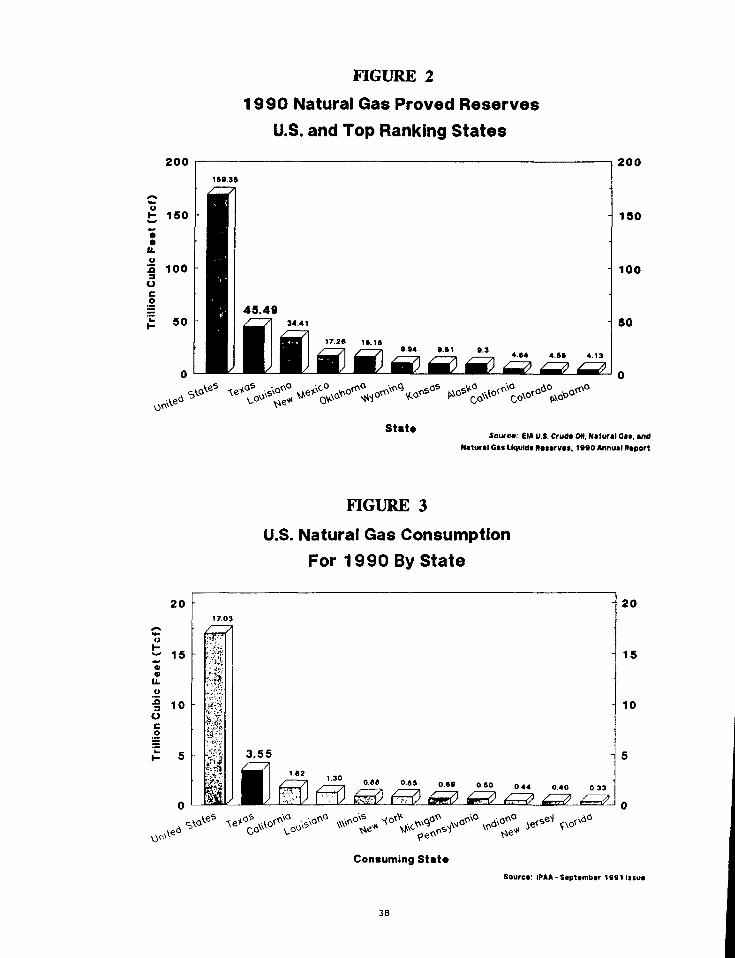
FIGURE 2
1990 Natural Gas Proved Reserves
U.S. and Top Ranking States
2 0 0 2 0 0
1S0
100
StaUSource EM U.S. Cruet OH, Natural Oa*. and
Natural Cat LlquMt Ratarvai. 1990 Annual Report
20
FIGURE 3
U.S. Natural Gas Consumption
For 1990 By State
O.«» OSS o.St 0.60
Consuming Stat*Sourer 1PAA - Saptambar 19»1l>tua
38
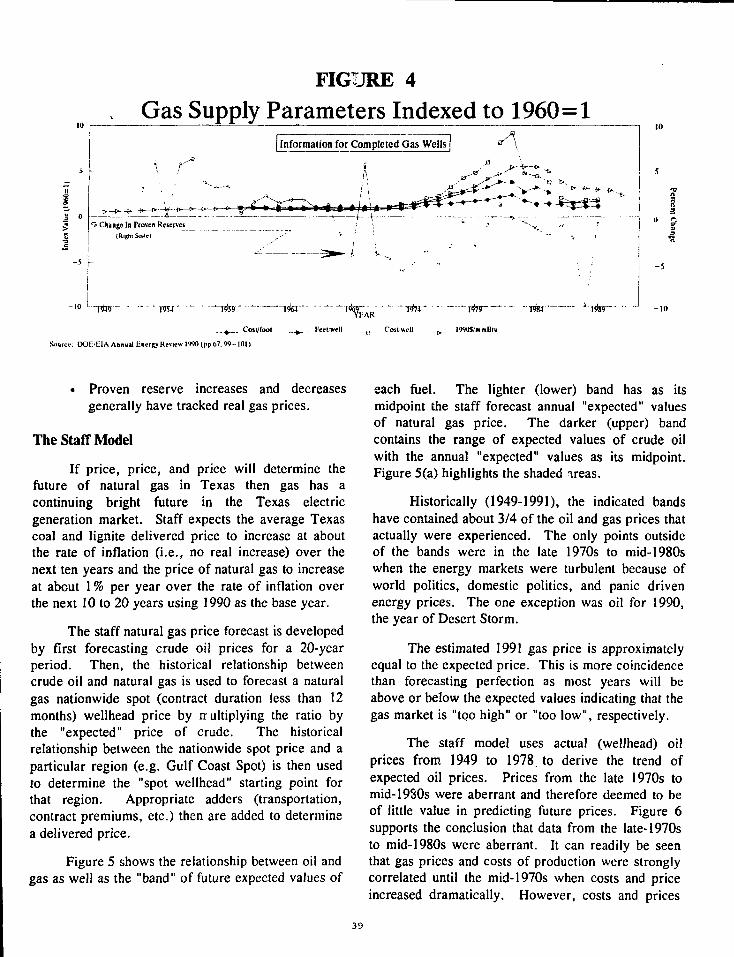
FIGURE 4
_. Gas Supply Parameters Indexed to 1960=1I Information for Completed Gas Wells A
\ r
• Change In Proven Reserves(Right Scale)
t Cosl/fool
Sourer: DOE'EIA Annual iinerey Henew 1990 (pp 07. 99-101)
. a-.YEAR
Feet/well _<y C o s t w e l l - o - 199US/mmBni
20 Q
-5
-10
• Proven reserve increases and decreasesgenerally have tracked real gas prices.
The Staff Model
If price, price, and price will determine thefuture of natural gas in Texas then gas has acontinuing bright future in the Texas electricgeneration market. Staff expects the average Texascoal and lignite delivered price to increase at aboutthe rate of inflation (i.e., no real increase) over thenext ten years and the price of natural gas to increaseat about 1 % per year over the rate of inflation overthe next 10 to 20 years using 1990 as the base year.
The staff natural gas price forecast is developedby first forecasting crude oil prices for a 20-yearperiod. Then, the historical relationship betweencrude oil and natural gas is used to forecast a naturalgas nationwide spot (contract duration less than 12months) wellhead price by rrultiplying the ratio bythe "expected" price of crude. The historicalrelationship between the nationwide spot price and aparticular region (e.g. Gulf Coast Spot) is then usedto determine the "spot wellhead" starting point forthat region. Appropriate adders (transportation,contract premiums, etc.) then are added to determinea delivered price.
Figure 5 shows the relationship between oil andgas as well as the "band" of future expected values of
each fuel. The lighter (lower) band has as itsmidpoint the staff forecast annual "expected" valuesof natural gas price. The darker (upper) bandcontains the range of expected values of crude oilwith the annual "expected" values as its midpoint.Figure 5(a) highlights the shaded areas.
Historically (1949-1991), the indicated bandshave contained about 3/4 of the oil and gas prices thatactually were experienced. The only points outsideof the bands were in the late 1970s to mid-1980swhen the energy markets were turbulent because ofworld politics, domestic politics, and panic drivenenergy prices. The one exception was oil for 1990,the year of Desert Storm.
The estimated 1991 gas price is approximatelyequal to the expected price. This is more coincidencethan forecasting perfection as most years will beabove or below the expected values indicating that thegas market is "too high" or "too low", respectively.
The staff model uses actual (wellhead) oilprices from 1949 to 1978. to derive the trend ofexpected oil prices. Prices from the late 1970s tomid-1980s were aberrant and therefore deemed to beof little value in predicting future prices. Figure 6supports the conclusion that data from the late-1970sto mid-1980s were aberrant. It can readily be seenthat gas prices and costs of production were stronglycorrelated until the mid-1970s when costs and priceincreased dramatically. However, costs and prices
39

FIGURE 5
Natural Gas Price Forecast9
8
7
6
25
1 4 •
3fflB 'O
Note: Hollow symbols represent actual valuesSolid symbols represent forecast values
iji n
i I
1949 1954 1959 1964 1969 1974 1979 1984 1989 1994
_m_. Oil Price +_ Gas/Oil
Range of Expected: • • • Oil Prices
Gas Price_Q_ Oil Price Gas/Oil1 i Gas Prices
1999 2004 2009
_ Gas Price
3.5
3 i
2.5
2
i
FIGURE 5A
| Expected Range of Oil I Wellhead | Price j
:MteS!!!fiM:^^
isaiiiiiisipaiisiii
0.5 rImpeded Range ol Oai iWcllhcad I Prrt
0 ' f943 1954 1059 ' * 1964 ' " 1969 ' ' T974 * " I Q V ) 1984' " ' '1989' * ' *j<j94" ' ' 'l&ri " ' 2(tj4 " "
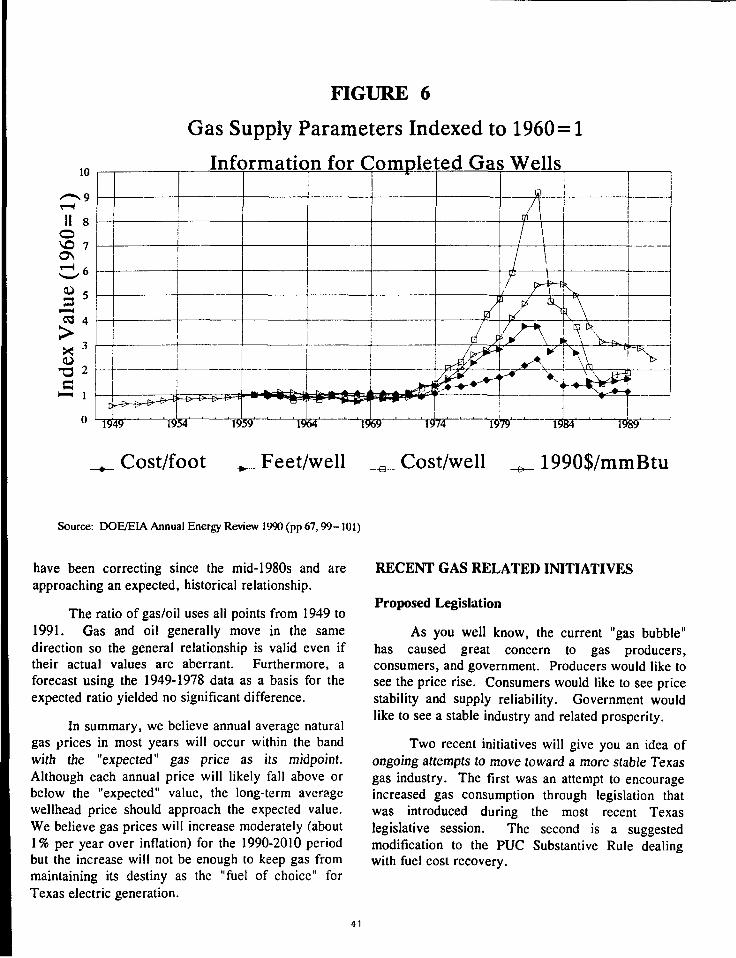
10
II 8OvO 7OS
I573 4
FIGURE 6
Gas Supply Parameters Indexed to 1960 = 1
Information for Completed Gas Wells
a[ •€M=*-E>~ **#
1949 I95T JT55T"
* * • £
1964
Cost/foot Feet/well
'lsW ' ' lT9*79J~i~""'i19W^^ T989
Cost/well 1990$/mmBtu
Source: DOE/EIA Annual Energy Review 1990 (pp 67,99-101)
have been correcting since the mid-1980s and areapproaching an expected, historical relationship.
The ratio of gas/oil uses all points from 1949 to1991. Gas and oil generally move in the samedirection so the general relationship is valid even iftheir actual values are aberrant. Furthermore, aforecast using the 1949-1978 data as a basis for theexpected ratio yielded no significant difference.
In summary, we believe annual average naturalgas prices in most years will occur within the bandwith the "expected" gas price as its midpoint.Although each annual price will likely fall above orbelow the "expected" value, the long-term averagewellhead price should approach the expected value.We believe gas prices will increase moderately (about1% per year over inflation) for the 1990-2010 periodbut the increase will not be enough to keep gas frommaintaining its destiny as the "fuel of choice" forTexas electric generation.
RECENT GAS RELATED INITIATIVES
Proposed Legislation
As you well know, the current "gas bubble"has caused great concern to gas producers,consumers, and government. Producers would like tosee the price rise. Consumers would like to see pricestability and supply reliability. Government wouldlike to see a stable industry and related prosperity.
Two recent initiatives will give you an idea ofongoing attempts to move toward a more stable Texasgas industry. The first was an attempt to encourageincreased gas consumption through legislation thatwas introduced during the most recent Texaslegislative session. The second is a suggestedmodification to the PUC Substantive Rule dealingwith fuel cost recovery.
41
Senator Bill Dickson introduced SB 1535during the last Texas legislative session. This billproposed the amending of the Public UtilityRegulatory Act (PURA) to designate natural gas as"the fuel of choice for electric utilities in Texas."The proposed amendment would have made it statepolicy to "support the use of natural gas to generateelectricity" by encouraging the PUC to take variousmeasures including: allowing full cost recovery for"reasonable" gas contract and gas storage costs;allowing the "reasonable" costs associated withswitching from gas to some other fuel during peakdemand periods when the utility's gas would beneeded by human needs customers; requiring areview and certification of long-term gas supplycontracts submitted to the PUC (if certified, the costspaid by the utility pursuant to terms of the contractwould have been recoverable monthly on a currentbasis).
The proposed legislation also would havedefined the conditions under which a contract wouldhave qualified as a "long-term" contract, theconditions that would constitute legitimate fuelswitching that would be eligible for full cost recoveryand conditions that would determine whether a gassupply contract should be certified to be reasonableand necessary.
Although this proposed legislation hadconsiderable support from state officials and gassuppliers, the bill failed to be enacted.
Proposed Rule Changes
A proposed rule change was filed with the PUCon January 21, 1992. The proposed rule would, inpart, cause natural gas contracts to be handled in
much the same manner as proposed SB 1535. Theproposed rule also included recommendations forchanging some of the provisions that currently governthe method by which utilities recover fuel costs andpurchased power costs. ENRON Corp., a major gassupplier and cogenerator, sponsored the proposedrule change.
ENRON stated its reason for proposing the rulechange as an attempt to create "...a procedure thatwould enable utilities to learn, in advance, whetherthe Commission will consider the terms of a longterm gas contract to be reasonable." ENRON notedthat based on its dealings with electric utilities both inTexas and in other states, it perceived a bias byTexas generating utilities against long-term gassupply contracts in favor of short-term supplycontracts because "...utilities in Texas currentlyperceive that long-run gas contracts expose a utility toa significantly greater risk of disallowances, andtherefore, litigation to avoid disallowances than doshort-term contn. cts.
This proposed rule amendment is beingreviewed as PUC Project 10893.
CONCLUSION
Natural gas will continue to be the fuel ofchoice for electric generation in Texas. Gas isabundant in Texas thus minimizing transportationcharges and enhancing reliability of supply. Gas isclean burning and efficient thereby minimizingburning costs. Gas will continue to be reasonablypriced thereby enabling it to maintain a competitiveedge. Finally, gas is the energy future of Texas andgovernmental actions that promote gas consumptionwill continue.
42
AVOIDED COSTS AND COMPETITIVE NEGOTIATIONS FORPOWER FROM QUALIFYING FACILITIES IN TEXAS
Sarut PanjavanPublic Utility Commission of Texas
Austin, Texas
Ali Al-JabirPublic Utility Commission of Texas
Austin, Texas
ABSTRACT
Texas is among the states with the highest potentialfor cogeneration. Currently, 3,121 MW ofcogenerated power supplies more than ten percent ofthe energy needs of ERCOT under firm contracts.This paper summarizes the key aspects of theregulatory framework related to cogeneration in theState of Texas. In addition, it discusses the currentround of standard avoided cost filings submitted tothe Public Utility Commission of Texas for approvaland focuses on future trends in the State'scogeneration market.
KEY ASPECTS OF TEXAS REGULATIONS
Cogenerators doing business in Texas need to beaware of the regulatory framework which governs themarket. This Section covers the Commission's rulesgoverning the methodology for determining a utility'savoided cost, including the specific parts whichdistinguish between purchases of firm and non-firmpower. In addition, it discusses the filingrequirements for utilities involved in avoided costdockets and the utilities obligations in dealing withqualifying facilities.
Avoided Cost Calculation Methodology
The Commission's Substantive Rule 23.66 (h)(3)(A),describes the methodology that all utilities must use incalculating their avoided costs for firm capacity. TheCommission requires that generating utilities use theCommitted Unit Basis (CUB) methodology tocalculate the avoided cost for firm power purchases.Firm power is defined as power or power-producing
capacity that is available to the electric utilitypursuant to a legally enforceable obligation forscheduled availability over a specified term.
The CUB methodology develops avoided capacitycosts based on the estimated cost of a specific,avoidable generating unit or group of avoidablegenerating units in the utility's expansion plan.Utilities must demonstrate that their selection of unitor units is consistent with the projected needs of theirsystems, both in terms of generating capacity and thetype of unit selected. A revenue requirement streamassociated with capacity and operating costs of this"shadow" unit can then be developed to reflect thecosts to the ratepayers. When it is approved by theCommission, the net present value of the streambecomes an upper bound for the net present value ofthe payment stream that can be offered to a qualifyingfacility for firm power contract.
In determining the revenue requirement for capacitycosts, the Commission requires that the utilityincorporate inflation into its estimate by relying on aregional forecast of power plant construction costsfrom a recognized forecasting service. In estimatingconstruction costs, Allowances for Funds UsedDuring Construction (AFUDC) must be calculatedusing the same rate approved in the utility's mostrecent Texas rate case. The utility can alsoincorporate an allowance for Construction Work InProgress (CWIP), using the simple average of thepercent CWIP allowed in the utility's rate base duringits two most recent rate cases or 50 percent,whichever is less. In addition, the revenuerequirement calculation must incorporate adepreciation rate which is based on the acceleratedrate used for electric utilities under existing tax laws.
43
The total avoided cost is the net present value ofestimated revenue requirement for capacity costs plusthe net present value of revenue requirement for theenergy costs. The Commission requires that thecombined cost of avoided capacity and energy beused as a ceiling for setting the rates to be paid toqualifying facilities for firm power purchases. Ratesfor firm purchases from the qualifying facilities thatdo not exceed this ceiling are determined to be justand reasonable and in the public interest.
Avoided Cost Filing Requirements
The Commission requires that every utility in thestate of Texas file a standard avoided cost calculationand terms and conditions for the purchase of firmcapacity from qualifying facilities every two years.This calculation is subject to review and approval bythe Commission after granting adequate notice toconcerned parties and providing the opportunity for ahearing. Non-generating utilities are also required topresent abbreviated avoided costs filings to theCommission, but these filings are not typically treatedas docketed cases.
To facilitate the process of reviewing these avoidedcost calculations, the Commission staff has developeda standard format for the presentation of the data usedto support these filings. This standardized filingpackage contains nine "requests" to which each utilityis asked to respond.
Request 1 provides a list of the persons within thecompany that the staff or intervening parties cancontact to clarify the information presented in thefiling or to request additional data.
Request 2 provides the utility's estimated capacityrequirements, based on its own capacity planningmethodology.
Request 3 provides the financial data used by theutility to calculate its weighted cost of capital.
Request 4 provides information on the avoided unitselected by the utility to meet its projected capacityrequirements.
Requests 5 and 6 provide the revenue requirementstream of the capacity and energy costs associatedwith the avoided unit.
Request 7 includes the calculation of the progressivepayment stream.
Request 8 describes the utility's proposedperformance bond requirements. These are the bondsthat the cogenerators are required to post to ensurethat they meet the obligations of their firm powercontracts with the utility.
Request 9 provides the standard terms and conditionswhich govern the agreement between the purchasingutility and the selling qualifying facility.
Non-Firm Power Purchases
In addition to establishing the conditions under whichthe rates for firm power purchases must be setthrough the standard avoided cost filing process, theCommission has also specified the rate-makingcriteria for non-firm power purchases from qualifyingfacilities. Non-firm power is defined as powerprovided under an arrangement that does notguarantee scheduled availability, but instead providesfor delivery as available. Substantive Rule 23.66(g)describes two methods which can be used todetermine rates for these non-firm purchases. Thefirst method sets the rate for non-firm power based onthe utility's average avoided energy costs. It alsoallows for a monthly customer charge to compensatethe utility for administrative, billing, and meteringcosts. This method can be used when it is acceptableto both the utility and the qualifying facility.
However the qualifying facility, at its own option,may choose the second method allowed by theCommission to set rates for its non-firm sales. Thisalternative method sets the rate based on the full cost,at the time of delivery, of the decremental energy thatthe utility would have incurred had the qualifyingfacility not been in operation. The cost ofdecremental energy is defined as the cost savings to autility associated with backing down some of its unitsor avoiding firing its own units, or avoidingpurchases of power from another utility because ofpurchases of power from qualifying facilities. TheCommission's rules require that several factors beincorporated into the calculation of this decrementalenergy cost. These factors include fuel costs,variable operating and maintenance costs, line losses,heat rates, and the cost of avoided purchases fromalternative sources. Capacity costs may also be
44
included in the calculation of the rate if it can bedetermined that, as a group, the qualifying facilitiesproviding non-firm energy to a utility also providesome predictable capacity.
Utility Obligations
In addition to the avoided cost filing and standardcalculation, the Commission has also specified anumber of obligations to which electric utilities withinthe state must conform in dealing with qualifyingfacilities. Most importantly, Substantive Rule23.66(d) provides that electric utilities are obligatedto purchase any energy or capacity that is madeavailable to them by a qualifying facility. Of course,there are certain caveats to this rule. In the case offirm capacity and energy, the utility must be able topurchase from the qualifying facility at a price lessthan or equal to its calculated avoided cost, asdetermined by the Commission. Moreover, a utilitywith access capacity is not required to contract forfirm capacity from cogenerators.
When tLc utility is faced with a situation in whichqualifying facilities are offering it more capacity thanit needs, it is required to give priority in the signingof contracts to those qualifying facilities who produceelectricity through environmentally beneficialprocesses. These generation technologies include theburning of municipal solid waste and renewable fuelsources such as solar or wind power. Beyond thispriority, the utility has the right to sign the mostfavorable contracts it can acquire through negotiationwith potential suppliers. Utilities are obligated tokeep records on all offers received from qualifyingfacilities for a period of five years from the receipt ofsuch offer. In addition to purchasing power fromqualifying facilities, utilities are also obligated toprovide services to them to support their operations.
Furthermore, utilities are required to providewheeling services for qualifying facilities to any otherutility to which they wish to sell power, provided thatcertain capacity and voltage specifications are met.These utilities are allowed to charge for suchtransmission wheeling service in accordance with atariff that is approved by the Commission. Wheelingservices for qualifying facilities can only beinterrupted when the utility experiences a systememergency.
Negotiation Process And Contract Certification
The Commission does not have a formal biddingprocess. The formal bidding system is believed tohave a flaw because it is based on the assumption thatall power supplies are the same. The Commissionrecognizes variation within cogeneration supply andallows cost adjustments according to the quality offirmness which includes such factor as operatingconstraints and impacts on the transmission system.Because of such variation, offers from differentqualifying facilities can have different values to theutility. Thus, the utility can negotiate in good faithwith potential suppliers to come to an agreement on"value" of the supply.
The Commission is not involved in the negotiationbut, under PURA, either party in the contract isallowed to apply for a certification of the contractfrom the Commission. For the contract to becertified, the payment specified in the contract mustnot exceed the most recent Commission-approvedavoided cost. The purpose of the contractcertification is to provide some comfort to the utilitythat the Commission will not second-guess theprudence of the agreement in future rate cases. Oncethe contract is certified, expenses bound by it will beconsidered reasonable and can be passed along to theratepayers.
COGENERATION MARKET IN TEXAS
There are 13 major utilities serving Texas. Nine ofthese utilities belong to the Electric ReliabilityCouncil of Texas (ERCOT) which makes up about 80percent of electricity market in Texas. ERCOTforms an interconnected transmission grid that ispractically isolated from other reliability councils.This isolation that limits ERCOT utilities to servingcustomers inside Texas exclude ERCOT utilitiesfrom federal regulations. Although Utilities servingTexas are obligated to purchase and wheelcogenerated power, it is unlikely that cogeneratedpower will flow across the ERCOT boundary.ERCOT utilities are not required to interconnect withutilities that are members of other reliability councils.Therefore, the discussion in this paper will focus onthe market in the ERCOT system only.
45
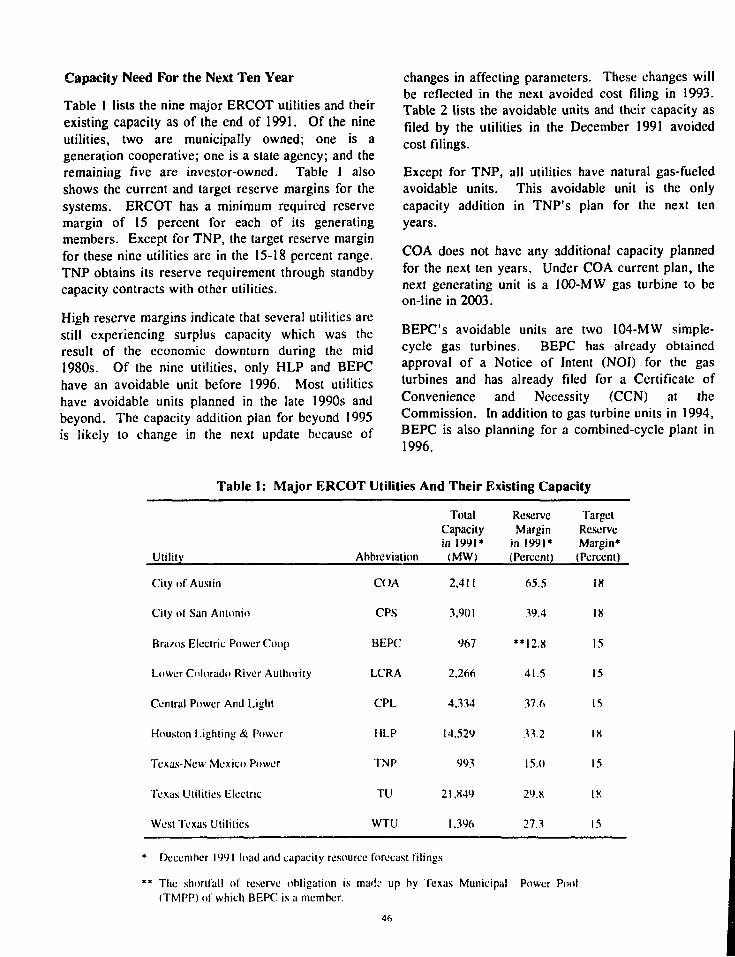
Capacity Need For the Next Ten Year
Table 1 lists the nine major ERCOT utilities and theirexisting capacity as of the end of 1991. Of the nineutilities, two are municipally owned; one is ageneration cooperative; one is a state agency; and theremaining five are investor-owned. Table 1 alsoshows the current and target reserve margins for thesystems. ERCOT has a minimum required reservemargin of 15 percent for each of its generatingmembers. Except for TNP, the target reserve marginfor these nine utilities are in the 15-18 percent range.TNP obtains its reserve requirement through standbycapacity contracts with other utilities.
High reserve margins indicate that several utilities arestill experiencing surplus capacity which was theresult of the economic downturn during the mid1980s. Of the nine utilities, only HLP and BEPChave an avoidable unit before 1996. Most utilitieshave avoidable units planned in the late 1990s andbeyond. The capacity addition plan for beyond 1995is likely to change in the next update because of
changes in affecting parameters. These changes willbe reflected in the next avoided cost filing in 1993.Table 2 lists the avoidable units and their capacity asfiled by the utilities in the December 1991 avoidedcost filings.
Except for TNP, all utilities have natural gas-fueledavoidable units. This avoidable unit is the onlycapacity addition in TNP's plan for the next tenyears.
COA does not have any additional capacity plannedfor the next ten years. Under COA current plan, thenext generating unit is a 100-MW gas turbine to beon-line in 2003.
BEPC's avoidable units are two 104-MW simple-cycle gas turbines. BEPC has already obtainedapproval of a Notice of Intent (NOI) for the gasturbines and has already filed for a Certificate ofConvenience and Necessity (CCN) at theCommission. In addition to gas turbine units in 1994,BEPC is also planning for a combined-cycle plant in1996.
Table 1: Major ERCOT Utilities And Their Existing Capacity
Utility
City of Austin
Cily of San Antonio
Bra/.os Electric Power Coop
Lower Colorado River Authority
Central Power And Light
Houston Lighting & Power
Texas-New Mexico Power
Texas Utilities Electric
West Texas Utilities
Abbreviation
COA
CPS
BEPC
LCRA
CPL
HLP
TNP
TU
WTU
TotalCapacityin 1991*
(MW)
2,411
3,901
967
2,266
4,334
14,529
993
21.849
1.396
ReserveMargin
in 1991*(Percent)
65.5
39.4
**I2.8
41.5
37.6
33.2
15.0
29.X
27.3
TargetReserveMargin*(Percent)
IK
18
15
15
15
IK
15
IK
15
* December 1991 load and capacity resource forecast filings
** The shortfall of reserve obligation is mad;' up by Texas Municipal Power Pool(TMPP) of which BEPC is a member.
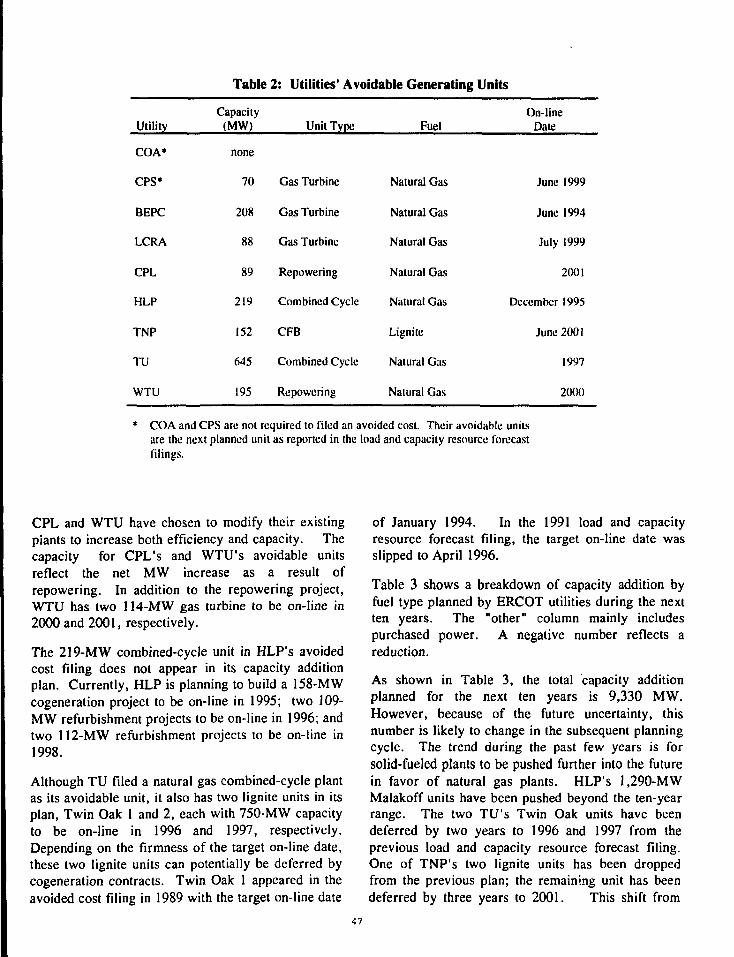
Table 2: Utilities' Avoidable Generating Units
Utility
COA*
CPS*
BEPC
LCRA
CPL
HLP
TNP
TU
WTU
Capacity(MW)
none
70
208
88
89
219
152
645
195
Unit Type
Gas Turbine
Gas Turbine
Gas Turbine
Repowering
Combined Cycle
CFB
Combined Cycle
Repowering
Fuel
Natural Gas
Natural Gas
Natural Gas
Natural Gas
Natural Gas
Lignite
Natural Gas
Natural Gas
On-lineDate
June 1999
June 1994
July 1999
2001
December 1995
June 2001
1997
2000
* COA and CPS are not required to filed an avoided cost. Their avoidable unitsare the next planned unit as reported in the load and capacity resource forecastfilings.
CPL and WTU have chosen to modify their existingplants to increase both efficiency and capacity. Thecapacity for CPL's and WTU's avoidable unitsreflect the net MW increase as a result ofrepowering. In addition to the repowering project,WTU has two 114-MW gas turbine to be on-line in2000 and 2001, respectively.
The 219-MW combined-cycle unit in HLP's avoidedcost filing does not appear in its capacity additionplan. Currently, HLP is planning to build a 158-MWcogeneration project to be on-line in 1995; two 109-MW refurbishment projects to be on-line in 1996; andtwo 112-MW refurbishment projects to be on-line in1998.
Although TU filed a natural gas combined-cycle plantas its avoidable unit, it also has two lignite units in itsplan, Twin Oak 1 and 2, each with 750-MW capacityto be on-line in 1996 and 1997, respectively.Depending on the firmness of the target on-line date,these two lignite units can potentially be deferred bycogeneration contracts. Twin Oak 1 appeared in theavoided cost filing in 1989 with the target on-line date
of January 1994. In the 1991 load and capacityresource forecast filing, the target on-line date wasslipped to April 1996.
Table 3 shows a breakdown of capacity addition byfuel type planned by ERCOT utilities during the nextten years. The "other" column mainly includespurchased power. A negative number reflects areduction.
As shown in Table 3, the total capacity additionplanned for the next ten years is 9,330 MW.However, because of the future uncertainty, thisnumber is likely to change in the subsequent planningcycle. The trend during the past few years is forsolid-fueled plants to be pushed further into the futurein favor of natural gas plants. HLP's 1,290-MWMalakoff units have been pushed beyond the ten-yearrange. The two TU's Twin Oak units have beendeferred by two years to 1996 and 1997 from theprevious load and capacity resource forecast filing.One of TNP's two lignite units has been droppedfrom the previous plan; the remaining unit has beendeferred by three years to 2001. This shift from
47

Table 3: Planned Capacity Addition By 2001 (MW)
Utility
COA
CPS
BEPC
LCRA
CPL
HLP
TNP
TU
WTU
Total
Natural Gas
350
699
88
53
1,849
2,200
157
5,396
Coal
40
650
690
Lignite
152
2,160
2,312
Other
-248
33
112
1,050
-15
932
Total
350
451
88
86
1,889
264
6,060
142
9,330
solid fuel to natural gas is primarily a result of thecollapse in natural gas prices and the 1986amendment of the Power Plant And Industrial FuelUse Act.
Of all the utilities discussed, TU is the only utilitywho still has a substantial amount of solid-fueledcapacity in its current plan. The 2,810 MW of solid-fueled capacity is made up of four units with the on-line target dates of 1996, 1997, 2000, and 2001,respectively. In addition to 2,810 MW of solid-fueledcapacity, TU has a plan for two 645-MW and one620-MW natural gas combined cycle units to be on-line in 1997, 1998, and 1999, respectively.
Of the 1,849 MW of HLP natural gas capacity, itappears that only 600 MW is firmly committed. This600 MW is made up of one cogeneration project andfour refurbishment projects. The remaining 1,249MW is still labeled as unknown and may come fromadditional refurbishment projects.
Existing And Future Cogeneration Supply
At the present, three ERCOT utilities have a total ofnine firm cogeneration contracts. TU has ninecontracts with the total capacity of 1,841 MW. HLPhas four contracts with the total capacity of 945 MW.TNP has one contract with a total capacity that variesfrom year to year.
Table 4 shows a trend of firm cogeneration capacityunder existing contracts during the next ten years.This trend does not include the expired contracts thathave not yet been renewed. However, it is expectedthat some of the current firm suppliers will continueto supply power to the utilities under new contracts.Because of the changes in the avoided cost situation,it is unlikely that the existing contracts will berenewed under the same terms. Most of the existingcontracts that expire in the 1990s are based on coal orlignite avoidable units. In the 1990s, the utilities areshifting their plans in favor of natural gas capacity.Several contracts executed in the 1990's will probablybe based on natural gas avoidable units.
Utilities' Avoided Costs
Table 5 lists the most recent avoided cost paymentstreams in current dollars for HLP, TU, and BEPCas filed in December 1991. These avoided costs arebased on the avoidable units shown in Table 2 withten-year contracts. They have not been approved bythe Commission, and the Commission-approved costsmay be different. For BEPC the first year in Table 4corresponds to 1994, while for HLP and TU the firstyear corresponds to 1996 and 1997, respectively.
The differences in these costs are caused by severalfactors such as financial parameters, types of
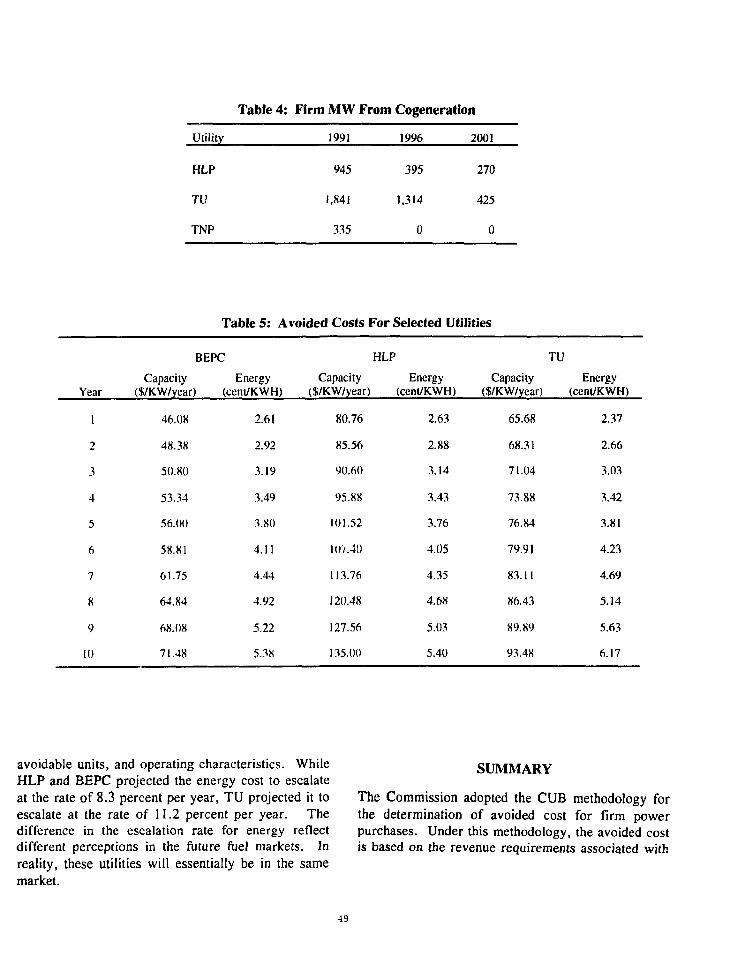
Table 4: Firm M W From Cogeneration
Utility 1991 1996 2001
HLP
TU
TNP
945
1,841
335
395
1,314
0
270
425
0
Table 5: Avoided Costs For Selected Utilities
Year
1
2
3
4
5
6
7
8
9
10
BEPC
Capacity Energy($/KW/year) (cent/KWH)
46.08
48.38
50.80
53.34
56.00
58.81
61.75
64.84
68.08
71.48
2.61
2.92
3.19
3.49
3.80
4.11
4.44
4.92
5.22
5.38
Capacity($/KW/year)
80.76
85.56
90.60
95.88
101.52
IOV.40
113.76
120.48
127.56
135.00
HLP
Energy(cent/KWH)
2.63
2.88
3.14
3.43
3.76
4.05
4.35
4.68
5.03
5.40
Capacity($/KW/year)
65.68
68.31
71.04
73.88
76.84
79.91
83.11
86.43
89.89
93.48
TU
Energy(cent/KWH)
2.37
2.66
3.03
3.42
3.81
4.23
4.69
5.14
5.63
6.17
avoidable units, and operating characteristics. WhileHLP and BEPC projected the energy cost to escalateat the rate of 8.3 percent per year, TU projected it toescalate at the rate of 11.2 percent per year. Thedifference in the escalation rate for energy reflectdifferent perceptions in the future fuel markets. Inreality, these utilities will essentially be in the samemarket.
SUMMARY
The Commission adopted the CUB methodology forthe determination of avoided cost for firm powerpurchases. Under this methodology, the avoided costis based on the revenue requirements associated with
49

certain future generating units. Every utility underthe Commission jurisdiction is required to filestandard avoided cost calculation for firm powerevery two years. The approved avoided cost servesas a pricing ceiling for future QF purchased powercontracts. The Commission does not have a formalbidding system. Utilities are required to negotiate ingood faith with potential suppliers. The Commissionis not involved in the negotiation. However, eitherparty in the contract is allowed to seek a certificationfor the contract from the Commission. Oncecertified, expenses bound by the contracts will beconsidered as reasonable and will not be disputed inthe subsequent rate cases.
During the next ten years, ERCOT utilities areplanning on adding 9,330 MW of new capacity.About 57.8 percent will be fueled by natural gas.Even though there is 3,002 MW of solid-fueledcapacity being planned in the late 1990's and later,the availability of low-cost natural gas makes thefuture solid-fueled capacity highly uncertain. Duringthe past five years, the utilities have been shiftingtoward more use of natural gas and less use of solidfuel. This shift will have a large impact on avoidedcost because the avoidable units based on natural gaspower plants will cost less than avoidable units basedon solid-fueled power plants.
TRANSMISSION ISSUES AND POWER EXCHANGES IN TEXAS
Harold L. Hughes, Jr., P.E.Manager of Engineering Section
Public Utility Commission of TexasAustin, Texas
ABSTRACT
The electric transmission system in Texas hasevolved over the years to its present state, in order toprovide reliable service and reduce the amount ofreserve capacity any individual utility needs tomaintain. Presently there is pressure on thetransmission owning utilities by several parties,primary distribution cooperatives, cogenerators, andlarge industrial customers, to grant wider access tothe system. This pressure is coming at a time whentransmission lines are becoming increasingly difficultto build. This paper presents a historical backgroundon the development of the transmission system anddescribes the problems of assessing the impact andproperly pricing certain bulk power transactions. Inaddition, it briefly describes the Electro-MagneticFields problem and how it relates to new transmissionline construction.
DEVELOPMENT OF TRANSMISSION SYSTEM
To understand current transmission issues inTexas and the operation of the bulk power system, alittle background on the development of the state'stransmission system may be helpful to put theseissues in perspective. Early electric utilities in Texascould best be described as plants, set up in individualtowns throughout the state, intended to serve only theimmediate community. These plants, built to providepurely local lighting service, were unreliable andinefficient. There was practically no demand forpower for industrial purposes. There were very fewinterconnections with other communities or systems.Most systems had a single distribution circuit. Iftrouble occurred, the entire town would be withoutpower until repairs had been made. The operationswere seldom profitable, and raising money for powerplants was extremely difficult. Because of these
problems and the limited market for electric power,these small companies were not able to takeadvantage of the improvements in improvedtechnology for generating facilities.
The utilities began solving the service problemscaused by individual single circuit plants byinterconnecting with other utilities. In Texas, theseinterconnections started in 1913 when Texas Powerand Light Company completed the first high-voltagetransmission line in the state. It was a 60,000 voltline connecting the Fort Worth Power and LightCompany plant in Fort Worth with the Texas Powerand Light plant in Waco, by way of Cleburne andHillsboro.
After America's entry into World War I, thepressures of the wartime economy created an evengreater need for the electric utility companies inTexas to expand and interconnect. Texas Power andLight Company built 450 miles of new transmissionlines and at the end of 1918 was serving 91communities. Houston Lighting & Power was alsoextending service to neighboring towns andestablishing interconnections with neighboringutilities. All told, HL&P expanded into nearly 70communities during the 1920s. In West Texas andSouth Texas, lines were also being built andinterconnections made. Since service territories werenot strictly defined, competition for loads sometimesled utilities to race each other to build lines, notletting even "niceties" such as rights-of-way blockprogress.
During the 1920s, improvements in high-voltageline construction were introduced, such as the nowfamiliar creosoted pine H-frame structures. Thesenew transmission lines let the utilities extend serviceto more communities while providing a way tointerconnect their systems and to exchange power.
51

Selling power between utilities, rather than buildingadditional plants, meant lower rates.
With America's entry into World War II, theutilities were once again stimulated to increasetransmission line construction. Although it was ashock to the population at large, the electric utilitiesin Texas had anticipated America's entry into the warand were well prepared for wartime demands.
As early as 1941, defense planners hadconceived a "power pool" arrangement that would tieinvestor-owned utilities in Texas to the dams alongthe Lower Colorado, Brazos, and Guadalupe rivers.In the spring of 1942, operating arrangements wereset up among Houston Lighting & Power, PublicService Company of San Antonio, the City of Austin,Lower Colorado River Authority, and Central Powerand Light. The organization, known as the SouthTexas Interconnected System, was the forerunner ofwhat would later become the Electric ReliabilityCouncil of Texas (ERCOT).
After World War II, pent-up consumer demandresulted in a tremendous growth in electric demand.Meeting the exploding demand required moregenerating capacity and more transmission lines. Theincreasing size and output of the new plants requiredlarger transformers and higher voltage lines. Thisexpansion was so great that by 1953, Central andSouthwest Companies were spending more money forline building than for new generation.
For the electric utilities, probably the mostimportant event of the 1960s was the famous NewYork blackout. On November 9, 1965, a massivepower outage in the Northeast plunged 33 millionpeople into darkness. The integrity of the nation'selectric power system, which had seemed almostinvincible, was dramatically called into question.President Lyndon Johnson asked the Federal PowerCommission to investigate. In 1967, the Commissiondetermined that a continuous supply of electricity hadbecome so vital to the nation's economy and securitythat the electric utility industry should take steps toincrease the overall reliability and lessen the chancesof such a blackout ever occurring again. In responseto the blackout, and in order to head off federalintervention, the industry formed reliability councilsto jointly plan and interconnect their systems. InTexas, the Electric Reliability Council of Texas
(ERCOT) was formed to coordinate operations. Withthe formation of ERCOT, rules and procedures wereformalized for the operation of the bulk power systemand the framework was set for the current powerexchanges. There are two primary types of powerexchanges; direct sales and purchases betweenadjacent utilities, and exchanges that involve morethan two parties, known as wheeling. Both types ofthese transactions will be described below.
POWER SALES AND PURCHASES
When two utilities are directly interconnected,sales of electricity occur when the selling utilityincreases its generation by the exact amount thebuying utility decreases. Perhaps the easiest way toexplain this is with an example. Utility A wants tosell 100 MW to directly interconnected Utility B for acertain time period. The first step in the transactionis for the utilities to agree on an exact start and stoptime for the transaction. For example, let us supposethat the transaction will begin at exactly 1:00 p.m.and end at 11:00 p.m. At the start of the transaction,Utility A will increase its generation by 100 MW andUtility B will simultaneously decrease its generationby 100 MW. The 100 MW will then flow fromUtility A to Utility B via the transmission system.Since electricity follows all paths from the source tothe destination based on the laws of physics, there isno control of the exact path the electricity will followfrom Utility A to Utility B, as shown on Figure 1.
WHEELING
Now suppose that Utility A wants to sell toUtility C with which it is not directly interconnected.In order to consummate the transaction thetransmission facilities of utility B will have to beused. This transaction where the facilities of a thirdparty, that is neither the buyer or the seller are usedis called wheeling. In an interconnected system,however, not only the transmission facilities of thebuying, selling, and wheeling utility are involved butalso all utilities in the system that are even indirectlyinterconnected are impacted by the transaction. Asshown by Figure 2, the actual path the electricity willfollow is the path of least resistance. This flow ofelectricity over the lines of other utilities that are notdirectly involved in the wheeling transaction isreferred to as the loop flow or parallel path problem.
52
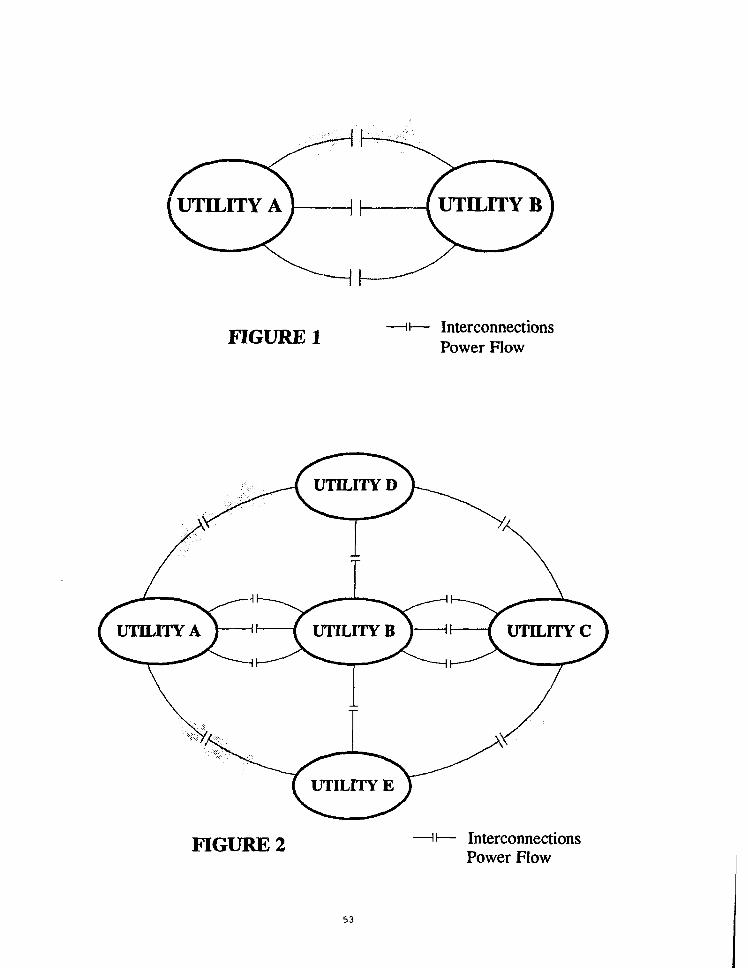
FIGURE 1 InterconnectionsPower Flow
FIGURE 2 InterconnectionsPower Flow
53

The problems the loop flows cause are twofold; first,there is the difficulty of measuring the impact of thetransaction and, second, the problem of devising atariff that fairly compensates all the parties for thetransaction. Most wheeling tariffs in the UnitedStates simply ignore the parallel path problem withpayments usually limited to a "postage stamp" methodwhere a set charge is billed to the wheeling utility byutilities that are in a direct "contract path" of thetransaction. The current wheeling tariffs in Texas doattempt to measure the loop flows and compensatethose utilities who are not on the contract path. Thetool used as the basis for payment is a load flowstudy.
LOAD FLOW STUDIES
In order to safely and efficiently operate a powersystem, the system voltage levels and the loading oflines and equipment have to be known in advance forall points in the system under different conditions.Hand calculations would be almost impossible sincethe solution to complex network flows involve thesolution of numerous simultaneous equations. Loadflow studies are simply computer simulations of theflows on all points on a network under specifiedconditions.
If only one wheeling transaction is taking placethen taking the difference between the before andafter transaction load flows would be a straight-forward method of assessing the impact of thetransaction. On most utility systems there is rarelyonly one transaction taking place; when multipletransactions are taking place simultaneously itbecomes very difficult to assess the proper impact ofeach of the individual transactions. If we start with abase case load flow which includes only native loadwith no wheeling transactions and change load flowswith each transaction included, we encounter twoproblems. First, it may not be possible to create sucha base case without load reduction and/or fictitiousgenerators, since some utilities will require thetransfers to serve their peak load. Second, ignoringall but a single transaction in such analysismisrepresents reality, since it is almost certain thatmore than one transaction will be occurring duringsome periods.
Alternately, if we begin with a procedure thatstarts with a no-transaction base case and addtransactions in the order of contract dates, then theresults for each transaction will depend upon its placein the order, so one user could in effect be rewardedfor early contracting. This could also result insituations where a single buyer could have twotransactions with a seller with different charges duesolely to different contract dates. Cancelling atransaction low in order would necessitate re-evaluation of all higher-order transactions.
Finally, if we attempt a decremental approach,where we start with a base case that includes allwheeling transactions and then compare it to changecases where each wheeling transaction is removedone at a time, we still encounter problems. The mainproblem with this procedure is that the transactionsincluded in both the base and change case willprobably not actually occur simultaneously during allperiods, so their presence can misrepresent realityand significantly distort the results.
As shown above, regardless of the method usedto select the base and transaction cases, we canencounter problems. This is why it is practicallyimpossible to define an objective procedure forevaluating transactions. Care and subjective goodjudgment must be used when these evaluations aremade.
PAYMENT
Even if the correct tool for calculating the loadflows is selected, there is still another problem; howto calculate the results. After load flow studies arerun, on a before and after basis, the results areusually tabulated in a table similar to Table 1.Column 8 summarizes the; net change in loadings onthe utility's lines caused by the wheeling transaction.The difference in the methods depends upon how thiscolumn is added. Some argue (principallycogenerators who will always be wheeling users butnot providers) that negative changes should besubtracted from positive changes. In this case theparty desiring the wheeling would receive a credit forunloading a utility's lines and freeing up capacity justas it receives debits for increasing line loads andreducing available transmission capacity. This resultsin a low impact, as shown in column 8. Many
54
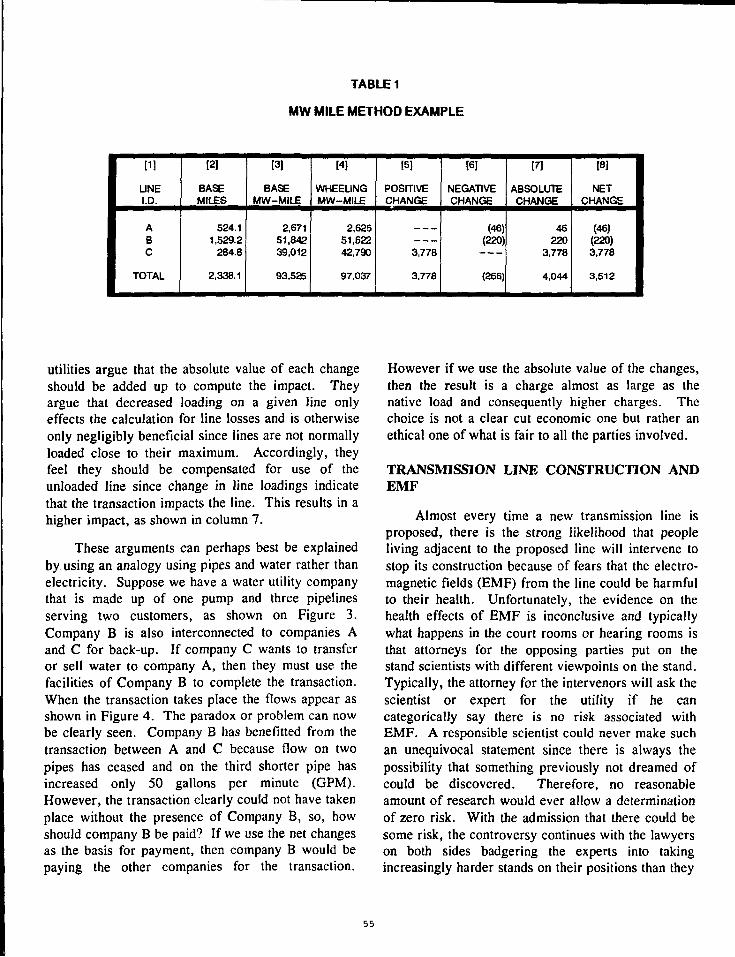
TABLE 1
MW MILE METHOD EXAMPLE
[11
LINEI.D.
ABC
TOTAL
[21
BASEMILES
524.11,529.2
284.8
2,338.1
[3]
BASEMW-MILE
2,67151,84239,012
93.525
M
WHEELINGMW-MILE
2,62551,62242,790
97,037
[5]
POSITIVECHANGE
3,778
3,778
[61
NEGATIVECHANGE
(46)(220)
(266)
mABSOLUTECHANGE
46220
3,778
4,044
[8]
NETCHANGE
(46)(220)3,778
3,512
utilities argue that the absolute value of each changeshould be added up to compute the impact. Theyargue that decreased loading on a given line onlyeffects the calculation for line losses and is otherwiseonly negligibly beneficial since lines are not normallyloaded close to their maximum. Accordingly, theyfeel they should be compensated for use of theunloaded line since change in line loadings indicatethat the transaction impacts the line. This results in ahigher impact, as shown in column 7.
These arguments can perhaps best be explainedby using an analogy using pipes and water rather thanelectricity. Suppose we have a water utility companythat is made up of one pump and three pipelinesserving two customers, as shown on Figure 3.Company B is also interconnected to companies Aand C for back-up. If company C wants to transferor sell water to company A, then they must use thefacilities of Company B to complete the transaction.When the transaction takes place the flows appear asshown in Figure 4. The paradox or problem can nowbe clearly seen. Company B has benefitted from thetransaction between A and C because flow on twopipes has ceased and on the third shorter pipe hasincreased only 50 gallons per minute (GPM).However, the transaction clearly could not have takenplace without the presence of Company B, so, howshould company B be paid? If we use the net changesas the basis for payment, then company B would bepaying the other companies for the transaction.
However if we use the absolute value of the changes,then the result is a charge almost as large as thenative load and consequently higher charges. Thechoice is not a clear cut economic one but rather anethical one of what is fair to all the parties involved.
TRANSMISSION LINE CONSTRUCTION ANDEMF
Almost every time a new transmission line isproposed, there is the strong likelihood that peopleliving adjacent to the proposed line will intervene tostop its construction because of fears that the electro-magnetic fields (EMF) from the line could be harmfulto their health. Unfortunately, the evidence on thehealth effects of EMF is inconclusive and typicallywhat happens in the court rooms or hearing rooms isthat attorneys for the opposing parties put on thestand scientists with different viewpoints on the stand.Typically, the attorney for the intervenors will ask thescientist or expert for the utility if he cancategorically say there is no risk associated withEMF. A responsible scientist could never make suchan unequivocal statement since there is always thepossibility that something previously not dreamed ofcould be discovered. Therefore, no reasonableamount of research would ever allow a determinationof zero risk. With the admission that there could besome risk, the controversy continues with the lawyerson both sides badgering the experts into takingincreasingly harder stands on their positions than they
55
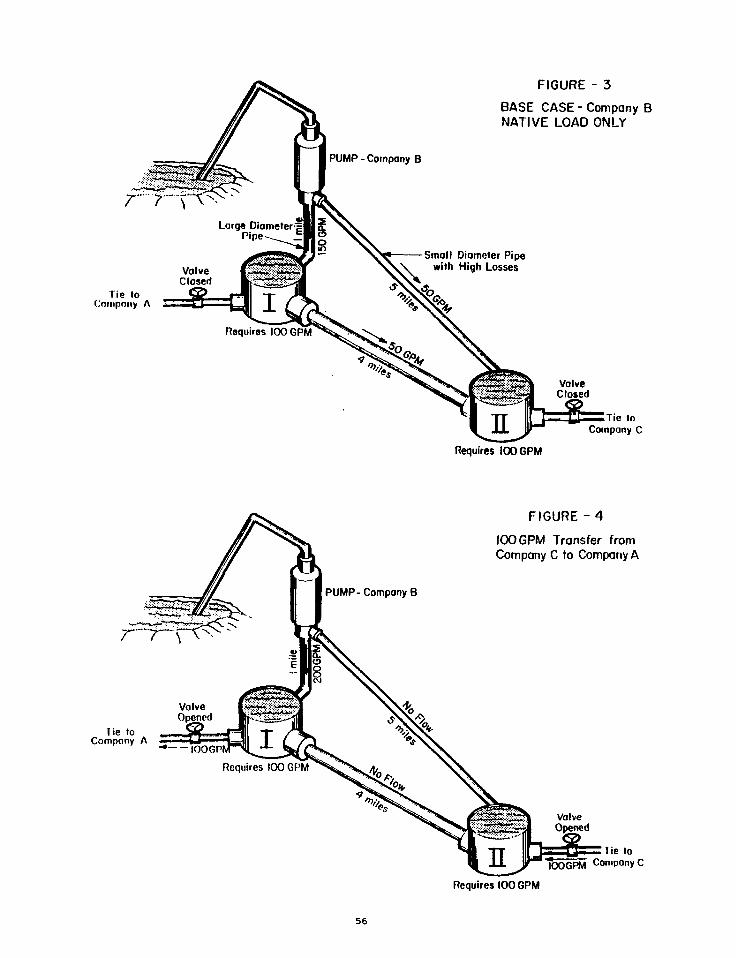
FIGURE - 3
BASE CASE-Company BNATIVE LOAD ONLY
PUMP-Company B
Tie toCompany A
Small Diameter Pipewith High Losses
Tic InCompany C
Requires 100 GPM
FIGURE-4
100 GPM Transfer fromCompany C to Company A
PUMP- Company B
lie toCompany A
= 1ie toTOOGPM Company C
Requires 100 GPM
56

ever would in a non-adversarial proceeding. Thejudge or Commissioner is then left with the verydifficult job of trying to properly decide the trueimpact of a proposed line on the health of thecommunity.
CONCLUSION
Given the problems with increased utilization ofthe transmission system and the risks inherent in anyradical change to the existing system, the challengefor the utilities, cogenerators, and regulators alikewill be to:
1. Determine the real impact of wheeling
transactions;
2. Devise rates that promote "good wheeling"which brings power produced at low cost to anarea that has only higher cost generatingalternatives, and discourage "bad wheeling"which benefits only one party and does notcontribute to the overall efficiency of thesystem;
3. Deal with the EMF problem and build neededlines;
4. Do all of the above without jeopardizingreliability.
57
RELIABLE GAS TURBINE OUTPUT;ATTAINING TEMPERATURE INDEPENDENT PERFORMANCE
James E. Neeley, P.E.Power Plant Engineer
Public Utility Commission of TexasAustin, Texas
Sam Patton, P.E.President
Patton EngineersDallas, Texas
Fred HolderElectrical DesignerPatton Engineers
Dallas, Texas
ABSTRACT
Improvements in gas turbine efficiency, coupledwith dropping gas prices, has made gas turbines apopular choice of utilities to supply peaking as well asbase load power in the form of combined cycle powerplants. Today, because of the gas turbine'scompactness, low maintenance, and high levels ofavailability, it is the major option for future powergeneration.
One inherent disadvantage of gas turbines is thedegradation of output as the ambient air temperatureincreases. This reduction in output during times ofpeak load create a reliability concern as more gasturbines are added to the electric system. A 10%reduction in gas turbine output, when it comprisesonly 10% of the electric system, does not causereliability concerns. A 10% reduction in gas turbineoutput, when it comprises 50% of the electric system,could create reliability and operational problems.
This paper explores the potential for maintainingconstant, reliable outputs from gas turbines bycooling ambient air temperatures before the air isused in the compressor section of the gas turbine.
BACKGROUND
Introduction
The gas turbine is an internal combustion rotaryengine, the most widely known example of which isthe jet aircraft engine. Basically, the engine burns alean mixture of fuel with compressed air. The hot,pressurized combustion gases expand through a seriesof rotating turbine wheel and blade assemblies
resulting in shaft power output, propulsive thrust, ora combination of the two.
The first serious attempt to construct a gasturbine on a large scale was in the early twentiethcentury. In 1905, a French company introduced aturbine that produced 400 horsepower at a rotationalspeed of 4250 RPM. By 1920, simple turbine drivensuperchargers for reciprocating aircraft engines hadbeen produced; however, the real breakthrough inaircraft propulsion did not come until the end ofWorld War II. Since then, tremendous strides havebeen made in the development of both aircraft,aircraft-derivative, and industrial gas turbines.
The Basic Cycle
The basic gas turbine engine consists of acompressor, a combustor, and a turbine in series.The intake air is compressed and delivered to thecombustion section of the turbine at substantiallyincreased pressure and temperature. There, the fuelis burned and the temperature raised to a higher value(on the order of 1800 F during continuous operation).These high pressure and temperature combustiongases then expand through the turbine causing it torotate. The turbine's rotation drives the compressorand any excess energy available produces shaftpower, thrust, or a combination of both. The numberof stages or configuration can change, but there isalways compression followed by heating followed byexpansion of the working fluid (air in this case).
Advantages and Applications
Major gas turbine applications include aircraftpropulsion, oil and gas pipeline pumping, powergeneration for offshore platforms, utility peak load
58
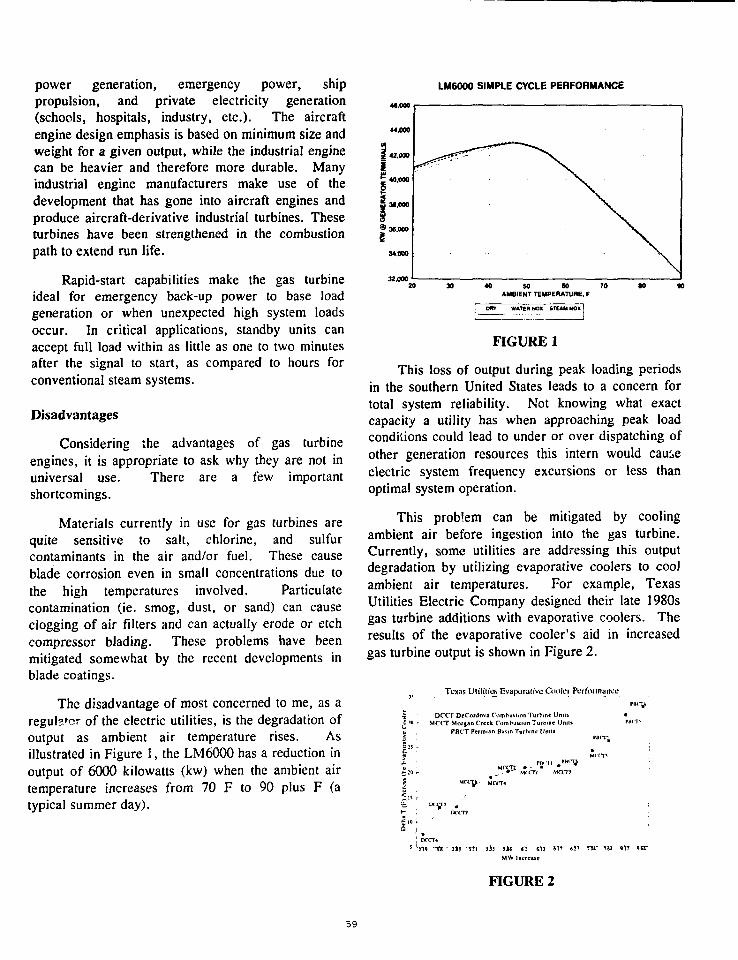
power generation, emergency power, shippropulsion, and private electricity generation(schools, hospitals, industry, etc.). The aircraftengine design emphasis is based on minimum size andweight for a given output, while the industrial enginecan be heavier and therefore more durable. Manyindustrial engine manufacturers make use of thedevelopment that has gone into aircraft engines andproduce aircraft-derivative industrial turbines. Theseturbines have been strengthened in the combustionpath to extend run life.
Rapid-start capabilities make the gas turbineideal for emergency back-up power to base loadgeneration or when unexpected high system loadsoccur. In critical applications, standby units canaccept full load within as little as one to two minutesafter the signal to start, as compared to hours forconventional steam systems.
Disadvantages
Considering the advantages of gas turbineengines, it is appropriate to ask why they are not inuniversal use. There are a few importantshortcomings.
Materials currently in use for gas turbines arequite sensitive to salt, chlorine, and sulfurcontaminants in the air and/or fuel. These causeblade corrosion even in small concentrations due tothe high temperatures involved. Paniculatecontamination (ie. smog, dust, or sand) can causeclogging of air filters and can actually erode or etchcompressor blading. These problems have beenmitigated somewhat by the recent developments inblade coatings.
The disadvantage of most concerned to me, as aregul?.for of the electric utilities, is the degradation ofoutput as ambient air temperature rises. Asillustrated in Figure 1, the LM6000 has a reduction inoutput of 6000 kilowatts (kw) when the ambient airtemperature increases from 70 F to 90 plus F (atypical summer day).
LM60O0 SIMPLE CYCLE PERFORMANCE
SO ( 0 7 0
AMBIENT TEMPERATURE, F
MY WATER NOK STEAM HOX
FIGURE 1
This loss of output during peak loading periodsin the southern United States leads to a concern fortotal system reliability. Not knowing what exactcapacity a utility has when approaching peak loadconditions could lead to under or over dispatching ofother generation resources this intern would cau^eelectric system frequency excursions or less thanoptimal system operation.
This prob'em can be mitigated by coolingambient air before ingestion into the gas turbine.Currently, some utilities are addressing this outputdegradation by utilizing evaporative coolers to coolambient air temperatures. For example, TexasUtilities Electric Company designed their late 1980sgas turbine additions with evaporative coolers. Theresults of the evaporative cooler's aid in increasedgas turbine output is shown in Figure 2.
Texas Utilities Evaporative Cooler Performance
| • DCCT DeCordova Comhushon Turhine Units •J » r MCCT Moijan Creel ComhusminTurlmie Unns run'V , P8CT Permian Basin Ttirhine tlmli
I":M ,c»-* MC'CTI * Meets
m ~MCCT*
FIGURE 2
59

Additionally, Brazos Electric Coop's currentrequest for new generation includes evaporativecooling on the two - 104 megawatt (mw)Westinghouse W501D5 gas turbines planned forcommercial operation in 1994 and 1995. Brazos hasrequired the turbine manufacturer to design theturbines for rated output during maximum ambientair conditions (105 F). While this may not be themost cost effective way of insuring rated output, itillustrates that some utilities are also concerned overgas turbine output degradation.
Substantially higher outputs at maximumambient air conditions can be achieved by usingchilled water combined with evaporative cooling (seeFigure 3). By cooling the air to a constanttemperature, a constant air mass and a subsequentsteady power output from the gas turbine can bemaintained. Evaporative coolers can only cool theinlet air to the wet bulb temperature of the ambientair. Chillers can be selected to maintain a constanttemperature inlet air without the limitation of ambientair conditions.
STEWART t STEVENSON LMMOO PERFORMANCE
0 20 40 60 BO tOO
AMBIENT TEMPERATURE. *F
FIGURE 3
Net power is a function of mass flow and changein the state of the gas. This explains why the gasturbine net power drops as the ambient airtemperature increases. As the temperature increases,the mass of the air being used in the combustionprocess decreases.
To calculate power output, net power (W) equalsmass flow (m) times the change in specific heat (cp)of the air and the change in temperature through theturbine (delta Tt) minus the change in specific heat of
the air and the change in temperature through thecompressor (delta Tc).
W = m * cp * delta Tt - m * cp * delta Tc
Chiller Applications
As illustrated in Figure 3 peak output can bemaintained throughout the summer independent ofambient air temperatures by the use of chillers. Thebig question still remains, which method of coolinginlet air is most economical for the utility orcogenerator installing the gas turbine?
The primary methods for reducing inlet airtemperatures are evaporative coolers (as describedabove for the Brazos system) and chilled watersystems. Both systems have marked advantages anddisadvantages and must be carefully compared duringthe design phase of the project.
Temperature reduction potentials of the twosystems can vary widely. The evaporative systemcan only reduce temperature to the coincident wetbulb temperature whereas the chilled water systemcan achieve temperature reductions independent ofthe coincident wet bulb temperature.
At the maximum expected summer temperature,102 F and 75 F wet bulb, for example, the LM6000turbine has a rated output of 30.44 mw (refer toFigure 3). Evaporative cooling can only lower theinlet temperature to approximately 75 F at 100%relative humidity (theoretical maximum) with acorresponding turbine output of 37.45 mw for animprovement of 7.01 mw. In contrast, the chilledwater system can lower the inlet temperature to the59 F design condition for a output of 42.4 mwresulting in a increased output of 11.96 mw.(Parasitic losses, which include compressors, pumps,and fans to operate the system have not beenincluded, but have been estimated to be around 1mw.)
Any analysis comparing these two systems mustinclude the operating hours of the turbine, sitespecific conditions, and the corresponding weatherdata to complete the design picture. Averagedifferences between dry bulb and coincident wet bulbtemperatures and the number of operating hours atthese conditions should be included in the analysis as
60
well as parasitic losses associated with the particulardesign. Some sites may have steam or hot wateravailable to reduce these losses.
With this information, the most economical typeof system and the sizing of that system can bedecided.
The Next Generation
The new generation of large industrial "F"turbines offer output up to 150 mw with heat ratesand efficiencies comparable to a conventional gasboiler and steam turbine (10,000 BTU per kilowatt-hour).
MANUFACTURER
GENERAL ELEC.
WESTINGHOUSE
SIEMENS/KWU
BASERATING
150 mw
145 mw
140 mw
HEAT RATE(btu/kwh)
9,880
10,000
9,860
As efficient as these machines are the mostefficient gas turbine built to date is the LM6000 builtby General Electric and packaged by Stewart &Stevenson.
The LM6000 is derived from the GE CF6-80C2jet aircraft engine. It is built in large quantities forcommercial aircraft such as the Boeing 747,McDonnell Douglas MD-11, and the Airbus A300.
The LM6000 is a two shaft gas turbine with anoutput speed of 3600 RPM so it can be directlycoupled to an electric generator. With the simplecycle heat rate of 8230 BTU/kilowatt-hour (kwh) andefficiencies of 41.5%, the LM6000 has the potentialto dominate the next generation of gas turbines. Witha rated output of 42.4 mw, the LM6000 can beincrementally added to the electric system capabilitiesquickly to respond to changing load forecasts.
The LM6000, utilizing a chiller to cool inlet airand a heater to maintain constant inlet airtemperatures, can stay at peak output throughout theyear (refer to Figure 3). Therefore, we have themost efficient gas turbine operating at constant peakoutput, independent of ambient air temperatures.
Steam augmentation and combined cycle can be usedto increase total plant output or can be added at alater date as load forecasts dictate. If parasitic loadsduring peak loads are not desired, an ice makingsystem can be added to the design.
The ice making system can produce ice at offpeak hours using lower cost base load power. Thisallows the lower cost nuclear or coal units to maintainfull load at off peak hours and avoid the parasitic loadof the chillers during peak system loading. One ofthese systems was installed at Lincoln ElectricSystem's Rokeby station just recently.
Retrofit of Existing Gas Turbines
We know now how to specify the most efficientnew gas turbines with reliable outputs. What do wedo with all the older gas turbines whose performancedegrades with ambient air temperature?
The answer remains the same. Evaporativecoolers and/or chillers can easily be added if spacepermits. Typically, in a cogeneration plant theavailability of steam and hot water can costeffectively reduce the retrofit costs. Similarly,utilizing absorption chillers and steam turbine drivencentrifugal chillers can reduce parasitic loadsassociated with inlet air cooling.
Higher outputs from gas turbines in the summertime could reduce peak demand charges if thecogenerator is also a electric consumer.Alternatively, the extra power could be marketed tothe host utility. Installed costs of inlet air coolingsystems are estimated to be less than the cost of newcapacity. Estimates for cooling systems cost rangefrom $165 to S300/kw.
Another benefit of the higher outputs from thegas turbine is higher steam production in the heatrecovery steam generator. This excess steam couldalso be marketed to the steam host or used to drivethe chiller. Often times cogeneration facilities utilizehigh-maintenance pressure reduction stations thatcould be replaced with a single or double stage non-condensing steam turbine to drive the chiller andsupply process steam at desired conditions.
61
CONCLUSION
With the Public Utility Commission reviewingrequests for new installed capacity of $350 to$2000/kw, increasing capacity by $165 to $300/kwlooks attractive from the ratepayer perspective.Cogenerators in Texas operate 7036.5 mw of powergeneration resources. Over 20% of this total i,comprised of gas turbines. Another 63% of thecogeneration power is produced by combined cycleplants. Assuming a third of the combined cyclepower is produced by steam turbines, then the othertwo thirds is probably produced by additional gasturbines. This means approximately 4362.6 mw areproduced by gas lurbines.
7036.5 mw * (20% + (63% - 1/3*63%)= 4362.6
Assuming a 10% capacity increase from coolinginlet air, the cogenerators could increase production436 mw at an installed cost less than the utilities arecurrently planning ($165 versus $2000 using theextremes). At avoided costs of $60 to $80/kw/year,
the capacity increases could pay for themselves intwo to three years.
With the advanced gas turbines currentlyavailable, it is hard to imagine a utility building aconventional gas-fired boiler and steam turbine.Nuclear and coal power plants are having toovercome so many environmental concerns that theirfuture depends more on the future costs of natural gasthan any other factor. Renewable technologies aredeveloping, but still offer limited applications.
The major growth in generation capacity duringthe 1990s will undoubtedly be in gas turbineapplications. The characteristics of the gas turbine(ie. reduction in output from high ambienttemperatures) must be considered when viewing themacrocosm of the electric system. System operatorsmust make allowances for reduced capabilities in thesummer or designers have to adjust for the outputdegradation or the electric system's reliabilityperformance could deteriorate.
62
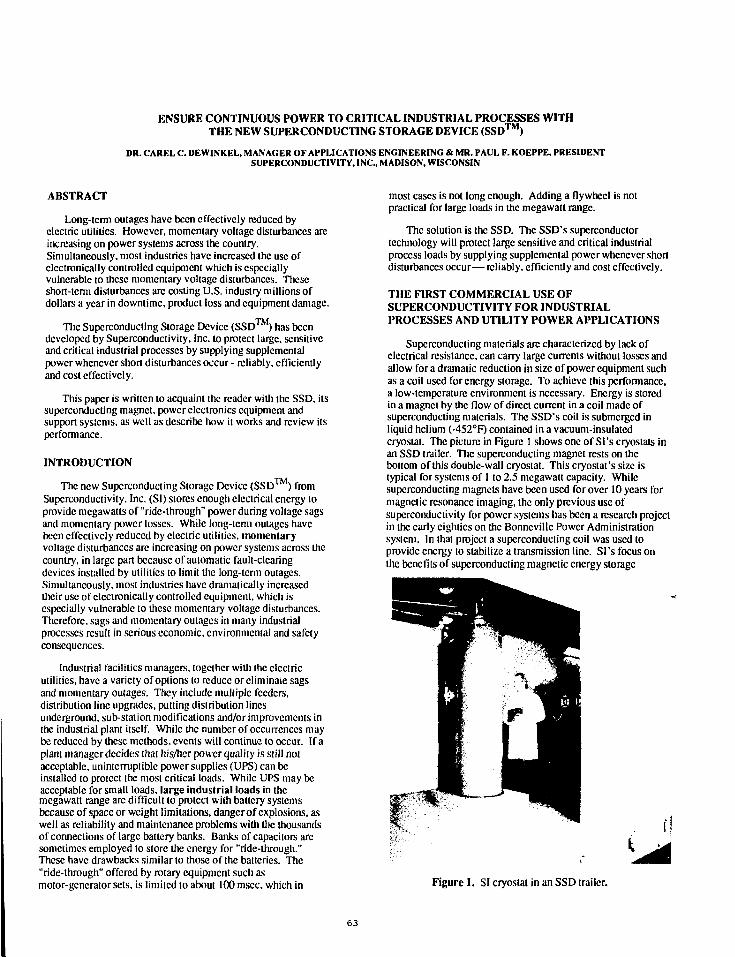
ENSURE CONTINUOUS POWER TO CRITICAL INDUSTRIAL PROCESSES WITHTHE NEW SUPERCONDUCTING STORAGE DEVICE (SSD™)
DR. CAREL C. DEWINKEL, M ANAG ER OF APPLICATIONS ENGINEERING & MR. PAUL F. KOEPPE, PRESIDENTSUPERCONDUCTIVITY, INC., MADISON, WISCONSIN
ABSTRACT
Long-term outages have been effectively reduced byelectric utilities. However, momentary voltage disturbances areincreasing on power systems across the country.Simultaneously, most industries have increased the use ofelectronically controlled equipment which is especiallyvulnerable to these momentary voltage disturbances. Theseshort-term disturbances arc costing U.S. industry millions ofdollars a year in downtime, product loss and equipment damage.
The Superconducting Storage Device (SSD™) has beendeveloped by Superconductivity, Inc. to protect large, sensitiveand critical industrial processes by supplying supplementalpower whenever short disturbances occur - reliably, efficientlyand cost effectively.
This paper is written to acquaint the reader with the SSD, itssuperconducting magnet, power electronics equipment andsupport systems, as well as describe how it works and review itsperformance.
INTRODUCTION
The new Superconducting Storage Device (SSD™) fromSuperconductivity. Inc. (SI) stores enough electrical energy toprovide megawatts of "ride-through" power during voltage sagsand momentary power losses. While long-term outages havebeen effectively reduced by electric utilities, momentaryvoltage disturbances are increasing on power systems across thecountry, in large part because of automatic fault-clearingdevices installed by utilities to limit the long-term outages.Simultaneously, most industries have dramatically increasedtheir use of electronically controlled equipment, which isespecially vulnerable to these momentary voltage disturbances.Therefore, sags and momentary outages in many industrialprocesses result in serious economic, environmental and safetyconsequences.
Industrial facilities managers, together with the electricutilities, have a variety of options to reduce or eliminate sagsand momentary outages. They include multiple feeders,distribution line upgrades, putting distribution linesunderground, sub-station modifications and/or improvements inthe industrial plant itself. While the number of occurrences maybe reduced by these methods, events will continue to occur. If aplant manager decides that his/her power quality is still notacceptable, uninterruptible power supplies (UPS) can beinstalled to protect the most critical loads. While UPS may beacceptable for small loads, large industrial loads in themegawatt range are difficult to protect with battery systemsbecause of space or weight limitations, danger of explosions, aswell as reliability and maintenance problems with the thousandsof connections of large battery banks. Banks of capacitors aresometimes employed to store the energy for "ride-through."These have drawbacks similar to those of the batteries. The"ride-through" offered by rotary equipment such asmotor-generator sets, is limited to about 100 msec, which in
most cases is not long enough. Adding a flywheel is notpractical for large loads in the megawatt range.
The solution is the SSD. The SSD's superconductortechnology will protect large sensitive and critical industrialprocess loads by supplying supplemental power whenever shortdisturbances occur— reliably, efficiently and cost effectively.
THE FIRST COMMERCIAL USE OFSUPERCONDUCTIVITY FOR INDUSTRIALPROCESSES AND UTILITY POWER APPLICATIONS
Superconducting materials are characterized by lack ofelectrical resistance, can carry large currents without losses andallow fora dramatic reduction in size of power equipment suchas a coil used for energy storage. To achieve this performance,a low-temperature environment is necessary. Energy is storedin a magnet by the flow of direct current in a coil made ofsuperconducting materials. The SSD's coil is submerged inliquid helium (-452°F) contained in a vacuum-insulatedcryostat. The picture in Figure 1 shows one of Si's cryostats inan SSD trailer. The superconducting magnet rests on thebottom of this double-wall cryostat. This cryostat's size istypical for systems of 1 to 2.5 megawatt capacity. Whilesuperconducting magnets have been used for over 10 years formagnetic resonance imaging, the only previous use ofsuperconductivity for power systems has been a research projectin the early eighties on the Bonnevillc Power Administrationsystem. In that project a superconducting coil was used toprovide energy to stabilize a transmission line. Si's focus onthe benefits of superconducting magnetic energy storage
Figure I. SI cryosiat in an SSD trailer.
63
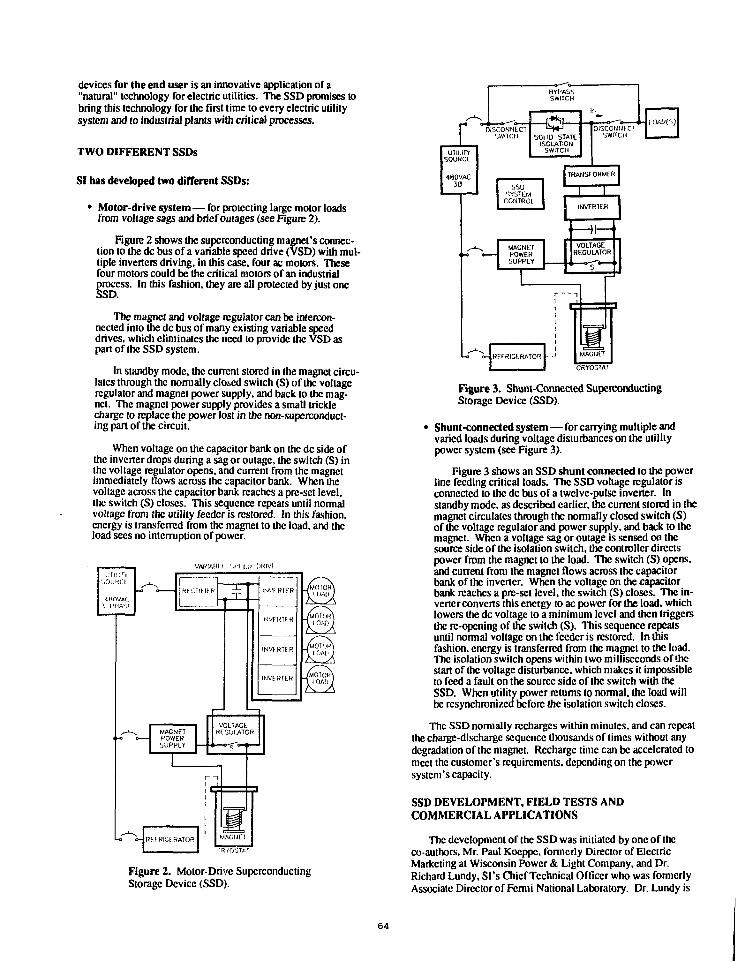
devices for the end user is an innovative application of a"natural" technology for electric utilities. The SSD promises tobring this technology for the first lime to every electric utilitysystem and to industrial plants with critical processes.
TWO DIFFERENT SSDs
SI has developed two different SSDs:
• Motor-drive system—for protecting large motor loadsfrom voltage sags and brief outages (see Figure 2).
Figure 2 shows the superconducting magnet's connec-tion to the dc bus of a variable speed drive (VSD) with mul-tiple inverters driving, in this case, four ac motors. Thesefour motors could be the critical motors of an industrialprocess. In (his fashion, they are all protected by just oneSSD.
The magnet and voltage regulator can be intercon-nected into the dc bus of many existing variable speeddrives, which eliminates the need to provide the VSD aspart of the SSD system.
In standby mode, the current stored in the magnet circu-lates through the normally closed switch (S) of the voltageregulator and magnet power supply, and back to the mag-net. The magnet power supply provides a small tricklecharge to replace the power lost in the non-superconduct-ing part of the circuit.
When voltage on the capacitor bank on the dc side ofthe inverter drops during a sag or outage, the switch (S) inthe voltage regulator opens, and current from the magnetimmediately flows across the capacitor bank. When thevoltage across the capacitor bank reaches a pre-set level,the switch (S) closes. This sequence repeats until normalvoltage from the utility feeder is restored. In this fashion,energy is transferred from the magnet to the load, and theload sees no interruption of power.
VAKAHII '.-J'll.11 IIKIVI
Figure 2. Motor-Drive SuperconductingStorage Device (SSD).
Figure 3. Shunt-Connected SuperconductingStorage Device (SSD).
• Shunt-connected system—for carrying multiple andvaried loads during voltage disturbances on the utilitypower system (sec Figure 3).
Figure 3 shows an SSD shunt connected to the powerline feeding critical loads. The SSD voltage regulator isconnected to the dc bus of a twelve-pulse inverter. Instandby mode, as described earlier, the current stored in themagnet circulates through the normally closed switch (S)of the voltage regulator and power supply, and back to themagnet. When a voltage sag or outage is sensed on thesource side of the isolation switch, the controller directspower from the magnet to the load. The switch (S) opens,and current from the magnet flows across the capacitorbank of the inverter. When the voltage on the capacitorbank reaches a pre-set level, the switch (S) closes. The in-verter converts this energy to ac power for the load, whichlowers the dc voltage to a minimum level and then triggersthe re-opening of the switch (S). This sequence repeatsuntil normal voltage on the feeder is restored. In thisfashion, energy is transferred from the magnet to the load.The isolation switch opens within two milliseconds of thestart of the voltage disturbance, which makes it impossibleto feed a fault on the source side of the switch with theSSD. When utility power returns to normal, the load willbe resynchronized before the isolation switch closes.
The SSD normally recharges within minutes, and can repeatthe charge-discharge sequence thousands of times without anydegradation of the magnet. Recharge time can be accelerated tomeet the customer's requirements, depending on the powersystem's capacity.
SSD DEVELOPMENT, FIELD TESTS ANDCOMMERCIAL APPLICATIONS
The development of the SSD was initiated by one of theco-authors. Mr. Paul Koeppc, formerly Director of ElectricMarketing at Wisconsin Power & Light Company, and Dr.Richard Lundy, Si's Chief Technical Officer who was formerlyAssociate Director of Fermi National Laboratory. Dr. Lundy is
64
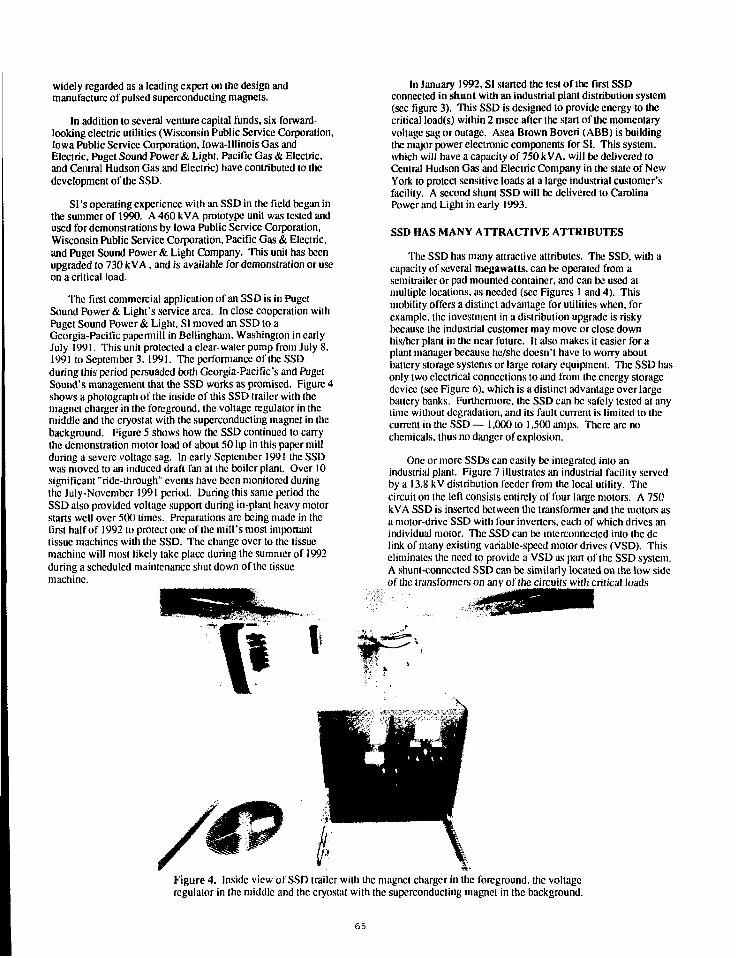
widely regarded as a leading expert on the design andmanufacture of pulsed superconducting magnets.
In addition to several venture capital funds, six forward-looking electric utilities (Wisconsin Public Service Corporation,Iowa Public Service Corporation, Iowa-Illinois Gas andElectric, Puget Sound Power & Light, Pacific Gas & Electric,and Central Hudson Gas and Electric) have contributed to thedevelopment of the SSD.
Si's operating experience with an SSD in the field began inthe summer of 1990. A 460 kVA prototype unit was tested andused for demonstrations by Iowa Public Service Corporation,Wisconsin Public Service Corporation, Pacific Gas & Electric,and Puget Sound Power & Light Company. This unit has beenupgraded to 730 kVA , and is available for demonstration or useon a critical load.
The first commercial application of an SSD is in PugctSound Power & Light's service area. In close cooperation withPuget Sound Power & Light. SI moved an SSD to aGeorgia-Pacific papermill in Bellingham, Washington in earlyJuly 1991. This unit protected a clear-water pump from July 8,1991 to September 3, 1991. The performance of the SSDduring this period persuaded both Georgia-Pacific's and PugetSound's management that the SSD works as promised. Figure 4shows a photograph of the inside of this SSD trailer with themagnet charger in the foreground, the voltage regulator in themiddle and the cryoslat with the superconducting magnet in thebackground. Figure 5 shows how the SSD continued to carrythe demonstration motor load of about 50 hp in this paper millduring a severe voltage sag. In early September 1991 the SSDwas moved to an induced draft fan at the boiler plant. Over 10significant "ride-through" events have been monitored duringthe July-November 1991 period. During this same period theSSD also provided voltage support during in-plant heavy motorstarts well over 500 times. Preparations are being made in thefirst half of 1992 to protect one of the mill's most importanttissue machines with the SSD. The change over to the tissuemachine will most likely take place during the summer of 1992during a scheduled maintenance shut down of the tissuemachine.
In January 1992, SI started the test of the first SSDconnected in shunt with an industrial plant distribution system(see figure 3). This SSD is designed to provide energy to thecritical load(s) within 2 msec after the start of the momentaryvoltage sag or outage. Asea Brown Bovcri (ABB) is buildingthe major power electronic components for SI. This system,which will have a capacity of 750 kVA. will be delivered toCentral Hudson Gas and Electric Company in the state of NewYork to protect sensitive loads at a large industrial customer'sfacility. A second shunt SSD will be delivered to CarolinaPower and Light in early 1993.
SSD HAS MANY ATTRACTIVE ATTRIBUTES
The SSD has many attractive attributes. The SSD, with acapacity of several megawatts, can be operated from asemitrailer or pad mounted container, and can be used atmultiple locations, as needed (sec Figures 1 and 4). Thismobility offers a distinct advantage for utilities when, forexample, the investment in a distribution upgrade is riskybecause the industrial customer may move or close downhis/her plant in the near future. It also makes it easier for aplant manager because he/she doesn't have to worry aboutbattery storage systems or large rotary equipment. The SSD hasonly two electrical connections to and from the energy storagedevice (sec Figure 6). which is a distinct advantage over largebattery banks. Furthermore, the SSD can be safely tested at anytime without degradation, and its fault current is limited to thecurrent in the SSD - - 1,000 to 1,500 amps. There arc nochemicals, thus no danger of explosion.
One or more SSDs can easily be integrated into anindustrial plant. Figure 7 illustrates an industrial facility servedby a 13.8 kV distribution feeder from the local utility. Thecircuit on the left consists entirely of four large motors. A 750kVA SSD is inserted between the transformer and the motors asa motor-drive SSD with four inverters, each of which drives anindividual motor. The SSD can be interconnected into the dclink of many existing variable-speed motor drives (VSD). Thiseliminates the need to provide a VSD as pan of the SSD system.A shunl-connccted SSD can be similarly located on the low sideof the transformers on any of the circuits with critical loads
Figure 4. Inside view of SSD trailer with the magnet charger in the foreground, the voltageregulator in the middle and the cryostat with the superconducting magnet in the background.
65
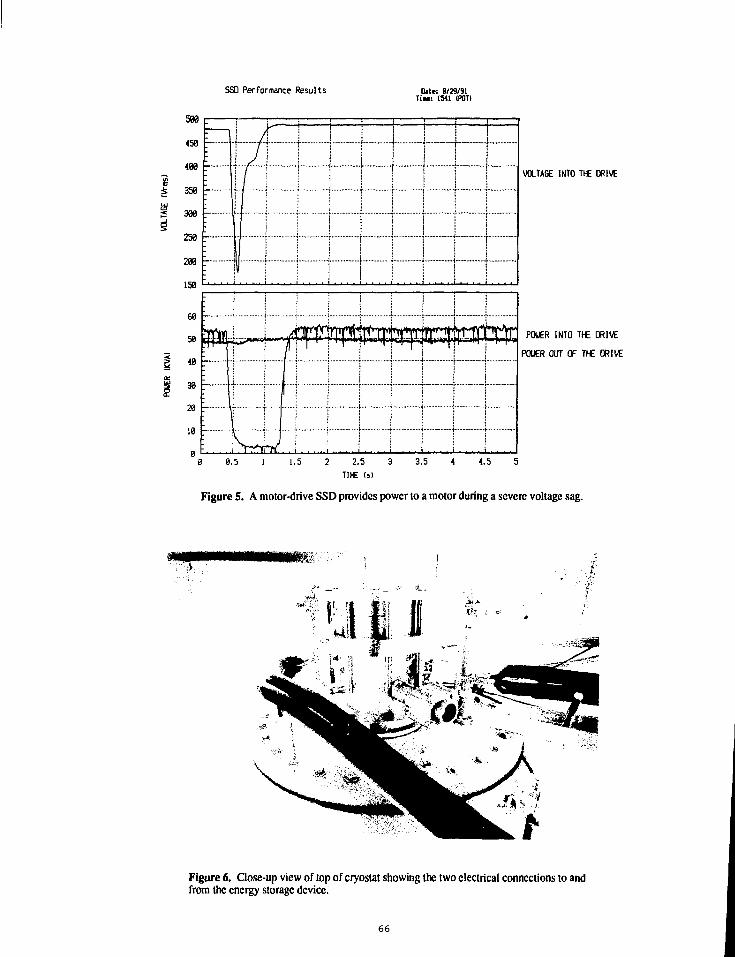
SSO Performance Results Elite: 8/29/91Tine: 1511 (POD
•f
..t......
i r
T
. . . i . . . .
tec
VOLTAGE INTO U£ DRIVE
POUER INTO THE DRIVE
POUER OUT OF THE DRIVE
0 0.5 1 1.5 2 2.5 3 3.5 4 4.5 5
TIME (5)
Figure 5. A motor-drive SSD provides power to a motor during a severe voltage sag.
Figure 6. Close-up view of top of cryostat showing the two electrical connections to andfrom the energy storage device.
66
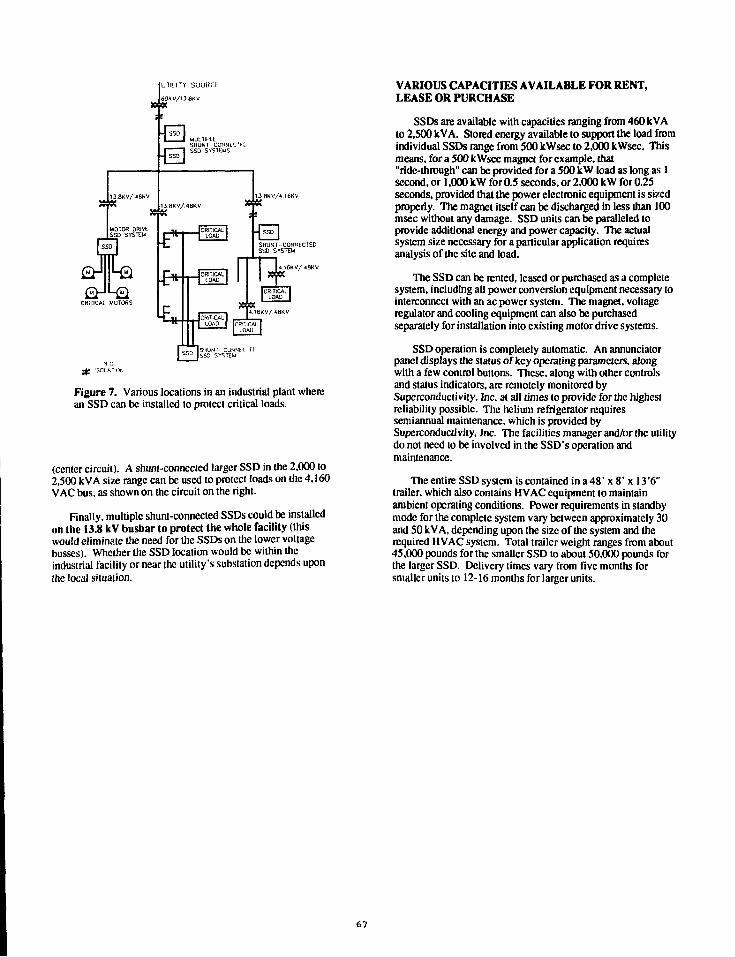
UTIl iTT SOURCI
SHUNT-CONNECTEDSSD SYSTEM
Figure 7. Various locations in an industrial plant wherean SSD can be installed to protect critical loads.
(center circuit). A shunt-connected larger SSD in the 2.000 to2,500 kVA size range can be used to protect loads on the 4,160VAC bus, as shown on the circuit on the right.
Finally, multiple shunt-connected SSDs could be installedon the 13.8 kV busbar to protect the whole facility (thiswould eliminate the need for the SSDs on the lower voltagebusses). Whether the SSD location would be within theindustrial facility or near the utility's substation depends uponthe local situation.
VARIOUS CAPACITIES AVAILABLE FOR RENT,LEASE OR PURCHASE
SSDs are available with capacities ranging from 460 kVAto 2,500 kVA. Stored energy available to support the load fromindividual SSDs range from 500 kWsec to 2,000 kWsec. Thismeans, for a 500 kWsec magnet for example, that"ride-through" can be provided for a 500 kW load as long as 1second, or 1,000 kW for 0.5 seconds, or 2.000 kW for 0.25seconds, provided that the power electronic equipment is sizedproperly. The magnet itself can be discharged in less than 100msec without any damage. SSD units can be paralleled toprovide additional energy and power capacity. The actualsystem size necessary for a particular application requiresanalysis of the site and load.
The SSD can be rented, leased or purchased as a completesystem, including all power conversion equipment necessary tointerconnect with an ac power system. The magnet, voltageregulator and cooling equipment can also be purchasedseparately for installation into existing motor drive systems.
SSD operation is completely automatic. An annunciatorpanel displays (he status of key operating parameters, alongwith a few control buttons. These, along with other controlsand status indicators, are remotely monitored bySuperconductivity. Inc. at all times to provide for the highestreliability possible. The helium refrigerator requiressemiannual maintenance, which is provided bySuperconductivity, Inc. The facilities manager and/or the utilitydo not need to be involved in the SSD's operation andmaintenance.
The entire SSD system is contained in a 4 8 ' x 8' x 13*6"trailer, which also contains HVAC equipment to maintainambient operating conditions. Power requirements in standbymode for the complete system vary between approximately 30and 50 kV A, depending upon the size of the system and therequired HVAC system. Total trailer weight ranges from about45.000 pounds for the smaller SSD to aboul 50,000 pounds forthe larger SSD. Delivery times vary from five months forsmallerunits to 12-16 months for larger units.
67
THE COMMISSION FORECAST 1992 REPORT:IMPORTANT RESOURCE PLANNING ISSUES
PARVIZ ADIBMANAGER, ECONOMIC ANALYSIS SECTION
ELECTRIC DIVISIONPUBLIC UTILITY COMMISSION OF TEXAS
ABSTRACT
There is a general agreement among experts in theelectric utility industry that some power plants will be builtin Texas in the 1990s. However, the existence ofnumerous alternatives to meet the growing demand mayhave a powerful impact on this new phase of construction.Therefore, the magnitude of the new power plantconstruction will probably not be as great as what wethought a few years ago.
The author emphasizes the importance of using anintegrated resource planning approach, in which alternativeresources could be analyzed and compared adequately.While there are many important issues in the preparation ofa utility's electric resource plan, the Commission staff willaddress a few important ones in the next CommissionForecast Report (Forecast '92). In particular, theCommission staff will insure that alternative resources, theenvironmental impacts of different technologies, andinnovative rate design options are considered.
INTRODUCTION
The electric industry in Texas has nearlycompleted a unique period in its histoiy that could becharacterized as follows:
• highly capital-intensive construction
• slow growth in demand
• multiple rate increases
• skyrocketing surplus capacity.
Because of the restructuring in the Texas economythat yielded a strong and diversified base capable ofavoiding the kind of economic slowdowns that Texasexperienced in the 1986-1988 period, I expect steadygrowth in the demand for electricity. This growth indemand, along with the retirement in aging plants, will
result in the elimination of surplus capacity and theaddition of some power plants in Texas in the 1990s.
Furthermore, there is a growing awareness of theeconomical alternatives to power plant construction.These alternatives include cogeneration, conservation,and renewable resources — the three pillars of energyefficiency. Cogeneration technologies allow moreefficient use of fuel, usually natural gas. Conservationtechnologies increase the efficiency of electricity use.Finally, renewable technologies allow the use ofplentiful natural resources such as wind and sunlight.Therefore, the magnitude of the new phase of powerplant construction will probably not be as great as whatwe thought it might be just a few years ago.
The Public Utility Commission, through a multi-stage process, evaluates (1) decisions made to build apower plant, (2) the management and cost ofconstruction, and (3) the inclusion of the resultingseveral million-dollar, or possibly billion-dollar,investments in the utilities' ratebase. My remarksfocus on the first stage of this multi-stage process.This first stage is the development of a utility's loadforecast and capacity resource plan.
First, I briefly summarize the utilities' ten-yearforecast filed in responses to the December 1991 Loadand Capacity Resource Forecast Filing. Second, Iaddress the current statutes and rules governingutilities' load and capacity resource planning. Third, Idiscuss the integrated resource planning process andthe Commission's current practice. Fourth, I provide abrief summary of the Commission's biennial forecastand integrated resource forecasting and planningmodels. Fifth, major planning issues are examined.Finally, a brief summary concludes my presentation.
TEN-YEAR FORECAST: UTILITIES' VIEW
Generating electric utilities in Texas are requiredto report their forecast of loads and resources pursuant
The views expressed in this paper are those of the authors and do not necessarily reflect the positions ofthe Public Utility Commission of Texas
68
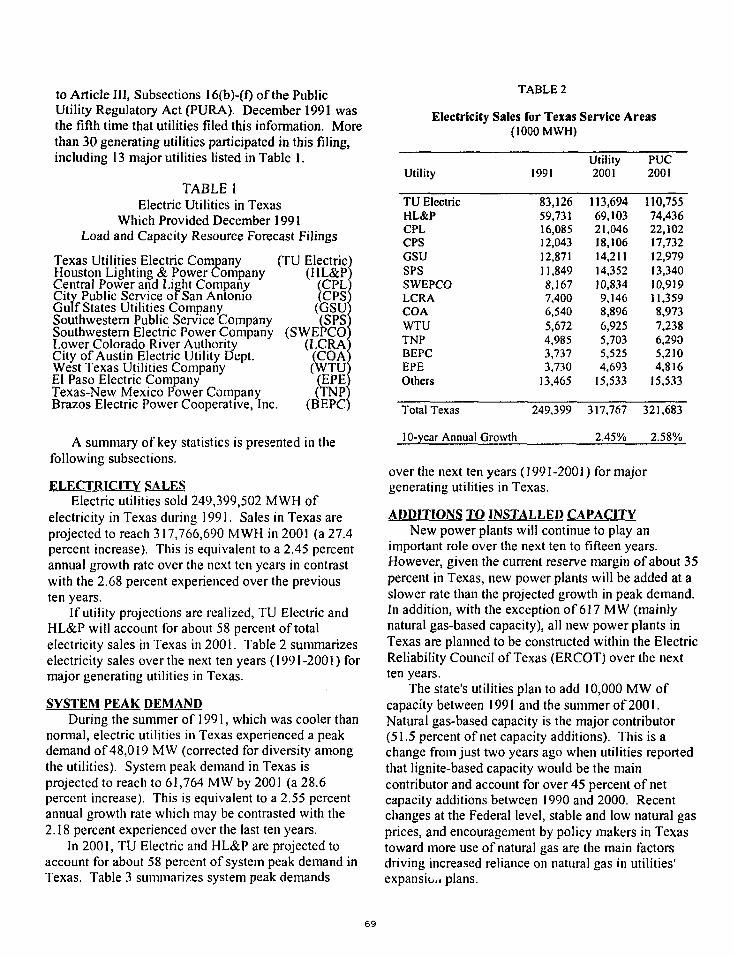
to Article III, Subsections 16(b)-(f) of the PublicUtility Regulatory Act (PURA). December 1991 wasthe fifth time that utilities filed this information. Morethan 30 generating utilities participated in this filing,including 13 major utilities listed in Table 1.
TABLE 1Electric Utilities in Texas
Which Provided December 1991Load and Capacity Resource Forecast Filings
Texas Utilities Electric Company (TU ElectricHouston Lighting & Power Company (HL&PCentral Power and Light Company (CPLCity Public Service of San Antonio (CPSGulf States Utilities Company (GSLJSouthwestern Public Service Company (SPSSouthwestern Electric Power Company (SWEPCOLower Colorado River Authority (LCRACity of Austin Electric Utility Dept. (COAWest Texas Utilities Company (WTUEl Paso Electric Company (£Texas-New Mexico Power Company (TNPBrazos Electric Power Cooperative, Inc. (BEPC
A summary of key statistics is presented in thefollowing subsections.
ELECTRICITY SALESElectric utilities sold 249,399,502 MWH of
electricity in Texas during 1991. Sales in Texas areprojected to reach 317,766,690 MWH in 200! (a 27.4percent increase). This is equivalent to a 2.45 percentannual growth rate over the next ten years in contrastwith the 2.68 percent experienced over the previousten years.
If utility projections are realized, TU Electric andHL&P will account for about 58 percent of totalelectricity sales in Texas in 2001. Table 2 summarizeselectricity sales over the next ten years (1991-2001) formajor generating utilities in Texas.
SYSTEM PEAK DEMANDDuring the summer of 1991, which was cooler than
normal, electric utilities in Texas experienced a peakdemand of 48,019 MW (corrected for diversity amongthe utilities). System peak demand in Texas isprojected to reach to 61,764 MW by 2001 (a 28.6percent increase). This is equivalent to a 2.55 percentannual growth rate which may be contrasted with the2.18 percent experienced over the last ten years.
In 2001, TU Electric and HL&P are projected toaccount for about 58 percent of system peak demand inTexas. Table 3 summarizes system peak demands
TABLE 2
Electricity Sales for Texas Service Areas(1000 MWH)
Utility 1991Utility2001
PUC2001
TU ElectricHL&PCPLCPSGSUSPSSWEPCOLCRACOAWTUTNPBEPCEPEOthers
83,12659,73116,08512,04312,87111,8498,1677,4006,5405,6724,9853,7373,73013,465
113,69469,10321,04618,10614,21114,35210,8349,1468,8966,9255,7035,5254,69315,533
110,75574,43622,10217,73212,97913,34010,91911,3598,9737,2386,2905,2104,81615,533
Total Texas 249,399 317,767 321,683
10-year Annual Growth 2.45% 2.58%
over the next ten years (1991 -2001) for majorgenerating utilities in Texas.
ADDITIONS TO INSTALLED CAPACITYNew power plants will continue to play an
important role over the next ten to fifteen years.However, given the current reserve margin of about 35percent in Texas, new power plants will be added at aslower rate than the projected growth in peak demand.In addition, with the exception of 617 MW (mainlynatural gas-based capacity), all new power plants inTexas are planned to be constructed within the ElectricReliability Council of Texas (ERCOT) over the nextten years.
The state's utilities plan to add 10,000 MW ofcapacity between 1991 and the summer of 2001.Natural gas-based capacity is the major contributor(51.5 percent of net capacity additions). This is achange from just two years ago when utilities reportedthat lignite-based capacity would be the maincontributor and account for over 45 percent of netcapacity additions between 1990 and 2000. Recentchanges at the Federal level, stable and low natural gasprices, and encouragement by policy makers in Texastoward more use of natural gas are the main factorsdriving increased reliance on natural gas in utilities'expansio.i plans.
69
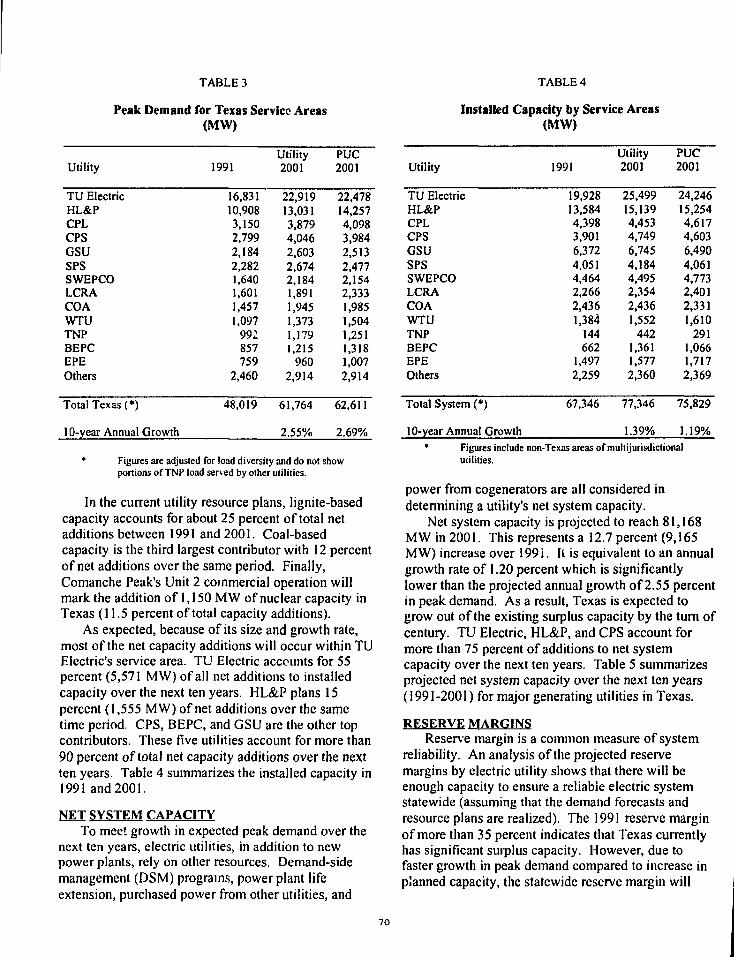
TABLE 3 TABLE 4
Peak Demand
Utility
TU ElectricHL&PCPLCPSGSUSPSSWEPCOLCRACOAWTUTNPBEPCEPEOthers
Total Texas (*)
10-year Annual Growth
for Texas Service Areas(MW)
1991
16,83110,9083,1502,7992,1842,2821,6401,6011,4571,097
991857759
2,460
48,019
Utility2001
22,91913,0313,8794,0462,6032,6742,1841,8911,9451,3731,1791,215
9602,914
61,764
2.55%
PUC2001
22,47814,2574,0983,9842,5132,4772,1542,3331,9851,5041,2511,3181,0072,914
62,611
2.69%
Installed <
Utility
TU ElectricHL&PCPLCPSGSUSPSSWEPCOLCRACOAWTUTNPBEPCEPEOthers
Total System (*)
Capacity by Service Areas(MW)
1991
19,92813,5844,3983,9016,3724,0514,4642,2662,4361,384
144662
1,4972,259
67,346
10-year Annual Growth
Utility2001
25,49915,1394,4534,7496,7454,1844,4952,3542,4361,552
4421,3611,5772,360
77,346
1.39%
PUC2001
24,24615,2544,6174,6036,4904,0614,7732,4012,3311,610
2911,0661,7172,369
75,829
1.19%
* Figures are adjusted for load diversity and do not showportions of TNP load served by other utilities.
In the current utility resource plans, lignite-basedcapacity accounts for about 25 percent of total netadditions between 1991 and 2001. Coal-basedcapacity is the third largest contributor with 12 percentof net additions over the same period. Finally,Comanche Peak's Unit 2 commercial operation willmark the addition of 1,150 MW of nuclear capacity inTexas (11.5 percent of total capacity additions).
As expected, because of its size and growth rate,most of the net capacity additions will occur within TUElectric's service area. TU Electric accounts for 55percent (5,571 MW) of all net additions to installedcapacity over the next ten years. HL&P plans 15percent (1,555 MW) of net additions over the sametime period. CPS, BEPC, and GSU are the other topcontributors. These five utilities account for more than90 percent of total net capacity additions over the nextten years. Table 4 summarizes the installed capacity in1991 and 2001.
NET SYSTEM CAPACITYTo meet growth in expected peak demand over the
next ten years, electric utilities, in addition to newpower plants, rely on other resources. Demand-sidemanagement (DSM) programs, power plant lifeextension, purchased power from other utilities, and
* Figures include non-Texas areas of multijurisdictionaluiilities.
power from cogenerators are all considered indetermining a utility's net system capacity.
Net system capacity is projected to reach 81,168MW in 2001. This represents a 12.7 percent (9,165MW) increase over 1991. It is equivalent to an annualgrowth rate of 1.20 percent which is significantlylower than the projected annual growth of 2.55 percentin peak demand. As a result, Texas is expected togrow out of the existing surplus capacity by the turn ofcentury. TU Electric, HL&P, and CPS account formore than 75 percent of additions to net systemcapacity over the next ten years. Table 5 summarizesprojected net system capacity over the next ten years(1991-2001) for major generating utilities in Texas.
RESERVE MARGINSReserve margin is a common measure of system
reliability. An analysis of the projected reservemargins by electric utility shows that there will beenough capacity to ensure a reliable electric systemstatewide (assuming that the demand forecasts andresource plans are realized). The 1991 reserve marginof more than 35 percent indicates that Texas currentlyhas significant surplus capacity. However, due tofaster growth in peak demand compared to increase inplanned capacity, the statewide reserve margin will
70
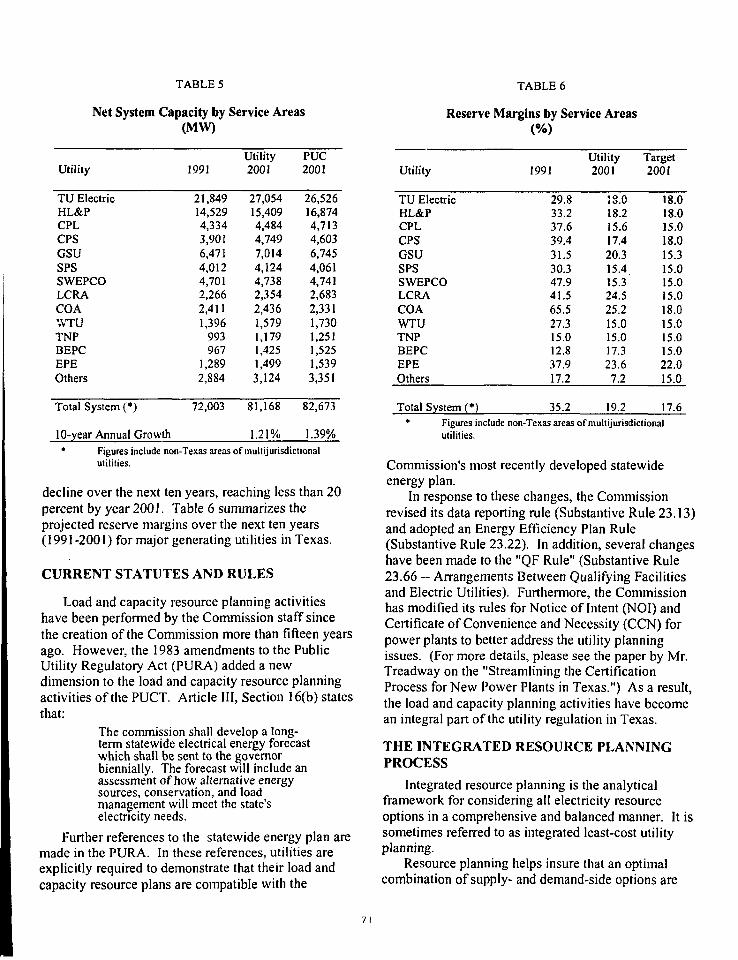
TABLE 5
Net System Capacity by Service Areas(MW)
TABLE 6
Reserve Margins by Service Areas
Utility
TU ElectricHL&PCPLCPSGSUSPSSWEPCOLCRACOA\VTUTNPBEPCEPEOthers
Total System (*)
10-year Annual Growth
1991
21,84914,5294,3343,9016,4714,0124,7012,2662,4111,396
993967
1,2892,884
72,003
Utility2001
27,05415,4094,4844,7497,0144,1244,7382,3542,4361,5791,1791,4251,4993,124
81,168
1.21%
PUC2001
26,52616,8744,7134,6036,7454,0614,7412,6832,3311,7301,2511,5251,5393,351
82,673
1.39%
Utility
TU ElectricHL&PCPLCPSGSUSPSSWEPCOLCRACOAWTUTNPBEPCEPEOthers
Total System (*)• Figures include
utilities.
1991
29.833.237.639.431.530.347.941.565.527.315.012.837.917.2
35.2
Utility2001
18.018.215.617.420.315.415.324.525.215.015.017.323.67.2
19.2
Target2001
18.018.015.018.015.315.015.015.018.015.015.015.022.015.0
17.6non-Texas areas of multijurisdictional
• Figures include non-Texas areas of multijurisdictionalutilities.
decline over the next ten years, reaching less than 20percent by year 2001. Table 6 summarizes theprojected reserve margins over the next ten years(1991-2001) for major generating utilities in Texas.
CURRENT STATUTES AND RULES
Load and capacity resource planning activitieshave been performed by the Commission staff sincethe creation of the Commission more than fifteen yearsago. However, the 1983 amendments to the PublicUtility Regulatory Act (PURA) added a newdimension to the load and capacity resource planningactivities of the PUCT. Article III, Section 16(b) statesthat:
The commission shall develop a long-term statewide electrical energy forecastwhich shall be sent to the governorbiennially. The forecast will include anassessment of how alternative energysources, conservation, and loadmanagement will meet the state'selectricity needs.
Further references to the statewide energy plan aremade in the PURA. In these references, utilities areexplicitly required to demonstrate that their load andcapacity resource plans are compatible with the
Commission's most recently developed statewideenergy plan.
In response to these changes, the Commissionrevised its data reporting rule (Substantive Rule 23.13)and adopted an Energy Efficiency Plan Rule(Substantive Rule 23.22). In addition, several changeshave been made to the "QF Rule" (Substantive Rule23.66 — Arrangements Between Qualifying Facilitiesand Electric Utilities). Furthermore, the Commissionhas modified its rules for Notice of Intent (NOI) andCertificate of Convenience and Necessity (CCN) forpower plants to better address the utility planningissues. (For more details, please see the paper by Mr.Treadway on the "Streamlining the CertificationProcess for New Power Plants in Texas.") As a result,the load and capacity planning activities have becomean integral part of the utility regulation in Texas.
THE INTEGRATED RESOURCE PLANNINGPROCESS
Integrated resource planning is the analyticalframework for considering all electricity resourceoptions in a comprehensive and balanced manner. It issometimes referred to as integrated least-cost utilityplanning.
Resource planning helps insure that an optimalcombination of supply- and demand-side options are
used to meet the need for electricity. Furthermore, itinsures that present u.id future customers are providedwith electric services in a reliable manner at the lowestpossible cost, within a given set of financial andregulatory constraints. The consequence of a sub-optimal resource plan is the imposition of unnecessarycosts on the utility's ratepayers.
INTEGRATED RESOURCE PLANNING INPRACTICE
Generally, utilities need additional capacity tomaintain an adequate supply of reliable electricity inresponse to the growth in demand. Retirements ofexisting units, both technical and/or economical, andfuel diversification are also mentioned as reasons foradditional capacity.
In the past, the construction of electrical generatingcapacity was the most common means of meetinggrowth in demand. Electric utilities now rely on avariety of supply-side and demand-side resources tomeet their additional capacity requirements. Theseinclude:
• the construction of additional generatingcapacity
• non-utility generation (cogeneration andsmall power production)
• demand-side management (includingconservation programs, load managementprograms, and strategic rate design)
• purchased power from other utilities
• efficiency improvements in generation,transmission, and distribution systems
• repowering and refurbishment of oldgenerating units
While all aspects of the resource planning processare important, certain functions are given particularattention by the staff. For example:
• Estimates of self-generation are veryimportant where large industrial customershave significant thermal energy needs.
• Power purchases from qualifying facilitiesmay offer unique opportunities for costsavings.
• Cost-effective DSM may delay the need forcapacity additions.
• Power purchases from other utilities willreduce surplus capacity in Texas and maylower costs.
• Consideration of environmental impacts mayresult in a more desirable allocation ofelectrical resources and a cleanerenvironment.
The process of preparing a resource plan will varyacross utilities. However, certain characteristics andactivities are so fundamental that we expect them to bean integral part of each utilities resource planningactivities. They include: the estimation of futuredemand, a projection of future fuel prices, acomprehensive evaluation of non-utility generationincluding customer self-generation, cogeneration andpurchases from other utilities, and a systematicexamination of emerging energy efficient technologiesand demand-side management options. Finally, theprocess should result in an integrated resource planthat embodies the activities just outlined. Integratedresource planning is crucial if a systematicinvestigation of all feasible and reasonable supply anddemand-side alternatives are to be evaluated. This isamong the reasons the Commission supports theintegrated resource planning approach.
THE COMMISSION'S BIENNIAL FORECAST
Certain electric utilities in Texas must file data forpeak demand forecasting, capacity resource planning,energy efficiency programs, and avoided energy andcapacity costs every two years. These filings are:
• Load and Capacity Resource Forecast Filing• Energy Efficiency Plan Filing• Standard Avoided Cost Filing
Staff relies on in-house expertise and otherresearch and consulting firms to supplement thesedata. These filings form the basis of the Commission'sbiennial statewide electric energy plan.
PREPARATION OF THE STATEWIDE ENERGYPLAN
The Commission staff relies on the above-mentioned filings to prepare the Commission'sindependent statewide electric forecast every twoyears. The report referred to as the "Forecast Report"provides resource plans for thirteen major generatingutilities' service areas. The 1992 Forecast Report willbe completed in the last quarter of 1992.
Staff prepares independent sales and peak demandprojections, demand-side management impactestimates, forecasts of self-generation by industrialcustomers and available cogeneration power toutilities, potential economic power transactions amongutilities, fuel forecasts, capital cost estimates, andcapacity expansion plans for every major generatingutility in Texas. A detailed examination of thirteenmajor generating service areas in Texas forms the
72
basis of the statewide electric energy plan presented inthe Forecast Report.
A draft report is then sent to electric utilities andother interested parties for comments. The reviseddraft report, the comments received, and the staffsreply to comments are then presented to theCommission for its review and final approval. Thefinal report is submitted to the Governor.
INTEGRATED RESOURCE FORECASTING ANDPLANNING MODELS
To choose the best combination of availabletechnologies and alternative resources, theCommission staff needs to have the proper analyticaland technical tools to evaluate the resource plansproposed by electric utilities and, if necessary, todevelop independent resource plans. With thisobjective in mind, the Commission has contracted withan outside source that collaborates with staff on theForecast Report. The Center for Energy Studies (CES)at The University of Texas at Austin develops modelsto analyze residential conservation program impacts.CES is also implementing production costing andresource planning models. These efforts will enhancethe staffs ability to evaluate the system operations andresource planning activities of the utilities.
In addition, the Commission has engaged EnergyManagement Associates (EMA). Their productioncosting and resource planning models will enhancestaffs ability to monitor the utilities' future generatingexpansion decisions.
Access to the state-of-art production costing andresource planning models has resulted in betterintegration of the demand-side and supply-side optionsand enhanced the Commission staffs effort to establisha thorough and comprehensive integrated resourceplanning capabilities. The 1992 statewide electricenergy plan will rely heavily on these models.
UTILITIES' RESPONSES TO THE FORECASTREPORT
A review of the last four Forecast Reports and theutilities' resource plans filed after each report indicatesthat utilities generally follow most of therecommendations made by the Commission staff ineach statewide electric energy plan. The 1991 Loadand Capacity Resource Forecast Filing indicatesacceptance of several Commission recommendationsmade in the Long-Term Electric Peak Demand andCapacity Resource Forecast for Texas. 1990. whichinclude:
TU Electric followed the staffrecommendation to defer both units of TwinOak (750 MW each). In addition, followingthe recommendation of staff, Forest GroveUnit 1 (660 MW) was deferred to the year2000.
HL&P followed the staff recommendation toreduce its target reserve margin from 20percent to 18 percent.
Staff recommended deferral of bothMalakoff Units (645 MW each). HL&P nowtilans the units to serve peak demand in 2005and 2007.
Staff recommended 301 MW of conservationby the year 2000. HL&P subsequentlyscrapped DSM plans to increase peakdemand by 421 MW and now plans todecrease peak demand by 269 MW by year2000.
Based on staff recommendations, CPL, CPS,LCRA, COA, and BEPC deferred somepreviously proposed additions to theircapacity.
THE USE OF THE COMMISSION'S FORECASTREPORT
The Forecast Report is the only forum in whichindividual utility service area capacity resource plansare integrated into a statewide plan. The report is avital document which is used in a variety ofCommission proceedings. The Commission'sStatewide Energy Plans adopted in 1986 and 1988have been used by the Commission staff in more thanfifty proceedings. The Commission staff also relied onthe 1990 Forecast Report in several proceedings,including the recently filed three Notice of Intent(NOI) applications for about 3,000 MW of generatingcapacity.
The Statewide Energy Plan serves as a referencepoint for staff testimony in all major proceedings,including rate cases, prudence dockets, fuel factorcases, certification dockets (NOI/CCN for newgenerating units), and avoided cost dockets.
Furthermore, the Statewide Energy Plan provides avalidity check for all electric forecasting efforts of theState's major generating utilities. In addition, itprovides a measure of the future reliability of theelectric power system in Texas.
Finally, the Statewide Energy Plan is a uniquesource of electric industry data and projections to thepublic, including projections of future electricity prices*o different rate classes.
73
PLANNING ISSUES
The Commission staff predicts that presentgenerating reserves, including plants underconstruction, will provide sufficient capacity forseveral years. Because annual growth in peak demandis projected to average 2.55 percent over the next tenyears, additional capacity should be needed in the late-1990s. When, how much, and what type of capacitymust be constructed are disputed because ofuncertainty about the future.
While there are many important issues in thepreparation of a utility's electric resource plan, theCommission staff will address a few important ones inthe next Commission Forecast Report (Forecast '92).These planning issues are briefly described in thefollowing subsections.
STRATEGIC RATE DESIGNThere is an emerging recognition that rate design
can be used as a powerful resource planning tool.Tariffs such as instantaneous interruptible contracts,time-of-day structures, real-time pricing tariffs,seasonal rate structures, load retention tariffs,economic development incentive tariffs, and specialblocking structures can have a significant impact onthe quantity and timing of electricity consumption.Rate design can thus be considered a resource planningtool because it affects consumption patterns which, inturn, influence generation requirements.
In response to the Commission's request, majorgenerating utilities reported on the uses and impact oftariffs which have a significant capability to fosterefficiency and improve the system economics. It isapparent to the Commission staff that only a fewutilities are making an effort to increase the efficiencyof energy usage or improve the economics of theutility system through the use of rate design. TheCommission staff is encouraging utilities to lookseriously into this powerful tool to meet their needs forpower. (For more details, please see the paper byMessrs. Jeff Rosenblum and Richard House on the"Strategic Rate Design: The Role of IndustrialTariffs.")
DEMAND-SIDE MANAGEMENTDemand-side management program review at the
Public Utility Commission of Texas arose out of the1983 amendments to the PURA where utilities wererequired to consider conservation in load forecastingand as an alternative to new generating capacity. TheDSM analysts performs three primary tasks:
review utility energy efficiency goalsn selection criteria, and progracriteria, and program
d t h dprogram ,evaluation data and methods
• perform cost-benefit analysis of DSMprograms and make recommendations onprogram design and implementation
• prepare short- and long-term DSM programimpact forecasts
The latter two tasks rely on models developed bythe Commission staff or the Electric Power ResearchInstitute (EPRI). True conservation programs (whichreduce electricity consumption significantly) are scarcebecause most utilities are concerned with the loss ofrevenues associated with programs which conserveenergy usage throughout the year.
Following staff recommendation, electric utilitieswill rely on 1,071 MW more active and passive DSMsavings over the next ten years than stated just twoyears ago. The new utility DSM forecast for the stateis almost identical to the DSM savings recommendedby staff. TU Electric with 1,283 MW of projectedsaving accounts for more than half of savings forecaststatewide. Central Power and Light Companyaccounts for 296 MW of saving over the next tenyears. Smaller but more active utilities in DSMactivities, such as City of Austin Electric UtilityDepartment, the Lower Colorado River Authority, andBrazos Electric Power Cooperative account for 227MW, 113 MW, and 104 MW of savings, respectively.
RENEWABLE RESOURCESRenewable resources with significant potential in
Texas, such as solar and wind technologies, have notreceived much attention by electric industry in Texas.Similarly, the Commission staff has not devoted timeand resources to investigate these alternative energysources. Consequently, while renewable resources,including hydropower, account for 9 to 10 percent ofdomestic energy supplies in the United States, theirshare in Texas is well below 1 percent.
The abundance of oil and gas in Texas has been areason for lack of interest to these renewableresources. However, there are some utilities that canor soon will be able to rely on these alternativeresources. The Commission staff is working in thisarea and expects to address these alternative resourcesin its resource planning activities and testimony beforethe Commission.
COGENERATION AND BULK POWERTRANSACTIONS
The State of Texas has a policy to encourage theeconomic production of electricity by qualifying
74
cogenerators. Given the increased level of activity bycogenerators in proceedings before the Commission, itis extremely important that the Commission staff isadequately equipped to handle the controversial issuesthat will be brought before it to ensure fair andimpartial decisions in the public interest.
Texas ranks among the highest in cogenerationsupplies with over 7,000 MW of installed capacity andabout 1,000 MW under construction or planned.Currently, ERCOT utilities have 3,121 MW of firmpurchase contracts with cogenerators, which amountsto about 5 percent of total generating capacity. In1991, cogenerators (firm and non-finn power)delivered about 23 million MWH, 11 percent of totalutility generation, into the transmission grid.
With regard to cogeneration power, TU Electricwith 1,841 MW and HL&P with 945 MW led otherutilities in the amount of cogeneration powerintegrated into their electrical system in 1991. Texas-New Mexico Power followed, receiving over 335 MWof cogeneration power. In contrast, cogenerationpower is not utilized by most other utilities in Texas.
TU Electric and HL&P have projected over 70percent reduction on purchases from cogenerators overthe next ten years (425 MW and 270 MW in year2001, respectively). This is in contrast to theCommission staff projected increases in the level ofpurchased power from cogenerators by these utilitiesover the next ten years (2,380 MW and 1,620 MW inyear 2001, respectively).
Statewide, utilities project 1,007 MW ofcogeneration power integrated into their system in year2001 compared to over 5,000 MW recommended bythe Commission staff. The past trend indicates that thelevel of reliance on cogeneration power will remain asa major disagreement between the staff and utilities.
The cogeneration-related issues are very broad,ranging from transmission access to determination ofavoided costs. And these issues will become evenmore important in the future due to the projectedelimination of surplus capacity in Texas over the nextfew years.
TARGET RESERVE MARGINSThe target reserve margin is one of the factors
which affects the need for additional capacity. Targetreserve margin is one measure of system reliability.Target reserve margins may vary from year to yearbased on the generation mix, planned capacityadditions, and other system characteristics. Statewide,the addition of 1 percent to the target reserve margin(for example from 15 percent to 16 percent) wouldresult in the addition of one 600-MW unit to the state's
generation capacity (about 3/4 of a billion dollars ofinvestment).
It is clear, therefore, that the determination ofreserve margins is an important task in thedevelopment of integrated resource plans for utilities.Rather than staying with some arbitrary numbersdeveloped many years ago, utilities must look foroptimal target reserve margins that result from abalance between the marginal cost of outage tocustomers and the marginal value of additionalcapacity needed to eliminate the outage in question.
In response to the Commission staff, major utilitiesfiled their studies with regard to the level of optimalreserve margins. HL&P followed the staffrecommendation to reduce its target reserve marginfrom 20 percent to 18 percent. However, most of theutilities relied on the conventional loss uf loadprobability (LOLP) approach rather than taking intoconsideration the reasonableness of the cost imposedon the electric utility customers.
Staff will continue to encourage a balancedapproach in determination of optimal reserve marginsbetween the marginal cost of outage to customers andthe marginal value of additional capacity needed toeliminate the outage in question.
ENVIRONMENTAL IMPACTSThe 1990 amendments to the Clean Air Act may
have far-reaching consequences for the state'sgenerating utilities. The Commission staff has alreadybegun to investigate the possible consequences and toprepare testimony before the Commission regardingthese amendments. Fortunately, no generating units inTexas are affected by the Clean Air Act Amendmentsuntil Phase 2 takes affect in the year 2000. Texas hasrelatively low SO2 emission rates because a substantialportion of its generation is natural-gas-fired. Inaddition, a large number of the existing coal andlignite units have control devices installed.
A growing number of states are examining theresidual emissions — that is, the impact of the pollutionwhich is permitted under the law. Texas is amongthose states which is taking an interest in this issue. InMay 1991 the Commission adopted a rule governingthe first stage of its two-step power plant certificationprocess. Under this new rule, the environmentaleffects beyond the levels specified by the Clean AirAct Amendments must be considered. As part of theapproval process, utilities must provide the followingcost information:
environmental costs and benefits, andany cost and benefits accruing to personsother than the utility and its

ratepayers^., environmental, socialand health [Substantive Rule4
The Commission has made it clear thatenvironmental externalities must be quantified byelectric utilities. While some parties believe thatquantification of emissions will suffice, theCommission has to state whether a dollar value mustbe assigned to these emission levels. Dollar valuesallow a simple comparison of the total cost ofalternatives but the Commission is not interested inspeculative studies or costly analyses based onunreliable science. The Commission believes that asignificant amount of reliable information exists andthat this information will illuminate the dollar costs ofenvironmental externalities.
The issue of environmental externalities and itsquantification has already appeared in differentproceedings before the Commission. This is animportant issue in integrated resource planning and theCommission staff has already begun to investigate it.We will seriously look at it in our 1992 ForecastReport.
VII. SUMMARY
Integration of demand-side and supply-sidealternatives has begun to occur in recent certificationproceedings. However, while utilities are increasinglywilling to adopt DSM programs that shift load withoutaffecting the level of energy sales, they are reluctant tocommit themselves to programs that conserve energy.As a result, conservation alternatives are not fullyconsidered and the potential for deferring capacitythrough DSM programs is largely untapped.
A similar reluctance to incorporate cogeneratedpower into their electrical system may be seen amongsome utilities. Such reluctance may explain why onlya small portion of potential cogeneration power withinthe state is utilized by the electric industry. Lack ofincentives for utilities in having more cogenerationpower in their system may be a significant factor intheir reluctance. The application of incentives,designed to insure that all sources of power receive afair hearing by the utilities, will begin to play anincreasingly important role in the stafl>' efforts.
While qualifying facilities will play the mostsignificant role in the coming years, there are otherresources which deserve equal attention. Competitivepower markets in Texas will be influenced byincreased demand-side management, the developmentof renewable resources, and the greater use ofimproved rate designs. The Commission, through itsrule making, is planning to address the utilities'concerns and facilitate more acceptance of alternativeresources.
In the preparation of the 1992 Forecast Report, theCommission staff will insure that alternative resources,environmental impacts of different technologies, andinnovative rate design options are considered.Furthermore, in different proceedings before theCommission, staff will investigate whether utilitieshave analyzed all reasonable supply-side and demand-side resources in their integrated resource planningactivities. No certificate of power plant constructionwill be approved unless it is shown that otherresources are fully considered and cannot technically,as well as economically, provide the needed power.
76
STREAMLINING THE CERTIFICATION PROCESS FOR NEW POWERPLANTS IN TEXAS
Nat TreadwayEconomic Analysis Section
Electric DivisionPublic Utility Commission of Texas
ABSTRACT
The 1983 amendments to the Public Utility RegulatoryAct require electric utilities to receive Public UtilityCommission of Texas (Commission) approval in tworegulatory proceedings prior to the construction of newpower plants. Seven "notice of intent" applications andthree power plant "certificate of convenience andnecessity" applications have been filed with theCommission since 1983. The significant resource planningissues which have arisen in these proceedings aresummarized and the Commission's recent and pending rulechanges are discussed. Some features of a comprehensiveintegrated resource planning process are discussed toilluminate the current debate. The author suggests ways tostreamline the current process — with or without changes tothe statute ~ if all interested parties are willing to committo a long-term planning process.
INTRODUCTION
Several 1983 amendments to the Texas PublicUtility Regulatory Act (PURA) increased regulatoryoversight of electric utility forecasting and planningactivities.1 The statute includes a biennial demandforecast and resource plan filing requirement forgenerating utilities.2 The Commission is required toprepare and transmit to the Governor a statewideelectrical energy plan which considers conservation,load management, and alternative energy resources.3
The Commission must also encourage cogenerationand small power production.4 In setting a .'tility's rateof return on invested capital, the Commissionconsiders compliance with this statewide plan.5
Electric utilities are required to receive regulatoryapproval of new power plants in two proceedings.6 Itis this two-step power plant certification process which
is the focus of this paper. Under current law, a utilitymust first obtain preliminary approval of the proposedpower plant in the Notice of Intent (NOI) proceedingand then prove that the proposed power plant is thebest option in the Certificate of Convenience andNecessity (CCN) proceeding. The Legislature createdthe NOI because in the early 1980s a CCN applicationwas denied after several parties had expended largesums of money exploring and defending a proposedgeneration facility.7 The 1983 amendments wereintended to eliminate frivolous and costly power plantcertification proceedings.
Seven NOI applications and three subsequentpower plant CCN applications have been filed with theCommission since 1983. To the extent that theseapplications are representative, the NOI proceedinghas been a success. Frivolous CCN applications havethus far been avoided; although it is impossible to statewhether this is a direct outcome of the statute. Someparties to these cases contend that the two-step processis burdensome.
The remainder of this paper provides a summary ofthe significant resource planning issues which havearisen in ten NOI and CCN proceedings. The relevantCommission activities in 1990 are then summarized.The Commission's recent and pending rule changes arediscussed. Next, some key features of acomprehensive integrated resource planning processare discussed to illuminate the current debate. Theauthor then suggests ways to streamline the currentprocess — with or without changes to the statute — ifall interested parties are willing to commit to a long-term planning process. Public involvement at an earlystage should improve planning and reduce thefrustrating and costly disputes which are currentlydecided by the Commission in NOI or C.CNproceedings.
The views expressed in this paper are those of the authors and do not necessarily reflect the positions ofthe Public Utility Commission of Texas
77
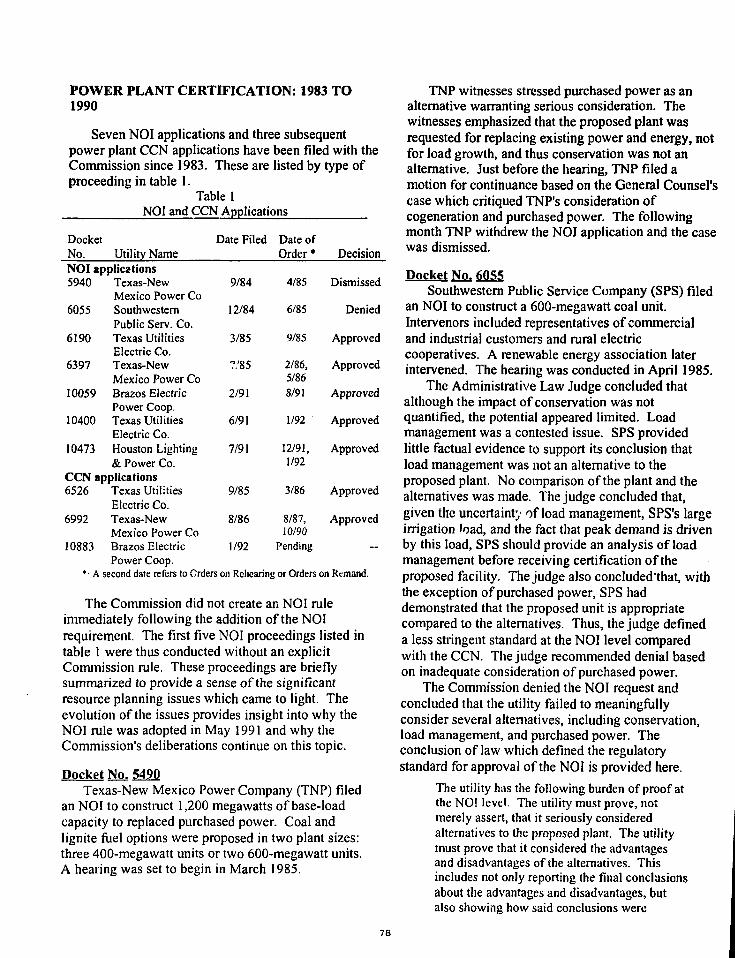
POWER PLANT CERTIFICATION: 1983 TO1990
Seven NOI applications and three subsequentpower plant CCN applications have been filed with theCommission since 1983. These are listed by type ofproceeding in table 1.
Table 1NOI and CCN Applications
DocketNo. Utility NameNOI applications5940
6055
6190
6397
10059
10400
10473
Texas-NewMexico Power CoSouthwesternPublic Serv. Co.Texas UtilitiesElectric Co.Texas-NewMexico Power CoBrazos ElectricPower Coop.Texas UtilitiesElectric Co.Houston Lighting& Power Co.
CCN applications6526
6992
10883
Texas UtilitiesElectric Co.Texas-NewMexico Power CoBrazos ElectricPower Coop.
Date Filed
9/84
12/84
3/85
7/85
2/91
6/91
7/91
9/85
8/86
1/92
Date ofOrder*
4/85
6/85
9/85
2/86,5/868/91
1/92
12/91,1/92
3/86
8/87,10/90
Pending
Decision
Dismissed
Denied
Approved
Approved
Approved
Approved
Approved
Approved
Approved
—
• A second date refers to Orders on Rehearing or Orders on Remand.
The Commission did not create an NOI ruleimmediately following the addition of the NOIrequirement. The first five NOI proceedings listed intable 1 were thus conducted without an explicitCommission rule. These proceedings are brieflysummarized to provide a sense of the significantresource planning issues which came to light. Theevolution of the issues provides insight into why theNOI rule was adopted in May 1991 and why theCommission's deliberations continue on this topic.
Docket No. 5490Texas-New Mexico Power Company (TNP) filed
an NOI to construct 1,200 megawatts of base-loadcapacity to replaced purchased power. Coal andlignite fuel options were proposed in two plant sizes:three 400-megawatt units or two 600-megawatt units.A hearing was set to begin in March 1985.
TNP witnesses stressed purchased power as analternative warranting serious consideration. Thewitnesses emphasized that the proposed plant wasrequested for replacing existing power and energy, notfor load growth, and thus conservation was not analternative. Just before the hearing, TNP filed amotion for continuance based on the General Counsel'scase which critiqued TNP's consideration ofcogeneration and purchased power. The followingmonth TNP withdrew the NOI application and the casewas dismissed.
Docket No. 6055Southwestern Public Service Company (SPS) filed
an NOI to construct a 600-megawatt coal unit.Intervenors included representatives of commercialand industrial customers and rural electriccooperatives. A renewable energy association laterintervened. The hearing was conducted in April 1985.
The Administrative Law Judge concluded thatalthough the impact of conservation was notquantified, the potential appeared limited. Loadmanagement was a contested issue. SPS providedlittle factual evidence to support its conclusion thatload management was not an alternative to theproposed plant. No comparison of the plant and thealternatives was made. The judge concluded that,given the uncertainty of load management, SPS's largeirrigation load, and the fact that peak demand is drivenby this load, SPS should provide an analysis of loadmanagement before receiving certification of theproposed facility. The judge also concluded'that, withthe exception of purchased power, SPS haddemonstrated that the proposed unit is appropriatecompared to the alternatives. Thus, the judge defineda less stringent standard at the NOI level comparedwith the CCN. The judge recommended denial basedon inadequate consideration of purchased power.
The Commission denied the NOI request andconcluded that the utility failed to meaningfullyconsider several alternatives, including conservation,load management, and purchased power. Theconclusion of law which defined the regulatorystandard for approval of the NOI is provided here.
The utility has the following burden of proof atthe NOI level. The utility must prove, notmerely assert, that it seriously consideredalternatives to the proposed plant. The utilitymust prove that it considered the advantagesand disadvantages of the alternatives. Thisincludes not only reporting the final conclusionsabout the advantages and disadvantages, butalso showing how said conclusions were
78
reached. The utility must prove theappropriateness of the proposed plant byshowing that it is preferable to the availablealternatives. The utility must also provecompatibility of the plant with the most recentlong-term electrical energy forecast developedby the Commission. (Final Order, COL No. 6.)
The word "preferable" is significant. The utility'sburden of proof was set forth as an obligation todemonstrate that the proposed plant is better thanalternative energy sources and conservation and loadmanagement. This conclusion of law was used in laterexaminer's reports.
Docket No. 6190Texas Utilities Electric Company (TU Electric)
filed an NOI for 960 megawatts of gas-fired peakingcombustion turbines in March 1985. A hearing on themerits was set for July 1985. The need for reliablepeaking power was emphasized by all parties. TheHearings Examiner recommended approval of the NOIand relied on the conclusion of law cited above. TheCommission adopted the examiner's report with littlediscussion and without modification.
Docket No. 6397TNP revisited the NOI procedure with the filing of
an application for 600 megawatts of base-load powerto replace existing purchased power. The four 150-megawatt units would bum Texas lignite or other fuelsin circulating fluidized beds. TNP witnesses statedthat the application united innovative technology andcommitments by a consortium which would financeand construct the units. Several representatives ofindustrial customers, cogenerators, and another utilityintervened. A hearing commenced in October 1985.
The Hearings Examiner stated that TNP need onlyshow that conservation and load management cannotalleviate or defer the need for the proposed plant, notwhether it has satisfied other Commissionrequirements to investigate conservation programs. Heconcluded that conservation savings would not helpdefer the need for base-load generating units. Theexaminer relied again on the conclusion of law used inDocket No. 6055 to define the standards for an NOIdecision. The examiner recommended denial of theNOI based on inadequate consideration ofcogeneration. The Commission overturned thatrecommendation on a two-to-one vote. The citedconclusion of law was modified to includeenvironmental impact, health and safety impacts,financial risks, and fuel diversity and to stresssuitability when compared with alternatives rather than
preferability to alternatives. (In this case these factorssupported the TNP proposal.) On rehearing theCommission again modified this conclusion of law andadopted the following wording:
The utility must prove the appropriateness ofthe proposed plant by showing that it is suitablewhen compared with the available alternatives.Considerations in determining appropriatenessmay include not only economics, but also suchfactors as environmental impact, health andsafety risks, financial risks to both the utilityand its ratepayers, and reliability (including fueldiversity). (Order on Rehearing, COL No. 4.)
On its face, the regulatory standard had beenlowered by stressing that the proposed plant was"suitable" rather than "preferable" to the alternatives.It is interesting to note, however, that in her dissentChairman Rosson stated t»;at the addition of the PURASection 54(c) factors — such as environmental, health,and safety impacts - made the standard in an NOIessentially the same as a CCN. (That is, in her opinionthe new wording set a higher regulatory standard.)
Docket No. 6526TU Electric filed its CCN for peaking combustion
turbines in September 1985. The application wasuncontested. A hearing convened in January 1986.The reliability of the system in West Texas wasdetermined to be a critical issue. The AdministrativeLaw Judge recommended approval of the application.The Commission adopted the judge's report withoutmodification and approved the CCN.
Docket No. 6992TNP filed its CCN for the four 150-megavvatt base-
load units in August 1986. Interveners includedcogenerators, another utility, and industrial consumers.The hearing began in February 1987. Conservationand cogeneration power were significant issues in thisproceeding. An argument was made that TNP alreadyhad a contract with one qualifying facility and thatgreater reliance on this source of power couldcompromise the reliability of TNP's system. TheAdministrative Law Judge recommended approval ofthe application. In August 1987 the Commission votedtwo-to-one to approve all four units subject to certainconditions.
In early 1990, the courts remanded the case to theCommission for a final decision. TNP withdrew itsrequest for units 3 and 4. The Commission approved aCCN for units 1 and 2 in October 1990.
79
Docket No. 10059Brazos Electric Power Cooperative (BEPC) filed
its NOI application for approval of 208 megawatts ofnatural gas-fueled peaking capacity in February 1991.The Commission staff criticized the utility forinadequate consideration of cogeneration, demand-sidemanagement programs, and purchased poweralternatives. Although the new NOI rule did not applyto this proceeding, the staff used the regulatorystandard of "reasonableness" from the proposed NOIrule in formulating its recommendation. Staff foundthe proposed units to be reasonable and recommendedseveral studies which would be crucial to any analysisconducted during a CCN proceeding.
The Hearings Examiner approved the applicationand stated in her report that the regulatory standardsestablished by the Commission in Docket No. 6397applied to this case. On a two-to-one vote, a finalorder approving the application was issued by theCommission in August 1991. Commissioner Greytok'sdissent focused on the utility's premature award of acontract for generating turbines and the process ofsoliciting bids for power from qualifying facilities.
Docket No. 10400TU Electric filed its NOI application in June 1991.
The Company sought approval 2,162 megawatts ofcapacity including a coai plant and natural gas-fueledsimple-cycle and combined-cycle combustion turbines.The application brought intervention from industrialcustomers and their representatives, an environmentalgroup, citizen groups, and a renewable energyorganization. The hearing explored the alternativesincluding demand-side management and purchasedpower. The parties differed as to the meaning of theportion of the new NOI rule which addresses thequantification of externalities.
The Administrative Law Judge recommendeddenial of the application on the grounds thatTU Electric failed to reasonably consider theenvironmental costs and benefits or any cost andbenefits accruing to persons other than the utility andits ratepayers. The Commission overturned the reportand approved the application on a two-to-one vote. Inhis dissent, Chairman Gee emphasized that the need toadequately consider externalities is required by theCommission's recently adopted rule.
Docket No. 10473Houston Lighting and Power Company (HL&P)
filed its NOI application for 598 megawatts of capacityin July 1991. The Company sought NOI approval for
the certification of a cogeneration plant and therefurbishment of four natural gas-fUeled generatingunits.
The Hearings Examiner recommended approval ofthe application and recommended against requiringcertain studies urged by the General Counsel. TheCommission unanimously approved the application byHL&P and overturned the examiner's recommendationagainst additional studies. The Commission identifiedthose issues which warrant a detailed examination inthe certification proceeding, particularly regarding howenvironmental costs must be considered in the resourceplanning process.
In addition, the Commission initiated an inquiryinto three significant policy issues: a) demand-sidemanagement, b) purchased power (including purchasesfrom qualifying facilities), and c) environmentalexternalities. This inquiry was subsequently combinedwith a request for rulemaking.8
Summary of Evolving StandardsThe Commission has dealt with the definition of an
appropriate regulatory standard for NOI proceedingssince the creation of the NOI in 1983. During 1985and 1986 the Commission made decisions on a case-by-case basis. The standard during that period wassummed up in the conclusions of law cited above. Theversion which was used twice (in Docket Nos. 6055and 6190) was modified for Docket No. 6397. Thedifference between these two standards is related to theheight of the regulatory hurdle (preferable vs. suitable)and to the scope of the criteria used to make adecision. Docket No. 6397 expanded the scope toinclude environmental, health, and safety impactswhich had previously been left for consideration inCCN proceedings.
It is useful to mention here that in the 1980s,regulatory oversight of resource plans was comprisedof the biennial filing requirement, the setting ofavoided costs, a review of demand-side managementprograms, and the two-step certification process forpower plants. Public intervention in the proceedings isrelatively costly and generally limited to a criticism ofpast planning decisions. Public input into discussionsregarding the regulatory standard for the NOI has thusbeen limited.
With the end of the recession in Texas and the startof a new decade the Commission took on the task ofwriting a rule for NOI proceedings. Before exploringthe standard which came out of that process it isinstructive to look at several related events which tookplace in 1990.
80
1990: A YEAR OF TRANSITION
From a resource planning perspective the mostimportant regulatory activity of 1990 was thedevelopment of a draft NOI rule in April 1990. Adiscussion of that event is preceded by a chronology ofother important events of 1990 which affect resourceplanning. Several of these were the result of theCommission staffs deliberate process to improve thequality of forecasting and planning in Texas. Othersarose during the course of regulatory work, that is tosay in response to utility activities.
Avoided Cost ProceedingsDuring the 1980s avoided costs were set after a
settlement conference in which utilities, the staff, andrepresentatives of industrial customers agreed on theavoidable unit, the methodology for calculation ofavoided costs, and the terms and conditions of astandard contract for power purchases from qualifyingfacilities. In Docket No. 9230, however, HL&Pinsisted that refurbishment of natural gas-fueled unitsshould determine the avoided costs. Others could notagree. Thus 1990 marked the first year in which theutility, Commission staff, and intervenor groups couldnot agree on the avoidable unit. This case marks thebeginning of a new, more competitive era betweenutilities and non-utility generators.
Docket No. 8425 Order on Sales PromotionIn June 1990 the Commission ordered HL&P to
cease seven promotional demand-side managementprograms and to emphasize the conservation ofresources. HL&P's energy efficiency plans filed inDecember 1987 and 1989 projected the use ofdemand-side management to increase peak demandmore than 400 megawatts in the 1990s. The programsfocused on the use of electricity through fuel switchingand new uses, typically without regard to theefficiency of the promoted equipment. As a result ofthe June 1990 Order, HL&P is now pursuing a modesteffort to reduce peak demand.
Docket No. 9300 Conservation BonusCommission staff recommended an upward
adjustment to TU Electric's rate of return on equity toprovide an incentive for peak-demand-reducingprograms. This was the first such use of Section 39(b)of the PURA. The Commission adopted thisrecommendation as part of the Final Order in DocketNo. 9300 in 1991.
Energy Efficiency Plan FilingsDemand-side management program reporting prior
to late 1989 lacked significant detail. The need fordetail results from the Commission's stated policyconcerns regarding fuel switching and the promotionof electricity use. The energy efficiency plansexamined in 1990 contained much more informationthan previous filings on the current and projectedsaturation of appliances, the promoted equipmentefficiency levels, and the likelihood of fuel switchingfrom natural gas to electricity. Electric utilities arenow expected to increase the sophistication of theirmodeling efforts to address these policy concerns.
Commission's Forecast ReportThe Commission's official statewide plan was
prepared in draft form in 1990 and included arecommendation that four critical studies be preparedby major generating utilities: a) the role of strategicrate design in resource planning, b) the implications ofthe 1990 Clean Air Act Amendments, c) the potentialfor increased economical power transactions within theElectric Reliability Council of Texas, and d) theappropriate reserve margins for capacity expansionplanning. The studies recently provided to theCommission will aid in the development of the 1992statewide plan.
Center for Energy Studies ContractThe Commission made a move toward increasing
the modeling capabilities of its staff in 1990. Acontract with the University of Texas at Austin Centerfor Energy Studies initiated a resource planning projectwith a simple objective: to put sophisticated resourceplanning models into the hands of the staff. Currentplans include implementation of the Electric PowerResearch Institute's Load Management StrategyTesting Model (LMSTM) and the Electric GenerationExpansion Analysis System (EGEAS), and EnergyManagement Associate Inc.'s PROMOD andPROSCREEN/PROV1EW planning models.
NOI Rule ProposedThe Commission staff prepared a draft NOI rule
and issued a committee report in April 1990. The staffcommittee was assembled when it became evident thatthe Commission needed a formal rule to deal with theanticipated NOI applications. An important issuediscussed by the staff was the regulatory standard forthe approval of NOI applications. Too high a standardwould turn the NOI proceeding into a "CCN-type"proceeding in which the stakes and costs are high.Too low a standard would make a mockery of the two-
step process established by the Legislature. Staffrecommended that the proposed power plant should bereasonable when compared to the alternatives. Thisrule was proposed to the Commission in late 1990 andwas adopted in May 1991.
RECENT AND PENDING RULE CHANGES
The activities in the area of resource planningsince the beginning of 1991 include the adoption of anNOI rule, decisions in three NOI proceedings, and theinitiation of a formal rulemaking and inquiry intoimportant resource planning issues.
NOI Rule AdoptedThe Commission adopted Substantive Rule
23.3 l(h), the Notice of Intent rule, in May 1991. Therule brought specific language regarding the criteria forapproval of an NOI.
The commission will approve the NOI if itconcludes that the proposed plant is feasible andreasonable, is compatible with the commission's mostrecent long-term forecast, and should be given furtherconsideration in light of the alternatives. (Subst. R.23.31(h)(2).)
The rule is also specific regarding the alternativeswhich must be considered by the utility, and themethods which must be employed to examine theadvantages and disadvantages of the alternatives.
Three NOI Cases DecidedThe three NOI cases filed between February and
July 1991 were decided between August 1991 andJanuary 1992. The Commission's position on theregulatory standard for NOI proceedings is stillevolving as evidenced by the differing opinions of theCommissioners in these three cases. Both the BEPCand TU Electric cases were decided on a two-to-onevote. The regulatory standard now in effect is the onestated in the Commission's Substantive Rule 23.31,although there are some differences of interpretation.
Rulemaking and InquiryBeginning in June 1991 informal meetings were
held to explore better ways for the Commission tohandle NOI, CCN, and avoided cost procedures. As aresult of these meetings, the Texas Industrial EnergyConsumers (TIEC) proposed changes to theCommission's rules governing certification andarrangements with qualifying facilities. (SubstantiveRules 23.31 and 23.66.) The proposed rules highlightthe need for changes in the manner in which contractswith qualifying facilities are obtained and propose amore open transmission system.
In January 1992 the Commission decided topublish the proposed rules along with a series ofquestions which deal with the integrated resourceplanning process, demand-side management,purchased power, and environmental externalities.9
The public input which will result from the inquiry willlead to a three-day series of meetings at theCommission in mid-May, 1992. Alternative means ofresolving disputes will be considered as theCommission formulates its positions on these planningissues. The written responses and public forum willhelp the Commission refine the existing certificationprocess and address the role of the public in futureplanning processes.
FEATURES OF AN INTEGRATED RESOURCEPLANNING PROCESS IN TEXAS
A large number of state commissions areconsidering ways to improve regulatory oversight ofelectric utility integrated resource planning. Somestates lack the strong statutory language of the TexasPURA, yet these states are making changes throughthe rulemaking process. This portion of the paperdiscusses several features of integrated resourceplanning which are not given great importance underthe current regulatory regime in Texas. Not all ofthese features may find their way into the regulatoryprocess in Texas nor would I imply they should be.Though important, these features may not be essentialto the regulation of integrated resource planningactivities.
Public InvolvementPublic workshops and hearings on electric utility
resource plans will allow input from interested parties.Under current law, the Commission in Texas isrequired to conduct an open meeting when it considersthe adoption of its Forecast Report. Comments fromthe public are accepted; however, the open meeting isheld at the end of a two-year process. Public hearingsare not conducted on each utility's long-term resourceplan.
In this context the word "public" does notnecessarily refer to individuals. The resource planningand regulatory processes are complex and only throughan exceptional commitment of time would anindividual be able to participate. "Public" refers torepresentatives of individuals. In Texas this mayinclude environmental and public policy organizationswhich garner support from individuals or the state-funded Office of Public Utility Counsel. Theseorganizations and agencies will be able to maintain an
32

ongoing commitment of time and money to express theconcerns and interests of many individual citizens.
An alternative approach would: a) involve thepublic at a much earlier stage in periodic workshops,b) allow public access to utility planning assumptionsand data prior to important planning decisions, c)establish a record of public involvement andrecommendations, and d) permit utilities and theCommission to respond to these recommendations.Public involvement could arise spontaneously orformal procedures could be established.
A well-informed and involved citizenry will offer aunique perspective to the policy questions whichinfluence multi-million dollar investment decisions.Early and ongoing involvement of the public shouldreduce the cost of regulatory proceedings because therepresentatives of the citizens will be involved in thedecision-making process. Those who "own" a portionof a planning process will not attack the plan laterwithout risking a loss of credibility. Those groupswhich arc interested in the long-term planning processneed to maintain their credibility. An effective processof public involvement will mean that there is too muchto lose through an "eleventh-hour" attack on the utilityresource plans presented in NOI and CCNproceedings.
Plan ApprovalSome state commissions conduct hearings and
specifically approve each utility's long-term resourceplan. Further, certain states require that newgenerating facilities be part of an approved plan priorto certification. In Texas, no hearings are conductednor is specific action taken on each resource plan. Autility may change its resource plan just prior to filingan NOI application and merely demonstratecompatibility with the approved statewide plan.
Resource plan approval and a requirement that aproposed power plant is in an approved plan prior toan NOI application or certification would providestability to the resource planning process, reduceutility "gaming" and increase public confidence in theregulatory process. Approval of a plan wouldrepresent a commitment to that plan and wouldeliminate "eleventh hour" changes to the plan.Utilities are likely to claim that plan adoption wouldreduce planning flexibility. Plan adoption requirescareful consideration but it appears that it would givegreater meaning to the long-term planning process.
Plan ImplementationMany states require utilities to implement the
approved resource plan. The approved resource plan
contains both long-term goals and a short-term actionplan with specific near-term objectives. In Texas,utilities are not required to implement the statewideplan and may change their plans dramatically fromyear-to-year. In major rate cases and CCNproceedings utilities in Texas are required todemonstrate the compatibility of their plan with thestatewide plan. The Commission may adjust a utility'srate of return or deny certification of new generatingfacilities if compatibility is not demonstrated. Theadvantages and disadvantages of requiring planimplementation are similar to those cited under "planapproval" above.
Other Planning IssuesSeveral other features of an integrated resource
planning process are worth exploring briefly.Regulatory barriers eliminated and incentives
provided. Current regulatory practice providesfinancial incentives for some resource alternatives andsets up barriers to others. There is general agreementthat the financial incentives differ for traditional powerplant investments, purchased power, small powerproduction, and demand-side management. Thecurrent debate at many state commissions deals withwhether to make power purchases and demand-sidemanagement expenditures as profitable for electricutilities as the construction of new generatingfacilities. This issue will be an important one as theTexas Commission considers changes to the currentpractice.
Competition. Many states have adopted acompetitive bidding process for resource procurement.In Texas the establishment of an avoided cost ceilingand "competitive negotiations" between utilities andqualifying facilities may be sufficient to attract andretain a large amount of reasonably-priced, reliable,cogenerated power. Some people believe that biddingmay lower the cost of purchased power. Demand-sidebidding has not been pursued in Texas. TheCommission staff generally supports the notion ofincreased competition as long as the reliability of thesystem is not compromised. Federal and state actionsmay affect the manner in which the issues areresolved.
Externalities. A number of states have decided toformally consider environmental externalities in theresource selection process. In Texas the statuterequires the consideration of the environmentalintegrity of new generating facilities and the new NOIrule requires the quantification of externalities. Thereis likely to be continued debate over the implications
83
of assigning costs to the external effects of powerplants.
STREAMLINING THE PROCESS
The current law in Texas requires a two-stepregulatory process for the certification of new powerplants. During the past eight years there has been adebate regarding the role of the first step, the NOI.Some believe that the Commission's practice hasresulted in two CCN-type proceedings with theassociated waste of time and money. Others contendthat the regulatory hurdle for NOI proceedings is toolow. Some parties believe that the NOI requirement isnot needed regardless of past practice.
Whether the NOI process remains or is changed ina future legislative session is an important matter, butit may not be critical to streamlining of thecertification process. It may be possible to makeimprovements under the existing statutes as otherstates have done.
The critical improvement in the current process isthe need to involve citizen organizations earlier in theprocess. Under the present rules, an interestedindividual or a citizen organization has a limited set ofoptions for involvement in the resource planningprocess. As a practical matter in Texas, significantinvolvement must occur in one of three forums:comments at the open meeting for adoption of thestatewide plan, intervention in an NOI, or interventionin a CCN.10 All three options come late in theplanning process and intervention comes at asignificant expense. Even worse from a planningperspective is public involvement after the fact — thatis, after a plan has been established and a power planthas been constructed. Public intervention in a ratecase or prudence hearing to urge disallowance ofinvestment costs may be necessary in certain cases (forexample, construction imprudence); however,meaningful public involvement early in the planningprocess should reduce or eliminate criticism of pastplanning decisions.
The involvement of the public earlier in theprocess will require electric utilities to provide a moreopen forum as a part of the process to assess planningassumptions and perform preliminary screening ofresource alternatives. This will increase the front-endcosts of the integrated resource planning process. Inparticular, citizen organizations will have to make astaffing commitment to remain involved in theplanning process. However, by bringing potentialadversaries to the planning table early on, theregulatory costs will be reduced in certification
proceedings and the potential for prudence review ofplanning decisions will be significantly reduced. Aninvolved public will necessarily present its ideasregarding alternative energy sources and demand-sidemanagement early in the planning process. Fairtreatment of this input should reduce public criticismof planning decisions in the future.
Plan approval and plan implementation are criticalelements as well. Public involvement loses meaning ifthe Commission does not formally adopt a plan ofrequire utilities to implement the adopted plans. Abalanced process of public involvement, plan adoption,and plan implementation will bring the utility andinterested parties to the table and insure that nocredible party will later change the plan or attack theplanning process. It may be important for theCommission to monitor this interaction.
The Commission has taken several steps recentlyto improve the integrated resource planning process inTexas. With the adoption of an NOI rule anddecisions in three recent NOI cases, utilities and otherinterested parties have a good sense of current law andpractice. The Commission has now started an inquiryinto these issues. By the time this paper is included inthe printed conference proceedings the inquiry processwill be well under way.
The rest of 1992 will be an interesting andhopefully highly productive time at the Public UtilityCommission of Texas. Whether changes in the rulesare an outcome of the current inquiry or not, it isapparent that increased involvement of all interestedparties will provide an education to generating utilities,customers, and regulators alike.
1 Texas Public Utility Regulatory Act (PURA), Sections 16 and54. Tex. Rev. Civ. Stat. Ann. article 1446c (Vernon's 1980), asamended in 1983 (68th Legislature, S.B. 232).
2 PURA, Section 16(c).3 PURA, Section 16(b) and (f)- The document is referred to here
as the Forecast Report or statewide plan.4 PURA, Section 16fg).5 PURA, Section 39(b).6 PURA, Section 54(d) and 54(e).7 Two nongenerating electric cooperatives formed Texland Electric
Cooperative, Inc. with the intent of reducing their dependence onpower purchases from the Lower Colorado River Authority. TheCCN application for new generating facilities was denied after asignificant expense to the two cooperatives.
8 The inquiry questions were prepared under Project No. 10842and then combined with the Project No. 10780 request forrulemaking.
9 The rulemaking and inquiry has been designated Project No.10780. The Texas Register publication date is February 7, 1991.
10 Citizen involvement in rulemaking is ? ' c ' important but thisstatement refers to the situation urnler <ne current rules.
84
INTEGRATED RESOURCE PLANNING: A DIALOGUE WITHELCON
Nat TreadwayEconomic Analysis Section
Public Utility Commission of TexasAustin, Texas
Gary TorrentEconomic Analysis Section
Public Utility Commission of TexasAustin, Texas
ABSTRACT
The oil price shocks of the 1970s were a precursor tosome fundamental changes in the way the supply anddemand for energy is viewed. One response to the events ofthat period is the application of integrated resource planning(IRP). IRP is, principally, a regulatory prerogative designedto promote a balance between supply and demand resourcesin electricity markets. In this paper we provide a definitionof that concept and discuss two of its main features:Demand-side Management programs and environmentalexternalities. We also examine a number of positions takenby ELCON with respect to IRP and provide our responses.
The days of sustained high growth in the demandfor electricity and the relatively riskless responsesdesigned to meet that demand are long over. The oilprice shocks of the 1970s saw to that. The initial resultsof the Arab oil embargoes were higher prices, a declinein demand and many utilities facing excess capacity.This period also saw an increase in the constaiction ofnuclear powered generating plants to meet fueldiversification objectives.
A confluence of events, including rising energyprices, increasing concern with the earth'senvironmental conditions, and the failure of somenuclear projects to be deemed prudent has resulted inwhat may be called revolutionary changes in the waythe supply and demand for electricity are viewed by thepublic, industry, and regulators. We believe that thechanges we have seen, and will continue to see, haveled to a new approach to planning. This approach iscurrently referred to as integrated resource planning
(IRP).l In essence, the evaluation of alternatives tosatisfy demand and supply requirements, are requiredto address issues which go beyond the building ofgenerating units. Planning decisions would nowinclude alternative energy sources^ and demand sidemanagement. Also very important in the IRP processis the evaluation of external impacts of any planningdecision with a special focus on environmental effects.
WHAT IS INTEGRATED RESOURCEPLANNING?
Integrated resource planning (or least costplanning) requires, in part, that in satisfying thedemand for electricity all options become a potentialalternative. Furthermore, the criteria for resourceselection is the equalization of marginal social costsand marginal social benefits from the proposed action.This is hardly a contentious requirement and leavespractitioners and planning theoreticians without aquarrel.
Utility planning now is required to consider, alongwith the traditional construction of fossil fuel andnuclear plants, alternative sources of power. Andperhaps even more interesting, utilities are nowconsidering ways to reduce sales as part of theplanning process. However, rational cost-minimizingagents would be expected to consider all these optionsin the absence of exogenous pressure.
Why is the idea of IRP becoming such animportant topic if planners would, while pursuingprofits, be expected to minimize cost? The answer liesin the nature of the industry. A firm facingcompetitive pressures must least-cost plan or it will notsurvive. Utility planners do not face the same regimethat may not provide the rewards for least-costplanning that we might expect. Any exploration of
The views expressed in this paper are those of the authors and do not necessarily reflect the positions ofthe Public Utility Commission of Texas.
85
pressures that a competitive firm does^ and areprovided with a set of incentives under the currentthese issues would take us far afield but suffice it tosay: The current regulatory environment may notprovide the incentives for planners to follow thedictates of IRP. That is, some options have just notbeen viewed as realistic alternatives because they offerno financial reward or are seen as being too risky. IRPproponents seem to focus on two issues in particular.One, for a given level of comfort, activities to moreefficiently use the marginal kWh may be cheaper thangenerating that marginal kWh. For example, from asocietal perspective, it may be cheaper for a consumerto install a more efficient air-conditioner or atticinsulation than to purchase an additional kWh whichrequires the expansion of generation capacity. This isthe logic behind the notion of demand-sidemanagement (DSM) as a resource option. It may becheaper to conserve a kWh than to buy one.4
Second, many argue that various supply-sideoptions yield costs and benefits external or uncapturedby the participants in the transaction. Consider aconsumer and the utility who generates electricity witha coal plant. The coal plant emits pollutants into theair harming (or causing disutility to) individuals otherthan the consumer of electricity. The price paid by theconsumer does not account for the harm done to thosewho suffer from the pollution. The argument yields theconclusion that, from a societal perspective, the truecost of the power generated from the coal plant isunderestimated. If the harm imposed on individualsother than the consumers of power were taken intoaccount the coal plant becomes a relatively lessattractive option. It is argued that the cost of theseexternal effects (externalities) must become part of theresource cost (that is, become internalized).
Proponents of DSM and externality pricing claimthat if planners recognize conservation opportunitiesand externalities the optimal resource plans we seemay be very different than those in the past. Forexample, instead of a new plant, the utility may be ableto provide the same level of comfort to consumers bypromoting demand-side management programs. Or, ifexternalities associated with the generation of powerwith fossil fuel plants are accounted for, solar powermay become viable.
IRP is an elegant statement of intuition. However,as pleasing theoretically as IRP is, things become verycomplex in practice. In the remainder of this paper wedraw out some of the conceptual and empiricalproblems associated with IRP by briefly presenting theElectric Consumers Resource Council's (ELCON) .
positions on the topic as well as our responses to thosepositions.
In a series of papers ELCON has commented onvarious aspects of IRP.5 In particular they focus onDSM programs and environmental externalities.ELCON's general position on IRP is reflected by theirdefinition of the IRP process as:
. . . a utility's planning process that minimizesits long-run revenue requirement necessary foran adequate, reliable and efficient electricsupply at rates based on actual costs. The least-cost plan should include cost-effective supplyand demand-side resources.
We do not disagree with this definition. However,there are certain points worth mentioning. A moredetailed look at ELCON's philosophy is exploredbelow.
ELCON'S POSITIONS - AN OVERVIEW
In this section we provide a brief summary of themajor positions taken by ELCON along with ourcomments.
1. The efficient use of all resources, includingenergy, is viewed as prudent and environmentallyresponsible.
2. Competition should be used on both the supplyand demand sides to obtain more efficientelectricity markets.
3. To create a "level playing field" for evaluatingcost-effective supply and demand-side options,market barriers should be minimized:
a. On the supply side, increased competition inbulk power markets should be encouraged.
b. On the demand side, price signals should be setcorrectly and end-users should have access toinformation on the costs and benefits of theirchoices.
4. a. Both supply and demand-side resources shouldbe subject to prudence and "used and useful"standards.
b. Costs of these resources should be expensed orrate-based as appropriate.
c. Utilities should not be given financial incentivesto implement least-cost planning.
86
5. Utilities should set cost-based rates which sendappropriate price signals. Utilities should offer afull range of services including time-of-use andinterruptible tariffs.
6. Utilities should limit DSM program payments tothe avoided cost minus the bill savings.
7. Competitive bids may be used to acquire demandreductions and conservation as well as supplyoptions.
8. Environmental costs should not be imposed byregulatory agencies but by the relevant legislativebody.
a. Piecemeal attempts to price environmentalexternalities may be inefficient.
b. Because there is an unlimited number ofexternalities, both positive and negative, andmost cannot be quantified, it is notunreasonable to assume net external costs arezero.
c. Attempts to internalize selected negativeenvironmental externalities only in electricutility resource planning will arbitrarily distortthe relative cost of utility-generated electricitywhich may distort price signals in energymarkets.
A recurring theme throughout ELCON's positionpapers is that increased competition (andaccompanying efficiencies) in all facets of the energyindustry will lead to optimal outcomes from a societalperspective. In general we believe that increasedcompetition can be beneficial. In particular we agreewith ELCON's arguments that one, the efficient use ofresources is prudent and environmentally responsible,and two, competition should be encouraged on boththe demand and supply sides to promote more efficientelectricity markets.
Consistent with their outlook is the argument thatmarket barriers need to be minimized to create a "levelplaying field" for evaluating cost-effective supply anddemand options. Staff agrees that increasedcompetition in the bulk power markets should beencouraged. On the demand side, price signals shouldreflect society's valuation of resources and consumersmust have access to information which will lead toinformation on the costs and benefits of their options.ELCON's preoccupation with the value of competitionmanifest itself in points five, seven and eight. In point
five ELCON claims that a full range of services aremore likely to send appropriate price signals then arelatively blunt price aggregate. Point seven focuseson the need for competitive bidding for all resourceswithin the IRP framework. ELCON voices justifiableconcern in point 8c that IRP will distort relative energyprices if decisions are not guided by competitivepressures. We are sympathetic to that very importantconcern. Clearly, the imposition of externality costsshould extend beyond just the electric powergeneration industry if efficiency in resource allocationis a goal. Finally, these views are relativelyuncontroversial and serve as a useful underpinning tothe notion of IRP. We now turn to issues concerningDSM programs and environmental externalities whichgive rise to some disagreement between staff andELCON.
DEMAND-SIDE MANAGEMENT
In its paper on demand-side management ELCONpresented many good guiding principles for theregulation of DSM programs and two positions whichare not in the public interest in our opinion. The firstof these is the statement that the cost of DSMprograms should not exceed the difference between theavoided cost and the bill savings. The second is astatement that the regulatory authority should notprovide financial incentives for DSM. Both positions,if adhered to, would place unreasonable limits on themanner in which DSM is considered in the IRPprocess.
The position that utilities should limit DSMprogram payments to the avoided cost minus the billsavings is essentially the "nonparticipants test"embodied in the standard cost-benefit analysismethodology for DSM programs.^ This test, alsoreferred to as the rate impact measure, examines futurestreams of marginal costs and the average costs ofelectricity. Its limitations are well documented as ameasure of economic efficiency but it has a use as onemeasure of equity. 7
Heavy reliance on the nonparticipant test is undulyrestrictive. During periods of excess capacity this testwould indicate that no conservation programs shouldbe pursued. During periods of capacity needconservation would be beneficial but that's the timewhen a power plant is needed most. It's too late forconservation to make a significant impact. It is thefailing of these bulky capital investments whichprovide the variabie marginal costs. A reasonableapproach to DSM requires an ongoing commitment to
87

program analysis and implementation. If successfulDSM is to be part of a plan to defer expensivegenerating capacity, then it must be pursuedconsistently, not sporadically. All four perspectives ofthe standard cost-benefit analysis should be weighed toevaluate a DSM program.
Another concern of ELCON is the provision offinancial incentives. Here it may be a matter ofsemantics. ELCON must concede that the purpose ofregulation is to act as a replacement for competitionand to provide utilities with an adequate return on theirinvestments. If an incentive for a fair return on equityis not provided then regulation will fail becauseutilities will undercapitalize. The puipose of providingfinancial incentives for all resource options it toprovide a fair return on all investments. Under thecurrent regime, purchased power and DSM do notreceive a reasonable return. Utilities thus spend lesson these options than they should. Regulatorycommissions should examine the riskiness of allresource options and reward utilities for eachalternative in an appropriate manner. The allowed rateof return should reflect the aggregate risk of allinvestments.
Financial incentives for DSM may cause rates torise as utilities pursue an underutilized resource morefully. In the long term a balance among resources willbe achieved and rates will decline. Further, if publicpolicy dictates it, bonuses can be provided to particularresource options. Section 39(b) of the PURA refers toadjustment of the rate of return for achievements in theconservation of resources. Application of this sectionmay be appropriate to reward excellence and penalizeinaction.
ENVIRONMENTAL EXTERNALITIES
The ELCON position on externalities provides 1) adefinition of externalities, 2) examples of externalities3) the theoretical basis for attempts to internalizeexternal costs and benefits, 4) a discussion of recentattempts to assign monetary values to externalities andintegrate these values into resource plans, and 5) adiscussion of the potential market distortions attendantto the pricing of externalities. Finally, ELCON arguesthat the pricing of externalities is a legislative asopposed to a regulatory function.
It is clear that the attempts by regulatory bodies toaddress the issue of environmental externalities is areality. States, including California and New York,are assigning externality values to resource options andthe Commissioners in Texas have expressed an interest
in studies concerning these issues. This is evidencedby the treatment of externalities in the recent HoustonLighting &Power and TU Electric Company NOI's.There is an unmistakable momentum building that willsee an increase in the attention and resources devotedto valuing environmental externalities.
Economists have been developing a theoreticalframework for the study of externalities over the lastthirty years. However, environmental externalitieshave only recently become a major consideration ofutility regulators. Staff does not doubt the theoreticaland empirical problems associated with these issues.However, objections based on either do not lead to theconclusion that it is unwise on either a theoretical orempirical basis to attempt to value the externalitiesassociated with the generation of electricity in Texas.While research in the area of valuing environmentalexternalities associated with electricity generation isnascent, staff believes only by continued work in thisarea can improvements be made.
The following definition of externalities put forthby ELCON is uncontroversial:
Externalities are costs and benefits ofproduction or consumption activities that arenot borne by producers or consumers.Externalities are "external" costs and benefitsbecause they are external to the transaction andtherefore not reflected in the market prices ofgoods and services.
ELCON argues that in practice, imposing the useof selected negative externalities only in the electricitysector of the economy will severely distort pricesignals in retail and wholesale energy markets,resulting in inefficient investment decisions andconsumption behavior. This may artificially raise thecosts of electricity and distort the process by which autility's capacity expansion options are evaluated withno guarantee that environmental objectives areachieved (p. 14).
ELCON's most important claim concerningenvironmental externalities is that "if [attempts tointernalize any external costs] are to be made at all,they are the responsibility of legislative, not regulatorybodies." This conclusion is underpinned by two mainarguments. One, if the Federal Energy RegulatoryCommission or state Public Utility Commissionsattempt to impose the internalization of selectedexternalities they essentially usuip legislativeprerogatives to make policy. And two, piecemealinternalization of costs (the result of state PUC efforts)
88
may not be efficient from a societal perspective. Weaddress each claim separately.
As to the usurpation of legislative power we wouldrespond by arguing that administrative agencies areoften-times required to inteipret the will of thelegislative body in question. Statutes are oftenambiguous and require interpretation by bureaucraticagencies. Of course the legislature always hasrecourse: They can make law. We believe ELCON'sobjections have more to do with efficiency issues thanconstitutional ones. We turn to these efficiencyarguments next.
ELCON suggests that states attempts to imposeenvironmental restrictions beyond those alreadyexisting may fail to maximize welfare because aseconomic theory suggests, welfare cannot bemaximized unless, at the margin, social costs equalsocial benefits. Externalities may bemultijurisdictional. "State regulators cannot collectcompensation from entities outside their jurisdictionwhich receive beneficial effects, nor can theycompensate entities outside their jurisdiction who arevictims of harmful effects." This inability of thestates to capture all aspects of behavior yields a"residual". This "residual" results in a violation of themarginal (social) cost = marginal (social) benefitprinciple.
We would argue that the "theory of second best"8suggests that piecemeal imposition of environmentalcosts might reduce social welfare, however theirimposition might increase welfare as well. We justdon't know prior to empirical studies being done.
If external costs (and benefits) aremultijurisdictional it might suggest a multilateralapproach to the problem. We have already seen callsfor regional integration of regulatory activity toaddress the problems we have discussed.
Finally, ELCON argues that because there are anunlimited number of externalities, both positive andnegative, and most cannot be quantified, it is notunreasonable to assume net external costs sre zero.We contend that it is unreasonable to assume that thenet external costs are zero just as we do not assumethat "[ejven a crude approximation would bepreferable to valuing externalities at zero."9 We donot accept either characterization of the problem andbelieve the gaps in our knowledge require furtherempirical efforts.
SUMMARY
Clearly we are heading into relatively unchartedwaters in the power generation industry. Demand andsupply options that, in the past, were not consideredwill now receive hearings. Staff believes thatdecisions must be guided by the fundamental principal:Marginal (social) cost = Marginal (social) benefit. Weare in agreement with ELCON that increasedcompetitive pressures applied to all demand andsupply-side options is crucial to fulfilling the goals ofregulators, producers, and consumers, i.e, reliableelectric power delivered at least cost.
ELCON's position papers highlight the potentialbenefits associated with IRP as well as attendantdifficulties. Staff has found many areas of agreement.However, a fundamental disagreement does remain.Staff contends that even without perfect knowledge ofDSM or environmental impacts, we can and shouldmove forward on both fronts.
There is an unmistakable momentum building thatwill see the electric utility industry applying theprinciples of integrated resource planning. Clearly theprocess is in its infancy with major principlescontinuing to evolve. Further research and discussioninvolving producers, consumers, and regulators shouldallow the establishment of principles which embodyincreased competition and its attendant efficiencies inresource use.
Or similarly, least-cost planning.Alternative, in the sense of alternative to conventional fossil fuelgeneration. Alternatives include cogeneration, power plantefficiency, life extension, bulk power transactions, and renewableresources such as solar and wind generation.Although, we do see increasing competitive pressures oninvestor-owned utilities from independent power producers as aresult of changes in PURPA and we may see more if PUHCA isamended.It is crucial to remember that we are talking about a given levelof comfort.ELCON uses IRP and least-cost planning (LCP) interchangeably.ELCON presented their views on DSM in Profiles in ElectricityIssues (number 14) December 1990, on IRP in Profiles inElectricity Issues (number 15) April 1991, and environmentalexternalities in Profiles in Electricity Issues (number 16) October1991.The "standard practice" for cost-benefit analysis of conservationand load management programs was formalized by Californiaregulators in 1983. It has become the industry standard for theanalysis of demand management programs from various points ofview. See California Public Utilities Commission and CaliforniaEnergy Commission, "Standard Practice for Cost-BenefitAnalysis of Conservation and Load Management Programs," SanFrancisco, February 1983 and "Standard Practice Manual:
89

Economic Analysis of Demand-Side Management Programs," page 560. Houston, Texas, June 17-19, 1986.SanFransico, December 1987. 8 Nicholson, Walter. 1978. Microeconomic Theory: BasicSee for example the list of references provided with a paper given Principles and Extensions. (Holder., Illinois: Dryden Press),at this conference six years ago: Treadway, Nat, "Electric Utility p.571.Demand-Side Evaluation Methodologies," Proceedings of the 9 Ottinger, Richard L. 1990. "Getting at the True Cost of ElectricEighth Annual Industrial Energy Technology Conference, Vol. II, Power" The Electricity Journal. 3:6. p. 15.
90
STRA TEGIC RA TE DESIGN: THE ROLE OF INDUSTRIAL TARIFFS
Jeffrey I. RosenblumRate Design Section
Public Utility Commission of TexasAustin, Texas
Richard HouseEconomic Analysis Section
Public Utility Commission of TexasAustin, Texas
ABSTRACT
Strategic rate design refers to the use of deliberatepricing strategies that alter customer demand in order toachieve certain strategic objectives. Often the objective isto defer or eliminate the need for additional generationcapacity—and, to a lesser extent, transmission anddistribution capacity. In the same way that "a penny savedis a penny earned," one can say that "demand reduced iscapacity acquired."
In some cases, the strategic objective may be somethingother than reduction in peak demand, such as promoting theeconomic development of a depressed region. In thesecases some increase in peak demand may be tolerated,especially if the utility is already in an excess- capacitysituation.
Strategic rate design is also a tool to deal with the self-generating customer. Over the past 14 years, tremendousgrowth has occurred in cogeneration capacity in Texas. Theutilities use their rate tariffs strategically to influence thegrowth of self-generation.
This paper will discuss several aspects of strategicrate design to influence industrial energy sales(measured in kilowatt-hours) and demand (measured inkilowatts). The paper is divided into three parts. Thefirst part provides a general discussion of strategic ratedesign. The second part describes some of the strategicrates offered by utilities in Texas for industrialcustomers. The third part considers how principles ofstrategic rate design are applied by utilities in Texas intheir dealings with cogenerators.
GENERAL PRINCIPLES OF STRATEGIC RATEDESIGN
Rate design has long been recognized as more of anart than a science. Perhaps the major reason for this isthat rates are designed to meet a number of potentiallyconflicting objectives. Among the commonly citedobjectives of sound rate design are the following:
• Revenue stability and predictability• Stability and predictability of the rates themselves• Promotion of efficiency of both production and
consumption of electricity• Due consideration of social costs and benefits
("externalities")• An equitable distribution of the cost of service
among the different rate classes• Avoidance of undue discrimination• Understandability and public acceptance
Satisfying all these objectives simultaneously isusually impossible, which means that trade-offs have tobe made among them. Adding the use of strategic ratedesign as a resource to this traditional list means thatadditional compromises must be made.
In particular, many utilities have as a primaryobjective the goal of setting rates that fully reflect costs.Even within this constraint, alternative pricingmechanisms are available to allow the utility to engagein strategic rate design. For example, time-of-use rates,demand ratchets, and the provision of interruptibleservice are strategic rate design mechanisms that areconsistent with setting cost-based rates.
It should also be recognized that, if not voluntary,strategic rate designs can be unpopular with customers.
The views expressed in this paper are those of the authors and do not necessarily reflect the positions ofthe Public Utility Commission of Texas.
91
For example, residential customers with seasonal ratesoften interpret higher summer rates (for summer-peaking utilities) as utility price gouging "just when Ineed the electricity most."
Because of the ability of changes in price to affectbehavior, rate design is a potentially powerfully andrelatively inexpensive tool for influencing system loadcharacteristics in desirable ways, such as peak shavingand load shifting. Peak shaving occurs when customersreduce their electricity demand at the time of peakoverall system demand. Load shifting is a type of peakshaving where the emphasis is on changing the timingof customer demand so that demand is reduced duringpeak periods but increased in other periods.
The successful use of strategic rate design can beviewed as a resource alternative for the utility. As aneffort to affect end-user demand, strategic rate design isa particular type of demand-side management (DSM)program. DSM can be defined as any utility activitythat influences the magnitude and timing of customerenergy usage.
Once employed, it remains difficult to estimate theimpact of strategic pricing on energy sales and systemcoincident peak demand. There are a number ofreasons for this difficulty. First, in many instancesutilities do not have sufficient load research capabilitiesto estimate the impacts. Second, there is always apotential "free rider" problem; that is, customers whotake advantage of a strategic rate without that rateactually having had any impact on the customer'senergy consumption patterns. For example, a printingfacility for a mo'ning newspaper could take advantageof pricing that is designed to encourage off-peak usagewithout changing its total consumption in any way.Measurement problems are compounded by theinfluence of other factors that can change customerbehavior irrespective of any changes in price, such asunusual weather, customer growth, or changes in areaeconomic conditions.
Probably the best way to measure the effects ofstrategic rate design would be through the estimation ofown-price and cross-price demand elasticities. As yet itappears that little work has been done in this area, atleast by utilities in Texas.
EXAMPLES OF STRATEGIC RATE DESIGNFOR INDUSTRIAL CUSTOMERS
InterrupUhleJnterruptibie rates allow certain customers of the
utility to purchase electricity at a reduced rate in returnfor an agreement from those customers that their service
may be interrupted by the utility when conditionswarrant. The customer benefits through a pricediscount. In return for this discount the customerreceives a lower quality of service. Interruptible servicecan provide a number of benefits to the utility. Theutility benefits by avoiding the need to provide capacitythat would be required under ordinary conditions tomeet the customer's load, assuming the customer wouldhave remained on the system in the absence of theinterruptible price discount. Alternatively, the utilitymay benefit insofar as the interruptible price discountserves as an incentive to the customer to remain on theutility's system, instead of producing its own power.
Instantaneous interruptible is also used as a meansto maintain system frequency at an acceptable level.Finally, under certain circumstances a portion of autility's instantaneous interruptible load may be countedtowards its spinning reserve requirements.
Most of the investor-owned utilities in Texas offerone or more interruptible rates to industrial customers.For example, Houston Lighting & Power (HL&P) offerscustomers a choice of three interniptible options: IS-1,IS-10, and IS-30. IS-I is service that is interniptibleinstantaneously, without any notice. IS-10 and IS-30allow the customer 10 and 30 minutes of interruptionnotice, respectively. The shorter the interruption notice,the greater the customer's discount.
Effectiveness of Interruptible RalesUtilities in Texas estimate a combined reduction in
capacity requirements from interniptible rate programsof 1,319 MW in 1991. This amount represents the totalprojected interruptible loads forecasted by the utilitiesto be available at the time of system peak. Implicit inthis projection is the assumption that interruptible loadwould have been Finn load in the absence of theinterniptible rate. To the extent that the load wouldhave left the system entirely in the absence of the rate,this estimate overstates the capacity savings that willresult from interruptible rate programs.
RatchetsA ratchet demand clause is often applied in the
determination of billing demands for large rate classes.A ratchet provision essentially serves to put a floorunder the maximum demand for billing purposes,holding the billing demand to no less than the highestdemand recorded in some stated period or somepercentage thereof. In the United States, nearly everyutility has some type of ratchet on most large-use rateschedules. The ratchets range from 30% to 100% andare effective for periods as short as three months to as
92
long as five years. For example, TU Electric's GeneralService rate restricts monthly billing demand to be notless than 80% of on-peak kW, 50% of contract kW, or50% of annual kW. Contract kW is defined as themaximum kW specified in the Company's Agreementfor Electric Service with the customer. Annual kW isdefined as the highest 15-minute kW recorded at thepoint of delivery in the 12-month period ended with thecurrent month.
The use of ratchets is intended to serve severalfunctions. First, it provides a degree of revenuestability to utilities by limiting fluctuations in billingrevenue that could be caused by large variations in acustomer's peak demand. Second, ratchets serve todistribute revenue responsibility more equitably byensuring that customer's who contribute a certainamount to the Utility's peak demand requirements arebilled a commensurate amount. Last, minimumdemand levels provide a price signal that encouragescustomers to improve their annual load factor.
There are also disadvantages associated with theapplication of ratchet clauses. While one of thepurposes of using a ratchet is to improve load factors,these clauses could induce unnecessary consumption ofelectricity during the customer's non-peak demandperiods. Also, charges of billing demands set byratchets could impose financial hardship on somecustomers, especially those with low load factors.Finally, it is difficult to determine a cost-basis forsetting ratchet levels, which means that given ratchetlevels may not be cost-justified.
Most of the investor owned utilities in Texas haveratchets in their large-class rates. The ratchets rangefrom 60% to 95%, and the period used for thedetermination of ratchet demands is usually one year.Most of the utilities establish their ratchets based onclass load factors or class coincident factors, whicheveris available. For instance, a ratchet might be set eitherequal to or higher than the class load factor. Someutilities use class coincidence factors as a reference forsetting ratchets. The determination of a ratchet usuallyresults from a subjective assessment of (he class' loadcharacteristics.
In practice, utilities in Texas use a variety ofmethods for setting ratchet levels. For example, HL&Pdetermines ratchet levels by comparing daily non-coincident system peak demands (NCP) to the annualsystem peak demand. TU Electric's 80% ratchet levelreflects the relationship that exists between thecoincidence factor and load factor for the class. As theload factor of a customer increases, that customer'scoincidence factor also increases, causing a
corresponding increase in the NCP that the companyprefers to use in allocating demand-related costs to theclass. According to TU Electric, a coincidence factor ofapproximately 80% corresponds to the normal range ofload factors for the class. Setting the on-peak minimumat that 80% level results in demand cost recovery beingrepresentative of class load characteristics, thusminimizing intraclass subsidization.
Industrial Economic Development RatesEconomic development rates are discounts or
credits offered by utilities in the form of riders orspecial contracts. A number of utilities in Texas offerdiscounts in order to attract new industry to the state, toexpand existing business, to discourage customers fromswitching to alternative fuel sources, to reduce excesscapacity, or to help create jobs in Texas*
The Public Utility Commission of Texas (PUCT)has not set any formal guidelines for economicdevelopment rates. In practice, the PUCT frequentlytakes the position that, after the discount, the rate muststill recover the short-run marginal cost to produce theelectricity. Further, economic development rates arenot usually approved unless the utility has excesscapacity. Allocation of foregone revenue is handled ona case-by-case basis; i.e., whether it is absorbed bystockholders, ratepayers, or some combination of thetwo.
The Gulf States Utilities Company (GSU)Experimental Economic Development Service Riderapplies to general service and large industrialcustomers, specifically those classified asmanufacturing, research and development, hi-tech workcenters, or prisons. The discount to the customer is tiedto the number of newly created full-time jobs attributedto the rider. The more jobs created, the greater thediscount, which ranges from 15% to 60%.
The Houston Lighting and Power Company(HL&P) Economic Redevelopment Service, which willnot be available after 1994, is available only for new oradded load, and is designed to produce a 20% discountfrom a Large Overhead Service customer's total bill.Targeted businesses include basic manufacturingindustries, regional warehousing, scientific andindustrial research, corporate relocations, governmentalprojects, and facilities receiving county tax abatements.As with GSU, the customer must demonstrate that thediscounts offered by the tariff influenced them toincrease their operations in the utility's service territory.
El Paso Electric Company (EPE) has a number ofexperimental development riders. In designing levelsfor their Economic Development Rate, EPE gathered
93
information to estimate the total expenditure range ofmedium- to large-sized expansion projects, includingheating costs and building or rental costs. Rates weredesigned to take into account the total expenditures of abusiness, including energy costs. The EPE Fixed RateRider, designed for businesses adversely affected byvariations in rates, promotes economic development byguaranteeing fixed rates for two years.
The Central Power and Light Company (CPL)Experimental Economic Development Rate providesincentives in the form of demand charge reductionsover a three-year period for large load additions.Increased benefits are provided when new jobs arecreated in the CPL service area and are associated withthe load additions Businesses eligible for service underthis rider are basic manufacturing, regionalwarehousing, industrial research, coiporate relocations,petroleum and chemical refineries, process and storageindustries, agricultural industries, and government.Again, CPL's rider grants a greater discount if morefull-time positions are created.
In December, 1991, West Texas Utilities Company(WTU) proposed an industrial economic developmentrider designed to encourage business expansion and jobcreation in communities served by WTU. WTU statesthat the rider is needed to help reverse the economichardships suffered by the region during the oil bust ofthe 1980s. Discounts are highest in year one, 40%, andare reduced to 10% by the fourth year. WTU isproposing that the rider be applicable only to newfacilities or expansions of facilities which have aminimum electrical lead of 500 kW and an increase ofemployment of at least 10 persons. Targeted to bothmedium- and large-sized businesses, this rider ismodeled after other economic development ratesalready approved by the Commission.
Effectiveness of the Economic Development RatesGenerally, it is difficult to gauge the effectiveness
of economic development rates (EDRs) in creating jobsand promoting economic development. Whencompanies are asked whether they were influenced bythe rate, they naturally respond "yes" so that the utilitywill keep the rate available, even if other factors weremore important in the company's decision to expand,such as growth in demand for the company's product ortax breaks from the city.
El Paso Electric's EDRs have been very effective,according to the utility. Recently, three large industrialcompanies (Phelps Dodge, ASARCO, and Border Steel)have begun expansions of their existing businesses, andothers are talking about doing the same. According to
the utility, these expansions are the direct result ofEPE's Experimental Economic Recovery Rider.
HL&P currently has 28 customers on its EconomicRedevelopment Service rate. The company reportsbeing very pleased with the results of the rate.
GSU is also pleased with the results of its EDR.While the utility has some reservations as to theeffectiveness of the rate due to industrial companies'incentive to claim that the EDR was a deciding factor inwhether to relocate or expand in the GSU service area,GSU believes that its EDR has been useful in attractingnew load to its service territory.
CPL currently has four customers on its EDR,which together have created 520 jobs and a demand of9.9 MW of electricity. These four customers are a gasplant, a beef processing plant, a chemical company, anda petroleum company. CPL is also trying to attractprisons into their service area. The company reportsworking closely with cities in their service area toattract EDR projects.
Other Strategic Rate DesignsA number of other strategic rate design tools are
available to utilities. One is the use of special blockingstructures, in which rates vary among different kWhconsumption "blocks." Blocked rate staictures usuallyprovide only a crude approximation of cost variations.
Seasonally-differentiated rates are also widelyemployed, with one season being identified as the on-peak period. Reduced demand and/or energy chargesduring the off-peak season are designed to reflect thereduced costs of providing service as compared to theon-peak period.
Time-of-day (TOD) rates send a more precise pricesignal to consumers than seasonally-differentiated rates.Electricity is priced at a premium during those specificperiods (such as summer afternoons) when providingpower is most costly. TOD rates are more effective atachieving desirable changes in customer behavior thanseasonal rates. It is easier to put off running thedishwasher to the evening than to next October.
TARIFFS FOR THE COGENERATOR IN TEXAS
A special subset of industrial customers, the self-generating variety, impose particular requirements onthe utility. A utility may see the self-generatingcustomer as a load the utility should be serving, or as anopportunity for sales in addition to what the customercan provide for itself, or even as a capacity resource forall of its customers. The tariffs offered the self-
94
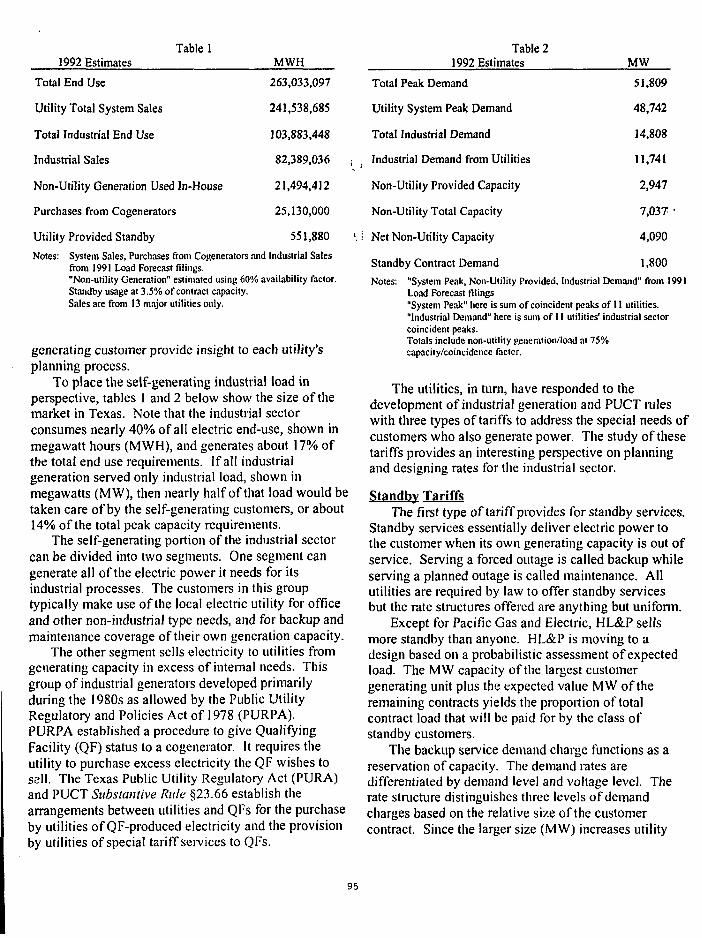
Table 11992 Estimates
Total End Use
Utility Total System Sales
Total Industrial End Use
Industrial Sales
Non-Utility Generation Used In-House
Purchases from Cogenerators
Utility Provided Standby
Notes: System Sales, Purchases from Cogenerators and Industrial Salesfrom 1991 Load Forecast filings."Non-utility Generation" estimated using 60% availability factor.Standby usage at 3.5% of contract capacity.Sales are from 13 major utilities only.
generating customer provide insight to each utility'splanning process.
To place the self-generating industrial load inperspective, tables 1 and 2 below show the size of themarket in Texas. Note that the industrial sectorconsumes nearly 40% of all electric end-use, shown inmegawatt hours (MWH), and generates about 17% ofthe total end use requirements. If all industrialgeneration served only industrial load, shown inmegawatts (MW), then nearly half of that load would betaken care of by the self-generating customers, or about14% of the total peak capacity requirements.
The self-generating portion of the industrial sectorcan be divided into two segments. One segment cangenerate all of the electric power it needs for itsindustrial processes. The customers in this grouptypically make use of the local electric utility for officeand other non-industrial type needs, and for backup andmaintenance coverage of their own generation capacity.
The other segment sells electricity to utilities fromgenerating capacity in excess of internal needs. Thisgroup of industrial generators developed primarilyduring the 1980s as allowed by the Public UtilityRegulatory and Policies Act of 1978 (PURPA).PURPA established a procedure to give QualifyingFacility (QF) status to a cogenerator. It requires theutility to purchase excess electricity the QF wishes tosell. The Texas Public Utility Regulatory Act (PURA)and PUCT Substantive Rule §23.66 establish thearrangements between utilities and QFs for the purchaseby utilities of QF-produced electricity and the provisionby utilities of special tariff services to QFs.
MWH
263,033,097
241,538,685
103,883,448
82,389,036
21,494,412
25,130,000
551,880
Table 21992 Estimates
Total Peak Demand
Utility System Peak Demand
Total Industrial Demand
i , Industrial Demand from Utilities
Non-Utility Provided Capacity
Non-Utility Total Capacity
'.! Net Non-Utility Capacity
MW
51,809
48,742
14,808
11,741
2,947
7,037 •
4,090
Standby Contract Demand 1,800
Notes: "System Peak, Non-Utility Provided, Industrial Demand" from 1991Load Forecast filings"System Peak" here is sum of coincident peaks of 11 utilities."Industrial Demand" here is sum of 11 utilities' industrial sectorcoincident peaks.Totals include non-utility generation/load at 75%capacity/coincidence factcr.
The utilities, in turn, have responded to thedevelopment of industrial generation and PUCT ruleswith three types of tariffs to address the special needs ofcustomers who also generate power. The study of thesetariffs provides an interesting perspective on planningand designing rates for the industrial sector.
Standby TariffsThe first type of tariff provides for standby services.
Standby services essentially deliver electric power tothe customer when its own generating capacity is out ofservice. Serving a forced outage is called backup whileserving a planned outage is called maintenance. Allutilities are required by law to offer standby servicesbut the rate structures offered are anything but uniform.
Except for Pacific Gas and Electric, HL&P sellsmore standby than anyone. HL&P is moving to adesign based on a probabilistic assessment of expectedload. The MW capacity of the largest customergenerating unit plus the expected value MW of theremaining contracts yields the proportion of totalcontract load that will be paid for by the class ofstandby customers.
The backup service demand charge functions as areservation of capacity. The demand rates aredifferentiated by demand level and voltage level. Therate structure distinguishes three levels of demandcharges based on the relative size of the customercontract. Since the larger size (MW) increases utility
95

costs for backup service compared to the same M Wmade up of several smaller-sized units, the larger-sizedcontracts are charged at a higher rate.
The rate for the energy charge depends on time ofuse and a liberal tilt of the capacity costs into the energycharge provides the customer a reason to reduce outagetime. That is, the service is more of a "pay as you useit" type than the standard industrial tariffs that bill theratchet id demand charge. The high rate per k Wh forbackup service energy encourages the customer to getthe failed generation equipment back on line quickly.
Maintenance service offers a low-per-kWh energycharge with no additional capacity charge because themaintenance is scheduled in advance, presumablyplacing little or no peak capacity requirements on theutility.
With the low rates for capacity reservation, lowcharges for maintenance, and high energy charges forbackup service, the tariff serves as an incentive forefficient operation of cogeneration facilities.
At the opposite end of the scale, TU Electric merelyplaces a clause in a couple of industrial tariffs statingthat they may also be used for standby services, ifneeded. Because the demand charge is ratcheted, thestandby customer in effect prepays for the service. Theeffect may be a disincentive to efficient operation of thecogeneration facility.
Other utilities in Texas lie between HL&P and TUElectric in the sophistication of standby rate design.
Supplementary service is delivered to the customerwho needs more than it can, or* wishes to, generate byitself. Although supplementary service is a form ofstandby service that a utility must offer, supplementarydemand tends to resemble a typical industrial load. It isusually delivered under the terms and conditions of a"normal," full-requirements industrial tariff.
Avoided CostThe second type of tariff for the self-generating
customers presents the rates for energy and capacitypayments by the utility for the electricity it purchasesfrom the customer. The standard tariff applies to QFsof 100 kW or less.
Non-firm energy (kWh) rates are based on hourly,day-night, or on-peak-off-peak utility fuel costs plusconversion, or energy costs. Non-firm capacity ratesare zero.
Every two years, the utilities file an avoided costcalculation. Filings for major utilities are docketedwith the Commission. Out of these cases comes aschedule showing the annual prices the utility must payfor purchases of electricity compelled under PURPA.
If the utility needs additional capacity within the next10 years, a schedule is also developed showing themaximum price the utility could pay for avoiding theaddition of that planned capacity and energy. Thisprice is the ceiling used to start negotiations withindividual cogenerators for payment for use of theircapacity to serve the utility's system.
Firm payments are made by four utilities: HL&P(956 MW), SPS (39 MW), TNP (300 MW), and TUElectric (1,982 MW). The utilities negotiated withcogenerators to arrive at a payment stream over theterm of the contract. Because of fuel diversificationefforts, the utilities were constructing solid-fuelgenerating units at the time many of those contractswere entered into. As a result, the avoided capacitycosts were high; and the capacity payments to thecogenerators are high. New contracts entered into thisdecade will likely reflect the lower capacity costs of thenatural-gas generating units the utilities nowcontemplate building.
Load RetentionA third type of tariff sometimes offered has been
called an anti-cogeneration tariff, or a "cogen-kill" rate.In this situation, the utility competes for the customer'sdollars by offering power at a price favorable enoughthat the customer would rather continue buying fromthe utility than install its own generation capacity. Abroader conception of this idea is load retention. Asnoted earlier, the PUCT allows load retention rates ifsome contribution to fixed cost above short-termmarginal cost is collected.
The GSU tariff SUS is a clear example of the load-retention type of tariff aimed at potential cogenerationdrop-off. It is offered to customers using a minimum of10,000 lbs steam/hour. It will be withdrawn when GSUsystem reserve margin drops below 18% (not projectedto happen within the next 15 years). And, it is initiallypriced just over GSU's short-run marginal cost. GSU,at least, is pleased with the results: retaining four largecustomers for now; and by discontinuing the tariff whenits reserve margin drops, reserving cogenerationresources for use in the future.
New Developments in a Competitive ContextA new development in competitive relations with
the industrial-generation market occurred in the HL&PNotice of Intent to apply for a Certificate ofConvenience and Necessity case, Docket No. 10473,where the utility won the first round with an innovativeproposal.

The utility proposes to build, own and operate anenergy-efficient cogeneration facility and sell steam to aDuPont plant. The concept represents a newdevelopment in load retention, as the customercontinues electric service from the utility under itsstandard industrial tariff. The bargain price it pays forsteam allows this to occur. The utility protects itsshareholder's interests by gaining a return on a facilitythat might otherwise have been built by a third party.Ratepayers pay lower fuel costs because the revenueHL&P receives from the sale of steam will be applied toits fuel account. It seems that co-production is awinning proposition for everyone.
The proposal does place the PUCT in the awkwardposition of de facto regulating steam sales. It alsomeans electric ratepayers are paying for non-electricityproducing equipment. The ratepayer is better offpaying for the steam-generation equipment andreceiving some benefits from the sale of the steam, butmay or may not appreciate the utility making thedecision as to which non-electrical investment to makeon their behalf.
More importantly, there may be some danger ofgiving the utility a competitive advantage over private
developers in the cogeneration-installation market. Thismay occur because the utility can sell the electricity atthe higher retail price while the cogenerator cannot.The utility would raise more revenue from sales ofelectricity from the same installation than would theprivate developer.
These and other issues will be more closelyexamined during the CCN-phase of the project. If myanalysis is correct and the proposal comes to fruition,future cogeneration project developers may find stiffercompetition than they previously faced.
The industrial tariff, like any other electric utilitytariff, should return to the utility its costs of providingservice. The tariff also does more, however. Amongthese additional effects, it provides price signals, affectsthe timing of usage, and encourages or discouragescertain economic activities. In strategic rate design, theidea is to lay out these added qualities on purpose—atleast be aware of them. The tariffs for the self-generating customer illustrate this aspect of rates moreclearly than most non-industrial tariffs. Just like thecustomers they are intended to serve, the industrialtariffs are complex and sophisticated.
97
INDUSTRIAL DEMAND-SIDE MANAGEMENT IN TEXAS
Danielle JaussaudEconomic Analysis Section
Public Utility Commission of TexasAustin, Texas
ABSTRACT
The industrial sector in Texas is highly energyintensive and represents a large share of many utilitieselectricity sales. Utilities may intervene to shape the loadof their customers through demand-side managementprograms. In doing so, they can improve the efficiencyof their system. Historically, utilities in Texas haveoffered industrial customers energy audits and othertechnical assistance.1 Few incentive programs havetargeted industrial customers specifically. Other types ofprograms, such as shared savings, request for proposalsand bidding have not been used. Overall, the demand-side programs offered by Texas utilities to their industrialcustomers are not structured to generate the energy anddemand savings needed to reduce utility loads and affectfuture resource planning.
INTRODUCTION
The industrial sector is a highly energy-intensivesector. Nationwide, it accounts for 35% of annualelectricity use.2 In Texas, the industrial sectorpurchased 79,377,313 MWH, or about one third ofall electricity purchases from the generating utilitiesin 1989.3 Industrial customers use energy for power,lighting, and processes. In each of these activities,the potential for energy savings exists.
Over time, the energy intensity of differentmanufacturing industries varies. All industriesexhibit a trend toward higher energy efficiency astechnology improves. In some instances this trend ismoderated by new uses of energy which result inimproved productivity and/or higher product quality.
The pace at which these changes take placenormally depends on the economics of the newtechnologies and on the pressures of competition.When utilities intervene to speed up the adoption rate
of new, energy efficient technologies, they engage indemand-side management.
Demand-side management programs may promoteefficient technologies and advocate efficient energypractices. They may also provide incentives toinfluence the shifting of customers' operations fromon-peak to off-peak periods. This paper reviews thedemand-side management activities of the majorgenerating utilities in Texas as they apply to theindustrial sector.
Utilities have different motivations to engage indemand-side management and may offer either loaddecreasing, load shifting, or load increasingprograms. The first two types of programs result inlower consumption and/or lower peak demand, andultimately reduce the need to build new capacity.Hence demand-side management can be used as aresource option to be considered alongside moretraditional supply-side resources in a utility resourceplan. This paper will assess whether industrialdemand-side management programs in Texas can helpmeet future demand growth and contribute to reducethe need for capacity addition in the state.
ENERGY CONSUMPTION OFMANUFACTURING INDUSTRIES IN TEXAS
In some service areas in Texas, industrial salesaccount for close to 50% of total sales. Table Ishows the importance of industrial electricity sales byutility.
For utilities that reiy heavily on industrial sales, itis important to retain industrial customers on the grid.If an industrial customer's energy costs increase, the
The views expressed in this paper are those of the authors and do not necessarily reflect the positionsof the Public Utility Commission of Texas.
98

customer may be tempted to self-generate, or he maylose his competitive edge. In both cases, the utilityloses a large source of revenues. Utilities haveresponded by helping their industrial customers bemore energy efficient. Demand-side managementprograms have been used as a way to provideindustrial customers the assistance needed to controltheir energy costs.
TABLE 1
INDUSTRIAL DEMAND AND ENERGY USE INTEXAS, BY UTILITY
Utility
TU
GSUHL&P
CPLSWEPCOSPSWTUEPETNP
Note
MW
2,82J
6654,22
A
4548466802126118224
MWas%of
system
16.00%
28.65%34.58%
16.58%28.41%34.55%11.36%15.75%21.50%
MWH
22,315,237
5,894,98726,216,991
3,546,1593,394,5876,275,056
737,419766,838
1,790,433Numbers are for fiscal year 1990-91,
MWHas %
ofsystem
27.00%
44.00%44.00%
17.60%41.55%48.00%14.26%21.20%35.70%except for'
Sales as%of
revenues
18.54%
35.86%34.15%
19.53%36.92%36.07%16.70%10.31%20.27%
fUEC andGSU's MWs which are for fiscal year 1988-89.
CONSERVATION OF RESOURCES OR SALESPROMOTION?
Utilities may direct their demand-sidemanagement programs so that they result in loadreductions (the effect of conservation programs), loadshifts (through programs that shift load from on-peakto off-peak periods), and load increases (throughvalley filling and load growth activities).
A utility that has a shortage of capacity maybenefit from using demand-side management to slowdown the rate of grcwth of elecricity demand while itseeks to expand capacity. This utility will promoteload decreasing technologies and activities. In Texas,many utilities have been faced with excess capacityfor several years, which has prompted them to usedemand-side management for sales promotion ratherthan conservation.
Although sales promotion efforts continue, Texasutilities are currently at a point where capacitymargins are shrinking, and plans are being made toacquire new resources. It is therefore possible thatDSM programs will increasingly be used to promotethe conservation of resources as we approach the endof the 1990's.
PROGRAM TYPES
Whether a demand-side program promotes new,energy efficient technology or induces customers tochange the timing of their operations, incentives areusually provided to move customers to action.Diverse approaches have been used. Nationwide, inthe industrial program area, the most commonapproaches have included technical audits or technicalassistance programs, informational programs,financial incentives such as rebates and loans, sharedsavings arrangements, request for proposals, andbidding programs. In Texas, most of the generatingutilities provide industrial energy audits andengineering assistance, and have informationalprograms. A few utilities offer financial incentives toindustrial customers. Shared savings, request forproposals and bidding programs are not currentlyused.
TECHNOLOGICAL OPPORTUNITIES FORDEMAND-SIDE MANAGEMENT
New technologies may offer opportunities todecrease load, shift load, or increase load, while atthe same time improving the energy efficiency and/orthe productivity of industrial operations.
High-efficiency motors that replaceconventionally wound electric motors, and adjustablespeed drives are promising load decreasingtechnologies. Nationwide, motors account forapproximately 70% of manufacturing electricityconsumption.4 Savings of 3% to 10% are thought tobe obtainable through the introduction of highefficiency motors, and additional potential savings ofup to 35% may be achieved through adjustable speeddrives.5
High-efficiency lighting is also considered animportant source of electricity savings in theindustrial sector. The potential savings from high-frequency ballasts, efficient lamps such as highintensity discharge (HID) lamps for outside
99
applications, reflectors, sensors and controls havebeen estimated at 35% of the existing industriallighting load.6
High-efficiency heating/ventilation and cooling(HVAC) systems are a less important source ofelectricity savings in the industrial sector than in thecommercial secior. It is estimated that HVACsystems represent no more than .5 % of totalindustrial load.7
Motors, lighting and HVAC systems arecommonly found at all industrial facilities. They canbe addressed by programs that target a technology, oran end-use, such as a motor rebate program, or anefficient lighting program. By contrast,electrotechnologies are often industry specific and donot lend themselves to this type of program. Theymay be included in a flexible, multiple end-useprogram, but they are more likely to be addressed aspart of a customized assistance program.
While some new electrotechnologies reduceelectricity consumption in industrial processes, manydo not. In some cases, consumption is shifted frominefficient fossil fuel applications to more efficientelectricity applications. In other cases, newelectrotechnologies introduce new uses of electricityand thus increase the energy intensity of an industrialprocess. (An example is the paper industry wheremechanical processes are being introduced toreplaced chemical processes.) Thus, when a utilitypromotes only electrotechnologies through demand-side management, it often fulfills a load increasingobjective.
One technology, the industrial heat pump,deserves special mention because it has applicationsin many industries and most utilities considered inthis paper promote it. Heat pumps have an importantrole where process heat is used. By recycling heat,the heat pump reduces the need for gas fired boilersand provides savings in the customer's total energybills. At the same time, the heat pump increaseselectricity consumption and thus increases utilitysales.
This technology presents economic advantages inseveral industries -- food, chemicals, paper andpetroleum ~ and its applications are expanding. Butin spite of these advantages, the industrial heat pumpis not well accepted. One reason is that heat pumpneeds differ with each application, and technicalanalyses are necessary before knowing whether a heat
pump opportunity really exists. By providingtechnical assistance, utilities can facilitate a wideracceptance of industrial heat pumps, while at thesame time increasing their sales.
DEMAND-SIDE PROGRAMS BY UTILITY INTEXAS
The programs of nine investor-owned generatingutilities are reviewed in the following sections. Theutilities are referred to by their acronym, as listedbelow:
TU Texas Utilities Electric CompanyHL&P Houston Lighting & Power CompanyGSU: Gulf States Utilities CompanyCPL Central Power and Light CompanySWEPCO Southwestern Electric Power CompanySPS Southwestern Public Service CompanyWTU West Texas Utilities CompanyEPE El Paso Electric CompanyTNP Texas-New Mexico Power Company.
1 - ENERGY AUDITSAll Texas generating utilities considered in this
paper offer free energy audits and/or technicalassistance to their industrial customers. Energyaudits are used to identify areas where energyefficiency improvements may be obtained. There aredifferent types of energy audits. A walk-throughaudit usually provides recommendations on the basisof a visual inspection of the facilities and an interviewwith the plant energy manager. It does not includedetailed engineering assessments. Crude estimates ofthe costs and savings of the recommended measuresare usually provided. Computerized audits includemore detailed analyses based on information collectedon site. A few utilities provide additional engineeringanalysis to the customer if a follow-up is requestedafter the original walk-through audit is conducted.Also provided is a bill analysis. EPE includes abreak-down of energy consumption by end-use or bytype of equipment. EPE, SWEPCO, SPS, and TUprovide two levels of Industrial Audits: walk-throughand detailed. GSU and HL&P do not have an energyaudit program per se but offer on-going technicalassistance to their industrial customers through theircustomer service department.
100

An audit report is usually issued to the customerwith recommendations on energy saving practices andmeasures. Follow-up services may be more or lessextensive. They may include assistance in installingthe recommended measures. EPE, WTU, TUEC, andSPS follow-up with visits by a utility representative toverify the implementation of the recommendationsand measure the savings achieved.
An initial audit may be a way for a utility tointroduce and market its other demand-sidemanagement programs. TU, for example, educatesthe customer about its rate structure, load shiftingopportunities, and incentive programs as part of anaudit visit. EPE has started informing customersabout its load shifting rates during an audit.
Other information routinely provided includestechnical documentation on energy efficienttechnology. Utilities that are members of the ElectricPower Research Institute (EPRI) distribute EPRI'stechnical briefs to keep customers updated on thenewest developments in electrotechnologies.
Utilities that have large excess capacity tend topromote electrotechnologies that can replace fossilfiiel equipment or introduce new uses of electricity inindustrial processes. CPL's EfficientElectrotechnologies Program, for example, offersengineering assistance in analyzing the benefits to thecustomer of new electric equipment applicable toindustrial processes.
The electricity consumption and demand impactsof industrial audit programs vary. SWEPCO, GSU,HL&P and TNP consider their audit programs ortechnical assistance to be purely informational and donot monitor the impacts. CPL emphasizeselectrification over conservation and reports increasesin consumption as a result of its program. TUprovides recommendations both on load decreasingand load increasing measures and reports bothsavings and load increases.
Table 2 summarizes the activities of the nineutilities that were analyzed for this presentation. Theprograms reported in Table 2 are listed below.
TUECHL&PHL&PGSU
Technical Services Program.Business Audit Program.
technical assistance on request.technical assistance on request.
CPL Better Thermal Utilization Program.SWEPCO C&I Walk-Through Energy AuditSWEPCO HVAC Design for Commercial/Industrial
ApplicationsSWEPCO Industrial Assistance ProgramSWEPCO Lighting Design Assistance for
Commercial/Industrial Applications.SPS Industrial Energy Audits Program.WTU Industrial Energy Audits Program.EPE Commercial & Industrial Audit Program.TNP technical assistance on request.
It is difficult to make a general statement aboutthe industrial audit programs offered by Texasutilities because of the disparity in data reporting.While some utilities do not record participationand/or program impact, others lump togethercommercial and industrial customers. Overall, auditprograms in Texas are customer service oriented anddo not seek to achieve important load reductions.About one-half of the utilities have load increasingactivities as well as, or instead of, load decreasingactivities. Finally, participation in energy auditprograms provided by utilities in Texas has been low,and the impacts very small compared to totalindustrial demand and energy consumption.
2 - END-USE INCENTIVE PROGRAMSHistorically, most utilities in Texas have offered
industrial customers energy audits, but have notprovided them with incentive programs to furtherencourage the adoption of efficient measures andequipment.
Several utilities offer night lighting programsopen to all classes. These programs have had a loadbuilding objective.
For a short period (1989-1990), HL&P offered anIndustrial Motor program, also with a load buildingobjective. The program promoted efficient electricmotors to replace non-electric drives and wascancelled by order of the Public Utility Commissionin Docket No. 8425.
TU had three incentive end-use programs open tocommercial and industrial customers between 1982and 1991. They were: a lighting program, a heatpump program for the new construction market, anda HVAC program for existing buildings. In these
101
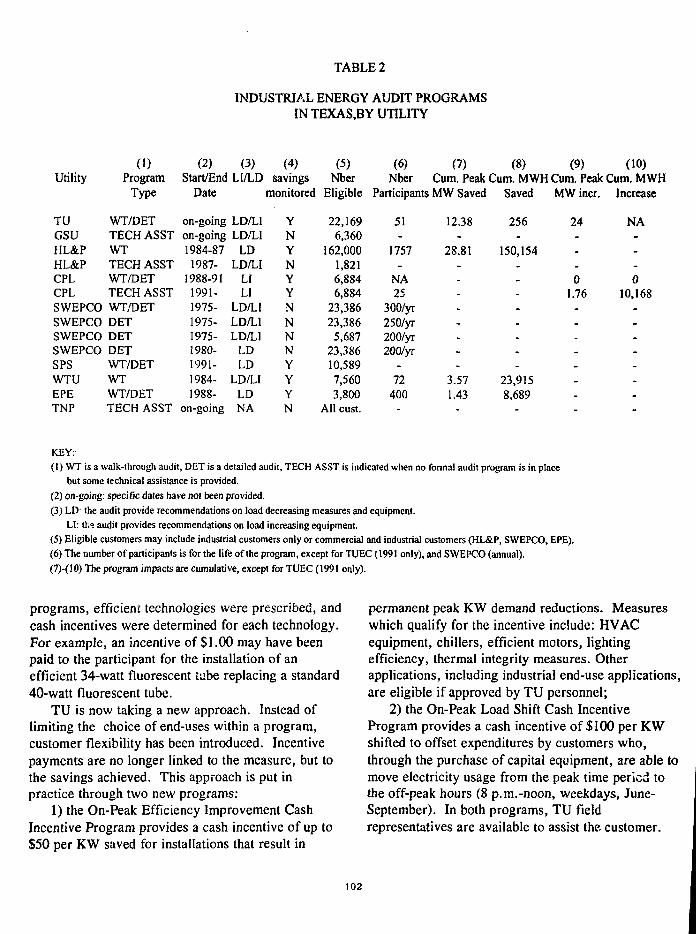
TABLE 2
INDUSTRIAL ENERGY AUDIT PROGRAMSIN TEXAS.BY UTILITY
Utility
TUGSUHL&PHL&PCPLCPLSWEPCOSWEPCOSWEPCOSWEPCOSPSWTUEPETNP
(I)Program
Type
WT/DETTECH ASSTWTTECH ASSTWT/DETTECH ASSTWT/DETDETDETDETWT/DETWTWT/DETTECH ASST
(2)Start/End
Date
on-goingon-going1984-871987-
1988-911991-1975-1975-1975-1980-1991-1984-1988-
on-going
(3)LI/LD
LD/LILD/LI
LDLD/LI
LILI
LD/LILD/LILD/LI
LDLD
LD/LILDNA
(4)savings
monitored
YNYNYYNNNNYYYN
(5)Nber
Eligible
22,1696,360
162,0001,8216,8846,884
23,38623,386
5,68723,38610,5897,5603,800
All cust.
(6)Nber
(7) (8) (9) (10)Cum. Peak Cum. MWH Cum. Peak Cum. MM
Participants MW Saved
51-
1757-
NA25
300/yr250/yr200/yr200/yr
.72
400
12.38-
28.81
3.571.43
Saved
256-
150,154
23,9158,689
_
MW incr.
24
01.76
_
lncreas
NA---0
10,168
-
KEY:
(1) WT is a walk-through audit, DET is a detailed audit, TECH ASST is indicated when no formal audit program is in place
but some technical assistance is provided.
(2) on-going: specific dates have not been provided.
(3) LD- the audit provide recommendations on load decreasing measures and equipment.
LI: the audit provides recommendations on load increasing equipment.
(5) Eligible customers may include industrial customers only or commercial and industrial customers (HL&P, SWEPCO, EPE).
(6) The number of participants is for the life of the program, except for TUEC (1991 only), and SWEPCO (annual).
(7)-(10) The program impacts are cumulative, except for TUEC (1991 only).
programs, efficient technologies were prescribed, andcash incentives were determined for each technology.For example, an incentive of $1.00 may have beenpaid to the participant for the installation of anefficient 34-watt fluorescent tube replacing a standard40-watt fluorescent tube.
TU is now taking a new approach. Instead oflimiting the choice of end-uses within a program,customer flexibility has been introduced. Incentivepayments are no longer linked to the measure, but tothe savings achieved. This approach is put inpractice through two new programs:
1) the On-Peak Efficiency Improvement CashIncentive Program provides a cash incentive of up to$50 per KW saved for installations that result in
permanent peak KW demand reductions. Measureswhich qualify for the incentive include: HVACequipment, chillers, efficient motors, lightingefficiency, thermal integrity measures. Otherapplications, including industrial end-use applications,are eligible if approved by TU personnel;
2) the On-Peak Load Shift Cash IncentiveProgram provides a cash incentive of $100 per KWshifted to offset expenditures by customers who,through the purchase of capital equipment, are able tomove electricity usage from the peak time period tothe off-peak hours (8 p.m.-noon, weekdays, June-September). In both programs, TU fieldrepresentatives are available to assist the. customer.
102
Following TU, HL&P is now proposing anidentical program with cash incentives of $50 per KWsaved, and $100 per KW shifted to the off-peakperiod. HL&P's Industrial Efficiency ImprovementProgram would apply to industrial customers only.In addition to the cash incentives, the program wouldprovide information to assist the customer inidentifying energy efficient technologies, and anenergy audit.
This new approach includes several strongelements: customer flexibility in the choice ofmeasures; comprehensiveness; financial incentives tomotivate participation; and customer assistance. Theprograms do not have enough history to assess thecustomer response at this point (TU's programsstarted in 1991; HL&P's program is scheduled for a1992 implementation date). It remains to be seenwhether the cash incentives offered are sufficient toattract participation. A rebate of $50 per KW savedmay be too low. Considering that the utilities'avoided costs are around $650 per KW, a largemargin exists that should allow for a highercompensation for KW saved through energyefficiency.8
Most utilities in Texas do not have incentiveprograms to promote the adoption of energy efficientmeasures. Two utilities that provide cash incentivesfor the installation of energy efficiency measures maynot be offering sufficient payment per KW saved toattract substantial participation. Thus, industrialincentive programs cannot be expected to contributesignificantly to demand-side management energysavings.
SHARED SAVINGS, REQUEST FORPROPOSALS AND BIDDING PROGRAMS
A shared savings program is an arrangementbetween the utility and a customer or third party,whereby the customer or third party takes theresponsibility to install energy conservation measuresand receives in payment a share of the dollar savingsobtained through the installed measures. Request ForProposals (RFP) programs allow customers to submitspecific conservation projects to utilities for funding.Bidding programs are similar. They differ fromRFP's in that with RFP programs, the utilityprescribes the installations that can or cannot beproposed, whereas bidding programs allow for more
flexibility in the choice of energy efficientinstallations.
Utilities in Texas do not provide these types ofprograms at this point in time. Utilities in other partsof the country have experimented with them, in somecases extensively.9 The advantage of these programsis that they are well suited for large customers withengineering expertise such as those found in theindustrial sector. They also require a high level ofcommitment on the part of the customer or third partyresponsible for providing the savings. These types ofprograms tend to involve large projects which resultin high savings per customer. There is at the presenttime sufficient experience with these types ofprograms at utilities in other states, and it may betime for utilities in Texas to learn from theseexperiences and tap into the potentially large sourcesof demand and energy savings offered by theseprograms.
CONCLUSION
The industrial sector in Texas, because it ishighly electricity intensive, presents a high potentialfor demand and electric energy savings throughdemand-side management. However, most utilitieshave limited demand-side management activitiestargeting industrial customers. When they provideindustrial audits or technical assistance, it is as acustomer service, rather than as a way to tap intothese potential savings.
Energy audits and other technical assistanceprograms offered by Texas utilities often have loadincreasing objectives. Effective audit programs mustbe backed by strong management commitment todemand-side management as a resource option ratherthan a marketing tool. They must be supported byfollow-up activities and complemented by programsthat facilitate the adoption of the measures andequipment recommended in the audits. Finally, theymust secure high participation through adequatemarketing activities.
Shared savings, request for proposal and biddingprograms are types of programs that are not beingused in Texas. These programs may be the key tosignificantly increase electric energy and demandsavings obtainable in the industrial sector. Utilitiesshould consider implementing such programs in
103

Texas, taking advantage of the experience acquiredby other utilities around the country.
1 The program information used in this paper was obtained fromthe December 1991 Energy Efficiency Plans filed with thePublic Utility Commission by nine large, investor-ownedgenerating utilities in Texas.
2 Energy Information Administration, 1989, Annual EnergyReview 1988 (Washington, D.C.: U.S. Government PrintingOffice), p. 13.
3 Public Utility Commission of Texas, March 1991, Long TermElectric Peak Demand And Capacity Resource Forecast ForTexas, 1990, Volume H, page 1.7.
4 Source: Electric Power Research Institute, Impact of Demand-side Management on Future Customer Electricity Demand: AnUpdate, September 1990.
Source: see note # 4. The range of savings attributable to high-efficiency motors varies with different sources. A studyconducted by SRI International for HL&P puts the potentialsavings at 2% to 6%, while other studies predict a higher rangeof potential savings.
Source: See note #4, p. C-6.
Source: See note #4, pp. C-3 and C-6
Source: Public Utility Commission of Texas, A Summary ofUtility Load Forecasts and Resource Plans for Texas, February1992, pp. 17 and 19.
See for example Northeast Utilities' Customer InitiatedProgram, or Central Maine Power's Efficiency Buy-Ba.kProgram and Power Partners Program.
104
MICROWAVES AND CHEMISTRY : THE CATALYSIS OF AN EXCITING MARRIAGE
JEFF WAN, PROFESSOR OF CHEMISTRY, QUEEN'S UNIVERSITY, KINGSTON, CANADA
ABSTRACT
The potential of microwave power as a tool tofacilitate chemical reactions has not whetted thechemist's appetite in the past and the phenomenon anduses of microwaves have remained in the corner ofspectroscopists and engineers for a long time.
The possibility of microwave initiating chemicalchanges has nevertheless excited our imagination for thepast ten years. We will present the original developmentof the concept of microwave catalysis/sensitization inchemistry and the coming of age of the techniques as anenabling technology in the industrial world. A numberof demonstrated applications ranging from hydrocarbonoxidations to environmental technology will beillustrated.
BACKGROUND
The concept of using microwaves as an energysource for chemical reactions has only recently beenappreciated. Part of the reason for this has been the biasof chemists, raised on the principles of quantummechanics, who concluded that the energy provided bymicrowave radiation was too low to cause bond breakingor electron transfer reactions. In the past ten years wehave adapted a microwave catalysis/sensitizationtechnique to overcome these problems.
The simple fact that most organic chemicals donot absorb microwaves in the S band had guided us tothe idea of using a "sensitizer", i.e., a suitable materialwhich strongly absorb the microwave radiation andsubsequently transfers the energy required to initiate thechemical reactions to the desired substrate. A furtheradvantage of this concept follows when some verysuitable materials, such as amorphous paramagneticmetal particles supported by a non-absorbing medium,can serve the dual purposes as a "chemical catalysts" aswell as an "energy converter". This concept leads to thedevelopment of a technique which we call "microwavecatalysis". The rapid transient heating of the amorphousmetal surfaces by high power pulsed microwaves isprobably due to the enhanced scattering of charged
particles such as electrons. By using a propermicrowave pulse train, it is further possible to controlthe much desired chemical selectivity in the productsformed. In an ideal situation, one would have an instant,transient high temperature to provide the energy forchemical activation and immediately after the primaryreaction (which usually is less than a microsecond) thetemperature is cooled off below the activation barrier tominimize any secondary reactions leading to undesirableproducts. The actual rates of temperature increase anddecrease depend on several factors, including the natureand configuration of the metal surfaces, the peak powerand the duration of the microwave pulses, and thethermal conductivity of the catalyst. For each chemicaLsysiem there exists a unique activation energy barrier forthe forward reaction to proceed. A correspondingactivation temperature also exists for a particular set ofreaction conditions. The microwave pulses supply therequired energy for the catalyst surface to reach theactivation temperature rapidly. During the off cyclebetween each pulse, the surface and the support mediumwould conduct the excess heat away from the "hot" spotsand thus reduce the "dark" temperature which in turnminimize the secondary reactions.
EXPERIMENTAL DEVELOPMENT
An older version of our millisecond pulsemicrowave waveguide reactor system with an averagepower of 3 kW has been described in literature [1]. Thecurrent model of our system incorporated more precisepower monitoring devices, as well as a number ofimproved reactor designs. Our theory suggests that themodification of the microwave system upgrading it tomicrosecond pulse width and megawatt peak power levelshould improve the chemical selectivity and efficiency.Still, the basic system provided remarkable success indemonstrating the concept of our technology, includingour first major success in cracking methane to ethyleneand hydrogen [1,2], the destruction of chlorinatedhydrocarbons [3,4], the hydrodcsulfurization ofhydrocrackcd pitch [5], and the microwave treatment ofsome Alberta oil sands and bitumens in heavy oilrecovery.
105
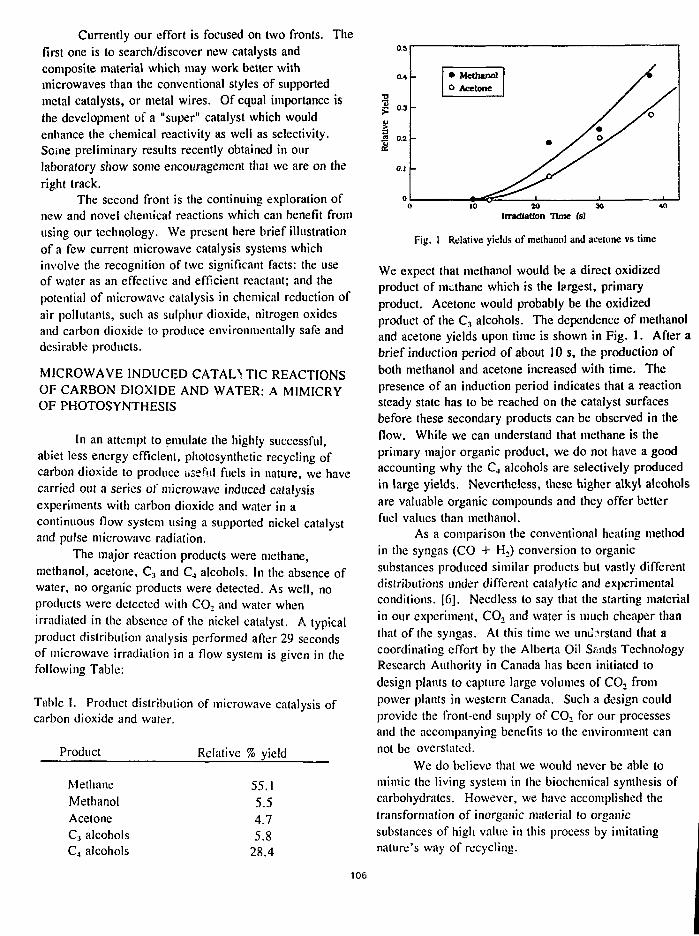
Currently our effort is focused on two fronts. Thefirst one is to search/discover new catalysts andcomposite material which may work better withmicrowaves than the conventional styles of supportedmetal catalysts, or metal wires. Of equal importance isthe development of a "super" catalyst which wouldenhance the chemical reactivity as well as selectivity.Some preliminary results recently obtained in ourlaboratory show some encouragement that we are on theright track.
The second front is the continuing exploration ofnew and novel chemical reactions which can benefit fromusing our technology. We present here brief illustrationof a few current microwave catalysis systems whichinvolve the recognition of two significant facts: the useof water as an effective and efficient reaclant; and thepotential of microwave catalysis in chemical reduction ofair pollutants, such as sulphur dioxide, nitrogen oxidesand carbon dioxide to produce environmentally safe anddesirable products.
MICROWAVE INDUCED CATALYTIC REACTIONSOF CARBON DIOXIDE AND WATER: A MIMICRYOF PHOTOSYNTHESIS
In an attempt to emulate the highly successful,abiet less energy efficient, photosynthetic recycling ofcarbon dioxide to produce useful fuels in nature, we havecarried out a series of' microwave induced calalysisexperiments with carbon dioxide and water in acontinuous flow system using a supported nickel catalystand pulse microwave radiation.
The major reaction products were methane,methanol, acetone, C3 and C, alcohols. In the absence ofwater, no organic products were detected. As well, noproducts were detected with CO2 and water whenirradiated in the absence of the nickel catalyst. A typicalproduct distribution analysis performed after 29 secondsof microwave irradiation in a flow system is given in thefollowing Table:
Table I. Product distribution of microwave catalysis ofcarbon dioxide and water.
Product
MethaneMethanolAcetoneC3 alcoholsC. alcohols
Relative % yield
55.15.54.75.8
28.4
0.5
2C 0.3
.2 0.2 -
-
-
• MethanolO Acetone
0 10 20 30 40Irradiation Time (s)
Fig. 1 Relative yields of methanol and acetone vs lime
We expect that methanol would be a direct oxidizedproduct of methane which is the largest, primaryproduct. Acetone would probably be the oxidizedproduct of the C3 alcohols. The dependence of methanoland acetone yields upon time is shown in Fig. 1. After abrief induction period of about 10 s, the production ofboth methanol and acetone increased with time. Thepresence of an induction period indicates that a reactionsteady state has to be reached on the catalyst surfacesbefore these secondary products can be observed in theflow. While we can understand that methane is theprimary major organic product, we do not have a goodaccounting why the CA alcohols are selectively producedin large yields. Nevertheless, these higher alkyl alcoholsare valuable organic compounds and they offer betterfuel values than methanol.
As a comparison the conventional heating methodin the syngas (CO + H2) conversion to organicsubstances produced similar products but vastly differentdistributions under different catalytic and experimentalconditions. [6]. Needless to say that the starting materialin our experiment, CO, and water is much cheaper thanthat of the syngas. At this time we unu^rstand that acoordinating effort by the Alberta Oil Sands TechnologyResearch Authority in Canada has been initialed todesign plants to capture large volumes of CO, frompower plants in western Canada. Such a design couldprovide the front-end supply of CO, for our processesand the accompanying benefits to the environment cannot be overstated.
We do believe that we would never be able tomimic the living system in the biochemical synthesis ofcarbohydrates. However, we have accomplished thetransformation of inorganic material to organicsubstances of high value in this process by imitatingnature's way of recycling.
106
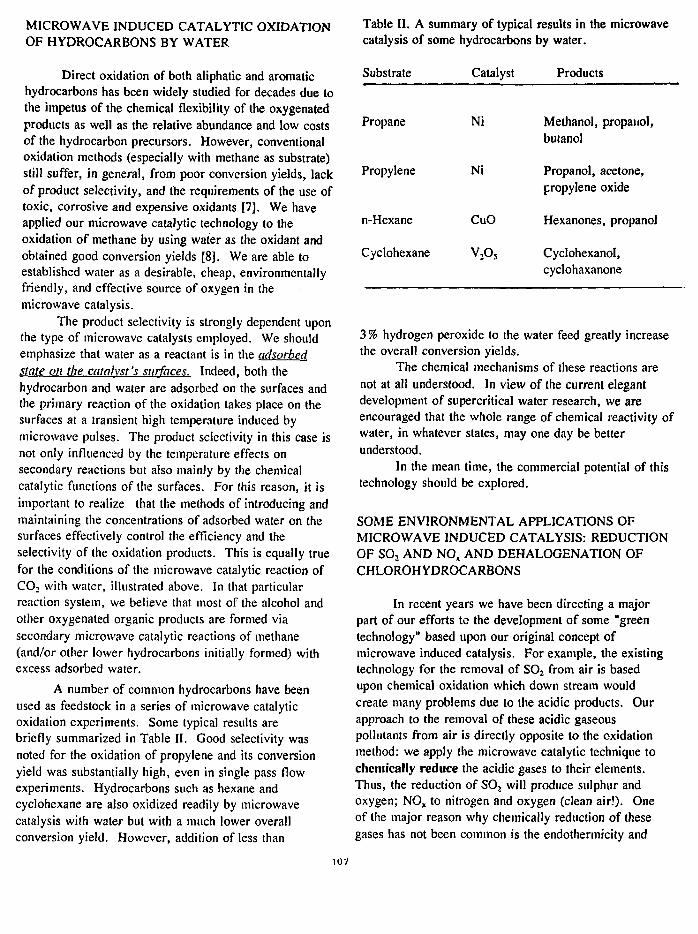
MICROWAVE INDUCED CATALYTIC OXIDATIONOF HYDROCARBONS BY WATER
Direct oxidation of both aliphatic and aromatichydrocarbons has been widely studied for decades due tothe impetus of the chemical flexibility of the oxygenatedproducts as well as the relative abundance and low costsof the hydrocarbon precursors. However, conventionaloxidation methods (especially with methane as substrate)still suffer, in general, from poor conversion yields, lackof product selectivity, and the requirements of the use oftoxic, corrosive and expensive oxidants [7]. We haveapplied our microwave catalytic technology to theoxidation of methane by using water as the oxidant andobtained good conversion yields [8]. We are able toestablished water as a desirable, cheap, environmentallyfriendly, and effective source of oxygen in themicrowave catalysis.
The product selectivity is strongly dependent uponthe type of microwave catalysts employed. We shouldemphasize that water as a reactant is in the adsorbedstate on the catalyst's surfaces. Indeed, both thehydrocarbon and water are adsorbed on the surfaces andthe primary reaction of the oxidation takes place on thesurfaces at a transient high temperature induced bymicrowave pulses. The product selectivity in this case isnot only influenced by the temperature effects onsecondary reactions but also mainly by the chemicalcatalytic functions of the surfaces. For this reason, it isimportant to realize that the methods of introducing andmaintaining the concentrations of adsorbed water on thesurfaces effectively control the efficiency and theselectivity of the oxidation products. This is equally truefor the conditions of the microwave catalytic reaction ofCO2 with water, illustrated above. In that particularreaction system, we believe that most of the alcohol andother oxygenated organic products are formed viasecondary microwave catalytic reactions of methane(and/or other lower hydrocarbons initially formed) withexcess adsorbed water.
A number of common hydrocarbons have beenused as feedstock in a series of microwave catalyticoxidation experiments. Some typical results arebriefly summarized in Table II. Good selectivity wasnoted for the oxidation of propylene and its conversionyield was substantially high, even in single pass flowexperiments. Hydrocarbons such as hexane andcyclohexane are also oxidized readily by microwavecatalysis with water but with a much lower overallconversion yield. However, addition of less than
Table II. A summary of typical results in the microwavecatalysis of some hydrocarbons by water.
Substrate Catalyst Products
Propane
Propylene
n-Hexane
Cyclohexane
Ni
Ni
CuO
v,os
Methanol, propanol,butanol
Propanol, acetone,propylene oxide
Hexanones, propanol
Cyclohexanol,cyclohaxanone
3 % hydrogen peroxide to the water feed greatly increasethe overall conversion yields.
The chemical mechanisms of these reactions arenot at all understood. In view of the current elegantdevelopment of supercritical water research, we areencouraged that the whole range of chemical reactivity ofwater, in whatever states, may one day be betterunderstood.
In the mean time, the commercial potential of thistechnology should be explored.
SOME ENVIRONMENTAL APPLICATIONS OFMICROWAVE INDUCED CATALYSIS: REDUCTIONOF SO, AND NOX AND DEHALOGENATION OFCHLOROHYDROCARBONS
In recent years we have been directing a majorpart of our efforts to the development of some "greentechnology" based upon our original concept ofmicrowave induced catalysis. For example, the existingtechnology for the removal of SO2 from air is basedupon chemical oxidation which down stream wouldcreate many problems due to the acidic products. Ourapproach to the removal of these acidic gaseouspollutants from air is directly opposite to the oxidationmethod: we apply the microwave catalytic technique tochemically reduce the acidic gases to their elements.Thus, the reduction of SOj will produce sulphur andoxygen; NOX to nitrogen and oxygen (clean air.'). Oneof the major reason why chemically reduction of thesegases has not been common is the endothermicity and
107
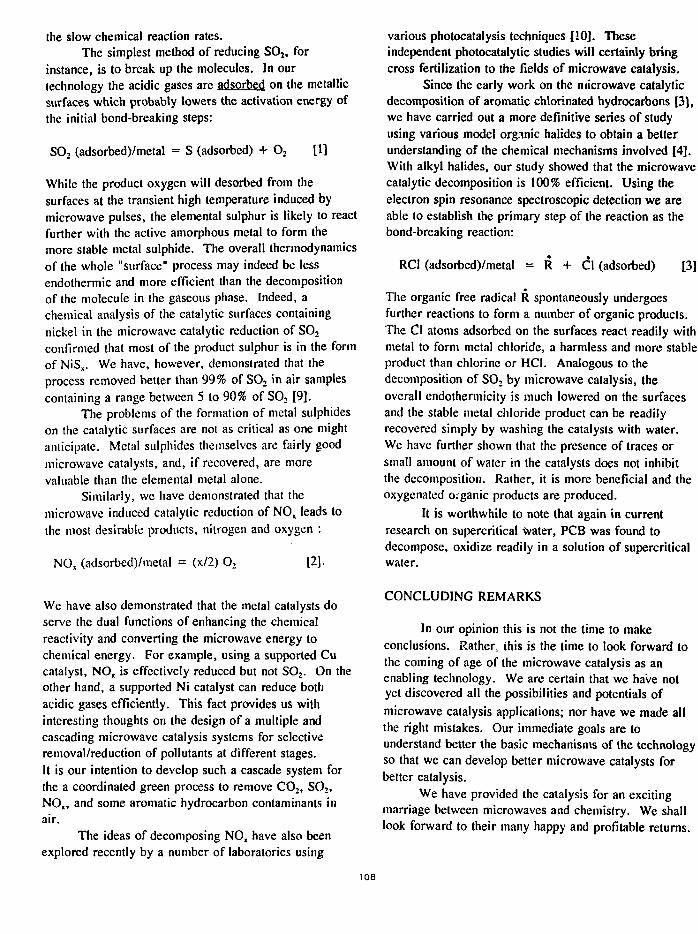
the slow chemical reaction rates.The simplest method of reducing SO2, for
instance, is to break up the molecules. In ourtechnology the acidic gases are adsorbed on the metallicsurfaces which probably lowers the activation energy ofthe initial bond-breaking steps:
SO, (adsorbed)/metal = S (adsorbed) + O, [1]
While the product oxygen will desorbed from thesurfaces at the transient high temperature induced bymicrowave pulses, the elemental sulphur is likely to reactfurther with the active amorphous metal to form themore stable metal sulphide. The overall thermodynamicsof the whole "surface" process may indeed be lessendothermic and more efficient than the decompositionof the molecule in the gaseous phase. Indeed, achemical analysis of the catalytic surfaces containingnickel in the microwave catalytic reduction of SO,confirmed that most of the product sulphur is in the formof NiSx. We have, however, demonstrated that theprocess removed better than 99% of SO2 in air samplescontaining a range between 5 to 90% of SO, [9].
The problems of the formation of metal sulphideson the catalytic surfaces are not as critical as one mightanticipate. Metal sulphides themselves are fairly goodmicrowave catalysts, and, if recovered, are morevaluable than the elemental metal alone.
Similarly, we have demonstrated that themicrowave induced catalytic reduction of NOX leads tothe most desirable products, nitrogen and oxygen :
NOX (adsorbed)/metal = (x/2) O2 12].
We have also demonstrated that the metal catalysts doserve the dual functions of enhancing the chemicalreactivity and converting the microwave energy tochemical energy. For example, using a supported Cucatalyst, NO, is effectively reduced but not SO2. On theother hand, a supported Ni catalyst can reduce bothacidic gases efficiently. This fact provides us withinteresting thoughts on the design of a multiple andcascading microwave catalysis systems for selectiveremoval/reduction of pollutants at different stages.It is our intention to develop such a cascade system forthe a coordinated green process to remove CO2, SO,,NOX, and some aromatic hydrocarbon contaminants inair.
The ideas of decomposing NO, have also beenexplored recently by a number of laboratories using
various photocatalysis techniques [10]. Theseindependent photocatalytic studies will certainly bringcross fertilization to the fields of microwave catalysis.
Since the early work on the microwave catalyticdecomposition of aromatic chlorinated hydrocarbons [3],we have carried out a more definitive series of studyusing various model organic halides to obtain a betterunderstanding of the chemical mechanisms involved [4].With alkyl halides, our study showed that the microwavecatalytic decomposition is 100% efficient. Using theelectron spin resonance spectroscopic detection we areable to establish the primary step of the reaction as thebond-breaking reaction:
RC1 (adsorbed)/metal = R + Cl (adsorbed) [3]
The organic free radical R spontaneously undergoesfurther reactions to form a number of organic products.The Cl atoms adsorbed on the surfaces react readily withmetal to form metal chloride, a harmless and more stableproduct than chlorine or HCI. Analogous to thedecomposition of SO, by microwave catalysis, theoverall endothermicity is much lowered on the surfacesand the stable metal chloride product can be readilyrecovered simply by washing the catalysts with water.We have further shown that the presence of traces orsmall amount of water in the catalysts does not inhibitthe decomposition. Rather, it is more beneficial and theoxygenated organic products are produced.
It is worthwhile to note that again in currentresearch on supercritical water, PCB was found todecompose, oxidize readily in a solution of supercriticalwater.
CONCLUDING REMARKS
In our opinion this is not the time to makeconclusions. Rather, this is the time to look forward tothe coming of age of the microwave catalysis as anenabling technology. We are certain that we have notyet discovered all the possibilities and potentials ofmicrowave catalysis applications; nor have we made allthe right mistakes. Our immediate goals are tounderstand better the basic mechanisms of the technologyso that we can develop better microwave catalysts forbetter catalysis.
We have provided the catalysis for an excitingmarriage between microwaves and chemistry. We shalllook forward to their many happy and profitable returns.
108

ACKNOWLEDGEMENTS
The author enthusiastically expresses his gratitudeto Drs. Cathy Depew, Yat Tse, Gratian Bamwenda, andmany present and former students of this laboratory formuch of the work given in this lecture. Financialsupport of this continuing study is provided by theNatural Sciences and Engineering Research Council ofCanada, the Alberta Oil Sands Technology ResearchAuthority, Department of Energy, Mines and ResourcesCanada, and the Ontario Ministry of Environment. Themuch needed personal advice and support by a numberof major industry is gratefully acknowledged.
REFERENCES
1. J.K.S. Wan, "Conversion of methane to ethyleneand hydrogen", US Patent 4 574 038, 1986.
2. J. Wan, M. Tse, H. Husby and M. Depew, "High-Power pulsed microwave Catalytic Processes:
Decomposition of Methane", J. Microwave PowerElectromagnetic Energy.25. 1, 1990.
3. J.K.S. Wan, "Method for disposal of ChemicalWaste", US Patent 4 345 983, 1982.
4. T. Dinesen, M.Y. Tse, M.C. Depew and J. Wan,"A Mechanistic Study of the microwave inducedCatalytic decomposition of organic halides",Research on Chemical Intermediates. 15, 113, 1991.
5. J.K.S. Wan and J. Kriz, "A Process for hydro-desulfurization of hydrocracked pitch", US Patent4 545 879, 1985.
6. For example, see J.K.S. Wan, G. Bamwenda andM.C. Depew, "Microwave induced catalyticreactions of carbon dioxide and water: Mimicryof photosynthesis", Research on ChemicalIntermediates. 16, 241, 1991, and referencetherein.
7. M.S. Scurrell, Applied Catalysis. 32, 1, 1987.
8. J.K.S. Wan, M.Y. Tse and M.C. Depew, "Micro-wave induced catalytic oxidations of hydrocarbonsby water", US Patent pending.
9. M.Y. Tse, M.C. Depew and J.K.S. Wan,"Applications of microwave induced catalysis',Research on Chemical Intermediates. 13, 221, 1990.
10. M. Anpo, T. Nomura, T. Kittao, E. Giamello, D.Murphy, M. Che and M.A. Fox, "Approach tode-NOX-ing photocatalysis. II.", Researchon Chemical Intermedia, 15, 225, 1991.
109
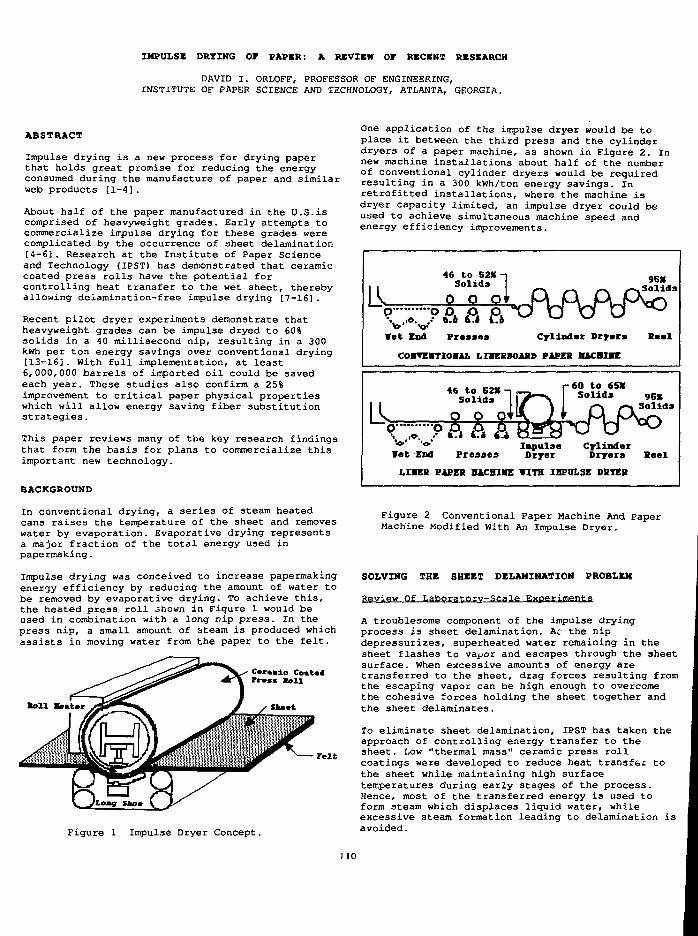
IMPULSE DRYING OF PAPER: A REVIEW OF RECENT RESEARCH
DAVID I. ORLOFF, PROFESSOR OF ENGINEERING,INSTITUTE OF PAPER SCIENCE AND TECHNOLOGY, ATLANTA, GEORGIA.
ABSTRACT
Impulse drying is a new process for drying paperthat holds great promise for reducing the energyconsumed during the manufacture of paper and similarweb products [1-4].
About half of the paper manufactured in the U.S.iscomprised of heavyweight grades. Early attempts tocommercialize impulse drying for these grades werecomplicated by the occurrence of sheet delamination[4-6]. Research at the Institute of Paper Scienceand Technology (IPST) has demonstrated that ceramiccoated press rolls have the potential forcontrolling heat transfer to the wet sheet, therebyallowing delamination-free impulse drying [7-16] .
Recent pilot dryer experiments demonstrate thatheavyweight grades can be impulse dryed to 60%solids in a 40 millisecond nip, resulting in a 300kwh per ton energy savings over conventional drying[13-16] . With full implementation, at least6,000,000 barrels of imported oil could be savedeach year. These studies also confirm a 25%improvement to critical paper physical propertieswhich will allow energy saving fiber substitutionstrategies.
This paper reviews many of the key research findingsthat form the basis for plans to commercialize thisimportant new technology.
BACKGROUND
In conventional drying, a series of steam heatedcans raises the temperature of the sheet and removeswater by evaporation. Evaporative drying representsa major fraction of the total energy used inpapermaking.
Impulse drying was conceived to increase papermakingenergy efficiency by reducing the amount of water tobe removed by evaporative drying. To achieve this,the heated press roll 3hown in Figure 1 would beused in combination with a long nip press. In thepress nip, a small amount of steam is produced whichassists in moving water from the paper to the felt.
•oil B*tt*r
- - Felt
One application of the impulse dryer would be toplace it between the third pres3 and the cylinderdryers of a paper machine, as shown in Figure 2. Innew machine installations about half of the numberof conventional cylinder dryers would be requiredresulting in a 300 kWh/ton energy savings. Inretrofitted installations, where the machine isdryer capacity limited, an impulse dryer could beused to achieve simultaneous machine speed andenergy efficiency improvements.
46 to 52XSolids
Vet End Presses Cylinder Dryers Baal
COPEniOUl LIBEBBOABD PAPER 1UCHIHE
60 to 65XSolids 95%
Solids
ImpulseDryer
CylinderDryersPresses
LIMER PAPEE IIICHUE TCTH IHPULSE DBTEB
Beel
Figure 1 Impulse Dryer Concept.
Figure 2 Conventional Paper Machine And PaperMachine Modified With An Impulse Dryer.
SOLVING THE SHEET DELAMINATION PROBLEM
Review Of Laboratory-Scale Experiments
A troublesome component of the impulse dryingprocess is sheet delamination. Ac the nipdepressurizes, superheated water remaining in thesheet flashes to vapor and escapes through the sheetsurface, when excessive amounts of energy aretransferred to the sheet, drag forces resulting fromthe escaping vapor can be high enough to overcomethe cohesive forces holding the sheet together andthe sheet delaminates.
To eliminate sheet delamination, IPST has taken theapproach of controlling energy transfer to thesheet. Low "thermal mass" ceramic press rollcoatings were developed to reduce heat transfer tothe sheet while maintaining high surfacetemperatures during early stages of the process.Hence, most of the transferred energy is used toform steam which displaces liquid water, whileexcessive steam formation leading to delamination isavoided.
110
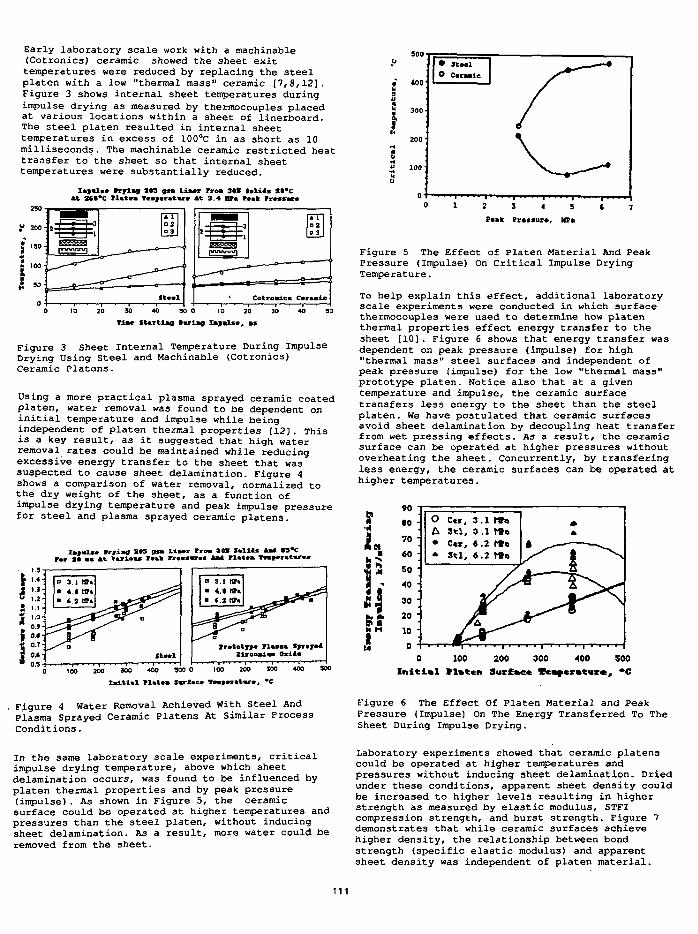
Early laboratory scale work with a machinable(Cotronics) ceramic showed the sheet exittemperatures were reduced by replacing the steelplaten with a low "thermal mass" ceramic [7,8,12].Figure 3 shows internal sheet temperatures duringimpulse drying as measured by thermocouples placedat various locations within a sheet of linerboard.The steel platen resulted in internal sheettemperatures in excess of 100°C in as short as 10milliseconds. The machinable ceramic restricted heattransfer to the sheet so that internal sheettemperatures were substantially reduced.
I«f*l» lrriag Its gn Uiir Tram 3t* Salils *«"Cit atl'C n*t»m T«)*ratw* It 3.4 or* *nt rnrnn
if 200
500
10 20 30 40 50 0 10 20 30 40 50
Tiac Starting Smrlag Xaf*lsc, as
Figure 3 Sheet Internal Temperature During ImpulseDrying Using Steel and Machinable (Cotronics)Ceramic Platens.
Using a more practical plasma sprayed ceramic coatedplaten, water removal was found to be dependent oninitial temperature and impulse while beingindependent of platen thermal properties [12] . Thisis a key result, as it suggested that high waterremoval rates could be maintained while reducingexcessive energy transfer to the sheet that wassuspected to cause sheet delamination. Figure 4shows a comparison of water removal, normalized tothe dry weight of the sheet, as a function ofimpulse drying temperature and peak impulse pressurefor steel and plasma sprayed ceramic platena.
I»»»ls» I m u 2tS g n Liacr Pro* 30k lolUJ U l *S*Cr«r 1* ax »t f u i o u F««» »osx«r»i UK rl«t«» M | i n t « »
a 3.1 HTa• ( i nr»• c.2 »»
rratotrr* Plaxaa S)r»r*tZixooaiaa Omit*
900 0
lirhct
200 300
Figure 4 Water Removal Achieved With Steel AndPlasma Sprayed Ceramic Platens At Similar ProcessConditions.
Figure 5 The Effect of Platen Material And PeakPressure (Impulse) On Critical Impulse DryingTemperature.
To help explain this effect, additional laboratoryscale experiments were conducted in which surfacethermocouples were used to determine how platenthermal properties effect energy transfer to thesheet [10] . Figure 6 shows that energy transfer wasdependent on peak pressure (impulse) for high"thermal mass" steel surfaces and independent ofpeak pressure (impulse) for the low "thermal mass"prototype platen. Notice also that at a giventemperature and impulse, the ceramic surfacetransfers less energy to the sheet than the steelplaten. We have postulated that ceramic surfacesavoid sheet delamination by decoupling heat transferfrom wet pressing effects. A3 a result, the ceramicsurface can be operated at higher pressures withoutoverheating the sheet. Concurrently, by transferingless energy, the ceramic surfaces can be operated athigher temperatures.
M M
»0
*0
70
60
SO
40
30
20
10
O C«r, 3.1 MiaA 3tl, 3.1 We• C*r, 6 .2 l*a* 3tl, » .2 W e
0 100 200 300 400 S00Initial XlnCen Surface ftafcntwc, *C
Figure 6 The Effect Of Platen Material and PeakPressure (Impulse) On The Energy Transferred To TheSheet During Impulse Drying.
In the same laboratory scale experiments, criticalimpulse drying temperature, above which sheetdelamination occurs, was found to be influenced byplaten thermal properties and by peak pressure(impulse). As shown in Figure 5, the ceramicsurface could be operated at higher temperatures andpressures than the steel platen, without inducingsheet delamination. As a result, more water could beremoved from the sheet.
Laboratory experiments showed that ceramic platenscould be operated at higher temperatures andpressures without inducing sheet delamination. Driedunder these conditions, apparent sheet density couldbe increased to higher levels resulting in higherstrength as measured by elastic modulus, STFIcompression strength, and burst strength. Figure 7demonstrates that while ceramic surfaces achievehigher density, the relationship between bondstrength (specific elastic modulus) and apparentsheet density was independent of platen material.
111
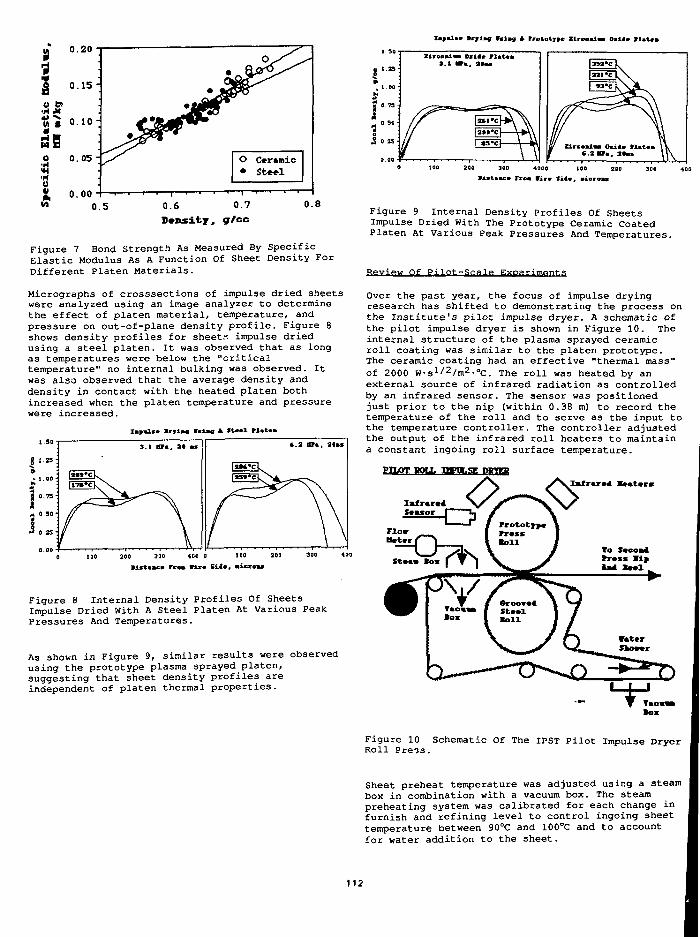
0.20
0.5 0.6 0.7
Density, g/cc
Figure 7 Bond Strength As Measured By SpecificElastic Modulus As A Function Of Sheet Density ForDifferent Platen Materials.
Micrographs of crosssections of impulse dried sheetswere analyzed using an image analyzer to determinethe effect of platen material, temperature, andpressure on out-of-plane density profile. Figure 8shows density profiles for sheets impulse driedusing a steel platen. It was observed that as longas temperatures were below the "criticaltemperature" no internal bulking was observed. Itwas also observed that the average density anddensity in contact with the heated platen bothincreased when the platen temperature and pressurewere increased.
200 300 400 0 100 200
>lst«BC» Fro* Wire 5ii«. aicroas
Figure 8 Internal Density Profiles Of SheetsImpulse Dried With A Steel Platen At Various PeakPressures And Temperatures.
A3 shown in Figure 9, similar results were observedU3ing the prototype plasma sprayed platen,suggesting that sheet density profiles areindependent of platen thermal properties.
Bistaac* Trim Wizm Sit*. Bicroas
Figure 9 Internal Density Profiles Of SheetsImpulse Dried With The Prototype Ceramic CoatedPlaten At Various Peak Pressures And Temperatures.
Rpvipw Of Pi 1 ol'.-fir:a 1t=»
Over the past year, the focus of impulse dryingresearch has shifted to demonstrating the process onthe Institute's pilot impulse dryer. A schematic ofthe pilot impulse dryer is shown in Figure 10. Theinternal structure of the plasma sprayed ceramicroll coating was similar to the platen prototype.The ceramic coating had an effective "thermal mass"of 2000 W-s1/'2/m2-oC. The roll was heated by anexternal source of infrared radiation as controlledby an infrared sensor. The sensor was positionedjust prior to the nip (within 0.38 m) to record thetemperature of the roll and to serve as the input tothe temperature controller. The controller adjustedthe output of the infrared roll heaters to maintaina constant ingoing roll surface temperature.
PILOT Wf\ir "HWVLSE DBTEB
1*1.
'•< biters
Figure 10 Schematic Of The IPST Pilot Impulse DryerRoll Pre^s.
Sheet preheat temperature was adjusted using a steambox in combination with a vacuum box. The steampreheating system was calibrated for each change infurnish and refining level to control ingoing sheettemperature between 90°C and 100"C and to accountfor water addition to the sheet.
112
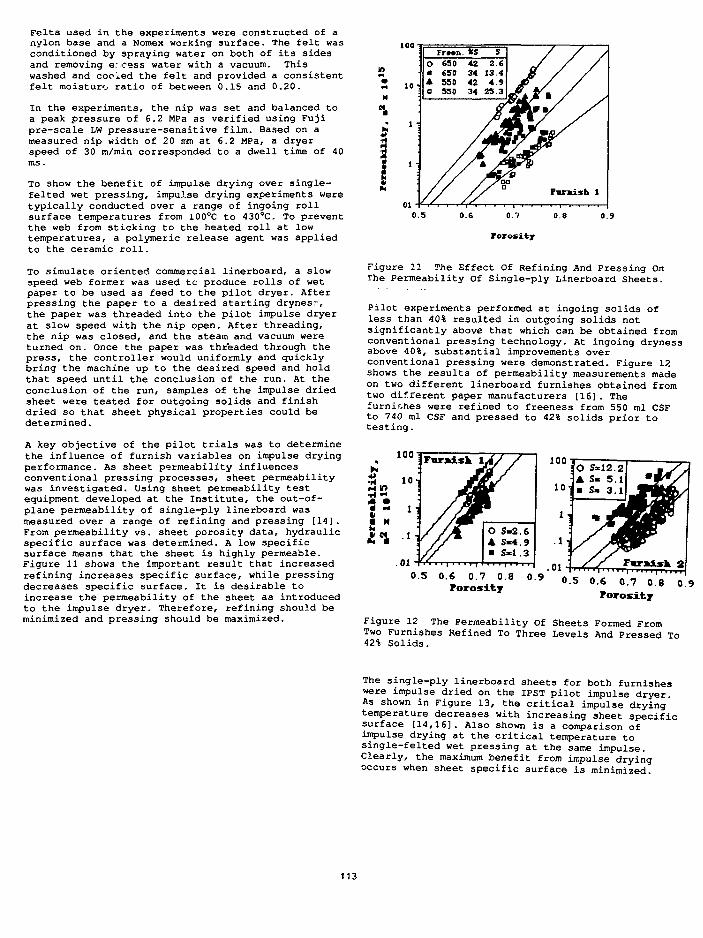
Felts used in the experiments were constructed of anylon base and a Nomex working surface. The felt wasconditioned by spraying water on both of its sidesand removing e:eess water with a vacuum. Thiswashed and cooled the felt and provided a consistentfelt moisture- ratio of between 0.15 and 0.20.
In the experiments, the nip was set and balanced toa peak pressure of 6.2 MPa as verified using Fujipre-scale LW pressure-sensitive film. Based on ameasured nip width of 20 mm at 6.2 MPa, a dryerspeed of 30 m/min corresponded to a dwell time of 40ms.
To show the benefit of impulse drying over single-felted wet pressing, impulse drying experiments weretypically conducted over a range of ingoing rollsurface temperatures from 100°C to 430°C. To preventthe web from sticking to the heated roll at lowtemperatures, a polymeric release agent was appliedto the ceramic roll.
To simulate oriented commercial linerboard, a slowspeed web former was used to produce rolls of wetpaper to be used as feed to the pilot dryer. Afterpressing the paper to a desired starting drynes.':,the paper was threaded into the pilot impulse dryerat slow speed with the nip open. After threading,the nip was closed, and the steam and vacuum wereturned on. Once the paper was threaded through thepress, the controller would uniformly and quicklybring the machine up to the desired speed and holdthat speed until the conclusion of the run. At theconclusion of the run, samples of the impulse driedsheet were tested for outgoing solids and finishdried so that sheet physical properties could bedetermined.
A key Objective of the pilot trials was to determinethe influence of furnish variables on impulse dryingperformance. As sheet permeability influencesconventional pressing processes, sheet permeabilitywas investigated. Using sheet permeability testequipment developed at the Institute, the out-of-plane permeability of single-ply linerboard wasmeasured over a range of refining and pressing [14].From permeability vs. sheet porosity data, hydraulicspecific surface was determined. A low specificsurface means that the sheet is highly permeable.Figure 11 shows the important result that increasedrefining increases specific surface, while pressingdecreases specific surface. It is desirable toincrease the permeability of the sheet as introducedto the impulse dryer. Therefore, refining should beminimized and pressing should be maximized.
010.5 0.9
Figure 11 The Effect Of Refining And Pressing OnThe Permeability Of Single-ply Linerboard Sheets.
Pilot experiments performed at ingoing solids ofless than 40% resulted in outgoing solids notsignificantly above that which can be obtained fromconventional pressing technology. At ingoing drynessabove 40%, substantial improvements overconventional pressing were demonstrated. Figure 12shows the results of permeability measurements madeon two different linerboard furnishes obtained fromtwo different paper manufacturers (16]. Thefurnishes were refined to freeness from 550 ml CSFto 740 ml CSF and pressed to 42% solids prior totesting.
.010.5 0.6 0.7 0.8
Porosity
Figure 12 The Permeability Of Sheets Formed FromTwo Furnishes Refined To Three Levels And Pressed To42% Solids.
The single-ply linerboard 3heets for both furnisheswere impulse dried on the IPST pilot impulse dryer.As shown in Figure 13, the critical impulse dryingtemperature decreases with increasing sheet specificsurface [14,16]. Also shown is a comparison ofimpulse drying at the critical temperature tosingle-felted wet pressing at the same impulse.Clearly, the maximum benefit from impulse dryingoccurs when sheet specific surface is minimized.
113
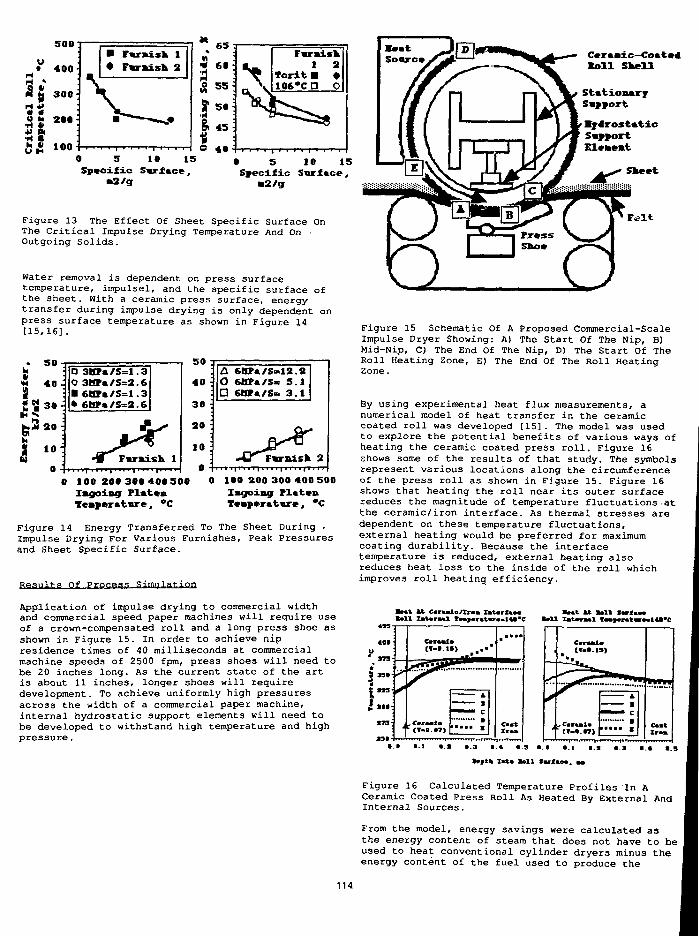
0 5 10 15Specific Swface,
•2/g
• ^v
Fmifk
Tcrit106*C
1
•D
2(^0
0 5 10 15Specific Surface,
•2/?
Figure 13 The Effect Of Sheet Specific Surface OnThe Critical Impulse Drying Temperature And On •Outgoing Solids.
Water removal is dependent on press surfacetemperature, impulsel, and the specific surface ofthe sheet. With a ceramic press surface, energytransfer during impulse drying is only dependent onpress surface temperature as shown in Figure 14(15,16].
• 3HPa/S=1.3O 3HPa/S=2.6• 6HPa/S=1.3
=2.6
Furnish 1
»o -
40 :
30 :20 :
10 :
0 -
AOa
6KF*/S>126HP»/S« 56HF«/S= 3
<
211
-CTFmria.sk 2
0 100 200 300 400 500Ingoing PlatenTemperature, °C
0 100 200 300 400 500Ingoing PlatenTemperature, *C
Figure 14 Energy Transferred To The Sheet During .Impulse Drying For Various Furnishes, Peak Pressuresand Sheet Specific Surface.
nf Pror.fiss Simulation
Figure 15 Schematic Of A Proposed Commercial-ScaleImpulse Dryer Showing: A) The Start Of The Nip, B)Mid-Nip, C) The End Of The Nip, D) The Start Of TheRoll Heating Zone, E) The End Of The Roll HeatingZone.
By using experimental heat flux measurements, anumerical model of heat transfer in the ceramiccoated roll was developed [15] . The model was usedto explore the potential benefits of various way3 ofheating the ceramic coated press roll. Figure 16shows some of the results of that study. The symbolsrepresent various locations along the circumferenceof the press roll as shown in Figure 15. Figure 16shows that heating the roll near its outer surfacereduces the magnitude of temperature fluctuations -atthe ceramic/iron interface. As thermal stresses aredependent on these temperature fluctuations,external heating would be preferred for maximumcoating durability. Because the interfacetemperature is reduced, external heating alsoreduces heat loss to the inside of the roll whichimproves roll heating efficiency.
Application of impulse drying to commercial widthand commercial speed paper machines will require useof a crown-compensated roll and a long press shoe asshown in Figure 15. In order to achieve nipresidence times of 40 milliseconds at commercialmachine speeds of 2500 fpm, press 3hoes will need tobe 20 inches long. As the current state of the artis about 11 inches, longer shoes will requiredevelopment. To achieve uniformly high pressuresacross the width of a commercial paper machine,internal hydrostatic support elements will need tobe developed to withstand high temperature and highpressure.
b t t « C«Mli>/Xr«B«ll Xitoratl T*«f«r»t«r«B
«.«t 1* loll tolmtell IitirMl T«H"tat.lU*C
Tata lol l Sarlto*. M
Figure 16 Calculated Temperature Profiles In ACeramic Coated Press Roll As Heated By External AndInternal Sources.
From the model, energy savings were calculated asthe energy content of steam that does not have to beused to heat conventional cylinder dryers minus theenergy content of the fuel used to produce the
114
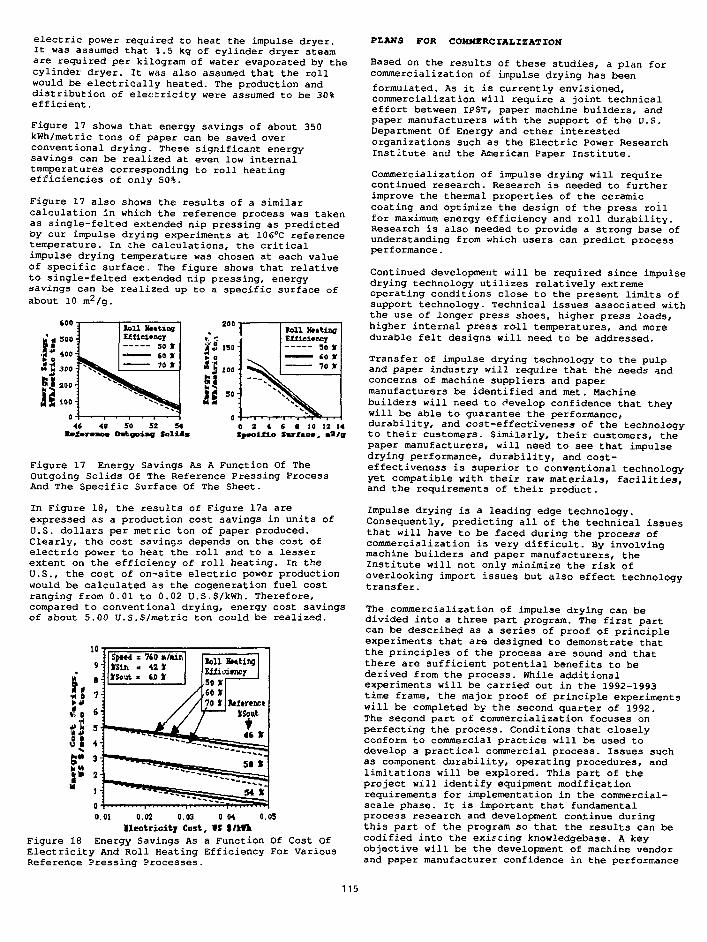
electric power required to heat the impulse dryer.It was assumed that 1.5 kg of cylinder dryer steamare required per kilogram of water evaporated by thecylinder dryer. It was also assumed that the rollwould be electrically heated. The production anddistribution of electricity were assumed to be 30%efficient.
Figure 17 shows that energy savings of about 350kWh/metric tons of paper can be saved overconventional drying. These significant energysavings can be realized at even low internaltemperatures corresponding to roll heatingefficiencies of only 50%.
Figure 17 also shows the results of a similarcalculation in which the reference process was takenas single-felted extended nip pressing as predictedby our impulse drying experiments at 106cC referencetemperature. In che calculations, the criticalimpulse drying temperature was chosen at each valueof specific surface. The figure shows that relativeto single-felted extended nip pressing, energysavings can be realized up to a specific surface ofabout 10 rn /g.
200
5 150
46 4« 50 52 54b f « n » Ostgoiag Solits
0 2 4 6Sjvoilio
I II 12 14
Figure 17 Energy Savings As A Function Of TheOutgoing Solids Of The Reference Pressing ProcessAnd The Specific Surface Of The Sheet.
In Figure 18, the results of Figure 17a areexpressed as a production cost savings in units ofU.S. dollars per metric ton of paper produced.Clearly, the cost savings depends on the cost ofelectric power to heat the roll and to a lesserextent on the efficiency of roll heating. In theU.S., the cost of on-site electric power productionwould be calculated as the cogeneration fuel costranging from 0.01 to 0.02 U.S.$/kWh. Therefore,compared to conventional drying, energy cost savingsof about 5.00 U.S.$/metric ton could be realized.
0.01 0.02 0.03 0 04 0.05Electricity Cost, IS t/kffc
Figure 18 Energy Savings As a Function Of Cost OfElectricity And Roll Heating Efficiency For VariousReference Pressing Processes.
PLANS FOR COMMERCIALIZATION
Based on the results of these studies, a plan forcommercialization of impulse drying has beenformulated. As it is currently envisioned,commercialization will require a joint technicaleffort between IPST, paper machine builders, andpaper manufacturers with the support of the U.S.Department Of Energy and other interestedorganizations such as the Electric Power ResearchInstitute and the American Paper Institute.
Commercialization of impulse drying will requirecontinued research. Research is needed to furtherimprove the thermal properties of the ceramiccoating and optimize the design of the press roilfor maximum energy efficiency and roll durability.Research is also needed to provide a strong base ofunderstanding from which users can predict processperformance.
Continued development will be required since impulsedrying technology utilizes relatively extremeoperating conditions close to the present limits ofsupport technology. Technical issues associated withthe use of longer press shoes, higher press loads,higher internal press roll temperatures, and moredurable felt designs will need to be addressed.
Transfer of impulse drying technology to the pulpand paper industry will require that the needs andconcerns of machine suppliers and papermanufacturers be identified and met. Machinebuilders will need to develop confidence that theywill be able to guarantee the performance,durability, and cost-effectiveness of the technologyto their customers. Similarly, their customers, thepaper manufacturers, will need to see that impulsedrying performance, durability, and cost-effectiveness is superior to conventional technologyyet compatible with their raw materials, facilities,and the requirements of their product.
Impulse drying is a leading edge technology.Consequently, predicting all of the technical issuesthat will have to be faced during the process ofcommercialization is very difficult. By involvingmachine builders and paper manufacturers, theInstitute will not only minimize the risk ofoverlooking import issues but also effect technologytransfer.
The commercialization of impulse drying can bedivided into a three part program. The first partcan be described as a series of proof of principleexperiments that are designed to demonstrate thatthe principles of the process are sound and thatthere are sufficient potential benefits to bederived from the process. While additionalexperiments will be carried out in the 1992-1993time frame, the major proof of principle experimentswill be completed by the second quarter of 1992.The second part of commercialization focuses onperfecting the process. Conditions that closelyconform to commercial practice will be used todevelop a practical commercial process. Issues suchas component durability, operating procedures, andlimitations will be explored. This part of theproject will identify equipment modificationrequirements for implementation in the commercial-scale phase. It is important that fundamentalprocess research and development continue duringthis part of the program so that the results can becodified into the existing knowledgebase. A keyobjective will be the development of machine vendorand paper manufacturer confidence in the performance
115
of the process and the various equipment subsystems.A key aspect of this part of the program will bedeveloping a contir-.-jous commercial speed impulsedryer for experiments on a pilot paper machine. Assignificant quantities of paper will be produced inthese experiments, the paper manufacturer will havea good opportunity to investigate the performance ofthe paper in various converting operations. Pilotpaper machine trials could be completed by thefourth quarter of 1994.
The third part of commercialization consists offull-scale experimentation and evaluation of thetechnology in a commercial environment. The purposeis to document the performance of the process and tosolve technology transfer problems as they arise.From the paper manufacturers viewpoint, the keyissues will be process performance in terms of paperproperty development, water removal, energyutilization, and equipment uptime. Paper propertydevelopment will be assessed in terms of measurableproperties and also in teiflis of the performance ofthe paper in its final application. Water removaland energy utilization will also be monitored toprovide a clear understanding of the economic impactof the process. Finally, the impact of the processon paper machine uptime will be assessed. This partof the commercialization plan will be completed atthe end of a 360 day/year commercial demonstrationby the fourth quarter of 1997.
ACKNOWLEDGEMENTS
The work reported was supported by the membercompanies of the Institute of Paper Science andTechnology and by the U.S. Department of EnergyOffice of Industrial Programs through Grant No. DE-FGO2-85CE40-738. Their support is gratefullyacknowledged. The author would also like toacknowledge the Electric Power Research Institutefor their support of future research in the areas ofEfficient Utilization of Electric Power for theImpulse Drying of Paper through EPRI ContractRP3328-03.
REFERENCES
1. Arenander, S., and Wahren, D., "Impulse DryingAdds New Dimension to Water Removal," TAPPI Journal,Vol.66, No. 9, (1983).
2. Sprague, C , and Lavery, H.P., "High-IntensityDrying Processes-Impulse Drying," Report 1 forDepartment of Energy Contract FGO2-85CE40738,DOE/CE/40738-T1, (1985).
3. Lavery, H.P., "High-Intensity Drying Processes-Impulse Drying," Report 2 for Department of EnergyContract FGO2-85CE40738, DOE/CE/40738-T2, (198V).
4. Lavery, H.P., "High-Intensity Drying Processes-Impulse Drying," Report 3 for Department of EnergyContract FGO2-85CE40738, DOE/CE/40738-T3, (1988) .
5. Crouse, J.W., Woo, Y.D', and Sprague, C.H.,"Delamination: A Stumbling Block To ImplementationOf Impulse Drying Technology For Linerboard," TappiEngineering Conference, Atlanta, Georgia, (1989).
6. Orloff, V.I., "High-Intensity Drying Processes-Impulse Drying," Report 4 for Department of EnergyContract FGO2-85CE40738, DOE/CE/40738-T4, (1989) .
7. Orlof.f, D.I., et al.. Method and Apparatus forDrying Web, U.S. Patent Application Number 417,261,Filed October 5, 1989, patent has been allowed,issue fee paid September 19, 1991.
8. Orloff, D.I.,"Impulse Drying of Paper-Fundamentals of Delamination and Its Control,"Presented at AICHE 1989 Annual Meeting,(1989).
9. Orloff, D.I., "High-Inte,nsity Drying Processes-Impulse Drying," Report 5 for Department of EnergyContract FGO2-85CE40738, DOE/CE/40738-T5, (1990) .10. Orloff, D.I., "High-Intensity Drying Processes-
. Impulse Drying," Yearly Report for Department ofEnergy Contract FG02-85CE40738, DOE/CE/40738-T6,(1991) .
11. Orloff, D.I., "Impulse Drying: HeterogeneousPress Surfaces Offer New Product Opportunities,"Proceedings 1991 Nonwovens Conference, TAPPI Press,(1991). In press, Tappi Journal (1992).
12. Orloff, D.I., "Impulse Drying Of Linerboard:Control Of Delamination," Proceedings of the 77thAnnual Meeting of the Technical Section of theCanadian Pulp and Paper Association, Montreal,Quebec, (1991), Journal of Pulp and Paper Science,(18)1, J23-J32 (1992).
13. Orloff, D.I., "Impulse Drying: ControllingDelamination in Heavy Weight Grades," Institute ofPaper Science and Technology 1991 Executives'Conference Proceedings, p.24-27, (1991) .
14. Orloff, D.I., and Lindsay, J.D, "Uhe Influenceof Yield, Refining and Ingoing Solids on the ImpulseDrying Performance of a Ceramic Coated Press Roll,"to be presented at the 1992 Tappi PapermakersConference, Nashville, (1992).
15. Orloff, D.I., Jones, G.L., and Phelan, P.M.,"The Effects of Heating Mode and Internal RollTemperature on Roll Durability and Efficiency ofImpulse Drying," to be presented at the 1992National Heat Transfer Conference, San Diego,(1992) .
16. Orloff, D.I., and Sobczynski, S.F., "ImpulseDrying Pilot Press Demonstration: Ceramic SurfacesInhibit Delamination," to be presented at SPCI'92ATICELCA Conference "The 4th New AvailableTechniques," Bologna, Italy (1992).
116

VOLUMETRIC IN SITU ELECTRICAL HEATING: AN UNEXPLOITED ELECTROTECHNOLOGY
J. E. BRIDGES, SENIOR SCIENCE ADVISOR, IIT RESEARCH INSTITUTE, CHICAGO, ILLINOIS
ABSTRACT
The use of electrical energy to heatlarge volumes of earth in place ("in situ")offers significant advantages overconventional in situ heat-transfer methods.For example, where properly applied, thenear-wellbore application of electricalenergy can triple flow rates from heavy-oilwells for an incremental operational costof only a few dollars per barrel. Theelectrically enhanced oil recovery (EEOR)single-well stimulation method produces 15barrels of oil for every barrel of oilconsumed at the electrical power plant.The EEOR process can be used in concertwith other enhanced oil recovery systems toreduce air pollution and to provide amarket for excess electrical powergeneration capacity. Other applications ofthe EEOR technology include the in situdecontamination of hazardous waste spillsand the disinfection of hospital wastes.
INTRODUCTION
The use of electrical energy to heatlarge volumes of earth in place ("in situ")offers major advantages over conventionalin situ heat transfer methods. Where hotfluids are used, the steam or hot gasesmust access the entire volume of theformation to be heated. However, suchaccess is not always possible, becausesteam tends to flow in the direction of thegreatest fluid permeability and also tendsto override the deposit. In some cases,hot gases from in situ combustion are usedfor heating, but such gases tend to dilutethe desired product.
A relatively unexploited alternative,electrical energy can be used to heat thedeposit volumetrically, in a manner similarto the heating that takes place in amicrowave oven, but in situ. To do thisrequires access to only one or two sides ofthe deposit to be heated; further, thelocation of the volume of earth to beelectrically heated can be more easilycontrolled. There are environmentaladvantages to the process: on-sitecombustion is not required; any on-sitefluid emissions are more easily treated;and the fluids or environment around theheated volume can be controlled independentof the heating, thereby eliminatingdilution of the product or combustion ofthe more volatile products of the process.
In the mid-1970s, we at IIT ResearchInstitute (IITRI) became interested inheating warehouse-size blocks of oil shalewith electrical energy principally in theshortwave radio-frequency (RF) band. Athermally efficient method to do this wasdemonstrated in a series of small-scalefield tests in the late 1970s and early1980s, but most of the activity withrespect to oil shale was shelved because ofthe drop in oil prices and the shift innational priorities from energyindependence to the Strategic DefenseInitiative, or "Star Wars."
We then modified our electrical insitu heating technology into a cost-cuttingmethod for enhancing production fromflowing heavy-oil reservoirs and into amore environmentally benign method fordecontaminating, in situ, warehouse-sizeblocks of earth near the surface. Further,we extended the technology to treat volumesof material such as hospital wastes andradioactive materials.
When properly applied, all of theseapproaches offer major advantages overexisting conventional heat-transfertechnologies. The most interesting aspectis that they can be highly energy-efficient. In the case of heavy-oil wellstimulation, the approach is capable ofproducing 15 barrels of oil or more forevery equivalent barrel of oil consumed atthe electrical power plant. Further, theseapproaches offer avenues for considerablecost savings. For example, the electricalenhanced oil recovery (EEOR) method forheavy-oil wells has been demonstrated infield tests to triple flow rates from wellsin heavy-oil reservoirs for an operationalcost of only a few dollars per incrementalbarrel of oil produced. All of theseapproaches offer environmental advantagesinasmuch as no on-site combustion isrequired and water use, if any, is minimal.
In many cases, the EEOR method cancomplement existing heavy-oil recoverymethods by providing a market for off-peakpower supplied either by cogenerationfacilities or by the electrical utilities.
• To illustrate these benefits, thispaper focuses primarily on the use of theEEOR approach to enhance flow rates fromheavy-oil wells. Although this paperprovides only a summary of the variousother approaches, the references citedprovide an in-depth technical discussion.
1 17
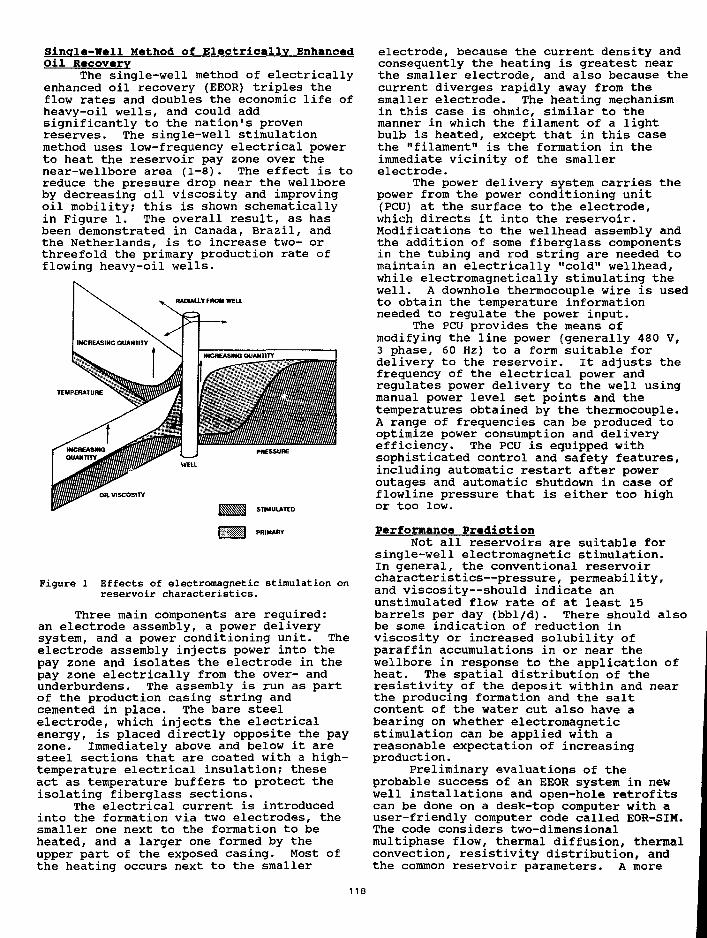
Single-Well Method of Electrically EnhancedOil Recovery
The single-well method of electricallyenhanced oil recovery (EEOR) triples theflow rates and doubles the economic life ofheavy-oil wells, and could addsignificantly to the nation's provenreserves. The single-well stimulationmethod uses low-frequency electrical powerto heat the reservoir pay zone over thenear-wellbore area (1-8). The effect is toreduce the pressure drop near the wellboreby decreasing oil viscosity and improvingoil mobility; this is shown schematicallyin Figure 1. The overall result, as hasbeen demonstrated in Canada, Brazil, andthe Netherlands, is to increase two- orthreefold the primary production rate offlowing heavy-oil wells.
RADUUY FROM WELL
Figure 1 Effects of electromagnetic stimulation onreservoir characteristics.
Three main components are required:an electrode assembly, a power deliverysystem, and a power conditioning unit. Theelectrode assembly injects power into thepay zone and isolates the electrode in thepay zone electrically from the over- andunderburdens. The assembly is run as partof the production casing string andcemented in place. The bare steelelectrode, which injects the electricalenergy, is placed directly opposite the payzone. Immediately above and below it aresteel sections that are coated with a high-temperature electrical insulation; theseact as temperature buffers to protect theisolating fiberglass sections.
The electrical current is introducedinto the formation via two electrodes, thesmaller one next to the formation to beheated, and a larger one formed by theupper part of the exposed casing. Most ofthe heating occurs next to the smaller
electrode, because the current density andconsequently the heating is greatest nearthe smaller electrode, and also because thecurrent diverges rapidly away from thesmaller electrode. The heating mechanismin this case is ohmic, similar to themanner in which the filament of a lightbulb is heated, except that in this casethe "filament" is the formation in theimmediate vicinity of the smallerelectrode.
The power delivery system carries thepower from the power conditioning unit(PCU) at the surface to the electrode,which directs it into the reservoir.Modifications to the wellhead assembly andthe addition of some fiberglass componentsin the tubing and rod string are needed tomaintain an electrically "cold" wellhead,while electromagnetically stimulating thewell. A downhole thermocouple wire is usedto obtain the temperature informationneeded to regulate the power input.
The PCU provides the means ofmodifying the line power (generally 480 V,3 phase, 60 Hz) to a form suitable fordelivery to the reservoir. It adjusts thefrequency of the electrical power andregulates power delivery to the well usingmanual power level set points and thetemperatures obtained by the thermocouple.A range of frequencies can be produced tooptimize power consumption and deliveryefficiency. The PCU is equipped withsophisticated control and safety features,including automatic restart after poweroutages and automatic shutdown in case offlowline pressure that is either too highor too low.
Performance PredictionNot all reservoirs are suitable for
single-well electromagnetic stimulation.In general, the conventional reservoircharacteristics—pressure, permeability,and viscosity—should indicate anunstimulated flow rate of at least 15barrels per day (bbl/d). There should alsobe some indication of reduction inviscosity or increased solubility ofparaffin accumulations in or near thewellbore in response to the application ofheat. The spatial distribution of theresistivity of the deposit within and nearthe producing formation and the saltcontent of the water cut also have abearing on whether electromagneticstimulation can be applied with areasonable expectation of increasingproduction.
Preliminary evaluations of theprobable success of an EEOR system in newwell installations and open-hole retrofitscan be done on a desk-top computer with auser-friendly computer code called EOR-SIM.The code considers two-dimensionalmultiphase flow, thermal diffusion, thermalconvection, resistivity distribution, andthe common reservoir parameters. A more
118
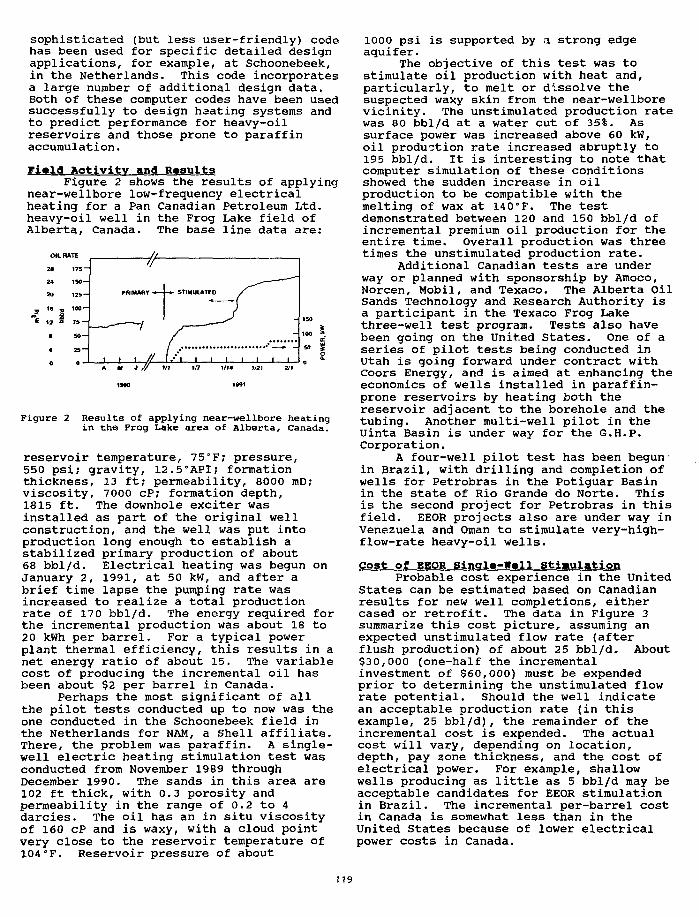
sophisticated (but less user-friendly) codehas been used for specific detailed designapplications, for example, at Schoonebeek,in the Netherlands. This code incorporatesa large number of additional design data.Both of these computer codes have been usedsuccessfully to design haating systems andto predict performance for heavy-oilreservoirs and those prone to paraffinaccumulation.
Fiald Activity and RasultsFigure 2 shows the results of applying
near-wellbore low-frequency electricalheating for a Pan Canadian Petroleum Ltd.heavy-oil well in the Frog Lake field ofAlberta, Canada. The base line data are:
*„
HLRATE
• 175 —
4 ISO —
0 125 —
2 3 7 5 -
1 50—
25 —
' '
PRIMARY ••—I
1——'/• • i / /
-#• STIMULATED /""^
J/»*
.* 1 1 1 1 1 1 1 11/14 1/21
1991
Figure 2 Results of applying near-wellbore heatingin the Frog Lake area of Alberta, Canada.
reservoir temperature, 75°F; pressure,550 psi; gravity, 12.5"API; formationthickness, 13 ft; permeability, 8000 mD;viscosity, 7000 cP; formation depth,1815 ft. The downhole exciter wasinstalled as part of the original wellconstruction, and the well was put intoproduction long enough to establish astabilized primary production of about68 bbl/d. Electrical heating was begun onJanuary 2, 1991, at 50 kW, and after abrief time lapse the pumping rate wasincreased to realize a total productionrate of 17 0 bbl/d. The energy required forthe incremental production was about 18 to20 kWh per barrel. For a typical powerplant thermal efficiency, this results in anet energy ratio of about 15. The variablecost of producing the incremental oil hasbeen about $2 per barrel in Canada.
Perhaps the most significant of allthe pilot tests conducted up to now was theone conducted in the Schoonebeek field inthe Netherlands for NAM, a Shell affiliate.There, the problem was paraffin. A single-well electric heating stimulation test wasconducted from November 1989 throughDecember 1990. The sands in this area are102 ft thick, with 0.3 porosity andpermeability in the range of 0.2 to 4darcies. The oil has an in situ viscosityof 160 cP and is waxy, with a cloud pointvery close to the reservoir temperature of104°F. Reservoir pressure of about
1000 psi is supported by a strong edgeaquifer.
The objective of this test was tostimulate oil production with heat and,particularly, to melt or dissolve thesuspected waxy skin from the near-wellborevicinity. The unstimulated production ratewas 80 bbl/d at a water cut of 35%. Assurface power was increased above 60 kW,oil production rate increased abruptly to195 bbl/d. It is interesting to note thatcomputer simulation of these conditionsshowed the sudden increase in oilproduction to be compatible with themelting of wax at 140°F. The testdemonstrated between 120 and 150 bbl/d ofincremental premium oil production for theentire time. Overall production was threetimes the unstimulated production rate.
Additional Canadian tests are underway or planned with sponsorship by Amoco,Norcen, Mobil, and Texaco. The Alberta OilSands Technology and Research Authority isa participant in the Texaco Frog Lakethree-well test program. Tests also havebeen going on the United States. One of aseries of pilot tests being conducted inUtah is going forward under contract withCoors Energy, and is aimed at enhancing theeconomics of wells installed in paraffin-prone reservoirs by heating both thereservoir adjacent to the borehole and thetubing. Another multi-well pilot in theUinta Basin is under way for the G.H.P.Corporation.
A four-well pilot test has been begunin Brazil, with drilling and completion ofwells for Petrobras in the Potiguar Basinin the state of Rio Grande do Norte. Thisis the second project for Petrobras in thisfield. EEOR projects also are under way inVenezuela and Oman to stimulate very-high-flow-rate heavy-oil wells.
Cost of EEOR Single-Wall StimulationProbable cost experience in the United
States can be estimated based on Canadianresults for new well completions, eithercased or retrofit. The data in Figure 3summarize this cost picture, assuming anexpected unstimulated flow rate (afterflush production) of about 25 bbl/d. About$30,000 (one-half the incrementalinvestment of $60,000) must be expendedprior to determining the unstimulated flowrate potential. Should the well indicatean acceptable production rate (in thisexample, 25 bbl/d), the remainder of theincremental cost is expended. The actualcost will vary, depending on location,depth, pay zone thickness, and the cost ofelectrical power. For example, shallowwells producing as little as 5 bbl/d may beacceptable candidates for EEOR stimulationin Brazil. The incremental per-barrel costin Canada is somewhat less than in theUnited States because of lower electricalpower costs in Canada.
119
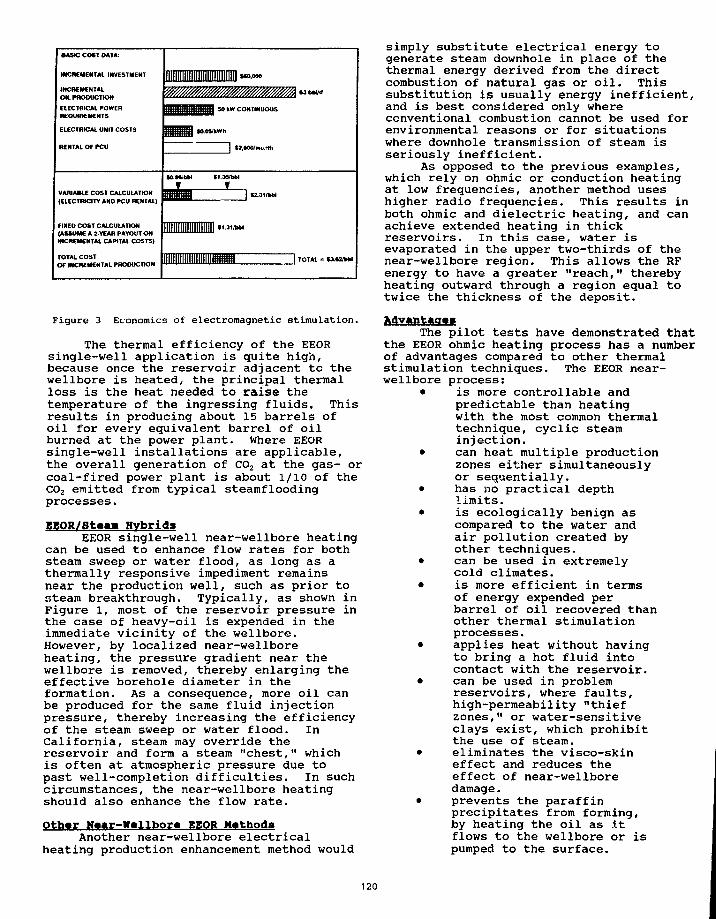
•ASIC COST DATA:
INCREMENTAL INVESTMENT
INCREMENTALOH. PRODUCTIONELECTRICAL POWERREQUIREMENTS
ELECTRICAL UNIT COSTS
RENTAL OF PCU
VARIAM.E COST CALCULATION(ELECTRICITY AND PCU RENTAL)
FIXED COST CALCULATION
INCREMENTAL CAPITAL COSTS)
TOTAL COST
Illllllllllllllllllllllllllll!*-.™
IIIIIIIIIIIIIIIIIIH SO kW CONTINUOUS
3839351 taovkwh
| t;.«K>fno.lth
SaM/bW «t.3&bM
Illlllllllllllllllll »*••»>
IIIIIIIIIIIIIIIHII^m 1 TOTAL . . M M * .
Figure 3 Economics of electromagnetic stimulation.
The thermal efficiency of the EEORsingle-well application is quite high,because once the reservoir adjacent tc thewellbore is heated, the principal thermalloss is the heat needed to raise thetemperature of the ingressing fluids. Thisresults in producing about 15 barrels ofoil for every equivalent barrel of oilburned at the power plant. Where EEORsingle-well installations are applicable,the overall generation of C02 at the gas- orcoal-fired power plant is about 1/10 of theCO2 emitted from typical steamfloodingprocesses.
EE0R/St«am HybridsEEOR single-well near-wellbore heating
can be used to enhance flow rates for bothsteam sweep or water flood, as long as athermally responsive impediment remainsnear the production well, such as prior tosteam breakthrough. Typically, as shown inFigure 1, most of the reservoir pressure inthe case of heavy-oil is expended in theimmediate vicinity of the wellbore.However, by localized near-wellboreheating, the pressure gradient near thewellbore is removed, thereby enlarging theeffective borehole diameter in theformation. As a consequence, more oil canbe produced for the same fluid injectionpressure, thereby increasing the efficiencyof the steam sweep or water flood. InCalifornia, steam may override thereservoir and form a steam "chest," whichis often at atmospheric pressure due topast well-completion difficulties. In suchcircumstances, the near-wellbore heatingshould also enhance the flow rate.
OthT War-Wllbor« EEOR tfthodaAnother near-wellbore electrical
heating production enhancement method would
simply substitute electrical energy togenerate steam downhole in place of thethermal energy derived from the directcombustion of natural gas or oil. Thissubstitution is usually energy inefficient,and is best considered only whereconventional combustion cannot be used forenvironmental reasons or for situationswhere downhole transmission of steam isseriously inefficient.
As opposed to the previous examples,which rely on ohmic or conduction heatingat low frequencies, another method useshigher radio frequencies. This results inboth ohmic and dielectric heating, and canachieve extended heating in thickreservoirs. In this case, water isevaporated in the upper two-thirds of thenear-wellbore region. This allows the RFenergy to have a greater "reach," therebyheating outward through a region equal totwice the thickness of the deposit.
AdvantagesThe pilot tests have demonstrated that
the EEOR ohmic heating process has a numberof advantages compared to other thermalstimulation techniques. The EEOR near-wellbore process:
• is more controllable andpredictable than heatingwith the most common thermaltechnique, cyclic steaminjection.
• can heat multiple productionzones either simultaneouslyor sequentially.
• has no practical depthlimits.
• is ecologically benign ascompared to the water andair pollution created byother techniques.
• can be used in extremelycold climates.
• is more efficient in termsof energy expended perbarrel of oil recovered thanother thermal stimulationprocesses.
• applies heat without havingto bring a hot fluid intocontact with the reservoir.
• can be used in problemreservoirs, where faults,high-permeability "thiefzones," or water-sensitiveclays exist, which prohibitthe use of steam.
• eliminates the visco-skineffect and reduces theeffect of near-wellboredamage.
• prevents the paraffinprecipitates from forming,by heating the oil as itflows to the wellbore or ispumped to the surface.
120

• can be used in concert withother enhanced oil recoverysystems.
Applicable Reserves in the United StatesThe major heavy-oil reservoirs in the
United States that might be expected tobenefit from the EEOR heating technologyare found mainly in Alaska, California,Wyoming, Oklahoma, Texas, Louisiana, andMississippi. There are also light-oilparaffin-prone oil deposits in some ofthese states as well as in some others.The EEOR technologies, when mature, couldplace in production a sizeable fraction ofthe 25 billion barrels of heavy-oil inplace in Alaska by mitigating thepermafrost difficulties associated withsteam stimulation. Further, mor.e than one-half of the 80 billion barrels of oil inplace in the United States exist below.3000ft, a depth that is generally' inappropriatefor steam stimulation but fully reachableby the EEOR method. Further development bysteam of the 40 billion barrels of heavy-oil reserves in California is severelyimpeded by air quality considerations. TheEEOR method could greatly reduce harmfulemissions whether used alone or inconjunction with conventional steam-assisted methods.
Other Near-Wellbore EEOR UsesThere are additional applications of
electromagnetic heating technology. Forexample, it can be used to heat theproduction tubing to eliminate flow rateimpediments caused by paraffin, gashydrates, or sulfur, or by rod drop orpumping problems associated with high-viscosity crudes.
EEOR installation can accept off-peakpower and, in some cases, can evenwithstand a delay in power application fora few days. This energy-storage abilitymay also offer attractive EEOR options whenused in conjunction with cogenerationfacilities or for load leveling strategiesfor electrical utilities.
LARGE-BLOCK EEOR
Oil ShaleWhen IITRI began to investigate EEOR
heating in the mid-1970s, we hoped todetermine whether an EEOR process, in thiscase the RF dielectric heating version,could overcome some of the environmental,economic, and social concerns inherent inthe conventional shale oil extractionprocesses.
During our initial examination of anapproach suitable for in situ RF heating,we discovered that the simple dropping ofantennas into boreholes would not work, inpart because of the wasteful use of energy,which overheated the oil shale near theborehole and both underheated and under-retorted it some distance away.
To overcome this limitation, wedeveloped a method of uniformly heating theoil shale by dielectric heating within theconfines of multiple rows of parallelconductors placed into the deposit (9).These rows of conductors simulate parallelconducting plates, which create a uniformfield and therefore result in largelyuniform heating. As opposed to antennas,these arrays contain virtually all of theelectromagnetic energy when the spacing ofthe conductors is properly chosen. In sucha case, significantly more energy isproduced in the form of a high-gradesyncrude than is consumed in the coal-firedpower plant that supplies the basic acpower, typically three barrels of syncrudefor every equivalent barrel of oil consumedat the power plant.
Based on the advantages of thisunexploited technology, a cooperativeprogram was initiated in the late 1970s byIITRI, the U.S. Department of Energy, andHalliburton Services. During this multi-million-dollar program, four successfulsmall-scale field tests were conducted, twoin oil shale and two in tar sand. Thesetests established that RF in situ heatingcould be successfully accomplished and thatpermeability could be induced in oil shaleas the kerogen decomposed and formedinterlocking void spaces. Considerablelaboratory and analytical work, much of itindependent of IITRI, established that avery large fraction of the high-Btu gas andhigh-quality liquids could be recovered iflarge oil shale blocks were properly heatedwith RF energy. This aspect, however,remains to be demonstrated on a largescale.
In 1984, the Bechtel Group (10), undercontract to Occidental, developed apreliminary conceptual design for acommercial-scale integrated RF retortingplan. The results of this studydemonstrated that upgraded shale oilproduced by the RF process could beprofitably sold at a price between $25 and$3 5 per barrel, and that this process wasthe least environmentally damaging. Morerecently, by taking advantage of the moreefficient gas-fired, combined-cycle powerplants and other factors such as lowerretorting temperatures, this cost rangecould be reduced to around $20 to $30 perbarrel for 25 gal/ton assay oil shale (11).
Large-Block EEOR for Thick, Rich. ShallowHeavy-Oil Deposits
Based on the uniform heatingtechnologies developed for oil shale, IITRIhas developed and tested on a limited scaleseveral large-block in situ heatingversions (12-14). Figure 4 shows one ofthese versions. The concept is implementedby emplacing electrode arrays around thewellbore and energizing these electrodessuch that the deposit is more or lessuniformly heated to a larger radius than is
121
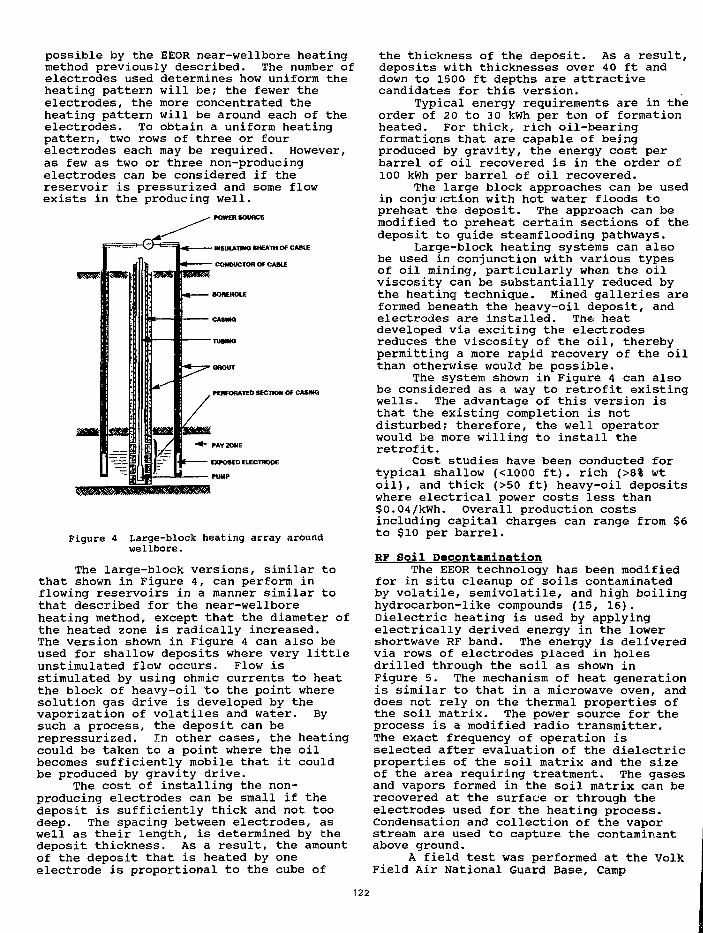
possible by the EEOR near-wellbore heatingmethod previously described. The number ofelectrodes used determines how uniform theheating pattern will be; the fewer theelectrodes, the more concentrated theheating pattern will be around each of theelectrodes. To obtain a uniform heatingpattern, two rows of three or fourelectrodes each may be required. However,as few as two or three non-producingelectrodes can be considered if thereservoir is pressurized and some flowexists in the producing well.
POWER SOURCE
HtSULATHKl SHEATH OF CABLE
CONOUCIOR OF CABi£
Figure 4 Large-block heating array aroundwellbore.
The large-block versions, similar tothat shown in Figure 4, can perform inflowing reservoirs in a manner similar tothat described for the near-wellboreheating method, except that the diameter ofthe heated zone is radically increased.The version shown in Figure 4 can also beused for shallow deposits where very littleunstimulated flow occurs. Flow isstimulated by using ohmic currents to heatthe block of heavy-oil to the point wheresolution gas drive is developed by thevaporization of volatiles and water. Bysuch a process, the deposit can berepressurized. In other cases, the heatingcould be taken to a point where the oilbecomes sufficiently mobile that it couldbe produced by gravity drive.
The cost of installing the non-producing electrodes can be small if thedeposit is sufficiently thick and not toodeep. The spacing between electrodes, aswell as their length, is determined by thedeposit thickness. As a result, the amountof the deposit that is heated by oneelectrode is proportional to the cube of
the thickness of the deposit. As a result,deposits with thicknesses over 40 ft anddown to 1500 ft depths are attractivecandidates for this version.
Typical energy requirements are in theorder of 2 0 to 30 kWh per ton of formationheated. For thick, rich oil-bearingformations that are capable of beingproduced by gravity, the energy cost perbarrel of oil recovered is in the order of100 kWh per barrel of oil recovered.
The large block approaches can be usedin conjunction with hot water floods topreheat the deposit. The approach can bemodified to preheat certain sections of thedeposit to guide steamflooding pathways.
Large-block heating systems can alsobe used in conjunction with various typesof oil mining, particularly when the oilviscosity can be substantially reduced bythe heating technique. Mined galleries areformed beneath the heavy-oil deposit, andelectrodes are installed. The heatdeveloped via exciting the electrodesreduces the viscosity of the oil, therebypermitting a more rapid recovery of the oilthan otherwise would be possible.
The system shown in Figure 4 can alsobe considered as a way to retrofit existingwells. The advantage of this version isthat the existing completion is notdisturbed; therefore, the well operatorwould be more willing to install theretrofit.
Cost studies have been conducted fortypical shallow (<1000 ft). rich (>8% wtoil), and thick (>50 ft) heavy-oil depositswhere electrical power costs less than$0.04/kWh. Overall production costsincluding capital charges can range from $6to $10 per barrel.
RF Soil DecontaminationThe EEOR technology has been modified
for in situ cleanup of soils contaminatedby volatile, semivolatile, and high boilinghydrocarbon-like compounds (15, 16).Dielectric heating is used by applyingelectrically derived energy in the lowershortwave RF band. The energy is deliveredvia rows of electrodes placed in holesdrilled through the soil as shown inFigure 5. The mechanism of heat generationis similar to that in a microwave oven, anddoes not rely on the thermal properties ofthe soil matrix. The power source for theprocess is a modified radio transmitter.The exact frequency of operation isselected after evaluation of the dielectricproperties of the soil matrix and the sizeof the area requiring treatment. The gasesand vapors formed in the soil matrix can berecovered at the surface or through theelectrodes used for the heating process.Condensation and collection of the vaporstream are used to capture the contaminantabove ground.
A field test was performed at the VolkField Air National Guard Base, Camp
122
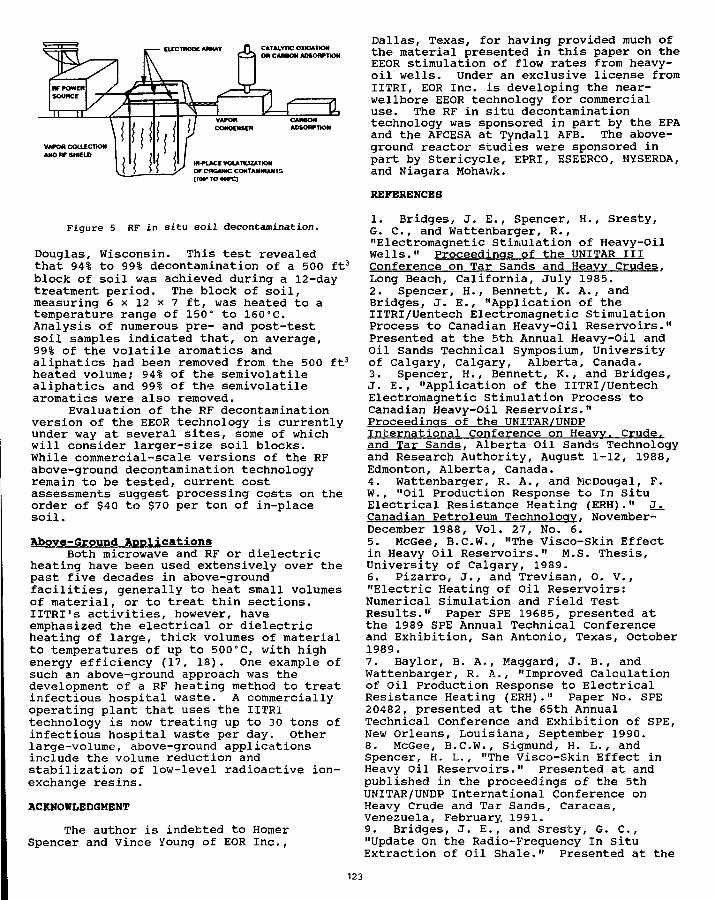
CATALYTIC OXKMTIONon CAMON AosonrnoN
VAPOA COLLECTIONANORF SHIELD
HI-PLACE VOLATILIZATIONOF ORGANIC CONTAMINANTS(100* TO 40VC)
Figure 5 RF in situ soil decontamination.
Douglas, Wisconsin. This test revealedthat 94% to 99% decontamination of a 500 ft3
block of soil was achieved during a 12-daytreatment period. The block of soil,measuring 6 x 12 x 7 ft, was heated to atemperature range of 150° to 160"C.Analysis of numerous pre- and post-testsoil samples indicated that, on average,99% of the volatile aromatics andaliphatics had been removed from the 500 ft3
heated volume; 94% of the semivolatilealiphatic^ and 99% of the semivolatilearomatics were also removed.
Evaluation of the RF decontaminationversion of the EEOR technology is currentlyunder way at several sites, some of whichwill consider larger-size soil blocks.While commercial-scale versions of the RFabove-ground decontamination technologyremain to be tested, current costassessments suggest processing costs on theorder of $40 to $70 per ton of in-placesoil.
Above-Ground applicationsBoth microwave and RF or dielectric
heating have been used extensively over thepast five decades in above-groundfacilities, generally to heat small volumesof material, or to treat thin sections.IITRI's activities, however, haveemphasized the electrical or dielectricheating of large, thick volumes of materialto temperatures of up to 500°C, with highenergy efficiency (17, 18). One example ofsuch an above-ground approach was thedevelopment of a RF heating method to treatinfectious hospital waste. A commerciallyoperating plant that uses the IITR1technology is now treating up to 30 tons ofinfectious hospital waste per day. Otherlarge-volume, above-ground applicationsinclude the volume reduction andstabilization of low-level radioactive ion-exchange resins.
ACKNOWLEDGMENT
The author is indebted to HomerSpencer and Vince Young of EOR Inc.,
Dallas, Texas, for having provided much ofthe material presented in this paper on theEEOR stimulation of flow rates from heavy-oil wells. Under an exclusive license fromIITRI, EOR Inc. is developing the near-wellbore EEOR technology for commercialuse. The RF in situ decontaminationtechnology was sponsored in part by the EPAand the AFCESA at Tyndall AFB. The above-ground reactor studies were sponsored inpart by Stericycle, EPRI, ESEERCO, NYSERDA,and Niagara Mohawk.
REFERENCES
1. Bridges, J. E., Spencer, H., Sresty,G. C., and Wattenbarger, R.,"Electromagnetic Stimulation of Heavy-OilWells." Proceedings of the UNITAR IIIConference on Tar Sands and Heavy Crudes.Long Beach, California, July 1985.2. Spencer, H., Bennett, K. A., andBridges, J. E., "Application of theIITRI/Uentech Electromagnetic StimulationProcess to Canadian Heavy-Oil Reservoirs."Presented at the 5th Annual Heavy-Oil andOil Sands Technical Symposium, Universityof Calgary, Calgary, Alberta, Canada.3. Spencer, H., Bennett, K., and Bridges,J. E., "Application of the IITRI/UentechElectromagnetic Stimulation Process toCanadian Heavy-Oil Reservoirs."Proceedings of the UNITAR/UNDPInternational Conference on Heavy. Crude,and Tar Sands. Alberta Oil Sands Technologyand Research Authority, August 1-12, 1988,Edmonton, Alberta, Canada.4. Wattenbarger, R. A., and McDougal, F.W., "Oil Production Response to In SituElectrical Resistance Heating (ERH)." J .Canadian Petroleum Technology. November-December 1988, Vol. 27, No. 6.5. McGee, B.C.W., "The Visco-Skin Effectin Heavy Oil Reservoirs." M.S. Thesis,University of Calgary, 1989.6. Pizarro, J., and Trevisan, O. V.,"Electric Heating of oil Reservoirs:Numerical Simulation and Field TestResults." Paper SPE 19685, presented atthe 1989 SPE Annual Technical Conferenceand Exhibition, San Antonio, Texas, October1989.7. Baylor, B. A., Maggard, J. B., andWattenbarger, R. A., "Improved Calculationof Oil Production Response to ElectricalResistance Heating (ERH)." Paper No. SPE20482, presented at the 65th AnnualTechnical Conference and Exhibition of SPE,New Orleans, Louisiana, September 1990.8. McGee, B.C.W., Sigmund, H. L., andSpencer, H. L., "The Visco-Skin Effect inHeavy Oil Reservoirs." Presented at andpublished in the proceedings of the 5thUNITAR/UNDP International Conference onHeavy Crude and Tar Sands, Caracas,Venezuela, February. 1991.9. Bridges, J. E. , and Sresty, G. C ,"Update On the Radio-Frequency In SituExtraction of Oil Shale." Presented at the
123

24th Oil Shale Symposium, Golden, Colorado,April 1991.10. Bowden, J. R., Gould, G. D., McKinsey,R. R., Bridges, J. E., and Sresty, G. c.,"In Situ Retorting of Oil Shale Using RFHeating (1985 update)." Presented at theSynfuels 5th Worldwide Symposium,Washington, D.C., November 1985.11. Streeter, W. S., Bridges, J. E., andSresty, G. C , "Economic Aspects for OilShale Production Using RF In SituRetorting." Presented at and published inthe proceedings of the 24th Oil ShaleSymposium, Colorado School of Mines,Golden, Colorado, April 1991.12. Bridges, J. E., Sresty, G. C , Dev,H., and Snow, R. H., "Recovery of Bitumenfrom Tar Sand Deposits Using the IITRI RFProcess." Paper No. SPE 10229, presentedat the 56th Annual Fall Conference, Societyof Petroleum Engineers, October 1981.13. Carlson, R. D., Blase, E. F., andMcLenden, J. R., "Development of the IITResearch Institute RF Heating Process forIn Situ Shale/Tar Fuel Extraction—AnOverview." Presented at the 14th Oil ShaleSymposium, Colorado School of Mines,Golden, Colorado, April 1981.14. Bridges, J. E., Sresty, G. C , andDev, H., "In Situ RF Heating for Oil-Sandand Heavy-Oil Deposits." Presented at and
published in the proceedings of the UNITARIII Conference on Tar Sands and HeavyCrudes, Long Beach, California, July 1985.15. Dev, H., "Radio Frequency Enhanced InSitu Decontamination of Soils Contaminatedwith Halogenated Hydrocarbons." Presentedat and published in the proceedings of the12th Annual Research Symposium, U.S. EPA,April 1986. U.S. EPA Publication No.EPA/600/9-86/022.16. Dev, H., Bridges, J. E., and Sresty,G. C , "Decontamination of Hazardous WasteSubstances from Spills and UncontrolledWaste Sites by Radio Frequency In SituHeating." Presented at and published inthe proceedings of the 1984 HazardousMaterials Spills Conference, Nashville,Tennessee, April 1984.17. Bridges, J. E., Sresty, G. C , M.Strickel, M., and Brabets, R. I.,"RF/Microwave Volume Reduction andStabilization System for Radwaste Resins."Presented at the 1986 Waste ManagementSymposium on Radioactive Waste Management,April 1986.18. Bridges, J. E., and Sresty, G. C ,"Radwaste Resin Volume Reduction andStabilization via RF/Microwave Heating."Proceedings of the 1988 Annual Meeting.American Nuclear Society. San Diego,California, June 1988.
124
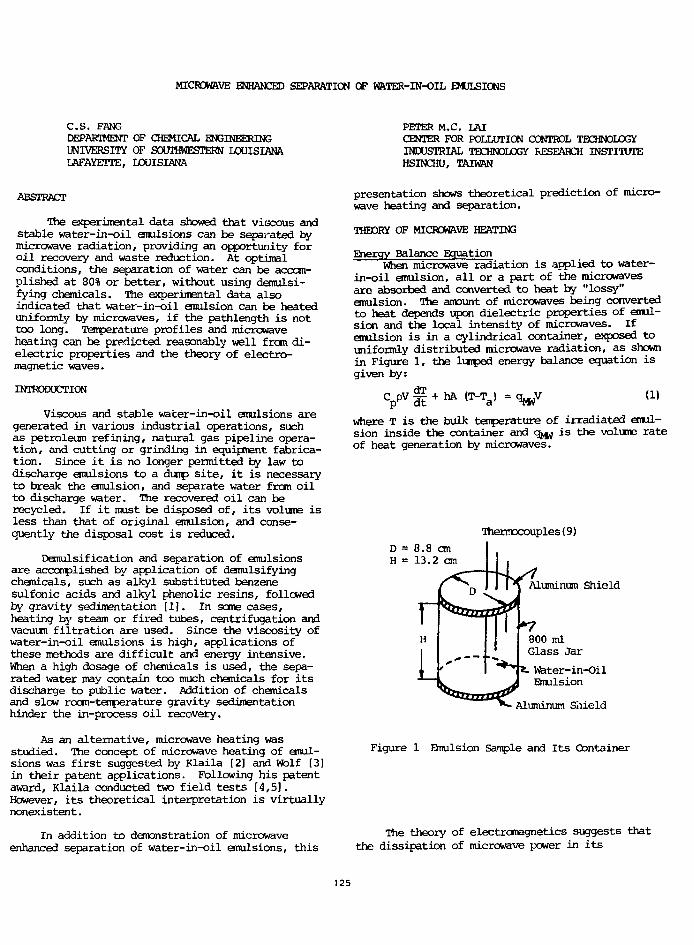
MICROWAVE ENHANCED SEPARATION OF WATER-IN-OIL EMULSIONS
C.S. FANGDEPARTMENT OF CHEMICAL ENGINEERINGUNIVERSITY OF SOUTHWESTERN LOUISIANALAFAYETTE, LOUISIANA
PETER M.C. LAICENTER FOR POLLUTION CONTROL TECHNOLOGYINDUSTRIAL TECHNOLOGY RESEARCH INSTITUTEHSINCHU, TAIWAN
ABSTRACT
The experimental data showed that viscous andstable water-in-oil emulsions can be separated bymicrowave radiation, providing an opportunity foroil recovery and waste reduction. At optimalconditions, the separation of water can be accom-plished at 30% or better, without using deimilsi-fying chemicals. The experimental data alsoindicated that water-in-oil emulsion can be heateduniformly by microwaves, if the pathlength is nottoo long. Temperature profiles and microwaveheating can be predicted reasonably well from di-electric properties and the theory of electro-magnetic waves.
INTRODUCTION
Viscous and stable water-in-oil emulsions aregenerated in various industrial operations, suchas petroleum refining, natural gas pipeline opera-tion, and cutting or grinding in equipment fabrica-tion. Since it is no longer permitted by law todischarge emulsions to a dump site, it is necessaryto break the emulsion, and separate water from oilto discharge water. The recovered oil can berecycled. If it must be disposed of, its volume isless than that of original emulsion, and conse-quently the disposal cost is reduced.
Demulsification and separation of emulsionsare accomplished by application of demulsifyingchemicals, such as alkyl substituted benzenesulfonic acids and alkyl phenolic resins, followedby gravity sedimentation [1]. In some cases,heating by steam or fired tubes, centrifugation andvacuum filtration are used. Since the viscosity ofwater-in-oil emulsions is high, applications ofthese methods are difficult and energy intensive.When a high dosage of chemicals is used, the sepa-rated water may contain too much chemicals for itsdischarge to public water. Addition of chemicalsand slow room-temperature gravity sedimentationhinder the in-process oil recovery.
As an alternative, microwave heating wasstudied. The concept of microwave heating of emul-sions was first suggested by Klaila [2] and Wolf [3]in their patent applications. Following his patentaward, Klaila conducted two field tests [4,5].However, its theoretical interpretation is virtuallynonexistent.
In addition to demonstration of microwaveenhanced separation of water-in-oil emulsions, this
presentation shows theoretical prediction of micro-wave heating and separation.
THEORY OF MICROWAVE HEATING
Energy Balance EquationWhen microwave radiation is applied to water-
in-oil emulsion, all or a part of the microwavesare absorbed and converted to heat by "lossy"emulsion. The amount of microwaves being convertedto heat depends upon dielectric properties of emul-sion and the local intensity of microwaves. Ifemulsion is in a cylindrical container, exposed touniformly distributed microwave radiation, as shownin Figure 1, the lumped energy balance equation isgiven by:
C ppvf + hA (T-Ta) = (1)
where T is the bulk temperature of irradiated emul-sion inside the container and g ^ is the volume rateof heat generation by microwaves.
Thermocouples(9)
Aluminum Shield
800 mlGlass Jar
Water-in-OilEmulsion
Aluminum Shield
Figure 1 Emulsion Sample and Its Container
The theory of electromagnetics suggests thatthe dissipation of microwave power in its
125
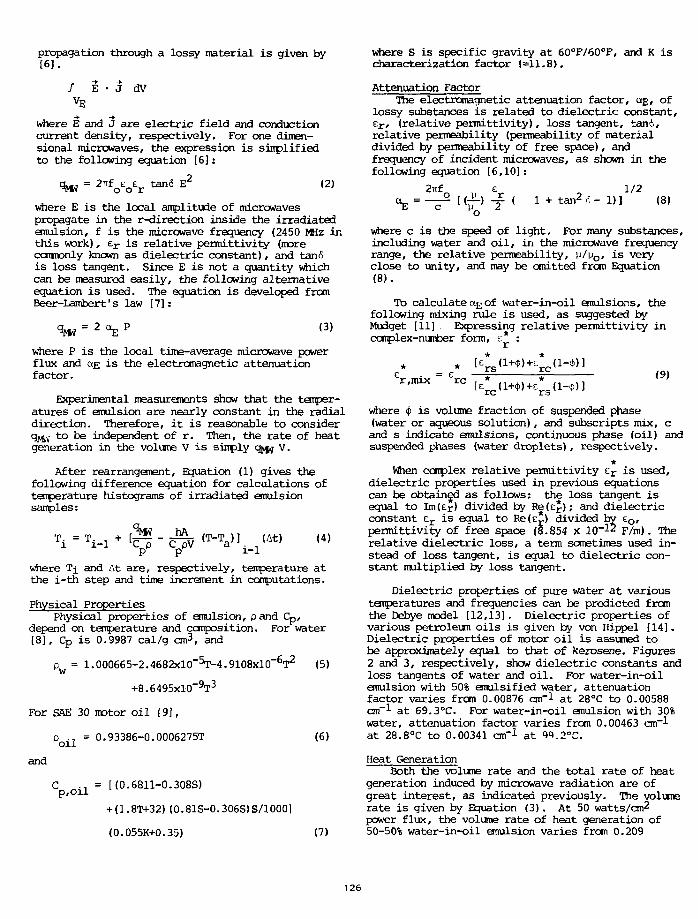
propagation through a lossy material is given by[6J.
/ E • J dV
where B and J are electric field and conductioncurrent density, respectively. For one dimen-sional microwaves, the expression is simplifiedto the following equation [6]:
27TfoEoer tanS E (2)
where E is the local amplitude of microwavespropagate in the r-direction inside the irradiatedemulsion, f is the microwave frequency (2450 MHz inthis work), E r is relative permittivity (morecommonly known as dielectric constant), and tancSis loss tangent. Since E is not a quantity whichcan be measured easily, the following alternativeequation is used. The equation is developed fromBeer-Lambert's law [7]:
= 2 (3)
where P is the local time-average microwave powerflux and aE is the electromagnetic attenuationfactor.
Experimental measurements show that the temper-atures of emulsion are nearly constant in the radialdirection. Therefore, it is reasonable to considerg^- to be independent of r. Then, the rate of heatgeneration in the volume V is simply q^ V.
After rearrangement, Equation (1) gives thefollowing difference equation for calculations oftemperature histograms of irradiated emulsionsamples:
T = T1 L ^ - C p V (T-Ta» (At» <4)i-1
where Tj_ and At are, respectively, temperature atthe i-th step and time increment in computations.
Physical PropertiesPhysical properties of emulsion, pand C p,
depend on tsnperature and composition. For water[8], Cp is 0.9987 cal/g cm3, and
p = 1.000665-2.4682xl0"5T-4.9108xl0"6T2 (5)
+8.6495xl0~9T3
For SAE 30 motor oil [9],
p ., = 0.93386-0.0006275T (6)
oiland
C ., = [(0.6811-0.308S)p,oil
+(1.8T+32)(0.81S-0.306S)S/1000]
(0.055K+0.35) (7)
where S is specific gravity at 60oF/60°F, and K ischaracterization factor (=11.8).
Attenuation FactorThe electromagnetic attenuation factor, OIE, of
lossy substances is related to dielectric constant,e r, (relative permittivity), loss tangent, tani,relative permeability (permeability of materialdivided by permeability of free space), andfrequency of incident microwaves, as shown in thefollowing equation [6,10]:
2?rf e 1/2a* = -IT- [ <77-> -f < l + tan 2fi-D] (8)
where c is the speed of light. For many substances,including water and oil, in the microwave frequencyrange, the relative permeability, u/uo, is veryclose to unity, and may be omitted from Equation(8K
To calculate «Eof water-in-oil emulsions, thefollowing mixing rule is used, as suggested byMudget [11] Expressing relative permittivity incomplex-number form, e* :
cr,mix ~ Crc[e*cU+<C)+c*s(l-<t>)]
(9)
where <$> is volume fraction of suspended phase(water or aqueous solution), and subscripts mix, cand s indicate emulsions, continuous phase (oil) andsuspended phases (water droplets), respectively.
When complex relative permittivity er is used,dielectric properties used in previous equationscan be obtained as follows: the loss tangent isequal to Im(er) divided by Re(e£); and dielectricconstant er is equal to Re(er) divided by EQ,permittivity of free space (8.854 x lO"1^ F/m). Therelative dielectric loss, a term sometimes used in-stead of loss tangent, is equal to dielectric con-stant multiplied by loss tangent.
Dielectric properties of pure water at varioustemperatures and frequencies can be predicted fromthe Debye model [12,13]. Dielectric properties ofvarious petroleum oils is given by von Hippel [14].Dielectric properties of motor oil is assumed tobe approximately equal to that of kerosene. Figures2 and 3, respectively, show dielectric constants andloss tangents of water and oil. For water-in-oilemulsion with 50% emulsified water, attenuationfactor varies from 0.00876 cm"1 at 28°C to 0.00588cm"1 at 69.3°C. For water-in-oil emulsion with 30%water, attenuation factor varies from 0.00463 cm~lat 28.8°C to 0.00341 cm"1 at 99.2°C.
Heat GenerationBoth the volume rate and the total rate of heat
generation induced by microwave radiation are ofgreat interest, as indicated previously. The volumerate is given by Equation (3). At 50 watts/cm-*power flux, the volume rate of heat generation of50-50% water-in-oil emulsion varies frcm 0.209
126
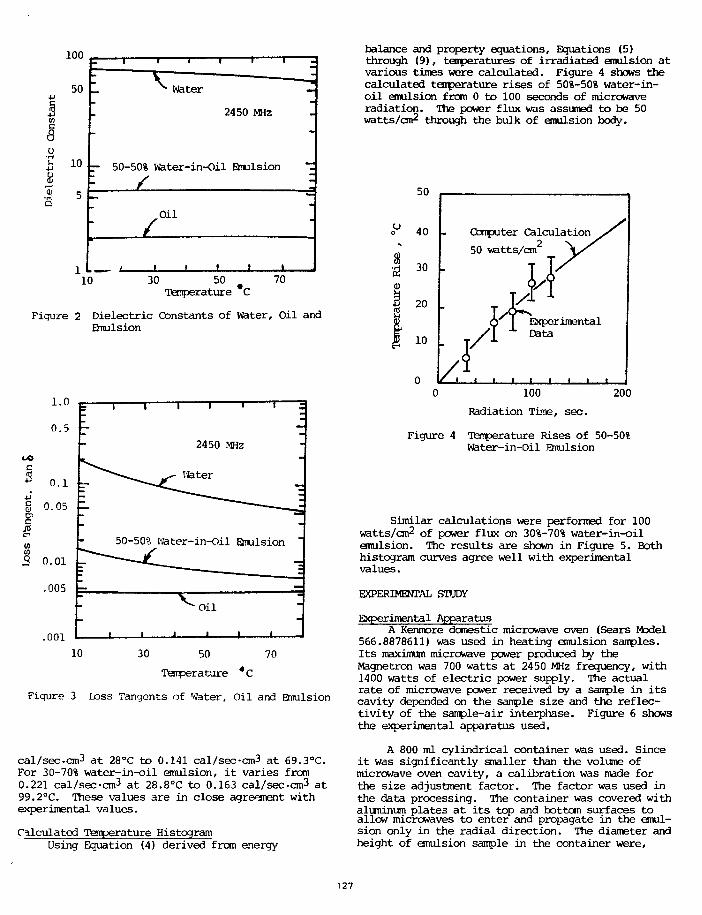
100
8
a 10
2450 MHz
7- 50-50% Water-in-Oil Bnulsion
Oil
1 — -10 30 50
Temperature C70
Figure 2 Dielectric Constants of Water, Oil andEmulsion
1.0
0.5
0.1 ~
§ 0.05
(Ain
,3 0.01
.005 fc;
.001
10 30 50 70
Temperature * C
Figure 3 toss Tangents of Water, Oil and Bnulsion
c a l / s e c a n 3 a t 28°C to 0.141 cal /sec-an3 a t 69.3°C.For 30-70% water-in-oil emulsion, i t varies from0.221 cal/sec-cm3
a t 28.8°C to 0.163 cal/sec-cm3 a t99.2°C. These values are in close agrefanent withexperimental values.
Calculated Temperature HistogramUsing Equation (4) derived from energy
1LU.
-
lMl|
*
50-50%
i i
l i • i z
2450 MHz
^~ Water
l-Jater-in-Oil Emulsion "
1 ' 1 t
balance and property equations. Equations (5)through (9), temperatures of irradiated emulsion atvarious times were calculated. Figure 4 shows thecalculated temperature rises of 50%-50% water-in-oil emulsion from 0 to 100 seconds of microwaveradiation. The power flux was assumed to be 50watts/cm^ through the bulk of emulsion body.
50
u Computer Calculation
100 200
ltediation Time, sec.
Figure 4 Temperature Rises of 50-50%Water-in-Oil Emulsion
Similar calculations were performed for 100watts/cm2 of power flux on 30%-70% water-in-oilemulsion. The results are shown in Figure 5. Bothhistogram curves agree well with experimentalvalues.
EXPERIMENTAL STUDY
Experimental ApparatusA Kenmore domestic microwave oven (Sears Model
566.8878611) was used in heating emulsion samples.Its maximum microwave power produced by theMagnetron was 700 watts at 2450 MHz frequency* with1400 watts of electric power supply. The actualrate of microwave power received by a sample in itscavity depended on the sample size and the reflec-tivity of the sample-air interphase. Figure 6 showsthe experimental apparatus used.
A 800 ml cylindrical container was used. Sinceit was significantly smaller than the volume ofmicrowave oven cavity, a calibration was made forthe size adjustment factor. The factor was used inthe data processing. The container was covered withaluminum plates at its top and bottom surfaces toallow microwaves to enter and propagate in the emul-sion only in the radial direction. The diameter andheight of emulsion sample in the container were.
127
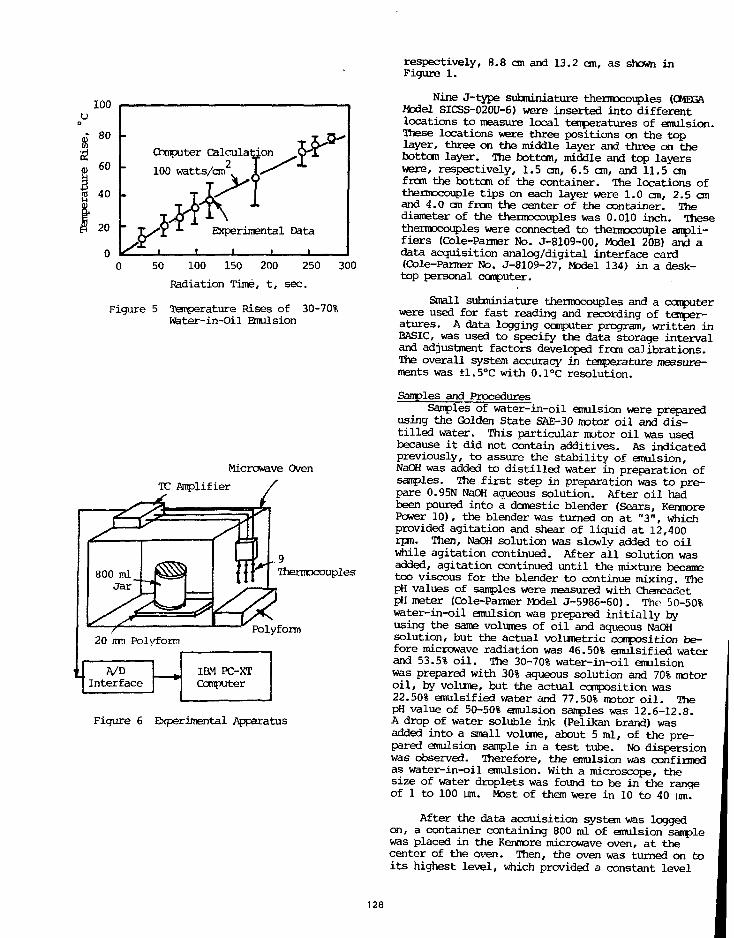
Experimental Data
0 50 100 150 200 250 300
Radiation Time, t, sec.
Figure 5 Temperature Rises of 30-70%Water-in-Oil Bnulsion
Microwave Oven
TC Amplifier
_9Thermocouples
Polyform
InterfaceIBM PC-XTComputer
Figure 6 Experimental Apparatus
respectively, 8.8 cm and 13.2 cm, as shown inFigure 1.
Nine J-type suhminiature thermocouples (OMEGAModel SICSS-020U-6) were inserted into differentlocations to measure local temperatures of emulsion.These locations were three positions on the toplayer, three on the middle layer and three on thebottom layer. The bottom, middle and top layerswere, respectively, 1.5 cm, 6.5 cm, and 11.5 anfrom the bottom of the container. The locations ofthermocouple tips on each layer were 1.0 cm, 2.5 cmand 4.0 cm from the center of the container. Thediameter of the thermocouples was 0.010 inch. Thesethermocouples were connected to thermocouple ampli-fiers (Cole-Parmer No. J-8109-00, Model 20B) and adata acquisition analog/digital interface card(Cole-Parmer No. J-8109-27, Model 134) in a desk-top personal computer.
Small subminiature thermocouples and a computerwere used for fast reading and recording of temper-atures. A data logging computer program, written inBASIC, was used to specify the data storage intervaland adjustment factors developed frcm calibrations.The overall system accuracy in temperature measure-ments was +1.5°C with 0.1°C resolution.
Samples and ProceduresSamples of water-in-oil emulsion were prepared
using the Golden State SAE-30 motor oil and dis-tilled water. This particular nutor oil was usedbecause it did not contain additives. As indicatedpreviously, to assure the stability of emulsion,NaOH was added to distilled water in preparation ofsamples. The first step in preparation was to pre-pare 0.95N NaOH aqueous solution. After oil hadbeen poured into a domestic blender (Sears, KenmorePower 10), the blender was turned on at "3", whichprovided agitation and shear of liquid at 12,400rpm. Then, NaQH solution was slowly added to oilwhile agitation continued. After ail solution wasadded, agitation continued until the mixture becametoo viscous for the blender to continue mixing. ThepH values of samples were measured with ChemcadetpH meter (Cole-Parmer Model J-5986-60). The 50-50%water-in-oil emulsion was prepared initially byusing the same volumes of oil and aqueous NaOHsolution, but the actual volumetric composition be-fore microwave radiation was 46.50% emulsified waterand 53.5% oil. The 30-70% water-in-oil emulsionwas prepared with 30% aqueous solution and 70% motoroil, by volune, but the actual composition was22.50% emulsified water and 77.50% motor oil. ThepH value of 50-50% emulsion samples was 12.6-12.8.A drop of water soluble ink (Pelikan brand) wasadded into a small volune, about 5 ml, of the pre-pared emulsion sample in a test tube. No dispersionwas observed. Therefore, the emulsion was confirmedas water-in-oil emulsion. With a microscope, thesize of water droplets was found to be in the rangeof 1 to 100 van. Most of them were in 10 to 40 \m.
After the data acquisition system was loggedon, a container containing 800 ml of emulsion samplewas placed in the Kenmore microwave oven, at thecenter of the oven. Then, the oven was turned on toits highest level, which provided a constant level
128
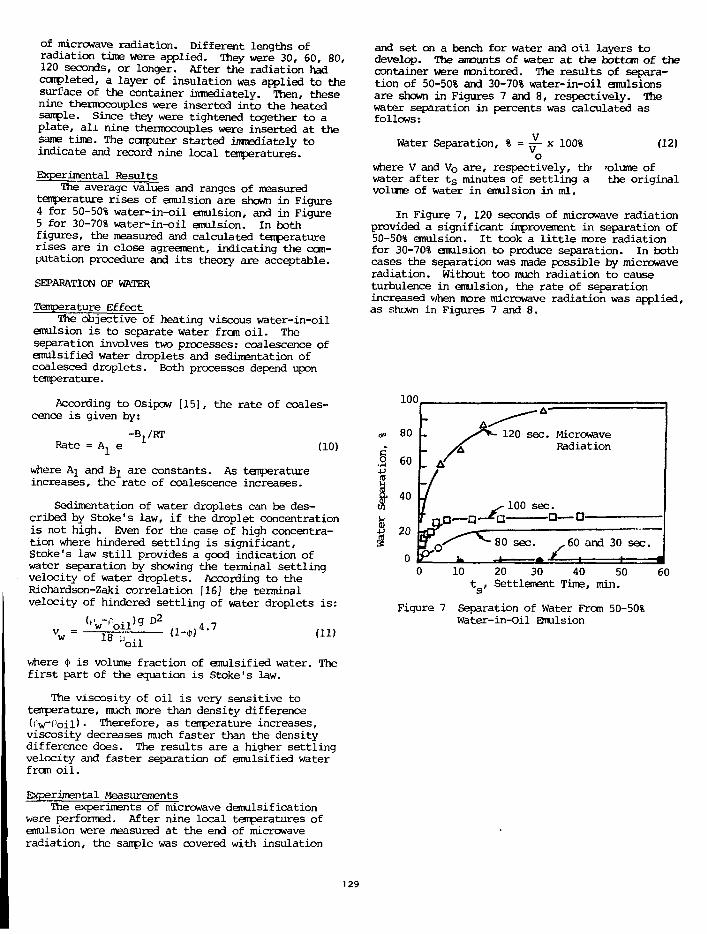
of microwave radiation. Different lengths ofradiation time were applied. They were 30, 60, 80,120 seconds, or longer. After the radiation hadcompleted, a layer of insulation was applied to thesurface of the container imnediately. Then, thesenine thermocouples were inserted into the heatedsample. Since they were tightened together to aplate, all nine thermocouples were inserted at thesame time. The computer started immediately toindicate and record nine local temperatures.
Experimental ResultsThe average values and ranges of measured
temperature rises of emulsion are shown in Figure4 for 50-50% water-in-oil emulsion, and in Figure5 for 30-70% water-in-oil emulsion. In bothfigures, the measured and calculated temperaturerises are in close agreement, indicating the com-putation procedure and its theory are acceptable.
SEPARATION OF WATER
Temperature EffectThe objective of heating viscous water-in-oil
emulsion is to separate water from oil. Theseparation involves two processes: coalescence ofemulsified water droplets and sedimentation ofcoalesced droplets. Both processes depend upontemperature.
According to Osipow [15], the rate of coales-cence is given by:
Rate =-B1/RT
(10)
where A^ and Bj are constants. As temperatureincreases, the rate of coalescence increases.
Sedimentation of water droplets can be des-cribed by Stake's law, if the droplet concentrationis not high. Even for the case of high concentra-tion where hindered settling is significant,Stoke's law still provides a good indication ofwater separation by showing the terminal settlingvelocity of water droplets. According to theRichardson-Zaki correlation [16] the terminalvelocity of hindered settling of water droplets is:
(tV'o i l )g >4.718 u'oil
(11)
where <t> is volume fraction of emulsified water. Thefirst part of the equation is Stoke's law.
The viscosity of oil is very sensitive totemperature, much more than density difference(<V('oil) • Therefore, as temperature increases,viscosity decreases much faster than the densitydifference does. The results are a higher settlingvelocity and faster separation of emulsified waterfrom oil.
Experimental MeasurementsThe experiments of microwave demulsification
were performed. After nine local temperatures ofemulsion were measured at the end of microwaveradiation, the sample was covered with insulation
and set on a bench for water and oil layers todevelop. The amounts of water at the bottom of thecontainer were monitored. The results of separa-tion of 50-50% and 30-70% water-in-oil emulsionsare shown in Figures 7 and 8, respectively. Thewater separation in percents was calculated asfollows:
Water Separation, % = - x 100% (12)o
where V and V o are, respectively, th? 'olume ofwater after t s minutes of settling a the originalvolume of water in emulsion in ml.
In Figure 7, 120 seconds of microwave radiationprovided a significant improvement in separation of50-50% emulsion. It took a little more radiationfor 30-70% emulsion to produce separation. In bothcases the separation was made possible by microwaveradiation. Without too much radiation to causeturbulence in emulsion, the rate of separationincreased when more microwave radiation was applied,as shewn in Figures 7 and 8.
100
80
60
40
_ A'
120 sec. MicrowaveRadiation
100 sec.• Q—D-
60 and 30 sec.
50 60t , Settlement Time, min.
Figure 7 Separation of Water From 50-50%Water-in-oil Emulsion
129
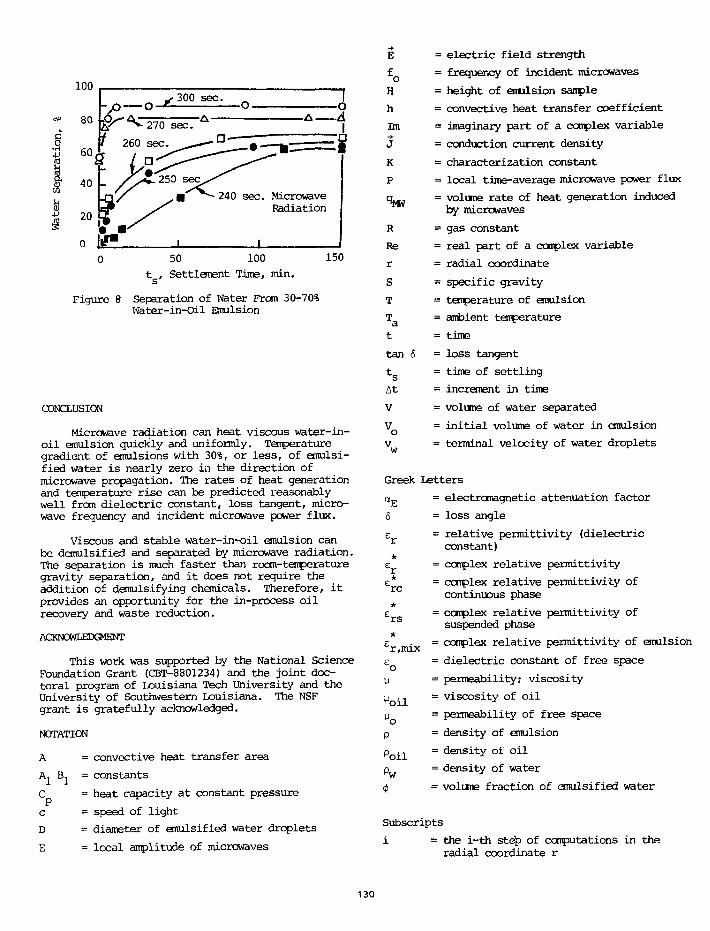
100
240 sec. MicrowaveRadiation
100 150t , Settlement Time, min.
Figure 8 Separation of Water From 30-70%Water-in-Oil Emulsion
CONCLUSION
Microwave radiation can heat viscous water-in-oil emulsion quickly and uniformly. Temperaturegradient of emulsions with 30%, or less, of emulsi-fied water is nearly zero in the direction ofmicrowave propagation. The rates of heat generationand temperature rise can be predicted reasonablywell from dielectric constant, loss tangent, micro-wave frequency and incident microwave power flux.
Viscous and stable water-in-oil emulsion canbe demulsified and separated by microwave radiation.The separation is much faster than room-temperaturegravity separation, and it does not require theaddition of demulsifying chemicals. Therefore, itprovides an opportunity for the in-process oilrecovery and waste reduction.
ACKNOWLEDGMENT
This work was supported by the National ScienceFoundation Grant (CBT-8801234) and the joint doc-toral program of Louisiana Tech University and theUniversity of Southwestern Louisiana. The NSFgrant is gratefully acknowledged.
NOTATION
A = convective heat transfer area
A, B. = constants
C = heat capacity at constant pressure
c = speed of light
D = diameter of emulsified water droplets
E = local amplitude of microwaves
E = electric field strength
f = frequency of incident microwaves
H = height of emulsion sample
h = convective heat transfer coefficient
Im = imaginary part of a complex variable
J = conduction current density
K = characterization constant
P = local time-average microwave power flux
q ^ = volume rate of heat generation inducedby microwaves
R = gas constant
Re = real part of a complex variable
r = radial coordinate
S = specific gravity
T = temperature of emulsion
T = ambient temperaturea
t = time
tan 6 = loss tangent
t = time of settlings
at = increment in time
V = volume of water separated
V = initial volume of water in emulsion
v = terminal velocity of water droplets
Greek Letters
a^ = electromagnetic attenuation factor
Ers
*£r,mix
P
'•'oil
^o
p
poil
Pw
= loss angle
= relative permittivity (dielectricconstant)
= complex relative permittivity
= complex relative permittivity ofcontinuous phase
= complex relative permittivity ofsuspended phase
= complex relative permittivity of emulsion
= dielectric constant of free space
= permeability; viscosity
= viscosity of oil
= permeability of free space
= density of emulsion
= density of oil
= density of water
= volune fraction of emulsified water
Subscripts
= the i-th steb of computations in theradial coordinate r
130
Unit Conversion
1 ft = 30.48 cm
T °F = 1.8 (T °C) + 32
1 Btu/hr = 0.29307 watts
1 Btu/hrft2 = 0.7540 x 10~4 cal/sec cm2
REFERENCES
1. Kermner, F.N., The Nalco Water Handbook, 2nded., McGraw-Hill, N.Y. (1988).
2. Klaila, W.J., "Method and Apparatus forControlling Fluency of High Viscosity Hydro-carbon Fluids/1 U.S. Patent 31,241 (1983).
3. Wolf, N.O., "Use of Microwave Radiation inSeparating Emulsions and Dispersions ofHydrocarbons and Water," U.S. Patent 4,582,629(1986).
4. Fang, C.S., B.K.L. Chang, P.M.C. Lai, and W.J.Klaila, "Microwave Demulsification," Chem.Eng.Conmunications, Vol. 73, Oct. 1988, p. 227-239.
5. Fang, C.S., B.K.L. Chang, P.M.C. Lai, and W.J.Klaila, "Oil Recovery and Waste Reduction byMicrowave Radiation," Envir.Prog. (Vol.8, No.4),Nov. 1989, p. 235-238.
6. Johnk, C.T.A., Engineering ElectromagneticFields and Waves, John Wiley (1975).
7. Atkins, P.W., Physical Chemistry, 3rd ed.,Freeman and Co., N.Y. (1986).
8. Dean, J.A. (ed.), Lange's Handbook of Chemistry,13th ed., McGraw-Hill, N.Y. (1985).
9. Standards of Tubular Exchanger ManufacturersAssociation, 1978, p. 165.
lO.Decareau, R.V., and R.A. Peterson, MicrowaveProcessing and Engineering, Ellis Horwood (1986).
ll.Mudget, R.E., D.I.C. Wang, and S.A. Goldblith,"Prediction of Dielectric Properties in Oil-in-Water and Alcohol-Water Mixtures at 3000 MHz,25°C Based on Pure Component Properties," J. ofFood Science, 1974, p. 632-635.
12.Mudget, R.E., "Electrical Properties of Foods inMicrowave Processing," Food Technology, Feb.1982.
13.Smyth, C.P., Dielectric Behavior and Structure,McGraw-Hill (1977).
14.von Hippel, A.R., Dielectric Materials andApplications, MIT Press (1954).
15.Osipow, L.I., Surface Chemistry, R.E. KriegerPub. Co. (1977).
16.Probstein, R.F., Physicochemical Hydrodynamics,Butterworths (1989).
131
CHEMICAL APPLICATIONS CF ELECTROHYDRAULICCAVITATION FOR HAZARDOUS WASTE CONTROL
MICHAEL R. HOFFMANN, PROFESSOR, CALIFORNIA INSTITUTE OFTECHNOLOGY, PASADENA, CA 91125
AbstractWe have been investigating the fundamental
chemistry and physics underlying the .spplication ofelectrohydraulic cavitation as induced by pulsed-power plasma discharge in water, by spark-gapdischarge in water (i.e., lithotripsy) and by pulsed(and/or continuous) ultrasonic irradiation (i.e.,sonolysis) of water for the elimination of chlorinatedhydrocarbons from water. These three differentapplications of electric power share a commonphysical thread, which involves hydraulic cavitation,production of shock waves, release of high energylight, production of hydroxyl radicals, hydrogenatoms, hydrogen peroxide and aquated electrons.The chemical changes of compounds in water pulsedwith these different sources of power are induced inpart by the violent collapse of cavitation bubbles.
Introduction
The elimination of toxic and hazardouschemical substances such as halogenatedhydrocarbons from waste effluents and previouslycontaminated sites has become a major national andinternational concern. More than 540 million metrictons of hazardous solid and liquid waste aregenerated annually by more than 14,000 installationsin the United States. Some hazardous wastes, whichare stored in holding ponds or are discharged withinlandfills, eventually contaminate ground and surfacewaters. Groundwater contamination is likely to bethe primary source of human contact with toxicchemicals. Some specific chemical compounds ofinterest are: 4-chlorophenol, pentachlorophenol,trichloroethylene (TCE), perchloroethylene (PCE),carbon tetrachloride, PCB's, dioxins, dibenzofurans,chloroform, methylene chloride, ethylenedibromide,vinyl chloride, ethylene dichloride, methylchloroform, p-chlorobenzene , andhexachlorocyclopentadiene. The occurrence ofchlorinated hydrocarbons and chlorofluorocarbonsand other grease-cutting agents in soils andgroundwaters is widespread.
The advanced technologies of sonolysis, spark-gap discharge and pulsed-power plasma discharge areintended to be complementary to some of theexisting approaches to the destruction ortransformation of hazardous chemical substancessuch as high-temperature incineration, amendedactivated sludge digestion, anaerobic digestion andconventional physicochemical treatment.
Pulsed-power plasma discharge technologymay have additional commercial applications beyondhazardous compound destruction. Some of thepossible applications include the separation of solidsfrom water, the disinfection of drinking water andwastewater and desalinization (due to the extremelyhigh pressure transients which dramatically shift thecontrolling solubility relationships).
We are motivated by the potential economicalapplication of electrohydraulic cavitation for therapid degradation of a wide range of halogenatedhydrocarbons. Current approaches to the treatmentof hazardous chemical, wastes include hightemperature incineration, chemical oxidation withand UV light, membrane separation, activated carbonadsorption, substrate-specific biodegration, electron-beam bombardment, super-critical fluid extractionand oxidation, fixed-bed high-temperature catalyticreactors and steam gasification. These techniques arenot totally effective, they are very often cost-intensive, they are often inconvenient to apply tomixed solid-liquid wastes and they are not readilyadapted to a wide variety of conditions.
Background
The term cavitation refers to the formationand the subsequent dynamic life of bubbles which arefilled with vapor and gases, in liquids. Cavitation isbrought about by tension produced by pressurevariations that may be of acoustic, explosive,hydrodynamic or thermal origin. Cavitation occursin water, organic solvents, biological fluids, liquidhelium and molten (Suslick, 1988).
132

The application of electrohydraulic cavitationin its various forms for the pyrolytic and oxidativecontrol of hazardous chemicals in water has thepotential to become economically-competitive withexisting technologies. In terms of convenience andsimplicity of operation, electrohydraulic cavitationcould prove to be far superior to many of the abovemethods. For example, the relative efficiency ofultrasound in terms of the total power consumed permole of p-nitrophenol degraded per liter of water isfar superior to UV-photolytic degradation(Kotronarou et al., 1991).
The chemical effects of ultrasound have beenexplained in terms of reactions occurring inside, atthe interface or at some distance away fromcavitating gas bubbles (Suslick, 1988; Sehgal andWang, 1981). In the interior of a collapsing cavitationbubble, extreme but transient conditions are knownto exist. Temperatures approaching 5000 K have beendetermined (Suslick et al., 1986; Mason, 1988; Flintand Suslick, 1991; Suslick et al., 1991) and pressures ofseveral hundred atmospheres have been calculated(Shutilov, 1988). Temperatures on the order of 2000K have been determined for the interfacial regionsurrounding a collapsing bubble (Flint and Suslick,1991; Suslick et al., 1986; Mason, 1988).
Sonochemical reactions are characterized bythe simultaneous occurrence of pyrolysis and radicalreactions especially at high solute concentrations.Volatile solutes will undergo direct pyrolysisreactions within the gas phase of the collapsingbubbles or within the hot interfacial region. In theseinterfacial regions, both combustion and free radicalreactions (e.g., ) are possible. Pyrolysis (i.e.,combustion) in the interfacial region is predominantat high solute concentrations, while at low soluteconcentrations free radical reactions are likely topredominate (Kotronarou et al., 1991). In the bulksolution, the chemical reaction pathways are similarto those observed in aqueous radiation chemistry (as
induced by aquated electrons, y-rays, or X-rays).However, evidence for combustion-like reactions atlow solute concentrations has been presented(Kotronarou et al., 1991).
In our investigation of the ultrasonicoxidation of hydrogen sulfide gas (Kotronarou et al.,1992), we have found a linear relationship betweenthe applied power at a fixed frequency and theobserved rate of loss of sulfide. We have also shownthat a continuous-flow stirred-tank (CSTR) ultrasonicreactor can attain significant conversion efficienciesat relatively high volumetric flow rates. Our initialtests indicate that the use of large high-poweredsonicators in the CSTR mode can result in viablecompound degradation rates.
The pulsed-power plasma discharge process(Wesley and Ayers, 1984; Weldon, 1985; Edebo andSelin, 1968; Gilliland and Speck, 1967; Clements et al.,1987; Lee, 1990; Goryachev et al., 1990) is a technologywhich has the potential for the cost-effectivetreatment of contaminated wastewaters and soils.This technology is an adaptation of an existingtechnology which has been used in a variety of otherapplications such as in the manufacture of beer cansand automobile springs and in the destruction ofkidney stones via focused high-pressure shockwaves. Pulsed-plasma discharge systems have alsobeen used to knock barnacles off marine structures, toform high strength metal alloys and to pressure-testcannon bores.
Pulsed-power discharge into water or water-solid slurries is an electrohydraulic phenomenoncharacterized by a periodic rapid release ofaccumulated electrical energy across a submergedelectrode gap ( 1 - 2 cm). The power source is a bankof charged capacitors capable of delivering a highvoltage, high amperage electrical current to thesubmerged electrodes at a frequency of 20 kHz. Eachelectrical discharge produces a short (20 us) burst of ata high power density within the electrode gap (i.e., 36kj). This highly ionized and pressurized plasma hasthe ability to transfer energy to wastewater viadissociation, excitation, and ionization (e.g. H2O+, eaq,OH, H , etc.) with a corresponding increase intemperature. The plasma produces a very highpressure shock wave (> 14,000 atm). If thepropagating shock wave is reflected back from eithera free surface or from a material with a differentaccoustic impedance, intense cavitation occurs withthe associated chemical changes as described abovefor the cavitational effects of ultrasound (pressurewaves in the latter case range from 2 to 200 atmdepending on applied frequency and power). Thus apulsed-power discharge in water provides a highlyefficient method for promoting pyrolytic, OH radical,aquated electron and UV promoted reactions inwater or soil-water slurries. Additional reactionpathways are likely to result from the direct reactionsof the rapidly expanding plasma gases with thechemical substrates of interest and from indirectproduction of OH radicals due to the release of soft X-rays and high energy UV radiation from theenergized plasma. In addition., the intense cavitationevents induced by the shock waves emanating fromthe plasma discharge can be used to destroyhalogenated hydrocarbons by the above mechanisms,to separate suspended and dissolved solids fromwater (due to the extremely high pressures whichdramatically shift chemical equilibria) and todisinfect wastewater by killing bacteria and viruses(Gilliland and Speck, 1967).
133
Spark-gap discharge into water with shock-wave focusing by a metal semi-ellipsoid has beenutilized in several biomedical applications such asextracorporeal shock wave lithotripsy (Chaussy, 1986;Gravenstein and Peter, 1986). This technique is usedroutinely for the destruction of kidney stones and forthe general treatment of urinary stone disease (e.g.,calcium oxalate stones and uric acid stones). Thebasis of the method is to use an externally-generatedshock wave that enters the body and propagateswithout interference because there is essentially nodifference in acoustic impedance between bodytissues and water. At the tissue/stone interface thereis a partial reflection of the shock Wave and thus ahigh pressure load which cracks the stone. Thetransmitted wave is reflected at the opposite sidewith a phase reversal such that it becomes a tensilewave. Further cracking of the stone results from anexceedance of the tensile strength of the mineral. Inessence, the pressure amplitude of the shock wavemust greatly exeed the compressive and tensilestrength of the stone.
In a spark-gap lithotriptor, shock waves areproduced by an underwater spark discharge. Theenergy stored in a condensor is released withinseveral microseconds. This rapid release of energyresults in an arc across the electrode gap, which inturn explosively vaporizes the water around the pathof the arc and establishes a rapidly expanding plasma.This explosive vaporization of the water yields ashock wave in the surrounding water whichpropagates radially outward. In lithotripsy, the shockwave is generated by spark-gap discharge at the focalpoint of rotationally symmetrical semi-ellipsoid. Theshock wave is reflected off the elliptical wall andconcentrates at a second focal point.
ApplicationsWe are optimistic about the potential of
ultrasonic irradiation and pulsed-power plasma (orspark-gap) discharge for the practical and economicaltreatment of a variety of hazardous chemicalcompounds found in contaminated aquatic systems.However, more research is needed in order tounravel the relative roles of hydraulic cavitation, softX-rays, plasma-initiated free-radical reactions, OHradical attack and direct pyrolysis toward thedegradation of substrates. We need to explore theeffects of temperature, ionic strength, energyintensity, energy density, and energy partitioning, toexamine the effects of the chemical andthermodynamical properties of the dissolved gases(e.g., Ar vs. O2), to examine the sonolysis ofintermediate products, to establish OH radicalformation rates and steady-state concentrations usingspecific scavengers. Fundamental physical theories
of induced cavitation coupled with chemistry need tobe developed.
The core of the pulsed-power reactor system isthe plasma discharge chamber (PDC). This chamber(5 - 20 L in volume) is a thick-walled alloy pressurechamber designed to sustain the millions of shockwave cycles produced by the pulsed plasma powerdischarge. The head of the PDC contains a bulkheadpenetration through which the external powersupply can be electrically connected to the twosubmerged electrodes. The inlet nozzle is connectedto a pipe through which the solute.water system willbe introduced via pumping from a reservoir. Theoutlet nozzle is connected to a second pipe throughwhich the treated effluent will flow. A control valueat the outlet of the PDC will regulate the flow.
We are currently carrying out experiments todetermine the optimum process conditions forchlorinated hydrocarbon destruction via directplasma contact, UV photolysis and shock-waveinduced cavitation. Once the conditions (e.g., thenature of the dissolved gases, the role of O2 transfer,presence of inhibitors, ionic strength, etc.) have beendetermined for a given design, the variables used tocontrol the degree of treatment will be the fluid flowrate (L min'1) and the plasma pulse frequency (Hz).
Since the high energy-electrical discharges areof very short duration the projected costs of thepulsed-power plasma technology are relatively low.Hazardous waste cleanup costs are estimated by theDOE to run in the range of $ 4 - 8,000 per 1 m3 ofliquid wastes with typical costs about $ 150 per m3.Pulsed-power processing should be at the lower endof the above cost range.
Initial our research into the chemical effects ofconfined shock waves have been conducted with aspark-gap lithotriptor apparatus. The physics ofspark-gap discharge in water is very similar to thatfor the higher energy pulsed-power plasma systemdescribed above.
We have been investigating reactions in avessel made of polyethylene, which has an acousticimpedance similar to that of water at a variabledistance between the first and second focal points ofthe lithotriptor. The degree of chemicaltransformation as a function of integrated shock-wave pulse time is determined using the techniquespreviously employed in this laboratory (Kormann etal., 1991) for chlorinated hydrocarbon quantificationin water. In this way we have investigated theoxidation of iodide to iodine and ferrous iron toferric iron.
134
A polyvinylidene difluoride needlehydrophone with an end-of-cable capacitance inwater of 208 pF is used to make pressuremeasurements in the shock wave field. Themaximum peak pressures at the second focal point ofthe shock waves varies between 140 and 300 atmdepending on the discharge circuit inductance. Thepeak current at discharge ranges between 10 to 20 kA.
Acknowledgements
The authors grateful acknowledge thefinancial support of the EPA, DARPA and EPRI. Weare indebted to Dr. Richard Ayers of Pulsed PowerTechnology, Inc. for introducing us to this fascinatingtechnology.
References
Chaussy, Ch. (1986) Extracorporeal Shock WaveLithotripsy , Karger, Basel, p. 155.
Clements, J. S..; Sato, M; Davis, R. H. (1987) IEEETrans. Ind. Appl., IA-23, 224.
Edebo, L.; Selin, I. (1968) /. Gen . Microbiol. 50, 253.
Flint, E. B.; Suslick, K. S. (1991) "The Temperature ofCavitation," Science, 253, 1397.
Gilliland, S. E.; Speck, M. L. (1967) Appl. Microbiol.15,1031-1037.
Goryachev, V. L; Remennyi, A. S.; Silin, N. A. (1990)Sov. Tech. Phys. Lett., 16, 439.
Gravenstein, J. S.; Peter, K. (1986) ExtracorporealShock -Wave Lithotripsy for Renal Stone Disease,Butterworths, Boston, p. 158.
Kotronarou, A.; Mills, G.; Hoffmann, M. R. (1991) J .Phys. Chem. 95, 3630.
Kotronarou, A.; Mills, G.; Hoffmann, M. R. (1992)Environ. Sci. Technol., in press.
Lee, W. M. (1990) /. Appl. Phys. 69, 6945.
Mason, T.; Lorimer, J. P. Sonochemistry: Theory,Applications and Uses of Ultrasound in Chemistry ,E. Horwood Ltd (1988).
Sehgal, C. M.; Wang, S. Y. (1989) /. Am. Chem. Soc.103,6606.
Shutilov, V. A. (1988) in Fundamental Physics ofUltrasound; Gordon & Breach Science Publishers:New York.
Suslick, K. S. (1988) in Ultrasound: Its Chemical,Physical and Biological Effects; Suslick, K. S., ed.,VCH: New York, p. 126-163.
Suslick, K. S.; Hammerton, D. A.; Cline, D. E., Jr.(1986) /. Am. Chem. Soc. 108, 5641.
Suslick, K. S. (1986) in Modern Synthetic Methods;Sheffold, R., Ed., Springer-Verlag: New York, 1986,Vol. 4.
Suslick, K. S.; Choe, S. B.; Cichowlas, A. A.; Grinstaff,M. W. (1991) Nature 253, 414-416.
Weldon, W. F. (1985) IEEE Spectrum, 59-66.
Wesley, R. H.; Ayres, R. A. (1984) U. S. Patent No.4,479,680 Method and Apparatus forElectrohydrodynamic Fracturing of Rock.
Wesley, R. H.; Ayres, R. A. (1984) U. S. Patent No.4,458,153 Organism Destruction by ElectrohydraulicDischarge within a Pulsed Magnetic Field Envelope.
135
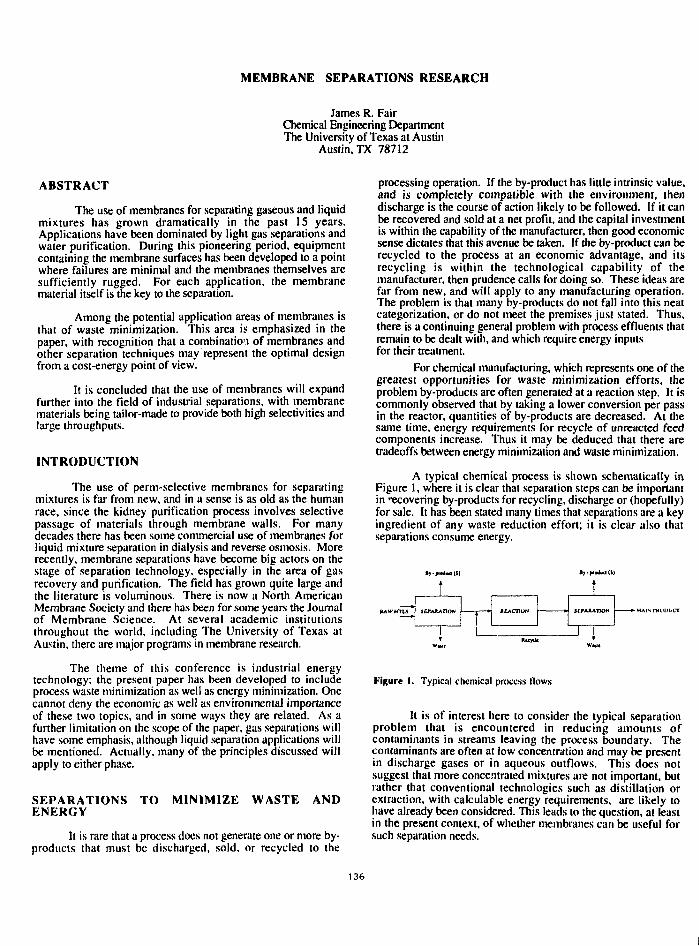
MEMBRANE SEPARATIONS RESEARCH
James R. FairChemical Engineering DepartmentThe University of Texas at Austin
Austin, TX 78712
ABSTRACT
The use of membranes for separating gaseous and liquidmixtures has grown dramatically in the past 15 years.Applications have been dominated by light gas separations andwater purification. During this pioneering period, equipmentcontaining the membrane surfaces has been developed to a pointwhere failures are minimal and the membranes themselves aresufficiently rugged. For each application, the membranematerial itself is the key to the separation.
Among the potential application areas of membranes isthat of waste minimization. This area is emphasized in thepaper, with recognition that a combination of membranes andother separation techniques may represent the optimal designfrom a cost-energy point of view.
It is concluded that the use of membranes will expandfurther into the field of industrial separations, with membranematerials being tailor-made to provide both high selectivities andlarge throughputs.
INTRODUCTION
The use of perm-selective membranes for separatingmixtures is far from new, and in a sense is as old as the humanrace, since the kidney purification process involves selectivepassage of materials through membrane walls. For manydecades there has been soine commercial use of membranes forliquid mixture separation in dialysis and reverse osmosis. Morerecently, membrane separations have become big actors on thestage of separation technology, especially in the area of gasrecovery and purification. The field has grown quite large andthe literature is voluminous. There is now a North AmericanMembrane Society and there has been for some years the Journalof Membrane Science. At several academic institutionsthroughout the world, including The University of Texas atAustin, there are major programs in membrane research.
The theme of this conference is industrial energytechnology; the present paper has been developed to includeprocess waste minimization as well as energy minimization. Onecannot deny the economic as well as environmental importanceof these two topics, and in some ways they are related. As afurther limitation on the scope of the paper, gas separations willhave some emphasis, although liquid separation applications willbe mentioned. Actually, many of the principles discussed willapply to either phase.
SEPARATIONS TO MINIMIZE WASTE ANDENERGY
It is rare that a process does not generate one or more by-products that must be discharged, sold, or recycled to the
processing operation. If the by-product has little intrinsic value,and is completely compatible with the environment, thendischarge is the course of action likely to be followed. If it canbe recovered and sold at a net profit, and the capital investmentis within the capability of the manufacturer, then good economicsense dictates that this avenue be taken. If the by-product can berecycled to the process at an economic advantage, and itsrecycling is within the technological capability of themanufacturer, then prudence calls for doing so. These ideas arefar from new, and will apply to any manufacturing operation.The problem is that many by-products do not fall into this neatcategorization, or do not meet the premises just stated. Thus,there is a continuing general problem with process effluents thatremain to be dealt with, and which require energy inputsfor their treatment.
For chemical manufacturing, which represents one of thegreatest opportunities for waste minimization efforts, theproblem by-products are often generated at a reaction step. It iscommonly observed that by taking a lower conversion per passin the reactor, quantities of by-products are decreased. At thesame time, energy requirements for recycle of unreacted feedcomponents increase. Thus it may be deduced that there aretradeoffs between energy minimization and waste minimization.
A typical chemical process is shown schematically inFigure 1, where it is clear that separation steps can be importantin recovering by-products for recycling, discharge or (hopefully)for sale. It has been stated many times that separations are a keyingredient of any waste reduction effort; it is clear also thatseparations consume energy.
RAWMTIS»•
]SETAMAT1QN A
REACTION SETA
1JWTTON *• IHAIN PKUDUCT
J I
Figure 1. Typical chemical process Hows
It is of interest here to consider the typical separationproblem that is encountered in reducing amounts ofcontaminants in streams leaving the process boundary. Thecontaminants are often at low concentration and may be presentin discharge gases or in aqueous outflows. This does notsuggest that more concentrated mixtures are not important, butrather that conventional technologies such as distillation orextraction, with calculable energy requirements, are likely tohave already been considered. This leads to the question, at leastin the present context, of whether membranes can be useful forsuch separation needs.
136
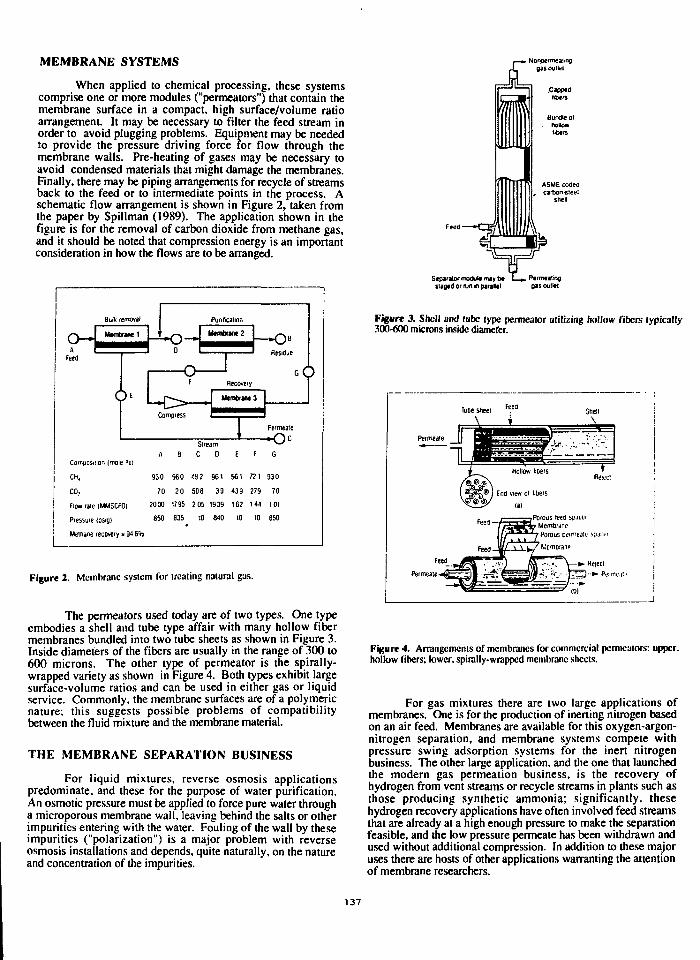
MEMBRANE SYSTEMS
When applied to chemical processing, these systemscomprise one or more modules ("permeators") that contain themembrane surface in a compact, high surface/volume ratioarrangement. It may be necessary to filter the feed stream inorder to avoid plugging problems. Equipment may be neededto provide the pressure driving force for flow through themembrane walls. Pre-heating of gases may be necessary toavoid condensed materials that might damage the membranes.Finally, there may be piping arrangements for recycle of streamsback to the feed or to intermediate points in the process. Aschematic flow arrangement is shown in Figure 2, taken fromthe paper by Spillman (1989). The application shown in thefigure is for the removal of carbon dioxide from methane gas,and it should be noted that compression energy is an importantconsideration in how the flows are to be arranged.
Bulk emoval
s \ 1 Membrane 1
feed I
cJ E
Composition (mole °o)
CH,
CO,
Floo rale IMMSCFD)
Pressure (DSig)
Metnane recovery * 94 6<*Q
I
rU.
D
—(
^ >
A
930
70
2000
850
6
960
20
1795
835
Purification
| Membrane 2 |
F
—111Recovery
Membrane 3
—
StreamC D E F
'.92
508
2 05
10
961 561 721
39 439 279
939 162 144
840 tO 10
Residue
G C
1—1Permeate
G
930
70
101
850
Figure 2. Membrane system for treating natural gas.
The permeators used today are of two types. One typeembodies a shell and tube type affair with many hollow fibermembranes bundled into two tube sheets as shown in Figure 3.Inside diameters of the fibers are usually in the range of 300 to600 microns. The other type of permeator is the spirally-wrapped variety as shown in Figure 4. Both types exhibit largesurface-volume ratios and can be used in either gas or liquidservice. Commonly, the membrane surfaces are of a polymericnature; this suggests possible problems of compatibilitybetween the fluid mixture and the membrane material.
THE MEMBRANE SEPARATION BUSINESS
For liquid mixtures, reverse osmosis applicationspredominate, and these for the purpose of water purification.An osmotic pressure must be applied to force pure water througha microporous membrane wall, leaving behind the salts or otherimpurities entering with the water. Fouling of the wall by theseimpurities ("polarization") is a major problem with reverseosmosis installations and depends, quite naturally, on the natureand concentration of the impurities.
Separator module may bestaged or run in paraKel
Figure 3. Shell and lube type pcrmealor utilizing hollow fibers typically300-600 microns inside diameter.
Permeate
Feed
Permeate-^i
Tu&e sheet
J ftt1
FecrJ-
Feed
Feed
i
' - — - • '
Hollow hbers
End view ot libers
HI
, _ , Porous teed sp.iceIf' mi' Membrnne
Stieli
Y: _ • : > ; •
tHeien
11/^^/ Porous pi'imeali: spjrn
i / *y^ ^ _ / M " -..•• V-*-
• mi
Reieci
•-»• FVimcat-
Figure 4. Arrangements of membranes for commercial permcalors: upper,hollow fibers; lower, spirally-wrapped membrane sheets.
For gas mixtures there are two large applications ofmembranes. One is for the production of inerting nitrogen basedon an air feed. Membranes are available for this oxygen-argon-nitrogen separation, and membrane systems compete withpressure swing adsorption systems for the inert nitrogenbusiness. The other large application, and the one that launchedthe modern gas permeation business, is the recovery ofhydrogen from vent streams or recycle streams in plants such asthose producing synthetic ammonia; significantly, thesehydrogen recovery applications have often involved feed streamsthat are already at a high enough pressure to make the separationfeasible, and the low pressure permeate has been withdrawn andused without additional compression. In addition to these majoruses there are hosts of other applications warranting the attentionof membrane researchers.
137
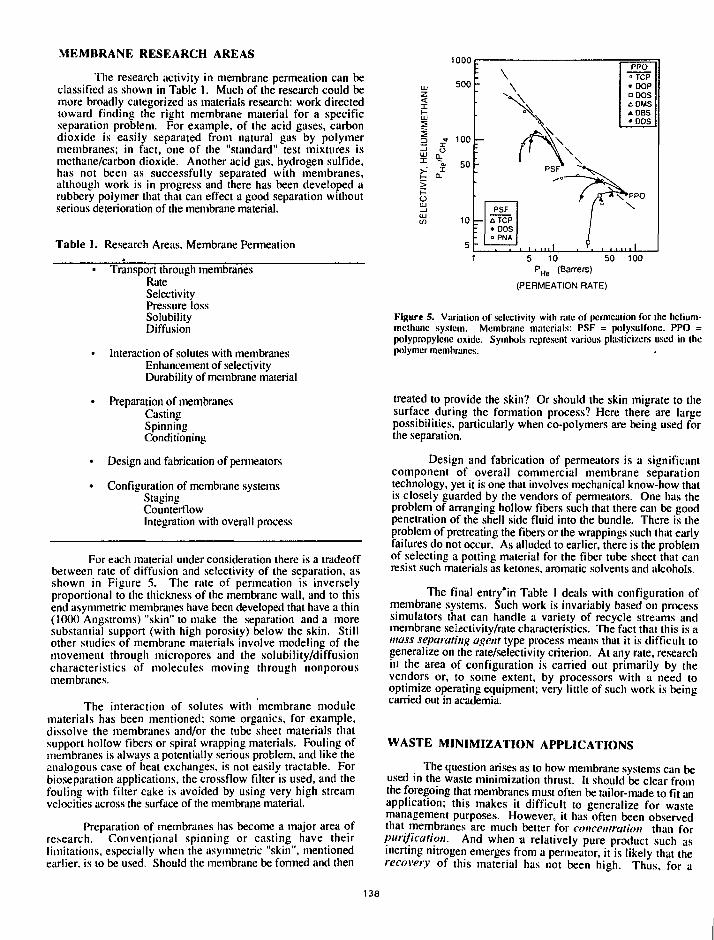
MEMBRANE RESEARCH AREAS
The research activity in membrane permeation can beclassified as shown in Table 1. Much of the research could bemore broadly categorized as materials research: work directedtoward finding the right membrane material for a specificseparation problem. For example, of the acid gases, carbondioxide is easily separated from natural gas by polymermembranes; in fact, one of the "standard" test mixtures ismethane/carbon dioxide. Another acid gas, hydrogen sulfide,has not been as successfully separated with membranes,although work is in progress and there has been developed arubbery polymer that that can effect a good separation withoutserious deterioration of the membrane material.
Table 1. Research Areas, Membrane Permeation*
• Transport through membranesRateSelectivityPressure lossSolubilityDiffusion
• Interaction of solutes with membranesEnhancement of selectivityDurability of membrane material
• Preparation of membranesCastingSpinningConditioning
• Design and fabrication of permeators
• Configuration of membrane systemsStagingCounterflowIntegration with overall process
For each material under consideration there is a tradeoffbetween rate of diffusion and selectivity of the separation, asshown in Figure 5. The rate of permeation is inverselyproportional to the thickness of the membrane wall, and to thisend asymmetric membranes have been developed that have a thin(1000 Angstroms) "skin" to make the separation and a moresubstantial support (with high porosity) below the skin. Stillother studies of membrane materials involve modeling of themovement through micropores and the solubility/diffusioncharacteristics of molecules moving through nonporousmembranes.
The interaction of solutes with membrane modulematerials has been mentioned; some organics, for example,dissolve the membranes and/or the tube sheet materials thatsupport hollow fibers or spiral wrapping materials. Fouling ofmembranes is always a potentially serious problem, and like theanalogous case of heat exchanges, is not easily tractable. Forbioseparation applications, the crossflow filter is used, and thefouling with filter cake is avoided by using very high streamvelocities across the surface of the membrane material.
Preparation of membranes has become a major area ofresearch. Conventional spinning or casting have theirlimitations, especially when the asymmetric "skin", mentionedearlier, is to be used. Should the membrane be formed and then
1— I
to111
500
100
50
10
5
: \: \
PSFA TCP• DOS° PNA
r \x1 \ \
/ii . y.
PPO•> TCPTDOPDDOSaDMSA DBS•DOS
5 10 SO 100PHe (Barrere)
(PERMEATION RATE)
Figure 5. Variation of selectivity with rate of permeation for the liclium-mclhanc system. Membrane materials: PSF = polysulfonc. PPO =polypropylene oxide. Symbols represent various plaslicizcrs used in thepolymer membranes.
treated to provide the skin? Or should the skin migrate to thesurface during the formation process? Here there are largepossibilities, particularly when co-polymers are being used forthe separation.
Design and fabrication of permeators is a significantcomponent of overall commercial membrane separationtechnology, yet it is one that involves mechanical know-how thatis closely guarded by the vendors of permeators. One has theproblem of arranging hollow fibers such that there can be goodpenetration of the shell side fluid into the bundle. There is theproblem of pretreating the fibers or the wrappings such that earlyfailures do not occur. As alluded to earlier, there is the problemof selecting a potting material for the fiber tube sheet that canresist such materials as ketones, aromatic solvents and alcohols.
The final entry'in Table 1 deals with configuration ofmembrane systems. Such work is invariably based on processsimulators that can handle a variety of recycle streams andmembrane selectivity/rate characteristics. The fact that this is amass separating agent type process means that it is difficult togeneralize on the rate/selectivity criterion. At any rate, researchin the area of configuration is carried out primarily by thevendors or, to some extent, by processors with a need tooptimize operating equipment; very little of such work is beingcarried out in academia.
WASTE MINIMIZATION APPLICATIONS
The question arises as to how membrane systems can beused in the waste minimization thrust. It should be clear fromthe foregoing that membranes must often be tailor-made to fit anapplication; this makes it difficult to generalize for wastemanagement purposes. However, it has often been observedthat membranes are much better for concentration than forpurification. And when a relatively pure product such asinerting nitrogen emerges from a penneator, it is likely that therecovery of this material has not been high. Thus, for a
138
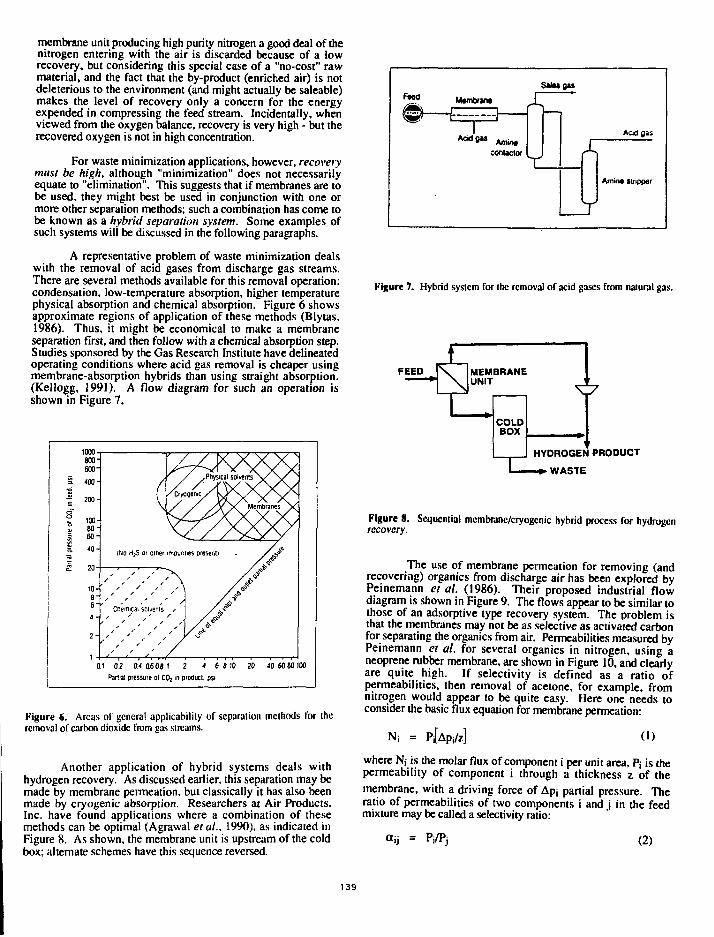
membrane unit producing high purity nitrogen a good deal of thenitrogen entering with the air is discarded because of a lowrecovery, but considering this special case of a "no-cost" rawmaterial, and the fact that the by-product (enriched air) is notdeleterious to the environment (and might actually be saleable)makes the level of recovery only a concern for the energyexpended in compressing the feed stream. Incidentally, whenviewed from the oxygen balance, recovery is very high - but therecovered oxygen is not in high concentration.
For waste minimization applications, however, recoverymust be high, although "minimization" does not necessarilyequate to "elimination". This suggests that if membranes are tobe used, they might best be used in conjunction with one ormore other separation methods; such a combination has come tobe known as a hybrid separation system. Some examples ofsuch systems will be discussed in the following paragraphs.
A representative problem of waste minimization dealswith the removal of acid gases from discharge gas streams.There are several methods available for this removal operation:condensation, low-temperature absorption, higher temperaturephysical absorption and chemical absorption. Figure 6 showsapproximate regions of application of these methods (Blytas,1986). Thus, it might be economical to make a membraneseparation first, and then follow with a chemical absorption step.Studies sponsored by the Gas Research Institute have delineatedoperating conditions where acid gas removal is cheaper usingmembrane-absorption hybrids than using straight absorption.(Kellogg, 1991). A flow diagram for such an operation isshown in Figure 7.
1000800-
0.1 0.2 O.< 0.608 1 2 4 6 810 20 40 6080100
Partial pressure ot CO? m product, psi
Figure 6. Areas ot general applicability of separation methods for (heremoval of carbon dioxide from gas streams.
Another application of hybrid systems deals withhydrogen recovery. As discussed earlier, this separation may bemade by membrane permeation, but classically it has also beenmade by cryogenic absorption. Researchers at Air Products,Inc. have found applications where a combination of thesemethods can be optimal (Agrawal et at., 1990), as indicated inFigure 8. As shown, the membrane unit is upstream of the coldbox; alternate schemes have this sequence reversed.
^ M«mbran«
Airitrw
contactor
Sain gas
TJL
T
Acid gas
Amint stripper
Figure 7. Hybrid system for the removal of acid gases from natural gas.
FEED
\
LMEMBRANEUNIT
»COLDBOX
L_HYDROGEh
—.»• WASTE
PRODUCT
Figure 8. Sequential membrane/cryogenic hybrid process for hydrogenrecovery.
The use of membrane permeation for removing (andrecovering) organics from discharge air has been explored byPeinemann et al. (1986). Their proposed industrial flowdiagram is shown in Figure 9. The flows appear to be similar tothose of an adsorptive type recovery system. The problem isthat the membranes may not be as selective as activated carbonfor separating the organics from air. Permeabilities measured byPeinemann et al. for several organics in nitrogen, using aneoprene rubber membrane, are shown in Figure 10, and clearlyare quite high. If selectivity is defined as a ratio ofpermeabilities, then removal of acetone, for example, fromnitrogen would appear to be quite easy. Here one needs toconsider the basic flux equation for membrane permeation:
N| = (1)
where N, is the molar flux of component i per unit area, P; is thepermeability of component i through a thickness z of themembrane, with a driving force of Apj partial pressure. Theratio of permeabilities of two components i and j in the feedmixture may be called a selectivity ratio:
= Pi/Pj (2)
139
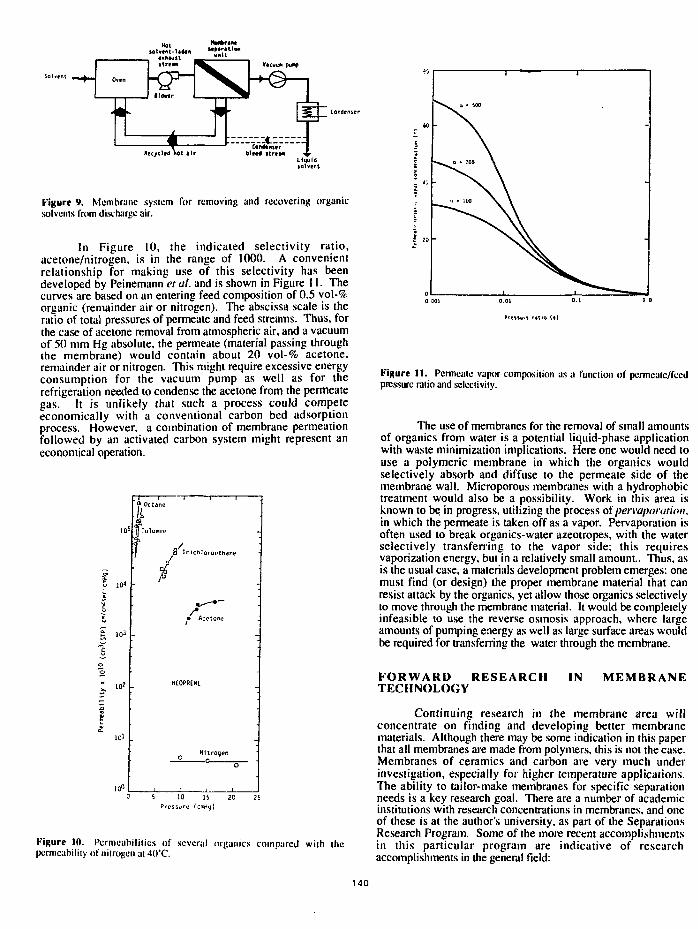
VACUUM pu«p
^ Counter |t Mr t\tti llrCM •$•
liquidIDlvrnt
Figure 9. Membrane system for removing and recovering organicsolvents from discharge air.
In Figure 10, the indicated selectivity ratio,acetone/nitrogen, is in the range of 1000. A convenientrelationship for making use of this selectivity has beendeveloped by Peinemann et at. and is shown in Figure 11. Thecurves are based on an entering feed composition of 0.5 vol-%organic (remainder air or nitrogen). The abscissa scale is theratio of total pressures of permeate and feed streams. Thus, forthe case of acetone removal from atmospheric air, and a vacuumof 50 mm Hg absolute, the permeate (material passing throughthe membrane) would contain about 20 vol-% acetone,remainder air or nitrogen. This might require excessive energyconsumption for the vacuum pump as well as for therefrigeration needed to condense the acetone from the permeategas. It is unlikely that such a process could competeeconomically with a conventional carbon bed adsorptionprocess. However, a combination of membrane permeationfollowed by an activated carbon system might represent aneconomical operation.
103
10"
• Octane
-|j Toluene
/B Trichloroethane
<£
• A
Nitrogen
5 10 15 20Pressure (cffiHg)
Figure 10. Permeabilities of several organics compared with ihepermeability of nitrogen at 40'C.
Figure 11. Pcrmcale vapor composition as a function of permcalc/fccdpressure ratio and selectivity.
The use of membranes for the removal of small amountsof organics from water is a potential liquid-phase applicationwith waste minimization implications. Here one would need touse a polymeric membrane in which the organics wouldselectively absorb and diffuse to the permeate side of themembrane wall. Microporous membranes with a hydrophobictreatment would also be a possibility. Work in this area isknown to be in progress, utilizing the process of pervaponition,in which the permeate is taken off as a vapor. Pervaporation isoften used to break organics-water azeotropes, with the waterselectively transferring to the vapor side; this requiresvaporization energy, but in a relatively small amount.. Thus, asis the usual case, a materials development problem emerges: onemust find (or design) the proper membrane material that canresist attack by the organics, yet allow those organics selectivelyto move through the membrane material. It would be completelyinfeasible to use the reverse osmosis approach, where largeamounts of pumping energy as well as large surface areas wouldbe required for transferring the water through the membrane.
FORWARD RESEARCHTECHNOLOGY
IN MEMBRANE
Continuing research in the membrane area willconcentrate on finding and developing better membranematerials. Although there may be some indication in this paperthat all membranes are made from polymers, this is not the case.Membranes of ceramics and carbon are very much underinvestigation, especially for higher temperature applications.The ability to tailor-make membranes for specific separationneeds is a key research goal. There are a number of academicinstitutions with research concentrations in membranes, and oneof these is at the author's university, as part of the SeparationsResearch Program. Some of the more recent accomplishmentsin this particular program are indicative of researchaccomplishments in the general field:
140
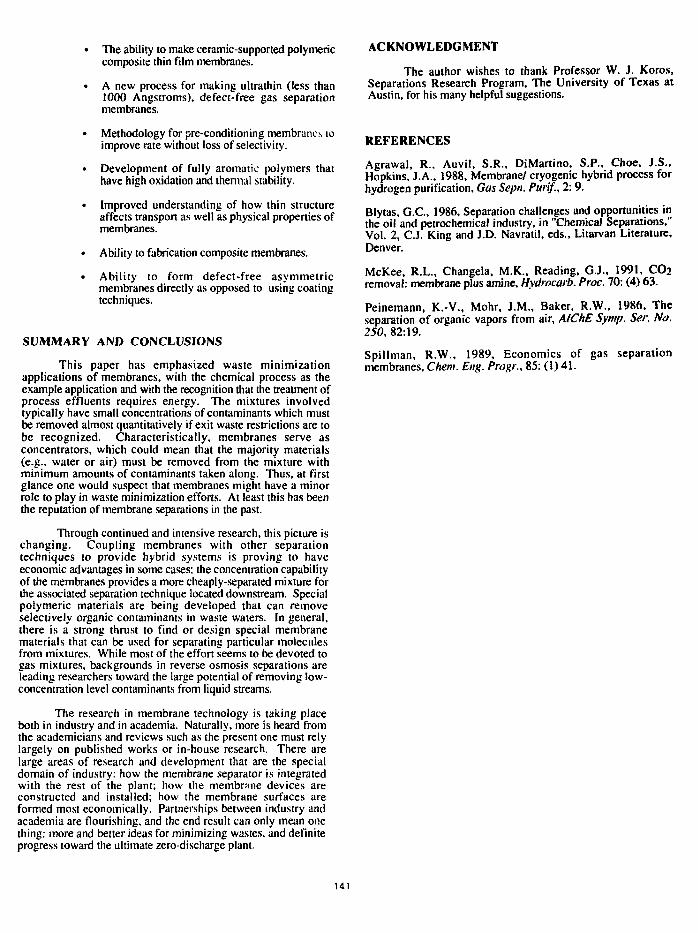
The ability to make ceramic-supported polymericcomposite thin film membranes.
A new process for making ultrathin (less than1000 Angstroms), defect-free gas separationmembranes.
Methodology for pre-conditioning membranes toimprove rate without loss of selectivity.
Development of fully aromatic polymers thathave high oxidation and thermal stability.
Improved understanding of how thin structureaffects transport as well as physical properties ofmembranes.
Ability to fabrication composite membranes.
Ability to form defect-free asymmetricmembranes directly as opposed to using coatingtechniques.
SUMMARY AND CONCLUSIONS
This paper has emphasized waste minimizationapplications of membranes, with the chemical process as theexample application and with the recognition that the treatment ofprocess effluents requires energy. The mixtures involvedtypically have small concentrations of contaminants which mustbe removed almost quantitatively if exit waste restrictions are tobe recognized. Characteristically, membranes serve asconcentrators, which could mean that the majority materials(e.g., water or air) must be removed from the mixture withminimum amounts of contaminants taken along. Thus, at firstglance one would suspect that membranes might have a minorrole to play in waste minimization efforts. At least this has beenthe reputation of membrane separations in the past.
Through continued and intensive research, this picture ischanging. Coupling membranes with other separationtechniques to provide hybrid systems is proving to haveeconomic advantages in some cases; the concentration capabilityof the membranes provides a more cheaply-separated mixture forthe associated separation technique located downstream. Specialpolymeric materials are being developed that can removeselectively organic contaminants in waste waters. In general,there is a strong thrust to find or design special membranematerials that can be used for separating particular moleculesfrom mixtures. While most of the effort seems to be devoted togas mixtures, backgrounds in reverse osmosis separations areleading researchers toward the large potential of removing low-concentration level contaminants from liquid streams.
The research in membrane technology is taking placeboth in industry and in academia. Naturally, more is heard fromthe academicians and reviews such as the present one must relylargely on published works or in-house research. There arelarge areas of research and development that are the specialdomain of industry: how the membrane separator is integratedwith the rest of the plant; how the membrane devices areconstructed and installed; how the membrane surfaces areformed most economically. Partnerships between industry andacademia are flourishing, and the end result can only mean onething: more and better ideas for minimizing wastes, and definiteprogress toward the ultimate zero-discharge plant.
ACKNOWLEDGMENT
The author wishes to thank Professor W. J. Koros,Separations Research Program, The University of Texas atAustin, for his many helpful suggestions.
REFERENCES
Agrawal, R., Auvil, S.R., DiMartino, S.P., Choe, J.S.,Hopkins, J.A., 1988, Membrane/ cryogenic hybrid process forhydrogen purification. Gas Sepn. Purif., 2: 9.
Blytas, G.C., 1986, Separation challenges and opportunities inthe oil and petrochemical industry, in "Chemical Separations,"Vol. 2, C.J. King and J.D. Navratil, eds., Litarvan Literature,Denver.
McKee, R.L., Changela, M.K., Reading, G.J., 1991, COiremoval: membrane plus amine, Hydrocarb. Proc. 70: (4) 63.
Peinemann, K.-V., Mohr, J.M., Baker, R.W., 1986, Theseparation of organic vapors from air, AlChE Symp. Ser. No.250,82:19.
Spillman, R.W., 1989, Economics of gas separationmembranes, Chem. Eng. Progr., 85: (1) 41.
141
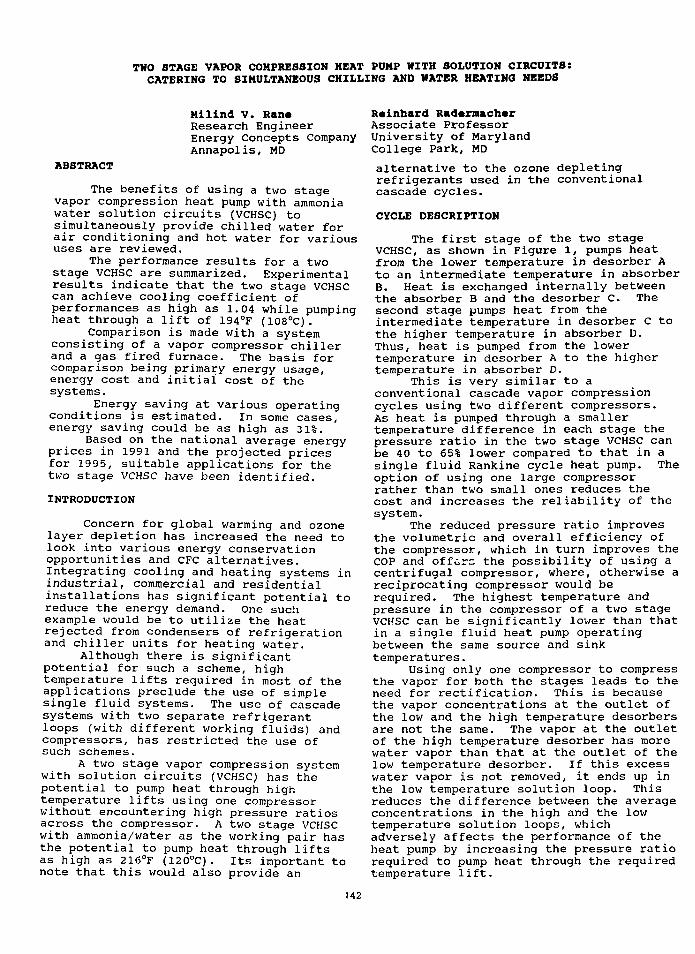
TWO STAGE VAPOR COMPRESSION HEAT PUMP WITH SOLUTION CIRCUITS:CATERING TO SIMULTANEOUS CHILLING AND WATER HEATING NEEDS
Milind V. Ran*Research EngineerEnergy Concepts CompanyAnnapolis, MD
ABSTRACT
The benefits of using a two stagevapor compression heat pump with ammoniawater solution circuits (VCHSC) tosimultaneously provide chilled water forair conditioning and hot water for varioususes are reviewed.
The performance results for a twostage VCHSC are summarized. Experimentalresults indicate that the two stage VCHSCcan achieve cooling coefficient ofperformances as high as 1.04 while pumpingheat through a lift of 194°F (1O8°C) .
Comparison is made with a systemconsisting of a vapor compressor chillerand a gas fired furnace. The basis forcomparison being primary energy usage,energy cost and initial cost of thesystems.
Energy saving at various operatingconditions is estimated. In some cases,energy saving could be as high as 31%.
Based on the national average energyprices in 1991 and the projected pricesfor 1995, suitable applications for thetwo stage VCHSC have been identified.
INTRODUCTION
Concern for global warming and ozonelayer depletion has increased the need tolook into various energy conservationopportunities and CFC alternatives.Integrating cooling and heating systems inindustrial, commercial and residentialinstallations has significant potential toreduce the energy demand. One suchexample would be to utilize the heatrejected from condensers of refrigerationand chiller units for heating water.
Although there is significantpotential for such a scheme, hightemperature lifts required in most of theapplications preclude the use of simplesingle fluid systems. The use of cascadesystems with two separate refrigerantloops (with different working fluids) andcompressors, has restricted the use ofsuch schemes.
A two stage vapor compression systemwith solution circuits (VCHSC; has thepotential to pump heat through hightemperature lifts using one compressorwithout encountering high pressure ratiosacross the compressor. A two stage VCHSCwith ammonia/water as the working pair hasthe potential to pump heat through liftsas high as 216°F (12O°C). Its important tonote that this would also provide an
Rcinhard Rad«rraach«rAssociate ProfessorUniversity of MarylandCollege Park, MD
alternative to the ozone depletingrefrigerants used in the conventionalcascade cycles.
CYCLE DESCRIPTION
The first stage of the two stageVCHSC, as shown in Figure 1, pumps heatfrom the lower temperature in desorber Ato an intermediate temperature in absorberB. Heat is exchanged internally betweenthe absorber B and the desorber C. Thesecond stage pumps heat from theintermediate temperature in desorber C tothe higher temperature in absorber D.Thus, heat is pumped from the lowertemperature in desorber A to the highertemperature in absorber D.
This is very similar to aconventional cascade vapor compressioncycles using two different compressors.As heat is pumped through a smallertemperature difference in each stage thepressure ratio in the two stage VCHSC canbe 4 0 to 65% lower compared to that in asingle fluid Rankine cycle heat pump. Theoption of using one large compressorrather than two small ones reduces thecost and increases the reliability of thesystem.
The reduced pressure ratio improvesthe volumetric and overall efficiency ofthe compressor, which in turn improves theCOP and offers the possibility of using acentrifugal compressor, where, otherwise areciprocating compressor would berequired. The highest temperature andpressure in the compressor of a two stageVCHSC can be significantly lower than thatin a single fluid heat pump operatingbetween the same source and sinktemperatures.
Using only one compressor to compressthe vapor for both the stages leads to theneed for rectification. This is becausethe vapor concentrations at the outlet ofthe low and the high temperature desorbersare not the same. The vapor at the outletof the high temperature desorber has morewater vapor than that at the outlet of thelow temperature desorber. If this excesswater vapor is not removed, it ends up inthe low temperature solution loop. Thisreduces the difference between the averageconcentrations in the high and the lowtemperature solution loops, whichadversely affects the performance of theheat pump by increasing the pressure ratiorequired to pump heat through the requiredtemperature lift.
142
A new scheme to significantly improvethe performance of the two stage cycle byeliminating the rectifier was firstinvestigated with the help of computersimulation (1), and then incorporated inthe experimental setup. The need for arectifier is eliminated by incorporating ableed line. Water balance in the high andthe low temperature circuits is maintainedby bleeding 2 to 5% of the weak solutionflow from the low temperature solutioncircuit to the high temperature solutioncircuit.
A 1.42 Ton (5 kW) bread board unitwas setup to test the two stage VCHSC(Figure 2).
SUMMARY OF EXPERIMENTAL RESULTS
The unit was operated successfullyunder stable conditions and the necessarycontrol mechanisms and strategies weredeveloped (2). Data from some of theexperimental runs is summarized in Tables1 and 2.
Operating Conditions:The heat pump was operated with an averageglycol-water temperature in the desorberof 32°F (0°C), and that in the absorber of212°F (100°C). The temperature of theglycol-water leaving the low temperaturedesorber was around 24°F (-4.4°C) and thatleaving the high temperature absorber wasaround 218°F (103.5°C). The weak solutionmass flow rate was varied from 6.6 to 22.8g/s in the low temperature stage and from0.04 to 0.072 lb/s (18 to 32.7 g/s) in thehigh temperature stage. Data werecollected at different weak solutionconcentrations in the low temperaturestage ranging from 4 3.0 to 56.0 wt%ammonia. The mass flow rate of theglycol-water mixture in the desorber andthe absorber was fixed at about 0.275 lb/s(125 g/s).
Performance Calculations;The desorber and the absorber capacitieswere calculated using the ammonia solutionconcentrations, the flow rates, thetemperatures at the inlet and the outletof the desorber and the absorber, and thevapor temperatures at the inlet and theoutlet of the compressor. Thesecapacities were found to be within +5percent of the capacities calculated basedon the glycol-water mixture. The coolingcapacities reported here are based on thecalculations made using the enthalpybalance on the glycol-water mixture.
The cooling COP of the heat pump isbased on the measured values for the powerconsumption of the compressor (afterbacking out the losses due to theelectrical efficiency of the motor (85%)and the transmission efficiency of thebelts (95%)). Thus the cooling COPs arebased on the compressor shaft work and theheating COPs will be one higher than the
cooling COPs. As the pump work is only1-4% of the compressor work, it is notconsidered in the COP calculation.
Results:Test results of the two stage heat pumpare very encouraging. Cooling COP in therange of 0.69 to 1.04 were obtained for atemperature lift of 194°F (108°C) . Thecooling capacities were in the range of0.57 to 1.2 ton (2.02 to 4.22 kW). Thepressure ratios encountered at variousoperating conditions range between 6.9 and11.0. High temperature lifts are achievedat pressure ratios which are less thanhalf as large as those for conventionalsystems (pressure ratio for a conventionalvapor compression heat pump using pureammonia as the working fluid would beabout 20 and the cooling COP would beabout 0.6 for the same temperature lift).
ECONOMIC CONSIDERATIONS
In the preceding sections, theperformance of the two stage VCHSC hasbeen reviewed and the feasibility ofoperating it at steady state has beendemonstrated.
In this section, the benefits ofusing a two stage VCHSC (option 1) tosimultaneously provide chilled water forair conditioning and hot water for varioususes will be assessed. Comparison is madewith a system consisting of a vaporcompressor chiller and a gas fired furnace(option 2). The basis for comparisonbeing:
a) the total primary energy usage,
b) the cost of energy required to runthe systems and
c) the initial costs of the systems.
Comparison Based on Primary Energy:The COP of the two stage VCHSC whilesimultaneously providing chilled water at44°F (7°C) and the hot water at 158°F (70°C)will be 1.5. This based on interpolationof experimental data. This means for a 20Ton cooling load (70.4 kW), the work input(at the compressor shaft) for the twostage VCHSC will be 46.9 kW, the heatdelivered to the hot water stream will be117.3 kW and the power input to thecompressor motor will be 55.2 kW (thisincludes the motor and the transmissionefficiencies). Compared to this, thechiller operating between 44°F (7°C) and95°F (35°C) will have a COP of 2.83 (3).This includes the condenser fan power (3kW). Thus, the chiller will consume 24.9kW of electricity. The gas fired waterheater operating at 85% efficiency willconsume 138 kW of primary energy todeliver 117.3 kW of heat. It is assumedthat all the heat delivered by the two
143

stage VCHSC is used.Thus, the tradeoffs of operating a
two stage VCHSC instead of the combinationof a chiller and a gas fired water heaterwill be the extra electricity (30.3 kW) ascompared to the extra gas used (138 JcW ofprimary energy). At a fuel to electricconversion efficiency of 351 (includesconversion and transition efficiencies),the extra electricity needed to operatethe two stage VCHSC will be generatedusing 86.6 kW of primary energy where asthe electric chiller/gas hot water systemwill use 138 kW of primary energy to heatthe water. Thus, the comparison showsthat the two stage VCHSC can save about(138 - 86.6) / (138 + 24.9 / 0.35) = 24.6%of the primary energy used by thecombination a electric chiller/gas waterheater.
Table 3 shows the effect of variationof the chilled or the hot watertemperature on the energy savings.Lowering the chilled water temperatureincreases the lift and results in decreasein COP. However, the percentage decreasein COP of the two stage VCHSC is smallerthan the percentage decrease in COP of thechiller. This is because the change inchilled water temperature represents asmaller (percentage) change in the liftfor the two stage VCHSC as compared tothat for the chiller. Thus, primaryenergy savings will increase if lowertemperature chilled water is required.
On the other hand, if the hot watertemperature is increased, the COP of thetwo stage VCHSC decreases and as a resultof this the primary energy required bythis option increases. But, the primaryenergy required for the combination of theelectric chiller/gas water heater remainsunchanged. This means that the primaryenergy savings for the two stage VCHSCwill decrease with increase in the hotwater temperature. In fact, for high heatdelivery temperatures of above 257°F(125°C) while simultaneously providingchilled water at 4A°F (7°C) , the systemusing the chiller and gas heater would bethe choice for saving primary energy.
Comparison Based on Energy Costs:Based on the national average energyprices in 1990, Holtberg et al. 1991,(residential: electric 0.0793 $/kWh, gas0.5813 $/therm; commercial: electric0.0723 $/kWh, gas 0.4821 $/therm; andindustrial: electr-ic 0.0495 $/kWh, gas0.2709 $/therm), the two stage VCHSC hasnet energy cost savings for theresidential and commercial applications(Table 4). But, the rate structure forthe industry makes this option costlierthan the combination of the electricchiller and a gas fired water heater.
Similar calculations at the projectedprices for electricity and natural gas in1995, Holtberg et al. 1991, (residential:electric 0.0945 $/kWh, gas 0.8625 S/therm;
commercial: electric 0.0859 $/kWh, gas0.7393 $/therm; and industrial: electric0.0613 $/kWh, gas 0.4712 $/therm),indicate that the energy costs for the twostage VCHSC will be less for residentialand commercial sectors. For thistemperature regime the industrial sectormay use option 2.
Table 4 also lists energy costestimates for an application where thecold stream leaves the system at -27°F (-33°C) while the hot stream exits at 158°F(70°C) . For this application at the 1995energy price estimates, the two stageVCHSC is the low cost option for all thethree sectors (residential, commercial andindustrial).
Comparison Baaed on Initial Costs:The initial costs of the two systems canbe estimated to be comparable to eachother. Although the electric chillerrequires a smaller compressor compared tothe two stage VCHSC, the added cost willmost likely be offset by the cooling towerrequired by the chiller (the chiller willrequire a water cooled condenser tooperate at the assumed COP of 2.25). Theadded cost of the two SHX in the two stageVCHSC will partly be offset by the cost ofthe gas water heater. With the aboveconsiderations in mind the added initialcost of the two stage VCHSC may not behigh. If used in an application withreasonable operating cost savings thepayback period on the added initial costmay be less than two years.
CONCLUSIONS
Experimental results for the twostage VCHSC demonstrate that* High temperature lifts (194°F) can beachieved at pressure ratios (as low as6.9) which are less than half as large asfor conventional systems (about 20).* The heat pump can be operated understable conditions using the controlmechanisms incorporated in theexperimental setup and strategiesdeveloped.* Cooling COP as high as 1.04 can beachieved while pumping heat through a liftof 194°F (108°C).
The potential of the two stage VCHSCtoo reduce primary energy demand (comparedto the combination of an electric chillerand a gas water heater), whilesimultaneously catering to cooling andheating loads is depicted.
Based on the energy costs of 1991 andthe projected costs for 1995, possibleapplications for reducing operating energycosts have been identified.
144
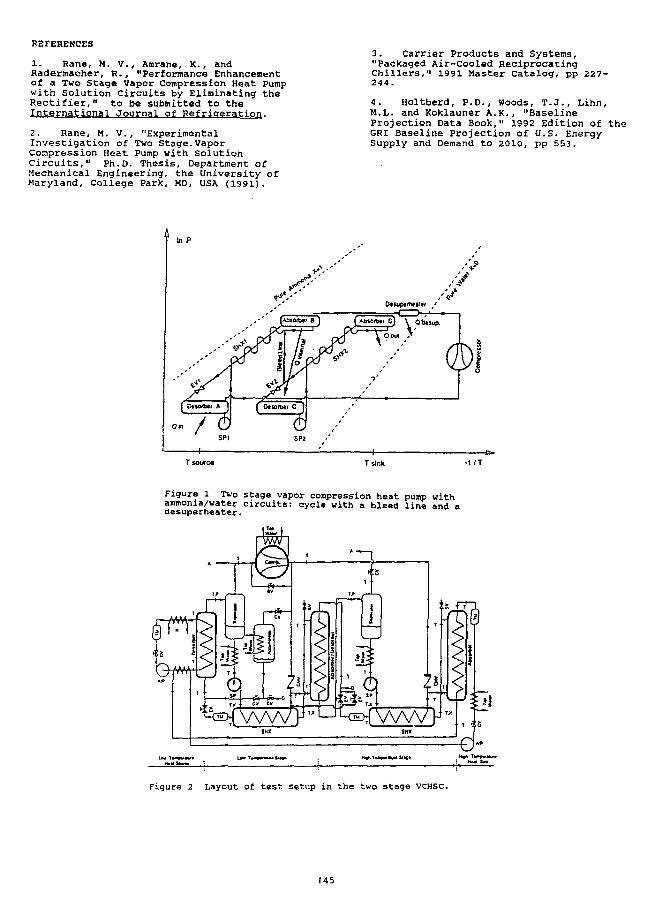
REFERENCES
1. Rane, M. V., Amrane, K., andRadermacher, R., "Performance Enhancementof a Two Stage Vapor Compression Heat Pumpwith Solution Circuits by Eliminating theRectifier," to be submitted to theInternational Journal of Refrigeration.
2. Rane, M. V., "ExperimentalInvestigation of Two Stage.VaporCompression Heat Pump with SolutionCircuits," Ph.D. Thesis, Department ofMechanical Engineering, the University ofMaryland, College Park, MD, USA (1991).
3. Carrier Products and Systems,"Packaged Air-Cooled ReciprocacingChillers," 1991 Master Catalog, pp 227-244.
4. Holtberd, P.D., Woods, T.J., Lihn,M.L. and Koklauner A.K., "BaselineProjection Data Book," 1992 Edition of theGRI Baseline Projection of U.S. EnergySupply and Demand to 2010, pp 553.
in P
T source Tsink
Figure 1 Two stage vapor compression heat pump withammonia/water circuits: cycle with a bleed line and adesuperheater.
Figure 2 Layout of test setup in the two stage VCHSC.
145
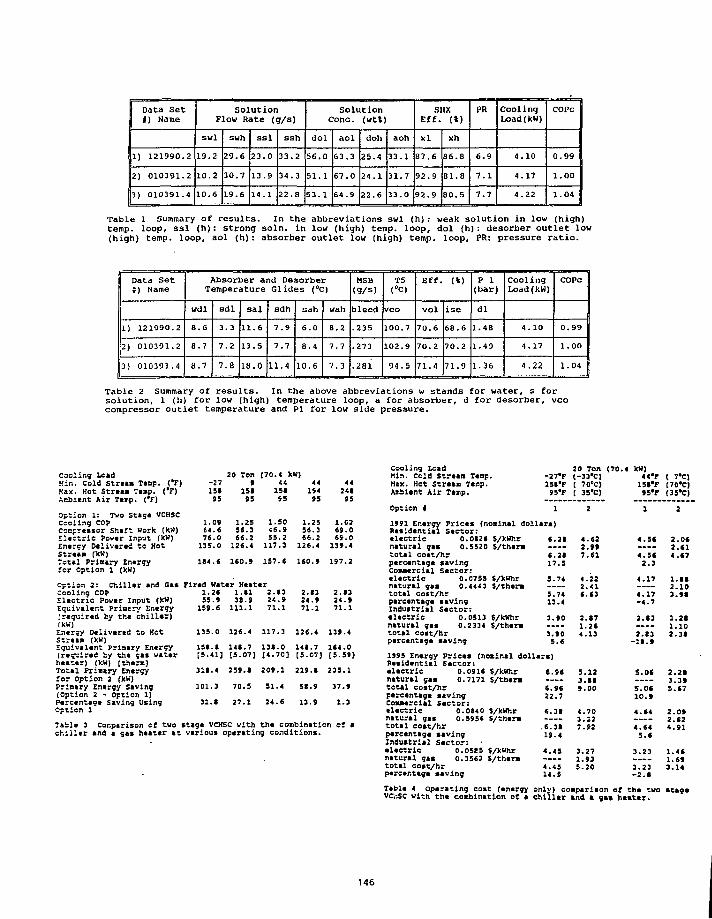
Data Set1) Name
1) 121990.2
2) 010391.2
3) 010391.4
SolutionFlow Rate (g/s)
swl
19.2
10.2
10.6
swh
29.6
30.7
19.6
ssl
23.0
13.9
14.1
ssh
33.2
34.3
22.8
SolutionCone, (wtt)
dol
S6.0
51.1
53.1
aol
63.3
67.0
64.9
doh
25.4
24.1
22.6
a oh
33.1
31.7
33.0
SMXEff. (*)
xl
87.6
92.9
92.9
xh
86.8
81.8
80.5
PR
6.9
7.1
7.7
Cool ingLoad(kW)
4.10
4.17
4.22
COPC
0.99
1.00
1.04
Table 1 Summary of results. In the abbreviations swl (h): weak solution in low (high)temp, loop, ssl (h): strong soln. in low (high) temp, loop, dol (h): desorber outlet low(high) temp, loop, aol (h): absorber outlet low (high) temp, loop, PR: pressure ratio.
Data SetJ) Name
1) 121990.2
2) 010391.2
3) 010391.4
Absorber and DesorberTemperature Glides (°C)
wdl
B.6
8.7
8.7
sdl
3.3
7.2
7.8
sal
11.6
13.5
18.0
sdh
7.9
7.7
11.4
sah
6.0
8.4
10.6
wan
8.2
7.7
7.3
MSB
(9/s)
bleed
.235
.273
.281
T5
(°c>
vco
100.7
102.9
94.5
Eff. (*)
vol
70.6
70.2
71.4
ise
68.6
70.2
71.9
P 1(bar)
dl
1.48
1.49
1.36
CoolingLoad(kW)
4.10
4.17
4.22
COPC
0.99
1.00
1.04
Table 2 Summary of results. In the above abbreviations w stands for water, s forsolution, 1 (h) for low (high) temperature loop, a for absorber, d for desorber, vcocompressor outlet temperature and PI for low side pressure.
20 Ton (70.4 kW)-27 9 44151 151 15*95 95 SS
4419495
1.0964.676.0135.0
1.2556.366.2126.4
1.50<6.955.2117.3
1.2556.366.2
126.4
1.0269.069.0
13*.4
184.6 160.* 157.6 160.* 197.2
Coding LoadKin. Cold stream Ttsp. <*F)Max. Hot Stream Temp. ("I")Aebient Air Temp. (*F)
Option l: Two Stag* VCHSCCeding COPconjressor shaft work (kW)Electric Pover Input (kK)Energy Delivered to HotStream (ktf)Total Primary Energyfor Option 1 (kW)
Option 2: Chiller and GasCooling COPElectric Power Input (kW)Equivalent Primary Energy(required by the chiller)(kW)Energy Delivered to Hotstream (kK)Equivalent Pri&ary Energy(required by the gas waterheater) (kW) [them]Total Primary Energyfor option 2 (kK)Primary Energy Saving(Option 2 - option 1)Percentage Saving UsingOption 1
Table 3 Comparison of two stage VCHSC with the combination of achiller and a gas heater at various operating conditions.
Fired water Heater1.26 1.11 2.1355.9 31.9 24.9
159.6 111.1 71.1
2.13 2.1324.9 24.971.1 71.1
135.0 126.4 117.3 126.4 13*.4
158.» 148.7 131.0
[5.41] (5.07) (4.70]
311.4 259.1 209.1
101.3 7D.5 51.4
31.» 27.1 24.6
1(1.7 164.0
[5.07] [5.59]
219.1 235.1
51.9 37.9
13.9 1.3
20 Ton (70.4 kW)-27'F <-33*C) 44*F ( 7'C)15I*F ( 70'C) 15«'F (70'C)
95«F ( 35*C) S5'F (35'C)
Cooling LoadKin. Cold Strean Temp.Hex. Hot Stream Tcnp.Ambient Air Temp.
Option I 1 2
1991 Energy Price* (nominal dollars)Residential Sector:electric 0.0126 S/kWhr 6.21 4.62natural gas 0.5520 $/them — — 2.9*total cost/hr 6.21 7.61percentage saving 17.5Commercial Sector:electric 0.075S $/ktfhr S.74 4.22natural gas 0.4443 S/therm 2.41total cost/hr 5.74 6.63percentage saving 13.4Industrial Sector:electric 0.0513 s/kwhr 3.90 2.17natural gas 0.2334 S/therm 1.2ctotal cost/hr 3.90 4.13percentage saving 5.6
1995 Energy Prices (nominal dollars)Residential Sector:electric 0.0916 $/kWhr 6.56 5.12natural gas 0.7171 S/ther» 3.Iftotal cost/hr 6.96 *.00percentage saving 22.7Commercial Sector:electric 0.0X0 s/kwhr 6.31 4.70natural gas 0.5956 $/therm 3.22total cost/hr .6.31 7.S2percentage saving 19.4Industrial Sector: -electric 0.05J5 S/kwhr 4.45 3.27natural gas 0.3563 $/thera ---- 1.93total cost/hr 4.45 5.20percentage saving 14.5
Table 4 Operating cast (energy onlv) comparison of the two stagevc.;SC with the combination of * chiller and a gas heater.
4.56
4.562.3
4.17
4.17-4.7
2.<3
2.13-11.»
5.06
S.0610.*
4.64
4.645.6
3.23
3.23-2.*
2.0C2.614.67
l.lt2.103.M
1.2S1.102.3(
2.213.3*5.67
2.0*2.(24.SI
1.461.6*3.14
146

ALTERNATE FUELS: IS YOUR WASTE STREAM A FUEL SOURCE?
. COERPER, MANAGER ALTERNATE FUEL SYSTEMS, CLEAVER-BROOKS, MILWAUKEE, Wl
ABSTRACT
Before the year 2000, more than one quarter of U.S.businesses will be firing Alternate Fuels in their boilersystems. And, the trend toward using Process Gases,Flammable Liquids, and Volatile Organic Compounds(VOC's), to supplement fossil fuels, will be considered akey element of the management strategy for industrialpower plants.
The increase in interest in Alternate Fuels and demand forproven Alternate Fuel technology is being driven by threefactors —
* The requirement of U.S. firms to compete in a globalmarket.
* The improvements in Alternate Fuel technologies.
* The increasing federal regulations encompassingmore types of waste streams.
This paper will provide an overview of the types of wasteutilized as fuel sources in packaged boilers and thetechnology available to successfully handle these wastestreams.
BACKGROUND
Twenty years ago, at the onset of the energy crisis,facility engineers and plant managers were wedgedbetween an "either-or" predicament. Either pay spiralingcosts for expensive, traditional boiler fuels or invest inunproven specialty equipment to bum Alternate Fuels.
More often than not, the facility engineer opted lo pay theprice for oil or gas. At that time Alternate Fueltechnology was not advanced enough to reliably handlethe variable composition of waste streams. Specialtyburner and control technologies were consideredembryonic.
Furthermore, the specific composition of waste streamswas not well documented. If was difficult to design aspecial fuel system because there was insufficient dataavailable regarding the type of waste, hearing value,contaminates, and consistency.
Today firms producing waste streams are required todocument the waste they produce and find alternates tothe more hazardous waste streams they have beenproducing or utilizing.
Advancements in the burner equipment, controls, andimproved definition of the available waste streams havelead to Alternate Fuel systems that are reliable and costeffective.
The focus of development of Alternate Fuel Systems hasbeen on three main waste fuel types - Waste GasStreams, Flammable Liquid Streams, and ContaminatedAir Streams.
Each of these waste streams represents a unique set ofengineering and design issues along with a unique set ofenvironmental and permitting issues.
WASTE GAS STREAMS
Examples of Waste Gas streams include Landfill Gas,Digester Gas, Hydrogen, and mixtures of Propane Ethaneand other Gaseous hydrocarbons produced by industry asa by-product.
Many times these gas streams contain contaminates thatcan be corrosive to the fuel handling or boiler equipment.Therefore, the fuel handling equipment must be selectedbased on a thorough review of the waste fuelspecification. These gas streams also are typicallydifferent in heating value and specific gravity whencompared with conventional fuels like Natural Gas.
The burner design must take into account the flow ratesand velocities of the fuel when entering the combustionchamber to mix with air for combustion.
Burner development that has taken place to address thisissue includes utilization of "Dual Canister" burners thatinclude separate orifice rings designed based on each fuelspecification. In this way the waste fuel can be firedwithout loosing the ability to fire the standard fuel as aback-up.
Waste Gas streams can usually be fired as a stand alonefuel without the need for a constant pilot or supplementalNatural gas.
The Dual Canister type burner design provides theflexibility to fire the waste gas simultaneously withNatural Gas if the waste fuel is not available in sufficientsupply to meet the demand of the boiler.
Figure 1 shows a drawing of a Dual Canister Burner.Note: the two fuels are supplied through completelyseparate burner paths. The individual orifices allow formaximum combustion efficiency while preventing highCO levels, boiler sooting, and burner overheating. Theburner is also adaptable for Propane vapor firing.
147

FIGURE 1DUAL CANISTER BURNER
When a boiler is utilized to burn a gas stream producedby a process that utilizes the steam from the boiler, it isimportant to review the relationship between the amountof waste gas produced and the steam demand on theboiler.
A key difference between a boiler and other combustiondevises like incinerators is that a boiler will only fire theamount of fuel required to meet the load (steam) demandput on the boiler system.
For this reason, a boiler burning waste gas streams thatcan not easily be stored typically includes controls thatmore closely integrate the boiler with the processproducing the waste.
These control options can include a revision to the waythe process in designed. For example, if a processincludes ten batch vessels that produce a waste gas whenvented and the plant normally vents five vessels at a time,the Alternate Fuel system design may include a change inthe procedure of the plant to vent two vessels at a time sothe amount of gas produced at a given time does notexceed the demand of the boiler.
Proper design of a boiler to handle a gas waste streamshould include a review of the process that supplies thewaste stream to the boiler.
FLAMMABLE LIQUIDS
Flammable Liquid waste streams include Alcohols,Toluene, Ketones, and other light end hydrocarbonfractions typically used by industry as solvents orproduced as by-products.
Unlike Waste Gas streams. Flammable liquid streamsshould be burned simultaneously with a standard fuel(typically Natural Gas) to provide good flame stabilityand proper combustion. The Natural Gas and FlammableLiquid stream should be metered through separate fuelhandling and burner systems. This provides for separatecontrol of each fuel, full standard fuel back-up, andpropsr materials of construction for the FlammableLiquid system.
It is not recommended that a Flammable liquid be firedutilizing a standard fuel oil burner and fuel train or bemixed with fuel oil. A standard fuel oil burner is notdesigned to properly combust a.waste liquid.Furthermore, the fuel train components on a standard fueloil system contain brass and Buna materials that may notbe compatible with the waste liquid.
New EPA regulations regarding burning waste fuels inboilers were enacted in August of 1991. Theseregulations require a formal permit procedure for thesesystems. The regulations also require the boiler toproduce less than 100 PPM Carbon Monoxide (CO) toassure that the waste stream is properly burned.
As with any Alternate Fuel source, a comprehensiveevaluation of waste fuel, boiler, and emissions isimportant to the success of the project.
CONTAMINATED AIR STREAMS
Waste Gas and Flammable liquids ane typically "high fuelvalue" streams. They contribute substantial heat input tothe boiler and significantly reduce standard fuel costswhen fired.
A third type of Alternate Fuel that can be fired in apackaged boiler includes air streams containing VolatileOrganic Compounds (VOC's). VOCs are organic vaporslike the vapor that escapes from your gas tank when youfill it with gasoline. These streams are typically low inVOC concentration and, therefore, low in heating value.New technology has been developed to mixContaminated Air streams with boiler combustion air as ameans of disposing of the air stream.
The key to the development of this technology has beenthe advancement of programmable controls that assurethat the maximum amount of VOC's are used withoutcompromising the proper operation of the boiler.
As new regulation require industry to reduce the amountof VOC's emitted, the boiler option will be onealternative available.
ENGINEERING STARTS WITH THEBURNER
The basis for successful combustion of any of these wastestreams begins at the burner. An integral front headburner design is a key advantage in the development ofspecial fuel handling systems.
High inherent combustion efficiencies and an adaptableboiler/burner design are prime influences in thedevelopment of the Dual Canister burner, simultaneousfiring of Flammable Liquids, and mixing of VOC airstreams with combustion air.
The advancement of programmable controls has alsodramatically increased the capability and reliability ofAlternate Fuel Systems.
148

IS YOUR WASTE A BOILER FUEL?
A successful Alternate Fuel project includes a completereview of the waste stream, boiler plant, and the processthat produces the waste. The regulatory requirements tobum special fuels also must be reviewed and understood.The payback for these projects can be substantial.Reductions in fuel costs between 50% and 100% andsubstantial reductions in waste hauling cost make thereturn on investment very attractive.
Today's economic climate incorporates rising costs amidtougher competition. To compete, you nvist producequality products. To be profitable, you must controlcosts. Reducing waste and turning waste into energysavings, are two areas where significant opportunities stillexist to cut costs. In looking for cost-cutting, industrialmanagers should look at their waste stream. It could be afuel source.
149

STYRENE PURIFICATION AND RECOVERY USING FREEZECRYSTALLIZATION
(Abstract Only)James A. Heist and Patrick J. Wrobel, FTC Acquisition Corp., Raleigh, NC
Lab tests have demonstrated the ability to separatestyrene from ABS and SAN plastics wastes by cooling thewaste until the styrene begins to crystallize. The same processthat recovers styrene from these wastes can be used to purifystyrene, in place of conventional distillation columns, withsubstantial reductions in energy consumption. The impact onplant energy balances for a typical styrene plant will bepresented, along with the results from lab testing.
150

GAS SEPARATION MEMBRANE USE IN THE REFINERY ANDPETROCHEMICAL INDUSTRIES
(Abstract Only)Joe Van, Hoechst-Celanese, Charlotte. NC
Membranes have gained commercial acceptance asproven methods to recover valuable gases from waste gasstreams. This paper explores ways in which gas separationmembranes are used in the refinery and petrochemicalindustries to recover and purify hydrogen. Several case studiesusing Separex® membranes to recover hydrogen fromhydrocracker offgas, ammonia purge gas, and methanol purgegas are discussed.
151
ENERGY EFFICIENCY IN CRYOGENIC FRACTIONATIONTHROUGH DISTRIBUTIVE DISTILLATION
C. R. CARRADINE, PRINCIPAL ENGINEER, OLEFINS BUSINESS DEVELOPMENTR. H. MCCUE, VP OLEFINS TECHNOLOGY
STONE & WEBSTER ENGINEERING CORPORATION, HOUSTON, TEXAS
ABSTRACT
The Advanced Recovery System (ARS) is apatented process that uses the principle of distri-buted distillation to achieve energy efficiencyin the olefins process. This paper describes theconcept of ARS and how, by integrating the chill-down and cryogenic fractionation steps, thetechnology can significantly reduce refrigerationpower requirements. ARS technology can be appliedto revamps of existing plants as well as new plantdesigns. Additional applications are now beingconsidered in the integration of refinery off-gasstreams with the olefins process.
BACKGROUND: THE OLEFINS PROCESS
The process for the production of high puritylight olefins (ethylene and propylene) is wellestablished and has been widely applied throughoutthe world. The basic process, first developedin the 1940's, utilizes the following fundamentalsteps:
]. Pyrolysis: Conversion of saturate hydrocarbonsto olefins in high-temperature furnaces(most commonly referred to as steam cracking).
2 Quenching: Reaction termination via heatremoval and subsequent cool down with efficientrecovery of the heat removed.
3. Treating: Compression, acid gas removal,drying.
4. Chilldown: Heat removal from the process tocryogenic levels using multi-stage propyleneand ethylene refrigeration systems.
5. Cryogenic Fractionation: Separation of the light,heavy and saturate compounds resulting inessentially pure ethylene and propyleneproducts.
While this basic sequence has remainedrelatively unchanged since the 1940's, today'solefins plant is much more efficient than plantsconstructed only a few years ago. This overallefficiency improvement has been realized throughthe aggregate effects of small improvements inalmost all components of the process. Examplesof these improvements are:
o Improved product yields in the pyrolysisreaction
o Increased furnace thermal efficiency andcompressor polytropic efficiency
o Greater thermal cycle efficiency via higherpressure steam systems
o Reduced product losses and recycles in thepurification process
o Increased heat integration. The energyrequirement of current designs is less thanhalf the energy per pound of product that ofplants designed prior to 1970.
DISTRIBUTED DISTILLATION: THE ARS CONCEPT
In 1989, Stone & Webster announced a furtherimprovement to the olefins process utilizinga concept some have termed "distributivedistillation". This improvement, co-developedand patented with Mobil, has been offered to theindustry under the trade name of the AdvancedRecovery System (ARS). The basic concept of ARSis integration of the chilldown and cryogenicfractionation steps. The technology makes specificuse of self refluxing plate-fin exchangers, calleddephlegmators. The dephlegmator technologyemployed is that of Air Products Corporation whichhas been applied to numerous separation applica-tions. The uniqueness of ARS is that it providesthe process sequence that best incorporates theadvantages of dephlegmators to the ethyleneprocess.
ARS application results in a 5-10% reduction inthe overall energy requirement per unit weight ofproduct. This saving is achieved by markedlyreducing the ethylene and propylene refrigerationcompression requirements.
152
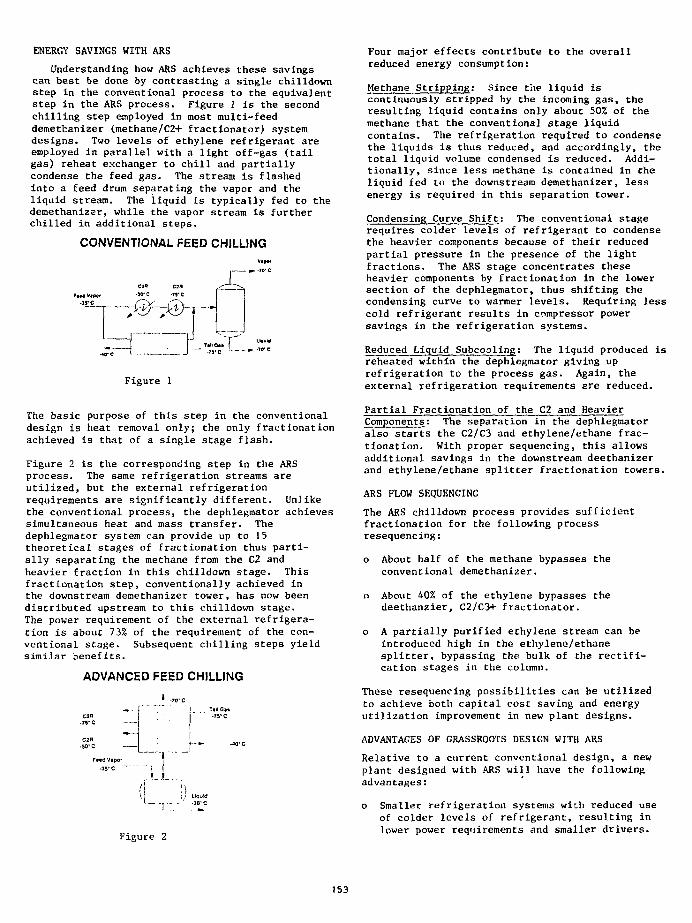
ENERGY SAVINGS WITH ARS
Understanding how ARS achieves these savingscan best be done by contrasting a single chilldownstep in the conventional process to the equivalentstep in the ARS process. Figure 1 is the secondchilling step employed in most multi-feeddemethanizer (methane/C2+ fractionator) systemdesigns. Two levels of ethylene refrigerant areemployed in parallel with a light off-gas (tailgas) reheat exchanger to chill and partiallycondense the feed gas. The stream is flashedinto a feed drum separating the vapor and theliquid stream. The liquid is typically fed to thedemethanizer, while the vapor stream is furtherchilled in additional steps.
CONVENTIONAL FEED CHILLING
C2" cm-WC 7VC
:Z_ljJ_-inr..rFigure 1
Four major effects contribute to the overallreduced energy consumption:
Methane Stripping: Since the liquid iscontinuously stripped by the incoming gas, theresulting liquid contains only about 50% of themethane that the conventional stage liquidcontains. The refrigeration required to condensethe liquids is thus reduced, and accordingly, thetotal liquid volume condensed is reduced. Addi-tionally, since less methane is contained in Cheliquid fed to the downstream demethanizer, lessenergy is required in this separation tower.
Condensing Curve Shift: The conventional stagerequires colder levels of refrigerant to condensethe heavier components because of their reducedpartial pressure in the presence of the lightfractions. The ARS stage concentrates theseheavier components by fractionation in the lowersection of the dephlegmator, thus shifting thecondensing curve to warmer levels. Requiring lesscold refrigerant results in compressor powersavings in the refrigeration systems.
Reduced Liquid Subcooling: The liquid produced isreheated within the dephlegmator giving uprefrigeration to the process gas. Again, theexternal refrigeration requirements are reduced.
The basic purpose of this step in the conventionaldesign is heat removal only; the only fractionationachieved is that of a single stage flash.
Figure 2 is the corresponding step in the ARSprocess. The same refrigeration streams areutilized, but the external refrigerationrequirements are significantly different. Unlikethe conventional process, the dephlegmator achievessimultaneous heat and mass transfer. Thedephlegmator system can provide up to 15theoretical stages of fractionation thus parti-ally separating the methane from the C2 andheavier fraction in this chilldown stage. Thisfractionation step, conventionally achieved inthe downstream demethanizer tower, has now beendistributed upstream to this chilldown stage.The power requirement of the external refrigera-tion is about 73% of the requirement of the con-ventional stage. Subsequent chilling steps yieldsimilar benefits.
ADVANCED FEED CHILLING
can.75-c
Tail Gas•73* c
Fata vapor
.35. C
<
Figure 2
Partial Fractionation of the C2 and HeavierComponents: The separation in the dephlegmatoralso starts the C2/C3 and ethylene/ethane frac-tionation. With proper sequencing, this allowsadditional savings in the downstream deethanizerand ethylene/ethane splitter fractionation towers.
ARS FLOW SEQUENCING
The ARS chilldown process provides sufficientfractionation for the following processresequencing:
o About half of the methane bypasses theconventional demethanizer.
o About 40% of the ethylene bypasses thedeethanzier, C2/C3+ fractionator.
o A partially purified ethylene stream can beintroduced high in the ethylene/ethanesplitter, bypassing the bulk of the rectifi-cation stages in the column.
These resequencing possibilities can be utilizedto achieve both capital cost saving and energyutilization improvement in new plant designs.
ADVANTAGES OF GRASSROOTS DESIGN WITH ARS
Relative to a current conventional design, a newplant designed with ARS will have the followingadvantages:
o Smaller refrigeration systems with reduced useof colder levels of refrigerant, resulting inlower power requirements and smaller drivers.
153

The power requirements for the ethylenerefrigeration system, which provides thecoldest level of refrigeration, is typicallyreduced by 50%; the propylene system poweris reduced by 20%.
Smaller conventional demethanizer.
Smaller deethanizer.
Reduced ethylene/ethane splitter refrigerationrequirements.
Currently, Stone & Webster is designing 3 grass-roots plants using ARS technology:
o Han Yang Chemical's 450,000 MTA naphtha/gas oil cracker, Yeorhun, Korea
o Titan Petrochemical1s 230,000 MTA naphtha/NGL cracker, Johor Bahru, Malaysia
o Thai Olefins 350,000 MTA naphtha/NGLcracker, Map Ta Phut, Thailand
The first of these plants will come on-streamin 1993.
ARS FOR EXISTING PLANTS
ARS can also be applied to existing plants, aspart of an overall revamp.
Traditionally, ethylene plants could be expandedup to the limits of their cryogenic fractionationand refrigeration systems. Since ARS results insubstantially lower refrigeration requirementsper unit of product, the existing refrigerationsystems sized for conventional production cansupport a much higher level of production withthe incorporation of ARS technology.
Since its introduction in 1989, over thirtycompanies world-wide have commissioned studies forcapacity increase revamps of their existingplants using ARS techniques. In nearly all cases,capacity increase of 40+ percent have been foundto be technically viable and, in most cases,economically attractive. Four projects have nowentered the full scale design and execution phasewith additional projects pending. These projects,which achieve capacity expansions between 45-80%are listed below:
o Amoco, Chocolate Bayou, Texaso Chevron, Port Arthur, Texas'O DSM, Galeen, Hollando Altona Petrochemical, Altona, Australia
The first of these projects will be fullystreamed in 1994.
OTHER ARS APPLICATIONS
ARS and dephlegmator technology can also beapplied to the recovery of feedstock or olefinscomponents of refinery off-gas streams. Theoff-gas streams from refinery operations such ascatalytic cracking or delayed coking usually areonly of value as fuel to the refiner. Thesestreams, rich in C2 and C3 hydrocarbons can providea cheap initial or intermediate feedstock to theolefins plant with proper pre-processing.
This pre-processing usually involves cryogenicfractionator to separate the valuable hydro-carbons from the hydrogen, nitrogen, carbonmonoxide and methane. Dephlegmators provide a wayto chilldown and fractionate efficiently so thatoptimum integration into the olefins process canbe achieved. There is usually strong economicIncentive for upgrading these refinery off-gasstreams for incorporation into an olefins plant.
154
ACID/BASE RECOVERY FROM SODIUM SULFATE
Marilyn J. Niksa
ELTECH Research Corporation625 East Street, Fairport Harbor, Ohio
I. ABSTRACT
Large amounts of sodium sulfate are producedas a by-product ol many diverse industries.Some of this material is recycled internally.Some is upgraded and sold as a product. Most isdisposed of as waste in landfills, or discharged todeep-wells, or bodies of water. Electrolyticregeneration of by-product sodium sulfate canprofitably exploit this valuable internal resource.ELTECH has a proven record in the developmentof long-life anodes for use in acid sulfatesolutions, and in providing high performanceelectrolytic generators.
II. INTRODUCTION
Closing The Loop On Sulfate Gains PublicSupport And Alleviates EnvironmentalConcerns
Public opinion can be adversely affected bydischarge of small quantities of chemicals tobodies of water that change their appearance(color, clarity). Emission of odor-causingchemicals can also be perceived as anenvironmental risk, regardless how invalid theconcern and industry is being called on toeliminate or reduce waste emissions.
Environmental concerns have forced federal,state, and local agencies to establish dischargelimits on BOD (Biological Oxygen Demand), COD(Chemical Oxygen Demand), TDS (TotalDissolved Solids), and chemical concentrations(such as Tri Halo Methane). The list of regulatedmaterials is growing and allowable dischargelevels are being driven down to BAT (bestavailable technology). Industry is scrambling toretrofit existing facilities with abatementmeasures. Process changes, plant upgrades, andnew plant construction, which require substantialcapital commitments and long pay-off times,
must plan to meet today's and tomorrow'senvironmental discharge requirements. "Diluteand dump" may be a viable alternative atpresent, but in light of potential "Cradle to Grave"legislation, even small quantities of unregulatedchemicals that are judged innocuous today maybe pronounced hazardous and regulatedtomorrow.
Closing The Loop On Sulfate Can ProvideEconomic Advantages
Much of the by-product sodium sulfate Isdisposed of as waste and costs vary widely,depending primarily on location. On-site costscan be insignificant but outside and fill expenseis rising exponentially as our landfills run out ofroom. Even "no-cost" disposal represents awaste of purchased resources. Current chemicalcosts (caustic soda and sulfuric acid) to makesodium sulfate are $40O-$S00/ton. This chemicalvalue is lost if the material is simply dumped.
Sale of some sodium sulfate may be possible, atpresent, however, the company may not evenrecover the added crystallization costs. It ishighly likely that future sales will decline due toreduced consumption in both the detergent andpulp markets.
Transportation costs of hazardous materials isalso rising exponentially with some chemicalsbanned completely from conveyance in urbanareas. If sodium sulfate is regenerated on-site,it need not be shipped out of the plant fordisposal. In addition, reduced amounts of causticsoda and acid will be shipped ]nto the plant foruse.
155
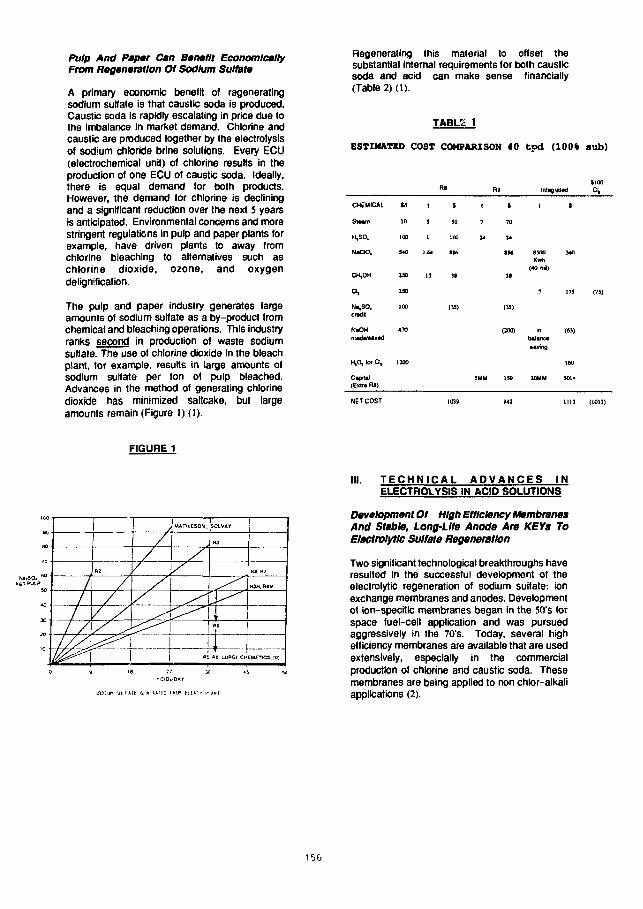
Pulp And Paper Can Banatlt EconomicallyFrom Regeneration Of Sodium Sulfate
A primary economic benefit of regeneratingsodium sulfate is that caustic soda is produced.Caustic soda is rapidly escalating in price due tothe imbalance in market demand. Chlorine andcaustic are produced together by the electrolysisof sodium chloride brine solutions. Every ECU(electrochemical unit) of chlorine results in theproduction of one ECU of caustic soda. Ideally,there is equal demand for both products.However, the demand for chlorine is decliningand a significant reduction over the next S yearsis anticipated. Environmental concerns and morestringent regulations in pulp and paper plants forexample, have driven plants to away fromchlorine bleaching to alternatives such aschlorine dioxide, ozone, and oxygendelkjnitication.
The pulp and paper industry generates largeamounts of sodium sulfate as a by-product fromchemical and bleaching operations. This industryranks second in production of waste sodiumsuliale. The use of chlorine dioxide in the bleachplant, for example, results in large amounts ofsodium sulfate per ton of pulp bleached.Advances in the method of generating chlorinedioxide has minimized saltcake. but largeamounts remain (Figure 1) (1).
Regenerating this material to offset thesubstantial Internal requirements for both causticsoda and acid can make sense financially(Table 2) (1).
TABLE 1
ESTIMATE COST COMPJkRISON 40 t p d (100% flub)
*100InlagrdKl
CHEMICAL
Staam
H.SO.
NaCKJ,
CH.OH
a,
end!
NaOHmada/aavad
H,O, lor Cl,
CapitallExlra R»>
NET COST
M
10
100
540
250
250
100
470
1200
1
5
1
144
.15
S
50
100
886
(W)
1019
t
7
M
SMH
t
70
24
186
IB
( » )
(200)
159
942
1
8300Kwh
(40 mi)
.7
inbalinoa•aving
20MM
t
MO
173
(63)
160
SOI-
1113
(75)
(1013)
90
BO
TO
*a
X,
JO
10
J - J
I
1p./// /
1 1y'lAATMICSON, SOLVAr
/
/
/
/
1
RB.BT
R3H. RAM
1J J
E. LJJRGI. CHEMrnCS, |0)
III. TECHNICAL ADVANCES INELECTROLYSIS IN ACID SOLUTIONS
Development Of High Efficiency MembranesAnd Stable, Lcng-Llfe Anode Are KEYs ToElectrolytic Sulfate Regeneration
Two significant technological breakthroughs haveresulted in the successful development of theelectrolytic regeneration ol sodium sulfate: ionexchange membranes and anodes. Developmentof ion-specific membranes began in the 50's forspace fuel-cell application and was pursuedaggressively in the 70"s. Today, several highefficiency membranes are available that are usedextensively, especially in the commercialproduction of chlorine and caustic soda. Thesemembranes are being applied to non chlor-alkaliapplications (2).
156
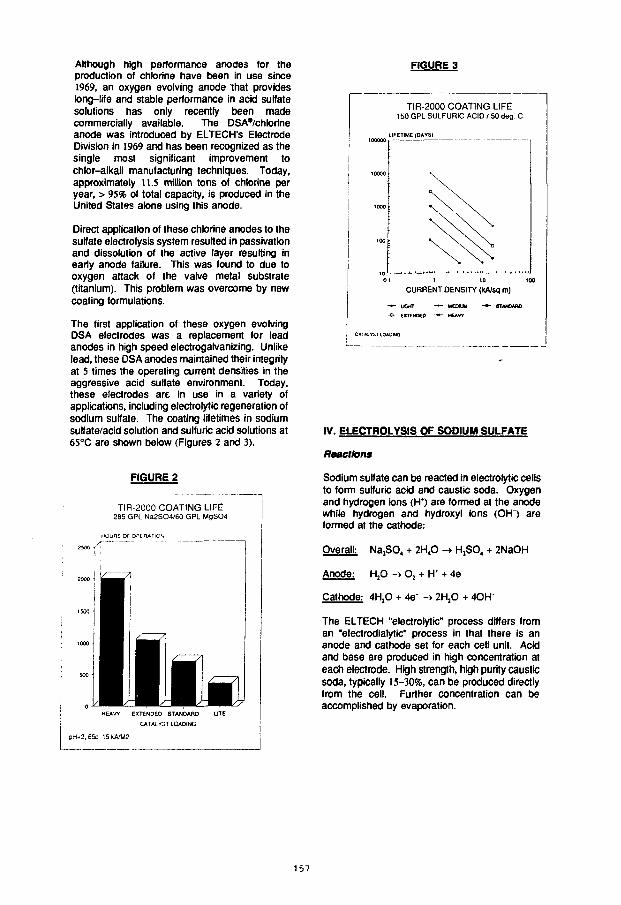
Although high performance anodes lor theproduction of chlorine have been in use since1969, an oxygen evolving anode that provideslong-life and stable performance in acid sulfatesolutions has only recently been madecommercially available. The DSA*/chk>rineanode was introduced by ELTECH's ElectrodeDivision in 1969 and has been recognized as thesingle most significant improvement tochlor-alkali manufacturing techniques. Today,approximately tl.S million tons of chlorine peryear, > 95% ot total capacity, is produced in theUnited States alone using this anode.
Direct application of these chlorine anodes to thesulfate electrolysis system resulted in passivationand dissolution of the active layer resulting inearly anode failure. This was found to due tooxygen attack of the valve metal substrate(titanium). This problem was overcome by newcoating formulations.
The first application of these oxygen evolvingDSA electrodes was a replacement for leadanodes in high speed electrogalvanizing. Unlikelead, these DSA anodes maintained their integrityat 5 limes the operating current densities in theaggressive acid sulfate environment. Today,these electrodes are in use in a variety ofapplications, including electrolytic regeneration ofsodium sulfate. The coating lifetimes in sodiumsulfate/acid solution and sulfuric acid solutions at65°C are shown below (Figures 2 and 3).
FIGURE 2
TIR-2000 COATING LIFE285 GPL Na2SCW60 GPL MgSCM
HOUflS OF OPE RATIOI
EXTENDED STANDARD
CATALYST LOADING
CH.2.65C 15kA<M2
TIR-2000 COATING LIFE150 GPL SULFURIC ACID / 50 deg. C
[ 100000
CURRENT DENSITY (kA/sq m)
- * - UGHI - + - UEOKJU - • - STAMMAD
-S- eXTENOEO -**- HEAVY
IV. ELECTROLYSIS OF SODIUM SULFATE
Reactions
Sodium sulfate can be reacted in electrolytic cellsto form sulfurtc acid and caustic soda. Oxygenand hydrogen ions (H*) are formed at the anodewhile hydrogen and hydroxyl ions (OH~) areformed at the cathode:
Overall: Na,SO, + 2H.0 -> H,SO, + 2NaOH
Anode: HtO -> O2 + H* + 4e~
Cathode: 4H2O + 4e~ -> 2H2O + 4OH"
The ELTECH "electrolytic" process differs froman "electrodialytic" process in that there is ananode and cathode set for each cell unit. Acidand base are produced in high concentration ateach electrode. High strength, high purity causticsoda, typically 15-30%, can be produced directlyfrom the cell. Further concentration can beaccomplished by evaporation.
157
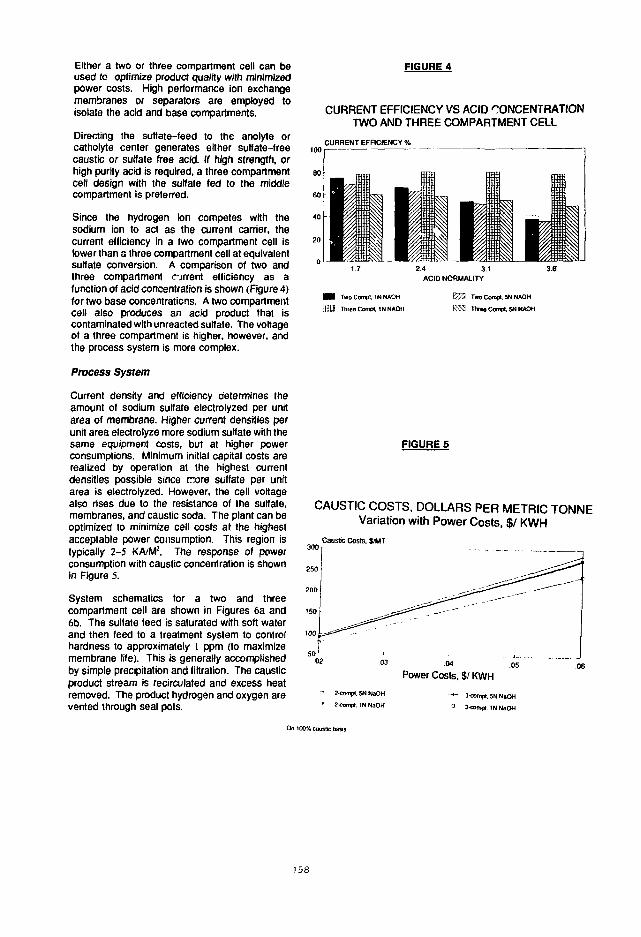
Either a two or three compartment cell can beused to optimize product quality with minimizedpower costs. High performance ion exchangemembranes or separators are employed toisolate the acid and base compartments.
Directing the sulfate-feed to the anolyte orcatholyte center generates either sulfate-freecaustic or sulfate free acid. If high strength, orhigh purity acid is required, a three compartmentcell design with the sulfate fed to the middlecompartment is preferred.
Since the hydrogen ion competes with thesodium ion to act as the current carrier, thecurrent efficiency in a two compartment cell islower than a three compartment cell at equivalentsulfate conversion. A comparison of two andthree compartment current efficiency as afunction of acid concentration is shown (Figure 4)for two base concentrations. A two compartmentcell also produces an acid product that iscontaminated with unreacted sulfate. The voltageof a three compartment is higher, however, andthe process system is more complex.
Process System
Current density and efficiency determines theamount of sodium sulfate electrolyzed per unitarea of membrane. Higher current densities perunit area electrolyze more sodium sulfate with thesame equipment costs, but at higher powerconsumptions. Minimum initial capital costs arerealized by operation at the highest currentdensities possible since more sulfate per unitarea is electrolyzed. However, the cell voltagealso rises due to the resistance of the sulfate,membranes, and caustic soda. The plant can beoptimized to minimize cell costs at the highestacceptable power consumption. This region istypically 2-5 KA/M!. The response of powerconsumption with caustic concentration is shownin Figure 5.
System schematics for a two and threecompartment cell are shown in Figures 6a and6b. The sulfate feed is saturated with soft waterand then feed to a treatment system to controlhardness to approximately 1 ppm (to maximizemembrane life). This is generally accomplishedby simple precipitation and filtration. The causticproduct stream is recirculated and excess heatremoved. The product hydrogen and oxygen arevented through seal pots.
CURRENT EFFICIENCY VS ACID CONCENTRATIONTWO AND THREE COMPARTMENT CELL
CURRENT EFFICIENCY %
ACID NORMALITY
• • TwoConvt. INHAOH
HUE Three Compl. IN NAOH
K 3 Two Compl, JN NAOH
K s i Tt»M Compt. 5H NAOH
CAUSTIC COSTS, DOLLARS PER METRIC TONNEVariation with Power Costs, $/ KWH
Caustic Costs. S/MT
Power Costs, $,' KWH
- 2-rampl. 5N NaOH
• 2-compt. IN NaOH3-compt. 5N NaOH
3-compt. IN NaOH
On 100% caustic basis
158
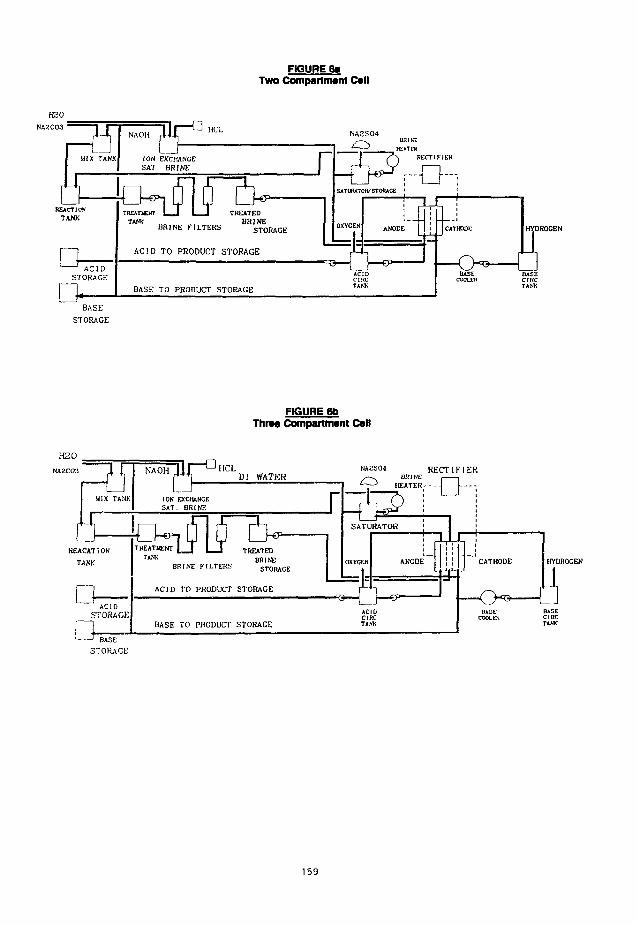
FIGURE 6«Two Compartment Cell
OH IKEHEATER
BASECfRCTANK
FIGURE 6bThree Compartment Cell
n—DTREATMENT | |REACATION TREATMENT | |
TANK BRCNE FILTERS
TREATEDBRINE
STORAGE
ACID TO PRODUCT STORAGE
BASE TO PRODUCT STORAGE
NA2S0J R E C T I F I E RBRINE
HEATER -
SATURATOR
BASECOOLET:
BASECIRCTANK
159
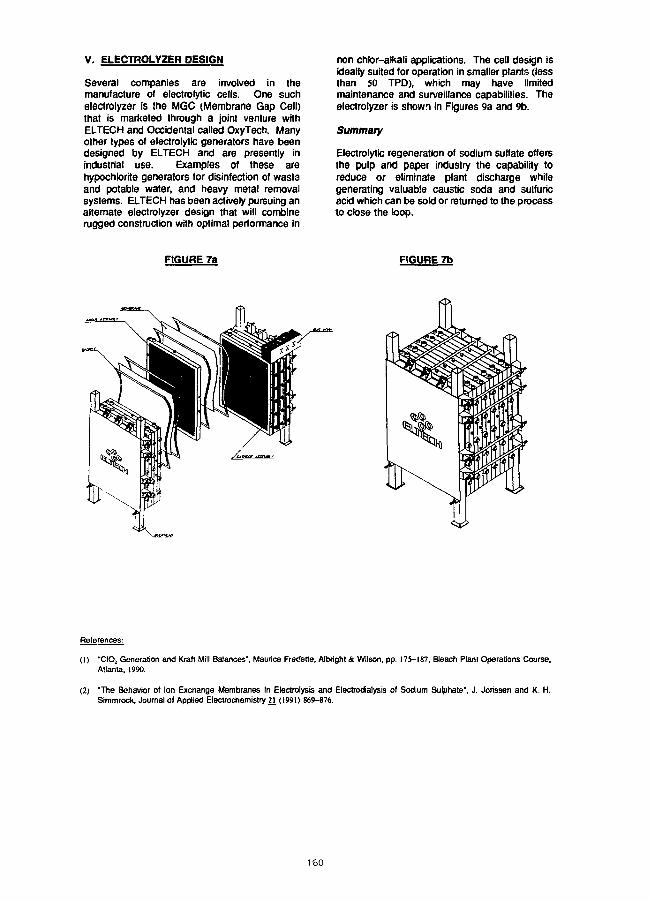
V. ELECTROLYZER DESIGN
Several companies are involved in themanufacture of electrolytic cells. One suchelectrolyzer is the MGC (Membrane Gap Cell)that is marketed through a joint venture withELTECH and Occidental called OxyTech. Manyother types of electrolytic generators have beendesigned by ELTECH and are presently inindustrial use. Examples of these arehypochlorite generators for disinfection ol wasteand potable water, and heavy metal removalsystems. ELTECH has been actively pursuing analternate electrolyzer design that will combinerugged construction with optimal performance in
non chlor-atkali applications. The cell design isideally suited for operation in smaller plants (lessthan 50 TPD), which may have limitedmaintenance and surveillance capabilities. Theelectrolyzer is shown in Figures 9a and 9b.
Summary
Electrolytic regeneration of sodium sulfate offersthe pulp and paper industry the capability toreduce or eliminate plant discharge whilegenerating valuable caustic soda and sulfuricacid which can be sold or returned to the processto close the loop.
FIGURE 7a FIGURE 7b
References:
(1) "CIO2 Generation and Kraft Mill Balances", Maurice Fredette, Albright & Wilson, pp. 175-187, Bleach Plant Operations Course,Atlanta, 1990.
(2) 'The Behavior of Ion Exchange Membranes In Electrolysis and Electrodialysis of Sodium Sulphate", J. Jorissen and K H.Simmrock, Journal of Applied Electrochemistry 21 (1991) 869-876.
160
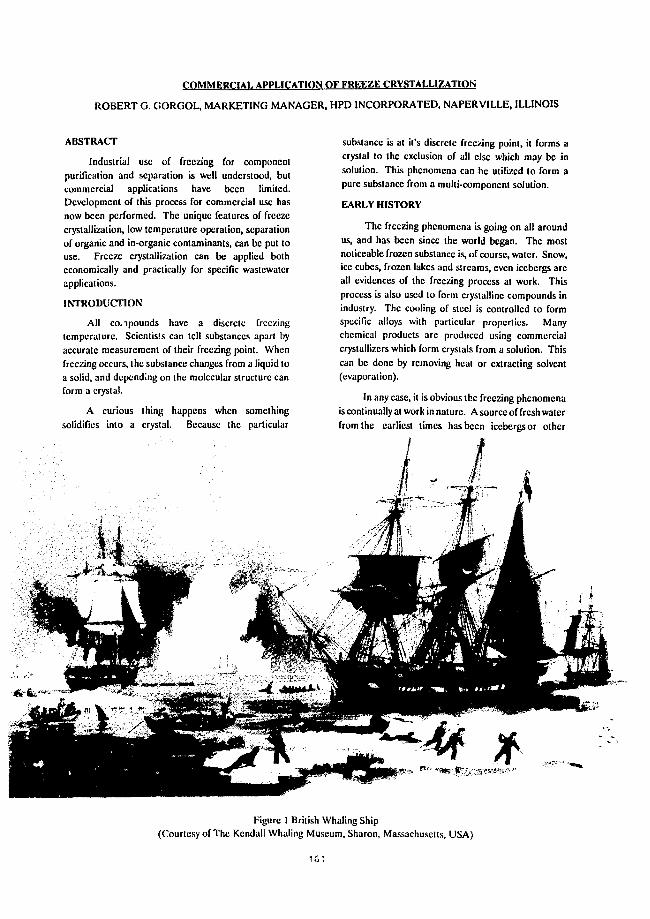
COMMERCIAL APPLICATION OF FREEZE CRYSTALLIZATION
ROBERT G GORGOL, MARKETING MANAGER, HPD INCORPORATED, NAPERVILLE, ILLINOIS
ABSTRACT
Industrial use of freezing for componentpurification and separation is well understood, butcommercial applications have been limited.Development of this process for commercial use hasnow been performed. The unique features of freezecrystallization, low temperature operation, separationof organic and in-organic contaminants, can be put touse. Freeze crystallization can be applied botheconomically and practically for specific wastcwatcrapplications.
INTRODUCTION
All conpounds have a discrete freezingtemperature. Scientists can tell substances apart byaccurate measurement of their freezing point. Whenfreezing occurs, the substance changes from a liquid toa solid, and depending on the molecular structure canform a crystal.
A curious thing happens when somethingsolidifies into a crystal. Because the particular
substance is at it's discrete freezing point, it forms acrystal to the exclusion of all else which may be insolution. This phenomena can be utilized to form apure substance from a multi-component solution.
EARLY HISTORY
The freezing phenomena is going on all aroundus, and has been since the world began. The mostnoticeable frozen substance is, of course, water. Snow,ice cubes, frozen lakes and streams, even icebergs arcall evidences of the freezing process at work. Thisprocess is also used to form crystalline compounds inindustry. The cooling of steel is controlled to formspecific alloys with particular properties. Manychemical products arc produced using commercialcrystallizers which form crystals from a solution. Thiscan be done by removing heal or extracting solvent(evaporation).
In any case, it is obvious the freezing phenomenais continually at work in nature. A source of fresh waterfrom the earliest limes has been icebergs or other
Figure 1 British Whaling Ship(Courtesy of The Kendall Whaling Museum, Sharon, Massachusetts, USA)

frozen water sources. Early men perhaps did notunderstand the mechanism of purification, but they didunderstand the water they obtained from ice waspotable.
RECENT APPLICATIONS
Scientists have understood the basic mechanismof the freezing phase change for many years. In aneffort to harness the power of this phenomena,applications were researched. Most early work wasperformed on brine solutions, mainly seawatcr. Theseefforts proved successful, but expensive. Today,seawater desalination is mainly accomplished with lesscapital intensive reverse osmosis technology, orevaporation.
Within the last twenty years or so, newapplications have been found which better suit thecapabilities of freeze crystallization. These arc:
* Fruit Juice Concentration* Isomer Separation* Specialty Water Purification
These applications have specific needs which canbest be met using freeze crystallization techniques.
FREEZE CAPABILITIES
A few key points about freezing of a substance.
1. Eachsubstance has itsown specific freezing point.
2. Freezing, under the right conditions, produces apure solid phase material.
3. Degradation of heat sensitive organics, can beminimized due to low temperature operation.
4. Low temperatures reduce corrosion.
5. Volatility of organics is reduced with lowtemperature operation.
6. Electrical power can be used where steam is notreadily available.
WASTEWATER APPLICATION
Gone are the days when water was taken forgranted. Increasingly the farm, mining, pulp and paper,steel, and just about any other industry you can name,have begun to realize water is a very valuable resource.
Even municipalities must husband their water. The dayis coming very soon when all industry will produce cleanwater as a cash product and water use will be carefullymanaged.
Everywhere you look there are reports ofmunicipalities, government bodies, andenvironmentalists crying for regulation on waterquality. The time is not far off when the NIMBY (NotIn My Back Yard) cry will eliminate potential expansionof industry until specific, proven, wastewater treatmenttechnology is included.
Such was the case for an innovative pulp andpaper company in Canada. This particular companywanted to build a high yield pulp mill in a near desertlike location of British Columbia. Because thegroundwater availability was limited, the constructionof the mill was in jeopardy. Enter the concept of aclosed water cycle mill.
At this particular location [he main product ispulp, but a very important secondary product is water.All the effluent generated by the mill was to beprocessed. Clean product water would be returned tothe mill to allow continued operation. Sound like FlashGordon?
CHETWYND PROJECT
This innovative pulp and paper producer came toHPD in 1989 with the idea of building a closed cyclepulp mill in Chetwynd, British Columbia. In order tomake the mill viable, all effluent from the plant had tobe collected and processed. No water could leave thesite, except through normal evaporation to theatmosphere.
The effluent collected would contain a widevariety of inorganics. From silicates and sulfates toperoxide and other pulping chemicals. The effluentwould also contain a wide variety of organics, from Clto C8, with high concentrations of organic acids whicharc naturally present in their wood source. Table 1 liststypical feed and product water characleristics.
162
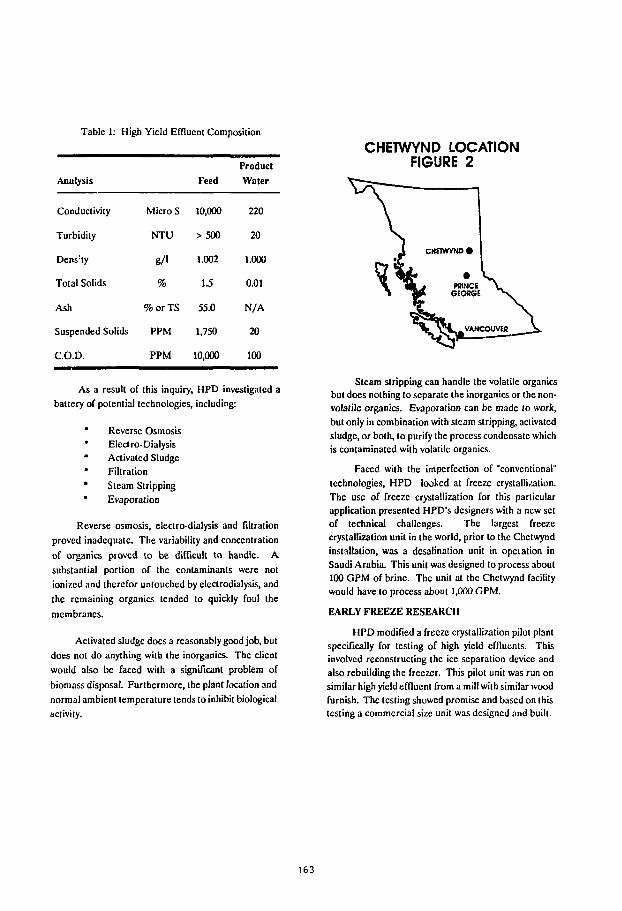
Table 1: High Yield Effluent Composition
Analysis
Conductivity
Turbidity
Dens'ty
Total Solids
Ash
Suspended Solids
C.O.D.
Micro S
NTU
8/1
%
%orTS
PPM
PPM
Feed
10,000
> 500
1.002
1.5
55.0
1,750
10,000
ProductWater
220
20
1.000
0.01
N/A
20
100
CHETWYND LOCATIONFIGURE 2
As a result of this inquiry, HPD investigated abattery of potential technologies, including:
* Reverse Osmosis* Eleciro-Dialysis* Activated Sludge* Filtration* Steam Stripping* Evaporation
Reverse osmosis, electro-dialysis and filtrationproved inadequate. The variability and concentrationof organics proved to be difficult to handle. Asubstantial portion of the contaminants were notionized and therefor untouched by electrodialysis, andthe remaining organics tended to quickly foul themembranes.
Activated sludge does a reasonably good job, butdoes not do anything with the inorganics. The clientwould also be faced with a significant problem ofbiomass disposal. Furthermore, the plant location andnormal ambient temperature tends to inhibit biologicalactivity.
Steam stripping can handle the volatile organicsbut does nothing to separate the inorganics or the non-volatile organics. Evaporation can be made to work,but only in combination with steam stripping, activatedsludge, or both, to purify the process condensate whichis contaminated with volatile organics.
Faced with the imperfection of "conventional"technologies, HPD looked at freeze crystallization.The use of freeze crystallization for this particularapplication presented HPD's designers with a new setof technical challenges. The largest freezecrystallization unit in the world, prior to the Chetwyndinstallation, was a desalination unit in opeiation inSaudi Arabia. This unit was designed to process about100 GPM of brine. The unit at the Chctwynd facilitywould have to process about 1,000 GPM.
EARLY FREEZE RESEARCH
HPD modified a freeze crystallization pilot plantspecifically for testing of high yield effluents. Thisinvolved reconstructing the ice separation device andalso rebuilding the freezer. This pilot unit was run onsimilar high yield effluent from a mill with similar woodfurnish. The testing showed promise and based on (histesting a commercial size unit was designed and built.
163
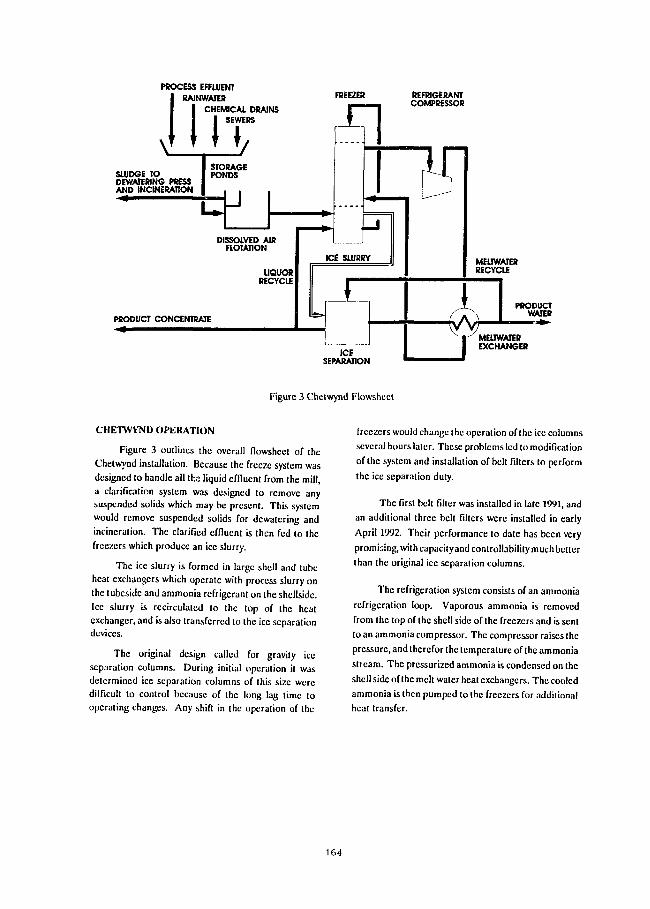
PROCESS EFFLUENTRAINWATER
CHEMICAL DRAINSSEWERSIT
FREEZER
.£1v
SLUDGE TODEWAIERING PRESSAND INCINERATION
STORAGEPONDS
LJ
DISSOLVED AIRFLOTATION
LIQUORRECYCLE
PRODUCT CONCENTRATE« -
REFRIGERANTCOMPRESSOR
ICE SLURRY
ICESEPARATION
rTMELTWATERRECYCLE
Figure 3 Chetwynd Flowsheet
CHETWYND OPERATION
Figure 3 outlines the overall flowsheet of theChetwynd installation. Because the freeze system wasdesigned to handle all ths liquid effluent from (he mill,a clarification system was designed to remove anysuspended solids which may be present. This systemwould remove suspended solids for dewatcring andincineration. The clarified effluent is then fed to thefreezers which produce an ice slurry.
The ice slurry is formed in large shell and tubeheat exchangers which operate with process slurry onthe tubesidc and ammonia refrigerant on the shellside.Ice slurry is recirculated to the top of the heatexchanger, and is also transferred to the ice separationdevices.
The original design called for gravity iceseparation columns. During initial operation it wasdetermined ice separation columns of this size weredifficult to control because of the long lag time tooperating changes. Any shift in the operation of the
freezers would change the operation of the ice columnsseveral hours later. These problems led to modificationof the system and installation of belt filters to performthe ice separation duty.
The first belt filter was installed in late 1991, andan additional three belt filters were installed in earlyApril 1992. Their performance to date has been verypromising, with capacityand controllability much betterthan the original ice separation columns.
The refrigeration system consists of an ammoniarefrigeration loop. Vaporous ammonia is removedfrom the top of the shell side of the freezers and is sentto an ammonia compressor. The compressor raises thepressure, and therefor the temperature of the ammoniastream. The pressurized ammonia is condensed on theshell side of the melt water heat exchangers. The cooledammonia is then pumped to the freezers for additionalheat transfer.
164
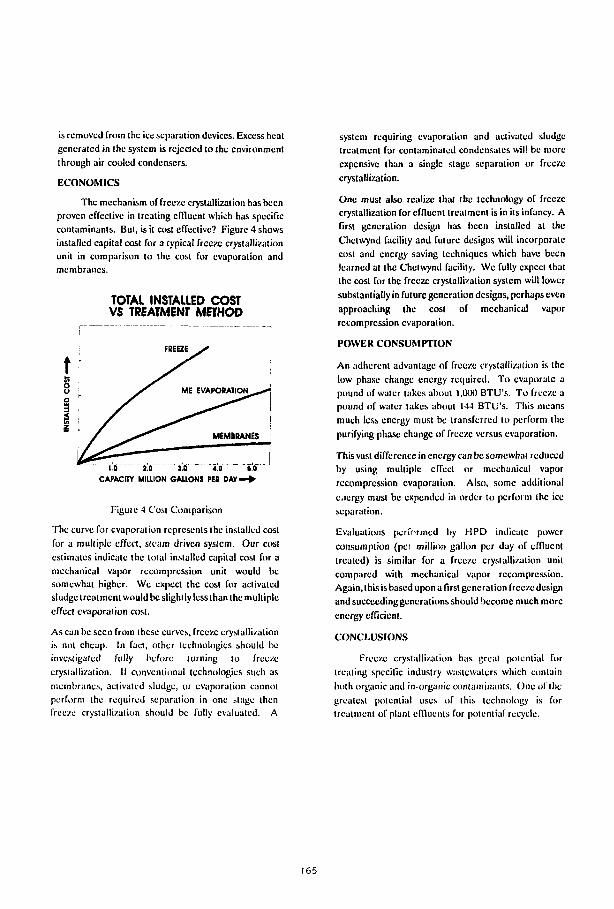
is removed from the ice separation devices. Excess heatgenerated in the system is rejected to ibe environmentthrough air cooled condensers.
ECONOMICS
The mechanism of freeze crystallization has beenproven effective in treating effluent which has specificcontaminants. But, is it cost effective? Figure 4 showsinstalled capital cost for a typical freeze crystallizationunit in comparison to the cost for evaporation andmembranes.
TOTAL INSTALLED COSTVS TREATMENT METHOD
1.0 2.0 JS 4.0 SOCAPACITY MILLION GALLONS MB DAY—^
Figure 4 Cost Comparison
The curve for evaporation represents the installed costfor a multiple effect, steam driven system. Our costestimates indicate the total installed capital cost for amechanical vapor recomprcssion unit would besomewhat higher. We expect the cost for activatedsludge treatment would be slightly less than the multipleeffect evaporation cost.
As can be seen from these curves, freeze crystallizationis not cheap. In fact, other technologies should beinvestigated fully before turning to freezecrystallization. If conventional technologies such asmembranes, activated sludge, or evaporation cannotperform the required separation in one Mage thenfreeze crystallization should be fully evaluated. A
system requiring evaporation and activated sludgetreatment for contaminated condensates will be moreexpensive than a single stage separation or freezecrystallization.
One must also realize thai the technology of freezecrystallization for effluent treatment is in its infancy. Afirst generation design has been installed at theChetwynd facility and future designs will incorporatecost and energy saving techniques which have beenlearned at the Chctvvynd facility. We fully expect thatthe cost for the freeze crystallization system will lowersubstantially in future generation designs, perhaps evenapproaching the cost of mechanical vaporrccomprcssion evaporation.
POWER CONSUMPTION
An adherent advantage of freeze crystallization is thelow phase change energy required. To evaporate apound of water lakes about l.lXX) BTU's. To freeze apound of water lakes about 144 BTU's. This meansmuch less energy must be transferred to perform thepurifying phase change of freeze versus evaporation.
This vast difference in energy can be somewhat reducedby using multiple effect or mechanical vaporrccompression evaporation. Also, some additionale.icrgy must be expended in order to perform the iceseparation.
Evaluations perff-rmcd by HPD indicate powerconsumption (pet million gallon per day of effluenttreated) is similar for a freeze crystallization unitcompared with mechanical vapor recomprcssion.Again, this is based upon a first generation freeze designand succeeding gene rations should become much moreenergy efficient.
CONCLUSIONS
Freeze crystallization has great potential fortreating specific industry wastewalers which containboth organic and in-organic contaminants. One of thegreatest potential uses of this technology is fortreatment of plant effluents for potential recycle.
165

Because the technology is still in it's infancy, rapiddevelopment and refinement can be expected. Whileenergy efficiency is roughly similartothat of mechanicalvapor recompression evaporation, overall installedcapital costs can be substantially reduced for effluentstreams which contain high organic loading.
Freeze crystallization is not universally applicablebut for specific applications it can be used quiteeffectively for economical and practical waterseparation problems.
166
ADVANCED OXIDATION TECHNOLOGY TOR PULP MILL EFFLUENT
J. ROBERT HART, MANAGER, EPRI PULP fi PAPER OFFICE, ATLANTA, 6A
ABSTRACT
The composition of effluent fromvarious pulping processes can exhibit awide range of physical and chemicalparameters. The dissolved solids consistof the chemicals derived from the woodmaterial plus the chemicals added to thespecific pulping process. No onetechnology can adequately treat theseeffluent streams, rather a combination oftreatment methods is often required.Advanced oxidation is one technologywhich has application to bleached Kraftpulp effluent, principally for colorreduction.
INTRODUCTION
The composition of wood (bone dry)is approximately 50% cellulose, 30%hemicelluloses and sugars, and 20%lignin. It is the objective of thepulping process to obtain an aqueousslurry of the cellulosic material invarying degrees of purity or yield.These yield values can be as high as 96%by weight for some mechanical pulps, toless than 50% for a high grade chemicalpulp. The difference (1-yield) is thewater soluble extractives found in theprocess wash waters. These wash waterstreams are further processed to recoverthe wood extractives and processchemicals when it is economicallyfeasible. When the chemical recovery inthese process streams becomesuneconomical, they will eventually besent to an effluent treatment facilityprior to discharge.
The process streams which willeventually be discharged, contain eithersuspended or dissolved solids. We areherein considering only the treatment ofthe dissolved solids portion, assumingthe removal of the suspended material bysome other means.
Dependent upon the nature of thepulping process and the particularprocess stream being considered, theeffluent stream will exhibit a wide rangeof conditions. Concentrations of
dissolved solids may vary from 0.5% orless to 3.5% or higher. The pH valuecould lie between 1.5 and 13. The colormay appear to be light amber to a verydark gray. The chemical compositioncould derive solely from the woodextractives or there can be substantialamounts of process chemical, such asinorganic salts, sulfonated andchlorinated organics, many of which areconsidered toxic.
Of particular interest in the Study(1) to be presented here, is that some ofthe effluent streams subjected totreatment, originated from a bleachingprocess which used chlorine and chlorinedioxide as bleaching agents. When thesechemicals are used in the bleachingprocess, the effluent streams wouldunwisely be considered for treatment bytechniques such as multiple-effectevaporation or incineration in powerboilers, due to the excessive amounts ofchloride compounds present in theconcentrate.
TREATMENT Or DISSOLVED SOLIDS
Let us look briefly at the varioustreatment technologies for removing orreducing the amount of dissolved solidsin a process stream. They might beclassified into the two broad categoriesof concentration techniques anddegradation or chemical modificationmethods.
Concantntion TachConcentration of dilute effluent
streams is desirable to achieve a largerecyclable stream along with a muchsmaller concentrated or "contaminated"stream. Little or no chemical changetakes place with the dissolved solids.The latter stream is then further treatedprior to discharge or disposal. Some ofthe these technologies are listed withoutfurther comment; flocculation,evaporation, ultrafiltration, membraneseparation, reverse osmosis, freezeconcentration, and adsorption.
167
Ch»«ie»l ModificationA variety of techniques exist
whereby dissolved solids found in pulpmill effluent can be subjected to slightor drastic chemical modification in orderto produce a more acceptable form ofdischarge material. The techniques forchemical degradation involveincineration, biological activity,photolysis (ultraviolet radiation), andthe addition of chemical oxidants such asozone and hydrogen peroxide. Oxidationof effluent streams can be assisted bythe simple means of aeration, or exposureto a dilute oxygen stream.
ADVANCED OXIDATION
Ozone reacts with organic materialin water in several manners, depending ofthe pH and the presence of othercompounds. Not all mechanisms are wellunderstood, however two types ofreactions can be expected in industrialwaste streams.
When the effluent stream is below apH of 8, the direct reaction of ozonewith the unsaturated bond in organiccompounds is favored. At a pH greaterthan 9, a free radical mechanism becomespredominate and the ozone does not reactdirectly with the organic compounds.Instead, ozone reacts with water to formhyroxyl and hydroperoxide radicals (-0Hand -00H).
The free radical mechanism isfavored because the oxidation reactionsare less discriminating than when ozonereacts directly with the organiccompounds. Therefore, several methodshave been developed to promote theformation of hydroxyl radicals when usingozone to treat effluent streams. Thesemethods are called advanced oxidationprocesses (AOP) and include the use ofhydrogen peroxide or UV radiation withozone. The simplest AOP, however, isusing ozone at a high pH.
Hydrogen peroxide (H2O2) is addedwith ozone to the effluent stream toincrease the formation of hydroxylradicals. The decomposition of ozone isenhanced with the result that the ozoneoxidation reaction is accelerated. Inaddition, certain reaction rates withvarious organic compounds indicate adependence on the hydrogen peroxideconcentration.
When UV radiation is used incombination with ozone, hydrogen peroxideis formed. Ozone/UV differs fromozone/hydrogen peroxide only in themanner by which hydrogen oxide is
introduced into the stream. However,certain organic compounds will degrade bydirect photolysis, making the ozone/UVsystem both an oxidation and photolysisprocess.
AOP FEASIBILITY STUDY
The application of AOP for thetreatment of pulp mill effluent wasdemonstrated in an EPRI Co-funded Project(1). This Project had the industrialsupport of about twenty companies andutilities. AOP systems were chosebecause of the nature of the effluentstreams to be treated. The particularmill site studied herein, generated threetroublesome streams that requiredtreatment before discharge. Two of thesestreams came from a bleaching process forKraft pulp using chlorine and chlorinedioxide chemicals, making themunacceptable for evaporation and eventualincineration. These two separate streamswere at pH values of 1.5 and 11.0. Athird effluent stream came from athermomechanical pulp process wheretreatment was required to reduce thetoxicity of the wood soluble extractives.The volume of these three streams are 7,2.5 and 3 mgd respectively.
The goal of this study was to reducecolor, while monitoring other dischargestandards such as toxicity, BOD(biochemical oxygen demand), AOX(adsorbable organic halides), TOC (totalorganic carbon), and VOC (volatileorganic compounds).
A continuous pilot plant facilitywas installed on-site, convenient to theeffluent streams to be investigated. Itconsisted of three ozone contact columns(8 inch diameter and 10 feet tall) withcountercurrent flow downwards to theozonated gas diffuser at the bottom ofeach contactor. These columns wereconnected in series and had the necessaryaccessories to monitor gas and liquidflows, injection and sampling points, andoff-gas detection.. The ozone wasgenerated with a Griffin Technics HC-1.0ozone generator. This unit is air-cooledand contains two dielectrics in series.Compressed air or liquid oxygen was usedas the feed gas, dependent upon thelocation of the pilot unit. Effluentflow rates were dictated by the ozonegenerating capacity and the applieddosage, thus flows ranged from 0.2-2.0gpm. The maximum dosage of ozone used inthe study was 4.2 lb/1000 gal.
168

The pilot unit was operated for one8-hour shift per day, 5 days per week,and a period of 16 weeks. One specificstream was tested for a minimum of a 5-day period before switching over toanother stream.
RESULTS
The complete analysis of the testdata is not yet unavailable, however somegeneral statements can be made withregard to the effect of the AOP systems.Also, none of the test data of this studyrevealed any significant or unexplaineddichotomies from previous data publishedin the literature.
Ozone and hydrogen peroxide wereeffective in removing up to 85% of thecolor in the caustic stream, and up to90% of the color in the acidic stream.In the caustic stream, color removal wasa function of both ozone and hydrogendosages, while the acid stream was onlyslightly affected by the hydrogenperoxide dose.
Average reduction of AOX values inthe caustic stream was 36% and wasdependent upc n the pH value. In theacidic stream, less affect upon AOX wasobserved. In some trials, the AOX valueincreased, particularly when the enteringpH was greater than the exit stream.
Toxicity reduction in the causticstream ranged from 64% to 95% and closelyfollowed the reduction of color. In theacidic stream, minimal effects werefound. In the TMP effluent stream, thedecrease in toxicity ranged from 45-95%
Ozone should have no effect on TOC,since ozone does not create organiccarbon. The test data indicated somevariability between the TOC values of theentering and exiting streams, but thiswas attributed to sampling and testingerror.
As expected, there were modestchanges in the B©D values in all theeffluent streams. The database of thisparticular study was not large enough todetermine those variables which could beused to predict the change.
The effect of ozone/UV applicationon the caustic stream had only minorreductions in color, but there were moresignificant decreases of color in theacidic streams. The TMP stream hadminimal color initially, and no testswere run on this stream.
ECONOMICS
Part of the objective of this EPRICo-funded Project was to project theeconomic feasibility for the use of AOPsystems in the treatment of pulp milleffluent. Calculations to arrive at thefigures for the capital and operatingcosts are very dependent upon the desiredreduction of color or other effluentproperty, and the desirability oftreating a particular stream versusanother to obtain regulatory compliance.In addition, it must be carefullyunderstood that the test data came from aspecific mill, employing a specificprocess, and using a specific woodsupply.
The present total worth of atreatment facility, for 1 mgd of acidicbleach effluent would range from S10 to$16 million., dependent upon the colorreduction required. To treat causticeffluent of the same quantity, the costof a facility would range for $13 to $30million.
The amount of electrical energyrequired to generate 1 pound of ozone isabout 5 kWh. Thus the treatment of 1million gallons of effluent, with adosage of 2.1 lb/1000 gal, will consume10.5 MWh per daily operation.
SUMMARY
An AOP system can successfully beapplied to the treatment of effluentstreams generated in a bleached Kraftpulp process and in a TMP process. Colorreductions of 85% can be achieved onspecific streams, along with reduction intoxicity values in selected streams.Changes in BOD, TOC, and AOX valuesresulting from treatment with ozoneeither varied according to physicalparameters of the incoming stream or intheory, had no effect. The present worthfor a facility to treat 1 mgd of causticextract for color reduction of 85% wouldbe approximately $19 million.
REFERENCES
1. Unpublished EPRI Technical Report,"Color Removal in Integrated Pulp andPaper Mill Effluents", 1992
169
INDUSTRIAL GASES AS A VEHICLE FOR COMPETITIVEHESS
James R. Dale, Director, Technology Programs, Airco Industrial Gases Division,The BOC Group, Inc., Murray Hill, New Jersey
ABSTRACT
Industrial gases are produced usingcompressed air and power. Improvementsin air separation technology haveresulted in a marked decrease in the costof nitrogen and oxygen production. The,use of those gases in industrialapplications has resulted in energysavings. Several cases are reviewed toshow the diversity and options availableto enable cost savings andenvironmentally driven processimprovements.
Industrial gases have come of ageduring the last fifteen years. Engineersand scientists have looked beyond theparadigms of their operations and haveembraced the use of industrial gases inways that they would not have dreamed ofbefore the mid 1970's. Cheap energy as anational resource had ceased to exist.We, in the engineering community, had tolook for new ways to prevent theunprecedented spiral of cost increases inorder to maintain or improve ourcompetitive position in domestic andworld markets.
Nitrogen, oxygen and argon areconsidered the bulk gases in ourbusiness. I will be focusing my commentson nitrogen and oxygen for theyconstitute the largest number ofapplications and volume of gas consumedby industry today. The specific energyto produce those gases has changeddramatically even though the fundamentalproduction techniques have not changed.
The first gas of value produced wasoxygen. For years, the means ofproduction was the cryogenic cycle andsupply was served either by a pipeline orcylinder delivery. In the 1950's,technical change brought the concept ofliquid delivery of gaseous products forconvenience, demand flexibility and costto the marketplace. Until the early1970's nitrogen was considered aby-product because the real force inexpansion of the industrial gas businessto this time was the use of oxygen insteelmaking. Specific power required toproduce a cubic foot of gas was about 3.0kilowatt-hours per hundred cubic feet ofgas produced (kwh/ccf).
During the late 1970's developmentwork was also going on to produce gas bynon-cryogenic means. Carbon molecular
sieve and zeolite-based separationtechnology was developing to offer analternative to cryogenic separation forthose instances when neither high purityor cryogenic properties were required bythe application. It resulted in gas oflower than 99.9995%, "five-nines", puritythat was the standard for liquid supply.Typical purity levels achieved was 97 to99.5% for nitrogen and 90 to 95% foroxygen. Nitrogen was produced at a powerfactor of about 2.0 kwh/ccf and oxygen ata power factor of 2.2 kwh/ccf, both at apressure of 110 and 120 psig respectively(nominal oxygen purity was 90%). Liquidproduct specific power had improved tosimilar cost levels. This made use ofthese products practical only when liquidwas very expensive, purity was not anissue, and there was a major geographicor distribution consideration.
The "energy crisis" of the early1970's resulted in major investments inresearch and development in plantperformance by the industrial gasindustry. Simultaneously, the need forfuel savings and process cost reductionsled to investment in gas processdevelopment. The use of nitrogen inindustrial processes went from by-productto primary gas produced in less than tenyears. The nature of the cryogenicliquefaction process is such that a ratioof three volumes of nitrogen to one ofoxygen is optimal for merchant planloading and costs. The specific powerrequirement for the liquefaction ofnitrogen gas has gone from 2.0 kwh/ccf to1.4 kwh/ccf. This represents a thirtypercent reduction in power required toproduce liquid nitrogen or oxygen.
Similarly, strides have alsooccurred in non-cryogenic productiontechniques. Both molecular sieves andzeolite performance have improvedbringing the specific power for anitrogen system at a nominal purity of99% down to a range of approximately .8kwh/ccf and oxygen at a nominal purity of93% to a range of 1.1 kwh/ccf atatmospheric pressure or approximately 1.3kwh/ccf at 130 psig. New gas productshave been introduced with the advent ofmembrane technology being used to producenitrogen. This technology holds greatpromise. The prime attraction issimplicity of the engineered systems ofproduction, the "high tech" image of theproduct and its essential lack of moving
170
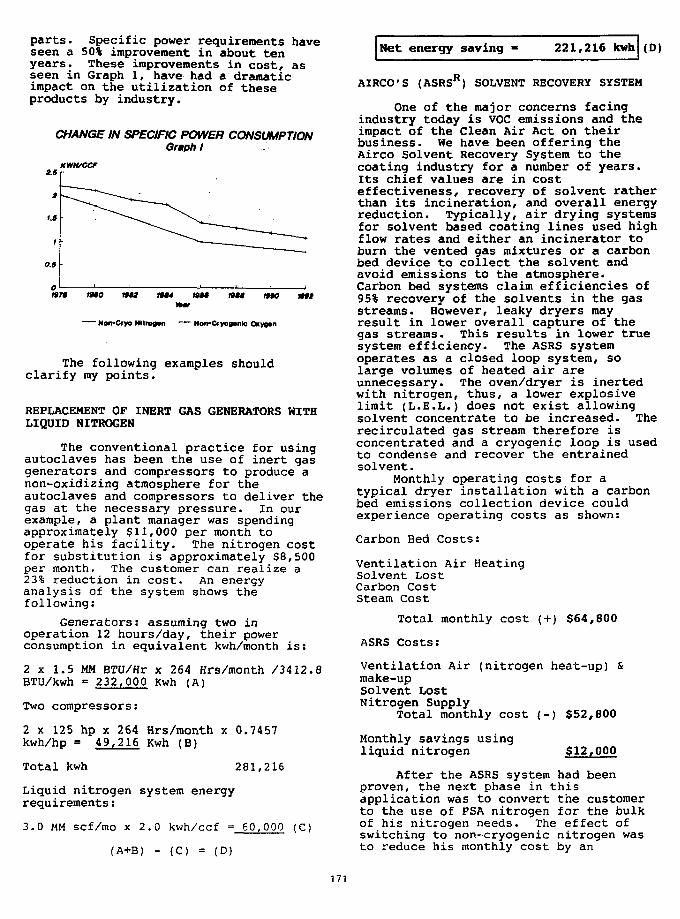
parts. Specific power requirements haveseen a 50% improvement in about tenyears- These improvements in cost, asseen in Graph 1, have had a dramaticimpact on the utilization of theseproducts by industry.
CHANGE IN SPECIFIC POWER CONSUMPTIONGraph I
KWWCCT
Net energy saving 221,216 kwh (D)
1971 1M0 19»i tt*4 « H 1M*
Non-Cryo Nllreflan - Non-&yog*nlc CMygan
The following examples shouldclarify my points.
REPLACEMENT OF INERT GAS GENERATORS WITHLIQUID NITROGEN
The conventional practice for usingautoclaves has been the use of inert gasgenerators and compressors to produce anon-oxidizing atmosphere for theautoclaves and compressors to deliver thegas at the necessary pressure. In ourexample, a plant manager was spendingapproximately $11,000 per month tooperate his facility. The nitrogen costfor substitution is approximately $8,500per month. The customer can realize a23% reduction in cost. An energyanalysis of the system shows thefollowing:
Generators: assuming two inoperation 12 hours/day, their powerconsumption in equivalent kwh/month is:
2 x 1.5 MM BTU/Hr x 264 Hrs/month /3412.8BTU/kwh = 232,000 Kwh (A)
Two compressors:
2 x 125 hp x 264 Hrs/month x 0.7457kwh/hp = 49,216 Kwh (B)
Total kwh 281,216
Liquid nitrogen system energyrequirements:
3.0 MM scf/mo x 2.0 kwh/ccf = 60,000 (C)
(A+B) - (C) = (D)
AIRCO'S (ASRSK) SOLVENT RECOVERY SYSTEM
One of the major concerns facingindustry today is VOC emissions and theimpact of the Clean Air Act on theirbusiness. We have been offering theAirco Solvent Recovery System to thecoating industry for a number of years.Its chief values are in costeffectiveness, recovery of solvent ratherthan its incineration, and overall energyreduction. Typically, air drying systemsfor solvent based coating lines used highflow rates and either an incinerator toburn the vented gas mixtures or a carbonbed device to collect the solvent andavoid emissions to the atmosphere.Carbon bed systems claim efficiencies of95% recovery of the solvents in the gasstreams. However, leaky dryers mayresult in lower overall capture of thegas streams. This results in lower truesystem efficiency. The ASRS systemoperates as a closed loop system, solarge volumes of heated air areunnecessary. The oven/dryer is inertedwith nitrogen, thus, a lower explosivelimit (L.E.L.) does not exist allowingsolvent concentrate to be increased. Therecirculated gas stream therefore isconcentrated and a cryogenic loop is usedto condense and recover the entrainedsolvent.
Monthly operating costs for atypical dryer installation with a carbonbed emissions collection device couldexperience operating costs as shown:
Carbon Bed Costs:
Ventilation Air HeatingSolvent LostCarbon CostSteam Cost
Total monthly cost (+) $64,800
ASRS Costs:
Ventilation Air (nitrogen heat-up) &make-upSolvent LostNitrogen Supply
Total monthly cost (-) $52,800
Monthly savings usingliquid nitrogen $12,000
After the ASRS system had beenproven, the next phase in thisapplication was to convert the customerto the use of PSA nitrogen for the bulkof his nitrogen needs. The effect ofswitching to non-cryogenic nitrogen wasto reduce his monthly cost by an
171
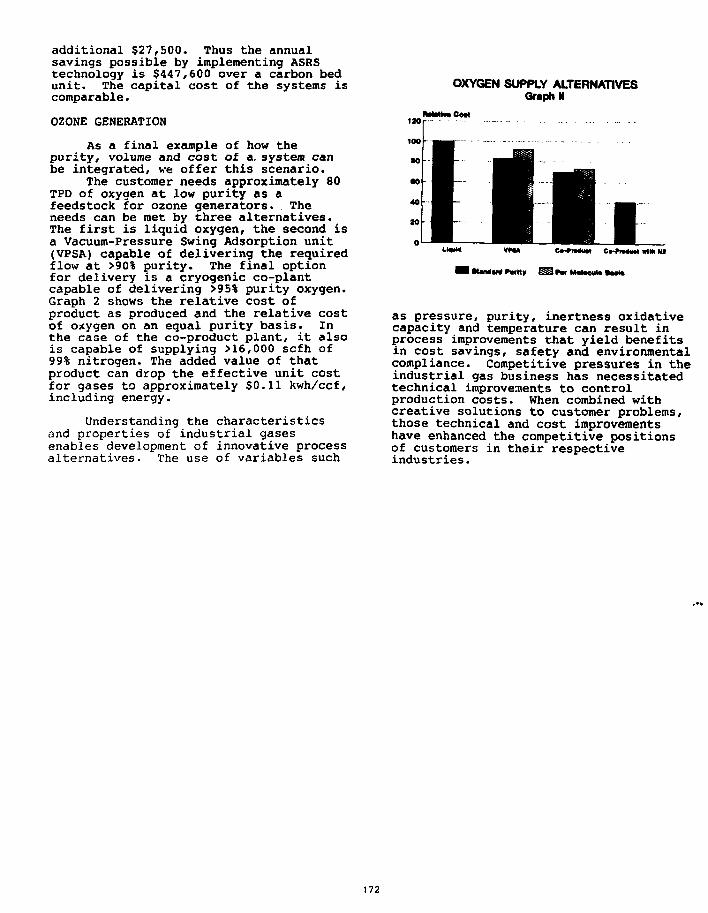
additional $27,500. Thus the annualsavings possible by implementing ASRStechnology is $447,600 over a carbon bedunit. The capital cost of the systems iscomparable.
OZONE GENERATION
As a final example of how thepurity, volume and cost of a. system canbe integrated, we offer this scenario.
The customer needs approximately 80TFD of oxygen at low purity as afeedstock for ozone generators. Theneeds can be met by three alternatives.The first is liquid oxygen, the second isa Vacuum-Pressure Swing Adsorption unit(VPSA) capable of delivering the requiredflow at >90% purity. The final optionfor delivery is a cryogenic co-plantcapable of delivering >95% purity oxygen.Graph 2 shows the relative cost ofproduct as produced and the relative costof oxygen on an equal purity basis. Inthe case of the co-product plant, it alsois capable of supplying >16,000 scfh of99% nitrogen. The added value of thatproduct can drop the effective unit costfor gases to approximately $0.11 kwh/ccf,including energy.
Understanding the characteristicsand properties of industrial gasesenables development of innovative processalternatives. The use of variables such
OXYGEN SUPPLY ALTERNATIVESGraph*
MMnCeM
as pressure, purity, inertness oxidativecapacity and temperature can result inprocess improvements that yield benefitsin cost savings, safety and environmentalcompliance. Competitive pressures in theindustrial gas business has necessitatedtechnical improvements to controlproduction costs. When combined withcreative solutions to customer problems,those technical and cost improvementshave enhanced the competitive positionsof customers in their respectiveindustries.
172
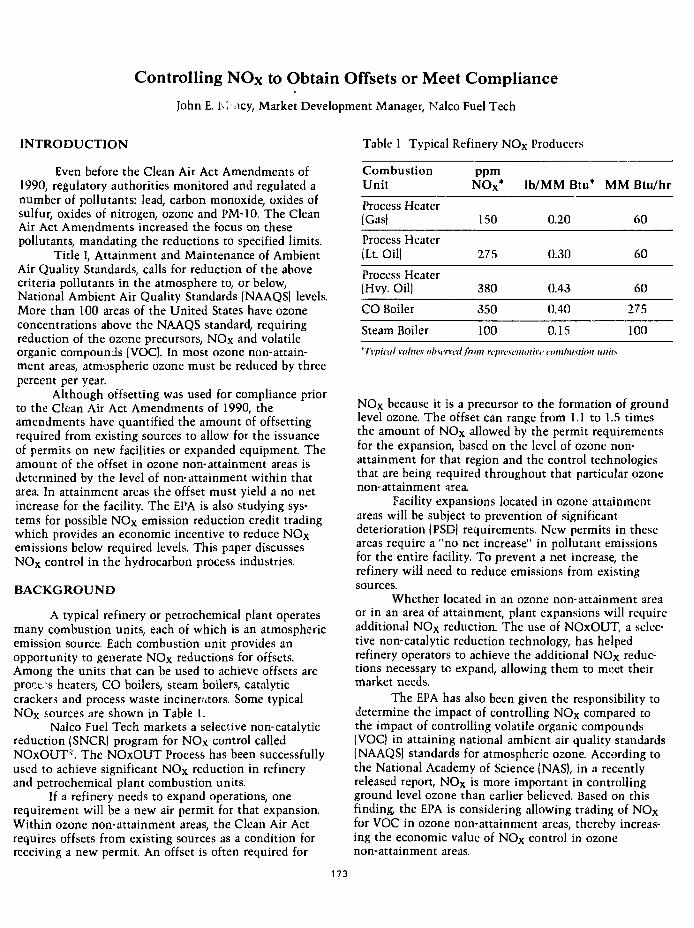
Controlling NOx to Obtain Offsets or Meet Compliance
John E. Iw'iicy, Market Development Manager, Nalco Fuel Tech
INTRODUCTION
Even before the Clean Air Act Amendments of1990, regulatory authorities monitored and regulated anumber of pollutants: lead, carbon monoxide, oxides ofsulfur, oxides of nitrogen, ozone and PM-10. The CleanAir Act Amendments increased the focus on thesepollutants, mandating the reductions to specified limits.
Title I, Attainment and Maintenance of AmbientAir Quality Standards, calls for reduction of the abovecriteria pollutants in the atmosphere to, or below,National Ambient Air Quality Standards (NAAQSI levels.More than 100 areas of the United States have ozoneconcentrations above the NAAQS standard, requiringreduction of the ozone precursors, NOx and volatileorganic compounds (VOC). In most ozone non-attain-ment areas, atmospheric ozone must be reduced by threepercent per year.
Although offsetting was used for compliance priorto the Clean Air Act Amendments of 1990, theamendments have quantified the amount of offsettingrequired from existing sources to allow for the issuanceof permits on new facilities or expanded equipment Theamount of the offset in ozone non-attainment areas isdetermined by the level of non-attainment within thatarea. In attainment areas the offset must yield a no netincrease for the facility. The EPA is also studying sys-tems for possible NOx emission reduction credit tradingwhich provides an economic incentive to reduce NOxemissions below required levels. This paper discussesNOX control in the hydrocarbon process industries.
BACKGROUND
A typical refinery or petrochemical plant operatesmany combustion units, each of which is an atmosphericemission source. Each combustion unit provides anopportunity to generate NOx reductions for offsets.Among the units that can be used to achieve offsets areprocc.s heaters, CO boilers, steam boilers, catalyticcrackers and process waste incinerators. Some typicalNOx sources are shown in Table 1.
Nalco Fuel Tech markets a selective non-catalyticreduction (SNCR) program for NOx control calledNOxOUT^. The NOxOUT Process has been successfullyused to achieve significant NOx reduction in refineryand petrochemical plant combustion units.
If a refinery needs to expand operations, onerequirement will be a new air permit for that expansion.Within ozone non-attainment areas, the Clean Air Actrequires offsets from existing sources as a condition forreceiving a new permit. An offset is often required for
Table 1 Typical Refinery NOx Producers
CombustionUnit
Process Heater|Gas)
Process Heater|Lt Oil)
Process Heater(Hvy. Oil)
CO Boiler
Steam Boiler
ppmNOx*
150
275
380
350
100
Ib/MM Btu*
0.20
0.30
0.43
0.40
0.15
MM Btu/hr
60
60
60
275
100
'Typical values obswetl from representative combustion units
NOx because it is a precursor to the formation of groundlevel ozone. The offset can range from 1.1 to 1.5 timesthe amount of NOX allowed by the permit requirementsfor the expansion, based on the level of ozone non-attainment for that region and the control technologiesthat are being required throughout that particular ozonenon-attainment area.
Facility expansions located in ozone attainmentareas will be subject to prevention of significantdeterioration (PSD) requirements. New permits in theseareas require a "no net increase" in pollutant emissionsfor the entire facility. To prevent a net increase, therefinery will need to reduce emissions from existingsources.
Whether located in an ozone non-attainment areaor in an area of attainment, plant expansions will requireadditional NOX reduction. The use of NOxOUT, a selec-tive non-catalytic reduction technology, has helpedrefinery operators to achieve the additional NOx reduc-tions necessary tc expand, allowing them to meet theirmarket needs.
The EPA has also been given the responsibility todetermine the impact of controlling NOX compared tothe impact of controlling volatile organic compounds(VOC) in attaining national ambient air quality standards(NAAQS) standards for atmospheric ozone. According tothe National Academy of Science (NAS), in a recentlyreleased report, NOx is more important in controllingground level ozone than earlier believed. Based on thisfinding, the EPA is considering allowing trading of NOXfor VOC in ozone non-attainment areas, thereby increas-ing the economic value of NOx control in ozonenon-attainment areas.
173
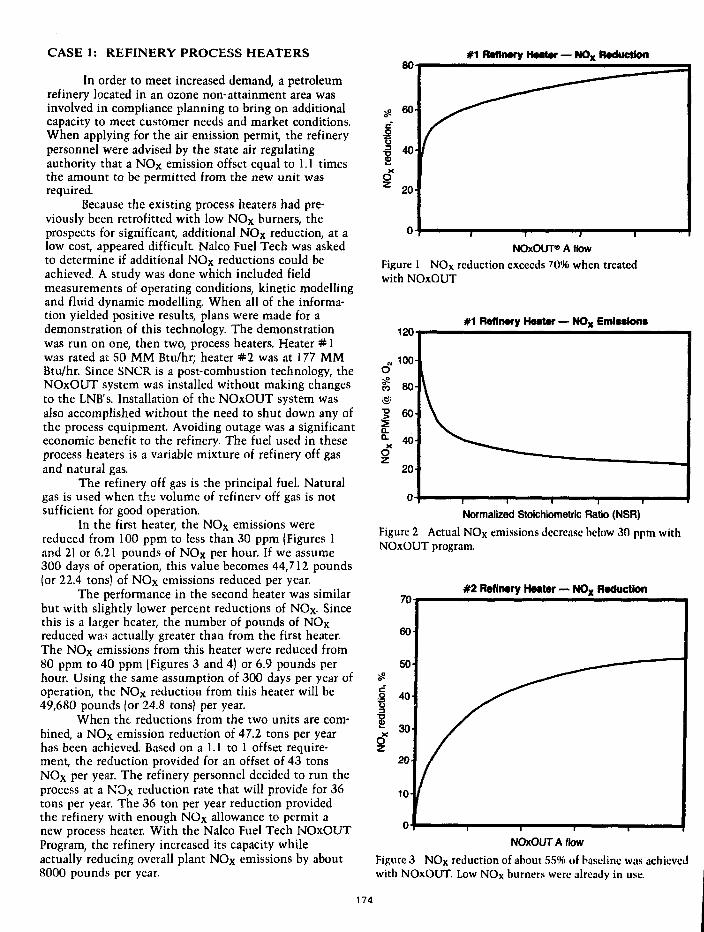
CASE I: REFINERY PROCESS HEATERS
In order to meet increased demand; a petroleumrefinery located in an ozone non-attainment area wasinvolved in compliance planning to bring on additionalcapacity to meet customer needs and market conditions.When applying for the air emission permit, the refinerypersonnel were advised by the state air regulatingauthority that a NOx emission offset equal to 1.1 timesthe amount to be permitted from the new unit wasrequired.
Because the existing process heaters had pre-viously been retrofitted with low NOX burners, theprospects for significant, additional NOx reduction, at alow cost, appeared difficult Nalco Fuel Tech was askedto determine if additional NOx reductions could beachieved. A study was done which included fieldmeasurements of operating conditions, kinetic modellingand fluid dynamic modelling. When all of the informa-tion yielded positive results, plans were made for ademonstration of this technology. The demonstrationwas run on one, then two, process heaters. Heater # 1was rated at 50 MM Btu/hr; heater #2 was at 177 MMBtu/hr. Since SNCR is a post-combustion technology, theNOxOLJT system was installed without making changesto the LNB's. Installation of the NOxOUT system wasalso accomplished without the need to shut down any ofthe process equipment. Avoiding outage was a significanteconomic benefit to the refinery. The fuel used in theseprocess heaters is a variable mixture of refinery off gasand natural gas.
The refinery off gas is the principal fuel. Naturalgas is used when the volume of refinerv off gas is notsufficient for good operation.
In the first heater, the NOX emissions werereduced from 100 ppm to less than 30 ppm | Figures 1and 2) or 6.21 pounds of NOx per hour. If we assume300 days of operation, this value becomes 44,712 pounds(or 22.4 tons) of NOx emissions reduced per year.
The performance in the second heater was similarbut with slightly lower percent reductions of NOx- Sincethis is a larger heater, the number of pounds of NOxreduced was actually greater than from the first heater.The NOX emissions from this heater were reduced from80 ppm to 40 ppm (Figures 3 and 4) or 6.9 pounds perhour. Using the same assumption of 300 days per year ofoperation, the NOx reduction from this heater will be49,680 pounds (or 24.8 tons) per year.
When the reductions from the two units are com-bined, a NOx emission reduction of 47.2 tons per yearhas been achieved. Based on a 1.1 to 1 offset require-ment, the reduction provided for an offset of 43 tonsNOX per year. The refinery personnel decided to run theprocess at a NOx reduction rate that will provide for 36tons per year. The 36 ton per year reduction providedthe refinery with enough NOx allowance to permit anew process heater. With the Nalco Fuel Tech NOxOUTProgram, the refinery increased its capacity whileactually reducing overall plant NOx emissions by about8000 pounds per year.
#1 Refinery Heater — NOX Reduction
NOxOUT® A flow
Figure 1 NOx reduction exceeds 70% when treatedwith NOxOUT
#1 Refinery Heater — NOX Emissions
Normalized Stoichiometric Ratio (NSR)
Figure 2 Actual NOx emissions decrease below 30 ppm withNOxOUT program.
#2 Refinery Heater — NOX Reduction
NOxOUT A flow
Figure 3 NOx reduction of about 55% of baseline was achievedwith NOxOUT. Low NOx burners were already in use.
174
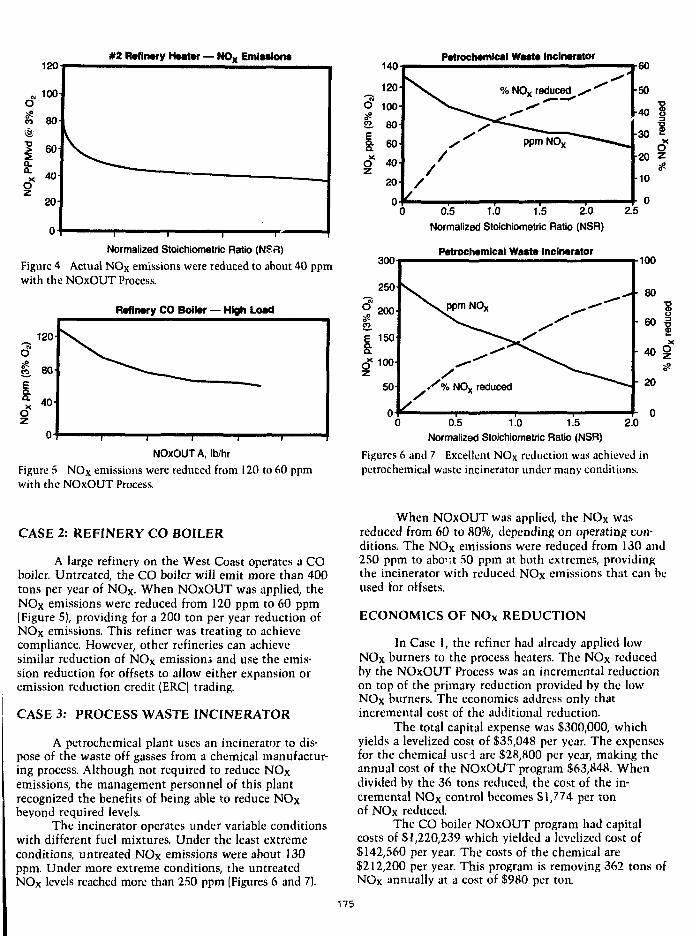
#2 Refinery Heater — NOX Emissions
Normalized Stoichiometric Ratio (NSrt)
Figure 4 Actual NOx emissions were reduced to about 40 ppmwith the NOxOUT Process.
Refinery CO Boiler — High Load
NOxOUT A, Ib/hr
Figure 5 NOx emissions were reduced from 120 to 60 ppmwith the NOxOUT Process.
140Petrochemical Wast* Incinerator
300
250
0.5 1.0 1.5 2.0
Normalized Sloichiometric Ratio (NSR)
Petrochemical Waste Incinerator100
0.5 1.0 1.5 2.0Normalized Stoichiometric Ratio (NSR)
Figures 6 and 7 Excellent NOx reduction was achieved inpetrochemical waste incinerator under many conditions.
CASE 2: REFINERY CO BOILER
A large refinery on the West Coast operates a COboiler. Untreated, the CO boiler will emit more than 400tons per year of NOX. When NOxOUT was applied; theNOx emissions were reduced from 120 ppm to 60 ppm(Figure 5), providing for a 200 ton per year reduction ofNOx emissions. This refiner was treating to achievecompliance. However, other refineries can achievesimilar reduction of NOx emissions and use the emis-sion reduction for offsets to allow either expansion oremission reduction credit (ERC) trading.
CASE 3: PROCESS WASTE INCINERATOR
A petrochemical plant uses an incinerator to dis-pose of the waste off gasses from a chemical manufactur-ing process. Although not required to reduce NOxemissions, the management personnel of this plantrecognized the benefits of being able to reduce NOxbeyond required levels.
The incinerator operates under variable conditionswith different fuel mixtures. Under the least extremeconditions, untreated NOX emissions were about 130ppm. Under more extreme conditions, the untreatedNOx levels reached more than 250 ppm (Figures 6 and 7).
When NOxOUT was applied, the NOX wasreduced from 60 to 8096, depending on operating con-ditions. The NOX emissions were reduced from 130 and250 ppm to about 50 ppm at both extremes, providingthe incinerator with reduced NOx emissions that can beused for offsets.
ECONOMICS OF NOX REDUCTION
In Case 1, the refiner had already applied lowNOx burners to the process heaters. The NOx reducedby the NOxOUT Process was an incremental reductionon top of the primary reduction provided by the lowNOx burners. The economics address only thatincremental cost of the additional reduction.
The total capital expense was $300,000, whichyields a levelized cost of $35,048 per year. The expensesfor the chemical usrd are $28,800 per year, making theannual cost of the NOxOUT program $63,848. Whendivided by the 36 tons reduced, the cost of the in-cremental NOx control becomes $1,774 per tonof NOx reduced.
The CO boiler NOxOUT program had capitalcosts of $1,220,239 which yielded a levelized cost of$142,560 per year. The costs of the chemical are$212,200 per year. This program is removing 362 tons ofNOx annually at a cost of $980 per ton.
175
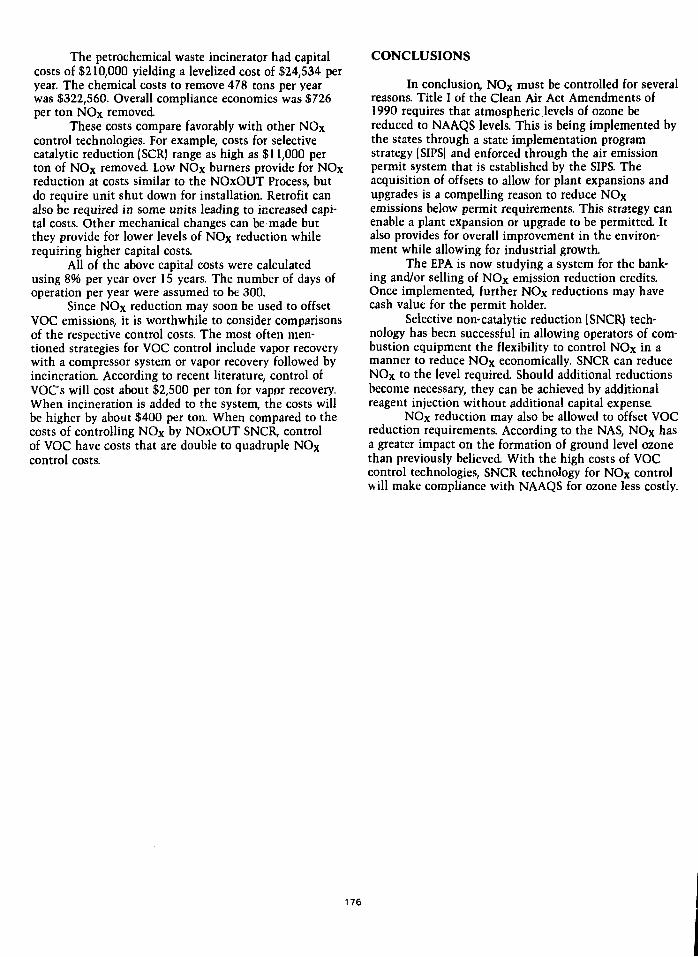
The petrochemical waste incinerator had capitalcosts of $210,000 yielding a levelized cost of $24,534 peryear. The chemical costs to remove 478 tons per yearwas $322,560. Overall compliance economics was $726per ton NOx removed.
These costs compare favorably with other NOxcontrol technologies. For example, costs for selectivecatalytic reduction (SCR) range as high as $11,000 perton of NOX removed Low NOX burners provide for NOXreduction at costs similar to the NOxOUT Process, butdo require unit shut down for installation. Retrofit canalso be required in some units leading to increased capi-tal costs. Other mechanical changes can be made butthey provide for lower levels of NOX reduction whilerequiring higher capital costs.
All of the above capital costs were calculatedusing 8% per year over 15 years. The number of days ofoperation per year were assumed to be 300.
Since NOX reduction may soon be used to offsetVOC emissions, it is worthwhile to consider comparisonsof the respective control costs. The most often men-tioned strategies for VOC control include vapor recoverywith a compressor system or vapor recovery followed byincineration. According to recent literature, control ofVOC's will cost about $2,500 per ton for vapor recovery.When incineration is added to the system, the costs willbe higher by about $400 per ton. When compared to thecosts of controlling NOX by NOxOUT SNCR, controlof VOC have costs that are double to quadruple NOxcontrol costs.
CONCLUSIONS
In conclusion, NOx must be controlled for severalreasons. Title I of the Clean Air Act Amendments of1990 requires that atmospheric levels of ozone bereduced to NAAQS levels. This is being implemented bythe states through a state implementation programstrategy (SIPS) and enforced through the air emissionpermit system that is established by the SIPS. Theacquisition of offsets to allow for plant expansions andupgrades is a compelling reason to reduce NOxemissions below permit requirements. This strategy canenable a plant expansion or upgrade to be permitted Italso provides for overall improvement in the environ-ment while allowing for industrial growth.
The EPA is now studying a system for the bank-ing and/or selling of NOx emission reduction credits.Once implemented, further NOx reductions may havecash value for the permit holder.
Selective non-catalytic reduction (SNCR) tech-nology has been successful in allowing operators of com-bustion equipment the flexibility to control NOX in amanner to reduce NOX economically. SNCR can reduceNOx to the level required. Should additional reductionsbecome necessary, they can be achieved by additionalreagent injection without additional capital expense.
NOX reduction may also be allowed to offset VOCreduction requirements. According to the NAS, NOx hasa greater impact on the formation of ground level ozonethan previously believed With the high costs of VOCcontrol technologies, SNCR technology for NOX controlwill make compliance with NAAQS for ozone less costly.
176
Estimation and Reduction Methodologies for Fugitive Emissions from Equipment
Anthony Scataglia, Branch Manager, Tmam, Incorporated, Webster, Texas
ABSTRACT
Environmental regulations haveresulted in the need for industrialfacilities to reduce fugitive emissionsfrom equipment leaks to their lowestpossible level. This paper presentsand compares approved methods outlinedby the U.S. Environmental ProtectionAgency (EPA) for estimating fugitiveemissions from equipment leaks, as wellas strategies to reduce fugitiveemissions through leak detection andrepair (LDAR) programs. Case studiesare presented to illustrate thedifference in computed emissionsresulting from the different emissionestimation methods, and to illustratethe effects of a LDAR programimplemented to reduce emissions fromequipment leaks. The fugitiveemissions reduction benefits ofimplementing an ongoing LDAR program,and the expected reductions from usingmore rigorous field testing andemissions estimate techniques areclearly indicated.
INTRODUCTION
The reporting requirements ofSection 313 of SAJtA Title III coupledwith the growing requirements ofFederal and State environmentalregulations have resulted in the needfor manufacturing facilitiescontaining chemical processing units toreduce and compute fugitive emissionsfrom equipment leaks as low aspossible. The purpose of this paper isto present and compare approved methodsoutlined by the U.S. EnvironmentalProtection Agency (EPA) for estimatingemissions of volatile organic compounds(VOC) and volatile hazardous airpollutants (VHAP) for equipment leaks,as well as present strategies to reduceVOC and VHAP emissions from equipmentleaks. Several case studies involvingthe use of EPA published factors andcorrelations for estimating emissionsfrom chemical process units arepresented to illustrate the differencein computed emissions resulting fromthe different methods. The effect of amaintenance program implemented to
reduce emissions from equipment leaksfrom chemical process units is alsoincluded. Various maintenance proceduresavailable to enhance a LDAR program toreduce fugitive emissions from equipmentare presented and discussed. Comparisonsof emissions estimated from using EPApublished emission factors andcorrelations versus emissions estimatedusing unit-specific factors andcorrelations developed through massemission rate testing (bagging) are alsopresented. The field testing proceduresand emission estimation methods presentedin this paper are explained in detail inthe 1988 EPA (1) and 1989 CMA (2)protocols for estimating fugitiveemissions. The reader is stronglyencouraged to obtain and read theseprotocols to familiarize themselves withthe field testing and data analysesmethods discussed and compared in thispaper.
METHODS FOR ESTIMATING EMISSIONS FROMEQUIPMENT LKAKS
Six methods for estimating emissionsfrom equipment leaks are examined in thispaper. They include the factor basedmethods and correlation based methodslisted below:
Factor based methods:* Average emission factor method;* Leak/no-leak emission factormethod;
* Three-strata emission factormethod;
Correlation based methods:* Application of EPA leakrate/screening valuecorrelations with EPA"default zero" factors;
* Application of EPA leakrate/screening valuecorrelations with unit-specific"default zero" factors and"pegged" factors developed frombagging;
* Application of unit-specificleak rate/screening valuecorrelations and unit-specific"default zero" factors and"pegged" factors from bagging.
177
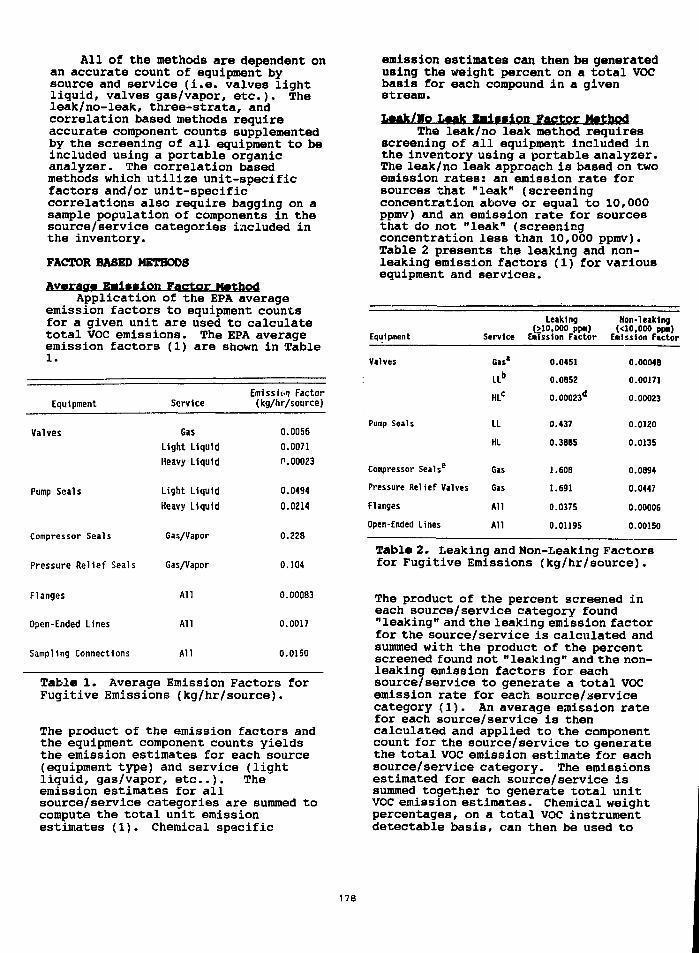
All of the methods are dependent onan accurate count of equipment bysource and service (i.e. valves lightliquid, valves gas/vapor, etc.). Theleak/no-leak, three-strata, andcorrelation based methods requireaccurate component counts supplementedby the screening of all equipment to beincluded using a portable organicanalyzer. The correlation basedmethods which utilize unit-specificfactors and/or unit-specificcorrelations also require bagging on asample population of components in thesource/service categories included inthe inventory.
FACTOR BASED METHODS
Application of the EPA averageemission factors to equipment countsfor a given unit are used to calculatetotal VOC emissions. The EPA averageemission factors (1) are shown in Table1.
Emission FactorEquipment Service (kg/hr/source)
0.0056
0.0071
P.000Z3
0.0494
0.0214
0.228
0.104
0.00083
0.0017
0.0150
Table 1. Average Emission Factors forFugitive Emissions (kg/hr/source).
The product of the emission factors andthe equipment component counts yieldsthe emission estimates for each source(equipment type) and service (lightliquid, gas/vapor, e t c . ) . Theemission estimates for allsource/service categories are summed tocompute the total unit emissionestimates (1). Chemical specific
Valves
Pump Seals
Compressor Seals
Pressure Relief Seals
Flanges
Open-Ended Lines
Sampling Connections
GasLight Liquid
Heavy Liquid
Light Liquid
Heavy Liquid
Gas/Vapor
Gas/Vapor
All
All
All
emission estimates can then be generatedusing the weight percent on a total VOCbasis for each compound in a givenstream.
The leak/no leak method requiresscreening of all equipment included inthe inventory using a portable analyzer.The leak/no leak approach is based on twoemission rates: an emission rate forsources that "leak" (screeningconcentration above or equal to 10,000ppmv) and an emission rate for sourcesthat do not "leak" (screeningconcentration less than 10,000 ppmv).Table 2 presents the leaking and non-leaking emission factors (1) for variousequipment and services.
Leaking Non-leaking(>10,000 ppn) (<10,000 ppn)
Equipment Service Emission Factor Emission Factor
Valves
Pump Seals
Compressor Sealse
Pressure Relief Valves
Flanges
Open-Ended Lines
Gas*
LLb
HLC
LL
HL
Gas
Gas
All
All
0.0451
0.0852
0.00023d
0.437
0.3865
1.60S
1.691
0.0375
0.01195
0.00048
0.00171
0.00023
0.0120
0.0135
0.0894
0.0447
0.00006
0.00150
Tabl* 2. Leaking and Non-Leaking Factorsfor Fugitive Emissions (kg/hr/source).
The product of the percent screened ineach source/service category found"leaking" and the leaking emission factorfor the source/service is calculated andsummed with the product of the percentscreened found not "leaking" and the non-leaking emission factors for eachsource/service to generate a total VOCemission rate for each source/servicecategory (1). An average emission ratefor each source/service is thencalculated and applied to the componentcount for the source/ service to generatethe total VOC emission estimate for eachsource/service category. The emissionsestimated for each source/service issummed together to generate total unitVOC emission estimates. Chemical weightpercentages, on a total VOC instrumentdetectable basis, can then be used to
178
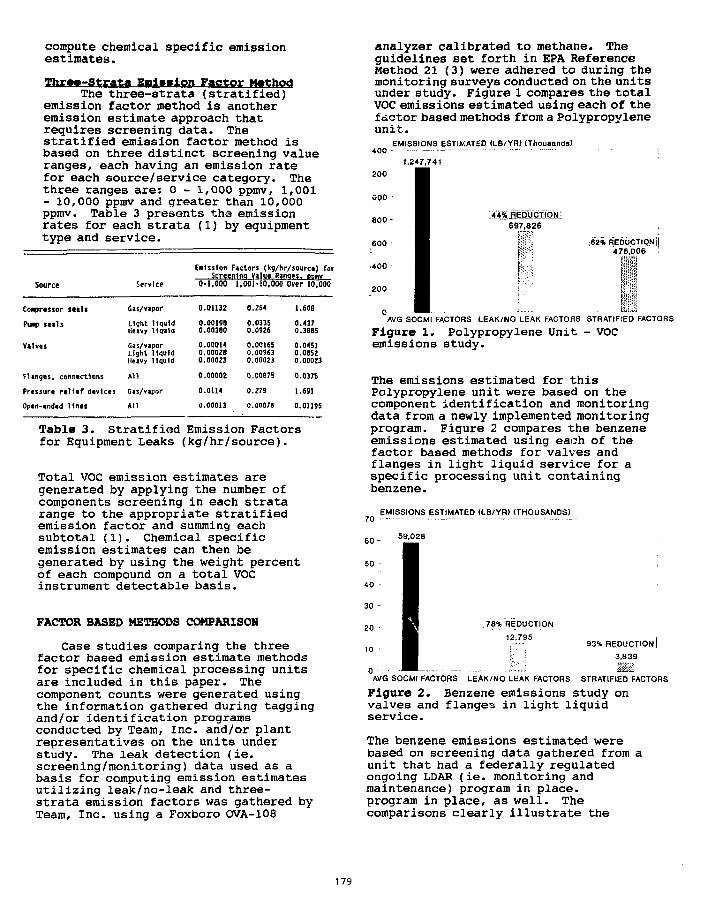
compute chemical specific emissionestimates.
Thr—-Strata Eni»»lon Factor MethodThe three-strata (stratified)
emission factor method is anotheremission estimate approach thatrequires screening data. Thestratified emission factor method isbased on three distinct screening valueranges, each having an emission ratefor each source/service category. Thethree ranges are: 0 - 1,000 ppmv,. 1,001- 10,000 ppmv and greater than 10,000ppmv. Table 3 presents the emissionrates for each strata (1) by equipmenttype and service.
Source Service
Enisslon Factors (kg/hr/sourca) farScreening Value Ranges. DDgv
0-1,000 1,001-10,000 Over 10,000
Compressor seals
PIMP seals
Valves
Flanges, connections
Pressure relief devices
Open-ended lines
Gas/vapor
Light liquidHeavy liquid
Gas/vaporLight liquidHeavy liquid
Ml
Gas/vapor
AM
0.01132 O.2G4
0.001980.00380
O.00OH0.000280.00023
0.00002
0.0114
0.00013
0.03350.0926
0.00I6S0.009630.00023
0.00875
0.279
0.00876
1.608
0.4370.388S
0.04510.08520.00023
0.0375
1.691
0.01195
Table 3. Stratified Emission Factorsfor Equipment Leaks (kg/hr/source).
Total VOC emission estimates aregenerated by applying the number ofcomponents screening in each stratarange to the appropriate stratifiedemission factor and summing eachsubtotal (1). Chemical specificemission estimates can then begenerated by using the weight percentof each compound on a total VOCinstrument detectable basis.
FACTOR BASED METHODS COMPARISON
Case studies comparing the threefactor based emission estimate methodsfor specific chemical processing unitsare included in this paper. Thecomponent counts were generated usingthe information gathered during taggingand/or identification programsconducted by Team, Inc. and/or plantrepresentatives on the units understudy. The leak detection (ie.screening/monitoring) data used as abasis for computing emission estimatesutilizing leak/no-leak and three-strata emission factors was gathered byTeam, Inc. using a Foxboro OVA-108
analyzer calibrated to methane. Theguidelines set forth in EPA ReferenceMethod 21 (3) were adhered to during themonitoring surveys conducted on the unitsunder study. Figure 1 compares the totalVOC emissions estimated using each of thefactor based methods from a Polypropyleneunit.
EMISSIONS ESTIMATED (LB/YR) (Thousands)
1,247,741
200
000
800-
600
•400
200
697,826i.62% REDUCTION!
476,006ft.'.
0AVG SOCMI FACTORS LEAK/NO LEAK FACTORS STRATIFIED FACTORS
Figure 1. Polypropylene Unit - VOCemissions study.
The emissions estimated for thisPolypropylene unit were based on thecomponent identification and monitoringdata from a newly implemented monitoringprogram. Figure 2 compares the benzeneemissions estimated using each of thefactor based methods for valves andflanges in light liquid service for aspecific processing unit containingbenzene.
EMISSIONS ESTIMATED (LB/YR) (THOUSANDS)70 ~~~ ' • • • ~ - - —
6 0 -
5 0 -
40
30 -
20 •
59,028
78% REDUCTION
12,79593% REDUCTION |
3,839
AVG SOCMI FACTORS LEAK/NO LEAK FACTORS STRATIFIED FACTORS
Figure 2. Benzene emissions study onvalves and flanges in light liquidservice.
The benzene emissions estimated werebased on screening data gathered from aunit that had a federally regulatedongoing LDAR (ie. monitoring andmaintenance) program in place,program in place, as well. Thecomparisons clearly illustrate the
179
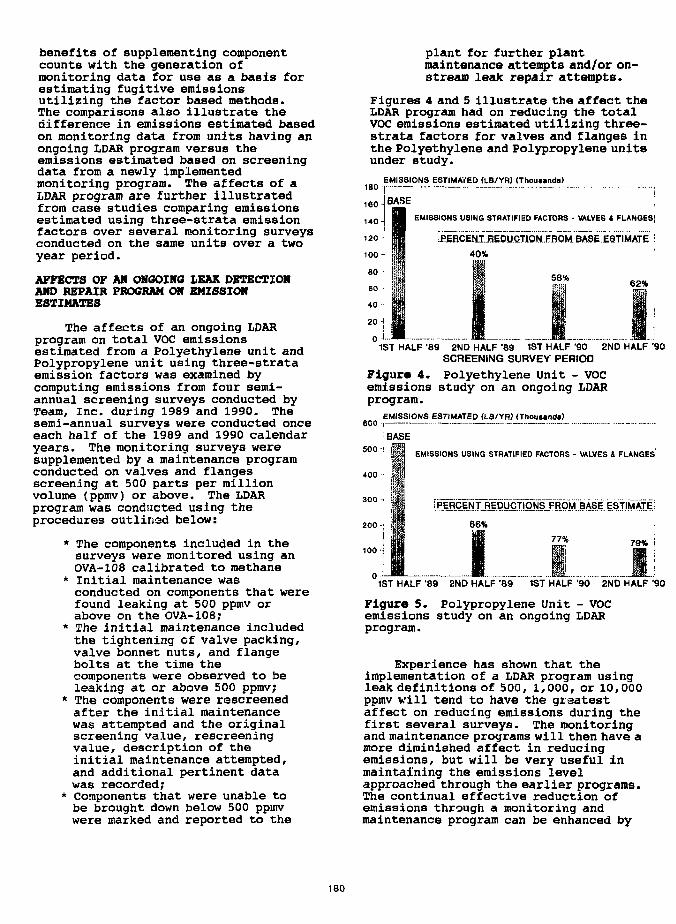
benefits of supplementing componentcounts with the generation ofmonitoring data for use as a basis forestimating fugitive emissionsutilizing the factor based methods.The comparisons also illustrate thedifference in emissions estimated basedon monitoring data from units having anongoing LDAR program versus theemissions estimated based on screeningdata from a newly implementedmonitoring program. The affects of aLDAR program are further illustratedfrom case studies comparing emissionsestimated using three-strata emissionfactors over several monitoring surveysconducted on the same units over a twoyear period.
AFFECTS OF AN ONGOING LEAK DETECTIONAND REPAIR PROGRAM ON EMISSIONESTIMATES
The affects of an ongoing LDARprogram on total VOC emissionsestimated from a Polyethylene unit andPolypropylene unit using three-strataemission factors was examined bycomputing emissions from four semi-annual screening surveys conducted byTeam, Inc. during 1989 and 1990. Thesemi-annual surveys were conducted onceeach half of the 1989 and 1990 calendaryears. The monitoring surveys weresupplemented by a maintenance programconducted on valves and flangesscreening at 500 parts per millionvolume (ppmv) or above. The LDARprogram was conducted using theprocedures outlined below:
* The components included in thesurveys were monitored using anOVA-108 calibrated to methane
* Initial maintenance wasconducted on components that werefound leaking at 500 ppmv orabove on the OVA-108;
* The initial maintenance includedthe tightening of valve packing,valve bonnet nuts, and flangebolts at the time thecomponents were observed to beleaking at or above 500 ppmv;
* The components were rescreenedafter the initial maintenancewas attempted and the originalscreening value, rescreeningvalue, description of theinitial maintenance attempted,and additional pertinent datawas recorded;
* Components that were unable tobe brought down below 500 ppmvwere marked and reported to the
plant for further plantmaintenance attempts and/or on-stream leak repair attempts.
Figures 4 and 5 illustrate the affect theLDAR program had on reducing the totalVOC emissions estimated utilizing three-strata factors for valves and flanges inthe Polyethylene and Polypropylene unitsunder study.
EMISSIONS ESTIMATED (LB/YR) (Thousands)
EMISSIONS USING STRATIFIED FACTORS - VALVES * FLANGES;
!BEBC£tiI^EDUC.TlQN.I:BQMBASE.ESTIMATE :
40%
58%62%
0-LJ1ST HALF '89 2ND HALF '89 1ST HALF '90 2ND HALF -90
SCREENING SURVEY PERIOD
Figur* 4. Polyethylene Unit - VOCemissions study on an ongoing LDARprogram.
EMISSIONS ESTIMATED (LB/YR) (Thousand*)600 i - - — -
BASE
500-
400
EMISSIONS USING STRATIFIED FACTORS - VALVES t, FLANGES
66%77% 79%
1ST HALF '89 2ND HALF '89 1ST HALF '90 2ND HALF '90
Figure 5. Polypropylene Unit - VOCemissions study on an ongoing LDARprogram.
Experience has shown that theimplementation of a LDAR program usingleak definitions of 500, 1,000, or 10,000ppmv will tend to have the greatestaffect on reducing emissions during thefirst several surveys. The monitoringand maintenance programs will then have amore diminished affect in reducingemissions, but will be very useful inmaintaining the emissions levelapproached through the earlier programs.The continual effective reduction ofemissions through a monitoring andmaintenance program can be enhanced by
180

the increasing of monitoring surveysand repair frequencies and/or thelowering of the leak definition formaintenance consideration. Anotherimportant step in reducing emissions isto trace repeat or problem leakers, andto look to a more permanent solutionthrough component replacement or moresophisticated leak repair techniquesbeyond the initial maintenancetechniques outlined above.
ON-STREAM LEAK REPAIR TECHNIQUES
Almost any leak, regardless of theleaking conditions can be repaired on-stream. Methods, materials andhardware designs vary depending onpressures, temperatures and theseverity of the leak.
Basically, on-stream repair ofleaks involves establishing a retainerfor the packing or sealing material anda method of injecting the sealingmaterial. Once this is done, the finalstep is to inject the packing orsealant and repair the leak.
To illustrate how this is actuallydone, the individual leaking componentmust be identified because thetechnique varies greatly depending onthe configuration of the equipmentwhich is leaking.
Valve Packing Gland LeaksValve packing gland leaks are
repaired by initially drilling andtapping a small hole into the packingarea through the wall of the packingbox. Pumpable packing material is theninjected under pressure to add packingmaterial. This repairs the leak andrestores full packing gland adjustmentto the packing follower.
Full Face Flange Gasket LeaksFilst face flanges with full face
gasket are a special case because nogap exists at the flange outsidediameter (OD). These leaks arerepaired by initially installing capnuts to replace flange stud nuts. Thesealant is then injected through thecap nuts to fill all stud holes andseal off the leak.
Flange Face Gap LeaksFlanges with gaps between the
flange faces are sealed either byinstalling a flange clamp on the OD ofthe flanges or by performing the wirewrap technique.
Flange Claap Technique*. The clampwhich fits the OD of the flange isinstalled and tightened. The clamp hasdrilled and tapped ports which allowssealant injection all around. Thesealant fills the gap, stud holes andseals the leak at the gasket OD.
Wire Wrap Technique. Instead of aclamp, wire is wrapped in the gap betweenthe flanges. The wire lays on the studsand completely fills the flange gap toprovide the retainer for the sealant.Sealant is then injected through cap nutsto seal the leak.
The wire wrap in most cases is lesscostly than the flange clamp repair andcan be done immediately with stockmaterials. The wire wrap is limited to650 psi line pressure and gaps to 3/8inches between flanges.
Piping and Fitting LeaksPiping enclosures and fitting
enclosures must be installed over theleaking component to provide the retainerfor the sealant. Once the enclosure isinstalled, sealant is injected into thecavity between the enclosure and the pipeor fitting. When the cavity is filledwith compressed sealant, the leak iseffectively sealed off.
Expansion Joint LeaksThe expansion joint must be
encapsulated in an enclosure which isdesigned with integral seals called"Perimeter Seals". These are doublepacking or tubing seals at the enclosureend plates and split lines. The doubleseals have an injection groove betweenthem that allows injection of the sealantto seal off the leak without injectioninto the cavity. Thus, the expansionjoint is free to flex and toleratemovement of the pipe.
This type of enclosure would also beused when the leak is a large hole in thepipe. Eliminating the need for injectingsealant into the enclosure cavitypositively prevents sealant frominadvertently entering the processstream.
Equipment Case LeakaPump, turbine and compressor cases
are prone to leak at the bolted joint.These leaks are repaired in most casessimply by drilling and tapping a holeinto the stud bolts and injecting sealantto fill the stud holes completely. Thisis effective on most cases because thebolt hole is directly in the path of theleak.
181
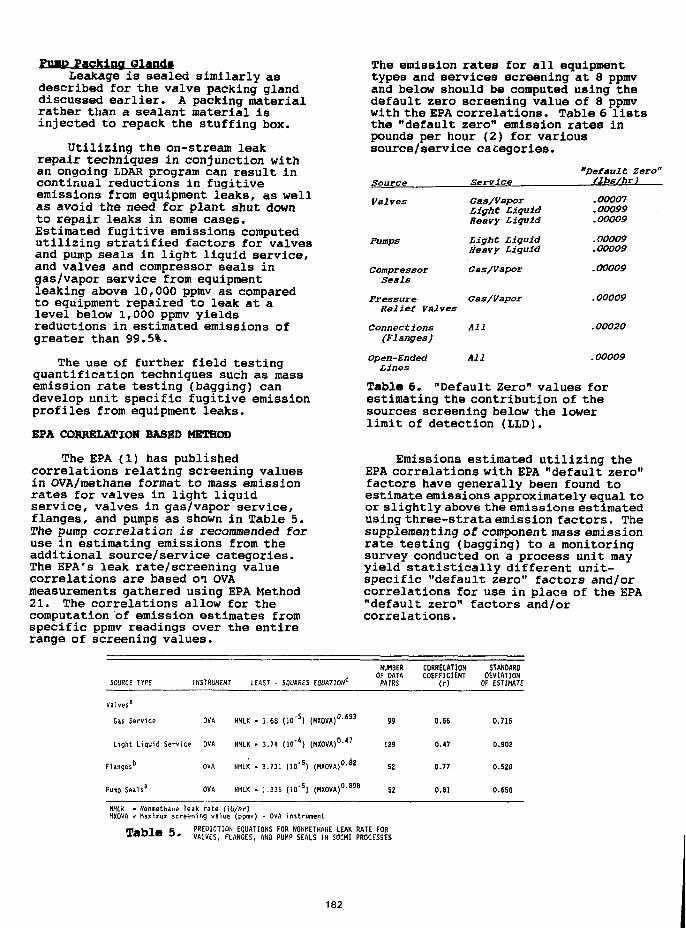
PIMP Pa?Mn? Gland*Leakage is sealed similarly as
described for the valve packing glanddiscussed earlier. A packing materialrather than a sealant material isinjected to repack the stuffing box.
Utilizing the on-stream leakrepair techniques in conjunction withan ongoing LDAR program can result incontinual reductions in fugitiveemissions from equipment leaks, as wellas avoid the need for plant shut downto repair leaks in some cases.Estimated fugitive emissions computedutilizing stratified factors for valvesand pump seals in light liquid service,and valves and compressor seals ingas/vapor service from equipmentleaking above 10,000 ppmv as comparedto equipment repaired to leak at alevel below 1,000 ppmv yieldsreductions in estimated emissions ofgreater than 99.5%.
The use of further field testingquantification techniques such as massemission rate testing (bagging) candevelop unit specific fugitive emissionprofiles from equipment leaks.
EPA CORRELATION BASED METHOD
The EPA (1) has publishedcorrelations relating screening valuesin OVA/methane format to mass emissionrates for valves in light liquidservice, valves in gas/vapor service,flanges, and pumps as shown in Table 5.The pump correlation is recommended foruse in estimating emissions from theadditional source/service categories.The EPA's leak rate/screening valuecorrelations are based oi OVAmeasurements gathered using EPA Method21. The correlations allow for thecomputation of emission estimates fromspecific ppmv readings over the entirerange of screening values.
The emission rates for all equipmenttypes and services screening at 8 ppmvand below should be computed using thedefault zero screening value of 8 ppmvwith the EPA correlations. Table 6 liststhe "default zero" emission rates inpounds per hour (2) for varioussource/service categories.
Source
Valves
Pumps
CompressorSeals
PressureRelief Valves
Connections(Flanges)
Open-EndedLines
Service
Gas/VaporLight LiquidHeavy Liquid
Light LiquidHeavy Liquid
Gas/Vapor
Gas/Vapor
All
All
"Default Zero"tlbs/hr)
.O0007
.00099
.00009
.00009
. 00009
.00009
.00009
.00020
.00009
Table 6. "Default Zero" values forestimating the contribution of thesources screening below the lowerlimit of detection (LLD).
Emissions estimated utilizing theEPA correlations with EPA "default zero"factors have generally been found toestimate emissions approximately equal toor slightly above the emissions estimatedusing three-strata emission factors. Thesupplementing of component mass emissionrate testing (bagging) to a monitoringsurvey conducted on a process unit mayyield statistically different unit-specific "default zero" factors and/orcorrelations for use in place of the EPA"default zero" factors and/orcorrelations.
SOURCE TYPE INSTRUMENT LEAST • SQUARES EQUATION0NUMBER CORRELATION STANDARO
OF DATA COEFFICIENT DEVIATIONPAIRS (r) OF ESTIMATE
Valvesa
Gas Service OVA NMLK - 1.68 (1O'!
Light Liquid Service OVA NMLK • 3.74 (1O"4) (MXOVA)0-47
Flanges"
Pump Sealsa
OVA NMLK - 3.731 (MXOVA)0'*2
99
129
52
52
0.66
0.47
0.77
0.81
0.716
0.902
0.S20
0.650
NHLK - Nonmethane leak rate (Ib/tir)MXOVA - Maximum screening value (ppmv) - OVA instrument
R PREDICTION EQUATIONS FOR NONMETHANE LEAK RATE FORD' VALVES, FLANGES, AM) PUMP SEALS IN SOCHI PROCESSES
182

MASS EMISSION SATE TESTING
Mass emission rate testing(bagging) is a procedure that may beused to determine the relationshipbetween screening values and organicmass emission rate more accurately thanthe factor based methods and EPAcorrelation based method described tothis point. Bagging involves theenclosure of a source combined with thedetermination of the concentration ofthe gas organic constituents containedin the enclosure. The bagging dataused to illustrate emission estimatecomparisons in this paper was gatheredusing the blow-through method.
Blow-Through MethodThe blow-through method of bagging
involves the enclosure of a source in aflexible tent comprised of a materialnonreactive to the chemicals understudy (e.g. tedlar). Nitrogen ismetered into the tent through one ortwo tubes in order to create a dilutedconstant VOC concentration inside thetent. The oxygen content andtemperature are taken from inside thetent. The VOC concentration inside thetent is tested using the OVA with adilution probe installed to determinewhen equilibrium has been approachedinside the tent. A sample is thentaken from the tent for organicconcentration determination. The stepsof the blow-through method aredescribed in more detail in Section 4of the EPA protocol (1). The datapresented in this paper was based onthe samples being drawn from the tentusing a constant low flow pump. Thesamples were transported to alaboratory for organic chemicalspeciation and concentration analysis.The mass emission rates computed frombagging data coupled with the screeningvalues of the sources tested at thetime of bagging may be used to generateunit-specific factors and/orcorrelations for use in estimatingemissions.
DEVELOPMENT OF A UNIT-SPECIFIC EMISSIONRATE FOR EQUIPMENT SCREENING NOTHINGABOVE THE BACKGROUND CONCENTRATION
A statistically valid unit-specific "default zero" emission ratefor a given source/service may begenerated through the use of baggingdata. The EPA "default zero" emissionrates were generated through somelimited bagging data performed onvalves in gas/vapor service. The EPA
"default zero" emission rate generatedfor valves in gas/vapor servicecorresponded to approximately an 8 ppmvscreening value as used in the EPAcorrelation for valves in gas/vaporservice. The 8 ppmv default screeningvalue for components screening at 8 ppmvand below was then established for use inestimating the "default zero" emissionrates from the additional EPAcorrelations for the other source/servicecategories. The limited bagging dataused to generate the EPA "default zero"emission rates led to the examination ofthe validity of using the EPA emissionrates to estimate emissions fromcomponents screening at 8 ppmv or less.
An outline for the development ofunit-specific "default zero" emissionrates for equipment that does not screenabove the background concentration isincluded in Appendix G of the EPAprotocol (1). The unit-specific "defaultzero" emission rates may be generatedfrom bagging of components insource/service categories of interest. Aminimum of two components screening atzero from a given source/service categoryin a process unit must be bagged for thedevelopment of a unit-specific "defaultzero" emission factor. The unit-specific"default zero" emission factor may beused to estimate emissions if the baggingdata indicates that the unit-specific"default zero" factor is statisticallydifferent from the EPA factor for thesource/service category. A statisticallyvalid unit-specific "default zero" factorlower than the EPA factor is indicatedwhen the upper confidence interval forthe "default zero" factor computed frombagging data is lower than the EPA"default zero" emission factor for thesource/service category underconsideration. Bagging data gatheredfrom valves in gas/vapor service, valvesin light liquid service, andflanges/connectors screening at zero fromstudies conducted by Team, Incorporatedon various chemical process units locatedover various geographical regions of theUnited States during the past 2+ yearshave been combined and compared to theEPA "default zero" factors.
Bagging data for a total of 39 valvesin gas/vapor service from 11 variousprocess units was combined forstatistical analysis and compared to theexisting EPA "default zero" factor forvalves in gas/vapor service. The resultsof the combined bagging data from valvesin gas/vapor service screening at zero,which yielded a total VOC "default zero"
183
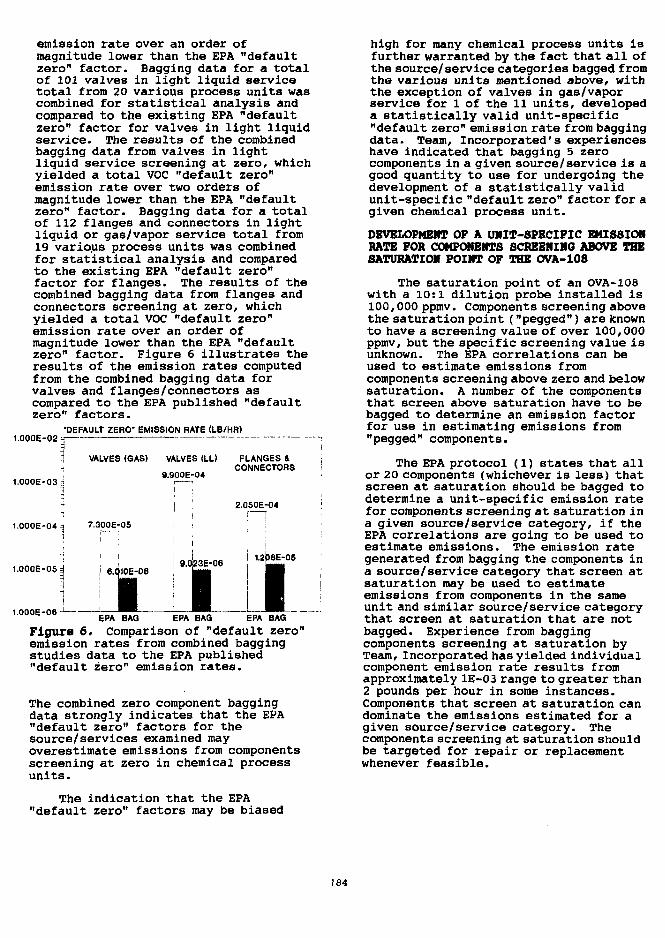
emission rate over an order ofmagnitude lower than the EPA "defaultzero" factor. Bagging data for a totalof 101 valves in light liquid servicetotal from 20 various process units wascombined for statistical analysis andcompared to the existing EPA "defaultzero" factor for valves in light liquidservice. The results of the combinedbagging data from valves in lightliquid service screening at zero, whichyielded a total VOC "default zero"emission rate over two orders ofmagnitude lower than the EPA "defaultzero" factor. Bagging data for a totalof 112 flanges and connectors in lightliquid or gas/vapor service total from19 variqus process units was combinedfor statistical analysis and comparedto the existing EPA "default zero"factor for flanges. The results of thecombined bagging data from flanges andconnectors screening at zero, whichyielded a total VOC "default zero"emission rate over an order ofmagnitude lower than the EPA "defaultzero" factor. Figure 6 illustrates theresults of the emission rates computedfrom the combined bagging data forvalves and flanges/connectors ascompared to the EPA published "defaultzero" factors.
1.000E-02;
1.000E-03 i
1.000E-04 a
1.000E-05
'DEFAULT ZERO' EMISSION RATE (LB/HR)
VALVES (GAS) VALVES (LL) FLANGES &CONNECTORS
9.900E-04
2.050E-04
-05
1.000E-06t
Figure 6. Comparison of "default zero"emission rates from combined baggingstudies data to the EPA published"default zero" emission rates.
The combined zero component baggingdata strongly indicates that the EPA"default zero" factors for thesource/services examined mayoverestimate emissions from componentsscreening at zero in chemical processunits.
The indication that the EPA"default zero" factors may be biased
high for many chemical process units isfurther warranted by the fact that all ofthe source/ service categories bagged fromthe various units mentioned above, withthe exception of valves in gas/vaporservice for 1 of the 11 units, developeda statistically valid unit-specific"default zero" emission rate from baggingdata. Team, Incorporated's experienceshave indicated that bagging 5 zerocomponents in a given source/service is agood quantity to use for undergoing thedevelopment of a statistically validunit-specific "default zero" factor for agiven chemical process unit.
DEVELOPMENT OF A UNIT-SPECIFIC EMISSIONRATE FOR COMPONENTS SCREENING ABOVE THESATURATION POINT OF THE OVA-108
The saturation point of an OVA-108with a 10:1 dilution probe installed is100,000 ppmv. Components screening abovethe saturation point ("pegged") are knownto have a screening value of over 100,000ppmv, but the specific screening value isunknown. The EPA correlations can beused to estimate emissions fromcomponents screening above zero and belowsaturation. A number of the componentsthat screen above saturation have to bebagged to determine an emission factorfor use in estimating emissions from"pegged" components.
The EPA protocol (1) states that allor 20 components (whichever is less) thatscreen at saturation should be bagged todetermine a unit-specific emission ratefor components screening at saturation ina given source/service category, if theEPA correlations are going to be used toestimate emissions. The emission rategenerated from bagging the components ina source/service category that screen atsaturation may be used to estimateemissions from components in the sameunit and similar source/service categorythat screen at saturation that are notbagged. Experience from baggingcomponents screening at saturation byTeam, Incorporated has yielded individualcomponent emission rate results fromapproximately 1E-03 range to greater than2 pounds per hour in some instances.Components that screen at saturation candominate the emissions estimated for agiven source/service category. Thecomponents screening at saturation shouldbe targeted for repair or replacementwhenever feasible.
184
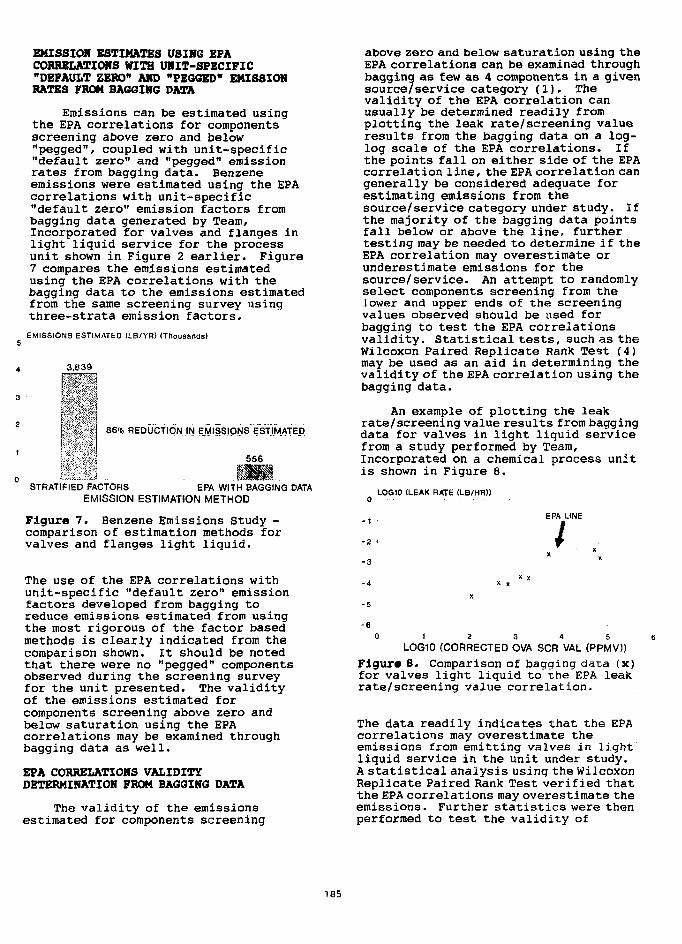
EMISSIOJf ESTIMATES USING EPACORRELATIONS WITH UNIT-SPECIFIC"DEFAULT ZERO" AND "PEGGED" EMISSIONRATES FROM BAGGING DATA
Emissions can be estimated usingthe EPA correlations for componentsscreening above zero and below"pegged", coupled with unit-specific"default zero" and "pegged" emissionrates from bagging data. Benzeneemissions were estimated using the EPAcorrelations with unit-specific"default zero" emission factors frombagging data generated by Team,Incorporated for valves and flanges inlight liquid service for the processunit shown in Figure 2 earlier. Figure7 compares the emissions estimatedusing the EPA correlations with thebagging data to the emissions estimatedfrom the same screening survey usingthree-strata emission factors.
EMISSIONS ESTIMATED ILB/YR) (Thousands)
3,839
i CV86% REDUCTION IN EMISSIONS ESTIMATED
556
STRATIFIED FACTORS EPA WITH BAGGING DATAEMISSION ESTIMATION METHOD
Figure 7. Benzene Emissions Study -comparison of estimation methods forvalves and flanges light liquid.
The use of the EPA correlations withunit-specific "default zero" emissionfactors developed from bagging toreduce emissions estimated from usingthe most rigorous of the factor basedmethods is clearly indicated from thecomparison shown. It should be notedthat there were no "pegged" componentsobserved during the screening surveyfor the unit presented. The validityof the emissions estimated forcomponents screening above zero andbelow saturation using the EPAcorrelations may be examined throughbagging data as well.
EPA CORRELATIONS VALIDITYDETERMINATION FROM BAGGING DATA
The validity of the emissionsestimated for components screening
above zero and below saturation using theEPA correlations can be examined throughbagging as few as 4 components in a givensource/service category (1). Thevalidity of the EPA correlation canusually be determined readily fromplotting the leak rate/screening valueresults from the bagging data on a log-log scale of the EPA correlations. Ifthe points fall on either side of the EPAcorrelation line, the EPA correlation cangenerally be considered adequate forestimating emissions from thesource/service category under study. Ifthe majority of the bagging data pointsfall below or above the line, furthertesting may be needed to determine if theEPA correlation may overestimate orunderestimate emissions for thesource/service. An attempt to randomlyselect components screening from theJower and upper ends of the screeningvalues observed should be used forbagging to test the EPA correlationsvalidity. Statistical tests, such as theWilcoxon Paired Replicate Rank Test (4)may be used as an aid in determining thevalidity of the EPA correlation using thebagging data.
An example of plotting the leakrate/screening value results from baggingdata for valves in light liquid servicefrom a study performed by Team,Incorporated on a chemical process unitis shown in Figure 8.
LOG10 (LEAK RATE (LB/HR))
EPA LINE
o
- 1
- 2
-3
-4
-5
0 1 2 3 4 5
LOG10 (CORRECTED OVA SCR VAL (PPMV))Figure 8. Comparison of bagging data (x)for valves light liquid to" the EPA leakrate/screening value correlation.
The data readily indicates that the EPAcorrelations may overestimate theemissions from emitting valves in lightliquid service in the unit under study.A statistical analysis using the WilcoxonReplicate Paired Hank Test verified thatthe EPA correlations may overestimate theemissions. Further statistics were thenperformed to test the validity of
185
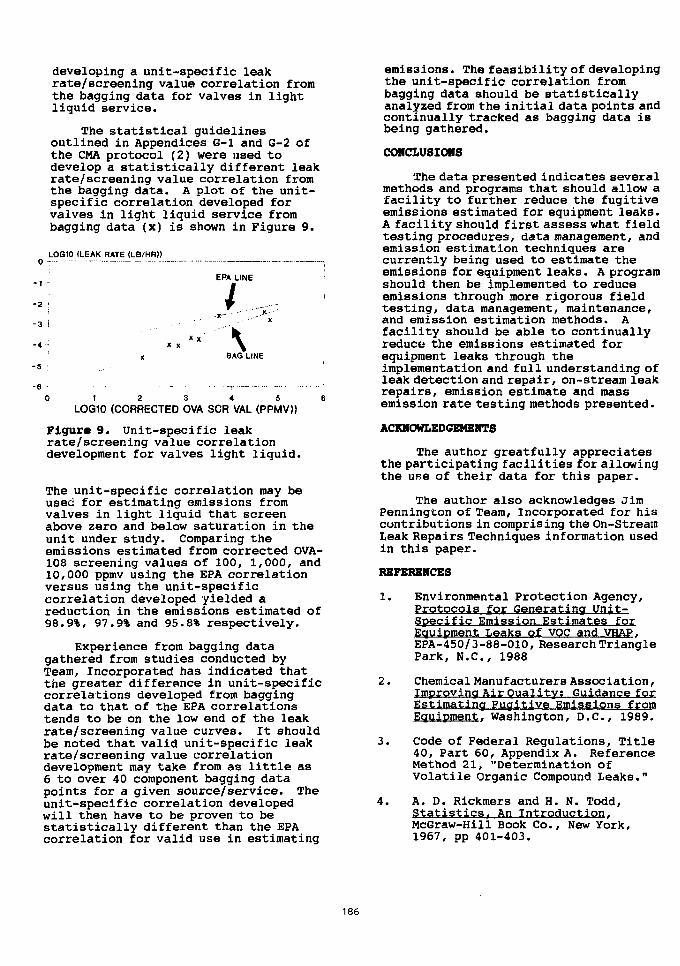
X xX X
BAG LINE
developing a unit-specific leakrate/screening value correlation fromthe bagging data for valves in lightliquid service.
The statistical guidelinesoutlined in Appendices G-l and G-2 ofthe CMA protocol (2) were used todevelop a statistically different leakrate/screening value correlation fromthe bagging data. A plot of the unit-specific correlation developed forvalves in light liquid service frombagging data (x) is shown in Figure 9.
LOG10 (LEAK RATE (LB/HR))Q _. — - -
I EPA LINE
- 2 :
- 3 i . . . • " •
-4 '•
-s :
-6 - - . . . . . . ..... ,
0 1 2 3 4 5
LOG10 (CORRECTED OVA SCR VAL (PPMV))
Figura 9. Unit-specific leakrate/screening value correlationdevelopment for valves light liquid.
The unit-specific correlation may beused for estimating emissions fromvalves in light liquid that screenabove zero and below saturation in theunit under study. Comparing theemissions estimated from corrected OVA-108 screening values of 100, 1,000, and10,000 ppmv using the EPA correlationversus using the unit-specificcorrelation developed yielded areduction in the emissions estimated of98.9%, 97.9% and 95.8% respectively.
Experience from bagging datagathered from studies conducted byTeam, Incorporated has indicated thatthe greater difference in unit-specificcorrelations developed from baggingdata to that of the EPA correlationstends to be on the low end of the leakrate/screening value curves. It shouldbe noted that valid unit-specific leakrate/screening value correlationdevelopment may take from as little as6 to over 40 component bagging datapoints for a given source/service. Theunit-specific correlation developedwill then have to be proven to bestatistically different than the EPAcorrelation for valid use in estimating
emissions. The feasibility of developingthe unit-specific correlation frombagging data should be statisticallyanalyzed from the initial data points andcontinually tracked as bagging data isbeing gathered.
COHCLUSIOWS
The data presented indicates severalmethods and programs that should allow afacility to further reduce the fugitiveemissions estimated for equipment leaks.A facility should first assess what fieldtesting procedures, data management, andemission estimation techniques arecurrently being used to estimate theemissions for equipment leaks. A programshould then be implemented to reduceemissions through more rigorous fieldtesting, data management, maintenance,and emission estimation methods. Afacility should be able to continuallyreduce the emissions estimated forequipment leaks through theimplementation and full understanding ofleak detection and repair, on-stream leakrepairs, emission estimate and massemission rate testing methods presented.
ACKNOWLEDGEMENTS
The author greatfully appreciatesthe participating facilities for allowingthe use of their data for this paper.
The author also acknowledges JimPennington of Team, Incorporated for hiscontributions in comprising the On-StreamLeak Repairs Techniques information usedin this paper.
REFERENCES
1. Environmental Protection Agency,Protocols for Generating Unit-Specific Emission Estimates forEquipment Leaks of VOC and VHAP.EPA-450/3-88-010, Research TrianglePark, N.C., 1988
2. Chemical Manufacturers Association,Improving Air Quality: Guidance forEstimating Fugitive Emissions fromEquipment, Washington, D.C., 1989.
3. Code of Federal Regulations, Title40, Part 60, Appendix A. ReferenceMethod 21, "Determination ofVolatile Organic Compound Leaks."
4. A. D. Rickmers and H. N. Todd,Statistics. An IntroductionrMcGraw-Hill Book Co., New York,1967, pp 401-403.
186
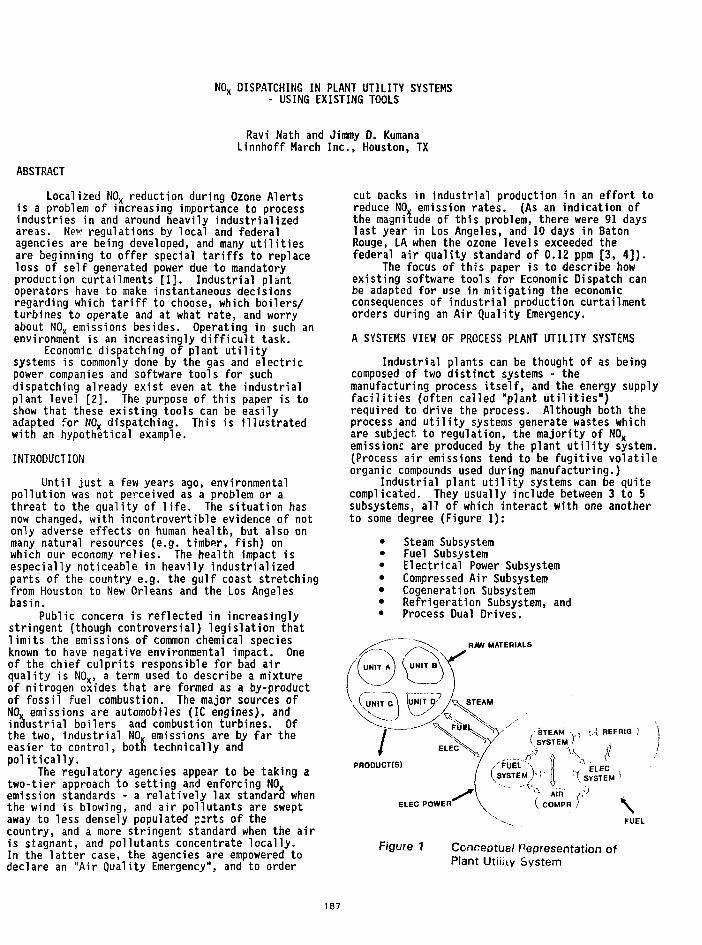
NOX DISPATCHING IN PLANT UTILITY SYSTEMS- USING EXISTING TOOLS
Ravi Nath and Jimmy 0. KumanaLinnhoff March Inc., Houston, TX
ABSTRACT
Localized N0x reduction during Ozone Alertsis a problem of increasing importance to processindustries in and around heavily industrializedareas. Nev1 regulations by local and federalagencies are being developed, and many utilitiesare beginning to offer special tariffs to replaceloss of self generated power due to mandatoryproduction curtailments [1]. Industrial plantoperators have to make instantaneous decisionsregarding which tariff to choose, which boilers/turbines to operate and at what rate, and worryabout N0x emissions besides. Operating in such anenvironment is an increasingly difficult task.
Economic dispatching of plant utilitysystems is commonly done by the gas and electricpower companies and software tools for suchdispatching already exist even at the industrialplant level [2]. The purpose of this paper is toshow that these existing tools can be easilyadapted for N0x dispatching. This is illustratedwith an hypothetical example.
INTRODUCTION
Until just a few years ago, environmentalpollution was not perceived as a problem or athreat to the quality of life. The situation hasnow changed, with incontrovertible evidence of notonly adverse effects on human health, but also onmany natural resources (e.g. timber, fish) onwhich our economy relies. The health impact isespecially noticeable in heavily industrializedparts of the country e.g. the gulf coast stretchingfrom Houston to New Orleans and the Los Angelesbasin.
Public concern is reflected in increasinglystringent {though controversial) legislation thatlimits the emissions of common chemical speciesknown to have negative environmental impact. Oneof the chief culprits responsible for bad airquality is N0x, a term used to describe a mixtureof nitrogen oxides that are formed as a by-productof fossil fuel combustion. The major sources ofN0x emissions are automobiles (IC engines), andindustrial boilers and combustion turbines. Ofthe two, industrial NOX emissions are by far theeasier to control, both technically andpolitically.
The regulatory agencies appear to be taking atwo-tier approach to setting and enforcing NO,,emission standards - a relatively lax standard whenthe wind is blowing, and air pollutants are sweptaway to less densely populated parts of thecountry, and a more stringent standard when the airis stagnant, and pollutants concentrate locally.In the latter case, the agencies are empowered todeclare an "Air Quality Emergency", and to order
cut backs in industrial production in an effort toreduce N0x emission rates. (As an indication ofthe magnitude of this problem, there were 91 dayslast year in Los Angeles, and 10 days in BatonRouge, LA when the ozone levels exceeded thefederal air quality standard of 0.12 ppm [3, 4]).
The focus of this paper is to describe howexisting software tools for Economic Dispatch canbe adapted for use in mitigating the economicconsequences of industrial production curtailmentorders during an Air Quality Emergency.
A SYSTEMS VIEW OF PROCESS PLANT UTILITY SYSTEMS
Industrial plants can be thought of as beingcomposed of two distinct systems - themanufacturing process itself, and the energy supplyfacilities (often called "plant utilities")required to drive the process. Although both theprocess and utility systems generate wastes whichare subject to regulation, the majority of N0xemissions are produced by the plant utility system.(Process air emissions tend to be fugitive volatileorganic compounds used during manufacturing.)
Industrial plant utility systems can be quitecomplicated. They usually include between 3 to 5subsystems, all of which interact with one anotherto some degree (Figure 1):
Steam SubsystemFuel SubsystemElectrical Power SubsystemCompressed Air SubsystemCogeneration SubsystemRefrigeration Subsystem, andProcess Dual Drives.
RAW MATERIALS
/STEAM •,( SYSTEM
REPniQ )
PRODUCT(S)
-\ SYSTEM!
ELEC POWERAIR /'•'
( COMPR j\FUEL
Figure 1 Conventual Representation ofPlant Utiiiiy System
187

To complicate matters further, some items ofequipment fall partly into one subsystem and partlyinto another. Examples are cogeneration equipment(impacts both fuel and electrical subsystems, orsteam and electrical subsystems) and process dualdrives (steam and electrical subsystems).
Steam SubsystemPlant steam subsystem is also commonly known
as the boiler house. The steam subsystem isrequired to meet all the steam needs of theprocess, and typically comprises one or moreboilers for steam generation. The steam is thendistributed to the process via a network of steamheaders.
Within the steam subsystem there are pressurereducing valves (PRVs) to maintain the desiredheader pressures. Associated with the boilers areauxiliary equipment such as FD and ID fans, BFWpumps etc. These auxiliaries could be eitherturbine driven or motor driven. There may also bemotor or turbine spares for the auxiliaries forimproving operating reliability. Other equipmentis condensate pumps, steam heaters etc. There mayalso be backpressure and condensing steam turbinegenerators.
fuel SubsystemPlant fuel subsystem comprises a network of
fuel headers. These fuel headers may havedifferent grades of fuel or are at differentpressures. At the supply end, headers areconnected to the various external fuel suppliers;at the demand end, the headers are connected tofuel consumers in the process plants (processfurnaces, engines etc.) and to fuel consumerswithin the utility system (such as boilers, gasturbines, HRSGs etc).
Since fuel is purchased from externalsuppliers there are pay meters to totalize theincoming fuel. There are contractual agreementswith each of fuel supplier which govern the sale offuel.
Electric Power SubsystemPlant electric power subsystem comprises a
connection to the local utility grid to meet thenet power demand of the process plant. However,the trend is towards multiple contracts fordifferent types of service (e.g. firm vs.interruptible) and time-of-use rate schedules.Increasingly, therefore, there are contractualdegrees of freedom which can be exploited tominimize power cost.
Compressed Air SubsystemPlant compressed air subsystem comprises one
or more compressed air headers supplying instrumentand process air to the plant users. Each of theair compressors could be either electric, fuel orsteam driven, and in general would have a differentcapacity and operating characteristic.
Coqeneration SubsystemPlant cogeneration subsystem is also known as
the power house, comprises large gas or steamturbines generators. Gas turbines usually haveheat recovery steam generators, or HRSGs. The
steam turbines may be a combination of backpressure and condensing cycles. There usually isdedicated fuel supply to the cogen system fromlong-term fuel suppliers.
Refrigeration SubsystemPlant refrigeration subsystem comprises
several refrigerant supply and return headers. Thereturned refrigerant vapor is compressed in one ormore compressors. Each of the compressors iseither electric, fuel or steam driven, and ingeneral has a difference capacity and operatingcharacteristics. At times, the refrigerant loopsare cascaded such as in Ethylene plants which addsto the complexity of the subsystem.
Process Dual DrivesProcess dual drives are the equipment that
falls in the area between the process and theutility. While the equipment itself is serving aprocess function, the choice of drive has an impacton the utility system. More importantly, thechoice of drive is of no consequence to theoperation of the process as such, so that the drivechoice should really be determined only by theprevailing utility balance.
EXISTING TOOLS FOR OPERATION OF THE PLANT UTILITYSYSTEM
There is an important characteristic of theplant utility systems (PLUS) which is worth noting.Since the plant utility system is required to meetthe utility needs of the process under varyingoperating conditions (such as startup, shutdown andother abnormal operations) it is typically designedfor considerable operating flexibility. Thisflexibility shows up as surplus equipment in thesystem. That is to say the system will have a lotmore steam generation capacity then would be neededfor normal operation. Similarly there would beprovisions to purchase more than the typical neededamount of fuel and electric power. This means thatthere are degrees of freedom in the operation ofthe plant utility system.
Another implication is that the system may betoo overwhelming in size and complexity for oneperson to fully understand and analyze within areasonable amount of time. Therefore, thereusually are different persons assigned to theoperation of each of the major subsystems. Oneperson may be assigned to oversee the operation ofsteam generation, another one to oversee theoperation of the fuel system and for acquisition offuel from external suppliers and yet another personmay be assigned to analyze the electrical subsystemand for negotiating electrical power contracts.
The complexity in the operation of plantutility systems is well recognized. Because ofthis enormous complexity, the operations are seldomoptimized, and major opportunities for costreduction exist in the day to day operation of theplant utility system. This fact is also wellrecognized. One way to capitalize on thisopportunity is to analyze all possible options inthe operation of the PLUS at any given time anddetermine the one which operates at the minimumcost. This task cannot be done by a team of plant
188
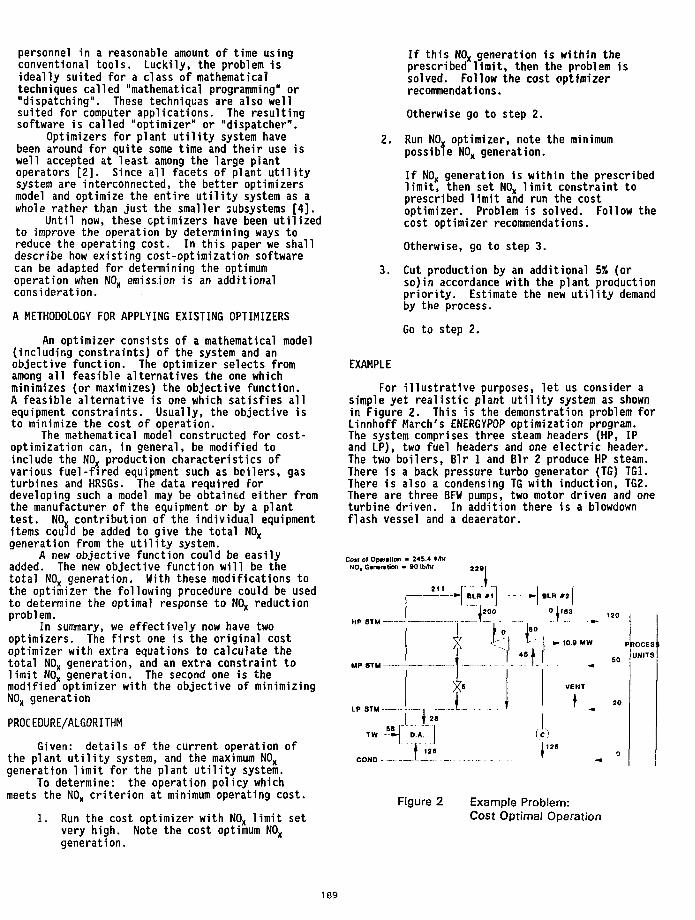
personnel in a reasonable amount of time usingconventional tools. Luckily, the problem isideally suited for a class of mathematicaltechniques called "mathematical programming" or"dispatching". These techniques are also wellsuited for computer applications. The resultingsoftware is called "optimizer" or "dispatcher".
Optimizers for plant utility system havebeen around for quite some time and their use iswell accepted at least among the large pi antoperators [2]. Since all facets of plant utilitysystem are interconnected, the better optimizersmodel and optimize the entire utility system as awhole rather than just the smaller subsystems [4],
Until now, these optimizers have been utilizedto improve the operation by determining ways toreduce the operating cost. In this paper we shalldescribe how existing cost-optimization softwarecan be adapted for determining the optimumoperation when NOX emission is an additionalconsideration.
A METHODOLOGY FOR APPLYING EXISTING OPTIMIZERS
An optimizer consists of a mathematical model(including constraints) of the system and anobjective function. The optimizer selects fromamong all feasible alternatives the one whichminimizes (or maximizes) the objective function.A feasible alternative is one which satisfies allequipment constraints. Usually, the objective isto minimize the cost of operation.
The mathematical model constructed for cost-optimization can, in general, be modified toinclude the N0x production characteristics ofvarious fuel-fired equipment such as boilers, gasturbines and HRSGs. The data required fordeveloping such a model may be obtained either fromthe manufacturer of the equipment or by a planttest. N0x contribution of the individual equipmentitems could be added to give the total N0xgeneration from the utility system.
A new objective function could be easilyadded. The new objective function will be thetotal NOX generation. With these modifications tothe optimizer the following procedure could be usedto determine the optimal response to N0x reductionproblem.
In summary, we effectively now have twooptimizers. The first one is the original costoptimizer with extra equations to calculate thetotal N0x generation, and an extra constraint tolimit N0x generation. The second one is themodified optimizer with the objective of minimizingN0x generation
PROCEDURE/ALGORITHM
Given: details of the current operation ofthe plant utility system, and the maximum N0xgeneration limit for the plant utility system.
To determine: the operation policy whichmeets the N0x criterion at minimum operating cost.
1. Run the cost optimizer with N0x limit setvery high. Note the cost optimum N0xgeneration.
If this NOX generation is within theprescribed limit, then the problem issolved. Follow the cost optimizerrecommendations.
Otherwise go to step 2.
2. Run N0x optimizer, note the minimumpossible N0x generation.
If NOX generation is within the prescribedlimit, then set N0x limit constraint toprescribed limit and run the costoptimizer. Problem is solved. Follow thecost optimizer recommendations.
Otherwise, go to step 3.
3. Cut production by an additional 5% (orso)in accordance with the plant productionpriority. Estimate the new utility demandby the process.
Go to step 2.
EXAMPLE
For illustrative purposes, let us consider asimple yet realistic plant utility system as shownin Figure 2. This is the demonstration problem forLinnhoff March's ENERGYPOP optimization program.The system comprises three steam headers (HP, IPand LP), two fuel headers and one electric header.The two boilers, Blr 1 and Blr 2 produce HP steam.There is a back pressure turbo generator (TG) TGI.There is also a condensing TG with induction, TG2.There are three BFW pumps, two motor driven and oneturbine driven. In addition there is a blowdownflash vessel and a deaerator.
Cost of OptralJon - 245.4 */hrNON Generation * 90 Ib/hr 2 2 9
HP STM
BLR * 1 • - BLR * 2
,200 0 l i B 3
•-10.0MW PDOCES ,
UNITS
Figure 2 Example Problem:Cost Optimal Operation
189
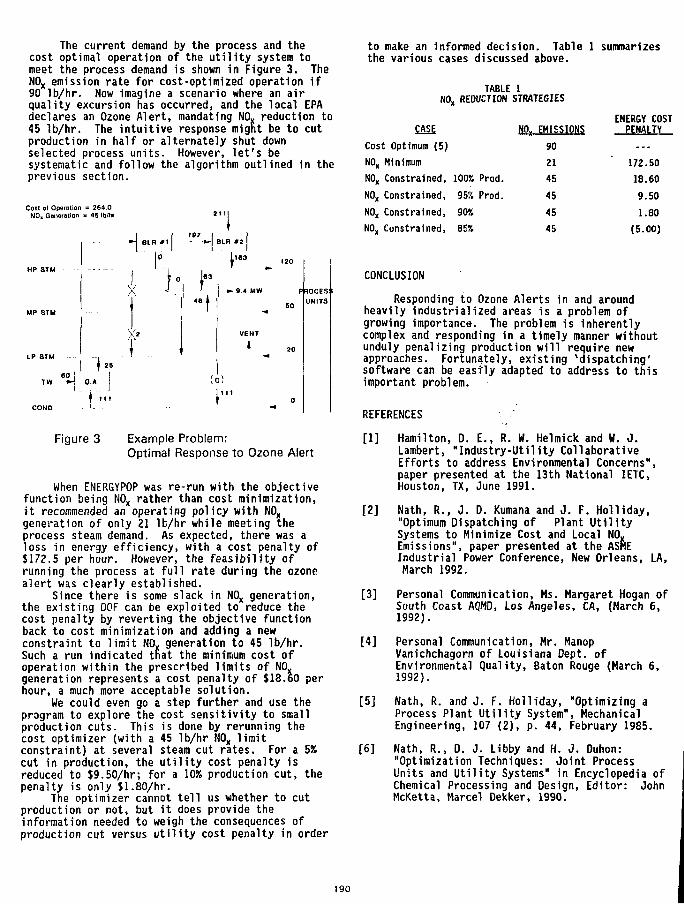
The current demand by the process and thecost optimal operation of the utility system tomeet the process demand is shown in Figure 3. TheN0x emission rate for cost-optimized operation if90 lb/hr. Now imagine a scenario where an airquality excursion has occurred, and the local EPAdeclares an Ozone Alert, mandating N0x reduction to45 Ib/hr. The intuitive response might be to cutproduction in half or alternately shut downselected process units. However, let's besystematic and follow the algorithm outlined in theprevious section.
Cost o( Operation = 264.0NO, Gunorolion > 45 ItJ.iv
to make an informed decision. Table 1 summarizesthe various cases discussed above.
I 187 |BLR * l - •" BLR *a
X2
.180 (
TW »A O.A.
Figure 3
'I!
(o)
I'1'
• UM» PROCES!
Example Problem:Optimal Response to Ozone Alert
When ENERGYPOP was re-run with the objectivefunction being N0x rather than cost minimization,it recommended an operating policy with N0xgeneration of only 21 lb/hr while meeting theprocess steam demand. As expected, there was aloss in energy efficiency, with a cost penalty of$172.5 per hour. However, the feasibility ofrunning the process at full rate during the ozonealert was clearly established.
Since there is some slack in N0x generation,the existing DOF can be exploited to reduce thecost penalty by reverting the objective functionback to cost minimization and adding a newconstraint to limit N0x generation to 45 lb/hr.Such a run indicated that the minimum cost ofoperation within the prescribed limits of N0xgeneration represents a cost penalty of $18.60 perhour, a much more acceptable solution.
We could even go a step further and use theprogram to explore the cost sensitivity to smallproduction cuts. This is done by rerunning thecost optimizer (with a 45 lb/hr N0x limit
57.constraint) at several steam cut rates. For acut in production, the utility cost penalty isreduced to $9.50/hr; for a 10% production cut, thepenalty is only $1.80/hr.
The optimizer cannot tell us whether to cutproduction or not, but it does provide theinformation needed to weigh the consequences ofproduction cut versus utility cost penalty in order
TABLEN0x REDUCTION
CASE
Cost Optimum (5)
N0x Minimum
N0x Constrained,
N0x Constrained,
N0x Constrained,
N0x Constrained,
100% Prod.
95% Prod.
90S85%
1STRATEGIES
N0x EMISSIONS
90
2145454545
ENERGY COSTPENALTY—
172.50
18.60
9.50
1.80
(5.00)
CONCLUSION
Responding to Ozone Alerts in and aroundheavily industrialized areas is a problem ofgrowing importance. The problem is inherentlycomplex and responding in a timely manner withoutunduly penalizing production will require newapproaches. Fortunately, existing ^dispatching'software can be easily adapted to address to thisimportant problem.
REFERENCES
[1] Hamilton, D. E., R. W. Helmick and W. J.Lambert, "Industry-Utility CollaborativeEfforts to address Environmental Concerns",paper presented at the 13th National I ETC,Houston, TX, June 1991.
[2] Nath, R., J. D. Kumana and J. F. Holliday,"Optimum Dispatching of Plant UtilitySystems to Minimize Cost and Local N0xEmissions", paper presented at the ASMEIndustrial Power Conference, New Orleans, LA,March 1992.
[3] Personal Communication, Ms. Margaret Hogan ofSouth Coast AQMD, Los Angeles, CA, (March 6,1992).
[4] Personal Communication, Mr. ManopVanichchagorn of Louisiana Dept. ofEnvironmental Quality, Baton Rouge (March 6,1992).
[5] Nath, R. and J. F. Holliday, "Optimizing aProcess Plant Utility System", MechanicalEngineering, 107 (2), p. 44, February 1985.
[6] Nath, R., D. J. Libby and H. J. Duhon:"Optimization Techniques: Joint ProcessUnits and Utility Systems" in Encyclopedia ofChemical Processing and Design, Editor: JohnMcKetta, Marcel Dekker, 1990.
190
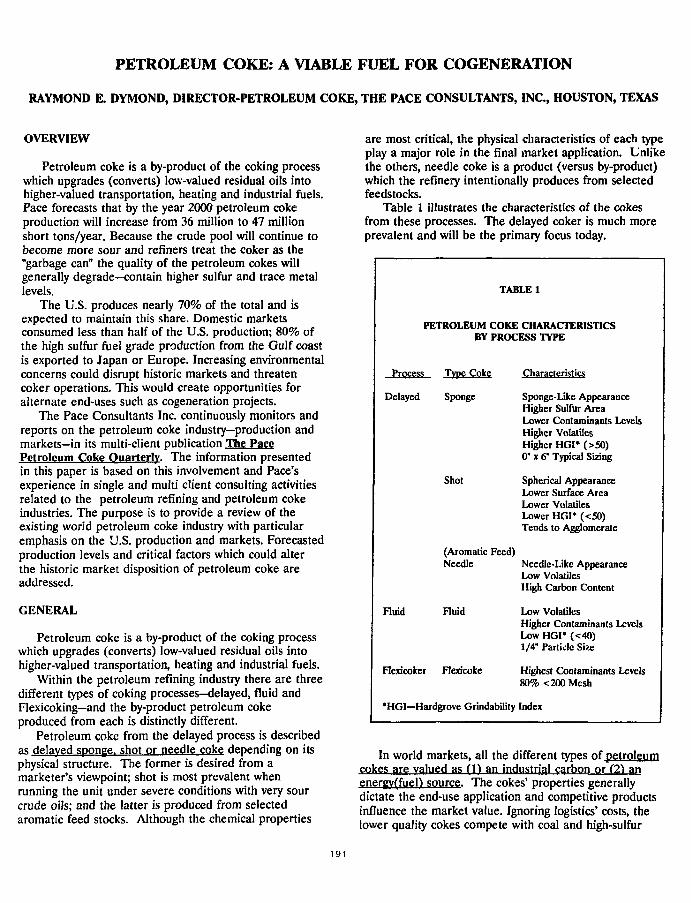
PETROLEUM COKE: A VIABLE FUEL FOR COGENERATION
RAYMOND E. DYMOND, DIRECTOR-PETROLEUM COKE, THE PACE CONSULTANTS, INC., HOUSTON, TEXAS
OVERVIEW
Petroleum coke is a by-product of the coking processwhich upgrades (converts) low-valued residual oils intohigher-valued transportation, heating and industrial fuels.Pace forecasts that by the year 2000 petroleum cokeproduction will increase from 36 million to 47 millionshort tons/year. Because the crude pool will continue tobecome more sour and refiners treat the coker as the"garbage can" the quality of the petroleum cokes willgenerally degrade—contain higher sulfur and trace metallevels.
The U.S. produces nearly 70% of the total and isexpected to maintain this share. Domestic marketsconsumed less than half of the U.S. production; 80% ofthe high sulfur fuel grade production from the Gulf coastis exported to Japan or Europe. Increasing environmentalconcerns could disrupt historic markets and threatencoker operations. This would create opportunities foralternate end-uses such as cogeneration projects.
The Pace Consultants Inc. continuously monitors andreports on the petroleum coke industry—production andmarkets—in its multi-client publication The PacePetroleum Coke Quarterly. The information presentedin this paper is based on this involvement and Pace'sexperience in single and multi client consulting activitiesrelated to the petroleum refining and petroleum cokeindustries. The purpose is to provide a review of theexisting worid petroleum coke industry with particularemphasis on the U.S. production and markets. Forecastedproduction levels and critical factors which could alterthe historic market disposition of petroleum coke areaddressed.
GENERAL
Petroleum coke is a by-product of the coking processwhich upgrades (converts) low-valued residual oils intohigher-valued transportation, heating and industrial fuels.
Within the petroleum refining industry there are threedifferent types of coking processes—delayed, fluid andFlexicoking—and the by-product petroleum cokeproduced from each is distinctly different.
Petroleum coke from the delayed process is describedas delayed sponge, shot or needle coke depending on itsphysical structure. The former is desired from amarketer's viewpoint; shot is most prevalent whenrunning the unit under severe conditions with very sourcrude oils; and the latter is produced from selectedaromatic feed stocks. Although the chemical properties
are most critical, the physical characteristics of each typeplay a major role in the final market application. Unlikethe others, needle coke is a product (versus by-product)which the refinery intentionally produces from selectedfeedstocks.
Table 1 illustrates the characteristics of the cokesfrom these processes. The delayed coker is much moreprevalent and will be the primary focus today.
TABLE 1
PETROLEUM COKE CHARACTERISTICSBY PROCESS TYPE
Process Tvne Cok,
Delayed Sponge
Shot
(AromaticNeedle
Fluid Fluid
Flcxicoker Flexicoke
; Characteristics
Sponge-Like AppearanceHigher Sulfur AreaLower Contaminants LevelsHigher VolatilesHigher HGI* (>50)0" x 6" Typical Sizing
Spherical AppearanceLower Surface AreaLower VolatilesLower HGI* (<50)Tends to Agglomerate
Feed)Needle-Like AppearanceLow VolatilesHigh Carbon Content
Low VolatilesHigher Contaminants LevelsLowHGI*(<40)1/4" Particle Size
Highest Contaminants Levels80% <200 Mesh
•HGI—Hardgrove Grindability Index
In world markets, all the different types of petroleumcokes are valued as (1} an industrial carbon or (21 anenergy(fuel) source. The cokes' properties generallydictate the end-use application and competitive productsinfluence the market value. Ignoring logistics' costs, thelower quality cokes compete with coal and high-sulfur
191
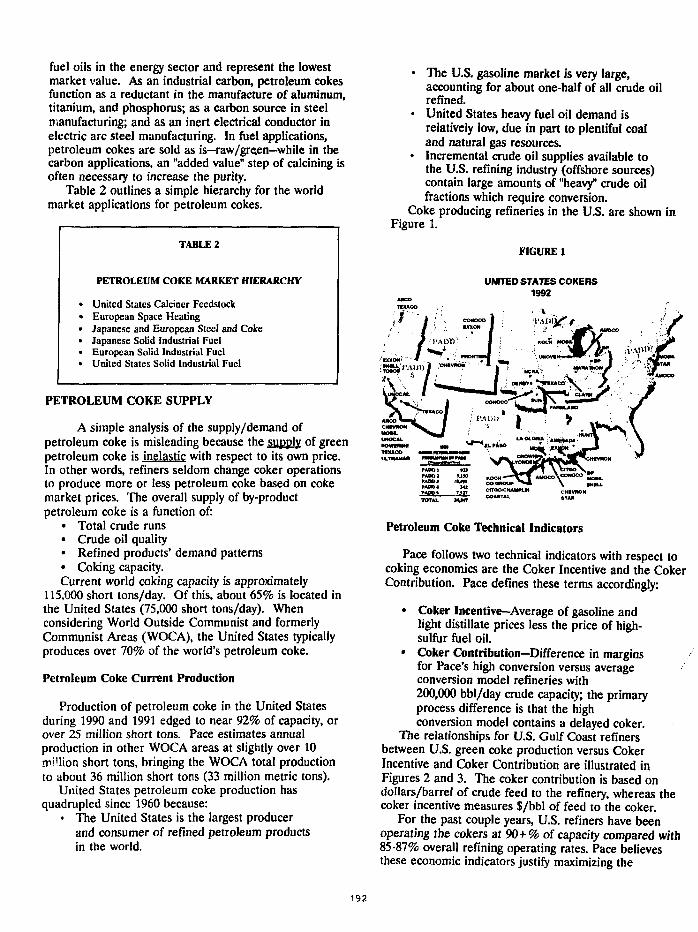
fuel oils in the energy sector and represent the lowestmarket value. As an industrial carbon, petroleum cokesfunction as a reductant in the manufacture of aluminum,titanium, and phosphorus; as a carbon source in steelmanufacturing; and as an inert electrical conductor inelectric arc steel manufacturing. In fuel applications,petroleum cokes are sold as is—raw/gre.en—while in thecarbon applications, an "added value" step of calcining isoften necessary to increase the purity.
Table 2 outlines a simple hierarchy for the worldmarket applications for petroleum cokes.
TABLE 2
PETROLEUM COKE MARKET HIERARCHY
United States Calcincr FeedstockEuropean Space HeatingJapanese and European Steel and CokeJapanese Solid Industrial FuelEuropean Solid Industrial FuelUnited States Solid Industrial Fuel
PETROLEUM COKE SUPPLY
A simple analysis of the supply /demand ofpetroleum coke is misleading because the supply of greenpetroleum coke is inelastic with respect to its own price.In other words, refiners seldom change coker operationsto produce more or less petroleum coke based on cokemarket prices. The overall supply of by-productpetroleum coke is a function of:
• Total crude runs• Crude oil quality• Refined products' demand patterns• Coking capacity.Current world coking capacity is approximately
115,000 short tons/day. Of this, about 65% is located inthe United States (75,000 short tons/day). Whenconsidering World Outside Communist and formerlyCommunist Areas (WOCA), the United States typicallyproduces over 70% of the world's petroleum coke.
Petroleum Coke Current Production
Production of petroleum coke in the United Statesduring 1990 and 1991 edged to near 92% of capacity, orover 25 million short tons. Pace estimates annualproduction in other WOCA areas at slightly over 10million short tons, bringing the WOCA total productionto about 36 million short tons (33 million metric tons).
United States petroleum coke production hasquadrupled since 1960 because:
• The United States is the largest producerand consumer of refined petroleum productsin the world.
• The U.S. gasoline market is very large,accounting for about one-half of all crude oilrefined.
• United States heavy fuel oil demand isrelatively low, due in part to plentiful coaland natural gas resources.
• Incremental crude oil supplies available tothe U.S. refining industry (offshore sources)contain large amounts of "heavy" crude oilfractions which require conversion.
Coke producing refineries in the U.S. are shown inFigure 1.
FIGURE 1
UNITED STATES COKERS1992
TOTAL MJKT
Petroleum Coke Technical Indicators
Pace follows two technical indicators with respect tocoking economics are the Coker Incentive and the CokerContribution. Pace defines these terms accordingly:
• Coker Incentive—Average of gasoline andlight distillate prices less the price of high-sulfur fuel oil.
• Coker Contribution—Difference in marginsfor Pace's high conversion versus averageconversion model refineries with200,000 bbl/day crude capacity; the primaryprocess difference is that the highconversion model contains a delayed coker.
The relationships for U.S. Gulf Coast refinersbetween U.S. green coke production versus CokerIncentive and Coker Contribution are illustrated inFigures 2 and 3. The coker contribution is based ondollars/barrel of crude feed to the refinery, whereas thecoker incentive measures $/bbl of feed to the coker.
For the past couple years, U.S. refiners have beenoperating the cokers at 90+% of capacity compared with85-87% overall refining operating rates. Pace believesthese economic indicators justify maximizing the
192
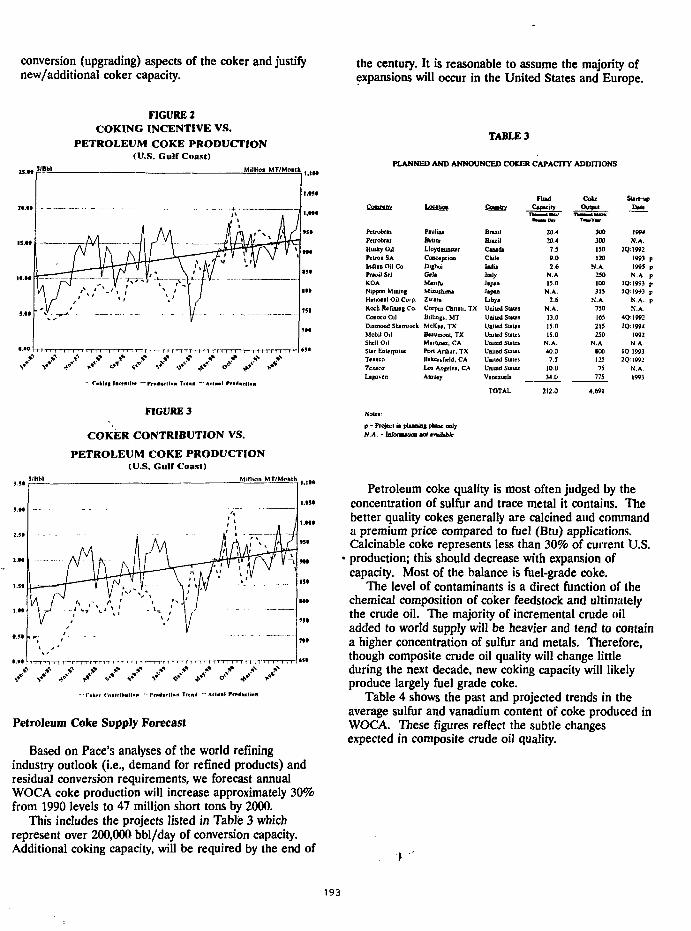
conversion (upgrading) aspects of the coker and justifynew/additional coker capacity.
the century. It is reasonable to assume the majority ofexpansions will occur in the United States and Europe.
FIGURE 2COKING INCENTIVE VS.
PETROLEUM COKE PRODUCTION(U.S. Guir Coast)
5 „ 'B°l Million MT/Moma ,
FIGURE 3
COKER CONTRIBUTION VS.
PETROLEUM COKE PRODUCTION(U.S. GuUCoast)
Million MT/Mohlh ,
* * f*' *•*' r V <,•" *'-' %*•' « / **' <f * * ' * *
Petroleum Coke Supply Forecast
Based on Pace's analyses of the world refiningindustry outlook (i.e., demand for refined products) andresidual conversion requirements, we forecast annualWOCA coke production will increase approximately 30%from 1990 levels to 47 million short tons by 2000.
This includes the projects listed in Table 3 whichrepresent over 200,000 bbl/day of conversion capacity.Additional coking capacity, will be required by the end of
TABLE 3
PLANNED AND ANNOUNCED COKER CAPACITY ADDITIONS
Comwnv
PetrobraiPetrobmHusky OilPetiox SAIndiu Oil Co.P«oi) SriKOA
Nippon MiningHmooil Oil Corp.Koch Re fuiing Co.Conoco OilDumond ShimiockMobil O,lShell OilStir EnterpriseTexacoTCJUCO
Ugoven
PaulinaBetimLloydnunsterCooctpcionDigboiCelaManfuMizushimaZwaraCorpus Chniti, TXBillings. MTMcKee. TXBeaumont, TXMartinez. CAPort Arthur, TXBakersficld. CALos Angele*, CAAmu»y
Coiaatrv
BrazilBrazilCanada
CbileIndia
Ita)>
Japan
Japan
Libya
United Stales
United States
United States
Umusd Stales
United Slates
United States
United States
United States
Venezuela
HudCapacity
20.4
M.47.59 0
2.6N.A
15.0
N.A.
2.6N.A.13.015.015.0
N.A.40.0
7.5
10.0340
Coke
300
300150120
N.A.250I0O
315
N.A.750165215250
N.A
100
125
75
775
Start-up
Dale
I9M
N.A.2Q:1992
1993 p1995 pN.A p
1Q1993 pIQ 1993 p
N.A. pN.A
4(3:19922Q; 1994
1992N.A.
10 19932Q:1992
N.A1993
4.691
p - Project is pluniaf pkuc onlyN.A. - lnformiUOD «ot ivtilable
Petroleum coke quality is most often judged by theconcentration of sulfur and trace metal it contains. Thebetter quality cokes generally are calcined and commanda premium price compared to fuel (Btu) applications.Calcinable coke represents less than 30% of current U.S.
• production; this should decrease with expansion ofcapacity. Most of the balance is fuel-grade coke.
The level of contaminants is a direct function of thechemical composition of coker feedstock and ultimatelythe crude oil. The majority of incremental crude oiladded to world supply will be heavier and tend to containa higher concentration of sulfur and metals. Therefore,though composite crude oil quality will change littleduring the next decade, new coking capacity will likelyproduce largely fuel grade coke.
Table 4 shows the past and projected trends in theaverage sulfur and vanadium content of coke produced inWOCA. These figures reflect the subtle changesexpected in composite crude oil quality.
r
193
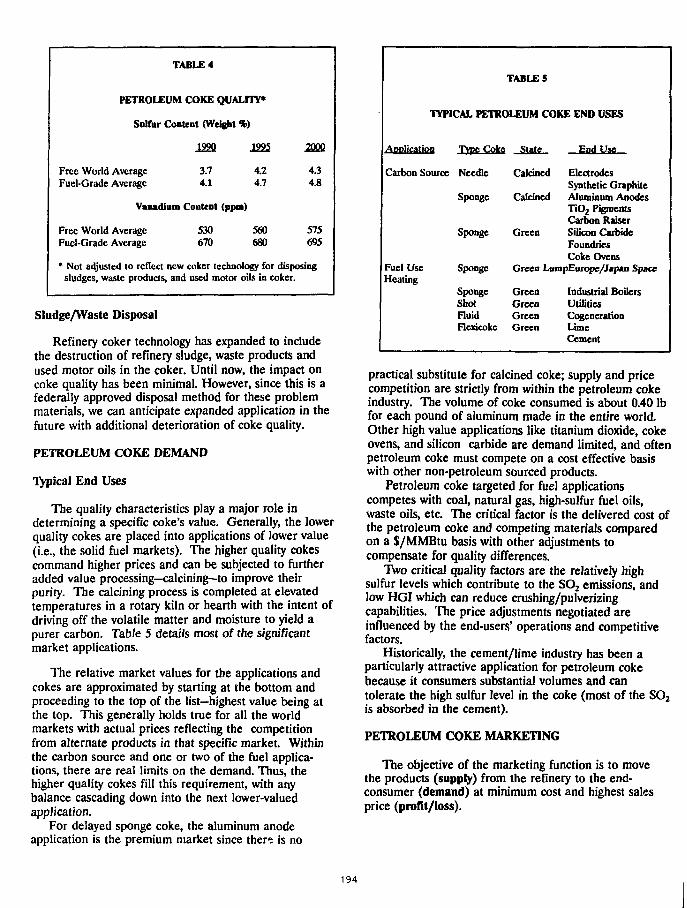
TABLE 4
PETROLEUM COKE QUALITY*
Sulfur Content (Weight %)
1990 1995
Free World Average 3.7 4.2Fuel-Grade Average 4.1 4.7
Vanadium Content (ppa)
Free World Average 530 560Fuel-Grade Average 670 680
2000
4.34.8
575695
* Not adjusted to reflect new coker technology for disposingsludges, waste products, and used motor oils in colcer.
Sludge/Waste Disposal
Refinery coker technology has expanded to includethe destruction of refinery sludge, waste products andused motor oils in the coker. Until now, the impact oncoke quality has been minimal. However, since this is afederally approved disposal method for these problemmaterials, we can anticipate expanded application in thefuture with additional deterioration of coke quality.
PETROLEUM COKE DEMAND
Typical End Uses
The quality characteristics play a major role indetermining a specific coke's value. Generally, the lowerquality cokes are placed into applications of lower value(i.e., the solid fuel markets). The higher quality cokescommand higher prices and can be subjected to furtheradded value processing—calcining—to improve theirpurity. The calcining process is completed at elevatedtemperatures in a rotary kiln or hearth with the intent ofdriving off the volatile matter and moisture to yield apurer carbon. Table 5 details most of the significantmarket applications.
The relative market values for the applications andcokes are approximated by starting at the bottom andproceeding to the top of the list—highest value being atthe top. This generally holds true for all the worldmarkets with actual prices reflecting the competitionfrom alternate products in that specific market. Withinthe carbon source and one or two of the fuel applica-tions, there are real limits on the demand. Thus, thehigher quality cokes fill this requirement, with anybalance cascading down into the next lower-valuedapplication.
For delayed sponge coke, the aluminum anodeapplication is the premium market since there is no
TABLE 5
TYPICAL PETROLEUM COKE END USES
Application Tvpc Coke Slate
Carbon Source Needle
Sponge
Sponge
Fuel Use SpongeHeating
SpongeShotFluidFlcxicoke
Calcined
Calcined
Green
End Use
ElectrodesSynthetic GraphiteAluminum AnodesTiO2 PigmentsCarbon RaiserSilicon CarbideFoundriesCoke Ovens
Green LumpEurope/Jap*n Space
GreenGreenGreenGreen
Industrial BoilersUtilitiesCogenerationLimeCement
practical substitute for calcined coke; supply and pricecompetition are strictly from within the petroleum cokeindustry. The volume of coke consumed is about 0.40 lbfor each pound of aluminum made in the entire world.Other high value applications like titanium dioxide, cokeovens, and silicon carbide are demand limited, and oftenpetroleum coke must compete on a cost effective basiswith other non-petroleum sourced products.
Petroleum coke targeted for fuel applicationscompetes with coal, natural gas, high-sulfur fuel oils,waste oils, etc. The critical factor is the delivered cost ofthe petroleum coke and competing materials comparedon a $/MMBtu basis with other adjustments tocompensate for quality differences.
Two critical quality factors are the relatively highsulfur levels which contribute to the SO2 emissions, andlow HGI which can reduce crushing/pulverizingcapabilities. The price adjustments negotiated areinfluenced by the end-users' operations and competitivefactors.
Historically, the cement/lime industry has been aparticularly attractive application for petroleum cokebecause it consumers substantial volumes and cantolerate the high sulfur level in the coke (most of the SO2is absorbed in the cement).
PETROLEUM COKE MARKETING
The objective of the marketing function is to movethe products (supply) from the refinery to the end-consumer (demand) at minimum cost and highest salesprice (profit/loss).
194
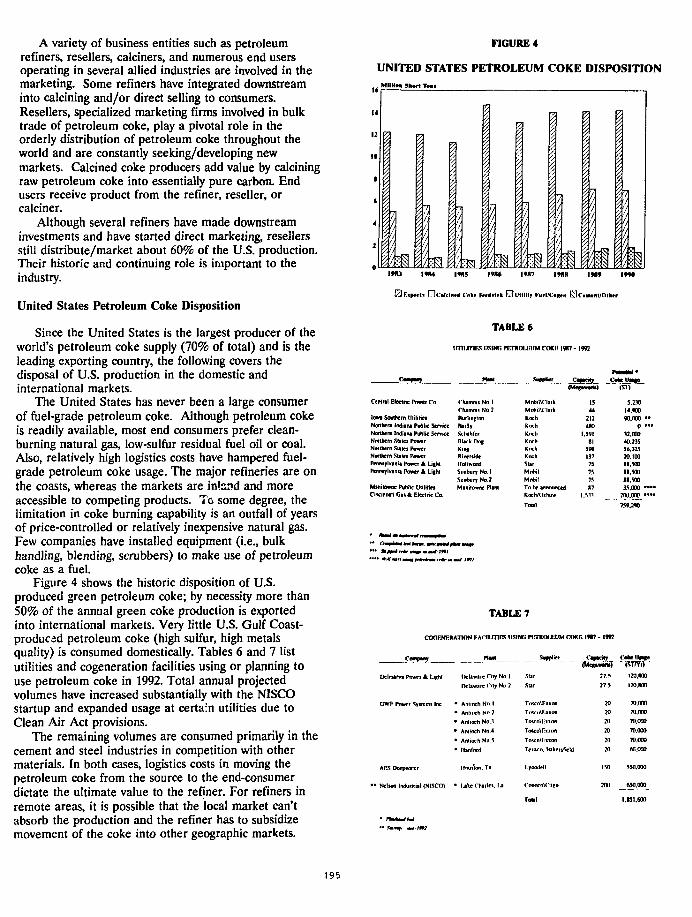
A variety of business entities such as petroleumrefiners, resellers, calciners, and numerous end usersoperating in several allied industries are involved in themarketing. Some refiners have integrated downstreaminto calcining and/or direct selling to consumers.Resellers, specialized marketing firms involved in bulktrade of petroleum coke, play a pivotal role in theorderly distribution of petroleum coke throughout theworld and are constantly seeking/developing newmarkets. Calcined coke producers add value by calciningraw petroleum coke into essentially pure carbon. Endusers receive product from the refiner, reseller, orcalciner.
Although several refiners have made downstreaminvestments and have started direct marketing, resellersstill distribute/market about 60% of the U.S. production.Their historic and continuing role is important to theindustry.
United States Petroleum Coke Disposition
Since the United States is the largest producer of theworld's petroleum coke supply (70% of total) and is theleading exporting country, the following covers thedisposal of U.S. production in the domestic andinternational markets.
The United States has never been a large consumerof fuel-grade petroleum coke. Although petroleum cokeis readily available, most end consumers prefer clean-burning natural gas, low-sulfur residual fuel oil or coal.Also, relatively high logistics costs have hampered fuel-grade petroleum coke usage. The major refineries are onthe coasts, whereas the markets are intend and moreaccessible to competing products. To some degree, thelimitation in coke burning capability is an outfall of yearsof price-controlled or relatively inexpensive natural gas.Few companies have installed equipment (i.e., bulkhandling, blending, scrubbers) to make use of petroleumcoke as a fuel.
Figure 4 shows the historic disposition of U.S.produced green petroleum coke; by necessity more than50% of the annual green coke production is exportedinto international markets. Very little U.S. Gulf Coast-produced petroleum coke (high sulfur, high metalsquality) is consumed domestically. Tables 6 and 7 listutilities and cogeneration facilities using or planning touse petroleum coke in 1992. Total annual projectedvolumes have increased substantially with the NISCOstartup and expanded usage at certain utilities due toClean Air Act provisions.
The remaining volumes are consumed primarily in thecement and steel industries in competition with othermaterials. In both cases, logistics costs in moving thepetroleum coke from the source to the end-consumerdictate the ultimate value to the refiner. For refiners inremote areas, it is possible that the local market can'tabsorb the production and the refiner has to subsidizemovement of the coke into other geographic markets.
FIGURE 4
UNITED STATES PETROLEUM COKE DISPOSITIONMIIHMI 5*)«rt Ttm*
ri Coke Fer4i1nh rTIl!iillir tuH/C«x*n fTlc.«*n1,<Olh«r
Certral EJecthc Power Co.
I w t Southern UtilitiesNorthern Indiana Public ServiceNorthern Indiana Puhlic ServiceNorthern Staiet PowerNorthern Siaiei PowerNorthern State* PowerPennsylvania Power A U|hlPenniylvinit Power A Lifh<
Mtnihnmc Public UtilitiesCincinnati Gal A Electric Co.
TABLE 6
tmunis USING pfrntoi j-iiM OOKH IW7 -1992
Mart Supplier Caa»cii|
Chamois No 1Chamois No. 2RufiinptonBaillySchahferRlack DogKM*RivmideIfotiwondiwriu^p NO' 1
Sunhury No. 2Manitownc Plant
MnhiUCIarkMohinciatkKnchKnchKochKnchKochKochStarMnhilMnhil
(Megawatla)
1544
2124 M
1.591SI
591137757575
To he announced H7Knch/Oihow 1.511
P M t M U *
(SI)
3.2W14.90090.000
0.-.2.00040.23556.3252O.1D011.500
11.50011.50035.000
200.000
TABLE 7
coGFjfERATioN i:Arn.rnns usfwi pinntni.nuM COKR IW7 -1992
rum
Oelmarva Power A Ijghl
GWP Power Systemi Inc
AES DeepwaTct
Nelson Industrial (NISCO)
Delaware City No 1
DctawateCily No 2
Anitoch No 1
AnroKh No 2
Aniifxh No.! 1
Antioch No 4 1
Anitoch Nn.5 1
llanford 1
tar
tar
r«co\r»on
MxaW.xran
oKo\Fnnn
oKnVliinn
eiico. llakersfietd
llnution. T» l.yowlcil
U k e Chaile*. l-a Ccmoco\Cti|;o
Tokl
27.5
27 5
20
20
20202020
ISO
20(1
120.M10
I2O.HO0
70.00T
7H.000
70.000
70.000
70.000
6C.O0O
550.000
_ M W I M
I.U1.600
195
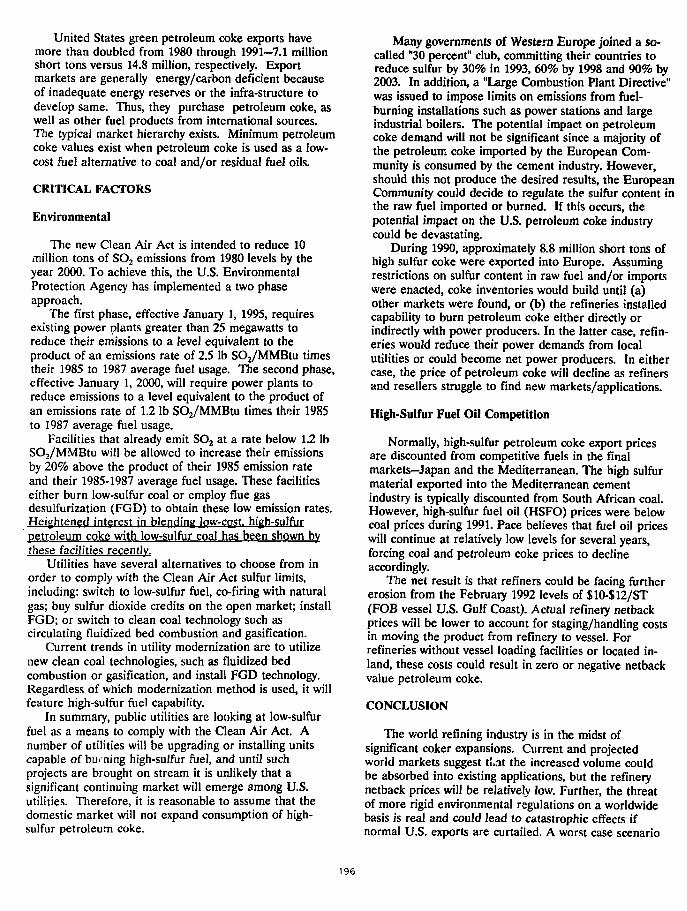
United States green petroleum coke exports havemore than doubled from 1980 through 1991—7.1 millionshort tons versus 14.8 million, respectively. Exportmarkets are generally energy/carbon deficient becauseof inadequate energy reserves or the infra-structure todevelop same. Thus, they purchase petroleum coke, aswell as other fuel products from international sources.The typical market hierarchy exists. Minimum petroleumcoke values exist when petroleum coke is used as a low-cost fuel alternative to coal and/or residual fuel oils.
CRITICAL FACTORS
Environmental
The new Clean Air Act is intended to reduce 10million tons of SO2 emissions from 1980 levels by theyear 2000. To achieve this, the U.S. EnvironmentalProtection Agency has implemented a two phaseapproach.
The first phase, effective January 1, 1995, requiresexisting power plants greater than 25 megawatts toreduce their emissions to a level equivalent to theproduct of an emissions rate of 2.5 lb SO2/MMBtu timestheir 1985 to 1987 average fuel usage. The second phase,effective January 1, 2000, will require power plants toreduce emissions to a level equivalent to the product ofan emissions rate of 1.2 lb SO2/MMBtu times their 1985to 1987 average fuel usage.
Facilities that already emit SO2 at a rate below 1.2 lbSO2/MMBtu will be allowed to increase their emissionsby 20% above the product of their 1985 emission rateand their 1985-1987 average fuel usage. These facilitieseither burn low-sulfur coal or employ flue gasdesulfurization (FGD) to obtain these low emission rates.Heightened interest in blending low-cost, high-sulfurpetroleum coke with low-sulfur coal has been shown bythese facilities recently.
Utilities have several alternatives to choose from inorder to comply with the Clean Air Act sulfur limits,including: switch to low-sulfur fuel, co-firing with naturalgas; buy sulfur dioxide credits on the open market; installFGD; or switch to clean coal technology such ascirculating fluidized bed combustion and gasification.
Current trends in utility modernization are to utilizenew clean coal technologies, such as fluidized bedcombustion or gasification, and install FGD technology.Regardless of which modernization method is used, it willfeature high-sulfur fuel capability.
In summary, public utilities are looking at low-sulfurfuel as a means to comply with the Clean Air Act. Anumber of utilities will be upgrading or installing unitscapable of burning high-sulfur fuel, and until suchprojects are brought on stream it is unlikely that asignificant continuing market will emerge among U.S.utilities. Therefore, it is reasonable to assume that thedomestic market will not expand consumption of high-sulfur petroleum coke.
Many governments of Western Europe joined a so-called "30 percent" club, committing their countries toreduce sulfur by 30% in 1993, 60% by 1998 and 90% by2003. In addition, a "Large Combustion Plant Directive"was issued to impose limits on emissions from fuel-burning installations such as power stations and largeindustrial boilers. The potential impact on petroleumcoke demand will not be significant since a majority ofthe petroleum coke imported by the European Com-munity is consumed by the cement industry. However,should this not produce the desired results, the EuropeanCommunity could decide to regulate the sulfur content inthe raw fuel imported or burned. If this occurs, thepotential impact on the U.S. petroleum coke industrycould be devastating.
During 1990, approximately 8.8 million short tons ofhigh sulfur coke were exported into Europe. Assumingrestrictions on sulfur content in raw fuel and/or importswere enacted, coke inventories would build until (a)other markets were found, or (b) the refineries installedcapability to burn petroleum coke either directly orindirectly with power producers. In the latter case, refin-eries would reduce their power demands from localutilities or could become net power producers. In eithercase, the price of petroleum coke will decline as refinersand resellers struggle to find new markets/applications.
High-Sulfur Fuel Oil Competition
Normally, high-sulfur petroleum coke export pricesare discounted from competitive fuels in the finalmarkets—Japan and the Mediterranean. The high sulfurmaterial exported into the Mediterranean cementindustry is typically discounted from South African coal.However, high-sulfur fuel oil (HSFO) prices were belowcoal prices during 1991. Pace believes that fuel oil priceswill continue at relatively low levels for several years,forcing coal and petroleum coke prices to declineaccordingly.
The net result is that refiners could be facing furthererosion from the February 1992 levels of $10-$12/ST(FOB vessel U.S. Gulf Coast). Actual refinery netbackprices will be lower to account for staging/handling costsin moving the product from refinery to vessel. Forrefineries without vessel loading facilities or located in-land, these costs could result in zero or negative netbackvalue petroleum coke.
CONCLUSION
The world refining industry is in the midst ofsignificant coker expansions. Current and projectedworld markets suggest t!.at the increased volume couldbe absorbed into existing applications, but the refinerynetback prices will be relatively low. Further, the threatof more rigid environmental regulations on a worldwidebasis is real and could lead to catastrophic effects ifnormal U.S. exports are curtailed. A worst case scenario
196

would be reduced exports, inventory build at refinery,and eventual disruption of coker operations. Short of thissituation, the refinery would subsidize removal of cokefrom the refinery, but eventually an environmentallyacceptable method for disposing of the petroleum cokewould be necessary. Given the current sulfur and tracemetals levels and the projected increases in fuel gradepetroleum cokes, regeneration projects utilizingpetroleum coke with fluidized bed combustion orgasification technology appear attractive and viable.
Although there is an economic advantage ofcogeneration using natural gas) potential problems:liability of building inventories of an environmentallysensitive material and/or lost upgrading revenuesresulting from curtailed coker operations are far moreimportant to the oil companies than supplying natural gasto cogeneration facilities. Even the value of thepetroleum coke becomes insignificant. For example, a40,000 bbl/day coker might produce 2,400 ST/day ofcoke. At a Coker Incentive of $15/bbl of feed and cokenetback price of S10/ST, the gross operating revenuesare approximately $600,000/day while the coke's value is$24,000/day.
Utilities probably will not seize the opportunity—itwill be up to the Independent Power Producers todevelop creative projects which minimize the refiner'sfuture exposure-guarantees prompt removal andacceptable disposal of the coke.
197

VOC EMISSION CONTROL WITH THE BRAYTON CYCLE PILOTPLANT OPERATIONS
(Abstract Only)Joseph C. Enneking. NUCON International, Inc., Columbus, OH
\ mobile pilot plant capable of removing VOCemissiuns from exhaust air streams was cooperatively funded bySCE, EPRI, 3M, and NUCON. Valuable information aboutthe process and the recovery operation has been gained byperforming tests at a number of industrial sites. Process designdata has been developed. Solvent has been recovered andtested for purity methods to avoid freeze-up. Economicanalyses have been made. A summary of the informationgenerated will be presented.
198
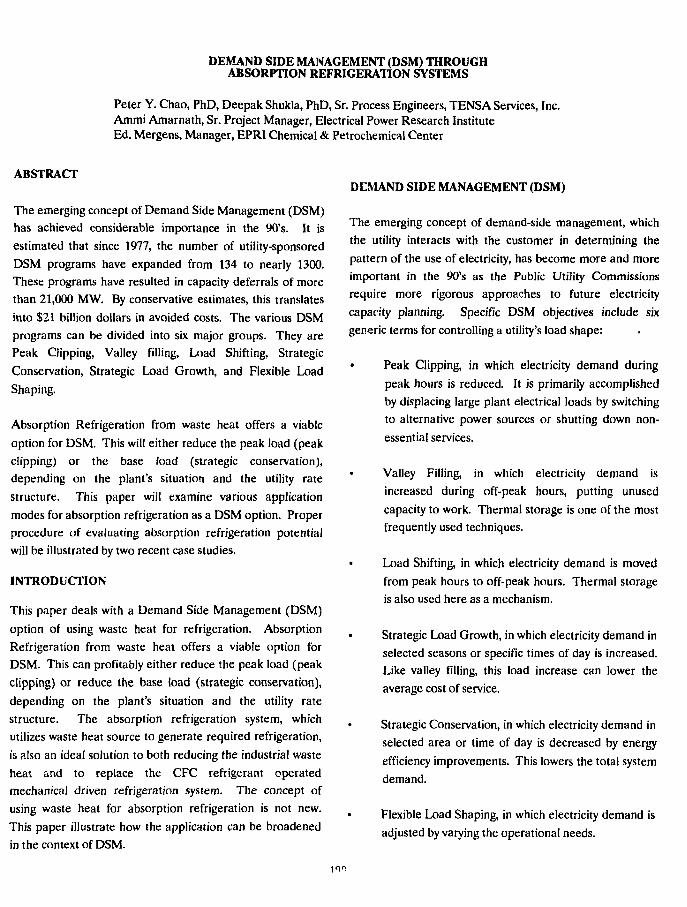
DEMAND SIDE MANAGEMENT (DSM) THROUGHABSORPTION REFRIGERATION SYSTEMS
Peter Y. Chao, PhD, Deepak Shukla, PhD, Sr. Process Engineers, TENSA Services, Inc.Ammi Amarnath, Sr. Project Manager, Electrical Power Research InstituteEd. Mergens, Manager, EPRI Chemical & Petrochemical Center
ABSTRACT
The emerging concept of Demand Side Management (DSM)has achieved considerable importance in the 90's. It isestimated that since 1977, the number of utility-sponsoredDSM programs have expanded from 134 to nearly 1300.These programs have resulted in capacity deferrals of morethan 21,000 MW. By conservative estimates, this translatesinto $21 billion dollars in avoided costs. The various DSMprograms can be divided into six major groups. They arePeak Clipping, Valley filling, Load Shifting, StrategicConservation, Strategic Load Growth, and Flexible LoadShaping.
Absorption Refrigeration from waste heat offers a viableoption for DSM. This will either reduce the peak load (peakclipping) or the base load (strategic conservation),depending on the plant's situation and the utility ratestructure. This paper will examine various applicationmodes for absorption refrigeration as a DSM option. Properprocedure of evaluating absorption refrigeration potentialwill be illustrated by two recent case studies.
INTRODUCTION
This paper deals with a Demand Side Management (DSM)option of using waste heat for refrigeration. AbsorptionRefrigeration from waste heat offers a viable option forDSM. This can profitably either reduce the peak load (peakclipping) or reduce the base load (strategic conservation),depending on the plant's situation and the utility ratestructure. The absorption refrigeration system, whichutilizes waste heat source to generate required refrigeration,is also an ideal solution to both reducing the industrial wasteheat and to replace the CFC refrigerant operatedmechanical driven refrigeration system. The concept ofusing waste heat for absorption refrigeration is not new.This paper illustrate how the application can be broadenedin the context of DSM.
DEMAND SIDE MANAGEMENT (DSM)
The emerging concept of demand-side management, whichthe utility interacts with the customer in determining thepattern of the use of electricity, has become more and moreimportant in the 90's as the Public Utility Commissionsrequire more rigorous approaches to future electricitycapacity planning. Specific DSM objectives include sixgeneric terms for controlling a utility's load shape:
• Peak Clipping, in which electricity demand duringpeak hours is reduced. It is primarily accomplishedby displacing large plant electrical loads by switchingto alternative power sources or shutting down non-essential services.
Valley Filling, in which electricity demand isincreased during off-peak hours, putting unusedcapacity to work. Thermal storage is one of the mostfrequently used techniques.
• Load Shifting, in which electricity demand is movedfrom peak hours to off-peak hours. Thermal storageis also used here as a mechanism.
Strategic Load Growth, in which electricity demand inselected seasons or specific times of day is increased.Like valley filling, this load increase can lower theaverage cost of service.
Strategic Conservation, in which electricity demand inselected area or time of day is decreased by energyefficiency improvements. This lowers the total systemdemand.
• Flexible Load Shaping, in which electricity demand isadjusted by varying the operational needs.
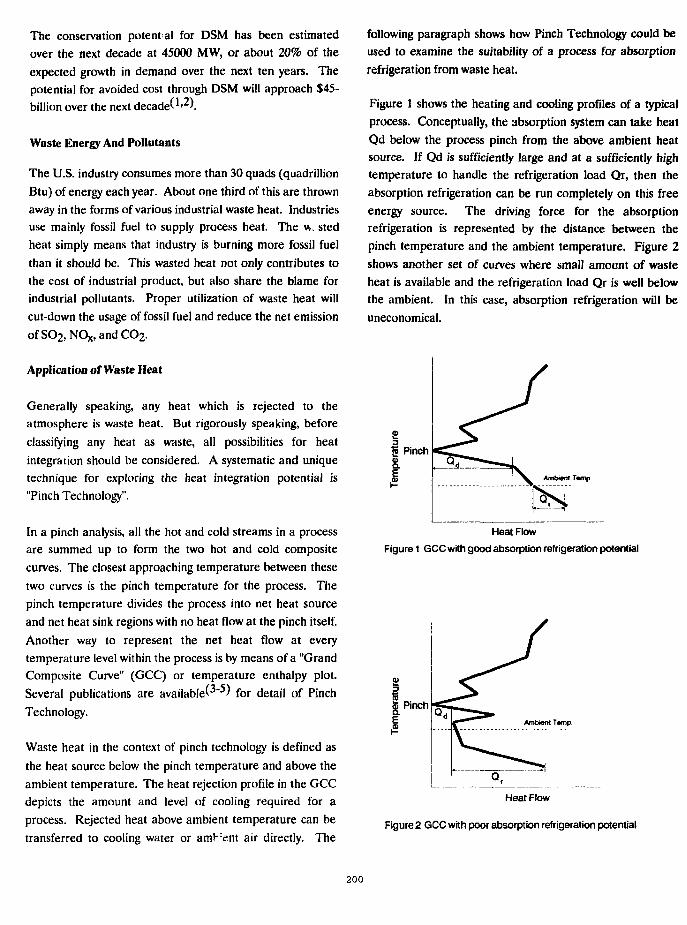
The conservation potent al for DSM has been estimatedover the next decade at 45000 MW, or about 20% of theexpected growth in demand over the next ten years. Thepotential for avoided cost through DSM will approach $45-billion over the next decade^1'2).
Waste Energy And Pollutants
The U.S. industry consumes more than 30 quads (quadrillionBtu) of energy each year. About one third of this are thrownaway in the forms of various industrial waste heat. Industriesuse mainly fossil fuel to supply process heat. The v>. stedheat simply means that industry is burning more fossil fuelthan it should be. This wasted heat not only contributes tothe cost of industrial product, but also share the blame forindustrial pollutants. Proper utilization of waste heat willcut-down the usage of fossil fuel and reduce the net emissionofSC>2,
Application of Waste Heat
Generally speaking, any heat which is rejected to theatmosphere is waste heat. But rigorously speaking, beforeclassifying any heat as waste, all possibilities for heatintegration should be considered. A systematic and uniquetechnique for exploring the heat integration potential is"Pinch Technology".
In a pinch analysis, all the hot and cold streams in a processare summed up to form the two hot and cold compositecurves. The closest approaching temperature between thesetwo curves is the pinch temperature for the process. Thepinch temperature divides the process into net heat sourceand net heat sink regions with no heat flow at the pinch itself.Another way to represent the net heat flow at everytemperature level within the process is by means of a "GrandComposite Curve" (GCC) or temperature enthalpy plot.Several publications are available^ ) for detail of PinchTechnology.
Waste heat in the context of pinch technology is defined asthe heat source below the pinch temperature and above theambient temperature. The heat rejection profile in the GCCdepicts the amount and level of cooling required for aprocess. Rejected heat above ambient temperature can betransferred to cooling water or amh:e,nt air directly. The
following paragraph shows how Pinch Technology could beused to examine the suitability of a process for absorptionrefrigeration from waste heat.
Figure 1 shows the heating and cooling profiles of a typicalprocess. Conceptually, the absorption system can take heatQd below the process pinch from the above ambient heatsource. If Qd is sufficiently large and at a sufficiently hightemperature to handle the refrigeration load Qr, then theabsorption refrigeration can be run completely on this freeenergy source. The driving force for the absorptionrefrigeration is represented by the distance between thepinch temperature and the ambient temperature. Figure 2shows another set of curves where small amount of wasteheat is available and the refrigeration load Qr is well belowthe ambient. In this case, absorption refrigeration will beuneconomical.
Heat Flow
Figure 1 GCC with good absorption refrigeration potential
Pinch
Heat Flow
Figure 2 GCC with poor absorption refrigeration potential
200
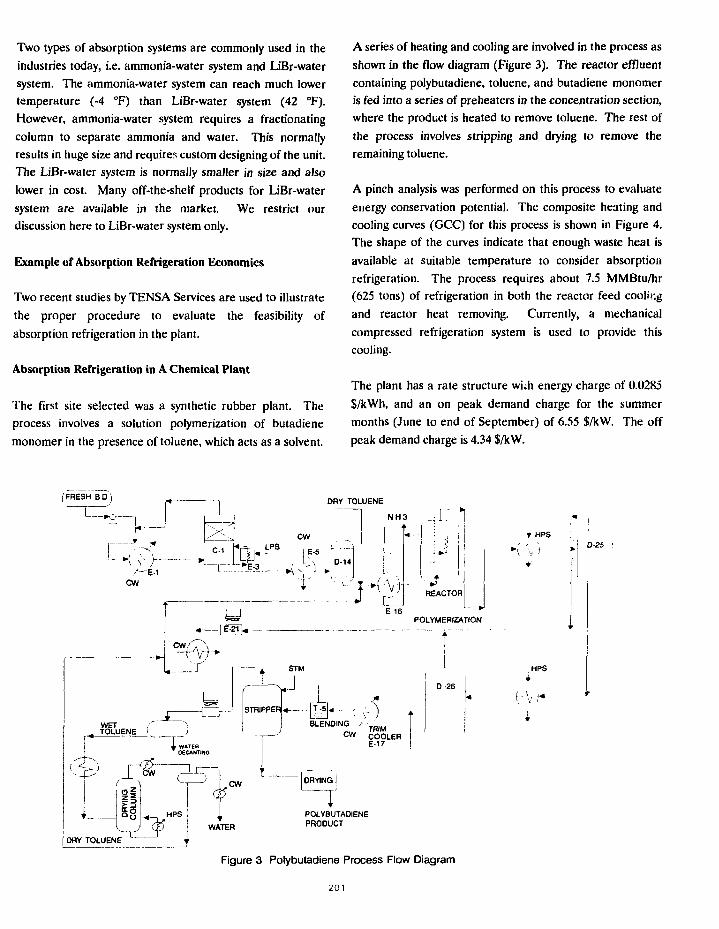
Two types of absorption systems are commonly used in theindustries today, i.e. ammonia-water system and LiBr-watersystem. The ammonia-water system can reach much lowertemperature (-4 °F) than LiBr-water system (42 °F).However, ammonia-water system requires a fractionatingcolumn to separate ammonia and water. This normallyresults in huge size and requires custom designing of the unit.The LiBr-water system is normally smaller in size and alsolower in cost. Many off-the-shelf products for LiBr-watersystem are available in the market. We restrict ourdiscussion here to LiBr-water system only.
Example of Absorption Refrigeration Economics
Two recent studies by TENSA Services are used to illustratethe proper procedure to evaluate the feasibility ofabsorption refrigeration in the plant.
Absorption Refrigeration in A Chemical Plant
The first site selected was a synthetic rubber plant. Theprocess involves a solution polymerization of butadienemonomer in the presence of toluene, which acts as a solvent.
A series of heating and cooling are involved in the process asshown in the flow diagram (Figure 3). The reactor effluentcontaining polybutadiene, toluene, and butadiene monomeris fed into a series of preheaters in the concentration section,where the product is heated to remove toluene. The rest ofthe process involves stripping and drying to remove theremaining toluene.
A pinch analysis was performed on this process to evaluateenergy conservation potential. The composite heating andcooling curves (GCC) for this process is shown in Figure 4.The shape of the curves indicate that enough waste heat isavailable at suitable temperature to consider absorptionrefrigeration. The process requires about 7.5 MMBtu/hr(625 tons) of refrigeration in both the reactor feed coolingand reactor heat removing. Currently, a mechanicalcompressed refrigeration system is used to provide thiscooling.
The plant has a rate structure wi;h energy charge of 0.0285$/kWh, and an on peak demand charge for the summermonths (June to end of September) of 6.55 $/kW. The offpeak demand charge is 4.34 $/kW.
i FRESH B D I
JDRY TOLUENE
f y J _,+- E-1
cw
CW
E-5D-14
NH3
LIE 16
•5 l !•; nj
REACTORi
-COD*POLYMERIZATION
STM
STRIPPER
BLENDING , m u
c w COOLERE17C O LE17
D-26
CW " TORYING!
WATER
POLYBUTADIENEPRODUCT
| DRY TOLUENE '
Figure 3 Polybutadiene Process Flow Diagram
t HPS :0 2 5
201
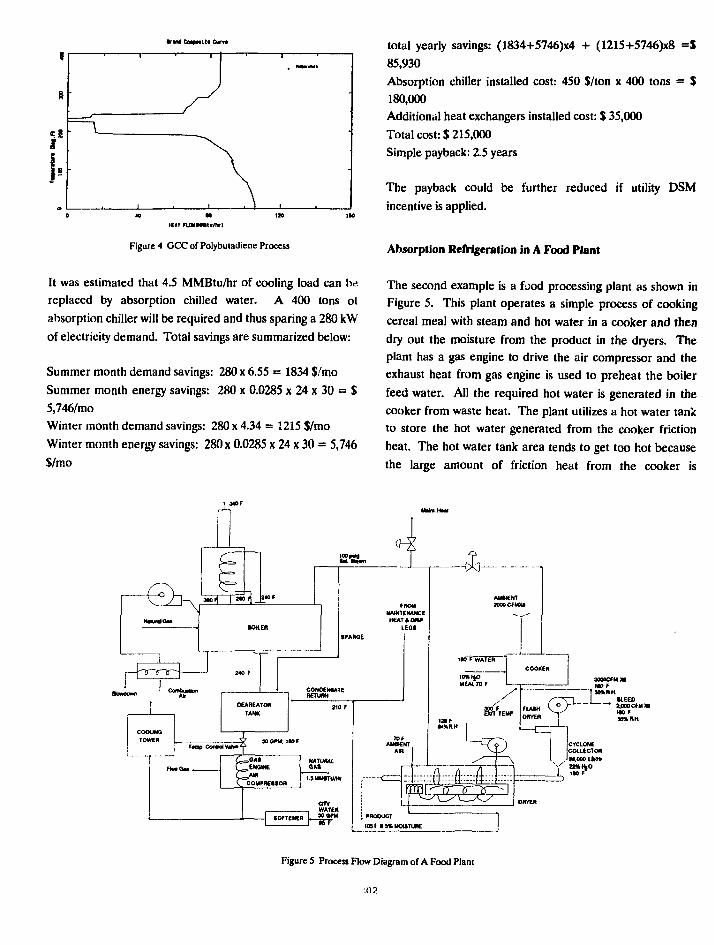
9
S
r
001 0
•rtntf Co*Mttfl Curvt
y, iwwnwi
•
« M FUMffMtu/ftr)
Figure 4 GCC of Polybuladiene Process
It was estimated that 4.5 MMBtu/hr of cooling load can be.replaced by absorption chilled water. A 400 tons olabsorption chiller will be required and thus sparing a 280 kWof electricity demand. Total savings are summarized below:
Summer month demand savings: 280 x 6.55 = 1834 %!tna
Summer month energy savings: 280 x 0.0285 x 24 x 30 = $5,746/mo
Winter month demand savings: 280 x 4.34 = 1215 {/moWinter month energy savings: 280 x 0.0285 x 24 x 30 = 5,746$/mo
total yearly savings: (1834+5746)x4 + (1215+5746)x8 =$85,930Absorption chiller installed cost: 450 S/ton x 400 tons = $180,000Additional heat exchangers installed cost: $ 35,000Total cost: $ 215,000
Simple payback: 2.5 years
The payback could be further reduced if utility DSMincentive is applied.
Absorption Refrigeration in A Food Plant
The second example is a food processing plant as shown inFigure 5. This plant operates a simple process of cookingcereal meal with steam and hot water in a cooker and thendry out the moisture from the product in the dryers. Theplant has a gas engine to drive the air compressor and theexhaust heat from gas engine is used to preheat the boilerfeed water. All the required hot water is generated in thecooker from waste heat. The plant utilizes a hot water tankto store the hot water generated from the cooker frictionheat. The hot water tank area tends to get too hot becausethe large amount of friction heat from the cooker is
Figure 5 Process Flow Diagram of A Food Plani
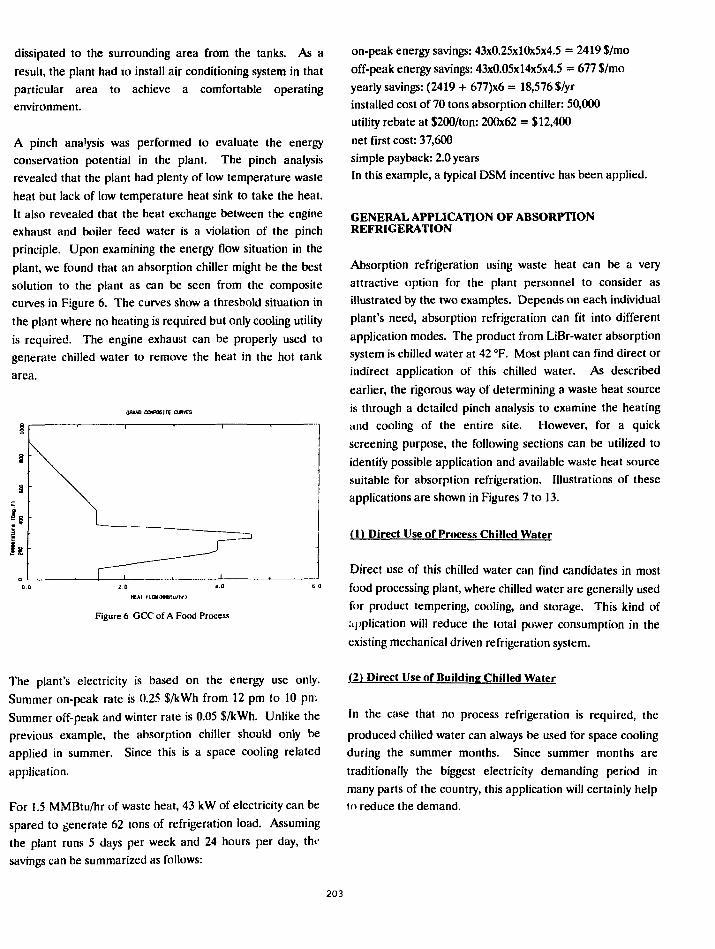
dissipated to the surrounding area from the tanks. As aresult, the plant had 10 install air conditioning system in thatparticular area to achieve a comfortable operatingenvironment.
A pinch analysis was performed to evaluate the energyconservation potential in the plant. The pinch analysisrevealed that the plant had plenty of low temperature wasteheat but lack of low temperature heat sink to take the heat.It also revealed that the heat exchange between the engineexhaust and boiler feed water is a violation of the pinchprinciple. Upon examining the energy flow situation in theplant, we found that an absorption chiller might be the bestsolution to the plant as can be seen from the compositecurves in Figure 6. The curves show a threshold situation inthe plant where no heating is required but only cooling utilityis required. The engine exhaust can be properly used togenerate chilled water to remove the heat in the hot tankarea.
GflANO OMTCITE CURVES
HEAT FLOH(HNBtu/hr)
Figure 6 GCC of A Food Process
The plant's electricity is based on the energy use only.Summer on-peak rate is 0.25 $/kWh from 12 pm to 10 pmSummer off-peak and winter rate is 0.05 $/kWh. Unlike theprevious example, the absorption chiller should only beapplied in summer. Since this is a space cooling relatedapplication.
For 1.5 MMBtu/hr of waste heat, 43 kW of electricity can bespared to generate 62 tons of refrigeration load. Assumingthe plant runs 5 days per week and 24 hours per day, thesavings can be summarized as follows:
on-peak energy savings: 43x0.25x10x5x4.5 = 2419 $/mooff-peak energy savings: 43x0.05x14x5x4.5 = 677 $/moyearly savings: (2419 + 677)x6 = 18,576 $/yrinstalled cost of 70 tons absorption chiller: 50,000utility rebate at $200/ton: 200x62 = $12,400net first cost: 37,600simple payback: 2.0 yearsIn this example, a typical DSM incentive has been applied.
GENERAL APPLICATION OF ABSORPTIONREFRIGERATION
Absorption refrigeration using waste heat can be a veryattractive option for the plant personnel to consider asillustrated by the two examples. Depends on each individualplant's need, absorption refrigeration can fit into differentapplication modes. The product from LiBr-water absorptionsystem is chilled water at 42 °F. Most plant can find direct orindirect application of this chilled water. As describedearlier, the rigorous way of determining a waste heat sourceis through a detailed pinch analysis to examine the heatingand cooling of the entire site. However, for a quickscreening purpose, the following sections can be utilized toidentify possible application and available waste heat sourcesuitable for absorption refrigeration. Illustrations of theseapplications are shown in Figures 7 to 13.
(1) Direct Use of Process Chilled Water
Direct use of this chilled water can find candidates in mostfood processing plant, where chilled water are generally usedfor product tempering, cooling, and storage. This kind ofapplication will reduce the total power consumption in theexisting mechanical driven refrigeration system.
(2) Direct Use of Building Chilled Water
In the case that no process refrigeration is required, theproduced chilled water can always be used for space coolingduring the summer months. Since summer months aretraditionally the biggest electricity demanding period inmany parts of the country, this application will certainly helpto reduce the demand.
203
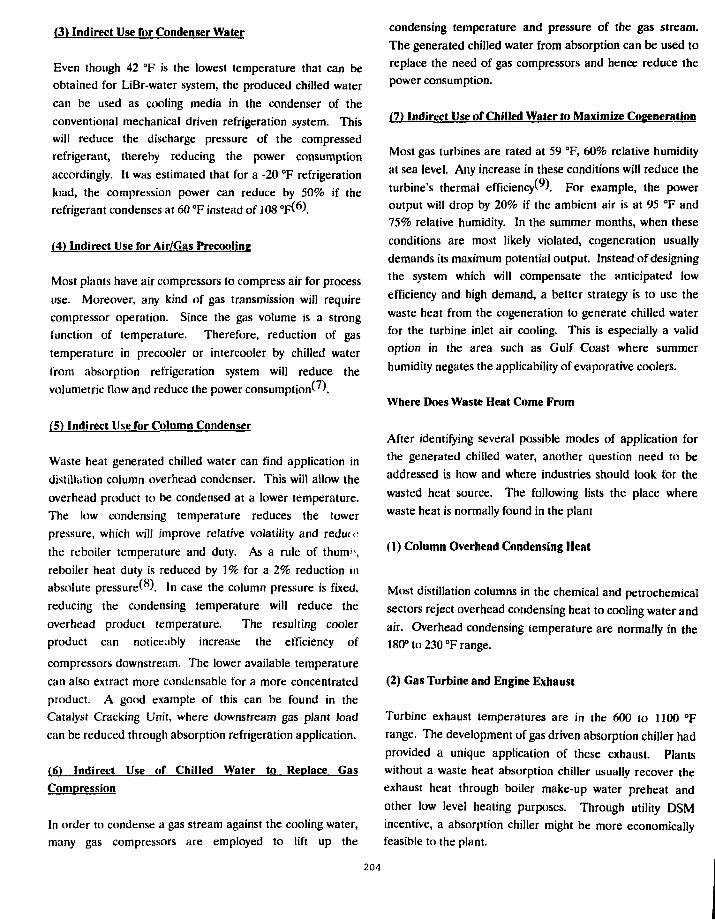
(3) Indirect Use for Condenser Water
Even though 42 °F is the lowest temperature that can beobtained for LiBr-water system, the produced chilled watercan be used as cooling media in the condenser of theconventional mechanical driven refrigeration system. Thiswill reduce the discharge pressure of the compressedrefrigerant, thereby reducing the power consumptionaccordingly. It was estimated that for a -20 °F refrigerationload, the compression power can reduce by 50% if therefrigerant condenses at 60 °F instead of 108 OF<6).
(4) Indirect Use for Air/Gas Preeooling
Most plants have air compressors to compress air for processuse. Moreover, any kind of gas transmission will requirecompressor operation. Since the gas volume is a strongfunction of temperature. Therefore, reduction of gastemperature in precooler or intercooler by chilled waterfrom absorption refrigeration system will reduce thevolumetric flow and reduce the power consumption").
(5) Indirect Use for Column Condenser
Waste heat generated chilled water can find application indistillation column overhead condenser. This will allow theoverhead product to be condensed at a lower temperature.The low condensing temperature reduces the towerpressure, which will improve relative volatility and reducethe reboiler temperature and duty. As a rule of thum'\reboiler heat duty is reduced by 1% for a 2% reduction inabsolute pressure'"'. In case the column pressure is fixed,reducing the condensing temperature will reduce theoverhead product temperature. The resulting coolerproduct can noticeably increase the efficiency of
compressors downstream. The lower available temperaturecan also extract more condensable for a more concentratedproduct. A good example of this can be found in theCatalyst Cracking Unit, where downstream gas plant loadcan be reduced through absorption refrigeration application.
(6) Indirect Use of Chilled Water to Replace GasCompression
In order to condense a gas stream against the cooling water,many gas compressors are employed to lift up the
condensing temperature and pressure of the gas stream.The generated chilled water from absorption can be used toreplace the need of gas compressors and hence reduce thepower consumption.
(7) Indirect Use of Chilled Water to Maximize Cogeneration
Most gas turbines are rated at 59 °F, 60% relative humidityat sea level. Any increase in these conditions will reduce theturbine's thermal efficiency^). For example, the poweroutput will drop by 20% if the ambient air is at 95 °F and75% relative humidity. In the summer months, when theseconditions are most likely violated, cogeneration usuallydemands its maximum potential output. Instead of designingthe system which will compensate the anticipated lowefficiency and high demand, a better strategy is to use thewaste heat from the cogeneration to generate chilled waterfor the turbine inlet air cooling. This is especially a validoption in the area such as Gulf Coast where summerhumidity negates the applicability of evaporative coolers.
Where Does Waste Heat Come From
After identifying several possible modes of application forthe generated chilled water, another question need to beaddressed is how and where industries should look for thewasted heat source. The following lists the place wherewaste heat is normally found in the plant
(1) Column Overhead Condensing Heat
Most distillation columns in the chemical and petrochemicalsectors reject overhead condensing heat to cooling water andair. Overhead condensing temperature are normally in the180° to 230 °F range.
(2) Gas Turbine and Engine Exhaust
Turbine exhaust temperatures are in the 600 to 1100 °Frange. The development of gas driven absorption chiller hadprovided a unique application of these exhaust. Plantswithout a waste heat absorption chiller usually recover theexhaust heat through boiler make-up water preheat andother low level heating purposes. Through utility DSMincentive, a absorption chiller might be more economicallyfeasible to the plant.
204
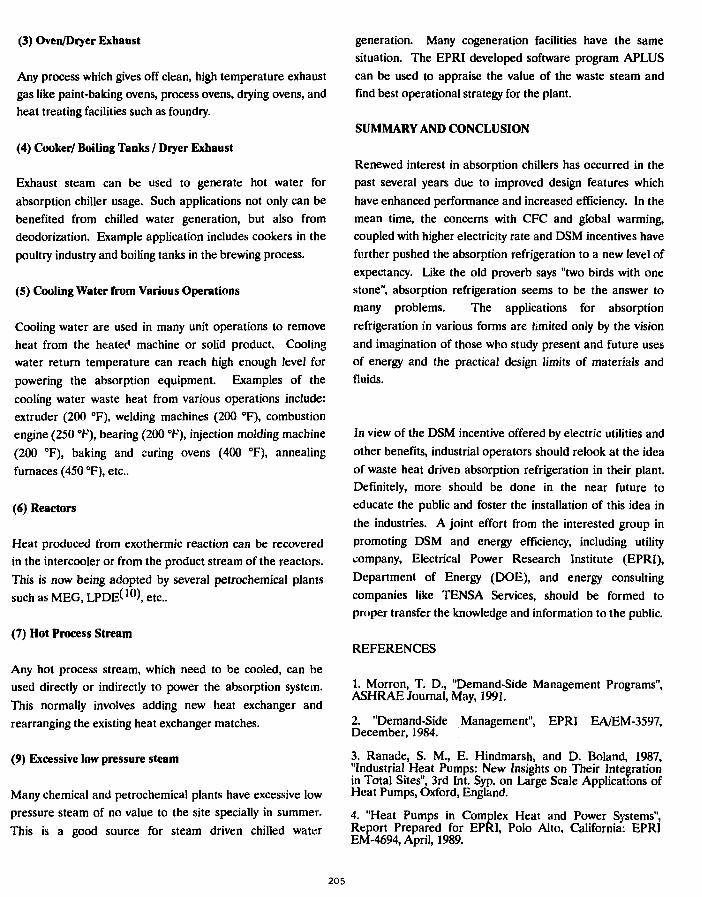
(3) Oven/Dryer Exhaust
Any process which gives off clean, high temperature exhaustgas like paint-baking ovens, process ovens, drying ovens, andheat treating facilities such as foundry.
(4) Cooker/ Boiling Tanks / Dryer Exhaust
Exhaust steam can be used to generate hot water forabsorption chiller usage. Such applications not only can bebenefited from chilled water generation, but also fromdeodorization. Example application includes cookers in thepoultry industry and boiling tanks in the brewing process.
(5) Cooling Water from Various Operations
Cooling water are used in many unit operations to removeheat from the heatec1 machine or solid product. Coolingwater return temperature can reach high enough level forpowering the absorption equipment. Examples of thecooling water waste heat from various operations include:extruder (200 °F), welding machines (200 CF), combustionengine (250 °F), bearing (200 °F), injection molding machine(200 °F), baking and curing ovens (400 °F), annealingfurnaces (450 °F), etc..
(6) Reactors
Heat produced from exothermic reaction can be recoveredin the intercooler or from the product stream of the reactors.This is now being adopted by several petrochemical plantssuch as MEG, LPDE(10), etc..
(7) Hot Process Stream
Any hot process stream, which need to be cooled, can beused directly or indirectly to power the absorption system.This normally involves adding new heat exchanger andrearranging the existing heat exchanger matches.
(9) Excessive low pressure steam
Many chemical and petrochemical plants have excessive lowpressure steam of no value to the site specially in summer.This is a good source for steam driven chilled water
generation. Many cogeneration facilities have the samesituation. The EPRI developed software program APLUScan be used to appraise the value of the waste steam andfind best operational strategy for the plant.
SUMMARY AND CONCLUSION
Renewed interest in absorption chillers has occurred in thepast several years due to improved design features whichhave enhanced performance and increased efficiency. In themean time, the concerns with CFC and global warming,coupled with higher electricity rate and DSM incentives havefurther pushed the absorption refrigeration to a new level ofexpectancy. Like the old proverb says "two birds with onestone", absorption refrigeration seems to be the answer tomany problems. The applications for absorptionrefrigeration in various forms are iimited only by the visionand imagination of those who study present and future usesof energy and the practical design limits of materials andfluids.
In view of the DSM incentive offered by electric utilities andother benefits, industrial operators should relook at the ideaof waste heat driven absorption refrigeration in their plant.Definitely, more should be done in the near future toeducate the public and foster the installation of this idea inthe industries. A joint effort from the interested group inpromoting DSM and energy efficiency, including utilitycompany, Electrical Power Research Institute (EPRI),Department of Energy (DOE), and energy consultingcompanies like TENSA Services, should be formed toproper transfer the knowledge and information to the public.
REFERENCES
1. Morron, T. D., "Demand-Side Management Programs",ASHRAE Journal, May, 1991.
2. "Demand-Side Management", EPRI EA/EM-3597,December, 1984.
3. Ranade, S. M., E. Hindmarsh, and D. Boland, 1987,"Industrial Heat Pumps: New Insights on Their Integrationin Total Sites", 3rd Int. Syp. on Large Scale Applications ofHeat Pumps, Oxford, England.
4. "Heat Pumps in Complex Heat and Power Systems",Report Prepared for EPRI, Polo Alto, California: EPRIEM-4694, April, 1989.
205
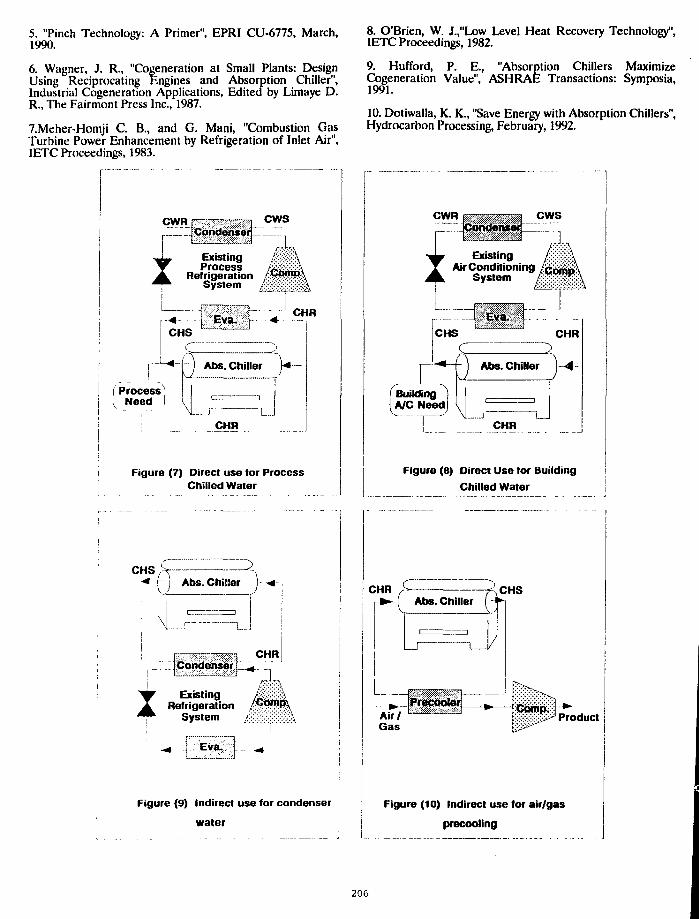
5. "Pinch Technology: A Primer", EPRI CU-6775, March,1990.
6. Wagner, J. R., "Cogeneration at Small Plants: DesignUsing Reciprocating Engines and Absorption Chiller",Industrial Cogeneration Applications, Edited by Limaye D.R., The Fairmont Press Inc., 1987.
7.Meher-Homji C. B., and G. Mani, "Combustion GasTurbine Power Enhancement by Refrigeration of Inlet Air",IETC Proceedings, 1983.
CWRCondenser
CWS
ExistingProcess
Refrigerationsystem
CHS
* I
CHR
' ProcessNeed
Abs. Chiller
cr.r ;
CHR
Figure (7) Direct use lor ProcessChilled Water
8. O'Brien, W. J.,"Low Level Heat Recovery Technology",IETC Proceedings, 1982.
9. Hufford, P. E., "Absorption Chillers MaximizeCogeneration Value", ASHRAE Transactions: Symposia,1991.
10. Dotiwalla, K. K., "Save Energy with Absorption Chillers",Hydrocarbon Processing, February, 1992.
CWR CWS
CHi
c
.XTBuilding )
1 A/C Need]
i)1\L
CHR
Abs. Chiller
CHR
Figure (8) Direct Use for BuildingChilled Water
CHS>Abs. Chilier
i *
CHRj Condenser j _ ^
ExistingRefrigeration /
System
Figure (9) Indirect use for condenser
water
CHRAbs. Chiller
CHS
Air/Gas
' ProductI
Figure (10) Indirect use for air/gas
precooling
206
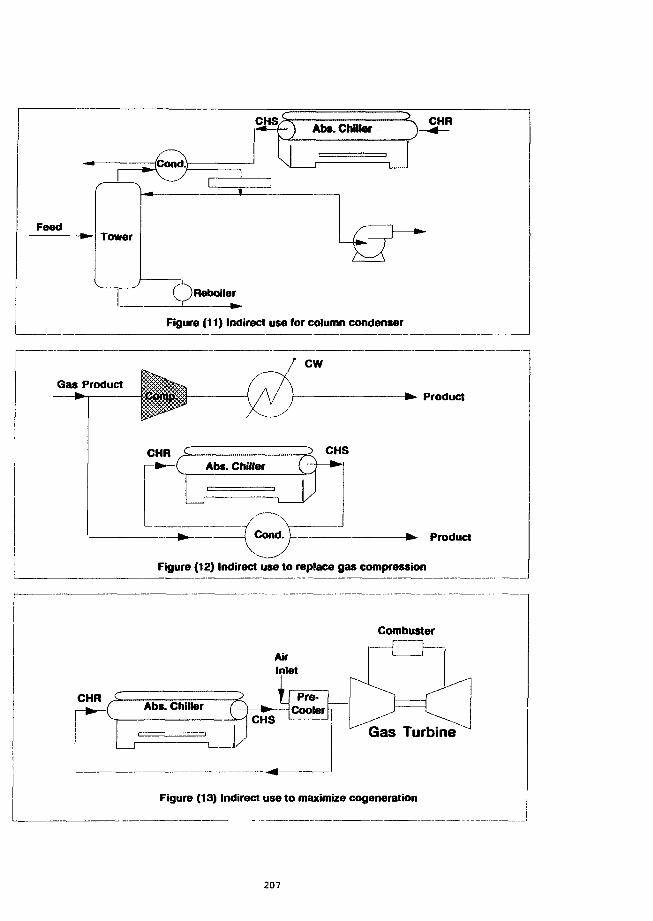
CHS,Abs. Chiller
CHR
aFeed
Tower
Reboiler
Figure (11) Indirect use for column condenser
Gas Product
CW
Product
CHR S-Q Abs. ChiBer (
CHS
Cond. Product
Figure (12) Indirect use to replace gas compression
Combuster
CHR
Figure (13) Indirect use to maximize cogeneration
207
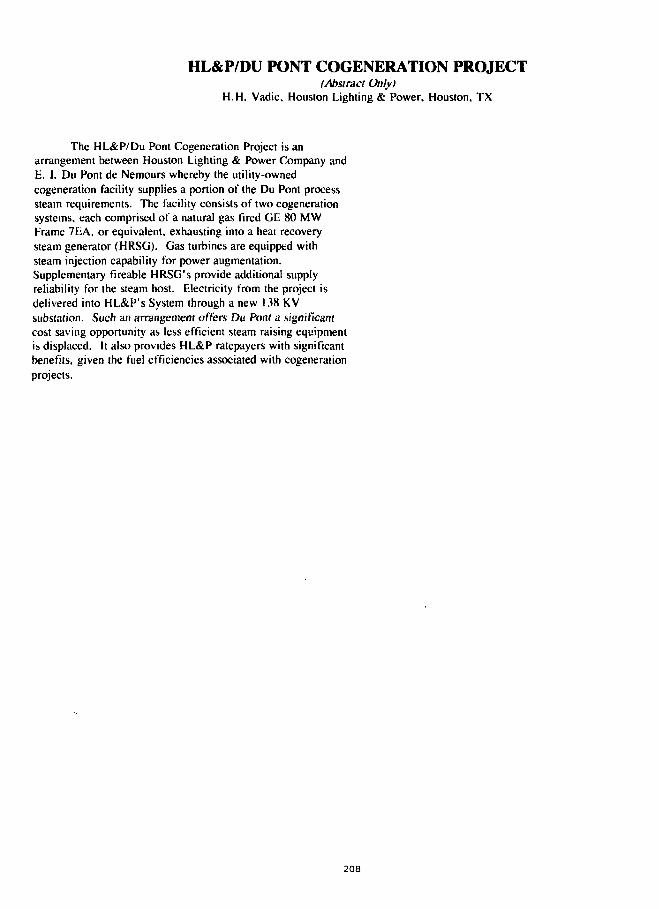
HL&P/DU PONT COGENERATION PROJECT(Abstract Only)
H.H. Vadie, Houston Lighting* Power, Houston, TX
The HL&P/Du Pont Cogeneration Project is anarrangement between Houston Lighting & Power Company andE. I. Du Pont de Nemours whereby the utility-ownedcogeneration facility supplies a portion of the Du Pont processsteam requirements. The facility consists of two cogenerationsystems, each comprised of a natural gas fired GE 80 MWFrame 7EA, or equivalent, exhausting into a heat recoverysteam generator (HRSG). Gas turbines are equipped withsteam injection capability for power augmentation.Supplementary fireable HRSG's provide additional supplyreliability for the steam host. Electricity from the project isdelivered into HL&P's System through a new 138 KVsubstation. Such an arrangement offers Du Ponl a significantcost saving opportunity as less efficient steam raising equipmentis displaced. It also provides HL&P ratepayers with significantbenefils, given the fuel efficiencies associated with cogenerationprojects.
208

A NOVEL APPROACH TO DETERMINING MOTOR LOAD
byMichael Brown
Georgia Tech Research InstituteAtlanta, Georgia
ABSTRACT
Properly sized electric motors are essential if industrial plantefficiency is to be optimized and energy costs minimized. Because ofthe difficulty in making power measurements on three phase motors,loading is rarely, if ever, checked. A simple indication of motor loadcan be achieved by measuring operating speed because speed and loadare almost linearly related. The decrease in motor speed from no loadconditions, referred to as slip, can be determined with a non-contact,optical tachometer. Field measurements of motor slip were conductedat a textile plant to quantify motor load conditions. To verify therelationship between operating speed and load, measurements of motorpower consumption on a representative number of motors were alsoconducted. The results of the motor survey, including number ofmotors, size, and load, are summarized in this paper along with anestimate of the savings from replacing oversized motors.
INTRODUCTION
Properly sized motors are essential if economical operation andlong life is to be achieved. Too often, oversized motors are selectedwhen safety factors are compounded or rapid load growth is expected.For example, a designer may use a 30 percent safety margin whensizing a pump or fan compounded with rounding up to a standard sizewhen a motor is specified. In the end, a motor with 20 percent or moreextra horsepower is selected. Unfortunately, ovcrsizing is usuallyunwarranted and ultimately leads to ineffi-ciency and energy waste.This paper examines methods to determine underloaded motor operationand presents an evaluation of the savings afforded by properly sizingof motors.
MOTOR EFFICIENCY
Motor efficiency is influenced by a number of factors, thesalient ones being motor design, motor size, and motor load. Simplystated, motor efficiency is the ratio between the output shaft powergenerated and the electrical power input. Before the cost of electricityrapidly increased during the Arab oil embargo, motor first cost, notefficiency, was not the primary concern w'icn specifying a motor. Theamount of active material in these motors, i.e., lamination steel, copperor aluminum or magnet wire, and rotor aluminum, selected was theminimum to meet the stated performance requirements of the motor.Efficiency was maintained at levels high enough to meet thetemperature requirements of a motor, and consequently efficienciesvaried widely depending on the type of enclosure and ventilationsystem used.
Motor Design
Following the increase in energy awareness after the firstenergy crisis, more efficient motors were offered by manufacturers.Initially, manufacturers designed motors with losses reduced by 25
percent and offered them as "energy efficient". Improvementsincorporated into these motors included higher quality bearings, betterwindings, improved laminations, and more efficient venti-lation fans.Efficiencies of energy efficient motors have steadily improved sincetheir introduction, and they present a qualified approach to reducingmotor losses. Typically, efficiencies of energy efficient motors are 5-7% greater than standard efficiency motors in small horsepower sizesand 2-4% greater in motors above 10 hp.
Motor Size
Another factor that affects efficiency is motor size. Typi-cally,as Figure 1 shows, average motor efficiency increases with the size ofthe motor. Efficiency increases rapidly with horse-power up to SO hpand then slowly grows. In smaller motors, the windage, magnetic, andstray losses do not fall in proportion to output as size decreases,therefore the overall efficiency for these motors is less.
Motor Load
A final factor that influences motor efficiency is the opcr-atingload. Motor efficiency decreases markedly when the load falls belowsome critical level. The critical load varies depend-ing on motor size,the larger the motor the lower the critical load. For a 5 hp motor, thecritical load is approximately 75%. For a 10 hp motor, it is atapproximately 50% load, and a 50 hp it is below 10%. Figure 2presents the load versus efficiency curve for a 50 hp motor.
The efficiency of most motors peaks at around 75% but dropsoff sharply below 40%. Thus to say within its optimal operatingbounds, a motor should be sized to run at least 50% loaded most of thetime. Smaller motors (10 hp and below) should be designed to operateabove 50% load, if possible. A grossly oversized motor (generallybelow 40% of full load) will run at low efficiency and low powerfactor. Another disadvantage of oversized motors is their greatercapital cost. Accurate determination of motor cffi-cicncy is a directconsequence of how precisely we can measure the operating load.
DETERMINING MOTOR LOADWattmeters
Measurements must be conducted in order to determine the loadon a motor. Unfortunately, several different methods have been usedto arrive at load. The most obvious and straightforward is a wattmeter.Direct measurement of input power yields the exact load on a motor.The disadvantages of this method arc that it is often difficult toproperly attach a wattmeter to a motor because it requires amperage aswell as voltage connections, the motor must be shutdown to safelyconnect it and this may disturb the process, and not everyone hasaccess to a meter. When practical, a wattmeter is the best method todetermine motor load.
209

Clamp-on Ammeters
Probably the most commonly used in-planl method to determinemotor load is to measure amperage. Amp draw docs vary with motorload, but the relation is not linear. Figure 3 shows the relation betweenmotor load and amperage. Notice that even at no load, the amperagedraw is approximately one-third of lull load. Because amps do notdrop significantly once the load drops below 25 percent. Amp drawcan give an indication of motor loading if it is above 50%. As the loadcontinues to drop, amperage is not an accurate indicator of load becausepower factor also falls rapidly and greatly influences amp readings.The only condition where amperage can accurately be used to gagemotor load is when the power factor has been corrected.
Motor Slip
The difference between no load and full load speed is knownas motor slip. For synchronous motors full load speed is 1800 or 3600rpm. Full load speed varies depending on design but is found on themotor namcplate. The relation between motor speed and load is alsopresented in Figure 3.
Table 1 presents the fractional slip at five load points formotors between 5 and SO tip. When slip is averaged for all motor sizesat each load point, an almost linear relation is found. Because slipspeed can assumed to be an almost linear function of load,determination of the operating speed yields a good indication of motorload. Operating speed can easily be determined without contactthrough the use of a strobciach.
Consider as an example a four-pole 10 hp synchronous motherwith a no load speed of 1,800 rpm, full load speed of 1,755 andmeasured speed of 1,779. The full load and actual slip are:
Full load slip = 1.800 - 1.755 = 45 rpmMeasured Slip = 1,800 - 1,779 = 21 rpm
Fractional Slip = 20/50 = 47%
Referring to Table 1, the actual motor load corresponding to a slipspeed of 1,779 rpm is 50%. Assuming equality between motor loadand fractional slip yields an error of only 6% of the actual value.
Error = (Actual Load - Estimated Load) / Actual Load= (50% - 47%) / 50%= 6%
Measuring motor speed in order to determine slip and, conse-quently, load is relatively simple and reliable. Unlike wattage andamperage measurement, no electrical connections are necessary. Oncethe shaft has been marked, speed measurement will not intcr-fcrc withthe operation of the machinery. Unlike amperage, slip speed is almostlinearly related to motor loading.
FIELD MEASUREMENTS
To verify the utility of speed measurement as a method offinding motor load, field readings were conducted at a textile finishingplant. The plant had a variety of motors, but measurements were madeon only four. These four were all fans. Fans and pumps arc excellentapplications for speed measurement because they exhibit relativelysteady load conditions and, therefore, have nearly constant speed.
The results of power and speed measurements on the motors arepresented in Table 2. Good agreement was found between the loadpredicted from speed measurement and the measured load. The greatesterror was on a 30 hp range motor. In other cases, the maximum errorfrom load predicted by slip measurement was less that 8%. Becausemotor slip is limited, only 40 rpm for the 25 and 30 hp motors studied,precise determination of operating speed is crucial if load is to beaccurate. With a slip of 40 rpm, each rpm change is equivalent loroughly a 2.5% difference in load.
Of the motors evaluated, only one, a 15 hp dryer fan motor,was found to be under loaded. The measured load on this motor was27%. Because the fan operates continuously and is severely under-loaded, replacement with a smaller size motor is probably warranted.
SAVINGS AVAILABLE FROM PROPER MOTOR SIZING
Other field studies conducted in U.S. industrial plants haveindicated that a significant percentage of the motors arc under- loaded.So pervasive is the problem a utility engineer in California afterconducting field measurements of 1,000 motors concluded that, "Halfthe motors in the rent world arc operating at less than 60% of theirrated load. And a third arc operating at less than half of their ratedload." Other motor experts concur with this assessment noting thatusers usually oversize when they select their own motors. ADepartment of Energy study found that one-fifth of the motors 5 hp andlarger were running at or below 40% of rated load. Data suggests thatloading between 25 and 40% results in a drop in efficiency, dependingon the motor size, of between 2 and 8% below that for 50% load.
The disadvantages of motor ovcrsizing, listed below, arcfivefold:
o lower efficiencyo lower power factoro higher motor costo higher controller costo higher installation costs.
This practice can be avoided by careful attention to design, but accurateselection docs not address oversized motors already in place. As ageneral rule, it is probably not cost effective to consider replacingmotor operating at load factors greater than 40%.
The 15 hp dryer fan motor operating at 27% load should beconsidered for downsizing. The effective motor output is .27 times thefull-load output or 4.05 hp. Thus, this 15 hp motor could be replacedwith a 5, 7.5, or 10 hp motor. If the load will docs not exceed thecurrent increase, a larger 7.5 or 10 hp motor is recommended. Theloading conditions, efficiency at this load, energy consumption basedon 6,000 annual hours of operation, operating cost, and savings for thismotor arc presented in Table 3.
The savings shown in Table 3 result from the improvement inefficiency resulting from the motor operating closer to its optimumload. The operating cost and savings arc based on an electrical cost of$0.06/kWh. As an example, consider the 10 hp motor:
2 ) 0
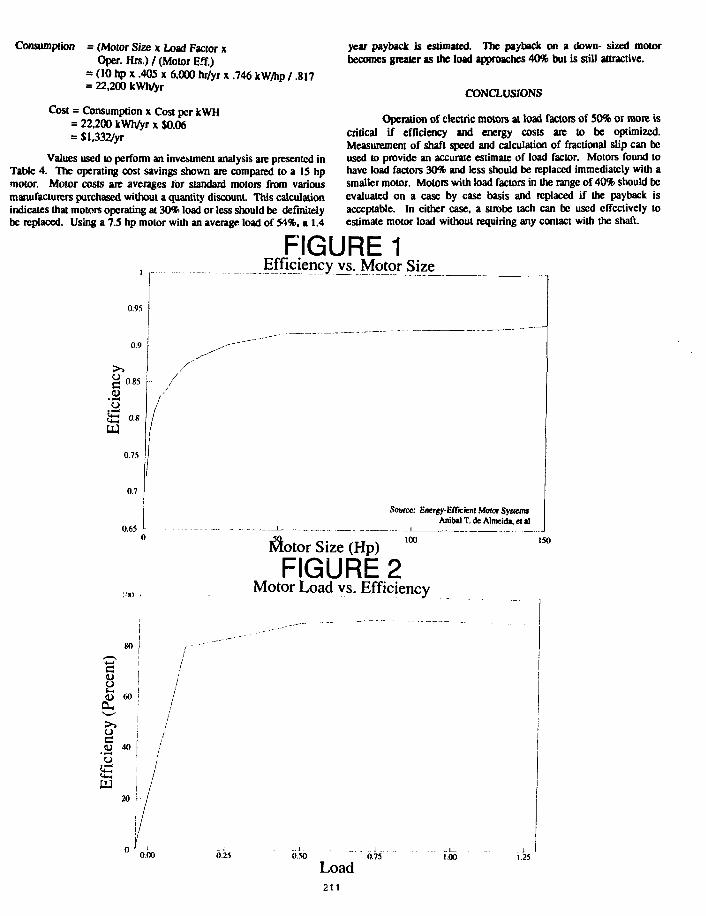
Consumption = (Motor Size x Load Factor xOper.Hrs.)/(Motor Efif.)
= (10 hp x .405 x 6,000 hr/yr x .746 kW/hp / .817= 22,200 kWh/yr
Cost = Consumption x Cost per kWH= 22,200 kWh/yr x $0.06= Sl,332/yr
Values used to perform an investment analysis are presented inTable 4. The operating cost savings shown are compared to a IS hpmotor. Motor costs are averages for standard motors from variousmanufacturers purchased without a quantity discounL This calculationindicates that motors operating at 30% load or less should be definitelybe replaced. Using a 7.S hp motor with an average load of 54%, a 1.4
year payback is estimated. The payback on a down- sized motorbecomes greater as the load approaches 40% but is still attractive.
CONCLUSIONS
Operation of electric motors at load factors of 50% or more iscritical if efficiency and energy costs are to be optimized.Measurement of shaft speed and calculation of fractional slip can beused to provide an accurate estimate of load factor. Motors found tohave load factors 30% and less should be replaced immediately with asmaller motor. Motors with load factors in the range of 40% should beevaluated on a case by case basis and replaced if the payback isacceptable. In either case, a strobe tach can be used effectively toestimate motor load without requiring any contact with the shaft.
0.9S
0.9
FIGURE 1Efficiency vs. Motor Size^
uc
.SiUJ
0.85
0.75
0.7
0.65
Source: Energy-Efficient Motor SystemsAnibalT.de Almeida, el al
100Motor Size (Hp)
FIGURE?Motor Load vs. Efficiency
ISO
0.25 0.50
Load0.75 1.00 1.25
211
FIGURE 3Motor Load vs. RPM, Amps
£ 17800i
Data for50 hp motor
a.<
0.50 1)75
Load
TABLE 1
Motor Load versus Fractional Slip for Different Motors
Load
0
25
50
75
100
Shp
0
.25
.52
.78
1.0
10 hp
0
.26
.47
.71
1.0
IShp
0
.23
.54
.83
1.0
20 hp
0
.23
.49
.71
1.0
25 hp
0
.23
.49
.77
1.0
50 hp
0
.23
.43
.67
1.0
Avg.
0
.24
.49
.75
1.0
TABLE 2
Field Measurements of Motor Load and Slip
MotorSize
HP
30
25
14.75
20.1
Full LoadSpeed
RPM
1760
1760
1730
1760
Meas.Speed
RPM
1776
1778
1783
1772
Meas.Load
kW
12.37
10.75
3.41
11.43
% FullLoadkW
%
.50
.51
.27
.67
% FullLofiip
%
.60
.55
.24
.70
212
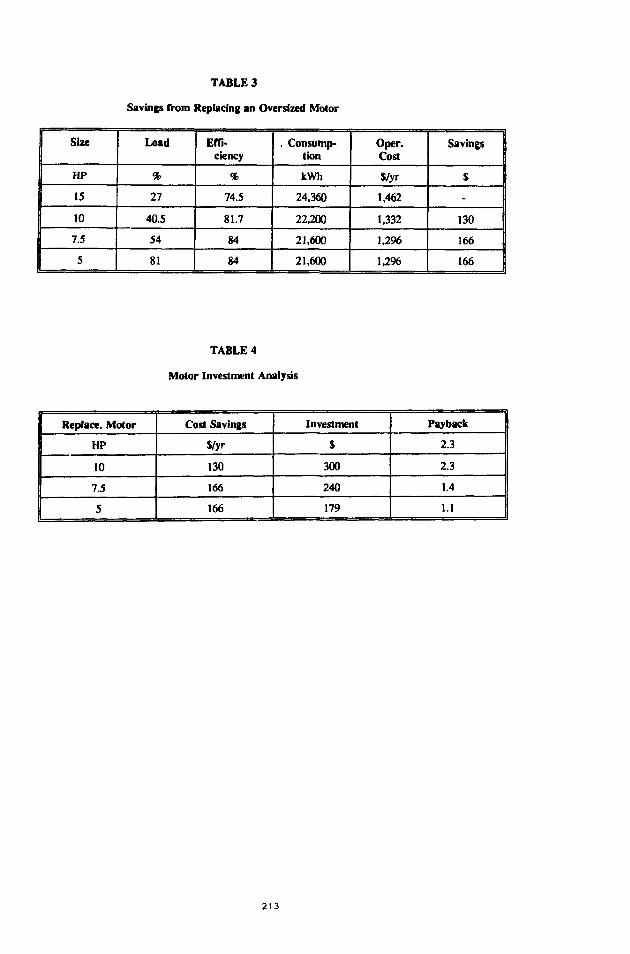
TABLE 3
Savings from Replacing an Oversized Motor
Size
HP
15
10
7.5
5
Load
%
27
40.5
54
81
Effi-ciency
%
74.5
81.7
84
84
. Consump-tion
kWh
24,360
22,200
21,600
21,600
Oper.Cost
Vyr
1,462
1,332
1,296
1,296
Savings
$
-
130
166
166
TABLE 4
Motor Investment Analysis
Replace. Motor
HP
10
7.5
5
Cost Savings
$/yr
130
166
166
Investment
$
300
240
179
Payback
2.3
2.3
1.4
1.1
213
PROCESS INTEGRATION STUDY OF A POULTRY PROCESSING PLANT
William A. Meffert, P.E.Research Engineer
Georgia Tech Research InstituteAtlanta, Georgia
ABSTRACT
This paper presents the results of a process integration study ofa poultry processing plant. The Pinch Methodology was utilizedto set targets for process energy use and to critique previousattempts at energy conservation in poultry plants. It was foundthat not all the energy conservation measures previouslyimplemented in the plant were conducive for minimum energydesign. This study revealed that designing a poultry plant forminimum energy use is possible with currently availabletechniques. Further, existing plants can be retrofitted to improvi*process energy use easily. Most significant is the minimumenergy design target for a process that has been studied verythoroughly in the past. This target answers the question, howmuch better could the poultry process be?
The author has also found that the Pinch Methodology can beeasily programmed on a spreadsheet. Many energy conservationengineers have shied away from Pinch analyses in the past.However, it is a very useful tool that can be easily applied afterthe initial inertia of training is overcome.
INTRODUCTION
The poultry industry is one of Georgia's largest and, asexpected, has received a great deal of government assistance.Its energy use has been scrutinized thoroughly and many energyconservation measures to improve process energy use have beenimplemented. With the development of the Pinch Methodology,a technique has been found to evaluate the extensive effortsmade in the past to improve energy use in the poultry industry.This paper will focus on the process for preparing whole broilerhens. A local plant that processes 7,600 birds per hour will beused since extensive data already exists for this plant. Manyplants vary their processes depending on whether wholechickens or parts are to be prepared and whether the chicken isto be ptecooked. However, the basic process of all these plantsis addressed in this paper.
Poultry plants typically use a great deal of steam andrefrigeration. In a recent study3, some plants in Georgia usedapproximately 0.93 MMBtu/1000 lbs which costs about $7 per1,000 pounds of bird in 1988. Plants process from 100,000 to250,000 birds per day at an average weight of 4 pounds. It iseasy to see that utility costs can easily climb over $1 million ina year especially at today's prices.
Obviously, the product stream in a poultry plant is chickens.The temperature requirements of this lumped mass determinesthe plants thermal requirements. This steady flow of lumpedmass is not very conducive for direct heat exchange and processintegration. The heat transfer medium used to alter the chickencarcass temperature in U.S. poultry plants is water. Thissecondary fluid stream will be used for the process analysis. Toinsure that the minimum amount of energy is used, the waterstreams flow countercurrent to the flow of the chickens in theplant.
PROCESS DESCRIPTION
The process for preparing a whole chicken broiler is verycomplex. However, only two thermal requirements exist in theprocess. The slaughtered chicken is scalded in a bath of waterat 128°F and after evisceration is chilled to 35°F. The chickenis scalded for two minutes to loosen its feathers for thedefeathering equipment. The bird is chilled to prepare it forrefrigerated shipping.
U.S. regulations require that 1 quart of fresh water must be usedper bird in the scalder. This water is considered waste after thisprocess and can not be used further. Two water streams resultfrom scalding, a hot stream of waste water that is cooled to theenvironmental temperature and a cold stream of make-up waterthat is to be heated. Several energy conservation measures havebeen implemented in the past to prevent heat loss from thescalder: 1) the scalder sides have been insulated, and 2) the topof the tank has been covered with a lid to prevent evaporation.For this process integration, these measures are assumed to bein place, though many plants have not even done these simplemeasures. An energy balance on the tank has been completedtaking into account all the losses, including water dragout withthe bird (see Figure 1). Solving the energy balance determinesthe required inlet temperature for the make-up water stream. Itis assumed that the make-up water supplies all the heat neededto keep the bath at 128°F. Many plants use steam sparging inaddition to hot make-up water to control the tank temperature.In this analysis, water is used as the heat transfer fluid only andis not allowed to change phase. Usually, a facility wants tomaximise the use of the least expensive utilities. This in turnmeans that we want to maximise the use of the coldest hotutility and the hottest cold utility. Thus, maximizing use of hotwater instead of steam in the preliminary design process insuresa minimum target will be achieved. A description of the twothermal streams at the scalder are shown in Table 1.
214
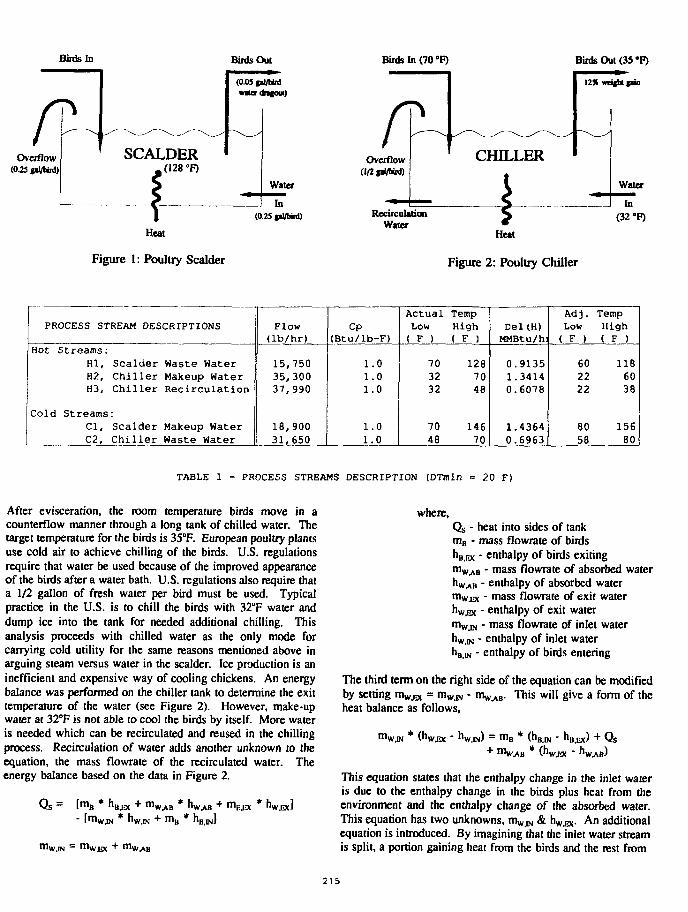
Birds In
Overflow
Birds Out' •(O.OSpl/Mrdwurdnfom)
Birds In (70 °F)
SCALDER,(128°F)
4Overflow
Waterwmmm
In(0.25 (•I/Hid)
Birds Out (35 *F)
12* wtijht gun
CHILLER
Heat
Figure 1: Poultry Scalder
RecirculationWater
Heat
Figure 2: Poultry Chiller
Water
In(32 -F)
PROCESS STREAM DESCRIPTIONS
Hot Streams:HI,H2,H3,
Cold StreamsCl,C2,
Scalder Waste WaterChiller Makeup WaterChiller Recirculation
Scalder Makeup WaterChiller Waste Water
Flow(lb/hr)
15,75035,30037,990
18,90031,650
Cp(Btu/lb-F)
1.01.01.0
1.01.0
ActualLow< F )
703232
7046
TempHigh( F )
1287048
14670
Del(H)MMBtu/h:
0.91351.34140.6078
1.43640.6963
Adj.Low( F )
602222
8058
TempHigh( F )
1186038
15680
TABLE 1 - PROCESS STREAMS DESCRIPTION (DTmin = 20 F)
After evisceration, the room temperature birds move in acounterflow manner through a long tank of chilled water. Thetarget temperature for the birds is 35°F. European poultry plantsuse cold air to achieve chilling of the birds. U.S. regulationsrequire that water be used because of the improved appearanceof the birds after a water bath. U.S. regulations also require thata 1/2 gallon of fresh water per bird must be used. Typicalpractice in the U.S. is to chill the birds with 32°F water anddump ice into the tank for needed additional chilling. Thisanalysis proceeds with chilled water as the only mode forcarrying cold utility for the same reasons mentioned above inarguing steam versus water in the scalder. Ice production is aninefficient and expensive way of cooling chickens. An energybalance was performed on the chiller tank to determine the exittemperature of the water (see Figure 2). However, make-upwater at 32°F is not able to cool the birds by itself. More wateris needed which can be recirculated and reused in the chillingprocess. Recirculation of water adds another unknown to theequation, the mass flowrate of the recirculated water. Theenergy balance based on the data in Figure 2.
Qs = [mB * nB,KX + mW.AB * hW^B + mEJ3C * V E X ]- irriwjH HWJN •*• mg "B.INI
mWJN = mWJ3< + mW,AB
where,Qs - heat into sides of tankmB - mass flowrate of birdsnB.Ex - enthalpy of birds exitingmw>a - mass flowrate of absorbed waternw.AB - enthalpy of absorbed watermw.Ex • m a s s flowrate of exit waterhW-EX - enthalpy of exit watermw.iN - mass flowrate of inlet waterhw,iN - enthalpy of inlet waternB.iN " enthalpy of birds entering
The third term on the right side of the equation can be modifiedby setting mWJBX = mWJN - m^,^. This will give a form of theheat balance as follows,
m'W.IN nW,lN) = m B * (h|+ m... ._ *
Qs' "WABf
This equation states that the enthalpy change in the inlet wateris due to the enthalpy change in the birds plus heat from theenvironment and the enthalpy change of the absorbed water.This equation has two unknowns, mw w & hW£X. An additionalequation is introduced. By imagining that the inlet water streamis split, a portion gaining heat from the birds and the rest from
2 )5
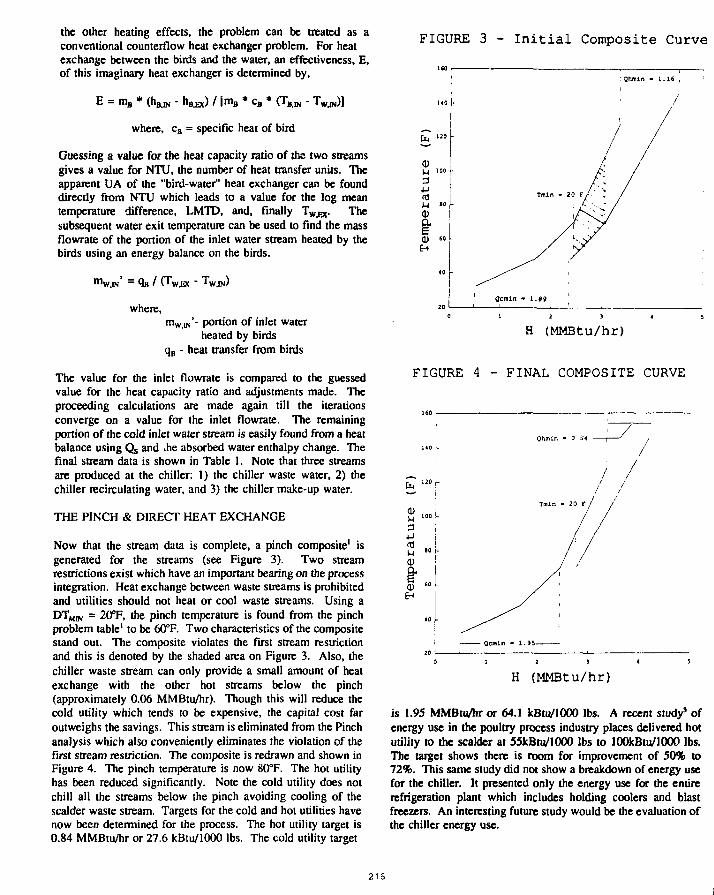
the other heating effects, the problem can be treated as aconventional counterflow heat exchanger problem. For heatexchange between the birds and the water, an effectiveness, E,of this imaginary heat exchanger is determined by.
FIGURE 3 - Initial Composite Curve
E = mB * (hBJN - hBEX) * cB * - TW4N)]
where, ca = specific heat of bird
Guessing a value for the heat capacity ratio of the two streamsgives a value for NTU, the number of heat transfer units. Theapparent UA of the "bird-water" heat exchanger can be founddirectly from NTU which leads to a value for the log meantemperature difference, LMTD, and, finally Tw£x . Thesubsequent water exit temperature can be used to find the massflowrate of the portion of the inlet water stream heated by thebirds using an energy balance on the birds.
where,mw.ni'- portion of inlet water
heated by birdsqB - heat transfer from birds
The value for the inlet flowrate is compared to the guessedvalue for the heat capacity ratio and adjustments made. Theproceeding calculations are made again till the iterationsconverge on a value for the inlet flowrate. The remainingportion of the cold inlet water stream is easily found from a heatbalance using Qs and the absorbed water enthalpy change. Thefinal stream data is shown in Table 1. Note that three streamsare produced at the chiller: 1) the chiller waste water, 2) thechiller recirculating water, and 3) the chiller make-up water.
THE PINCH & DIRECT HEAT EXCHANGE
Now that the stream data is complete, a pinch composite1 isgenerated for the streams (see Figure 3). Two streamrestrictions exist which have an important bearing on the processintegration. Heat exchange between waste streams is prohibitedand utilities should not heat or cool waste streams. Using aDTM m = 20°F, the pinch temperature is found from the pinchproblem table' to be 60°F. Two characteristics of the compositestand out. The composite violates the first stream restrictionand this is denoted by the shaded area on Figure 3. Also, thechiller waste stream can only provide a small amount of heatexchange with the other hot streams below the pinch(approximately 0.06 MMBtu/hr). Though this will reduce thecold utility which tends to be expensive, the capital cost faroutweighs the savings. This stream is eliminated from the Pinchanalysis which also conveniently eliminates the violation of thefirst stream restriction. The composite is redrawn and shown inFigure 4. The pinch temperature is now 80°F. The hot utilityhas been reduced significantly. Note the cold utility does notchill all the streams below the pinch avoiding cooling of thescalder waste stream. Targets for the cold and hot utilities havenow been determined for the process. The hot utility target is0.84 MMBtu/hr or 27.6 kBtu/1000 lbs. The cold utility target
H (MMBtu/hr)
FIGURE 4 - FINAL COMPOSITE CURVE
Qtimln - 0 a'4
u '00
3•U01 !
I1 I
- Qcmin - 1.9S-
H (MMBtu/hr)
is 1.95 MMBtu/hr or 64.1 kBtu/1000 lbs. A recent study3 ofenergy use in the poultry process industry places delivered hotutility to the scalder at 55kBtu/lOOO lbs to lOOkBtu/1000 lbs.The target shows there is room for improvement of 50% to72%. This same study did not show a breakdown of energy usefor the chiller. It presented only the energy use for the entirerefrigeration plant which includes holding coolers and blastfreezers. An interesting future study would be the evaluation ofthe chiller energy use.
21S
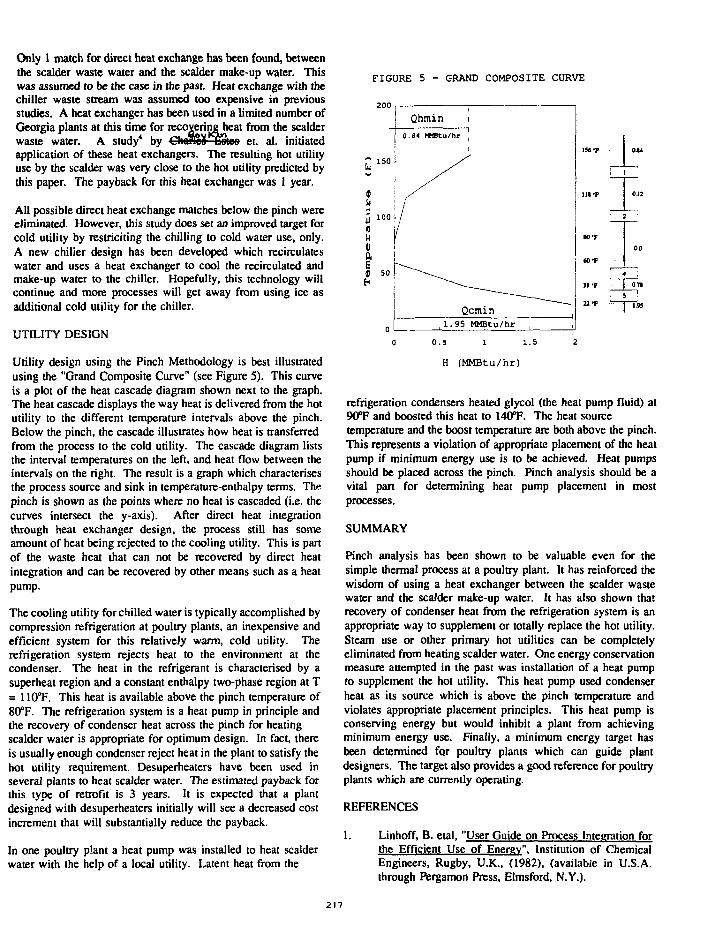
Only 1 match for direct heat exchange has been found, betweenthe scalder waste water and the scalder make-up water. Thiswas assumed to be the case in the past. Heat exchange with thechiller waste stream was assumed too expensive in previousstudies. A heat exchanger has been used in a limited number ofGeorgia plants at this time for recovering heat from the scalderwaste water. A study4 by Chaneli baton et. al. initiatedapplication of these heat exchangers. The resulting hot utilityuse by the scalder was very close to the hot utility predicted bythis paper. The payback for this heat exchanger was 1 year.
All possible direct heat exchange matches below the pinch wereeliminated. However, this study does set an improved target forcold utility by restriciting the chilling to cold water use, only.A new chiller design has been developed which recirculateswater and uses a heat exchanger to cool the recirculated andmake-up water to the chiller. Hopefully, this technology willcontinue and more processes will get away from using ice asadditional cold utility for the chiller.
UTILITY DESIGN
Utility design using the Pinch Methodology is best illustratedusing the "Grand Composite Curve" (see Figure 5). This curveis a plot of the heat cascade diagram shown next to the graph.The heat cascade displays the way heat is delivered from the hotutility to the different temperature intervals above the pinch.Below the pinch, the cascade illustrates how heat is transferredfrom the process to the cold utility. The cascade diagram liststhe interval temperatures on the left, and heat flow between theintervals on the right. The result is a graph which characterisesthe process source and sink in temperature-enthalpy terms. Thepinch is shown as the points where no heat is cascaded (i.e. thecurves intersect the y-axis). After direct heat integrationthrough heat exchanger design, the process still has someamount of heat being rejected to the cooling utility. This is partof the waste heat that can not be recovered by direct heatintegration and can be recovered by other means such as a heatpump.
The cooling utility for chilled water is typically accomplished bycompression refrigeration at poultry plants, an inexpensive andefficient system for this relatively warm, cold utility. Therefrigeration system rejects heat to the environment at thecondenser. The heat in the refrigerant is characterised by asuperheat region and a constant enthalpy two-phase region at T= 110°F. This heat is available above the pinch temperature of80°F. The refrigeration system is a heat pump in principle andthe recovery of condenser heat across the pinch for heatingscalder water is appropriate for optimum design. In fact, thereis usually enough condenser reject heat in the plant to satisfy thehot utility requirement. Desuperheaters have been used inseveral plants to heat scalder water. The estimated payback forthis type of retrofit is 3 years. It is expected that a plantdesigned with desuperheaters initially will see a decreased costincrement that will substantially reduce the payback.
In one poultry plant a heat pump was installed to heat scalderwater with the help of a local utility. Latent heat from the
FIGURE 5 - GRAND COMPOSITE CURVE
0.5 1 1.5
H (MMBtu/hr)
refrigeration condensers heated glycol (the heat pump fluid) at90°F and boosted this heat to 140°F. The heat sourcetemperature and the boost temperature are both above the pinch.This represents a violation of appropriate placement of the heatpump if minimum energy use is to be achieved. Heat pumpsshould be placed across the pinch. Pinch analysis should be avital part for determining heat pump placement in mostprocesses.
SUMMARY
Pinch analysis has been shown to be valuable even for thesimple thermal process at a poultry plant. It has reinforced thewisdom of using a heat exchanger between the scalder wastewater and the scalder make-up water. It has also shown thatrecovery of condenser heat from the refrigeration system is anappropriate way to supplement or totally replace the hot utility.Steam use or other primary hot utilities can be completelyeliminated from heating scalder water. One energy conservationmeasure attempted in the past was installation of a heat pumpto supplement the hot utility. This heat pump used condenserheat as its source which is above the pinch temperature andviolates appropriate placement principles. This heat pump isconserving energy but would inhibit a plant from achievingminimum energy use. Finally, a minimum energy target hasbeen determined for poultry plants which can guide plantdesigners. The target also provides a good reference for poultryplants which are currently operating.
REFERENCES
1. Linhoff, B. etal, "User Guide on Process Integration forthe Efficient Use of Energy". Institution of ChemicalEngineers, Rugby, U.K., (1982), (available in U.S.A.through Pergamon Press, Elmsford, N.Y.).
217

2. Karp, A. et. al., "Pinch Technology: A Primer". ElectricPower Research Institute, Final Report for ResearchProject 2783-13, (1990).
3. Ross, Charles C , Walsh, James L. and Smith, MichaelS., "Enerev Usage in Poultry Processing". Final Reportfor Project N400-930, Agricultural Technology ResearchProgram, Georgia Tech Research Institute.
4. Boykin, W.B., Combes, Richard S., "EnergyConservation in the Poultry Processing Industry", FinalReport for U.S. Department of Energy Project EC-77-5-05-5459, Georgia Tech Research Institue, 1979.
218
ENVIRONMENTAL PROTECTION THROUGH ENERGY EFFICIENCY:CATALYZING NEW OPPORTUNITIES
(Abstract Only)Andrew Silbiger, Research Associate, Bruce Company, Washington DC
Joel B. Smith, Deputy Division Director, Climate Change Division, U.S. Environmental Protection Agency,Washington DC
Increasing attention to environmental issues The EPA would also like to help companiesat home and abroad is providing a new impetus for access the huge potential export market for energycompanies to improve energy efficiency In doingso, this attention is creating new marketopportunities for energy efficient products. Thereis increasing recognition that energy, environment,and economic issues are closely linked. In this eraof increasing environmental awareness, U.S.companies are finding that improving energyefficiency provides a cost effective means to reducethe environmental impact of their operations,improve compliance with environment standards,and promote a better image.
The opportunities for companies to improveenergy efficiency are enormous. The NationalAcademy of Sciences has estimated energyefficiency could reduce overall industrial energydemand by 25 percent shortly after the turn of thecentury. Companies that seek to capitalize on theseopportunities are likely to find the EPA ready tosupport them. While the agency will maintain itsregulatory functions, it is increasingly emphasizingvoluntary programs. This shift reflects arecognition that working cooperatively with theprivate sector to achieve mutual goals is often moreeffective than taking a regulatory approach.
Given the multiple benefits of energyefficiency, the EPA is eager to support companiesthat wish to improve their energy efficiency or tomarket energy efficient products. One reflection ofthis desire is EPA's Green Lights programs, whichrecognizes and provides technical support tocompanies wishing to upgrade their lighting, inaddition to its existing programs, EPA is examiningother support for U.S. companies. This rangesfrom technology-specific programs along the linesof Green Lights to awards recognizing companiesthat have made significant commitments to energyefficiency.
efficient products. In Western Europe mostgovernments are committed to stabilizing orreducing their carbon dioxide emissions in the nextdecade, and the European Community (EC) iscurrently considering a carbon tax. Achieving thesereductions will require substantial investments inenergy efficiency. The European Association forthe Conservation of Energy has estimated that thepotential market in the EC alone for reducinggreenhouse gas emissions is $520 billion in the next
Opportunities in developing countries whereenergy growth is projected to eclipse growth in theindustrialized world will be far greater. EasternEuropean countries have pollution problems thatoften dwarf environmental problems in the West.Many of these problems are tied directly toinefficient energy production and use. In addition,the World Bank has estimated that if developingcountries meet power requirements by simplybuilding new plants, they will need $1 trillion in thenext decade to meet their electric powerrequirements alone. These estimates represent ahuge opportunity for producers of energy efficientproducts, since these producers can offerdeveloping countries a way to meet their energyservice requirements at a substantially lowermonetary and environmental cost than aconventional supply-oriented approach.
Environmental issues are poised to unleash anew wave of change in the way industry usesenergy, perhaps as significant a change as followedthe oil shocks of the 1970s. This new wave may bean opportunity or a liability for Americancompanies. Those companies that approach energyand environmental issues as opportunities are likelyto ride this wave toward more efficient productionand new markets and to find EPA an eager partnerin the effort.
219
SPECIFYING WASTE HEAT BOILERSV.Ganapathy,ABCO Industries
Abi1ene,Texas
ABSTRACT
Waste heat boilers or Heat Recovery SteamGenerators(HRSGs) as they are often calledare used to recover energy from waste gasstreams in chemical plants,refineries,kilns, incineration systems andcogeneration and combined cycle plants,tomention a few applications.Depending onseveral factors such as quantity of gas 01steam flow,cleanliness of gas,gas andsteam pressure and space availability,theymay take various configurations as seen inFig 1 to 5.Consultants and engineers whospecify and evaluate HRSGs should be awarethat several factors influence the finalconfiguration of HRSGs.Some of thesefactors are discussed below.
SYSTEM DESCRIPTION
The application or the system of which theHRSG is a part should be describedcompletely in order that the HRSG supplierunderstands the system needs.Depending onthe process,the gas stream may havepeculiar characteristics.For instance,ifthe flue gas is from a municipal solidwaste incinerator,then the gas will bedirty and would have slaggingconstituents.The boiler design shouldinclude features such as cleaningaisles.hoppers,soot blowers,bare tubesetc.If the gas stream were from a fumeincinerator or gas turbine exhaust,it willbe clean and extended surfaces may be usedto make the boiler compact. If the gasstream is from a sulfur combustor orsecondary reformer in a hydrogenpiant,then the HRSG designer canunderstand the need for boiler exit gastemperature control.Mention should also bemade how the steam is being utilized sothat proper steam purifying devices can beincorporated.If the steam is used forinjection into a gas turbine for NOxcontrol,then the steam purity should be inthe parts per billion range and henceproper drum internals should be provided.
A flow diagram showing how the steam istaken off for process use alsohelps.Sometimes steam an from an externalevaporator could be imported into thesuperheater of the HRSG; alternativelysaturated steam from the HRSG could betaken for process and a lesser quantitymay be superheated.The superheater designhas to consider ' these requirements.Aschematic diagram is helpful particularlyin multi-pressure HRSG designs withcomplex steam distribution system.
GAS PARAMETERS
All of the data pertaining to the gasstream should be stated.Oftenspecifications are written without amention of the flue gas analysis andnature of the gas stream.
a.Gas flow in mass units,NOT in volumetricunits
The gas flow entering the HRSG should begiven in pounds per hour and not involumetric units such as cubic feet perminute.It the flow is given in cfm.thenone has to compute the density correctlyin order to arrive at the mass flow;oftengas pressure and analysis are omitted fromspecifications and hence each HRSGsupplier can come up with his own versionof mass flow,which can create problems forthe person evaluating bids and results inwaste of time for everybody including theHRSG designer.Also,volumetric units maynot clearly state whether the flow is inactual cfm or standard cfm and againstandard cfm can be interpreted bydifferent engineers in differentways.Hence the gas flow should always begiven in mass units so that the HRSGdesign basis is consistent.
b.gas analysis
Exhaust gas analysis should be stated forseveral reasons.The gas enthalpy orspecific heat and hence the duty or HRSG
220

size is affected particularly by the %volume of water vapor and hydrogen.Thedifference in Cp could be as hiqh as 10 %between an uninjected exhaust gas andsteam injected exhaust gas in a gasturbine HRSG.In hydrogen plants thepresence of hydrogen in reformed gasaffects the gas side heat transfercoefficient significantly.The presence ofcorrosive gases such as sufuric acid orhydrochloric acid vapor should bementioned upfront so the HRSG designer cantake proper precauations while designingthe unit.Material selection is alsoimpacted by the presence of . corrosiveqases.If partial pressure of hydrogen ishigh in the gas stream,then the tubematerials may have to be selectedconsidering the likelihood oi corrosionusinq guidelines such as Nelson'schart.Hydrogen chloride gas even in smallquantities is responsible for hightemperature corrosion in superheaters ofHRSGs behind municipal solid wasteincinerators.
c.Gas pressure and pressure drop
Gas pressure is important when it comes toselecting the type of boiler whether firetube or water tube.Fire tube designs aresuitable for high gas pressures/Whilewater tube designs are not,unless placedinside a pressure vessel.Casing design isalso affected by gas pressure.A few psiincrease from atmospheric pressure cancomplicate the structural design aspects.Gas pressure drop is critical to the sizeand operating costs of a HRSG.If thespecifications do not mention a desiredvalue or range.different designers cancome up with different options or size andevaluating them could be difficult.Alternatively,the cost of pressure drop orpower consumption to move the gasesthrough the boiler should be indicated sothat designer can balance the size of HRSGwith operating cost and optimize thedesign.
d.Nature of the gas
The source and nature of gas is veryimportant to the boiler designer.If the
gas stream is from an incinerator of solidwaste,factors such as particulate analysisand loading can be influenced by thematerials being incinerated as well as theoperating regimes.Ash or particulateloading in the qas stream is also impactedby the type of incinerator.whether fixedbed,rotary kiln or fluid bed.Slaggingconstituents present in the gas can resultin bridging of tubes by molten salts iftube spacing is not wide,particularly atthe boiler inlet.Ash hoppers ,soot blowersand cleaning lanes should be incorporatedin such units .Extended surfaces should beavoided.If slagging is likely to be severeat the boiler front,then a fire tubeboiler may not be a good choice at all anda water tube boiler with radiant sectionmay be required.Unless the specificationsdiscuss these aspects,the HRSG designermay not consider them.
BOILER DUTY
The amount of energy to be recovered fromthe gas stream should be stated clearly;inmulti-pressure HRSGs used in gas turbineapplications,one may use software such asCOGEN |21 to optimize gas/steamtemperature profiles and evaluate thesteam output of high and low pressuresteam at different, exhaust gasconditions.If the steam output at variouspressures is not stated,then the HRSGdesigner can come up with differentcombinations depending upon the pinchpoint.approach point selected for eachpressure level.In single pressure units if the duty orexit gas temperature is not stated,thenthe designer may come up with differentsizes,which can be evaluated only if acriterion such as cost versus duty or gaspressure drop is suggested in thespecifications.
SURFACE AREA
Surface area oi a boiler depends onseveral factors such as tubesize,pitch,gas velocity used and whetherit has bare or finned tubes.The variationsbetween designs can be as high as 100 to200 % for the same duty and similar gas
221

pressure drop |3].The variations insurface area can be more glaring whenextended surfaces are used.Use of finnedtubes reduces the overall heat transfercoefficient.Engineers should be concernedwith the product of UxS and not Salone.Hence specifications should NOT callfor a minimum surface area.This suggestionapplies to both fire tube and water tubedesigns.Reference 1 shows several examplesof both tire tube and water tube boilerswhere the difference in S is over 50 to200 % and yet due to variations in U,theduty or energy transferred is the same.
COST OB1 FUEL AND ELECTRICITY
Specification writers, consultants andplant owners should be concerned with theinitial PLUS operating costs and not theinitial investment alone.The author hasseen several hundred specificationswherein no mention was ever made of theoperating costs associated with fuelconsumption or moving the gas through theboiler .High gas pressure in say a gasturbine HRSG can result in reducedelecrtical power output of the gasturbine;generaJ1y a 4 in we additionalpressure drop reduces the power output by1 %.Fan power consumption and henceelectrical power consumption increaseswhen the qas pressure drop in the boileris high.In order to evaluate differentdesigns or bids,the specification shouldmention criteria used tor evaluatingadditional fuel or power consumption.
FEED WATER ANALYSIS AND STEAM PURITY
Inputs on feed water analysis and desiredsteam purity help the HRSG designer selectproper blow down criterion and druminternals.This again goes back to thesystem description where a description ofhow and where the steam is being usedhelps.High steam purity calls forexpensive drum internals and hence adds tothe cost.In a fire tube boiler,it a highsteam purity is not required,then a firetube boiler where the steam space isintegral with the shell containing thetubes may be adequete.If a high steam
purity is reguired,then an external steamdrum with downcomers,risers may berequired adding to the cost.Steam purityin the ppb range may warrant an externalsteam separator.
SPACE AVAILABILITY AND LAYOUT
For the same duty,one can come withdifferent designs, depending on theavailability of space or layout.Multi-passfire tube or water tube designs canconserve space.Duty or pressure drop mayhave to be compntnised in some cases tofit a HRSG within given space.Hencespecifications should address thisaspect;modifications to the design at alater date may be expensive.
FUEL ANALYSIS,EMISSIONS
In the case of fired HRSGs.say gas turbineapplications,the specification should givethe complete fuel analysis as the type offiring equipment depends on the fuel andburner duty.Also,in case there areregulations on NOx or CO emissions.theseshould b« stated as dealing with themafter the HRSG is built could be a majorproblem.
CONCLUSION
Several variables influence the design andhence the cost of HRSGs.The above aspectsshould be considered in thespecifications,in addition to mechanicaldesign considerations such as corrosionallowance,code requirements and cosmeticaspects.These inputs in the specificationsearly in the project should help speed upthe process of design and evaluation.
Reference
V.Ganapathy,"Wastedeskbook",FairmontAtlanta,1991.
HeatPress,
Boiler
222
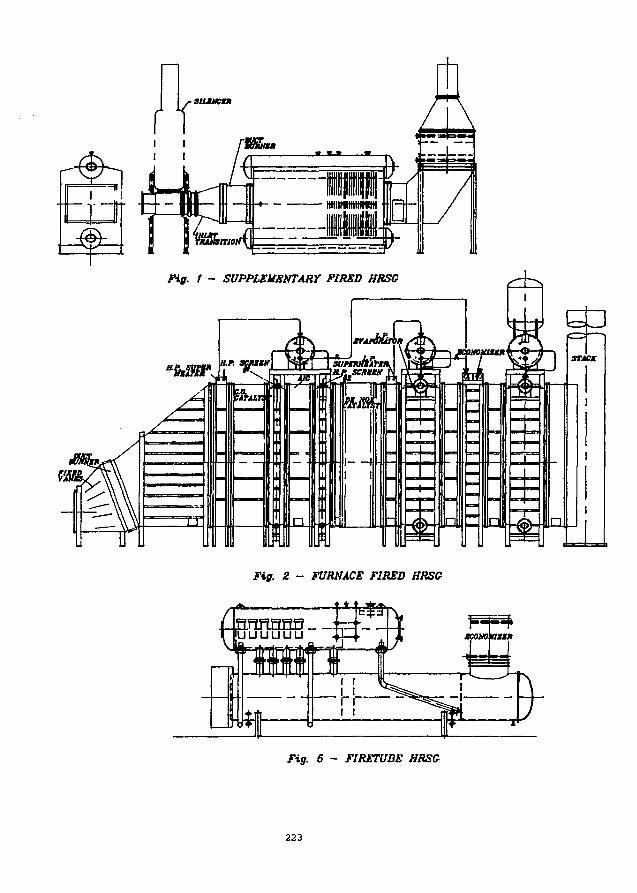
Fig. 1 - SUPPLEMENTARY FIRED HRSG
Fig. 2 - FURNACE FIRED HRSG
nflHHB__uuuuuu
Fig. 5 - FIRETUBE HRSG
223
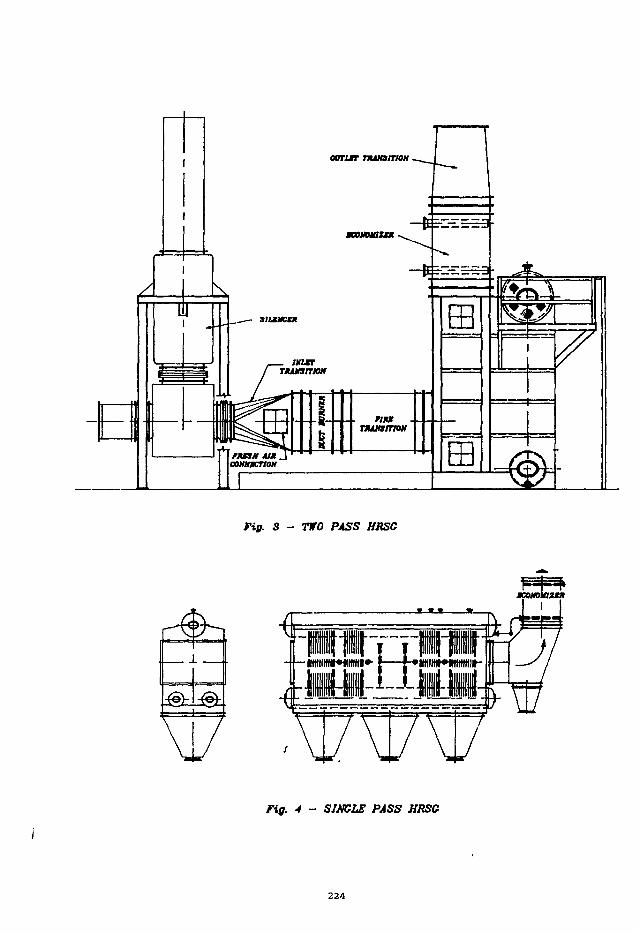
Fig. 3 - TWO PASS HRSG
ri
Fig. 4 - SINGLE PASS HRSG
224
NO CHEMICAL, ZERO BLEED COOLING TOWER WATER TREATMENT PROCESS
ALDEN L. COKE. CWS IV, PRESIDENT, AQUA-FLO, INC., BALTIMORE, MARYLAND
ABSTRACT
This paper describes a process to treatcooling tower water by means of a fully automatedand chemical free mechanical water treatmentprocess. This is an alternative to conventionalchemical treatment. Beginning with a suction pumpto draw water out of the tower sump, water goesthrough a permanent magnetic descaler to increasethe water solubility and begin the scaleinhibition process. This also descales existingscale build-up ir. the system. Ozone ismanufactured from ambient air and injected intothe bypass system through a venturi type injector.
This kills algae, slime and bacteria andenhances the magnetic descaling process. Thefinal stage filter separates solids from the waterto prevent corrosion from impingement. Thesesolids are automatically purged to the sanitarydrain. Clarified water is returned to the sumpwhere the process repeats on a 10Z-20Z by volumeside stream basis.
CAPITAL DECISIONS
Capital investments have historically beenbased on a return expected on the investment(ROI). While this is still true in principle, anew reason to make capital investments is sweepingthe country. Environmental concerns are causingdecision makers to evaluate the benefits ofreducing further damage to our planet byeliminating all the chemicals possible inmanufacturing processes and HVAC systems. Thefollowing information is provided with thisthought in mind.
NO TREATMENT
Why treat cooling tower water at all? Theanswer is, many people do not. They simplyoperate on very low cycles of concentration intheir sump, this gives them a low sludge level,and they rely on yearly or semi-annual scaleremoval on the heated surfaces of theircondensers, heat exchangers, etc. Of course,these same people generally end up not onlyreplacing the tower, but all of the auxiliaryequipment including condensers, compressors, heatexchangers, etc. in a shorter than normal lifespan than the equipment is engineered for.
CHEMICAL TREATMENT
As you know, the conventional chemicaltreatment includes biocides, corrosion inhibitors,scale inhibitors, and anti-foaming agents to treatthe various problems associated with cooling towerwater management.
For a long time, chromates and chromatecompounds were used as very effective watertreatment biocides and corrosion inhibitors untilEPA determined that the chromates werecarcinogenic and outlawed their use in the HVACmarket some years back. In several states, theyare already outlawed today for process coolingwater. Even the replacement organophosphatechemicals show a carcinogenic impact on laboratoryanimals. Why subject yourself and others to thiswhen there is a better wayJ Under heavy chemicaltreatment, towers often are due for repair withinfour or five years, and often times, don't lastfifteen years. These pictures were taken only 6months into a chemical treatment program. Thisnew tower was replaced after 15 years of chemicaltreatment that destroyed the original tower. Mostof the equipment manufacturers will tell you theirequipment should last for forty years with propercare and treatment. When you go to replace thecooling tower, the associated equipment such ascompressors, condensers, and chillers also need tobe replaced or repaired, and at a considerableexpense. These expenses far outweigh the cost ofproper water treatment, which can be doneeffectively, and economically, without the use ofany conventional chemical treatment. Thesepictures show an AQUA-FLO installation after onefull operational season.
DR'S STORY
Most of you in this room today remember thegood old days where it was thought that a healthybreakfast consisted of bacon, eggs, toast, butter,fried potatoes, heavy cream, and lots of sugar.Well, today medical science teaches us that whatwe thought was good for us back then is absolutelythe worst thing for us today, and may bring onhigh cholesterol, triglycerides, cardiovascularproblems, etc. These breakfast goodies are thelast thing that anybody should eat if they want tokeep their body in good physical condition. So,what used to be the good conventional breakfasthas recently become a "no-no" in today's medicalbooks. It is often like this with our watertreatment systems. We do something for so longthat it becomes "normal." People don't evenrealize that there are better ways to do it.
CONVENTIONAL WISDOM REPLACED
So the conventional wisdom of yesterday hasbeen replaced with better technology. Little bylittle, the conventional chemical technology isgiving way to non-chemical methods of watertreatment in cooling towers, boilers, spas,swimming pools, municipal water treatment systems,sewage and industrial waste water disposal, etc.
225

You can see this new technology taking hold allover America, and oddly enough, just like the newdiets of today, this technology is not brand new.Many of the techniques and equipment are proventechnology with a historical track record of overone hundred years. It is often only talked aboutin scientific literature and has not beenintroduced at the applied science level ofindustry.
HISTORICAL PROOF - OZONE
Ozonation is proven technology. Ozone hasbeen used commercially as a municipal waterdisinfectant in Europe, and specifically inFrance, since 1905. So, that's not newtechnology. Today there are over 1100 municipalwater treatment facilities around the world thatuse ozone as their primary water disinfectantsource. By contrast, municipal chlorination ofdrinking water was introduced in New Jersey in1908.
MAGNETICS
Magnetic water conditioner technology has aproven track record for 60 or 70 years as scaleinhibitors and descaling tools. Although some ofthe technology has been maligned during the past10 or 15 years in the U.S.A., it certainly isn'tmaligned in foreign countries where chemicals aretoo expensive to buy. This is primarily becausepeople don't understand the technology or theyexpect this equipment to do more than it isdesigned to do. Briefly, these devices changethe crystalline structure of minerals from a hardlinear calcite crystal to a soft rhomboid typearagonite crystal. They don't remove any hardnessminerals. Many of the chemical companies havebeen so paranoid regarding this particular subjectmatter that they have gone out of their way toattempt t.o keep the equipment off the market. Asa matter of fact, back in the 60's, W.R. GraceCompany purchased the old Packard magnetic waterconditioner lock, stock and barrel, andimmediately removed it from the marketplace, soit's never been heard of since. That is one wayto eliminate competitionl
FILTERS
Solid/liquid separators, media filters, andcentrifuges have a history of hundreds of years ofoperation. Even today, these different productsare not_well understood by the general mechanicalengineering people, however, they have a historiceffective operating history. In water treatmentof any kind, you must hrve appropriately selectedfiltration equipment.
CONTROLS
Different control & sensor devices used inour industry, such as oxidation reductionpotential controllers (ORP), pressure demandsensors and flow meters have a long history ofoperational effectiveness. We control theconcentration of ozone demand for a tower throughthe use of ORP equipment. This allows us toadjust tho ozone dosage to any degree we desire tomaintain low corrosion and scaling potentials inthe customer's equipment. Do they fail?Sometimes, like any mechanical device, that is whywe have a service & maintenance program available.
ENGINEERED SYSTEM
What we, at AQUA-FLO, have done is simplyengineered a number of independent technologiesand have synthesized these into a finishedengineered product which solves every singleuniversal problem associated with cooling towerwater treatment problems worldwide. It isimportant right now to understand that no singlepiece of our system, nor any single stand alonetreatment plan such as ozone, will ever solve yourwater treatment needs.
UNIVERSAL PROBLEMS
In researching the water quality managementproblems that each of you facilities and plantengineers are faced with, we uncovered fouruniversal problems that everyone is faced with,regardless of location, when you want to manageyour cooling tower water problems. These fouruniversal problems are algae, corrosion, scale,and sediment. There are always four, and thereare only four universal problems associated withmanaging the quality of cooling water.Occasionally, there are specific localizedproblems such as oil seepage or airbornecontaminants which are dealt with on a case bycase basis through our chemical engineeringdepartment which require additional specifictreatment.
ALGAE/SLIME
The first universal problem we attack isalgae and slime. We use ozone as the biocide tokill algae, slime, bacteria, and othermicroorganisms in the water supply. We use itbecause it can kill bacteria 15 times faster thanchlorine. Microorganisms do not become resistantto ozone, as they do with other chemicals. Ozonekills microorganisms by a process called cellularlysing. A single oxygen atom pierces the cellwall for instant destruction, whereas otherchemicals are diffused through the cell wall for aslower destruction process. Existing studiesclearly indicate that ozone is a more powerfulgermicide in all classes of microorganism
226

destruction by a factor of 5 to 100, dependingupon the microorganism being dealt with. Ozone issecond only to fluorine in its oxidizingpotential. Ozone is triatomic oxygen, that is,it's composed of three oxygen atoms. Oxygen or 02by itself is a very stable gas. 03, which isozone, is an extremely unstable gas, cannot bestored, and it has a extremely short half life,which allows it to be used in many applicationswhere a long term residual biocide effect is notdesirable, for plant or animal life. Ozone isself-destructive and leaves no chemical trailbehind. We manufacture ozone by the coronadischarge method. The air going through ourcorona discharge unit must be prepared, dried, andfiltered to give us a high percentage of ozonefrom our unit. Either oxygen or air dried tominus 60~F. can be used as the feed gas. Theoxygen feed gas is substantially more efficientfor ozone production. The results of using ozoneregarding algae problems are that the customerdoesn't have any algae, bacteria, or slime intheir system!
CORROSION
The second universal problem that isencountered is corrosion. The major source ofcorrosion in cooling towers is acid from sulfidereducing bacteria. When these bacteria aredestroyed by the use of ozone, we eliminate thebasic cause of this type corrosion. Another typeof corrosion can be caused through impingement.Impingement is the constant pitting of the metalparts in tiie system from suspended solids in thewater, and in order to get rid of these solids inthe water, our filtration process is designed toeliminate the majority of solids down to the 30micron level. Severe corrosion is also caused bywater treatment chemicals. When chlorine is usedas a biocide, it forms a soluble metal halide oncontact with metal parts. An example of thiswould be copper chloride. On the other hand,ozone forms an insoluble metal oxide as a thinlayered skin which prevents further oxidation.Fine filtration prevents rupturing this metaloxide skin, thereby eliminating further corrosion.So, you can see that the corrosion problem issolved through two features of our equipment.That is through the ozone process, as well as thefiltration process, and the results that areobtained are corrosion factors of less than 2 milsper year.
SCALE
Scale is the third universal problem, andlike corrosion, there are two parts of ourequipment that solve this problem. The primaryscale inhibitor in our system is our permanentAQUA-FLO magnetic descaling unit. The technologyin this case is to reverse the polarity potentialso that these minerals don't tend to bond to the
negative plumbing walls. Under normalcircumstances, when water flows through a pipingsystem at a given velocity, you develop a positivemillivolt potential within the system. Thispotential can be measured with a multi meter onthe voltage scale. When we place our AQUA-FLOdescalers in-line, the polarity of this millivoltpotential is reversed to a negative millivoltpotential, rather than a positive millivoltpotential, and this is what reduces the polarbonding to the interior piping walls which is theprimary cause of scale build up. Ozone plays nopart in eliminating this primary cause of scaling.Minerals that cause scale build up in heated andchilled systems are primarily calcium andmagnesium ions. These ions are positivelycharged, and when precipitated, tend to formcalcium carbonate and calcium biocarbonate scalewhich readily bonds to the negatively charged ornegatively grounded plumbing and piping systemsthat act as the water conduits. Ozone can be ahelp in the descaling process when scale hasbonded through organic secretions which act asglue for the scale particles to build on. Theozone dissolves this glue or mucilage typematerial and helps scale formation to pass onthrough the system. Without microbial infestationin the system, this mucilage material will notexist. The magnetic AQUA-FLO unit acts as theprimary scale inhibitor and continues to dissolvescale build up to less than 1/2 millimeter in thesystem. 1/16" scale reduces heat transferefficiency by 152. On a 600 ton tower, that costsmore than $33,000 per year in wasted electricalcharges based on $0.06/Kwh. So the results ofthis aspect of our equipment means there are nocondensers to acid treat or rod out, and weincrease heat transfer efficiency accordinglythrough this energy saving device.
SLUDGE
The fourth and final universal problem is theproblem of sludge and sediment. As the waterevaporates out of the tower, minerals in the towerfall to the bottom of the sump, and at some pointin time, must be removed. Also, a substantialamount of dust particles from the air are drav/ninto the sump and add to the volume of sedimentand sludge in the system. A small 600 ton toweroperating at 5 cycles of concentration with totaldissolved solids content in the makeup water of250 parts per million will deposit 55 pounds ofsediment on a daily basis. That is about 10 tonsa year plus the airborne deposits. So, with thefinal universal problem of sediment solved by ourfiltration system, there are no sumps to clean,and no toxic waste land fill or dump charges to beconcerned with. Additionally, with thischemically free system, there are no MSDS forms tofile or reports to forward to your local DER.Results are a crystal clear water system with nochemical additives and no sump to clean.
227

CONTROLS
To make all of these individual parts of thepuzzle work together, we put in variouscontrollers, sensors, and instrumentation. OurService Agreement provides for two types of checkson scale and corrosion. One is a monthlyLanglier Saturation Index water test done by ourlocal trained service technician. The other testis a semi-annual corrosion coupon test done by athird party chemical laboratory. Our systemperformance is adjustable --similar to adjustingthe amount of chemicals that a chemical contractorwill recommend. During our monthly performancecheck, if we find the system is either scaling orcorrosion is taking place, our technician willadjust the parameters on our controllers. When weput the system all together, it looks like this.
BENEFITS
Water conservation is one benefit. A 600 toncooling tower at 5 cycles of concentration willbleed in excess of 6,000 gallons a day, over 2million gallons a year, and that's a lot of waterto waste for one small tower.
Another benefit is that up to 10Z heattransfer and condenser horsepower efficiency canbe increased. Additionally, this equipment isenvironmentally and ecologically the safesttreatment available, and I might add again, at avery affordable price. If budget capital is notavailable, we can lease or rent the equipment.Most of the time, we can develop a positive cashflow within your existing operating budget. Let'slook at the figures.
WARRANTY
One of the outstanding features of our systemis that of our guarantees and warranty. We offera five year full service, maintenance, andwarranty on our equipment and provide a monthlyand semiannual equipment monitoring program toassure you of excellent water quality parametersfor your equipment. The parameters we maintain onyour equipment are:
Corrosion < 2 mils/yearScale build up < .5 mm
Any equipment manufacturer will tell you thatif you can maintain your water quality to providethose parameters, you should experience theprojected life-span of 40 years on your equipment,not 5, 10 or 15 years which is often times thecase under heavy chemical treatment.
OPERATIONAL COSTS
Operational costs of our system on a 600 tontower amount to less than $1900.00 per year.
WHERE TO START
To wrap it up, all systems are sitespecifically engineered, and controls are customdesigned to customer requirements. Quotations areonly made after we receive a completed "CoolingTower Engineering Data Work Sheet," which answersa number of questions we need to have answeredbefore quoting a price and guaranteeing thewarranty on a system.
228
Steam Path Audits on Industrial Steam Turbines
DOUGLAS R. MITCHELL. ENGINEER. ENCOTECH, INC., SCHENECTADY, NEW YORK
ABSTRACT
The electric utility industry hasbenefitted from steam path audits on steamturbines for several years. Benefitsinclude the ability to identify areas ofperformance degradation during a turbineoutage. Repair priorities can then be setin accordance with quantitative resultsfrom the steam path audit. As a result ofoptimized repair decisions, turbineefficiency increases, emissions decrease,and maintenance expenses decrease. Thesebenefits can be achieved by using acomputer program Encotech, Inc. developedfor the utility industry to perform steampath audits. With the increased emphasison industrial turbine efficiency, and as aresult of the experience with the DestecOperating Company, Encotech is adapting thecomputer program to respond to the needs ofthe industrial steam turbine community.This paper describes the results of usingthe STPE computer program to conduct asteam path audit at Destec Energy'sLyondell Cogeneration power plant.
INTRODUCTION
This paper presents the results of asteam path audit conducted at DestecEnergy's Lyondell Cogeneration power plantin Houston, Texas. The purpose of theaudit was to identify specificopportunities to improve the efficiency ofthe Lyondell steam turbine. The turbineaudit was performed using Encotech's SteamTurbine Performance Evaluation computerprogram (STPE)1. This audit was the firstapplication of the STPE program on anindustrial power plant cycle.
Destec Energy's objective for theturbine outage was to perform non-destructive testing and to implementplanned maintenance actions. A steam pathaudit was performed to help identify theturbine steam path losses so plantpersonnel could determine the most cost-effective way to spend maintenance dollars.
The steam path audit identifiedseveral areas of potential performance
'Copyright 19B9-1992 by Encotech, Inc., all rights reserved.
improvement and the Lyondell facility wasable to recover 3,387 KW, a recovery ofover 52% of the total steam path loss.
BACKGROUND
In the electric utility industry, fuelcosts are normally 70% to 80% of theoperating costs to produce electricity.Steam path audits help utilities setmaintenance priorities based on turbineheat rate losses. The benefit to theutility is fuel savings as a result ofimproved turbine efficiency.
For the industrial steam turbinecycle, maintenance priorities are morelikely assigned on a kilowatt loss basis.Steam path audits help industrialgenerators set maintenance priorities basedon the power loss. The benefit toindustrial power generators is an increasein sellable power output as a result ofimproved turbine efficiency.
The Lyondell facility is a combinedcycle power plant where a gas turbine heatrecovery system supplies steam to the steamturbine. Since this steam is a byproductof the gas turbine exhaust, fuel to heatthe steam is not a direct cost to producingpower in the steam turbine. Increasingturbine efficiency, therefore, benefits theLyondell facility by increasing poweroutput.
DESCRIPTION OF THE STEAM PATH AUDIT
The basic approach of the STPE basedsteam path audit is to examine the entireturbine steam path in detail and thencompare the "as-found" condition with the"new-and-clean" condition of the machine.The new-and-clean performance of theLyondell steam turbine was modeled in STPEusing the valves-wide-open heat balance.Although complete restoration to the new-and-clean condition is generally notpossible, this design model provides afixed standard against which to makecomparisons.
A complete steam path audit consistsof three steps:
(1) Steam turbine cycle computer modeling(2) Steam path inspection before repairs(3) Steam path inspection after repairs
229
fitflfn TUlTpine Modeling:Before the on-site steam path audit workbegins, a computer model of the steamturbine and turbine cycle is generatedusing STPE. The model is unique to eachsteam turbine and forms the basis forevaluating the steam path audit data.
A steam turbine cycle model is builtusing the information provided in theturbine design heat balance, turbine cross-section, and first stage shell pressurecurve. Steam seal diagrams are used todefine packing type, configuration, anddesign clearance. Turbine geometry is usedto determine seal flow diameter and stageflow area. Data taken on-site is also usedto refine the turbine model for the flowpath geometry.
Opening Steam Path Audit:An opening steam path audit was conductedon the Lyondell steam turbine. Its purposewas to estimate the overall turbine powerloss, to identify power losses on a stage-by-stage basis, and to identify particularproblem areas. Results from the openingaudit showed the potential power thatDestec could recover from steam pathrepairs.
Opening steam path audits begin whenthe turbine casings are removed and thesteam path is exposed. While the rotor isin the lower half shells, the overallcondition of the steam path is examined forany abnormalities and clearances aremeasured for steam packings and spillstrips. The horizontal joint is inspectedfor miscellaneous leakages and the steampath surface finish is examined (1).
To get a better representation of thepacking and spill strip flow area thanhorizontal joint clearances can supply,packing tooth height measurements are madeon all upper half radial spill strips,interstage packings, root spill strips andend packings. Once the turbine rotor isremoved, tooth heights are measured onbottom half packings and spill strips.Clearances and tooth heights as well astooth roundness are used to calculate theflow through the packing or spill strip (2).
Along with evaluation of steampackings, measurements are made of otheritems which affect the turbine performance.An evaluation of the roughness of flow pathsurfaces (3) is done. The steam path isexamined for nozzle partitions withthickened trailing edges, and depositsunder the rotating blade covers.Measurements are also made of all observedsolid and liquid particle erosion,mechanical damage, and deposits. Themeasured changes in turbine condition are
evaluated to determine the impact on theturbine output power (4, 5).
Four to five calendar days arerequired to gather all of the data neededfor a complete opening steam path audit ona unit such as the Lyondell turbine. Dataacquisition for the turbine audit coincideswith the dismantling of the turbine anddoes not extend the turbine outage. Toassure that all of the turbine audit dataare available, the audit engineer must beat the turbine site the day the steam pathis first exposed.
A report of the opening audit findingsis generated to describe the as-foundcondition of the steam path. This reportis presented to site personnel somaintenance decisions can be evaluated.
Closing Steam Path Audit:A closing steam path audit was alsoconducted on the Lyondell steam turbine.Its purpose was to estimate the return-to-service performance of the turbine and toevaluate the effectiveness of the repairs.A comparison between the opening andclosing steam path audit results shows theexpected performance recovery as a resultof the turbine maintenance.
A closing steam path audit consists ofthe same turbine inspection and evaluationas the opening audit. Data acquisition forthe closing audit coincides with theturbine assembly. To assure that allturbine audit data are available, the auditengineer must be at the turbine site theday before the rotor is to be placed in thelower half casing.
To perform a closing steam path auditrequires three to four days. The timerequired is generally less than that for anopening audit because replaced items areusually in better condition and thereforeeasier and quicker to evaluate. Forexample, deposits on steam path componentsare removed by grit blasting so measurementof deposits is unnecessary.
Steam Turbine Audit Background:The steam turbine audits performed at theLyondell facility were performed using theSteam Turbine Performance Evaluationcomputer program. The STPE program wasdeveloped for utility use in cooperationwith Southern California Edison (6). Priorto STPE's completion, Southern CaliforniaEdison (SCE) tested beta versions in thefield. SCE utilized pre- and post-outageperformance test results and pre- and post-repair turbine audit results to test theability of STPE to identify turbine losses.For SCE's and other performance testing,good correlation between the performance
230
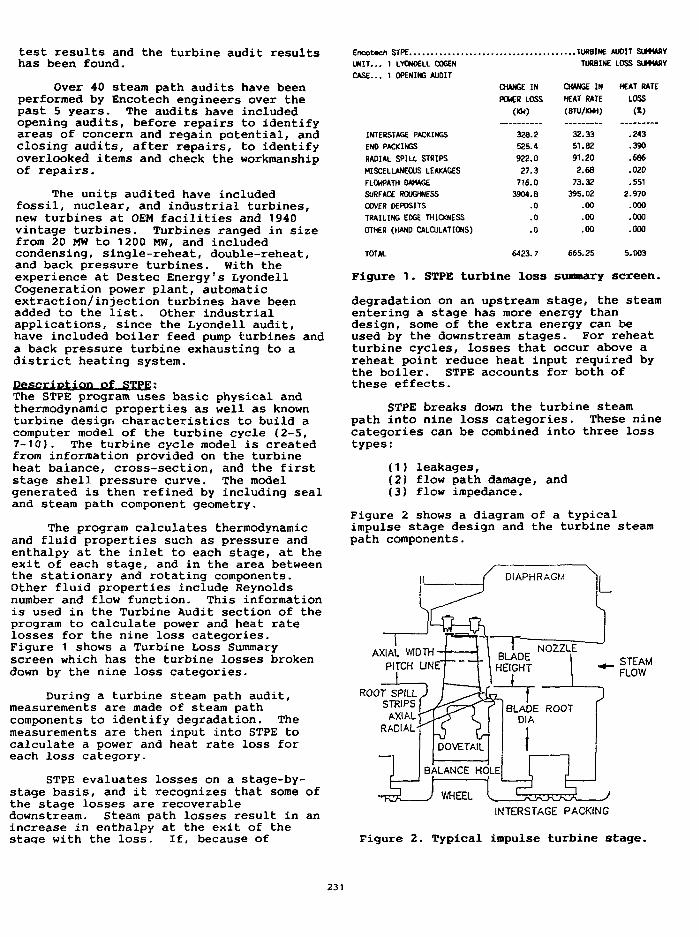
test results and the turbine audit resultshas been found.
Over 40 steam path audits have beenperformed by Encotech engineers over thepast 5 years. The audits have includedopening audits, before repairs to identifyareas of concern and regain potential, andclosing audits, after repairs, to identifyoverlooked items and check the workmanshipof repairs.
The units audited have includedfossil, nuclear, and industrial turbines,new turbines at OEM facilities and 1940vintage turbines. Turbines ranged in sizefrom 20 MW to 1200 MW, and includedcondensing, single-reheat, double-reheat,and back pressure turbines. With theexperience at Destec Energy's LyondellCogeneration power plant, automaticextraction/injection turbines have beenadded to the list. Other industrialapplications, since the Lyondell audit,have included boiler feed pump turbines anda back pressure turbine exhausting to adistrict heating system.
Description of STPE:The STPE program uses basic physical andthermodynamic properties as well as knownturbine design characteristics to build acomputer model of the turbine cycle (2-5,7-10). The turbine cycle model is createdfrom information provided on the turbineheat balance, cross-section, and the firststage shell pressure curve. The modelgenerated is then refined by including sealand steam path component geometry.
The program calculates thermodynamicand fluid properties such as pressure andenthalpy at the inlet to each stage, at theexit of each stage, and in the area betweenthe stationary and rotating components.Other fluid properties include Reynoldsnumber and flow function. This informationis used in the Turbine Audit section of theprogram to calculate power and heat ratelosses for the nine loss categories.Figure 1 shows a Turbine Loss Summaryscreen which has the turbine losses brokendown by the nine loss categories.
During a turbine steam path audit,measurements are made of steam pathcomponents to identify degradation. Themeasurements are then input into STPE tocalculate a power and heat rate loss foreach loss category.
STPE evaluates losses on a stage-by-stage basis, and it recognizes that some ofthe stage losses are recoverabledownstream. Steam path losses result in anincrease in enthalpy at the exit of thestape with the loss. If, because of
Encotach STPEU N I T . . . 1 LYONDELL COGEN
CASE.. . 1 OPENING AUDIT
INTERSTAGE PACKINGS
END PACKINGS
RADIAL SPILL STRIPS
MISCELLANEOUS LEAKAGES
FLOWPATH DAMAGE
SURFACE ROUGHNESS
COVER DEPOSITS
TRAILING EDGE THICKNESS
OTHER (HAND CALCULATIONS)
CHANGE IN
POWER LOSS
<KW)
328 .2
525.4
9 2 2 . 0
27.3
716.0
3904. B
.0
.0
.0
TURBINETURBINE
CHANGE IN
HEAT RATE
(BTU/KWH)
32.33
SI . 82
91.20
2.68
73.32
395.02.00
.00
.00
AUDIT s u m mLOSS surtwRv
HEAT RATE
LOSS
<*)
.243
.390
.686
.020
.551
2.970
.000
.000
.000
TOTAL 6423.7 665.25 5.003
Figure 1. STPE turbine loss summary screen.
degradation on an upstream stage, the steamentering a stage has more energy thandesign, some of the extra energy can beused by the downstream stages. For reheatturbine cycles, losses that occur above areheat point reduce heat input required bythe boiler. STPE accounts for both ofthese effects.
STPE breaks down the turbine steampath into nine loss categories. These ninecategories can be combined into three losstypes:
(1) leakages,(2) flow path damage,(3) flow impedance.
and
Figure 2 shows a diagram of a typicalimpulse stage design and the turbine steampath components.
AXIAL WIDTHPITCH L I N E " " STEAM
FLOW
ROOT SPILLSTRIPS
AXIALRADIAL-
INTERSTAGE PACKING
Figure 2. Typical impulse turbine stage.
231
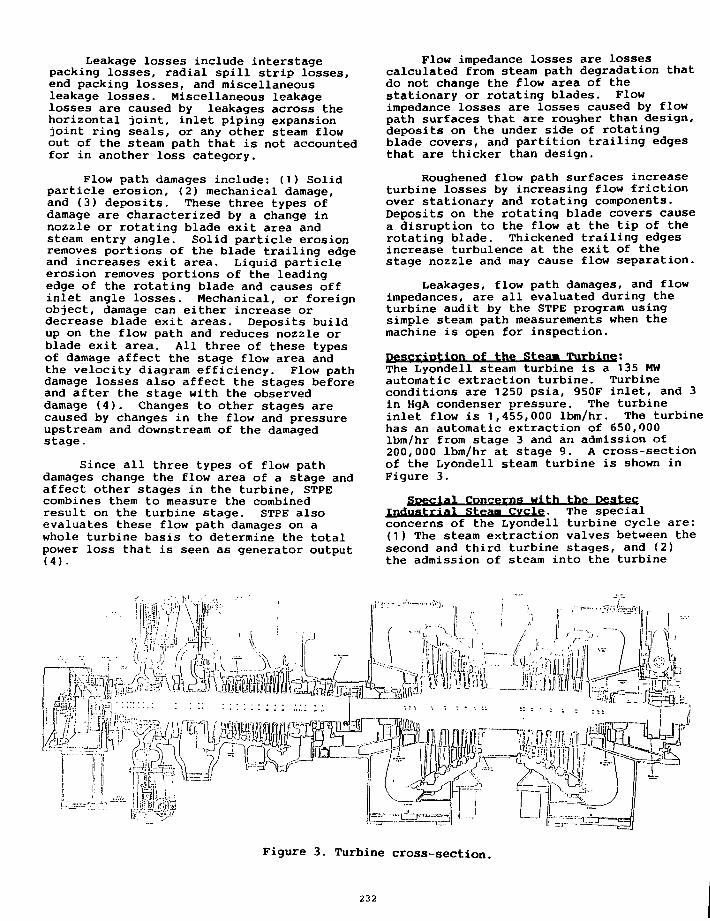
Leakage losses include interstagepacking losses, radial spill strip losses,end packing losses, and miscellaneousleakage losses. Miscellaneous leakagelosses are caused by leakages across thehorizontal joint, inlet piping expansionjoint ring seals, or any other steam flowout of the steam path that is not accountedfor in another loss category.
Flow path damages include: (1) Solidparticle erosion, (2) mechanical damage,and (3) deposits. These three types ofdamage are characterized by a change innozzle or rotating blade exit area andsteam entry angle. Solid particle erosionremoves portions of the blade trailing edgeand increases exit area. Liquid particleerosion removes portions of the leadingedge of the rotating blade and causes offinlet angle losses. Mechanical, or foreignobject, damage can either increase ordecrease blade exit areas. Deposits buildup on the flow path and reduces nozzle orblade exit area. All three of these typesof damage affect the stage flow area andthe velocity diagram efficiency. Flow pathdamage losses also affect the stages beforeand after the stage with the observeddamage (4). Changes to other stages arecaused by changes in the flow and pressureupstream and downstream of the damagedstage.
Since all three types of flow pathdamages change the flow area of a stage andaffect other stages in the turbine, STPEcombines them to measure the combinedresult on the turbine stage. STPE alsoevaluates these flow path damages on awhole turbine basis to determine the totalpower loss that is seen as generator output(4).
Flow impedance losses are lossescalculated from steam path degradation thatdo not change the flow area of thestationary or rotating blades. Flowimpedance losses are losses caused by flowpath surfaces that are rougher than design,deposits on the under side of rotatingblade covers, and partition trailing edgesthat are thicker than design.
Roughened flow path surfaces increaseturbine losses by increasing flow frictionover stationary and rotating components.Deposits on the rotating blade covers causea disruption to the flow at the tip of therotating blade. Thickened trailing edgesincrease turbulence at the exit of thestage nozzle and may cause flow separation.
Leakages, flow path damages, and flowimpedances, are all evaluated during theturbine audit by the STPE program usingsimple steam path measurements when themachine is open for inspection.
Description of the SteflU Turbine:The Lyondell steam turbine is a 135 MWautomatic extraction turbine. Turbineconditions are 1250 psia, 950F inlet, and 3in HgA condenser pressure. The turbineinlet flow is 1,455,000 lbm/hr. The turbinehas an automatic extraction of 650,000lbm/hr from stage 3 and an admission of200,000 lbm/hr at stage 9. A cross-sectionof the Lyondell steam turbine is shown inFigure 3.
Special Concerns with the PestecIndustrial Stpaa Cycle. The specialconcerns of the Lyondell turbine cycle are:(1) The steam extraction valves between thesecond and third turbine stages, and (2)the admission of steam into the turbine
Figure 3. Turbine cross-section.
232
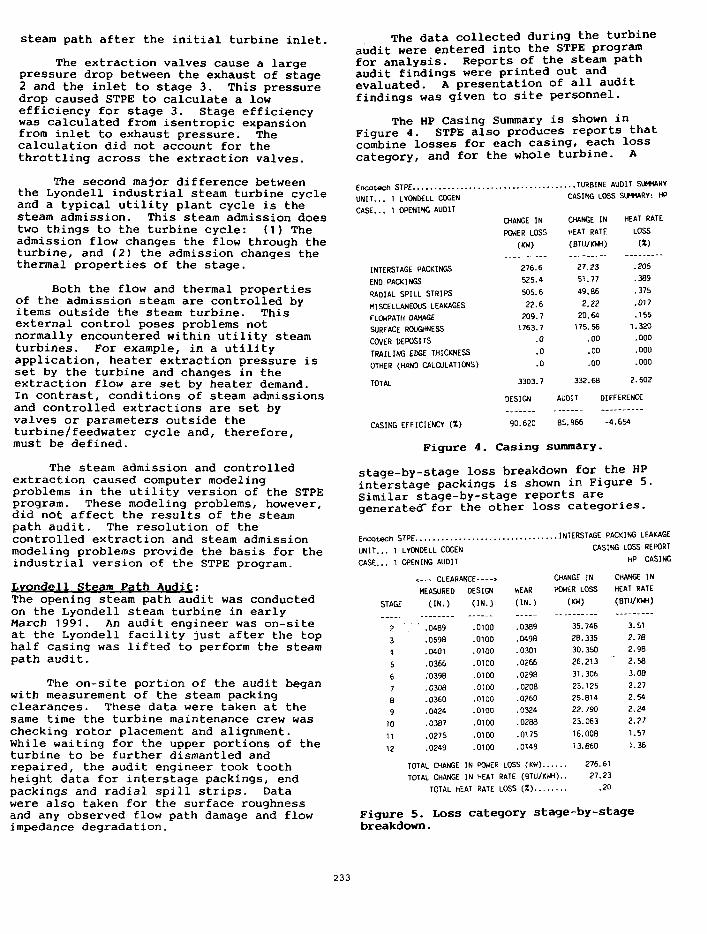
steam path after the initial turbine inlet.
The extraction valves cause a largepressure drop between the exhaust of stage2 and the inlet to stage 3. This pressuredrop caused STPE to calculate a lowefficiency for stage 3. Stage efficiencywas calculated from isentropic expansionfrom inlet to exhaust pressure. Thecalculation did not account for thethrottling across the extraction valves.
The second major difference betweenthe Lyondell industrial steam turbine cycleand a typical utility plant cycle is thesteam admission. This steam admission doestwo things to the turbine cycle: (1) Theadmission flow changes the flow through theturbine, and (2) the admission changes thethermal properties of the stage.
Both the flow and thermal propertiesof the admission steam are controlled byitems outside the steam turbine. Thisexternal control poses problems notnormally encountered within utility steamturbines. For example, in a utilityapplication, heater extraction pressure isset by the turbine and changes in theextraction flow are set by heater demand.In contrast, conditions of steam admissionsand controlled extractions are set byvalves or parameters outside theturbine/feedwater cycle and, therefore,must be defined.
The steam admission and controlledextraction caused computer modelingproblems in the utility version of the STPEprogram. These modeling problems, however,did not affect the results of the steampath audit. The resolution of thecontrolled extraction and steam admissionmodeling problems provide the basis for theindustrial version of the STPE program.
Lvondell Steam Path Audit:The opening steam path audit was conductedon the Lyondell steam turbine in earlyMarch 1991. An audit engineer was on-siteat the Lyondell facility just after the tophalf casing was lifted to perform the steampath audit.
The on-site portion of the audit beganwith measurement of the steam packingclearances. These data were taken at thesame time the turbine maintenance crew waschecking rotor placement and alignment.While waiting for the upper portions of theturbine to be further dismantled andrepaired, the audit engineer took toothheight data for interstage packings, endpackings and radial spill strips. Datawere also taken for the surface roughnessand any observed flow path damage and flowimpedance degradation.
The data collected during the turbineaudit were entered into the STPE programfor analysis. Reports of the steam pathaudit findings were printed out andevaluated. A presentation of all auditfindings was given to site personnel.
The HP Casing Summary is shown inFigure 4. STPE also produces reports thatcombine losses for each casing, each losscategory, and for the whole turbine. A
UNIT... 1 LYONDELL COGENCASE... 1 OPENING AUOIT
INTERSTAGE PACKINGS
ENO PACKINGSRADIAL SPILL STRIPSMISCELLANEOUS LEAKAGESFLOWPATH DAMAGESURFACE ROUGHNESSCOVER DEPOSITSTRAILING EDGE THICKNESSOTHER (HAND CALCULATIONS)
TOTAL
CHANGE INPOWER LOSS
(KW>
276.6
525.4505.622.6209.71763.7
.0
.0
.0
3303.7
DESIGN
TURBINE AUDIT SUMMARYCASING LOSS
CHANGE INHEAT RATE(BTU/KWH)
27.2351.77
49.86
2.2220.64175.56
.00
.00
.00
332.68
SUMMARY: HP
HEAT RATELOSS
(X)
.205
.389
.375
.017
.1551.320.000
.000
.000
2.502
AUDIT DIFFERENCE
CASING EFFICIENCY (X) 90.620 85.966 -4.654
Figure 4. Casing summary.
stage-by-stage loss breakdown for the HPinterstage packings is shown in Figure 5.Similar stage-by-stage reports aregenerated" for the other loss categories.
Encotech S
UNIT... 1CASE... 1
STAGE
?
3)
567891011
12
THELYONDELL COGENOPENING AUDIT
1
< CLEARANCE >MEASURED
(IN.)
. ' .0489.059B.0401.0366.0398.0308.0360.0424.0387
.0275
.0249
TOTAL CHANGETOTAL CHANGE
DESIGN
(IN.)
.0100
.0100
.0100
.0100
.0100
.0100
.0100
.0100
.0100
.0100
.0100
IN POWERIN HEAT
TOTAL HEAT RATE
WEAR
(IN.)
.0389
.0498
.0301
.0266
.0298
.0208
.0260
.0324
.0288
.0175
.0149
LOSS (KW).
CASING LOSS REPORT
CHANGE INPOWER LOSS
(KW)
35.74628.33530.35026.213
31.30623.12525.81422. 79023.063
16.008
13.860
276.61
RATE (BTU/KWH).. 27.23
LOSS (Z)... .20
HP CASING
CHANGE INHEAT RATE(BTU/KWH)
3.512.762.982.58
3.082.272.542.242.271.57
1.36
Figure 5. Loss category stage-by-stagebreakdown.
233
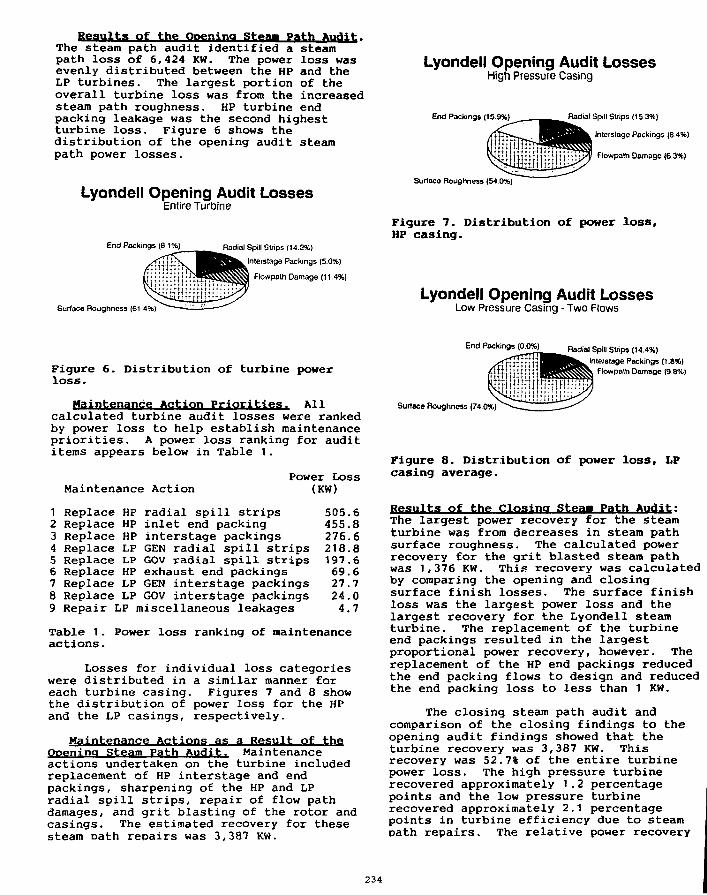
Results of the Opening Sfq«« Path Audit.The steam path audit identified a steampath loss of 6,424 KW. The power loss wasevenly distributed between the HP and theLP turbines. The largest portion of theoverall turbine loss was from the increasedsteam path roughness. HP turbine endpacking leakage was the second highestturbine loss. Figure 6 shows thedistribution of the opening audit steampath power losses.
Lyondell Opening Audit LossesEntire Turbine
End Packings (8.1%)
Surface Roughness (61 .4%)
Radial Spill Strips (14.2%)
Interstage Packings (5.0%)
Flowpath Oamage (11.4%)
Lyondell Opening Audit LossesHigh Pressure Casing
End Packings (15.9%)
Surface Roughness (54 0%)
Radial Spill Strips (15 3%)
Interstage Packings (8 4%)
Flowpaih Damage (6.3%)
Figure 7. Distribution of power loss,HP casing.
Lyondell Opening Audit LossesLow Pressure Casing - Two Flows
Figure 6. Distribution of turbine powerloss.
Maintenance Action Priorities. Allcalculated turbine audit losses were rankedby power loss to help establish maintenancepriorities. A power loss ranking for audititems appears below in Table 1.
Maintenance ActionPower Loss
(KW)
1 Replace HP radial spill strips 505.62 Replace HP inlet end packing 455.83 Replace HP interstage packings 276.64 Replace LP GEN radial spill strips 218.85 Replace LP GOV radial spill strips 197.66 Replace HP exhaust end packings 69.67 Replace LP GEN interstage packings 27.78 Replace LP GOV interstage packings 24.09 Repair LP miscellaneous leakages 4.7
Table 1. Power loss ranking of maintenanceactions.
Losses for individual loss categorieswere distributed in a similar manner foreach turbine casing. Figures 7 and 8 showthe distribution of power loss for the HPand the LP casings, respectively.
Maintenance Actions as a Result of theOpening Steam Path Audit. Maintenanceactions undertaken on the turbine includedreplacement of HP interstage and endpackings, sharpening of the HP and LPradial spill strips, repair of flow pathdamages, and grit blasting of the rotor andcasings. The estimated recovery for thesesteam Dath repairs was 3,387 KW.
End Packings (0.0%) Radial Spill Strips (14.4%)Interstage Packings (1.8%)
Flowpa* Damage (9 8%)
Surface Roughness (74.0%)
Figure 8. Distribution of power loss, LPcasing average.
Results of the Closing Audit:The largest power recovery for the steamturbine was from decreases in steam pathsurface roughness. The calculated powerrecovery for the grit blasted steam pathwas 1,376 KW. This recovery was calculatedby comparing the opening and closingsurface finish losses. The surface finishloss was the largest power loss and thelargest recovery for the Lyondell steamturbine. The replacement of the turbineend packings resulted in the largestproportional power recovery, however. Thereplacement of the HP end packings reducedthe end packing flows to design and reducedthe end packing loss to less than 1 KW.
The closing steam path audit andcomparison of the closing findings to theopening audit findings showed that theturbine recovery was 3,387 KW. Thisrecovery was 52.7% of the entire turbinepower loss. The high pressure turbinerecovered approximately 1.2 percentagepoints and the low pressure turbinerecovered approximately 2.1 percentagepoints in turbine efficiency due to steamoath repairs. The relative power recovery
234
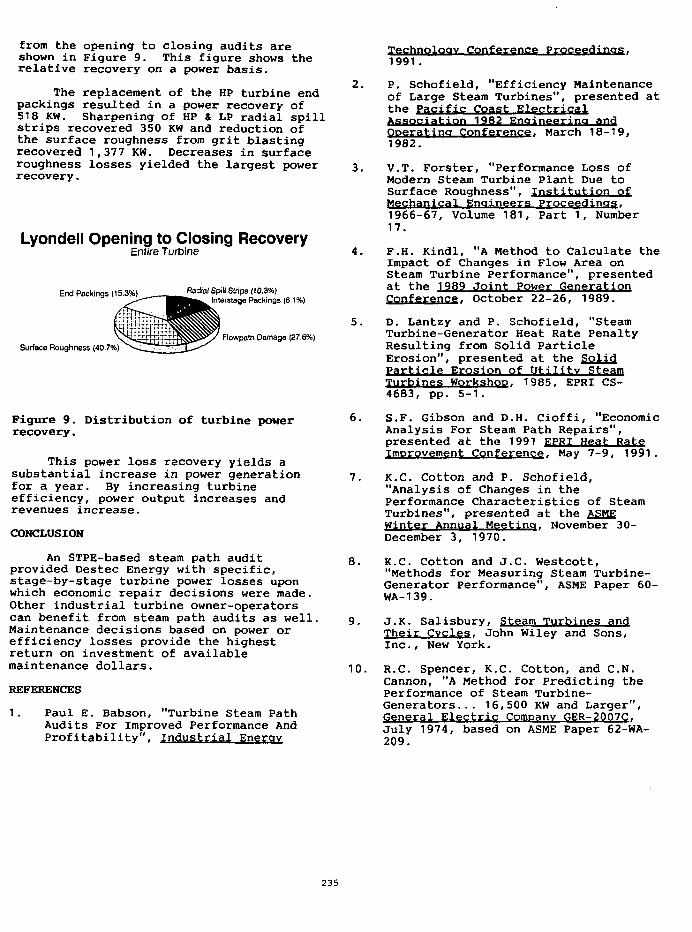
from the opening to closing audits areshown in Figure 9. This figure shows therelative recovery on a power basis.
The replacement of the HP turbine endpackings resulted in a power recovery of518 KW. Sharpening of HP & LP radial spillstrips recovered 350 KW and reduction ofthe surface roughness from grit blastingrecovered 1,377 KW. Decreases in surfaceroughness losses yielded the largest powerrecovery.
Lyondell Opening to Closing RecoveryEntire Turbine
End Packings (15.3%)
Surface Roughness (40.7%)
Radial Spill Strips (10.3%)Interstage Packings (6.1%)
Flowpath Damage (27.6%)
Figure 9. Distribution of turbine powerrecovery.
This power loss recovery yields asubstantial increase in power generationfor a year. By increasing turbineefficiency, power output increases andrevenues increase.
CONCLUSION
An STPE-based steam path auditprovided Destec Energy with specific,stage-by-stage turbine power losses uponwhich economic repair decisions were made.Other industrial turbine owner-operatorscan benefit from steam path audits as well.Maintenance decisions based on power orefficiency losses provide the highestreturn on investment of availablemaintenance dollars.
REFERENCES
1. Paul E. Babson, "Turbine Steam PathAudits For Improved Performance AndProfitability", Industrial Energy
Technology Conference Proceedings.1991.
2. P. Schofield, "Efficiency Maintenanceof Large Steam Turbines", presented atthe Pacific Coast ElectricalAssociation 1982 Engineering andOperating Conference. March 18-19,1982.
3. V.T. Forster, "Performance Loss ofModern Steam Turbine Plant Due toSurface Roughness", Institution ofMechanical Engineers Proceedings.1966-67, Volume 181, Part 1, Number17.
4. F.H. Kindl, "A Method to Calculate theImpact of Changes in Flow Area onSteam Turbine Performance", presentedat the 1989 Joint Power GenerationConference. October 22-26, 1989.
5. D. Lantzy and P. Schofield, "SteamTurbine-Generator Heat Rate PenaltyResulting from Solid ParticleErosion", presented at the SolidParticle Erosion of Utility SteamTurbines Workshop. 1985, EPRI CS-4683, pp. 5-1.
6. S.F. Gibson and D.H. Cioffi, "EconomicAnalysis For Steam Path Repairs",presented at the 1991 EPRI Heat RateImprovement Conference. May 7-9, 1991.
7. K.C. Cotton and P. Schofield,"Analysis of Changes in thePerformance Characteristics of SteamTurbines", presented at the ASMEWinter Annual Meeting. November 30-December 3, 1970.
8. K.C. Cotton and J.C. Westcott,"Methods for Measuring Steam Turbine-Generator Performance", ASME Paper 60-WA-139.
9. J.K. Salisbury, Steam Turbines andTheir Cycles. John Wiley and Sons,Inc., New York.
10. R.C. Spencer, K.C. Cotton, and C.N.Cannon, "A Method for Predicting thePerformance of Steam Turbine-Generators. .. 16,500 KW and Larger",General Electric Company GER-2007C.July 1974, based on ASME Paper 62-WA-209.
235
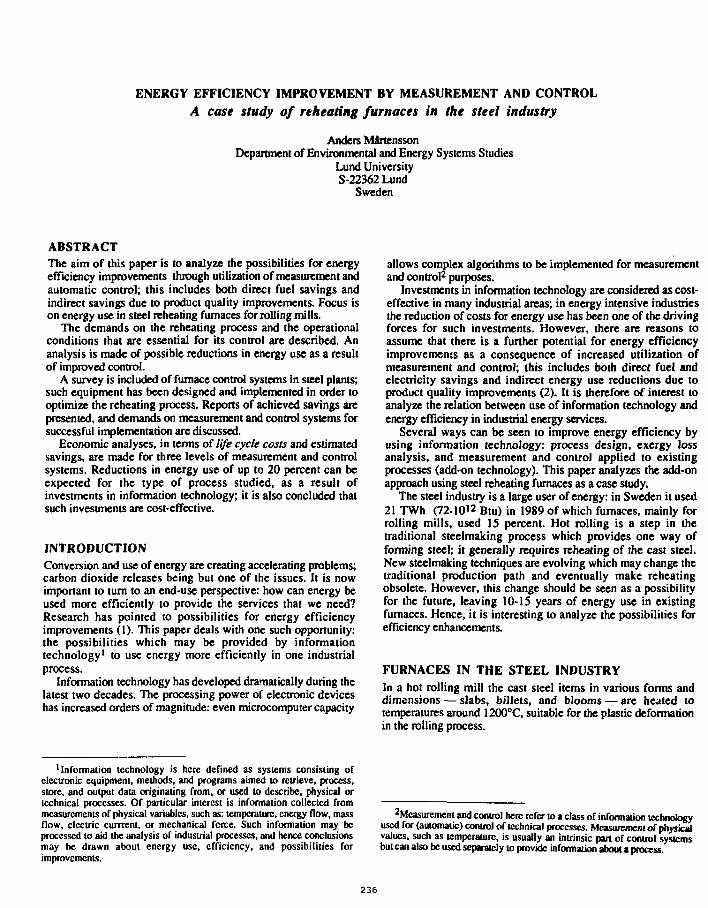
ENERGY EFFICIENCY IMPROVEMENT BY MEASUREMENT AND CONTROL
A case study of reheating furnaces in the steel industry
Anders MSrtcnssonDepartment of Environmental and Energy Systems Studies
Lund UniversityS-22362 Lund
Sweden
ABSTRACTThe aim of this paper is to analyze the possibilities for energyefficiency improvements through utilization of measurement andautomatic control; this includes both direct fuel savings andindirect savings due to product quality improvements. Focus ison energy use in steel reheating furnaces for rolling mills.
The demands on the reheating process and the operationalconditions that are essential for its control are described. Ananalysis is made of possible reductions in energy use as a resultof improved control.
A survey is included of furnace control systems in steel plants;such equipment has been designed and implemented in order tooptimize the reheating process. Reports of achieved savings arepresented, and demands on measurement and control systems forsuccessful implementation are discussed.
Economic analyses, in terms of life cycle costs and estimatedsavings, are made for three levels of measurement and controlsystems. Reductions in energy use of up to 20 percent can beexpected for the type of process studied, as a result ofinvestments in information technology; it is also concluded thatsuch investments are cost-effective.
INTRODUCTIONConversion and use of energy are creating accelerating problems;carbon dioxide releases being but one of the issues. It is nowimportant to turn to an end-use perspective: how can energy beused more efficiently to provide the services that we need?Research has pointed to possibilities for energy efficiencyimprovements (1). This paper deals with one such opportunity:the possibilities which may be provided by informationtechnology1 to use energy more efficiently in one industrialprocess.
Information technology has developed dramatically during thelatest two decades. The processing power of electronic deviceshas increased orders of magnitude: even microcomputer capacity
allows complex algorithms to be implemented for measurementand control2 purposes.
Investments in information technology are considered as cost-effective in many industrial areas; in energy intensive industriesthe reduction of costs for energy use has been one of the drivingforces for such investments. However, there are reasons toassume that there is a further potential for energy efficiencyimprovements as a consequence of increased utilization ofmeasurement and control; this includes both direct fuel andelectricity savings and indirect energy use reductions due toproduct quality improvements (2). It is therefore of interest toanalyze the relation between use of information technology andenergy efficiency in industrial energy services.
Several ways can be seen to improve energy efficiency byusing information technology: process design, exergy lossanalysis, and measurement and control applied to existingprocesses (add-on technology). This paper analyzes the add-onapproach using steel reheating furnaces as a case study.
The steel industry is a large user of energy: in Sweden it used21 TWh (7210'2 Btu) in 1989 of which furnaces, mainly forrolling mills, used IS percent. Hot rolling is a step in thetraditional steelmaking process which provides one way offorming steel; it generally requires reheating of the cast steel.New steelmaking techniques are evolving which may change thetraditional production path and eventually make reheatingobsolete. However, this change should be seen as a possibilityfor the future, leaving 10-15 years of energy use in existingfurnaces. Hence, it is interesting to analyze the possibilities forefficiency enhancements.
FURNACES IN THE STEEL INDUSTRYIn a hot rolling mill the cast steel items in various forms anddimensions — slabs, billets, and blooms — are heated totemperatures around 1200°C, suitable for the plastic deformationin the rolling process.
'information technology is here defined as systems consisting orelectronic equipment, methods, and programs aimed to retrieve, process,store, and output data originating from, or used to describe, physical ortechnical processes. Of particular interest is information collected frommeasurements of physical variables, such as: temperature, energy flow, massflow, electric currrcnt, or mechanical force. Such information may beprocessed to aid the analysis of industrial processes, and hence conclusionsmay be drawn about energy use, efficiency, and possibilities forimprovements.
Measurement and control here refer lo a class of information technologyused Tor (automatic) control of technical processes. Measurement of physicalvalues, such as temperature, is usually an intrinsic part of control systemsbut can also be used separately to provide information about a process.
236
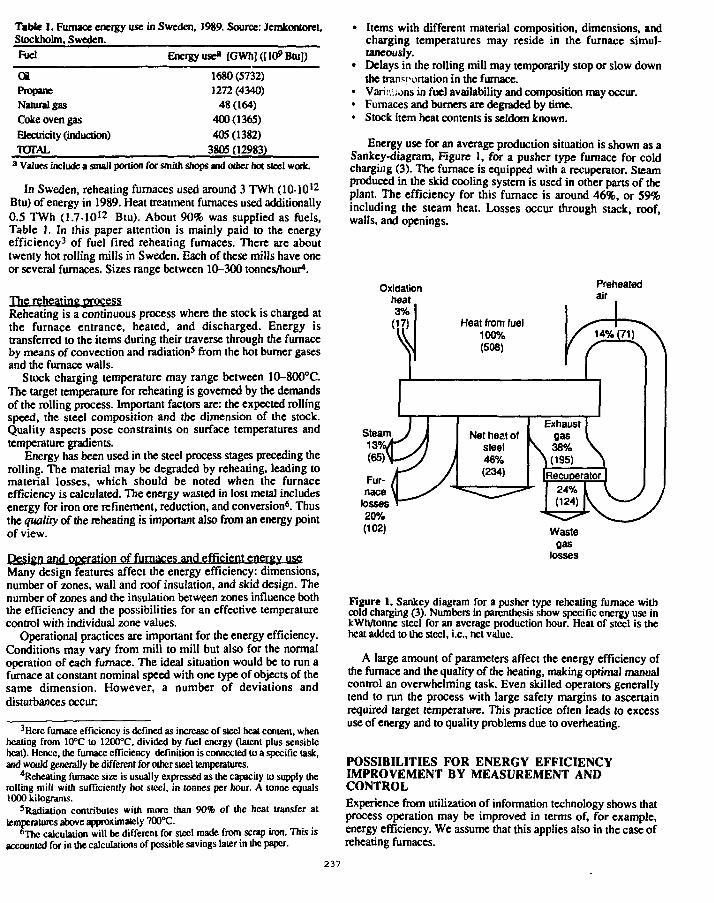
Table 1. Furnace energy use in Sweden, 1989. Source: Jemkontoret,Stockholm. Sweden.
Fuel
CAPropaneNatural gasCoke oven gas
Electricity (induction)TOTAL
Energy use» [GWh] ([10s* Btu])
1680(5732)1272 (4340)
48 (164)400(1365)405(1382)
3805 (12983)a Values include a small portion for smith shops and other hot steel work.
In Sweden, reheating furnaces used around 3 TWh (10-1012
Btu) of energy in 1989. Heat treatment furnaces used additionally0.5 TWh (1.7101 2 Btu). About 90% was supplied as fuels,Table 1. In this paper attention is mainly paid to the energyefficiency3 of fuel fired reheating furnaces. There are abouttwenty hot rolling mills in Sweden. Each of these mills have oneor several furnaces. Sizes range between 10-300 tonnes/hour4.
The reheating processReheating is a continuous process where the stock is charged atthe furnace entrance, heated, and discharged. Energy istransferred to the items during their traverse through the furnaceby means of convection and radiation5 from the hot burner gasesand the furnace walls.
Stock charging temperature may range between 10-800°C.The target temperature for reheating is governed by the demandsof the rolling process. Important factors are: the expected rollingspeed, the steel composition and the dimension of the stock.Quality aspects pose constraints on surface temperatures andtemperature gradients.
Energy has been used in the steel process stages preceding therolling. The material may be degraded by reheating, leading tomaterial losses, which should be noted when the furnaceefficiency is calculated. The energy wasted in lost metal includesenergy for iron ore refinement, reduction, and conversion6. Thusthe quality of the reheating is important also from an energy pointof view.
Design and operation of furnaces and efficient energy useMany design features affect the energy efficiency: dimensions,number of zones, wall and roof insulation, and skid design. Thenumber of zones and the insulation between zones influence boththe efficiency and the possibilities for an effective temperaturecontrol with individual zone values.
Operational practices are important for the energy efficiency.Conditions may vary from mill to mill but also for the normaloperation of each furnace. The ideal situation would be to run afurnace at constant nominal speed with one type of objects of thesame dimension. However, a number of deviations anddisturbances occur:
3Hcrc furnace efficiency is defined as increase of sieel heat content, whenheating from 10°C to 1200°C, divided by fuel energy (latent plus sensibleheal). Hence, the furnace efficiency definition is connected lo a specific task,and would generally be different for other steel temperatures.
4Reheating furnace size is usually expressed as the capacity to supply ihcrolling mill with sufficiently hot steel, in tonnes per hour. A tonne equals1000 kilograms.
5Radialion contributes with more than 90% of ihc heat transfer attemperatures above approximately 700°C.
"The calculation will be different for sieel made from scrap iron. This isaccounted for in the calculations of possible savings later in the paper.
• Items with different material composition, dimensions, andcharging temperatures may reside in the furnace simul-taneously.
• Delays in the rolling mill may temporarily stop or slow downthe transportation in the furnace.
• Varir,;;ons in fuel availability and composition may occur.• Furnaces and burners are degraded by time.• Stock item heat contents is seldom known.
Energy use for an average production situation is shown as aSankey-diagram, Figure 1, for a pusher type furnace for coldcharging (3). The furnace is equipped with a recuperator. Steamproduced in the skid cooling system is used in other parts of theplant. The efficiency for this furnace is around 46%, or 59%including the steam heat. Losses occur through stack, roof,walls, and openings.
Oxidationheat3%
(17) Heat from fuel100%(508)
Preheatedair
/ 14% (71)
Figure 1. Sankey diagram for a pusher type reheating furnace withcold charging (3). Numbers in parenthesis show specific energy use inkWh/tonne steel for an average production hour. Heat of steel is theneat added to the steel, i.e., net value.
A large amount of parameters affect the energy efficiency ofthe furnace and the quality of the heating, making optimal manualcontrol an overwhelming task. Even skilled operators generallytend to run the process with large safety margins to ascertainrequired target temperature. This practice often leads to excessuse of energy and to quality problems due to overheating.
POSSIBILITIES FOR ENERGY EFFICIENCYIMPROVEMENT BY MEASUREMENT ANDCONTROLExperience from utilization of information technology shows thatprocess operation may be improved in terms of, for example,energy efficiency. We assume that this applies also in the case ofreheating furnaces.
237
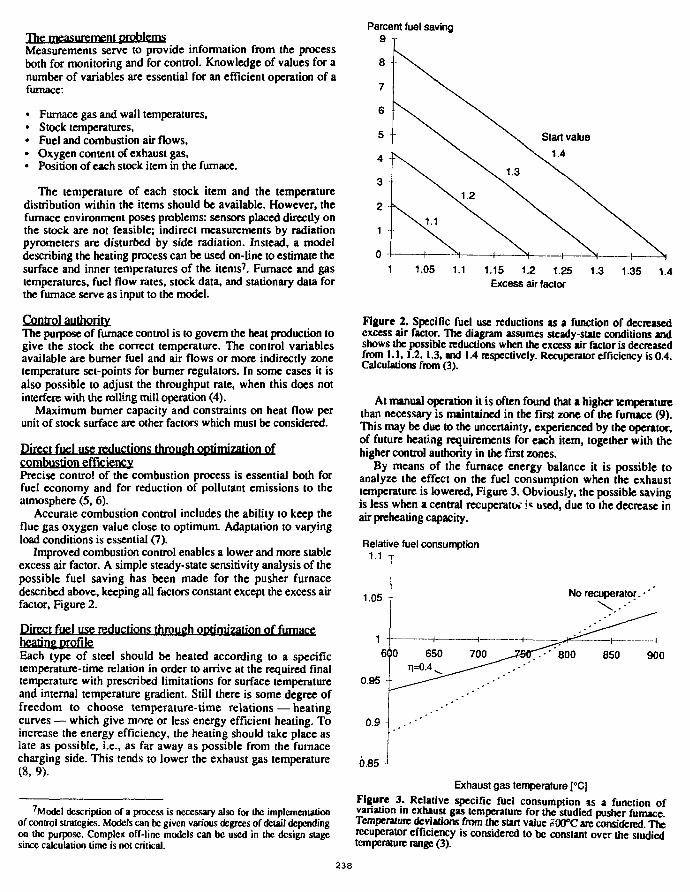
The measurement problemsMeasurements serve to provide information from the processboth for monitoring and for control. Knowledge of values for anumber of variables are essential for an efficient operation of afurnace:
• Furnace gas and wall temperatures,• Stock temperatures,• Fuel and combustion air flows,• Oxygen content of exhaust gas,• Position of each stock item in the furnace.
The temperature of each stock item and the temperaturedistribution within the items should be available. However, thefurnace environment poses problems: sensors placed directly onthe stock are not feasible; indirect measurements by radiationpyrometers are disturbed by side radiation. Instead, a modeldescribing the heating process can be used on-line to estimate thesurface and inner temperatures of the items7. Furnace and gastemperatures, fuel flow rates, stock data, and stationary data forthe furnace serve as input to the model.
Control authorityThe purpose of furnace control is to govern the heat production togive the stock the correct temperature. The control variablesavailable are burner fuel and air flows or more indirectly zonetemperature set-points for burner regulators. In some cases it isalso possible to adjust the throughput rate, when this does notinterfere with the rolling mill operation (4).
Maximum burner capacity and constraints on heat flow perunit of stock surface are other factors which must be considered.
Direct fuel use reductions through QPtJITliffltiflP. flfcombustion efficiencyPrecise control of the combustion process is essential both forfuel economy and for reduction of pollutant emissions to theatmosphere (5, 6).
Accurate combustion control includes the ability to keep theflue gas oxygen value close to optimum. Adaptation to varyingload conditions is essential (7).
Improved combustion control enables a lower and more stableexcess air factor. A simple steady-state sensitivity analysis of thepossible fuel saving has been made for the pusher furnacedescribed above, keeping all factors constant except the excess airfactor. Figure 2.
Direct fuel use reductions through optimization of furnaceheating profileEach type of steel should be heated according to a specifictemperature-time relation in order to arrive at the required finaltemperature with prescribed limitations for surface temperatureand internal temperature gradient. Still there is some degree offreedom to choose temperature-time relations — heatingcurves — which give more or less energy efficient heating. Toincrease the energy efficiency, the heating should take place aslate as possible, i.e., as far away as possible from the furnacecharging side. This tends to lower the exhaust gas temperature(8, 9).
Percent fuel saving9
7Model description or a process is necessary also for Ihc implementationof control strategics. Models can be given various degrees of detail dependingon the purpose. Complex off-line models can be used in the design stagesince calculation time is not critical.
1.05 1.1 1.15 1.2 1.25 1.3Excess air factor
1.35 1.4
Figure 2. Specific fuel use reductions as a function of decreasedexcess air factor. The diagram assumes steady-stale conditions andshows the possible reductions when the excess air factor is decreasedfrom 1.1,1.2,1.3, and 1.4 respectively. Recuperator efficiency is 0.4.Calculations from (3).
At manual operation it is often found that a higher temperaturethan necessary is maintained in the first zone of the furnace (9).This may be due to the uncertainty, experienced by the operator,of future heating requirements for each item, together with thehigher control authority in the first zones.
By means of the furnace energy balance it is possible toanalyze the effect on the fuel consumption when the exhausttemperature is lowered, Figure 3. Obviously, the possible savingis less when a central recuperatori« used, due to the decrease inair preheating capacity.
Relative fuel consumption1.1 T
1.05 No recuperator. •
0.95
0.9 -
6.85 J
' 8 0 0 850 900
Exhaust gas temperature [°C]Figure 3. Relative specific fuel consumption as a function ofvariation in exhaust gas temperature for the studied pusher furnaceTemperature deviations from the start value 290°C arc considered. Therecuperator efficiency is considered to be constant over the studiedtemperature range (3).
238
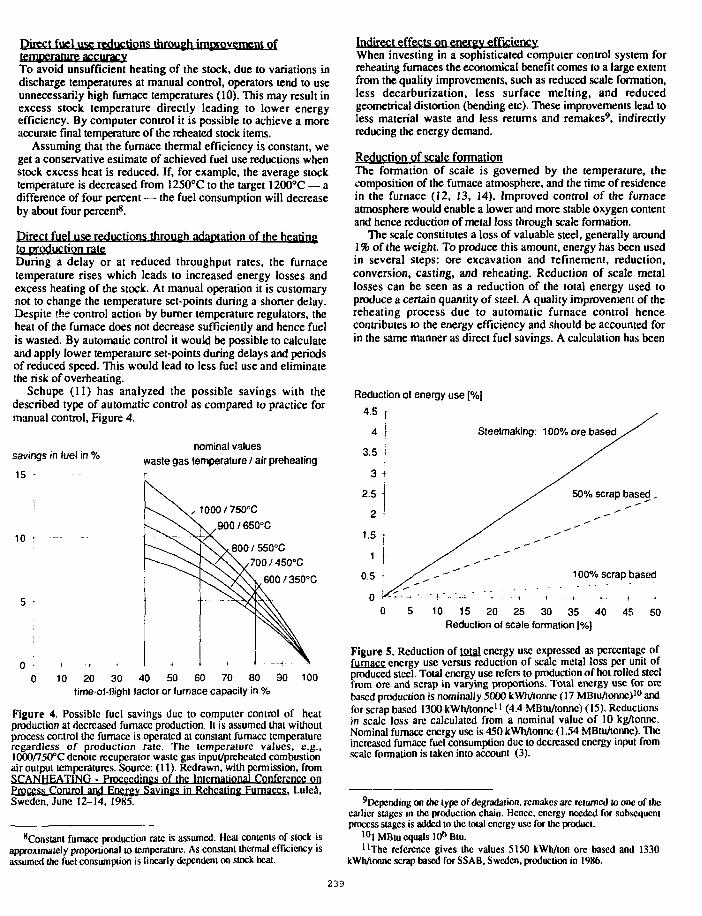
Direct fuel use reductions through improvement oftemperature accuracyTo avoid unsufficient heating of the stock, due to variations indischarge temperatures at manual control, operators tend to useunnecessarily high furnace temperatures (10). This may result inexcess stock temperature directly leading to lower energyefficiency. By computer control it is possible to achieve a moreaccurate final temperature of the reheated stock items.
Assuming that the furnace thermal efficiency is constant, weget a conservative estimate of achieved fuel use reductions whenstock excess heat is reduced. If, for example, the average stocktemperature is decreased from 125O°C to the target 1200°C— adifference of four percent — the fuel consumption will decreaseby about four percent8.
Direct fuel use reductions through adaptation of the heatingto production rateDuring a delay or at reduced throughput rates, the furnacetemperature rises which leads to increased energy losses andexcess heating of the stock. At manual operation it is customarynot to change the temperature set-points during a shorter delay.Despite the control action by burner temperature regulators, theheat of the furnace does not decrease sufficiently and hence fuelis wasted. By automatic control it would be possible to calculateand apply lower temperature set-points during delays and periodsof reduced speed. This would lead to less fuel use and eliminatethe risk of overheating.
Schupe (11) has analyzed the possible savings with thedescribed type of automatic control as compared to practice formanual control, Figure 4.
savings in fuel in %
15 •
10
nominal valueswaste gas temperature / air preheating
1000/750°C,900/650°C
800 / 550°C700 / 450°C
600 / 350°C
0 10 20 30 40 50 60 70 80 30 100time-of-flight faclor or lurnace capacity in %
Figure 4. Possible fuel savings due to computer control of heatproduction at decreased furnace production. It is assumed that withoutprocess control the furnace is operated at constant furnace temperatureregardless of production rale. The temperature values, e.g.,KXXy75O°C denote recuperator waste gas input/preheated combustionair output temperatures. Source: (11). Redrawn, with permission, fromSCANHEATING - Proceedings of the International Conference onProcess Control and Energy Savings in Reheating Furnaces. Lulca,Sweden, June 12-14, 1985.
Indirect effects on energy efficiencyWhen investing in a sophisticated computer control system forreheating furnaces the economical benefit comes to a large extentfrom the quality improvements, such as reduced scale formation,less decarburization, less surface melting, and reducedgeometrical distortion (bending etc). These improvements lead toless material waste and less returns and remakes9, indirectlyreducing the energy demand.
Reduction of scale formationThe formation of scale is governed by the temperature, thecomposition of the furnace atmosphere, and the time of residencein the furnace (12, 13, 14). Improved control of the furnaceatmosphere would enable a lower and more stable oxygen contentand hence reduction of metal loss through scale formation.
The scale constitutes a loss of valuable steel, generally around1 % of the weight. To produce this amount, energy has been usedin several steps: ore excavation and refinement, reduction,conversion, casting, and reheating. Reduction of scale metallosses can be seen as a reduction of the total energy used toproduce a certain quantity of steel. A quality improvement of thereheating process due to automatic furnace control hencecontributes to the energy efficiency and should be accounted forin the same manner as direct fuel savings. A calculation has been
Reduction ol energy use [%]
50% scrap based.
Steelmaking: 100% ore based
100% scrap based
10 15 20 25 30 35 40 45 50Reduction of scale formation [%]
Figure 5. Reduction of total energy use expressed as percentage offurnace energy use versus reduction of scale metal loss per unit ofproduced steel. Total energy use refers to production of hot rolled steelfrom ore and scrap in varying proportions. Total energy use Tor orebased production is nominally 5000 kWMonnc (17 MBtuAonnc)10 andfor scrap based 1300kWh/tonncn (4.4 MBlu/tonnc)(15). Reductionsin scale loss arc calculated from a nominal value of 10 kg/tonne.Nominal furnace energy use is 450 kWhAonnc (1.54 MBtu/tonnc). Theincreased furnace fuel consumption due to decreased energy input fromscale formation is taken into account (3).
8Constant furnace production rate is assumed. Heal contents of stock isapproximately proportional to temperature. As constant thermal efficiency isassumed ihc fuel consumption is linearly dependent on stock heat.
^Depending on (he type of degradation, remakes arc returned to one of Ihcearlier stages in the production chain. Hence, energy needed for subsequentprocess stages is added to the total energy use for the product.
1 0 1MBUI equals lO^Btu."The reference gives the values 5150 kWh/ton ore based and 1330
kWh/lonnc scrap based for SSAB. Sweden, production in 1986.
239
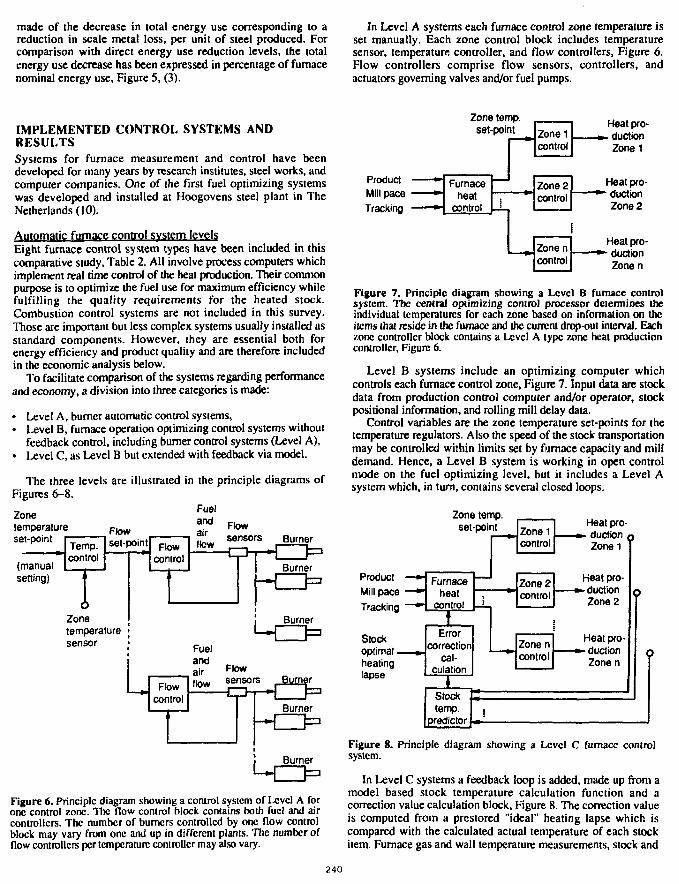
made of the decrease in total energy use corresponding to areduction in scale metal loss, per unit of steel produced. Forcomparison with direct energy use reduction levels, the totalenergy use decrease has been expressed in percentage of furnacenominal energy use, Figure 5, (3).
In Level A systems each furnace control zone temperature isset manually. Each zone control block includes temperaturesensor, temperature controller, and flow controllers, Figure 6.Flow controllers comprise flow sensors, controllers, andactuators governing valves and/or fuel pumps.
IMPLEMENTED CONTROL SYSTEMS ANDRESULTSSystems for furnace measurement and control have beendeveloped for many years by research institutes, steel works, andcomputer companies. One of the first fuel optimizing systemswas developed and installed at Hoogovens steel plant in TheNetherlands (10).
Automatic furnace control system levelsEight furnace control system types have been included in thiscomparative study, Table 2. All involve process computers whichimplement real time control of the heat production. Their commonpurpose is to optimize the fuel use for maximum efficiency whilefulfilling the quality requirements for the heated stock.Combustion control systems are not included in this survey.Those are important but less complex systems usually installed asstandard components. However, they are essential both forenergy efficiency and product quality and are therefore includedin the economic analysis below.
To facilitate comparison of the systems regarding performanceand economy, a division into three categories is made:
• Level A, burner automatic control systems,• Level B, furnace operation optimizing control systems without
feedback control, including burner control systems (Level A),• Level C, as Level B but extended with feedback via model.
Zone temp.
The three levels are illustrated in the principle diagrams ofFigures 6-8.
Fuelandairflew
Zonetemperatureset-point
Flow
(manualsetting)
Zonetemperaturesensor
L Flowcontrol
Fuelandair F l o w
flow sensors
Figure 6. Principle diagram showing a control system of Level A forone control zone. The flow control block contains both fuel and aircontrollers. The number of burners controlled by one flow controlblock may vary from one and up in different plants. The number offlow controllers per temperature controller may also vary.
Product
Mill pace
Tracking
set-point
Furnaceheat
i
Zoneicontrol
Zone 2control
Zonencontrol
Heat pro-- duction
Zone 1
Heat pro-- duction
Zone 2
Heat pro-- duction
Zonen
Figure 7. Principle diagram showing a Level B furnace controlsystem. 71K central optimizing control processor determines theindividual temperatures for each zone based on information on theitems that reside in the furnace and the current drop-out interval. Eachzone controller block contains a Level A type zone heat productioncontroller, Figure 6.
Level B systems include an optimizing computer whichcontrols each furnace control zone. Figure 7. Input data are stockdata from production control computer and/or operator, stockpositional information, and rolling mill delay data.
Control variables are the zone temperature set-points for thetemperature regulators. Also the speed of the stock transportationmay be controlled within limits set by furnace capacity and milldemand. Hence, a Level B system is working in open controlmode on the fuel optimizing level, but it includes a Level Asystem which, in turn, contains several closed loops.
Zone temp,set-point
Product
Mill pace
Tracking
Stockoptimal —heatinglapse
Zoneicontrol
Furnaceheat
control i
Errorcorrection
cal-culation
Zone 2control
<Zonencontrol
Heat pro-- duction
Zonei
Keat pro-«-duction
Zone 2
Heat pro-» duction
Zone n
Stocktemp.
predictor
Figure 8. Principle diagram showing a Level C furnace controlsystem.
In Level C systems a feedback loop is added, made up from amodel based stock temperature calculation function and acorrection value calculation block, Figure 8. The correction valueis computed from a prestored "ideal" heating lapse which iscompared with the calculated actual temperature of each stockitem. Furnace gas and wall temperature measurements, stock and
2 4 0
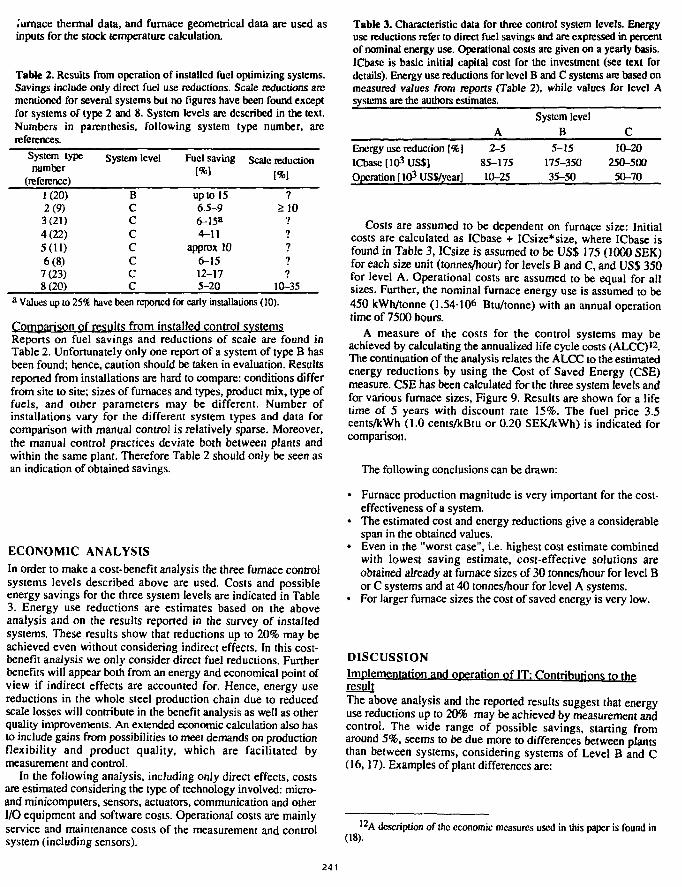
•urnace thermal data, and furnace geometrical data are used asinputs for the stock temperature calculation.
Table 2. Results from operation of installed fuel optimizing systems.Savings include only direct fuel use reductions. Scale reductions arcmentioned for several systems but no figures have been found exceptfor systems of type 2 and 8. System levels arc described in the text.Numbers in parenthesis, following system type number, arcreferences.
System typenumber
(reference)
System level Fuel saving Scale reduction
1(20)2(9)3(21)4(22)5(11)6(8)
7(23)8(20)
BCCCCCCC
up to 156.5-96-15*4-11
approx 106-1512-175-20
?>10
9
79
77
10-35a Values up to 25% have been reported for early installations (10).
Comparison of results from installed control systemsReports on fuel savings and reductions of scale are found inTable 2. Unfortunately only one report of a system of type B hasbeen found; hence, caution should be taken in evaluation. Resultsreported from installations are hard to compare: conditions differfrom site to site; sizes of furnaces and types, product mix, type offuels, and other parameters may be different. Number ofinstallations vary for the different system types and data forcomparison with manual control is relatively sparse. Moreover,the manual control practices deviate both between plants andwithin the same plant. Therefore Table 2 should only be seen asan indication of obtained savings.
ECONOMIC ANALYSIS
In order to make a cost-benefit analysis the three furnace controlsystems levels described above are used. Costs and possibleenergy savings for the three system levels are indicated in Table3. Energy use reductions are estimates based on the aboveanalysis and on the results reported in the survey of installedsystems. These results show that reductions up to 20% may beachieved even without considering indirect effects. In this cost-benefit analysis we only consider direct fuel reductions. Furtherbenefits will appear both from an energy and economical point ofview if indirect effects are accounted for. Hence, energy usereductions in the whole steel production chain due to reducedscale losses will contribute in the benefit analysis as well as otherquality improvements. An extended economic calculation also hasto include gains from possibilities to meet demands on productionflexibility and product quality, which are facilitated bymeasurement and control.
In the following analysis, including only direct effects, costsare estimated considering the type of technology involved: micro-and minicomputers, sensors, actuators, communication and otherI/O equipment and software costs. Operational costs are mainlyservice and maintenance costs of the measurement and controlsystem (including sensors).
Table 3. Characteristic data for three control system levels. Energyuse reductions refer to direct fuel savings and are expressed in percentof nominal energy use. Operational costs arc given on a yearly basis.ICbase is basic initial capital cost for the investment (see text fordetails). Energy use reductions for level B and C systems are based onmeasured values from reports (Table 2), while values for level Asystems are the authors estimates.
System levelA B C
Energy use reduction [%] 2-5 5-15 10-20ICbasc[103US$l 85-175 175-350 250-500Operation [l^USVyear] 10-25 35-50 50-70
Costs are assumed to be dependent on furnace size: Initialcosts are calculated as ICbase + ICsize*size, where ICbase isfound in Table 3, ICsize is assumed to be US$ 175 (1000 SEK)for each size unit (tonnes/hour) for levels B and C, and US$ 350for level A. Operational costs are assumed to be equal for allsizes. Further, the nominal furnace energy use is assumed to be450 kWh/tonne (1.54106 Btu/tonne) with an annual operationtime of 7500 hours.
A measure of the costs for the control systems may beachieved by calculating the annualized life cycle costs (ALCC)12.The continuation of the analysis relates the ALCC to the estimatedenergy reductions by using the Cost of Saved Energy (CSE)measure. CSE has been calculated for the three system levels andfor various furnace sizes, Figure 9. Results are shown for a lifetime of 5 years with discount rate 15%. The fuel price 3.5cents/kWh (1.0 cents/kBtu or 0.20 SEK/kWh) is indicated forcomparison.
The following conclusions can be drawn:
• Furnace production magnitude is very important for the cost-effectiveness of a system.
• The estimated cost and energy reductions give a considerablespan in the obtained values.
• Even in the "worst case", i.e. highest cost estimate combinedwith lowest saving estimate, cost-effective solutions areobtained already at furnace sizes of 30 tonnes/hour for level Bor C systems and at 40 tonnes/hour for level A systems.
• For larger furnace sizes the cost of saved energy is very low.
DISCUSSION
Implementation and operation of IT: Contributions to th?.resultThe above analysis and the reported results suggest that energyuse reductions up to 20% may be achieved by measurement andcontrol. The wide range of possible savings, starting fromaround 5%, seems to be due more to differences between plantsthan between systems, considering systems of Level B and C(16,17). Examples of plant differences are:
(18).
I2A description of the economic measures used in this paper is found in
241
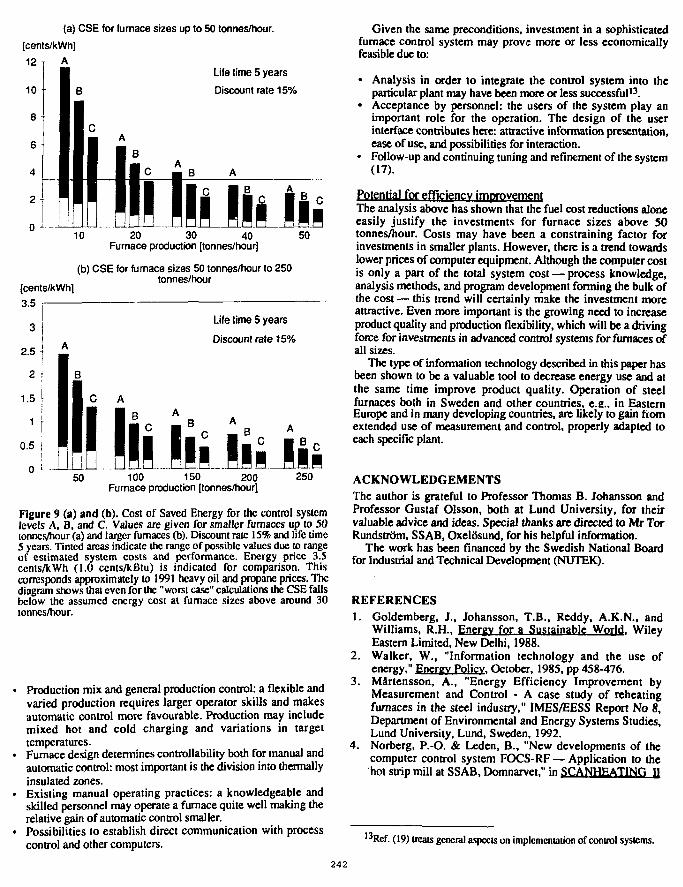
(a) CSE for furnace sizes up to 50 tonnes/hour.
[cents/kWh]
12 T A
10 +
Life time 5 years
Discount rate 15%
10 20 30 40Furnace production [tonnes/hour]
50
[cents/kWh]
3.5 i
(b) CSE for furnace sizes 50 tonnes/hour to 250tonnes/hour
Life time 5 years
Discount rate 15%2.5 j
2 f
1.5 r
-I0.5 ;
0 '50 100 150 200
Furnace production [lonnes/hour]250
Figure 9 (a) and (b). Cost of Saved Energy for the control systemlevels A, B, and C. Values are given for smaller furnaces up to 50tonnes/hour (a) and larger furnaces (b). Discount rate 15% and life lime5 years. Tinted areas indicate the range of possible values due to rangeof estimated system costs and performance. Energy price 3.5ccnts/kWh (1.0 ccnts/kBtu) is indicated for comparison. Thiscorresponds approximately to 1991 heavy oil and propane prices. Thediagram shows that even for the "worst case" calculations the CSE fallsbelow the assumed energy cost at fumacc sizes above around 30tonnes/hour.
Production mix and general production control: a flexible andvaried production requires larger operator skills and makesautomatic control more favourable. Production may includemixed hot and cold charging and variations in targettemperatures.Furnace design determines controllability both for manual andautomatic control: most important is the division into thermallyinsulated zones.Existing manual operating practices: a knowledgeable andskilled personnel may operate a furnace quite well making therelative gain of automatic control smaller.Possibilities to establish direct communication with processcontrol and other computers.
Given the same preconditions, investment in a sophisticatedfurnace control system may prove more or less economicallyfeasible due to:
• Analysis in order to integrate the control system into theparticular plant may have been more or less successful13.
• Acceptance by personnel: the users of the system play animportant role for the operation. The design of the userinterface contributes here: attractive information presentation,ease of use, and possibilities for interaction.
• Follow-up and continuing tuning and refinement of the system(17).
Potential for efficiency improvementThe analysis above has shown that the fuel cost reductions aloneeasily justify the investments for furnace sizes above SOtonnes/hour. Costs may have been a constraining factor forinvestments in smaller plants. However, there is a trend towardslower prices of computer equipment. Although the computer costis only a part of the total system cost — process knowledge,analysis methods, and program development forming the bulk ofthe cost — this trend will certainly make the investment moreattractive. Even more important is the growing need to increaseproduct quality and production flexibility, which will be a drivingforce for investments in advanced control systems for furnaces ofall sizes.
The type of information technology described in this paper hasbeen shown to be a valuable tool to decrease energy use and atthe same time improve product quality. Operation of steelfurnaces both in Sweden and other countries, e.e.. in EasternEurope and in many developing countries, are likely to gain hornextended use of measurement and control, properly adapted toeach specific plant.
ACKNOWLEDGEMENTSThe author is grateful to Professor Thomas B. Johansson andProfessor Gustaf Olsson, both at Lund University, for theirvaluable advice and ideas. Special thanks are directed to Mr TorRundstrom, SSAB, Oxelosund, for his helpful information.
The work has been financed by the Swedish National Boardfor Industrial and Technical Development (NUTEK).
REFERENCES1. Goldembcrg, J., Johansson, T.B., Reddy, A.K.N., and
Williams, R.H., Energy for a Sustainable World. WileyEastern Limited, New Delhi, 1988.
2. Walker, W., "Information technology and the use ofenergy," Energy Policy. October, 1985, pp 458-476.
3. MSrtensson, A., "Energy Efficiency Improvement byMeasurement and Control - A case study of reheatingfurnaces in the slecl industry," IMES/EESS Report No 8,Department of Environmental and Energy Systems Studies,Lund University, Lund, Sweden, 1992.
4. Norberg, P.-O. & Leden, B., "New developments of thecomputer control system FOCS-RF — Application to thehot strip mill at SSAB, Domnarvet," in SCANHEATINQ II
I3Rcf. (19) treats general aspects on implementation of control systems.
242
- Proceedings of the 2nd International Conference onHeating Including Detection and Conditioning of SurfaceDefects on Hot Material. Hot Charging and Hot DirectRolling. Lulea. Sweden, June 15-16, 1988
5. Glassman, I., Combustion. Orlando Acadcmis Press, 1987.6. Leden, B., "Brannarreglering - Sammanstallning av litteratur
och erfarenheter," BTF85063/82, MEFOS, Bearbetnings-tekniska Forskningsstationen, 198S.
7. Shinskey, F.G., Energy Conservation through Control.Academic Press Inc., New York, 1978.
8. Fontana, P., Boggiano, A., Furinghetti, A., Cabras, G.,and Simoncini, C.A., "An advanced computer controlsystem for reheat furnaces," Iron and Steel Engineer. August1983, pp 55-62.
9. Evers, W., Klima, R., Krause, A., Kuck, A., and Plottke,A.,"Energieoptima!e modellgestutzte Fuhrung einerWalzwerksofengruppe," Stahl und Eisen. Vol. 108, 16 May,1988, pp 489-497.
10. Hollander, F., and Huisman, R.L., "Computer ControlledReheating Furnaces Optimize Hot Strip Mill Performance,"Iron and Steel Engineer. September, 1972, pp 43-56.
11. Schupe, W., Schmid, K.-F., and Klammer, H., "Processcontrol of continuous heating furnaces - strategy of acalculation model and operating results," inSCANHEATING - Proceedings of the InternationalConference on Process Control and Energy Savings inReheating Furnaces. Lulea. Sweden, on June 12-14,1985.
12. Petrucci, M., Quintiliani, G., De Vito, A., and Granato, F.,"Surface quality with oxygen control of furnaceatmosphere," in SCANHEATING - Proceedings of theInternational Conference on Process Control and EnergySavings in Reheating Furnaces. LuleS, Sweden, June 12-141985.
13. Jarl, M., and Leden, B., "Oxide scale formation on steel infuel fired reheating furnaces," in SCANHEATING -Proceedings of the International Conference on ProcessControl and Energy Savings in Reheating Furnaces. Lulea,Sweden, June 12-14, 1985.
14. Quintiliani, G., Mazzarano, A., and Montagna, G.,"Mathematical model of thermal evolution and scale growthof billets in a rotary hearth furnace," in SCANHEATING II- Proceedings of the 2nd International Conference onHeating Including Detection and Conditioning of SurfaceDefects on Hot Material. Hot Charging and Hot DirectBalling Lulca, Sweden, June 15-16, 1988.
15. Eketorp, S., "Electrotechnologies and Steelmaking," inElectricity: Kfficient End Use and New GenerationTechnologies, and Their Planning Implications. Johansson,Bodlund, and Williams (eds.), Lund University Press,Lund, Sweden, 1989, pp 261-296.
16. Meller, G., Bergslagens Processkonsult, Norberg, Sweden,Personal Communication, 1991.
17. Norberg, P.-O., SSAB, Borlange, Sweden, PersonalCommunication, 1991.
18. Larson, E.D., Nilsson, L.J., and Johansson, T.B.,"Thetechnology menu for efficient end use of energy". Volume 1,part 2. Environmental and Energy Systems Studies, LundUniversity, Lund, Sweden, 1989.
19. Olsson, G., and Piani, G., Computer Systems inAutomation and Control. Prentice Hall Int., 1992.
20. Leden, B., "Bransleoptimeringssystemet FOCS-RF -Beskrivning och sammanstailning av erfarenheter,"BTF86023/85, MEFOS, Bearbetningstekniska Forsknings-stationen, 1986.
21. Hollander, F., "Accurate temperature control of the reheatingprocess at mixed cold and hot charging," inSCANHEATING - Proceedings of the InternationalConference on Process Control and Energy Savings inReheating Furnaces LuleJ, Sweden, June 12-14,1985.
22. Millamon, P., "Reheating furnace automatization," inSCANHEATING - Proceedings of the InternationalConference on Process Control and Energy Savings inReheating Furnaces. Lulea, Sweden, June 12-14,1985.
23. Dewar, D., Brown, K., and Smith, D.,"Computerizedreheating furnace control at B.S.C., Ravenscraig Works," inSCANHEATING II - Proceedings of the 2nd InternationalConference on Heating Including Detection and Conditioningof Surface Defects on Hot Material. Hot Charging and Hotpirect Rolling. Luiea, Sweden, June 15-16,1988.
243

MEMBRANE CELLS IN CHLOR ALKALI APPLICATIONDr. K. Lesker, UHDE GmbH
ABSTRACT
The worldwide chlorine/caustic sodaproduction has reached approximately 40 milliontpy. Despite the stagnation of the chlorine demandin the western world, e.g., the decline in the pulpand paper industry, there is still a n overall increasein production due to the higher growth rates in theAsian region.
The economical and ecological advantagesof membrane technology have been growing sinceits introduction more than one decade ago. Thedecision makers therefore not only take the optionfor membrane technology in grass root plants, butincreasingly for conversions of diaphragm andmercury plants.
The single clement design of membrane cellshas especially proven its versatility in order tofulfill all requirements tor the conversion of anexisting chlor alkali plant.
The worldwide chlorine/caustic sodaproduction has reached approximately 40 milliontpv. The United States is the major producer with ashare of 28%, Furope with 27%, Japan with 10%and the rest of the world accounting for theremaining 35%.
Despite the stagnation of the chlorinedemand in the United States (-3% in 1991) andWestern Europe (-4.5% in 1991) due to icduceddemand for pulp and paper, HVC and organicchemicals, there is still an overall increase inproduction, mainly attrihutahle lr> high growth ratesin Asia.
For the production of chlorine and causticsoda there are three very different electrolysistechnologies: The mercury process with a highiiislalicU capacity in Western Europe, the diaphragmprocess which is used extensively in the United
States and the membrane process which is beingused exclusively for new membrane plants and forexample in Japan we see that already all formermercury and diaphragm plants have been convertedto the membrane process.
Distribution of Electrolysis Technology
MercuryPlAJCCM
DiaphragmPrrwv*
Membrane' Process
£ millionTO
World
14
17,5
7,5
39.0
WesternEiintpe
8,3
3,2
1,0
12.5
NorthAmerica
2,2
10,6
1.5
14.2
Japan
. / .
1,0
3,3
4.3
Other* |
3.5
2,7
1,7
7.9 1
The economical and ecological advantagesof the membrane process are the primary reasonsfor the increase of the market share for thistechnology.
First of all we would like to point out theeoologiral problems, Fven with mortem mercuryplants it is not favorable to reduce mercuryemissions to zero. Most diaphragm plants usesubstantial quantities of asbestos, which is a causefor concern due to its long-term toxic effects.
For production of 50% caustic soda solutionthe membrane process is far more economic.Comparing the power consumption's the mercuryprocess uses almost 2800 kWh/t NaOH-100%.diaphragm process 3200 kWh/f, whereas themembrane process only uses 2150 kWh/t.
These advantages towards the membranetechnology leaves tor us, as a major supplier ofmembrane electrolysis plants, a great potential of
244

conversion projects, even though there is astagnation in the worldwide chlorine demand.
The invention of the per fluorinatedmembrane dales 30 years age. Since then a lot ofresearch has been performed to reach aneconomical, commercial chloralkali industry:
1962
1968-72
1073-75
1975
1980-83
Invention of the per fluorinated ionexchange membrane
Development of the membraneprocess
Test in pilot cells
First commercial plant
Membranes for > 30% of NaOH
1981 First conversion of a diaphragm plant
In a membrane chloralkali cell themembrane is suspended between the anode andcathode electrodes. The anode compartment withdepleted caustic soda (29%). The ion exchangemembrane is a separator, preventing a mixing ofcaustic and hydrogen with the brine and chlorine.It only allows the Na+-ions plus a certain quantityof water molecules to pass from the anode intocathode chamber. Cl'-ions separate at the anode toform Cb-gas. whereas HT is formed at the cathode.
The actual parameters of a moderncliluralkali plant are 90", 32% caustic and currentdensity of 3-4 kA/m^. The stability offluorocarbon polymers is so great that chemicaldegradation will not be a cause of membranefailure.
A major source of performance decline isthe accumulation of solid impunties. Impurityaccumulation of 0.1 -1 % by weight is usuallyenough to cause significant loss of performance.Looking towards the mass transport (200-250kg/m^/day) it becomes obvious that impurities, —especially cations, which the membrane cannot
reject have to be very low, e.g., Ca/Mg < 50ppb.
Sources of contamination in the chloralkalicells are originated from sail (e.g., Ca, Mg, S04,Al, I), water and the used hardware.
To prevent the electrolysis from anyimpurities and to ensure a long reliable productionis the main skill for us, UHDE, as a supplier andcontractor of membrane plants.
There are two possible electricalarrangements of elecfrolyrers in a cell house: theso called bipolar and the monopolar design.
Using the inonopolar arrangement element!)are connected in parallel. These plants use lowvoltage and high amperage rectifier. Due to theparallel connection it is necessary to distribute thehigh current 4kA/m^ from each clement to eachelement. This distribution can only be realized byusing a high amount of copper.
An alternative is the so-called bipolararrangement. Here the elements are connected inseries.
The current, up to 11 kA, passes from thecathodic back wall of one element to the anodicbackwall of the subsequent element.
Due lo the eliminated problem of currentdistribution large membrane surfaces up to im*- arechosen. Up to 120 elements and more can bearranged in series with a production of > 45 tonsof caustic per day and per clcctrolyzcr. Therectifier is more economic by using low amperageand high voltage.
As already mentioned above a majorpotential for future membrane plants will be theconversions of mercury and diaphragm plants.Therefore it is necessary for a contractor to fulfillthe following requirements for an optimalconversion:
245
Reuse of existing cell room
Reuse of existing transformer/rectifier
Maximum reuse of the existing systems, e.g.the brine system
Minimum space requirement
Minimum production loss duringconversions
Low investment costs for:
• Electrolyzer bypass switches• Busbars• Cell room piping• Instrumentation
For a diaphragm conversion theciecltoly/ers arc designed tu meet ihc requirementsof the existing rectifier.
The chlorine and hydrogen treatment can bereused with minor modification, existing blowersare not necessary, because of elevated cell pressureusing the a.m. technology.
The caustic circuit is a totally newinstallation. For each conversion we endeavor toreuse existing caustic concentration units.
Three rectifiers with 116 kA each and 225 Vfeed 48 mercury cells. They were step by stepexchanged by 24 electroiyzers comprising 64 singleelements per electrolyzer-size 2,7 m . Each of therectifiers is now supplying 8 electroly/ers. Theconversion of the plant happened according to thefollowing lime schedule:
First conversion phase:48 Hg-cells running* basic and detail engineering• procurement cells and other equipment
• election of busbar bypass and otherequipment
Second conversion phase:short shutdown• removal of 16 Hg-celis
Third conversion phase:32 Hg-cells running• erection or cell racks• pre commissioning
Fourth conversion plia.se:short shutdown• connecting of piping and busbars to
existing systems
Fifth phase of conversion.24 membrane electroiyzers in operation• start-up 1 1/2 years from contract
becoming effective• removal of remaining Hg-cclls
The space requirement of Ihe finalmembrane plant was only 33% of the original.
The membrane technology lias proven thai itis the right economical and ecological way for thefuture chloralkali production. It is still a co-prodnction which supplies two different markets. Asituation which can be slightly change byimplementing the old technology of caustification.but due to the availability of natural soda ash andthe higher prices for the alkali product it leavesonly a restricted market share.
246
CONVERTING PETROLEUM COKE TO ELECTRICITY
by
Anthony PavoneSenior ConsultantSRI International
Menlo Park, CA 94025
ABSTRACT
Changes in oil refining technology and economicsare driving refiners to utilize thermal processesto maximize the conversion of heavy crude oilcomponents to clean products. Since the primaryunit operation to accomplish this objective isthe coking unit, more cokers are being built, andexisting cokers are being operated to maximumcapacity utilization.
SRI recently completed an assignment for arefiner interested in converting the by-productfluid coke from his unit to electricity. This paperpresents the operating history of US based plantsconverting petroleum coke to electricity, andpresents generic economics for the conversionprocess utilizing the three primary technologiesavailable: conventional pulverized cokecombustion, atmospheric fluidized bedcombustion, and coke gasification combinedcycle power production.
BACKGROUND
Worldwide petroleum coke production isapproximately 100,000 MT/D, and the UScontributes 80% of this total. As crude oilquality deteriorates, and the market for residualoil becomes less profitable due to increasinglystringent air quality emissions, the incentive toupgrade resid to clean products will be capturedprincipally via more coking. Although 3 basic
coking technologies are practiced (delayedcoking, fluid coking, and Exxon flexi-coking),over 90 % of US coking capacity is associatedwith delayed coking.
Where is the by-product coke from these unitsgoing to go? Petroleum coke has an energycontent 50% higher than coal, but also containsmany undesireable components such as sulfur andheavy metals. Not only do these constituentsdetract from the potential for combusting thisfuel, but the potential for heavy metal leachingfrom rainfall has resulted in the EPA designatingcoke as a hazardous waste, thereby limiting therange and increasing the cost of possible storageand disposal options.
Approximately one-third of the petroleum cokeproduced in the US is calcined in rotary kilns andconverted to a premium grade that can be used aselectrodes for aluminum production. The balanceis ultimately combusted as fuel. We sayultimately, because there currently exists a fewmountains of coke waiting for an economicallypreferable ultimate disposition. Although mostof the coke is combusted domestically, some isexported to fuel markets in the Pacific Rim.
The ideal combustion environment for petroleumcoke is a cement kiln, where the alkalinecomponents in cement will absorb the sulfurreleased by the coke during combustion, andthereby eliminate the need for costly scrubbers.However, this market disposition is saturated,forcing the balance of the coke to find acombustion medium equipped with the pollution
247
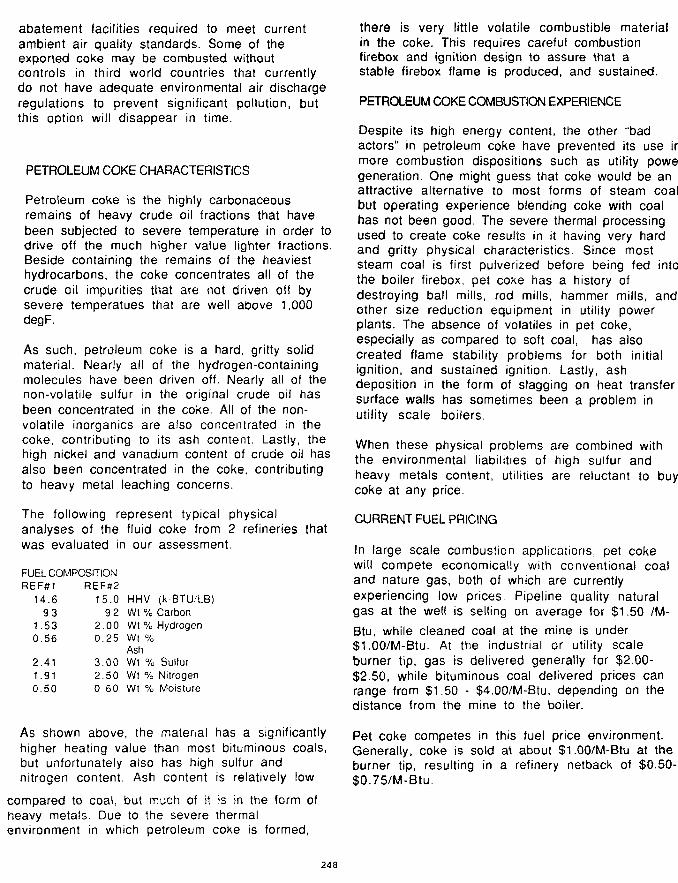
abatement facilities required to meet currentambient air quality standards. Some of theexported coke may be combusted withoutcontrols in third world countries that currentlydo not have adequate environmental air dischargeregulations to prevent significant pollution, butthis option will disappear in time.
PETROLEUM COKE CHARACTERISTICS
Petroleum coke is the highly carbonaceousremains of heavy crude oil fractions that havebeen subjected to severe temperature in order todrive off the much higher value lighter fractions.Beside containing the remains of the heaviesthydrocarbons, the coke concentrates all of thecrude oil impurities that are not driven off bysevere temperatues that are well above 1,000degF.
As such, petroleum coke is a hard, gritty solidmaterial. Nearly all of the hydrogen-containingmolecules have been driven off. Nearly all of thenon-volatile sulfur in the original crude oil hasbeen concentrated in the coke. All of the non-volatile inorganics are also concentrated in thecoke, contributing to its ash content. Lastly, thehigh nickel and vanadium content of crude oil hasalso been concentrated in the coke, contributingto heavy metal leaching concerns.
The following represent typical physicalanalyses of the fluid coke from 2 refineries thatwas evaluated in our assessment.
FUEL COMPOSITIONREF#1
14.693
1.530.56
2.411.910.50
REF#215.0
922.000.25
3.002.500 60
HHVWt %Wt %Wt %AshWt 7cWt %Wt %
(k-BTU/LB)CarbonHydrogen
, SulfurNitrogenMoisture
As shown above, the material has a significantlyhigher heating value than most bituminous coals,but unfortunately also has high sulfur andnitrogen content. Ash content is relatively low
compared to coal, but much of it is in the form ofheavy metals. Due to the severe thermalenvironment in which petroleum coke is formed,
there is very little volatile combustible materialin the coke. This requires careful combustionfirebox and ignition design to assure that astable firebox flame is produced, and sustained.
PETROLEUM COKE COMBUSTION EXPERIENCE
Despite its high energy content, the other "badactors" in petroleum coke have prevented its use irmore combustion dispositions such as utility powegeneration. One might guess that coke would be anattractive alternative to most forms of steam coalbut operating experience blending coke with coalhas not been good. The severe thermal processingused to create coke results in it having very hardand gritty physical characteristics. Since moststeam coal is first pulverized before being fed intothe boiler firebox, pet coke has a history ofdestroying ball mills, rod mills, hammer mills, andother size reduction equipment in utility powerplants. The absence of volatiles in pet coke,especially as compared to soft coal, has alsocreated flame stability problems for both initialignition, and sustained ignition. Lastly, ashdeposition in the form of slagging on heat transfersurface walls has sometimes been a problem inutility scale boilers.
When these physical problems are combined withthe environmental liabilities of high sulfur andheavy metals content, utilities are reluctant to buycoke at any price.
CURRENT FUEL PRICING
In large scale combustion applications, pet cokewill compete economically with conventional coatand nature gas, both of which are currentlyexperiencing low prices. Pipeline quality naturalgas at the well is selling on average for $1.50 /M-
Btu, while cleaned coal at the mine is under$1.00/M-Btu. At the industrial or utility scaleburner tip, gas is delivered generally for $2.00-$2.50, while bituminous coal delivered prices canrange from $1.50 - $4.00/M-Btu, depending on thedistance from the mine to the boiler.
Pet coke competes in this fuel price environment.Generally, coke is sold at about $1.00/M-Btu at theburner tip, resulting in a refinery netback of $0.50-$0.75/M-Btu.
248
PURCHASED ELECTRICITY PRICES
Given the relatively low netback for pet coke, andthe problems in storing and transporting it,refiners are asking whether onsite combustion ofpet coke to make electricity is a better alternative.In this regard, the cost of converting pet coke toelectricity has to be less than the cost ofcontinuing to purchase power, for this option to beeconomically desireable.
Across the US, bulk purchased power costs for oilrefiners vary tremendously, 'inc. lowest costs areabout 3 c/kwh, and the highest about 7 c/kwh.Average prices seem to be between 4-4.5 c/kwh.
ON-PURPOSE PET COKE POWER PLANT EXPERIENCE
Although there are not a lot of electricityproducing plants firing pet coke exclusively in theUS, there are a few with notable histories. Twomajor plants that utilize adaptations ofconventional pulverized coal technology are thepower plants operated by Star Enterprises(formerly Texaco) at Delaware City and the AESPlant burning Lyondell's coke (previously Arco) atChannelview. A standard 20 MW size atmosphericfluidized bed system developed by CombustionPower Corp (Menlo Park, CA) is used in 6 Californiapower projects: one is adjacent to Mobil's Torrancerefinery, while the other 5 operate in suburban San
Francisco firing coke from the nearby Tosco andExxon refineries.
In addition to these operating plants, several moreon-purpose pet coke power plants are in variousstages of development. Gulf States Utilities hasteamed up with Cities Services to build 2 parallel100 MW fluidized bed cogen units at Lake Charles.Exxon is evaluating a fluid bed unit for Billings, andStar Enterprises has decided to build a Texaco cokegasification, combined cycle plant at DelawareCity.
TECHNOLOGY COMPARISONS
The 3 major technologies available for convertingpet coke to power are:
• Modified pulverized coke combustion• Atmospheric fluidized bed combustion• Coke gasification, combined cycled power
A pulverized coke unit would combine many of thefeatures of a conventional pulverized coal unit,with additional features that address the specificphysical and chemical characteristics of pet coke.The coke would be processed through a sizereduction unit, to proably minus 80 mesh, andblown pneumatically into the firebox.Supplementary fuel (10%) would be necessary toignite the process, and be required continuously tomaintain flame stability. Firebox temperatueswould average 2000-2500 degF. Air would beintroduced at several different stages to create alean-burn environment minimizing the formation ofCO and NOx. In addition, a catalytic de-NOx unitusing ammonia or urea would be needed to meet NOxcriteria in many areas of non-attainment.Conventional wet scrubbing would remove 90% ofthe sulfur oxides. Paniculate removal (probably anelectrostatic precipitator) may be requiredupstream of the scrubber to reduce solids loading,and particulate removal would be necessary
downstream of the scrubber (probably a fabricfilter) for final solids removal. The environmentalfacilities constitute approximately 35% of thetotal capital cost, reduce overall heat rate by 1-5%, and incur significant operating costs.
An atmospheric fluidized bed unit uses a bubblingor circulating bed of alkaline solid (lime orlimestone) to absorb sulfur oxides released duringcombustion. This eliminates the need for scrubbersand the heat rate penalty associated with them, butrequires more alkaline material than scrubbers. Wehave assumed that 10% supplementary fuel wouldbe required to ignite and maintain combustion,although some vendors indicate that this has beenunnecessary in practice. Combustion temperatuesare relatively low at 1600 degF, reducing theproduction of both CO and NOx. Catalytic de-NOxfacilities will probably still be required, and anelaborate particulate removal system will be usedto both recirculate fines from the fluidized bed,and remove \or final disposal the particulates thatwould otherwise exit the stack. Due to thefluidized bed and the higher firebox residence time,coke particulates need not be size reduced to thesame extent as required by a pulverized unit.
A coke gasification, combined cycle power unitpartially oxidizes the coke feed in a mediumpressure (250 psig) slagging gasifier thatintroduces both oxygen and steam. The reaction isdesigned to convert coke to a synthesis gas mixtureof CO ana H2. Sulfur in the form of H2S is removed
249

chemically in a downstream treatment unit, as areother impurities. The treated synthesis gas is thenfed to a combustion turbine for power generation.The combustion turbine exhaust, usually at 1000degF, flows through a heat recovery steamgenerator. The steam produced is then expandedthrough a condensing steam turbine to makeadditional power.
The principal licensors of coke gasification,combined cycle power technology are TexacoDevelopment, Shell Oil, and Dow-Destec.
COMPARISON OF ENERGY PERFORMANCE
One major criteria for comparing the 3 powers isthe efficiency with which they convert the coke tokilowatts. The most common industry standard forthis measurement is net heat rate, based on coke'shigher heating value. Our assessment of industrialscale units is as follows:
Heat RatefBtu/kwh)
10,400 Coke gasification, combined cycle11,500 Atmospheric fluidized bed11,700 Conventional pulverized coke
The above numbers include complete thermalsystem parasitic power requirements, assume 39%steam turbine efficiency, and 30% combustionturbine efficiency (higher heating value basis). Inthe coke gasification case, the heat recovery steamgenerator is assumed to be unfired, with an HRSGefficiency of 51%.
SYSTEM AVAILABILITY
For both the atmospheric fluidized bed case, andthe coke gasification, combined cycle case, wehave assumed a 90% system availability vs 85% forconventional pulverized coke combustion. Thehigher value has been amply demonstrated by theCombustion Power Units, and by commercialgasification systems producing syngas forchemicals. We do not anticipate a major systemavailability debit for adding an industrial-scale,base loaded combustion turbine such as a GE Frame7 or 9, Westinghouse 501D, or Brown-Boveri Type11. The primary source of the availability debit forthe pulverized coke system is the wet scrubber,
which still encounters internal scaling andplugging problems despite 20 years of commercialexperience in the power generation business.
ENVIRONMENTAL PERFORMANCE
For the systems described above, the cokegasification, combined cycle unit provides the bestpotential for environmental compliance. For thistechnology, we anticipate 99.9% solids capture,99% sulfur removal efficiency, and 99% efficiencyfor CO and NOx removal. This is equivalent to stackgas discharges of 0.18 ppmw for particulates, 7.7ppmv sulfur, 9 ppm NOx as NO2, and 25 ppmv CO.
The next best performer is the atmosphericfluidized bed technology. We anticipate 99.5%solids removal, 92.5 % SOx removal, and 90%efficiency for CO and NOx.
The corresponding values for a pulverized coke unitwith scrubbing, catalytic de-NOx, and multi-stagecombustion are 99.5 % particulates removal, 90%SOx removal, and 90% removal of CO and NOx.
CAPITAL COST COMPARISON
We estimated the total erected cost, in 1991dollars, for building a grass roots power generationfacility burning 1,000 metric tons per day of fluidcoke, for each of the technologies. The results are
CAPITAL COST($M)
208.5 Atmospheric fluidized bed248.7 Pulverized coke195.0 Coke gasification, combined cycle
Since each of the technologies has its ownefficiency, another way to compare capital costs isin terms of $/kw. On that basis, the results are:
($ cap/kw)
1627 Atmospheric fluidized bed1971 Pulverized coke1890 Coke gasification, combined cycle
The apparent disparity between heat rate andefficiency for coke can be explained by thesupplementary fuel we have assumed would berequired in the fluidized bed and pulverized cokecases, but not in the gasification case.
250

We have reviewed these capital costs with anumber of companies in the independent powerproduction business. Most feel comfortable withthe fludized bed and pulverized coke numbers, butbelieve we understate the cost of the gasificationsystem. Given the lack of industrial experiencewith gasification systems, we suggest that detaildesign and cost guarantees be provided bygasification vendors, if their technology is chosenfor specific field applications.
TECHNOLOGY TRADEOFFS
Determining which technology should be selectedfor a particular application is not easy. Pulverizedcoke systems appear very competitive withfluidized bed systems until one demands equalenvironmental performance. Our numbers werebased upon California requirements, which arestricter than the new Clean Air Act. In the absenceof such stringent requirements, pulverized cokeunits may be the technology of choice. However,with our basis, atmospheric fluidized bed systemswere economically preferable. In addition, disposalof scrubber sludge vs dry solids becomes a keysensitivity if they are labelled as hazardous solidwaste.
To date, large single train pulverized coke unitscan be ordered, while fluidized units can be orderedin modules up to about 100 MW. As a result, single
train pulverized units do achieve economies ofscale in larger sizes (above 100 MW).
The big question mark is coke gasification,combined cycle units. Although conceptuallycomplicated as chemical process units, whencompared to simple combustion systems,gasification systems are much smaller thancomparable output combustion systems because ofthe higher pressure in which they operate, and thesize efficiencies associated with combustionturbine power generation. Lastly, there areconsiderable questions as to whether cokegasification, combined cycle units can be purchasedand guaranteed for the capital costs that have beenclaimed by licensing vendors.
251