Controlling Nitrogen Dose Amount in Atmospheric-Pressure ...
Upload
khangminh22Category
view
1download
0
1
INDUCTIVE METHOD FOR ASSESSING THE AMOUNT AND ORIENTATION OF STEEL FIBERS IN CONCRETE Josep M. Torrents, Ana Blanco, Pablo Pujadas, Antonio Aguado, Pablo Juan-García and Miguel Ángel Sánchez-Moragues
Construction and Electronic Engineering Departments, Technical University of Catalonia, Campus Nord, C1 and C4 buildings, Jordi Girona, 1, 08034 Barcelona, Spain
Abstract
Steel fibers are ferromagnetic and they have the property of altering the magnetic fieldaroundthem.Thispaperdiscussesamethodandgivesapracticalexampletomeasure,non-destructively,theamountandorientationoffibersfromcubicconcretespecimens(150mm).This is possible because the fibersaffect inductance ofa sensor (an inductive coil) that iswrappedaroundthespecimen.
Keywords:non-destructivemethods,magnetism,inductivemethod,steelfiberreinforcedconcrete(SFRC).
1. INTRODUCTION
Therecentpublicationofregulationsandinstructions(Blancoetal.2010)relatedtofiber reinforcedconcrete (FRC)caused a significant increase of theapplication of FRC forstructuralpurposesinthelastyears(Lambrechts2008,Sernaetal.,2009andPujadasetal.2011).This increaseshouldbeaccompaniedbycontrolmethodswithregards to the fibercontentortheorientationoffibersthatcombinereliabilityandeconomy.
Severaltechniqueshavebeenappliedtodeterminethedosageand/ororientationof
the fibers inFRC,whichcanbeclassifiedaseitherdestructiveornon-destructive,andarebasedondirector indirectmeasuring.Amongthedestructivemeasures, themostcommonmethod is themanual counting of the fibersafter crushing the specimen (Soroushian andLee, 1990; Gettu et al., 2005; Dupont and Vandewalle, 2005).With regard to orientation,Krenchel,(1975)proposedamethodtodeterminetheaverageorientationofthefibersinthecrosssectionbymeansofatheoreticalexpression.Sincethemeanorientationofthefibersisproportional to the post-cracking strength of the steel fiber reinforced concrete (SFRC),severalresearchershaveindirectlyassessedtheorientationoffibersbymeansofmechanicaltests(Kooiman,2000;Barragán,2002;Grünewald,2004).
Directmeasurementsabouttheorientationofafibercanbeobtainedthroughsuchtechniquesas image analysis (Grünewald, 2004; Lappa, 2007), X-raymethods (VanGysel,2000;Robinsetal.,2003;Vandewalleetal.,2008)orcomputerizedtomography(CT-scans)(Molinsetal.,2008;StälhiandvanMier,2007).
Recently,significantadvanceshavebeenobtainedwithregardstothedevelopment
ofnon-destructivemethodsfordeterminingtheorientationofsteel fibersinelementsonalargescale.Thesemethodshavetobepreviouslycalibratedonsmallersamples.Examplesofsuch methods are the alternating-current impedance spectroscopy (AC-IS) (Ozyurt et al.,
brought to you by COREView metadata, citation and similar papers at core.ac.uk
provided by Loughborough University Institutional Repository

2
2006; Ferrara et al., 2008), the assessment of the electromagnetic wave reflection ofmicrowavesproducedinacoaxialtransmissionlineterminatedwithanopencircuit,actingas a sensor, and in contactwith FRC (Torrents et al., 2009;VanDamme et al., 2004), thewaveguideantenna (Roquetaetal.,2009),methodsbasedontheelectricresistivity(Latasteet al., 2008) andmagneticmethods (Faifer et al., 2010). Thesemethods enable easy andeconomicmeasurementsoftheorientationof fibersandhaveasagreatadvantagethefactthat theuncertaintieswhich tend toexistbetween thesmall-scaleelementsand the large-scaleones,duetothedifferentorientationoffibersinelementswithdifferentdimensions,can be avoided. These uncertainties appear when themeasures obtainedwith a methodaddressed for small-scale elements are extrapolated to a full-scale structure withoutaccounting for the differences in fiber orientation. More details about the methods andresearch related to the electric properties of concrete with fibers can be found in (ACI-544.5R-10).
Withregardtothecontroloftheamountoffibers,regulationshavebeenproposedfor both fresh and hardened concrete [EN 14721:2005 and EN 14721+A1:2007, UNE-EN14721:2001+A1:2008].Bothtestspresentconsiderabledisadvantageswithregardtocosts,timeand/or environmental issues. In the case of fresh concrete,a freshmass of concretemustbewashed(whichrequireshighamountsofwaterandtime)inordertoseparatethefibersbymeansofamagnet;and in thecaseofhardenedconcrete, thespecimenmustbecrushedto,likewise,separatethefibers.
For the case of hardened concrete, the Spanish regulation UNE 83512:2005
proposes an alternative testing technique bymeans ofmagneticmethodswhich does notrequire crushing the specimen, with its corresponding advantages. However, thismethodhasgoneunnoticedand itsusehasnotbeenwidespreadnoranypractical testingmethodhas been developed according to it. Besides, this methodology is absent in the updatedversionofthisSpanishregulation.
Severalexplanationscouldaccount for this issue,but theyarenot fundamental to
this paper, therefore only theadvances in this directionwill beexplained.First ofall, themagneticmethodrequiresequipmentwithmagneticcoils.Theapplicationofamagneticfieldin a structure made of concrete with fibers and the measurement of the disturbance oralterationofthisfieldduetothesefibersareindirect, feasibleandnon-destructivemethodfor the quantification of the presence of steel fibers, aswell as their possible orientation.Bothfactorshaveadecisiveinfluenceoverthesubsequentbehaviorofthestructure(Blanco,2008andPujadas,2008),thusthepossibilityofmeasuringthemacquiresavitalimportanceinordertoguaranteethequalitycontrolofthematerial(Laranjeira,2010).
Theaimofthispaperistointroduce,assessandcompareseveralprototypesbased
on inductive methods, created in order to determine the amount and orientation of thefibers,analyzingtheirsuitabilityasasystematiccontrolmethodforSFRC.Therelevanceofthepresentedmethodstandsinprovidinganon-destructivecontrolsystemwhichisnotonlyatoolabletodeterminetheamountoffiberspresentinconcrete,butatthesametimealsomakes it possible to know their orientation. Likewise, the method proves to be highlyrepeatableandreliable.Aseriesofparametersaredealtwith(amountoffibers,orientation,ageofconcreteandtypeoffiber)andtheirinfluenceonthemeasurementsandresultsoftheinductivemethodareanalyzed.ThepurposeofthisstudyistocontributetotheknowledgeofFRCinthestructuralfieldandtohelptospreaditsuse.
2. PRECEDENTS TO THE INDUCTIVE METHOD 2.1. Introduction
Due to theelectricpropertiesof concrete,manyresearchstudieshave focusedon
thedevelopmentanduseofelectricmethodsasasystemtocharacterizeconcrete,withthe

3
aim of consolidating new applications and non-destructive tests useful for control anddiagnosis(Ozyurtetal.,2006).
Inthisrespect,theSpanishregulationUNE83512-1:2005includedaninductivetest
withcylindricalspecimens,describedverybriefly,asshowninFigure1.Thisregulationcanbeconsideredtobethefirststeptowardthecontrolmethodintroducedinthisarticle.
Essentially, the magnetic induction test is an application of Faraday’s law of
magnetism. For such a test, the specimens must be placed within a container with anestablishedgeometry.Twocopperoraluminumwirecoilsareplacedaroundthecontainer,constitutingthesensorelementofthesystem.Electriccurrentflowsthroughoneofthecoils(theprimaryone),generatingamagneticfieldand,consequently,amagneticfluxwhichgoesthroughthecenterofthecoil.Ifthisfluxisvariable,acurrentisinducedintheothercoil(thesecondary one). Reciprocity exists between the flux generatedby one of thecoils and thecurrent induced in the other one, and the relationship between them is called mutualinduction coefficient,which is ameasurement of themagnetic influence between the twocoils.Itcanbeprovedthatthisinductioncoefficientdependsonlyontheshapeanddistancebetween thecoils,aswellas the(ferromagnetic)natureof thematerials close to thecoils.Therefore,ifthematerialofthespecimenschangestheinductioncoefficientalsochanges.
Fig.1.Measurement configuration detailed in regulation UNE 83512-1.
2.2. Theoretical basis for the inductive method
2.2.1 Laws of magnetism
By combiningAmpere’s andFaraday’s laws ofmagnetism, the inductance (L)ofa
solenoid (coil), which are functions of the geometry and the surrounding material, isobtainedbymeansofEquation[1]:
L= µ * k [1]
where:µ istheeffectivemagneticpermeabilityoftheenvironment(inH/m)(wheresymbol
HofHenryistheSIunitofinductance)dependingonthetemperature(with(µ0)being the vacuum magnetic permeability and (µ) the permeability in anotherenvironment).
kencompassesthedependenceonthegeometry(inm). Ifavariablecurrentisinjectedintothesolenoidthroughoutacircuit,thereappearsanelectromotiveforce(emf)inducedinthecircuit.Thisself-inducedemfisinoppositiontothevariationofthecurrent(energyconservation)andiscalledcounter-electromotiveforce(counteremf).
In the case ofmortar or concrete specimens, if the aggregates are not ferric, thepermeabilitycanbeconsideredtobethatofthevacuum.Besides,ifthesurroundingmaterialcontainsferromagneticelements(thefibers,forinstance),thentheeffectivepermeabilityoftheenvironment(µ)willbeafunctionweightedbythegeometricdistributionofthematerial(seeEquation[2]).Therefore,theinductancecanbeexpressedasinEquation[3].
μ = [α * μ1 + (1 – α) * μ0] for any value of α Є (0,1) [2]
L = [α * μ1 + (1 – α) * μ0] k for any value of α Є (0,1) [3]
where αisthevolumefractionoftheinclusions

4
µ1representsthepermeabilityoftheferromagneticelement(thefibers)withµ1>µ0.
Theanalyticaldeterminationoftheadjustmentconstantα,functionofthegeometryofthelocationofthematerialswithregardtothefieldlinesprovestobenon-viable,exceptincasesofveryfavorablesymmetry.Furthermore,itshouldberecalculatedforeachtypeoffiber, different steel composition, different geometry (hooked-ended or wavy), size andaspect ratio. In any case, the increase in inductance produced by placing a prismaticspecimenwithinthecoilmakesitpossibletodetermine,bymeansofapreviouscalibration,thefibercontentofthespecimen.
2.2.2 Effective permeability of mixtures
AnalternativewaytoseethisrelationshipisthroughtheMaxwell-Garnettequation,
whichrelatestheincreaseoftheeffectivepermeabilityofanenvironment(µ)when(initiallyspherical) inclusionsofpermeability (µ1)different to thatof thesurroundingenvironment(inthiscase,withapermeabilityequaltothatofthevacuumµ0)areinserted.Theequationsupposes, correctly in this case, that the size of the inclusions is much smaller than thewavelengthofthemeasurement.Besides,theinclusionsdonot interactamongthemselves,normuchlesshavecontact(thatonlyhappenswithverysmalldosesofinclusions).Sihvolaand Lindell particularize the Maxwell-Garnett equation for the case of needle-shapedinclusions(fibers)withrandomorientation(Sihvola,Lindell,1992):
µ = µ0 + α(µ1-µ0))1*5)0
(3-2+))1*(3*2+))0 [4]
For the usual caseswhere the volume ratio of the fibers ismuch lower than the
volume ratio of concrete, equations [2] and [4] are approximately equal. When theorientationisnotrandom,theequationismodified.Forinstance,inclusionsalignedwiththedirectionofthemagneticfield, increasetheeffectivepermeabilityandalmostdonotaffectinclusions which are perpendicular to the magnetic field. On average with the threecoordinateaxes,theycoincidewiththerandomorientation.Therefore,asitwillbeshowninsection 4.2 Orientation, if the fibers are arranged in parallel with the direction of themagneticfield,theeffectivepermeabilityismaximum.Incontrast,ifthefibersarearrangedperpendiculartothedirectionofthemagneticfield,theeffectivepermeabilityisminimal.Aninterestingresultdeductedfromequations[2]or[4]isthatthechangeininductance(orinmagneticpermeability)isproportionaltothecontentofinclusions.
2.3. Corporate experience
Atthesametime,aGermancompanydevisedanequipmentbasedonthepreviously
explainedprinciple,capableofmeasuringwithcubicspecimensand,atthesametime,givinginformationabouttheorientationofthefibers.ThecompanyHERTZSystemtechnikGmbH(http://www.hertznet.de/de/products/measurement/bsm100), based in Delmenhorst(Germany)developedananalogsystemcapableofcarryingoutsaidtest,applicabletocubicspecimens of 150x150x150 mm. The system performs a calibration on the basis of themeasurement of a given number of standard specimenswith different fiber dosages. Themeasurementprotocolrequirestheintroductionofthespecimenaccordingtoitsthreeaxes,inordertodeterminethefiberratioorientedineachdirection(afiberalongthemagneticflow modifies the induction coefficient, whereas one crossing it yields practically nomodification). As a result, theequipment offersan estimation of the amount of fibers andtheirdistributionineachofthedirectionsmeasured.Thisequipmentcanalsobeusedwithfreshconcretethankstobucketssuitablydesignedtothepurpose.However,thisequipmenthascertaindisadvantages,whicharedetailedbelow.
Due to the geometry of the coil, themagnetic field is not uniform throughout the
whole central space, which was empirically checked. As a consequence of these signal

5
differences,itcanbeseenthatwithinthecubicspecimenthosefiberslocatedinthecentralareawill have a larger effect than those located in the edges. Therefore, if the fibers areuniformlydistributedthefinalmeasurementwillbeadequate,butif,onthecontrary,therearespecialdistributionsoraccumulationsoffibers(fiberballs)incertainareasofthespace,theywillhaveadifferenteffectonthefinalreadingdependingonwhethertheyarelocatedin the central area or in the upper and lower areas of the specimen being tested. Forinstance,sincethefieldhasanintensityof75%intheedgeswithregardtothatgeneratedinthecenterofthecoil,aconcentrationoffibersa75%lowerinthecenterofthespecimenwillrenderthesamenumericalresultthanthe100%inoneoftheedges.
As a result of these considerations, and with the purpose of improving and
correcting the dysfunctions previously described, the design of an alternative to thecontainerandthecoilpreviouslyintroducedisproposed,byusingcoilswithanon-uniformdistribution.Inthisway,inspiteoftheimpossibilityofobtainingacompletelyuniformfield,it is possible to reduce the difference between the center and the edges, thus achieving amore balanced effect among all the fibers present in the specimen, regardless of theirgeometricalposition.
3. INDUCTIVE METHOD PROPOSED 3.1 Test equipment and differences with the previous methods and systems
Havingexplainedthedifficultiesandlimitationsofthepreviousequipment(uniform
coils leading to certain differences owing to the edge effect), this section introduces thesolutionsdevelopedinordertoimprovetheequipment.Asproposedintheprevioussection,a single coil is used for the measurement, acting at the same time as both emitter andreceptor(thatis,actingasbothprimaryandsecondarycoil,henceavoidingtheweightofasecondary coil). Thus, the mutual induction coefficient becomes the self-inductioncoefficient,self-inductanceorsimplyinductance.Thepresenceoffiberswithinitwilltriggeravariationinitsinductance;bymeasuringwithanimpedanceanalyzer(HP4192AorAgilentU1732A), its variation depending on the content and orientation of the fibers can bedetermined.Themeasurementsareperformedatalowfrequencyof100Hz,atwhichbothinstrumentscanmeasure.
Fig. 2. Test equipment: a) Impedance analyzer HP4192; b) Impedance analyzer Agilent U1732A.
Figure2ashowsthetestequipmentwiththeupper-mid-rangeimpedanceanalyzerHP4192A. This equipment allows the configuration of several parameters (voltage,excitation,frequency,averaging,etc.),whichmakesitveryversatile.Eventhoughitisratherheavy (19 kg), it can bemounted on a frame,and it isvery convenient for the laboratorytests. Figure 2b shows an alternative to the previous equipment, a low-end impedanceanalyzerAgilentU1732A.Thoughlessversatile,itisautonomous,light,smallandveryeasytouse,especiallysuitableforin-situtests.Inpractice,thismodelhasshownaprecisionandefficiencyinmeasuringcomparabletothoseoftheHP4192A.Bothimpedanceanalyzersaresuitableforcarryingoutthetest,butduetoitsautonomyandsize,theAgilentU1732Aseemstobethemostappropriateoneforthequalitycontrolintheworksite.
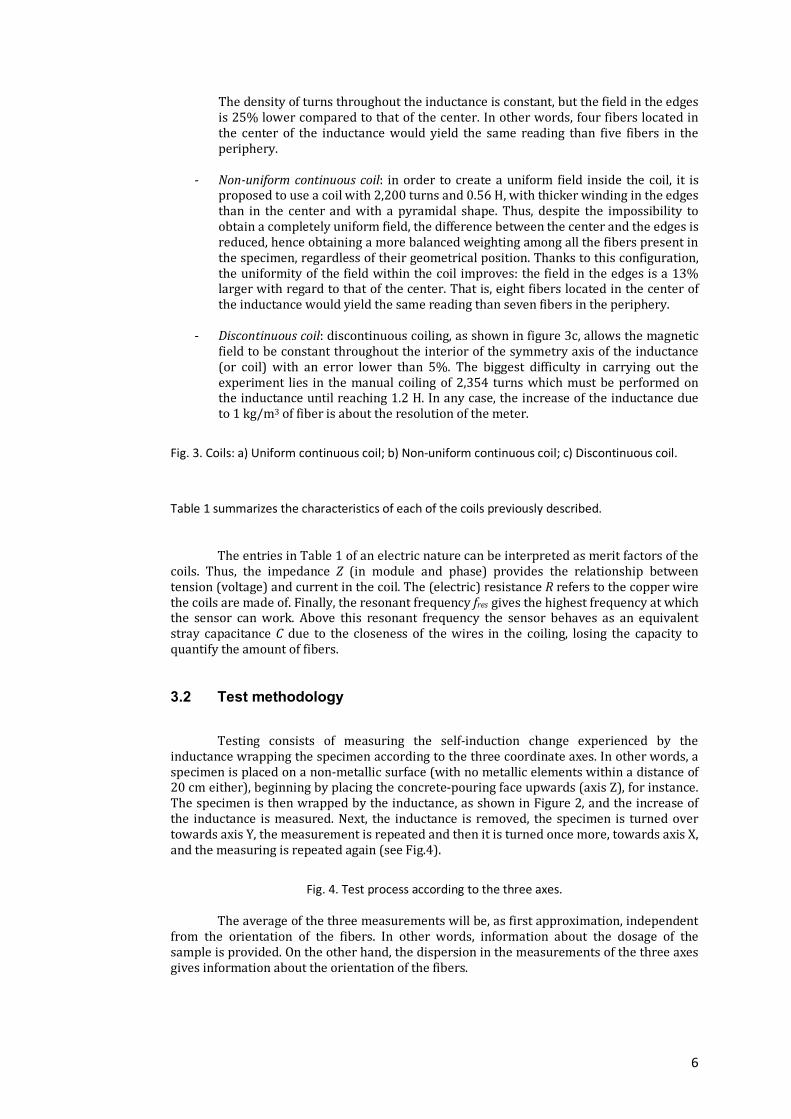
Duringtheprocessofresearchandimprovementofthemethod,threedifferentcoilsweredeveloped(seeFig.3).Theyaredescribedbelow:
- Uniformcontinuouscoil: a coilwithabout8,800 turnsand12H (Henry,SIunitofinductance)isdevisedinordertocontrastitsworkingbehaviortothatofthetestedequipment.With this coil, thevalidityof themethodwitha singlecoil is checked.
6
Thedensityofturnsthroughouttheinductanceisconstant,butthefieldintheedgesis25%lowercomparedtothatofthecenter.Inotherwords,fourfiberslocatedinthe center of the inductancewould yield the same reading than five fibers in theperiphery.
- Non-uniformcontinuouscoil: inorder tocreateauniform field inside thecoil, it isproposedtouseacoilwith2,200turnsand0.56H,withthickerwindingintheedgesthan in the centerandwith a pyramidal shape. Thus, despite the impossibility toobtainacompletelyuniformfield,thedifferencebetweenthecenterandtheedgesisreduced,henceobtainingamorebalancedweightingamongallthefiberspresentinthespecimen,regardlessoftheirgeometricalposition.Thankstothisconfiguration,theuniformityofthefieldwithinthecoil improves:thefieldintheedgesisa13%largerwithregardtothatofthecenter.Thatis,eightfiberslocatedinthecenteroftheinductancewouldyieldthesamereadingthansevenfibersintheperiphery.
- Discontinuouscoil:discontinuouscoiling,asshowninfigure3c,allowsthemagnetic
fieldtobeconstantthroughouttheinteriorofthesymmetryaxisoftheinductance(or coil) with an error lower than 5%. The biggest difficulty in carrying out theexperiment lies in themanual coilingof2,354 turnswhichmustbeperformedontheinductanceuntilreaching1.2H.Inanycase,theincreaseoftheinductancedueto1kg/m3offiberisabouttheresolutionofthemeter.
Fig. 3. Coils: a) Uniform continuous coil; b) Non-uniform continuous coil; c) Discontinuous coil.
Table 1 summarizes the characteristics of each of the coils previously described.
TheentriesinTable1ofanelectricnaturecanbeinterpretedasmeritfactorsofthecoils. Thus, the impedance Z (in module and phase) provides the relationship betweentension(voltage)andcurrentinthecoil.The(electric)resistanceRreferstothecopperwirethecoilsaremadeof.Finally,theresonantfrequencyfresgivesthehighestfrequencyatwhichthe sensor canwork. Above this resonant frequency the sensor behaves as an equivalentstray capacitanceC due to thecloseness of thewires in the coiling, losing the capacity toquantifytheamountoffibers.
3.2 Test methodology
Testing consists of measuring the self-induction change experienced by the
inductancewrappingthespecimenaccordingtothethreecoordinateaxes.Inotherwords,aspecimenisplacedonanon-metallicsurface(withnometallicelementswithinadistanceof20cmeither),beginningbyplacingtheconcrete-pouringfaceupwards(axisZ),forinstance.Thespecimenisthenwrappedbytheinductance,asshowninFigure2,andtheincreaseofthe inductance ismeasured.Next, the inductance is removed, thespecimen is turnedovertowardsaxisY,themeasurementisrepeatedandthenitisturnedoncemore,towardsaxisX,andthemeasuringisrepeatedagain(seeFig.4).
Fig. 4. Test process according to the three axes.
Theaverageofthethreemeasurementswillbe,asfirstapproximation,independentfrom the orientation of the fibers. In other words, information about the dosage of thesampleisprovided.Ontheotherhand,thedispersioninthemeasurementsofthethreeaxesgivesinformationabouttheorientationofthefibers.

7
Althoughcurrentlytheequipmentisonlyapplicabletocubicspecimens,themethodcouldberearrangedforitsusewithcylindricalspecimensbymodifyingthesensorcoil,orbystudyingmethodsofsignalprocessing.Inthisrespectitmustbehighlightedthattheuseofcubicspecimensprovidesvaluableinformationabouttheorientationofthefibersaccordingtothethreemainaxesofthespecimen.
3.3 Results from contrasting
Byusingaprismaticcoil,morerepresentativeresultsareobtained,sinceitweights
each of the fibers present inamoreevenway, regardless of their location. The industrialmanufacturingofacoilwithsuchgeometryismorecomplexthanthatofaconventionalcoil,but developing one with the same number of turns as a conventional one would yieldimprovementsintheresolutionofthemeasurement.
Figure 5 shows the curveswhich relate the results obtained aftermeasuring thesame elements of SFRC with each of the coils. The uniform continuous coil and thediscontinuous coil are compared to the non-uniform continuous coil (Fig. 5a and Fig. 5b,respectively). The results from this figure indicate a strong linear relationship for thedifferenttypesofcoils.
Fig. 5. Relationship between the results from the different coils: a) Uniform and non-uniform continuous coil; b) Non-uniform continuous coil and discontinuous coil.
Apartfromerrorsinmeasuringandlimitationsintheresolutionoftheinstruments,thegraphsinFigure5showthelinearandproportionalrelationshipbetweentheincreaseofinductanceandtheincreaseofferricmaterial.Thisproportionalitydoesnotdependonthecoilusedforthemeasurement.ThisresultverifiesEquation(3)experimentally,sinceαisavery small term (the increase in volumeof fiberswithregard to the volumeof thewholespecimenanditssurroundings);andthetermdependingonμ0iscalibrated.Inanycase,thisequationhasitslimitationswhen“connected”fibersareconsidered,aswillbeexplainedinsection4.3Typeoffiber.
4. ANALYSIS PARAMETERS
4.1 Amount of fibers
Because of the dependence between the amount of fibers and the measured
inductanceanditssimplicityandeconomyinits implementation,thismethodseemstobethemostsuitablesystemfortheverificationofthedosageoftheSFRCinqualitycontrols.
Figure6ashowstheresultsfromanexperimentwherecubicspecimenswithseveralknown amounts of fibers (with increases of 15 kg/m3) were tested; then controlmeasurements were carried out in order to verify the fiber content in each specimen,obtainingafirstreferencestraight linecorrelatingtheincreaseininductanceandthefiberdosage. Figure 6b shows the results obtained for the quality control of specimens fromanotherserieswith40kg/m3and60kg/m3.InthiscasethetypeoffiberisdifferentfromthatofFigure6a,andastraight linewithadifferentslopeisobtained(theinfluenceofthetypeoffiberinthetestisexplainedinsection4.3Typeoffiber).
Fig. 6. Application of the inductive method for the control of the amount of fibers in cubic specimens: a)dosagelineI;b)dosagelineII.

8
Figure 6a and Figure 6b prove the applicability of the method and the resultsobtainedwithconcretespecimenscastwithcubicmolds.However,thismethodcanalsobeusedwithcubicsamplescutfromprismaticspecimensorlargerelements.
Inasecondexperiment,samplesobtainedfromcuttingprismaticspecimens(150x
150x600mm)wereused,followingFigure7a.Accordingtothatfigure,thesamplesarecutatadistanceof75mm(>Lfiber)fromtheedgesinordertoavoidthepossibleedgeorwalleffectsgenerated by themolds. The type of fiber used in thisexperimentwas the same thatwasusedintheexperimentpresentedinFigure6b(lengthof50mmanddiameterof0.60mm).
Fig.7 a) Sketch of the cutting of cubic samples (150 mm) obtained from a prismatic specimen; b) Results from the control of the amount of fibers in cubic samples (dosage line III).
Whencomparingtheresultsfromthesametypeoffiber(Fig.6bandFig.7b),itcanbe
observed that the correlation between variation of inductance and dosage (called dosagelines IIand III, respectively)hardlyvaries,whichcanbedue to the fact that theeffectsofconcretingandtheedgeeffectorwalleffect(seesection4.2.1)onlyaffecttheorientationoffibers,butnotthedosageofthemixtureofSFRC.
Likewise,thedatagatheredinFigure6andFigure7revealthecapacityofthetestmethod forobtainingaccurate resultswithspecimen-sizedelementsaswellaswithcubicsamples obtained from larger elements. Besides, the evident linearity in the correlationbetween increase of inductance anddosagemakes thecalibration of the line for the fiberunderconsiderationremarkablyeasier(Section4.3willdealwiththeinfluenceofthetypeoffiberon themeasurementsof inductance).A line isdefinedby twopoints:oneof them isimposedbythedosageof0kg/m3,sinceithasnofibers,inductanceisnotaffected.Thus,itisonlynecessary toknowthe increaseof theinductancegeneratedbyagivendosageof thefiberused.
4.2 Orientation
4.2.1 Physics principle of the method
SFRCisnotanisotropicmaterial;thefibersdonotprovideauniformreinforcement
inthethreedirectionwiththesameefficiencyinallofthem(Laranjeira2010d).Inmostofthecasespreferentialorientationsintheconcretematrixoccurasaresultofseveralaspects,being the wall-effects introduced by the formwork (Romualdi and Mandel, 1964;Kameswara, 1979;Krenchel, 1975;Soroushianand Lee, 1990;Hoy, 1998; Stroeven, 1999;Kooiman, 2000; Van Gysel, 2000; Dupont and Vandewalle, 2005) and the fresh-stateproperties of SFRC (Grünewald, 2004; Stälhi and van Mier, 2008; Ferrara et al., 2008;Martinieetal.,2009)twoofthemostsignificant.
Assuminganinfinitelylargevolumeofconcrete,fiberswouldbeexpectedtoorient
withequalprobabilitiesindifferentdirectionsinspace.Nevertheless,boundariesarealwayspresent inconcreteelements theprobability toorientate randomlynear theboundariesisverylow(SoroushianandLee,1990).Insuchcases, fiberstendtoorientateparalleltotheboundaries.Thisphenomenonisknownasthewalleffect.
Studies have been carried out to determine to what extent do the fresh-state
properties(namelyflowproperties)ofFRCaffectfiberdistributionandorientationoffibers(Grünewald2004;StälhiandvanMier,2008).TheconclusionsfromthestudypresentedbyStälhi and van Mier confirm that fibers align with the flow of fresh concrete and thealignmenthasadirect influenceonthebendingstrength(betterfiber-alignmentleadstoahigherbendingstrength).Onthecontrary,conventionalFRC(nonself-compactingconcrete

9
ornon-ultra-fluid)presents largescatterintheresultsofbendingstrength,decreasingthecharacteristicvaluesofstrength(Kooiman2000).
Other factors influencing the orientation of fibers are concrete pouring and the
work-siteapplicationsystem, the typeofvibrationand theproductionmethod (Laranjeira2010a).Thisphenomenonofpreferentialorientationcanbeanadvantageordisadvantagedependingontheapplicationand,thereforeitisofspecialimportancebeingabletocontrolit.
Due to the physical nature of the magnetic field, the fibers located in a positionparallel to the direction of the field (Fig. 8b)will vary the inductance of the coil,whereasthoseinaperpendicularposition(Fig.8aandFig.8c)willshowpracticallynovariation.Thissimple physics principle will make it possible to determine the orientation of the fibersaccordingtothemainaxesofthespecimen.
Fig. 8. Diagram of a fiber aligned to axis x and affected by the magnetic field created by a coil turned around according to its three main axes: a) according to axis x; b) according to axis y; c) according to axis z.
Therefore, sincea fiberalong themagnetic fieldmodifies the inductioncoefficientwhereasoneacrossitpracticallydoesnotmodifyit, thefractionoffibersorientedineachdirection can be determined if, using the coil as a sensor, the inductance ismeasured bywrappingeach specimen sequentially, three times, according to the three coordinateaxes(seeFig.8).
4.2.2 Experimental verification
In order to corroborate such circumstance, the following experimentwas carried
out: the fibers are suspended, in only one direction,within amethacrylate cube,with thehelpofaspongeofthesamesizeastheinteriorofthecube;themeasurementsarerepeatedwiththefibersplacedparallelandperpendiculartothemagneticfield.TheresultsobtainedareshowninFigure9.
Fig. 9. Measurements of fiber orientation for: (a) uniform continuous coil; (b) non-uniform continuous coil.
The results shown in Figure 9 clearly indicate the detection of the orientation of
fibers;thedifferencebetweentheemptycoilandthecoilwiththefibersperpendiculartothefield(Fig.8aandFig.8c)issmall(11-13%),whereasthedifferencebecomesremarkable(87-89%)inthecaseofthecoilwiththeparallelfibers(Fig.8b).
Ifthecontributionofthefiberstotheinductanceisconsideredtobethevalueofthe
inductancemeasuredwithfibersminusthevalueofthecoilinthevacuum,andthe100%isassignedtothesumofthevariationswithfibersperpendicularandparalleltothefield:
• Inthecaseoftheuniformcontinuouscoil,theincreaseforperpendicularfibersisof
∆L90=(12,29 H–12,24 H)=0,05 H and for parallel fibers, of ∆L0=(12,64 H–12,24H)=0,40 H. hence, the growth is of a 11% for perpendicular fibers100*∆L90/(∆L90+∆L0)andofa89%forparallelfibers100*∆L0/(∆L90+∆L0).
• With the non-uniform continuous coil, on the other hand, it is of a 13% in theperpendicularsituationandofa87%inparallel,ofthesamemagnitudelevelthanwiththepreviouscoil,showingthatinbothcases(withbothcoils)thedifferenceisremarkable.

10
4.2.3 Preferential directions
Theorientationofthefibersinhardenedconcreteistheresultofachainofstages
the FRC goes through from mixing to hardening within the formwork. The boundaryconditionsspecific toeachstageof theproductionprocess,aswellas theactions imposed(walleffect,gravity,externalvibration,etc.) inducenumerousinteractionstageswheretheorientationofthefibersismodified(Laranjeiraetal.,2010b;Laranjeiraetal.,2010c).Inthisregard,themeasurementonspecimensrevealstwodirectionswherefibersaremorealignedthaninthethirdone(vertical,axisz),creatingthusapreferentialplaneoforientation(thehorizontal one). Figure 10 shows the results from the percentages of fiber orientationaccordingtothethreemainaxesinspecimenswithdifferentamountsoffibers.Theprocessofcalculationofthepercentagesisthesameasindicatedabove(Section4.2.2).
Fig. 10. Distribution of fiber orientation (%) in the three axes for specimens with: a) 20 kg/m3; b) 30 kg/m3 and c) 40 kg/m3.
The values from the graphs in Figure 10 indicate the existence of a preferentialhorizontalplaneintheorientationoffibersforthethreedosagesused.Thisphenomenonistheresultofthefibercastingorplacingmethod;itisnotcausedbytheamountoffibers,asthedistributionsinFigure10show. ThecompactionprocessofSFRCbecomesasignificantinfluenceontheorientationofthefibers.Duringthatprocessthefiberstendtoorientateparalleltotheformworksurface(walleffect). Itmustbementioned that thiseffect isonly local (in theconcrete incontactwiththeformwork),butcanbesignificantinthinelementsandwhenthefibersarelong(seeFig. 11). Moreover, vibration can also trigger the rotation and alignment of the fiberspreferentiallyinaspecificdirection(Gettuetal.,2005).Specifically,externalvibrationtendstoorientatefibersinaplaneperpendiculartothedirectionofthevibration(EddingtonandHannant,1972),withatendencytowardsaplainorientationofthefibers(SoroushianandLee,1990;Kooiman,2000):themoretheFRCissubjecttovibration,themorethefiberstendtoalignthemselvesinthehorizontalplane.
Fig. 11. Preferential orientation (wall effect) in a thin element. Several researchers have highlighted the remarkable influence of casting of the
elements(ToujanjiandBayasi,1998;Markovic,2006;Torrijosetal.,2008)andthedirectionof the concreting on the orientation of the fibers (Torrijos et al., 2008; Stälhi et al., 2008;Dozio,2008).Thisphenomenonisobservedwhenmeasuringtheorientationofthefibersinconcretespecimensfromcubicmoldsandincubicsamplescutfromprismaticelementswithdimensionsof150x150x600mm(followingthecuttingpatternindicatedinFig.7a).Figure12(correspondingtotwodifferentamountsof fibers:40and60kg/m3)andTable2showthe results of the distribution of fiber orientation (in percentage) obtained from saidexperiment. (WhereHx,HyandVzstands forhorizontalx,horizontalyandvertical zaxisrespectively).
Fig. 12. Distribution of the orientation of the fibers in cubic specimens and samples (with 40 and 60 kg/m3).
Table 2. Percentages of fibers (%) for different directions and with two different amounts of fibers.
TheresultspresentedinFigure12andTable2showanalignmentofthefibersinthehorizontalplane(axesHxandHy)forbothdosages;however,itseemsmoreinterestingto compare the results obtained from the cubic specimens to those obtained with thesamples cut from prismatic specimens. In the latter, the horizontal plane remains as thepreferential orientation plane, but the alignment of the fiberswith the axis Hy augmentssignificantly.Thisphenomenonisduetothefactthattheinfluenceoftheflowisintrinsically

11
related to thepouringandplacingsystemandwith thegeometryof theelementcastwithconcrete(inthiscase,aprismaticmold).Theseresultscoincidewiththestudiescarriedoutwhichpointoutthatthepouringorflowofconcretecauseapreferentialorientationofthefibers(Grünewald,2004;Stälhietal.,2008;Lapa,2007).Theiralignmentwiththeflowalsoincreasesatincreasingflowdistance. Thepossibilityofknowingtheorientationofthefibersinanelementturnsouttoberelevant information with regard to the mechanical behavior of the element, since theorientationhasdirectconsequencesover thepost-crackingstrengthof thematerial.Whencubic specimens or samples are tested following the configuration of a double-punch test(liketheBarcelonaUNE83515:2010test(Molinsetal.,2009),butwithoutacontrolchainforcircumferentialstrain),theresidualstrengthwasinfluencedbytheorientationofthefibers,depending on whether they are aligned in a direction favorable to the strength of thestresses generated. Another example can be found in the flexural strength tests withprismatic specimens of FRC (UNE EN 14651:2007+A1:2008 or NBNB 15238),where thespecimenisturnedaroundandthehorizontalplaneofpreferentialorientationofthefibersdoesnotcorrespondwiththeplaneofapplicationoftheload(seeFig.13).Thisrotationofthespecimenwillyieldresultsofresidualstrengthslowerthanthoseobtainediftheplaneofpreferentialorientationofthefiberscoincidedwiththeplaneofloadapplication.
Fig. 13. Specimen for flexural strength test: a) concrete pouring position; b) test position.
4.3 Type of fiber
ThetypeoffiberusedfortheproductionofSFRCisafactorthatmustbetakeninto
accountwhenapplying the inductivemethod, since thegeometryof fibers (withregard tolength,diameterorcontactamongtheminsidetheconcretematrix)causesadifferentresultofthemeasurementofself-inductionintheinductance.Therefore,thecorrelationbetweenthefibercontentandtheinductanceincreaseforeachtypologyoffibermustbecalibratedinordertodeterminethedosageinasystematicway(aswaspointedoutinSection4.1Amountoffibers).
4.4 Age of concrete
Asithasbeenpreviouslydescribed,thecomponentsofconcrete(aggregates,water
andcement)arenotferromagnetic,andthischaracteristicisindependentfromthestateofconcrete (be it in fresh state or in hardened state).This invariability of the ferromagneticproperties of concrete guarantees that the results obtainedwhen performing the test 24hoursafterconcrete-pouringwillbethesameasthoseobtainedafter28days.Withtheaimofverifyingthishypothesis,thefollowingexperimentwascarriedout:12cubicspecimensofSFRCwerecast,andmeasurementsweretakenwiththeinductivemethodatdifferentages.Figure 14 shows thegraphwith the results (inH) obtainedat bothageswhenmeasuringwith the uniform continuous coil according to the three coordinate axes (the X axiscorrespondstotheconcrete-pouringface).
Fig.14. Results obtained (inductance) with each of the coordinate axes at the SFRC ages of 7 days and 90 days.
ThevaluesfromFigure14areanindicationoftherepetitivenessinthevaluesfrom
themeasurementsatbothages(7/90days).Thisexperimentconfirmsthat,sincethenon-ferromagneticpropertiesofthecomponentsofconcreteremainconstantthroughtime,theinductivemethodcanbesuitablyusedatanymomentand is independent fromtheageofconcrete.
Table3showstheinductanceincreaseresultsobtainedlikethemeasurementsfromFigure 14 (in this case the test equipment consisted of: HP4192A analyzer and uniform

12
continuous coil). The values show how the difference in sample age between the twomeasurementsisnon-existentornegligibleinmostofthecases.
Table 3. Measurements from each specimen by means of HP4192A analyzer uniform continuous coil taken at 7 days and 90 days.
In previous experiments, introduced in Section 4.2.3 Preferential directions, a
preferentialorientationof fiberswasdetected in theplaneof theconcrete-pouring faceofthe cubic specimen, and lower induction values weremeasured in axis Z direction. Thisphenomenon, as has been previously explained, is caused by several factors, such as thecompactionofconcrete.Anexcessivevibrationofthespecimenalignsfibersintheplaneoftheconcrete-pouringface.However,theresultspresentedinTable3andFigure14donotshowaclearorientationin thatplane;on thecontrary,thevalues fromthe threeaxesaresimilar. Probably, vibration of the specimens was not carried out, but instead externalknockingofthemoldswasperformed.
5. APPLICATION OF THE INDUCTIVE METHOD WHEN THE AMOUNT OF FIBERS IS UNKNOWN
Withtheaimofdeterminingtheaccuracyoftheinductivemethodforassessingthecontentof fibersinconcrete,ablindtest(thedosageoffiberswasnotknownbeforehand)wascarriedoutwith12cubicspecimensofSFRCwiththesametypeoffiberand6differentamountsoffibers(atintervalsof5kg/m3).Thetestwasperformedinordertodeterminethefibercontentofeachofthespecimens.
Theinductancewasmeasuredbymeansofacheaphandimpedancemeasurer(LCR)byAgilent,modelU1732A,at100Hz(someinductancemeasurementswererepeatedat120Hzwithdifferenceslowerthantheresolutionoftheinstrument).Thiseconomicinstrumentcanonlymeasureatcertainfrequencies.Inthiscase,a lowfrequencyequalto100Hzwasselected.Theinductanceofthediscontinuouscoil,1.2HasmentionedinSection3.1,istheminimuminductancevaluethatmadeitpossibletoobservetheinductancechangesduetoavariationof1kg/m3offiberinthespecimenanditisabovetheresolutionoftheinstrument.In other words, the empirical determination of k comes from measuring the coil in thevacuum.Thus,k=1.2H/µ0.
Bymeans of the systempreviously described, the inductance changes inducedbyeach of the twelve samples are measured. It must be highlighted that each set ofmeasurementsofthethreeorientationsforeachofthetwelvespecimenscanbeperformedbyonesingleoperatorinlessthananhour.Afterthenecessarytimeforthestabilizationofthemeasurement,thefluctuationswerelowerthan0.3mH.
Before proceedingwith the analysis of the results, it is necessary to explain thedifference between the theoretical dosage and the real dosage of the specimen. Thetheoreticaldosageisthedosageusedinthemixture(weightedandintroducedintothepasteintheexactamount).However,whentheconcreteispouredintothemold,itmayoccurthattheproportionofthemixturedriftsfromthetheoreticalamount.Thatdosageiscalledthemeasuredrealdosage;however, thevariation is sosmall that it canbeassumed tobe thetheoreticaldosage.
Inordertodeterminetherealdosageandtocalibratethemethod(inotherwords,theincrementofinductancecorrespondingwiththeexactamountoffibers)itisnecessarytocountthefibers.Thisprocedureiscarriedoutbycrushingallthespecimens,collectingthefibersandweightingthemaccordingto[EN14721:2008].Theaveragenumberoffibersinspecimens 35A and 35Bwere used as the standard for the assessment of the amount offibers. The comparison between the exact dosage of the other samplesmeasured by [EN

13
14721:2008]andthedosageinferredbythemagneticmethodoverthepattern,hasallowedtomeasurethegoodnessofthemagneticmethod.
Table 4 provides the predicted dosages after themeasurement, at 90 days, of thevariation of inductance in the specimens previously introduced, with the three coils(nonuniformcontinuous,uniformcontinuousanddiscontinuouscoils).Additionally,Table4shows the results of the abovementioned comparison between real dosage and dosagemeasuredbythemagneticmethod.Table4.ResultswithHP4192AanalyzerfromtheexperimentwithcubicspecimensofSFRCcomparedwithmeasuredrealdosage[EN14721:2008]. InviewoftheresultsreproducedinTable4,theerroroftheinductivemethodislessthan 2 kg/m3 in all cases. Moreover, because the magnetic field is more uniform in thediscontinuouscoilthanintheothertwocoils,thedispersionofthemeasurementsbetweenthe three coilsmay be indicative of heterogeneity in the distribution of fiberswithin thespecimens.Itcanalsobeobservedthatthetestequipmentisaccurateenoughtodistinguishthe real dosage in the specimens and being able to assign a theoretical dosage to eachspecimenwithnoriskoferror.
6. CONCLUSIONS
ThegrowinguseofSFRCstructureshighlightsthenecessityfornewnon-destructivemethodsforqualitycontrol,combiningpracticalityandeconomywithefficiency.Withthatpurpose in mind, a control method was developed on the basis of the UNE 83512-1regulation.ThismethodmakesitpossibletocontrolthedosageandorientationofthefibersinSFRCelements.
Inordertoprovethecapacityoftheaforementionedtestmethodadetailedanalysiswascarriedout,andthefollowingcanbeconcluded:
- ThedevelopedtestequipmentisabletodetectthedosageofaSFRCelementwitha
verifiedaccuracybetterthan5kg/m3.
- The developed method makes it possible to determine the percentage of fibersaligned according to the main axes, information which can be advantageouslyappliedforthedesignandimprovementofthestructuralresponseoftheelement.
- Theageofconcretedoesnot influenceover the test results.Then, the test canbecarriedoutatanyageoftheSFRC.
- Itispossibletoobtainadosageline(fromwhichtheamountsoffibersdependingonthe inductancemeasurements are obtained) for each type of fiberwith only onereferencemeasure.
Applicationofthismethodislimitedtothesensorsamplesandthefielduniformity
inside.Other systems apply to structures, although itsapplication is limited to laboratoryresults.Amagneticsystemwithalesserdependencyonthegeometryofthesensorcould,infuture,analyzestructuralelementsinsitu.
All the properties of the test method described lead to the conclusion that the
measurementof thechangeof inductancegeneratedby thepresenceof steel fibers in theconcreteisareliable,simple, fastandeconomicmethodforthedetectionoftheamountoffibersaswellastheirorientation.Theinductivemethodhasthepotentialtobecomeakeytoolfor thequalitycontrolanddiagnosisofSFRCelements,beingofspecial interest inthefieldofprefabrication.

14
ACKNOWLEDGEMENTS
The authorswish to thank the companies FCC, S.A. (HATCONS Project), PROMSA,ESCOFETandCEMEXfortheirpartial financingandtheirparticipationintheexperimentalcampaignscarriedout.TheauthorsalsowishtothanktheMinistryofScienceandInnovation(MCINN)onthegroundsoftheCONSFIBproject(reference:BIA1010-17478).Thesecondand the third authors wish to express their acknowledgement to the Comissionat per aUniversitats del DIUE de laGeneralitat de Catalunya i del Fons Social Europeu for the FIgrantandtothePolytechnicUniversityofCataloniafortheFPI-UPCgrant,respectively.Thesame authors are also grateful for the support provided by the Col·legi d’Enginyers deCamins,CanalsiPortsdeCatalunya.
REFERENCES Aguado,A.,Laranjeira,F.,(2007)PresentacióndelanejodehormigónconfibrasdelaEHEyecuaciónconstitutivadelhormigónconfibras.CátedraBMB-UPC:Aplicacionesestructuralesdehormigónconfibras.Barcelona,2007.Barragán,B.E.(2002)Failureandtoughnessofsteelfiberreinforcedconcreteundertensionandshear,PhDThesis,UniversitatPolitècnicadeCatalunya.Blanco, A., Pujadas, P., de la Fuente, A., Aguado, A. (2010) Análisis comparativo de losmodelosconstitutivosdelhormigónreforzadocon fibras,HormigónyAcero,61(256):83-101.Blanco, A. (2008)Durabilidaddel hormigón con fibras de acero,Minor thesis, UniversitatPolitècnicadeCatalunya.Dozio, D. (2008) SFRC structures: Identification of the uniaxial tension characteristicconstitutivelaw,PhDThesis,PolitecnicodiMilano.Dupont,D.,Vandewalle,L.(2005)Distributionofsteelfibresinrectangularsections,CementandConcreteComposites,27:391-398.Edington J., Hannant, D.J. (1972) Steel Fibre reinforced concrete. The effect on fibreorientationofcompactionbyvibration,MaterialsandStructures,5(25):41-44.Faifer, M.; Ottoboni, R.; Toscani, S.; Ferrara, L. (2010) Steel fiber reinforced concretecharacterizationbasedonamagneticprobe,InstrumentationandMeasurementTechnologyConference(I2MTC),IEEE:157-162.Ferrara, L., Park, Y., Shah, S.P. (2008) Correlation among fresh State Behavior, FiberDispersion and Toughness Properties of SFRCs, Journal of Materials in Civil Engineering,20(7):493-501.Gettu, R., Gardner, D.R., Saldívar, H., Barragán, B.E. (2005) Study of the distribution andorientationoffibersinSFRCspecimens,MaterialsandStructures,38(1):31-37.Grünewald, S. (2004) Performance-based design of self-compacting fibre reinforcedconcrete,PhDThesis,DelftUniversityofTechnology.Hoy, C.W. (1998)Mixing andmix proportioning of fibre reinforced concrete, PhD Thesis,UniversityofPaisley.Kameswara RAO, C.V.S. (1979) Effectiveness of random fibres in composites, Cement andConcreteResearch,9:685-693.

15
Kooiman,A.G.(2000)ModellingSteelFibreReinforcedConcreteforStructuralDesign,PhDThesis,DelftUniversityofTechnology.Krenchel, H. (1975) Fibre spacing and specific fibre surface, In: Neville A, editor. Fibrereinforcedcementandconcrete,UK:TheConstructionPress:69-79.Lambrechts, A. (2008)Performance classes for steel fibre reinforced concrete: Be critical.BEFIB 2008: 7th RILEM International Symposium on Fibre Reinforced Concrete. RILEMPublicationsSARL:1007–1020.Lappa, L. (2007) High Strength Fibre Reinforced Concrete: Static and fatigue behavior inbending,PhDThesis,DelftUniversityofTechnology.Laranjeira,F.(2010)Design-orientedconstitutivemodelforsteelfiberreinforcedconcrete,PhDThesis,UniversitatPolitècnicadeCatalunya.Laranjeira, F., Aguado, A., Molins, C. (2010a) Predicting the pullout response of inclinedstraightsteelfibersMaterialsandStructures,43(6):875-895.Laranjeira, F., Molins, C., Aguado A. (2010b) Predicting the pullout response of inclinedhookedsteelfibers,CementandConcreteResearch,V.40:1471-1487.Laranjeira, F., Grünewald, S., Walraven, J., Blom, C., Molins, C., Aguado, A.(2010c)Characterization of the orientation profile of steel fiber reinforced concrete, Accepted onMaterialsandStructuresandsoonavailableonline.Lataste, J.F.,Behloul,M.,Breysse,D.(2008)Characterisationof fibresdistributioninasteelfibrereinforcedconcretewithelectricalresistivitymeasurements,NDT&EInternational,41:638-647.Markovic I (2006)High-PerformanceHybrid-FibreConcrete:Development andUtilisation,PhDThesis,DelftUniversityofTechnology.MartinieL.,Rossi,P.,Roussel,N.(2010)Rheologyoffiberreinforcedcementitiousmaterials:classificationandprediction,40(2):226-234.Molins, C., Martinez J., Arnáiz, N. (2008) Distribución de fibras de acero en probetasprismáticasdehormigón,CD-ROMfromthe4thInternationalStructuralConcreteCongress(ACHE),Valencia,Spain.Molins,C.,Aguado,A.,Saludes,S.(2009)DoublePunchTesttocontrolthetensilepropertiesofFRC(Barcelonatest).Rev.MaterialsandStructures(RILEM).Vol.42,nº4.May2009:415-425.NBNB15-238,1992“Essaisdesbétonsrenforcésdefibres-Essaideflexionsuréprouvettesprismatiques“.Nuclear Energy Agency, Committee on The Safety of Nuclear Installations (1998)DevelopmentprioritiesforNon-DestructiveExaminationofConcreteStructures inNuclearPlant.Nea/Csni/R(98)6.Ozyurt, N., Mason, T.O., Shah, S.P. (2006) Non-destructivemonitoring of fiber orientationusingAC-IS:Anindustrial-scaleapplication,CementandConcreteResearch,36:1653-1660.Pujadas, P. (2008) Durabilidad del hormigón con fibras de polipropileno, Minor Thesis,UniversitatPolitècnicadeCatalunya.Pujadas, P., Blanco, A., de la Fuente, A., Aguado, A. (2011) Cracking behaviour of FRCslabswith traditional reinforcement.MaterialsandStructures,Accepted21September2011(DOI:10.1617/s11527-011-9791-0).

16
Robins,P.J.,Austin,S.A.,Jones,P.A.(2003)Spatialdistributionofsteelfibresinsprayedandcastconcrete,MagazineofConcreteResearch,55(3):225-235.Romualdi, J.P., Mandel, J.A. (1964) Tensile strength of concrete affected by uniformlydistributedandcloselyspacedshortlengthsofwirereinforcement,ACIJournal,61(6):27-37.Roqueta, G., Romeu, J., Jofre, L. (2009) Electromagnetic modeling and characterization ofsteel fiber reinforced concrete during the pouring process. Antennas and PropagationSocietyInternationalSymposium,2009.APSURSI'09.IEEE:1–4.Serna, P., Arango, S., Ribeiro,T.,Núñez, A.M., Garcia-Taengua, E. (2009) Structural cast-in-place FRC: technology, control criteria and recent applications in Spain, Materials andStructures,42(9):1233-1246.Sihvola, A.H., Lindell, I.V. (1992) Effective Permeability of Mixtures. Progress InElectromagneticsResearch,PIER06:153-180.http://www.jpier.org/PIER/pier.php?volume=06.Accessed23May2011.Soroushian,P.,LeeC (1990)Distributionandorientationof fibers insteel fiber reinforcedconcrete,ACIMaterialsJournal,87(5):433-439.Stälhi, P. (2008) Ultra-Fluid, Oriented Hybrid-Fibre-Concrete, PhD Thesis, Institute forBuildingMaterialsETHZürich.Stälhi, P, Custer, R., van Mier, J.G.M. (2008) On flow properties, fibre distribution, fibreorientationandflexuralbehaviourofFRC,MaterialsandStructures,41:189-196.Stroeven, P. (1999) Steel fibre reinforcement at boundaries in concreteelements,Proceedings of the 3rd International Workshop on High Performance FiberReinforcedCementComposites(HPFRCC3),Mainz,Germany,413-421.Torrents, J.M., Juan-García, P., Patau, O., Aguado, A. (2009) Surveillance of steel fibrereinforcedconcreteslabsmeasuredwithanopen-endedcoaxialprobe,Proceedingsof theXIX IMEKOWorld Congress: Fundamental andAppliedMetrology, Lisbon, Portugal: 2282-2284.http://www.imeko2009.it.pt/Papers/FP_633.pdf.201.Accessed23May2011.Torrijos,M.C.,Tobes,J.M.,Barragán,B.E.,Zerbino,R.L.(2008)OrientationandDistributionofSteelFibresinSelf-CompactingConcrete,Proceedingsofthe7thRILEMSymposiumonFibreReinforcedConcrete:DesignandApplications(BEFIB2008),Chennai,India:729-738.Toujanji,H.,Bayasi,Z.(1998)Effectsofmanufacturingtechniquesontheflexuralbehaviorofsteelfiber-reinforcedconcrete,CementandConcreteResearch,28(1):115-124.UNE 83512-1, 2005 “Hormigones con fibras. Determinación del contenido de fibras deacero”.AENOR,Madrid.Van Damme, S., Franchois, A., De Zutter, D. and Taerwe, L. (2004) NondestructiveDetermination of the Steel Fiber Content in Concrete Slabs UIT an Open-Ended CoaxialProbe.IEEETransactionsonGeoscienceandRemoteSensing,42,11:2511-2521.Vandewalle,L.,Heirman,G.,vanRickstal,F.(2008)Fibreorientationinself-compactingfibrereinforced concrete, Proceedings of the 7th RILEM Symposium on Fibre ReinforcedConcrete:DesignandApplications(BEFIB2008),Chennai,India:719-728.Van Gysel, A. (2000) Studie van het uittrekgedrag van staalvezels ingebed in eencementgebondenmatrixmettoepassingopstaalvezelbetononderworpenaanbuiging,PhDThesis,GentUniversity.

17
UNEEN14651,2005 “Testmethod formetallic fibreredconcrete -Measuring the flexuraltensilestrength(limitofproportionality(LOP),residual)”.

18
Fig.1.MeasurementconfigurationdetailedinregulationUNE83512-1.

19
Fig.2.Testequipment:a)ImpedanceanalyzerHP4192;b)ImpedanceanalyzerAgilentU1732A.

20
Fig.3.Coils:a)Uniformcontinuouscoil;b)Non-uniformcontinuouscoil;c)Discontinuouscoil.

21
Fig.4.Testprocessaccordingtothethreeaxes.

22
Fig.5.Relationshipbetweentheresultsfromthedifferentcoils:a)Uniformandnon-uniformcontinuouscoil;b)Non-uniformcontinuouscoilanddiscontinuouscoil.

23
Fig.6.Applicationoftheinductivemethodforthecontroloftheamountoffibersincubicspecimens:a)dosagelineI;b)dosagelineII.

24
Fig.7a)Sketchofthecuttingofcubicsamples(15cm)obtainedfromaprismaticspecimen;b)Resultsfromthecontroloftheamountoffibersincubicsamples(dosagelineIII).

25
Fig.8.Diagramofafiberalignedtoaxisxandaffectedbythemagneticfieldcreatedbyacoilturnedaroundaccordingtoitsthreemainaxes:a)accordingtoaxisx;b)accordingtoaxisand;c)accordingtoaxisz.

26
Fig.9.Measurementsoffiberorientationfor:(a)uniformcontinuouscoil;(b)non-uniformcontinuouscoil.

27
Fig.10.Distributionoffiberorientation(%)inthethreeaxesforspecimenswith:a)20kg/m3;b)30kg/m3andc)40kg/m3.

28
Fig.11.Preferentialorientation(walleffect)inathinelement

29
Fig.12.Distributionoftheorientationofthefibersincubicspecimensandsamples(with40and60kg/m3).

30
Fig.13.Specimenforflexuralstrengthtest:a)concretepouringposition;b)testposition.

31
Fig.14.Influenceofthetypeoffiberonthemeasurementoftheinductance:a)alignmentofthefiber;b)exposureofthefibertothemagneticfield.

32
Fig.15.Resultsobtained(inductance)witheachofthecoordinateaxesattheSFRCagesof7daysand90days.

33
Table1.Maincharacteristicsofthethreecoilsdeveloped.
Characteristics Uniformcontinuouscoil
Non-uniformcontinuouscoil Discontinuouscoil
Geometry 15x17x17cm 15x17x17cm 15x17x17cmTurnshape Square(289cm2) Square(289cm2) Square(289cm2)Numberofturns 8,800 2,200 2,354Wirelength 5,632m 1,408m 1,600mDiametercable 0.3mm 0.2mm 0.2mmTurns Positive Positive PositiveMagneticfield Non-uniform Non-uniform UniformTheoreticalinductance(L) 12H 0.56H 1.2HModule(Z) 8,106Ω 760Ω 1,189ΩPhase(Z) 79.1DG 27.6DG 39.9DGResistance(R) 1,540Ω 673Ω 920ΩResonantfrequency(fres) 2kHz 5kHz 20kHzEquivalentstraycapacitance(C) 0.50nF 2.00nF 0.05nFWeight 4.70kg 0.95kg 1.15kg

34
Table2.Percentagesoffibers(%)fordifferentdirectionsandwithtwodifferentamountsoffibers.
AxisHx AxisHy AxisVz
40kg/m3Specimen 38.13 40.37 21.50Samples 47.70 34.01 18.29
60kg/m3Specimen 39.65 36.09 24.25Samples 48.06 30.14 21.80

35
Table3.MeasurementsfromeachspecimenbymeansofHP4192Aanalyzeruniformcontinuouscoiltakenat7daysand90days.
Code Specimen
Changeininductanceaccordingtomeasurementsfrom29/06/10
Changeininductanceaccordingtomeasurementsfrom8/09/10
Axisx(H)
Axisy(H)
Axisz(H)
Average(H)
Axisx(H)
Axisy(H)
Axisz(H)
Average(H)
30A 1 0.14 0.16 0.11 0.14 0.14 0.16 0.12 0.14 30B 2 0.14 0.16 0.14 0.15 0.14 0.16 0.14 0.15 31A 3 0.19 0.20 0.17 0.19 0.19 0.20 0.17 0.19 31B 4 0.20 0.22 0.18 0.20 0.20 0.21 0.18 0.20 32A 5 0.26 0.27 0.29 0.27 0.27 0.27 0.30 0.28 32B 6 0.22 0.23 0.23 0.23 0.23 0.23 0.24 0.23 33A 7 0.27 0.31 0.32 0.30 0.28 0.31 0.32 0.30 33B 8 0.35 0.32 0.30 0.32 0.34 0.32 0.30 0.32 34A 9 0.37 0.43 0.36 0.39 0.37 0.43 0.35 0.38 34B 10 0.45 0.48 0.35 0.43 0.45 0.48 0.35 0.43 35A 11 0.48 0.49 0.39 0.45 0.49 0.49 0.39 0.46 35B 12 0.43 0.56 0.48 0.49 0.43 0.56 0.48 0.49
HP4192Aanalyzeranduniformcontinuouscoil HP4192Aanalyzeranduniformcontinuouscoil

36
Table 4. ResultswithHP4192Aanalyzer from the experimentwith cubic specimens of SFRC comparedwithmeasuredrealdosage[EN14721:2008].Specimen
TheoreticalDosage(kg/m3)
MeasuredrealDosage(kg/m3)EN14721:2008
Volume(l)
Weight(kg)
Fibreweight(gr)
Dosage(kg/m3)
Dosage(kg/m3)
Dosage(kg/m3)
30A 10 9.94 3.372 7.514 33.50 10.18 9.79 10.2430B 10 11.00 3.364 7.506 37.00 10.68 11.02 11.7531A 15 13.51 3.368 7.469 45.50 13.55 13.57 13.7631B 15 14.44 3.360 7.475 48.50 14.29 15.05 15.8632A 20 20.14 3.376 7.585 68.00 20.37 20.48 20.4032B 20 16.64 3.395 7.511 56.50 17.00 17.27 17.8833A 25 22.90 3.363 7.460 77.00 22.09 22.12 22.4933B 25 23.94 3.342 7.419 80.00 23.32 23.27 24.0034A 30 28.71 3.378 7.492 97.00 27.92 28.29 28.6234B 30 31.23 3.362 7.438 105.00 31.05 30.67 31.1435A 35 32.69 3.359 7.547 109.80 33.26 33.14 33.7435B 35 36.22 3.382 7.598 122.50 35.64 35.77 36.26
Uniformcontinuouscoil
Non-uniformcontinuouscoil
Discontinuouscoil
Copyright © 2022 FDOKUMEN