Indonesia Making the New Indonesia Work for the Poor
359
November 2006 Document of the World Bank Report No. 37349-ID Indonesia Making the New Indonesia Work for the Poor Poverty Reduction and Economic Management Sector Unit East Asia and Pacific Region Public Disclosure Authorized Public Disclosure Authorized Public Disclosure Authorized Public Disclosure Authorized Public Disclosure Authorized Public Disclosure Authorized Public Disclosure Authorized Public Disclosure Authorized
-
Upload
khangminh22 -
Category
Documents
-
view
0 -
download
0
Transcript of Indonesia Making the New Indonesia Work for the Poor

November 2006
Document of the World BankR
eport No. 37349-ID
Indonesia
Making the N
ew Indonesia W
ork For the Poor
Report No. 37349-ID
IndonesiaMaking the New IndonesiaWork for the Poor
Poverty Reduction and Economic Management Sector UnitEast Asia and Pacifi c Region
Pub
lic D
iscl
osur
e A
utho
rized
Pub
lic D
iscl
osur
e A
utho
rized
Pub
lic D
iscl
osur
e A
utho
rized
Pub
lic D
iscl
osur
e A
utho
rized
Pub
lic D
iscl
osur
e A
utho
rized
Pub
lic D
iscl
osur
e A
utho
rized
Pub
lic D
iscl
osur
e A
utho
rized
Pub
lic D
iscl
osur
e A
utho
rized


Glossary of terms
Abbreviations and acronyms
AAHRD Afta Amdal APBD APBN Arisan Asabri Asean Askes
Bappeda
Bappenas BIGS Bimas
BKD BKKBN BKM BKN BLK BOS BPN BPOM BPR BPS BRI Bulog
CAF CBO CCT CDD CEFE CIFOR CPI cso
DAH DAU DBH DFlD DFID-MFP D HS' Dinas DPR DPRD
FA0 FDI FE Unpad FG D FP Scheme
GDP G DS GlAT Project
Agency for Agricultural Human Resource Development Asean Free Trade Area Environmental Impact Permit (Analisis Mengenai Dampak Lingkungan) Regional Government Budget (Anggaran Pendapatan Belanja Daerah) State Budget (Anggaran Pendapatan Belanja Nasional) Rotating credit scheme at community level Pension and health coverage for the Armed Forces and Police Association of South-East Asian Nations Health insurance provided by PT Askes (Asuransi Kesehatan)
Development Planning Agency at SubNational Level (Badan Perencanaan Pembangunan Daerah) National Development Planning Agency (Badan Perencanaan dan Pembangunan Nasional) Bandung Institute for Governance Studies Mass Guidance (or Bimbingan Massal) - government program that provided farmers access to high-yielding rice varieties,fertilizers and pesticides Rural Development Bank (Badan Kredit Desa) National Family Planning Agency (or Badan Koordinasi Keluarga Berencana Nasional) Student Scholarship Program (Beasiswa Kerja Mahasiswa) National Civil Service Agency (Badan Kepegawaian Negara) Vocational training center (Balai Latihan Kerja) Operational Aid for Schools Program (Bantuan Operasional Sekolah) National Land Agency (Badan Pertanahan Nasional) National Agency for Drug and Food Control (Badan Pemeriksa Obat dan Makanan) People's Credit Bank (Bank Pinjaman Rakyat) Central Bureau of Statistics (Badan Pusat Statistik) Bank Rakyat Indonesia, partially state-owned nationwide bank National Logistics Agency (Badan Urusan Logistik Nasional)
Community Achievement Fund Community-Based Organization Conditional Cash Transfer Community Driven Development Creation of Enterprise through Formation of Entrepreneur Center for International Forestry Research - Indonesia Consumer Price Index Civil Society Organization
Special Allocation Fund (Dana Alokasi Khusus) General Allocation Fund (Dana Alokasi Umum) Shared-Revenue Fund (Dana Bagi Hasil) Department for International Development Department for International Development - Multi-stakeholder Forestry Program Demographic and Health Survey Regional Sector Office House of Representatives (Dewan Perwakilan Rakyat) Provincial House of Representatives (Dewan Perwakilan Rakyat Daerah)
Food and Agriculture Organization Foreign Direct Investment Faculty of Economics, University of Padjajaran Focus Group Discussion Foster-parent Scheme
Gross Domestic Product Governance and Decentralization Survey Growth through Investment in Agriculture and Trade Project

MAKING THE NEW INDONESIA WORK FOR THE POOR
GIC GNP GRDP
HDI HH
IAARD ICRAF I CT I DT I FAD IFLS I LO IMR lnpres IRDA IRI
J a msoste k JKJ JPKM J PS
JSS
Kcal KDP Kepmen Keppres KHM KKB KLK Kopin kra
KUD KUK Kupedes
LAN LAP LE LIK LMPDP LOC LPBE
JPS-BK
KPK-D
MA MASS MDGs ME Menpan MI MIC MIE MMR MNC MPR MSS
Growth Incidence Curve Gross National Product Gross Regional Domestic Product
Human Development Index Household
Indonesian Agency for Agricultural Research and Development International Center for Research in Agro-forestry - Kenya Information and Communication Technologies Village Infrastructure Development Program (Inpres Desa Tertinggal) International Fund for Agricultural Development Indonesian Family Life Survey International Labor Organization Infant Mortality Rate Presidential Instruction (Instruksi Presiden) Indonesia Rapid Decentralization Appraisal International Roughness Index
A provident fund Jembrana Health Insurance (Jaminan Kesehatan Jembrana) Health coverage provided by local goverment Social Safety Net (Jaringan Pengaman Sosial) Social Safety Net on Health (Jaring Pengaman Sosial Bidang Kesehatan) Junior Secondary School
Kilo calories Kecamatan Development Program Ministerial Decree (Keputusan Mentri) Presidential Decision (Keputusan Presiden) Minimum Subsistence Need (Kebutuhan Hidup Minimum) Fuel Compensation Cards (Kartu Kompensasi Bahan Bakar Minyak-BBM) Vocational training courses (Kursus Latihan Kerja) Cooperatives for Small Industries (Koperasi lndustri Kerajinan Rakyat) Regional Poverty Reduction Committee (Komite Penganggulangan Kemiskinan Daerah) Village Cooperative (Koperasi Unit Desa) Small-Scale Credit Unit (Kredit Usaha Kecil) General Rural Credit (Kredit Umum Pedesaan)
National Institute of Administration (Lembaga Administrasi Negara) Land Administration Project Large Enterprise Small-Scale Industrial Estates (Lingkungan lndustri Kecil) Land Management and Policy Development Project Land Office Computerization Research institute, Faculty of Economy, University of Padjajaran (Laboratorium Penelitian Pengabdian pada Masyarakat dan Pengkajian Economi)
Islamic Senior Secondary School (Madrasah Aliyah) Microfinance Access and Services Survey Millennium Development Goals Medium Enterprise State Ministry for State Apparatus Reform (Menteri Negara Pendayagunaan Aparatur Negara) Islamic Primary School (Madrasah Ibtidaiyah) Middle-Income Country Micro Enterprises Maternal Mortality Rate Multi-National Company People’s Consultative Assembly (Majelis Permusyawarahan Rakyat) Minimum Service Standard

Glossary of terms
MT Musren bangNas
N FE
NlT
OBA OECD Opec OPK
P4K
PAD PDAM PDM-DKE
PEP1
PETS PlSA PKBM PKK
PKWT PLN PMDF PMT Podes PoS Cards Posya nd u PPA PPP PRA Progresa PSDA PSlA PU Puskesmas Pustu
PKPS-BBM
RALAS Raskin Renja-KL Renstra Renstra-KL Renstra-SKPD RlCA RlCS RKA-KL R HA-SKPD RKP
RPJM
RPO RPPG RPPK RVA
R K P-D
RPJM-D
Islamic Junior Secondary School (Madrasah Tsanawiyah) Government Development Planning Forum
Non-Farm Enterprise NGO Non-Governmental Organization NSS Nutrition and Surveillance Survey NTBWest Nusa Tenggara (Nusa Tenggara Barat) East Nusa Tenggara (Nusa Tenggara Timur)
Output-Based Aid Organization for Economic Cooperation and Development, Organization of the Petroleum Exporting Countries Special Market Operation (Operasi Pasar Khusus)
Income Generating Project for Marginal Farmers and Fishermen (Proyek Peningkatan Pendapatan Petani-Nelayan Kecil) Own-Source Revenue (Pendapatan Asli Daerah) Municipal Water Companies (Perusahaan Daerah Air Minum) Regional Empowerment to Overcome the Impact of Economic Crisis (Program Pemberdayaan Daerah Akibat Dampak Krisis Ekonomi) National Team to Promote Exports and Investment (Tim Nasional Peningkatan Ekspor dan Peningkatan Investasi) Public Expenditure Tracking Survey Program for International Student Assessment Community Learning Center (Pusat Kegiatan Belajar Masyarakat) Family Welfare Education (Pendidikan Kesejahteraan Keluarga) Fuel Subsidy Compensation Program (Program Kompensasi Pengurangan Subsidi BBM) Temporary Working Agreement (Perjanjian Kerja Waktu Tertentu) State Electricity Company (Perusahaan Listrik Nasional) Proportion of Maternal Deaths of Females Proxy Means Test Village Potential Statistics (Potensi Desa) Point of Sale Cards Integrated Health Services Unit (Pos Pelayanan Terpadu) Participatory Poverty Assessment Purchasing Power Parity Participatory Rural Appraisal Cash transfer program in Mexico Water resource management (Pengelola Sumber Daya Air) Poverty and Social Impact Analysis Public Works (Pekerjaan Umum) Community Health Center (Pusat Kesehatan Masyarakat) Community Health Sub-center (Puskesmas Pembantu)
Reconstruction of Aceh Land Administration Project Rice for the Poor Program (Beras Miskin) Ministry Work Plan (Rencana Kerja Kementerian/Lembaga) Strategic Plan (Rencana Strategis) Ministry Strategic Plan (Rencana Strategis Kementerian/Lembaga) Dinas Work Plan Budget (Rencana Strategis Satuan Kerja Perangkat Daerah) Rural Investment Climate Assessment Rural Investment Climate Survey Ministry Work Plan and Budget Dinas Work Plan Budget Government Annual Work Plan (Rencana Kerja Pemerintah) Regional Annual Work Plan (Rencana Kerja Pemerintah - Daerah) Medium-Term Development Plan (Rencana Pembangunan Jangka Menengah) Regional Medium-Term Development Plan (Rencana Pembangunan Jangka Menengah Daerah) Rural Producer Organization Rate of Pro-Poor Growth Revitalisasi Pertanian, Perikanan dan Kehutanan (Revitalizing Agriculture, Forestry and Fisheries) Risk and Vulnerability Assessment

MAKING THE NEW INDONESIA WORK FOR THE POOR
Sakernas SD SDI SE SGP SlKD SLTP SMA SME SMK SMP SMU SNPK
SSN Supas Susenas Susi
SPK-D
Taspen TBA TFR TIMSS TPC
UCT UNICEF UPP U PT UUPK
Warsi WDI WDR WEF WHFWP WHO WSLICQ wss WUAs
YPC
Labor survey (Survei Angkatan Kerja Nasional) Primary School (Sekolah Dasar) Surface Distress Index Small Enterprise Scholarship Grant Program Reginonal Finance Information System (Sistem lnformasi Keuangan Daerah) Public Junior Secondary School (Sekolah Lanjutan Tingkat Pertama) Senior High School (Sekolah Menengah Atas) Small to Medium Enterprise Vocational Schools (Sekolah Menengah Kejuruan) Junior High School (Sekolah Menengah Pertama) Senior Secondary School (Sekolah Menengah Umum) National Strategy for Poverty Reduction (Strategi Nasional Penanggulangan Kemiskinan) Regional Poverty Reduction Strategy (Strategi Penanggulangan Kemiskinan Daerah) Social Safety Net Inter-censal survey, or Survei Penduduk antar Sensus National Socio-Economic Survey (Survei Sosial Ekonomi Nasional) Integrated Business Survey of non-registered Micro and Small Enterprises (Survei Usaha Terintegrasi)
Pension fund for civil servants Traditional Birth Attendant Total Fertility Rate Trends in Mathematics and Science Study Targeted Performance Contracting Program
Unconditional Cash Transfer United Nations Children's Fund Urban Poverty Program Technical Service Unit (Unit Pelaksana Teknis) Basic Forestry Law (Undang-Undang Pokok Kehutanan)
Conservation Information Kiosk (Warung lnformasi Konservasi) World Development Indicators World Development Report World Economic Forum Women's Health and Family Welfare Project World Health Organization Second Water and sanitation for Low-Income Communities Project Water Supply and Sanitation Water Users Associations
Sandalwood Education Foundation (Yayasan Pendidikan Cendana)
Editorial and data note
Indonesian words are italicized (bupati), but where they are acronyms they are capitalized but not italicized (Wartel). Likewise, where Indonesian words are considered to be used in the sense of proper nouns they are capitalized but not italicized (Dewan Perwakilan Rakyat, or DPR). Abbreviations and acronyms that are pronounced as words (not separate letters) tend to have the first letter only capitalized to indicate to the reader they are pronounced as words (Jamsostek).
Dollar figures are current US dollars, unless otherwise specified. Billion (bn) means 1,000 million (m); trillion (trn) means 1,000 billion.

Contents
Foreword ............................................................................................................................................................ i
Acknowledgments ................................................................................................................................................. ii
Overview .......................................................................................................................................................... iv
Chapter 1 Introduction ...................................................................................................................................... 1
Introduction ........................................................................................................................................ 2
Chapter 2 A History of Growth and Poverty Reduction ................................................................................ 4
I Making the New Indonesia Work for the Poor ............................................................................... 5
I1 . A Troubled History and Chronic Poverty ..................................................................................... 5
I11 . A Period o f Growth and Poverty Reduction ................................................................................ 7
1V . A Structural Transformation ...................................................................................................... 11
V.The Financial Crisis ..................................................................................................................... 14
V I . Post-Crisis: Stabilization. Democracy and Decentralization ..................................................... 18
VI1 . Conclusion: Learning from History to Support Poverty Reduction ......................................... 19
Chapter 3 Understanding Poverty in Indonesia ............................................................................................ 22
I . Salient Facts about Poverty in Indonesia ...................................................................................... 23
I 1 . A Profile ofthe Poor ................................................................................................................... 38
111 . The Determinants o f Poverty ..................................................................................................... 46
I V . The Determinants o f Recent Poverty Changes: A Dynamic Analysis ....................................... 52
V . Conclusion: Poverty Diagnostics Provide Pointers for Poverty Reduction Efforts .................... 56
Chapter 4 Making Growth Work for the Poor .............................................................................................. 80
I . Introduction .................................................................................................................................. 81
I1 . What Are the Pathways out o f Poverty? ..................................................................................... 83
I11 . Linking Pathways out o f Poverty to Policies for Pro-Poor Growth ........................................... 88
I V . Maintaining a Stable Macroeconomy ........................................................................................ 92
V . Investing in the Capabilities o f the Poor ................... ............................................................ 93
V I . Connecting the Poor to Growth ............................................................................................... 102
VI1 . Conclusion: Making Growth more Pro-Poor .......................................................................... 116
Chapter 5 Making public Spending Work for the Poor ............................................................................. 120
I . Introduction ................................................................................................................................ 121

I1 . Aggregate Spending Levels and Fiscal Space ........................................................................... 122
111 . Human Development Sectors .................................................................................................. 125
I V . Infrastructure Sectors ............................................................................................................... 145
V . Conclusion: Achieving Synergies through the Right Development Spending Mix .................. 156
Making Social Protection Work for the Poor ............................................................................ 164
I . Introduction ................................................................................................................................ 165
Chapter 6
I1 . The Evolution o f Social Protection Institutions: From Universal Subsidies to Targeted Transfers ........................................................................................................................................ 169
111 . Household Risk Management: Findings from a Risk and Vulnerability Assessment and Implications for Social Protection Policy ...................................................................................... 175
IV . Towards a National Social Protection System that Makes Sense for Indonesia ...................... 182
V . Conclusion: Towards a Third-Generation System .................................................................... 199
Chapter 7 Making Government Work for the Poor ................................................................................... 208
I1 . Policy, Planning and Budgeting Systems .................................................................................. 212
IV . Monitoring and Assessment of Poverty and Poverty Reduction Interventions .
I . Introduction ................................................................................................................................ 209
111 . Institutional Accountability . ............................................................................................... 224
............. 242
..................................... 245 V . Conclusion: Towards Government Services Focused on the Poor
Chapter 8 Summary of Recommendations .................................................................................................. 252
I . Priorities for Poverty Reduction: An Agenda for Action ........................................................... 253
I1 . Poverty Reduction Policy Matrix .............................................................................................. 257
List o f Boxes
Box 2.1
Box 3.1
Box 3.2
Box 3.3
Box 3.4
Box 3.5
Box 3.6
Box 3.7
Box 4.1
Indonesia’s elections and the consolidation of democracy .............................................................. 19
Poverty definitions and measures .................................................................................................... 25
I s inequality in Indonesia really so low? .......................................................................................... 33
The faces of urban poverty .............................................................................................................. 40
Unemployment and poverty are not equivalent ............................................................................... 43
Rice-price increases disproportionately hurt the poor ..................................................................... 44
Tobacco damages poor households’ finances as well as their health ............................................... 45
There are differences in poverty correlates and constraints across regions ..................................... 5 1
Rationalizing the use o f ‘forest lands’ can help the poor ................................................................. 97
Box 5.1
Box 5.2
Box 5.3
Box 5.4
Box 6.1
Box 6.2
Box 6.3
Box 6.4
Box 6.5
Box 6.6
Box 6.7
Box 7.1
Box 7.2
Box 7.3
Box 7.4
Box 7.5
Box 7.6
Box 7.7
Box 7.8
Box 7.9
Box 7.10
Box 7.1 1
Box 7.12
Does the Operational Aid to Schools improve affordability for poor students? Issues and concerns regarding the BOS program ............................................................................................ 132
Local ownership in Lumajang ....................................................................................................... 149
Scaling up community-driven development through the KDP program A strategy for building rural infrastructure while reducing poverty ...................................................................... Keeping the ‘C’ in community-driven development Concerns with the PKPS-BBM Village Infrastructure Program ................................................................................................................... 155
Comprehensive insurance frameworks and the role o f government in social risk management: .. 168
Indonesia’s PKPS-BBM Unconditional Cash Transfer (UCT) program: The problems encounter and ways forward ................................................................................................. 174
The emergence o f cash transfers as an instrument o f social policy in developing countries ......... 185
What i s a CCT and what i s its purpose? ........................................................................................ 187
Can public employment programs act as social insturance for the por and near-poor ................... 189
Improving poor people’s access to healthcare: Concerns with the PKPS-BBM health insurance scheme ..................................................................................................................... 192
Poverty targeting database ............................................................................................................. 199
The challenges o f implementing good pro-poor planning and budgeting by sub-national government .................................................................................................................................... 215
How i s the D A U allocated across districts? ................................................................................... 219
High levels o f teacher absenteeism ...................................................................... 224
Legislative blockage to local government action .................................................. The basics o f better staffing ............................... The challenges o f implementing local civil service reforms .......................................................... 232
Informal patronage behavior in the Indonesian civil service ......................................................... 233
How public-private competition can improve healthcare for poor clients ..................................... 235
Developing a high-quality, locally-initiated block grant program in Blitar city ............................ 237
When vouchers work for the poor-and when they don’t ........................................................ Increasing the benefits from the private sector ...... .................................. 239
How can incentives change the behavior o f frontline service providers? ...................................... 240
List of Figures
Figure 2.1
Figure 2.2
Figure 2.3
Periods o f sustained growth have brought rapid poverty reduction in Indonesia. 1961-2005 ........... 7
Indonesia experienced a rapid structural transformation in recent decades ..................................... 12
Corruption in Indonesia remained a potential source o f weakness in the period 1980-98 ............... 15

Figure 2.4 Rice prices increased substantially during the crisis .......................................................................... 16
Figure 3.1 Growth has become less pro-poor over time ................................................................................... 24
Figure 3.2 Almost half o f all Indonesians live on less than US$2-a-day .......................................................... 25
Figure 3.3 Trends in educational attainment in Indonesia ................................................................................. 29
Figure 3.4 Under-five mortality since 1960: ..................................................................................................... 30
Figure 3.5 But today Indonesia has a high and stagnating child malnutrition rate ............................................ 30
Figure 3.6 Large variations exist in poverty headcount, across Indonesia ........................................................ 34
Figure 3.6.b ... and pockets o f poverty exist even within rich provinces ............................................................... 34
Figure 3.7 Expansion in access to safe water source and improved sanitation by income group, 1994- ................................................................................................................................ 35
Figure 3.8 Growth i s less pro-poor in eastern Indonesia ................................................................................... 37
Figure 3.9 Households with very small planned areas are much poorer .............................................................. 39
Figure 3.10 Changes in selected endowments for the poor, 1999-2002 ............................................................... 53
Figure 3.1 1 Movement towards the informal sector was greater among the poor ............................................... 56
Figure 4.1 Poverty headcount projections depend on the pro-poorness o f growth ........................................... 81
Figure 4.2 The pathways out o f poverty ............................................................................................................ 83
Figure 4.3 Movements along the pathways out o f poverty, 1993 to 2002, when villages can be reclassified as urban in 2002 from their 1993 status as rural (‘published’ data) ..................
Movements along the pathways out o f poverty, 1993 to 2002, when villages remain in their 1993 classification as urban or rural (‘corrected’ data) .................................................................... 85
Figure 4.5 The welfare benefits associated with ‘investing’ in the poor and ‘connecting’ the poor ................. 89
Figure 4.6 Most important constraints faced by firms in RIC survey ................................................................. 90
Figure 4.7 Low land registration in Indonesia .................................................................................................. 97
Figure 4.8 The gap between household consumption associated with high educational endowments has
Figure 4.4
widened between urban and rural areas for higher levels of schooling (1 999-2002) ...................... 99
Figure 4.9 In rural areas, lack ofjob availability i s a concern even for graduates o f senior secondary schools ............................................................................................................................................. 99
Figure 4.10 The ratio o f wages for SMK vs . regular senior secondary school graduates have recovered in recent years .................................................................................................................................... 100
Figure 4.1 1 Vocational school enrollments are regressive: the poorest 20 percent o f population capture only about 12 percent o f benefits from public SMKs .................................................................... 100
Figure 4.12 Better infrastructure i s associated with higher levels o f non-farm enterprise activities in Indonesia .................................................... .............................................................................. 103
Figure 4.13 Real minimum wages in Indonesia have been on the r ise in recent years ........................................ 108
Figure 5.1 Consolidated spending as a percentage o f GDP over time ............................................................ 123

Figure 5.2 Fuel subsidies ran out of control with increasing oil prices and stagnating refinery capacity ....... 123
Figure 5.3 Fuel subsidies and spending in pro-poor development sectors ........................................................ 123
Figure 5.3a Fiscal space for development programs and fuel subsidy reductions .............................................. 123
Figure 5.4a Aggregate public education expenditure has increased in decentralized Indonesia (% o f GDP) .. 128
Figure 5.4b Comparison of public funds available for education ...................................................................... 128
Figure 5.5 Sources o f basic education spending from public and private resources (2003) .......................... 128
Figure 5.6 Expanded access to secondary school level has made education public spending more pro- poor over time ............................................................................................................................... 128
Figure 5.7 Learning levels among Indonesian 15-year-olds are low, even among the relatively better off .... 129
Figure 5.8 Non-fee costs of schooling are higher than the cost of school fees for the poor ............................ 132
Figure 5.9 Aggregate public health expenditure has increased in decentralized Indonesia (% o f GDP) ........ 136
Figure 5.10 Indonesia‘s total health spending (from public and private sources still remains low ................... 136
Figure 5.1 1 Sources o f healthcare spending in Indonesia (2003) ........................................................................ 136
Figure 5.12 Over time benefit incidence of public health spending .................................................................... 136
Figure 5.13 Health utilization o f health providers by income groups (2004) ..................................................... 138
Figure 5.14 Development spending on infrastructure (% GDP) ........................................................................ 146
infrastructure services (ranking: 1 worst, 7 best) .......................................................................... 146 Figure 5.15 Indonesia i s already lagging behind China in the ‘commercial perception’ o f quality in
Figure 5.16 Development spending on infrastructure by sub-sector (% GDP) ................................................ 150
Figure 6. 1 Indonesia’s universal fuel subsidy: a dominant social policy with a highly regressive impact ..... 173
Figure 6.2 Real rice prices were stable before the crisis .................................................................................... 193
Figure 6.3
Figure 6.4
Figure 7.1
Figure 7.2
Figure 7.3
Figure 7.4
Figure 7.5
Figure 7.6
The reach of traditional social insurance: participants in the labor force by per capita income. selected countries circa 1995 ......................................................................................................... 195
The targeting performance of various targeted poverty programs in Indonesia are only slightly pro- poor ...................................................................................................................................... 196
Governance indicators for Indonesia ............................................................................................. 212
Three key areas of government action ........................................................................................... 212
Less pro-poor distribution of education expenditures after decentralization due to increased inequities in decentralize spending (2000-03) ............................................................................... 217
Shared natural-resource revenues are distributed to a few provinces only .................................... 218
The education DAK does not correlate with problem areas in terms o f SMP enrollment rates ............................................................................................................................................... 220
... while the health DAK i s better targeted to regions where infant mortality rate i s high (2005) ............................................................................................................................................. 220
Figure 7.7 Puskesmas receive most o f their revenues in the form o f in kind transfers or earmarked funding ........................................................................................................................................... 226
Figure 7.8 Use o f public and private service providers ...................................................................................... 234
List of Tables
Table 2.1
Table 2.2
Table 2.3
Table 2.4
Table 2.5
Table 2.6
Table 3.1
Table 3.2
Table 3.3
Table 3.4
Table 3.5
Table 3.6
Table 4.1
Table 4.2
Table 4.3
Table 4.4
Table 4.5
Table 4.6
Table 4.7
Table 4.8
Table 5.1
Table 5.2
Table 6.1
Table 6.2
Table 6.3
Long-term patterns o f pro-poor growth in Indonesia ........................................................................ 6
Poverty elasticity o f growth has varied over time with most rapid poverty reduction in the period 1976-1987 ............................................................................................................................... 9
Employment has moved to non-agricultural sectors and urban areas over time .............................. 1 1
Indonesia had the longest serving leader o f any country impacted by the Asian financial crisis .... 15
The crisis caused construction, finance and trade sectors to contract in relative size ...................... 16
Real wages were eroded by inflation during the crisis keeping unemployment surprisingly stable .................................. ............................................ 17
Poverty has declined to pre-crisis levels in most regions ................................................................. 23
Multi-dimensional poverty .............................................................................. Rice and tobacco are large spending items in the budgets of the poor . .................................... 42
Household expenditure function by urbadrural area, 1999-2002 .................................................... 47
Decomposition of changes in poverty incidence by endowments, 1999 to 2002 ............................ 54
Post-crisis movement towards informal and agriculture sectors ...................... True rural-urban migration, 1990- 1995 ........................................................................................... 86
Poverty transition matrix, 1993 to 2000, from IFLS panel data (percent of individuals, not ...................................................................
Linking policies to pathways out o f poverty .................................................................................... 91
Access to infrastructure by region ................................................................................................. 104
................. 105
Maintaining and upgrading the district road network: estimated costs .......................................... 106
Financial obstacles facing rural non-farm enterprises ..... ......................................................... 113
Condition and surface type of district-level roads, 2003 ......................................
Reasons for not applying to a formal financial institution ( f i r m s that need additional funds) ....... 114
MDGs and national medium-term development targets (RPJMs) for Indonesia ........................... 121
Comparison o f health indicators across countries .......................................................................... 127
Movements in and out o f poverty, 2003-04 .................................................. ............................ 165
Typology o f instruments for household risk management ............................................................. 167
Indonesia's crisis-era social safety net ........................................................................................... 170

Table 6.4
Table 6.5
Table 6.6
Table 6.7
Table 7.1
Table 7.2
Table 7.3
Table 7.4
Table 7.5
Table 7.6
Shocks that “had a negative impact to family welfare”. reported incidence (percent) among households. 2004 ........................................................................................................................... 179
Households that reported “solutions” to the shocks. reported recourse among households reporting shocks, 2004 ................................................................................................................... 179
Risk mitigation and coping instruments captured in Susenas ........................................................ 180
International comparison o f targeting performance for cash transfer programs ...................... What a difference a decade makes ................................................................................................. 2 I O
Translating poverty reduction priorities and objectives into results on the ground ....................... 213
Before and after: government efforts to rectify deficiencies in planning and budgeting processes ........................................................................................................................................ 214
Suggested functional allocations for service delivery .................................................................... 228
Locally initiated governance reforms implemented in West Sumatra province ............................ 232
Economic benefits from community-managed basic infrastructure ............................................... 236
List of Annexes
Annex 11.1
Annex 11.2 Framework for pro-poor growth ......................................................... Poverty lines. percentage o f poor and total numbers of poor in Indonesia .................................... 265
................................. 266
................. 267
Annex 11.4 Mean share o f per capita income from each source (national, rural, urban) ..................................... 268
Annex 11.5 lncrease in non-agricultural sector employment was higher than predicted by average employment growth (1982-2002) ...................... .............................. . 269
Annex 11.3 Empirics o f structural transformation in Indonesia .............................
Annex 11.6 Rural and informal economy absorbed workers during the crisis ..................................................... 270
Where do the poor who lack access to basic infrastructure services live? ...................................... 271 Annex 111.1
Annex 111.2 Poverty growth elasticities (supporting table for Figure 3.8) ......................................................... 272
Annex 111.3 Differences in poverty correlates and constraints across regions
Annex 111.4 Microeconomic simulation of changes in poverty .......................................................................... 274
Annex V . l Inpres development grants ....................................................................................... Annex V.2 Education spending in Indonesia 1994-2004 (Rp billion and % GDP) . Annex V.3 Health spending in Indonesia 1994-2004 (Rp billion and YO GDP) ................................................. 277
Annex V.4
..................................
Infrastructure development expenditures by sector and level of government (nominal Rp billion) ......................................... ............................................................................................. 278
Annex V.5 Only 18 percent ofthe urban poor have access to tap water .............................................. Annex VI . 1 Parameters And Performance O f Indonesia’s Principal Targeted Social Programs ........................ 280

Annex V1.2 Risk and vulnerability analysis tables ............................................................................................. 282
Appendix Table 6.1 Vulnerability profiles: Life cycle distribution o f risks to earnings ability and household income in Indonesia ....................................................................................................................... 283
Appendix Table 6.2 Risk mitigation and coping instruments captured in Susenas ............................................. 285
Appendix Table 6.3 Model 1 : Impact o f reported shocks on household expenditure on food ............................ 286
Appendix Table 6.3 Model 2: Impact of reported shocks on household expenditure on food-including household and labor market control variables ............................................................................... 287
Appendix Table 6.3 Model 2: Impact of reported shocks on household expenditure on food (continued) ......... 288
Appendix Table 6.3 Model 3: Impact of reported shocks on household expenditure on food and the effectiveness mitigation and coping ............................................................................................... 289
Appendix Table 6.3 Model 3: Impact o f reported shocks on household expenditure on food and the
Appendix Table 6.3 Model 3: Impact o f reported shocks on household expenditure on food and the
Appendix Table 6.3 Model 3: Impact of reported shocks on household expenditure on food and the
Appendix Table 6.3 Model 3: Impact of reported shocks on household expenditure on food and the effectiveness mitigation and coping (continued) ........................................................................... 293
Annex VI.3 Indonesia: likely CCT program impacts on the MDG in program areas by 2015 .......................... 294
Annex VI.4 Budgets for the PKPS-BBM programs for 2006 ............................................................................ 295
effectiveness mitigation and coping (continued) ........................................................................... 290
effectiveness mitigation and coping (continued) ........................................................................... 291
effectiveness mitigation and coping (continued) ........................................................................... 292
References .......................................................................................................................................................... 296

Foreword Since 2002, a team of leading Indonesian and international analysts under the umbrella of the Indonesia Poverty Analysis Program (INDOPOV) at the World Bank Office, Jakarta, has been studying the characteristics of poverty in Indonesia. They have sought to identify what works and what does not in the fight against poverty, and to help clarify options available to the government and non-governmental organizations in their efforts to raise living standards and the quality of life for the poor. This report brings together their findings.
This work has been greatly assisted by many Indonesian government institutions, particularly the Coordinating Ministry for the Economy, the Coordinating Ministry for People’s Welfare and Bappenas. Many of the leading academic institutions and civil society organizations have also contributed to this report. The Economic Analysis Institute, University of Indonesia (LPEM-UI), the Faculty of Economics, Padjadjaran University (Unpad) and SMERU Research Institute deserve particular mention for their valuable contributions. The work was made possible by funding support from the United Kingdom’s Department for International Development (DFID), together with funding from the World Bank.
This report seeks to analyze the various dimensions of poverty in today’s Indonesia in a fresh light, based on the important changes that have occurred in the country over the past decade. Earlier Poverty Assessments were undertaken by the World Bank in 1993 and 2001, but generally not in such depth. This Assessment presents a wealth of shared knowledge from the World Bank and Indonesian government that we hope will contribute to a lively policy debate, and ultimately lead to policy and practice changes that will accelerate poverty reduction efforts.
In summarizing its findings, the report presents a concrete policy matrix that suggests how Indonesia might better align policies and programs to achieve its ambitious poverty reduction objectives. Our hope is that these findings will be useful for Indonesia in operationalizing its five-year national development strategy (SNPK), and in planning actions to attain the Millennium Development Goals, and the even more ambitious goals that it has set itself in its SNPK to 2009. These goals include reducing poverty to 8.2 percent, achieving 98.1 percent junior school enrollments and cutting maternal mortality rates from 307 deaths per 100,000 live births currently to 226-all by 2009.
Indonesia today is, of course, a very different place from the Indonesia of a decade ago. It should come as no surprise that the strategies required to reduce poverty have changed just as Indonesia itself has changed. It is our sincere hope that this poverty assessment will be of help in addressing these challenges. In so doing, we hope to contribute towards the continuing remarkable transition that is taking place in this country.
Andrew D. Steer Country Director, Indonesia East Asia and Pacific Region The World Bank
1

MAKING THE NEW INDONESIA WORK FOR THE POOR
Acknowledgments The Making the New Indonesia Work for the Poor report is an output of the Indonesia Poverty Analysis Program (INDOPOV) led by Jehan Arulpragasam. INDOPOV is a multi-year poverty analysis program that has been supported by the World Bank and the DFlD Poverty Reduction Partnership Trust Fund.
This report has been prepared by a core team led by Jehan Arulpragasam and Vivi Alatas. The team that drafted the chapters also included Meltem Aran, Kathy Macpherson, Neil McCulloch, Stefan Nachuk, Truman Packard, Janelle Plummer, Menno Pradhan and Peter Timmer. lndermit Gill contributed to the drafting of the Overview section of this report.
Extensive excellent contributions were received from Maria Abreu, Tarcisio Castaneda, Leya Cattleya, Jennifer Donohoe, Giovanna Dore, Luisa Fernandez, Jed Friedman, Djoko Hartono, Yoichiro Ishihara, Anne-Lise Klausen, Ray Pulungan, Robert Searle, Shobha Shetty, Widya Sutiyo, Ellen Tan, Susan Wong, and the SMERU Research Institute.
Invaluable research and data analysis was provided, in particular, by (Hendro) Hendratno Tuhiman and Lina Marliani. Additional analytical support was received from Javier Arze, Cut Dian Augustina, Zaki Fahmi, Ahya Ihsan, Melanie Juwono, Bambang Suharnoko, Ellen Tan and Bastian Zaini.
This report benefited from the valuable comments of Peer Reviewers Bert Hofman (Lead Economist, EASPR), Jeni G. Klugman (Lead Economist, AFTP2), Kathy A. Lindert (Country Sector Leader, LCSHD), Mohamad lkhsan (Expert Staff, Coordinating Ministry of Economy), and Bambang Bintoro Soedjito (Institut Teknologi Bandung (ITB) and former Deputy for Regional Development and Local Autonomy at Bappenas).
We would like to thank everyone who generously and graciously provided comments throughout the development of the report. In particular, we would like to thank Javier Arze, Timothy Brown, Stephen Burgess, Sally L. Burningham, Mae Chu Chang, Soren Davidsen, Giovanna Dore, Wolfgang Fengler, Hongjoo J. Hahm, Pandu Harimukti, Joel Hellman, Peter Heywood, Yoichiro Ishihara, Anne-Lise Klausen, loana Kruse, Josef L. Leitmann, Blane Lewis, Puti Marzoeki, Vicente Paqueo, Andrew Ragatz, Claudia Rokx, Risyana Sukarma, Michael Warlters, Susan Wong and Elif Yavuz for their valuable comments.
We would like to thank photographer Poriaman Sitanggang and narrator Rani M. Moerdiarta for their hard work and commitment in developing the “Portraits from the Regions” section. Likewise, we would like to thank Scott Guggenheim (DSF) and our colleagues at the Kecamatan Development Program (KDP) and Community Development Committees (BKM) for their generous support in identifying families, including: John Odius and lffah (Lampung), Kuseri and Dasimi (Jakarta), Sainafur and J. Simbolon (West Kalimantan), Alman Hutabarat and Erna (East Nusa Tenggara), and Leo Koirewo and Barbara Juliana Sopacua (Papua).
The editor of this report was Peter Milne who also provided important written contributions.
Invaluable project management for this report was led by Widya Sutiyo, with support from Peter Milne and Stefan Nachuk. Special thanks to them for their dedication and hard work throughout the development of this report. Indispensable logistical and production support was provided by Deviana Djalil, Niltha Mathias and Juliana Wilson.
The development of the report benefited substantially from the Yogyakarta Workshop in January 2006, which was attended by the core team, Andrew Steer, Wolfgang Fengler, lndermit Gill, Anne-Lise Klausen, Vicente Paqueo and Bill Wallace. Special thanks to John Adams who facilitated this workshop and has been a team mentor throughout the INDOPOV program.
This report was produced under the overall guidance of lndermit Gill, Sector Manager for Poverty Reduction (EASPR) and Bill Wallace, Lead Economist for Indonesia (EASPR) for the World Bank. Strategic guidance and key comments were also provided by Andrew Steer, Country Director, Indonesia.
This report also benefited from work undertaken under two other key INDOPOV products, Making Services Work for the Poor in Indonesia and Revitalizing the Rural Economy: An assessment o f the investment climate faced
ii

Glossary of terms
by non-farm enterprises at the Distrlct level, and from contributions to those elements of the INDOPOV program.
... Ill


MAKING THE NEW INDONESIA WORK FOR THE POOR
45 -
4 0 -
35 -
30 -
h E 3 0
m 25 -
I" 2 0 - P a
1 5 -
Overview
40 1
\
I Making the New Indonesia Work for the Poor
Indonesia stands at the threshold of a new era. After the historic economic, political and social upheavals at the end of the 199Os, Indonesia has started to regain its footing. The country has largely recovered from the economic crisis that threw millions of its citizens back into poverty in 1998 and saw Indonesia regress to low-income status. Recently, it has once again become one of the world's emergent middle- income countries. Poverty levels that had increased by over one-third during the crisis are now back to pre-crisis levels (Figure 1). Meanwhile, Indonesia has undergone some major social and political transformations, emerging as a vibrant democracy with decentralized government and far greater social openness and debate.
Figure 1 Poverty In Indonesia fell rapidly untll the 1990s' and has declined again since the crhls
lo i
\ 333
\ 26 9
Crisis
\ 23 4
11 34" 'r
t * Revised Method
17.8
o - l , , , , I , , , , , , , , 1976 1978 1980 1981 1984 1987 1990 1993 l 9 W 1899 2002 2003 2004 2005" 2006
The challenge of reducing poverty remains one of the country's most pressing issues. The number of people living below US$2-a-day in Indonesia comes close to equaling all those living on or below US$2-a- day in all of the rest of East Asia besides China. The Indonesian government is committed to the objective of reducing poverty in its medium-term plan (RPJM) for 2005-09 which, in turn, draws on a national poverty reduction strategy (SNPK). In addition to signing on to the Millennium Development Goals (MDGs) for 2015, in its medium-term plan the government has laid out its own key poverty reduction objectives for 2009. This includes an ambitious target of reducing the poverty headcount rate from 18.2 percent in 2002 to 8.2 percent by 2009. While national poverty rates may be close to precrisis levels, this still means that about 40 million people are living below the national poverty line. Moreover, although Indonesia is now a middle-income country, the share of those living on less than US$2-a-day is similar to that of the region's low-income countries such as Vietnam.
Indonesia has a golden opportunity for rapldly reducing poverty. First, given the nature of poverty in Indonesia, focusing attention on a few priority areas could deliver some quick wins in the fight against poverty and low human development outcomes. Second, as an oil and gas producing country, Indonesia stands to benefit in the next few years from increased fiscal resources as much as US$10 billion In 2006-thanks to higher oil prices and reductions in fuel subsidies. Third, Indonesia can harness still further benefits from its ongoing processes of democratization and decentralization.
iv

Overview
The challenge is how to make the new lndonesla ‘work for the poor’. This is the focus of this report, which aims to contribute to the policy debate and decision-making process in the country by putting forth: (i) new and more comprehensive analysis of empirical poverty diagnostics; and (ii) suggestions on concrete policies and programs for a strategic action-plan to achieve Indonesia’s stated poverty-reduction objectives.
Indonesia can learn from Its own economlc growth, government policies and soclal programs. Indonesia has had remarkable success in reducing poverty since the 1970s. The period from the late 1970s to the mid-1990s is considered one of the most ‘pro-poor growth’ episodes in the economic history of any country, with poverty declining by half. After the spike during the economic crisis, poverty has generally returned to its pre-crisis levels. The poverty rate fell back to about 16 percent in 2005 following a peak of over 23 percent in 1999 in the immediate wake of the economic crisis. Macroeconomic stabilization from mid-2001 onwards underpinned this recovery, bringing down the price of goods, such as rice, that are important to the consumption of the poor. However, despite this steady progress in reducing poverty, more recently, there has been an unforeseen upturn in the poverty rate. This reversal appears to have been caused primarily by a sharp increase in the price of rice-an estimated 33 percent for rice consumed by the poor-between February 2005 and March 2006, which largely accounted for the increase in the poverty headcount rate to 17.75 percent.
Box 1 Why did poverty Increase from 2005 to 20063
In September 2006, BPS announced that the poverty rate in Indonesia had increased during the period February 2005 to March 2006 from 16.0 percent to 17.75 percent-in contrast to steady declines in the poverty rate since the crisis.
The 33 percent increase in rice prices between February 2005 and March 2006-mostly due to the ban on rice imports-is the main reason that poverty rates have increased. Around three-quarters of the additional four million people falling into poverty during this period did so as a result of the rice price increase and, in addition, recent analysis indicates that the fuel price increase was not a major factor in the increased poverty rate. The unconditional cash transfer (UCT) program, which provided cash transfers to 19.2 million poor and near-poor households, more than offset, on average, the negative impact of the fuel price increase for the poor. In other words, the impact of the combined effects of the fuel price increase and the UCT compensation point t o a net positive income gain, overall, for the poorest 20 percent of the population.
However, with rice prices still going up, and the UCT program drawing to an end, there is a possibility that poverty rates could rise again next year unless economic growth increases significantly.
Dimensions of Poverty in Indonesia and a Proposed Policy Framework
Poverty In Indonesia has three salient features. First, many households are clustered around the national income poverty line of about PPP US$1.55-a-day, making even many of the non-poor vulnerable to poverty. Second, the income poverty measure does not capture the true extent of poverty in Indonesia; many who may not be ‘income poor’ could be classified as poor on the basis of their lack of access to basic services and poor human development outcomes. Third, given the vast size of and varying conditions in the Indonesian archipelago, regional disparities are a fundamental feature of poverty in the country.
0 A large number of lndoneslans are vulnerable to poverty. The national poverty rate masks the large number of people who live just above the national poverty line. Close to 42 percent of all Indonesians live between the US$l-and US$a-a-day poverty lines-a remarkable and defining aspect of poverty in Indonesia (see Figure 2). Analysis indicates that there is little that distinguishes the poor from the near-poor, suggesting that poverty reduction strategies should focus on improving the welfare of the lowest two quintile groups. This also means that the vulnerability to falling into poverty is particularly
V

MAKING THE NEW INDONESIA WORK FOR THE POOR
6
4
2
0
high in Indonesia: while only 16.7 percent of Indonesians surveyed were poor in 2004, more than 59 percent had been poor at some time during the year preceding the survey. Recent data also indicate a high degree of movement in and out of poverty over time: over 38 percent of poor house holds in 2004 were not poor in 2003.
Flgure 2 Forly-two percent of Indonesia’s populatlon lives on between U S I - and U S 2 - a d a y
48.0 % of papulation below PPP US$’Uday
below Nstlonal
Population density
0 Non-lncome poverty Is a more serlous problem than lncome poverty. When one acknowledges all dimensions of human well-bein-dequate consumption, reduced vulnerability, education, health and access to basic infrastructurHhen almost half of all Indonesians would be considered to have experienced at least one type of poverty. Nonetheless, Indonesia has made good progress in past years on some human capital outcomes. There have been notable improvements in educational attainment at the primary school level; basic healthcare coverage (particularly in birth attendance and immunization): and dramatic reductions in child mortality. But in some MDG-related indicators Indonesia has failed to make significant progress and lags behind other countries in the region. Indeed, specific areas that warrant concern are:
Malnutrition rates are high and have even risen in recent years: a quarter of children below the age of five are malnourished in Indonesia, with malnutrition rates stagnating in recent years despite reductions in poverty.
Maternal health is much worse than comparable countries in the region: Indonesia’s maternal mortality rate (307 deaths in 100,000 births) is three times that of Vietnam and six times that of China and Malaysia; only about 72 percent of births are accompanied by skilled birth attendants.
Education outcomes are weak. Transition rates from primary to secondary school are low, particularly among the poor: among 16- to 18-year-olds from the poorest quintile, only 55 percent completed junior secondary school, compared with 89 percent from the richest quintile from the same cohort.
Access to safe water is low, especially among the poor. For the lowest quintile access to safe water in rural areas is only 48 percent, against 78 percent in urban areas.
Access to sanitation is a crucial problem. Eighty percent of the rural poor and 59 percent of the urban poor do not have access to septic tanks, while less than 1 percent of all Indonesians have access to piped sewerage services.
0 Reglonal dlsparltles In poverty are conslderable. Wide regional differences characterize Indonesia, some of which are reflected in disparities between rural and urban areas. Rural households account for about 57 percent of the poor in Indonesia and also frequently lack access to basic infrastructure
vi

Overview
services: only about 50 percent of the rural poor have access to an improved source of water, compared with 80 percent for the urban poor. But importantly, across the vast Indonesian archipelago, it is also reflected in broad swathes of regional poverty, in addition to smaller pockets of poverty within regions. For example, the poverty rate is 15.7 percent in Java/Bali and 38.7 percent in more remote Papua. Services are also unequally distributed across regions, with an undersupply of facilities in remote areas. In Java the average distance of a household to the nearest public health clinic is 4 kilometers, whereas in Papua it is 32 kilometers. While 66 percent of the poorest quintile in Java/Bali have access to improved water, this number is 35 percent for Kalimantan and only 9 percent for Papua. A challenge faced by the government is that although poverty incidence is far higher in eastern Indonesia and in more remote areas, most of Indonesia’s poor live in the densely populated western regions of the archipelago. For example, while the poverty incidence in Java/Bali is relatively low, the island is home to 57 percent of Indonesia’s total poor, compared with Papua, which only has 3 percent of the poor.
Figure 3 Poverty incidence and mass vary greatly across the Indonesian archipelago
Percentage of Poor People by Provlnce in Indonesia, 2004
Percentage 01 Poor Peuple m ‘I
m,o 11 1( Ha m.
Number of Poor People by Province in Indonesia, 2004 .$e*
vii

MAKING THE NEW INDONESIA WORK FOR THE POOR
An analysis of poverty and its determinants In Indonesla, as well of Indonesia’s history In reduclng poverty to date, points to three ways to fight poverty. The three means for helping people lift themselves out of poverty are economic growth, social services, and public expenditures. Each of these prongs addresses one or more of the three defining features of poverty in Indonesia: vulnerability, multidimensionality, and regional disparities (see Table 1 below). In other words, an effective poverty reduction strategy for Indonesia has three components:
Maklng Economlc Growth Work for the Poor. Economic growth has been, and will continue to be, fundamental to reducing poverty. First, making growth work for the poor is simultaneously key to linking the poor throughout various parts of the Indonesian archipelago to the growth process- whether it is across the rural-urban space or across the various regional and island groupings. So it is fundamental to addressing the issue of regional disparities. Second, to address the vulnerability characteristic of poverty associated with the dense concentration of income distribution in Indonesia, anything that can shift this distribution to the right will rapidly reduce the incidence of and vulnerability to income poverty.
Maklng Social Servlces Work for the Poor. The delivery of social services to the poor-whether by the public or private sector-is essential to addressing poverty in Indonesia. First, this is key in addressing the non-income dimensions of poverty in Indonesia. Lagging human development indicators such as the high maternal mortality rate must be tackled by improving the quality of services that are made available to the poor. This goes beyond levels of public spending: it is about improving systems of accountability, service delivery mechanisms, and even government processes. Second, the nature of regional disparities transcends income disparity and is largely reflected in disparities in access to services which, in turn, results in disparities in human development outcomes across regions. Thus making services work for the poor is key to addressing the problem of regional disparities in poverty.
Maklng Publlc Expendlture Work for the Poor. Besides economic growth and social services, the government, by targeting public spending to the poor, can assist them in countering income and non-income poverty. First, public spending can be used for helping those who are vulnerable to income poverty through a modern system of social protection that augments their own efforts to deal with economic uncertainty. Second, public spending can be used to improve human development outcomes-hence, tackling the non-income multidimensional aspects of poverty. Making expenditures work for the poor is particularly pertinent now given the increased fiscal space that exists in today’s Indonesia.
e
e
e
Table 1 An approach for addressing Indonesia’s poverty problems
Dimensions of indoneslan poverty Vulnera bllity Multldimensionallty Regional disparltles
Economlc growth 0 e Social services 0
Pubilc expenditure e 0 0
Note: e Indicates principal link between thematic area and the aspect of poverty; o indicates an important linkage.
Thls Overview hlghllghts the top priority actions to address each of the three salient features of Indonesla’s poverty problem. It is not intended to be a comprehensive summary of this entire report, which provides a broad range of diagnostics and related policy implications. Likewise, neither does this Overview present the comprehensive set of policy prescriptions following from this report. Rather, this Overview section highlights the top priority actions under each of the three thematic prongs laid out above, in line with Table 1 above. It highlights policy priorities under Growth, Services and Expenditure where it is deemed that action under any of these areas would be most effective in addressing one of the three salient features of poverty in Indonesia.
viii

Overview
Making Economic Growth Work for the Poor
For Indonesia, growth that beneflts the poor has been, and will continue to be, the main route to poverty reductlon. From the 1970s through to the late 199Os, growth was rapid and it reached the poor: each percentage point increase in average expenditure resulted in a 0.3 percent reduction in the poverty headcount. Even since the crisis, growth has been the primary determinant of poverty reduction. However growth will need to accelerate and benefit the poor more if the government is to meet its poverty reduction targets. If the current rate and pattern of growth continues, Indonesia will not meet its poverty reduction target of 8.2 percent by 2009. In fact, if the current pattern of growth continues, the medium- term poverty reduction target of government will not be met even if growth were accelerated to the projected rate of 6.2 percent. To meet the government’s poverty target, growth must become more pro- poor. For example, if the incomes of the poor grow at the same rate as those of the rich then the medium- term target can be broadly met.
Making growth work for the poor wlll requlre gettlng the poor onto effective pathways out of poverty. This will mean harnessing the structural transformation that is ongoing in Indonesia-albeit at a significantly slower rate than precrisis. This transformation is characterized by two phenomena. First, there is an ongoing shift from more rural-based to more urban-based activities. Indonesia has experienced rapid urbanization, with the population of Indonesia’s cities nearly trebling in 25 years. This has stimulated a shift from rural to more urban-based activities, even when households have not in fact changed location (some 35 to 40 percent of urbanization). Urban markets are thus becoming increasingly important for both the rural and the urban poor. Second, there has been a marked shift from farm to more non-farm activities. In rural areas in particular, this has meant substantial growth in the share of employment in rural (or previously rural) non-farm enterprises (4 percent per year between 1993 and 2002). This transformation suggests two important pathways that households have taken out of poverty in Indonesia.
The first pathway out of poverty is improved agricultural productivity. This could come from increasing productivity in small-scale agriculture or an increased shift to commercial farming. Agricultural productivity gains from the green revolution were one of the main drivers of growth in the three decades commencing with the 1970s. More recently, high world commodity prices have sustained output growth, while the shift of labor out of the sector has maintained the growth of labor productivity in agriculture. As a result, recent poverty diagnostics show that increases in agricultural incomes continue to be an important driver of reductions in poverty. Panel data between 1993 and 2000 show that 40 percent of agricultural workers in rural areas escaped poverty while staying in rural agriculture.
The second pathway out of poverty Is increasing non-farm productlvlty, whether this be in urban areas or rapidly urbanizing rural areas. In this regard, the transition through rural non-farm enterprises is an important stepping-stone to moving out of poverty, either by connecting rural enterprises to urban growth processes or, importantly, by these enterprises in the rural fringe being subsumed into urban areas. Between 1993 and 2002, the employment share of non-poor workers in rural non-farm employment increased by 6.7 percentage points, suggesting that increasing non-agricultural productivity in rural areas was an important pathway out of poverty. Moreover, many of these ‘rural’ areas were urban by the end of the period, showing the complementary roles of urbanization and productivity enhancements.
0
0
A strategy to help the poor take advantage of economlc growth has several elements. First, it will be important to maintain macroeconomic stability: key to this are ensuring low inflation and a stable and competitive exchange rate. Countries that have had more macroeconomic shocks experience slower growth and poverty reduction than those with better macroeconomic management (World Bank, 2005a). Indonesia knows better than most countries the dreadful poverty impact of macroeconomic crises. Second, the poor have to be connected to opportunities for growth. Better access to roads,
ix

MAKING THE NEW INDONESIA WORK FOR THE POOR
telecommunications, credit and formal sector employment are associated with significantly lower poverty. The benefit of being ‘connected’ is large, particularly in the case of formal sector employment outside of agriculture. Third, it will be important to invest in the capabilities of the poor. Part of the strategy for growth must be to invest in the poor so that they are well prepared to benefit from the opportunities for income growth that present themselves. In both rural and urban areas, higher levels of education of household heads are associated with higher levels of consumption. Investing in education for the poor will boost the capability of the poor to participate in growth.
Figure 4 Rural non-farm actlvltles have helped lndoneslans leave poverly
Non-poor Poor
-4 J
Source: Susenas 1993, 2002, rural/urban classification of 1993.
Three priority areas of action stand out:
0 Revitalize agrlculture and Increase agricultural productivity. With almost two-thirds of poor household heads still working in agriculture, boosting agricultural capability remains essential for broad-based poverty reduction. Analysis shows that households working in informal agriculture are most likely to be poor, with increases in consumption associated with moving to formal agriculture. Yet agriculture in Indonesia is not doing well. Despite labor productivity remaining buoyant with the outflow of labor from agriculture, agricultural total factor productivity growth has been negative since the early 199Os, from annual gains of 2.5 percent in 1968-92 to annual contractions of 0.1 percent from 1993 to 2000. The government can contribute to increasing agricultural productivity through: boosting investment in key infrastructure, notably farm-to-market roads and irrigation, while widening local water management; encouraging and supporting diversification into higher value-added crops; working with the private sector to ensure that exports meet world standards; boosting expenditure on agricultural research; and redesigning the decentralized extension service to allow for greater involvement of the private sector and civil society. These efforts to improve agricultural productivity should also include development of better marketing and information systems for rural-based businesses. Efforts to speed up land titling and more broadly ensure appropriate forms of secure tenure throughout the country will also help.
0 Remove the ban on rlce Imports. Lowering the rice price and creating greater price stability by removing the import ban on rice is the fastest way for the government to reduce poverty quickly. Rice is a critically important food commodity for all Indonesians but especially for the poor, constituting 24.1 percent of their consumption. For the country as a whole, four out of five households are net consumers of rice, that is, they consume more rlce than they produce. The sharp surge in rice prices during the economic crisis, and then again in 2005-06, increased the total poverty rate. Indeed, it is estimated that the 33 percent increase in the rice price between February
X
Overview
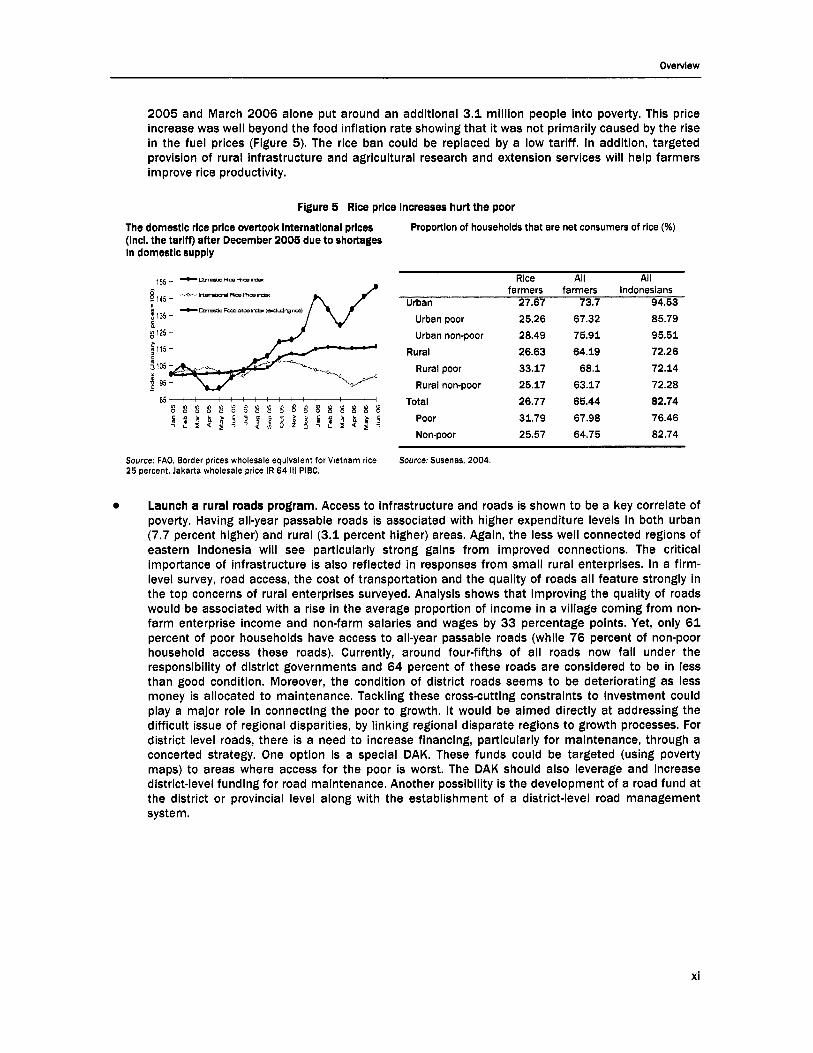
2005 and March 2006 alone put around an additional 3.1 million people into poverty. This price increase was well beyond the food inflation rate showing that it was not primarily caused by the rise in the fuel prices (Figure 5). The rice ban could be replaced by a low tariff. In addition, targeted provision of rural infrastructure and agricultural research and extension services will help farmers improve rice productivity.
Figure 5 Rice price increases hurt the poor The domestic rice prlce overtook international prices (inci. the tarlff) after December 2005 due to shortages In domestic supply
Proportion of households that are net consumers of rice (%)
155 - +-cRmmmlnl* Rice All All farmers farmers Indonesians g,45 __ I/ Urban 27.67 73.7 94.53
o irterrtldR-m-l* - (Ixrsos F0cdInDBln.k (OdUlrurmB) Urban poor 25.26 67.32 85.79 Urban non-poor 28.49 75.91 95.51
Rural 26.63 64.19 72.26 Rural poor 33.17 68.1 72.14 Rural non-poor 25.17 63.17 72.28
Total 26.77 65.44 82.74
si;$q;:z?8ga$$j$q$ Poor 31.79 67.98 76.46 Non-poor 25.57 64.75 82.74
8548 b b b b L b i b b i? b b b x k b is
Source: FAO, Border prices wholesale equlvaient for Vietnam rice 25 percent, Jakarta wholesale price If7 64 Ill PIBC.
Source: Susenas, 2004.
Launch a rural roads program. Access to infrastructure and roads is shown to be a key correlate of poverty. Having all-year passable roads is associated with higher expenditure levels in both urban (7.7 percent higher) and rural (3.1 percent higher) areas. Again, the less well connected regions of eastern Indonesia will see particularly strong gains from improved connections. The critical importance of infrastructure is also reflected in responses from small rural enterprises. In a firm- level survey, road access, the cost of transportation and the quality of roads all feature strongly in the top concerns of rural enterprises surveyed. Analysis shows that improving the quality of roads would be associated with a rise in the average proportion of income in a village coming from non- farm enterprise income and non-farm salaries and wages by 33 percentage points. Yet, only 6 1 percent of poor households have access to all-year passable roads (while 76 percent of non-poor household access these roads). Currently, around four-fifths of all roads now fall under the responsibility of district governments and 64 percent of these roads are considered to be in less than good condition. Moreover, the condition of district roads seems to be deteriorating as less money is allocated to maintenance. Tackling these cross-cutting constraints to investment could play a major role in connecting the poor to growth. It would be aimed directly at addressing the difficult issue of regional disparities, by linking regional disparate regions to growth processes. For district level roads, there is a need to increase financing, particularly for maintenance, through a concerted strategy. One option is a special DAH. These funds could be targeted (using poverty maps) to areas where access for the poor is worst. The DAH should also leverage and increase district-level funding for road maintenance. Another possibility is the development of a road fund at the district or provincial level along with the establishment of a district-level road management system.
xi

MAKING THE NEW INDONESIA WORK FOR THE POOR
Making Services Work for the Poor
Making services work for the poor requires Improving lnstltutlonal accountability systems and introducing Incentives to Improve service delivery In order to Improve human development outcomes. Currently, poor service delivery lies at the center of weak human development outcomes, or non-income ‘multidimensional’ poverty, such as poor quality of health and educational care. According to survey data, 44 percent of households in the poorest quintile with children enrolled in school reported difficulties in financing junior secondary education. The poor pay 7.2 percent of their total expenditure for each enrolled student at junior secondary level. On the demand side, to address this issue the government should consider programs of targeted transfers, such as scholarships or conditional cash transfers linked to attendance to junior secondary school (and vocational schools). Junior secondary school capacity in Indonesia provides learning opportunities on average to only some 84 percent of potential students in the 13 to 15 age group. Likewise, huge regional disparities in these indicators are reflections of differential access to these services across regions. The government needs to focus on making services work for the poor to address the multidimensional aspect of poverty and high regional disparities in these indicators. With regard to addressing the multidimensional aspects of poverty, efforts should be aimed at improving service delivery especially with a view to improving quality.
The other area of focus is Improved access of the poor to services to reduce regional disparities In human development Indicators. The variability in access to services across the country is a fundamental driver of regional inequalities in poverty-related outcomes. While in some regions, such as Central Java, school capacity exceeds 100 percent, in East Nusa Tenggara and South Sumatra the average coverage of school capacity is below 60 percent of the number of potential students, indicating a lower degree of access. And the average distance to junior secondary schools in Java is 1.9 km while in Papua the average distance is 16.6 km (Podes, 2005). Of the junior secondary schools available, a ministry survey in 2004 found 27.3 percent of their classrooms to be damaged in some way. More junior secondary classrooms and schools need to be made available, and one way this can be achieved is by converting primary schools where there is excess supply.
In education, a key Issue Is the high dropout rate among the poor as they transition from primary to junior secondary level. The main problem is the lack of access among the poor to junior secondary schools and to vocational schools. Lack of access is both physical and financial. Financial access is limited due to the high level of fees that creates a barrier to the poor’s education at junior secondary level. The share of poor children who complete primary school is 89 percent, but only 55 percent of poor children complete junior secondary. Yet, diagnostics show that the returns to education increase with increasing levels of schooling. In 2002, the increase in urban (rural) male wages resulting from an additional year of schooling for someone who had only one year of schooling already was 8.3 percent (6.0 percent); after five years of schooling, the return was 10.0 percent (7.6 percent) and after eight years of schooling it was 11.1 percent (8.8 percent).
Figure 6 Inequality in outcomes remains high
Proportion of current cohort that reaches to each grade Under-five mortality per 3.,000 live blrths,
proportion
0.6
0.2
0- 1 4 7 10
grade
- richest quintile
quintile 4
quintile 3 quintile 2
- poorest quintile
_. 70
6o 50
e 40 30
a 20 10
0
by quintile
Poorest Qulntiie 2 auintiie 3 Qulntile 4 nulntlie
Source: Enrollment data are from analysis of data from Susenas 2004, current cohort defined as between 20 to 25 years of age. Mortality and water and sanitation are from analysis of data from Demographic and Health Survey 2002/2003.
xii

Overview
Improving attainment among the poor at the junior secondary school level will require both supply- and demandglde Interventions. On the supply side, teacher management policies that deploy greater numbers to remote areas are needed. Remote schools have higher student-teacher ratios, and a recent study showed that despite the general teacher oversupply in Indonesia, 74 percent of remote schools are below entitlement. Likewise, despite the large allocation to teacher salaries in the budget, teachers’ monthly salaries are low. While spending on salaries is 50 percent of total educational spending, teachers are paid 2 1 percent less than workers with equivalent qualifications. On the demand side, junior secondary schools and vocational training schools (SMKs) can be made more affordable for the poor by targeting transfers to poor students through scholarships or conditional cash transfers (CCTs). Better primary healthcare requires better Incentives for both the poor and for providers. Chaudhury et a1 (2005) found that absenteeism among health workers in Indonesia is 40 percent, even higher than in Bangladesh and Uganda. A governance and decentralization survey found that only 30 percent of primary health clinics visited had complete stocks of medicines. For higher-level healthcare, affordability is an issue and targeted programs would make sense, such as a health insurance program. It will be important to build on this recently launched program-based on recent assessments, findings point to the need to improve targeting and open up service provision. Progress in reducing maternal mortality lies in increasing the proportion of births attended by skilled professionals, increasing the proportion of institutional deliveries and improving access to 24-hour obstetric care. Currently, only 72 percent of births are attended by skilled personnel in Indonesia nationally, compared with 97 percent in Malaysia and China and 99 percent in Thailand. Increasing deliveries with skilled staff in attendance in health clinics will require action on four fronts: increasing the availability of skilled midwives in remote areas; improving the affordability of care by skilled professionals; increasing awareness, especially among women, of the importance of skilled midwifery at birth; and improving the quality of skilled birth attendant services.
Indonesia needs to address the shortfalls facing the poor in accessing safe water and Sanitation. An estimated 50 million rural poor are not connected to piped water and of that number six million pay higher rates (in excess of those charged the state water utility company). For rural areas, the existing community management supply model that has been shown to work should be expanded. This currently covers 25-30 percent of the rural population, but could be expanded to cover the 50 million people currently without adequate water supply. In urban areas, levels of access to utility supply are lower in the poorest quintile, but the district water utilities (PDAM) service to all households is also limited. In practice, the urban poor obtain their water from many sources, primarily non-network water and self-supply. For urban areas, supply must be strengthened by improving capacity and incentives for water utilities (PDAMs) to plan, deliver and monitor service delivery. In addition, PDAMs need to be mandated and given incentives to scale up services to areas inhabited by the poor. Consideration needs to be given to designing appropriate tariff structures for the poor who benefit from current connections, or who will have future connections. The coverage of sanitation services in Indonesia is the worst in the region, with less than 1 percent of all Indonesians accessing piped sewerage systems. Survey data show that 80 percent of the rural poor and 59 percent of the urban poor have no access to adequate sanitation. It is estimated that the cost of poor sanitation is about 2.6 percent of GDP, while public spending on water and sanitation together is less than 0.2 percent of GDP. Two immediate options are the development of a national strategy to increase sanitation financing, and local government investment in sanitation infrastructure at the neighborhood and city levels, for example through a specific DAH for sanitation, or by including sanitation services in minimum service standards.
xiii

MAKING THE NEW INDONESIA WORK FOR THE POOR
Figure 7 Inequality in services remains high
Main source of drinking water, by quintile Type of toilet, by quintlle
100 1 0 0
80 8 0
60 6 0
40 4 0
20 2 0
0 0 Poorest 2 3 4 Richest P o o r e s t 2 3 4 R i c h e s t quintiie quintile q u in tile q u i n ti le
- P r i v a t e w i t h s c e p t i c t a n k g P r i v a t o w i t h o u t i c e p t l c l a n k
l 3 N e n e l o i h s r g S h s r e d i P u b i l c mgP It I Piped hl Wellipump E! Surface UO Other
Source: Enrollment data are from analysis of data from Susenas 2004, current cohort defined as between 20 to 25 years of age. Mortality and water and sanitation are from analysis of data from Demographic and Health Survey 2002/2003.
Three priority areas for action stand out:
Clarify functional responsibilities for the provision of services. The lack of clarity of responsibilities is paralyzing accountability in service delivery. The financing and provision of services is based on bureaucratic instructions, providing relatively little actual autonomy to either providers or beneficiaries. A typical government health clinic has eight sources of cash income and 34 operational budgets, many of which are provided in kind by the central or local government. The central government should limit its role to policy-making, staffing issues, information and developing core national service-delivery standards. Provincial level governments should focus on fixing regional standards, building capacity at the district level and implementing cross-district services, while at the district level governments should be responsible for planning and budgeting, and ensuring implementation of service delivery. Providers should be expected to monitor outcomes for the services they provide. Communities should be empowered to provide feedback to those providers, possibly even managing their own targeted programs and helping to build/ maintain local infrastructure.
0 Improve civil service staffing and management in social sectors. The government needs to review and provide clarity in the regulatory framework and incentives for organizational and personnel management by instituting a less rigid employment regime and abolishing the system of structural and functional positions and the rigid ranking of posts. While civil service reform is not easy, it is a vital component to ‘unsticking’ service delivery. A recent study involved making surprise visits on more than 100 primary schools and health centers in Indonesia. The study found absenteeism rates of 10 percent among teachers and 40 percent among health workers. Indonesia had the highest health-worker absenteeism rate of all the countries included in this global study. Not only does high absenteeism reduce quality, but it also reduces the demand for public health services. Creating more robust and predictable incentives for staff will also help, as has been proven in the case of some frontline service providers (see Box 2).
0 Provide stronger incentives for service providers. The provision of clear, predictable rewards and sanctions is necessary to provide a framework that will systematically promote good behavior and outcomes by service providers. Incentives can take the form of performance contracts or incentive payments for good results. One specific option is to pilot the use of service agreements-a contract between a public service provider and local government that specifies the services that will be delivered, and the resources that will be provided to do so. In addition, local governments can work with private providers as partners in delivering good quality services to the poor. For example, almost 60 percent of all healthcare visits were to private facilities or providers in 2004. The poor use private services not only because they are often cheaper, but they are perceived to be of higher
xiv

Overview
quality. Many local governments are working creatively to provide incentives for improved educational outcomes and healthcare (see Box 2 below). On the demand side, conditional cash transfers (CCTs) can help where behavioral change is required to enhance demand, such as child well-being and nutrition status check-ups, and child immunization.
Box 2 Better incentives and lnformatlon can change the behavlor of service provlders
Numerous experiments using incentives for local service providers have been conducted In Indonesia in recent years. In some cases, there was a marked change in the behavior of service provlders in response to changed incentives. For example:
in Tanah Datar district, West Sumatra, a scheme was launched in 2002 to provide stronger incentives to English teachers and headmasters by offering them study tours of Australla, Malaysia, and Singapore if they promised to follow up with changed practices. Teachers returning from study trips had to submit a group report to the bupatl, with follow-up observations and recommendations:
The trips increased the motivatlon to improve conditions in schools. These included stronger discipline of teachers, students, and parents; smaller class sizes; providing classes in computer skills and English; changing the teaching methodology; and, consulting with students.
The trips effected changes in teaching methodology. One English teacher began teaching her classes in English rather than lndoneslan following her trip to Australla. She has also begun using a 'student agenda,' in which students record their activities in English, as weii as what they have learned from them, as an aid in teaching.
The trips increased interest In student performance. Teaching hours increased, due to both school-based management and the stronger incentives policy; on average students now study about 15 hours more a week. To demonstrate his commitment to raising student test scores, one headmaster even signed an agreement with his school committee stating that if scores at his school were not above a certain level he would resign.
in Jembrana district, Baii, health sector reforms created a new health insurance program (Jamlnan Kesehatan Jembrana). The program provided free primary heaithcare for all enrolled citizens and free secondary care for all poor members. It also enhanced client choice by enabling members to choose between private and public heaithcare providers, both of whom were reimbursed under the scheme. in addition to increasing coverage of health services, the scheme directly affected the behavior of public health staff, who had to compete for clients with private providers in the wake of this reform. As a result, public providers measurably Improved their client orientation by sending mobile clinics and doctors to remote areas at least once a month (rather than just providing health education in these remote areas, as they previously had); improving medicine packaging; and providing 'full smile' reception for patients. In addition, the management board of the project supervised quality control for reimbursements by both creating a clear set of service standards for all providers and investigating cases of malfeasance.
As part of the Safe Motherhood Program in Pemalang district, Central Java, poor women were issued vouchers that they could exchange for prenatal care from midwives. The midwives were usually responsible for distributing these vouchers. With the added Incentive of additional fees earned from clients with vouchers, midwives substantially increased the number of poor women they treated. This had the additional beneficial impact of introducing poor women to the formal health system and inducing them to seek out healthcare from formal providers more frequently.
Source: Leisher and Nachuk, 2006.
Making Public Expenditure Work for the Poor
By reducing fuel subsidies, Indonesia has taken a big step towards making public expenditure more p r e poor. The fuel subsidy-a universal price subsidy-represented the biggest subsidy or transfer to households in recent years: it was, de facto, the centerpiece of Indonesia's social protection scheme until 2005. By fixing fuel prices at subsidized levels well below world prices, the government effectively supported a transfer to fuel-consuming households, protecting them from fluctuations in world prices. Between 1998 and 2005, fuel subsidies averaged three-quarters of the total subsidies and transfers that constituted Indonesia's social protection system. However, spending on fuel subsidies benefited mainly middle and higher income groups that consumed more fuel. Figure 8 depicts the regressive incidence of
xv

MAKING THE NEW INDONESIA WORK FOR THE POOR
the fuel subsidy, had the government not changed the domestic price of fuel in 2005. In total, the benefits accruing to the richest 10 percent from fuel subsidies were more than five times those accruing to the poorest 10 percent
Flgure 8 Regressive fuel subsldles have been replaced by progressive cash transfers Estimated impact of 1 October 2005 fuel price increase
by expenditure declle Estlmated Impact of 1 October 2005 fuel price increase by expenditure
declie as a percentage of mean household expenditures in decile 50 000 45 000 35000 30000 25000 20000
=
2 15000 e" 10000
5 000 0
6%
4%
5%
2%
1%
M
-bd%dzmqppaepit. rpndln(lnd31r
1 2 3 1 5 6 7 8 9 9
mo m1 ~ ~ d h n WIIC.
Source: Susenas 2004, World Bank staff calculations
40%
R1 mptl apndiwn drlb
Source: Susenas 2004, World Bank staff calculations.
Government can make good use of the increased public resources. To date, public expenditure has not always been successful at effectively addressing the constraints that still hinder the poor and keep them mired in poverty. At a time when the government has increased fiscal space following the reallocation of regressive fuel subsidies, it is all the more important to ensure that this expenditure makes a real impact on the poor. The government now has a window of opportunity to begin addressing the high level of vulnerability of the poor in Indonesia by channeling spending into social protection systems that mitigate this vulnerability. An important component of this reallocation of public spending is through focusing on ways to improve the incomes of the poor, especially in view of the fact that 49 percent of Indonesians earn less than US$2-a-day. Public spending that can have a direct impact by boosting income levels will also have a commensurate impact on poverty. One priority that stands out-which the government is already moving to address-is the scaling-up of community driven development (CDD).
Public resources can be targeted better. While the CDD approach will allow for a broad focus in addressing widespread vulnerability, it will also be vital to use public expenditure to target the very poorest, who lag behind in terms of the non-income, multidimensional aspects of poverty. Only through a more effective targeted approach in public spending can the government achieve progress in these human development indicators. In particular, the government should press ahead with the piloting of targeting transfer to the poor. This could be done through CCTs aimed at the delivery highquality services to where they are needed most. Public expenditure can also be a sharp instrument for addressing the issue of regional disparities in both the income and non-income dimensions of poverty. In view of the wide disparities that continue to exist across the country, there is a need to make the current system of transfers from the center to the regions more pro-poor, and to build capacity and create incentives within local governments to improve their focus on pro-poor policy implementation.
Local government capacity Is uneven, and Is now the binding constraint to poverty reduction. About one- third of total public expenditure is allocated and spent at the district level. While this is a sign that decentralization is working, the problem is that many local governments are facing difficulties in the planning, budgeting, and execution of this spending. One indication of these difficulties is the increasing level of local government surpluses witnessed in recent years. There is therefore a growing and increasingly urgent need for a concerted effort to improve the capacity of local governments, and the civil servants who work for them, to plan, budget and implement programs for service delivery and poverty reduction. Once again, this is an issue that could be usefully complimented through incentives at the district level to encourage local governments to both spend more efficiently and also in a more pro-poor way. For example, the central government could induce improvements in service delivery with increased funding for those districts achieving certain targets in service delivery. However, this will require a strong
xvi

Overview
commitment towards building a partnership between local and central governments and a long-term strategy to address capacity issues.
Three priority areas for action stand out:
0 Scale up Indonesia’s successful communltydriven development (CDD) programs. Community- driven development projects, such as Kecamatan Development Program, or KDP, have a history of success in Indonesia. The CDD approach has yielded high rates of return on investment; it addresses in an integrated fashion the binding constraints to poverty reduction at the village level- whether these are village roads, water and sanitation systems, or other constraints to poverty and well-being-and it targets poorer areas. Indeed, evidence from community-level infrastructure projects constructed as part of the KDP project shows that economic internal rates of return are between 22 and 47 percent and were 56 percent cheaper than equivalent roads built through government contracts. The CDD approach also empowers the poor by giving them a say in how community resources are spent. For example, community-driven programs have been shown to assist with labor-intensive approaches to the construction and maintenance of village and kecarnatan roads. Moreover, given a choice of investments, villagers in these programs tend to choose infrastructure programs: some 67 percent of total spending chosen by these communities goes to the communities. Indonesia should aggressively scale up its CDD approach to cover the entire nation. It is estimated that such a national program could be up and running within three years. The government’s recent announcement to launch a community-based development program nationally can be a key component of a vigorous poverty reduction strategy. While mitigating the vulnerability of the poor, it will address regional disparities in incomes through employment creation, as well as helping to connect the poor to growth through the development of rural infrastructure.
Pilot demand-slde programs that improve service quality and encourage behavioral change. In particular, CCT programs can be effective in addressing key multi-dimensional poverty goals for poor families, for instance in terms of preventative basic healthcare and nutrition, and in education. By placing targeted spending in the hands of poor households, this will motivate poor families to demand the services they require to meet program conditions and motivate service providers. CCT programs could therefore be targeted to ensure that children and expectant mothers receive critical healthcare services. Equally important in improving outcomes among the poorest households will be CCTs aimed at inducing families to enroll their children at school and maintain regular school attendance. In view of the detailed design and planning that would be necessary for such a program in Indonesia, CCTs should be piloted for extremely poor, rural households and, if successful, scaled up gradually. Success would depend on developing: (i) a beneficiary roster with family demographic data; (ii) a policy and procedures to verify compliance, and to deal with non- compliance; (iii) assessment of the availability of relevant health and education services to address any anticipated supply-side issues; and (iv) a complaints, resolution and appeals system. While this approach has proved to be successful in other countries, given that a CCT program has never been tried in Indonesia the government should assess the effectiveness of such a program before scaling UP.
0 Make both the DAU and the DAH more pro-poor. The General Allocation Fund (DAU) is not structured to target areas with high poverty incidence-indeed, there is no correlation between DAU transfers and poverty rates. Given that the DAU provides on average about two-thirds of sub- national revenues, it is important that the ‘fiscal-gap’ formula be refined to increase the weighting of the poverty variable already contained in the formula. In addition, the recent requirement that the DAU must first cover fully the wage bill of all local governments crowds out other spending, especially at a time when salaries have surged to more than 50 percent of DAU allocations. Meanwhile, the Special Allocation Fund (DAH) is not being used for its intended purpose-the delivery of basic services in lagging regions. First, the DAK is small, comprising only 3 percent of central government transfers to the sub-national governments in 2005. Second, the DAK is spread across sectors and regions too thinly, in addition to often being earmarked for investment in facilities and infrastructure regardless of whether these are constraints to pro-poor outcomes.
xvii

MAKING THE NEW INDONESIA WORK FOR THE POOR
Indeed, with the exception of the health sector, poverty indicators are not used to determine DAH allocations. With the DAH doubling in 2006 and due to rise by a further 25 percent to Rp 14.4 trillion in 2007, this presents an enormous opportunity to address priority needs in resource- deficient districts and sectors. In particular, the DAH is a powerful instrument that should be used to support the pathways out of poverty and improved service delivery in lagging regions. To this end, the DAH should be used to leverage local government resources by revising the matching-funding requirement, which at present only requires a minimum 10 percent matching funds. The government should consider introducing performance-oriented incentives to improve the efficiency and effectiveness of DAH funding. For example, the allocation of an education DAH could be conditional on a predefined increase in junior secondary completion rates. Key areas in which to consider such leverage would be in sanitation, which is in crisis in Indonesia with only 1 percent of Indonesians having access to piped sewerage systems, and in rural road maintenance, which has still to recover to its pre-crisis levels.
Priorities for Poverty Reduction
Three transformations are taking place in Indonesia, each of which can be more or less pro-poor. This report suggests policy measures that can make these changes rapidly reduce poverty.
0 First, as it grows, Indonesia’s economy is being transformed from one with agriculture as its mainstay to one that will rely more on services and industry. The priority for making this growth work for the poor is a friendlier rural investment climate, principally through better rural roads. Second, as democracy takes hold, the government is being transformed from one where social services were delivered centrally to one that will rely more on local governments. The priority for making services work for the poor is stronger capacity of local governments and better incentives for service providers.
0
0 Third, as Indonesia integrates internationally, its system of social protection is being modernized so that Indonesia is both socially equitable and economically competitive. The priority for making public expenditure work for the poor is to shift from intervening in markets for commodities that the poor consume (such as fuel and rice) to providing targeted income support to poor households, and using the fiscal space to improve critical services such as education, health, safe water, and sanitation.
Table 3 Nine steps towards a poverty-free Indonesia
Key dlmensionr of indoneslan poverty Reducing vulnerabliity to Reducing non-Income Reducing reglonai Income poverty poverty disparitles In poverty
1. Revise rice policy 2. Revitalize agriculture
Making Growth Work for the Poor 3. Rural roads program
Making Services Work for the Poor 1. Improve incentives 2. Clarify functional
3. Improve local capacity for service providers responsibilities.
Making Expenditures Work for the Poor programs poor poor
1. Scale up CDD 2. Pilot CCTs for the 3. Make DAU and DAH pro
xviii


Chapter 1 Introduction

MAKING THE NEW INDONESIA WORK FOR THE POOR
Indonesia stands at the threshold of a new era and at an Important juncture of Its history. After the historic economic, political and social upheavals at the end of the 1990% Indonesia has started to regain its footing. The country has largely recovered from the economic and financial crisis that threw millions of its citizens back into poverty in 1998 and saw it regress to a low-income status. Recently, it has once again crossed the threshold, making it one of the world’s emergent middle-income countries. Likewise, poverty rates that increased by over one-third during the crisis fell back to pre-crisis levels in 2005- despite rising somewhat in 2006 largely driven by hefty rice price increases in late 2005 and early 2006. Meanwhile, politically and socially Indonesia has seen some major transformations: it is now a country with a vibrant emergent democracy, a newly decentralized government, and far greater social openness and public debate.
Yet as Indonesia faces this new era, the challenge of reducing poverty remains one of the country’s most pressing challenges. While national poverty rates may have largely recovered to pre-crisis levels- notwithstanding the recent increase in the 2006 poverty ra teth is means that close to 35 million people still live in poverty. This is more than the total number of poor in all of the rest of East Asia combined, excluding China. Moreover, national poverty rates mask the large number of ‘near-poor’ in Indonesia, who lie precipitously close to the poverty line. Some 40 percent of the population, or close to 90 million people, live between US$1 and US$2-a-day. Indeed, even though Indonesia is now a middle-income country, the share of those living below US$2-a-day is similar to that of the region’s lowest-income countries. This high vulnerability of the near-poor in Indonesia was once again highlighted by the rice-price driven increase in the poverty rate in 2006, causing poverty to rise from 16.0 percent to 17.7 percent. Indonesia is also seriously lagging on some key non-income dimensions of poverty. Its maternal mortality rate, junior-secondary enrollment rate, and malnutrition rate, for example, have not been improving fast enough and are high relative to comparable countries in the region. Indonesia is also characterized by huge regional disparities and inequalities. There are regions in Indonesia where the poverty levels and characteristics are more similar to some of the poorest low-income countries in the world, and there are pockets of poverty in even the better-off regions of the country.
The democratically elected Government of Indonesia recognizes poverty reduction as a primary challenge and has set Itself ambitious short- and medium-term poverty reduction goals. The Indonesian government is clearly committed to reducing poverty in its medium-term plan (RPJM) for 2004-09 which, in turn, draws from its national poverty reduction strategy (SNPK). In addition to signing on to the Millennium Development Goals for 2015, in its medium-term plan the government has laid out its own key poverty reduction objectives for 2009. These include the ambitious but relevant targets of reducing the poverty headcount rate from 18.2 percent in 2002 to 8.2 percent; increasing the junior-secondary school enrollment ratio from 79.5 percent in 2002 to 98 percent; and bringing down the maternal mortality rate from 307 per 100,000 live births in 2002 to 226.
How to achieve Its poverty reduction goals and ’make the new Indonesia work for the poor’ Is one of the preeminent policy challenges facing the nation. History has much to teach, and Indonesia’s record in poverty reduction since independence and through the crisis stands out as an example for the developing world. The challenges and lessons of success and failure that are a legacy of this history are important in this regard. But trying to use the lessons of history alone as a guide for the solutions of the future is not sufficient. This is in many respects a new Indonesia, with a new democracy, a newly decentralized administration and newly formed (and reforming) institutions. Consequently, the challenges involved in tackling the issue of poverty in Indonesia today present a very new set of circumstances to policy-makers.
The purpose of this report is to Identify the nature and key constraints to poverty reduction In today’s Indonesia and to provide concrete recommendations on how Indonesia can move forward to achieve Its poverty reduction objectives. It aims to contribute to the policy debate and decision-making process in Indonesia by putting forth: (i) new and more comprehensive analysis of empirical poverty diagnostics; and (ii) suggestions on concrete policies and programs for a strategic action-plan to achieve Indonesia’s stated poverty-reduction objectives. This report lays out how Indonesia can better align policies and programs to achieve the key poverty indicators in which Indonesia is lagging and that are identified by planning documents such as the SNPK and RPJM.
2
Chapter 1 Introduction
This report Is organized around an actionorlented diagnostic and strategic framework that lends Itself to action. Chapter 2 lays out the history of growth and poverty reduction, and analyzes where Indonesia stands today and how past experiences have influenced the present. It also highlights that the lessons of the past are relevant to the future. Chapter 3 presents new analysis that enhances our understanding of the nature and causes of poverty in Indonesia, as well as some of the forces driving the changes in poverty. Based on this understanding, the next chapters lay out pillars for action.
0 ‘Making Growth Work for the Poor’ has been, and will need to continue to be, a fundamental component to reducing poverty. Chapter 4 analyzes how growth processes have aided people in finding pathways out of poverty, and lays out strategies to address the constraints that hinder the poor from linking into and contributing towards growth. Its focus is how to increase the incomes of the poor.
0 ‘Making Public Spending Work for the Poor’ focuses on how the government can better use Its resources to achieve its poverty reduction objectives. Chapter 5 analyzes the benefit incidence of spending in key sectors that matter most for the poor and proposes policies and actions to make budget allocations and sector spending programs more pro-poor. This issue is particularly pertinent in the context of the fiscal situation in today’s Indonesia. Greater fiscal consolidation combined with added fiscal resources resulting from increased fuel prices has raised the issue among policy- makers of how best to use resources for poverty reduction. The focus of this chapter, beyond further reductions in income poverty, is how to reach some of the key targets among the non-income dimensions of poverty.
0 ‘Making Social Protection Work for the Poor’ addresses the high vulnerablllty that characterizes poverty In Indonesia. This issue was recently brought to a head by a government decision to reallocate the fuel subsidy that de facto formed the biggest budgetary share of any such subsidy or transfer program. Chapter 6 provides original analysis of the actual risks and vulnerabilities faced by the poor and the mechanisms they use to cope with shocks. It proposes specific programs that might address the nature of shocks that affect the poor in Indonesia. It looks at mitigating risks and vulnerability as a key component to poverty reduction.
0 Finally, ‘Making Government Work for the Poor’ argues that improved governance Is a critical factor In ensuring that growth, spending, and social protection work for the poor. Strengthening key government systems and accountability mechanisms is thus a key part of the poverty reduction agenda, as without improved governance and institutions, it will not be possible to get the New Indonesia to Work for the Poor.
3

Chapter 2 A History of Growth and Poverty Reduction


Chapter 2: A History of Growth and Poverty Reduction
Only 50 yean ago, Indonesia was one of the poorest countries In Asla. The story of its poverty and poverty reduction is a story of the political and economic eras that determined the nation's development trajectory: colonial rule and exploitation; authoritarian rule, coupled with sustained growth, then dramatic collapse; and, most recently, democracy accompanied by economic flux and tentative stabilization. At independence in 1945, dislocated by Japanese occupation during World War I1 after years of colonial rule and commercial exploitation, the vast majority of Indonesia's population was impoverished. By 1993, however, with poverty reduced to 14 percent of the population and annual economic growth at more than 7 percent, Indonesia was ranked along with a handful of other East Asian countries as a High-Performing Asian Economy (World Bank, 1993) and lauded for its astonishing transformation. In order to understand this remarkable turnaround it is necessary to develop an understanding of the key factors that drove the change in livelihoods of some 100 million Indonesians.i
History has much to teach Indonesia as It struggles to reestablish economic growth and reconnect that growth to Its remaining poor. Because Indonesia has experienced such sharp swings in its development path, there are numerous successes to examine, just as there are also lessons to learn from the many failures. Drawing on the vast historical literature in this area (Timmer, 2003; Hofman et ai, 2004; Temple, 2001; Mclntyre, 2003; and Hill, 1996), this chapter briefly sets out this history, beginning with the unfavorable starting point, then focusing on the policies of the Soeharto government that brought about the structural transformation in the livelihoods of the poor, and going on to reflect on the causes and impacts of the greatest economic crisis in Indonesian history. The story of three decades of sustained pro- poor growth, juxtaposed with the story of rapid collapse and recovery, provides useful insights for future policy-ma king.
The purpose of this chapter Is to provide some context to the current poverty scenario In Indonesia by telling the extraordinary story of povetty reduction and economic growth that has occurred since Indonesia emerged from colonial rule. To this end, this chapter traces the paths of growth and poverty reduction in Indonesia, focusing on the policies and structural changes that marked key stages. The chapter first describes the chronic poverty of the pre-independence period, the post-war muddling through followed by gradual economic deterioration under the Sukarno regime, and then the later 30-year period of growth and poverty alleviation, and the nature of the structural transformation that changed the nation's history. It then focuses on the more recent past, describing the economic crisis, the post-crisis stabilization, and the emergence of democracy and decentralization in the new millennium.
II A Troubled History and Chronic Poverty
For the duration of the 350-year period of Dutch colonial rule, the trade and tax regime favored colonial extraction of Income with dire consequences for the Indonesian population. Analysis provided by Van der Eng and interpreted by Timmer enables an examination of growth, the severity of poverty (through a comparison of the annual food energy intake measured in kcals), and the income elasticity of consumption over the past century. The record shows marked variability in both the rate of economic growth and how well it was connected to the poor over a series of political and economic epochs. During the nineteenth century, growth in consumption was negative, estimated at -0.34 kcal, the second-lowest in Indonesia's measured history-while the index of pro-poor growth2 was only a fraction of the long-term average, illustrating the severe disconnect between the poor and the modest economic growth that
1 This chapter draws on papers from Peter Tirnmer and others. Timmer's paper draws attention to the global lessons that Indonesia provides: 'Indonesia is the original home of the dual economy. Boeke's experience during the Dutch colonial administration of Java led him to identify two types of economic agents "rational" and "traditional"-with almost entirely separate spheres of economic activity (Boeke, 1946). Lewis (1954) built his Nobel- Prizewinning model of the dual economy with unlimited supplies of labor on the behavior of such agents." Timmer (2005), p.15. 2 A crude 'index of pro-poor growth' IPPG shown in Table 2.1 is based on an analytical relationship between the overall incidence of poverty and the observed, average income elasticity of demand. The Income elasticity of food energy for the entire period from 1880 to 1990, estimated to be 0.313, is used as the long-run base, scaled to one. It is multiplied times the long-run growth rate in per capita incomes, 0.89 percent per year, to generate the iong-run average index of pro-poor growth (IPPG) of 0.89. The income elasticity for each separate epoch is then scaled relative to the long-run average, and multiplied times the growth rate in per capita incomes, to generate the IPPG for each epoch. Note that the IPPG incorporates both the growth and the distributional dimensions of pro-poor growth, and this index is thus a country-specific version of Equation 1 in "Concept Paper on Operationalizing Pro-Poor Growth World Bank (2004).
5

MAKING THE NEW INDONESIA WORK FOR THE POOR
occurred during this period. In the mid- to late-nineteenth century, similar to most other regions of Southeast Asia, the historical record of Indonesia was one of severe poverty (Timmer, 2004).
The collapse of export prices and disastrous economic management In the 1920s resulted in the lowest growth rate and least prepoor growth period in Indonesia’s recorded history. At the beginning of the twentieth century, when Dutch public opinion was starting to influence the management of the colonies for the first time, a more developmental approach, known as the ‘ethical policy’, was implemented for a brief period. The policy brought significant benefits to the economy (growth reached 1.63 percent) and to the poor (growth in food intake reached an annual average of 1.39 percent per year). But this internal investment in the country lasted for only a brief period. The collapse of world prices for export commodities in the 1920s, and the abysmal economic management of Indonesia3 during the Great Depression, resulted in the lowest economic growth rate and rate of pro-poor growth in any period before independence. While the colonial authorities had built a significant network of irrigation and transport facilities, there was very little investment in educating the nation’s population. Only 3.5 percent of the population was attending school of any kind in 1939, compared with 26.7 percent in 1995 (Susenas, 1995). Poverty increased significantly during the period of World War II and the subsequent struggle for independence, which only reached closure with final acceptance by the Dutch in 1949. The tumultuous global period spanning the Great Depression, the Pacific War, and the fight for independence (192550), saw a marked deterioration in per capita income growth rates (-2.42 percent) and a negative rate of pro- poor growth (-2.57 percent). (Table 2.1)
Table 2.1 Long-term patterns of pro-poor growth in indonesla 4
Avg annual Avg annual income index of Time Perlod growth In growth in kcai eiartlclty of prepoor
Income per consumption consumption growth capita (%) per capita (W) for kcai
Dutch colonial exploitation 0.33 -0.34 0.051 0.05 1880-1905 0.165
1905-25 2.805
192550 1.064 1.46 0.68 0.509 2.37 The Sukarno era, including the ‘Guided Economy’
1950-65 1.626 The ‘New Order’ regime of Soeharto 3.45 2.10 0.595 6.56
‘Ethical Policy’ under the Dutch 1.63 1.39 0.878 4.57
Depression, Pacific War, and fight for independence -2-42 -0.78 0.333 -2.57
1965-90 1.901 Long-term averages 0.89 0.22 0.313 0.89 1880-1990 1.000
Source: Timmer, 2005.
After independence, during the perlod when the Indonesian natlon was being built, weak and inward- looking policies resulted In an Increase In poverty rates after 1960. By the early 1960% similar to other post-independence states, poverty had fallen in the postwar recovery, and Indonesia was muddling along with modest growth and weak but quasi-democratic governance. However, after Sukarno imposed ‘guided democracy’ in 1959, the situation deteriorated sharply. Adopting an inward-looking development policy and severely neglecting agriculture, Indonesia was ‘a prime exemplar of the dangerously degenerative consequences of weak governance and a sickly economy’ (Maclntyre, 2003). Incomes fell dramatically and the hyperinflation of 196566 had an adverse impact on the entire population as the poverty rate increased rapidly and the economy collapsed.5 Probably 70 percent of the population was absolutely poor by 1966 and hunger was widespread (Timmer, 2003). Unsurprisingly, in 1968, with no hint of the future, Gunnar Myrdal observed in Asian Drama ... “no economist holds out any hope for Indonesia.”
3 The Dutch forced the Netherlands East Indies, Indonesia’s colonial name, to remain on the Gold Standard well after their regional competitors, including the Japanese, devalued. 4 Details of the regressions are provided in Timmer (2005), along with a full explanation of the analytical relationship between the overall incidence of poverty and the average income elasticity of demand for food energy. 6 A t 2.31, the IPPG is surprisingly high during the Sukarno era, when economic policy is widely regarded to have been a disaster. But a combination of a modest recovery from the quarter century of depression and wars, with average per capita incomes rising 1.5 percent per year, and large average income elasticity for food energy, suggest that what growth there was actually reached the poor.
6

Chapter 2: A History of Growth and Poverty Reduction
111 A Period of Growth and Poverty Reduction
The trajectory of growth and poverty transformed dramatically under the New Order government. Starting in 1968, for three remarkable decades, Indonesia’s GDP grew on average by 7.4 percent annually. As a result, in 1997 Indonesia’s per capita income reached US$906, more than quadruple the 1968 level (World Development Indicators). When compared with previous periods in Indonesian history, the quarter century from 1965 to 1990 saw an annual growth of caloric intake of 2.1 percent a year, 50 percent higher than the next best epoch in 1905-25 and almost ten times the long-term average. The rate of pro- poor growth reached 6.7 percent in the period 1965-90. This was the highest pro-poor growth rate in Indonesian history, seven times the long-term average and nearly half as high again as the next best epoch in 1905-25.
Figure 2.1 Perlods of sustalned growth have brought rapld poverty reductlon In Indonesia, 1961-2005
30
25
20
15 u
f 10
E 5 f
-5
40
35
5
0
Source: Central Bureau of Statistics (BPS). Hofman et al, 2004. Annex 11.1 Poverty lines, percentage of poor and total numbers of poor In Indonesia, for details on poverty numbers over time.)
The story of Indonesla’s poverty reductlon Is first and foremost a story of sustalned pro-poor growth. From 1970 onwards, large and sustained reductions in poverty in Indonesia have only occurred during periods of sustained economic growth: the more rapidly the country’s economy grew, the more dramatically poverty declined, while slower growth always resulted in slower reductions in poverty. Figure 2.1 provides an illustration of the close connection between poverty reduction and growth. Over these three decades, each percentage point of economic growth resulted in a 1.3 percentage reduction in poverty.
The pro-poor performance for these three decades was based on a conscious strategy that combined rapid economic growth with Investment and pollcles that ensured growth reached the poor. The strategy integrated the macroeconomy with the household economy by lowering the transactions costs of operating in markets. This strategy also effectively combined efforts to increase human capabilities and increase demand (conceptualized in Annex 11.2 Framework for pro-poor growth). It was designed and implemented by highly skilled economic planners outside the political sphere, but at the direct urging of President Soeharto. Huge investments were made in the expansion of education, family planning and health; transaction costs fell markedly through the construction of roads and other infrastructure that enabled the poor to be connected to the growth process; and, sound macroeconomic management was (from the late 1970s) accompanied by a competitive exchange rate.
In the early pre-0pec years of the Soeharto government, pollcy-maklng focused on the macroeconomlc stablllzatlon of the economy. During the period 1966-73, as the Soeharto government consolidated political power, comprehensive changes in economic policy established a first phase of economic
7

MAKING THE NEW INDONESIA WORK FOR THE POOR
liberalization: the restoration of external viability, the imposing of fiscal constraints, the restoration of the banking system and the liberalization of the investment regime (Hofman et al, 2004). Major investments were also made to restore agriculture through irrigation rehabilitation, the introduction of high-yielding varieties of rice,6 fertilizer imports and distribution, and the Bimas7 program of extension and farm credits. Since median farm size was less than a hectare, rice intensification had widespread benefits (Afiff and Timmer, 1971)8 and food production and overall food supplies rose sharply. Growth rates sky- rocketed to 12 percent in 1968 and the poverty headcount fell rapidly by 10 percentage points to 60 percent over a seven-year period as the economy stabilized. Annual growth rates stayed largely within a 7 to 9 percent range during the 1970s (Hofman et al, 2004).
The continuation of sound macroeconomic management was key to the success of the boom yean that followed. From 1973 to 1983, the rapid rise in oil prices created a windfall gain for oil exporters across the world. In Indonesia, net oil revenues increased seven-fold, from US$0.4 billion in 1973 to US$2.8 billion in 1975, and jumped to US$4.4 billion in 1979 in response to the turmoil in the wake of the Iranian revolution. This windfall in oil revenues generated current account surpluses and increased budgetary revenues, enabling a rapid expansion of the economy and massive public investment in infrastructure, health and education. The first official poverty estimates, based on the 1976 Susenas, indicated a national poverty rate of 40 percent (see Annex 11.1).
Sound exchangerate management enabled Indonesia to stimulate an export-led economy and labor lntenslve growth, ensuring the poor were connected Into the country’s growth. Between 1976 and 1978, income distribution deteriorated sharply as the real appreciation of the rupiah reduced the profitability of tradable goods production, especially in agriculture (Warr, 1984). Although the regional and commodity dimensions of poverty masked its economic roots, during the mid-1970s there was a growing awareness of income inequalities and severe poverty in rural areas. The technocrats took a highly strategic approach to what was then diagnosed as ‘Dutch Disease’ and, in November 1978, devalued the rupiah, to the surprise of financial markets. Tradable goods production rapidly recovered, particularly in the agriculture sector. After 1978, poverty rates again started to decline assisted by a significant recovery in the share of income (19.9 percent in rural areas) garnered by the bottom 40 percent of the distribution (see Table 2.2). By the end of the decade, the poverty headcount had fallen to 28.6 percent. Despite this, the national Gini coefficient of inequality reached what would be its highest point for the rest of the decade. The government ensured that adjustments were made in the decade that followed. By 1983, when the international oil boom slowed and commodity prices fell, Indonesia restructured its economy and policies with devaluation and trade openness. Agriculture continued to grow and rice prices were kept artificially stable. Simultaneously, the government pursued aggressive exchange rate protection, devaluing first in 1983 and again in 1986 (Hill, 1996; Thorbecke, 1995).
The mid-1980s saw a series of trade reforms belng Introduced to correct the import blas and estabilsh a pro-poor trade reglme. Indonesia’s new trade openness led to a significant increase in the role of the manufacturing sector. By 1986, the import substitution policies that had stifled the country’s growth during the 1970s were replaced by a strategy focusing on labor-intensive manufactured exports. With broad-based industrial growth underway, the 1980s saw a determined effort by the government at export promotion. The manufacturing sector contributed 29.2 percent of GDP growth between 1987 and 1992, a marked increase from the 10 percent contributed during the recovery period of 1967-73 (Hill, 1996). Large-scale and sustained economic deregulation led to better incentives for exports, and these were matched by incentives for foreign direct investment (FDI). Manufactured exports responded even faster than anticipated and contributed almost half of all exports by 1992, up dramatically from the 3 percent in 1980. The fortuitous ‘push’ in FDI from Japan and the ‘pull’ from the attractive climate in Indonesia thus allowed the manufacturing sector to become a significant employer of the poor, increasing wages by the end of the 1980s. This growth in the commercial sectors created a boom in the non-tradable economyg
6 Obtained from the International Rice Research Institute (IRRI). 7 Mass Guidance (Bimbingan Massai, or Bimas) is a subsidized government credit program in Indonesia In the 1970s and 1980s to promote the green revolution, i.e. the use of high yielding seeds variety and pesticides to increase agriculture production. 8 Although larger farmers (those who cultivate about one hectare of land) benefited the most In the early years. 8 The two commercial sectors are the ”engines of growth” because of their potential for rapid productivity gains. Connecting them to the %on-tradable” sector, however, is the key to a high “elasticlty of connection” between overall economic growth and rapid poverty reduction. Unless demand from rising incomes in the commercial sectors spills over to this non-tradables sector, the poor tend to be left out of the growth process.
8
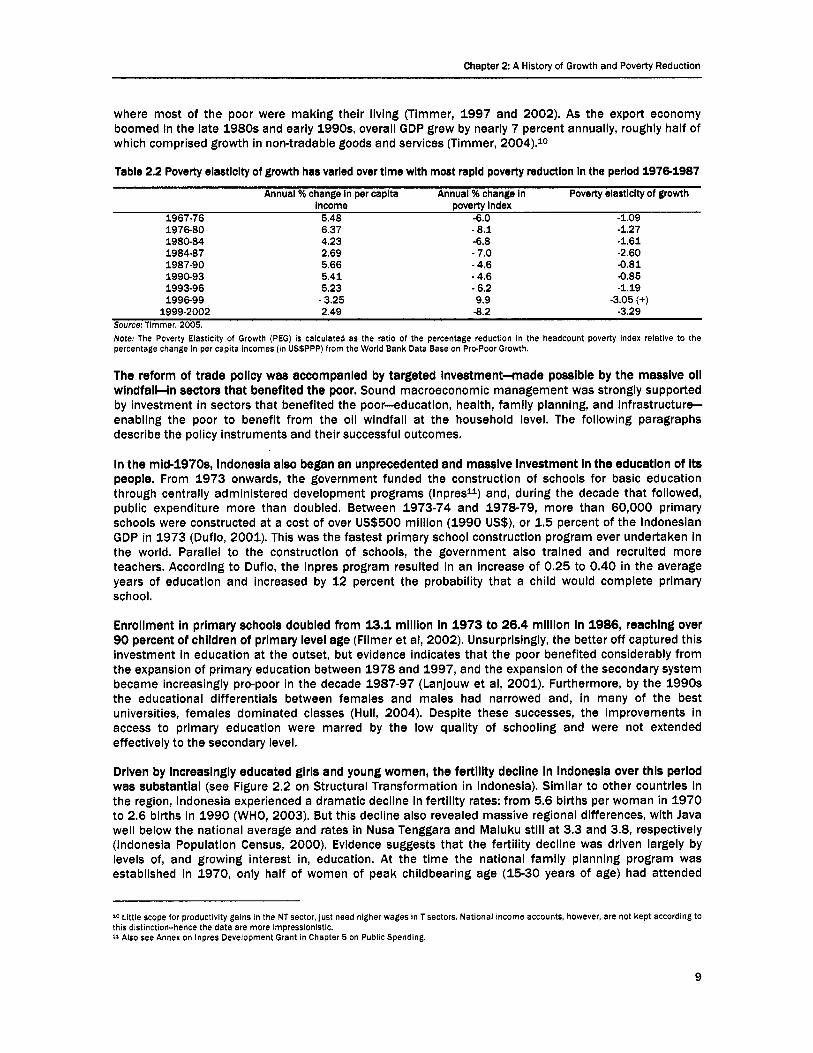
Chapter 2: A History of Growth and Poverty Reduction
where most of the poor were making their living (Timmer, 1997 and 2002). As the export economy boomed in the late 1980s and early 199Os, overall GDP grew by nearly 7 percent annually, roughly half of which comprised growth in non-tradable goods and services (Timmer, 2004).lO
Table 2.2 Poverty elasticity of growth has varied over time with most rapid poverty reduction In the period 1976-1987
Annual %change In per capita Annual %change in Poverty elasticity of growth income poverty index
1967-76 5.48 -6.0 -1.09 1976-80 1980-84 1984-87 1987-90 1990-93 1993-96 1996-99
Source: Timmer, 2005. 1999-2002 2.49 -8.2 -3.29
6.37 4.23 2.69 5.66 5.41 5.23
- 3.25
- 8.1 -6.8 - 7.0 - 4.6 - 4.6 - 6.2 9.9
-1.27 -1.61 -2.60 -0.81 -0.85 -1.19
-3.05 (+I
Note: The Poverty Elasticity of Growth (PEG) 1s calculated as the ratio of the percentage reduction in the headcount poverty index relative to the percentage change in per capita incomes (in US$PPP) from the World Bank Data Base on Prc-Poor Growth.
The reform of trade policy was accompanied by targeted Investment+nade possible by the massive 011 wlndfalHn sectors that benefited the poor. Sound macroeconomic management was strongly supported by investment in sectors that benefited the poor-education, health, family planning, and lnfrastructur+ enabling the poor to benefit from the oil windfall at the household level. The following paragraphs describe the policy instruments and their successful outcomes.
In the mId-l970s, Indonesia also began an unprecedented and massive Investment In the education of Its people. From 1973 onwards, the government funded the construction of schools for basic education through centrally administered development programs (Inpresli) and, during the decade that followed, public expenditure more than doubled. Between 1973-74 and 1978-79, more than 60,000 primary schools were constructed at a cost of over US$500 million (1990 US$), or 1.5 percent of the Indonesian GDP in 1973 (Duflo, 2001). This was the fastest primary school construction program ever undertaken in the world. Parallel to the construction of schools, the government also trained and recruited more teachers. According to Duflo, the lnpres program resulted in an increase of 0.25 to 0.40 in the average years of education and increased by 12 percent the probability that a child would complete primary school.
Enrollment In primary schools doubled from 13.1 million In 1973 to 26.4 million in 1986, reaching over 90 percent of children of primary level age (Filmer et al, 2002). Unsurprisingly, the better off captured this investment in education at the outset, but evidence indicates that the poor benefited considerably from the expansion of primary education between 1978 and 1997, and the expansion of the secondary system became increasingly pro-poor in the decade 1987-97 (Lanjouw et ai, 2001). Furthermore, by the 1990s the educational differentials between females and males had narrowed and, in many of the best universities, females dominated classes (Hull, 2004). Despite these successes, the improvements in access to primary education were marred by the low quality of schooling and were not extended effectively to the secondary level.
Driven by Increasingly educated girls and young women, the fertility decline In Indonesia over this period was substantial (see Figure 2.2 on Structural Transformation in Indonesia), Similar to other countries in the region, Indonesia experienced a dramatic decline in fertility rates: from 5.6 births per woman in 1970 to 2.6 births in 1990 (WHO, 2003). But this decline also revealed massive regional differences, with Java well below the national average and rates in Nusa Tenggara and Maluku still at 3.3 and 3.8, respectively (Indonesia Population Census, 2000). Evidence suggests that the fertility decline was driven largely by levels of, and growing interest in, education. At the time the national family planning program was established in 1970, only half of women of peak childbearing age (1530 years of age) had attended
10 Little scope for productivity gains in the NT sector, just need higher wages in T sectors. National income accounts, however, are not kept according to this distinction-hence the data are more Impressionistic. 11 Also see Annex on lnpres Development Grant in Chapter 5 on Public Spending.
9

MAKING THE NEW INDONESIA WORK FOR THE POOR
primary school. In the next three decades, these figures rose dramatically so that by the turn of the century only 2 percent of women in this age group were illiterate (Hull, 2005). Various studies have concluded that the course of fertility decline in Indonesia was shaped by reductions in the desired family size among the succeeding generation of mothers (with education as a dual driver) and the opportunity to attain substantial control over fertility through the government-sponsored provision of efficient forms of birth control.12
From 1978, Indonesia’s public investment in primary healthcare led to a substantial increase in access to health servlces and a marked improvement in health outcomes. In the late 1970s, Indonesia launched a primary healthcare approach to health investments.13 Over a 12-year period, the country witnessed the construction and staffing of over 26,000 public health centers and sub-centers (Puskesmas and Puskesmas Pembantu, or Pustu for short) and 285 districts and 50 referral hospitals (World Bank, 2000). In 1989, the government began hiring nurse-midwives and placing them in rural villages.14 The share of communities with a nurse-midwife increased from less than 10 percent in 1993 to almost 46 percent by 1997.15 By 2002, almost half of all births in rural areas were attended by a village nurse-midwife.I6 Infant mortality rates dropped from over 94 deaths per thousand births in the mid-1970s to 48 in the 1995.l’ Between 1977 and 1997, life expectancy rose from 53 to 65 years18 and malnutrition prevalence fell from 40 percent of children under five in 1987 to 30 percent in 1998.19 This approach was successful in terms of dramatically improving access, although the quality of services is a growing concern (see Chapter 5 on Public Spending) and progress towards the Millennium Development Goals (MDGs) is not satisfactory in malnutrition and maternal mortality.
To enhance tradabiiity and boost agricultural productivity, the government also focused on the development of physlcai Infrastructure and facilities throughout the country. The windfall also supported the development of widespread and large-scale investment in infrastructure assets. Up until 1994, the government was spending 30 percent of its development budget on infrastructure,20 equivalent to 2.3 percent of GDP (see Chapter 5 on Public Spending for more detailed analysis). The expansion of the road network was particularly significant. In 1977, local roads (mostly farm-to-market roads) totaled 8,500km and rose in a 21-year period to 31,900km by 1998. The transformation of Indonesia’s network of highways took off in the 1970s, expanding by an average 8.3 percent annually between 1970 and 1998. This, together with the massive investment in trucks, radically transformed Indonesian capacity to move goods to ports and around the country in just two short decades. The impact on transaction costs was significant.
But the policy and institutional framework was far from complete, hindering private-sector investment. A key gap in the framework for development concerned the legislative and regulatory framework for private- sector investment. During the 1980s, the private sector expanded without a strong legal system to provide the certainty and structure for private-sector confidence (Hofman et al, 2004). Apart from a chronically ineffective judiciary (and thus any legal recourse), the basic legal framework dating back to the colonial period gave inadequate provisions to promote business confidence, and a lack of cooperation
12 Two drivers were mutually reinforcing-the more education the parents had attained, the higher thelr hopes and expectations for their children. One factor that sharpened this process in Indonesia was the relative gender equity that the cultural setting supported. While boys may have received more attention than girls, the gap was not as great as those found in Chinese or South Asian cultures. (Hull, 2004, p. 2). The sustainability of current levels of fertility however is now questioned (see for instance Shoemaker, 2005). 13 The expansion of public basic health facilities was inspired by the Health for All (HFA) initiative of the 1978 UN conference in Alma Ata. Indonesia was one of the first countries to put this primary-care oriented prc-poor health design into place. 14 By 1994 over 50,000 nurse-midwives had been placed across Indonesia an initiative subsequently formalized as the Village Midwives (bldan di desa) program (Parker and Roestam , 2002). 15 Among communities Surveyed in the indonesian Family Life Survey or IFLS (Frankenberg et al, 2004). 16 Among communities Surveyed in the Indonesian Family Life Survey (IFLS) the share of Communities with a nursemidwife increased from less than 10 percent in 1993 to almost 46 percent by 1997. By 2002 almost half of births in rural areas were attended by a village nursemidwife (BPS and ORC Macro, 2003). 17 Mortality rate, infant (per 1,000 live births): Harmonized estimates of the World Health Organlzation, Unicef, and the World Bank. based mainly on household surveys, censuses, and vltal registration, supplemented by World Bank estimates based on household surveys and vital registration (World Development indicators, or WDI). 18 Life expectancy at birth, total (years): World Bank staff estimates from various sources including census reports, the United Nations Statistics Division’s Population and Vital Statistics Report, country statistical offices, and Demographic and Health Surveys from national sources and Macro International (WDI). 10 Malnutrition prevalence, weight for age (percentage of children under 5): Prevalence of child malnutrition (weight for age) Is the percentage of children under five whose weight for age is more than two standard devlatlons below the median reference standard for their age (WDI). 20 See Chapter 5 on Public Spending for more analysis. The infrastructure sectors included in this analysis are water and sanitation, irrigation, roads and electricity only.
10

Chapter 2: A History of Growth and Poverty Reduction
between responsible institutions led to poor sequencing of updated regulations and legal codes for economic activity. This weak enabling environment had (and continues to have) profound long-term impacts on investor confidence and the sustainability of private-sector investment in a number of sectors vital to continued growth.
And weak, dysfunctlonal lnstltutlons failed to keep up with the expanding and complex economy, and vastly increased levels of government spendlng. Despite the strong connections that were established between the poor and the country’s growth, the process was strained by the dysfunctionality of government institutions, especially in the sectors and at lower levels of government. In the 1970% the government appeared to be ‘‘a munificent benefactor of the fledgling service” and the problems of under- funding undermined the quality and integrity of the civil service (Hofman et al, 2004). The massive growth of the civil service reflected the policy emphasis on service delivery and infrastructure development (Rohdewohld, 1995), and the recruitment of teachers, doctors and engineers increased the overall size of the civil service from 525,000 In 1970 to 2 million in 1990 and over 4 million in 1993. This represented a five-fold increase from 4.1 to 21.8 staff per thousand inhabitants between 1960 and 1993 (Hofman, 2004). The problem was not size but quality.2i
IV A Structural Transformation
The policies of the New Order government built upon and accelerated a process of structural transformation. Macroeconomic stability, investment in human and physical assets, and a reduction in transaction costs during this period transformed the livelihoods of the Indonesian people from low-value agriculture to higher-value agriculture, from agriculture to non-agriculture, and from rural- to urban-based activities. This transformation dramatically affected the pattern of employment and transformed Indonesia’s workforce over the two decades from the early 1980s to the early years of the new millennium. A largely agricultural and rural workforce in 1982 became increasingly off-farm and urban: in 1982, 54.2 percent and 45.7 percent of workers were employed in agriculture and non-agriculture, respectively. This ratio was more or less 5050 by 1993, and tipped to 45 percent agriculture and 55 percent non-agriculture by 2002. The services sector drove the increase in the share of non-agricultural employment, rising from 30 percent in 1980 to 34 percent in 1990, and to 43 percent in 1995 (Figure 2.2).22 Even more significant was the transformation from rural to urban, with the urban share of non- agricultural employees more than doubling in this 20-year period (see Table 2.3 and Annex II. 3).
Table 2.3 Employment has moved to non-agricultural sectors and urban areas over time
(‘000) (“m) (’000) (“m) (‘000) (%I Agrlculture 30,487 54.24 39,137 49.88 39,035 44.92 Nin-agrlcu lture
Rural Urban
All secton
25,724 45.76 39,329 50.12 47,874 55.08 15,939 28.36 18,992 24.20 16,785 19.31 9,785 17.41 20,337 25.92 31,088 35.77
56,211 100 78,466 100 86,909 100
Source: Susenas, 1982,1993, 2002. Data exclude Aceh, Maiuku, North Maluku and Papua. Note: Employment is defined as self employed without help, self employed with help of householders/temporaty workers, self employed with help of regular workers, employees and family workers with age 10 years and over (definition until 1997). The definition of employment since 1998 is the same as above, but for persons 15 years and above.
The agricultural transformatlo-he shlft from low to high productlvity agrlculture-was the primary driver of poverty reduction In Indonesia. Although the importance of agriculture declined from 1993 to 2002, agricultural income still represented over 37 percent of the income source for the poor, while by 2002 the richest quintile was obtaining less than 5 percent income from agriculture. As average land-holdings
2 1 Although the relative size of the civil service was not dissimilar to that of India or China at its peak in 1993 and thereafter, it had stlll done little to overcome the bureaucratic deficiencies of the Sukarno regime, reported some 20 years earlier (World Bank, 2003). 22 Labor surveys or Survei Tenaga Kerja (Sakernas), 1980, 1990 and 1995.
11
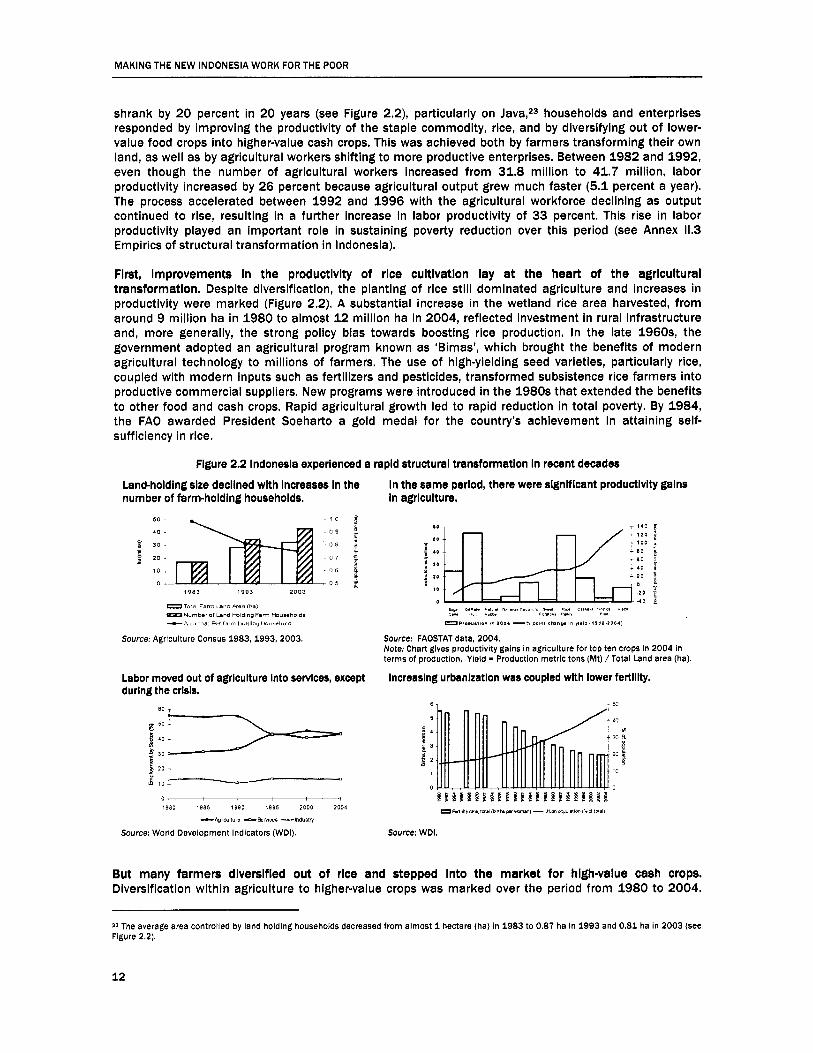
MAKING THE NEW INDONESIA WORK FOR THE POOR
shrank by 20 percent in 20 years (see Figure 2.2), particularly on Java,23 households and enterprises responded by improving the productivity of the staple commodity, rice, and by diversifying out of lower- value food crops into higher-value cash crops. This was achieved both by farmers transforming their own land, as well as by agricultural workers shifting to more productive enterprises. Between 1982 and 1992, even though the number of agricultural workers increased from 31.8 million to 41.7 million, labor productivity increased by 26 percent because agricultural output grew much faster (5.1 percent a year). The process accelerated between 1992 and 1996 with the agricultural workforce declining as output continued to rise, resulting in a further increase in labor productivity of 33 percent. This rise in labor productivity played an important role in sustaining poverty reduction over this period (see Annex 11.3 Empirics of structural transformation in Indonesia).
First, Improvements In the productivlty of rice cultivation lay at the heart of the agricultural transformation. Despite diversification, the planting of rice still dominated agriculture and increases in productivity were marked (Figure 2.2). A substantial increase in the wetland rice area harvested, from around 9 million ha in 1980 to almost 12 million ha in 2004, reflected investment in rural infrastructure and, more generally, the strong policy bias towards boosting rice production. In the late 1960% the government adopted an agricultural program known as 'Bimas', which brought the benefits of modern agricultural technology to millions of farmers. The use of high-yielding seed varieties, particularly rice, coupled with modern inputs such as fertilizers and pesticides, transformed subsistence rice farmers into productive commercial suppliers. New programs were introduced in the 1980s that extended the benefits to other food and cash crops. Rapid agricultural growth led to rapid reduction in total poverty. By 1984, the FA0 awarded President Soeharto a gold medal for the country's achievement in attaining self- sufficiency in rice.
Figure 2.2 Indonesia experienced a rapid structural transformation in recent decades Land-holding size declined with increases in the number of farm-holding households.
In the same period, there were signlflcant productivity gains in agriculture.
& N o d < h a 2 1 RT f i l l i l l I b~d,ng~* ,~ in , t ic i ld O P r o d u o f ~ o n In 2 0 0 4 -% pomt olmw in y i . l d ~ l 9 l 0 . 2 l 0 4 l
Source: Agriculture Census 1983,1993, 2003. Source: FAOSTAT data, 2004. Note: Chart gives productivlty gains in agriculture for top ten crops In 2004 in terms of production, Yield - Production metric tons (Mt) / Total Land area (ha).
Labor moved out of agriculture into services, except during the crlsis.
increasing urbanlzatlon was coupled with lower fertiilty.
6
5
i4 t 3 $ 30
20 f z
1
0
% l i i l P l f B B % B i l l $ ~ l B ~ I $ W E = l k n i l ~ f i r ~ e fold ( b f l k ~ s m n l -lib#> I~uIMIUO f"ao(lYIYl1
l I - - " l c 1980 1985 1890 1995 2000 2004
-Pglwllure o ? a w o a c "-lndumw
Source: WDI.
;'=--2- Source: World Development indicators (WDI).
But many farmers dlverslfled out of rice and stepped into the market for high-value cash crops. Diversification within agriculture to higher-value crops was marked over the period from 1980 to 2004.
2 1 The average area controlled by land holding households decreased from almost 1 hectare (ha) In 1983 to 0.87 ha in 1993 and 0.81 ha in 2003 (see Figure 2.2).
12
Chapter 2: A History of Growth and Poverty Reduction
The growth in production of the top ten crops over the past 20 years was illustrated by the fifteen-fold rise in the production of oil palm fruit, from 0.2 million ha in 1980 to over 3 million ha in 2004. Although much smaller harvested areas were involved, other higher-value crops, such as fresh fruit, vegetables and spices, experienced more than a doubling of area harvested.
Second, the changlng opportunities and demands on land and households created by strong economic growth meant that many households dlverslfled, or partlally dlverslfled, their sources of income towards non-agricultural activities. The growing population and declining land holdings over this period, coupled with the non-agricultural options that emerged and the large gap between labor productivity in agriculture and other sectors, led to a change in the share of income recorded from different sources. In 1993, the average share of per capita income from self-employment in agriculture, forestry or fisheries was 25 percent; by 2002, it has declined to 22 percent, driven by a strong decline in the average share of income from food crops, as well as an increase in the share of non-agricultural income. By 2002, for the first time more than half of per capita income came from non-agricultural self-employment or non-agricultural wages (see Annex 11.4).
The third component of the structural transformation was a shift from rural to urban-based activities. Over the past 25 years, the population of Indonesia’s cities has nearly trebled. This rapid increase can be attributed to all three causes of urban growth: expansion of cities into the rural fringe (3540 percent), natural growth (3540 percent) and rural-urban migration (f25-30 percent). Annual urban population growth rates are estimated at 4.6 percent over the period 1980-2000 and 3.6 percent over the last five years, resulting in an urban population of over 93 million (BPS, 2004). In absolute terms, this means that around 8 to 9 million people were taking up an urban rather than a rural livelihood each year. Between 1982 and 1993, non-agricultural employment grew by 10.5 million people (6.7 million more than would be predicted by employment growth in the time period) and, between 1993 and 2002, a further 10.7 million joined non-agricultural employment-8.6 million more than would be predicted by employment growth (see Annex 11.5 for detailed analysis).
Many of those who ‘shifted’ from rural to urban employment dld not actually move. Rather, population growth, the structural shift out of agriculture, and the development of modern facilities in rural neighborhoods resulted in villages being reclassified as urban. Thus, much of the ‘growth’ of urban areas is accounted for by the reclassification of rural areas (see Chapter 4 for further details). However, what is important is not the classification of locations, but the change in the sources of income from rural to urban activities. Indeed, the most dramatic change by far is the increase in urban non-agricultural employment. Over the same period, the number of non-poor workers in these jobs rose by 10.5 million, increasing the share of total employment from 22 percent in 1993 to almost 32 percent in 2002 (MoCulloch, Timmer, and Weisbrod, 2006). This long-term evidence suggests that the processes of urbanization (including reclassification) and migration to urban areas in Indonesia may have been as important for poverty reduction as the sectoral shift from agriculture to rural non-agriculture.
While growth and poverty reduction in the aggregate was healthy and rising, the regional picture was more varied and, In the worst lagging regions, somewhat sobering. The bi-modality of poverty in Indonesia stems from the success of economic growth on Java compared with the lagging growth in eastern Indonesia. In the 1960s and 1970s, poverty was concentrated on Java in both absolute terms and in incidence. In the mid-l960s, some districts in Central Java would have been among the most impoverished anywhere in the world (Timmer, 1975). Today, however, this region is exporting hand- crafted furniture to demanding markets in the West and poverty had fallen to 2 1 percent in 2004 (Susenas, 2004). But not all of the variance across regions can be explained by lower incomes in regions with high poverty. There are major differences in income distribution across regions and between urban and rural areas (Friedman and Levinsohn, 2002). This variance is not so surprising in view of the great diversity seen in Indonesia’s local economic systems-although the variance does suggest that factor flows are not as smooth as the absence of formal trade barriers within the economy might indicate. More surprising is that the actual relationship between economic growth and poverty reduction seems not to
13

MAKING THE NEW INDONESIA WORK FOR THE POOR
vary substantially across provinces.24 (See Chapter 3 on Understanding Poverty for details on regional variations in poverty reduction elasticity of growth.)
And corruption was lodged in all transactions at all levels of government. Despite Indonesia’s extraordinary progress, the losses due to corruption at the highest levels of government during the New Order regime were unprecedented worldwide. Estimates of Soeharto’s personal gain amounted to US$15- 35 billion,25 but a range of corrupt practices affected all transactions at all levels of government. All basic services-health, education and water-on which the poor rely were, and still are, riddled with bribery, embezzlement, fraud and distortions, radically affecting the services the poor ultimately received.
V The Financial Crisis
Just at a time when growth was being sustained at around 7.5 percent annually and 1.1 million individuals were escaplng poverty every year,26 the Indonesian economlc miracle stalled. The knock-on effects of the Thai baht crisis in mid-1997, combined with systemic weaknesses and a series of subsequent events,27 resulted in negative growth of 13.1 percent in 1998, plunging 25 percent of Indonesia’s non-poor population back into poverty (Ravallion and Lokshin, 2005; Strauss et al, 2004). The depreciation of the rupiah-floated in July 1997-from its precrisis level of just under Rp 2,40O/US$l, to as low as Rp 18,00O/US$l in January 1998, had devastating effects on both agricultural2* and non- agricultural markets, and the purchasing power of the poor. The country’s structural transformation stopped abruptly; output fell in both industry and services; and growth in agricultural output remained stagnant but positive as many workers returned to the agricultural sector or were absorbed into the growing informal service sector (see Annex 111.3).
Indonesia experienced such a deep and long-lasting shock as a result of the 1997-98 crisis at least in part because its Institutional development had not kept pace with its economic development. By the mid- 199Os, the Indonesian state was marked by a highly centralized decision-making process. While this process enabled the ‘development state’ to continue to deliver the goods in terms of schools, clinics, and local economic development, the system was marked by little participation by citizens or organized social/political groups. There was practically no ‘veto power’ on the part of organized political groups vis- a-vis the president’s power (Maclntyre, 2003). This led to the politicization of the wider system: civil servants responded to central commands, and not a set of objective rules; the president and his closest aides had few effective ways of gauging public sentiment; and the emerging middle-class had no legitimate avenues to participate in civic or political affairs (Schwarz, 1994).
in many other countries In Southeast and East Asia, the 1960s through to the 1990s was not only a period of rapld economic growth, but also a time during which states strengthened their institutions. This is partly evidenced by the levels of corruption, as measured by Transparency International surveys over time. Indonesia did make some progress according to these measures in addressing corruption, but it is notable that in 1980 it had (and thereafter maintained) the lowest ranking among the ‘Asian Tiger’ nations in levels of corruption (see Figure 2.3). Progress, although evident, was painfully slow.
24 As a result of Friedman’s careful analysis of six Susenas data sets from 1984 to 1999, we now have a clear statistical picture of the geographic variation in the relation between levels of poverty and income and inequality. This statistical picture complements the view from the ground that was developed In 1991 and 1992 by the Harvard-Stanford Poverty Team which reported to Bappenas in September 1992 (Timmer et al, 1992). 25 Transparency International claims Soeharto stole US$1535 billion between 1967 and 1998. Global Corruption Report (2004). 26 The number of poor declined from 25.9 million to 22.5 million between 1993 and 1996 using the old methodology for calculating the poverty line (see Annex 11.1). This means that about 1.1 million poor were escaping poverty per year in this time period when growth rates were on average 7.5 percent annually. 27 Structural weaknesses in Indonesia’s financial sector, weak institutions, a loss of government credibility and a depreciating currency causing rising US$ debt llabllitles all combined in a vicious spiral to spark capital flight. The result was a sharp decline in real incomes, triggerlng a breakdown in law and order in the absence of any social safety net. This stoked social unrest and subsequently led to serious ethnic conflict and political turmoil. 28 Some agricultural producers did very well as the drop in the exchange rate meant the price of tradable goods became more expensive, and those selling tradable goods in remote regions benefited, e.g. cashews etc.
1 4

Chapter 2: A History of Growth and Poverty Reduction
Figure 2.3 Corruption in Indonesia remained a potential source of weakness in the period 1980-98
10 ~ 10=No Corruption . - Q 1980-85 8
6 Q 1990-92
4 1996
2 1998 0
Singapore HonQ KOng Indonesia South Kona Malaysia
Source: Transparency International, taken from Haggard, 2000.
In addition to high levels of corruption, when the crisis hit, the leadership had a limited reservoir of popular support to call upon. Two factors are notable in Table 2.4. Indonesia had, by far, the longest- serving leader of any of the countries impacted by the Asian financial crisis, as well as the most centralized decision-making process. While the other countries impacted by the crisis-Thailand, South Korea, and Malaysia-had developed at least partially inclusive representative institutions during the 1980s and 199Os, the Indonesian state continued down an authoritarian path, with real power continuing to be concentrated in the president and his family, selected cronies, and the military. While in better times the regime had the power to create and enforce many policies almost single-handedly, when collective national sacrifice was necessary there were few reservoirs of goodwill to call upon from a disenfranchised citizenry.
Table 2.4 Indonesia had the longest serving leader of any country impacted by the Asian financial crisis
Thailand South Korea Malaysia Indonesia Leader Prime Minister President Kim Young Prime Minister President Soeharto
Chavalit Sam Mohammad Yongchaiyudh Mahathir
Date started In offlce November 1996 February 1993 July 1981 March 1966
Decision-making process Parliamentary, six Presidential, unified Parliamentary, Authoritarian,
executive-legislative government, but concentrated and intra-party splits UNMO dominant
party coalition government but coalition highly
Source: Haggard, 2000.
Thus, while centralized leadership and rapid growth managed to mask these underlying deficiencies during the good times, the social compact between citizens and government quickly disintegrated when placed under severe stress. While other nations had relatively broad coalitions that could, in effect, distribute the pain across a broad segment of society, in Indonesia a relatively isolated leadership quickly found out that it had no effective coalition, and that it was impossible to ‘square the circle’ of demanding sacrifice and compromise from both ruling elites and ordinary citizens. Citizens, long disenfranchised, had little interest in supporting the regime during difficult times (Bourchier and Hadiz, eds, 2003), and elites, long accustomed to making and enforcing the rules were unable to implement the required policies, as these would have directly undermined their financial interests (Bourchier and Hadiz, eds, 2003; Maclntyre 2003; Haggard, 2000). Thus, the regime found its policy options severely constrained, and inadequate to the task of promoting shared sacrifice and rapid recovery.
The economic crisis hit the poor through the dramatic increase in the price of rice and the immediate and widespread loss of jobs. While it is true that the crisis also hit the rich hard because their assets lost their value, the impact on poor and near-poor households across the nation was devastating because they lost
15
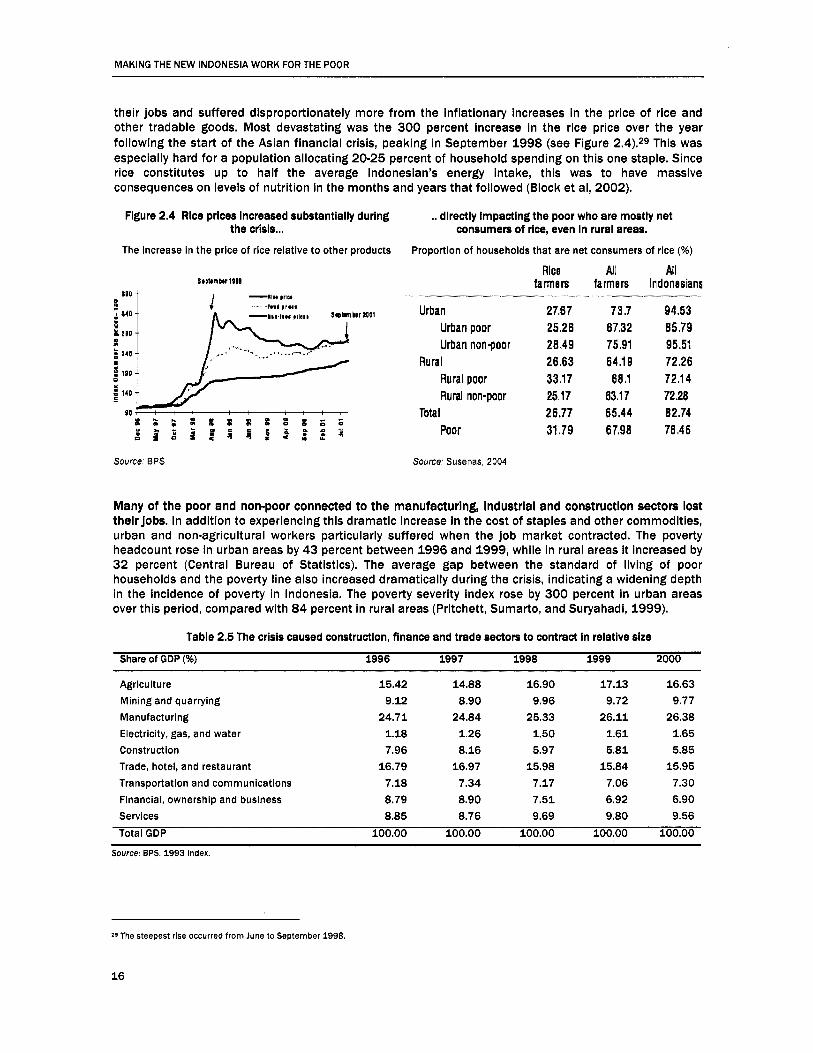
MAKING THE NEW INDONESIA WORK FOR THE POOR
their jobs and suffered disproportionately more from the inflationary increases in the price of rice and other tradable goods. Most devastating was the 300 percent increase in the rice price over the year following the start of the Asian financial crisis, peaking in September 1998 (see Figure 2.4).29 This was especially hard for a population allocating 20-25 percent of household spending on this one staple. Since rice constitutes up to half the average Indonesian’s energy intake, this was to have massive consequences on levels of nutrition in the months and years that followed (Block et ai, 2002).
Figure 2.4 Rlce prices Increased substantially during the crisis...
The increase In the price of rice relative to other products
.. dlrectly Impacting the poor who are mostly net consumers of rice, even in rural areas.
Proportion of households that are net consumers of rice (%)
Rlce All All Itpltrnbr 1 W farmers farmers Indonesians
~~ - - - ~ -I - I -IC4 PfIM n o t
P Urban 27.67 73.7 94.53 Urban poor 25,26 6732 85,79 Urban nonqoor 28.49 75,91 95.51
Ru ra I 26.63 64.19 72.26 Rural poor 33 .I 7 68.1 72.14 Rural non-poor 25.17 63.17 72.28
Total 26.77 65.44 82.74 I = ~ S X I L ~ Z L ~ = % a i i s ; s r s i ; 4 Poor 31,79 67,98 76,46
I rosi)rma*
Source: BPS Source: Susenas. 2004
Many of the poor and non-poor connected to the manufacturing, industrial and constructlon sectors lost their jobs. In addition to experiencing this dramatic increase in the cost of staples and other commodities, urban and non-agricultural workers particularly suffered when the job market contracted. The poverty headcount rose in urban areas by 43 percent between 1996 and 1999, while in rural areas it increased by 32 percent (Central Bureau of Statistics). The average gap between the standard of living of poor households and the poverty line also increased dramatically during the crisis, indicating a widening depth in the incidence of poverty in Indonesia. The poverty severity index rose by 300 percent in urban areas over this period, compared with 84 percent in rural areas (Pritchett, Sumarto, and Suryahadi, 1999).
Table 2.6 The crisis caused construction, finance and trade sectors to contract In relative size
Share of GDP (%) 1996 1997 1998 1999 2000
Agriculture 15.42 14.88 16.90 17.13 16.63 Mining and quarrying 9.12 8.90 9.96 9.72 9.77 Manufacturing 24.71 24.84 25.33 26.11 26.38 Electricity, gas, and water 1.18 1.26 1.50 1.61 1.65 Construction 7.96 8.16 5.97 5.81 5.85 Trade, hotel, and restaurant 16.79 16.97 15.98 15.84 15.95 Transportation and communications 7.18 7.34 7.17 7.06 7.30 Financial, ownership and business 8.79 8.90 7.51 6.92 6.90 Services 8.85 8.76 9.69 9.80 9.56 Total GDP 100.00 100.00 100.00 100.00 100.00
Source: BPS, 1993 index.
29 The steepest rise occurred from June to September 1998.
16

Chapter 2: A History of Growth and Poverty Reduction
The coplng strategies adopted by affected households In the Immediate postcrisis period resulted In many moving backwards along the pathways that had led them out of poverty. To lessen the blow of an urban, formal and modern sector crisis, many households affected by the crisis moved back, from urban to rural, from formal to informal, and from modern to traditional, non-farm to farm activities-a reversal of the structural transformation. This resulted in a significant change in the shape of the labor market. Detailed data (Annex 11.5) show that the rural and informal economy absorbed those retrenched from urban and formal jobs. The crisis resulted in sectors such as agriculture and manufacturing mushrooming in relative size and others, such as construction, finance and trade shrinking (see Table 2.5). The flexibility of the Indonesian labor market was a mixed blessing: while there was only a small increase in unemployment (see Table 2.6), high inflation rates led to a drastic fall in real wages of 27 percent.
Table 2.6 Real wages were eroded by inflatlon during the crlsls keeplng unemployment surprlslngly stable
1996 1997 1998 1999 2000 2001 2002
Real minimum wage (Rp) 311,444 324,204 235,127 225,756 279,416 323,650 372,851
Unemployment rate (%) 5.0 4.7 5.5 6.4 6.1 5.4 5.9
Source: World Bank Database, real wages are provided In constant 2002 prices. Unemployment figures take the Sakernas definition.
Households also cut back thelr spendlng, resulting In a significant Increase In malnutritlon. This had both long- and short-term impacts on human and household assets: health, education and savings. Part of the long-term impact of the crisis can be seen in the rising levels of malnutrition among children under five years of age. The malnutrition rate among these children followed a downward trend until 2000. Malnutrition in Indonesia reached a low of 23 percent in that year, but subsequently increased to almost 26 percent by 2003 (Block et al, 2OO2).30 The percentage of children who were severely m a l n ~ u r i s h e d ~ ~ has also increased in recent years, although the reversal of the downward trend occurred later, in 2001 (Abreu, 2005). Increasing malnutrition was also observed at the regional level, although the upward trend was steeper in some regions than in others (see Focus on Malnutrition in Chapter 5 on Public Spending). However, Susenas data indicate that while malnutrition continued to rise until 2003, the rate of increase has slowed and appears to have stagnated. Other data sources32 indicate that levels of malnutrition in rural areas leveled out in 2003, and even started to decline in urban areas in 2002-03.
During this economic contractlon the government developed and extended a number of formal safety net programs. The social safety net programs (laringan pengaaman social, or JPS), known until then for their patchy record, were extended to help protect the chronically and transitory poor from the impacts of the crisis. Initially, these crash programs were directed to urban areas throughout the country but were also intended to reach rural areas where harvest failures were causing great hardship. The JPS programs had four goals: (i) to ensure the poor could obtain food at affordable prices; (ii) to create employment; (iii) to preserve access to social services such as health and education; and (iv) to sustain local economic activity through regional block grants and small-scale credit programs (Sumarto et al, 2001). Evidence highlights the mixed effectiveness of the various programs (SMERU, 2004). While the scholarships program had a positive impact by keeping children in school, and the health-card program showed improved access of the poor to public health facilities, the Raskin (subsidized rice for the poor) program saw higher levels of capture by higher quintiles (see further discussion in Chapter 6 on Social Protection).
30 The data used in the study reported here are taken from the Core, Module and Yodium (survey of iodized salt consumption) components of the Susenas household survey. In order to ensure comparability over time, the provinces of Aceh, Maluku and Papua, for which a complete time series is unavailable, are excluded from the analysis. See Abreu (2005). The rise in malnutrition levels seems to have been caused by a combination of several effects, including the impact of changes in the relative prices of rice, cassava and cooking oil (a carryover from the depreciated real exchange rate after the crisis and government policy toward rice imports), and the presence of a cohort effect resulting from underweight children born during or just after the crisis of 1998. Not all this can be attributed to the crisis. Research has also shown that the use of infant feeding supplements as a substitute for breastfeeding, the incidence of which has Increased by almost 10 percent over the past few years, is associated with a significant increase in malnutrition levels, while the rate of utilization of Posyandu services, already in decline long before the reversal of the malnutrition trend, has no statistlcaliy significant effect on malnutrition levels. 3 1 Malnourished is defined as children whose weight-for-age is more than three standard devlatlons lower than the average for their reference group. 32 Data from Helen Keller International/lndonesia.
17

MAKING THE NEW INDONESIA WORK FOR THE POOR
VI Post-Crisis: Stabilization, Democracy and Decentralization
The key governmental response in Indonesia was not at the micro level, but at the macro level In the stablllzatlon of the economy. The government’s success in reinstating macroeconomic stability and, through the exchange rate, bringing down the relative price of rice, was critical to Indonesia rapidly reducing the poverty rate from its crisis spike of 23.4 percent in 1999 to 18.2 percent in 2002. The fall in the relative price of rice (index of rice prices over all food prices) from 1.43 to 1.08 over the period from September 1998 to September 2000 was a key factor driving the decline in poverty over that period. While the poverty headcount rates have come back to pre-crisis levels, studies also suggest there may be some lasting impacts from the crisis. Ravallion and Lokshin (2005) estimate that the headcount index would have been about half of what it was in 2002 had the crisis not taken place.
The crisls and recovery showed that the price of rice Is the most Important determinant of poverty at the household level In Indonesia. Macro price stability matters to the poor (Timmer, 2004). Rice prices are important for poverty alleviation, not only in terms of their short-term direct benefits on the poorest quintiles but also because they play a key role in the structural transformation of the agricultural sector and the economy as a whole. In agriculture, low rice prices encourage farmers to diversify crops by reducing the incentives to plant rice. The result is a move towards crops that give the poor higher profit margins. In Indonesia, artificially high rice prices have slowed down the crop diversification process, as well as discouraging investments in non-farm rural activities (Timmer, 2004).
Indonesia’s structural transformation has not yet restarted. Although output in industry and services bounced back after the crisis, employment growth since the crisis has been much slower than the pre- crisis rates. The structural transformation by which workers moved out of agriculture towards more productive employment in industry and services appears to still be on hold, with the share of workers in agriculture barely changing between 1999 and 2004 (see Annex 111.3).
Although the economic crisls was triggered by externalities, It exposed and unraveled the Inherent weaknesses of the institutional and political structures In the country and resulted in structural change unprecedented in Indonesia’s history. In early 1997, although Indonesia had prospered to a level commensurate with its neighbors and sustained growth rates over 7 percent, many argued that this success was fragile because the institutions were fragile (Hofman et ai, 2004). When the economic crisis hit in 1997, the collapse of the rupiah caused the withdrawal of foreign investment, the loss of tens of thousands of jobs overnight, and an increase in the poverty headcount to almost 25 percent. An economic crisis became a political crisis that would transform one of the largest authoritarian political systems in the world. The 32-year economically powerful but increasingly oppressive rule of Soeharto ended just eight months later. The enormity of the transition that followed the exchange rate collapse and the subsequent progress in the eight years of reformasi has been remarkable: the constitutional amendment making way for democratic legislative elections in 2001, the removal of the military from parliament, and the country’s first ever direct presidential election in 2004. Despite inherent weaknesses (see Chapter 7 on Government) by and large the households that emerged from poverty following the crisis did so in a democratic country with a new openness and freedom for all.
This rapid political change was accompanied by one of the biggest ‘big-bang’ decentralizations in the world. By mid-1998, the growing discontent in the regions drew further attention to the imbalance of power between Jakarta and the thousands of islands off-Java. With secessionist sentiments already strong in several provinces, the new postdoeharto leaders feared provincial power would lead to national disintegration. In order to defuse the growing tensions, the ruling administration decentralized power down to the kabupaten level, empowering 292 districts in 1999.33 Although drafted in haste and lacking important details, the Regional Autonomy and the Fiscal Balancing Laws came into effect in 2001, and were subsequently amended in 2004.34 Together with the country’s rapid democratization, this devolution of responsibility for basic services resulted in a much more complex story of economic recovery-and the impacts on the poor-than that told in other East Asian states.
33 The number of districts subsequently increased to 336 in 2001 and 434 by 2004. Source: Bastian Zaini, World Bank Decentralization Team. 34 Regional Autonomy Law No. 22/1999 and the Fiscal Balancing Law No. 25/1999 which was amended by Fiscal Balancing Law No. 33/2004.
18

Chapter 2: A History of Growth and Poverty Reduction
Box 2.1 Indonesla’s electlons and the consolidation of democracy Before 1999, Indonesians went to the polls every five years to elect members of the national parllament (DPR) and the People’s Consultative Assembly (MPR), the latter of which in turn elected a president and vicepresldent. This was not accompanied with any expectatlon that by casting a vote Indonesians could effect any real change in the way their country was governed. The system was not designed to allow for any real opposition to President Soeharto or the ruling Golkar party. Opposition parties were interfered with and co-opted by the government; government policies and programs could be criticized only warily and indirectly; and, the president could not be criticized at all. However, elections did matter to Soeharto: they helped to mobilize the public to give the appearance of support for government policies, and also created a channel for a limited form of public participatlon, albeit highly choreographed, in Indonesia’s political process.
The 1999 general election was the first ‘free-and-fair’ election in Indonesia since the early 1970s. With the euphoria of reformasi and the convening of a new parliament, Abdurrahman Wahid, a prominent Muslim cleric, was elected president by the MPR in October 1999, with Megawati Soekarnoputri as his vice-president. President Wahid continued to pursue the path of democratization. However, in 2000, under growing pressure from parliamentarians and student demonstrators, and against of background of continuing economlc strife and violent clashes in Maluku, Poso and Central Kalimantan, President Wahid issued a presidential decree allowing hls vice-president to take over more responsibility in an effort to improve the day-to-day management of the government. But this failed to mitigate the mountlng pressure on the president. Wahid’s position was further undermlned by allegations of corruption. Finally, in 2001, parliament used these allegations of corruption as a means to bring about a vote of no confidence in Wahid, engineerlng Wahid’s ouster and his replacement as president by Megawati in July 2001.
By 2003, the pace of democratization and decentralization quickened with the passage of important electoral and decentralization laws, conceived in the wake of Soeharto’s reslgnatlon in 1998. In April 2004, Indonesians participated in their second ‘free-and-fair’ general election to elect representatives to a new parliament. As mandated by the decentralization law, local governments would also be elected instead of appointed by the central government. Later, in July, the world witnessed the largest one-day election ever as Indonesians participated in the country’s first direct presidential election. Susiio Bambang Yudhoyono, a former general and minister for security In Megawati’s cabinet, won the presidency by a landslide and was inaugurated in October 2004.
Although natlonal pollcy-makers and local declslon-makers are now accountable in a way they have never been before, decentralization poses a challenge for economic management and poverty reduction. The decentralization legislation also established new social and political space for civil society, mandating that village governance support participation and autonomy. This reform has created enormous opportunities for local initiatives in tackling local problems, and designing development strategies that best meet local needs-but it has also led to policy uncertainty. Many districts lacked capacity and revenue and, consequently, this decentralization-in theory political, fiscal and administrativewas in practice fraught with inconsistencies and blockages. Much of the decentralization business was left undone: districts inherited responsibility for the delivery of health and education services without clarity on roles for some of the key functions of government; fiscal decentralization created an imbalance between resource-rich and resource-poor districts; and the immaturity of Indonesia’s civil society and local governments (now responsible for key poverty reduction functions) pose new challenges for the country.
VI1 Conclusion: Learning from History to Support Poverty Reduction
Indonesia’s hlstory sheds much light on what has worked to reduce poverty In the past. These lessons can be used when looking to a strategy for poverty reduction going forward. At the same time, it is important to be highly cognizant of the fact that much has changed in Indonesia, both structurally and institutionally. In particular, Indonesia now has a deepening and strengthening democratic process. In addition, development processes today must work in the context of decentralization. Moreover, the structural nature of the Indonesian economy, the global economy and Indonesia’s relationship to it, have all changed. Related, to some extent the nature of poverty is also somewhat different today than in the past, as will be discussed in the next chapter. Nevertheless, the history of poverty reduction in Indonesia
19

MAKING THE NEW INDONESIA WORK FOR THE POOR
provides important guidance for poverty reduction efforts going forward and the lessons motivate the framework of this report.
First, Indonesia’s record shows what a drivlng force for poverty reduction growth can be when It works for the poor. Indonesia’s success is in poverty reduction over the past three decades was because: (i) it engendered so much growth; and (ii) it made this growth ‘work for the poor’. Critical in this regard, as discussed, was a macroeconomic and liberalized trade and exchange framework that allowed the poor to benefit from world prices while also benefiting from macrostability (i.e. generally stable prices and low inflation). Furthermore, the poor in Indonesia benefited greatly from measures that specifically ensured that the sectors that the poor worked in were engines for the growth process. In agriculture this was enhanced through investment in rural infrastructure and agricultural technology (in the form of more productive rice varieties) and exchange and trade policies that fostered higher incomes from cash crops. In manufactured exports this was enhanced again through a competitive exchange rate and liberal labor market policies that allowed Indonesia to hire labor to manufacture products that could be competitively exported. An issue of concern going forward is that Indonesia’s overall growth rate has slowed. Moreover, the extent to which the growth rate is ‘pro-poor’ has deteriorated after the crisis. What must be done to reignite growth that benefits the poor going forward, learning lessons from the past?
Second, Indonesia’s record shows that wlsely channellng enhanced spending into efforts and programs that benefit the poor is key to poverty reduction. History shows that this is one of the ways through which growth was made more pro-poor: increased public revenues from growth were channeled into public spending that supported service delivery, as well as being a handmaiden to the growth process itself. One important example that Indonesia presents to the rest of the world is the way in which it used its oil windfall in the 1970s and 1980s to support service delivery and growth itself by investing in things that mattered to the poor: rural infrastructure, including roads; and public services, especially in rural areas, including health and education facilities. Big money was spent to expand the networks of road, health and education infrastructure. Now the challenge may shift more towards how to maintain this infrastructure and enhance the ‘software’ to deliver services. Here, Indonesia faces a challenge. Indicators of service delivery-as evidenced by outcome indicators such as maternal mortality, junior secondary school enrollment, and even malnutritiolF-are lagging. But Indonesia also is fortuitous in being presented with a fiscal opportunity: the past couple of years have brought with them another oil windfall. How can Indonesia make’enhanced public spending work better for the poor to foster growth and service delivery?
Third, Indonesia’s experience with the shock of the economic crisis shows more than ever the need to make soclai protection work for the poor. The poor and near-poor in Indonesia are particularly vulnerable to price and other shocks given the income distribution profile in Indonesia. (The nature of this vulnerability is explored more fully in the Chapter 4 on Growth and in Chapter 6 on Social Protection.) Nothing exemplified this vulnerability more than the economic crisis in 1998. Several lessons are to be learned from that experience. For one, poverty rates in Indonesia were able to recover much faster than some neighboring Asian countries in large part due to macroeconomic and factor market policies. Macroeconomic stabilization efforts that were able to reduce inflation and the price of the main food commodity were critical to protecting the poor. So too were labor markets and wages that were flexible enough at that time to prevent further unemployment. Specific social protection programs were rapidly put in place after the crisis. Some may argue that they were too little, too late, although there is evidence that they helped mitigate some of the social costs. Moreover, since the crisis, many of these programs have shut down. The lesson, if any, is that given the high vulnerability of the poor, it makes sense for the government not only to put in a well-organized social protection system to protect the poor from the annual shocks they tend to suffer, but also to be ready for any future crises, whether these be economic, natural disasters, or otherwise. So a key question is: how should Indonesia go forward in making social protection work for the poor?
Fourth, Indonesla’s past experience shows that it has to make government work for the poor. The historical record here is mixed at best. On one hand, history reinforces the point that a strong central government fully committed to policies that reduce poverty and with the technical capacity to formulate and implement these policies can be key to poverty reduction. On the other hand, history also tells the story of how weak accountability and institutional capacity to deliver services+md not investing in such capacity--can itself undermine development. indeed, poor governance at the very highest levels of
20

Chapter 2: A History of Growth and Poverty Reduction
government, as well as at lower levels of government, can cause a collapse in the entire development effort, as witnessed during the political crisis in 1998. Moreover, weak accountability, capacity, and institutions at all levels of government make the task of ‘delivering on poverty reduction’-whether it be through growth, spending, social protection-extremely difficult. In this regard, history was not so beneficial for Indonesia. Far from being left with strong and accountable institutions and an effective civil service, after the crisis Indonesia has had to contend with strengthening these systems for poverty reduction. Decentralization certainly enhances the opportunity to improve government’s ability to deliver on poverty reduction by moving decision-making power closer to citizens and allowing efforts to be tailored to regional issues. But, at least initially, decentralization also makes the task more complex and Indonesia is still working on sorting out the specifics of its decentralization framework. So, a key question for poverty reduction then is: how can Indonesia better make government work for the poor?
21


Chapter 3 Understanding Poverty in Indonesia

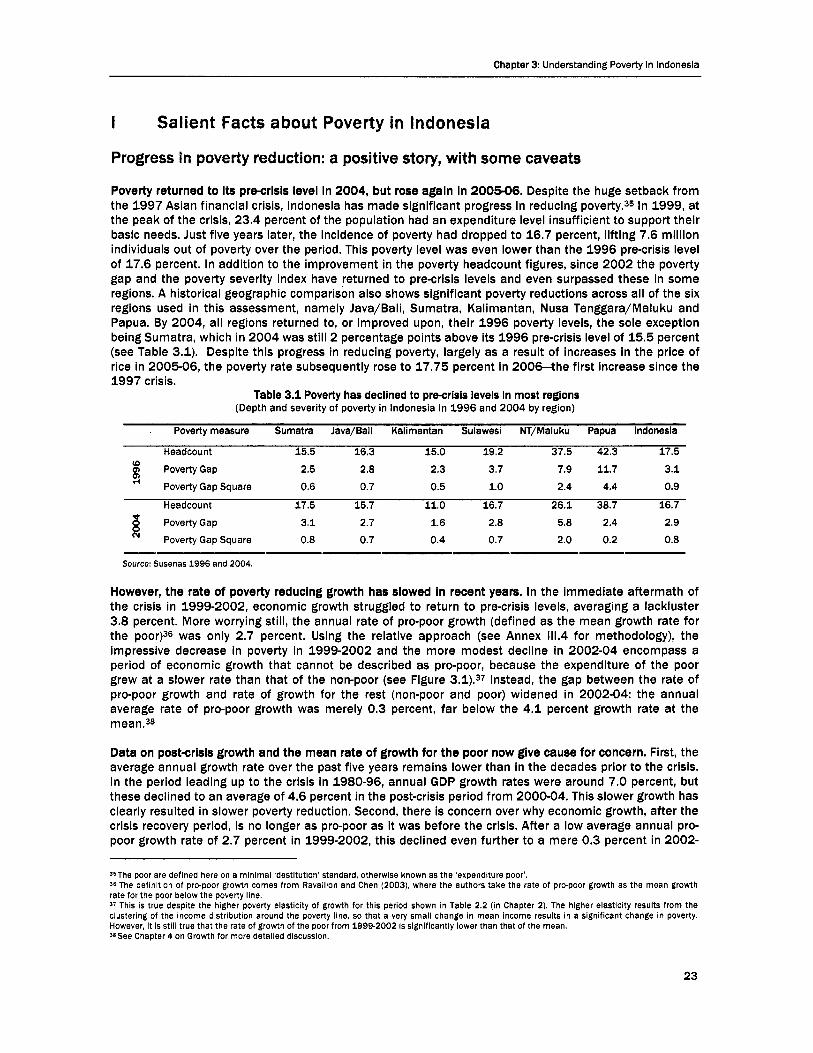
Chapter 3: Understanding Poverty in Indonesia
I Salient Facts about Poverty in Indonesia
Progress in poverty reduction: a positive story, with some caveats
Poverty returned to Its precrisls level In 2004, but rose agaln In 200506. Despite the huge setback from the 1997 Asian financial crisis, Indonesia has made significant progress in reducing poverty.35 In 1999, at the peak of the crisis, 23.4 percent of the population had an expenditure level insufficient to support their basic needs. Just five years later, the incidence of poverty had dropped to 16.7 percent, lifting 7.6 million individuals out of poverty over the period. This poverty level was even lower than the 1996 pre-crisis level of 17.6 percent. In addition to the improvement in the poverty headcount figures, since 2002 the poverty gap and the poverty severity index have returned to pre-crisis levels and even surpassed these in some regions. A historical geographic comparison also shows significant poverty reductions across all of the six regions used in this assessment, namely Java/Bali, Sumatra, Kalimantan, Nusa Tenggara/Maluku and Papua. By 2004, all regions returned to, or improved upon, their 1996 poverty levels, the sole exception being Sumatra, which in 2004 was still 2 percentage points above its 1996 pre-crisis level of 15.5 percent (see Table 3.1). Despite this progress in reducing poverty, largely as a result of increases in the price of rice in 2005-06, the poverty rate subsequently rose to 17.75 percent in 20064he first increase since the 1997 crisis.
Table 3.1 Poverty has declined to precrisls levels In most regions (Depth and severity of poverty in Indonesia in 1996 and 2004 by region)
Poverty measure Sumatra Java/Bail Kalimantan Sulawesl NT/Maluku Papua indonerla
Headcount 15.5 16.3 15.0 19.2 37.5 42.3 17.5 2.5 2.8 2.3 3.7 7.9 11.7 3.1
Poverty Gap Square 0.6 0.7 0.5 1.0 2.4 4.4 0.9
(0 0) PovertyGap
Headcount 17.5 15.7 11.0 16.7 26.1 38.7 16.7 PovertyGap 3.1 2.7 1.6 2.8 5.8 2.4 2.9 Poverty Gap Square 0.8 0.7 0.4 0.7 2.0 0.2 0.8 N
Source: Susenas 1996 and 2004.
However, the rate of poverty reducing growth has slowed In recent years. In the immediate aftermath of the crisis in 1999-2002, economic growth struggled to return to pre-crisis levels, averaging a lackluster 3.8 percent. More worrying still, the annual rate of pro-poor growth (defined as the mean growth rate for the poorp6 was only 2.7 percent. Using the relative approach (see Annex 111.4 for methodology), the impressive decrease in poverty in 1999-2002 and the more modest decline in 2002-04 encompass a period of economic growth that cannot be described as pro-poor, because the expenditure of the poor grew at a slower rate than that of the non-poor (see Figure 3.1).37 Instead, the gap between the rate of pro-poor growth and rate of growth for the rest (non-poor and poor) widened in 2002-04: the annual average rate of pro-poor growth was merely 0.3 percent, far below the 4.1 percent growth rate at the mean.38
Data on post-crlsls growth and the mean rate of growth for the poor now give cause for concern. First, the average annual growth rate over the past five years remains lower than in the decades prior to the crisis. In the period leading up to the crisis in 1980-96, annual GDP growth rates were around 7.0 percent, but these declined to an average of 4.6 percent in the post-crisis period from 2000-04. This slower growth has clearly resulted in slower poverty reduction. Second, there is concern over why economic growth, after the crisis recovery period, is no longer as pro-poor as it was before the crisis. After a low average annual pro- poor growth rate of 2.7 percent in 1999-2002, this declined even further to a mere 0.3 percent in 2002-
3sThe poor are defined here on a minimal 'destitution' standard, otherwise known as the 'expenditure poor'. 36 The definition of prc-poor growth comes from Ravailion and Chen (2003), where the authors take the rate of prc-poor growth as the mean growth rate for the poor below the poverty line. 37 This is true despite the higher poverty elasticity of growth for this period shown in Table 2.2 (in Chapter 2). The higher elasticity results from the clustering of the income distribution around the poverty line, so that a very small change in mean income resuits in a significant change in poverty. However, it is still true that the rate of growth of the poor from 1999-2002 is significantly lower than that of the mean. 38See Chapter 4 on Growth for more detailed discussion.
23

MAKING THE NEW INDONESIA WORK FOR THE POOR
04 (see Figure 3.1). Third, rural areas have increasingly lagged behind urban areas over this period and the mean growth rate for the poor has been considerably higher in urban areas than in rural areas. In 2002-04, the average annual urban growth rate for the poor was 1.4 percent, fully ten times that experienced in rural areas (Alatas and Tuhiman, 2005).
Figure 3.1 Growth has become less prepoor over time39
1 0 1 2 0 0 2 4 4 1
The near-poor and vulnerability: significant aspects of the poverty story
As many as 42 percent of all Indonesians live between the US$& and USP-a-day poverty lines. This is one of the remarkable and defining aspects of the poverty story in Indonesia. Income distribution (see Figure 3.2) shows how densely clustered the population is around three poverty lines: US$l-a-day; US$2-a- day; and the national poverty line (about US$1.55a-day). (Box 3.1 explains the significance and methodology of these poverty lines, and the poverty measures derived from them.) The level of extreme poverty (defined as below US$l-a-day) is relatively low, even by regional standards, at 7.4 percent. However, the proportion of the population earning less than US$a-a-day stands at a huge 49.0 percent.40
While Indonesia has recently crossed the threshold to become a middle-Income country, the share of its population under US$2-aday Is closer to lower-Income Countries In the region. At 49.0 percent, the population under US$2-a-day is high relative to the comparable average for the East Asia region (including China), at 34 percent. By this measure, the share of poor under US$2-a-day in Indonesia is closer to that found in the lower-income East Asian countries. The average for Cambodia, Laos, Papua New Guinea and Vietnam stands at 53.8 percent.
3BGrowth incidence curves show how much growth has impacted the poor. The more negatively sloping the growth incidence curve, the more the poor benefit from growth. The more upward sloping the curve, the more growth accrues to the rich. in the graphs shown in the period 1980-1996, growth was beneficial to the very poor, as well as the very rich. During the crisis, the rich lost out more than the poor. Worryingly, however, the period 2002- 2004 is far more pro-rich in terms of the benefits from growth than any of the previous periods. The line passing through the middle of each graph shows the growth date of mean per capita expenditures (whlch are: 6.42 percent in 1980-96, -4.46 percent in 1996-99, 3.8 percent in 1999-2002 and 4.1 percent in 2002-04. 4oThe U S 1 and U S 2 PPP poverty statistics for Indonesia and other East Asia Pacific countries cited in this section are taken from the April 2005 East Asia Update.
24
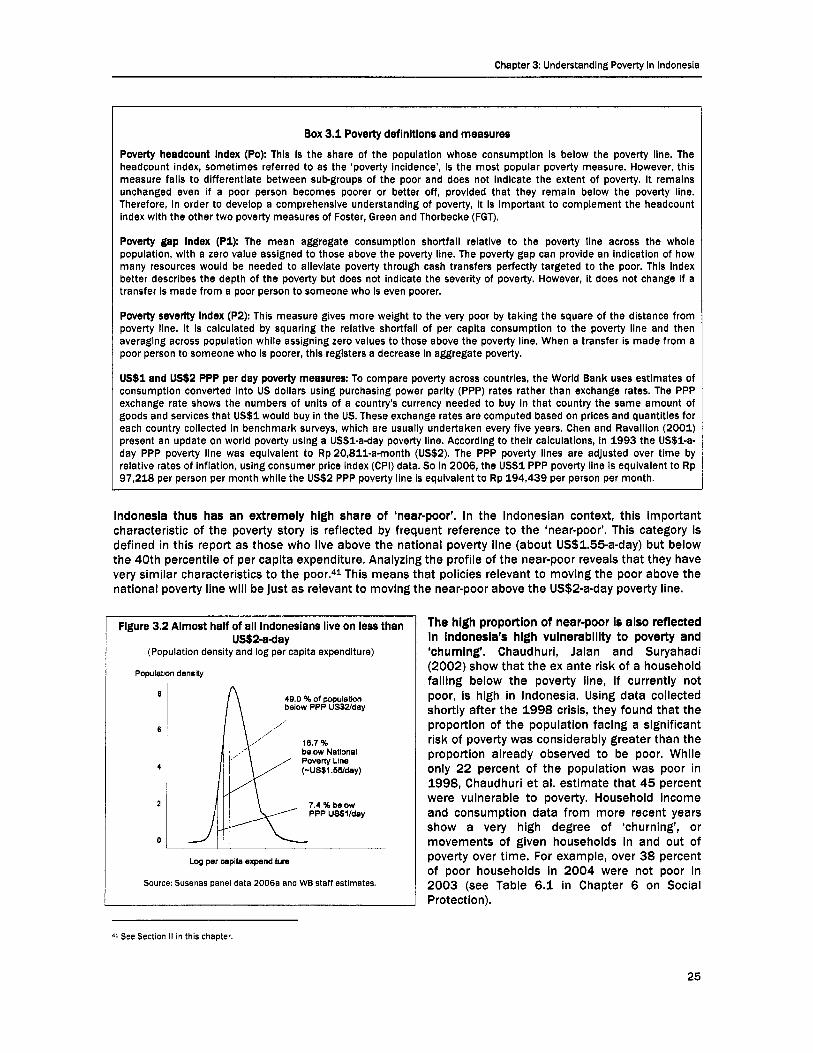
Chapter 3: Understanding Poverty in Indonesia
Box 3.1 Poverty definitions and measures Poverty headcount Index (Po): This is the share of the population whose consumption is below the poverty line. The headcount index, sometimes referred to as the ‘poverty incidence’, is the most popular poverty measure. However, this measure fails to differentiate between subgroups of the poor and does not Indicate the extent of poverty. It remains unchanged even if a poor person becomes poorer or better off, provided that they remain below the poverty line. Therefore, in order to develop a comprehensive understanding of poverty, it is important to complement the headcount index with the other two poverty measures of Foster, Green and Thorbecke (FGT).
Poverty gap index (Pi): The mean aggregate consumption shortfall relative to the poverty line across the whole population, with a zero value assigned t o those above the poverty Ilne. The poverty gap can provide an indication of how many resources would be needed to alleviate poverty through cash transfers perfectly targeted to the poor. This index better describes the depth of the poverty but does not indicate the severity of poverty. However, it does not change if a transfer is made from a poor person to someone who is even poorer.
Poverty severity Index (P2): This measure gives more weight to the very poor by taking the square of the distance from poverty line. It is calculated by squaring the relative shortfall of per capita consumption to the poverty line and then averaging across population while assigning zero values to those above the poverty line. When a transfer is made from a poor person to someone who is poorer, this registers a decrease in aggregate poverty.
US$I and U s 2 PPP per day poverty measures: To compare poverty across countries, the World Bank uses estimates of consumption converted into US dollars using purchasing power parity (PPP) rates rather than exchange rates. The PPP exchange rate shows the numbers of units of a country’s currency needed to buy In that country the same amount of goods and services that US$1 would buy in the US. These exchange rates are computed based on prices and quantities for each country collected In benchmark surveys, which are usually undertaken every five years. Chen and Ravallion (2001) present an update on world poverty using a US$1-a-day poverty line. According to their calculations, in 1993 the US$l-a- day PPP poverty line was equivalent to Rp20,811-a-month (US$2). The PPP poverty lines are adjusted over time by relative rates of inflation, using consumer price index (CPI) data. So In 2006, the U S 1 PPP poverty line Is equivalent to Rp 97,218 per person per month while the US$2 PPP poverty line is equivalent to Rp 194,439 per person per month.
Indonesia thus has an extremely high share of ‘near-poor’. In the Indonesian context, this important characteristic of the poverty story is reflected by frequent reference to the ‘near-poor’. This category is defined in this report as those who live above the national poverty line (about US$1.55a-day) but below the 40th percentile of per capita expenditure. Analyzing the profile of the near-poor reveals that they have very similar characteristics to the poor.41 This means that policies relevant to moving the poor above the national poverty line will be just as relevant to moving the near-poor above the US$2-a-day poverty line.
Flgure 3.2 Almost half of all Indonesians live on less than US2-aday
(Population density and log per capita expenditure)
Powlabon densty
49.0 % of population below PPP US$llday
below National Poverty Line ( -US1 .Ss/day)
7.4 %below PPP uSJi/day
Log per capita expenditure
Source: Susenas panel data 2006a and WB staff estimates.
The high proportion of near-poor Is also reflected in Indonesia’s high vulnerabll[ty to poverty and ’churning’. Chaudhuri, Jalan and Suryahadi (2002) show that the ex ante risk of a household falling below the poverty line, if currently not poor, is high in Indonesia. Using data collected shortly after the 1998 crisis, they found that the proportion of the population facing a significant risk of poverty was considerably greater than the proportion already observed to be poor. While only 22 percent of the population was poor in 1998, Chaudhuri et ai. estimate that 45 percent were vulnerable to poverty. Household income and consumption data from more recent years show a very high degree of ‘churning’, or movements of given households in and out of poverty over time. For example, over 38 percent of poor households in 2004 were not poor in 2003 (see Table 6.1 in Chapter 6 on Social Protection).
41 See Section It in this chapter
25

Recent Developments
Why did poverty increase from 2005 to 20061
On September 1 2006, the Central Bureau of Statistics (BPS) announced that the poverty rate in Indonesia had risen to 17.75 percent in March 2006, up from 16.0 percent in February 2005. In what was the first recorded increase in poverty incidence since the economic crisis, this meant that an additional 4 million people fell into poverty during the period. How did such an increase come about? Economic growth during the period was 5.2 percent, not very different from the previous two years (5.6 percent and 4.4 percent, respectively) during which poverty fell continuously. If the increase in poverty cannot be explained through changes in growth patterns, other events must have affected relative income distribution in such a way as to hurt the poor more than other groups.
The 200506 period witnessed several events likely to have impacted poverty. The fuel subsidy reduction in October 2005 increased fuel prices by 114 percent overall and tripled the price of kerosene. Meanwhile, rice prices rose dramatically (33 percent) between February 2005 and March 2006. While the increase in fuel prices would have had a limited direct impact on the poor, the large increase in kerosene and rice prices undoubtedly had a larger negative effect. Conversely, the unconditional cash transfer (UCT) program, which provided cash targeted to 19.2 million poor and near-poor households, was introduced to soften the blow. This is the world's largest ever cash transfer program targeting some 34 percent of the populatiorr-well in excess of the number of poor households in the population-with each beneficiary family receiving about US$11 per month.
World Bank analysis indicates the impact of the fuel price increase is unlikely to have been the main driver behind the poverty increase. It is estimated that in the absence of the UCT, the fuel price increase would have reduced the welfare of the poor and near-poor by some 5 percent and increased poverty substantially because of the tripling of kerosene price and the overall inflationary percent of poverty line would have more than offset the negative impact of the fuel price increase for those among the poor who received it. The overall impact depends on the targeting performance of the cash transfer program. Simulations of the combined effect of the UCT and fuel price increase point to a positive net income gain for the poorest two deciles (see Figure 6. ld in Chapter 6 on Social Protection). The preliminary analysis of the UCT targeting (see Figure 6.3) suggests that the actual targeting was between Scenario 2 (slight mistargeting) and Scenario 3 (greater mistargeting). Both scenarios pointed towards net income gains for the poor. Even assuming significant mistargeting, the lower deciles were, on average, more than compensated for the fuel price increase^.^^
This means, then, that the increase in the rice price by 33 percent between February 2005 and March 2006-mostly due to shortages as a result of the ban on rice imports-is the main factor behind the increase in poverty rates. Rice plays an important role, as it makes up about 25 percent of the consumption basket of the poor. Moreover, three-fourths of the poor are net consumers of rice. Thus rice price increases hurt far more people than they help. Moreover, the World Bank estimates that most of the increase in poverty is attributable to the rice price increase.
With rice prices still on an upward trend and the UCT program drawing to an end, poverty rates may well increase again next year. The loss of the UCT will be a major income loss for the poor who receive it, while the conditional cash transfer (CCT) program to be piloted next year will be too small to offset the impact of the ending of the UCT. The immediate impact of plans to upscale the national community empowerment program on poverty will also be limited. In order to reduce poverty in the short run the government might consider both continuing with a scaled-down version of the UCT program, and (ii) adopting a rice policy that promotes stabilized rice prices at international levels.
42 Although on average the scenarios point to a positive net income gain, the actual impact depends on the level of expenditure of the recipients. When Susenas 2006 data become available, we will need to conduct further studies to fully decompose the change in poverty incidence.
26

MAKING THE NEW INDONESIA WORK FOR THE POOR
Counting the poor in Indonesia
In estimating poverty incidence, we require data on welfare measures and poverty line estimates. In Indonesia, the welfare measure used is that of per capita consumption. Households having a per capita consumption below the poverty line are considered poor. The poverty line is usually anchored to the notion of a minimum calorific intake to fulfill nutritional requirement, usually set at 2,100 calories.
Household consumption is obtained from the Susenas consumption survey. This module collects data on quantities and expenditure for 218 food items, and expenditure for 109 non-food items. Previously, official poverty estimates could only be calculated once every three years, when the consumption module was administered to around 60,000 households across the country. Since the start of the Susenas panel survey, which administers the consumption module to a nationally representative sample of around 10,000 households, national poverty statistics have been updated yearly.
The most difficult issue in counting the poor is deciding at which level to set the poverty line, and how to update it over time so that it reflects the same level of welfare. The poverty line used by BPS has two components: one for food and one for non-food items. Both the food and non-food components of the poverty line boil down to costing a bundle of basic minimum needs. This is done for each province separately, by urban and rural areas, to account for differences in consumption patterns.
There are two main methods in computing a poverty line in developing countries: the ‘food energy intake’ and the ‘cost of basic needs’ methods. BPS uses an adaptation of the food energy intake method to obtain the food poverty line. The chart below summarizes the method. In setting its national poverty line, BPS proceeded as follows: (i) It defined the reference group as the 20 percent of the population with a per capita consumption just above the first round estimate of the poverty line (denoted by z in the figure). The first round estimate of the poverty line is obtained by multiplying last year’s poverty line by the rate of inflation over the previous year. (ii) Average expenditure on, and calories obtained from, 52 of the most common food items are calculated for each household in a reference group. Dividing these two and averaging over all households in the reference group provides us with an average cost per calorie. This is multiplied by 2,100 to obtain the food poverty line (denoted by FPL in the chart). (iii) The non-food component of the poverty line is obtained by multiplying the sum of actual expenditure on 32 non-food items in the reference group by a correction factor. The factors are unique for each commodity and remain the same from one year to the next.
Consumption of 2,100 calories per person per day is a standard norm for caloric needs.
Consumption of 2,100 calories per person per day 1s a standard norm for caloric needs. Calories obtained from
5 2 food items
Expenditures on 5 2 food items
The method used by BPS contains several flaws. First, the bundle changes over time and across regions, both for the food and non-food poverty line. It is therefore not guaranteed that the bundle of goods
27

Recent Developments
reflects the same welfare level. Food energy intake does not take into consideration changes in tastes, activity levels, relative prices or publicly provided goods that can affect the relationship between food energy intake and total consumption expenditure. For example, taste differences could result in a higher food poverty line for regions where the poor tend to consume high cost per calorie foodstuffs (Wodon, 1997; Ravallion and Lokshin, 2003). Second, the bundle of goods that is used for the poverty line corresponds more to the typical expenditure of those above the poverty line, not of the poor. It would be better to use a reference group that reflects the actual consumption patterns of the poor. Poverty lines are quite sensitive to the choice of reference group (Pradhan et al, 2001) and using wealthier reference groups generally results in a higher poverty lines. Third, the sample size of the 10,000 Susenas panel makes setting the poverty line separately for each province very sensitive to outliers. On average, there are only around 33 households in the reference group for each region. Since not every household consumes every item included in the bundle, the poverty line may be based on actual consumption of just a few households.
BPS could consider adopting a ‘cost of basic needs’ method to measure poverty. This method fixes the bundle of goods across regions and time to set the poverty line. Only the prices are allowed to change to correct for regional price differences and inflation. The advantage of this method is that it guarantees that the poverty line is always sufficient to purchase the same bundle of goods and, thus, is sufficient to attain the same level of welfare. The bundle of goods can be updated periodically to reflect changes in consumption patterns, but should remain the same when doing comparisons of poverty over time.
Non-income poverty: indicators show persisting problems
Indonesia has achieved remarkable progress In key human development indicators. Chapter 2 described the history of how Indonesia adopted policies that allowed the country to make remarkable progress in a number of key aspects of human development. Progress in some key indicators was significant and noteworthy.
0 Improved educational attainment, particularly in primary schools. A child born in 1940 had only a 60 percent chance of attending any school, a 40 percent chance of completing primary school, and a mere a 15 percent chance of completing junior secondary school. In contrast, over 90 percent of children born in 1980 completed primary school and about 60 percent completed junior secondary school. Figure 3.3.a clearly shows younger cohorts are better educated. The mean educational attainment of the 1980 birth cohort is about 9.5 years of schooling, 2.4 times higher than the 1940 cohort. In 1996, around one-third of the population had not completed primary school. Eight years on, this proportion has fallen only 24 percent. The average number of years of schooling in the working- age population increased by 23 percent during the same eight-year period, from 6.7 to 8.25 years.
Improved basic healthcare coverage, particularly in birth attendance and immunization. In 1989, the government began hiring trained midwives and placing them in rural villages-an initiative subsequently formalized as the Village Midwife (bidan di desa) Program. By the end of 1994, over 50,000 midwives had been placed in villages (Parker and Roestam, 2002). Among communities surveyed in the Indonesian Family Life Survey (IFLS), the share of communities with a midwife increased from less than 10 percent in 1993 to almost 46 percent by 1997 (Frankenberg et al, 2004). By 2002, almost half of all births in rural areas were attended by a village midwife (Badan Pusat Statistik and ORC Macro, 2003). A focus on basic healthcare is also reflected in improvements in vaccination rates. While fewer than 20 percent of 12 to 23 month old children had received their first DPT vaccination in 1980, close to 90 percent were covered by 2004. However, despite this progress, polio is recurring in some areas.
0 Dramatic reductions In child mortality. As Figure 3.4 shows, Indonesia’s under-five child mortality rate was extremely high at over 200 per thousand in 1960, more than double the rate in the Philippines and Thailand at that time. But, by 2005, Indonesia had brought its child mortality rate down to less than 50. While still slightly higher than its regional peers, this was one of the fastest declines in the region.
28

Recent Developments
However, there are other human development lndlcators In whlch Indonesia Is seriously lagging and where speclal attentlon Is required. Despite solid policy-driven achievements in some areas, Indonesia will need to focus intense efforts on other indicators in which the country lags behind if it is to achieve progress. These include the transition rate from primary to secondary school, child malnutrition, maternal mortality, and access to safe water and sanitation. (See Focus Boxes in Chapter 5 on Public Spending, which discuss several of these poor outcomes in more detail, including specific policy interventions that could help Indonesia succeed in addressing them.)
0 Transition rates from primary to secondary school are low, particularly among the poor. Since the economic crisis, improvements in net junior secondary school enrollment rates have slowed. Net enrollment increased by 16 percent from 1992 to 1997 (Figure 3.3.b), but in the five years following 1997 net enrollment increased by only 4 percent.43 Even worse, many children, particularly poor children, are dropping out after primary school. Among 16 to 18 year olds from the poorest quintile, only 55 percent completed junior secondary school, compared with 89 percent from the richest quintile from the same cohort. A closer look at the data reveals that the rise in junior secondary school net enrollment since 2001 is due to more children who have completed class level one in junior secondary school continuing on to attend levels two and three. Therefore, the apparent improvement is not in fact due to an improved transition rate between primary and junior secondary school.
Figure 3.3 Trends In educational attainment In Indonesia a. Younger cohorts are better educated b. Net junior secondary school enrollment shows a steady
Increase
c. But average educational attainment can hide d. And the poor struggle to make transition to secondary differences by region or expenditure group
* NearPoor . Poor
Non Poor
Source: Susenas, 2004.
propor l l on 1
0 8
0 6
0 4
0 2
0
- r i c h e s t q u i n t i l o
- q u i n t i l e 4 q u i n t i l e 3
-quinti l, 2 c --poorest qu in l l le
1 4 7 10 g r a d 8
45 Recently. net enrollment has picked up agaln and an extrapolation of recent trends indicates that it is now growing at about 8 percent for the Current five-year period (using data from the 2002-04 period).
29

Recent Development
0 Malnutrltlon rates are worrylngly high and have only recently stopped rlslng. Malnutrition is high for a country with Indonesia’s overall level of health, with more than one-quarter of all children under the age of five being malnourished using the weight-for-age measure (see Figure 3.5). By comparison, the malnutrition rate is 18 percent in Malaysia. While Indonesia’s under-five mortality rate is about one- third of Cambodia’s, Indonesia’s percentage of malnourished children is only about 20 percent lower than the Cambodian level (Susenas, 2004). Moreover, in view of the steady improvement in living standards in Indonesia, it is all the more surprising that child malnutrition rates have increased slightly in recent years. The malnutrition rate among children under the age of five followed a downward trend similar to that in poverty levels until 2000, reaching a low of 23 percent in that year, but then started to rise. Although there appears to have since been a levelling-out of the increase, malnutrition rose to almost 26 percent by 2003.4 Data sources other than Susenas indicate that malnutrition may have started to decline once again.
0 Indonesia’s maternal mortality rate Is high, much hlgher than other comparable countrles In the reglon. The risk of maternal death during, or shortly after, delivery is significant in Indonesia. The Figure 3.4 Under-five mortality since 1960:
the fastest decline In the region Figure 3.5 But today Indonesia has a high and stagnating
child malnutrition rate (Trends in child malnutrition in Indonesia)
Source: Making Services Work for the Poor In Indonesia, World Bank 2005. Under-five mortality data comes from WHO/UNICEF Joint Reporting Forum on Vaccine Preventable Diseases based on WHO, UNICEF, and IDHS data (www.childinfo.ug)
Source: Susenas 2004 and Helen Keller International, Indonesia report different malnutrition figures. **Note: Chiid malnutrition is defined as the proportion of children under the age of five who fall minus two standard deviations below the median weight-for-age of the reference populatlon.
national maternal mortality ratio (MMR) is 307 per 100,000 live births.45 This means that a woman who bears four children has on average a probability of 1.2 percent of dying as a result of her pregnancies. Maternal deaths account for an estimated 21 percent of all female deaths of reproductive age (Djaja, 2000; National Household Health Survey, 1995).de This MMR is far higher
than other comparable countries in the region, such as the Philippines, at 172 based on data from 1997, and Malaysia, at only 20 (UNDP and Government of Malaysia, 2005).
0 Access to safe water Is low, especially among the poor. Access to safe water in rural areas has increased by 17 percent over the past decade, but the poorest quintile still has disturbingly low levels of access. Overall data show a significant difference between rural and urban access to safe water, access in rural areas being estimated at 69 percent and in urban areas at 90 percent. But for the lowest quintile, access in rural areas is only 48 percent, against 78 percent in urban areas. Data for Susenas 1994 and 2004 indicate that the rate of increase in access has been even across quintiles in
44The data used in this study are taken from the Core, Module and Yodium (survey of ionized salt consumption) components of the Susenas household survey. In order to ensure comparability over time, the provinces of Aceh, Maluku and Papua, for which a complete time series is unavailable, are excluded from the analysis. 45 Estimate based on the 2002 Indonesian Demographic and Health Survey (DHS) reported deaths over the period 1998 to 2002. 46 In the 10th revision of the International Classification of Diseases maternal death is defined as ”the death of a woman while pregnant or within 42 days of termination of pregnancy, irrespective of the duration and site of the pregnancy, from any cause related to or aggravated by the pregnancy or its management but not from accidental or Incidental causes.
30

Recent Developments
rural areas and is leveling out in urban areas (as would be expected given the already higher rates of access).
0 There is a major failure in Sanitation adequacy, particularly among the poor. The coverage of sanitation services in Indonesia is undoubtedly the worst in the region, with less than 1 percent of all Indonesians provided with piped sewerage services. Susenas data indicate that 80 percent of the rural poor and 59 percent of the urban poor have no access to adequate sanitation. The costs of inadequate sanitation are substantial and the health and environmental costs in cities are especially high. Considering those 70 million people who use and share public and other non-private forms of sanitation facilities, it is estimated that the cost of poor sanitation (just measured by waiting and walking time) is in the order of Rp 530,000 (US$56) per person per year, or almost 2.6 percent of GDP.
Multidimensional poverty: a multi-headed beast
if ‘multidimenslonal’ poverty Is defined as expendlture/lncome poverty and/or deprivation in terms of one of the non-Income dimensions of poverty discussed above, around half of ail Indonesians are poor. When poverty is expanded to include other dimensions of human well-being-adequate consumption, education, health, and access to basic infrastructurethen poverty remains a major issue in Indonesia. Almost half of all Indonesians are currently experiencing at least one type of poverty. The true extent of poverty is even more striking in rural areas, with two-thirds of the population experiencing at least one type of deprivation, while almost 30 percent of urban households are deprived of at least one kind of basic need. Although there is a tendency for the poor to experience several forms of deprivation, it should be noted that other dimensions of deprivation are not perfectly correlated with expenditure poverty. Around 42 percent of the so-called non-poor households are nonetheless without access to safe water, while around 32 percent of non-poor households have to made do without adequate sanitation.
The variability in the nature of poverty across regions has lmpilcations In considering Strategies for poverty reduction in Indonesia. First, it is imperative to recognize these regional differences and disaggregate data regionally to determine what poverty problem predominates where. Second, differentiated strategies may be needed to address different poverty outcome indicators. Third, these strategies should take advantage of Indonesia’s decentralized administration, which allows for different strategies to be adopted in different regions.
Table 3.2 Multidimensional poverty
Proportion Poor (%) Non-Poor (%)
Births attended by traditional paramedics 40.2 22.8 Children aged 7-12 not enrolled in primary school 6.0 2.5 Children aged 12-15 not enrolled In junior high school 22.5 10.9 Households without access to sanitation 52.4 32.5 Households without access to safe water 51.8 42.2
Source: Susenas, 2004.
Although the correlation between various dimensions of poverty may not be strong In some regions It Is In others, for instance In eastern Indonesia. In this more remote part of the country, clearly income poverty coincides with poorer service delivery outreach and poorer non-income poverty outcomes. Areas such as eastern Indonesia may warrant special regional strategies to address the multi-dimensional nature of poverty.
3 1

Recent Developments
Inequality: a positive story, with questions
One of the major strengths of Indonesia’s hlstorlcal pro-poor growth story has been Its relatively equal national Income dlstrlbutlon, whlch remained fairly stable for decades. From the early 1980s up to the crisis in 1998, the Gini ratio for consumption stayed at around 33 percent, while the Gini ratio for income was 11 percentage points higher at 44 percent. Inequality even decreased slightly during the crisis, reaching a Gini consumption ratio of 31.7 percent in 1999. Indeed, had the distribution of expenditure not changed in an inequality-reducing way in 1997-99 as a result of the impact of the crisis, poverty incidence would have been 28 percent, far higher than the 23.4 percent actually experienced in 1999.
In recent years, the previously stable Gin1 ratio has started to register an Increase In Inequality. The Gini ratio in 2004 was around 34.8 percent or 3.1 percentage points higher than the ratio in 1999. Decomposition of poverty changes after the crisis into a growth component and a distribution component shows that the two components both played compensating effects. The poverty-decreasing growth effect in 1999-2004 was far larger than the poverty-increasing distribution effect, resulting in a dramatic decrease of 6.7 percentage points in the poverty headcount. Over this period, if inequality had not increased as a result of the change in distribution favoring the non-poor, poverty incidence would have fallen to only 12.1 percent, significantly lower than the 16.7 percent incidence actually experienced in 2004. While it is unclear precisely what lies behind this shift, empirical evidence has documented such a phenomenon in all developing countries. Moreover, given Indonesia’s historical starting point of relative equality in distribution of expenditure, poverty reduction would be best driven by growth that benefits the (large) tail of the income distribution that sits below the US$2-a-day poverty line (see Figure 3.1).
The most compelling Income lnequallty story In lndonesla Is In geographic and group dlsparltles (see previous section). Inequality in urban areas is much higher than in rural areas, with the difference in 2004 of as much as 9 percentage points in the Gini ratio of income. Java/Bali (47 percent) has a wider inequality ratio than off-Java (40 percent). The services sector had the highest income inequality in 2004, while the agriculture sector had the lowest inequality in both areas.
However, the Inequality story In lndonesla raises some questlons. Is inequality in Indonesia actually as low as the Susenas statistics historically indicate? Some anecdotal evidence suggests that this may not be the case (see Box 3.2 on Inequality). If there is an issue here, it likely relates to a major understatement of the income of Indonesia’s most affluent citizens. Further analysis is required to better understand incomes among this group. Not only would this be difficult to undertake, but such a study of the most affluent group is outside the scope of this poverty report. However, what is clear is that the highest incomes among even the top decile alone could significantly change the Gini estimates. While this might stretch the upper tail of income distribution, leaving the distribution ‘hump’ where it is, this would still not change the focus or recommendations of this report in its targeting of the poor.
32

Recent Developments
Box 3.2 Is inequality in Indonesia really so low? The Susenas household survey data indicate that Indonesia has only a moderate level of inequality. indeed, Indonesia’s Gini coefficient for inequality of 35 percent makes it comparable to the Netherlands, a country with an extensive Social welfare system, and well ahead of comparable developing countries, such as Brazil (61 percent), China (40) and Malaysia (49). The data also suggest that inequality declined from 2002 to 2004.
But is inequality really so low? The perceptions of many ordinary Indonesians are in sharp contrast to the data and simply stroiling around the streets of Jakarta makes one question the accuracy of the data. Central Jakarta is dotted with high- class shopping malls and extremely affluent neighborhoods, and it is not unusual to see Jaguars and Mercedes fender-to- fender with the ubiquitous battered Metro Minis that are the main public transport buses in the center of the city.
One possible explanation for the apparent dlscrepancy between official statistics and casual observation Is that the Susenas household survey does not adequately capture the expenditures of the rich. For instance, the 2002 Susenas records per capita household expenditure of the highest 9 9 t h percentile as a mere Rp 10 million per month (about US$1,100), a surprising low figure. Meanwhile, casting doubt on this figure, using 2001 data, McKinsey in Hong Kong estimated that super-rich households, defined as those with assets of at least US$1 million, constltuted only 0.03 percent of the total population, or around some 64,000 individuals. Data on import duties reveal that each year about 1,600 Mercedes Benz with a prlce tag of over US$30,000 are imported into the country. Another indication of inequality can be seen in the growing number of self-financing Indonesians studying at Australian universities. While in precrisis 1996 the total number of these students was about 3,000, by 2000, during the depth of the financial crisis, this number had doubled. All of these observations would indicate that inequality in Indonesia may not be as moderate as depicted in the data from the household surveys.
in research conducted by the SMERU Research Institute, several drawbacks in the data gathered by Susenas are pinpointed, including the use of expenditures as a proxy for income, the omission of very affluent households, and the failure to look at inequality within and between rural and urban areas.
Source: Susenas, 2002: Suryadarma, Suryahadi, and Widyanti, 2003; McKinsey, 1997.
Lagging regions
Regional disparities and pockets of poverty
Wlde regional disparities characterize Indonesia, particularly the sosalled ‘lagging regions’ in eastern Indonesia. The national poverty headcount index hides wide disparities in poverty incidence rates across the country (see the six Regional Focus sections at the end of this chapter). For example, poverty incidence ranges from 3.2 percent in Jakarta to 27.9 percent in East Nusa Tenggara. Based on 2004 data, a Papuan was almost four times more likely to be poor than someone living in the richest region, Kalimantan, with its relatively low poverty headcount of 11 percent. The magnitude of these significant differences in the incidence of poverty between different geographical areas is often too large to be explained by the differences in individual or household characteristics alone. Even after controlling for other characteristics, eastern Indonesia (the island groupings of Nusa Tenggara and Maluku) still exhibits a higher expenditure poverty rate (both with regard to poverty incidence and severity), as well as a poorer performance in almost all socio-economic indicators.
Regional disparitles are not only evident in sharp poverty variations across island groupings and provlnces: pockets of poverty are also evident within provinces. Just as with regional variations, so internal variations in province/district poverty are significant. Within relatively rich Kalimantan (poverty headcount of 11 percent) there are poor kabupaten such as Landak, where 24.7 percent of the population live below the poverty line, and rich kabupaten such as the city of Banjarmasin, where only 3.2 percent are poor. Meanwhile, within relatively poor eastern Indonesia (poverty headcount of 26.1 percent) there are kabupaten with a poverty level even lower than the national average, such as the city of Ternate, North Maluku. Such variations in poverty headcounts are highlighted by the development of poverty maps using small-area estimation methods, which dramatically reveal the existence of such geographical pockets of poverty even within districts (see Box 6.10 on poverty-mapping in Chapter 6 on Social Protection).
33

Recent Developments
Figure 3.6 Large variations exist in poverty headcount across Indonesia ... Percentage of poor people by province in Indonesia, 2004
Pcncninre Pcndulfuk Mukin
Perrenrxg. of Poor ProplE
D 6-1"
11-15 10 2" 2" *
400 0 400 800 Kllometers
Source: Susenas, 2004.
Figure 3.6.b ... and pockets of poverty exist even within rich provinces
(East Kalimantan) (Maluku) A rich province with poor pockets A poor province with rich pockets
Source: Susenas. 2004.
Regional disparities are evident throughout Indonesia even when looking at non-income dimensions of poverty. These regional disparities in non-income poverty correlate broadly with poverty incidence figures across island groupings. Some of the provinces with the highest incidence of poverty also exhibit the highest incidents of other deprivations. Overall, Nusa Tenggara, Bengkulu, West Kalimantan, and Papua lag behind other provinces in combating multi-dimensional poverty. The Spearman Rho correlation between the poverty headcount and other non-income deprivation indicators is around 18 to 57 percent.
0 Regional disparities in educational attainment. While mean educational attainment is less disparate across regions (with the difference between highest and lowest being only 0.6 years), the difference is larger with regard to educational attainment among the poor. Educational attainment among the poor is three years less in Papua than in Sumatra, with Papua also exhibiting a wide disparity in attainment between non-poor and poor. In addition, there is a striking difference in educational attainment between urban and rural areas, with an average gap of 2.5 years.
0 Regional disparities in access to safe water sources. Figure 3.7 shows the 55 percentage-point gap between the access of the lowest quintile to safe water in Papua compared with their better-served
34

Recent Developments
lowest quintile counterparts in Java/Bali. In Sumatra, Sulawesi and Nusa Tenggara/Maluku access to safe water coverage is in the 50-70 percent range for all quintiles.
Reglonal dlsparitles in access to sanitation. Even with low aggregate levels of access to sanitation, there are striking differences in access across regions. The gap between the lowest and highest quintiles is greatest in Papua, where 10 percent of the poorest quintile have access to sanitation compared with 70 percent of the highest quintile (Susenas, 2004). Another dramatic difference is between rural areas, where sanitation access is 44 percent, and urban areas, where access is 66 percent (see Figure 3.7). This coverage is further differentiated among richer and poorer households. Only 40 percent of the lowest urban quintile has access to improved sanitation, whereas 80 percent of the highest quintile has access. Only 12 percent of the rural poor have any access to improved sanitation. While the situation has improved in urban areas, there has been less improvement in rural areas over the past decade.
Regional disparities in child malnutrition. The malnutrition rate, while remaining high in all regions, shows some regional disparities. In Java/Bali, where the malnutrition levels are the lowest across regions, close to one-fourth of children under the age of five are considered ma lno~r i shed~~ (and 6 percent of those are considered severely malnourished). Malnutrition rates are higher in eastern Indonesia, for example, in Nusa Tenggara close to 40 percent of children under the age of five are considered undernourished, while the level of severe malnourishment reaches 13 percent.48
Figure 3.7 Expansion In access to safe water source and Improved sanltatlon by Income group, 1994-2004 Access to improved water has increased in the past decade but rural areas still lag behind
Access to Sanitation Is stili lower than improved water source in both urban and rural areas
100%
- - ---- = E loo%
W---
- -0 -<,- - - u- - -<t - -
- - - 0 % I’ - - -
l(po0r) 2 3 4 5 Eipendilure quinlile8
-3.- Wban 1994 - Wban 2004 1 (Poor) 2 3 4 5 w n d i t u r e quintiles mrai 1994 --4-lhlrat 2004
Source Susenas 1994 and 2004. Note Definition of improved water is taken as the percentage of people living in a household that have access to bottled, tap, pumped or protected spring water
What compllcates the problems of deallng with lagging regions in Indonesia Is that most of Indonesia’s poor live in regions that have relatively lower poverty incidence, such as Java and Sumatra. This is a function of the much higher population density on these two western islands. For example, while the poverty incidence in Java is 15.7 percent, the island is home to 59 percent of all Indonesians and 56.7 percent of Indonesia’s total poor. In contrast, while the poverty incidence in Papua is 38.7 percent, Papua is home to only 1.2 percent of all Indonesians and only 2.7 percent of Indonesia’s total poor. Annex 111.2 provides an illustration of where poor people who lack access to basic infrastructure services in roads, electricity, water and sanitation, live. When looking at the numbers of poor people who lack access, rural
Java/Bali, rural Sumatra consistently show up as areas where most of the poor who lack access to basic services reside. This poses a difficult dilemma for reducing poverty in Indonesia. Clearly, focusing on the poorest regions is important for promoting equity, regional integration, balanced growth and political stability. But focusing on addressing poverty in the most densely populated areas would result in a more rapid reduction of poverty in Indonesia as a whole and, given population density, would carry lower unit costs for poverty reduction efforts.
47Child malnutrition is defined as the percentage of children under the age of five who fall minus two standard deviations from the median weight-for- age for the reference population. Severe malnourishment is defined as the percentage of children whose weight-for-age is more than -standard deviations lower than the average for their reference group.
The data are taken from the Core, Module and Yodium (survey of ionized salt consumption) components of the Susenas household survey.
35

Recent
Regional diversity and the impact of growth on poverty
There are fundamentally dlfferent relatlonships between poverty and growth dependlng on the region. But what drlves the difference? The different structures of the economies on- and off-Java are revealed in the highly diverse responses of poverty to local economic growth. The high degree of heterogeneity across Indonesia’s regions-agro-climactic zones, local institutions and other important factors-leads to fundamentally different relationships between poverty and growth. Not every region has the same history of poverty reduction-poverty reduction in some regions has been much more rapid than in others. The question is: are the differences across regions due to differences in the levels of regional growth alone, or are there region-specific factors that differentially translate the growth experience into poverty reduction?
The answer lies In lsolatlng the effect of growth on poverty change and analyzlng elasticltles between poverty and growth. To answer this question, provincial level data on poverty measures and consumption measures that span the period 1984-2002 are analyzed. Provinces are divided into urban and rural areas, so for most provinces (except Jakarta) there are two observations. The elasticity between poverty and growth for these provincial and urban/rural areas is then estimated s ta t i~ t i ca l l y .~~ (See Annex 111.2 for resu Its.)
By controlling for initial inequality, it Is possible to Isolate the effect of growth on poverty change. Growth in mean consumption is negatively and significantly associated with poverty change, with an estimated elasticity of -2.1 percent. This number quantifies how much the poverty headcount will change given a 1.0 percent change in mean consumption. Thus in these data the poverty headcount on a national basis is reduced by 2.1 percent on average for every 1.0 percent increase in mean consumption (which is a proxy for economic growth per capita).
It becomes clear that there are regional disparities In how growth impacts poverty. Next, it is possible to allow for differences across the six regions used in this report: Sumatra, Java/Bali, Kalimantan, Sulawesi, Nusa Tenggara/Maluku and Papua. The poverty-growth elasticity for Java/Bali is -2.5 percent, greater in magnitude than for the country as a whole, thus implying that growth in Java/Bali results on average in faster poverty reduction than for the rest of the country. Figure 3.8 show that several regions have significantly smaller poverty elasticities than Java/Bali. In particular, Papua, Nusa Tenggara/Maluku, and possibly Sulawesi, all have lower estimated elasticities. Thus, there is clear evidence of regional disparities in how growth impacts poverty.
49This estimation involves regressing the change in local poverty on the change in mean consumption, where this change in mean consumption proxies for the overall growth in the local area. Since the relationship between growth in local consumption and the change in local poverty is in part a function of the distribution of consumption close to the poverty line, it is necessary to control for the distribution of consumption in the initial or base period. This is done by also including the base period Gini coefficient and the base period poverty headcount in the analysis.
36

Recent Developments
Figure 3.8 Growth Is less prepoor In eastern Indonesia (Poverty growth elasticities by region, urban rural)
0
-0.5
-1
-1.5
- 2
-2 .5
- 3
-3.5
- 4
- 4 . 5
- 5
Less pro-poor growth
t More pro-poor growth
Total
Indonesia - Average
Urban
Data: Susenas Consumption Modules 19842002. Source: Friedman, 2006. Ninety-five percent confidence intervals given.
Urban and rural areas also tell very dlfferent storles. It is also possible to look separately at urban and rural areas and these present very different regional stories too. For urban areas, the regional elasticities do not vary much. But for rural poverty, there is a very different regional pattern. The elasticity estimated for Java/Bali is -2.5 percent, very similar to the elasticity in urban Java/Bali. However, the elasticities for rural Sulawesi, Nusa Tenggara/Maluku, and Papua are all significantly smaller in magnitude. For Sulawesi the estimated elasticity is -2.1 percent, while for NT/Maluku it is -0.9 percent and for Papua -0.5 percent. Thus, rural poverty change in these areas is much more disconnected from overall growth than rural poverty change in other areas of Indonesia. This suggests a need for much better infrastructure in these areas if they are to be connected to growth throughout the economy. One last feature of regional diversity stands out in Figure 3.8. For Sumatra and Java/Bali (which together account for 80 percent of Indonesia's population and 79 percent of its poor), rural growth elasticities of poverty are significantly larger (in absolute terms) than urban growth elasticities. This finding is consistent with much evidence from Indonesia and other Asian countries that growth in agricultural productivity is pro-poor. More worrying, and reflecting the lack of appropriate agricultural technology in much of eastern Indonesia, urban growth has been far more pro-poor than rural growth in Kalimantan, Sulawesi, Nusa Tenggara/Maluku and Papua.
37

Recent Developments
II A Profile of the Poor
Of every 100 Indoneslam... But of every 100 poor Indoneslam... 57 live In rural areas 69 live in rural areas 44 do no have access to safe water 49 do not have access to decent sanitation 28 have household size more than five 43 have less than primary education 11 are illiterate 44 work in agriculture 60 work in informal sector 16 work as unpaid family worker 42 live in villages without secondary high school 36 live In villages without access to telephone Of those aged below five, 25 are malnourished and 32 were delivered by unskilled midwife
52 do no have access to safe water 73 do not have access to decent sanitation 48 have household size more than five 55 have less than primary education 16 are illiterate 64 work in agrlculture 75 work in Informal sector 22 work as unpaid family worker 50 live In villages without secondary high school 49 live in villages without access to telephone Of those aged below five, 28 are malnourished and 47 were delivered by unskilled midwife
Source: Susenas. 2004.
Most poor households are In rural areas. With rural households accounting for about 57 percent of the poor, poverty in Indonesia is still largely a rural phenomenon. However, the share of urban poverty is on the rise. In 1976, the share of poor who lived in urban areas was only 18.5 percent, but by 2004 this had reached 32 percent and continues to increase. By 2015, the urban share of the total number of households living in poverty is expected to have reached 45 percent and will pass the halfway mark by 2023. Understanding the scope, nature and characteristics of urban poverty, as well as the complex processes of this rural-to-urban shift, will be critical to policy-makers in the coming years (see Box 3.3 Urban Poverty).
Poor households are concentrated In the agrlculture sector. Agriculture employs the majority of household heads. While agricultural households represent only about 4 1 percent of the population, almost two-thirds of poor household heads work in agriculture. For all years, the average per capita expenditure was lowest and the incidence of poverty highest among formal and informal agriculture-sector workers. With the agricultural household poverty headcount being 25.7 percent, agricultural households are 2.6 times more likely to be poor than non-agricultural households. Agricultural income accounts for about 40 percent of the total income of the poor, compared with 32 percent of the near-poor and 15.8 percent of the non- poor.
38

r, > g! 005 -
Poverty Is closely associated with working in the Informal sector. Labor markets are characterized by a high degree of lnformallty. In 2004, as many as 51.6 percent of household heads worked in the informal sector (an increase on 47.5 percent in 1996). Return to informal employment differs by sector. Although household heads working in informal agriculture are 2.1 times more likely to be poor, those working in the informal service sector were 2 1 percent less likely to be poor than others.
than 0.5 hectares of rice lanci-suggesting even higher rates for the landless (Susenas, 2004).50
The natural envlronment has a strong impact on the nature of poverty. Some of the poor live in depleted and polluted coastal environments, while others-albeit far fewer-live in dense forests or in the central mountains. Poor people living in poor quality or fragile environments will not have the same opportunities as those in better endowed areas. For example: farmers in Kalimantan have to contend with generally poorer soil quality than that found in Java; the people of Nusa Tenggara receive less rainfall and have steeper slopes that those in other areas, which constrains their opportunities, as does their remoteness from major markets; and the costal plain of West and South Sumatra is narrow and steeply rising, so farmers there are more constrained relative to those in the north and eastern side of the island. Thus, although the general picture of poverty as predominantly rural and based on the agricultural and informal sectors holds true, the specific constraints and opportunities open to poor people depend to an important extent on their natural environment.
Poor households have less educatlon. The relative risk of poverty decreases with higher education. Junior secondary school graduates are 26.7 percent less likely to be poor than primary school graduates, and the likelihood of senior secondary school and university graduates being poor is even lower. The average gap between the poor and non-poor is two years of schooling. The net enrollment rate of poor children is substantially below the rates of the near-poor and non-poor. While the difference is insignificant at the primary level, the gaps in secondary enrollment between non-poor and near-poor households are 8.1 percent (junior secondary) and 9.1 percent (senior secondary), respectively. A child coming from a poor family is 20 percent less likely to be enrolled in a junior high school and 44 percent less likely to be enrolled in a senior high school than a non-poor child.
59 Asian Development Bank (2000).
39

Recent Developments
Box 3.3 The faces of urban poverty
The urban poor include a diverse range of people whose vulnerability and poverty vary widely. These include for instance slum-dwellers, street traders, street children, informal laborers and sex workers. Below we take a brief look at three of these sub-groups.
Street traders: Perhaps the most visible of the urban poor work in the informal sector as street traders (pedagang kak i lima). These traders can be seen in abundance working in crowded streets, in public markets and near commercial centers and transportation terminals, typically clustered in groups. In Jakarta and Bandung, it has been estimated that those working in this informal sector tripled in the aftermath of the financial crisis in 1998.
Key to establishing a street-trader business is modest start-up working capital, normally around Rp 200,000 (US$22). Although street-traders are generally assumed to be poor, they can still succeed in creating opportunities for their households to better survive and, in some cases, even prosper above the poverty line. Evidence suggests that many can access health and education services, and often achieve access levels to services that are higher than average Indonesian poverty indicators. Often traders have completed primary education and detailed surveys suggest that higher education levels (over 12 years) are associated with street traders running more ‘lucrative’ businesses. While far from easy, and prone to the environmental hazards from working long hours in polluted areas, street traders can nonetheless help to support poor households.
Sex workers: The sex industry flourishes in most urban areas and women generally enter the industry because they are bonded by relatives or guardians, are deceived or abducted, or choose to enter voluntarily. Of those who enter voluntarily, many explain their reason as the need to look after poor or sick parents, to support children or younger siblings, or to meet important social obligations. Evidence suggests that poor women are highly represented in the sex industry and studies show a strong correlation between entry and low education levels.
In Indonesia, sex work occurs in: official brothel complexes (lokalisasi) where sex workers both work and live; unofficial brothels (rumah bordil) and entertainment venues, where women are managed, and often abused, by pimps; and on the street and in open public locations (wanita lalanan). These traditional forms of sex work and the vulnerabilities that they bring are increasingly being added to by new forms of sex work in the urban environment. These now include young women who are often educated (and generally not poor) but who choose to accept sex work to pay for schooling or clothes.
Street children: Those described as street children in Indonesia are predominantly part of the urban poor, often (but not always) live outside their homes and undertake economic activities, such as begging, rubbish-picking, shoe-shining, newspaper-selling, or work as sweatshop workers or petty criminals. Many are later forced into sex work. An ADB survey of 12 cities conducted in 1999 estimated that there were some 170,000 street children in Indonesia (ADB, 2000). Typically, domestic violence or sexual abuse, household poverty and seeking economic opportunities were given as reasons that children become street children. However, some poor households sell or abandon their children to reduce family size.
The lives of street children are characterized by vulnerability and risk. They may work alone, with older street children, or under the control of adults or gangs. In many cases they are forced to raise a certain sum of money each day for ‘invisible adults’ who control traffic intersections, footbridges or markets. The consequences include: detention and beatings by the authorities; prostitution; exclusion; and a loss of self-esteem. Most have no ID cards or any form of identification, denying them access to formal health services or education.
Source: Suharto , 2002; West, 2003; and Kearney, 2000.
Poverty appears to be no hlgher among households headed by women, although this may be deceptlve. Households headed by men had a marginally higher poverty rate (16.7 percent) than those headed by women (15.9 percent) in 2004. So, using the Susenas data, apparently-and contrary to popular belief- female-headed households are slightly less likely to be poor than male-headed households. However, only 9.7 percent of households are female-headed, marginally more in urban (10.9 percent) than rural (8.7 percent) areas. But when other characteristics, such as demographic composition, schooling, sectoral work and access to basic infrastructure are controlled for, the story is reversed: male-headed households
40

Recent Developments
do indeed appear less likely to be poor than female-headed household (ADB, 2000).51 (See the following section on Gender for a more detailed analysis.)
Poverty is no higher among households with an unemployed household head. Among poor households, heads of household can ill afford to be unemployed (see graph in Box 3.4). Consequently, the relative risk of being unemployed for poor household heads is negative. Household heads of poor households are 9 percent less likely to be unemployed than non-household heads from non-poor households. The unemployment rate for the bottom quintile of household heads is only about 2 percent.52 Thus, the statement that unemployment is a ‘luxury good’ is indeed true for poor heads of households, but not the case for other household members. For them, poverty is strongly associated with unemployment. Non- household-head members of poor households are 8 percent (1.08 times) more likely to be unemployed than non-household-head members of richer households. While poverty and unemployment are two separate issues, since 1999 the unemployment rate of the poor has slightly exceeded that of the non- poor (see Box 3.4).
Poor households are larger. The average size of poor households is 5.4 members, compared with only 4.3 for non-poor households, more than one household member larger. Households of five people or more are 2.7 times more likely to be poor than smaller households. The difference in household size is largely due to higher fertility rates among the poor. The average number of children below the age of 18 among poor households is 2.6, while among non-poor households it is only 1.6-fully one child less.
The urban poor live In the worst locations, in densely occupied settlements, and In Inadequate and crowded housing. A sharp rise in slum city areas was noted in the MDG progress report (Indonesia Progress Report on the MDGs, 2004). In 1999, some 48,000 ha in Indonesian urban areas were officially classified as slum areas inhabited by 2.3 million slum-dwellers, a significant increase on 38,000 ha in 1996. The average size of dwellings occupied by those in the poorest quintile is only 10m sq, while for those in the second quintile the average size is double, at 20m sq (Susenas, 2004).
While the consumptlon pattern of poor households In Indonesia Is broadly typical, two exceptions stand out:
The poor are heavily dependent on rice and therefore very sensitive to Increases In the price of rice: Rice Is by far the most Important staple In Indonesia. It is consumed more by the poor, for whom it constitutes almost one-quarter of all expenditures, than the non-poor, for whom it constitutes closer to 10 percent (see Table 3.3). This means that looking solely at the consumption side, high rice prices-and policies that increase rice prices-will have a severely adverse impact on the poor. Even taking into account rice production, the poor are still hurt by rice-price increases, since three-quarters of the poor are net rice consumers (see Box 3.5 on Rice).
The poor consume a very high share of thelr money on tobacco: Tobacco (Includlng a small amount of betel) Constitutes an unduly large share of the non-food consumption of poor households-at 6.3 percent among the poor and 7.7 percent among the near-poor. The near-poor share is even higher than the non-poor (6.6 percent). What is remarkable is that this share is close to what the poor spend on key food items, such as vegetables (6.6 percent), and six times more than what they spend on eggs and milk. In fact, spending on tobacco is not much less than the total spent on all goods and services, including spending on health and education services. This means that any tax that increases tobacco prices is not progressive (i.e. it will hurt the poor). But consideration also needs to be given to policies that promote longer-term welfare of households since tobacco has long-term negative health costs (see Box 3.6 on Tobacco).
5 1 See Section 111. 52 The uses an old definition of unemployment rate that does not include discouraged workers.
41

Recent Developments
Table 3.3 Rice and tobacco are large spending items in the budgets of the poor
Poor Near-Poor Non-Poor Total
Rice
Tobacco and betel
Of which tobacco Vegetables
Eggs and milk
Prepared food and drinks
Other food and consumables
Housing and household facilities
Good and services
Clothing, footwear and head gear
Durable goods
Taxes and insurance
Festivities and ceremonies
24.1
6.3 6.0 6.6 2.5 6.7 24.3 14.7
7.3 5.4 1.0 0.3 0.7
100.0
19.4 7.7 7.5 6.0 2.8 8.1 24.2 15.1
8.4 5.6 1.5 0.4 0.8
100.0
9.4 6.6 6.6 4.3 3.4 10.3 21.3
18.8 13.3 5.1 4.8 0.9 1.8
100.0
11.8
6.8 6.7 4.7
3.3 9.8 21.9
18.0 12.2 5.2 4.1
0.8 1.6
100.0
Source: Susenas ZOO2 Consumption module.
42

MAKING THE NEW INDONESIA WORK FOR THE POOR
Box 3.4 Unemployment and poverty are not equivalent Unemployment continued to climb and formal Job creatlon lagged following the crlsls. The unemployment rate stood at a mere 4.9 percent In 1996, but jumped to 6.3 percent in 1999 and by 2004 had reached the worrying level of 12.8 percent. Recent trends in youth unemployment are also alarming: youth unemployment has risen dramatically since the financial crisis, surging from 16.0 percent In 1996 to 25.2 percent in 2004. Lackluster employment creation due to increasing rigidity in the labor market and continuing setbacks In the Investment climate have been the main reasons for rising unemployment in recent years. On average, employment growth remained slower than labor force growth between 1996 and 2005 (see Chapter 6 for more details). During 1996-2004, while employment grew at an annual average of 1.25 percents3 the labor force expanded at a rate of 1.97 percent. As a result, unemployment n u m b e r w s i n g the old definltlon-increased by an average 6.28 percent annually. Rates of job creation were significantly lower than the rates at which new entrants joined the labor force. In some years, job creation rates were even lower than the Increase In the population over 15 years of age. Labor force participation rates showed an increasing trend In 1996-2005, although there were some fluctuations.
Curlously, increasing unemployment In 1999-2004 occurred against a background of falling poverty rates. As discussed early, poverty levels declined In Indonesia using all poverty measures In 1999-2004: the headcount came down from 23.4 percent in 1999 t o 16.7 percent in 2004. Even accounting for lag effects, this dichotomy poses a puzzle for policy-makers. Employment creation and connecting the poor t o jobs are critical for poverty reduction and Chapter 6 goes into further detail about constraints in the Indonesian labor market that reduce the access of the poor to jobs (see Chapter 6 section).
Contrary t o common perception, unemployment and poverty are not equivalent. While there is a strong dynamic link between poverty reduction and the poor’s connection to the labor market, the characteristics of the poor and the unemployed in Indonesia are not similar. In fact, the unemployed have a very different profile compared with the poor, and this partly explains the phenomenon of how unemployment can increase while poverty rates decline.
o Educational attalnment: While unemployment is mainly a problem of the educated, poverty remains a problem of the less educated. In fact, the higher the level of education, the higher the risk of unemployment and the lower the risk of poverty (see Table below). Unemployment is highest among senior high school graduates (18.9 percent) and lowest among those with no primary education (7.9 percent). A senior high school graduate is 1.4 times more likely to be unemployed than someone who never completed primary education. Meanwhile, the relative risk of a senior high school graduate falling into poverty is far lower than for those with primary education or less. Urban/rural area: Another Indication that unemployment and poverty are not equivalent is the higher levels of unemployment found In urban areas than rural areas. Continuing a trend of previous years, in ,2004 urban unemployment was 10.1 percent, while rural unemployment was 7.4 percent. Conversely, poverty is slgnlficantly higher In rural areas (20.1 percent) compared with urban areas (12.1 percent). By age group: Unemployment is also higher among the young, while poverty Is only moderately higher. While overall unemployment in the workforce stands at 18.4 percent, the rate for those aged 15 to 24 is 33.9 percent, making this age group almost five times as likely to be unemployed. Meanwhile, poverty is only slightly higher among those aged 15 to 24 (18.9 percent) compared with adults (14.5 percent). This indicates that young people are only moderately more likely to become poor than adults, far lower than risk of young people becoming unemployed.
o
o
To conclude, the hlgh level of unemployment among educated Indonesians can be partially explained by the hypothesis that unemployment Is a ‘luxury good’. In other words, those who can afford to be unemployed are generally not the poor. This goes some of the way towards explaining the diverging trends in poverty and unemployment levels. While the profiles of the poor and unemployed help to explain the recent diverging trends, this analysis does not detract from the Importance of labor-market policies that connect the poor to jobs and the growth process. Further analysis of labor-market policies and the impact on the poor can be found in Chapter 6 of this report.
Unemployment Is predominantly a problem of the educated In urban areas, while poverty remains a rural problem of the less educated.
Unemployment rate of household heads increases with consumption.
Characteristics Povertv Unemdovment Educational attainment
Never attended or did not 21.4 8.2 Primary 18.0 10.2 Junior hlgh school 12.7 16.8 Senior high school Diploma 1/11/111 Bacheior/Post-graduate
6.6 2.5 1.6
18.9 12.6 10.9 a
Total
Urban 12.1 15.9 Rural 20.1 10.6
Indonesia 16.7 12.8
Area
0 1 2 3 4 5 6 7 8 9 10
Per capita expenditure deuler
43

MAKING THE NEW INDONESIA WORK FOR THE POOR
Rice-price Increases hurt the poorest in Indonesia
Box 3.5 Rlce-price increases disproportionately hurt the poor
Rice Is a critically Important commodity for ail Indonesians-but especlally for the poor. This is because rice accounts for 24.1 percent of poor households' total consumption, significantly higher than the budget share for rice among the near- poor (19.4 percent) and the non-poor (9.4 percent). Furthermore, for the country as a whole, four out of five households are net consumers (Le. they consume more rice than they produce). Although most of the poor live in rural areas and work in agriculture, more than three quarters of the poor (76 percent) are net rice consumers. in urban areas, 85.6 percent of the poor are net rice consumers, but even in rural areas 72 .1 percent of the poor are net consumers. Consequently, any increase in the price of rice disproportionately hurts the poor.
Sharp rice price increases dramatically increased poverty durlng the Asian financial crisis in 1997-98. As the rupiah collapsed, so the domestic price of tradable goods consumed by the poor surged, most notably the prlce of rice. The urban poor were hit worst: not only were they more predominantly net rice consumers but they suffered far more from the contraction in employment, both formal and informal. The government was successful In restoring relative macroeconomic stability by 2001, strengthening the rupiah and bringing down the domestic price of rice as a result. This helped to bring down the poverty headcount, which fell from 23.4 percent at the peak of the crisis to 16.7 percent by 2004. The experience of the crisis shows the importance of macroeconomic stability and, in particular, the stability of rlce prices in preventing future increases In poverty rates.
These lessons became relevant once again towards the end of 2005 and into 2006, when the price of rice surged by about 30 percent above international prices, rising 55 percent between June 2005 and June 2006-far ahead of other domestic food price increases.
in thls case, the rice price started to run out of control due to shortages In supply caused in part by the government's ban on the importation of rice. Simulations indicate that the price increase may have moved over 3.1 million Indonesians below the poverty line. Prices subsequently fell with the arrival of the main harvest but, worryingly, have begun to rise again. The most efflcient way for the government to address this issue going forward-despite strong resistance from the rice-producers' iobby-would be to impose a low tariff and allow general imports of rice. By helping to maintain rice price stability such a policy would be highly pro-poor. (See Chapter 6 for more on policies for rlce price stabilization.)
Source: Susenas, 2004.
The domestic rlce price overtook international prices (inci. the tariff) after December 2005 due to shortages in domestic supply
(Net benefit ratio of increase in rice prices by expenditure group)
Source: Susenas. 2004.
155
8 145
135
i 1 2 5
i f 1 5
5105 c
g 95 - 85
Source: FAO, Border prices wholesale equivalent for Vietnam rice 25 percent, Jakarta wholesale price IR 64 111 PIBC.
44

MAKING THE NEW iNDONESlA WORK FOR THE POOR
Box 3.6 Tobacco damages poor households’ finances as well as their health
Tobacco constitutes a major expenditure for the poor. According to Susenas data (see Table 3.5) the second largest single commodity Item consumed by poor indonesians after rice is cigarettes. In 2002, 6.3 percent of the poor’s expenditure went on tobacco, while at 7.7 percent the figure was even higher for the near-poor (Susenas, 2002). The poor are also more iikeiy to smoke; men in the lowest three quintiles smoke the most at 62.9 percent, 65.4 percent and 64 percent consecutively, compared to 57.4 percent of men in the highest quintile (Susenas, 2001). Despite the negative impact of tobacco consumption on family budgets and health, public perceptions of the tobacco industry are iargeiy positive. The government enjoys high revenues from the tobacco industry, and the industry is perceived as an important source of employment even though its significance is actually In decline.
Expendlture on tobacco takes away money that the poor could spend on food, heaithcare and education and Increases the burden on the national health system. It is clear that spending on tobacco, which may be seen as a short-term consumption benefit, has long and short-term negative health implications for both smokers and passive smokers and inhibits poverty reduction. About 6.5 million indonesians suffer smoking-related diseases annually, such as lung cancer, coronary heart disease and strokes. The National Agency for Drug and Food Control (BPOM) reports that 1,100 deaths a day and 57,000 deaths a year (primarily male) are attributable to tobacco use in Such high mortality has a cost t o household expenditures as well as to the national health system and economy. At the level of the household, losing a primary breadwinner is shown to be one of the major shocks that cause poverty (Chapter 6 on Social Protection).
Meanwhile the importance of the tobacco industry is in decline In terms of employment. In 1970, tobacco manufacturing contributed 38 percent of total employment in the manufacturing sector. This flgure has dropped significantly to just 5.6 percent in 2000, and only 1.0 percent of employment in the industrial sector (Ministry of Health, 2004). In addition, the tobacco industry on average pays only two-thirds of the average monthly wage to its employees. The largest impact of a decrease in tobacco consumption is likely to be felt in the agricultural sector with an estimated 2.3 million farmers growing tobacco or cloves for domestic production of hretek (clove cigarettes) and cigarettes55 Other areas that would suffer are trading, transportation and advertising (Reynolds, 1998).
However, the tobacco industry remains a significant source of government revenues and public perceptions of tobacco and the industry remain iargeiy positive. In 2004, the industry produced 199 billion cigarettes and contributed Rp 27 trillion (almost US$3 billion) in excise revenue (Abadi, 2005). Indonesia is now a net importer of tobacco leaves, tobacco-leaf imports exceeding exports by US$44 million. However, it is a net exporter of tobacco products: net exports were equivalent to US$176 million in 2001. Despite this, tobacco exports contributed only 1.0 percent of total exports in 2002 (Ministry of Health, 2004). in a 2001 study by the University of Indonesia’s Center for Health Research, almost 60 percent of respondents had a positive view of the industry. The majority of tobacco users perceive It to be an important provider of jobs (39 percent). Only 28 percent acknowledged that the industry was harmful to health (14 percent) and detrimental to family finances and the environment (14 percent) (Center for Health Research, 2001). Tobacco users have only limited knowledge of the effects of smoking on health: heart ailments (19.8 percent), respiratory aliments (74.1 percent), cancer (4.3 percent) and impotence (0.2 percent). Knowledge of the harmful effects of smoking fails to prevent teenagers from starting to smoke or continuing to smoke (Martini and Sulistyowati, 2005), their decision Is based on affordablilty and availability of cigarettes at home and at school.
What would be the most effective way of reducing tobacco consumption among the p o o p International experience has shown that the most effective way of reducing tobacco consumption is by increasing the price of tobacco products through Increasing taxes on these products. Research in indonesia and other Southeast Asian countries, however, has shown that increased prices alone do not have as significant an impact as in other countries. A 10 percent price increase in tobacco products is predicted to lead to only a 3.5-6 percent decrease in consumption (Ministry of Health, 2004). Likely to be more effective, is a widespread advertising and public awareness campaign of the health and economic consequences of smoking and passive smoking, combined with a comprehensive ban on tobacco advertising (partial bans are Ineffective). increased taxation could be used to ensure government revenues do not decline as anti-smoking campaigns are put into place, and to finance such campaigns.
What would be the effect of a national antkmoking campaign on poverty, health and the Indonesian economv The tobacco Issue Is a difficult one to tackle, with strong political and private sector interests determined to maintain a large market, even if this contributes to impoverishment and disease. A reduction in tobacco consumption will improve health outcomes and Improve the welfare of the poor both directly and indirectly. The reduction in employment In tobacco manufacturing will not likely have a significant impact; however, government will need to create strategies to address this reduction in smpioyment and in assistlng tobacco farmers to switch to different crops. The effect on the economy as a whole Is unlikely to be significant if the government increases taxation on tobacco products in accordance with declining demand.
45
MAKING THE NEW INDONESIA WORK FOR THE POOR
111 The Determinants of Poverty
This section uses multi-variate analysis to reveal the determinants and the relative importance of key household characteristics, assets and access as correlates. This analysis gives a more comprehensive picture than one produced by relying on simple poverty risk descriptions discussed in the previous section. This is because the high relative risk of certain groups within the population could be attributable to household characteristics within the group, rather than to the group characteristics. In addition to commenting on the relative roles and magnitude of household characteristics and endowments in determining poverty status, multi-variate analysis also permits an assessment of the potential impact that policy changes in these factors are likely to have on poverty, holding ail other factors constant.
But it is important to note the limitations of such analysis. First, the analysis is constrained by the data available, in this case secondary data from Susenas and Podes (Village Potential Survey). Although in some cases proxies can be used for important determinants, such as access to infrastructure, numerous correlates of poverty are not quantifiable. Second, while theory also supports the findings that many of the variables in the analysis do contribute to poverty, the Statistical results are more appropriately interpreted as correlates rather than purely statistical causes of poverty, since causality can run both ways .56
Several key factors matter for poverty and hence matter for reducing poverty. Table 3.4 presents household expenditure functions in urban and rural areas in 1999 and 2002. The correlates of poverty are analyzed using regression analysis to see the effect on the household consumption of a specific household, while holding constant all other characteristics. The regressions estimate the partial correlation coefficient between household consumption, and household access and asset variables included in the anaiy~is.5~
Correlate k Education
Poverty is closely associated with inadequate education. Similar to findings in other countries, higher educational attainment is associated with higher household consumption. in addition, the partial correlation coefficients are generally higher in urban than in rural areas, both for household heads and members, indicating that urban households benefit disproportionately more than rural households for every extra year of education.58
Going beyond primary education significantly improves welfare. Correlates of poverty exhibit a convex relationship to level of schooling, i.e. the gains are even stronger with higher levels of education (see Table 3.4 and Figure 4.8 in Chapter 4). in urban areas, a household head with a senior secondary education is associated with a consumption level that is 33 percent higher than that of an uneducated household head. The consumption increase associated with education is especially marked for university graduates both in urban and rural areas (72 percent and 45 percent, respectively). The same results hold true (but to a lesser degree) for other household members, especially for households in urban areas.
46

MAKING THE NEW INDONESIA WORK FOR THE POOR
Table 3.4 Household expendlture function by urban/rural area, 1999-2002
1999 2002 9 n
Sex
Years of schooling
Square of years of schooling
Experience
Square of experience
Inactive
Formal agriculture
Industry
OccupaUon of Household Head
Informal
Formal
Services Informal
Formal
Agriculture informal
Formal
Informal
Formal
Informal
Formal
Occupatlon of Non Household Head wlth Hlghest EducaUon
Industry
Services
Other Household Characterlstlcs Average years of schooling of household
Square of average years of schooling of household
Status of house
Communlty and Faclllty CharactedsUcs by Dlstrlct Population density
Average number of senior high schools
Proportion of vocational skills education
Proportion of existing credit facilitles
Proportion of type of widest road that is asphalt
Proportion of existing telephone and wartel
Constant
0.14290 (15.610)***
-0.02214 (7.610)*
0.00364 (21.629)***
0.02444 (33.790)***
-0.00035 (30.309)*
0.01924 (1.230)
-0.05920 (2.830)* * *
0.01409 (0.570)
0.06052 (3.990)* * *
0.05909 (3.970)* * *
0.11654 (8.090)* *
0.03277 (2.610)***
-0.01697 (0.980)
0.04135 (2.600)* **
0.03417 (4.530)* *
0.09247 (14.550)** *
0.11351 (20.660)* * *
0.016 (13.920)***
-0.00014 (1.570)
0.13997 (18.020)***
0.00039 (14.630)***
0.01290 (9.130)* **
0.06349 (9.770)***
0.00984 (1.550)
0.08027 (6.180)*
0.04678 (4.330)***
12.15499 (546.179)***
24.606
0.28362 (37.360)* * *
-0.03169 (12.140)* * *
0.003674 (20.320)*
0.018353 (31.459)*
-0.000283 (31.379)*
-0.020381 (2.160)** -0.060937 (7.610)***
-0.018471 (1.140)
0.069911 (8.290)***
0.096282 (11.030)* * *
0.142563 (17.459)* * *
0.031849 (8.550)** * 0.035793
(5.150)*
0.031828 (3.370)*** 0.057964
(7.940)***
0.096342 (14.000)***
0.114582 (16.180)***
0.030124 (29.540)* * *
-0.000939 (10.430)* * *
0.011664 (0.800)
-0.000046 (0.300)
-0.001383 (0.360)
0.111026 (8.440)* ** 0.028603
(5.060)* ** 0.031031
(6.540)* * * 0.000919
(0.150) 12.41
(738.450)* * 34,034
0.15825 (17.170)***
-0.00711 (2.790)* * *
0.00292 (21.200)***
0.0 2 0 2 9 (28.790)***
-0.00029 (26.010)***
0.10219 (7.460)**
0.03589 (1.870)*
0.08382 (4.320)***
0.17636 (13.550)** *
0.13452 (10.420)***
0.21392 (17.200)***
0.01016 (0.940)
-0.02273 (1.140)
0.03074 (2.240)**
0.05449 (7.910)***
0.06596 (9.540)***
0.12597 (23.200)***
0.01241 (11.770)* * *
0.00011 (1.390)
0.13657 (19.510)* *
0.00003 (8.230)***
0.00679 (4.330)* *
0.07061 (11.370)* *
0.05504 (8.750)***
0.07721 (6.950)***
0.01721 (1.300)
12.18094 (584.729)** *
0.31072 (38.070)***
-0.02078 (7.710)***
0.00280 115.150)*** ' 0.01587 (25.799)* * *
-0.00026 (26.940)** *
0.00888 (0.8900) 0.03127
(3.530)***
0.05413 (3.990)***
0.11729 (12.500)** *
0.14269 (14.990)** *
0.22667 (25.000)* * *
0.02389 (6.240)* * *
0.03346 (3.820)***
-0.01333 (1.300)
0.09136 (10.700)* *
0.10010 (12.780)* * *
0.15694 (19.160)* * *
0.02913 (27.440)***
-0.00098 (10.240)***
0.02833 (2.820)***
-0.00220 (6.010)***
0.03793 17.220)*** I 0.00999
(0.7700) 0.01788
(2.920)*** 0.03111
(6.370)** * 0.00722 (1.3400)
12.42142 (925.669)* *
Observations 27,288 30,712 R-rquared 0.4560 0.3923 0.4675 0.3831
Source: Susenas 1999 and 2002. Note: Absolute value o f t statistics In parentheses significant at 10 percent; ** Significant at 5percent: and *** significant at 1 percent
Improving educational attainment In certain regions/areas is correlated wlth even greater poverty reductions. The poverty reduction gains to increasing education levels in Java/Bali are larger than elsewhere, as this region has the lowest educational attainment and the highest coefficient associated with education in the expenditure function (see Table 3.6 and Annex 111.3). Likewise, increasing educational attainment reduces poverty more dramatically in urban areas. This highlights one of the
47
MAKING THE NEW INDONESIA WORK FOR THE POOR
major dilemmas facing Indonesian policy-makers: while confronted with higher levels of poverty and deprivation in rural and remote areas, faster inroads in reducing aggregate national poverty are possible by investing in the poor in more densely populated areas (such as urban areas and Java/Bali) where economic activity is also higher. For example, if the education levels of urban poor household heads and members in Java/Bali were increased to the senior secondary level, this would raise household consumption of the poor by 37 percent. This is a significantly higher gain than aiming for universal junior secondary school coverage, which would provide only a 13 percent increase.
Correlate 2: Occupation
Working In agriculture Is strongly correlated with poverty. Household heads working in agriculture have significantly lower consumption levels (and hence are more likely to be poor) than those working in other sectors. Using household heads working in the informal agricultural sector as the base, the correlates of poverty (see Table 3.6) suggest that rural household heads working in formal agriculture are associated with a 3.1 percent increase in consumption level, while those working in informal industry can expect a 5.4 percent increase. The gains are even higher for household heads working in formal industry (11.7 percent). The highest gains are in services: in informal services the gain is about 14 percent, while in formal services the gain is about 22 percent, both for urban and rural areas. Given that the poor have a low share of formal and non-agricultural sector employment and the fact that working in these more lucrative sectors is correlated to reductions in poverty, so a movement of labor towards the formal agricultural sector, or the formal and informal non-agricultural sectors, will provide an escape from poverty (see Chapter 4 on Growth).
The vulnerablllty of the agricultural sector “...usually, if it is the ralny season, we would plant rlce paddy and corn. Already the land Is not fertile now that the cllmate is changing as well. For example, we would put down the fertlllzers for chlll peppers or plant tobacco after the harvesting of rice paddy, but then It would raln In the evenlng. This doesn’t happen just once, but many times. As a result, we experience harvest fallures, and then there are also attacks of locusts and rats. So we live on the profit made from selllng cows or chlckens...” (Bapak Amrlllah, partlclpant of the male group of a FGD, Madura, East lava).
Llvellhood and seasonal calendar “...pacekllk Is the perlod when It Is very hot and dry, there are no jobs around, no lnformal work as laborers, only lots of thleves and people getting divorced ...” (Mamlq Dena, particlpant of a FGD, West Nusa Tenggara)
Kajlan Kemlsklnan Bersama Komunltas, Klkls, 2003.
Correlate 3: Gender
Although poverty appears to be marglnally lower among femaleheaded households, the true plcture Is hidden: male-headed households do still have significant advantages over female-headed households. In 1999, holding other characteristics constant, urban male-headed households had expenditure levels that were 14.4 percent higher than urban female-headed household. This gender gap is even more striking in rural areas, where there was a 28.4 percent difference. By 2002, the gender gap had widened to 15.8 percent for urban and 31.1 percent for rural. The seemingly conflicting results between the correlates (which indicate that female-headed households are significantly worse off) and the simple descriptive analysis (which indicates that female-headed households are marginally less poor) can only be explained by unobserved characteristics, such as a higher propensity to shocks and lower accessibility to mitigating and coping instruments, that may correlate with the gender of the household head. The risk and vulnerability assessment among different types of household and life-cycle stages indicates that poor female-headed households have a higher risk of experiencing negative shocks from conflict, health shocks and economic risks.6g
48

MAKING THE NEW INDONESIA WORK FOR THE POOR
Correlate 4: Access to basic services and infrastructure
Povetty Is clearly associated wlth lower levels of access to bask facllltles and Infrastructure. Several locality proxies were used to represent these various access levels. These locality variables can be interpreted as proxies for local endowment and represent the effect of local characteristics not captured by other variables. Almost all of these accesses to facilities and infrastructure have substantial predictive power with significant and positive coefficients (see Table 3.6).
Households In rural areas wlth more access to secondary education are slgnlflcantly less likely to be poor. In rural areas, having access to secondary education within reasonable proximity is associated with a 3.8 percent increase in household consumption.60 The coefficient associated with access to secondary education is the highest in rural areas of all other access variables considered. Given that the proportion of the rural poor who live within proximity of secondary school Is only 11.7 percent, investing in secondary schools in rural areas with high poverty densities should yield significant results. Interestingly, the gain from access to secondary education is much less in urban areas, amounting to only a 0.7 percent increase in consumption level. This could be a consequence of diminishing returns, as urban areas generally have a higher number of secondary schools. In rural areas, secondary schools also serve as venues for information and knowledge diffusion, and teachers are often regarded as local activists/key players (tohoh rnasyarakat) involved in various development project or village planning activities (so- called Musbangdes). Combined with the earlier findings of high return to education in urban areas, this indicates that further investment in education in urban areas should place stronger emphasize on other proximate determinants, such as improving teacher and school management, not on the construction of additional schools.
Access to Informal courses can be a key factor In upward economlc moblllty, especially In urban areas. Living in areas with access to informal courses raised household expenditure by 7.1 percent in urban areas.61 In rural areas, access to informal courses only slightly increased household expenditure, by 1.0 percent. This is not so surprising, as demand for the technical skills associated with this particular proxy (mechanical and computer skills) is higher in urban areas.
Access to a nelghborhood credlt lnstltutlon also significantly Increases expenditure and reduces the likelihood that a household will be poor. Rural households with access to a village savings and loans unit (Koperasi Unit Desa, or KUD) have expenditures that are 2.0 percent higher than those without such access.62 Urban households with access to a bank have a 5.5 percent increase in expenditures relative to those that do not. The proportion of poor households with access to a KUD in rural areas is 16.1 percent, whereas the proportion of urban poor households living within proximity of a bank is 31.2 percent. Although credit programs through commercial banks such as BRI (Bank Rakyat Indonesia) or community- driven development (CDD) programs such as a KDP (Kecamatan Development Program) or UPP (Urban Poverty Project) proliferate, there is clearly a strong argument for expanding access to credit for poorer households as a means of reducing poverty.
Road access Is correlated wlth higher levels of consumption. Having all-year passable asphalt roads is associated with higher expenditure levels in both urban (7.7 percent higher) and rural (3.1 percent higher) areas.63 This is hardly surprising as road access is crucial in providing access to opportunities (labor and product markets) and services (health and education services). Similar to access to other infrastructure and facilities, access is higher in urban areas and rises with income. Access to roads is limited for the poor. While the proportion of non-poor households with access to all-year passable asphalt roads is 75.9 percent, only 60.9 percent of poor households have access to all-year passable asphalt roads. The problem is more acute for the rural poor, where only 53.0 percent of poor households have access to all- year passable asphalt roads.
Access to telecommunlcatlons was Insignificantly correlated wlth consumption at the national level, but not In some regions. Unlike other access proxies, access to telecommunications has insignificant coefficients. The only exceptions to this were in urban areas of Sumatra and Papua, and rural areas of Java/Bali and Kalimantan.
49

MAKING THE NEW INDONESIA WORK FOR THE POOR
Correlate 5: Geographic location
Given these regional disparities, it Is not surprising that geographical location also correlates with poverty. Today, and despite Indonesia’s vast area, it is increasingly possible to make use of much finer geographic disaggregation techniques to confirm these disparities and focus poverty-reducing efforts down to the lowest levels. Indonesia has 33 provinces; 440 districts or municipalities (kabupaten or kota); 5,850 sub- districts (kecamatan) and 73,219 villages (desa/kelurahan). However, for the purpose of this national poverty assessment, although it is important to capture the disaggregated story as much as possible, it was decided to focus primarily on the geographic differences and findings across six broad island groupings: Sumatra, Java/Bali, Kalimantan, Sulawesi, Nusa Tenggara/Maluku and Pap~a .6~ The six Blue Regional features focus on each of these island groupings (at the end of this chapter) provide a sense of these regional variations and an abbreviated poverty profile for each island grouping. Regarding the correlation between these geographic groupings and poverty, summary findings from the poverty correlates of each region are described in Box 3.7 below:
50

MAKiNG THE NEW INDONESIA WORK FOR THE POOR
Box 3.7 There are differences in poverty correlates and constralnts across regions
Specific poverty correlates for each region and the decomposition of the major differences in poverty incidence between Java/Baii and the five other regions65 (see Annex 111.3) reveal the following insights:
Java/Ball: The main advantages that Java/Baii has over the other five regions are its higher return to education, its higher level of access and assets, and its lower informality rates in employment, Expanding infrastructure, especially in access to roads, as well as access to credit in urban areas, would help upward mobility strategies in Java/Baii. That said, the main disadvantages of Java/Bali are its hlgher propensity to shocks than other regions, its lower return to other household member (i.e. non-household head) occupation, and its lower return to access to secondary education.
Sumatra: The maln advantages of Sumatra compared with Java/Bali are its higher return to work experience, its higher return to communication access and its higher return to occupational choice. Sumatra’s access to telecommunications coefficient is the highest of all six regions, correlating to an 8.3 percent increase in consumption levels. On the other hand, Sumatra was at a disadvantage to Java/Bali in terms of its lower return to education, its lower level of access and assets, and its higher rates of informality in employment. If Sumatra had been able to achieve the same return to education as Java/Bali’s, then poverty incidence in Sumatra would have decreased by an additional 5.6 percentage points.
Hailmantan: The main advantages of Kaiimantan compared with Java/Bali include its higher return to occupational choice for non-household heads, its higher return to roads and also its higher return to work experience. However, Kaiimantan was at a disadvantage to Java/Baii in terms of its lower return to education, its far lower levels of access and assets, and its higher level of informal employment. Had Kaiimantan’s distribution of assets and access to basic facilities been similar to Java/Bali’s, poverty incidence would have decreased by additional 7.6 percentage points.
Sulawesi: The region of Suiawesi has several advantages over Java/Baii, including its higher return to occupational choice for non-household heads, its higher return to access to communications, and its higher return to access to secondary education. Conversely, Suiawesi is at a disadvantage to Java/Bail when It comes to its lower return to education, its lower return to work experience, its lower ievei of access and assets, and its higher rates of informal employment. Had Sulawesi’s household heads been able to achieve a similar return to work experience as in Java/Baii, poverty would have decreased by an additlonal2.3 percentage points.
Nusa Tenggara/Maiuku: Compared with Java/Bali, the region of Nusa Tenggara/Maiuku has advantages in its higher return to occupational choice, and its higher return to work experience. However, the region’s disadvantages compared with Java/Baii are s tark Nusa Tenggara/Maluku has a far lower level of access and assets, lower return to education, far higher levels of informal employment and generally lower return to most accesses. The remoteness of Nusa Tenggara and the islands of Maiuku, and their particular soil and climate conditions, translate into lower levels of access to basic services and infrastructure. This inhibits the accumulation of human capital by the poor, and curtails access to markets and the diffusion of new technologies. Had the level of access and assets of Nusa Tenggara/Maiuku been similar to Java/Baii’s, the incidence of poverty would have decreased by a huge 18.8 percentage points.
Papua: The region of Papua has several advantages over Java/Baii. These include its higher return to occupatlonai choice, its far higher return to work experience, its higher return to road access, and its slightly higher return to access to credit. However, Papua is at a major disadvantage to Java/Baii in many areas, the most important of which include Its far lower return to education, its generally lower level of access and assets, and its significantly higher levels of informal employment. If Papua’s labor market structure were similar to Java/Bali’s, poverty incidence would have decreased by 4.8 percentage points.
Source: World Bank staff estimates.
5 1

MAKING THE NEW INDONESIA WORK FOR THE POOR
IV Analysis
The Determinants of Recent Poverty Changes: A Dynamic
Why did poverty decrease substantially between 1999 and 2002, while Inequality increased? This section focuses on this more recent period of Indonesia’s history of poverty reduction. In particular, it explores the issues, highlighted in Chapter 2, flagging the fact that, although important inroads have been made in poverty reduction since the crisis, the rate of pro-poor growth appears to have slowed down. During this period, poverty declined from 23.4 percent to 18.2 percent, but inequality increased, with the Gini ratio rising from 31.7 percent to 34.0 percent.
This analysis recognizes the complexity of the dynamlcs of poverty reduction, using a micrwimulation decomposition method. The method employs microeconomic simulations to decompose changes in poverty over two different years (1999 and 2002) and across the six different regions into the contributions of four sets of phenomenaF
(i) Endowment effect changes in the socio-demographic structure of the population, Le. the assets and personal or household characteristics in the population (also referred to as the population effect):
(ii) Price effect: changes in the structure of earnings/expenditures, i.e. the returns to those assets and characteristics:
(iii) Occupational choice effect: changes in occupational-choice behavior, Le. how people use those assets and characteristics in the labor market; and
(iv) Error term: shocks or unobservable factors.
The analysis provides valuable insights into the determinants of recent changes In poverty and inequality, with implications for strateglc pollcy going forward. The two decomposition approaches consist of simulating counterfactual expenditure by changing how markets and households behave, one aspect at a time, and by observing the effect of the change on the poverty headcount, while holding all other aspects constant. In order to obtain the simulated price effect, in the 1999 sample the expenditure of households is replaced with the value obtained using the function estimated for 2002, while keeping the observable and Unobservable characteristics of the households constant. A symmetric definition applies to the occupational-choice effect, while the endowment effect serves as the residual after removing other effects from the actual changes observed during 1999-2002. Table 3.5 shows the decomposition results using the two approaches.
Endowment effect: endowment changes were the main contributor to poverty red uct i on
An Increase in endowments was the key factor in contributing to poverty reduction over the period. Socio- demographic structures were modified with increases in the average educational level of the population, the replacement of older cohorts by younger, better educated and more productive cohorts, and the decline in fertility and family size. Changes in access to basic infrastructures and facilities also impacted endowments of the poor. Figure 3.10 provides the mean change and the incidence of change (by expenditure groups) for various endowments, where a negative slope in the curve indicates a pro-poor increase in a particular endowment.
The primary endowment effect that reduced poverty In this period was the Increase in educational attainment. The bottom quintile households saw a 2.2 percent increase In the education of household heads and similar increases for other household members (Figure 3.10a). In addition, the endowment effect related to the reduction in fertility and household size also helped to reduce poverty (Figure 3.10b). Endowments also improved as measured by increased access to informal courses and telecommunications. The increase in access to informal courses was 1.4 percent for the poorest quintile
52

MAKING THE NEW INDONESIA WORK FOR THE POOR
and 3.9 percent for the mean income group (Figure 3.10~). The bottom quintile experienced a very large (10 percent) increase in access to telecommunications which was higher than the increase in access at the mean at 7.9 percent (Figure 3.10d).
The overall endowment effect benefited the rich more than the poor and was a factor In increasing lnequallty during the period. There were larger reductions in access to asphalt roads and to credit among poorer households, and smaller gains in access to informal courses (Figure 3.10c, e and f). The bottom quintile experienced a decline in access to asphalt roads by 3.0 percent in this period, compared to 0.7 percent decline for the mean income group. Only the richest three-quarters of the population enjoyed better access to asphalt roads in this time period. The bottom quintile households also experienced a decline in access to credit (2.8 percent). Meanwhile, although there was an increase in access to informal courses for the poor (1.4 percent), the increase was larger for richer percentiles, which consequently also had an inequality-increasing effect.
Figure 3.10 Changes in selected endowments for the poor, 19992002 (Growth incidence of various endowment variables on percentiles)
a. Educational attainment increased, especially for the poorest
i i 20 40 60 80 100
Expenditure percentiles ,J
d. Access to telecommunications increased, especially for the poor
b. Fertility declined especially for the near-poor mechanical) increased, benefiting mostly
c. Access to informal courses (computer and
the rich
B
e.
i
Access to asphalt roads decreased for the poor and general population and only increased for the richest percentiles
rl 80 1w
f. Access to credit declined for the poor but increased for the average income group and the rich
R f"
-Ga)i(hlncidenCeOlrw -Qa)i(hlgeln MEm
Source: Susenas 1999, 2002 and World Bank staff calculations. Note: Growth incidence of each variable across expenditure percentiles is shown by the red curve. Growth rate at the mean per capita expenditure is shown by the straight line. The percentiles where the red curve is above zero increased their endowment In the partlcular variable in the period 1999- 2002.
53

MAKING THE NEW INDONESIA WORK FOR THE POOR
Price effect: the poverty impact of the return to assets and access was mixed
The return to assets and access over the period was poverty reducing In net. The price effect was similar to the endowment effect in increasing inequality over the period, since the return in net was higher for the non-poor. Despite these net effects, there was heterogeneity in the impact of the return to different assets, with the significant increase in the return to education of household heads dominating. It is useful to review how the return to each of these assets tended to either contribute to, or detract from, poverty reduction and equality over the period.
A significant Increase In the return to education among household heads reduced poverty. Comparing 1999 and 2002, it is apparent that the return to education increased both in urban and rural areas (Table 3.4). While in 1999 urban heads of household with a junior secondary education could expect a 9.5 percentage-point increase in their household expenditure relative to non-educated heads of household, by 2002 this increase had risen to 17.2 percentage points. The observed increase in the return to education implies a widening of the consumption gap between higher-educated household heads and those with lower levels of education. The absolute approach indicates that the increase in the return to education of household heads contributed to an impressive 2.6 percentage-point decrease in the poverty headcount. In contrast, the relative approach indicates that changes in the return to household-head education increased (relative) poverty by 0.4 percentage points, demonstrating the inequality-increasing impact of this effect (Table 3.5).
The decline In the return to education for other household members tended to Increase poverty and Inequality, and decreased both In urban and rural areas. On one hand, as members of poor households have lower education, the decline in the return to education of non-household heads helped to reduce inequality. On the other hand, poor households have larger household sizes and, as a result, the total number of household members affected by the decline in the return to education was higher for poor households. This second effect was dominant and so the change in the return to education for other household members slightly increased inequality.
Table 3.5 Decomposition of changes in poverty incidence by endowments, 1999 to 2002
(Percentage polnt change) Absolute Approach Relative Approach Initial values (%) 23.4286 2 3.4 2 8 6 End value (2002) (%) 17.6002 17.6002 Change in poverty -5.8284 -5.8284 Growth effect -8.2180 -8.2180 Distribution effect 2.3900 2.3900
Gender -1.7504 -0.1420 Education of household head -2.5864 0.4086 Experience 3.5309 -0.2176 Other member educatlon 1.2774 0.1630 Asset: household status -0.8124 -0.1951 Density 1.6541 -0.5493 Access to secondary educatlon -0.1131 -0.1344 Access to informal courses 0.0535 -0.0592 Access to credit -0.4024 0.3539 Access to infrastructure 0.0636 -0.0279 Access to communication 0.6866 -0.2699
Occupational choice effect -1.5536 1.3901 Household occupation return -3.59 13 0.9034 Other member occupation return 0.0504 0.2576 Endowment of occupational choke (oc) 1.9874 0.2290
Non observables’ variance 1.1451 0.0683 Price + residual variance + occupational effect 0.0529 0.7884 Population effect -5.8813 1.6016
Overall price effect 1.6014 -0.6699
Constant effect -1.1401
Source: Susenas, 1999 and 2002.
54

MAKING THE NEW INDONESIA WORK FOR THE POOR
0 The effect of the decrease In the return to experlence In the labor market was actually poverty- Increaslng, while reducing inequallty. More experienced household heads are less likely to be poor. This therefore means that the rich are hurt disproportionately more by a decline in the return to experience and, hence, this effect reduces inequality.67 The experience price effect increased absolute poverty substantially by 3.5 percentage points.
0 The Increased return to access to credit caused a decrease In poverty, but was Inequality Increaslng. While the return to access to credit increased substantially in urban areas, it decreased slightly in rural areas. As the increase in the return to access to credit in urban areas more than compensated for the effect of a lower return in rural areas, the overall price-effect of access to credit reduced the incidence of poverty by 0.4 of a percentage point. This effect was also inequality increasing. This is because, when richer households have higher access to a particular factor, an increase in the return to this higher access will also increase inequality.
Occupational-choice effect: changes were poverty reducing but inequality increasing
With the simulated occupationalchoice movement, one can assess the effect of changes In occupatlonal behavlor on the expenditure distribution. This is done by using the sample of 1999 and deriving for each household member what their household expenditure would have been if their occupation behavior had followed the simulated choices. The results of all these factor changes appear in Table 3.6, which demonstrates the movement towards informal and agriculture sectors in the postcrisis period.68
Table 3.6 Post-crlsls movement towards Informal and agriculture sectors
Share (%) Net movement (% point) 1999 2002 Simulated Actual Simulated
Inactive 32.5 34.07 32.53 1.57 0.03
Informal 18.58 21.19 26.5 2.61 7.92
Informal 1.9 2.62 2.62 0.72 0.72
Agriculture Formal 6.22 4.09 4.1 -2.13 -2.12
Industry Formal 10.99 10.79 9.43 4 .2 -1.56
Servlcer Formal 11.97 10.4 9.68 -1.57 -2.29 Informal 17.83 16.85 15.14 4.98 -2.69
Source: Susenas 1999 and 2002.
There was a poverty-increasing movement towards the informal sector and agriculture over the period. The change in occupational-choice behavior between 1999 and 2002 was dramatic. In net terms, about 6.4 percent of the entire working-age population switched from formal into informal employment, with the major shifts being towards informal agriculture and informal industry.69 A movement towards the two sectors yielding the lowest occupational returns is bound to increase poverty. The labor movement simulated an increase in poverty incidence of 1.98 percentage points from 1999 to 2002.
This labor movement across sectors hurt the poor more than the non-poor and hence also had an inequallty Increaslng effect. That this sectoral shift in occupations is inequality-increasing is also not surprising, since the movement towards the informal sector primarily affected poor households. Indeed, the rate of net entry into informal agriculture decreases with expenditure (see Figure 3.11). As formal sector jobs experienced larger increases in return and, at the same time, the increases in urban areas were larger, the non-poor obtained larger gains. Hence, these changes in return contributed to an increase in inequality.
55
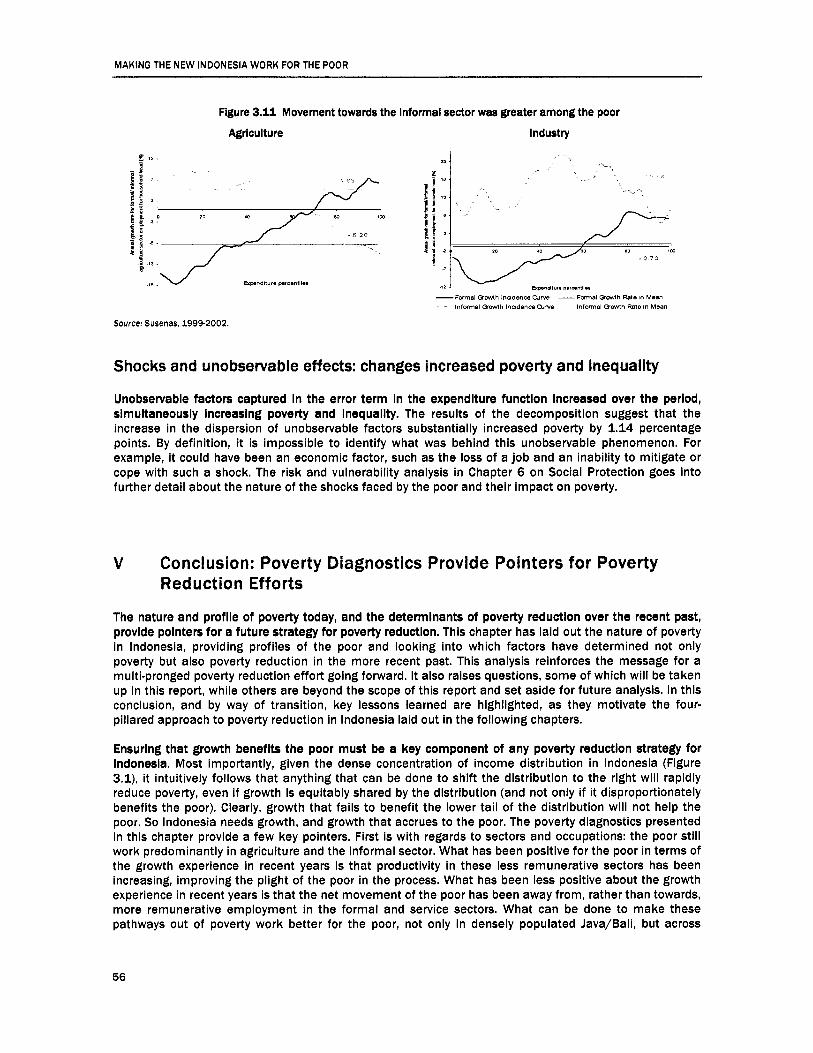
MAKING THE NEW INDONESIA WORK FOR THE POOR
Figure 3.11 Movement towards the Informal sector was greater among the poor Agriculture Industry
l
.11
m m - 0 7 2
-Formal ODwth lnadenm Cuwe . _ Informal Cm*rth lnadenm oilwe l n f m a l O w i h Rate in Mean
- Fwmal e w i h Pale in Mean
Source: Susenas, 1999-2002.
Shocks and unobservable effects: changes increased poverty and inequality
Unobservable factors captured in the error term in the expenditure function increased over the period, simultaneously increasing poverty and inequality. The results of the decomposition suggest that the increase in the dispersion of unobservable factors substantially increased poverty by 1.14 percentage points. By definition, it is impossible to identify what was behind this unobservable phenomenon. For example, it could have been an economic factor, such as the loss of a job and an inability to mitigate or cope with such a shock. The risk and vulnerability analysis in Chapter 6 on Social Protection goes into further detail about the nature of the shocks faced by the poor and their impact on poverty.
V Conclusion: Poverty Diagnostics Provide Pointers for Poverty Red uct io n Efforts
The nature and profile of poverty today, and the determlnants of poverty reduction over the recent past, provlde pointers for a future strategy for poverty reduction. This chapter has laid out the nature of poverty in Indonesia, providing profiles of the poor and looking into which factors have determined not only poverty but also poverty reduction in the more recent past. This analysis reinforces the message for a multi-pronged poverty reduction effort going forward. It also raises questions, some of which will be taken up in this report, while others are beyond the scope of this report and set aside for future analysis. In this conclusion, and by way of transition, key lessons learned are highlighted, as they motivate the four- pillared approach to poverty reduction in Indonesia laid out in the following chapters.
Ensuring that growth benefits the poor must be a key component of any poverty reduction strategy for Indonesia, Most importantly, given the dense concentration of income distribution in Indonesia (Figure 3.1), it intuitively follows that anything that can be done to shift the distribution to the right will rapidly reduce poverty, even if growth is equitably shared by the distribution (and not only if it disproportionately benefits the poor). Clearly, growth that fails to benefit the lower tail of the distribution will not help the poor. So Indonesia needs growth, and growth that accrues to the poor. The poverty diagnostics presented in this chapter provide a few key pointers. First is with regards to sectors and occupations: the poor still work predominantly in agriculture and the informal sector. What has been positive for the poor in terms of the growth experience in recent years is that productivity in these less remunerative sectors has been increasing, improving the plight of the poor in the process. What has been less positive about the growth experience in recent years is that the net movement of the poor has been away from, rather than towards, more remunerative employment in the formal and service sectors. What can be done to make these pathways out of poverty work better for the poor, not only in densely populated Java/Bali, but across
56
MAKING THE NEW INDONESIA WORK FOR THE POOR
regionally diverse Indonesia? Second, and related, it would appear from these poverty diagnostics that investing in the endowments of the poor that are particularly important in reducing poverty and connecting them to factor and product markets will be crucial. The diagnostics in this chapter show that improved educational endowments-and going beyond primary educatiowis a key factor in reducing poverty, and that recent poverty reduction progress has been dominated by both the endowment and return effects on human capital. Investing in the poor will be essential. Also key to income growth among the poor is access to infrastructure. Importantly, access to roads and credit has enabled the poor to link into markets. Connecting the poor to growth will be key.
Ensuring that public spending on services work for the poor will be critical in addressing poverty reduction. Indonesia is lagging on some key non-income poverty output and outcome indicators, such as access to safe water and sanitation, secondary school enrollment, maternal mortality and child malnutrition. Clearly, investing appropriately in health and education services that will allow Indonesia to achieve its goals in these areas will be crucial to the challenge of spending better for poverty reduction. Moreover, income poverty-let alone non-income dimensions of poverty-is not surprisingly critically dependant on access to public services that help improve non-income dimensions of poverty. For example, the diagnostics presented here show that access to secondary education and informal courses (especially in urban areas) correlate with poverty. The diagnostics also raise some issues related to the quality of outcomes and service delivery, with the return to access of certain key public services among the poor (such as to secondary education and roads) actually declining in recent years. This raises the question of not only which sectors to spend on, but also how best to spend in these sectors to enhance the return to the poor.
Ensurlng that social protection works for the poor must be a key element of any poverty reduction strategy. The diagnostics presented in this chapter clearly reveal the vulnerability of Indonesia’s poor and near-poor to shocks. As mentioned in the World Development Report 2000-01, vulnerability and insecurity are important dimensions of poverty in and of itself, Again, this is intuitively clear in looking at the Indonesian income distribution in Figure 3.1 and the gradient of the distribution at the poverty line. Any decreases to incomes among households anywhere close to the poverty line will have a major impact on poverty. Moreover, the diagnostics show that there is a high level of ‘churning’ and transient poverty, as this dense population around the poverty line, including the near-poor, moves in and out of poverty from one year to the next, depending on shocks. (The nature of these risks, vulnerabilities and shocks is discussed further in Chapter 6 on Social Protection). Related to making spending work for the poor is the question of how best to put together a social protection system that addresses the high vulnerability to poverty among Indonesians. This is a question that becomes increasingly appropriate to ask and address as Indonesia joins the ranks of middle-income countries and makes progress in reducing poverty to more manageable levels.
Finally, poverty diagnostics also reaffirm the importance of the government itself being able to work for the poor and deliver on the above agenda. Putting into place systems that ensure poverty-focused planning and budgeting in government will be a key part of this economic governance agenda for poverty reduction. But public-spending allocations and policy decisions alone will not automatically lead to poverty reduction. Evidence has shown that public service delivery is failing the poor (World Bank, 2006k). Programs need to be implemented and policy enacted and enforced. Enhancing accountability of government, as well as capacity, becomes crucial to this effort. In an archipelago the size of Indonesia, with weak capacity, this is a major issue. Moreover, given the vast regional disparities noted in this chapter, the strategies relevant for poverty reduction will invariably need to be fine-tuned from one region to another. Decentralization, if it works well, offers the best vehicle for achieving this. There is scope for considering how the decentralization framework could be better used to address the challenge of poverty reduction in its diversity.
57

MAKING THE NEW INDONESIA WORK FOR THE POOR
Sumatra is a vast island, almost four times the size of 45.2 9 1
third the size of Java’s. It contains seven provinces 69.3 and nUmerOUS ethnicities, and is rich in natural Infant mortality (deaths per 1,000 live births) 31.7 resources. Indeed, its resources have long been a Avg land-holding size (m2) 231.0 major factor in driving the Indonesian economy. Proportion of total poor (%) 21.8 Medan, Indonesia’s third-largest city and its largest
Population (m) Population density (per kmz) Avg life expectancy (yrs)
neighboring Java, but with a population of only one
Number of poor (person) 7,879,861 city off Java, is located in North Sumatra.
Poverty map per district, Sumatra
20.29 30
Local economy: The economy of Sumatra is of considerable significance to the national economy, rich in oil and gas and an important producer of palm oil, rubber, coffee and timber. The region’s economy is well balanced between agriculture, the extractive industries and manufacturing, which together account for about 63 percent of the region’s GDP. Sumatra ranks third of the six regions in per capita revenue, far behind Papua, and slightly behind Kalimantan, with Rp 784,000 (US$83) per capita revenue in 2004. Of this sum, 56 percent comes from the government’s General Allocation Fund (DAU), while a further 2.4 percent comes from the Special Allocation Fund (DAK). The three largest components of spending per capita go on government and administration (29 percent), education (28.3 percent) and public works (11.3 percent). Although the region’s largest spending item is government and administration, as a proportion of total spending this is the lowest for any of the six regions.
Socioeconomic indicators: With 20.8 percent of Indonesia’s total population, Sumatra contains a similar proportion of the country’s poor, at 21.8 percent, and has a poverty headcount of 17.5 percent, slightly higher than the national average of 16.7 percent. Notwithstanding Sumatra’s relatively prosperity, the region still contains significant pockets of poverty, particularly in Aceh, the islands off the west coast of Aceh including Nias, coastal areas of South Bengkulu, and inland areas of North Lampung. Conversely, the lowest incidence of poverty is found around the major cities of Medan, Padang and Palembang, in Pekanbaru and Jambi, and on the island of Bangka.
58

MAKING THE NEW INDONESIA WORK FOR THE POOR
The region's workforce is concentrated in the agricultural sector, which accounts for 56.8 percent of all workers. Of this number working on the land, 87 percent work in the informal sector. Overall, more than 68 percent of the entire workforce is engaged in informal work, giving rise to insecurity and financial vulnerability. At almost 12 percent, Sumatra is third to the Java/Bali region and Kalimantan in the proportion of the workforce employed in industry, with 32 percent involved in the service sector. While official unemployment is relatively low at 6.5 percent, the region has the second-highest level of unemployment of the six regions, second only to Java/Bali with 7.2 percent
Where the poor work in Sumatra: Three-quarters of the poor in the workforce are subject to the insecurities of the informal sector, with 72 percent working in agriculture, 6 percent in services and 4 percent each in the transportation, construction and industrial sectors.
The structure of Sumatra's economy, 2004
Financial SIIVCOS
T i
water 0 5%
Source: Central Bureau of Statistics, National Socio-Economic Survey (Sunas). 2004
Non-monetary poverty indicators: Many indicators place Sumatra in third position, well behind Java/Bali, but close to Kalimantan. Overall, average life expectancy is almost two years less than in Java/Bali, at 69.3 years. At 97 percent almost everyone in Java/Bali has access to electricity, in Sumatra only 78 percent of the population has electricity, close behind Kalimantan at 80 percent. Clean water is only available to 62 percent, behind Java/Bali at 78 percent and Sulawesi at 63 percent. But in terms of clean water Sumatra is ahead of Kalimantan, where only 46 percent have access. For child malnutrition, Sumatra is also third, at 28 percent, higher than Java/Bali (23 percent) and, surprisingly, Papua (24 percent). But Sumatra does well compare with all the other regions in education. The region has the highest primary school enrollment ratio of 93.7 percent, and increases its lead in junior secondary high- school enrollments (69.3 percent) and senior secondary high- school enrollments (48.5 percent).Java/Bali is Sumatra's closest rival in school enrollments, with 93.4 percent, 66.1 percent and 42.4 percent, respectively. With such positive educational indicators, Sumatra's poor stand a relatively better chance of escaping from poverty.
59

MAKING THE NEW INDONESIA WORK FOR THE POOR
The region’s workforce is concentrated in the agricultural sector, which accounts for 56.8 percent of all workers. Of this number working on the land, 87 percent work in the informal sector. Overall, more than 68 percent of the entire workforce is engaged in informal work, giving rise to insecurity and financial vulnerability. At almost 12 percent, Sumatra Is third to the Java/Bali region and Kalimantan in the proportion of the workforce employed in industry, with 32 percent involved in the service sector. While official unemployment is relatively low at 6.5 percent, the region has the second-highest level of unemployment of the six regions, second only to Java/Bali with 7.2 percent
Where the poor work In Sumatra: Threequarters of the poor in the workforce are subject to the insecurities of the informal sector, with 72 percent working in agriculture, 6 percent in services and 4 percent each in the transportation, construction and industrial sectors.
The structure of Sumatra’s economy, 2004
Financial SBNICBS
TI
Manufan~ring 22 9% E l e ~ l r ~ ~ i t y Gas 6 16 5%
water 0 5%
Source: Central Bureau of Statistics, National SocieEconomic Survey (Sunas), 2004
Where the poor work In Sumatra
I I \
Non-monetary poverty Indicators: Many indicators place Sumatra in third position, well behind Java/Bali, but close to Kalimantan. Overall, average life expectancy is almost two years less than in Java/Bali, at 69.3 years. A t 97 percent almost everyone in Java/Bali has access to electricity, in Sumatra only 78 percent of the population has electricity, close behind Kalimantan at 80 percent. Clean water is only available to 62 percent, behind Java/Bali at 78 percent and Sulawesi at 63 percent. But in terms of clean water Sumatra is ahead of Kalimantan, where only 46 percent have access. For child malnutrition, Sumatra is also third, at 28 percent, higher than Java/Bali (23 percent) and, surprisingly, Papua (24 percent). But Sumatra does well compare with all the other regions in education. The region has the highest primary school enrollment ratio of 93.7 percent, and increases its lead in junior secondary high- school enrollments (69.3 percent) and senior secondary high- school enrollments (48.5 percent).Java/Bali is Sumatra’s closest rival in school enrollments, with 93.4 percent, 66.1 percent and 42.4 percent, respectively. With such positive educational indicators, Sumatra’s poor stand a relatively better chance of escaping from poverty.
59

MAKING THE NEW INDONESIA WORK FOR THE POOR
Llvlng conditions of every 10 people in Sumatera Poor Near- Non- Total Indonesia
poor poor avg
Do not have access safe water 5.7 5.1 4.0 4.6 4.4 Do not have access to decent sanitation 7.1 6.5 4.5 5.5 4.9 Do not have electricity 3.4 2.7 1.4 2.1 1.1 Live in villages without secondary school 5.1 5.1 4.1 4.5 4.2 Live in villages without a telephone 6.3 6.2 4.5 5.2 3.6 Are illiterate 1.0 0.9 0.6 0.8 1.1 Below the age of five are malnourished 3.6 2.8 2.5 2.8 2.5 Below the age of five were delivered by a traditional 3.6 3.0 1.8 2.5 3.2 untrained midwife (dukun)
Source: Susenas, 2004
comparator
Poverty proflle: Close to three-quarters of all poor and near-poor households live in rural areas. Close to 60 percent of poor households have more than five members, compared with only 48 percent of poor households nationally. Looking at non-monetary indicators, almost six poor households in ten have no access to safe water, while more than seven in ten have inadequate sanitation. Worse than the national average, 3.4 out of 10 poor households have no electricity. However, somewhat higher educational standards are reflected in Sumatra’s poverty profile, with higher levels of school enrollment leading to less than one poor person in ten being illiterate. This compares favorably with a national level of illiteracy among the poor of 1.6 out of 10. Nonetheless, poor households with malnourished children under the age of five remain higher than the national average, with 3.6 out of 10 poor children insufficiently fed. This compares with only 2.8 out of 10 poor malnourished children nationally.
In terms of difficulties experienced by the poor in gaining access, 7.6 percent have no asphalt road in their village, while 82.6 percent have no bank or credit facilities in their village.More than six poor households in ten live in villages with no telephone and half have no secondary school. In Sumatra, the poor have one paramedic for every 50 households, similar to the national average.
Focus on Java and Bali
Home to almost 6 1 percent of Indonesia’s population, the crowded islands of Java and Bali are the hub of the country’s political and economic life, with the unique characteristics of Bali as a famous tourist destination. Stunning beauty and an active chain of volcanoes nvg land-holding (m2) 177.7
industrialized and urbanized islands, with two major Number of poor (person) 20,727,966
Population (m) 131.7 Population density (per km2) 980 Avg life expectancy (yrs) 7 1 . 1 ~ ~ ~ ~ ) m o r t a l i t y ( d e a t h s per liooo live 25.0
notwithstanding, Java and Bali are Indonesia’s most Proportion of total poor (%) 57.3
industrial centers of Greater Jakarta and Surabaya. But over-population, together with a relative dearth of natural resources, also means that pockets of poverty exist in Java.
60

MAKING THE NEW INDONESIA WORK FOR THE POOR
Poverty map by district, Java and Bali
1 Kilometen 0 65 130 280
Percentage of poor
10 10 - 19 20 - 29
I 3 0 +
Local economy: The relative industrialization and sheer size of the economy of Java/Bali dominates other regions. As a result, the percentage shares of manufacturing, trade, restaurants and hotels, and financial services are the highest of the six regions, while Java/Bali’s agricultural share is the lowest. Indeed, agriculture comprises less than 12 percent of the region’s total GDP, while manufacturing accounts for over 30 percent. Reflecting its relatively scarce natural resources, only 2.6 percent of Java/Bali’s GDP comes from extractive industries, compared with 57 percent in Papua. As a result of its high population, the region has the lowest per capita allocation of the central government’s DAU, at only Rp 268,900 per capita (US$29).70 This sum is tiny compared with the per capita DAU in Papua, at Rp 1,834,200 (US$195). Java/Bali also receives the lowest total revenue per capita and per capita government spending of across all sectors of the six regions. For example, health spending is less than 20 percent per capita of that found in Papua.
The structure of Java/Ball’r economy, 2004
I 1 I Mining and
Transpodation Cornmunicati
6 1 Ole
Trade, Restaurant 8 5 3% \ Electnuty Gas L Hotel Water 21 8% 1 5 %
Where the poor work In Java/Ball
Source: Susenas, 2004.
Soclo-economlc Indicators: With 60.6 percent of Indonesia’s total population, Java/BaIi has 57.3 percent of the country’s poor with a poverty headcount of 15.7 percent, slightly less than the national average of 16.7 percent. This places the region in the paradoxical position of having the country’s lowest incidence of poverty while containing the largest number of poor of any of the six regions. While Bali and the Greater
6 1

MAKING THE NEW INDONESIA WORK FOR THE POOR
Jakarta areas have the lowest incidence of poverty in the region, poor kabupaten are found in western Central Java and on the island of Madura, East Java. Additionally, the region has the lowest workforce proportion engaged in agriculture, at only 36 percent, compared with 83 percent in Papua. Industry absorbs 22 percent of the workforce, while services employ a further 42 percent. Overall, Java/Bali has the lowest proportion of workers in the informal sector, at about 52 percent. Conversely, Papua has the highest overall informal sector ratio, at over 78 percent. With lower levels of informal employment, the region offers higher job security than elsewhere. However, 7.2 percent of the workforce is unemployed, the highest level of all six regions.
Where the poor work in Java/Bali: Those from poor households in Java/Bali work primarily in agriculture (56 percent), with far fewer working in the next most important sectors of trading and industry, at 14 percent and 11 percent, respectively. Despite the region’s relative prosperity, the poor remain closely tied to the land and rural life. Indicating a high level of vulnerability, 7.2 out of 10 workers from poor households work in the informal sector. Among workers from poor families, unemployment in Java/Bali is the highest of the six regions, at 12 percent.
Living condltlons of every 10 people In Java and Ball Poor Near- Non- Total Indonesia avg
poor poor comparator Do not have access safe water 4.8 4.5 3.9 4.2 4.4 Do not have access to decent sanitation 7.1 5.9 3.3 4.5 4.9 Do not have electricity 0.6 0.3 0.1 0.2 1.1 Live in villages without secondary school 4.9 4.6 3.6 4.0 4.2 Live in villages without a telephone 3.9 3.5 2.1 2.7 3.6 Are illiterate 1.6 0.9 0.9 1.1 1.1 Below the age of five are malnourished 2.5 2.4 2.3 2.3 2.5 Below the age of five were delivered by a 4.9 2.2 2.2 3.2 3.2 traditional untrained midwife (dukun) Source: Susenas. 2004.
Non-monetary poverty indicators: Java/Bali measures up comparatively well with other regions. At 71.1 years, the region has the longest life expectancy, while at 25 deaths per 1,000 live births it also has the lowest infant mortality rate. The region has the highest number of households with electricity, at over 97 percent; Kalimantan comes a distant second, with 80 percent. In addition, the region has the highest levels of access to clean water, at 78 percent, good sanitation, at almost 40 percent, and the lowest level of child malnutrition, at 23 percent. Of these indicators, the worst are Papua (34 percent), Nusa Tenggara/Maluku (21 percent) and Nusa Tenggara/ Maluku (38 percent), respectively. Although behind Sumatra, the region has Indonesia’s second-highest school enrollment at all levels of the primary and secondary education system.
Poverty profile: The poverty profile indicates 6.3 out of every 10 poor households are found in rural areas, only slightly less than the national average. However, only 42 percent of poor households have more than five family members, less than the 48 percent national average for the poor. Looking at non-monetary indicators, while 96 percent of poor households have electricity, almost half of all poor households have no access to safe water, while more than 7 out of 10 have no decent sanitation. Similar to the national average, 5.4 out of 10 poor households have less than primary school education while 1.6 out of 10 of the poor is illiterate. While the level of literacy in the region is on a par with the national average, this lags far behind Sumatra, Indonesia’s best performing region. Malnourishment among children from poor households remains high, at 2.5 out of 10, and half of all births in poor households are attended by an untrained traditional midwife (dukun).
Access of the poor to markets is important and despite the region’s infrastructure, over 8 percent of poor households still live in villages without asphalt road and 78 percent have no access to telecommunications. Moreover, access of the poor to credit is low, with over 75 percent of the poor have no bank or credit facilities in their village and access to education is limited because secondary schools
62

MAKING THE NEW INDONESIA WORK FOR THE POOR
are not available in the villages of poor households in 49 percent of cases. However, the region has the best paramedic coverage, with one paramedic for every 42 poor households.
Focus on Kalimantan
Kalimantan, the Indonesian portion of the island of (m) 11.9 Borneo, covers a huge area of some 5.4 million km2
This makes it one of Indonesia's most sparsely 31.8
populated regions, less sparse than only Papua. Avg la,.,d-holdI,,g (m2) 308.3
and industrial centers, such as Samarinda, Balikpapan and Banjarmasin, which are based on timber and the extractive industries, large tracts of the region's interior remain remote and accessible only by river.
Popuiation denslty(per km2) Avg life expectancy(yrs) ::::)mortaiity(deaths per ifooo live
Number of poor
2 1 69.3 but has a small population of less than 12 million.
Although Kalimantan has several major commercial Proportion of total poor (%) 3.6 1,303,586
Poverty map by district, Kallmantan
10.19 20.29
0- .. 30 +
Peroontage of poor
< 10
Local economy: Kalimantan's economic wealth is largely based on timber, mining and the oil and gas industry, with precious stones also important. The region's economy has Indonesia's second-smallest agricultural sector, contributing only 15.6 percent, with the largest contributions to regional GDP coming from the extractive industries (24.5 percent) and manufacturing (28.6 percent). Kalimantan has Indonesia's two largest coal mines. This means that as a contributor to the regional economy, manufacturing in Kalimantan is almost as high as in Java/Bali, where it contributes 30.2 percent. Kalimantan has Indonesia's second-highest per capita revenue at Rp 1,471,000 (US$156), second only to Papua. Of this revenue, about 46 percent comes in the form of the DAU and DAK, a lower proportion than
The structure of Kallrnantan's economy, 2004
Finanwal Services Sew,ce
Transportation and Communication
5 1 010
Where the poor work In Kalimantan
I Finance. Social Services
Buildinbr 'ra:;r%,, lnsuranca ent 5%
'3 I I
Source: Susenas, 2004.

Chapter 3 Understanding Poverty in Indonesia
all regions with the exception of Java/Bali. In terms of government spending, with the exception of Papua, Kalimantan has the highest per capita spending on public health, education, housing, agriculture and mining. As a proportion of spending, Kalimantan devotes more than any other region to public works and transportation.
Socioeconomic indicators: With only 5.4 percent of Indonesia’s total population, Kalimantan contains only 3.6 percent of the country’s poor and has a poverty headcount of 11.0 percent, significantly lower than the national average of 16.7 percent. Kalimantan has made considerable progress towards development and, unlike any other region, not one habupaten has a poverty incidence of over 30 percent, even in the remote interior of northern East Kalimantan. Kalimantan’s workforce distribution is very similar to Sumatra’s, 52.4 percent being concentrated in the agricultural sector. Of these agricultural workers, a large 90 percent work in the informal sector. Overall, more than 63 percent of the entire workforce is engaged in informal work. At 15.7 percent, Kalimantan is second only to the Java/Bali region in the proportion of the workforce employed in industry, with 31.8 percent involved in the service sector. Official unemployment is relatively low, at 5.2 percent
Where the poor work in Kalimantan: Seventy-one percent of the poor in Kalimantan work in agriculture, followed by 8 percent in trading and 6 percent in industry. Of all those from poor households who do work, three-quarters are engaged in the informal sector with little job security.
Llvlng condltions of every 10 people In Kaiimantan Poor Near- Non- Total lndonesla avg
poor poor comparator Do not have access safe water 6.9 6.6 4.9 5.4 4.4 Do not have access to decent sanitation 7.5 6.8 4.9 5.6 4.9 Do not have electricity 3.3 2.7 1.5 1.9 1.1 Live in villages without secondary school 4.8 4.6 3.8 4.1 4.2 Live in villages without a telephone 5.7 5.7 4.5 4.9 3.6 Are illiterate 1.4 1.1 0.8 0.9 1.1 Below the age of five are malnourished 3.4 3.8 3.3 3.4 2.5 Below the age of five were delivered by a 5.1 4.4 3.0 3.5 3.2 traditional untrained midwife (duhun)
Source: Susenas. 2004.
Non-monetary poverty Indicators: Despite this apparent strength, overall non-monetary indicators of poverty for the region are mixed. Only 46 percent have access to clean water, well behind all other regions with the exception of Papua, although 30 percent have access to sanitation, a higher level than in either Papua, or Nusa Tenggara/Maluku. Indicating a higher level of industrialization and urbanization, 80 percent of the residents of Kalimantan have electricity, second only to Java/Bali, at 97 percent. But despite this, Kalimantan’s level of child malnutrition is high, at 32.5 percent, with only Nusa Tenggara/Maluku worse, at 37.5 percent. In terms of education, Kalimantan is on a par with Java/Bali for primary school enrollments, at 93.4 percent, but as children move up through the school system so enrollments more closely resemble Sulawesi’s pattern, with 60.3 percent enrolling in junior high school and only 38.2 percent in senior high school. As such, Kalimantan lies in the middle of the six regions in terms of school enrollments.
Poverty profile: Kalimantan’s poverty profile indicates that the poor continue to live primarily in rural areas, where 7.5 out of 10 poor households are to be found. This is higher than the national average of 6.9 out of 10 poor households. Another sign of poverty, over 60 percent of poor households have more than five family members, the highest level of the six regions. Looking at non-monetary indicators, poor households in the region experience higher levels of poverty than average poor households across the country. For instance, 6.9 out of 10 poor households have no access to safe water, compared with the national poor households’ average of 5.2 percent. Three-quarters of poor households in Kalimantan have inadequate sanitation, slightly higher than the national average. While 2.1 out of 10 poor households across Indonesia have no electricity, in Kalimantan 3.3 out of 10 poor households are without electricity. Child malnourishment is also rather prevalent among poor households, with 3.4 out of 10 children under
64

Chapter 3: Understanding Poverty in Indonesia
five malnourished, compared with 2.8 out of 10 for poor children nationally. Slightly below the national average for the poor, 5.5 out of 10 people from poor households have received less than primary school education, while illiteracy is close to the average for the poor, at 1.6 out of 10. In terms of difficulties experienced by the poor in gaining access to markets, almost three times as many poor households in Kalimantan live in villages without an all-weather road as compared with average poor households in Indonesia, highlighting the difficulties of transportation in the more remote areas of the region. Over 81 percent of the poor have no bank or credit facilities in their village, while a similar proportion have no access to telecommunications. Slightly less than half of all poor households are found in villages with no secondary school
Focus on Sulawesi
The strangely shaped island region of Sulawesi contains a diverse mixture of ethnic groups and religions. Close to one-third of the land area of Kalimantan, Sulawesi has a somewhat larger population, at 15.6 million, and consequently a far higher density of 80 people per km2, somewhat less than Sumatra. The region has one major city and port, Makassar in the south, but is otherwise predominantly rural.
Population (m) 15.6 Population density (per km2) 80 Avg life expectancy (yrs) 69.4 Infant mortality (deaths per 1,000 live births) 31.2 Avg land-holding size (ml) 196.7 Proportion of total poor (%) 7.2 Number of poor (person) 2,597,7
16
Poverty map by district, Sulawesl
‘* - 5.i
The structure of Sulawesl’s economy, 2004
SeNlCeS
TransDonation and I Agnwlture Communlcatio 34 3%
7 7%
Mining and Quanyng
7 5%
Trade Restauran note1 14 3%
construct iod 7 0% Electnuty, i Gas \Manufadunng 6 10 4%
Water 0 8%
Source: Susenas, 2004
Local economy: The regional economy of Sulawesi is heavily reliant on agriculture, which comprises over 34 percent of the region’s GDP-the highest agricultural contribution of any of Indonesia’s six regions. While there is some mining and manufacturing in Sulawesi, their contribution is modest, together
65

Chapter 3: Understanding Poverty in Indonesia
accounting for less than 18 percent of the region's GDP. Trade, tourism and services together account for 27.2 percent of the region's economy, with the services component the second-highest of the six regions, at about 15 percent. Revenue per capita is closed to the national average, at Rp 889,000 (US$95), but this accrues largely in the form of the DAU and DAH. indeed, Sulawesi receives the second-highest proportion of any region from the DAU and DAH, at 74 percent, close behind the highest recipient, Nusa Tenggara/Maluku, which receives 77 percent in government grants. In terms of government spending, Sulawesi devotes the lowest proportion per capita of the six regions to public works, but the highest proportion per capita to education.
Where the poor work in Sulawesl
smw 75%
Socio+conomlc Indicators: With only 7.2 percent of Indonesia's total population, Sulawesi also contains exactly 7.2 percent of the country's poor and has a poverty headcount of 16.7 percent the national average. Pockets of poverty exist particularly in kabupaten Poso, in Central Sulawesi, exacerbated by sectarian conflict, and in Gorontalo and Boalemo to the north. The areas with the lowest poverty incidence center on Pare-Pare, South Sulawesi, and Minahasa, North Sulawesi, together with the cities of Makassar and Palu. While Sulawesi's workforce is heavily engaged in agriculture, with almost 57 percent working in this sector, services are also important, employing almost 34 percent. Conversely, less than
10 percent of workers are involved in manufacturing. Seventy percent work in the informal sector, with only Nusa Tenggara/Maluku and Papua having higher levels of informal employment. Official unemployment accounts for 6.4 percent of the workforce.
Where the poor work in Sulawesi: Similar to other regions, the poor in Sulawesi rely heavily on agriculture for employment at 76 percent, followed by 7 percent in trading and 5 percent in industry.
Llvlng condltlons of every 10 people in Sulawesi Poor Near- Non- Total Indonesia avg
poor poor comparator Do not have access safe water 5.3 4.8 4.0 4.4 4.4 Do not have access to decent sanitation 7.5 6.3 4.0 5.1 4.9 Do not have electricity 4.5 3.0 1.4 2.3 1.1 Live in villages without secondary school 5.8 5.4 4.5 4.9 4.2 Live in villages without a telephone 7.0 6.2 4.2 5.1 3.6 Are illiterate 1.8 1.5 1.0 1.2 1.1 Below the age of five are malnourished 3.4 3.0 2.4 2.8 2.5 Below the age of five were delivered by a 5.9 5.3 3.4 4.5 3.2 traditional untrained midwife (dukun)
Source: Susenas, 2004.
Non-monetary poverty Indlcators: Overall, the indicators for the region are very similar to those of Sumatra's. Seventy six percent have electricity, while only 34 percent have adequate sanitation and 63 percent have access to safe water. Malnutrition among the under-fives is also close to Sumatra's level, at 28.9 percent. However, Sulawesi performs less well in education, with primary school enrollments at 90.3 percent, only worse in Papua, at 85.3 percent. Interestingly, enrollments in higher levels of education in Sulawesi improve, with 39.4 percent of children enrolling for senior secondary school, ranking third behind Sumatra and Java/Bali.
Poverty profile: Sulawesi's poverty profile reveals the extent to which the poor are still trapped in agriculture, with 8.7 out of 10 poor households found in rural areas. This compares with 6.9 out of 10
66

Chapter 3: Understanding Poverty in Indonesia
poor households for the country as a whole. The size of poor families is large, with 58 percent having more than five members. In terms of non-monetary indicators, over half of all poor households have no access to safe water and threequarters have inadequate sanitatiotHevels that are fairly typical nationally. What is less typical is that 4.5 out of 10 poor households in Sulawesi have no electricity, indicating the extent to which poor households remain disproportionately rural and disconnected from urban centers. In terms of education, 60 percent of those in poor households have less than primary education and 1.8 out of 10 remain illiterate. For children from poor households aged 6 to 14, 7.8 out of 10 are in school, somewhat lower than the national average for children from poor households of 8.4 out of 10. Child malnutrition is also rather high, with 3.4 out of 10 poor children under the age of five malnourished, compared with 2.8 out of 10 poor children nationally. The likelihood of a child being delivered by an untrained traditional midwife (dukun) is far higher in a poor household in Sulawesi, at almost 60 percent, compared with 47 percent for poor households nationally.
In terms of the poor struggling to gain access to markets, 7.9 percent have no access to an asphalt road. The poor in Sulawesi are the most financially disconnected of the six regions, with 89.3 percent having no access to credit or banking facilities, while 70 percent have no access to a telephone in their village (compared with 49 percent of poor households nationally). Of poor households, 5.8 out of 10 live in villages that are without a secondary school.
Focus on Nusa Tenggara and Maluku
The region of Nusa Tenggara and Maluku (NT/Maluku) covers a vast expanse of islands and ocean, much of which is remote and only connected to the rest of the country by limited and infrequent transportation services. Lacking significant natural resources and major infrastructure, it is not surprising that this region suffers from high levels of poverty. The region shares some of the characteristics of Papua in having a relatively small population and low levels of infrastructure.
Population (m) 10.3 Population density (per km2) 6 2 Avg life expectancy (yrs) 66.7 Infant mortality (deaths per 1,000 41.9 live births) Avg land-holding size (m2) 196.2 Proportion of total poor (%) 7.4 Number of poor 2,692,408
Poverty map by district, Nusa Tenggara and Maluku
Percentage of poor
&B'P < 1 0 10.19
2 0 . 2 9 111 3 0 t
" . ? S
3
67

MAKING THE NEW INDONESIA WORK FOR THE POOR
Local economy: The regional economy of Nusa Tenggara/Maluku is based primarily on agriculture and fishing, with some tourism until thls declined after the sectarian unrest of 1999 in Maluku and more generally since the 2002 Bali bombing. Maluku is home to some mining and timber industries. As the fabled ‘spice islands’, Maluku also produces cloves and nutmeg, although low international prices have undermined these two crops as major sources of revenue. Agriculture contributes 33 percent to the region’s economy, with mining at 15.7 percent and trade and tourism at 15.5 percent. The contribution to the region’s GDP from services is the largest of any of the six regions, at 14.8 percent. The region’s revenue per capita is about average, at Rp 859,000 (US$91), marginally higher than Sumatra. The region receives the highest proportion of its revenue in the form of the DAU and DAH, together accounting for 79
The structure of Nusa Tenggara/Maluku’s SBNICeS
Finanual SENICES
Agriculture 32 8%
lade Restaurant
Mining and
0 4%
Source: Susenas, 2004
Where the poor work In Nusa
Trading 8% , \ 71’ 4%
Other Constructions 0%
percent of total revenue. In terms of government spending per capita, Nusa Tenggara/Maluku spends the lowest proportion of all six regions on transportation, but the highest on health and agriculture, forestry and fisheries.
Socio+conomic Indicators: With only 4.8 percent of Indonesia’s population, Nusa Tenggara/Maluku contains 7.4 percent of the country’s poor and has a poverty headcount of 26.1 percent, well above the national average of 16.7 percent. On a kabupaten basis, poverty is particularly prevalent in Maluku (North Maluku fairs slightly better), Sumba, western Flores, West Timor and the small islands to the east of Wetar. With the sole exception of Ambon, no kabupaten has a poverty incidence of less than 10 percent. Only in Papua does a higher proportion of the population work on the land. Over 72 percent of the workforce in Nusa Tenggara/Maluku works in agriculture (75 percent in Papua), whereas in Java/Bali only around 36 percent work in agriculture. Compounding this is the informal nature of employment across the region, with 77 percent of all the region’s workers employed in informal jobs. The level of informal work is even higher in the agricultural sector, at over 95 percent, higher only in Papua. Unemployment in the region stands at a low 4.9 percent.
Where the poor work In Nusa Tenggara/Maluku: Up to 75 percent of the poor work in agriculture, followed by 8 percent in industry and 6 percent in trading.
68

MAKING THE NEW INDONESIA WORK FOR THE POOR
Llvlng condltlons of every 10 people In Nusa Tenggara and Maluku Poor Near- Non- Total lndonesla avg
poor poor comparator Do not have access safe water 5.1 5.1 4.2 4.7 4.4 Do not have access to decent sanitation 8.2 7.3 5.2 6.6 4.9 Do not have electricity 5.0 4.4 2.9 3.9 1.1 Live in villages without secondary school 3.8 3.9 3.7 3.8 4.2 Live in villages without a telephone 6.8 6.5 5.5 6.1 3.6 Are illiterate 1.9 1.8 1.3 1.6 1.1 Below the age of five are malnourished 3.4 4.0 3.2 3.5 2.5 Below the age of five were delivered by a 5.9 5.1 3.9 4.9 3.2 traditional untrained midwife (duhun) Source: Susenas, 2004.
Non-monetary poverty indlcaton: these indicators in Nusa Tenggara/Maluku exhibit some worrying signs. The region has Indonesia’s worst life expectancy, at only 66.7 years (compared with 74 years in Jakarta). The region has a very high level of child malnutrition, with 35 percent of children under five being malnourished, far higher than the country’s best performing region of Java/Bali, at 23 percent. Not surprisingly then, infant mortality is the highest of the six regions, at 41.9 deaths per 1,000 live births, far higher than the closest level in Papua. While 63 percent have access to clean water, ahead of Kalimantan and Papua, Nusa Tenggara/Maluku has the country’s worst level of sanitation, at only 20.6 percent, far inferior to even Papua’s level of 28 percent. In education, Nusa Tenggara/Maluku also struggles, with enrollments throughout the education system behind those of the rest of the country. Although the region is ahead of Papua, only 85.3 percent of children enroll for primary school, while this falls to only 48.2 percent for junior secondary school and 3 1 percent for senior secondary school. Not surprisingly, almost 20 percent of the population is illiterate, although this level of illiteracy is still almost twice as high as in Papua.
Poverty profile: The poverty profile for Nusa Tenggara/Maluku shows that threequarters of all poor households live in rural areas. Out of 10 poor households, 5.8 have more than five family members, compared with only 4.8 out of 10 for poor households nationally. Looking at non-monetary indicators among poor households, 5.1 out of 10 have no access to safe water, while 8.2 out of 10 have inadequate sanitation facilities. Fully half of all poor households in Nusa Tenggara/Maluku have no electricity, which compares poorly with the national average for poor households, where only 2.1 out of 10 have no electricity. This illustrates the problems and high costs of supplying electricity to numerous remote islands. Over 60 percent of poor household members have less than primary school education, with 1.9 out of 10 being illiterate. Also of concern, only 8.3 out of 10 of poor children aged 6 to 14 are in school, while half of this age group works as child laborers. Of children below the age of five, 3.4 out of 10 are malnourished compared with 2.8 out of 10 for poor children nationally. Almost 60 percent of poor household births in the region are delivered by a traditional midwife (dukun).
Regarding the difficulties experienced by the poor in gaining access to markets, more than 10 percent of the poor have no all-weather road in their village. Just over 8 out of 10 poor families live in villages with no bank or credit facilities. Similarly, communication is a problem for poor households, with 8 1 percent having no access to telecommunications. Thirty-eight percent of poor households live in villages without a secondary school.
69

Chapter 3: Understanding Poverty in Indonesia
Focus on Papua
2.5 recently formed West lrian Jaya, are the country's Population kml) 6.0 largest, together Covering 22 percent of Indonesia's 68.4
34.9 provinces, being furthest from Jakarta and the Avg land-holding size (m2) 156.2 industrial centers of Java and Sumatra. The region is 2.7
966,589
Indonesia's eastern-most provinces, Papua and Population (m)
Avg life expectancy (yrs) Infant mortality (deaths per 1,000 live births) total landmass. They are also Indonesia's most remote
Proportion of total poor(%)
Indonesia's most sparsely populated, with a population of only 2.5 million (only 15 percent of Jakarta's population). Almost three-quarters of its area comprise of primary rainforest and Indonesia's highest mountain range.
Number Of poor
Poverty Map by District, Papua and West lrlan Jaya
Percentage o i poor
< 10 10. 20.29 30
Local economy: Although rich in minerals and other natural resources, the main economic activities of Papua's residents remain subsistence agriculture and animal husbandry, together with fishing and hunting. However, the largest contributor to the region's economy is mining and quarrying, which accounts for 57 percent of regional GDP. This is followed by agriculture at just under 20 percent. The region's small population, coupled with high revenues from industry and central government grants, results in per-capita revenue for the region that is the highest in Indonesia. Over 58 percent of the region's revenue comes from the DAU and DAK. As for government spending per capita, the region has the highest spending across all sectors because of the small population. Curiously, the region allocates the highest proportion of per capita spending of all six regions to government and administration, at over 36 percent. Conversely, it spends proportionately the lowest per capita of all regions on public health and education. The local economy has posted an impressive average GDP growth of 10 percent over the past 15 years, outperforming Indonesia as a whole. But fiscal wealth and economic growth cannot boost development to the extent that this will dramatically benefit the poor. Despite impressive growth, the region continues to under-perform in overcoming poverty and improving human development outcomes.
70

Chapter 3: Understanding Poverty in Indonesia
Where the poor work In Papua Tlawp0fl.lio"
1%
Sociwconomic lndlcators: Notwithstanding the economic benefits stemming from decentralization in 2000 and the 2001 Special Autonomy Law for Papua aimed at speeding up economic development, the region continues to register Indonesia's highest headcount poverty level of 38.7 percent. This is well above the country's second-highest headcount of 26.1 percent In NT/Maluku and the national average of 16.7 percent. However, only 1.2 percent of Indonesia's total population and a mere 1.7 percent of the country's poor reside in this region. While more than 53 percent of the poor is found in Java, creating a dilemma for policy-makers. The highest prevalence of poverty is found in kabupaten Manokwari, together with the costal kabupaten of Nabire and Yapen Waropen and the highland district of Puncak Jaya. While the lowest incidence of poverty is in the north and south of Papua and the western half of the 'bird's head', west of Manokwari, no kabupaten in this region registers a poverty incidence of less than 10 percent.
In terms of employment distribution, only 5 percent are involved in industry, while 73 percent of the population works in agriculture, with the remaining 22 percent working in the services sector. While the official unemployment rate is low, at 4.8 percent, those working are primarily involved in the informal sector, which accounts for 78.3 percent of all those in some form of employment. More worrying, of those working in agriculture, over 97 percent are informally engaged, making their earnings insecure and vulnerable to shocks.
Where the poor work In Papua: A staggering percentage of the poor in Papua is involved in agriculture (94 percent). Of the region's poor, only 1 percent work in industry or services. This contrasts with Java/Baii, where 11 percent of the poor work in industry or services.
Non-monetary poverty lndlcators: Despite the high revenue per capita, the non-monetary indicators of poverty for Papua are among Indonesia's highest. Only 34 percent have access to clean water and 28 percent to adequate sanitation. Only 46 percent have electricity, the lowest level in the country. The region is the worst performer in education, with only 85 percent of all children enrolling for primary education, falling dramatically to 48 percent for junior secondary and 3 1 percent for senior secondary. Against these alarming indicators, Papua has the second-lowest level of malnutrition rate for under-fives at 24 percent compare with other regions, with Java/Bali at 23 percent. The continuing prevalence of poverty is illustrated by the fact that 56 percent have less than primary education and illiteracy stands at 25 percent.
7 1

MAKING THE NEW INDONESIA WORK FOR THE POOR
Living condltlons of every 10 people In Papua
Poor Near- Nom Total lndoneslaavg poor poor comparator
Do not have access safe water 6.9 5.9 4.3 5.7 4.4 Do not have access to decent sanitation 9.0 7.4 4.7 6.9 4.9 Do not have electricity 8.3 5.6 2.1 5.2 1.1 Live in villages without secondary 8.4 6.8 3.5 6.1 4.2 school Live in villages without a telephone 9.0 7.3 3.9 6.6 3.6 Are illiterate 3.9 2.4 1.3 2.5 1.1 Below the age of five are malnourished 6.1 1.9 1.2 1.8 2.5 Below the age of five were delivered by 2.4 3.0 1.1 2.0 3.2 a traditional untrained midwife (dukun)
Source: Susenas, 2004.
Poverty profile: The poverty profile of poor households indicates that 9.5 out of 10 poor households live in rural areas, significantly higher than the average 6.9 households across the archipelago. However, only 4 out of 10 poor households have more than five family members, below the national average for poor families. Looking at non-monetary indicators, 6.9 out of 10 have no access to safe water, while 9 out of 10 poor households have inadequate sanitation in their homes and just over 8 out of 10 poor households have no electricity. Low levels of education prevent many escaping from poverty: almost 4 out of 10 of the poor are illiterate and more than 7 out of 10 have never been to primary school. Of every ten children aged 6 to 14, only 7 out of 10 are in school and almost 10 percent already work as child laborers. Over 6 out of 10 poor children under the age of five are malnourished in Papua, compared with only 2.4 out of 10 in the Java/Bali region. In such circumstances it is extremely hard for children to escape from the poverty of their parents and far harder than for many children in poor families in other regions of the country.
The poor in Papua also face difficulties in gaining access to markets. Half of all poor households are found in villages only accessible by a dirt road, highlighting the inadequate linkages between the rural poor and the urban economic centers, while 83.5 percent have no access to bank or credit facilities. Ninety percent of poor households have no access to a telephone in their village and 8.4 out of 10 live in villages without a secondary school.
72
MAKING THE NEW INDONESIA WORK FOR THE POOR
LACK OF CLEAN WATER CAN HAVE DIRE HEALTH IMPACTS: TULANG BAWANG, LAMPUNG
Family plantation pawned to save the life of a mother
For married couple Tarna and Dasem, their cassava plantation had been their main source of income and hope for a better future. However, a little over a year ago, they were forced to pawn the plantation in order to pay for hospital bills incurred when Dasem experienced complications during labor. Dasem recalls that during her fifth month of pregnancy with her second child, she slipped and fell while carrying a bucket of water home from her neighbor’s well. Since then she had experienced pains in her lower back. These became much more intense during her eighth month of pregnancy, when she also experienced abnormal bleeding. Soon after, Dasem went into labor prematurely.
After withstanding a day of painful labor she finally gave birth, but the baby was sickly. Dasem’s dukun bayi (traditional birth attendant) was unable to remove her placenta. The one and only midwife in the village could not offer any help either. But the midwife was worried and advised Dasem to go to the subdistrict hospital because there were signs of infection.
It had never occurred to Tarna to put any extra money aside for extra medical expenses when his wife gave birth. In a panic to save his wife’s life, Tarna made a painful decision: he decided to pawn the family’s prized possession, a half hectare plantation, for just Rp 2 million.
But this modest sum was only enough to cover transportation to and from the hospital and three days of in- patient care. And, despite making such a large sacrifice, shortly after Dasem returned home her newborn baby died. ”I was totally devastated,” recounts Dasem. “All I could do was to hug our family cat everyday to comfort me; without the cat I wouldn’t have known how to go on.”
Already having pawned their plantation, the loss of their second child all but wiped out any hope left in Tarna’s family. The financial impact of that tragic incident fourteen months ago is still being felt by the family today: besides losing their plantation, they are still indebted to the family of the village midwife who administered the medication that Dasem used during labor. On top of that debt, Tarna also has an older debt for money borrowed to build the family home-a loan from a local fishery businessman, the ‘Fish Boss’, to whom Tarna sells his daily catch. And finally, Tarna still has to find the money to pay the installments on the loan used to buy his fishing canoe.
Now without his plantation, using his canoe Tarna paddles into the swamp each morning to catch fish. Tarna needs one full day to set up his fifty fish traps made of bamboo scattered throughout the swamp. He inspects each fish trap the following day. One fish trap usually catches one to three fish, although some traps fail to catch any fish at all. Tarna on average brings home about three kilograms of varied fish a day. One kilogram is sold to the ’Fish Boss’ for Rp 3,000 to Rp 6,000, the final price decided by the buyer depending on the type, quality and size of the fish.
Sometimes Tarna comes home empty-handed. “It’s because I cannot predict where in the swamp the fish will feed”, Tarna explains. If he comes home empty-handed and if no rice is available at home, his family is forced to ask for food from his neighbor. Should one day the neighbor require assistance (to cut the grass or cultivate the farm), Tarna and Dasem will offer a helping hand as a way of repaying their neighbor.
Tarna holds on to the hope that he will be able to pay off his debts quickly and not toil in the swamp too much longer. He wishes he could be back working on his own cassava plantation and hopes one day to be able to buy the plantation back. Then, who knows, if things work out maybe Tarna will be able to save a little money, and build up enough capital to open up his own food stall one day, where Dasem can work. Hopefully, if Dasem eventually tries for another child there will be a well closer to the house so there will no need to carry heavy buckets of water so far. And maybe, too, there will be more affordable and earlier healthcare during her pregnancy and the family can avoid losing what little they have if anything goes wrong.
73

Understanding Poverty In lndonesla
ACCESS TO WATER AND ELECTRICITY MOVES OUT OF REACH OF THE POOR: TANJUNG PR IO K, JAKARTA
Trapped by law wages in the Informal sector, a hard-working family cannot make ends meet
Rizal Syam was devastated when, in mid-2002 and at an age when he felt he was still productive (he was 55 years old), he was suddenly laid off. He had dedicated 22 years to his job in the service sector working at a large state owned port in North Jakarta. Rizal only received Rp 15 million in severance pay after all those years. And the loss of his job compounded an already difficult situation: Rizal’s wife, Nur Asmawati, had lost her job as a laborer at a manufacturing company back in 2000.
Rizal and Nur Asmawati used some of the severance pay for renovating their parents’ home, which was falling into disrepair. Some they used as start up capital for a nasi uduk an Indonesian specialty of rice cooked in coconut milk) food stall in front of their house, managed by Nur Asmawati. But the food stall never made a decent profit and after one year Rizal and his wife were once again unemployed. Rizal was forced to take the only other opportunity that seemed to be available: working in sanitation for his local RT (rukun tetangga, or neighborhood association), where he was made responsible for collecting rubbish and the cleaning and unblocking of open sewers.
Now three years later, Rizal collects his income directly from the 40 or so households in his RT at the end of every month. The monthly fees he collects only come to about Rp 200,000, but that sum does not include the Rp 20,000 levied by the RT for maintenance of his trash cart.
With such a meager income, it is hardly surprising that after increases in water and electricity rates Rizal and his family feel increasingly desperate when the monthly bills arrive. Sometimes, Rizal is able to salvage a few items that still have some value from the trash he collects, including plastic water-bottles, carton, steel alloy and used items made of aluminum. These goods he then sells to a used-goods collector. To further supplement their income, Nur Asmawati does some baby-sitting, watching over Adiansyah, and the youngest child of a working mother. For her babysitting services, Nur Asmawati earns Rp 200,000 a month.
Rizal explains that a representative from the state-owned drinking water company (PAM) visited the house recently to explain that he had failed to pay his water bills for over a year. As Rizal has accumulated Rp 1.25 million in fees and penalties for late payment and still could not guarantee to pay off the arrears, the representative was forced to turn off the water supply to Rizal’s family. Rizal also produces a notification letter from the state-owned electricity company (PLN). The message is basically the same: six months have passed since the electricity bill was last paid, putting his outstanding fees and penalties at Rp 600,000. His land and property taxes have not been paid for nine years, and now total Rp 600,000.
Rizal’s eyes well up with tears as he talks of his circumstances. But he is quick to add that his are not tears of sadness but rather tears of compassion. All this time, he feels that poor people such as himself are never given much thought in Indonesia, let alone helped to deal with their harsh circumstances. Nevertheless, Rizal does not want to become a burden to society or the government.
Rizal says he hopes the government will not only pay attention to office workers. He hopes it will also take into account people such as himself, who work in the informal sector for small wages-but who are nonetheless prepared to work. Thinking about the future of his young grandniece and nephew, Rizal also hopes the government will not only develop high-rise offices, but also open spaces and parks so that poor children living in overcrowded neighborhoods can still play in a decent, healthy environment.
In the evenings, when Rizal’s large family gathers together, they love to watch television programs that promise the fulfillment of the dreams of poor families, such as ‘Rebuild Your Home’ and ‘Surprise Money’. “Who knows,” dreams Nur Asmawati, “maybe one day it’ll be our turn?” But dreaming about TV game shows aside, if the economic climate were to improve and jobs once again became more abundant, maybe Rizal and Nur Asmawati could start to look for jobs in the formal sector, and reconnect to steadier and higher incomes. Then
74
Chapter 3 Understanding Poverty in Indonesia
they could start saving once again, perhaps putting enough aside to have another try at starting a small food business.
75

Understandfng Poverty in fndonesia
LACK OF OPPORTUNITIES LEADS TO A POOR DIET: SANGGAU, KALIMANTAN
The poorest household In the village
The only house in Entawak with walls still made of bamboo and with a roof still comprising leaves belongs to the family of Lukas. Most of the other houses in this village have walls made of wooden boards or stone, and roofs made from steel alloy. Reflecting this disparity, Lukas’s family is the poorest in the village and Lukas’s wife Rosalia often feels belittled by the talk of her neighbors.
The main sources of livelihood for Lukas’s family come from alternately harvesting rice on his father’s land and extracting rubber from the trees on his father’s plantation. Cultivating rice begins in June, when the land is prepared for planting, and lasts until the harvest at the end of the year. In the intervening period, from January to May, Lukas’s family members focus their daily efforts on extracting rubber from the rubber trees on his father’s plantation.
The rice harvest is stored for the family’s daily consumption and it is often shared with members of their extended family (father, mother, siblings) who also participate in cultivating the rice. Meanwhile, the rubber is sold and the proceeds used to purchase necessities. But this supplementary income is unreliable given that the extraction process depends to a large extent on weather conditions.
If the weather is bad, Lukas can often only work three days a week. Extracting rubber on a normal working day (from 6 am to 2 pm) yields three kilograms of rubber. Lukas sells one kilogram of rubber to Tauke, a rubber collector, at a price of Rp 7,00O/kg.
Lukas’s wife, Rosalia, is thankful that she and her husband rarely fall ill, but their two children, five-year- old Dewi and two-year-old Amos, often experience stomach aches. The family diet consists of rice twice a day (for breakfast they sometimes have coffee, but only occasionally), flavored with salty or sweet soy sauce. If she feels up to it, Rosalia searches in the forest nearby to gather vegetables (cassava, bamboo shoots and ferns). This means that rice and vegetables are the family’s staples, while they seldom consume sources rich in protein, such as fish, eggs, chicken or pork. Pork is a real treat and only eaten once a year, when they celebrate the harvest.
Rosalia is keen to limit her family to two children. To do this she takes a natural contraceptive made from a mixture of local grass, dried wood and water. The grass can be gathered from the forest, but only the traditional healer (dukun) knows the type of wood needed and the correct way to prepare it.
While buying sources high in protein would be expensive, Rosalia could always catch fish from the river nearby her house. But she hardly ever tries to do so. When asked whether she realizes that her two young children need different kinds of food other than rice and vegetables, especially protein-rich food, Rosalia says that she is afraid to give her children fish from the river. This is because according to local beliefs, children who consume river fish become infected with intestinal worms.
Lukas and Rosalia rarely travel beyond the limits of their village. Their interaction with outsiders is limited to health officials (at the Puskesmas) and security officers. Maybe these contacts with officialdom are what drive their aspirations for their children: they hope Dewi will one day become a nurse and Amos will join the military.
Maybe if there were some more opportunities for work in the village, perhaps through local development projects, they could make a little more money, improve their diet and start to renovate their house. A steady income would make such a difference and allow them to start constructing a more permanent h o m m n e similar to their neighbors and fit to raise their children.
76

Chapter 3: Understanding Poverty in Indonesia
LACK OF ACCESS TO CREDIT CONSTRAINS THE POOR: KOLAKA, SOUTHEAST SULAWESI
A traditional boat-builder needs to upgrade
From an early age, Mahmud (nicknamed Mude) has been an expert boat-builder, a skill passed down from his father. His father also taught him the skills of fishing, using nets bait and a fishing spear. Now Mude needs capital to buy a more modern boat, one with a motor.
Mude feels closely connected to the sea. When asked what his most valued possession is, he responds without thinking: his handmade boat. Mude would be very happy to make a simple living from building boats. But with only two to three orders for boats each year, Mude must find another way to support his family.
Mude’s five children were born and raised on the coast. As Bajuans, they are accustomed to a life closely tied to the sea. Most of the children’s time outside of school is spent playing in the sea. Only two out of his five children go to school. Mude wanted his children to continue on to junior secondary school but there is only one primary school in the village and the only junior secondary school is located in a faraway subdistrict.
The needs of their five children have driven Mude and his wife Suwarni to supplement their income, as they have found they can no longer simply live off the sea as their ancestors used to do. Following the example of others, they have now also started to grow seaweed commercially, albeit in a simple way and for modest returns.
Between rearing her five children and looking after the family home, Suwarni also runs a small food stall in front of the house, where she sells sugar, coffee, cigarettes, instant noodles, soap and other daily consumables. Her customers are her neighbors and people from other communities in the area. There are about 112 heads of households in the village, with one household comprising around six people. This small business was set up with some of Mude’s savings. Income from the food stall is enough to cover the snacks for the children.
In contrast to their own parents, Mude and Suwarni’s aspirations for their children are no longer linked to the sea. Instead, as Mude says, he hopes their children “can become office workers”, without specifying what type of work that might mean.
From Mude’s fishing catch, only the so-called ‘super fish’, a type of grouper, provides a decent income. One kilogram of this elusive fish can be sold for Rp 40,000. But in one day Mude usually can only catch about three kilograms. Mude and his wife often dream of buying their own fishing boat. This would enable them to sail to nearby Selayar Island, where the fish are plentiful and from where it would be easy to bring back their catch to the fish market in Pomalaa.
As a Muslim, Mude defines success in his life as the opportunity to undertake the haj (pilgrimage to Mecca) together with his wife. To this end, Mude and Suwarni have begun to save little by little, stashing their savings underneath their mattress as they have no bank account. If only there were a bank near their village. Then they could save money safely, and even earn a little interest, not just for the haj, but also for all the longer-term needs of their family: education of the children, and unexpected health problems or other unforeseen expenses
77

MAKING THE NEW INDONESIA WORK FOR THE POOR
TRANSITION TO SECONDARY SCHOOL IS BEYOND THE MEANS OF THE POOR: ENUPETU, EAST NUSA TENGGARA
A math genius settles for work as a coconut seller
Simon Aprianus Banamtuan is 13 years old. As a student at a SD (primary school), he was always at the top of his class. His favorite subject is mathematics. “On my report card, I always received the top grade for mathematics,” he says calmly. But his prowess is not limited to mathematics; he excels in all subjects, as shown by his Final School Exam (UAS), which placed him second in overall ranking at his school. But after completing his sixth grade exam in 2004, Simon did not continue on to SMP (junior secondary school). His parents could not afford the entrance fee and annual tuition fees. Despite there being a SMP not far from Simon’s house and three other SMPs in the local district, Simon’s family cannot make use of them.
Instead of going to school, Simon now helps his neighbor by scaling his coconut trees to collect coconuts. For every ten coconuts he collects, Simon is given four. Since he usually collects twenty coconuts, this means he gets to keep eight. After gathering the coconuts, he accompanies his neighbor to the market to help sell them. If he manages to sell all eight of his own coconuts at the market, Simon should receive a total of Rp 4,000, or Rp 500 for each coconut.
Simon’s parents, Jonathan and Orance work hard to meet basic necessities. Jonathan works alternately on cultivating sweet potato and corn, cleaning weeds out of people’s gardens, gathering firewood and keeping an eye on other people’s livestock.
Jonathan Banamtuan and Orance have another child named Sefnat, who is mentally retarded and suffers from deafness, muteness and defective vision. The family is still grateful that Sefnat is relatively independent-he can eat and walk unaided. But even so wherever Sefnat goes he must be accompanied. However, Jonathan and Orance are proud to point out that Sefnat helps draw water from a nearby spring. Several times a day, he carries water to his parents who work in the garden, 600 meters away from the house.
The family diet is limited to corn cooked with papaya or cassava leaves. Sometimes, they eat rice received from the Raskin program (subsidized rice for the poor). The Banamtuan family received their health cards in December 2005, which helps tremendously with their health costs. The money they save on medicine can now be used to buy food.
The family situation made Simon give up on his dream of continuing school. Instead, Simon realizes that he has to help his family. Rather than playing with friends or sitting around idle, Simon works wherever he can. In this respect he takes after his parents, who never let a day go by just relaxing.
When asked if there is any financial assistance that could help Simon to continue his education, Jonathan responds by saying that he is too embarrassed to ask about it. When asked about his family’ daily diet, Jonathan only lowers his head, looks away and remains silent. His wife also avoids being drawn by the question, indicating only that such questions make her husband sad.
Although Simon is keen to continue his education, the topic of school is never discussed. But his father is already clearly aware of it: with obvious pride, Jonathan highlights the awards his son has achieved at school. He concedes that if Simon were to continue his education, his future would be brighter. With a hint of bitterness in his voice, Jonathan says that putting his bright, hardworking son through school is just a pipe-dream when the reality is that Simon is needed for work, no matter how modest his contribution.
But the family maintains a sense of dignity: their acceptance of hard work and difficult circumstances, and their stoic refusal to ask for help from anyone. Maybe next year Simon’s old SD headmaster will encourage the family to seek financial help from the district government that might allow Simon to make the transition to junior secondary school. Who knows where that might lead? Maybe with his prowess at school Simon could go on to university, find a good job, maybe even as a mathematics teacher, and then help to support his family, improving all their lives.
78
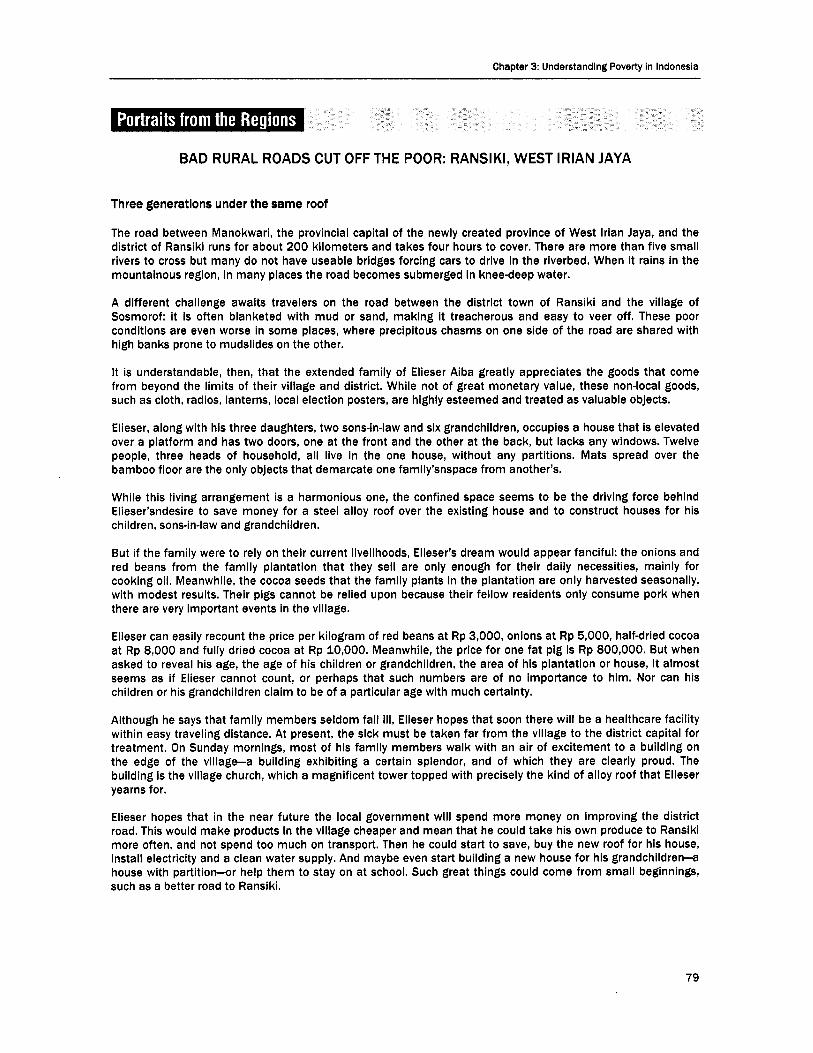
Chapter 3: Understanding Poverty in Indonesia
BAD RURAL ROADS CUT OFF THE POOR: RANSIKI, WEST IRIAN JAYA
Three generatlons under the same roof
The road between Manokwari, the provincial capital of the newly created province of West lrian Jaya, and the district of Ransiki runs for about 200 kilometers and takes four hours to cover. There are more than five small rivers to cross but many do not have useable bridges forcing cars to drive in the riverbed. When it rains in the mountainous region, in many places the road becomes submerged in knee-deep water.
A different challenge awaits travelers on the road between the district town of Ransiki and the village of Sosmorof: it is often blanketed with mud or sand, making it treacherous and easy to veer off. These poor conditions are even worse in some places, where precipitous chasms on one side of the road are shared with high banks prone to mudslides on the other.
It is understandable, then, that the extended family of Elieser Aiba greatly appreciates the goods that come from beyond the limits of their village and district. While not of great monetary value, these non-local goods, such as cloth, radios, lanterns, local election posters, are highly esteemed and treated as valuable objects.
Elieser, along with his three daughters, two sons-in-law and six grandchildren, occupies a house that is elevated over a platform and has two doors, one at the front and the other at the back, but lacks any windows. Twelve people, three heads of household, all live in the one house, without any partitions. Mats spread over the bamboo floor are the only objects that demarcate one family’snspace from another’s.
While this living arrangement is a harmonious one, the confined space seems to be the driving force behind Elieser’sndesire to save money for a steel alloy roof over the existing house and to construct houses for his children, sons-in-law and grandchildren.
But if the family were to rely on their current livelihoods, Elieser’s dream would appear fanciful: the onions and red beans from the family plantation that they sell are only enough for their daily necessities, mainly for cooking oil. Meanwhile, the cocoa seeds that the family plants in the plantation are only harvested seasonally, with modest results. Their pigs cannot be relied upon because their fellow residents only consume pork when there are very important events in the village.
Elieser can easily recount the price per kilogram of red beans at Rp 3,000, onions at Rp 5,000, half-dried cocoa at Rp 8,000 and fully dried cocoa at Rp 10,000. Meanwhile, the price for one fat pig is Rp 800,000. But when asked to reveal his age, the age of his children or grandchildren, the area of his plantation or house, it almost seems as if Elieser cannot count, or perhaps that such numbers are of no importance to him. Nor can his children or his grandchildren claim to be of a particular age with much certainty.
Although he says that family members seldom fall ill, Elieser hopes that soon there will be a healthcare facility within easy traveling distance. At present, the sick must be taken far from the village to the district capital for treatment. On Sunday mornings, most of his family members walk with an air of excitement to a building on the edge of the v i l lagea building exhibiting a certain splendor, and of which they are clearly proud. The building is the village church, which a magnificent tower topped with precisely the kind of alloy roof that Elieser yearns for.
Elieser hopes that in the near future the local government will spend more money on improving the district road. This would make products in the village cheaper and mean that he could take his own produce to Ransiki more often, and not spend too much on transport. Then he could start to save, buy the new roof for his house, install electricity and a clean water supply. And maybe even start building a new house for his grandchildren-a house with partition-or help them to stay on at school. Such great things could come from small beginnings, such as a better road to Ransiki.
79

Chapter 4 Making Growth Work for the Poor


Chapter 4 Making Growth Work for the Poor
20% -
18% . 16% .
8 14% -
: 12% . U c 10% .
$ 6% -
p 8%
I Introduction
Growth Is the single most Important drlver behind poverty reductlon. This is true for Indonesia (see Chapter 2 on the History). It is also true for many other countries. The World Bank’s seminal study on Pro- Poor Growth (World Bank, 2005c), which provides case studies of growth in 14 countries, gives the same message: growth is essential for poverty reduction.
But growth can be more or less pro-poor. Growth can create considerable inequality with knock-on impacts on social cohesion-or it can be strongly equalizing, helping to integrate rural and urban communities. As Chapter 2 shows, Indonesia’s experience in the 30 years before the economic crisis was an example of equalizing growth. But the crisis changed the pattern of growth: since 1998, growth has not only been lower, it has also been less equalizing. The key policy challenge for growth, therefore, is not only how to raise the rate of growth, but also how to ensure that growth reverts to the pro-poor pattern that characterized it before the crisis.
The current pattern of growth could mean that the government will fall to hit Its poverty headcount target of 8.3 percent by 2009. Figure below shows three different poverty projections. The basecase projection assumes that inequality continues to widen at the same rate as it has since the crisis. If this occurs then Indonesia will not meet the target poverty headcount of 8.2 percent by 2009, set in the RPJM. It would meet the less ambitious Millennium Development Goals (MDGs) target for poverty reduction-but even this target moves out of reach if growth falls from the projected 6.2 percent to only 4.0 percent per year as shown in the low-case projection. To meet the government’s poverty target, growth must become more pro-poor. The high-case projection shows the impact of sharing growth more equitably. Even with the high- case projection of 6.2 percent pro-poor growth, by 2009 poverty incidence will only be reduced to around 12 percent.
Figure 4.1 Poverty headcount projections depend on the pro-poorness of growth Poverty Projection with different growth scenario’s
Poverty Projections with different growth scenarios
::I , , , , , , , , , , , ,
2006 1007 1000 2000 1 0 9 2011 200 IOU IOU 2 0 6 2 0 8 2077 10s 0%
-LOW C a s e - Base C a s e High Case
Source: World Bank staff calculations.
81

MAKING THE NEW INDONESIA WORK FOR THE POOR
Descriptlon of Scenario Impact on Poverty
Low Case Inequality as predicted by previous trend (the poor RPJM target Is not attainable, nor is the MDG experience lesser growth than the rlch) but the level of growths are smaller than the base case The base case scenario uses the projected growth figures in the Medium Term Framework (up to 2007) and then assumes growth rates to remain at 6.2 percent until 2016. In this scenario, inequality is as predicted by previous trend where the poor experience lesser growth than the rich. Distribution neutral growth (the poor experience the same level of growth as the rlch 6.2 percent)
Base Case
High Case
target of halving the national poverty number.
RPJM target of achieving 8.2 percent poverty rate by 2009 is not attainable under this scenario, but the MDG target of halving the national head count by 2015 is attainable.
RPJM target of achieving 8.2 percent poverty rate by 2009 is not attainable under this scenario, but the MDG target of halving the national head count by 2015 is attainable RPJM and MDG targets are both attainable.
There are two key pathways through which households and Individuals have escaped poverty In Indonesia’s recent past:
0 improvements in agricultural productivity in rural areas; and increases in non-agricultural productivity in both urban and rapidly urbanizing rural areas.
Most individuals who escaped poverty in the past ten years followed one of these two paths. However, a significant role has also been played by Indonesia’s structural transformation as people moved from agricultural to non-agricultural activities as some rural areas rapidly urbanized.
The question is: what policies help the poor onto these pathways? How then can policy help the poor to get onto, and stay on, a pathway out of poverty? Although the answer clearly depends on sector and location, there are three cross-cutting types of policies that are needed.
First, It Is essential to maintain macroeconomic Stability. Indonesia’s hard fought recovery from the economic crisis of 1998 has focused on restoring confidence in macroeconomic management. This was and is the right focus. A stable macroeconomy is the cornerstone of a successful economy and of poverty reduction. Economic crises not only dampen long-run growth, but they hit the poor hardest. Sustained reductions in poverty require a stable and conducive macroeconomic environment.
Second, Invest in the capabilities of the poor. The poor, particularly those in urban areas, are poor primarily because they earn very low incomes (rather than because they are unemployed). Their incomes are low because the productivity of the activities they do is low, in part because of very low human capital. Improving education for the next generation and vocational training for the current one are essential in enabling the poor to access better jobs. A t the same time, for poor rural households earning most of their income from agriculture, what matters more is appropriate knowledge of how to boost agricultural productivity. This requires substantial investment in agricultural research and the re-building of an effective agricultural extension service.
Third, connect the poor to opportunltles. The rural poor do not merely lack capabilities; they lack the means of connecting to growth. Sometimes the missing connection is physical-for example, access to markets in many rural areas is hampered by poor quality roads at the district (kabupaten) and subdistrict (kecamatan) level. But other forms of connection matter too: poor households have more difficulty in accessing credit, in part because of their lack of collateral; and poor people in urban areas find it hard to access the labor market because of labor regulations that discourage the hiring of less-skilled workers.
This chapter proceeds as follows: Section I1 describes the pathways out of poverty and the evidence about what constitute the most important pathways. Section Ill explains the linkages between the pathways framework and the policy agenda. Section IV describes briefly the policies needed to ensure macroeconomic stability. Section V discusses policies to build the capabilities of the poor to participate in
82
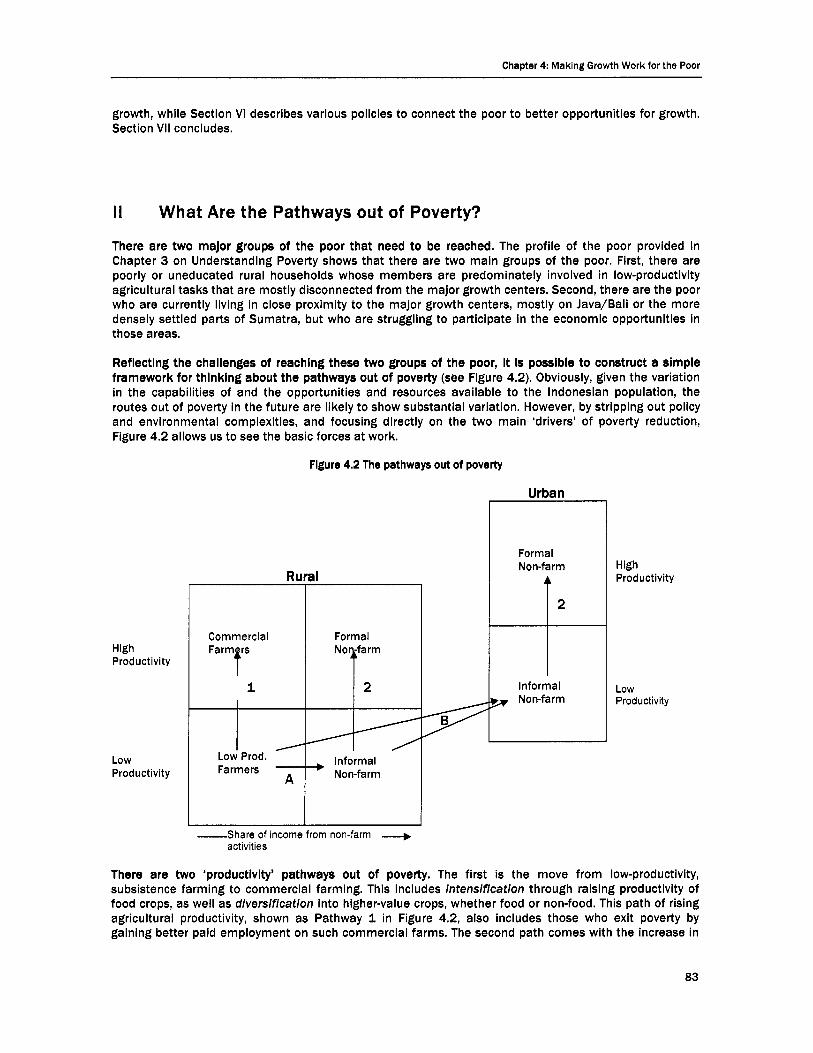
Chapter 4 Making Growth Work for the Poor
growth, while Section VI describes various policies to connect the poor to better opportunities for growth. Section VI1 concludes.
II What Are the Pathways out of Poverty?
There are two maJor groups of the poor that need to be reached. The profile of the poor provided in Chapter 3 on Understanding Poverty shows that there are two main groups of the poor. First, there are poorly or uneducated rural households whose members are predominately involved in low-productivity agricultural tasks that are mostly disconnected from the major growth centers. Second, there are the poor who are currently living in close proximity to the major growth centers, mostly on Java/Bali or the more densely settled parts of Sumatra, but who are struggling to participate in the economic opportunities in those areas.
Reflecting the challenges of reaching these two groups of the poor, It Is possible to construct a simple framework for thlnklng about the pathways out of poverty (see Figure 4.2). Obviously, given the variation in the capabilities of and the opportunities and resources available to the Indonesian population, the routes out of poverty in the future are likely to show substantial variation. However, by stripping out policy and environmental complexities, and focusing directly on the two main ‘drivers’ of poverty reduction, Figure 4.2 allows us to see the basic forces at work.
Flgure 4.2 The pathways out of poverty
High Productivity
Low Productivity
Ru
Commercial
II
Formal
I Formal Non-f a rm
I Informal
Low Prod. I
I I
-Share of income from non-farm + activities
High Productivity
Low Productivity
There are two ‘productivity’ pathways out of poverty. The first is the move from low-productivity, subsistence farming to commercial farming. This includes intensification through raising productivity of food crops, as well as diversification into higher-value crops, whether food or non-food. This path of rising agricultural productivity, shown as Pathway 1 in Figure 4.2, also includes those who exit poverty by gaining better paid employment on such commercial farms. The second path comes with the increase in
83
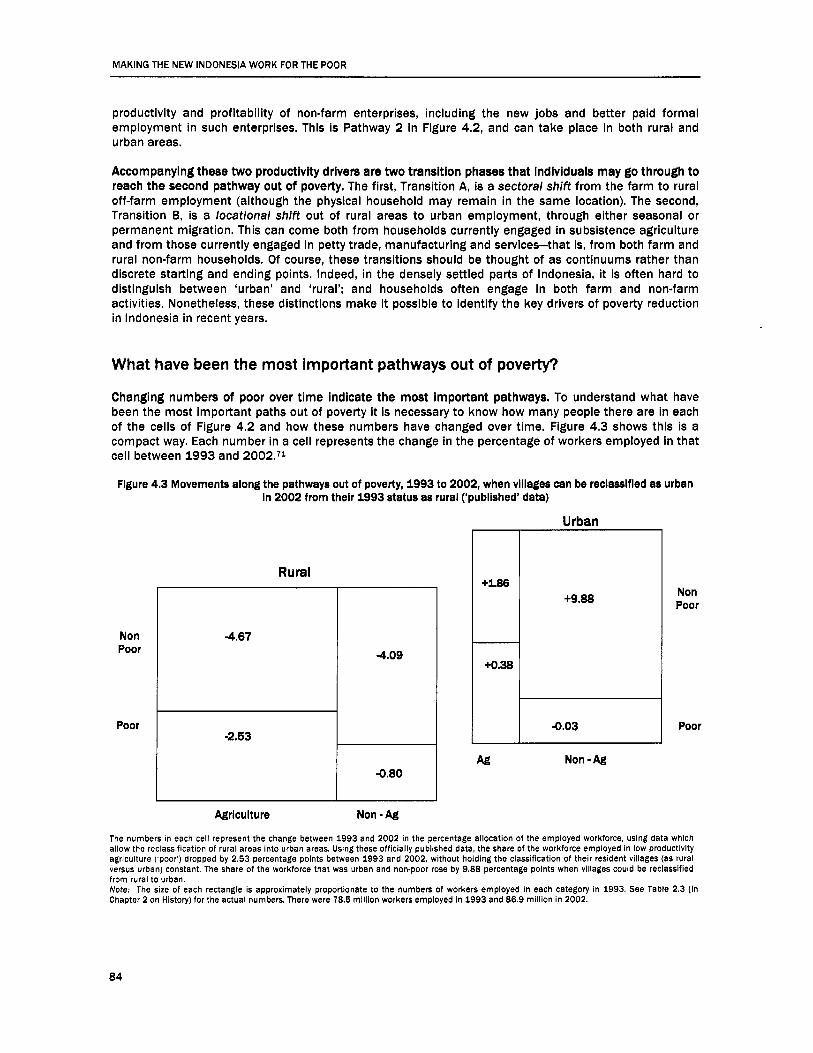
MAKING THE NEW INDONESIA WORK FOR THE POOR
productivity and profitability of non-farm enterprises, including the new jobs and better paid formal employment in such enterprises. This is Pathway 2 in Figure 4.2, and can take place in both rural and urban areas.
Accompanying these two productivity drivers are two transition phases that individuals may go through to reach the second pathway out of poverty. The first, Transition A, is a sectoral shift from the farm to rural off-farm employment (although the physical household may remain in the same location). The second, Transition B, is a locational shift out of rural areas to urban employment, through either seasonal or permanent migration. This can come both from households currently engaged in subsistence agriculture and from those currently engaged in petty trade, manufacturing and services-that is, from both farm and rural non-farm households. Of course, these transitions should be thought of as continuums rather than discrete starting and ending points. Indeed, in the densely settled parts of Indonesia, it is often hard to distinguish between ‘urban’ and ‘rural’; and households often engage in both farm and non-farm activities. Nonetheless, these distinctions make it possible to identify the key drivers of poverty reduction in Indonesia in recent years.
What have been the most important pathways aut of poverty?
Changing numbers of poor over time indicate the most important pathways. To understand what have been the most important paths out of poverty it is necessary to know how many people there are in each of the cells of Figure 4.2 and how these numbers have changed over time. Figure 4.3 shows this is a compact way. Each number in a cell represents the change in the percentage of workers employed in that cell between 1993 and 2OO2.’l
Figure 4.3 Movements along the pathways out of poverty, 1993 to 2002, when villages can be reclassifled as urban In 2002 from their 1993 status as rural (‘published’ data)
Urban
I
Rural
-4.09
-2.53 Poor I
0.80
Agriculture Non - Ag
+9.88
I 0.03
Ag Non - Ag
Non Poor
Poor
The numbers in each cell represent the change between 1993 and 2002 in the percentage allocation of the employed workforce, using data which allow the reclassification of rural areas Into urban areas. Using these officially published data, the share of the workforce employed in low productlvlty agriculture (‘poor’) dropped by 2.53 percentage points between 1993 and 2002, without holding the classification of their resident villages (as rural versus urban) constant. The share of the workforce that was urban and non-poor rose by 9.88 percentage polnts when villages could be reclassifled from rural to urban. Note: The size of each rectangle Is approximately proportionate to the numbers of workers employed In each category in 1993. See Table 2.3 (In Chapter 2 on History) for the actual numbers. There were 78.5 million workers employed in 1993 and 86.9 million in 2002.
84
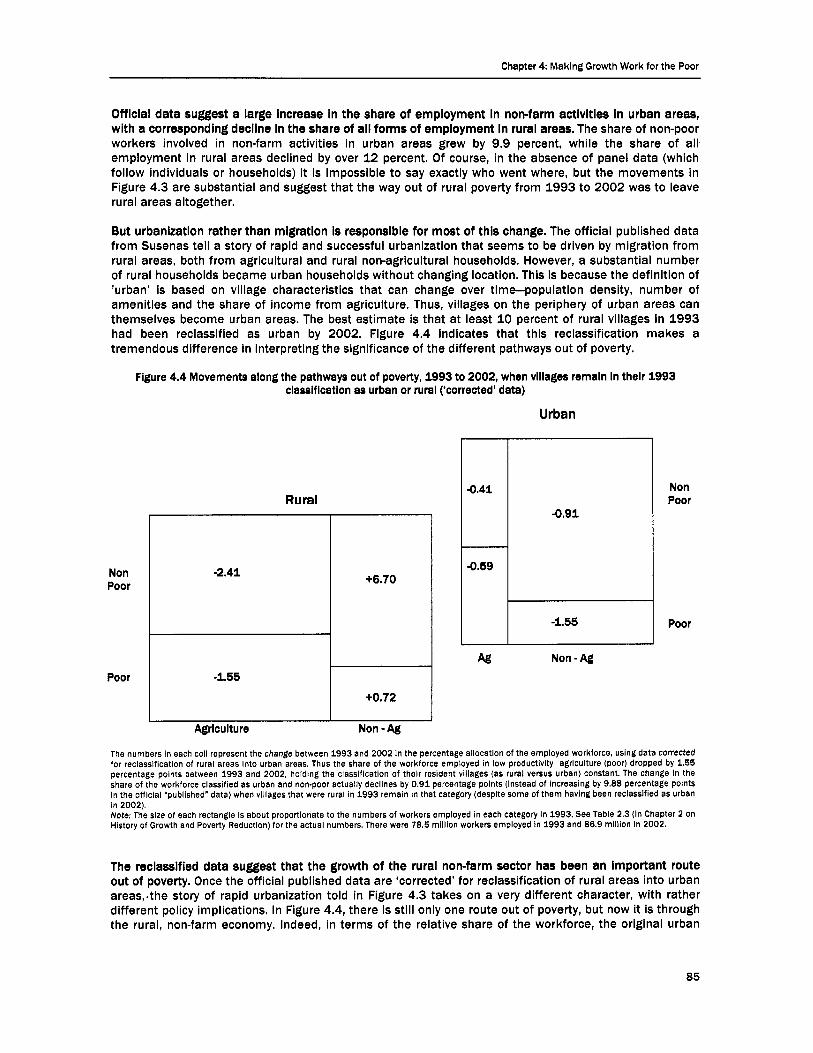
Chapter 4 Making Growth Work for the Poor
Official data suggest a large Increase in the share of employment In non-farm activities In urban areas, with a corresponding decline In the share of all forms of employment In rural areas. The share of non-poor workers involved in non-farm activities in urban areas grew by 9.9 percent, while the share of all employment in rural areas declined by over 12 percent. Of course, in the absence of panel data (which follow individuals or households) it is impossible to say exactly who went where, but the movements in Figure 4.3 are substantial and suggest that the way out of rural poverty from 1993 to 2002 was to leave rural areas altogether.
But urbanization rather than migration Is responslble for most of this change. The official published data from Susenas tell a story of rapid and successful urbanization that seems to be driven by migration from rural areas, both from agricultural and rural non-agricultural households. However, a substantial number of rural households became urban households without changing location. This is because the definition of ’urban’ is based on village characteristics that can change over time-population density, number of amenities and the share of income from agriculture. Thus, villages on the periphery of urban areas can themselves become urban areas. The best estimate is that at least 10 percent of rural villages in 1993 had been reclassified as urban by 2002. Figure 4.4 indicates that this reclassification makes a tremendous difference in interpreting the significance of the different pathways out of poverty.
Figure 4.4 Movements along the pathways out of poverty, 1993 to 2002, when villages remain in their 1993 classification as urban or rural (‘corrected’ data)
Urban
Non Poor
Poor
-2.41
Rural
+6.70
-1.55
Agriculture
+0.72
Non - Ag
-0.41
-0.59
Ag
-0.91
-1.55
Non - Ag
Non Poor
Poor
The numbers in each ceii represent the change between 1993 and 2002 in the percentage allocation of the employed workforce, using data corrected for reclassification of rural areas into urban areas. Thus the share of the workforce employed in low productlvity agriculture (poor) dropped by 1.55 percentage points between 1993 and 2002, holding the classification of their resident villages (as rural versus urban) constant. The change in the share of the workforce classified as urban and non-poor actually declines by 0.91 percentage points (instead of increasing by 9.88 percentage points in the official ‘published” data) when villages that were rural in 1993 remain in that category (despite some of them having been reciasslfied as urban in 2002). Note: The size of each rectangle is about proportionate to the numbers of workers employed in each category in 1993. See Table 2.3 (in Chapter 2 on History of Growth and Poverty Reduction) for the actual numbers. There were 78.5 million workers employed in 1993 and 86.9 million in 2002.
The reclassified data suggest that the growth of the rural non-farm sector has been an Important route out of poverty. Once the official published data are ‘corrected’ for reclassification of rural areas into urban areas,.the story of rapid urbanization told in Figure 4.3 takes on a very different character, with rather different policy implications. In Figure 4.4, there is still only one route out of poverty, but now it is through the rural, non-farm economy. Indeed, in terms of the relative share of the workforce, the original urban
85

MAKING THE NEW INDONESIA WORK FOR THE POOR
areas suffered a loss of about half a million workers from all four categories. The difference between the pathways in Figures 4.3 and 4.4 is that the ‘successful’ rural non-farm economies in Figure 4.4 became urban in the process.
But the success of rural non-farm enterprises in poverty reduction is hidden. Of course, the rapid urbanization seen in the official data is ‘real’ in the sense that these are now urban areas, even if they had been rural a decade before. The significance of the difference between Figures 4.3 and 4.4, however, is that the great success of rural non-farm enterprises in reducing poverty is lost by calling them ‘urban’ after the fact. Their very success is what made them urban.
Rural-urban migration did also play a role, but a relatively small one. Table 4.1 shows an estimate of ‘true’ migration obtained from the inter-censal survey (Supas) in 1995.72 Only 2.8 percent of those individuals in rural villages in 1990 were living in urban villages in 1995. Moreover, the 3.6 million people who moved to urban villages between these two years were compensated in part by 1.8 million people who moved from urban to rural villages over the same period. Overall, around 5 percent of those in urban areas in 1995 had been living in rural areas five years previously. Thus, although the role of ‘true’ migration is certainly not trivial-the much larger shifts in the shares of urban employment described above suggest that, overall, urbanization rather than rural-urban migration has been the dominant factor in changing the nature of activities undertaken by the poor and, therefore, their opportunities for finding a pathway out of poverty.
Table 4.1 True rural-urban migration, 1990.1995
1995 Rural Urban Total
1990 Rural 122,037,729 3,570,511 125,608,240
Urban
Total
97.16 98.53
1,823,701 2.69 1.47
123,861,430 64
100
2.84 5.13
66,089,601 97.31 94.87
69,660,112 36
100
100 64.91
67,913,302 100
35.09
193,521,542 100 100
Source: Supas, 1995.
There are two conclusions from this dynamic. First, urban areas need to be prepared, both economically and politically, to absorb rapidly growing peri-urban economies. Second, constraints on the growth of these successful rural, non-farm enterprises need to be relaxed for those not yet absorbed in urban growth poles-or, put differently, creating a better rural investment climate is important for poverty reduction, even if these enterprises end up as urban in the process. Figures 4.3 and 4.4 are suggestive about the pathways that may be the most important (and in particular they point to a much larger role for urbanization than might have been thought before), but they are not definitive since all that is shown is the net position rather than the actual flows themselves. For definitive results on who actually moved and their characteristics, panel data are needed as discussed below.
Panel data on individual pathways out of poverty
Representative data exist on who moved in and out of poverty. Fortunately, panel data exist in the form of the Indonesian Family Life Survey (IFLS), which interviewed the same families in 1993, 1997 and 2000.73 The 1993 sample was representative of about 83 percent of the Indonesian population in 13 provinces. McCuiloch, Timmer and Weisbrod (2006) use the IFLS to track the movements in and out of poverty of a
86

Chapter 4: Making Growth Work for the Poor
large set of individuals between 1993 and 2000 as shown in Table 4.2. Although the IFLS data are not entirely representative of the Indonesian population, the 5,308 workers tracked in Table 4.2 do represent basic Indonesian poverty patterns reasonably well. Rural poverty made up 74.9 percent of total poverty in 1993 in the unweighted IFLS data, compared with 74.0 percent in the 1993 Susenas data. Analysis of how these 5,308 workers fared between 1993 and 2000 should provide very useful insights into the dynamics of poverty in Indonesia.
There Is a high level of mobility in and out of poverty. For example, of the 522 workers who were poor and working in rural agricultural activities in 1993, only 2 2 1 of them were still in that category seven years later; 212 individuals exited poverty while staying in agricultural activities in rural areas, and a further 7 1 shifted into rural non-farm activities, half of them escaping poverty and half not. But mobility was both downwards as well as up: there were 226 individuals who were non-poor in rural agricultural activities in 1993 who had fallen into poverty in the same sector by 2000. Another 86 people fell from being non-poor in rural non-farm activities into rural agricultural poverty. Overall there is a great deal of ‘churning’ in and out of poverty (see Table 3.2 in Chapter 3 on Understanding Poverty).
Improved productivity In agriculture is still an Important route out of poverty. Most of the rural agricultural poor in this sample who exited poverty did so while staying in rural agriculture. Over 80 percent of the poor rural farmers in the sample were still working in rural agriculture in 2000, but around half of the households from which they came still managed to exit from poverty.74 Most of the rest moved into non- agricultural activities in rural areas and, more often than not, out of poverty too. However, moving to urban areas was rare for this group-only 3.5 percent of those working as poor rural farmers in 1993 were working in urban areas in 2000, and more than half of these remained in poverty.
Rural non-agrlcuiturai activities can be a stepping-stone out of poverty In rural areas. Individuals from poor rural households who worked off-farm in 1993 were more mobile than those working in agriculture. Less than one-fifth stayed poor in rural non-agricultural activities-but another fifth shifted back to agriculture while remaining poor. Almost half escaped poverty while staying in rural area- similar rate to those who started poor in agriculture. Urban migration played a more important role for this group, but still a minor one-less than 10 percent of this group moved to urban areas, and only half of those that did so exited poverty.75 Still, this migration rat+almost 10 percent of poor, rural non-farm workers migrated to urban areas in just seven years-is three times the rural-to-urban migration rate of poor farm workers. During the same period, 13.6 percent of poor, rural farmers moved to rural non-agricultural jobs and more than half exited poverty in the process. Thus the panel results confirm the suggestion of the Susenas- based analysis: that the growth of the non-farm rural economy may be an important stepping-stone out of poverty.
Nonagricultural activities in urban areas are much more stable. As Table 4.2 shows, 76.4 percent of the non-poor in this category remained non-poor, non-agricultural and in urban areas. At the same time, 46 percent of the urban non-agricultural poor remained in that category. Both rates of ’stability’ are the highest of the four categories. This stability may arise because earnings are much higher in urban areas, so the poor prefer to stay in the hope of a good job; or it may be difficult for poor urban workers to move or return to rural areas. The distinction should not be overdrawn, however, as around 60 percent of the rural, non-poor remained in their original sector of activity. Indeed, when agricultural and non-agricultural activities are combined+ common occurrence for households in rural areas-75.1 percent of rural agricultural households and 76.9 percent of rural non-agricultural households (in 1993) remained stably out of poverty. Nonetheless, it is noteworthy that almost 90 percent of poor urban non-agricultural workers in 1993 stayed in the same sector and location, with almost half of them leaving poverty in the process.
Government pollcy should therefore encourage rural transformation and urbanization. Urbanization has been rapid, but only a small part is due to actual physical migration of workers and households. In rural areas, there is a gradual diversification of economic activities taking place, characterized by greater reliance on non-farm sources of income. This process of rural diversification reflects greater opportunities for growth in a dynamic non-farm economy than in agriculture per se, although increases in agricultural productivity remain an important pathway out of poverty. Government policy, rather than inhibiting this rural transformation, should actively encourage it. Moreover, there is an important role for government
87

MAKING THE NEW INDONESIA WORK FOR THE POOR
policy at both the national and the sub-national level in improving the investment climate for both agricultural and rural non-agricultural enterprises, as well as in helping connect the urban poor to better jobs. How policy can build the capacity of the poor and connect them to growth is the subject of the next section.
Table 4.2 Poverty transition matrix, 1993 to 2000, from IFLS panel data (percent of individuals, not weighted)
2000 Poor Nongoor Total
Rural Urban Rural Urban # Agriculture Non- Agriculture Non- Agriculture Non- AgriWlture Non -
individuals agriculture agriculture agriculture agriculture Rural Agriculture 522 42.2 6.5 1.4 0.5 40.5 7.1 0.9 0.7 100
0 Urban Agriculture 66 2.6 0.0 38.4 14.4 6.6 4.1 19.9 13.9 100 m Non- agriculture 265 0.0 0.5 5.8 46.0 0.0 1.2 3.0 43.5 100
g Non- agriculture 228 22.1 19.8 0.0 4.1 10.7 38.0 0.0 5.3 100
3 8 Rural Agriculture 1243 18.2 4.1 0.2 0.0 59.1 16.0 1.6 0.8 100 61 Non- agriculture 1536 5.6 9.5 0.5 1.7 16.9 60.0 1.1 4.7 100 5 Urban Agriculture 116 3.9 0.0 12.4 6.3 18.1 5.9 29.0 24.5 100 z Non- agriculture 1332 0.2 0.3 0.7 12.8 1.1 5.2 3.2 76.4 100
Total 5,307 592 281 82 348 1270 1328 139 1269 11.2 5.3 1.5 6.6 23.9 25.0 2.6 23.9 100
Source: indonesla Family Life Survey (IFLS). Note: Data are the percentage of individuals in the 1993 category who end up in the 2000 category. The individuals are those were aged 1555 in 1993 and were working
Ill Linking Pathways out of Poverty to Policies for Pro-Poor Growth
Having laid out the pathways out of poverty, it is important to elaborate on the policies ilkely to be most effective In getting the poor onto the various pathways out of poverty and keeping them there. Of course, there are myriad policies that have an influence on growth and poverty reduction: macroeconomic policy, which sets the framework for all economic activities; trade policy, which determines the costs of exchange both internationally and domestically; educational policy, which influences the capacity of the workforce; financial policy, which determines the access to credit and financial services; and many more. Amidst this sea of choices, how should the government choose the priority policies for generating pro-poor growth?
Macroeconomic policy must remain the core of any successful poverty reduction strategy. One priority is clear: the lessons of the past decade of policy reforms in developing countries show clearly that maintaining sound macroeconomic policies is central to sustained poverty reduction. Countries that have had more macroeconomic shocks experience slower growth and poverty reduction than those with better macroeconomic management (World Bank, 2005c) Indonesia knows better than most countries the dreadful poverty impact of macroeconomic crises (see Chapter 2).
But which microeconomic policies are most likely to reduce poverty? One approach to answering this question is to estimate the impact of access-to education, training, roads, credit and so forth-on the level of household consumption. Figure 4.5 shows the percentage increase in household expenditure associated with improved access for several different types of assets and services.
investing in the capabilities of the poor appears to give a high return. Figure 4.5 shows that in both rural and urban areas, higher levels of education of the household head are associated with higher levels of consumption. The effect is particularly strong if the household head already has nine years of education. This suggests that investing in education for the poor-and, in particular, in ensuring transition from primary to junior secondary school and increasing the number of secondary schools in rural areas-will be key to boosting the capability of the poor to participate in growth (see Chapter 5 on Public Spending for more details on education). Improving access to informal courses could also help to improve the productive capabilities of the poor, particularly in urban areas. Figure 4.5 shows that the return to access to informal courses and vocational training is generally even higher than the return to general education, particularly in poorer eastern Indonesia. (Also see Table 3.4 in the section on The Determinants of Poverty in Chapter 3.)
88

Chapter 4: Making Growth Work for the Poor
Figure 4.5 The welfare benefits assoclated with ‘investing In the poor and ‘connecting’ the poor (Percentage increase in household expenditures associated with changes In household characteristics)
Investing in the poor variables
5 40% Connecting the poor variables
a w a d ; -10%
g 1
road
Urban Rural
0 Srnatra o &M/Bali Kalirnantan Slww H NTIMaluku I Papua (1999) rn INKNESA
Source: Susenas 1999 and 2002 consumption modules and Podes 2003. Note: The results come from household expenditure regression provided in Table 3.6.
And connecting the poor to oppottunitles for growth Is key. Figure 4.5 also shows the impact on consumption of access to roads, telecommunications, credit, and formal sector employment. The impact of being ‘connected’ is high, particularly for formal sector employment outside of agriculture. Access to asphalt roads is also strongly associated with higher consumption, as is access to credit in some locations. Again, the less well-connected regions of eastern Indonesia see particularly strong gains from improved connections.
The Rural Investment Climate Survey (RICS) bears out the impottance of connecting the poor to growth. The RICS surveyed 2,500 predominantly micro and small non-farm enterprises in six districts (World Bank, 2006h). Figure 4.6 shows which issues these firms identified as their most important constraint. Firms at the district level, which constitute the vast majority of firms and which employ the majority of the non-farm poor, see their most important constraints as those associated with: low demand for their goods and services; difficulties in accessing credit; and problems in accessing markets due to poor road, transportation and electricity infrastructure.
89

MAKING THE NEW INDONESIA WORK FOR THE POOR
Figure 4.6 Most important constraints faced by firms in RIC survey
Demand for goods and s e ~ i c e s
Access to formal credit
Roadaccess
Cost of transportation
interest rates
A C C ~ S S to market
Qualityof roads
Quality of electricity
Uncerlain economic policy
Access to credit from family
Complicated loan procedures
Fear of repayments
Cost of electricity
Corruption
Informationabout themarket
0 10,000 20,000 30,000 40,000 50,000 60,000
Estimated number of firms that list this wntraint as the most important one limiting their operations
Source: RICS, 2006.
Based in part on the evidence above, Table 4.3 lays out a framework for linking policies to the pathways out of poverty.
90
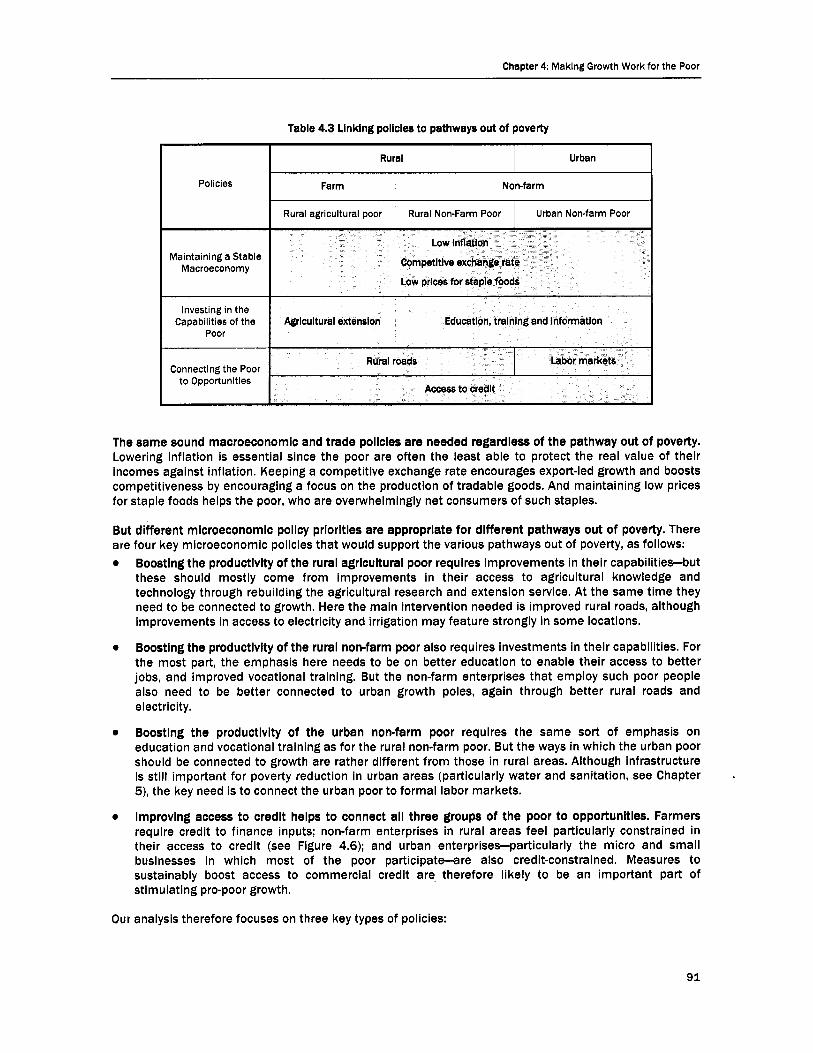
Chapter 4 Maklng Growth Work for the Poor
Table 4.3 Linking pollcles to pathways out of poverty
Maintaining a Stable Macroeconomy
Agricultural extenslon
The same sound macroeconornlc and trade pollcles are needed regardless of the pathway out of poverty. Lowering inflation is essential since the poor are often the least able to protect the real value of their incomes against inflation. Keeping a competitive exchange rate encourages export-led growth and boosts competitiveness by encouraging a focus on the production of tradable goods. And maintaining low prices for staple foods helps the poor, who are overwhelmingly net consumers of such staples.
But different mlcroeconomlc policy priorities are appropriate for different pathways out of poverty. There are four key microeconomic policies that would support the various pathways out of poverty, as follows:
Boosting the productlvlty of the rural agricultural poor requires improvements In their capabilities-but these should mostly come from improvements in their access to agricultural knowledge and technology through rebuilding the agricultural research and extension service. At the same time they need to be connected to growth. Here the main intervention needed is improved rural roads, although improvements in access to electricity and irrigation may feature strongly in some locations.
Boosting the productlvlty of the rural non-farm poor also requires investments in their capabilities. For the most part, the emphasis here needs to be on better education to enable their access to better jobs, and improved vocational training. But the non-farm enterprises that employ such poor people also need to be better connected to urban growth poles, again through better rural roads and electricity.
Boosting the productlvlty of the urban non-farm poor requires the same sort of emphasis on education and vocational training as for the rural non-farm poor. But the ways in which the urban poor should be connected to growth are rather different from those in rural areas. Although infrastructure is still important for poverty reduction in urban areas (particularly water and sanitation, see Chapter 5) , the key need is to connect the urban poor to formal labor markets.
Improving access to credit helps to connect all three groups of the poor to opportunities. Farmers require credit to finance inputs; non-farm enterprises in rural areas feel particularly constrained in their access to credit (see Figure 4.6); and urban enterprises-particularly the micro and small businesses in which most of the poor participate-are also credit-constrained. Measures to sustainably boost access to commercial credit are, therefore likely to be an important part of stimulating pro-poor growth.
.
Our analysis therefore focuses on three key types of policies:
9 1
MAKING THE NEW INDONESIA WORK FOR THE POOR
0 Maintaining a stable macroeconomy 0 Investing in the capabilities of the poor, and
Connecting the poor to opportunities
The following sections discuss policies options in these areas in more detail.
IV Maintaining a Stable Macroeconomy
‘Making growth work for the poor’ Involves two coordinated Strategies: one Is ‘growth acceleration’, the other Is ‘work for the poor’. Macroeconomic stability is a prerequisite for both strategies. On the one hand, macroeconomic stability is a top priority for investorsin the absence of stability investment will be adversely affected (World Bank, 2006e). On the other hand, the poor are the most vulnerable group to the negative consequences of macroeconomic instability that arise from extreme exchange rate fluctuations.
Restoring low Inflation has been of vital Importance to the poor. After high levels of inflation in the post- crisis period, the rate of inflation fell back to 6 to 7 percent in 2003-04. However, the government’s bold decision to reduce fuel subsidies in 2005 caused the inflation rate to surge to over 15 percent on a year- on-year basis. Despite this setback, the secondary impact of the fuel-price increase has been limited. Recent developments suggest that the rate of inflation should return to single digits by the end of 2006. This return to more benign levels of inflation is in part due to the move by Bank Indonesia to officially adopt inflation targeting in July 2005. Bank Indonesia currently aims to achieve an inflation rate of 7 to 9 percent for 2006 and 5 to 7 percent for 2007. This increased emphasis on price stability is a positive development for macroeconomic stability and hence for the poor.
Crucial to restoring low Inflation Is ensuring a stable and competitive exchange rate. Exchange rate fluctuations directly affect the price of tradable goods. The rupiah exchange rate is still susceptible to both domestic and external shocks, and credible macroeconomic management is key to containing exchange- rate fluctuations. Although the rupiah exchange rate depreciated to its lowest level in four years during 2005, Bank Indonesia’s prompt action to increase interest rates, as well as the government’s decision to reduce fuel sybsidies, were both major factors in quickly restoring market confidence.
Following a sound fiscal policy has helped to create ‘fiscal space’. For the first time since the crisis, Indonesia’s state budget has enough ‘fiscal space’ to allow for increases in spending on education, health and infrastructure, without jeopardizing fiscal sustainability. Fiscal sustainability has therefore been largely achieved. The budget deficit to GDP ratio improved to 0.5 percent of GDP in 2005, while the government’s debt to GDP ratio improved from a peak of 100 percent in 1999 to less than 50 percent in 2005. The combination of declining debt burdens, the significant reduction in fuel subsidies and increasing non-oil tax revenues have all helped to expand the government’s ‘fiscal space’, creating new opportunities for the implementation of pro-poor spending policies.
As the regions start to shoulder a higher share of public spending, so they will have a growing Impact on fiscal policy. Since decentralization in 2001, the role of regional governments has significantly increased. The regional share of total public spending has grown to over 50 percent. Also, higher commodity prices, especially for oil and minerals, have contributed towards a swelling of the financial resources of regional governments. Sound fiscal policy (from both central and regional governments) is important in fostering macroeconomic stability. Key to achieving this will be the development of an efficient public financial management mechanism.
Keeping an open trade regime Is also Important for the poor. Indonesia already has a very open trade regime with an average tariff rate of 8.5 percent. The government recently announced the medium-term tariff harmonization program aimed at moving towards a ‘low’ and ‘uniform’ tariff rate. The government’s commitments to Afta (the Asean Free Trade Area) and the exemption from duty of certain goods under
92

Chapter 4 Making Growth Work for the Poor
various trade facilitation programs are likely to lower the effective average tariff rate still further. This should benefit the poor by cutting costs of imported goods and encouraging competition in domestic markets.
But trade restrlctlons, for example on rice imports, have the potential to hurt the poor. Nevertheless, some aspects of the current trade policy, such as the restrictions on the importation of rice, are detrimental to the poor. The significant increase in domestic rice prices between March 2005 and March 2006 was partly attributable to the restrictions on rice imports.
Improving the general Investment climate Is also good for the poor. Since the inauguration of the new administration in October 2004, confidence in macroeconomic policy has greatly improved. One indication of this improvement can be seen in the three packages recently formulated that are aimed at improving the investment climate, and opening up the infrastructure and financial sectors. However, effective policy implementation is a key concern. In terms of improving the investment climate, micro- risks of government failures, such as poor contract enforcement, corruption and inadequate infrastructure, are binding constraints to higher levels of private investment in Indonesia.
V Investing in the Capabilities of the Poor
Boosting agricu I t ura I ca pa bi I ity
Hlgher agricultural productivity used to be a key pathway out of poverty. Much of Indonesia’s remaining poverty is caused by low agricultural productivity, so finding a way to raise it would be among the most pro-poor actions the government could take. Improving the capability of farm households to utilize new and improved agricultural technology can reduce poverty in two ways. First, by raising farm productivity and household incomes directly, technology adoption can speed farmers along this pathway out of poverty. Second, higher farm incomes have significant multiplier effects on the rural, non-farm economy.
But recently productivity growth In the agricultural sector has been low. Agricultural total factor productivity growth turned negative after the early 199Os, from annual gains of 2.5 percent in 1968-92, to annual contractions of 0.1 percent from 1993 to 2000 (Fuglie, 2004). There are several reasons for this. First, investment in irrigation stalled after the crisis, with the result that much of the current irrigation infrastructure is in poor condition. Second, agricultural extension services have suffered a serious decline, particularly since decentralization, with the result that fewer farmers are actually able to receive such services. Finally, the technical options for improving agriculture are currently limited, and have been since the early 1990% especially for rice. There are few immediately applicable new technologies likely to provide a significant boost to yields.
The government’s strategy for rural poverty reduction Is therefore right to focus on revitalizing agriculture. The Medium-Term Development Plan (RPJM) and the Strategy for Revitalizing Agriculture, Forestry and Fisheries (RPPK) stress the need to boost agricultural productivity and to develop agro-industry. This will require a multi-faceted and coordinated response from several line ministries (including the Ministries of Public Works, Agriculture, Forestry, Fisheries, Home Affairs, Health, Transportation and Education, as well as local government agencies), which will deal with both on-farm and off-farm initiatives to improve productivity and empowerment of rural communities. The objectives of the government’s strategy should be threefold:
0 Hlgher productivity for rice farmers and the livestock economy. To raise rice productivity, improved irrigation structures and management will be most critical. There are also opportunities to raise productivity through the precision management of inputs, the consolidation of rice- farming operations through land rental or sale markets (and not just for rice land), and production for specialized rice markets to meet more sophisticated consumer demand. Moreover, if higher rice productivity is to help reduce rural and urban poverty, Indonesia’s
93

MAKING THE NEW INDONESIA WORK FOR THE POOR
domestic rice price cannot remain substantially above import parity, as rice price increases disproportionately hurt the poor (see Box 3.5 in Chapter 3).
0 Dlversificatlon Into higher-valued crops. Diversified farming will be the solution for farmers whose scale of operations or land quality does not enable them to earn a livelihood from rice farming. Indeed, such rural diversification has been an important source of higher productivity and a pathway out of poverty in most advanced countries. It is an integral part of a successful structural transformation. Diversification means switching to high-value crops, livestock and fish production in response to new types of consumer demand that are transmitted through modern supply chains. Many small farmers will need technical assistance from either the public or private sector if they are to respond successfully to these new opportunities.
0 Expansion of export commodltles. There is a historic opportunity to expand the production of export commodities, as the market values of several of the most important ones, especially rubber and palm oil, reflect the new reality of scarce energy supplies. There is also an opportunity to improve the quality of Indonesia’s beverage crops, especially cocoa, coffee and tea, which would rapidly lead to higher incomes for the small farmers producing these commodities. Finally, Indonesia would almost certainly benefit from an aggressive global marketing campaign to ‘brand’ its tropical products, perhaps building on its image as the ‘Spice Islands’.
These three objectives can be achieved through action in five different areas:
1. Improving lrrlgatlon quality and management
The RPJM recommends Increasing publlc Investment In lrrlgatlon infrastructure and management. The systematic underfunding of the maintenance of irrigation systems has led to at least one-third of the 3 million hectares of government-designed irrigation schemes being rehabilitated twice in the past 25 years (ADB, 2004a). Growing water scarcity is projected to slow irrigated crop yield growth. The problem of increasing scarcity of water is heightened by the rising costs of developing new water sources, soil degradation in irrigated areas, groundwater depletion, water pollution and the degradation of water-related ecosystems, as well as the wasteful use of existing water supplies. Tackling all these issues will require a cross-sectoral effort between the concerned line ministries.
The RPJM rlghtly calls for Increased partlclpatlon by water users. In recent years, the government has developed a localized water-management model that places Water Users Associations (WUAs) at the center of decision-making, in close cooperation with local governments. Experience shows that such associations are effective in enhancing good water use, leading to higher productivity; innovative water uses (crop diversification, fisheries development, etc); better income generating opportunities; sustained preventive maintenance; and a more positive partnership between local government, its farmer constituency and national line agenciesS76 In addition, securing protection and equity for existing non-formalized customary rights to water resources is aprerequisite to establishing orderly, equitable and transparent processes of water re-allocation in order to meet communities’ changing needs. This will require strengthening the nascent basin organizations’ (Balai PSDAs-Pengelola Sumber Daya Air) approach to water-resource management in order to better manage scarce water resources and to optimize their allocation.
Irrigation investments have a hlgh rate of return If they are accompanied by a more partlclpatory approach to irrlgatlon management. A cost-benefit analysis conducted for the Water Resources and Irrigation Sector Management Project (WISMP) showed an economic rate of return (ERR) of 36 percent. Moreover, an enhanced cost-benefit analysis was also carried out to test the justification of applying the government’s new policy of Participatory Irrigation Management (PIM) to that of traditional physical rehabilitation. This showed an ERR of 32 percent for the incremental investment associated with the implementation of PIM, but only 11 percent when the implementation of participatory management failed.
2. Dlverslfylng agrlculture Into higher-valued crop and llvestock systems
94

Chapter 4: Making Growth Work for the Poor
Diversification raises productlvlty. The diversification of agriculture into higher-valued crop and livestock systems-especially by facilitating access to supermarket supply chains, including mechanisms for collective action by farmers to reduce transactions costs-is one effective way of raising agricultural productivity.
There Is already a strong trend of diversification away from rice. The RPJM and RPPK recognize the importance of diversification for improving efficiency and farmer welfare, and the growing importance of globalization in agricultural competitiveness. However, measures are called for that go beyond just the RPJM’s focus on diversification in consumption away from rice. The latter is already happening. Between 1996 and 2002, despite the economic crisis, per capita food consumption in Indonesia increased by 8 percent in real terms (Susenas, 2005). All of this growth took place in high-value foods, such as animal products, fruit, vegetables, fish, fats and oils, and prepared foods. Per capita consumption of low-value grains and tubers actually declined (Susenas, 2005). These changes have induced rapid growth in supermarkets, which have further influenced the agricultural production structure, including processing, handling and marketing. Diversification is key in the estimated 24 million hectares of dryland areasT7 where measures that encourage livestock, vegetable intercropping, reforestation of small areas with high-value wood species, and diversification into cashew or fruit, could all contribute to more stable incomes and poverty reduction.
Partnership between traders, processors and producers in a system of effective self-regulation will be crucial to further diversification. Much of the future productivity increase in dryland areas from higher- value commodities (smallholder estate crops, horticulture, livestock and fisheries) will only be possible if there are effective partnerships among producers, traders, processors and a public sector more focused on regulation and research. Indonesia’s agricultural product regulatory framework is fairly well developed but attention is needed on capacity building, maintaining the integrity of national systems with decentralization, and focusing on assisting smallholders to meet trade specification requirements. Private markets depend on an effective and streamlined regulatory environment, including grades and standards, food safety, bio-safety and environmental regulation, in order to lower transaction costs. Regulations alone are not enough, however. They must be matched by a partnership with traders, processors and producers in a system of effective (and transparent) self-regulation. This will be important not just for domestic consumer protection and safety, but also to gain and maintain access to international markets. Importing countries are increasingly tightening the quality/safety requirements for food products with measures that include permit ‘traceability’ of products all the way back to the farm level. Without attention here, a focus on productivity gains for farmers could fail to translate into welfare gains for the poor if market outlets are limited.
3. Boosting agrlcultural research and redeslgnlng agricultural extenslon
Rural productivity needs agricultural technology. Broad-based growth in rural productivity needs effective systems for generating, adapting and disseminating technology relevant to small-scale producers. High-quality agricultural research and extension systems will be critical to getting productivity onto a higher growth path.
This can be done by boosting research. Indonesian agricultural research expenditure has declined dramatically since the early 1990s compared with its neighbors. Real expenditure on public agricultural research in 2001 was no greater than in 1995; presently, it ranks near the bottom compared with other Asian countries in terms of agricultural research spending relative to agricultural GDP and total government expenditure on agriculture. Indonesia provides less than 0.1 percent of agricultural GDP to support agricultural research in the country (less than Bangladesh and well below the recommended level of 1.0 percent) (ADB, 2004a). The immediate challenges for the agricultural research system are to: (1) increase the overall level of national research expenditure despite closure of several current research projects; (2) clarify the public funding responsibility for the sub-national adaptation institutes; (3) counter the effect of decentralization that increases the administrative overhead costs of this sub-national system; (4) replace the significant proportion of senior researchers nearing retirement; (5) integrate private-sector agricultural research capacity as part of a national strategy; (6) strengthen capacity in biotechnology research; and (7) reinvigorate rice variety and
95

MAKING THE NEW INDONESIA WORK FOR THE POOR
system research, while nonetheless rebalancing resources and effort to give more emphasis to non- rice commodities.
And also by redeslgnlng extension. Similar to public sector extension systems in many countries, Indonesia faces a major challenge in developing an effective institutional mechanism for disseminating technology relevant for small-scale producers. While the RPJM and RPPK do indicate the need for improving extension, new approaches will be required in the context of the changed institutional environment. There is growing evidence78 of significant benefits to decentralized extension systems that involve the private sector and civil society, which need to be replicated nation- wide and strengthened. Local governments need a paradigm shift: (1) from top-down to participatory approaches; (2) from input and technology dissemination to dissemination of market and upstream information and technology; and (3) from centrally managed extension services to decentralized services, and some movement towards privatization of extension.
Prlvatlzed extension services will assume greater importance in the dryland cash cropping sub-sector In eastern Indonesia. This is because exportable commodity production is being increasingly supported by the private sector. The present political climate in Indonesia also provides a more conducive environment for a range of rural producer organizations (RPOs) than was possible in the past. In all of these initiatives, it is important that measures are put in place to better link agricultural research and extension; the separation of these functions within the organization of the Ministry of Agriculture (between the Indonesian Agency for Agricultural Research and Development, or IAARD, and the Agency for Agricultural Human Resource Development, or AAHRD) has made it difficult to focus on farmers’ problems when setting the research agenda, while at the same time achieving effective dissemination of research results.
4. Developlng marketlng and informatlon technology for agriculture and rural SMEs. Weak information systems are a barrier to higher rural productivity. The RPJM identifies the low status of rural information and communication technologies (ICT) development as a significant barrier to increasing rural productivity and incomes. Rural communities need up-todate information on sources, availability and cost of inputs for production, and also on the potential of different techniques and technologies used for production, processing and marketing. However, the information that is often most relevant to improving livelihoods is non-technical, including the role and responsibilities of different institutions in the provision of key services, such as agricultural extension, credit, health and education, and where to go and who to ask for more specific information. Rural communities increasingly need information about off-farm activities, about rural development projects and policies, and how to participate in and influence government processes.
ICT offers an opportunity to make rapid progress. It is important that this information is available in an appropriate format and language, and that rural communities have the capacity to access, analyze and act on it. With decentralization and the new political and institutional environment in Indonesia there is an opportunity to use ICT to support the rural development agenda and improve the delivery of government services in innovative ways (World Bank, 2005b). Indeed, an example of this can be seen at the National Land Agency (BPN), which is making significant progress in introducing e- administration services in land management.
5. Improving property rights and the land market, both rental and ownership.
Land conflicts and disputes, concentrated ownership and tenure of land, and lack of legal protection of poor people’s rights over land adversely affect Income and opportunities for the poor. Fewer than 25 percent of holders of rural land parcels have formal land certificates, compared with almost universal possession of land-use certificates by farmers in China and Vietnam and widespread certification in Thailand and Malaysia of close to 90 percent and over 50 percent in the Philippines (see Figure 4.7). The low share of landowners that possess a formal certificate of ownership is also a constraint on access to credit. Analysis demonstrates that rural recipients of land certificates borrow more, invest more, and earn more from their land-based economic activities (SMERU, 2002).
96
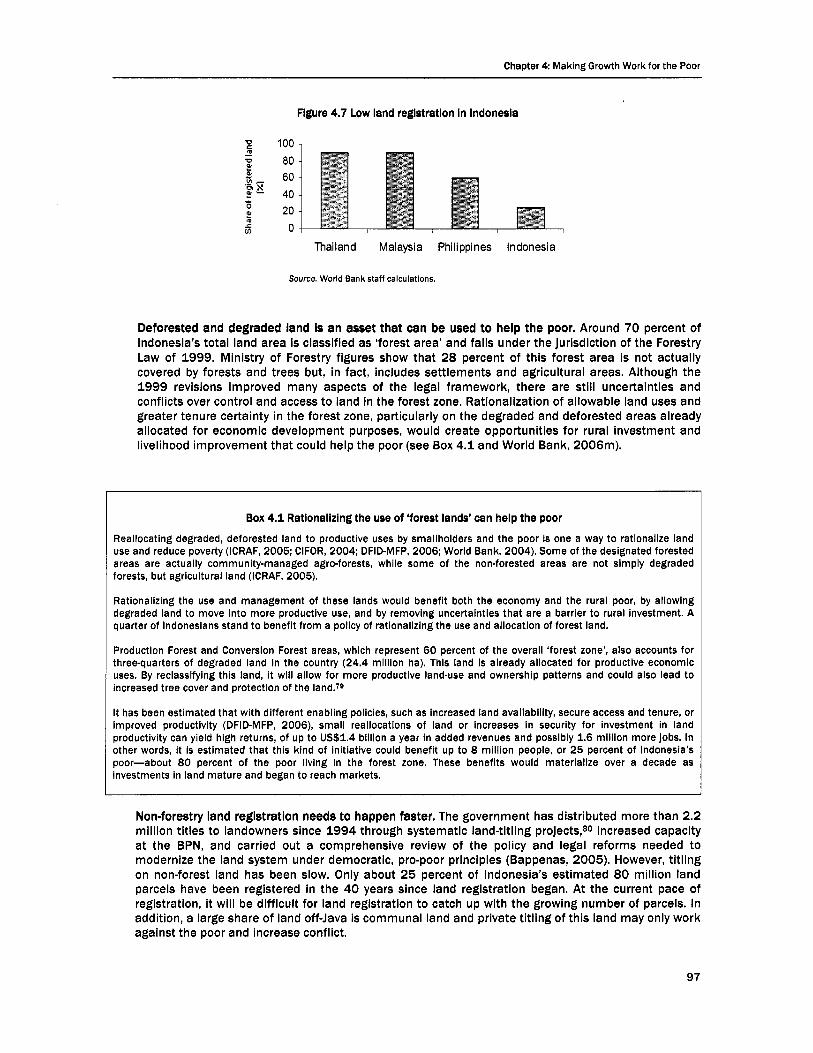
Chapter 4 Making Growth Work for the Poor
Figure 4.7 Low land registration In Indonesia
F 100,
Thai Ian d Malaysia Phi Ii ppi nes Indonesia
Source. World Bank staff calculations.
Deforested and degraded land is an asset that can be used to help the poor. Around 70 percent of Indonesia’s total land area is classified as ‘forest area’ and falls under the jurisdiction of the Forestry Law of 1999. Ministry of Forestry figures show that 28 percent of this forest area is not actually covered by forests and trees but, in fact, includes settlements and agricultural areas. Although the 1999 revisions improved many aspects of the legal framework, there are still uncertainties and conflicts over control and access to land in the forest zone. Rationalization of allowable land uses and greater tenure certainty in the forest zone, particularly on the degraded and deforested areas already allocated for economic development purposes, would create opportunities for rural investment and livelihood improvement that could help the poor (see Box 4.1 and World Bank, 2006m).
Box 4.1 Rationalizing the use of ‘forest lands’ can help the poor Reallocating degraded, deforested land to productive uses by smallholders and the poor Is one a way to rationalize land use and reduce poverty (ICRAF, 2005; CIFOR, 2004; DFID-MFP, 2006; World Bank, 2004). Some of the designated forested areas are actually community-managed agro-forests, while some of the non-forested areas are not simply degraded forests, but agricultural land (ICRAF, 2005).
Rationalizing the use and management of these lands would benefit both the economy and the rural poor, by allowing degraded land to move Into more productive use, and by removing uncertainties that are a barrier to rural investment. A quarter of Indonesians stand to benefit from a policy of rationalizing the use and allocation of forest land.
Production Forest and Conversion Forest areas, which represent 60 percent of the overall ‘forest zone’, also accounts for three-quarters of degraded land in the country (24.4 mlllion ha). This land Is already allocated for productlve economlc uses. By reclassifying this land, it will allow for more productive land-use and ownership patterns and could also lead to increased tree cover and protection of the
It has been estimated that with different enabling policies, such as increased land availability, secure access and tenure, or improved productivity (DFID-MFP, 2006), small reallocations of land or increases in security for investment in land productivity can yield high returns, of up to US$1.4 billion a year In added revenues and possibly 1.6 million more jobs. In Dther words, it Is estimated that this kind of initiative could benefit up to 8 million people, or 25 percent of Indonesia’s poor-about 80 percent of the poor living In the forest zone. These benefits would materialize over a decade as investments in land mature and began to reach markets.
Non-forestry land registration needs to happen faster. The government has distributed more than 2.2 million titles to landowners since 1994 through systematic land-titling projects,*O increased capacity at the BPN, and carried out a comprehensive review of the policy and legal reforms needed to modernize the land system under democratic, pro-poor principles (Bappenas, 2005). However, titling on non-forest land has been slow. Only about 25 percent of Indonesia‘s estimated 80 million land parcels have been registered in the 40 years since land registration began. At the current pace of registration, it will be difficult for land registration to catch up with the growing number of parcels. In addition, a large share of land off-Java is communal land and private titling of this land may only work against the poor and increase conflict.
97

MAKING THE NEW INDONESIA WORK FOR THE POOR
Improving education and vocational training
For those working in non-farm activities in both rural and urban areas, the priority Is to boost thelr capability to obtaln better jobs. Boosting capabilities in agriculture is a key priority for generating pro-poor growth for the rural agricultural poor. However, for many others, particulariy those involved in non-farm activities in both rural and urban areas, the priority will be boosting their capability to obtain better jobs. As Chapter 3 shows, Indonesia has a thriving informal sector, so access to work per se is not the major problem. Nor is the amount of work necessarily a major constraint for the poor: many also work long hours, even if the intensity of work and productivity per hour may be low. The main constraint for the poor is the lack of access to regular work in which returns are sufficiently high and stable to support basic family needs.
There are two reasons why the poor fall to access better jobs. First, the national economy is not yet generating enough employment opportunities, particularly for unskilled workers. We discuss how policy might help to boost the employment of the unskilled in Section VI. Second, many of the poor simply do not have the skills that are needed to obtain better jobs. Building the capabilities of the poor to access better jobs through improvements in education and training should be a major policy priority for the government. The return to education Is higher at higher levels of schooling, so focusing education Investments only on primary education Is no longer enough. The benefits of openness, technology and market competition for economic growth depend greatly on education and skill levels, and so increasingly higher levels of education have become more important for retaining the benefits of growth. However, in Indonesia the additional earnings that one can expect to receive from an additional year of education (the ‘return’ to education) are higher for individuals who already have more education (see Figure 4.8). In 2002, the increase in urban (rural) male wages resulting from an additional year of schooling for someone who had only one year of schooling already was 8.3 percent (6.0 percent); after five years of schooling, the return was 10.0 percent (7.6 percent) and after eight years of schooling it was 11.1 percent (8.8 percent). This ‘increasing return’ to schooling can lead to increased inequalities, as the rich have greater access to higher levels of education. In order to ensure that the poor also benefit from the high return to education a focus on secondary education will be required-primary education is no longer enough.
But market failures are preventing the poor from accessing higher levels of education. When there is a high return to education, the fact that the poor are dropping out of school at an early age may signal that there are market failures relating to (i) credit constraints that reduce the ability of the poor to borrow for schooling, and (ii) imperfect information on the return to schooling. The registration fee for junior secondary schools is a great barrier for enrollment in junior secondary schools for poor families: the average registration fee for junior secondary schools in Jakarta amounts to 30 percent of a poor household’s expenditure.*l There are high externalities to education investments for society as a whole, as well as equity implications of providing education for the poor given the increasing return to education, so public action to ensure that the poor also benefit from secondary education is crucial. Also burdensome to the poor are the miscellaneous fees for sitting examinations, the constantly changing book lists and the variety of uniforms required by students.
There Is a widening gap between the return to education In rural and urban areas, so policy needs to respond to the challenges of urbanization. Figure 4.8 shows that the return to education is lower in rural areas than in urban areas and that this gap is larger for higher levels of education and has been widening over time. The return to education in rural Indonesia may be much lower than in urban areas due to the scarcity of jobs: of the unemployed people with junior (senior) secondary school degrees in rural areas, 13.4 percent (12.4 percent) reported their reason for not looking for work as being that “it is not possible to get a job,” while in urban areas 6.4 percent (4.7 percent) of graduates reported such disappointment in the availability of jobs in the market (see Figure 4.9). This suggests that the priority in rural areas should be generating jobs through improvements in the rural investment climate.
98

Chapter 4: Making Growth Work for the Poor
The government needs to provide the rural poor with the skills to escape from poverty. The role of the non- farm rural and peri-urban sectors in the pathways out of poverty suggests that the government should focus on providing the rural poor with the skills to pull themselves out of poverty within an increasingly urban economy. Indonesia's structural transformation and urbanization require a comprehensive strategy to balance investment in rural areas with the provision of job information, re-skilling for new migrants, and basic education services for their children. Otherwise, the growing urban population will give rise to new forms of poverty and exclusion in urban areas in the years ahead. Within this structural transformation, one of the greatest challenges will be harnessing the productive potential of urban migrants. In order to achieve this, it is imperative to provide appropriate education and training to rural populations, as well as to the urban poor.s2
Education Investments need to focus on the skills and ernployability of the growing young population In Indonesia. Youth unemployment is one of the most serious challenges facing the government: in 2004, the total number of unemployed young people in Indonesia reached 6.4 million, representing 58.5 percent of the unemployed p ~ p u l a t i o n . ~ ~ The country's predominantly young population (29.6 percent under 15 and 37.3 percent under 19 years of age)84 requires education, while the growing working-age population in Indonesia requires employment opportunities to generate secure livelihoods for themselves and their dependents. The dependency ratio is declining as a result of more working-age young people entering the labor force (54.1 percent of population in labor force today compared with 51.2 percent in 1987),85 but this implies there that needs to be enhanced job opportunities for new graduates. In addition to generating new jobs for unemployed young people, cost-effective educational programs that focus on skills development and enhancing the employability of young people from disadvantaged households should be central to the government's agenda.
Figure 4.8 The gap between household consumption associated with hlgh educational endowments has widened between urban and rural areas for hlgher
levels of schooling (1999-2002)
Figure 4.9 In rural areas, lack of job avallablllty Is a concern even for graduates of senior secondary schools
80%
60%
40%
20%
0%
-20% 1 Years of schooling
- -0. - M a n 1999 - e- - R l m l l 9 9 9 - M a n 2002 -Ruml 2002
U b a n Rural EachBIorlPo6praduale
olplom lIlVlll p a - 8 F Senor HphSchool e 0
f s Jurror HghSchool * - - P r i w y
3 lncOnplefed pr1-y
Source: Susenas, 1999 and 2002. Note: the change in household consumption associated with educational attainment of household head is taken from the household expenditure function provided in Chapter 3.
Source: Susenas, 2004.
The vocational capabilities of the poor are key. Improving formal education is a key part of building the capabilities of the poor and ensuring that future generations are able to escape from poverty. But it is equally important to increase the vocational capabilities of the poor. The government has several instruments available to improve the productivity and employability of the poor through vocational training.
1. Vocatlonal schools and apprentlceshlp schemes
It Is still unclear how much school-based vocational training should be publicly funded. Currently, there are over 4,500 vocational schools (sekolah menengaah kejuruan, or SMKs) in Indonesia at senior secondary school level enrolling about 1.4 million students in total, of which about one-third are enrolled in public vocational schools. In the 1970s and 198Os, the government invested heavily in
99

MAKING THE NEW INDONESIA WORK FOR THE POOR
vocational schools, but over time the provision of vocational training was increasingly left to the private sector. At the beginning of the 199Os, it was realized that the wage return to vocational schools was about the same in the labor market as the return to regular senior secondary schools, while the SMKs were more costly to run. As a result, there was a shift towards less public involvement in vocational education. By 2002, 83 percent of SMKs were privately run, more than half of all SMKs focused on business and management training, while about one-third focused their curricula on technology and industrytraining (Ministry of Education, 2004). However, today this situation has changed: the wage return in the labor market to SMK graduates is 23 and 42 percent higher for men and women, respectively, when compared with SMA (senior secondary school) graduates (Figure 4.10).
Figure 4.10 The ratlo of wages for SMK vs. regular senior secondary school graduates have recovered In recent years
Mditionai wages
Source: Sakernas various years.
Flgure 4.11 Vocational school enrollments are regressive: the poorest 20 percent of population capture only about
I 2 percent of benefits from public SMKs -
1 60% Z p 40%
x 20% & S 8 : b E 0%
8n 1 ( b ) 2 3 4 5
Expenditure quinbles
rn Rlvate Vocational Senior H@ shwl (SMKJ 0 Rlblic VOcabonal SBnlOf H@ shool (SAKI &I Rivate Senior H@ shwl (mu) 0 Rlblic Smor H@ shool (WUJ
Source: Susenas, 2004 Note: The analysis takes into account only those students who do not continue their studies at the tertiary level.
At present, SMKs are not very effectlve In helplng the poor. Despite their potential advantages, vocational schools do not enroll many poor students. As a consequence, most additional expenditure on SMKs will not reach the poor-the poorest 20 percent of the population capture only about 12 percent of the benefits from public vocational schools (Figure 4.11). The return to public investments in vocational schools is related to the quality of teaching, the ability of schools to follow up with new technologies and the demands of the labor market. Studies on the success of vocational training need to be carefully updated, as the latest available research dates from the early 1990s. The wage return to this type of education needs to be assessed against the cost of providing this expensive form of education and the fact that many people would have found jobs in the absence of training through public funds.
Targetlng the poor with vouchers would give them better access to SMKs. In order to make already existing public spending on SMKs more pro-poor, the government could use a strategy of targeting benefits to poor students through a voucher/scholarship program similar to the one that exists for senior secondary schools (SMAs). Alternatively, it could provide block-grant programs to SMKs in exchange for extending services to the community on weekends and evenings outside of school hours, in order to reach out to poor unemployed adults or young school dropouts.
2. Pobllc vocational tra/n/ng centers
Publlc vocational training centers failed to provide adequate access to the poor in the past. Public vocational training centers (BLKs and KLKs) under the direction of the Ministry of Manpower were intended to become short-term (about three-month) training centers for Indonesia's growing manufacturing industry in the 1970s and 1980s. While these centers received substantial donor assistance at the start-up, they were unsustainable without public funds, running into problems of low budgets and under-utilization due to low demand towards the end of 1980s. The centers were also
100

Chapter 4 Making Growth Work for the Poor
3.
4.
initially set up to target poorer applicants who had only graduated from primary school or who had dropped out of secondary school; students were exempt from fees for this reason. By the beginning of 199Os, however, most of the benefits from public vocational training centers were captured by more educated applicants, since students who had not completed senior secondary school could not qualify in the entrance exams, which required them to handle technical equipment.
Decentralization now offers an opportunlty, but also rlsks. After decentralization, these vocational centers have come under the jurisdiction of district governments, whereby some have received more funding while others have become dilapidated with a lack of funds and modern machinery. The decentralization of these schools to district governments could mean that the centers will be better able to accommodate local conditions and change their organizational structures appropriately. However, it may also mean that the funding and quality of these centers could fall, reducing their effectiveness.
BLKs could take on a new role In targeting pro-poor student selection. Many of the programs offered by BLKs are already offered by private training centers and BLKs could gradually reduce the direct provision of training in areas served by the private sector. However, the role of public vocational centers in students’ selection and placement could be increased in order to improve the pro-poor targeting of such programs.
The dual and apprentlceshlp (magang) schemes
Apprenticeships act as a bridge between training and the labor market. These apprenticeship schemes were envisioned as ‘company-based training’ to connect vocational training schools (SMKs) and BLKs/KLKs with the labor market. The apprenticeship schemes were implemented by the Ministry of Manpower, while the ‘dual scheme’ was carried out by the Ministry of Education. In these schemes, companies select trainees and enter into an apprenticeship contract with them and devote one production supervisor for training. The cost-sharing of the program is between the government and the employers.
Incentives could help to overcome employer reluctance to Join such schemes. The success of these types of schemes depends heavily on finding companies that are interested in training through vocational schools and are prepared to fund supervisors for the training. However, surveys indicate reluctance among employers to participate in such schemes (World Bank, 1997). In the future, the government might consider providing companies with incentives for taking on supervision of trainees from public and private vocational training centers, but more analysis is needed on the potential costs and benefits from the expansion of such schemes.
Private tralnlng lnstltutlons and youth match and llnk programs
Prlvate training centers serve far more students than public centers. Private training centers in Indonesia are dynamic market-driven institutions and have been growing in number over the past two decades. In 1994, there were about 28,000 private training centers registered with the Ministry of Education or the Ministry of Manpower. These centers were reaching about 4.5 million students annually, compared with only 50,000 students reached by public vocational training centers (World Bank, 1997). Most of these courses are vocational in nature: of the courses registered under the Ministry of Education (in 1994) the most popular were sewing, hairdressing, computer courses, typing and accounting.
Targeting the poor to help them access such training centers is an effectlve way of raising their skills and productivity. Recently, the government has implemented a voucher scheme for training centers to provide economically useful vocational skills to young under-educated, unemployed or under- employed Indonesians. The scheme identifies and accredits private trainers through local NGO collaboration, and then matches them with locally unemployed youth aged 16 to 25 through the use of vouchers. The program provides block grants to the community learning centers (PKBM) managed by NGOs in exchange for the PKBM offering services to under-educated youth in this age range. The budget allocation for this project for 2003 and 2004 was about Rp 15 billion, reaching about 150 learning centers with a grant of about Rp 100 million each. Expanding this type of match-and-link
101

MAKING THE NEW INDONESIA WORK FOR THE POOR
program between poor and under-educated youth and private trainers serves as a cost-effective way of improving the skill-set of young Indonesians in a marketdriven way. Increasing subsidies to this kind of program would be an effective way for the government to invest more in building the skills and productivity of the poor.
VI Connecting the Poor to Growth
The poor need to be connected to growth If they are to benefit. Improving the capabilities of the poor is only part of the solution. Even if their capabilities are enhanced, poor people still need to be connected to opportunities in order to benefit from growth. But, as noted in Section II, the sorts of connection that matter most depend on which poor group is being considered. Rural roads, labor-market reforms and credit are all key. For the rural poor, the top priority should be reducing the physical costs of connection through improvements in rural infrastructure, notably rural roads. In addition, the physical and information costs of access to credit are high in rural areas. In urban areas, infrastructure issues are less of a concern from the perspective of linking the poor to growth (although water and sanitation issues have a direct bearing on poverty. See Chapter 5.) The key in urban areas is connecting the poor to jobs through reforms in labor-market policies and other improvements in the investment climate. Again, access to credit for the poor is a major constraint to accessing opportunities, including problems associated with collateral, complicated procedures and the inability to use a good repayment record as an asset. We therefore explore how to connect the poor to growth in three areas:
0
0
0
Connecting the rural poor to urban markets Connecting the poor to jobs Connecting the poor to finance
Connecting the rural poor to urban markets
Access to good quality Infrastructure Is strongly associated wlth economic success. Evidence from Indonesian surveys matches evidence from the rest of the world, confirming that access to good quality infrastructure is strongly associated with lower poverty often through enabling the success of non-farm enterprises. This can be demonstrated through a comparison of the productivity of enterprises in areas with and without access to good infrastructure (Willoughby, 2004; Escobal and Ponce, 2002; Songco, 2002; Lanjouw, 2001). 86
All-year sealed roads make a big dlfference to Incomes. For example, estimates from the 1993 and 2000 Indonesia Family Life Survey (Figure 4.12) show that access to improved infrastructure is strongly associated with non-farm enterprise (NFE) development. Households in villages with predominantly dirt roads earn 39 percent less of their income from non-farm enterprises than the average across all households. Households in villages where the average speed of travel to the district capital is faster also see more non-farm income earnings. Villages that had their roads upgraded between 1993 and 2000 saw significantly faster growth in non-farm enterprise activities than other villages (Gibson, 2006).
102

Chapter 4 Making Growth Work for the Poor
Figure 4.12 Better Infrastructure Is associated with higher levels of non-farm enterprise actlvltles In Indonesia
Public telephone No Public teleDhOne
No blackouts Less than weekly blackouts
More than weekly blackouts
84 X Village HH electricity 64% Village HH electricity
Asphalt or concrete road Dlrt road
0 1 2 3 4 5 6 Household Income from NFE (%)
Source: Gibson, 2006. Note: Results are conditional correlations, in the case of telephones on distance and average speed to provincial capital and dirt road, In the case of electricity and blackouts (both in the same regression) also on distance to provincial capital in the case of roads on distance and average speed to provincial capital.
Indonesia has made tremendous progress in improving rural infrastructure, but major gaps remain. Overall, at the national level, great advances have been made in improving access to electricity, roads and telecommunications facilities over the past 25 years. However, the development of this infrastructure has been uneven and areas outside Java/Bali lag behind in all areas (see Table 4.4). For example, the percentage of villages connected by a concrete or asphalt road is as low as 46 percent in Central Kalimantan. Similarly, while all provinces in Java/Baii had electrification rates above 90 percent, in Central Sulawesi only 64 percent of homes are served by PLN (the state electricity company).
103
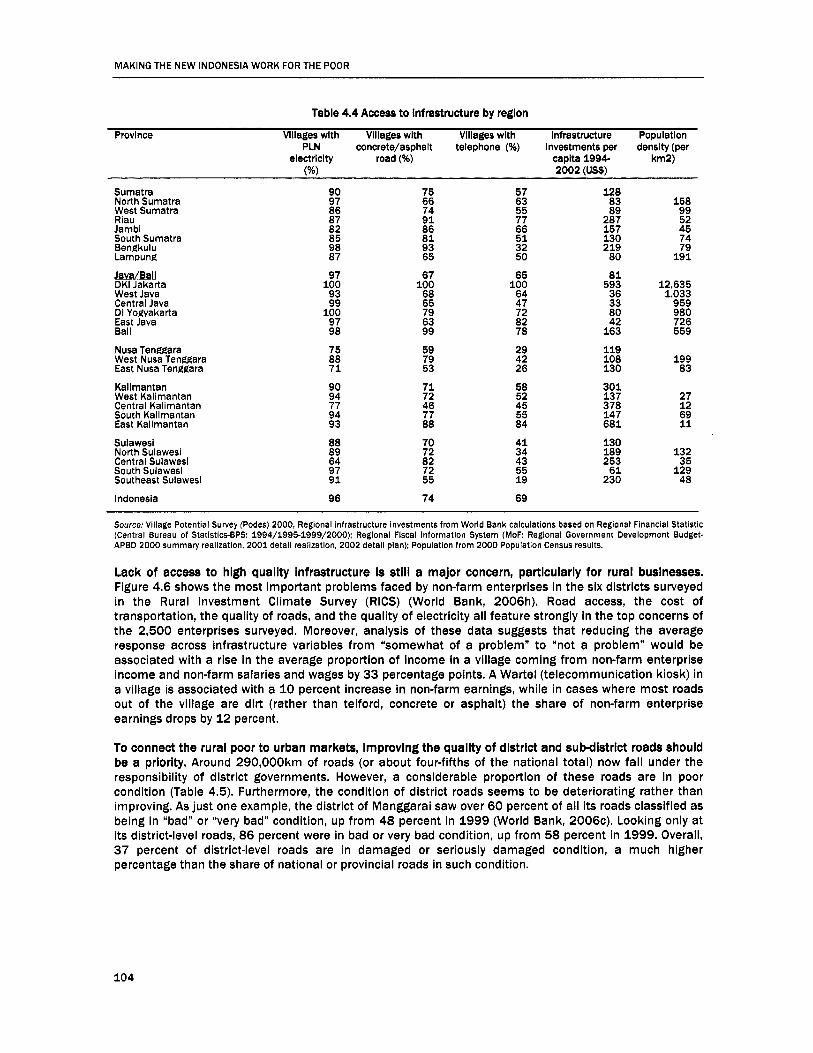
MAKING THE NEW INDONESIA WORK FOR THE POOR
Table 4.4 Access to Infrastructure by region
Province Villages wlth Vliiages wlth Villages with Infrastructure Populatlon PLN concrete/asphalt telephone (%) Investments per density (per
(%) 2002 IUS$) electricity road (%) capita 1994- km2)
Sumatra North Sumatra West Sumatra Riau Jambi South Sumatra Bengkulu Lampung
kE!!Ba!! DKI Jakarta West Java Central Java DI Yowakarta East Java Bali
Mu-alen~m West Nusa Tenaara East Nusa Tenggara
Kallmantan West Kalimantan Central Kalimantan South Kallmantan East Kalimantan
Sulawesl North Sulawesi Central Sulawesl South Sulawesi Southeast Sulawesl
Indonesia
90 97 86 87 82 85 98 87
97 100 93 99
100 97 98
75 88 7 1
90 94 77 94 93
88 89 64 97 91
96
75 66 74 91 86 8 1 93 65
67 100 68 65 79 63 99
59 79 53
7 1 72 46 77 88
70 72 82 72 55
74
57 63 55 77 66 51 32 50
65 100 64 47 72 82 78
29 42 26
58 52 45 55 84
4 1 34 43 55 19
69
128 83 89
287 157 130 2 19 80
158 99 52 45 74 79
191
8 1 593 12,635 36 1,033 33 959 80 980 42 726
163 559
119 108 199 130 83
301 13 7 27 378 12 147 69 681 11
130 189 132 253 35 6 1 129
230 48
Source: Village Potential Survey (Podes) 2000, Regional infrastructure investments from World Bank calculations based on Regional Flnancial Statistic (Central Bureau of Statistics-BPS: 1994/1995-1999/2000); Regional Fiscal Information System (MoF: Regional Government Development Budget- APED 2000 summary realization, 2001 detail realization, 2002 detail plan): Population from 2000 Population Census results.
Lack of access to high quality infrastructure Is still a major concern, particularly for rural businesses. Figure 4.6 shows the most important problems faced by non-farm enterprises in the six districts surveyed in the Rural Investment Climate Survey (RICS) (World Bank, 2006h). Road access, the cost of transportation, the quality of roads, and the quality of electricity all feature strongly in the top concerns of the 2,500 enterprises surveyed. Moreover, analysis of these data suggests that reducing the average response across infrastructure variables from "somewhat of a problem" to "not a problem" would be associated with a rise in the average proportion of income in a village coming from non-farm enterprise income and non-farm salaries and wages by 33 percentage points. A Wartel (telecommunication kiosk) in a village is associated with a 10 percent increase in non-farm earnings, while in cases where most roads out of the village are dirt (rather than telford, concrete or asphalt) the share of non-farm enterprise earnings drops by 12 percent.
To connect the rural poor to urban markets, improving the quality of district and sulxiistrict roads should be a priority. Around 290,000km of roads (or about four-fifths of the national total) now fall under the responsibility of district governments. However, a considerable proportion of these roads are in poor condition (Table 4.5). Furthermore, the condition of district roads seems to be deteriorating rather than improving. As just one example, the district of Manggarai saw over 60 percent of all its roads classified as being in "bad" or "very bad" condition, up from 48 percent in 1999 (World Bank, 2006~) . Looking only at its district-level roads, 86 percent were in bad or very bad condition, up from 58 percent in 1999. Overall, 37 percent of district-level roads are in damaged or seriously damaged condition, a much higher percentage than the share of national or provincial roads in such condition.
104

Chapter 4 Making Growth Work for the Poor
Table 4.5 Condition and surface type of dlstrlct-level roads, 2003
Sumatra Java Ball & Nusa Tenggara Kallmantan Sulawesl Maluku & Papua Total (km) (km) (km) (km) (km) (km) (km) %
Surface type Asphalt 41,814 61,948 12,389 9,537 23,718 3,703 153,109 52 Gravel/Stone 15,580 10,409 4,128 4,417 7,275 927 42,736 15 Earth 25,875 10,099 8,142 9,925 9,411 8,917 72,369 25
Total 90,232 83,943 25,700 28,236 44,606 20,057 292,774 100 Other wx~ 1,487 1,041 4,357 4,202 6,510 24,560 a
Condltlon Good 29,779 3 ~ , i a 3 9,217 7,183 18,357 5,179 105,898 36 Moderate 22,215 22,433 5,456 5,684 9,557 12,386 77,731 27 Damaged 21,815 18,283 7,295 8,818 6,939 903 64,053 22 Seriously Damaged 16,423 7,044 3,732 6,551 9,753 1,589 45,092 15 Total 90,232 83,943 25,700 28,236 44,606 20,057 292,774 100 Source: BPS, 2003.
Investing in district and suWlstrlct roads can give high rates of return. One concern about investing in district and sub-district roads is that they tend to be much more expensive per kilometer than national or provincial roads, while low population densities in more remote locations can mean that the benefits from their improvement are limited. However, evidence from community level infrastructure projects constructed as part of the Kecamatan Development Project (KDP) show that this does not necessarily have to be the case. Road projects implemented as part of KDP had an economic internal rate of return of between 33 and 47 percent (Torrens, 2005) and were 56 percent cheaper than equivalent roads built through government contracts. It will be important to translate the lessons about low cost infrastructure provision learned from community level projects such as KDP into effective mechanisms for reducing the costs and maximizing the benefits of more technically sophisticated district and subdistrict roads.
Most of the money for district roads comes from the central government. District governments are responsible for all road functions not specifically assigned to central or provincial governments, which includes the construction, upgrading and maintenance of all non-national and all non-provincial roads. Funding for this work comes predominantly from the central government’s general allocation fund (DAU), although funding can also come from the special allocation fund (DAK), grants from aid agencies, and central government support to rural infrastructure projects financed by savings from reduced fuel subsidies (PKPS-BBM), as well as district governments’ own-source revenues.
The poor quality of the road network Is a result of the dramatic decline In government expenditure on roads after the crisis. Analysis in Chapter 5 shows that expenditure from all levels of government on roads dropped dramatically after the crisis. This prolonged collapse in expenditure was one of the main reasons for the decline in road quality at all levels, but with a particularly damaging impact on district-level roads.
But lack of funding In aggregate Is now not the main problem. Road expenditure nearly recovered to its pre-crisis level in 2002 as a percentage of GDP. In the last couple of years, local governments have seen very large increases in their DAU allocations, partially as a result of redistribution of the gains from the reduction in the fuel subsidy. As a result, the aggregate level of funding is not now the principal problem.
The distribution of resources does not always reflect needs. The distribution of resources to the districts entailed in the current DAU formula does not reflect the road infrastructure needs of different districts very well. Decentralization led to the abandonment of the lnpres performance-oriented transfer programs, which helped to achieve national minimum service standards in road infrastructure, with funds granted on the basis of road length, condition, density and cost. The DAU by contrast is allocated primarily on the basis of population. Therefore, districts with extensive district road networks but sparse populations tend to receive fewer funds than they need to adequately maintain their road networks.
The key problem Is that not enough money is being allocated to maintenance. At the start of the 199Os, road maintenance accounted for about 47 percent of the central government grants to districts for roads. By the end of the decade, this had dropped to 15 percent (Parikesit, 2006). in 2001, routine spending on
105

MAKING THE NEW INDONESIA WORK FOR THE POOR
roads accounted for 8 percent of infrastructure spending by government. This dropped to only 4.5 percent by 2003 (although total infrastructure spending did rise over this period) (World Bank, 2006h, Chap 4). Estimating that 5.0 percent of total roads expenditure goes on maintenance, this suggests that annual government spending on maintenance is about Rp 986 billion. Estimates for the cost of full routine and periodic maintenance of just the district network are around 17 times this figure (Table 4.6), suggesting that much more needs to be spent on maintenance.
Table 4.6 Malntalnlng and upgradlng the district road network estlrnated costs
Upgrade cost (RP bn) (RP bn)
Asphalt 9,324 14,801
Maintenance cost per year
Stone/gravel 2,513 1,282 Earth 4,509 1,447 Total 16.346 17.530
Source: Based on surface type from Parikesit (2006), condition from World Bank (2004b), upgrade and maintenance cost from World Bank (2006a). Note: Based on the sssurnptlon that asphalt Is dlvlded equally between 6rn hotrnlx, 3rn hotrnlx and Impact.
international experience shows that road repair costs increase drarnatlcally If malntenance is neglected. If defects are neglected, an entire road section may fail completely, requiring full reconstruction at three times or more the cost, on average, of maintenance costs. For example, the South African National Road Agency Ltd. (Sanral) estimates that repair costs rise to six times maintenance costs after three years of neglect and to 18 times after five years of neglect. To avoid such escalating costs, Sanral first allocates its available funding resources to ideal maintenance actions and thereafter to more extensive works.
But in Indonesia road expenditure Is biased towards new road construction/upgrading. Around 95 percent of all road expenditure goes on new road construction, the reconstruction of poorly maintained roads, and upgrading roads to a higher standard. Moreover, this heavy bias towards construction/upgrading rather than routine maintenance is perpetuated by low maintenance expenditure itself since, as the roads degrade more quickly, there is greater pressure for higher expenditure on periodic maintenance and upgrading. Higher routine maintenance expenditure would reduce substantially the capital costs associated with periodic maintenance and upgrading, enabling these activities to take a less dominant share of the budget.
Why do district governments not spend more on maintenance?
0 The technical rules for maintenance are not yet in place. One adverse consequence of decentralization is that it has resulted in the removal of the former centralized standards-setting institutional structure, as well as the associated financing incentives to meet such standards.
The local politlcai economy demands new roads. Newly directly elected district heads and local legislators are under considerable local political pressure to deliver new asphalt roads. Each community that does not currently have access to an asphalt road would clearly prefer this to any other option. But such communities do not take into account the fact that other communities are asking for the same thing, and that resources are not available to provide new asphalt roads for all. Local politicians respond to these pressures by biasing expenditure towards highly visible asphalt roads rather than better maintenance of existing earth or gravel roads (World Bank, 2006~) .
0
0 More money can be corrupted from new roads. Sadly, road construction is a major source of corruption both in Indonesia and elsewhere. Anecdotal evidence suggests that road contractors are major contributors towards the election campaigns of district heads who, in turn, may influence key local officials to award construction contracts to the same contractors. Corruption may also account for the choice and type of roads to be constructed or upgraded in a district. Choosing to construct asphalt rather than Telford roads not only increases construction costs by 80 percent, but doubles maintenance costs. Despite this, all recent road upgrading in a case study in the district of Manggarai, East Nusa Tenggara, involved asphalt (World Bank, 2006a). In
106

Chapter 4 Making Growth Work for the Poor
general, the larger quantities and more complex procedures involved in asphalt construction allow for greater opportunities for corruption in construction. Corruption is thus a factor in the preference for expenditure on road construction (especially asphalt) rather than maintenance.
What should be done?
Create more resources for road maintenance. For example, this could be done through the creation of a district or provincial road fund. Such funds would collect resources from road users (including license and registration payments) and use these resources to maintain the road network under the oversight of a board involving both public and private sector representatives.
Introduce an appropriate district level Road Management System. An equivalent of the Indonesia Road Management System-which governs planning and budgeting at the national and provincial levels to ensure budgeting is adequate and well-targeted-is also needed at the district level. This would ensure that new investments are:
a) Based on verifiable (and sensible) design and selection criteria, which include consideration of spillover benefits to neighboring districts;
b) Being transparently and competitively bid out for construction; and c) Being constructed to a high standard based on independent quality audits carried out
with inputs from NGOs and local transport operators.
0
0 Greater use of performancebased contracts. For example, some central funds for road investments could be linked to the production of evidence that the existing road stock is being properly maintained. In addition, elements of road maintenance could be contracted out to private providers. Third-party verification of the quality of the maintenance operation might be used by DAH administrators as part of yardstick competition (comparison of performance between similar districts) to set standards to be met in order to receive investment funds. Local transport operators could again play an important role in providing inputs into the verification process, as a significant customer base for the road network.
Connecting the poor to jobs
For the poor to partlclpate In growth there must be jobs for them to do. Connecting the rural poor to urban markets will be critical to helping them escape from poverty. Most of the urban poor are already connected to such markets, so the key for them is to obtain better employment within urban areas. Section V discussed how to build the capabilities of the poor to enable them to participate in growth. However, in order for the poor to participate there must actually be jobs for them to do. Unfortunately, the rising costs of labor-market legislation and regulations in the post-crisis period, ranging from a strengthening of minimum-wage legislation to highly onerous terms and conditions for hiring and firing have had a significant impact on employment prospects particularly of the poor. This section explores the impact of labor market policies on the employment of the poor.
Formal labor market pollcles affect wages In the Informal sector. In an integrated labor market such as Indonesia’s, regulations in the formal sector can have immediate repercussions on employment uptake and productivity in the informal sector where most of the poor work. For example, restrictive labor regulations that decrease employment in the formal sector will cause an increase in levels of employment in the informal sector, as displaced workers move from one sector to the other. In order to absorb this increase in the supply of workers in the informal sector, marginal productivity and wages will fall as a consequence. There are three aspects of national and provincial labor legislation that have an important impact on employment growth, particularly in the formal sector: legislation and regulations on minimum wages; severance pay; and, contract workers and outsourcing.
107

MAKING THE NEW INDONESIA WORK FOR THE POOR
500 -
Minimum-wage regula tlons Minlmum wages have risen sharply in recent years. The Indonesian labor market has experienced a significant change since the early 199Os, with the implementation of regional minimum-wage regulations, which have been updated annually. SMERU (2001) reports that the government tripled the minimum wage in the first half of the 199Os, and the nominal wage continued to increase during the latter half of the 1990s. The real value of minimum wages began to taper off after 1996 and fell significantly in 1998. Since 2000, the economy has recovered and the various governments since then have vigorously pursued minimum-wage increases (Figure 4.13).
-Real m i n i m u m wage in 2002 prices * -
Figure 4.13 Real minlmum wages in lndonesla have been on the rise in recent years
w z 0 0 0 N
- 0 0 N
2 0 N
0 0 0 N .p 0 0 N
Y) 0 0 N
Source: World Bank Office Jakarta database.
Mlnlmum wages are now under the control of regional governments. Since the implementation of decentralization in 2001, power to determine minimum wages was transferred to the heads of regional governments, i.e. governors, mayors (walikota) and district heads/regents (bupati). The framework for setting the minimum wage was established by the national government and is implemented by provinces and districts. Each district’s minimum wage is anchored around the minimum wage set by the province. Minimum wages increase each year in line with minimum basic subsistence needs (KHM).
Minimum wages have been widely, although not uniformly, adopted by businesses in the modern formal sector. Large foreign-owned businesses usually do not see the minimum wage as an important cost burden and it is not among the most important factors for potential investors in choosing a location for their investments. It is a problem, however, for labor-intensive industries facing stiff competition from similar producers elsewhere in the region, notably Vietnam and China.
Evidence of the impact of minimum wages on formal employment in Indonesia Is mixed. SMERU (2001) suggested that increases in the minimum wages had a negative impact on urban formal sector employment after the crisis. This negative effect was greatest for those groups that are most vulnerable to change in labor market conditions, such as females, young workers and less educated workers. However, Alatas and Cameron (2003) found different results from a study of the impact of minimum wages under more favorable labor-market conditions prior to the crisis. Their study looked at the impact of minimum wages on employment in the clothing, textiles, footwear and leather industries. Their results suggest that the increase in minimum wages had no significant employment effect for large firms, both domestic and foreign. In contrast, the increase of minimum wages had a significant negative impact on employment in small domestic firms. An earlier study by Rama (1996) also found similar results.
Minimum wages may be a more important constraint on employment growth now than before the crisis. The different results from studies on the labor market before and after the crisis suggest that minimum wages may be a more important constraint upon employment in the formal sector now than in the more favorable labor-market conditions prior to the crisis. But it should be noted that the vast majority of micro
108

Chapter 4 Making Growth Work for the Poor
and small businesses at the district level do not conform to the minimum wage legislation at all. For example, a case study conducted in the district of Serang, Banten (World Bank, 20061) showed that while large and foreign-owned firms claim to pay their workers at, or even above, the minimum wage, many small or medium-sized, and even some larger, Indonesian firms still pay their workers below the minimum wage. Such broad non-compliance implies that minimum wages are unlikely to be a major constraint to the growth of most small enterprises.
Severance pay Severance pay regulatlons may also restrlct mobility in the formal sector labor market. Dismissal regulations in Indonesia that include provisions governing severance pay have seen significant changes since 1996, both in terms of rates and coverage to various groups of workers. While several countries are reforming their severance-pay systems to reduce dismissal costs, Indonesia appears to be moving in the opposite direction, with measures that increase dismissal costs.
Rates of severance pay for workers with long years of service were increased with the lmplementatlon of Law on Manpower No. l3/ 2003. The regulations define the rights of workers and rates of severance pay and longservice payments depending on the cause of separation. Three broad categories of reasons for separation include:
Voluntary quits; Dismissal for economic reasons (i.e. downsizing and bankruptcy); and Violations (minor and major violations or offences).
For workers dismissed for economic reasons, the law increased the overall rate of severance pay almost three-fold compared with the 1986 regulations.
But evidence from a case study In the district of Serang suggests that most small and medium buslnesses and even many large labor-Intensive firms do not comply with the law (World Bank, 2006b). In the event of economic downsizing, many firms claim that they could not afford to pay according to the 2003 law, and that they therefore opt for a compromise settlement through tripartite bargaining. In many cases, the practice is to pay severance payments of about one to two months of salary, regardless of legal entitlement.
Despite substantial non-compllance, the law still causes concern to buslnesses. Many firms are worried about their ability to stay competitive in the face of slow business growth and the threat of competition from similar industries in the East Asia region. There is a tendency for firms to increase the use of short- term contract workers and outsource their orders, especially for firms with fluctuating orders, in order to avoid using employees who would be entitled to higher severance pay.
Short-term contract workers and outsourcing Similarly, regulations governing the employment of contract workers and the outsourcing of labor appear to be becoming more, rather than less, restrictive. In particular, the Ministerial Decree No. 100/2004 on Temporary Working Agreements (or PKWT) creates a more restrictive regulatory environment. Among other provisions, this decree contains the following:
Contract renewals: While the previous decree permitted a once-only renewal of a short-term contract, it is unclear whether this is possible under the new decree;
Reporting requirements There are requirements to report the names of all daily and fixed-term contact workers to the local manpower office (LPSE FE UNPAD-GIAT, 2004);
Llmltatlons on terms of contracts Under the new decree, employers can only hire workers on limited-term contracts of no more than two years with a one-year extension allowed for a range of
0
0
0
109

MAKING THE NEW INDONESIA WORK FOR THE POOR
reasons.87 Employers can hire workers on contract for seasonal work or daily work lasting no more than three months, otherwise they must become permanent workers; and
Limitation on activities: The new law also limits labor outsourcing of production and services to ‘non-core’ activities, such as cleaning services, security and catering.
0
Restrictions on the choice of employment arrangements have discouraged firms from hlrlng new permanent workers in the formal sector. However, these regulations are unlikely to have a direct effect on employment in informal sector where the regulations are not binding. The impact on firms in the informal sector comes primarily from the increased supply of labor to the sector as a result of slower employment growth in the formal sector.
Evidence polnts to the Increasing use of contract workers and outsourcing. The case study in the district of Serang confirms a trend towards the use of contract workers and outsourcing due to fluctuating orders; excess supply in the labor market; and the impact of the Law No. 13/2003, particularly as it regards severance pay. Firms have largely shifted to limiting the number of permanent workers hired, or have avoided hiring permanent workers altogether. It is not uncommon to find firms with fluctuating orders that hire 20 percent of their workers on a daily basis. There are also cases where firms employ up to 70 percent of their workers as short-term contract workers, paid on a daily basis.
But few contract workers are ever permanently hired. The Serang case study found little evidence of contract workers being hired on a permanent basis after their two- to three-year contract periods had expired. Firms often re-contract the workers for another short-term period, without heeding the required maximum contract period of two to three year or the 30-day grace period required between completion of one short-term contract and the start of the next. The discrepancy between the law and actual practice reflects the labor-market surplus, where many jobseekers are willing to accept temporary employment without demanding legal minimum wages and workers benefits.
Making labor pollcy more prepoor A thorough revlew and revision of Indonesia’s labor laws at both the national and local level Is vltal. There is ample evidence that the ‘jobless’ recovery since the financial crisis is largely a product of a worsening investment climate for formal-sector firms. Recent labor regulations are a significant contributing factor to this. Existing labor regulations are inherently ‘anti-poor’, largely because they are forcing an increasing share of the labor force into the informal, unprotected sector.
A new social contract is needed with respect to minimum wages, severance pay and methods for settling Industrial labor disputes. Indonesia needs to substantially reduce the costs associated with employment, particularly of younger and female workers who face the greatest barriers to obtaining formal sector jobs. A t the same time, the government must protect and enforce basic labor rights and conditions appropriate to the country’s stage of development.
Moreover, these efforts may need to be accompanied by endeavors to ‘socialize’ the main Ideas through media and advocacy campaigns, if they are to be accepted by key political actors, at the national, provincial and district levels. Social support policies for the working poor (such as the cash compensation program for those most affected by the rise in fuel prices) and public works schemes for the poor can be an important complement in building support for reforms of the regulatory environment for labor.
110
Chapter 4: Making Growth Work for the Poor
Connecting the poor to financial services
Good financial systems play a key role In economlc development by acting as an efficient Intermediary between savers and borrowers in ways that result in acceptable returns on investment and effective management of risk. At the microeconomic level, the past three decades have seen a growing appreciation of the potential role of financial services in reducing poverty, both by supporting income growth among the poor and by allowing them to reduce their vulnerability to economic shocks.
Indonesia Is a world leader In microfinance. Although the Unit System of Bank Rakyat Indonesia (BRI) represents by far the largest single microfinance institution in Indonesia, it is only one of many financial institutions that have managed to find ways to serve low-income households and micro-scale enterprises while earning sufficient profit to survive and expand. Drawing upon this experience, it is possible to characterize three main linkages between financial services and poverty reduction:
(1) Microfinance for the poor (2) (3) Credit for employment-generating enterprises
Savings and other financial services for the poor
This section briefly considers each of these In turn, presenting a description of the principal linkages and some key constraints. The following section suggests how these constraints might be relieved. It is worth noting that many of the recommendations in this section are also relevant to Chapter on Social Protection in reducing the vulnerability of the poor and near-poor.
1. Mlcroflnance for the poor
The success of mlcroflnance Is a result of growth, as well as a cause. When considering the past and current success of microfinance in Indonesia, it is important to maintain a degree of perspective. The strong growth and success of largely rural but mainly non-farm microfinance in the 1980s up to the mid-1990s was preceded and accompanied by macroeconomic stability, growing agricultural productivity and heavy investment in rural infrastructure, particularly roads. The combination of growth in agriculture and increased opportunities for trade and services created by new roads produced an excellent environment for micro- and small-enterprise growth, particularly in petty trade.
But microfinance has its limitations, especially If growth Is absent. This experience is strongly indicative of the role that microenterprises and microfinance can reasonably be expected to play in economic development. During times of economlc growth, microenterprise development can be considered the embodiment of the multiplier-effect, taking advantage of the growth opportunities provided by infrastructure improvements or widely disseminated advances in technology, but rarely acting as an independent engine of growth. Indeed, this is true almost by definition, since the very few microenterprises capable of creating sustainable growth quickly become small- or medium-scale enterprises.
However, there Is still great potential value In connecting households to the financial system for the flrst time. Providing household enterprises with access to credit allows the family to make much more extensive and efficient use of available family labor and increases the family’s ability to take advantage of household investment opportunities, whether within or outside the enterprise. Moreover, the household increases its ability to smooth consumption over time, mainly through savings and enterprise diversification.
Reaching even the currently qualifying poor would Imply a substantial Increase In the borrower base of existing microfinance Institutions. For example, the 2002 Microfinance Access and Services Survey (MASS) (World Bank, 2006h) concluded that while about two-thirds of households would qualify for credit from a commercial microfinance institution (an institution with requirements similar to those of Bank Rakyat Indonesia-BRI Units), a large proportion of non-borrowing households were unaware that they met the requirements for a micro-scale loan. Just over one-fifth (21.6 percent) of all households
111

MAKING THE NEW INDONESIA WORK FOR THE POOR
2.
were actually borrowing. Moreover, 4 1 percent of qualifying non-borrowers (19 percent of total households) indicated that they would like to borrow, while 53 percent of non-qualifying households (17 percent of total households) said they would like to do so.
This suggests that the potentlal exists to almost double microfinance lending if ways can be found to address the constraints faced by households and firms that would qualify for loans and wish to borrow, but do not currently do so. Many, but not all, of the qualified non-borrowers appeared to lack information on whether and from where they could successfully obtain a loan.
Furthermore, there are many nearqualifiers who are able to demonstrate thelr creditworthiness with some relatively modest initial interventions. Thus, the target market for a special credit initiative can be broader than just the currently qualifying poor. Based on the experience of the P4K credit program8* and other programs to date, efforts to build the capacity of potential lenders are almost always better carried out through well-designed credit programs or NGO-aff iliated microfinance institutions than by more ‘commercial’ microfinance institutions.
However, few Indonesian institutions wish to actively target the enterprising poor when the number of potential non-poor (although usually still low-income) borrowers continues to represent a much larger and more immediately viable market. Therefore, achieving a rapid increase in the number of poor households borrowing from ‘commercial’ microfinance institutions requires a special initiative.
Nnanclal services for the poor: reducing distance, revamping products
Secure savlngs mechanisms are Invaluable to the poor. For those poor households able to use it productively, credit continues to dominate other financial services in its potential to increase income and household welfare. However, a large proportion of poor households are simply in no position at present to use credit effectively. Trying to lend to these households runs the risk of either deepening their impoverishment through debt collection or bankrupting and discrediting the microfinance institutions through failure to collect. Savings services carry far less risk of misapplication (as long as the savings institution is liquid, savers can always take their money back) and the use of financial savings services is also more widespread than credit.
The growth impact of savings services alone is far shallower than that of weil-appiied credit. Savings alone, even over a prolonged period, are unlikely to move families out of poverty. Indeed, financial savings, especially at the accumulation levels of the poor, are usually not a good investment-returns to small savings lag considerably behind inflation in Indonesia. Bank savings are, however, safe, liquid and confidential, while maintaining the slight barriers to convenient access that seem to help many people remain committed to their savings strategies.
But saving can constitute the first stage in asset accumulation or preparation for major expenditure. Financial savings can also reduce vulnerability to economic shocks (helping to prevent households from dropping into poverty), and savings accounts can facilitate careful cash management.
The anti-poverty benefits of savings are largely for the next generation, particularly in helping children continue their schooling-a major motivation for household saving. More intensive encouragement of a savings-oriented lifestyle, such as that promoted by many Indonesian credit unions, may of course yield much greater benefits over time, but is also relatively difficult to propagate outside a strongly supportive social environment.
Payment servlces also have an Important role In facllitating transfers. Credit and savings are still the two basic financial services, but online payment services (here the term is used to encompass deposit/withdrawal transactions at multiple locations, electronic transfers, overseas and domestic remittances, ATM access, debit/PoS cards, and similar services) have become increasingly important even to relatively low-income households in Indonesia over the past decade. In terms of poverty impact, online access facilitates domestic and overseas remittances, as well as support for family members, including students or aging relatives living far away from the principal family income- earners. The introduction of online services to previously unserved rural areas can greatly increase
112

Chapter 4 Making Growth Work for the Poor
local commerce in cases where there is potential for substantial trade in agricultural or other commodities. This effect, however, is likely to be mainly of indirect benefit to poor villagers.
To facilitate electronic payments, by far the single most useful step would be to encourage BRI to move faster in putting Its Unit System and village service posts (pos peiayanan desa) online. Indeed, BRI is already moving is this direction, committing itself to putting 1,000 units online in 200- much higher target than the 200-300 per year achieved previously. As BRl’s majority shareholder, the government could signal its support for higher levels of investment and technical support by BRI in this area, if it has not already done so.
Complementing this lnstitution-specific approach would be an Incentive program to any bank setting up online service locations In rural or remote areas, with care to ensure that program design does not inadvertently push a particular technical solution. People’s Credit Banks (BPRs) would also benefit greatly from improved access to online services, the current lack of which seriously harms their savings com petitiveness.
3. Can enterprise credlt generate more jobs for the poor?
The lndlrect Impact of credlt on generatlng employment growth may be as Important as the direct impact of mlcroflnance and flnanclal servlces. Not everyone is an entrepreneur. Just as it is fundamentally incorrect to design poverty alleviation policy as if the poor are helpless economic actors unable to manage their own affairs, it is equally wrong to assume that the poor are uniformly entrepreneurial. The real ladder out of poverty for many poor households is not subsistence-level self- employment but the ability to obtain a steady job for oneself or one’s children.
Would rellevlng credlt Constraints generate employment growth among the pooR Given that SMEs often mention credit (along with marketing or market constraints) as one of their top two business constraints,89 is there an important financial linkage to employment growth? In other words, could the removal of barriers to credit for growth-oriented enterprises help encourage employment for the poor? The answer to this question depends on the answers to four further questions:
Are a substantial number of enterprises credit-constrained? What are the constraints that they face? Would relieving the credit constraints for these enterprises increase employment? Would such employment draw in the poor?
A substantlal number of enterprises are creditconstrained. Systemic barriers to accessing lending still remain for enterprises of all sizes. For large enterprises and conglomerates, the main systemic hindrances to accessing credit tend to be structural, such as risks related to failures in the legal system. But for small and medium enterprises, much of the systemic problem is caused by more tractable policy issues. The Rural Investment Climate Survey (RICS) adds important data and insights on the credit problems faced by micro and small enterprises. Half the surveyed enterprises said they faced financial obstacles in maintaining operations or expanding (see Table 4.7). Almost a quarter said that this was their main problem.
Table 4.7 Financial obstacles faclng rural non-farm enterprises
Potential financerelated obstacles (N=2,366) Is a problem (%firms) Is the main problem (% firms)
Possibility to borrow from family, friends or others 33 3 Possibility to borrow from formal financial institution 46 11 Interest rate 47 5 Complicated bank loan procedures 45 2 Fear of not being able to pay Instailments 45 2 Ail financial obstacles 52 23
Source: Calculated from RICS, 2006.
There are many other reasons for enterprises not seeking loans. There are a wide range of constraints that discourage firms from applying to formal financial institutions for loans. These include lack of
113

MAKING THE NEW INDONESIA WORK FOR THE POOR
collateral, fear of not being able to repay, a desire not to have debt, complicated procedures and high interest rates.
Table 4.8 Reasons for not applylng to a formal financial institution (firms that need additional funds)
Mlcro Small Medium / All Enterprises
N -Number of firms In the survey 856 70 11 961 % of firms which listed the category as a reason for not applying for a loan (more than one reason allowed) Afraid of not being able to repay 62 44 27 59 interest rates too high 59 57 73 59 Don't want debt 50 36 50 Insufficient collateral / Don't meet requirements 50 39 0 48 Complicated procedures 46 43 45 45 Prefer to save 45 53 27 45 Prefer to borrow from family or friend 36 36 27 36 Don't know how to apply 32 14 0 30 Don't know where to apply 26 11 0 24 No FFI nearby 21 17 0 20 Had previous loan problems % 6 9 18 7
Large
Source: Calculated from RICS. 2006.
Relieving the credit constraints on these enterprises would probably Increase employment. The enterprises in the RICS indicated that their incomes might grow by 40 to 50 percent if these financial constraints could be removed. Analysis of loan size in comparison with their working capital suggests that the expansion could be even larger. Given the labor intensive nature of most micro and small businesses, it is highly likely that such a substantial expansion of activity would be accompanied by employment growth.
But It is less clear If the poor would be the primary beneficiaries. Unfortunately, we do not know whether the poor would be among the first beneficiaries of an increase in micro and SME employment, although most workers would certainly be drawn from low-income households (i.e. the near-poor). Given slow job growth in the economy, poor, less-educated workers may be at a disadvantage during the initial stages of job growth relative to their slightly better off but still under-employed peers. Even if SME employment has started to grow, the poorest are still likely to be at the end of the queue for trade and manufacturing jobs, where median worker education tends to be slightly higher (junior secondary school level) than in agriculture, construction, or mining (primary school level).
Approaches to improving access to financial services
Three approaches to improving access to financial services might support poverty reduction and pro-poor growth.
1. Support for one or more outreach lnltlatlves almed at connectlng new mlcreborrowers to the flnanclal system
One approach would be to develop a P4K-style outreach program for financing the household enterprises of rural low-Income households. Similar to the Kredit Mini/Midi program that marked the true beginning of BRI Unit microfinance in the late 1970% the P4K program is one of the relatively few credit programs that has worked well. That this program succeeded as well as it did is largely because so many aspects of the program were already 'institutional' from the beginning. Originally funded by IFAD/ADB and implemented jointly by the Ministry of Agriculture and BRI, agricultural extension workers carried out group formation and maintenance while BRI loaned to groups once they were ready. BRI also handled the financial administration. At its peak, the program was successfully lending to more than 200,000 marginal farming and fishing households.
114

Chapter 4: Making Growth Work for the Poor
2.
There remains a need to subsldlze some of the cost of group formatlon, supewlslon and InstitutlonaIlzatlon. Although the program had a very good repayment record (higher than 95 percent), especially compared with other government/donor credit programs, there is a need for an indirect subsidy to cover some of the cost of group formation; local, regional, and national supervision; and institutionalization, including some technical assistance. In general, loan risk proved to be concentrated in the first loan; if the borrower repaid their first loan on time, the risk on subsequent loans dropped to commercially acceptable levels. A successor to this program could be spread to all rural and semi-urban areas throughout Indonesia, not just in the present provinces. The P4K approach has the great advantage of scaling down in rural areas better than virtually any other program tried in Indonesia; other efforts at reaching the same class of borrowers (including small savings and loan cooperatives) require a critical mass of borrowers (50-100) at the local level in order to support the development of an institution.
To ensure success the early involvement of comrnerclal mlcroflnance institutions Is needed. In order to be a long-term success, such an initiative would need to have as its objective the bringing of borrowers into the financial system. In the past, this was largely accomplished by institutionalizing the program. A better approach would be to provide incentives for commercial micro lenders to begin lending to borrowers before the program ends (rather than attempt end-of-project handovers that often do not work). The key to this is early involvement of Interested commercial microfinance institutions.
Make comrnerclal banks (and BPRs) more transparent
Better reporting by lenders would Improve transparency. This initiative would require some technical expertise and a willingness to push key financial institutions to be more transparent in their activities. BRI in particular has established itself as perhaps the world’s best micro-enterprise finance institution, currently lending to more than 3 million micro-borrowers nationwide. However, the way in which reporting is done by BRI, most BPDsgO and some other banks that claim to focus on micro/SME lending, makes it difficult to determine how much lending has actually gone to micro/small enterprises, and how much has been consumer lending to individuals.
Banks tend to emphasize total disbursement, not outstanding loans or number of borrowers. For example, these banks are often reluctant to show micro-enterprise lending separate from micro-scale lending to civil servants and employees, and they tend to emphasize cumulative disbursement rather than outstanding loan amounts or the number of borrowers. The point here is not to embarrass banks or to add an additional reporting burden. Rather it is to require them to provide a more accurate picture of their current microfinance activities. In practice, the additional information required from banks is fairly modest:
Greater emphasis on reporting the number of accounts/people to whom micro and SME loans have been made, not just rupiah values;
A more honest classification of loans, distinguishing between enterprise and consumer lending; and
Particularly for state-owned banks, the requirement that the profit and loss of the banks be disaggregated according to business line.
3. Ensure that all banks have bask no-fee savlngs products avallable to the poor (and everyone else too)
Even modest bank fees can erode savings held by the poor. Since the poor are unlikely to earn much interest income, even a fairly modest monthly or per-transaction fee on deposits and withdrawals can wipe out interest earnings and even cause their savings balances to decline in nominal terms. Although desirable, a positive real rate of interest is not a requirement of a good pro-poor savings instrument, but a fee and interest structure that preserves poor savers’ nominal balances most certainly is.
115

MAKING THE NEW INDONESIA WORK FOR THE POOR
Slnce the burden of no-fee banking will fall on the banks, an award/reward scheme could act as an Incentive. In implementing this policy (whether through regulation or a ‘voluntary’ effort coordinated by the central bank), banks should of course be free to modify features (such as ATM and online services) normally included in a flagship savings product. There is no need to revert to a Tabanas-like national savings product. The key is to provide a no-fee option for basic savings services, minimally including unlimited free deposits and withdrawals at one location. The burden of this policy will fall disproportionately upon the banks with the best networks and fewest informal barriers to doing business with the poor, and it may be worthwhile to consider recognizing this with a small award/reward scheme.
VI1 Conclusion: Making Growth more Pro-Poor
Economic growth Is essential for poverty reductlon, but making growth pro-poor Is also Important. Supported by a growing body of academic research, including the World Bank’s seminal study on pro-poor growth (World Bank, 2 0 0 5 ~ ) ~ it is now widely accepted that economic growth is the primary driver of reducing poverty. This is just as true in Indonesia as elsewhere and, indeed, Indonesia has been an example of the successful channeling of growth for poverty reduction goals over a period spanning many years (Timmer, 2004). ‘Making growth work for the poor’ therefore requires both ‘making growth’ and ensuring that this growth is shared by the poor.
Indonesla’s successful pro-poor model was dislocated by the financial crisis. Unfortunately for Indonesia’s poor, when the Asian financial crisis struck in 1997, not only was the country’s previously robust growth shattered, but in the aftermath of the crisis Indonesia failed to return to the pro-poor pattern of growth that it had previously enjoyed. Not only was growth lackluster compared with previous years, but its character was no longer pro-poor. Even today, as growth finally picks up thanks to returning macroeconomic stability, the poor are not benefiting from the recovery to the same extent as the non- poor. This worrying state of affairs threatens to undermine Indonesia’s own medium-term poverty reduction objectives and potential even its ability to meet the MDGs by 2015.
Study of Indonesia’s pro-poor growth gives clues as to how to make renewed growth once again more pro- poor. Looking closely at the ways in which the poor moved out of poverty in the past, it is possible to understand the main pathways that enabled the poor to escape poverty. There are two key productivity pathways followed by individuals and households: improvements in agricultural productivity in rural areas, and increases in non-agricultural productivity in both urban and rapidly urbanizing rural areas. The first of these boosts the earnings of the rural poor, while the second helps to create better jobs (and higher earnings) for those poor who have already moved out of agriculture. In addition, there are two transitional phases that help the poor out of poverty: there is a sectoral shift from farm to rural non-farm employment, and there is a locational shift out of rural areas to urban employment, through both seasonal and permanent migration. In Indonesia’s post-crisis renewed-growth environment, the government needs to apply policy measures that support these pathways and transitions out of poverty in order to make growth pro-poor once again.
Macroeconomic stability Is fundamental to growth and therefore to poverty reductlon. As Indonesia’s experience over the past decade attests, there can be little real growth, and therefore little real progress in poverty reduction, without a stable macroeconomic environment. Indonesia has struggled hard to recover from the 1997-98 crisis. And in the past couple of years the government has succeeded in restoring confidence in the economy and bringing about a return to macroeconomic stability. Despite ongoing risks and the impacts of foreign shocks-for example the surge in oil prices in 2005-the government has managed to maintain this hard won stability. This bodes well for higher levels of growth going forward.
Macroeconomic stabillty will also help to make growth pro-poor In several ways. One is restoring low inflation. This is all the more important after the turbulence of 2005, as rising prices hit the poor hardest.
116

Chapter 4 Making Growth Work for the Poor
Also important is keeping the fiscal balance in check, maintaining confidence in the currency and the government’s fiscal management. The government has done well here too, addressing the politically difficult issue of burgeoning fuel subsidies before this undermined the currency. Finally, maintaining an open trade regime is important and Indonesia has made steady progress towards this end, although the continuing restrictions on rice imports have the potential to hurt the poor (and throw many of the near- poor back into poverty) if scarcity of rice is again allo,wed to drive prices upwards.
To enable the poor to benefit from renewed growth, the government needs to invest in the capabilities of the poor. Just as important as macroeconomic policies, microeconomic measures are key to building the capabilities of the poor if they are to be able to move along the pathways out of poverty. Action in two areas would support pro-poor growth. First, higher agricultural productivity is an important pathway out of poverty and measures to build capabilities here are crucial. These include revitalizing agriculture through improved irrigation quality and management, promoting diversification into higher-value crops and livestock, boosting agricultural research, redesigning agricultural extension systems, developing marketing and IT for agriculture and rural SMEs, and improving property rights and the land market. Second, providing targeted education and vocational training to build the capabilities of the poor is key. Here there is scope for helping the poor gain better access to vocational schools (SMKs) and vocational training centers (BLKs and KLKs), for example through targeted voucher schemes. The BLKs and KLKs should also be used as a means of improving pro-poor targeting of training programs, while companies should be provided with incentives to train apprentices from poor households.
The government also needs to ensure that the poor are connected to the opportunities generated by renewed growth. Even with their capabilities enhanced, the poor still need to be connected to opportunities if they are to benefit from growth. First, the government needs to invest in rural infrastructure to ensure that the rural poor are physically connected to urban markets. In particular, rural roads have deteriorated markedly since the crisis and additional resources now need to be channeled into the repair and routine maintenance of rural roads, supported by a new district-level road management system. The increased use of performance-based contracts for road maintenance work would also be beneficial in ensuring quality standards of maintenance work. Second, for the poor to escape poverty they must be connected to employment opportunities. Rigidities in the labor market are causing jobs to move from the formal to the informal sector, hurting the poor. As the government addresses the issue of labor policy and considers revisions to the current labor regime, its emphasis should be on making Indonesia’s labor policy more pro-poor. This could be done by constructing a new social contract regarding minimum wages, severance pay and methods for settling industrial labor disputes. Third, the poor need to be better connected to financial services. This can be achieved through expanding microfinance programs, making commercial banks more transparent and ensuring that all banks have no-fee savings and other pro-poor products
117

Chapter 4: Making Growth Work for the Poor
Remittances from female migrant workers: A lifeline to communities
More than 80 percent of the 400,000 reglstered overseas workers In 2004 were women. These women are known as ‘TKW’ in Indonesia, or tenaga kerja wanita. Given the high number of informal or undocumented workers, the total could be as much as twice as high as those officially registered. Women as a percentage of the total number of migrants have been increasing since the government began promoting labor exports in the 1980s. Their general low level of educational attainment means that the majority work in unskilled occupations-usually in the informal sector as domestic workers, but also in factories and the entertainment industry. The vast majority of female migrant workers are from rural areas in selected regions and provinces.gi The main destination countries are Saudi Arabia, Malaysia, Kuwait, Singapore, Hong Kong and Taiwan.
Limited job opportunltles and low salaries in rural areas, together wlth a need to repay debt and/or a deslre to emulate other successful returnee mlgrants, provide the stlmulus for women to seek work overseas. Recruiters or ‘middlemen’ (calo), who actively recruit from certain villages, play an important role in influencing women to work overseas, providing information and funds that can be borrowed by migrants to cover the various costs of migration.
Placement costs are stlpulated by the Mlnlstry of Manpower and Transmlgration, but they only represent part of the total cost, as the actual costs are often far hlgher. Placement costs charged by brokers or agents vary from one month up to one year of the salary of migrant workers. Often the higher the wages migrant workers will potentially receive the higher the placement cost. The placement costs may be paid in cash upfront or in the form of a loan that is deducted from migrants’ wages. In addition to placement costs, formal migrants also have other expenses charged to them, such as accommodation in the ‘training’ center before departure, living expenses in the host country and the cost of returning home.
Total official remittances from lndoneslan mlgrant workers were US$1.35 billion In 2004 and estimated to be US$2.5 billion in 2005. Given that migrant workers come from selected regions, it is not surprisingly that remittances return to those selected regions. Several districts in Indonesia receive large volumes of remittances, for example: (i) in Sukabumi, West Java, remittances (compared with regional own source revenues in brackets) were Rp 480 billion (Rp 23.9 billion) in 2001, Rp 285 billion (Rp 31.2 billion) in 2002, and Rp 237 billion (Rp 34.7 billion) in 2003;9* and (ii) in West Nusa Tenggara remittances average Rp 111 million per month and constitute 3.8 percent of the region’s gross domestic product (Ananta and Arifin, 2004).
It Is difficult to measure the value of remlttances reliably and data are not sex disaggregated. Official balance of payments or central bank data on remittances are compiled using data on wire transfer flows officially reported by financial-sector institutions. Such data significantly underestimate actual remittance flows, in particular because they do not include funds repatriated informally by both formal and informal migrants through mail services as well as intermediaries. They also fail to capture non-monetary goods that are brought back.
Costs of sending remittances are often unnecessarily high glven the relatlvely small transfers made by female migrants. If sent through banks or transfer service provides, fees vary by country. Often family members do not have ready access to banking services and so money is sent through brokers’ or agents’ accounts. Brokers tend to charge relatively high transaction fees, sometimes taking advantage of the financial illiteracy of migrants and/or their families.
Salary level is the key factor Influencing the amount of remittances sent. There is a significant variation in domestic workers’ wages paid to female migrant workers and therefore in how much is remitted. In a recent World Bank study, the average salary was US$70/month for domestic workers in Malaysia, compared with a much higher salary of US$39O/month in Hong Kong and Taiwan. How much is remitted, as well as how much is received, is also influenced by the various fees that have to be paid as part of the recruitment process, the level of a migrant’s education, ease of money transfers, the number of dependents in the household and the family relationship.
118
MAKING THE NEW INDONESIA WORK FOR THE POOR
Research from other countrles suggests that women mlgrants are more rellable remitters than men. Some researchers have posited that this is because female migrants are more closely attached to their families and/or there is more pressure upon them to fulfill familial obligations.
Studies show that the majorlty of remlttances received are used to pay off debts and for consumptlve needs. The World Bank study found that the prominence of unproductive expenditures stems in part from the lack of investment opportunities at the village level. Remittances spurred a housing construction boom in the four districts that were part of the World Bank study. Remittances were also occasionally used to buy land or cattle. A study of returned migrants in West Java also found only a small proportion spent their money on productive uses, such as buying agricultural land or starting businesses.
There are no rellable data In lndonesla comparing how male and female mlgrants spend their remlttances. However, a worldwide UNFPA study documented that male and female immigrants spend remittance income differently. Men tend to purchase conspicuous consumer goods, such as cars and televisions, while women are far more likely to invest remittance income in food, schooling and healthcare services. The report tentatively concluded that female spending patterns may “raise families out of poverty in the long run.”
Ways fomard In maximizing the beneflts from female migrant workers
A comprehensive integrated migrant policy and management system would include measures to facilitate transmittal of remittances to boost both their contribution to economic growth, as well as provide benefits to women and their families, such as:
Revlew and Improve the quallty of data and methodologies used to estimate remlttances. Basic sex- disaggregated data on many aspects of remittances need to be collected and made available on a regular basis. Currently, many of the remittances that enter Indonesia are not recorded and, where they are, the data do not indicate the sex of the sender. This would allow more indepth analysis to determine, for example, whether there are differences between men and women in terms of the share of remittances that is remitted and how the money is spent. A better understanding of the gendered patterns of migration would contribute towards the development of more appropriate policies.
Reduce the costs of transferring remlttances. An international study of remittances suggests that greater competition among remittance service-providers could reduce remittance costs (World Bank, 2006). While this is largely up to the remittancesource countries, Indonesia could facilitate the establishment of payment networks that are shared by banks and microfinance institutions. Another alternative could be to facilitate establishment of cooperatives of female migrants to pool and remit savings.
Facllltate remittance Inflows through formal means uslng mlcroflnance mechanlsms that migrant women and their families are familiar with. Small cooperatives and rural credit unions are springing up to receive transfers, hold savings and make small loans to develop small businesses. The legal framework should be adjusted to permit these institutions to receive remittances.
Provide supports to facllltate the use of remittances towards Investment. This could include the creation of social funds, savings and credit plans to finance small business start-ups, as well as promotion of financial literacy. Providing advisory services to households with migrant workers to start up microenterprises could also be explored. Banks should be encouraged to provide financial services, such as remittance management, savings and investments. The Unit System of Bank Rakyat Indonesia (BRI), for example, lends to migrant workers’ families using the future remittances as collateral. They also offer credit to migrant workers at the time of departure, usually at more favorable rates than placement agencies
119


Chapter 5 Making Public Spending Work for the Poor


Chapter 5 Making Public Spending Work for the Poor
I Introduction
The next decade poses some very specific challenges, but also a tremendous window of opportunity for Indonesia to use Its public resources to make a dramatic leap in reducing povew In all its dimensions. Indonesia recently surpassed an international threshold, moving out of the range of low-income countries in 2003. Even with current growth rates-which well exceed population growth-Indonesia is expected to consolidate its place as a middle-income country by the end of this decade. This, coupled with a continued stable macroeconomy and a sound fiscal position, should continue to provide the government with the fiscal resources it needs to achieve its development objectives and to address the main poverty issues that still plague the country (see Chapter 3 on Understanding Poverty). The fiscal scope for making progress on the poverty reduction agenda has also been augmented by the significant increase in state revenues from oil and gas exports, as well as the concomitant steps taken to reduce the significant budget share absorbed by regressive fuel subsidies. The public resources are now available to address poverty in Indonesia in the remainder of this decade as the country moves to take its place among other middle-income countries.
The government has expressed a strong commitment towards achieving the Miilennlum Development Goals (MDGs) by 2015, and to making concrete progress against those and other Indonesia specific objectives during the current admlnistratlon. The government has set itself ambitious targets to address poverty in its multiple dimensions. indeed, the current administration has stated its intention to halve income poverty over the five-year period up to the end of this decade. Critical to this effort will be putting Indonesia’s growing public financial resources to the most effective use in reducing poverty and achieving Indonesia’s development objectives.
Table 5.1 MDGs and national medium-term development targets (RPJMs) for Indonesia Indicatorflarget 2000 2002 2004 RPJM 2009 MDGs 2015
Poverty Reduction Actual Actual Actual Target Target
Population below US$1 a day (%) 7.2 7.5 4.8 10.3 Poverty head-count ratio (%) 18.2 16.7 8.2 7.5 Population below US$2 a day (%) 55.4 52.4 45.4
Under 5 mortality rate (per 1,000 live births) 48.0 38.4 33 Health
infant mortality rate (per 1,000 live births) 36.0 29.6 26 Maternal mortality ratio (per 100,000 live 307 226 105 births)
Education
(%) Net enrollment rate in primary education 93.9 95.3 94.3 99.6 100
Literacy rate of 15-24 years of age (%) 98.7 100 Gross enrollment rate at junior level (%) 79.5 82.2 98.1
Water &Sanitation Population with access to improved water (%I Rural Development Agricultural sector growth (%)
77.0 80
3.5
Source: Indonesia Progress Report on the MDGs 2001, World Development Indicators. Medium-Term Development Pian and Country Assistance Strategy, 2004.
The effective and efficient use of public funds to target sectors that are most beneficial to the poor Is crucial for poverty allevlatlon. How those funds are allocated across sectors and also within sectors in programs better targeted towards the poor is of considerable importance to the government. There are three broad areas through which government spending can help to reduce poverty: (i) through social services in the health and education sectors that increase the human capital of the poor and hence improve their productivity; (ii) through infrastructure investments that increase the income opportunities and market access of the poor; and (iii) through social transfers and safety nets that help to supplement
121

MAKING THE NEW INDONESIA WORK FOR THE POOR
the income of the poor and near-poor in the short term (considered in more detail in Chapter 6 on Social Protection). If Indonesia is to succeed in achieving its objectives, it needs to spend its resources more effectively on service provision, particularly in these sectors. Indonesia needs to spend enough (level), on the right things (sector allocation), in the right places (geography). This chapter takes stock of the poverty focus of Indonesia’s spending today and points to some concrete and strategic actions that would help to improve spending in ways that could accelerate Indonesia’s development and reduction of poverty by the end of this decade. The chapter starts with a discussion of aggregate spending levels in Indonesia and fiscal space in the years going forward, and then considers sectoral spending in the education, health, water and sanitation. and roads sectors.
Success In achieving Indonesia’s development goals does not only depend on Increased spending In p r e poor sectors but also on the ability to translate these resources Into Improved services to the poor. Weak performance incentives, a lack of accountability mechanisms and imperfect monitoring systems can all undermine the delivery of services to the poor even when the availability of resources is not a constraint (World Bank, 2004d). While this chapter looks at how spending can be better allocated to address some of Indonesia’s most pressing poverty issues, Chapter 7 on Government focuses on issues of accountability, governance and transparency, which are just as vital if these services are to better serve the poor.
II Aggregate Spending Levels and Fiscal Space
Aggregate spending
in the period since the oil boom in the 1970s, Indonesia has made exemplary progress In harnessing Its growth to reduce poverty, primarily through Its public Investment program.93 With the reduction in fuel prices in 1986-88, Indonesia experienced an external revenue shock, which resulted in reductions in capital spending. The levels of spending recovered towards the end of the 1980s and remained stable in real terms until the Asian financial crisis in the late 1990s.
in the period ieadlng up to the financial crlsis and also foilowing it, aggregate fiscal spending was restrained, with Implications for the public Investment program. As a percentage of GDP, central expenditures were already beginning to fall after 1994. After the financial crisis, there was a peak in percentage of GDP expenditures mostly due to the reduction in the denominator with shrinking economic activity. Indonesia has successfully achieved fiscal consolidation in the years following the crisis. The budget deficit was reduced to about 1.0 percent of GDP in 2004 and 0.5 percent of GDP in 2005, while the central government’s debt outstanding contracted from about 100 percent in 1999 to 46.8 percent in 2005 (PER, World Bank, forthcoming). Such a conservative fiscal policy has contributed to macroeconomic stability in this period and Indonesia’s fiscal situation has significantly improved over the past five years. On the flip side, fiscal consolidation after the crisis has squeezed out spending in the development sectors.
Fuel subsldies played a major role in determinlng levels of central spending after the crisis and fluctuations in world oll prices have had a direct Impact on indonesla’s fiscal spending as a result of price control policies. Although real consolidated spending increased in Indonesia following the crisis, the changes in spending were largely driven by changes in the fuel subsidy which, in turn, were closely related to fluctuations in world oil prices. The fuel subsidy reached Rp 69 trillion in 2004 and continued to surge to Rp 96 trillion in 2005, despite reductions in the subsidy in that year.94 The increase in fuel subsidies was mainly attributed to the fixed fuel-price mechanism introduced in January 2003 and subsequent international oil-price increases (see Figures 5.1 and 5.2). Concurrently, domestic fuel consumption increased over these two years and, in order to meet this increasing demand, the government was forced to import expensive fuel products. While in the 1970s and 1980s Indonesia was able to ride the wave of increased world oil prices as a net oil exporter, after the crisis, with reduced production capacity and continuing price controls, Indonesia began to subsidize domestic oil consumption as a net importer of refined oil products (PER, 2005). As a result, the large chunk of funding allocated to fuel subsidies took
122

Chapter 5: Making Public Spending Work for the Poor
away resources from important development sectors (see Figure 5.3). But while fuel subsidies were the major transfer program in the country and constituted a large part of the government budget, they failed to respond to the needs of the poor and were highly regressive in their targeting.96
Figure 5.1 Consolidated spending as a percentage of GDP over time
FY94 FY95 FY% FY97FY98 FY98FYOO FYOl FYOZ FY03 FYCd FYO5 FYW
- C T ~ l a l Exp.ndilur.e IEroludmg loan o~p11a I paymmlr l --c C ~ n l r a i Spending -+Tranthrs to Local Gournment -.ci- Pari OfCenIral Spending AIIw*ted 10 Fun1 Subidles
Source: Ministry of Finance (MoF) data, World Bank calculations.
Figure 5.3 Fuel subsldies and spending in prepoor development sectors
4 5 % % i I 3%
c1 2 % 0
1 %
0% FY84 FY95 FY96 FY97 FY98 FYW FYOO FYOl FYOZ FY03 FY04 FYOS
+Fuel Subsidies HeaNhSperdicg
Inflaitiuctu$ Developmew Spending I*- EducaOon Spending
Source: MoF, SIKD.
Figure 5.2 Fuel subsidies ran out of control with increasing oil prices and stagnating refinery capacity
14 *
12 ,
60
20 -
0
I Indonesia's zoo2 Fuel Subsidy 2003 (Billion USS) 2004 2005
+International Average Crude Oil Price (US$ per barmi)
Source: MoF. EIA 2006. Note: International oil prices taken as refiner acquisition cost of crude oil, composite (US$/barrel).
Flgure 5.3a Fiscal space for development programs and fuel subsidy reductions
1 16
14
* 12
= 10
a 2 8
4
2
0 F Y O l FY02 FY03 FYO4 FY05 FY06
(Budgeted)
mFuel Subsidies Realized Msavings from JulyfAug adjustment
mSavlngs from March 05 prlce hike USavings from October 05 price hike
Source: MoF data, World Bank PER 2006 calculations. Note: International oil price assumption for 2006 is taken as US$60 for this calculation.
Another important development In the period after the crisis was the decentraliratlon of fiscal spending to the districts after 2001, allowing spending by the regions to constitute a growing share of total public Spending. Whereas in 2000 the central government share of spending was 87 percent and the regional governments' share 13 percent, by 2004 the share of the central government had declined to 69.3 percent, while the regional governments' share had grown to 30.7 percent (PER, World Bank, forthcoming). (See Figure 5.1) Indonesia now operates within a decentralized fiscal setting and policies going forward need to take into account incentives by local governments to prioritize pro-poor development sectors in order to achieve national poverty reduction priorities. This topic will be further discussed in the Chapter 7 on Government. Aggregate development expenditure is close to the precrisls level mostly as a result of increasing distrlct- level spending. Aggregate development expenditure as a share of GDP started to recover, reaching 5.4 percent in 2004, although this was still lower than the pre-crisis high of 7.5 percent in 1994. Although for a period of time the transition to decentralization may have adversely affected the disbursement of development expenditure, the subsequent recovery in development spending was largely driven by district governments. Development expenditure by district governments increased from 1.1 percent of GDP in 1994 to 1.8 percent in 2004, while development expenditure at the central government level decreased from 5.6 percent in 1994 to 2.7 percent in 2004.96
123

MAKING THE NEW INDONESIA WORK FOR THE POOR
The current fiscal sltuatlon and fiscal prospects compared with the past decade are much more promising. The government’s decision to reduce fuel subsidies is a major contributor to this outcome. Initially raising fuel prices in March 2005 by a weighted average of 29 percent, the government followed this increase with a far more dramatic increase in October 2005, when prices were raised by a weighted average of an additional 114 percent.9’ Current projections foresee the government continuing to focus on fiscal consolidation, with deficits projected at no more than 1.0 percent of GDP. The medium-term fiscal framework shows substantial scope for increasing spending levels in the medium term in order to achieve development targets. Fuel-subsidy reductions in 2005 provided a gross saving of US$4.6 billion for the budget (from the March and October price increases) and an additional US$l.O billion from the July/August adjustment in industrial prices (see Figure 5.3a). The government reallocated about US$1.7 billion of these savings into development programs in education, health and rural infrastructure, as weii as putting into place a cash transfer program designed to mitigate the impact of the October fuel-price increases, leaving the rest of the savings for increased deficit financing. For 2006, the savings from the October price increase are estimated to be around US$10.1 billion. In the medium term, in order for fiscal policy to play an active role in supporting economic growth, fiscal consolidation must be balanced with rising public investment in key social and infrastructure sectors. With this level of savings available from the reduction in the fuel subsidy, the government’s challenge will be to spend the available funding wisely in poverty reducing sectors that will also support future economic growth.
Sectoral spending
The focus of the sections that follow is on government spending on services that are central to the needs of the poor. In particular, these focus on public spending aimed at poverty reduction in key social service sectors, namely in the human development sectors of (i) education and (ii) health, and in the infrastructure sectors of (iii) water and sanitation systems, and (iv) rural roads. (Spending on social protection and transfer programs is discussed in greater depth in Chapter 6.) These sectors are prioritized under the current government medium-term plan (RPJM) and already make up a significant portion of total spending.
As an extension of the discusslon of health sector spending there is also a focus on two non-Income dimensions of poverty, namely (i) reducing maternal mortality, and (li) reduclng malnutrition. These areas have been prioritized by the government in its national development targets and are also components of the MDGs (see Table 5.1). The Focuses on Maternal Mortality and on Child Malnutrition at the end of the chapter provide diagnostics on the constraints that limit Indonesia’s achievement of better outcomes in these priority areas and suggest specific vertical interventions for overcoming these constraints.
With the exceptlon of infrastructure development spending, in the period between 1994 and 2004 spending In all these sectors Increased, although there was a temporary dip in all sectors followlng the crlsls. Post crisis, education and health expenditures picked up (both in real terms and as a percentage of GDP) with increases in decentralized spending by district governments and continued development and routine spending by the central government (see Figures 5.1 and 5.3). Infrastructure development spending has been slower to recover than other sectoral spending, but by 2004 it was close to returning to pre-crisis levels.
The reductlon of fuel subsldes in 2005 has further freed up resources for more pro-poor spendlng and Increased allocations in these sectors. The government reallocated a total of US$1.7 billion in 2005 away from the regressive fuel subsidy to pro-poor sectors and programs with better-founded development objectives (the PKPS-BBMgS programs). The government has taken a politically difficult but economically rational and pro-poor step in allocating resources more effectively in sectors that matter to future growth and prosperity. The boxes on each of these four programs, in this chapter and in Chapter 6 on Social Protection, provide information on the design, budget and targeting of these programs, as well as preliminary results from the recently undertaken qualitative evaluations of the programs.
The PKPSBBM unconditional cash transfer (UCT) program was designed to serve as a social safety net, protecting the poor against the short-term impact of the fuel-price increases. (For details on budget, targeting and preliminary evaluation results see Box 6.3 in Chapter 6).
0
124

Chapter 5: Making Public Spending Work for the Poor
0 in the education sector, the compensation package included an operational aid program to primary and junior secondary schools (BOP) aimed at canceling school fees, as well as providing targeted scholarships for poor senior secondary school students (see Box 5.1).
0 in healthcare, the fuel-subsidy savings were reallocated in a program that supports basic healthcare at the Puskesmas level and also offers targeted health insurance coverage to the poor for in-patient care in third-class hospital beds (see Box 6.7 in Chapter 6).
In rural infrastructure, the government financed direct grants to 12,800 villages with the objective of improving village infrastructure and generating labor-intensive employment through a bottom- up decision-making process (see Box 5.4).
0
Ill Human Development Sectors
Ove w iew
Inadequate educatlon is a powerful determinant of povei-j and unequa access to education Is a strong correlate of income inequality. Providing basic education for all has long been a poverty reduction strategy for Indonesia. Since the 1970s, Indonesia has invested vastly in infrastructure for primary education through the lnpres program (see Annex V . 1 lnpres development grants), and has achieved high enrollment rates for most of its population at the primary school level. Basic education or literacy training has been crucial in equipping the poor with the means to contribute to, and benefit from, economic growth. Furthermore, improving the educational attainment of Indonesians is critical to their obtaining better jobs and working their way out of poverty, while also improving Indonesia’s competitiveness in the global economy (see Chapter 4 on Growth for linkages between education investments and growth). Indonesia’s human capital policies have played a critical role in creating and supporting rapid economic growth from the 1970s through to the late 1990s. The education policies in Indonesia focused on primary and secondary schooling-rather than higher levels of schooling that would have benefited only a select few. Meanwhile, limited public funding for post-secondary education focused on technical skills and vocational training; higher education at university and college levels was largely met by self-financed private systems.
In Indonesia, the return to education are increasingly higher for higher levels of schooling, so focusing education investments only on primary education Is no longer sufficient. The benefits of openness, technology and market competition for economic growth depend greatly on education and skill levels, and increasingly higher levels of education become more important for retaining the benefits of growth. Alatas and Bourguignon (2005) find that in Indonesia, the earning function for male wage workers is ‘convex’, which implies that an additional year of schooling means an increasingly higher relative gain of income for those who have high initial levels of schooling.100 The increasing return to each additional year of schooling in the earnings function can lead to increased inequalities, as the rich have more access to higher levels of education. Poverty diagnostics also show that the gap in the return to educational assets has also increased in Indonesia and educational assets have proved to be a means for escaping poverty after the crisis for many of the transitory poor (see Chapter 3 on Understanding Poverty). The implication of these findings is that the returns to human capital are rising and the gap between the educated and non-educated is widening, with an increasing return for each additional year of schooling, especially in urban areas. While in previous decades providing primary education to the poor was sufficient, the government has to increasingly think of ways to integrate the poor into these labor markets and to improve their ability to tap into the benefits of growth.
Indonesia has set itself a medium-term development pian target of reaching 100 percent enrollment at the prlmary school level and 98 percent enrollment at the junior secondary school level by 2009. National Education System Law No. 20/2003 states that every citizen aged 7 to 15 must attend basic education, implying that the government needs to provide free educational services to all pupils at these levels of schooling. Achieving such ambitious enrollment targets, coupled with investments in improving the quality of education, will be central to Indonesia’s poverty reduction strategy, as well as its
125

MAKING THE NEW INDONESIA WORK FOR THE POOR
competitiveness in the region and its rate of growth in the years to come (see Table 5.1 MDGs and national medium-term development targets (RPJMs) for Indonesia).
Indonesia’s past enrollment expansion closed the enrollment gap across income groups at the primary education level, but strlking lnequalitles remain at the junlor secondary and senlor secondary levels. In 2004, primary school enrollment rates were 107 percent gross and 93 percent net in Indonesia.iOi Problems with access become more significant at the junior secondary school level. Using figures from 2004, there is a significant break in enrollment rates at the junior secondary level, where the gross enrollment rate is 82 percent but the net enrollment rate declines to 65 percent. Officially, basic education (through grades from 1 to 9) is compulsory for children aged 7 to 15, although this is not strictly enforced. While access to primary schooling may still be a problem in remote areas, today for most of the poor in Indonesia the most pressing issue in terms of access to education concerns the transition to junior secondary schooling.
Equally impottant, health is one of the key goals of development and lack of access to healthcare Is in itself a key dimension of poverty. Out of seven Millennium Development Goals (MDGs), four relate to health102 including reductions in maternal, infant and under-five mortality, disease control for malaria and HIV/AIDS, as well as the elimination of extreme poverty which, broadly defined, is also related to access to affordable healthcare by all households. Indonesia itself has set ambitious targets for the remainder of this decade: the government’s medium-term development plan (RPJM) outlines its health sector goals as being: (i) the increase in life expectancy from 66.2 years to 70.6 years; (ii) the reduction in infant mortality rate from 35 to 26 per 1,000 live births; (iii) the reduction in maternal mortality rate from 307 to 226 per 100,000 births; and (iv) the reduction in the prevalence of infant nutritional deficiency from 25.8 percent to 20 percent (see Table 5.1 MDGs and national medium-term development targets (RPJMs) for Indonesia).
Indonesia has made significant efforts in recent decades to expand basic healthcare on an equitable basis. The 1970s and 1980s witnessed a significant expansion of public facilities, including hospitals, community health centers (Puske~mas),~03 supporting health posts (Puskesmas Pembantu, known as Pustu) and regional pharmaceutical depots. The focus on expanding healthcare facilities has helped to improve access to healthcare even in remote areas (Knowles and Marzolf, 2003). In parallel with this expansion, partially subsidized health services were provided by public health facilities with the aim of increasing the affordability of healthcare, especially for the poor. Modern public health services have since become more accessible to most of the population, with health outcomes showing marked improvement during the 1980s and 199Os, until 1997 when the economic crisis first began (Lieberman and Marzoeki, 2000). The infant mortality rate (IMR) fell from over 80 deaths per 1,000 births in the late 1970s to under 50 in the mid-1990s. Usage of contraception in this period rose by over 60 percent, while the total fertility rate fell from 4.7 births to 2.8 (Lieberman and Marzoeki, 2000). Interventions through family planning and fertility reduction programs have reduced the risk of maternal death over a lifetime, but the risk of death facing a pregnant woman remains high (Knowles and Marzolf, 2003).
Notwithstanding the progress made in expanding the public healthcare system, access and quality of healthcare remain low and Indoneslans, including the poor, rely heavlly on private sector provision. Despite the expansion of healthcare facilities in Indonesia, the utilization of public health facilities has remained low. In the 1970s and early 1980s, although the community health situation improved slightly and the number of health centers rose dramatically, increasing the percentage of Indonesians receiving medical help from trained staff, the reliance on public provision of community services remained low. One reason for this was the persistently low government spending on healthcare (Knowles and Marzolf, 2003). Although public services were widely available, even among the poor, these highly subsidized public health centers were the providers of choice only half the time, especially in the 1990s when a separate private health sector first started to emerge in Indonesia. For instance, the poor still rely heavily on the services of traditional midwives (dukun) for child deliveries: more than half of all children born to the poorest quintile in Indonesia are delivered by traditional midwives. With no formal training, traditional midwives are unable to foresee possible complications that may arise during childbirth (see Focus on Maternal Mortality at the end of this section). The utilization of the traditional midwives with no formal training, as well as lack of access to 24-hour obstetric care (even in situations when there is a skilled birth attendant), contributes to Indonesia’s high maternal mortality rates.
126

Chapter 5 Making Public Spending Work for the Poor
Indonesia l a p behind In several other health outcomes, partlcularly In Infant mortality and malnutrition. Trends towards improving health outcomes in these areas are only moderate. The current Indonesian infant mortality rate (IMR) of roughly 30 infant deaths per 1,000 births is down from the 70 infant deaths level in 1985, but remains well above rates in other East Asian countries (World Development Indicators, or WDI). Over the same period, several other low-income countries achieved faster IMR reductions. Moreover, trends in malnutrition in Indonesia have shown only moderate improvement despite systematic primary care interventions. In the coming years, effective policies and programs will need to be put in place if Indonesia is to meet the MDGs on reducing infant mortality (see Focus on Child Malnutrition for recommendations on possible vertical interventions).
Table 5.2 Comparison of health Indicators across countries
Births attended by Improved water source Infant mortality rate Maternal mortality rate skilled health staff (%of population with (per 1,000 live births) (per 100,000 births)
(%of total) access) 2004 Thailand 99 85 18 36 Malaysia 97 95 10 50 China 97 77 26 50 Vietnam 90 73 17 95 indonesia 72 77 30 307
Source: World Development Indicators, MMR and IMR: Unicef, 2004. Births attended by skilled health staff, World Development Indicators (200046).
Education sector
Levels of spending on education
Education expenditure has been Increasing. In recent years real per capita spending on education in Indonesia increased by 49 percent between 2000 and 2003, reaching Rp 63.6 trillion in 2003. In 2004, there was a slight decline in real spending levels compared with the previous year, but spending was Rp 62.6 trillion in 2004-still higher than pre-crisis levels in real terms104 (see Figure 5.4a). In 2004, education expenditure constituted 2.8 percent of GDP (up from 2.5 percent of GDP in pre-crisis year of 1996-97). As a share of total budget, in 2004 the education sector took up 14.0 percent of total government expenditure at central, province and district levels (PER, World Bank forthcoming). With its 2004 level of spending, Indonesia ranks slightly below average compared with countries in the region (see Figure 5.4b). Both the Constitution and the Law on National Education System stipulate that a minimum of 20 percent of the central budget (APBN) exclusive of salary costs, and 20 percent of the districts’ budgets (APBD), also exclusive of salaries, must be allocated to educati0n.10~ In 2003, it is estimated that about 57 percent of education spending went towards financing salaries. This means that in order to attain the 20 percent quota set by the Constitution (exclusive of salaries), an additional 14 percent of government spending would have to be switched from other sectors into the education sector.106 However, rather than dramatically increasing resources to the sector in terms of salary spending, the solution to many of the sector’s problems is a more effective use of resources. (For more analysis refer to Education PER, World Bank, forthcoming.)
127
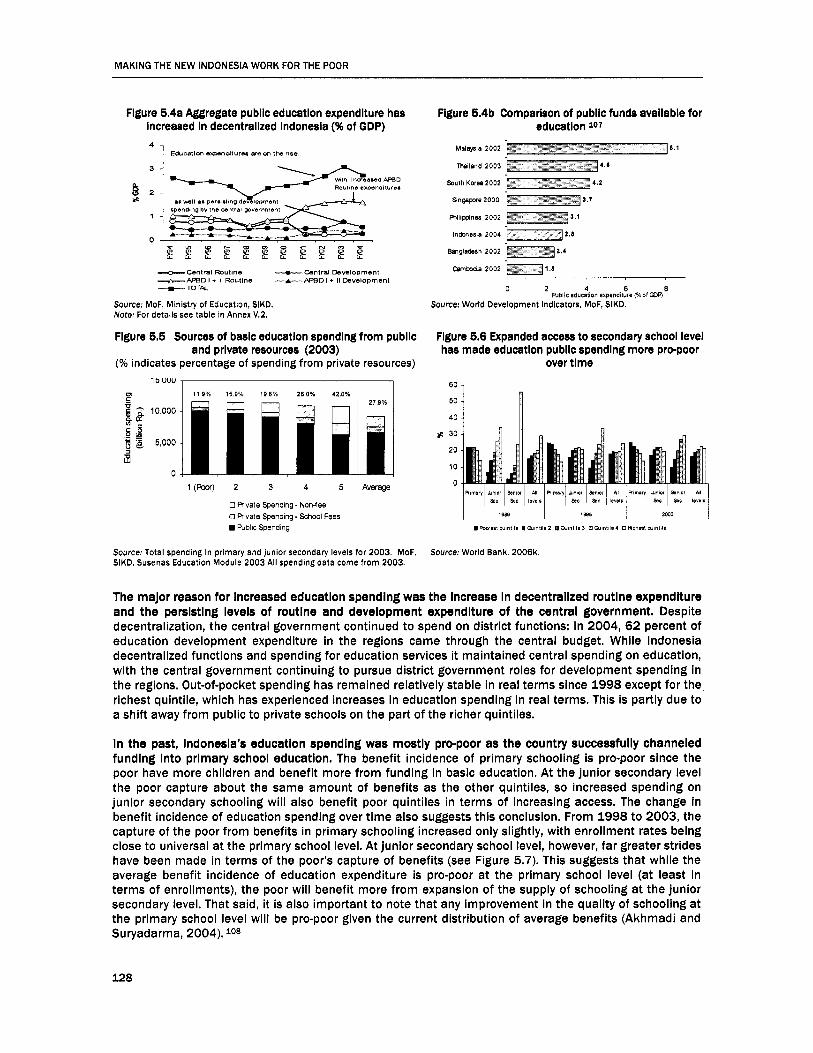
MAKING THE NEW INDONESIA WORK FOR THE POOR
Figure 5.4a Aggregate public education expenditure has Increased In decentralized Indonesia (% of GDP)
-Centra1 Routme -Central Eeveloprnent --PPBDI+ IIRoutlne --IL----PPBDI+ IICeveloprnent -TOTAL
Source: MoF, Ministry of Education, SIKD. Note: For details see table in Annex V.2.
Figure 5.5 Sources of basic educatlon spending from public and private resources (2003)
(% indicates percentage of spending from private resources) 1 s,uuu
m .-
.- 3 k 5,000
i 0
Figure 5.4b Comparison of public funds available for education 107
Malayola 2002
m i l a n d 2003
South Korea 2002
Slngapwe2000
millpplnes 2002
lndcnesia 2004
Eangledash 2002
Camboda 2002
6 8 Rlbllc educa4bon expenditure (%of ow)
0
Source: World Development Indicators, MoF, SIKD.
Flgure 5.6 Expanded access to secondary school level has made education public spendlng more pro-poor
over time 60
50
40
z 30
20
10
0 1 ( b ) 2 3 4 5 Average
0 Rivate Spending - Non-fee 0 Rivate Spending. school Fees
Riblic Spending I P o c ( a s t q ~ n l 1 e I O I i n l i l 8 2 mOIi lnl i le3 Ohlin111e4 OR~heel innt i lc
Source: Total spending in primary and junior secondary levels for 2003. MoF, SIKD, Susenas Education Module 2003 All spending data come from 2003.
Source: World Bank, 2006k.
The major reason for Increased education spending was the Increase in decentralized routine expenditure and the persisting levels of routine and development expenditure of the central government. Despite decentralization, the central government continued to spend on district functions: in 2004, 62 percent of education development expenditure in the regions came through the central budget. While Indonesia decentralized functions and spending for education services it maintained central spending on education, with the central government continuing to pursue district government roles for development spending in the regions. Out-of-pocket spending has remained relatively stable in real terms since 1998 except for the, richest quintile, which has experienced increases in education spending in real terms. This is partly due to a shift away from public to private schools on the part of the richer quintiles.
in the past, Indonesia's education spending was mostly prckpoor as the country successfully channeled funding into primary school education. The benefit incidence of primary schooling is pro-poor since the poor have more children and benefit more from funding in basic education. At the junior secondary level the poor capture about the same amount of benefits as the other quintiles, so increased spending on junior secondary schooling will also benefit poor quintiles in terms of increasing access. The change in benefit incidence of education spending over time also suggests this conclusion. From 1998 to 2003, the capture of the poor from benefits in primary schooling increased only slightly, with enrollment rates being close to universal at the primary school level. At junior secondary school level, however, far greater strides have been made in terms of the poor's capture of benefits (see Figure 5.7). This suggests that while the average benefit incidence of education expenditure is pro-poor at the primary school level (at least in terms of enrollments), the poor will benefit more from expansion of the supply of schooling at the junior secondary level. That said, it is also important to note that any improvement in the quality of schooling at the primary school level will be pro-poor given the current distribution of average benefits (Akhmadi and Suryadarma, 2004). I O 8
128

Chapter 5 Making Public Spending Work for the Poor
Priority issues for poverty reduction in education
The poor are adversely affected by three main issues in the education sector: (i) overall quality, (ii) affordability, and (iii) supply-side constraints in terms of schools and teachers in remote areas.
Quallty improvlng learning quality remains a challenge for Indonesia's education system. Given the already high average enrollment rates, improving quality, especially in primary school education, could have a significantly beneficial impact on the poor. Standardized test scores are an objective indicator of performance in the education sector. Internationally comparable test scores reveal that the standard of education among 15year-olds in Indonesia is slightly lower than some comparable countries. Indonesia participated in the Program for International Student Assessment (PISA) study109 over two consecutive rounds, in 2000 and 2003. The fact that the Indonesian government participated in this study provides a useful opportunity to compare student performance in Indonesia over time, as well as compare levels of learning with other countries. The study defined three areas of literacy in reading, science and mathematics, and was given to young adults aged 15 who are approaching the end of nine years of basic education. While Indonesian students improved their performance in reading and math skills over this period, they remained behind other comparable countries in the sample (see Figure 5.7). Low quality of schooling raises questions concerning the adequacy of the school system in delivering returns and improving employability and income prospects. This is especially an issue for poor rural migrants to urban areas, for whom unemployment is a more serious risk factor. While there is a balance to be struck between the allocation of resources towards improving enrollments and the raising of quality levels in education, investments in teaching quality are necessary in tandem with funding for raising enrollment rates if the return to education for the poor is to be increased.
Figure 5.7 Learning levels among Indonesian Syearolds are low, even among the relatively better off
Distribution of PlSA 2003 test scores in Indonesia and comparison countries
Distribution of PlSA 2003 test scores by economic status quintiles in Indonesia
Teacher quality is one determinant of school effectiveness. Indonesia has one of the lowest pupil-to- teacher ratios in the world at the primary school level at just under 20 pupils per teacher.Iio However, this can hardly be seen as a quality indicator in Indonesia: despite the abundant supply of teachers, the average class size in Indonesia is not so small. For instance, at the junior secondary level the pupil-to- teacher ratio is on average 14 to 1, although the class size is 37 students on average. This is due to the fact that Indonesia has an oversupply of teachers along with low salary levels and short working hours per week.111 In fact, Indonesia's low pupil-to-teacher ratio signals inefficiencies in personnel management in basic education. A ministerial decree (World Bank, 2005d) allocating a minimum of nine teachers to each school is poorly adapted to the needs of schools. Sixty-five percent of schools in Indonesia are over- staffed, while at the same time there is an inequitable allocation of teacher entitlements, which works to
129
MAKING THE NEW INDONESIA WORK FOR THE POOR
the strong disadvantage of schools in remote rural areas. School staffing levels would be far better addressed by a teacher quota per school determined according to the number of pupils.
Teacher salaries are a large line item In educational flnance in Indonesia, although teachers’ monthly salaries are low. Indonesia’s education spending on salaries is estimated to be about 60 percent of total education spending. Although the total spending on salaries is high, teachers are paid 21 percent less than other workers with equivalent qualifications (Education PER, World Bank, forthcoming). This is not the case, however, when hourly wages are compared: hourly earnings shows that teachers earn more per hour relative to other workers since they work less hours. In order to improve teaching quality and spending effectiveness, the government could consider reducing the number of teachers while increasing the salaries of those teachers retained, such that the overall impact on the teacher salary bill is not too burdensome, but so that quality gains are made in the process.
In order to encourage teachers to take up postings In remote areas, the government Is currently Impiementlng a teacher deployment and incentives package. The incentives package will double (or in some places even quadruple) teacher salaries depending on the remoteness of the teaching post and the qualifications of the teacher. As it is not clear that doubling teacher salaries will necessarily improve the quality of teaching or reduce absenteeism, so it is important that this initiative is coupled with further mechanisms that improve the accountability of teachers to provide better quality outcomes. In order to improve teacher quality, Indonesia should invest more resources in teacher networks for career development. Along these lines, more resources could be put into arranging meetings for teachers working in similar fields to enable them to share their experience and lesson plans, while also providing them with new teaching materials.
Investing in textbooks and inciass teaching materials may be a cost-effective way of Improving quailty in Indonesia, Making textbooks freely available produces one of the highest learning returns to investment (McMahon, 2001), since even in the absence of teachers students can continue to learn if they have access to quality textbooks. Unfortunately, about 40 percent of students in grades 1 to 6 in Indonesia report having no access to textbooks,llZ while more than 50 percent of children at the primary school level in the lowest quintile report difficulties in financing books and school equipment (Susenas, 2003). In Indonesia, the resources devoted to covering salaries may be crowding out investments in teaching materials and textbooks. As an alternative, the governments of both South Korea and Singapore try to maintain an average class size of more than 40 in basic education, enabling resources to be assigned to other inputs such as books, teaching materials and computers. Educational research across a wide range of countries supports the view of South Korea and Singapore that this trade-off is cost-effective (World Bank, 2002c)
A fforda bllity The poor and near-poor are not benefiting suff icientiy from secondary education, undermining their chances of obtaining higher paying Jobs In urban areas. The private share of expenditure is small for primary schooling, but much higher for junior secondary schools, indicating the need to further subsidize the junior secondary level of schooling for the poor. While most of the resources in the education sector are allocated to primary schools, the binding constraints for increasing enrollments for nine years of free basic education are mostly on the supply side for junior secondary schooling, especially in rural areas.
in Indonesia, school fees create barriers to the poor’s access to education, particularly at the junior secondary school level. According to Susenas data, 34 percent of households in the poorest quintile with children enrolled in school reported difficulties in financing school fees at primary school level and 44 percent reported difficulties at the junior secondary school level (Susenas Education Module, 2O03).ll3 While education expenditure at the primary school level is better subsidized for the poor (constituting only 2.8 percent of per capita expenditure for the poorest quintile compared with 3.3 percent for the richest quintile), at the junior secondary level education expenditure becomes far more difficult for the poor to finance. Reflecting this financial strain, the poor pay a larger proportion of their expenditure per capita on education than the richest quintile (7.2 percent vs. 6.1 percent) at junior secondary school level.
General discussion of school fees focuses speciflcaliy on tuition fees. In reality, there are numerous other expenses that are onerous for the poor. Education demand estimates reveal that the indirect costs of
130

Chapter 5: Making Public Spendlng Work for the Poor
education also play an important role in enrollment decisions (Paqueo and Sparrow, 2005). Where possible, it is important for the government to implement programs that reduce such costs in order to improve access to schooling for poverty alleviation purposes. The extra costs of schooling, such as textbooks, uniforms and transportation, make up a larger share of costs for the poor than school fees at all levels of schooling. For instance, for the poorest two quintiles, 55 percent of education spending at the primary school level goes towards textbooks, stationary, uniforms etc. while only about 18 percent of education spending goes towards tuition fees at this level of schooling (Susenas Education Module, 2003). Uniform costs are strikingly high in Indonesia with multiple school uniforms being required by schools even at the primary school level: for the poorest two quintiles in Indonesia the spending on uniforms is more than double the amount spent on school books at the primary school level (see Figure 5.8).
Another barrier to educatlon Is the opportunity cost of schooling. Instead of attending school, children can choose to work, either for a wage or in the household. Higher local labor wages have the effect of reducing demand for schooling by raising the opportunity cost of attending school. Controlling for regional and household characteristics, every Rp 1,000 increase in the local child-wage rate reduces demand for education at the junior secondary school level by 0.4 percent (Paqueo and Sparrow, 2005). A regional analysis of the average-odds ratiol14 reveals that the poor in Java/Bali are less likely to continue on to junior and senior secondary school compared with the national average for the same income groups. The determinant of dropping out in this region could be the opportunity cost of schooling, with more job options available to primary school graduates. In this case, spending on junior secondary schools needs to be better targeted towards the poor and needs to cover not only the extra costs associated with schooling but also the opportunity cost.
The Operational Aid to Schools (BOS) program Is a valuable attempt to Improve affordability of educatlon (see Box 5.1 on the BOS program in this chapter). However, while the BOS program offers value in terms of improving quality of schooling, it may not be as effective as a demand-side transfer in improving school affordability and raising enrollment rates. As such, additional block funding to primary schools may not be the most effective way of using precious resources to increase affordability for poor students or improve teaching quality. The need for increased funding for front-line providers could be addressed by better allocation of resources within the sector. International experience indicates that if additional funds are allocated to address the issues of quality and affordability of education for the poor, additional targeted subsidies for the poor and/or conditional cash transfers (CCTs) are both possible options.
Targeted CCT or scholarshlp programs could have a greater Impact on school enrollments. Developing a targeted program, possibly a conditional cash transfer (CCT) program, may be key in addressing this issue from the demand side. There is also a clear need for a program to address a supply-side shortage of secondary schools. Here too the issue of teacher management and training is crucial, as it will be necessary to ensure that adequately qualified teachers are available to staff new schools and classes. The return to secondary school education also needs to be improved if there is to be demand. From the education sector perspective, this also entails a careful examination of the secondary school curriculum to establish whether it adequately prepares young Indonesians for the demands of the job market.
131
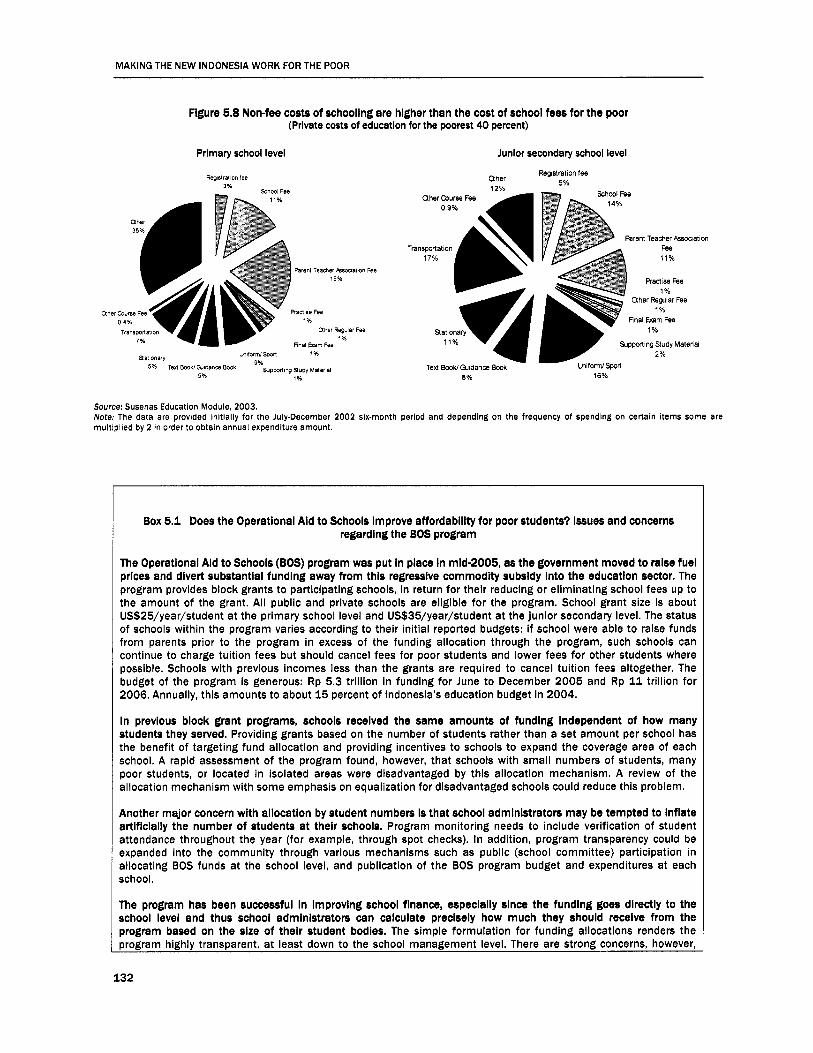
MAKING THE NEW INDONESIA WORK FOR THE POOR
Figure 5.8 Non-fee costs of schoollng are higher than the cost of school fees for the poor (Private costs of education for the poorest 40 percent)
Prlrnary school level
Registration fee
Junior secondary school level aher Regstration fee
5% 3%
Uher Course Fee
Parent Teacher Assoaation
1 1 % Transportation Fee
Ractisa Fee 1 %
Uher Regular Fee 1 %
Final Exam Fee 1 %
11% Suppoiting Study Matenai 2%
Paren1 Teamer 15% Asomlion Fee 17% 09d
h a 1 Barn aher Fee Regular 1% Fee
5% Texi BOoklCi8danCe Book gOhSuppon,ng study Ted BooWCuidance Book
StationafA
UniforrnlSpolt 1% Satlonary
5 % 1% a 16%
Source: Susenas Education Module, 2003. Note: The data are provided initially for the July-December 2002 six-month period and depending on the frequency of spending on certain items some are multiplied by 2 in order to obtain annual expenditure amount.
Box 5.1 Does the Operational Aid to Schools Improve affordablllty for poor students? Issues and concerns regarding the BOS program
The Operational Aid to Schools (BOS) program was put In place In mld-2005, as the government moved to raise fuel prlces and divert substantial funding away from this regressive commodity subsidy into the educatlon sector. The program provides block grants to participating schools, in return for their reducing or eliminating school fees up to the amount of the grant. Ail public and private schools are eligible for the program. School grant size is about US$25/year/student at the primary school level and US$35/year/student at the junior secondary level. The status of schools within the program varies according to their initial reported budgets: if school were able to raise funds from parents prior to the program in excess of the funding allocation through the program, such schools can continue to charge tuition fees but should cancel fees for poor students and lower fees for other students where possible. Schools with previous incomes less than the grants are required to cancel tuition fees altogether. The budget of the program is generous: Rp 5.3 trillion in funding for June to December 2005 and Rp 11 trillion for 2006. Annually, this amounts to about 15 percent of Indonesia’s education budget in 2004.
In previous block grant programs, schools received the same amounts of funding Independent of how many students they served. Providing grants based on the number of students rather than a set amount per school has the benefit of targeting fund allocation and providing incentives to schools to expand the coverage area of each school. A rapid assessment of the program found, however, that schools with smaii numbers of students, many poor students, or located in isolated areas were disadvantaged by this allocation mechanism. A review of the allocation mechanism with some emphasis on equalization for disadvantaged schools could reduce this problem.
Another major concern with allocation by student numbers Is that school admlnlstrators may be tempted to Inflate artlflclally the number of students at their schools. Program monitoring needs to include verification of student attendance throughout the year (for example, through spot checks). In addition, program transparency could be expanded into the community through various mechanisms such as public (school committee) participation in allocating BOS funds at the school level, and publication of the BOS program budget and expenditures at each school.
The program has been successful in lmprovlng school finance, especially since the funding goes directly to the school level and thus school administrators can calculate precisely how much they should receive from the program based on the size of their student bodies. The simple formulation for funding allocations renders the program highly transparent, at least down to the school management level. There are strong concerns, however,
132

Chapter 5 Making Public Spending Work for the Poor
regarding the targeting of poor students, which is not being expressly carried out in most schools according to a recent assessment of the program. This is occurring for several reasons. The objective of providing free tuition for poor students, and other forms of support such as subsidized textbooks, uniforms and transport, has not been communicated well at the local level. In addition, school administrators are under pressure to reduce or eliminate fees for all students, regardless of their economic status, due to misconceptions that the program is intended to provide free education for all. The current design contains no accountability or feedback mechanism to ensure that tuition fees are lowered or eliminated for poor students. Given its supply-driven design, targeting the poor at the school level is crucial for achieving the program’s poverty alleviation outcomes.
The program should be complemented wlth a targeted scholarshlp component, and clarlflcatlon and enforcement of the rules for targeting poor students. Currently, there are clauses in the program design that enable school administrators to provide stipends to poor students to cover transportation and extra school costs over and above tuition fees. However, the definition of these transfers is very weak and no quota exists for targeting poor students. In further revisions of the program, the definitions of such transfers to poor students need to be clarified and their implementation monitored in a more rigorous fashion.
Finally, whlle recentrallzlng school finance Is, on one level, an advantage of the program, as It makes the flow of funding more predictable down to the school level, It Is also a disadvantage In that dlstrlct governments may see this large highly visible program as an opportunlty to reduce thelr own operatlonal spendlng on schools. In the end, this could result in the crowding out of local government spending, impairing coordination in school financing across levels of government. The Department of National Education stated recently that it plans to create a mechanism for local governments to provide matching funds for the program from 2007. It is hoped that this will overcome some of these issues
Supply-side constralnts There is a general lack of access to secondary schooling due to inadequate supply. This creates a bottle- neck for school progression in general, but one that particularly hinders the educational attainment of the poor. The availability of schools at the junior secondary level is much lower than for primary schools with a 7 to 1 ratio, making it more difficult to access basic education for all children aged 12 to 15.1i5 Given that the government’s goal is to bring about universal access to nine years of basic education, there is a need to expand resources for the junior secondary level, since this is the level at which the access of the poor breaks down.
Junior secondary school capacity in Indonesia provides learning opportunities on average to only 84 percent of potential students in the 13 to 15 age group (Hartono, 2O05).ll6 In Central Java and Yogyakarta provinces, the average school capacity exceeds 100 percent. This means that the available classrooms are under-utilized. Conversely, in East Nusa Tenggara and South Sumatra provinces, the average coverage of school capacity is below 60 percent of potential students, indicating a lower degree of access. In terms of the condition of classrooms, a ministry survey conducted in 2004 revealed that 57.2 percent of primary school and 27.3 percent of junior secondary school (general and madrasah) classrooms are damaged in some way (Ministry of National Education, 2004). Renovation of classrooms and the conversion of some primary schools (of which there is an over-abundance in most provinces) into junior secondary schools should be prioritized to reduce constraints on the supply of classrooms.
Some gains can stili be made in primary school access in remote regions. By looking at potential enrollment rates of the poor in a region (the number of children in appropriate age groups) and comparing these to the existing distribution of benefits across quintiles, one finds that there are still potential gains to be made by expanding primary schooling in the two regions of Nusa Tenggara/Maluku and in Papua. For the other regions, the benefits to the poorest quintile for primary schooling appear to be saturated (the benefits accruing to the poor are at least proportional to the population of children) in terms of enrollment rates, although quality gains can probably still be made in schools attended by predominantly poor children.
The low quality and absenteelsm of teachers in remote and rural areas also disproportionately impact the poor. In Indonesia, remote schools have higher student-teacher ratios (25:l for remote schools vs. 20: l average). According to the Teacher Employment and Deployment Study, despite general teacher
133

MAKING THE NEW INDONESIA WORK FOR THE POOR
oversupply in Indonesia, 74 percent of remote schools are below entitlement (World Bank, 2005d). There is also an unequal distribution of honorary teachers with predominance in remote schools (78 percent have honorary teachers), thus reducing the quality of teaching in remote areas. A wide range of incentives for teachers exists, coming both from local governments and the schools themselves, which creates a high incentive differential between teaching in urban Jakarta compared with in remote rural areas. Salaries often depend upon a district’s or a school’s capacity to pay. Thirty-six percent of teachers receive local government incentives, while 14 percent receive school incentives.
leacher incentives and management are issues that require urgent attentlon, especially given that such a high propottion of education sector resources go towards teacher salaries. With the passage of the Law on Teachers and Lecturers in December 2005, the government is trying to couple a teacher certification and quality enhancement scheme with improved teacher incentives. The law stipulates that all teachers must be certified within 10 years and that, upon certification, they will receive a professional allowance equivalent to their base salary. A special area allowance is specified in this law, which will be given to teachers in conflict, natural disaster, remote, and other hardship areas. This is expected to increase the number of teachers available for teaching in remote areas-but the impact of this expensive reform on absenteeism and quality of teaching depends on the implementation of reform.
Recommendations for pro-poor spending on education
This analysis points to some key priorities and strategic directions for improving spending in education to make it more pro-poor and help address Indonesia’s key poverty-related development goals.
Ensure affordablllty, continued high enrollment and improved quality of education for prlmary schools. Primary school enrollment outcomes are high and an appropriately high level of funds is allocated to this sector. The benefits of these funds can be improved further for the poor with particular emphasis on maintaining affordability. The BOS program is aworthy attempt to address this issue. However, it is questionable whether additional block funding to schools is the most effective way to increase affordability to poor students and improve teaching quality. The need for increased funding for front-line providers could be addressed by better allocation of resources within the sector. International experience indicates that if additional funds are allocated so as to address the issues of affordability and quality of education for the poor, the government should consider either further targeted scholarships for the poor and/or conditional cash transfers (CCTs). Reducing the number of uniforms demanded by schools will be also be a pro-poor reform since the poor spend twice as much money purchasing various uniforms as they spend on textbooks.
Balance class slzes in primary schools to improve quality of education. There is an oversupply of primary school teachers, coupled with inefficient and inequitable allocation of teacher entitlements to schools. Given that 65 percent of schools in Indonesia are over-staffed based on the current policy (World Bank, 2005d); the government should change the law requiring a minimum allocation of nine teachers to each school. This could involve a system whereby school staffing levels are calculated on a teacher-quota-per-school basis, determined according to the number of pupils. The government should also encourage teachers to take further training and certification to move to junior secondary teaching and its higher levels of compensation.
Improve Incentives to front-llne providers and teachers, lncludlng through better teacher management. Improving incentives is key to improving the quality of educational outcomes, including the quality of education itself. The government should enhance incentives both to local governments and schools in order to enhance education capacities. It should consider the use of conditional grants contingent on improved educational outcomes to enhance desired outcomes, such as improved enrollment rates for the poor. Given the large proportion of education sector resources that go towards teacher salaries, there is also a clear need for the government to address weaknesses in teacher management. It is important for the government to introduce incentives to attract teachers to remote schools and to devise a simplified remuneration structure that is more equitable and includes national incentives for teaching in remote schools.
134
Chapter 5 Making Public Spending Work for the Poor
4. Redouble efforts on primary to junior secondary school transition. The primary challenge to meeting Indonesia’s education targets is to reduce the dropout rate in the transition to secondary school-a problem that applies particularly to the poor. The government should consider developing a targeted program, possibly a conditional cash transfer (CCT) program, to address this issue from the demand side. On the supply side, the government could consider addressing the shortage of secondary schools through the conversion of some primary schools to secondary schools, the construction of new schools, or both. In the construction of new junior secondary schools there are opportunities to mobilize community labor, thereby reducing construction costs. Opportunities also exist to convert primary school buildings in some areas into junior secondary schools by considering demographic changes and the distribution of primary and junior secondary school aged children, forecasting declining future demand for primary schools by district and mapping this with existing school data. In densely populated areas more schools can be turned into double-shift schools at the primary school level, freeing up additional school facilities for use by the junior secondary school level. A t the same time, the government will need to ensure that adequately qualified teachers are available to staff these new schools and classes.
5. Focus on Improving learning quality. Research indicates that investing in in-class teaching materials is one of the most cost-effective ways of improving learning quality. Making textbooks freely available also produces one of the highest returns to investment (McMahon, 2001). Very high numbers of students in Indonesia report having no access to basic textbooks. The largest resource component covers salaries at the school level leaving only limited resources for learning materials. In terms of improving teacher quality, the government should also invest more resources in teacher networks for career development. Along these lines, more resources can be put Into arranging meetings for same- field teachers in order to share experience and lesson plans, while also providing them with new learning materials.
Health sector
Levels of spending on health
Public health expenditure In Indonesia has been lncreaslng but Is still well below International allocations, even among comparable countries In the region. Indonesia has seen some increases in aggregate public health spending from 2000-03 and a slight decline in 2004 (see Figure 5.9). Despite this, real per capita public health spending in 2004 was 47.8 percent higher than in 2000. In 2004, public health spending was Rp 16.7 trillion, with 50 percent of development spending coming from the central government. The level of public health spending still remains low by international standards. In 2004, as a share of total budget the health sector constituted only about 3.8 percent of total government expenditure. Despite the recent increase in healthcare spending, Indonesia still spends less on health as a percentage of GDP than comparable countries in the region (see Figure 5.10).
The determinants for this Increase In public spending are higher decentralized spending by district governments and continuing deconcentrated development spending from the center being spent In the regions. It is still too early in the stages of decentralization to say whether the trend of increasing health expenditure will continue. Currently, it seems that the increase in spending on health is a consequence of the central government holding onto health spending while local governments also increase their own health spending (in addition to the other sectors that now fall under their responsibility). In the future, public health spending needs to be better coordinated across levels of government, as well as increased. It also needs to be channeled more carefully towards the areas of greatest need.
Currently, public health spending generally benefits the rlcher qulntlles more than the poor through regressive subsidies for secondary care, as well as spending being mainly channeled to rlcher districts. As a consequence, there is a need to better target health spending, not only towards the type of facilities and programs that are funded, but also in the geographical distribution of the spending, in order to better reach the poor. Currently, the benefit incidence of public spending on primary healthcare is not pro-poor but neutrally distributed among quintiles, while spending on secondary healthcare is certainly not pro-
135

MAKING THE NEW INDONESIA WORK FOR THE POOR
poor, with most of the benefits accruing to the richer quintiles. While the public health services most utilized by the poor in Indonesia are basic healthcare facilities, Indonesia spends about 40 percent of public healthcare resources on regressively targeted subsidies to public hospitals (see Figure 5.11). The poor have very little access to public hospitals and, hence, do not make use of the vast majority of the spending that goes into secondary healthcare. Of the funding that goes into hospital care, the benefits that accrue to the poorest quintile of the population are about 9.5 percent, while those that accrue to the richest quintile are about 40 percent. Spending on secondary healthcare is a highly regressive way of allocating limited resources at a time when Indonesia is struggling to meet its medium-term development targets in health.
While increasing marginally in the period since the crisis, the increase in public health expenditure has not been pro-poor. Most of the increase went into secondary healthcare, despite the regressive nature of supply-side secondary care subsidies: whereas in 1995.96 the proportion of health expenditure going into secondary care was about 25 percent, this ratio increased to 40 percent of health spending in 2003. Overall, the poor's utilization of health services and their capture of health spending have not increased significantly since 1998 (Figure 5.12). The PKPSBBM healthcare program is aimed at both increasing access to basic and secondary healthcare for the poor in a targeted way. This program, if effectively targeted and implemented, could be key in expanding health services for the poor (see Box 6.7 in Chapter 6).
Figure 5.9 Aggregate public health expenditure has Increased In decentralized Indonesia (% of GDP)
Figure 5.10 Indonesia's total health spending (from public and private sources still remains low
math expenditures are also on the rise as %W Total Health Spendingasohof GDp(2002-2003) butstill reman belw 1 X c i Q F l n 2004
1 0
India
Viet Nam
0 6 Singapore
M a lap ia 0 4
Sn Lanka
0 8
c1 ae
Thailand 0 2
indOnesia 0 0
Philippines
0 1 2 3 4 5 6 7
%Gcp
Note: See Annex '4.3 Health Spending in Indonesia 1994-1004 for details. Source: World Development Indicators.
Figure 5.11 Sources of healthcare spending in Indonesia
(% indicates percentage of spending from private resources)
Figure 5.12 Over time benefit Incidence of public (2003) health spending
400.000 ,
1 (Poor) 2 3 4 5
Source: Susenas 2003, MoF, SIKD.
30 s
55 5% 20
10
0
I m e * 1 Q4"lIle I Culnllie 2 11 (Xlinllie 3 0 Qdlntlie 4 0 RChll qulnllle
Source: World Bank, 2006k.
136

Chapter 5: Making Public Spending Work for the Poor
Priority issues for poverty reduction in health
The poor have a high vulnerablllty to health shocks that have a negative Impact on family welfare. For instance, across all groups loss of income from health factors is more frequently reported than loss of income from unemployment (see risk and vulnerability analysis in Chapter 6 on Social Protection). The urban poor male-headed households and rural poor (and non-poor) female-headed households have a particularly high vulnerability to health shocks. Also, among urban households headed by women, loss of income due to health factors is the second most commonly reported shock across all income groups, whereas for other groups loss of income from health factors is more likely to be the third most frequently reported shock. Although increasing spending in healthcare alone is insufficient for achieving health sector goals in itself (without the correct institutional set-up and accountability mechanisms), the right level and mix of pro-poor spending in the sector, as well as improving the efficiency of that spending, matter tremendously for reaching health and poverty reduction goals in the medium term.
Among the priority tasks In healthcare are: (i) improving quality of healthcare provided in basic community healthcare clinics (Puskesmas); (ii) investing in the training of private (and public) paramedics to benefit the poor, especially in rural areas where the poor have little access to other services; and (iii) investing in demand-side activities that increase the access of the poor to in-patient care. Beyond these priorities, many of the Indonesian health sector’s problems are related to systemic problems and institutional constraints in service delivery. In addition to providing increased health financing through supply and demand-side schemes, in the medium term there are systemic problems within the sector that need to be addressed, including management of the health sector workforce and determining the function of provincial governments. These issues are discussed further in Chapter 7 on Government in which the institutional problems of the sector are explored.
Quality of baslc healthcare In order to allgn publlc expenditure on health with the needs of the poor, a hlgher proportion of subsidies for baslc healthcare services through public or prlvate provlslon Is required. While less cost-effective services in secondary in-patient healthcare should continue, these should be less dependent on public subsidies as they benefit mainly the wealthy. Instead, Indonesia needs to redirect current public spending for health, as well as any increases in expenditure, in order to better meet the needs for public healthcare with the aim of providing a minimum package of essential clinical services that are accessible to the poor.
Contrlbutlons from patlents, with a rate determlned at around US$0.25/vlslt, make up only about 2 percent of Puskesmas revenues In lndonesia.117 Having low levels of user fees at the Puskesmas is not necessarily pro-poor. User fees may in fact improve the welfare of the poor. If fees are used to improve quality and if, as a result of the quality improvement, demand for basic healthcare by the poor increases, then the welfare of the poor will also increases (Bitran and Giedion, 2003). The Puskesmas need to be able to charge higher fees from those who can afford to pay for services. In the current set-up, the richer quintiles benefit from subsidies to the Puskesmas just as much as the poor and they utilize these services almost as frequently. Finding the optimal level of user fees for the richer quintiles and being able to better target the poor, who will be exempt from these fees, are both key to increasing the resources available at the Puskesmas and for improving quality of services. In Tanah Datar and Purbalingga districts, where the Puskesmas were allowed to charge higher user fees for services, there has been an increase in the utilization of health services by the poor due to better perceived quality of services.il*
Absenteeism of health personnel Is a major problem In ensuring quallty of healthcare In publlc health clinics. Arecent study involved making surprise visits on more than 100 primary schools and health centers in Indonesia (Chaudhury et al, 2006). The study found absentee rates of 19 percent among teachers and 40 percent among health workers. Indonesia had the highest health-worker absentee rate of all the countries included in this global study, worse than Peru, at 25 percent, Bangladesh at 35 percent, and Uganda at 37 percent. Not only does high absenteeism reduce quality, but it also reduces the demand for public health services, since people are reluctant to travel long distances when there is a significant chance that health personnel might be absent. High absentee rates may be a consequence of many Puskesmas doctors running their own private practices: the GDS1+ data collected from over 120
137

MAKING THE NEW INDONESIA WORK FOR THE POOR
Puskesmas showed that three-fourths of Puskesmas heads also had private practices of their own, which has implications on the time they are able to allocate to public health centers.
investing in private provision of healthcare Supportlng private sector provision of healthcare will also be Important for the poor. Since the early 199Os, private healthcare has started to play an increasingly important role in the financing and delivery of services in Indonesia. Indonesia’s approach to private providers expanded the opportunities for private doctors and nurses to practice and added to the availability of health services to both poor and non-poor households. In the 1980s, when the low salaries of government health workers made it difficult for them to keep practicing their profession, the government-rather than restricting levels of employment and raising salaries-allowed its staff to maintain private practices outside of their normal working hours (World Bank, 2003). Today, the majority of healthcare professionals in Indonesia engage in the delivery of both public and private services. While this dual position of public health providers created’ perverse incentives, lowered the quality of services in the public health system (mainly due to the reduced number of hours these doctors put into public practices, as well as the usage of drugs and other public facilities in their private practices), it also allowed the private provision of services to develop and the average number of hours served by trained physicians and paramedics to increase. Arguably, one of the reasons why Indonesia is probably not doing too badly in most health outcomes despite low levels of public spending is that private provision services have filled the service provision gap in areas where public provision has been inadequate in supply or quality. In this situation, private providers are very much part of health service delivery in Indonesia, and training and the contracting and monitoring of services need to be an integral part of government health policy.
Figure 5.13 Health utillratlon of health providers by Income groups (2004)
0 20 - 0 1 8 6 5 0 1 6 + E $ 0 1 4
5 g 0 1 0 Rvate paramedic + 0 0 8 a 3 0 0 6 ’ 3 0 0 4
0 02 0 00
o mvate pdydinic
a mvate hospital
mvate traditional health care - !2 g 0 1 2
I Rvate dodor
0 Public hospital
0 Public Polindes, Posyandu etc.
I Public Puskesmas 1 2 3 4 5 (Poor) Expenditure quintiles
Source: Susenas, 2003.
Of the private providers, the poor make most use of private paramedics and doctors (see Figure 5.13). With increasing income there is a switch away from paramedics towards doctors. The average-odds ratio of participation-the ratio of the quintile-specific average participation rate to the overall average- provides a useful tool for understanding the current utilization of services and highlighting those quintiles the services are likely to benefit most. The average-odds ratio of participation is highest for the poor in public Puskesmas and private paramedics (nurses, midwives etc), which means that investments in these areas, if participation rates remain the same across quintiles, will be more likely to benefit the poor than the richer quintiles. In contrast, investments in private polyclinics, and public and private hospitals are among the most pro-rich investments in Indonesia given the underlying utilization rates for health services.
138

Chapter 5 Making Public Spending Work for the Poor
lnvestlng In demand slde act/vltles that lncrease the access of the poor to ln-patlent care When the blndlng constraints on the poorh access to services are on the demand slde due to reasons that limit their access to these services, It may be more appropriate to stimulate the demand for these services through voucher or cash transfer schemes. A demand-based financing scheme that is pro-poor targeted gives more power to the client to select preferred providers. A well-targeted demand-based program also has the potential to provide incentives for improving the quality of healthcare for the poor. In order for demand-side programs to succeed, two conditions need to be in place: (i) the supply of services should be already available in the area covered by the program. If not, demand-side programs will be ineffective and transfers to households may result in wasting significant resources with little impact on outcomes; (ii) the targeting of the poor, which has been so problematic in Indonesia, needs to be improved so that program benefits reach the poor. Targeting remains a central issue for reaching the poor with demand-side programs. The distribution of voucher benefits is of critical importance in the design and targeting of any demand-side intervention scheme. The objective can be achieved by geographic targeting, which strengthens provision of services through the Puskesmas and other available private providers in the area, especially those in districts and sub-districts with a high proportion of poor families. The targeting function can be contracted out to NGOs that then ensure the distribution, registration and recording of vouchers is pro-poor.
Indonesia has experienced a series of targeted Insurance programs since the mId-l990s, starting with the health card (kartu sehat) program In 1994. In the initial program, poor families were distributed health cards by their village heads, which allowed them to access the nearest Puskesmas and referral care in third-class in-patient wards in district hospitals. Providers were reimbursed on the basis of fixed fees varying for out-patient or in-patient visits. However, healthcare staff were not compensated for the services they provided to card holders and the program was not fully funded. By 1998, the program had become largely inoperative and the social safety net (JPS) program that was designed after the crisis, while based on a similar system, did not continue the transfers to the same beneficiaries (World Bank, 2003; Knowles and Marzolf, 2003).
In 1998, the government developed several targeted programs to protect the poor In the face of the crisis. These programs, collectively referred to as jaringan pengaman sosial (JPS) or social safety net programs, and included workfare, subsidized rice sales, village block grants and targeted scholarships, as well as subsidized health services. The JPS-BK program provided block grants to health providers through district post offices in a way that was proportional to the number of poor families residing in an area. The objectives of the JPS-BK program were to assist poor families to cover the costs of basic health services and referrals, and to provide nutritious supplement foods for children and pregnant mothers of poor families. The targeting of the JPS-BK health cards was done on the basis of the BKKBNll9 Family Welfare (KS) targeting system. The health card entitled the families to free curative and preventive care at public health facilities, and private providers were not included in the scheme. The program also included in- patient care on referral in third-class in-patient wards of public hospitals, as well as contraception and mother-and-child healthcare (MCH) from village midwives. In 2001, the government introduced additional subsidies aimed at healthcare services for the poor through the BBM subsidies program. In 2002, this program was renamed the 'fuel-subsidy compensation program', or PKPS-BBM. However, the nature of the program remained the same (Arifianto, Tan et at, 2005).
Pro-poor financing schemes need to be based on the real costs of providing public health services to the poor. Otherwise the services will either not be provided or be of low quality. The JPS-BK program used capitation-based grants in order to provide supply-side funding to health providers. The scheme distributed funds to service providers on the basis of the number of poor residing within their jurisdiction. Throughout this program, providers received funding regardless of their services to the poor. In this regard, although the program targeted the poor and was meant as a targeted demand-side program, in reality it worked as a supply-driven program only subsidizing the utilization of the poor (Pradhan et al, forthcoming). If the funding scheme had been based on a fee-for-service or prospective payments system, there may have been more incentives on the part of providers to reach out to the poor. The health-card program, while intended to operate as a demand-side health insurance program, in practice fails to function in a demand-driven way since the flow of money is not attached to final service delivery.
139

MAKING THE NEW INDONESIA WORK FOR THE POOR
Although the lack of accountability of providers to the poor was a problem In Itself, the more significant concern with the healthcard scheme was the Ineffective targeting of the program. The program benefits were almost homogenously distributed across quintiles (see Chapter 6 for targeting analysis). In 2004, only about 22 percent of the households in the poorest quintile were covered by the health-card program and only about 3 1 percent of the cards were given to the poorest 20 percent, while 12 percent of the cards found their way into the households of the richest quintile. Health cards therefore had a limited impact because of socialization problems that resulted in poor targeting. For the JPS-BK program, targeting was slightly pro-poor but the degree of targeting effectiveness fell short of what has been achieved in some other countries. In the design of the program, there was little incentive for providers to socialize the program.
Regardless of the poor targeting performance of the JPSBK and PKPSBBM healthcard programs, in general they have provided benefits to the beneficiary groups in terms of the utilization of public services. There has been a significant increase in use of health facilities, such as the Puskesmas and Posyandu,i20 and supplementary feeding to the poor was provided through the program (children under five years of age and pregnant mothers) (SMERU, 2005). Conditional on being sick, the poor’s likelihood of using public facilities was higher for those who had access to the health card when compared with peers in the same quintile (Pradhan et al, forthcoming). For all quintiles, those who had access to health cards were less likely to only self-treat themselves than those who did not have cards. Card holders were also slightly more likely to use public services than private service providers. As expected in any demand-side intervention, the benefits resulting from the health-card program have generally been found to be directly proportional to the particular geographical aspects and available infrastructure of a certain area. The benefits of the JPS-BK program in rural areas, particularly in remote areas, tended to be less evident than the benefits evident in urban areas.
In 2005, the government once again undertook a remarkably large scheme of health financing aimed at increasing access and health service quality to all people, In particular to the poor, so as to achieve better health outcomes. The program is very similar to the predecessor JPS-BK (1998-2001) and PKPS-BBM (2001-05) programs in that it also proposes to provide: (i) free-of-charge health services at Puskesmas; and (ii) in-patient treatment at third-class hospital beds for the poor. The only difference in the new program is that the in-patient treatment part of the program is run by PT Askes, whereby health cards are distributed by this insurance company and the hospitals are reimbursed for their services on a fee-for- service basis. (Further details of the program can be found in the PKPS-BBM Box in Chapter 6 on Social Protection.)
Recommendations for pro-poor spending on health
While the overall allocation of public spending on health is low, augmenting spending needs to be done strategically If it is to be effective, especially If it is to benefit the poor. The benefit incidence provides three major insights into how the government can improve health services for the poor:
1. Increasing spending on primary public healthcare services for the poor and focusing on interventions that Improve the quality of services. Investing in basic healthcare facilities on the supply side can be done through public or private provision. There is great merit in centralized campaigns to address major communicable diseases. Much can be accomplished through major communication campaigns on basic health information when it comes to tackling communicable diseases in Indonesia today.
2. Investing in the training of private paramedics benefits the poor, especially In rural areas where the poor have little access to other services. Their use by the poor should be subsidized through demand-side voucher schemes allowing for the poor to claim benefits when using private providers. Investing in improvements in the quality of the private-sector providers giving healthcare to the poor will in effect be pro-poor. De facto, this is an important part of the healthcare system and needs to be reinforced.
140

Chapter 5 Making Public Spending Work for the Poor
3. Investing In demandslde activities that Increase the access of the poor to secondary In-patlent care. In the current utilization pattern, the poor benefit very little from subsidies going to hospitals and the only pro-poor financing for hospital care would be through targeted vouches (health cards) that allow free care for the poor on a fee-forservice basis. In order to improve the pro-poorness of health financing, all other subsidies to secondary care facilities should be channeled into primary care. There may be special merit to subsidizing ambulatory care, especially in remote regions. The current BBM-PKPS program is well-intentioned in terms of increasing the poor’s access to primary and secondary in-patient care. The key is to make sure it works, and to assess it and improve It Incrementally (see Box 6.6 on the PKPSBBM program in healthcare in Chapter 6).
FOCUS ON MATERNAL M O R T A L I T Y 1 2 1
The risk of death during childbirth or shortly after delivery is slgnlficant in Indonesia. The Indonesian maternal mortality ratio (MMR) is 307 per 100,000 live births,122 implying that a woman who decides to have four children has a probability of 1.23 percent of dying as a result of her pregnancies. Maternal deaths account for an estimated 21 percent (Djaja, 2000) of all female deaths of women of reproductive age (National Household Health Survey, 1995).123 Indonesia fares poorly compared with most of its regional peers: the Philippines has an MMR of 172 based on data from 1997 (UNDP, 2003), Malaysia’s MMR is a mere 20 (UNDP and Government of Malaysia 2005). Only Cambodia has a worse ratio than Indonesia’s, at 437 based on the DHS survey from 2000 (Kingdom of Cambodia, 2003).
Main medical causes leading to maternal mortality are hemorrhaging (bleeding), Infection and eclampsla. Over 60 percent of maternal deaths are estimated to be caused by these direct obstetric complications. Hemorrhages occur most frequently and account for between 25 and 45 percent124 of maternal deaths, followed by eclampsia (13 percent) (JHPIEGO, 2004) and post-natal Infection (10 percent) (Supratikto et al, 2002). The majority of deaths caused by hemorrhaging are reported to be a result of a retained placenta-a strong indication of inadequate management of the third stage of labor.125 Death due to infection is an indicator of poor prevention and management of infections. Unsafe abortions and a lack of post-abortion care also contribute to a significant percentage of maternal deaths, with government estimates based on the Indonesian Demographic and Health Survey (IDHS) indicating that abortions comprise 11 percent of all maternal mortality (Ministry of Health, 2003). The pattern of maternal mortality highlights the importance of skilled midwifery during labor, as the risk of most complications can be significantly reduced by the presence of a skilled birth attendant (bidan) and the availability of a referral system to 24hour obstetric care if complications arise. Preliminary estimates (Graham, Bell et al, 2001) suggest that only 16 to 33 percent of maternal deaths due to obstructed labor, eclampsia, infection and hemorrhaging could have been avoided by the presence of a skilled midwife at delivery. A well-functioning referral system is needed to reduce MMR further.
Progress In reduclng maternal mortallty lies In increasing the proportion of blrths attended by skilled professlonals, increasing the proportion of institutional dellveries and improving access to 24hour obstetric care. Previously, the government’s strategy to reduce maternal mortality focused on Increasing assisted deliveries and access to birth control. The bidan di desa (Village Midwives) program aimed to increase access to midwife services. During the 199Os, some 54,000 nurses underwent a oneyear course to become village midwives and were placed in underserved villages. Studies do indicate that the arrival of a midwife was linked to a significant increase in infant birth weight (Frankenberg and Thomas 2001) and subsequent nutritional health of children (Frankenberg, Suriastini et al, 2005). These are signs of healthier pregnancies, which also help to reduce the likelihood of maternal mortallty. Despite some improvements, currently only 72 percent of births are attended by skilled personnel in Indonesia nationally, compared with 97 percent in Malaysia and China, and 99 percent in Thailand (WDI, 2006). Most deliveries, 59 percent, are at stili at home and only 9 percent of deliveries are at public sector health facilities. Most institutional deliveries (30 percent of all deliveries) are in private practices, often in the homes of midwives (BPS and ORC Macro, 2003). Increasing deliveries with skilled staff in attendance at health clinics will require action on several fronts.
Five steps towards reduclng maternal mortality In lndonesla
1. lncreaslng avallablllty of skilled mldwives In remote areas. Nationally, there is one midwife per 4,000 of population, which is actually better than the internationally recommended level of one per 5,000.126 However, remote areas certainly do lack skilled professionals for delivery. There is huge variance in provision: in Java/Bali the average client has to travel 1.5km to see a midwife, while on many of the outer islands (Kalimantan, Maluku, Nusa Tenggara and Papua) average travel distance varles from 12km to 30km. Thirty percent of rural villages
141
MAKING THE NEW INDONESIA WORK FOR THE POOR
have no midwife present, while 57 percent have no maternity house where children can be safely delivered (Podes, 2003).
2.
3.
4.
Keeping skilled midwives in remote areas is a challenge and past efforts to locate midwives in remote villages have proven unsustainable. Midwives are less likely to live in remote areas, as conditions are difficult and there are fewer paying clients. Of the bidan placed in underserved villages underthe Village Midwives program in the 199Os, only 40 percent elected to stay in the villages where they were placed once their government contracts has expired. However, potential solutions are being explored: UNICEF and the government are supporting a new project, called Improving Maternal Health in Eastern Indonesia (JHPIEGO), which aims to provide enhanced support from district health centers for village-based midwives. Taking a fundamentally different approach, JHPIEGO attempts to identify daughters of TBAs in remote areas and offer them scholarships to enable them to study to become skilled midwives.127
improving affordability of care by skllled professionals. Only 48 percent of women in the poorest quintile have assistance form a qualified midwife or doctor during pregnancy and childbirth, while 90 percent of women in the richest quintile do.128 The average fee for a midwife-assisted delivery is Rp 200,000, close to monthly per capita consumption in the poorest quintile. One way to address the problem of affordability is through providing targeted price subsidies for poor women to access skilled healthcare services. To date, there have been two fundamentally different approaches. The first is the national health-card scheme, which was set up in response to the financial crisis of 1997 and has more recently been funded largely from savings on fuel subsidies. Poor households are provided with health cards that entitle household members to free basic health services, including access to midwives, by public providers. Providers are directly compensated for the services they deliver to health-card holders. However, the impact of the health-card program on increasing access to skilled delivery appears to be minimal. The other approach is an experimental scheme, the Targeted Performance Contracting (TPC) program, which was launched in 10 districts in Central and East Java, but was later abandoned when financial support came to an end. Booklets containing pre-paid vouchers for free midwifery services were distributed to poor pregnant women. TPC-contracted midwives received a basic monthly salary, but with an option of topping up their salaries based on number of Services delivered.
The government should consider greater use of demand-side financing to help the poor overcome the financial barriers preventing them from accessing skilled providers. Greater impact might be possible if funding were channeled to the poor through alternative mechanisms (rather than through providers). One possibility is to develop contracts with communities, or cash transfers to poor households, both conditional on an improvement in birth attendance by skilled professionals (CCTs). Vouchers to poor pregnant women, similar to the TPC program but not distributed by midwives, would also be a more direct way of promoting access for poor women.
increasing awareness especially among women of the importance of skilled midwifery at birth. The poor often fail to seek care from trained professionals, because birth is considered a natural process that does not require professional skills. A recent ‘Voices of the Poor’ study at eight sites in Indonesia (Mukherjee, 2006) suggests that, as long as no complications are expected, the traditional birth attendant (TBA) is the favored care provider among the poor. The TBA remains the principal choice of childbirth assistance provider-more so according to women than men. Although the most obvious reason seems to be the cost savings of using a TBA compared with midwives/Puskesmas, several other factors favor the TBA. In five out of eight sites, the satisfaction ratings of the TBA were higher than those of local clinics or midwives.
A comprehensive approach is needed to address these issues and one program, called SiagalzQ (Be Alert) and initiated in 1998, has demonstrated good results in addressing underlying issues of empowerment and community structures to reduce maternal mortality in Nusa Tenggara.130 This community-driven approach has led both to practical changes in behavior and measurable results (Sood, Chandra et al, 2004). A recent evaluation by Maternal and Neonatal Health found that Siaga villages had measurably higher levels of reported assistance to women during childbirth than nondiaga villages, as well as an increased awareness among women that bleeding was a danger-sign during childbirth. Siaga villagers have also taken practical steps to improve maternal health, including reviewing maternal deaths with local health providers in order to evaluate what could have been done better, creating ‘rapid response’ vehicles to rush pregnant women to hospital, and villagers working together to improve the quality of local water and sanitation facilities.
Improving quality of skilled birth attendant services: Besides increasing access to professionally assisted deliveries, government policy should focus on improving the quality of services delivered. Low quality service providers harm poor women disproportionately, as these women have the least choice in selecting providers. Most pregnant women, especially poor pregnant women, seek maternal health services in their villages, but the quality of services provided by village midwives is often of low quality due to poor training (Parker and Roestam, 2002). Reasons for this include an overly theoretical curriculum, the lack of follow-up supervision by more
142
Chapter 5 Making Public Spending Work for the Poor
experienced midwives and, more recently, uneven quality of training as a result of decentralization. For instance, many districts have opened new midwifery schools but lack experienced teachers to train staff.
Support and supervision by more experienced midwives, as well as peer review and support, can reinforce theoretical knowledge and improve midwifery skills by imparting practical knowledge. This finding is supported by an analysis of communication training (APN basic obstetric training) for district health center midwives: while formal training resulted in new midwives increasingly using newly acquired skills, training coupled with follow-up self-assessment and peer reviews helped maintain these skills (Abdallah, 2002). In one recent evaluation, the skills of about 70 percent of new midwives declined three months after they had completed their training if they received little or no peer review or support (Abdallah, 2002).
Promising approaches include a stronger focus on practical skills, supervision and peer review, as well as accreditation. Both UNICEF and Project Concern, in cooperation with provincial governments, have promoted more rigorous peer review and support systems, with the longer-running Project Concern approach demonstrating that peer reviews can result in improved skills (Robinson, Burkhalter et al, 2001). The newest approach to this effort is the Bidan Delima program, initiated in 2003 in 160 districts to promote higher-quality private midwives. The program, supported by the Indonesian Midwife Association, enables midwives to conduct self-assessment, and then to study to improve their skills. Finally, when they reach an objective standard, they are certified as high-quality providers. Midwives are strongly motivated by this opportunity because certification enables them to garner more clients.
Quality will also improve with the availability of medical equipment and drugs to support deliveries. For this reason, increasing the availability and use of well equipped clinics for deliveries is needed. For instance, in remote areas, the government can reduce the risk of maternal mortality by increasing access to medicines such as Misoprostol. Misoprostol 1 3 1 is a prostaglandin, causing muscles to contract and thereby speeding up the release of the placenta. The majority of deaths caused by hemorrhaging are reported to be due to retained placenta.132 A comparative effectiveness trial conducted by the WHO Collaborating Center in Bandung and JHPIEGO’s Maternal and Health Program in Indonesia assessed the impact of the drug. The study concluded that a community-based approach using Misoprosol is a safe, acceptable, feasible and effective approach where skilled care is not available (Maternal and Neonatal, 2004). Women in the intervention area were 24 percent less likely to suffer excessive bleeding and 3 1 percent less likely to need emergency referral. However, the drug can cause abortions if taken during pregnancy. In view of the nature of the drug and the need to train community volunteers and regional coordinators who would be responsible for supplying Misoprostol, the drug’s use should be phased in over time (Sanghvi et al, 2004).
143
MAKING THE NEW INDONESIA WORK FOR THE POOR
FOCUS ON CHILD M A L N U T R I T I O N 1 3 3
Despite reductions in Indonesia’s poverty rate and economic recovery In recent years, In the perlod 200043 there was no improvement in the child malnutritlon rate. The Nutrition and Surveillance Survey (NSS) provides continuous data on trends in selected urban and rural areas. 134 The NSS shows no change in trends after 2000, giving the impression that malnutrition has been stagnant since then. Child malnutrition, defined in terms of weight-for-age for children under the age of five, has even increased slightly, mostly due to an increase in malnutrition in urban areas. For several decades before 2000, child malnutrition in Indonesia had declined steadily and, although it remained substantial, was successfully brought down to levels close to those in other countries in the region. In 1999, for instance, child malnutrition135 was 25.9 percent in Indonesia, while it was 18 percent in Malaysia, 28 percent in the Philippines and 33.8 percent in Vietnam. The reasons behind the stagnation in improving malnutrition levels are three-fold:
First, changing Infant feeding practices and the use of Infant food supplements as substitutes for breastfeedlng durlng the first year of life have a strong negative effect on nutrltlon. The use of supplements increased over the period from 1998 to 2003 by almost 10 percent. Indonesian mothers are shifting from exclusive breastfeeding during the first six months to greater use of supplementary food and drink products. From 1999 to 2003, exclusive breastfeeding declined from 54 to 43 percent in rural households, and from 5 1 to 2 1 percent in urban households (De Pee et al, 2002). Concurrently, use of supplementary food and drink products increased from 65 percent in 1999 to 74 percent in 2002 (De Pee et al, 2002). Regression results suggest that breastfeeding at some point during an infant’s life is associated with lower levels of child malnutrition. Relative to exclusive breastfeeding, the use of supplementary food and drink results in significantly lower values of weight-for-age (higher malnutrition levels), after controlling for other individual factors such as gender and age, and household characteristics. This finding suggests that the government should invest in putting in place information campaigns that relay the clear benefits of breastfeeding for child nutrition.
Second, sharp Increases In the price of staple foods, in particular rice, had an adverse effect on chlld malnutrition that reverberated In both rural and urban households. Significant increases in rice prices from 1998 to 2003 have been associated with considerable increases in the child malnutrition, as parents could ill afford to maintain their children’s usual caloric intake. While the government needs to implement policies to mitigate pressures that are likely to drive up the price of staple foods, such as lifting the import ban on rice, it can also fortify foods with multi-micronutrients and subsidize iodized salt (see Box 3.5 in Chapter 3 on Understanding Poverty for more details on rice).
Contrary to common perceptions, the decline In utilization of Posyandu units does not have a statistically significant effect on malnutrition. In fact, the increase in malnutrition levels took place in 2003, at a time when there was a higher availability of Posyandu units per 1,000 of population. Any effect from the increase in utilization and coverage of Posyandu centers in reversing the downward trend of child malnutrition appears negligible and, in some areas, even irrelevant. First, the closure of Posyandu centers postdates the rise in child malnutrition. Second, some areas have high Posyandu utilization rates while also exhibiting high child malnutrition. In Nusa Tenggara, for example, an increased utilization of Posyandu centers has had no effect on child malnutrition rates, suggesting that any observed effect in other provinces may be specific to that province. Nonetheless, while the decline of Posyandu centers appears to have had little measurable effect on child malnutrition, the reassertion of a well-implemented health campaign that vastly improves awareness in communities of good complementary infant feeding practices, as well as the benefits of exclusive breastfeeding, will be beneficial in reducing malnutrition going forward.
144

Chapter 5 Making Public Spending Work for the Poor
IV Infrastructure Sectors
Ove w iew
Infrastructure development matters both for income and non-income dlmensions of poverty. investment in infrastructure services contributes to growth by reducing transaction costs and facilitating trade flows within and across boundaries. Infrastructure investment can enable economic actors to respond to new types of demand in different places, lowers the costs of inputs used in the production of almost all goods and services, opens up new economic opportunities and makes business more profitable. However, going beyond its impact on growth and the income dimensions of poverty, it is also important to understand the synergies between infrastructure and non-income dimensions of poverty. Global estimates suggest that differences in access to safe water could explain about 25 percent of the difference in infant mortality rates between the poorest and richest quintiles, and 37 percent of the difference in child m0rtality.~3~ In Indonesia, diarrhoeal disease is the second largest cause of mortality among children. One half of all child deaths are associated with water-borne, faecal-borne or respiratory diseas- result of inadequate water and sanitation services, drainage and detrimental fuels.
Public investment in infrastructure in Indonesia has fallen in the past decade and has not recovered to precrisis levels. In the growth period of the late 1980s and early 199Os, infrastructure was allocated the lion’s share of central government revenues and looked set to continue as the primary and most favored sector for development spending. In 1994, development spending in infrastructure s u b - s e ~ t o r s ~ ~ ~ was close to 2.3 percent of GDP, when three-quarters of this spending came from central government development spending (Figure 5.14). After the 1994 fiscal adjustment, policies encouraging more private- sector investment, together with decision-making processes that allocated expenditure away from infrastructure resulted in a declining trend in infrastructure sector investment. The economic collapse in 1998 exacerbated this situation as the government tightened expenditure and focused on stabilizing the economy.
All infrastructure sectors have suffered as a result and regional competitiveness has been lost. Power outages are imminent in Java, while the outer regions already suffer regular black-outs. Limitations to internet and data access are affecting business. Road congestion has increased and is pushing up costs for exporters. Maintenance of existing roads is neglected: almost half the district roads are in poor or bad condition, leading to increases in transport costs and lower prices for farm produce. The water and sanitation sectors are in crisis, registering some of the lowest access rates in the region and undermining health outcomes.
This downturn in spending on Infrastructure Is markedly different from spending patterns found elsewhere In the region. Data comparing gross fixed capital investment across a range of East Asian countries show that while Indonesia was investing close to 30 percent of GDP in capital investments in 1990 (ranking just below Thailand and Malaysia in the region), by 2004 Indonesia’s capital investments were lower at around 21 percent and even Cambodia, India, Bangladesh, Sri Lanka and China had higher levels of fixed capital investment as a percentage of GDP (WDI). This has serious implications for future economic growth. Several business surveys have identified poor infrastructure as a key barrier to investment in Indonesia and the country now ranks below most of its neighbors on key infrastructure indicators. By 2002, China for instance, previously behind Indonesia in competitiveness rankings-had overtaken Indonesia in terms of quality of infrastructure.
There are signs that the tide Is slowly turning, but the levels of spending needed to revive the sector will take years to achieve and need to be better targeted. The gradual upward trend that is now emerging in infrastructure spending continues to be biased towards growth-oriented investment and an infrastructure gap is evident in household-level services. The primary challenge for Indonesia is in the selection (and implementation) of a pro-poor development spending mix.
145

MAKING THE NEW INDONESIA WORK FOR THE POOR
Flgure 5.14 Development spending on Infrastructure (% GDP)
Flgure 5.15 Indonesia Is already lagging behind China In the 'commercial perception' of quality In Infrastructure
servlces (ranking: 1 worst, 7 best)
2 5%
2 0%
B 1 5 %
i $5 1 0%
E
0 5 %
0 0%
development spending ha) corns down.. \ ] 0 Indonesia
M94 FY95 FY96 FY97 M98 M99 MOO FYOl FYOZ M03 M04 Port lacllltles Electrlclty Road Water Telephone SeNlCe8
-Total A Central De~loprnent . . A----DlSlWt P,OIl"CB
Source: MoF, SlKD data. Note: Includes only water and sanitation, irrigation, electricity and roads sectors. See Annex V.4 for details.
Source: Estache and Goicoechea (2005)
Water and sanitation services sector
Levels of spending on water and sanitation services
Despite the linkages to poverty reduction and human development, government expenditure on water and sanitation Is low compared with other sectors, and other comparable Countries. Overall spending on water and sanitation services (WSS) in 2002 amounted to Rp 2.57 trillion, equivalent to only 0.14 percent of GDP.138 Figure 5.16 provides an illustration of the trends in the water sector over the past decade, including the decline in total expenditure as a percentage of GDP.
Decentralization has not created significant change in aggregate terms, but there is inconsistency in the proportions of central, provincial and district government WSS spending in different regions. This indicates differing levels of effective fiscal decentralization in the sector. Whereas in Java/Bali, 60 percent of WSS expenditure was central government spending, in Sumatra over 60 percent was district spending, while in Papua over 70 percent was provincial spending. This lack of consistency in sector spending levels can be explained by project spending.
Access levels to water services are low and self-provision characterizes the sector. As of 2004, WDI figures indicate that 77 percent of the population of Indonesia had access to what was termed an 'improved water source'. Official Susenas data categorize access to water according to ownership: whether ownership is private or public, individual or shared. These data indicate that of those households that have access, 52 percent have individual privately-owned sources of drinking water (e.g. pump or well), and 25 percent have a jointly-owned source (e.g. communal taps). Most of the water consumed in Indonesia is not delivered. Instead, the majority of Indonesians obtain water by drawing on the ground water table, either by accessing water on their own land or in the locality. In urban areas, only 33 percent of population live in households with access to piped water and, of the poorest quintile, only 18.3 percent have access to tap water (Susenas, 2004). Where possible people in Indonesia rely on water collected from rainwater, lakes, rivers, and hand-pumped wells, springs or communal wells, and these people are probably not using enough water for basic hygiene standards to be met (see Annex V.5 for details on access to water for the poor).
The real probiem-the type of supply and the associated convenience, cost and quality of w a t e r 4 hidden in access data. Access figures suggest Indonesia is on par with other countries in terms of water service delivery, but most of the water consumed in Indonesia is not delivered. The high rates of self-provisioning,
146

Chapter 5: Making Public Spending Work for the Poor
mostly at the individual but also at the community level, make Indonesia a country with one of the highest rates of self-supplied water. Water-supply strategies must be extremely cognizant that: (i) this self- provisioning is hard to convert to utility supply once in place and functioning effectively at the individual household level; (ii) there is a huge variation in potential sustainability, which is very dependent on location; and (iii) self-supply is probably a water-supply lifeline in the short term. Few water sector strategies have recognized the importance of self-supply, or worked out what the implications are for devising a water-supply strategy.
Access to sanitation services in terms of piped sewage dlsposal is less than 1 percent of the total population in Indonesia. Thls Is the lowest level in the region and among comparable countries.139 The lack of sanitation in Indonesia is longstanding, and has resulted in low demand and low expectations. There is also low awareness of the adverse impacts of inadequacy and the potentially huge benefits of improving sanitation systems. In Indonesia, policy dictates that basic sanitation is the responsibility of private households, even though the costs of inadequate sanitation are substantial. The health and environmental costs of inadequate sanitation in cities are especially marked. Any improvement in this situation will require far higher public awareness of the negative impacts of inadequate sanitation on health, economic growth and the environment, and political will to address the problems (see Chapter 3 on Understanding Poverty for more details on access levels).
Priority issues for poverty reduction in water and sanitation services
The supply of water to the urban poor is complex. The existing situation reveals significant variation across cities and suggests a mix of solutions for the future. In urban areas, levels of access to utility supply are lower in the poorest quintile but the district water utility (Perusahaan Daerah Air Minum, or PDAM) service is also limited to all households. This analysis, together with analysis of tariff and connection fees, suggests that if there is a piped service available it is likely that the poor can access it. In practice, however, the urban poor obtain their water from a number of different suppliers. Collignon has documented by volume and value the proportions of network and non-network water consumed in poor areas surveyed in selected cities. This shows not only the high reliance on self-supply in all cities except Jakarta, but the predominance of water terminals in Palembang, private networks in Bandung, both public and private networks in Makassar, and a mixed pattern in Subang (Hydroconseil, 2004). It is highly likely that the household decision on connection is closely linked to alternative supply options available in the locality.
Poor households connected to utlllty networks pay subsidized fees and tariffs, but only a small percentage of households are connected (see Annex V.5). Subsidies are provided through a rising block tariff (RBT) and are therefore not targeted as well as they might be. (The rising block tariff exclusively benefits those households that are connected, disadvantages poor households that often share connections or have large consumption, and provides the benefit of subsidized water in the first block to all consumers.) High connection fees should be discouraged for pro-poor expansion of services even though utilities currently insist on applying these fees as they increase instant revenue.140
Targeting and subsidy mechanisms are flawed and need to be rectified to increase access for the poor. Pro-poor expenditure basically means making affordable services available to the poor. A variety of subsidy policy options should be considered to help increase access of these services to the poor. Tariffs and subsidies need to be better targeted to ensure that they are not captured by the non-poor. Appropriate pricing is the most controversial aspect of sector reform. The restructuring of sector finances-necessary to create viable service delivery institutions-is likely to have some negative impact on the poor in the short term. Mechanisms need to be put in place to specifically target those who need the services most. Past subsidization through the rising block tariff has benefited poor and non-poor alike, creating inefficiencies in institutional performance and hindering the capacity of PDAMs to expand coverage to include more poor areas. As things stand, the low level of household connection means that the tariff invariably subsidizes the non-poor.
147

MAKING THE NEW INDONESIA WORK FOR THE POOR
The rising block tariff is, despite the best intentions, a regressive tariff that needs to be replaced and/or supplemented with other instruments. Experience suggests that the most effective means of targeting the poor will be highly dependent on local conditions, especially where supply options vary (McGranahan and Satterthwaite, 2004).
A number of alternative, nonquantlty-based subsidies, such as geographic targeting (where the poor are spatially clustered), means-testing or even (temporary) lower service-level subsidies (e.g. promoting access to standpipes) that also encourage incremental service improvement, might be considered in different situations.
Connection subsidies would need to be very carefully considered in viable contexts and combined with complementary non-price mechanisms (such as security of tenure) to make utility services accessible and affordable to poor households.
In both urban and rural contexts, low sanitation coverage has significant health and environmental (and therefore economic) Impacts, but demand for sanitation remains weak. Sanitation is a public good, cost recovery is difficult to establish at the outset and in Indonesia there is little demand/pressure coming from consumers. The sanitation component of the WSS sector needs detailed and separate consideration if new developments are to reach the poor. In the absence of such careful forethought, and given the very low current levels of sanitation service provision, direct improvements are likely to be captured by the non-poor for many years to come.
Recommendations for pro-poor spending on water and sanitation services
The linkage between Inadequate water and sanitation services and poor human development outcomes is clear and public spending In water and sanitation Is widely proven to be poverty-reducing. But pro-poor expenditure in water and sanitation services requires understanding of blending, targeting, community- driven development, multi-stakeholder delivery and viable financing. The following recommendations aim to achieve this and also suggest ways of making spending on water and sanitation services more efficient and effective:
1. Blend water and sanitation expenditure with health and education spending to provide a mix of services specifically designed for poor areas/qulntlles. A mix of services would provide synergies and cumulative benefits, and more so for the poorest quintiles. A targeted strategy is needed for higher spending on WSS in districts and provinces where under-five mortality is high. This should then be blended with a package of better preventive healthcare, maternal education, and efforts to monitor the progress of the lowest quintile in these targeted areas to achieve optimal pro-poor WSS expenditure.
2. Design and allocate resources and programs for WSS at the regional level to respond directly to local and instltutlonal constraints and variations, other supply options and household needs.
Account for household and regional needs: map water and sanitation access and type against infant mortality rates, and then target water and sanitation DAKs to needy areas.
Account for supply options: the vast range of services currently available and the very different profile of supply options across the country suggest that a one-size-fits-all solution is unlikely to be appropriate, particularly in urban and peri-urban areas.
Account for existing services: the high level of self-provisioning of WSS in Indonesia is a dilemma that needs to be taken into account in local level water and sanitation strategies.
Account for the capacity of the delivery agencies: allocate to the stakeholder (LG, NGO, CBO) most able to deliver. Irrespective of context, awareness of the capacity of the delivery agency to delivery WSS and specifically to deliver WSS to the poor is a critical factor in the design and allocation of resources.
148

Chapter 5: Making Public Spending Work for the Poor
3. In terms of water provision In rural areas, establish a tlme-bound national action plan and budget, llnked to the MDGs to replicate the community-management supply model to the 50 mlllion people without adequate water supply (see Box 5.2). Household provision is currently estimated at 55-60 percent and community level provision (village-level managed and operated systems) has increased to 2 5 3 0 percent, while PDAMs and small-scale providers supply an estimated 5-8 percent of households at the rural-urban interface (World Bank, 2004a). The predominance of rural self- provision and a country-wide recognition of the success of rural community water-supply initiatives mean that an approach for rural areas is at least already known. Policy has developed over the past decade to build on these opportunities, and implementation and roll-out is planned, but greater government spending is needed in order to achieve a broader impact. Community-based solutions can also benefit from the lessons emerging elsewhere. More attention is needed to the development of sustainable management systems, alternative technologies, cost recovery, economies of scale and a delivery system able to improve the rate and scale of progress of service improvements. The financing of policy into an implementation framework should be identified and incorporated into national budgets. Efforts to secure financing and plan the roll-out of successful initiatives to lagging regions are urgently needed if the problem of rural water is to be tackled.
I Box 5.2 Local ownership in Lumajang The Second Water and Sanitation for Low-Income Communities Project (WSLiC-2) started in Indonesia in 2000. The project aims to improve the health status, productivity and quality of life of poor rural communities. Project activities focus on improving health and health behavior, providing better access t o water and sanitation, and community participation. In Lumajang district, East Java, where a WSLiC-2 project began in 2002, 75 percent of targeted villagers in villages visited by the research team now have access to project water supply (although the tank-to-household ratio of between 25 and 43 to 1 is rather high). Distances traveled by water collectors have shortened and water quality is better.
WSLIC-2 pays up to Rp 200 million for a village water supply system; for larger villages with higher project costs, the consent of the Management Unit is required. Villagers are required to contribute 20 percent of the total (4 percent must be in cash and 16 percent in kind and labor). Because of Lurnajang's geography, only piped water systems-the most expensive type-are possible, so the project has paid the maximum Rp 200 million for each village system in this district. Each village has therefore contributed Rp 8 million (US$900) in cash and Rp 32 million (US$3,600) in kind and labor, demonstrating ownership of the systems from the beginning of construction.
Villagers in one site said: "We are happy and proud of [the water system]; we celebrated the birth of the water system on the evening of the fifth of May with buii-races," 'Together with the facilitators we have created the water infrastructure," and, "WSLIC-2 is the first t ime the people have been trusted." The head of one village explained that 'WSLIC-2 woke up sleeping people; it gave them the incentive to. .. take matters into their own hands."
Source: 'Innovation in Pro-Poor Service Delivery: Nlne Case Studies from Indonesia."
I
4. In terms of water provision In urban areas, strengthen capacity and establish Incentive structures for PDAMs for plannlng, delivery and monitorlng of service delivery. The failure of water institutions generally, and PDAMs specifically, has been a serious blockage hindering sector development, but signs of success in a number of PDAMs over recent years provide models and hope for change. The chronic inefficiency of PDAMs-the interference of local government owners, the payment of dividends annually to local governments irrespective of profit, the need for expansion, compromised hiring practices, the lack of transparency, and inappropriate connection charges and tariff structure+ affects the poor and non-poor alike. A pro-poor effort is needed to support or supplement systemic reforms (World Bank, 2004). But PDAMs need to be mandated, and given incentives to scale up services to marginal areas inhabited by the poor. The low utility coverage requires effort by utilities to institutionalize pro-poor approaches, reconsider service levels, resolve the issue of subsidies and the pricing of water, develop pro-poor financing strategies and affordable cost recovery solutions, and target the needs of the poorest households in the development of solutions. A pro-poor strategy needs to accept that at present the vast majority of the poor do not have access to network water. Changing tariff structures may indirectly support these groups, but other instruments will need to be used if the poor are to be served with adequate and affordable water. While connecting poor households to utility water at an affordable cost is undoubtedly optimal, not all improvement strategies will focus on connections in the foreseeable future. And for those currently connected, or
149

MAKING THE NEW INDONESIA WORK FOR THE POOR
targeted for future connection, a number of instruments (appropriate billing and connection, service options, poverty selection) are needed to ensure sustainability of service.
5. Sanltatlon for the poor requires increasing public awareness and poiitlcai wlli. Stronger institutions and increased financing will not come about without stronger political will and far greater public awareness of the adverse impacts of inadequate sanitation on health, the environment and economic growth. The lack of sanitation in Indonesia over many decades and political eras has resulted in low demand, low expectation and low awareness of both the impacts of inadequacy and the potential impacts of improvement. This low demand from constituents has meant weak political support for sanitation. Expenditure on hygiene and sanitation awareness-building might be stimulated in the private sector if government used public finance to launch and leverage the effort, and provided strong political leadership to a sanitation clean-up campaign.
Figure 5.16 Development spending on Infrastructure by sub-sector (% GDP)
Road Infrastructure Water a n d Sanitation
1 0%
a 08% - n (3 06% - s
0 4%
08% (3 s 06%
0 4%
0 2% 0 2%
0 0% 0 0% N 9 4 N 9 5 FY96 FY97 N 9 8 FY99 N O 0 NO1 N O 2 N94 N 9 5 N96 N 9 7 N 9 8 N 9 9 M O O N O 1 N O 2
-m- Total -0- Central + District --CY-- Province
Source: MoF, SIKD. Annex V.4 for details on spending levels in nominal rupiah terms.
Rural roads sector
Levels of spending and access to rural roads
Roads and transport contribute to both growth and poverty reduction. This is because roads and transport significantly affect the remoteness of rural households. It therefore comes as no surprise that investment in roads has an important impact on income and non-income dimensions of poverty. Better transport increases the efficiency of resource allocation, improving the performance of markets and fostering economic growth, and economic efficiency lowers costs and enhances economic opportunities (see Chapter 4, Section VI on Connecting the rural poor to urban markets). In terms of non-income poverty dimensions, improved roads and transportation have a positive impact by enhancing access to health and education services, while in emergency situations access to roads can even be a defining factor in reducing maternal mortality.
Roads and transport slgnlflcantly affect the remoteness of rural households and lack of road access Is highly correlated wlth poverty. Poverty diagnostics show that having access to an asphalt road is one of the key variables associated with increases in household expenditure in Indonesia (see Chapter 4 on Growth). Controlling for other household and regional characteristics, having access to an asphalt road is associated with an 8 percent increase in household expenditure in urban areas of Indonesia.141 But it is not just distance that matters. The quality of road matters greatly too. Better quality roads, as measured by the proxy of a higher average speed traveled between village and provincial capital, raise real per capita expenditure, with an elasticity of 0.06.
150

Chapter 5: Making Public Spending Work for the Poor
Road Infrastructure expenditure and access reflect overall Infrastructure trends: a dramatic increase in the 1980s and early 1990s and then a dramatic decline since 1994. Road sector development has been marked by highs and lows for a 30-year period. The length of the road network in Indonesia increased by an average 8.3 percent annually between 1970 and 1998, and included a surge of construction of local farm-to-market roads (from 8,500km in 1977 to 31,900km in 1998). In 1990, the total road network was 1.8km per 1,000 people, and today still remains higher in these terms than China and Vietnam. The roads that were constructed widely throughout the country prior to the crisis supported the growing economy, particularly the agricultural and manufacturing sectors. While the allocation was not optimal and investment in urban areas still dominated, the absolute levels of spending meant that vast road networks were provided in rural areas as well. By 1993, the overall coverage of the network was only slightly below the regional Southeast Asia average density in relation to population (and arable land area) and 92 percent of the population had access to passable roads all year round.
Spending levels are comparatively low and unpredictable, and a lack of maintenance Is the primary problem characterizing the sector. The decline in real investment following 1994 was stark: over the seven-year period from 1994 to 2000, spending halved as a percentage of the national development budget-from a sound 1.47 percent of GDP in 1994, to only 0.48 percent in 2000 (see Figure 5.16). By 2002, and despite widespread agreement in the government and donor community that the roads sector was vital to economic growth and poverty reduction, this figure was still only 0.69 percent of GDP. Unfortunately, it is currently not possible to retrieve spending data after 2002 at the sub-sector level due to a reclassification of infrastructure spending data at the decentralized level.
Spending In recent years has been blased towards the national networks and has not met development, improvement and preservation needs. While the national arterial road network is in good condition, with 95 percent paved and 88 percent in good-to-fair condition (in 2003) and the provincial network is also predominately good-to-fair, the district and urban road networks are of much poorer quality: 44 percent are paved and 50 percent are in poor-to-bad condition (World Bank, 2004b). While budgets for national- level roads are sufficient, as one moves out from the center budgets and expenditure become increasingly insufficient to cover the costs of maintaining roads. The result is that district and village roads (Le. those roads the rural poor use most) are deteriorating badly, some are dysfunctional and urgent efforts are needed for their rehabilitation.
Decentralization has created disincentives for the allocation of resources for road Investments or maintenance with benefits that go beyond the kabupaten level. It is clear provincial governments have very little say over the flow of funds regarding the construction or maintenance of kabupaten and village roads. Meanwhile, national funds have not been used to ensure that optimal investment decisions are made not just at the kabupaten but also the regional and national levels (in the case of roads near kabupaten borders, for example, where much of the benefit of construction or maintenance may flow to a neighboring authority). While the DAK is in part designed to provide resources precisely to support investments with spillover benefits, in practice it has rarely been used to encourage such projects (and may, regardless, be too small to achieve such objectives).i42
Priority issues for poverty reduction in rural roads
The roads sector Is In need of Increased and more predictable Investment. It is not only the decline in recent years that has created a problem for the sector. The high levels of expenditure in the 1980s and early 1990s created a large stock of road assets that then needed routine and periodic maintenance. This rapid rise in investment and asset-building in the sector followed by a steep fall in expenditure has meant that the sustainability of previous investments is now in question.
Lack of maintenance Is the primary problem characterizing the sector. By 2000, expenditure on maintenance had reached its lowest point as a proportion of development, dropping from 30 percent to 10 percent of overall expenditure (on national and provincial roads) over the past two decades. The result has been a progressive decline in the quality of, and access to, roads. The lack of maintenance of roads is a cause for significant concern in that it has significantly reduced the quality and efficiency of the road
151

MAKING THE NEW INDONESIA WORK FOR THE POOR
stock, and reduced the corresponding quality and efficiency of services. Spending on road maintenance has three times the rate of return as spending on new roads, but its economic and social importance is often underestimated. Despite the high return to maintenance expenditure, data in Indonesia show asignificant decline in routine, periodic and emergency maintenance in rural areas (Infrastructure PER, World Bank, 2004).
There is little focus on transport services, especially In remote reglons. Indonesia’s poor are also transport poor: their livelihoods are sensitive to the transport they access. Disparities in access and mobility in Indonesia are very marked. The rural poor have limited mobility beyond their immediate settlements due to geographic isolation and the high cost of motorized transport. Transport is a service, but it is also a significant employment opportunity for the rural poor. Typically, transport services provision has a low entry cost and is highly labor intensive, with a vast range of technologies. Transport services are not only a service but one of the key non-agricultural livelihood opportunities available to rural people. Most agree that the best government can do to support this transport marketplace is to lighten the regulatory and taxation burden that impedes the development of competitive transport services, and keep the roads in a condition that makes it cost effective for transport operators to provide services that utilize them.
Recommendations for pro-poor spending on rural roads143
In Indonesia, comrnltment to Infrastructure at the policy level has not been matched with a financing strategy commensurate with government goals. instead, the sector is plagued by variability and unpredictability. The sector is essential to economic growth and poverty reduction, and a strategy for making infrastructure expenditure work for the poor must carefully consider the role of roads. Recommendations to improve the quality and accessibility of rural roads in Indonesia are as follows:
1. Roads at the local level, Including both dlstrict and village roads, should be a prlmary focus of Investment and increasing the scale of the DAK might be a first step towards reconstructlng a system of incentlves for better road management. The funds should be more carefully conditioned so that they act, as originally intended, as an incentive for projects with spillover benefits between districts and regions, and also as an incentive for good planning and maintenance. Reforms to improve the quality and reach of rural roads would center around providing additional funds to poorer district governments. Reforms would also involve efforts to maximize returns to targeted expenditure through more efficient procedures. However, just as importantly, better targeting of those funds is required to ensure: (i) increased expenditure on roads rather than other expenditure, (ii) increased focus on maintenance rather than construction, and (iii) increased focus on ‘appropriate quality’ rather than ’highest quality’.
2. Construction and maintenance of vlllage and kecamatan roads can be financed through community- driven approaches similar to the Kecamatan Development Project (KDP). Indonesia’s community- driven development model through KDP is internationally recognized for its success in delivering results to communities through better infrastructure service, as well as community empowerment and decision-making (see Box 5.3 on the KDP program). Labor-based construction provides employment to the poor. Involving the poor in the building of infrastructure creates a win-win situation by producing assets needed for growth and productivity, while also providing income for poor households to keep children in school (with its longer-term gain) (Timmer, 2004). The government is already planning to scale up the KDP program to become a nationwide poverty reduction and infrastructure program. The government has also been channeling about Rp 3.3 trillion into the village infrastructure PKPS-BBM program as a result of fuel subsidy reallocations since late 2005, funds that are being distributed to some 12,800 villages (see Box 5.4 on the PKPS-BBM program on village infrastructure in this chapter). In scaling up CDD projects in rural infrastructure, there is scope for Indonesia to be more systematic in managing these community-driven infrastructure programs and also providing technical supervision to achieve a higher quality of construction.
152

Chapter 5: Making Public Spending Work for the Poor -
3.
4.
5.
While there Is strong evidence that a participatory approach works at the village level In the case of road construction and design, evidence Is less clear that It does so at the kabupaten level. An equivalent of the Indonesia Road Management System, which governs planning and budgeting at the national and provincial level to ensure budgeting is adequate and well-targeted, is needed at the district level. Funds for new investment projects in the transport sector will only flow if there is evidence that the existing road stock is being properly maintained, and that new investments are: (i) based on verifiable (and sensible) design and selection criteria which included consideration of spillover benefits; (ii) being transparently and competitively bid out for construction; and (iii) being constructed to a high standard based on independent quality audits carried out with inputs from NGOs and local transport operators. An earmarked priority for investments could be the provision of basic all-weather roads to all villages currently lacking such access.
Efforts are needed to link road user charges to resources for maintenance. One approach would be to create a provincial or district fund to collect resources from road users (including license and registration payments) and use these resources to maintain the road network under the oversight of a board involving both public and private sector representatives. The fund could contract with private providers to ensure road maintenance. Third-party verification of the quality of the maintenance operation might be used by DAH administrators as part of yardstick competition (comparison of performance between similar kabupaten) to set standards to be met in order to receive investment funds. Local transport operators could again play an important role in providing inputs into the verification process, as a significant customer base for the road network.
It Is essential that efforts are made to ensure that the poor can access transport services and benefit from Improved road Infrastructure. Better understanding is needed of the transport poverty of different poor groups. The government can explore targeted subsidies in urban areas and support for non-motorized transport, and also underpin SME transport activity in more remote areas.
Box 5.3 Scaling up communltydriven development through the KDP program A strategy for building rural Infrastructure while reduclng poverty144
Indonesia’s Hecametan Development ProJect (KDP) Is one of the largest communltydrlven development proJects In the world. KDP is a government program first started in 1998 that aimed to alleviate poverty, strengthen local government and community institutions, and improve local governance. The KDP program supports participatory planning at the village and kecamatan levels, leading to block grant financing of Rp 500 million to Rp 1.5 blllion to each kecamatan depending on population size. Funds are used for productive economic assets, such as rural infrastructure, economic activities, and education and health. To date, KDP has covered some 34,200 vlllages, equivalent to 48 percent of the poorest villages in the country. The KDP program has achieved significant successes to date:
First, communitydriven use of funding ensures high rates of return on Investment, as project design Is adapted to address the most binding constraints faced by local communities. KDP projects have improved the poor’s access to markets, town centers, education and health facilities, as well as providing clean water supplies and sanitation. KDP has funded some 104,000 infrastructure, economic and social activities across the country since 1998, including new bridges, reconstructed irrigation systems, and clean water supply and sanitation units. The program has also contributed to the construction and renovation of schools and community health clinics, as well as the provision of school equipment and targeted scholarships for poor students. Torrens (2005) calculated the economic internal rate of return for four provinces covering both KDP cycle 1 and 2, and estimated expected internal rate of return (EIRR) at 38.6 percent (irrigation), 51.8 percent (road) and 67.6 percent (water supply). These high benefits mostly resulted from tapping suppressed or latent production capacity. For instance, new road infrastructure made it possible to access previously isolated villages where, prior to KDP, all produce had to be hand carried or carried in small bundles by motorcycle. Similarly, irrigation projects doubled agricultural production in some areas, by channeling water from local springs during the dry season. Water projects also helped to free community women from the time- consuming burden of water collection.
Second, the program Is successful In the targeting of poor kecamatan and has had demonstrable Impact on poverty. Alatas (2005) evaluated the targeting performance of the program at the kecamatan level, as well as at the household level, and found that the geographic targeting of KDP was pro-poor: the incidence of poverty was 24.7 percent in KDP kecamatan vs. 13.93 percent in non-KDP kecamatan in the first stage of the program. However, as Alatas notes, many of the poor also live outside of the areas covered by the KDP. By comparing KDP targeting with
153

MAKING THE NEW INDONESIA WORK FOR THE POOR
simulations from poverty maps recently developed by BPS, Alatas found that by using poverty maps the poverty targeting of the program could be further improved to cover 52 percent of the poor in Indonesia instead of the 30 percent of the poor covered by KDP I kecamatan (Alatas, et al, 2006). The poverty reduction impact of the program was significant according to the same study: by 2003, rural households residing in the cycle 1 KDP kecamatan were able to increase their annual expenditure by 5.0 percent of initial mean expenditure in 1998. For cycle 2 the impact was around 3.1 percent of the mean expenditure in 1998. The estimated annual impact was larger for hecamatan that received KDP over a longer period of time.
Thlrd, the program was Cost-effective, generated employment opportunities locally and suffered only low levels of corruption. For Instance, the costs for Infrastructure projects were estlmated to be 20 to 25 percent less than other government-sponsored publlc works of the same quality. Labor-based construction is not only cost-effective but also provides employment to the poor. As a result of KDP projects, 37 million workdays of employment were generated in labor-intensive infrastructure projects. The application of labor-based approaches to rural road construction contributes substantially to their poverty alleviating impact (Lebo and Schelling, 2001). Utilizing local labor not only allows the local community to earn wages and transfers skills, but it also creates ownership and empowers communities.
Building on the knowledge base of this program, Indonesia now has a unlque opportunity to launch an effective natlonal poverty program-one that wlll have lmmedlate results on the ground. In developing this process, it is important to build upon and expand the successful KDP model. Establishing a strong policy and management structure to guide the program, and factoring in costs/time for program facilitation and socialization in new kecamatan, will be extremely important if such a program is to succeed. Also, securing financing at the start for technical assistance to projects, and monitoring and evaluating programs (at around 20 percent of project costs) are crucial to ensure program effectiveness and continuity.
154

Chapter 5 Making Public Spending Work for the Poor
Box 5.4 Keeping the ‘C’ In communitydriven development Concerns with the PKPSBBM Vlllage Infrastructure Program
The PKPSBBM Village Infrastructure Program was developed using savings accruing from the reduction In fuel subsldles in March 2005. The program aimed to generate labor-intensive employment and improve village infrastructure through a bottom-up decision-making process. The program was designed with similar characteristics to other community-driven development (CDD) programs. The government financed direct grants to villages with an annual program budget of about US$345 million distributed to some 12,800 villages (at Rp 250 million per village) through the Ministry of Public Works (PU). Prior to deciding on the longer-term future of the program, the government commissioned a rapid assessment study to understand whether the program was being successfully implemented and had the potential to achieve the objectives outlined.
The preliminary findings of the rapid assessments revealed many problems with the implementation of the program due to (i) the time pressure for disbursement of funding, (ii) the lack of initial socialization of the program, and (iii) poor quality of project outputs.
First, the overall timeframe was extremely limited as the instructions were such that the funds should ail be expended by the end of 2006. Consequently, there was insufficient time for proper and thorough consultation and socialization of the program with communities, and planning for much needed infrastructure. Preliminary results from the field suggest that the program was implemented far more slowly than initially planned. About half of all sites randomly selected for assessment had not yet completed their projects. Issues that contributed to the delays included that the program was started at the beginning of the wet season when it is difficult (or at times impossible) to build infrastructure, and that the technical facilitators were deployed to the projects late.
Second, the socialization of the program was limlted and details on implementation and community Involvement were not clear to participating villagers. Sixty-seven percent of villagers interviewed knew that their village would receive funding from the fuel-subsidy compensation scheme, and 56 percent knew that the community should be involved in the project. But very few respondents knew what the funds should be used for or what their rights were in terms of participation in decision-making and implementation. In half of all the villages assessed, the decision on which project to carry out was made outside of the designated community meeting. Those involved in community meetings were generally village elites and government representatives, and very few community representatives or poor citizens involved. This failing was reflected in low satisfaction levels with the program among community members, with a 100 percent dissatisfaction level (stated as “less than satisfied” or “unsatisfied”) in the location or type of infrastructure project that was selected.
Third, the quality of Infrastructure produced by the program gives cause for concern. Of all the roads built using project funding, 47 percent were ranked of poor quality (unlikely to last more than one year), and for all projects, only 50 percent were ranked of good quality. Only 20 percent of all villages surveyed had established committees to maintain the infrastructure built through the program. Cost-effectiveness was also questionable, with one-third of all projects seen as not cost effective.
Finally, some additional concerns did not show up in the community survey. The choice of using contractors rather than communities to implement projects was a highly risky facet of project design and was a potential source of corruption. The size of the grant at Rp 250 million/ village was also considered to be too large for the type of community projects under consideration.
If the government decides to continue the implementation of this program, It Is crucial that time and fundlng be allocated for a process that engages communities in project selectlon and implementation. In order to achieve cost-effective and quality results from such a program, it is essential to provide communities with the necessary technical assistance and involve them in determining not just the choice of project but also decisions about whether to complete the project with community labor/resources or to contract out to third parties. (See also Box 5.3 Scaling up community-driven development: Towards a national poverty reduction program.)
155

MAKING THE NEW INDONESIA WORK FOR THE POOR
V Conclusion: Achieving Synergies through the Right Development Spending Mix
To make public spending work for the poor, attention should be focused on those sectors and programs that will be of most benefit to the poor, particularly where the poor experience affordablllty constraints In accessing services. This chapter takes stock of levels of government spending and the access of the poor to services, as well as constraints to improved access and affordability, in four sectors that are of particular concern to poverty reduction: education, health, and the infrastructure sectors of water and sanitation services, and roads.
In the health and education sectors, Indonesia faces mainly secondary level problems. These problems need to be addressed through measures that improve quality and induce demand for services. In health and education services, Indonesia made impressive progress in the three decades prior to the economic crisis in 1998, through centrally-led expansion of public services: large-scale programs for the construction of schools and basic health facilities, and the hiring of civil servants to staff these nationwide facilities. Evidence suggests that this approach was successful in terms of dramatically improving access, although service quality failed to improve at the same pace as access. Today, Indonesia is faced with the secondary level problems of improving quality in basic services in these sectors (Le. the quality of services provided by primary schools and Puskesmas), and expanding access in secondary level services, such as improving transition rates from primary to junior secondary schools, as well as improving the access of the poor to health insurance and in-patient hospital care. Supply-side issues still remain in terms of improving quality of services and hiring qualified staff, including the management and deployment of teachers and health personnel. In the education sector, the low availability of secondary schools is also a constraint in expanding services to the poor. However, in order to fine tune the delivery of services in these sectors, demand-side measures come into their own at this stage of developing service delivery. Such demand-side measures include interventions such as voucher schemes, as in the case of maternity healthcare vouchers for poor pregnant women, as well as scholarships or conditional cash transfer (CCT) programs to improve the access of the poor to junior secondary schooling.
Public spending In health and education has Increased following decentralization, with substantial contributions now coming from district governments. Overall, public spending in health and education has increased following decentralization, with the combination of increasing district government spending coupled with central government spending that has still to be reduced from pre-decentralization levels. As district governments now cover most salaries of personnel, their spending on health and education is dominated by these transfers and, as a result of continued deconcentrated spending by the central government, decentralization has resulted in an increase of resources flowing into these sectors. However, particularly in the health sector, the increases in public spending have not necessarily benefited the poor. This is because the districts have focused more attention on the supply of hospitals and secondary level healthcar+services that do not primarily benefit the poor. The deteriorating benefit incidence of public spending in the health sector is of concern to the central government. Its response to the worry that spending is not as pro-poor after decentralization has been to increase central development spending in the regions. While this improves the incidence of spending on the poor in the short run, the central government risks crowding out the attention and fiscal space provided by district governments to these services, harming the decentralization process in the medium term.
The central government needs to be sensitive In managing central development spending In these sectors In order to synergize with the resources that come from district governments. Centrally run programs with large visible budgets, such as the BOS and the PKPS-BBM health insurance program, run this type of risk. As a result, they need to be carefully integrated into the vision of district governments in budgetary and service delivery terms to avoiding being detrimental to service delivery in the long run. Matched grants from the center to the districts in the form of DAKs can help mitigate this problem and need to be carefully considered and implemented going forward. (Further discussion of these issues is provided in Chapter 7 on Government.)
Infrastructure spending has followed a more unfortunate pattern In the postcrisis and decentralization period. Development spending on roads and water and sanitation services has still not recovered to pre-
156

Chapter 5: Making Public Spending Work for the Poor
crisis levels. Currently, the incentives operating in infrastructure sectors do not encourage the provision of quality infrastructure services. In water provision, government regulatory and subsidy policies are largely designed to reduce the cost of infrastructure to existing consumers rather than to improve access and quality. In roads, expenditure priorities are skewed in favor of new construction of over-engineered roads rather than towards maintenance of the existing stock and construction of appropriate new infrastructure. Spending data reveal that district governments respond less well to the need for infrastructure development. Consequently, matched grants from the center, as well as an increase in funding for community driven projects for infrastructure development, will both be important steps in these sectors in the near future.
The synergies and compiementarities between the infrastructure and human development sectors should be recognized, with a comprehensive strategy and budget for poverty reduction. Although the link between infrastructure and poverty reduction goals seems more indirect, infrastructure sectors are key in attaining improved outcomes in both the income and non-income dimensions of poverty. Striking the correct spending balance between infrastructure sectors and human development sectors is vital in creating the necessary synergies needed to overcome constraints in achieving the MDGs and national poverty reduction goals. The expansion of quality water supply services and the maintenance of rural roads are particularly important for those outcomes that most impact the poor. Sanitation services, which clearly lag in Indonesia and have detrimental impacts on outcomes such as infant and child mortality, need to be expanded-this despite the fact that the sector faces demand-side constraints that also need addressing.
Wlth high lnternatlonal oil prices and the recent reductlons in domestic fuel subsidies, Indonesia stands today at a point where it can make significant strides in poverty reduction through targeted spending in pro-poor sectors and by combining the right mix of spending on infrastructure and human development services. This chapter makes specific recommendations on how to improve access to services for the poor in these sectors, and on how to improve affordability while also focusing on the quality of services already accessible to the poor. It also recognizes that the problems in the sectors analyzed are not only problems of levels of spending. A number of structural blockages need to be addressed in order to make public spending in these sectors work more effectively and deliver better results to the poor. These institutional blockages regarding accountability mechanisms in service delivery and incentives to providers are considered in more detail in Chapter 7 on Government.
157
MAKING THE NEW INDONESIA WORK FOR THE POOR
Corruption in water service delivery: direct and indirect impacts on the poor
Corruption has a direct impact on water poverty by decreasing access to, and quality of, water assets, management and services, and by increasing costs. Understanding the differentiated impacts on poor households and the types of corrupt interactions they experience is essential for the development of effective pro-poor strategies in Indonesia. When a poor householder pays a bribe or indirectly suffers from the diversion of resources, one or more of their assets ~hanges.1~5
It is therefore critical for anticorruption strategies to measure all effects of corruption on the poor. Many poor citizens live and function predominately in the informal economy, have much lower access to formal basic services, are subject to much greater intimidation, and have less access to justice than other citizens. Their marginalization from formal processes is therefore a key descriptor and determining factor of their interactions. However, we do not know how the different poor groups perceive this or what their views are on tackling corruption and changing their service options.
The very poorest probably do not bribe because they do not have the money or assets to do so, but their marginalization is the greatest and the impacts of poor redistribution most marked. But what of the other poor groups nearer the Indonesian poverty line? How does water corruption affect these groups? How does corruption function as a part of their coping strategies?
Of course, the poor may be involved in forms of corruption other than bribery. There are strong incentives for the poor to pay the bribes or defraud projects, and thereby strengthen the structure of corruption at the local level (Jenkins and Goetz, 2004). Indeed, poor people often re-elect corrupt officials or leaders because they return something to them through an unofficial economy. Conversely, there is often a cost to the poor for not entering into corrupt transactions and whistleblowers are sometimes punished. Understanding these conflicting views helps us to understand why civil society can be so divided on the issue of curbing corruption and why some key actors are apparently so unwilling to confront it.
Developlng prctpoor anticorruption strategies
Development policies in Indonesia today are focused on user pay models, which mean that the poor are meant to pay for capital infrastructure and recurrent costs more than ever before. When they cost-share, they pay for leakages (such as those occurring in procurement and elite capture) from scarce household resources.
An analysis of the poor's interaction with water services and resources helps point towards some of the areas where corruption might be concentrated and result in greater impact on the livelihoods of the poor. A simplified diagram indicating a typical flow of funds in the water sector is provided below. This value chain suggests three key areas of concern in a pro-poor strategy: fund transfers, procurement and the local capturing of assets intended for the poor.
Corruption-in-water typically refers to three different types of money/assets: public, private or citizens'. Each of these has a different impact on the poor. Public money is diverted, leaked and misallocated, leading to underinvestment in the sector and in assets that benefit the poor. Private money-which mostly changes hands during procurement and construction (apart from state capture)-results in lower level and quality of interventions. Corrupt water practices that directly involve the poor are mostly the poor allocating their limited household money to the bribery of officials. They do this for market reasons: entry (to access a service or asset), quality (to ensure its continuation at a certain level), and cost (to ensure they are paying the right price for it).
Furthermore, in practice the flows shown below are associated with a broad spectrum of water services and resources. The way the poor use/interact with the water sector, or the way water services and
158

Chapter 5 Making Public Spending Work for the Poor
resources comes to them, is also a determining factor in understanding the nature and scope of their corrupt transactions.
In Indonesia water supply, about 15 percent of the population obtain network drinking water from utilities, about 20 percent (and many of these will be poor) use utility water (obtained illegally or through other providers) and 65 percent use non-utility water (obtained from private suppliers, community- managed systems or provided by themselves). In this case, focusing anti-corruption efforts on improved management and efficiency of the utility would miss the majority of the poor (benefits for the poor may result, but are not guaranteed). Cleaning up the ‘illegal band’ (essential for the viability of utilities) probably hurts the poor in the short term if alternatives are not provided. However, a strategy that tackles the corruption in informal systems, community-managed systems and in the construction of wells and on- site sources would change the corruption field in which many poor live.
Whereas private-sector stakeholders interact with procurement officials and supervising engineers (or at the higher levels with senior bureaucrats and politicians), in their corrupt transactions the poor interact with the lowest level of officials. Many of these officials will be poor or near-poor themselves, using their public role to meet their own household needs. The poor also operate in a context where the most indigenous and powerful stakeholders (most committed to the status quo) generally determine who gets what. In situations where money needs to change hands for social leaders, it may be a poor household that acts as middleman. The interaction with the village elder, tribal leader or elected community leader is an important relationship in the corruption field of the poor. These figures extort or accept bribes from community members to facilitate action that will improve their household situation (be it bribing to have latrines emptied qr to divert water to irrigate crops). In rural areas, the poor also interact with quasi- government officials, such as village elites/leaders entrusted with public roles, over water resource management or the management and decision-making over water supply. In CDD or CDR water projects, poor households will also interact with facilitators and project officials (Woodhouse, 2002).
159

MAKING THE NEW INDONESIA WORK FOR THE POOR
I I
.i 1 ! 5
f e 2
Simplified flow of funds in the provision of water services and resources to the poor Where does the money go?
Government or
... Funds make it to poverty reduction
/community development I budgets
Funds make it to
irrigation assets and interventions
Water assets / services available to
Payment system Formal service payments fair and
iource: Adapted from Piummer, J. 'Making Anti-corruption Approaches Work for the Poor: Issues for consideration in the levelopment of prc-poor anti-corruption strategis", Stockholm International Water Institute (SIWI), Stockholm.
160

Chapter 5: Making Public Spending Work for the Poor
on Gender
Aligning village-level spending with the needs of the poor through the participation and empowerment of women
What Is a participatory approach In vlllage-level spendlng?
Participatory community budget formulation requires an inclusive dialogue of the poor, women and other social groups whose interests may be overlooked in traditional approaches to planning and budget formulation. A shift in local government attitudes towards building capacity in order to work more closely with the community is crucial if participatory budgeting exercises are to succeed.
The Importance of women In the process: Women area vital part of this process: involving them in needs assessments and proposal selection benefits not only the women but also the wider community, while failing to involve them can lead to project failure. The participation of women has also been shown to reduce corruption.
The lack of knowledge of facilitators: Many facilitators do not understand gender issues well, and even when women’s participation has been actively sought, development practitioners have generally assumed that the presence of women at a meeting is sufficient for them to be ‘represented’. Thus, better methods have had to be developed that enable women’s participation.
Examples of success: However, some programs, like KDP, have succeeded in making women’s participation meaningful. During a four- to six-month facilitated socialization and planning process, male and female villagers participate at the hamlet, village and sub-district levels. In order to ensure women actively participate, they are also active in dissemination activities and the selection and training of village facilitators. Special women’s meetings are held to prepare funding proposals and women are facilitated to participate in preparing, implementing and monitoring the resulting projects. Participatory auditing within KDP has successfully involved women and men in monitoring both the quality of service delivery and actual budgetary spending and, as a result, helped to reduce corruption of project funds.
The Asian Development Bank (ADB>assisted Gender Equity in Policy and Program Planning program implemented by the Women’s Empowerment Bureau in four districts is another example of actively supporting gender-balanced development. In this program, gender-sensitive facilitators introduced the concept of power relations into the community, while also encouraging women’s participation in development planning. It was found in at least one district, Wonosobo, that the gender sensitivity of facilitators was integral to enhancing women’s participation and ensuring equitable deve10pment.l~~ Conversely, facilitators who are unconcerned about process, power relationships and differences can easily reinforce forms of developmental practice that do little to address inequalities.
What do women want?
Women prefer community resources to be spent on health, education water and sanitation facilities. It is women, for example, who largely shoulder the burden of water collection. Time spent by women fetching water prevents them from availing themselves of educational opportunities and participating in income- generating activities, including paid labor.
Proposals submitted by female groups for support by KDP differ from those of male groups. In a six- month period from end-2004 to mid-2005, 39 percent of proposals from women’s groups were for water and sanitation, education and health-sector related activities. Conversely, 59 percent of proposals submitted by men and mixed groups were for transportation infrastructure.
161
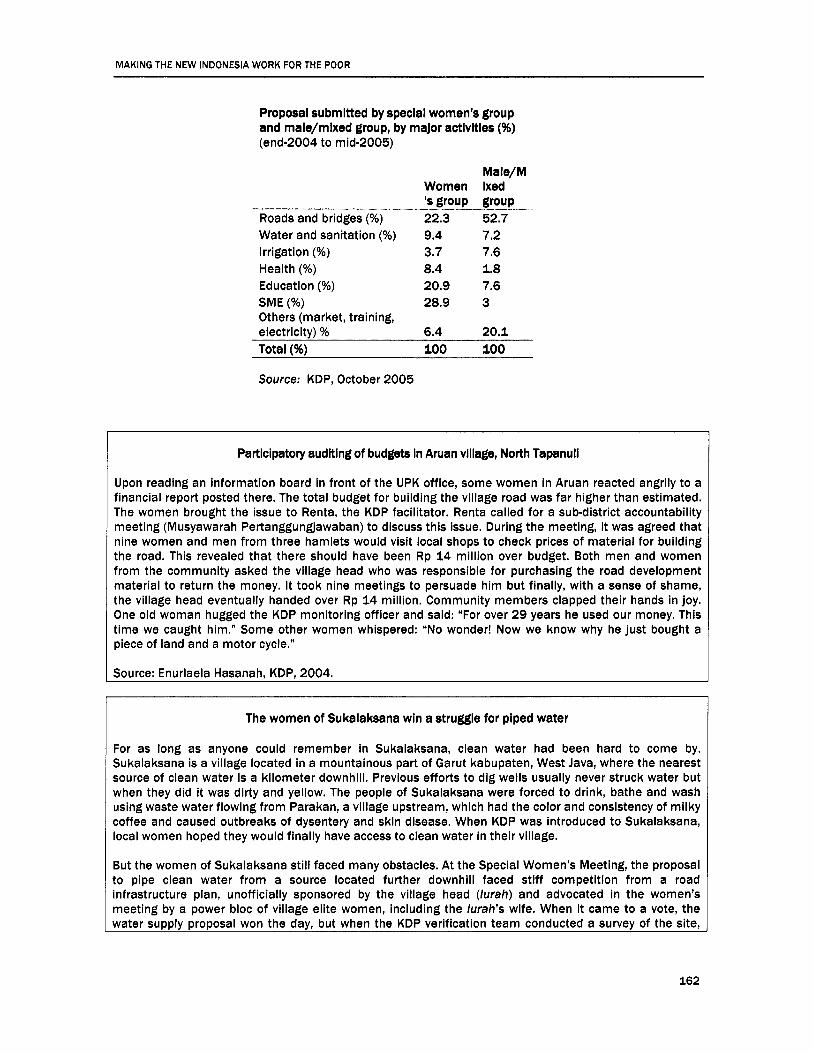
MAKING THE NEW INDONESIA WORK FOR THE POOR
Proposal submitted by special women’s group and maie/mixed group, by major activities (%) (end-2004 to mid-2005)
Women ‘s group
Roads and bridges (%) 22.3 Water and sanitation (%) 9.4 Irrigation (%) 3.7 Health (%) 8.4 Education (%) 20.9 SME (%) 28.9 Others (market, training,
Maie/M lxed group 52.7 7.2 7.6 1.8 7.6 3
Source: KDP, October 2005
Particlpatoty auditing of budgets In Aruan village, North Tapanuii
Upon reading an information board in front of the UPK office, some women in Aruan reacted angrily to a financial report posted there. The total budget for building the village road was far higher than estimated. The women brought the issue to Renta, the KDP facilitator. Renta called for a subdistrict accountability meeting (Musyawarah Pertanggungjawaban) to discuss this issue. During the meeting, it was agreed that nine women and men from three hamlets would visit local shops to check prices of material for building the road. This revealed that there should have been Rp 14 million over budget. Both men and women from the community asked the village head who was responsible for purchasing the road development material to return the money. It took nine meetings to persuade him but finally, with a sense of shame, the village head eventually handed over Rp 14 million. Community members clapped their hands in joy. One old woman hugged the KDP monitoring officer and said: “For over 29 years he used our money. This time we caught him.” Some other women whispered: “No wonder! Now we know why he just bought a piece of land and a motor cycle.”
I Source: Enurlaela Hasanah, KDP, 2004.
The women of Sukaiaksana win a struggle for piped water
For as long as anyone could remember in Sukalaksana, clean water had been hard to come by. Sukalaksana is a village located in a mountainous part of Garut kabupaten, West Java, where the nearest source of clean water is a kilometer downhill. Previous efforts to dig wells usually never struck water but when they did it was dirty and yellow. The people of Sukalaksana were forced to drink, bathe and wash using waste water flowing from Parakan, a village upstream, which had the color and consistency of milky coffee and caused outbreaks of dysentery and skin disease. When KDP was introduced to Sukalaksana, local women hoped they would finally have access to clean water in their village.
But the women of Sukalaksana still faced many obstacles. At the Special Women’s Meeting, the proposal to pipe clean water from a source located further downhill faced stiff competition from a road infrastructure plan, unofficially sponsored by the village head (lurah) and advocated in the women’s meeting by a power bloc of village elite women, including the lurah’s wife. When it came to a vote, the water supply proposal won the day, but when the KDP verification team conducted a survey of the site,
162

they found that water would never reach the village due to difference in altitude between the village and the spring’s position downhill.
Debate ensued as to whether the women should be allowed to alter the specifications of the proposal, with the lurah’s group agitating for the water supply to be dropped altogether. Finally, the village decided to hold the Special Women’s Meeting again and abide by the final results. Women were allotted seeds and asked to vote by placing their seeds in envelopes representing the various proposals. The result was resounding support for an altered water-supply system proposal, this time utilizing bore water and an electronic pump. As one woman said, “Just by putting our seeds into the clean water envelope, we were able to defeat the lurah’s desire to build a road.” Flushed with victory and in the face of the lurah’s displeasure, the women hinted that if the lurah was opposed the clean water project, then he need not have the facility connected to his own house!
Still, difficulties were not yet over for the village women. During the second visit of the verification team, concerns were raised that the bore water they sought to tap was of poor quality, and that the installation of the electric pump could be a long-term financial burden on the community. A third solution was proposed that would see water piped from a spring 3.5 km away. With the plans finalized, and KDP funds secured and dispersed, villagers set to work on building the pipeline.
As the midday call to prayer sounded on Monday 19 April 2004, clean water flowed into Sukalaksana. It was greeted by the cheers of villagers and the shrieks of children, who raced into the washhouse to play together in the water. Village elders gathered to douse themselves in prayerful thanks. Not to be outdone, the women, who had worked so hard to see their dreams realized, arrived en masse with buckets at the ready. The realization of their long-held dream saw some women moved to tears. After so much initial opposition, Sukalaksana women had defeated their detractors and brought water to their village. Today, the water flows as a symbol of their triumph over those who sought to dominate the decision-making process and deny women the expression of their true needs.
Source: Various KDP reports, World Bank. “Enhancing Women’s Participation. Learning from Field Experience”, KDP Project, 2003. PRA report for Wonosobo district, ADB’s TA on “Gender Sensitive Public Policy and Planning”, 2003.


Chapter 6 Making Social Protection Work for the Poor


Chapter 6: Making Social Protection Work for the Poor
“lmagine several mountain climbers scaling a cliff face who want protection from falling. One way to protect them would be to place a net at the bottom of the cliff to catch any climberjust before he hits the ground. Another would be to provide a rope, and a set of movable devices that can be attached to the cliff; as the climbers scale the cliff, they attach the rope at hlgher levels, so that if a climber falls, he falls only by the length of the rope ... the ‘safety net’ guarantees against a fall past an absolute level; the ‘safety rope’ guarantees against a fall of more than a given distance. ”
- Sumarto, Suryahadi, and Pritchett (2001)
I Introduction
Why understanding vulnerability is important to fighting poverty in Indonesia
Although Income poverty In lndonesla Is relatively low, vulnerablllty to Income poverty Is high. As discussed in the Chapter 3 on Understanding Poverty, while only 16.7 percent of the population fell below the national poverty line in 2006,147 a much greater share of households (49.0 percent) were living on or below US$2-a-day. This means that some 32 percent of the population lives between the national poverty line and the US$2-a-day line, a much higher share than any other country in the region.
In any given year, the risk that a large portion of households will fall below the poverty line, even If currently not poor, Is high In Indonesia. The clustering around the poverty line largely explains the high risk that, in any given year, a significant portion of households that were previously non-poor or near-poor can fall below the poverty line (Chaudhuri, Jalan and Suryahadi, 2002; Pritchett, Sumarto and Suryahadi, 2001 and 2002). Panel data from the Village Potential Survey (Podes) reveal that a substantial percentage of households move in and out of poverty. In the period directly after the crisis, from August 1998 to October 1999, 58 percent of respondents were poor at least once, even while the average poverty rate over the period was only 37 percent and only 17 percent of respondents were chronically poor (Pritchett et ai, 2001). More recent household income and consumption tracking also shows the same degree of movement in and out of poverty. Over 38 percent of poor households in 2004 were not poor in 2003 (see Table 6.1). Income and expenditure shocks, such as job loss, the failure of a business, a poor harvest, lost income from ill health and the costs of treating sickness, or a rise in basic commodity prices such as rice, can lead to these sudden changes in a household’s poverty level.
Table 6.1 Movements in and out of poverty, 2003-04
2004 Non-poor household Poor household Total
Non-poor HH (Row percent) (Col percent)
156,377,528 13,097,915 169,475,443 92.27 7.73 100.00 91.57 38.26 82.67
Poor household 14,396,615 21,138,941 35,535,556 8 (Row percent) 40.51 59.49 100.00
(Col percent) 8.43 61.74 17.33 8 Total 170,774,143 34,236,856 205,010,999
(Row percent) 83.30 16.70 100.00 (Col percent) 100.00 100.00 100.00
Source: Indonesia Poverty Assessment team, using Susenas panel data, 2003-04.
The real concern for policy-makers Is how households cope with Income shocks that throw them Into poverty (or deeper Into poverty). Without the right tools and assistance, households seeking to manage these shocks may take actions that lower the likelihood of emerging from poverty later. This sort of ‘bad coping’ typically consists of actions that diminish a household’s stock of human capitahuch as cutting spending on food and health, or pulling children out of schoo!-and, as a result, perpetuate a cycle of low
165

MAKING THE NEW INDONESIA WORK FOR THE POOR
earnings, chronic disadvantage and vulnerability to future shocks. Although closely related and part of a long-term poverty elimination agenda, the policy concern and recommendations to tackle vulnerability can have a separate, distinct rationale.
Today there Is a real opportunlty to seize the moment and set in place a welldesigned social protectlon system that can address the risks and vulnerabllltles faced by Indonesia’s poorer and more vulnerable households. A confluence of increased fiscal space and an increasing recognition that, even after recovery from crisis, there continues to be a critical need to protect the poor from high vulnerability, provides an opportunity today to put into place a well-designed social protection system. This chapter provides an overview of what the objectives of such a social protection policy might be, in the context of overall social risk management. It goes on to discuss the evolution and experience of social protection in Indonesia to date, leading to the recent changes being made by the government. It juxtaposes this against an empirical household risk and vulnerability assessment undertaken for this report. This assessment, of household needs in addressing actual risk and vulnerabilities shows a mismatch between needs and many existing social protection programs. it leads to implications for a restructured social protection policy. Section VI of the chapter therefore makes some recommendations on how to move towards a possible national social protection system that would make sense in the Indonesian context.
Given the wellestablished links between human capital and economic well-being, social protection Is a core part of development policies to flght poverty and increase equity. Although social contracts will differ widely between countries, social protection policies are generally intended to safeguard households’ investment in human capital. Social protection systems (comprising policy interventions, public institutions, and sometimes the regulation of private institutions) aim at preventing poverty and helping families manage shocks to income that can threaten their human capital.
Social protectlon to safeguard human capital Is also important for promoting and sustalnlng efficiency and growth. Where households do not have a sufficiently wide array of tools with which to insure against risks/losses, they are condemned to spend precious resources recovering from adverse shocks that could otherwise be put to productive use. Coping with certain shocks can impair households’ human capital or hinder further investment. When few options for mitigating the losses from shocks exist, households may be deterred from taking appropriate risks in their investment decisions in other areas, fearing the costs of failure of adopting a new, more productive technology, for example, or experimenting with a new crop. Since there are many risks to which private insurance markets cannot or will not respond, there is a clear role for public policy in augmenting the set of mitigation instruments available to households.
Social protection can be seen as social risk management. Individuals and societies can respond in a variety of ways when faced with the prospect of economic losses from shocks, such as natural disasters, sickness, sudden death, disability and unemployment. Social risk management is a concept encompassing three broad categories of responses to shocks: ex-ante prevention, mitigation, and ex-post coping. The challenge for households or societies is how, in the case of a ‘bad’ or shock state, income can be transferred from a ‘good’ or normal state period to the ‘bad’ or shocked state period to allow for consumption smoothing. There are effectively three ways in which this can be done: (i) risk-pooling (or market insurance), which pools risks across individuals and allows for the redistribution of consumption opportunities towards the ‘bad’ or shocked states at a price; (ii) saving (or self-insurance), which, while it does not involve risk-pooling and has no explicit price, does have an imputed cost of forgone consumption; and (iii) prevention, which lowers the probability of the bad state occurring but does not reduce the size of loss should one occur. Households that are unable (or choose not) to take preventative measures, or to insure themselves by saving or through risk-sharing structures, are forced to cope with the full cost of losses in the wake of shocks. According to the framework, individuals or households smooth consumption over good and bad states. Where risk-pooling is missing the individual is forced to smooth consumption using only savings and prevention. An array of instruments exists that households can make use of, to pool, save or prevent, in order to address risks. Table 6.2 provides examples of the array of instruments households have at their disposal, arranging these into ‘pooling, saving and prevention’. (See also Box 6.1 on a comprehensive insurance framework for theoretical perspectives on how the government can approach social risk management depending on size of loss, frequency and level of externalities involved.)
166

Chapter 6: Making Social Protection Work for the Poor
Table 6.2 Typology of Instruments for household rlsk management
Informal Formal
Inter-household or Communlty-network Provided by the Provided by Inter-famlly based market government
Preventlon (lowers the likelihood of a shock)
Saving (transfers resources from ‘good’ times to ‘bad’ times, but without pooling risks)
Rlsk-pooling (similarly transfers resources from ‘good’ times to ‘bad’ times, but compensates for differences in vulnerability between individuals)
Coplng (measures taken to deal with a shock-both savings and pooling-but that were not originally intended for this use)
Less risky production . Migration . Proper hygiene Proper nutrition
. Money under the mattress or in the household . Investment in human capital
D Intra-household transfers
. Pulling school- age kids out of school to work Selling household assets
in food or education (spending that builds human capital)
. Cutting spending
Community disaster preparation strategies, plans and structures Community level works to lower likelihood of disasters
Unregulated community level banks
Investment in social capital (rituals and reciprocal gift giving) Funeral societies Unregulated rotating credit schemes Religious or charity
Charity from neighbors Borrowing from unregulated money lenders
Privately provided education and primary/prevent ative health services Training
Savings accounts in regulated commercial banks Regulated micro- finance Financial assets Private insurance Severance (job protection) schemes
Borrowing from commercial banks
1 Public education . Public nutrition programs Public primary/prevent ative health care . Work-place safety regulation . Pollution controls . Mandated savings
0 Savings instruments provided by public banks
. Public pension . Public health insurance . Unemployment insurance . Other social security
D Healthcare provided by public hos pi t a Is directly . Public work safety net programs
= Emergency disaster relief Budget reallocations
Source: Based on Holzmann and Jorgensen, 2001, and Gill and Ilahi. 2000.
167
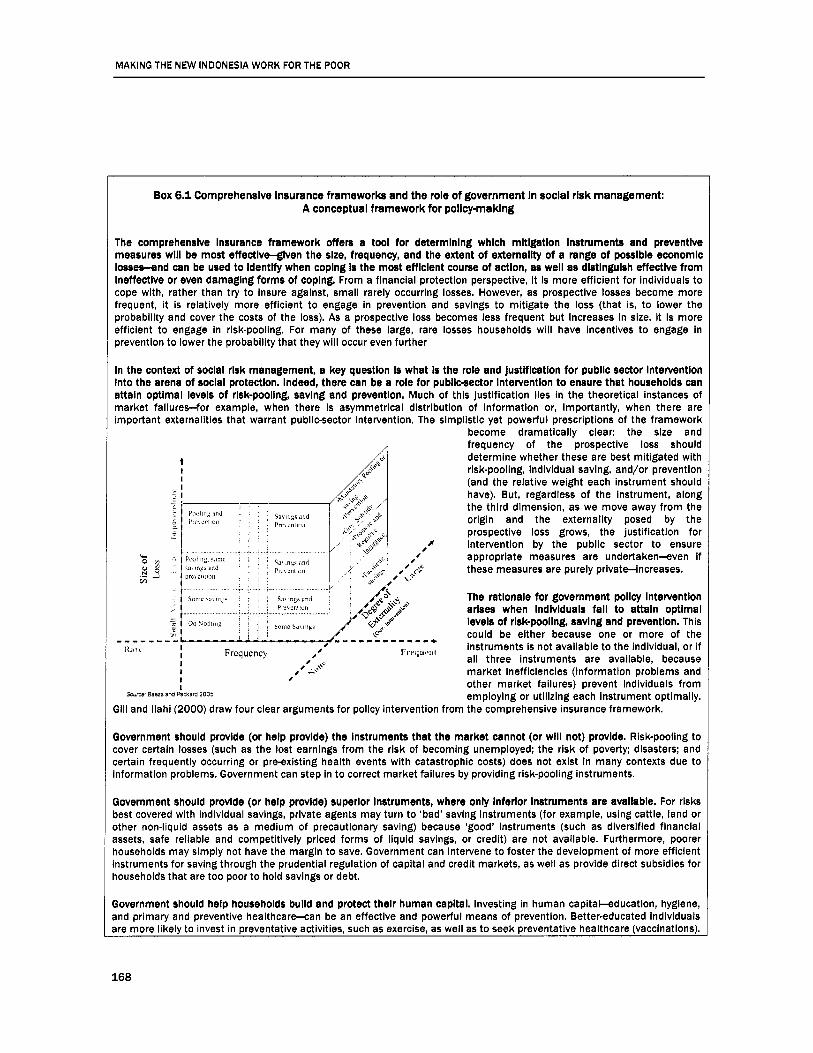
MAKING THE NEW INDONESIA WORK FOR THE POOR
Box 6.1 Comprehenslve Insurance frameworks and the role of government In social rlsk management: A conceptual framework for policy-maklng
The comprehenslve Insurance framework offers a tool for determlnlng whlch mltlgatlon Instruments and preventlve measures wlll be most effectlve-glven the slze, frequency, and the extent of externallty of a range of posslble economlc l ossewnd can be used to ldentlfy when coplng Is the most efflclent course of actlon, as well as dlstlngulsh effectlve from lneffectlve or even damaglng forms of coplng From a financial protection perspective, It Is more efficient for individuals to cope with, rather than try to insure against, small rarely occurring losses. However, as prospective losses become more frequent, it is relatively more efficient to engage In preventlon and savings to mitigate the loss (that is, to lower the probability and cover the costs of the loss). As a prospectlve loss becomes less frequent but increases in size, It is more efficient to engage in risk-pooling. For many of these large, rare losses households will have incentives to engage in prevention to lower the probability that they will occur even further
In the context of soclal rlsk management, a key questlon Is what Is the role and Justlflcation for public sector lnterventlon Into the arena of social protection. Indeed, there can be a role for publlc-sector lnterventlon to ensure that households can attain optimal levels of risk-pooling, saving and preventlon. Much of this justlficatlon lies in the theoretical instances of market failures-for example, when there is asymmetrical distribution of information or, Importantly, when there are important externalities that warrant public-sector lnterventlon. The slmpllstic yet powerful prescriptions of the framework
becdme dramatically clear: the slze and frequency of the prospective loss should determine whether these are best mitigated with risk-pooling, individual saving, and/or prevention (and the relative weight each instrument should have). But, regardless of the Instrument, along the third dimension, as we move away from the origin and the externality posed by the prospective loss grows, the justification for
0C intervention by the public sector to ensure appropriate measures are undertaken-even if these measures are purely privateincreases.
The ratlonale for government pollcy lnterventlon arlses when lndlvlduals fall to attaln optlmal levels of rlsk-poollng, savlng and preventlon. This could be either because one or more of the instruments is not available to the individual, or If all three instruments are available, because market Inefficiencies (Information problems and other market failures) prevent individuals from employing or utilizing each instrument optimally.
I-----------. , , ~ ~ , ~ , ~ . ~ ~ ,
Gill and llahi (2000) draw four clear arguments for policy Intervention from the comprehensive insurance framework.
Government should prwlde (or help provlde) the Instruments that the market cannot (or wlll not) provlde. Risk-pooling to :over certain losses (such as the lost earnings from the rlsk of becoming unemployed; the rlsk of poverty; disasters; and :ertain frequently occurring or preexisting health events with catastrophic costs) does not exist in many contexts due to information problems. Government can step in to correct market failures by providing risk-pooling instruments.
Government should provlde (or help provlde) superlor Instruments, where only lnferlor Instruments are available. For risks ,est covered with Individual savings, private agents may turn to ‘bad’ saving Instruments (for example, using cattle, land or 3ther non-liquid assets as a medium of precautionary saving) because ‘good’ instruments (such as diversified financial assets, safe reliable and competitively priced forms of liquid savings, or credit) are not available. Furthermore, poorer iouseholds may simply not have the margin to save. Government can Intervene to foster the development of more efficient nstruments for saving through the prudential regulation of capltal and credit markets, as well as provlde direct subsidies for iouseholds that are too poor to hold savings or debt.
lovernment should help households bulld and protect thelr human capltal. Investing In human capitakducation, hyglene, and primary and preventive healthcarMan be an effective and powerful means of prevention. Better-educated individuals are more likely to invest in preventative activities, such as exercise, as well as to seek preventative healthcare (vaccinations).
168

Chapter 6 Making Soclal Protection Work for the Poor
Healthier individuals are less likely to be unable to work, and more educated or better-trained workers may be less likely to suffer long-term unemployment. However, where credit is constrained, individuals may choose lower-than-optimal holdings of human capital in favor of assets with greater collateral value. To prevent Individuals and households from tilting their portfollos away from human capital, government can subsidize its acquisition through spending on education and health.
It Is usually better t o help households t o mltlgate losses than to cope wlth them. The instruments for individuals and governments to pool risks and save are not always available. The resources to take preventative measures are often scarce. Where individuals and governments are constrained, bad coping in the short run can result. Some prevention and insurance (risk-pooling and saving) is always desirable. Effective policy should place greater emphasis on enabling individuals to insure agalnst losses through risk-pooling and individual saving, and lower the probability of losses through prevention, rather than coping with losses after a shock.
In addltlon to helplng households manage thelr rlsks, government also has an important role to play in the management of risks at the ‘macro’ level. Governments can pool the risks of a limited (but growing) range of possible losses through private market Insurance, as well as through international, multi-lateral risk-pooling structures; ‘save’ by accumulating surpluses in good times to spend on social programs during bad times (using ear-marking, stabllization funds, countercyclical spending policies); and ‘prevent’ by practicing prudent monetary and fiscal policy, engaging in reforms that increase the efficiency and safety of factor markets-thus lowering the probability of crises-and by investing in increasing their administrative capacity.
ll The Evolution of Social Protection Institutions: From Universal Subsidies to Targeted Transfers
Similar to many lower-Income countries, Indonesia lacks a structured and coherent social protection system. East Asia in general and Indonesia in particular rely less on social protection instruments relative to other comparable countries. From the crisis to 2005, Indonesia’s social protection system was characterized primarily by (i) crisis-era safety net programs; and (ii) large commodity price subsidies and transfers, particularly through fuel products. Universal commodity price subsidies may be considered a ‘first generation’ social protection approach, having been the instrument of choice used by many developing countries in the 1960s and 1970s. The targeted programs undertaken during the crisis period may be considered as an attempt at ‘second generation’ type safety net programs. In Section 111, this chapter will argue that Indonesia may be ready to move to a ‘third generation’ system that is more comprehensive and matched to the actual risks and vulnerabilities faced by its more susceptible citizens.
The crisis-era safety net
The targeted poverty programs put Into place In Indonesia In the wake of the 1998 financial crisis were designed as a social protection response to the crisis. Prior to the crisis, the emphasis had been on broad- based poverty reduction programs. The events of 1998 led Indonesia to establish a broad social safety net (jaringan pengaman sosial, or JPS) set up to help poor households impoverished by the crisis (see Table 6.3). The JPS programs were designed more as temporary short-term safety net interventions than a long- term social protection system and aimed to ensure the continued access for the poor to affordable food, as well as health and education, through the crisis period. Many of these programs have remained entrenched in social policy since (a detailed JPS program review is provided in Annex VI.1). Initially funded primarily by donors, starting in 2001, the budgets for the existing programs were first complemented and later fully replaced by government funding.
The continued social safety net programs address a diversity of issues, but are low in coverage, institutionally fragmented and are not managed as one umbrella system. In the years prior to 2005, specific programs covered only a small number of the poor. They had been designed and implemented by a wide array of government agencies, with limited budgetary resources and little coordination. In 2003, the budgets allocated to the three principal targeted programs, namely Raskin (subsidized rice for the poor), educational scholarships and health cards, were around Rp 4.8 trillion, Rp 2.7 trillion and Rp 9 4 1 billion, respectively. Together these largest programs constituted only about 2.2 percent of total
169

MAKING THE NEW INDONESIA WORK FOR THE POOR
government expenditure. Moreover, in 2003 the scholarships program covered only 12.1 percent and health cards only 22.2 percent of households in the poorest quintile. Clearly, the JPS programs were failing to operate as an effective safety net for most of the poor.
Table 6.3 Indonesia’s crlslsera social safety net
Safety Net ObJectlve Speclflc Program
Food security Special Market Operation (operas/ pasar khosus, or OPK) program: sales of subsidized rice to targeted households, currently known as Raskin.
Employment creation ‘Padat Karya’: an uncoordinated collection of ‘labor-intensive’ programs executed by various government departments
Education
Health
Community empowerment
Scholarships to elementary, secondary and upper secondary school students and block grants to selected schools
Funding for: b Medical servlces b b b Family planning services b Nutrition b Midwife services
Regional Empowerment to Overcome the Impact of Economic Crisis (PDM-DKE): block grants directly to villages for either public works or subsidized credit
Operational support for health centers Medlcine and imported medical equipment
Source: Sumarto, Suryahadi and Widyanti, 2004.
Assessments of Individual programs point to some posltlve aspects, but raise questions over the abllity of previous safety net programs to respond to household needs from the standpoints of both effectiveness and efflclency. Pritchett et al (2001) found that the self-targeting ’labor-intensive’ public works programs succeeded in keeping many households out of poverty, but the fragmentation and efficiency of these schemes has been called into question. A more recent safety net programs evaluation (Sumarto, Suryahadi and Widyanti, 2004) was generally positive, but found that impact varied across programs. Earlier evaluations of the scholarships program found that although these reduced the chances of students dropping out of school during the crisis period, they were not effective in increasing the likelihood of transition to the junior secondary school level (Filmer et al, 2002). Raskin program evaluations found that the benefits accruing to an average beneficiary household were very low given the high cost of running the program (SMERU, 2005). The total subsidy received by all Raskin beneficiaries ranged between Rp 2.0 and Rp 2.7 trillion. This corresponded to only 42 percent to 56 percent of the program budget in APBN 2003, indicating high institutional costs for relatively low benefits. Health-card program evaluations have been relatively more positive, showing that the scheme led to increased utilization of public health centers in the period after the crisis (Pradhan et al, forthcoming).
The targeting performance of these safety net programs has also been inadequate. While households in the poorest quintile are the main objective group for these programs, they have access to only 3 1 percent of health cards, 39 percent of scholarships and about 29 percent of Raskin benefits (Susenas, 2004) (see Targeting in Section IV). Evaluations have found that, although participation in these programs is greater among lower income groups, participation of households in higher income groups is still substantial. There are two main reasons for this poor targeting performance typically cited in recent studies. First, the programs each had their own registries of the poor, which are created and run by separate institutions. The targeting of scholarships was usually handled at the provider level by school principals and school committees. The targeting of health cards was carried out by district health offices through community identification of the poor. Second, there were different targeting criteria employed in the programs. For instance, in the distribution of health cards, ‘chronic illness’ was often used as a criterion for eligibility, which does not necessarily correlate with income poverty. Third, and importantly, the clustering of households (especially in rural areas) around the poverty line, together with cultural norms about sharing, challenged efforts to target the poor. In the case of Raskin distribution, for example, it was commonly found that the subsidized rice was distributed evenly in communities due to: (i) community expectations
170

Chapter 6 Making Social Protection Work for the Poor
that benefits would be shared equally (bagi rata); (ii) lack of cash resources in poor households to cover the cost of rice (even highly subsidized rice); and (iii) a perception at the local level that the official list of the poor coming from higher government authorities does not accurately reflect the current status of the poor at the village level.
The fuel subsidy: a pillar of Indonesia’s social protection program in recent years
The fuel subsldy-a universal price subsidwepresented the biggest subsidy or transfer to households in recent years; it was, de facto, the centerpiece of Indonesia’s soclal protection scheme until 2005. By fixing fuel prices at subsidized levels well below world prices, the government effectively supported a transfer to fuelconsuming households, protecting them from fluctuations in world prices. Between 1998 and 2005, fuel subsidies averaged three-quarters of the total subsidies and transfers that constituted Indonesia’s social protection systemI4* (see Figure 6.la). Indeed, in the decade prior to 2005, the portion of Indonesia’s budget spent on universal fuel subsidies was similar in absolute and relative size (that is, compared with spending on education, health, targeted programs and infrastructure) to what many governments in middle-income countries spend on welfare and social in~urance.1~9 Seen in this light, the fuel subsidy could be historically considered Indonesia’s first-generation ‘social protection’ mechanism.
However, the fuel subsidy was regressive In nature, benefiting richer households that consumed more fuel far more than It did poorer households. As with commodity price subsidies in other countries, spending on fuel subsidies benefited mainly middle and higher income groups that consumed more fuel. Figure 6.1 depicts the regressive incidence of the fuel subsidy had the government not changed the domestic price of fuel in 2005. In total, the benefits accruing to the richest 10 percent from fuel subsidies were more than five times those accruing to the poorest 10 percent. The top 40 percent captured 60 percent of the subsidy.150 In 2005, an individual in the top decile was expected to receive Rp 551,000 annually in fuel subsidies on premium gasoline, kerosene and diesel. In contrast, an individual in the bottom decile would have received less than one-fifth of this amount at only about Rp 98,000. The total incidence of fuel subsidies on the poorest quintile was estimated to be only around Rp 5 trillion out of the total Rp 103 trillion spent on fuel subsidies in 2005. In addition, although the poor clearly benefited from the subsidy on kerosene, which is widely used as a cooking fuel, even the incidence of the kerosene subsidy was regressive. An equivalent direct transfer to the poor could have been accomplished at a fraction of the cost.
In 2005, the government took a bold move to reduce regressive fuel subsidies. The move was precipitated by the escalation in world oil prices along with a concomitant and ongoing reduction in domestic production capacity. The medium-term fiscal outlook certainly pointed to lack of fuel subsidy policy sustainability.l51 The government raised fuel prices in March 2005 by a weighted average of 29 percent, followed by a more dramatic increase in October 2005, when prices rose by an additional 114 percent. While in March 2005, the price of kerosene was left unchanged, in the October price rise the kerosene price almost tripled.152 The annualized budgetary savings from the 2005 October fuel price increase (as they apply to the 2006 budget) are estimated to be equivalent to some US$10.1 billion. Currently, the budgeted amount for fuel subsidies is down to some US$5.6 billioni53 (in contrast to the US$15.7 billion it would have been in 2005 without the October price increase). The October price increase impact, by decile, is also shown in Figure 6.1.1” The total short-term fuel price increase impact made up about 5.1 percent of per capita expenditure155 for the poorest decile and 6.2 percent of per capita expenditure for the richest decile. In the absence of any compensatory measures, it is estimated that the October price increases would have led to a 5.6 percentage point increase in the poverty headcount index; other factors being constant (see Chapter 5 on Spending for more details). The impact of the reduction in the fuel subsidy In March 2005 was mitigated by the Introduction of three programs. The compensation policy enacted shortly after the first fuel price increase in March involved reallocation of Rp 17 trillion towards programs targeting the poor in education, health and rural infrastructure (these three PKPS-BBM programs discussed in detail in Chapter 5). With the second wave of price increases in October 2005, the government took a markedly different step to compensate households. Anticipating a relatively greater negative impact on the poor and near-poor with the inclusion of kerosene in the October price liberalization (excluded in the first wave in March), the government opted for the introduction of a cash transfer, (subsidi langsung tunai, or SLT). With 19.2 million beneficiary
171

MAKING THE NEW INDONESIA WORK FOR THE POOR
households in 2006, this program is the largest ever cash transfer program in coverage and total volume of transfers. Each beneficiary household receives a Rp 300,000 transfer distributed quarterly (see Box 6.3).
An opportunity for the future
The establishment of a targeted cash transfer program signifies a shift from the generally Ineffective and inefficient blunt Instrument, that is, a general subsidy benefiting primarily the non-poor to a social protection regime that Is leaner and more focused on targeting poor and vulnerable households. The Unconditional Cash Transfer (UCT) program was designed as a temporary, one-year cash transfer program aimed at mitigating the impacts of the fuel subsidy. It makes sense to use the UCT program, as well as the health insurance component of the PKPS-BBM program, as stepping-stones to developing a social protection program for the future. As Indonesia moves forward to develop a comprehensive and coherent social protection system, it is important to ensure that government programs (which together, on an annual basis, currently account for the equivalent of about US$2.4 billion per year in reallocated funds from the fuel subsidy. See Annex V.5) are focused on addressing the actual risks and vulnerabilities faced by poorer Indonesians. Section Ill undertakes focused empirical analysis to ascertain exactly what these risks and vulnerabilities are, with a view to pointing to the implications for developing a social protection system for Indonesia that makes sense.
172
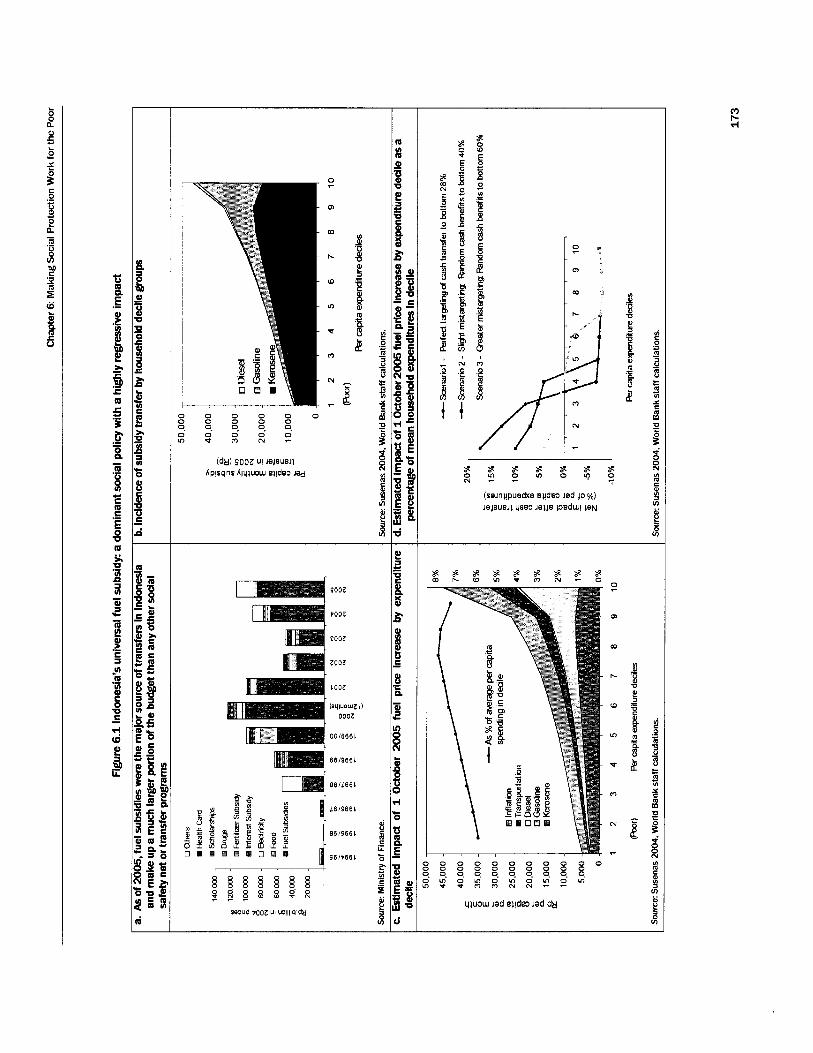
0 0 0 0 0 0 0 0 0 0 0
0 0 0 0. 0. 0. 0. 0.
1 0 P r n Z Z
0 - cs)
m
h
(D
10
P
m
N
7
5002
POOZ
EOOZ
2002
IO02
(sl(luowZ L) 0002
0016661.
661966L
9 6 l L 6 6 1
L61966I
9515661
S61P661
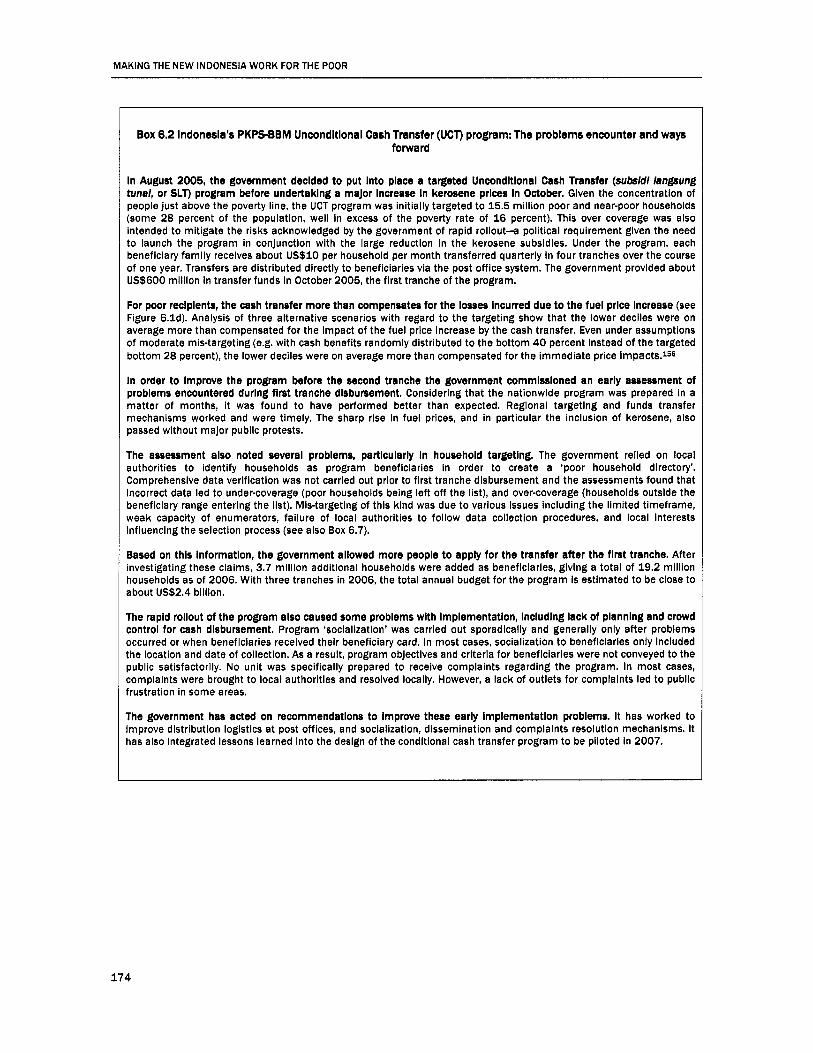
MAKING THE NEW INDONESIA WORK FOR THE POOR
Box 6.2 Indonesia’s PKPSBBM Unconditional Cash Transfer (UCT) program: The problems encounter and ways forward
In August 2005, the government declded to put Into place a targeted Uncondltlonal Cash Transfer (subsldl langsung tunel, or SLT) program before undertaklng a major Increase In kerosene prlces In October. Given the concentratlon of people just above the poverty line, the UCT program was initially targeted to 15.5 million poor and near-poor households (some 28 percent of the population, well in excess of the poverty rate of 16 percent). This over coverage was also intended to mitigate the risks acknowledged by the government of rapid rollout-a political requirement glven the need to launch the program in conjunction with the large reduction in the kerosene subsidies. Under the program, each beneficiary famliy receives about US$10 per household per month transferred quarterly In four tranches over the course of one year. Transfers are distributed directly to beneficiaries via the post office system. The government provided about US$600 mlllion in transfer funds in October 2005, the first tranche of the program.
For poor reclplents, the cash transfer more than compensates for the losses Incurred due to the fuel prlce Increase (see Figure 6.ld). Analysis of three alternative scenarios with regard to the targeting show that the lower deciles were on average more than compensated for the impact of the fuel price increase by the cash transfer. Even under assumptions of moderate mis-targeting (e.g. with cash benefits randomly distributed to the bottom 40 percent Instead of the targeted bottom 28 percent), the lower declles were on average more than compensated for the immediate price irnpa~ts.15~
In order to Improve the program before the second tranche the government commlssloned an early assessment of problems encountered durlng flrst tranche dlsbursement. Considerlng that the natlonwlde program was prepared In a matter of months, it was found to have performed better than expected. Regional targeting and funds transfer mechanisms worked and were timely. The sharp rise in fuel prlces, and In particular the inclusion of kerosene, also passed without major public protests.
The assessment also noted several problems, partlcularly In household targetlng. The government relied on local authorities to Identify households as program beneficiaries In order to create a ‘poor household dlrectory’. Comprehensive data verification was not carried out prior to first tranche disbursement and the assessments found that incorrect data led to under-coverage (poor households being left off the list), and over-coverage (households outside the beneficiary range entering the list). Mis-targeting of this kind was due to various Issues including the limited timeframe, weak capacity of enumerators, failure of local authorities to follow data collection procedures, and local interests influencing the selectlon process (see also Box 6.7).
Based on this lnforrnatlon, the government allowed more people to apply for the transfer after the flrst tranche. After investigatlng these claims, 3.7 million additional households were added as beneficiaries, giving a total of 19.2 million households as of 2006. With three tranches in 2006, the total annual budget for the program Is estimated to be close to about US$2.4 billion.
The rapid rollout of the program also caused some problems wRh lmplementatlon, lncludlng lack of plannlng and crowd control for cash disbursement. Program ‘sociallzation’ was carried out sporadically and generally only after problems occurred or when beneficiaries received their beneficiary card. In most cases, socialization to beneficiaries only included the location and date of collection. As a result, program objectives and criteria for beneflclaries were not conveyed to the public satisfactorily. No unit was specifically prepared to receive complaints regarding the program. In most cases, complaints were brought to local authorities and resolved locally. However, a lack of outlets for complaints led to public frustration in some areas.
The government has acted on recommendatlons to Improve these early lmplementatlon problems. It has worked to improve distribution logistics at post offices, and socialization, dissemination and complaints resolution mechanisms. It has also integrated lessons learned into the design of the conditional cash transfer program to be piloted in 2007.
174

Chapter 6 Making Social Protection Work for the Poor
111 Household Risk Management: Findings from a Risk and Vulnerability Assessment and Implications for Social Protection Policy
A first step In developlng a coherent social protection system In Indonesia is to understand the risks and vulnerabilities faced by households. That is the purpose of this section, which summarizes findings of a household risk and vulnerability assessment (presented fully in Annex V1.2). Such an analysis has previously not been undertaken in this country. The assessment consists of three parts. In the first, we present indicators of vulnerability to lower income and earnings capacity organized over the life cycle-a ‘vulnerability profile’-for different household groups of interest. In the second, we analyze the most important shocks reported by households and how they managed and/or coped with these shocks. In the last, we examine the availability of risk-pooling, savings and prevention instruments for mitigating losses, and whether these make a difference to how households fare, proxied by observed changes in spending on food in the wake of shocks (Packard, Alatas and Marliani, 2005).
Vulnerability profile
Risks to earnings capacity and Income are usually significantly greater among poor and near-poor households than among the non-poor households In the three highest qulntlles.i67 The main differences between poorer households during working life are labor market risk factors that increase vulnerability to shocks, namely informality, non-professional self-employment, and underemployment. Thus, the risk to incomes is one of the most significant factors differentiating them from the non-poor (see Annex V1.2, Appendix Table 6.1.V).
Moreover, factors that pose risks during Infancy, early childhood and among school-aged children are significantly more frequently observed among the poor than among the non-poor. These risks- malnutrition, lack of immunizations and dropping out from schoo!-at the earliest stage of the life-cycle can increase the likelihood of, and perpetuate, chronic disadvantage. Higher risk factors among poorer households persist into the latter teens and early working life, and in adulthood manifest in higher rates of incomplete education, underemployment, informal employment, non-professional self-employment and reported disability.
The poor and near-poor have similar profiles of risk directly related to the labor market and employment. There are no significant differences in the inactivity and unemployment rates between the poor and near- poor. The only significant differences between poor and near-poor households are in the risks faced by children. Poor children have less pre-natal healthcare, a higher propensity to malnutrition and higher drop- out rates than near-poor children. In contrast (but similar to the poor), the near-poor generally have a markedly different risk profile to the non-poor: the only similar risk profile of the near-poor and non-poor is the self-employment rate.
Rural households show a greater degree of vulnerability than urban households do at almost every stage of the life cycle. Rural households appear more vulnerable: risk factors at various points in the life cycle are higher among rural households than among urban households. Rural households have higher rates of unattended birth, higher drop-out rates, and higher incidence of child labor. Some important exceptions to this general pattern are inactivity among 16 to 25 year-olds (neither working nor studying), unemployment among this age group and unemployment among adults aged 26 to 55, which is consistently higher among urban households. This may reflect the ‘luxury good’ nature of unemployment in Indonesia, particularly among urban groups, found by others (Alatas et al, 2006; Alisjahbana and Manning, 2005).
Gender Is also an Important determinant of household vulnerability. There are again significant differences in risk factors during the earliest stage of the life cycle between households headed by men and those headed by women. The direction (i.e. whether male-headed households fare better than female-headed households, and vice versa) and magnitude of significant differences in risk vary by
175

MAKING THE NEW INDONESIA WORK FOR THE POOR
indicator. However, some general patterns in the vulnerability profiles emerge: there is a higher incidence of mothers failing to receive prenatal care in households headed by women; school attendance is lower: and the incidence of child labor is higher in households headed by women. There are also significant differences between households headed by men and women of the same income group. For instance, among poor and near-poor households school attendance at the primary and secondary level is lower in households headed by women. On the other hand, among poor households, young children are less likely to be sent to preschool and the incidence of unattended births is higher among households headed by men.
However, the elderly in poorer households do not appear to be slgniflcantly more vulnerable than those in non-poor households. The risk factors that typically provoke concern among policy-makers, such as the elderly living alone, labor-market participation, unemployment and disability, are not significantly greater among the elderly poor and near-poor. The main indicator of vulnerability in old age (over 65), the elderly living alone (or accompanied only by their spouse), actually increases among higher income groups. Fewer elderly in lower income groups-the near-poor and the poor-live alone. Unemployment among the elderly is also highest among non-poor households. An exception to this general finding is underemployment among the elderly, which is higher among poorer households. There are no significant differences in the incidence of permanent disability among the elderly between any of the household groups. Even among those aged 55 to 64, there are no significant differences in risk factors between poor and near-poor households except for underemployment.
Nature of shocks and coping mechanisms
Three types of reported shocks stand out among all households in Indonesia: the ranking of reported shocks (Le. from most frequently reported to least frequently reported) is strikingly similar across all households (see Table 6.4 copied from Annex V1.3 Model 2). The most frequently reported are systemic or ’covariate’ losses from changes in government regulations (such as increases in the price of subsidized goods, such as fuel and rice). The second most commonly reported shocks are ‘economic risks’ or losses in earnings that could be covariate or idiosyncratic to the household. More typically, idiosyncratic shocks are reported third, with losses from adverse health events ranked highest and uniformly more frequently reported than even unemployment.
Indonesian households are more likely to use different forms of saving to solve the problems caused by these shocks than other forms of risk management. In particular, the rural and urban poor and near-poor households are more likely to use ‘saving’ mechanisms, such as borrowing money and reducing household expenses over ‘pooling’ mechanisms, such as seeking help from family and asking another family member to work. Two-thirds of urban male-headed poor households used saving mechanisms. Among different forms of ‘saving’, recourse to credit/borrowing and actual financial savings are more frequently reported than the selling or pawning of goods or cuts in household spending (see Table 6.4).
However, selling household goods and cutting spending are more frequently reported among poorer groups, raking concern that poorer households may be forced Into bad coping (see Table 6. 5). Around 20 percent of rural poor female-headed households claimed that they reduce their household expenses in coping with shocks. Notably, the poor and near-poor are more likely to report asking household members who were not previously working to enter the labor market. Around 10 percent of urban poor households stated that they asked household members to work, while the corresponding figure for non-poor is just 7 percent. Similarly, in rural areas the gap between poor households and non-poor households is also around 3 percent, with 11 percent of poor households relying on ‘bad coping’ mechanisms, such as asking members, most notably children, to work, and 8 percent of non-poor households relying on bad coping mechanisms.
The high recourse to saving rather than riskoollng mechanisms is probably due to the lack of access to risk-poollng instruments, either formal or Informal, among households. The lack of risk-pooling at households’ disposal may be driving the dominant recourse to saving instruments-and worryingly, the recourse to spending cuts that is uniformly reported by poor and near-poor households with greater
176

Chapter 6 Making Social Protection Work for the Poor
frequency. Cuts in expenditure or increases in household labor supply after a shock are to be expected. The concern from a social protection perspective is that these cuts may be in investment in human capital, and that those being deployed into the labor market are children who would otherwise be in school.
The various forms of coping and Instruments used to cope across poor, near-poor and non-poor households differ, but do so in an expected fashion. Table 6.6 catalogues the mitigation and coping instruments captured in the Susenas surveys, using the ’risk-pooling, savings and prevention’ typology presented in the conceptual framework section. Forms of prevention, such as safe water and sanitation, increase with income, as do the coverage of traditional social insurance and the actual receipt of pensions. The poor and near-poor are less likely than the non-poor to hold savings in financial institutions but, as discussed previously, are observed to borrow money, and sell and pawn household assets, more frequently than the non-poor.
Impact of shocks
Reported shocks have a significantly negative impact on household food spending and the magnitude of this impact varies greatly across Income groups. This finding is the result of regression analysis (Appendix Table 6.3 Model 2 and Appendix Table 6.3 presented in Annex V1.2), which examines the impact of reported shocks on investment in human capital (proxied by changes in household spending on food). Food spending by poor households is more negatively affected by a wider range of shocks, such as economic and health losses, than for near-poor and non-poor households. However, near-poor households experienced cuts in food spending of the greatest magnitude.
The severest cuts in food spending among poor households are among those who reported losses from conflict, natural dlsaster and economic risks (grouped together), followed by poor households faclng economic shocks, and then by those facing health shocks. The largest cuts in food spending were experienced among near-poor households that reported this set of losses (see Annex V1.2). These were followed in severity by cuts in food spending experienced in poor households reporting economic losses alone, and then those reporting losses from health factors alone. Again, households that reported losses in all income groups experienced significant cuts. To put the magnitude of these cuts into perspective, while poor households experienced falls in food-spending of up to 26 percent (depending on the type of shock they experienced), and near-poor households experienced a decrease of 52 percent, food-spending of non-poor households that reported shocks fell by only 5 percent.
Withdrawal of financial savings, such as the sale of household assets, does not prove adequate: it falls to prevent a decline in food spending In the face of shock. Recourse to forms of ‘saving’, such as withdrawal of actual financial savings and pawning, was in the case of some shocks found to be positive, but in the case of others associated with a decrease in food spending. The sale of household assets is unambiguously associated with a decrease in food spending, notably so among near-poor households. The withdrawal of financial savings is to be expected in the wake of a shock, and the sale of household assets could be deemed ‘bad coping’ depending on what these assets are. In Indonesia, recourse to the sale of assets appears to be at the very least ‘ineffective coping’, particularly for the near-poor but also for the poor. Such a release of savings does not succeed in preventing cuts to spending on food following the shock.
177
MAKING THE NEW INDONESIA WORK FOR THE POOR
Formal forms of risk-pooling, such as social safety net programs, have not been successful in mitigating shocks, while informal risk-pooling instruments, such as informal household transfers and rotating credit schemes, have had more success. The effect of social safety net programs (i.e. the Raskin subsidized rice program, education scholarships and health-card coverage) and public healthcare, where significant, were consistently associated with cuts in spending. Pensions were found to be significant only among non-poor households. The effects of informal forms of risk-pooling were also found to be significant, and the nature of their impact was mixed. However, on balance money transfers, food transfers and payments from Arisan-a community-level, rotating credit scheme-were associated with a positive change in food consumption.
178

- m c
to
0 I $ 8
B $ 8
c z n
u I I
b a
- m c co p $ 8
f
K Z Q r r
8 a
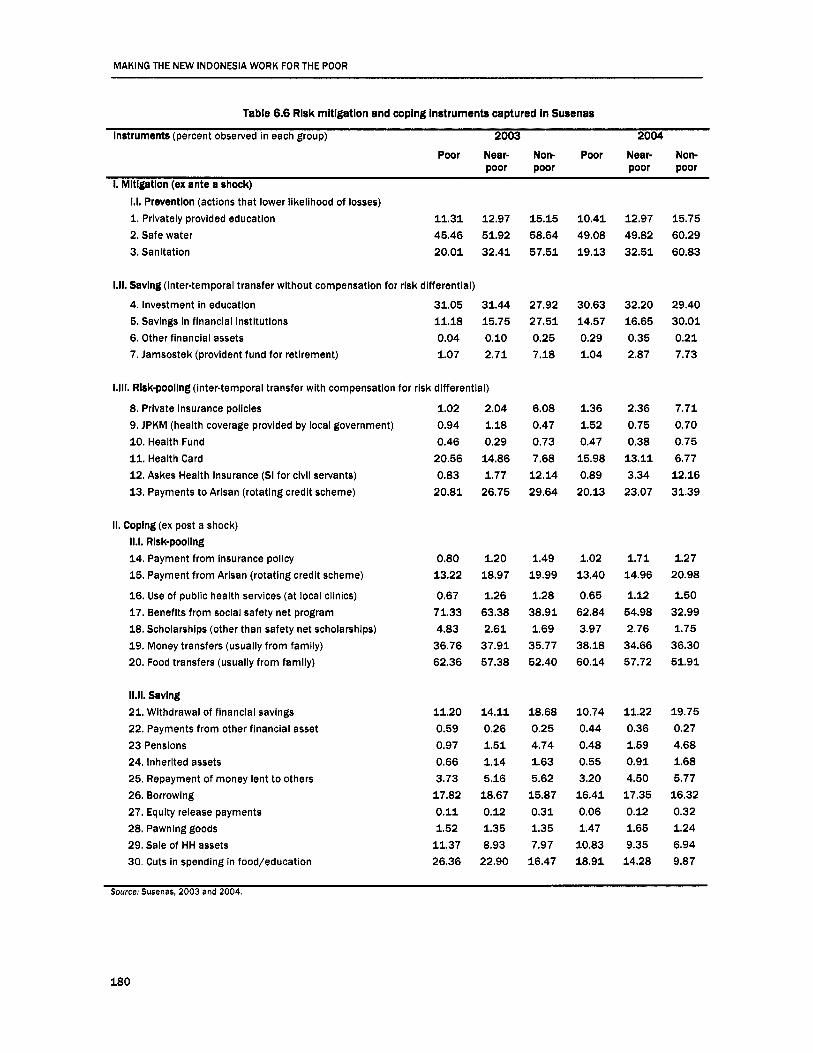
MAKiNG THE NEW iNDONESiA WORK FOR THE POOR
Table 6.6 Risk mitlgation and coping instruments captured in Susenas
Instruments (percent observed in each group) 2003 2004
Poor Near- Non- Poor Near- Non- poor poor poor poor
I. Mitlgatlon (ex ante a shock) 1.1. Prevention (actions that lower likelihood of losses) 1. Privately provided education 11.31 12.97 15.15 10.41 12.97 15.75 2. Safe water 45.46 51.92 58.64 49.08 49.82 60.29 3. Sanitation 20.01 32.41 57.51 19.13 32.51 60.83
1.11. Saving (inter-temporal transfer without compensation for risk differential)
4. investment in education 31.05 31.44 27.92 30.63 32.20 29.40 5. Savings in financial Institutions 11.18 15.75 27.51 14.57 16.65 30.01 6. Other financial assets 0.04 0.10 0.25 0.29 0.35 0.21 7. Jamsostek (provident fund for retirement) 1.07 2.71 7.18 1.04 2.87 7.73
1.111. Risk-pooling (inter-temporal transfer with compensation for risk dlfferentlal)
8. Private insurance policies 1.02 2.04 6.08 1.36 2.36 7.71 9. JPKM (health coverage provided by local government) 0.94 1.18 0.47 1.52 0.75 0.70 10. Health Fund 0.46 0.29 0.73 0.47 0.38 0.75 11. Health Card 20.56 14.86 7.68 15.98 13.11 6.77 12. Askes Health Insurance (SI for civii servants) 0.83 1.77 12.14 0.89 3.34 12.16 13. Payments to Arlsan (rotating credit scheme) 20.81 26.75 29.64 20.13 23.07 31.39
II. Coplng (ex post a shock) 11.1. Rlsk-pooling 14. Payment from insurance poiicy 0.80 1.20 1.49 1.02 1.71 1.27 15. Payment from Arisan (rotating credit scheme) 13.22 18.97 19.99 13.40 14.96 20.98
16. Use of public health services (at local clinics) 0.67 1.26 1.28 0.65 1.12 1.50 17. Benefits from social safety net program 71.33 63.38 38.91 62.84 54.98 32.99 18. Scholarships (other than safety net scholarships) 4.83 2.61 1.69 3.97 2.76 1.75 19. Money transfers (usually from family) 36.76 37.91 35.77 38.18 34.66 36.30 20. Food transfers (usually from family) 62.36 57.38 52.40 60.14 57.72 51.91
11.11. Savlng 21. Withdrawal of financial savings 22. Payments from other flnanciai asset 23 Pensions 24. Inherited assets 25. Repayment of money lent to others 26. Borrowing 27. Equity release payments 28. Pawning goods 29. Sale of HH assets 30. Cuts in spending in food/education
11.20 0.59 0.97 0.66 3.73 17.82 0.11 1.52
11.37 26.36
14.11 0.26 1.51 1.14 5.16 18.67 0.12 1.35 8.93
22.90
18.68 0.25 4.74 1.63 5.62 15.87 0.31 1.35 7.97 16.47
10.74 0.44 0.48 0.55 3.20 16.41 0.06 1.47 10.83 18.91
11.22 0.36 1.59 0.91 4.50 17.35 0.12 1.65 9.35 14.28
19.75 0.27 4.68 1.68 5.77 16.32 0.32 1.24 6.94 9.87
Source: Susenas, 2003 and 2004.
180

Chapter 6 Making Social Protection Work for the Poor
Implications for developing a social protection system
Several implications can be drawn from our assessment of household vulnerability and risk management that are useful in designing effective social protection policies for Indonesia.
First, given the similarities between the poor and near-poor, it is important to recognize that In addressing broad risks and vulnerabilities, both these groups should be considered. indeed, this section showed that while poor households experience cuts in food spending from a wider range of shocks, the severest cuts (of greatest magnitude) in the wake of shocks are observed among near-poor households. Consistent with these results, Chapter 3 on Understanding Poverty revealed that inability to manage shocks explains up to 1.4 percentage points of the poverty rate. Clearly, shocks are a problem not only for the poor but also for the near-poor, and could be leading to coping mechanisms that have longer-term consequences than mere movements in and out of poverty.
Second, both the vulnerability profile and assessment of the nature of shocks point to four major sources of vuinerabiilty that may need to be the focus of any social protection scheme in Indonesia:
Risks to earnings capacity and income are significantly greater among poorer (poor and near-poor) households. Labor-market risk factors, such as reliance on informal sector, non-professional self- employment, and underemployment increase vulnerability to shocks among the poor. The risk to income shocks is one of the key factors differentiating the poor and near-poor from the non-poor. Programs may need to be considered that address idiosyncratic or covariate shocks to household incomes of these poorest households
There is evidence of relatively higher r i s k to children's future earnings ability and welfare following shocks among poor and near-poor households. This may indicate that the opportunity costs of undertaking preventative healthcare, and sending and keeping children in school, could be high. In contrast to acute shocks, however, the potential losses wrought by these risk factors are likely to manifest themselves gradually in the form of chronic disadvantage. Programs intended to assure at least basic healthcare for mothers and children; minimum nutrition requirements; and, preventing poorer households from pulling their children from school, could help address this dimension of vulnerability.
Health shocks are a partlcuiariy important source of vulnerability among poorer households in Indonesia. Health shocks are uniformly identified as one of the major idiosyncratic risks and shocks that households face. A comprehensive social protection system would need to consider how to address this issue.
A further major self-reported shock reported by households themselves is 'losses from government regulations." Further analysis would be required to disentangle what is meant by this. However, in the broadest terms it would follow that the maintenance of the terms of trade (or cost of living) for poor households would be a key factor. Hence, maintenance of macroeconomic stability and price stability of key commodities consumed by the poor (such as rice) would be important, while dramatic increases in prices would be expected to have an immediate negative impact. Likewise, the uncertainty of government regulations might also be considered a risk factor by households. Policy stability is usually highly valued in terms of household security. These factors may lie beyond the remit of a social protection program per se but are important aspects in the broader strategy for social protection and mitigation of risks and vulnerabilities, as per the framework put forward earlier.
Third, there Is little evidence that the risk factors that arise with ageing contribute to household vulnerability. The rate of reported disability in old age is relatively uniform across all income groups; labor force participation and unemployment among the elderly is highest among the non-poor; and most poor and near-poor elderly live in households with working-age family members. In light of this finding, the emphasis given to the risks associated with ageing in recent efforts to create a national traditional social security system seems misplaced.
181

MAKING THE NEW INDONESIA WORK FOR THE POOR
Fourth, greater access to safe, competitively provided financial forms of saving, and formal risk-pooling Is likely to augment household risk management considerably. (See section on: Connecting the Poor to Financial Services in Chapter 4 on Growth for more detailed recommendations on this sector.) The incidence of shocks to households, while widespread, leads to the most severe cuts in food spending among poor and near-poor households, whose preponderant reliance on savings still does not permit adequate mitigation of shocks. Immediate, acute losses, both systemic (regulatory changes, sudden economic shocks, unemployment) and idiosyncratic (again unemployment, other earnings losses, adverse health events) are widespread and reported by all types of households. However, as discussed above, these shocks lead to more severe cuts in food spending in poor and near-poor households. Households rely heavily on forms of saving in the wake of shocks. Recourse to financial savings is widespread, but the poor and near-poor rely more heavily on non-financial forms of savings, such as pawning and the sale of household assets. While these actions may or may not prove to be ‘bad coping’, they are not fully effective in preventing cuts in food spending. Formal risk-pooling instruments are found to be effective, but only for the non-poor. This reflects the very low coverage of traditional social insurance and private insurance policies among the poor and near-poor. However, where available, informal risk-pooling mechanisms help households to manage these losses better. Households could clearly benefit from better instruments to augment risk management. However, to be really effective, publicly-provided formal risk-pooling would have to take an institutional form that is very different from the current highly structured, institutionally intensive, pay-roll-tax financed models, which do very little for Indonesia’s most vulnerable.
IV Towards a National Social Protection System that Makes Sense for Indonesia
There is substantial Interest among policy-makers In the creation of a national social protection system and now Is a prime opportunity to develop such a system. Interest in social protection is driven by at least two recent factors touched on to some extent in earlier sections of this chapter. These are: (i) the reduction in the universal fuel subsidies that generated enormous budget savings for the government and a desire to channel these savings towards more effective poverty reduction programs; and (ii) concern over signs of a return to an ad hoc, fragmented approach to the design and implementation of poverty programs in the post-crisis recovery period. There are also some concerned about the Social Security Law (Law No. 40/2004) that nominally extends coverage of payroll-tax-financed social insurance nationally, with no consideration of institutional capacity, little regard for the losses that pose the greatest risks to Indonesian households, and potentially unsustainable fiscal costs.
The government Is right In wanting to establish a coherent and coordinated social protection system that effectively augments the set of options households have to manage shocks and helps In the broader policy drive to eliminate poverty. The readiness to revise the social protection system acknowledges important facts about current social protection policies and programs, including targeted social assistance, traditional social insurance programs, and the once dominant universal fuel subsidies. Namely, that these forms of social protection have been to varying degrees expensive and regressive, have done little to address vulnerability, and could do much more to bring the poor out of poverty as part of a broader poverty reduction strategy. Indeed, it is important that such a system is relevant to the shocks that most threaten the poor and near-poor, and is institutionally appropriate for Indonesia. For this purpose, Section Ill assessed vulnerability, shocks and risk management at the household level. This provides pointers to policy-makers on the type of social protection system that would be most beneficial to Indonesian households given the risks they face, the losses they most frequently report, the set of instruments within their reach, and the instruments that would be beneficial but are currently out of reach, particularly of poor and near-poor households.
It Is important to clarify the Objectives of various social protection policies and programs as dlstlnct4ut not necessarily separate f r o w h e wider set of policies for reducing poverty. As stated earlier, the objectives of Indonesia’s crisis-era social safety net (JPS) are generally well aligned with internationally recognized goals of social protection policy: (i) to alleviate the poverty of the current poor, by raising their consumption level; (ii) to prevent the near-poor from falling into poverty; and (iii) to help households-both
182

Chapter 6: Making Social Protection Work for the Poor
near-poor and non-poor-mitigate the fall in income in the wake of shocks. The three objectives are sound and in line with what social protection systems are commonly expected to achieve. However, the current structure of the safety net fails to differentiate these objectives. From purely the standpoint of helping households manage risks to their human capital, with regard to the objectives, (ii) and (iii) are thus distinct from (i), which is a more generic objective of Indonesia’s overall poverty reduction strategy. This has led to a misalignment between each objective and the instruments the government deploys to achieve each objective. The performance of past social safety net programs has been hindered by a lack of clarity and separation of these objectives of a social protection system, and where these may at times even diverge from purely poverty-elimination objectives. For example, while the structures of some of the component programs of the safety net are best suited to raising the consumption of the current poor, they do not perform well in keeping the near-poor out of poverty. Looking ahead, as policy-makers explore options for a new social protection system, although the three objectives listed above are adequate, greater clarity on how each is best pursued is required.
Different objectives are better pursued with different instruments. The programs that are best suited to tackling the determinants of (and cover) losses that manifest over a longer period (such as the damage done by child malnutrition, lack of immunization, etc) are very different from the programs that will most effectively cover sudden, acute losses (such as unemployment, disability or losses from health events). The specific instrument deployed (risk-pooling, saving or prevention) to cover a given prospective loss (job- loss, sickness, etc) should reflect the nature of the loss (frequent or rare: small or large; purely individual or wider external impact). Moreover, the logistical design of these instruments (targeting method, etc) should also match the losses that they are intended to cover.
There are several critical areas on which policy-makers can immediately focus their efforts towards establishing a national social protection system that makes sense for Indonesia today. First, there is clearly a need for more effective, publicly provided risk-pooling instruments to augment household risk management options, given the limited reach of private formal risk-pooling and the nature of the risks (under-employment, unemployment, health losses) that should be covered. Second, there is also evidence that households would benefit from more efficient provision of privately provided risk-pooling and savings instruments, particularly sophisticated, safe and competitively priced financial instruments. Third, to a great extent the chronic disadvantage that makes poor and near-poor households more vulnerable to shocks could be addressed with more extensive and effective prevention efforts. In the remainder of this section, we discuss the policies and programs the government should consider to address the first and third areas directly.15*
In particular, given the risks and vulnerabilities outlined in the previous section, there Is merit to Indonesia considering a four-pronged approach to a social protection strategy, which would build where possible on existing programs and address the actual risks and vulnerabilities faced by the poor. The risk and vulnerability assessment (RVA) outlined in this chapter shows that households are most affected by catastrophic (and covariate) shocks best covered by simply designed, broad, national-level risk-pooling instruments, rather than sophisticated closed forms of traditional social insurance. Indeed, the RVA pointed to three broad risk and vulnerability factors that Indonesia should consider when developing its social protection system. The large-scale social insurance system envisioned by the National Social Security Bill would be less of a priority from this standpoint.
0 A conditional cash transfer program (‘cash for education and health’). The objective of such a program would specifically be to address the findings on the risk factors that appear to be hindering human development outcomes among the poor due to their bad coping mechanisms for shocks, and particularly those that hinder children’s development (e.g, through cuts to healthcare and education spending).
0 A workfare program (‘cash for work’). One of the biggest risk factors to poor and near-poor households alike was shocks to their incomes-especially given their vulnerabilities to the particularities of informal sector employment, self-employment, etc. A workfare program would have as an objective the reduction of this risk factor.
183

MAKING THE NEW INDONESIA WORK FOR THE POOR
0 Health insurance. One of the most important risk factors to be consistently reported by poor and near- poor households is health-related shocks, such as reduced spending on regular healthcare for children (as opposed to actual health shocks, such as illness of a family member). Thought is required on how best to address this risk factor with an appropriately efficient and targeted program.
Rice price stabliizatlon. Maintaining stable rice prices is very important for the poor, but the current system for preventing large increases in the price is seriously flawed. The most effective way to prevent large increases in rice prices would be to allow the general importation of rice subject to a low tariff.
0
Related to this, In developing a new system that focuses on actual risks and vulnerabllltles, the government should also consider which existing ‘social protection’ or ‘safety net’ programs It may need to cut. It will be important to consider refining existing programs to support the development of the above programs or to address the risks and vulnerabilities identified in another manner. A possible phasing-out of some existing programs may be required in order to ensure a streamlined social protection system. From the fiscal standpoint, a consolidated and comprehensive social protection system with a few major programs can also improve institutional coordination, cost-effectiveness and program efficiency.
Conditional cash transfer program
Indonesia’s move to a monetized cash transfer system Is a step in the right direction away from regressive and Inefficient commodity subsidies. A shift to cash transfers, such as the UCT program recently instituted in Indonesia, is important because it allows households to simultaneously address their immediate income needs (admittedly, an objective and feature of risk-pooling) and-because cash-in-hand is fungibl-pend in areas that can strengthen their human capital (whether these be investments in improved nutrition, more primary health attention, or keeping children in school) and thus lower their vulnerability to future shocks (Le. prevention). Cash transfers have been shown to be more efficient and effective than transfers in kind (see Box 6.3). Indeed, even after reductions in the fuel subsidy, Indonesia can go even further in this direction by monetizing other commodity price subsidies, such as the current subsidies on fertilizer and rice for the poor, and reducing distortions in market prices.
184

Chapter 6 Making Social Protection Work for the Poor
Box 6.3 The emergence of cash transfers as an Instrument of soclal pollcy In developlng countries Countries at all levels of development and Income have used a variety of Instruments to compensate households for prlce changes, to help them to manage economic shocks, and to alleviate the plight of poor households. In developed countries, the use of cash has been more prevalent in temporary or permanent assistance programs and unemployment subsidies. In developing countries, cash transfers are less prevalent and the preferred means are broad prlce subsldles on the products that the poor consume, or for In kind (mainly food) transfers. The rationale for preferring these mechanisms over cash transfers is somewhat paternalistic, and rest on a fundamental distrust of household consumption decisions, particularly the capacity of the poorest households to make sound decisions that will lead to eventual welfare improvements. For example, since cash is fungible, in kind food transfers are believed to guarantee food consumption and to deter ‘frivolous spending’ on goods or spending behavior that society deems undesirable, such as alcohol, tobacco and gambling. However, none of these claims has been supported by strong evidence. In fact, quite to the contrary, the more traditional methods used by governments concerned with helping households manage risks and poverty can lead to worse outcomes. Universal price subsidies are typically captured by non-poor groups and can result in regressive transfers. In kind food assistance may compete with local food production and consumption and may have deleterious effects on local food production. Recently, the governments of many developing countries have started to prefer cash transfeHhlch, among other things, are cheaper to deliver than In kind transfe-nd present slmliar or better benefits that many of the In kind transfers. With cash transfers, families are able to buy the foods they prefer in local markets and can buy in small quantities to rationalize consumption and storage. The fundamental shift for policy-makers Is away from meddling In markets-whether directly In the form of prlce subsldles or indirectly through the dlstortlons caused by in kind transferr-end towards an approach that places greater trust In mother’s decision-making. This shift has been pushed by evidence showing that, although some ‘frivolous spending’ can indeed exist, the overwhelming majority of mothers make sensible, welfare-enhancing decisions.
Source: Adapted from Castaiieda. 2005; and Castaiieda and Lindert, 2005.
CCT programs can go further than just providing a cash transfer t o poor households, by making cash transfers conditional on certaln human capital behaviors by households, CCT programs go further than just reducing consumption poverty In the short term. As an anti-poverty instrument, a cash transfer alone addresses one important dimension of poverty, but leaves other dimensions unaffected or affected only indirectly. Conditional cash transfer (CCT) programs, on the other hand, allow the simultaneous transfer of cash to the poor, while also leveraging an increase in demand by these households for health and education services, thus promoting accumulation of human capital. CCT programs provide cash transfers to the poor, conditional on families receiving health check-ups, vaccinations and other preventive healthcare for their small children, and keeping school-aged children enrolled in school (see Box 6.4). From a ‘risk-management’ perspective, conditioning cash is a way for governments to augment household ‘prevention’ measures that address chronic vulnerability by lowering the likelihood of losses from shocks. The CCT model presents a number of advantages. It is flexible (adaptable to a country’s specific needs), scalable (works for pilots and can be expanded to large numbers), and fiscally sustainable (cost effectiveness is typically greater than that of other programs).
Impact evaluations of CCTs show lmpresslve results In terms of Increased school enrollment and usage of preventive health services by poor households. A study by Rawlings and Rubio (2003) shows that CCT programs are effective in promoting human-capital accumulation among poor households. For instance, CCTs were found to: improve child nutrition and increase vaccination, thus, preventing the spread of communicable diseases and the advent of under-nutrition; improve maternal health by increasing pre- natal check-ups; and, increase transition rates from primary to secondary education. Higher enrollment and transition rates also reduced child labor. In Mexico, the poverty gap was reduced by 30 percent and the severity of poverty by 45 percent among program beneficiaries (Skoufias, 2005). In Colombia, the incidence of extreme poverty was reduced by 6 percent after about one year of program operation (Attanasio et al, 2004). In most cases, over 40 percent of program benefits went to the poorest quintile of the population. In Nicaragua, average enrollment rates in treatment areas increased nearly 22 percentage points as a result of the program, from a low starting point of 68.5 percent. In Mexico, the CCT program reduced the probability of working among children aged 8 to 17 by 10 to 14 percent relative to the level observed prior to the program (Parker and Skoufias, 2000). The Progresa evaluation shows a significant increase in nutrition monitoring and immunization rates. Infants under the age of three participating in Progresa increased their growth monitoring visits by between 30 and 60 percent, and child beneficiaries aged under five had a 12 percent lower incidence of illness compared with non-
185
MAKING THE NEW INDONESIA WORK FOR THE POOR
Progresa children (Gertler et al, 2006). Several countries also report that the program improved the status of women within the family and/or community.
The CCT model can be adapted to lndonesla to address Its key multidlmenslonal poverty goals. A CCT program could be specifically designed to address Indonesia’s high maternal and child mortality rates, under-nutrition, low progression to junior secondary education of children from poor households, or deficient access to water and sanitation. Based on the experience of other countries, a CCT program in Indonesia could produce a decrease in maternal mortality rates by improving pregnancy check-ups early on, providing vitamins and other supplements, and dispensing health education. In addition, it could lower child mortality rates by increasing vaccination coverage and provide vitamins and supplements (iron, etc.) together with nutritional education. However, it would be critical to ensure that health conditions could be met by utilizing the services of non-governmental/private providers. In education, the poorest children could achieve higher progression rates to junior secondary school and there would be more secondary school graduates. These would all be significant contributions to achieving the Millennium Development Goals (MDGs).
Given Its long tradition of community driven development, Indonesia could experiment wlth a condltlonal transfer to comrnunlties. One possible innovation of the CCT model not yet tried elsewhere might be to provide grants to local communities on condition that the community reaches the same health and education indicators that form the conditionalities of a household CCT. This could be most effective where there are problems that are best dealt with collectively. As with other community empowerment programs, trained facilitators would likely be required to help communities collectively diagnosis the specific problems in health and education in their village, and identify steps they could take to resolve them.
186
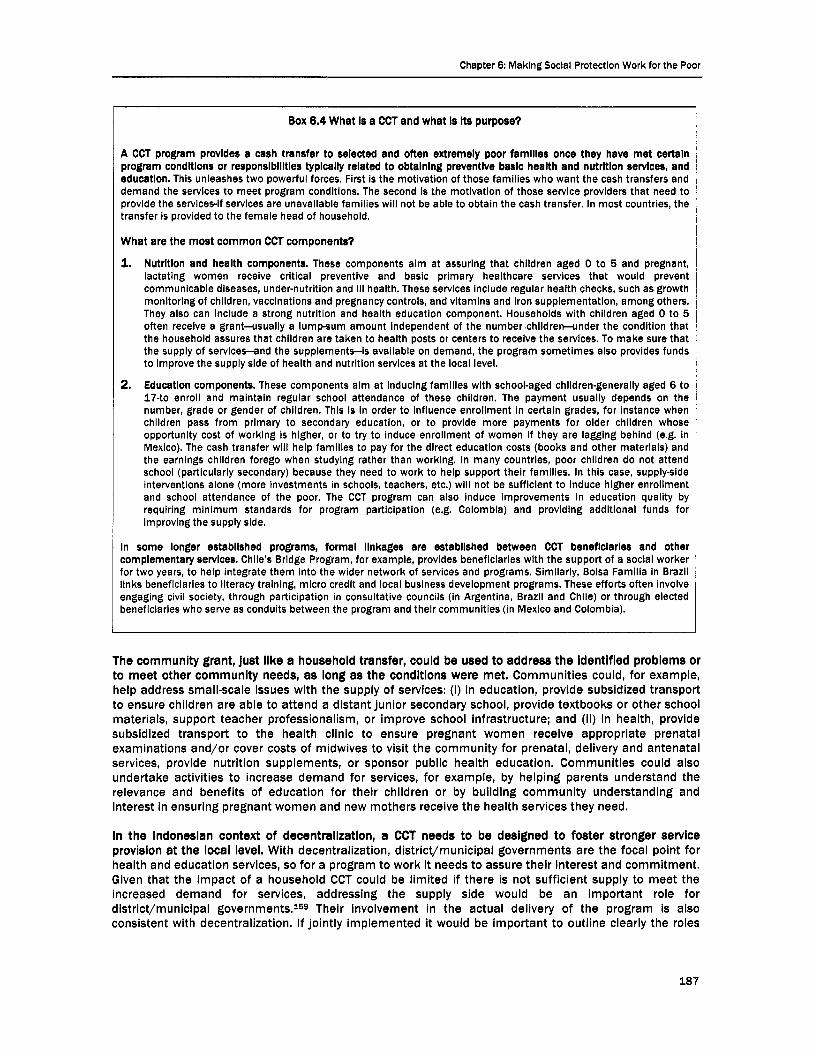
Chapter 6: Making Social Protection Work for the Poor
Box 6.4 What Is a CCT and what is Its purpose?
A CCT program provides a cash transfer t o selected and often extremely poor famllles once they have met certain program condltlons or responslbllltles typically related to obtaining preventlve basic health and nutrltlon services, and educatlon. This unleashes two powerful forces. First is the motivation of those families who want the cash transfers and demand the services to meet program conditions. The second is the motivation of those service providers that need to provide the services-if services are unavailable families will not be able to obtain the cash transfer. In most countries, the transfer is provided to the female head of household.
What are the most common CCT components?
1.
2.
Nutrltlon and health components. These components aim at assuring that children aged 0 to 5 and pregnant, lactating women receive critical preventive and basic primary healthcare services that would prevent communicable diseases, under-nutritlon and ill health. These services include regular health checks, such as growth monitoring of children, vaccinations and pregnancy controls, and vitamins and Iron supplementation, among others. They also can Include a strong nutrition and health education component. Households with children aged 0 to 5 often receive a grant-usually a lump-sum amount independent of the number chlldren-under the condition that the household assures that children are taken to health posts or centers to receive the services. To make sure that the supply of servlces-and the supplements-is available on demand, the program sometimes also provides funds to improve the supply side of health and nutrition services at the local level.
Education components. These components aim at Inducing families with school-aged children-generally aged 6 to 17-to enroll and maintain regular school attendance of these children. The payment usually depends on the number, grade or gender of children. This is in order to influence enrollment in certain grades, for instance when children pass from primary to secondary education, or to provide more payments for older children whose opportunity cost of working Is higher, or to try to induce enrollment of women if they are lagging behind (e.g. in Mexico). The cash transfer WIII help families to pay for the direct education costs (books and other materials) and the earnings chlldren forego when studying rather than working. In many countries, poor children do not attend school (particularly secondary) because they need to work to help support their families. In this case, supply-side interventions alone (more investments in schools, teachers, etc.) will not be sufficient to induce higher enrollment and school attendance of the poor. The CCT program can also induce improvements in education quality by requiring mlnimum standards for program participation (e.g. Colombia) and providing additional funds for improving the supply side.
In some longer established programs, formal linkages are establlshed between CCT beneflclarles and other complementary services. Chile’s Bridge Program, for example, provides beneficiaries with the support of a soclal worker for two years, to help integrate them into the wider network of services and programs. Similarly, Bolsa Familia in Brazil links beneficiaries to literacy tralnlng, micro credit and local business development programs. These efforts often involve engaging civil society, through participation in consultative councils (in Argentina, Brazll and Chile) or through elected beneficiaries who serve as condults between the program and their communities (in Mexico and Colombia).
The community grant, Just llke a household transfer, could be used to address the identified problems or to meet other communlty needs, as long as the condltlons were met. Communities could, for example, help address small-scale issues with the supply of services: (i) in education, provide subsidized transport to ensure children are able to attend a distant junior secondary school, provide textbooks or other school materials, support teacher professionalism, or improve school infrastructure; and (ii) in health, provide subsidized transport to the health clinic to ensure pregnant women receive appropriate prenatal examinations and/or cover costs of midwives to visit the community for prenatal, delivery and antenatal services, provide nutrition supplements, or sponsor public health education. Communities could also undertake activities to increase demand for services, for example, by helping parents understand the relevance and benefits of education for their children or by building community understanding and interest in ensuring pregnant women and new mothers receive the health services they need.
In the lndoneslan context of decentralization, a CCT needs to be designed to foster stronger servlce provision at the local level. With decentralization, district/municipal governments are the focal point for health and education services, so for a program to work it needs to assure their interest and commitment. Given that the impact of a household CCT could be limited if there is not sufficient supply to meet the increased demand for services, addressing the supply side would be an important role for district/municipal go~ernments.1~9 Their involvement in the actual delivery of the program is also consistent with decentralization. If jointly implemented it would be important to outline clearly the roles
187

MAKING THE NEW INDONESIA WORK FOR THE POOR
and responsibilities of the different levels of government in a program implementation agreement. A substantial investment in institutional and individual capacity building would be required.
The effectiveness of a household conditional cash transfer on health, nutrition, and education outcomes will depend, in part, on the quality of the targeting and the human capital conditions. The conditions need to be kept simple so they can be easily understood by beneficiaries and service providers alike, while also addressing what are the key constraints for the poor in achieving better health and education outcomes. Evidence from several impact evaluations suggests that CCT effects on enrollment, for example, are largest among children with lowest probability of enrollment, and for transition grades with high dropout rates (Schady, 2006; de Janvry, 2006). Targeting of poor under CCTs in other countries has generally been through some combination of geographic and household targeting. But although the targeting performance of CCTs has generally been better than other social assistance programs, they still exclude some of the poor. Given Indonesia’s poverty profile (described earlier), targeting poorer households will be particularly challenging (see Targeting Section and Box 6.7).
Given the detailed design planning that would be necessary, and the operational and administrative complexity involved, a CCT program would need to be introduced In phases. In Latin American middle- income countries, CCTs often began as pilot programs for extremely poor, rural and indigenous families, and were scaled up gradually. For example, the largest program (Bolsa Familia, covering 11.1 million families in Brazil) was created through the merger of four preexisting cash transfer programs.
The design of the key program design features would be a complex task requiring sufficient time and resources. While the experience of the UCT suggests that cash can be successfully transferred via post offices to people throughout the country, making the receipt of a cash transfer dependent on meeting health and education conditions would significantly increase the complexity of the program and introduce a very different dynamic. For example, a household CCT would require: (i) a beneficiary roster with family demographic information relevant to the conditions; (ii) a policy and procedures to verify compliance with conditions, as well as to deal with non-compliance; (iii) assessment of the availability of relevant health and education services, and a follow-up plan to address anticipated supply-side issues; and, (iv) a complaints resolution and appeals system. Similarly, a community CCT would also require significant administrative capacity, although it could build on the experiences of community driven development programs in facilitating communities to plan and implement infrastructure projects. Both approaches would also require a monitoring (including MIS) system, a socialization strategy targeted toward beneficiary households or communities and other stakeholders, and lastly, a set of accountability mechanisms.
Any new program will come with implementation challenges, not all of which can be anticipated. What would be key is whether there are mechanisms in place to identify and resolve issues early rather than waiting for them to fester or deteriorate. This would be particularly important if the program were introduced with joint central-district responsibilities. In addition to ongoing monitoring of program implementation, conducting quality control reviews and independent spot checks periodically would also be important.
As a CCT program has never been tried in Indonesia, It would be important that government rigorously assess the impacts of a CCT program before scaling it up. There have been high quality evaluations of CCT programs in other countries that provide evidence of their impacts. The success of CCTs in other countries is, however, no guarantee that success will be reproduced with similar results in Indonesia. It would be important for Indonesia to use a similarly high-quality approach to assess the effectiveness of program targeting and coverage, and to determine whether there is increased utilization of health and education services, and resulting higher education attainment and improved health and nutrition status. Process evaluation would also help policy-makers to understand more about what works, what does not, and why.
188

Chapter 6 Making Social Protection Work for the Poor
Workfare
One promising publicly provided option for addressing the shocks to household Incomes-shown to be a particular vulnerablllty of poor and near-poor households4s the deployment of ‘workfare’ or ‘cash-for- work’ programs. Such programs have worked well in low- and middle-income countries with large informal sectors. They have been instituted in several countries to respond automatically in economic downturns, acting as a source of income when reduced hours, reduced earnings, outright job loss and the failure of small businesses become widespread. In this way, ’cash-for-work’ programs can act as ‘social insurance or earning insurance’ in countries where highly structured, institutionally intensive forms of traditional social insurance are not viable (see Box 6.5).
Box 6.5 Can public employment programs act as social Insurance for the poor and near-poor?
The rlsk of losses from unemployment Is generally not considered ‘Insurable’ by prlvate markets, since It can be hlghly systemlethat Is, when unemployment strlkes, say In an economic recession, a large number of lndlvlduals In the rlsk pool are affected. Since there are typically not enough ‘winners’ to compensate all the ‘losers’ from the shock, it becomes too expensive for private insurers to cover losses. However, household earnings protection is important, both for social protection and efficiency reasons: earnings protection can help households avoid bad coping but also help improve matching of jobs with jobseekers by removing an element of urgency from the job search. For thls reason, governments help correct this market failure to provide or mandate earnings insurance instruments: from risk-pooling at the firm level in the form of severance programs, to pooling across the working population in pay-as-you-go systems of unemployment insurance, and even systems based on individual savings accounts where these are backed with minimum benefit guarantees financed by pooled funds.
However, In economies where large segments of the labor force are selfemployed or work Informally, provldlng earnlngs Insurance through any of these tradltlonal devices Is lnstltutlonally difficult and can even lead to regressive subsidies to relatively well off ‘formal’ workers. What is more, financing social insurance structures from payroll contributions draws a sharp distinction between the protections enjoyed by workers with a legal contract, and those without, including the self- employed.
To surmount thls problem and extend coverage of earnlngs protectlon, governments In many mlddla and IOWer-InCOme countries offer public employment or ‘cash-for-work’ programs. Since these are financed dlrectly from general revenues and typically do not discriminate according to the type of employment individuals have lost (Le. whether legal employment, Informal or self-employment), these structures can effectively function as a social insurance instrument (Le. a public risk-pooling intervention). Indeed, if correctly structured, these programs can be a form of social insurance that is most likely to reach workers who lose employment in the informal sector or the self-employed whose businesses fail in a downturn (see de Ferrantl et at, 2000 and Galasso and Ravallion, 2001).
The critical feature of publlc employment programs that dlrectly determines whether they succeed In acting as earnings Insurance for the Informal sector Is the program wage. Correctly setting the program wage is critical in ensuring that protection reaches those who need it most, is readily available in economic downturns, and does not Introduce damaging distortions when labor markets improve.
In India’s new ‘Guaranteed Employment Program’, beneficiaries are offered benefits equkalent to the legal mlnlmum wage. However, the number of hours and workdays under the program, together with the number of beneficiaries in each district, has to be strictly limited to contain costs. In effect, with regard to public employment programs, India has foregone unrationed, self-targeting forms of earnings protection, for relatively expensive (in terms of above-market wage costs) forms of employment assistance that are strictly rationed and thus of limited coverage.
Indonesia has had experience in deploying public employment programs In the past that can provide Invaluable lessons to policy-makers. Several of the ‘labor-intensive’ programs deployed as part of the JPS safety net package of interventions remain to this day. Early evaluations of the JPS programs point to the public employment programs as the best example of a ‘safety-rope’, Le. a self-targeting program that was effective not only in responding to the plight of the poorest, but also to the shock-management needs of the near-poor who benefited most from the consumption-smoothing mechanisms these programs provided in the wake of the crisis (see Pritchett et ai, 2001). However, more recent evaluations of the labor-intensive programs show that these have significantly degenerated, focus on low-productive work,
189

MAKING THE NEW INDONESIA WORK FOR THE POOR
and that their administration has fragmented among several public institutions that then misuse them for political patronage. Many of the programs may have repeated the mistakes of workfare committed so often in other countries, for instance by paying benefit wages greater than market wages. Conversely, some experiences, most notably in Aceh, demonstrate how a public works intervention can succeed in simultaneously addressing the need to provide an income to households, as well as rebuilding urgently needed infrastructure.
Key to the success and sustalnablllty of such programs Is the setting of the program wage at an approprlately low relevant ‘safety net’ wage for unskilled manual labor. The most effective way to ensure public employment programs succeed in providing reliable and sustainable earnings protection to households that are at greatest risk is to pay wages below the market wage and ensure that the work is relatively undesirable to the individual. This way the program will be self-targeted to those who really need temporary income support. However, many governments make the mistake of setting program wages at the legal minimum wage, well above the market wage for unskilled manual labor. Offering above-market wages imposes three separate economic costs: (i) they attract more workers to public employment programs; (ii) they pay each more than they would otherwise accept; and (iii) they crowd out private employment. As many governments have discovered, if public employment programs offer (or subsidize) above-market wages, the fiscal costs of these programs can increase unless protection is rationed (see Box 6.5). However, this places government in the uncomfortable position of working through quantities rather than through prices, and hinders the program’s effectiveness at protecting households.
The main objectlve of the ‘cash-for-work’ is to provide earnlngs Insurance for the poor, not to tackle general unemployment. As discussed in previous chapters, poverty and unemployment are not equivalent. Given that the heads-of-household unemployment rate is merely 2.5 percent,l60 this strongly supports the ‘luxury good’ hypothesis of unemployment. Indeed, poor heads of household simply cannot afford to be unemployed. As previously discussed, poverty and unemployment are not equivalent (see Box 3.4 in Chapter 3). Instead, unemployment is predominantly a problem of the educated, while poverty is mostly a problem of the uneducated. Unemployment is higher in urban areas, while poverty higher in rural areas. Similarly, the unemployment rate is higher for women, while the relative risk of poverty is somewhat gender neutral. As a consequence, the design of programs to provide social or earnings insurance for the poor through cash-for-work is completely different to programs whose objective is to lower the unemployment rate: the target groups are different, their main problems are different and the jobs provided should also be different.
The unemployment problem In Indonesia is mostly a youth unemployment problem and speclflc actions, such as ‘cash-for-training’, are needed to address this problem. The number of unemployed youth has increased steadily over the past decade, attaining 13 million in 2004. This indicates a youth unemployment share of 6 1 percent, far higher than its population share of 18.4 percent. Programs to combat youth unemployment need specific actions. The ‘Joven’ programs that have been applied in many Latin American countries are good examples of ‘cash-for-training’ for youth. These are training programs for young adults aged 16 to 29 that provide practical training and financial support to unemployed low- income youth in order to prepare them to compete in the labor market. The programs are demand-driven and consist of a three- to five-month training course, followed by a three-month internship. Technical training and internship experiences with employers are combined with basic life skills and other support services to ensure social integration and job readiness. Private and public institutions-contracted through public bidding mechanisms-provide the training services and are responsible for organizing the internships. The programs served a vast number of disadvantaged young adults: Proyecto Joven in Argentina reached about 116,000 young adults from 1993 to 2000, and Chile Joven served nearly 165,000 beneficiaries between 1991 and 2001. The programs increased the probability of beneficiaries finding employment upon graduation. The impact on employment measured against a control group was statistically significant, increasing the probability of employment by about 10 percentage points in Argentina (Aedo and Nunez, 2001), 21 percentage points in Chile (Aedo and Pizarro, 2004), and 7.5 percentage points in Peru (Deutsch et ai, 2001; and IADB, 2005).
‘Workfare’ public employment programs can be seen as just another form of CCT where, Instead of cash- for-Immunization or cash-for-school attendance, the government gives households cash-for-work. Indeed,
190
Chapter 6 Making Social Protection Work for the Poor
the new risk-pooling and prevention measures discussed above can be viewed as a package (albeit each with specific implementation requirements as discussed below). The innovations on the CCT program discussed above that would build on Indonesia’s long tradition of community-led development efforts, might also include a cash-for-work component where communities in which the supply of local services was found to be deficient could quickly build the roads, schools or clinics necessary to provide the basic services that beneficiaries of the other transfers would eventually demand.
Health insurance
The one pervasive risk factor discussed previously in the risk and vulnerability assessment that would not be directly addressed by the cash transfer programs above is health shocks. Among typically idiosyncratic losses reported by households, the financial losses from adverse health events are the most frequently reported in Indonesia. Among households headed by women, these are more frequently reported than economic risks or earnings losses. A health component of a conditional cash transfer could help lower the likelihood of these adverse health events. However, households are very likely to still face sickness and accidents that lead not only to lost days of labor and earnings, but can also impose substantial treatment costs that most households have to pay out-of-pocket (that is, through financial and non-financial savings instruments). The cost of care paid out-of-pocket can be impoverishing in and of itself in Indonesia (Wagstaff and Pradhan, 2003) and elsewhere (see Baeza and Packard, 2005).
These findings would argue for the establlshment of a well-functioning and efficient social protection program in the form of health insurance for the poor. On this issue, Indonesian policy-makers have been correct in identifying an appropriate area for intervention. Key to moving forward will be the need to build on emerging lessons from practice to date. While past evaluations of the health-card scheme, in which the government extends entitlement to treatment to the poor, found a positive impact on utilization (Pradhan et al, forthcoming), it is not yet known whether the ‘new’ social health insurance program introduced following the first partial repeal of the fuel subsidy in March 2005 will have the same effect. Through the new program, about 60 million households were given health insurance cards entitling them to receive free healthcare at local public health clinics, as well as in third-class public hospital beds (see Box 6.6 on the PKPS-BBM program for healthcare). If this extension of coverage were to increase utilization, the government may have succeeded in extending vital risk-pooling against the financial losses from adverse health events to the vulnerable. (See also Chapter 5 on Public Spending for analysis on demand-side programs for improving the poor’s access to health services.)
It will be critical to review the Impacts of the health insurance program. Early assessments point towards scope to improve the design of this program in numerous areas. One curious feature of this expansion in health coverage was that financing for the measure was channeled through a traditional social insurance institution-PT Askes, a health-insurance provider for Indonesian civil servants. While the overall impact of extending publicly provided risk-pooling for health losses may prove positive in time, the measure could probably have been done in a more efficient way. Channeling such a social protection program of risk- pooling for the poorest through a traditional social insurance institution such as PT Askes departs dramatically from international experience. It will also be key to determine whether increased access actually leads to an increase in utilization by the poor, and whether increased use of public facilities leads to increased utilization overall or just decreased use of non-government private providers. Addressing these issues in improving the program going forward will be critical to ensure its efficacy as a cost- efficient social protection for the poor and near-poor in the future. (See Chapter 5 on Public Spending and Box 6.6 for further analysis.)
191

MAKING THE NEW INDONESIA WORK FOR THE POOR
Box 6.6 improving poor people’s access to healthcare: Concerns with the PKPSBBM health insurance scheme
in 2005, the government introduced a healthcare scheme aimed at increasing access and service quality to all Indonesians, and particularly the poor. The program provides: (i) free-of-charge healthcare services at Puskesmas (public health centers) and (ii) in-patient treatment in third-class hospital beds for the poor. The Puskesmas component of the program is very similar to its predecessors, the JPSBK (1998-2001) and PKPSBBM (2001-05), in that it provides supply-side block grants to Puskesmas for operational requirements, equipment and medicines, and free access those poor who have health cards. The difference, however, is that the in-patient treatment component of the program (60 percent of funding) is now run by PT Askes, whereby individual health cards are distributed by this insurance company and hospitals are reimbursed for their services on a fee-for-service basis. The program is budgeted at around US400 million across 2005 and 2006, equivalent to about one-fifth of Indonesia’s public health spending in 2004.
However, the program does have many problems that need to be addressed to ensure the poor benefit. Some of the issues and concerns highlighted by a preliminary assessment of the program include:
The targeting mechanism of the program Is problematic. The insurer, PT Askes, was given responsibility for targeting the poor and for socializing the program, but given how they are funded (see point 2 below), it was not in their financial interest to reach poor households. There have also been difficulties due to the changes from household-based cards used in previous programs to individual Askeskin cards. Results of field assessments show that in some places local implementers have questioned central poverty data and, as a result, have postponed health-card distribution, being afraid of repercussions from disgruntled community members. Self-targeting has been allowed through a SKTM (a letter from the neighborhood head stating that a person is poor), which has rendered the costing of the program unpredictable. It is also unclear what indicators local officials use to determine who should receive the SKTM letter, and therefore whether they are indeed poor.
(2) The program is, in essence, supplydriven whereby funds flow through the providers and the poor are not empowered to question the quality of servlces they receive. Receiving services is a favor rather than a right for the poor under this scheme. There are no incentives for Puskesmas staff to improve service quality for the poor, since they are not compensated on a fee-per-service basis. Even PT Askes, which compensates hospitals on a fee-per-visit basis, receives funding from government in block grant form-regardless of the quantity or quality of services provided to the poor through the hospital system. Given this supply-side flow of funding, the system depends solely on the altruistic behavior of providers and insurer to improve quality of services to the poor.
(3) The program does not enable the poor to utilize the services of non-government or private providers, such as midwives and paramedics in vliiages-6ervlces that are in high demand by the poor. Although the intention of the program was also to cover the services of private providers in rural areas, the mechanism through which this would take place is not outlined in the program; private providers are generally not included in the scheme. With the majority of poor people in Indonesia preferring to use private providers, this has serious consequences in terms of increasing access to and utilization of healthcare services by the poor.
(4) The program does not take into account regional variations. The prevalence of certain illnesses and difficulties in accessing health facilities in isolated areas is not taken into account. In addition, the design fails to accommodate the role of local government in planning, implementation, monitoring and evaluation. Worse still, the program undermines some of the existing health insurance schemes previously started by some forward-looking local governments.
Going forward, greater impact may be possible If program deslgn takes into account incentlve problems and program limitations. For instance, private providers need to be included in the scheme and this would be possible if funding were channeled to the poor through alternative mechanisms. Even a voucher system-similar to the health carcCthat operates on a fee-for-service basis would imply a change in incentives for the service provider. The Funding that goes through PT Askes also needs to be carefully monitored, as too much discretion is left with the company in terms of targeting the poor, as well as providing reimbursements to hospitals.
* Regulations for the PKPSBBM health program changed again in 2006 reverting to the first half of CY05 where almost all funds, including for Puskesmas, are channeled through PT Askes. Certain out-patient and other services (such as ambulatory care, birthing and midwifery services) are also reimbursable (whether from a Puskesmas or hospital).
192

Chapter 6 Making Soclal Protection Work for the Poor
Rice price stabilization
Maintaining stable rice prices Is critically Important for the poor. As noted in Chapter 2, high rice prices were very harmful to the poor during the crisis in 1997/98 (see Figure 2.4). More recently, the 33 percent increase in the price of rice between February 2005 and March 2006 was primarily responsible for the increase in the poverty headcount in 2006 (see Chapter 3 Box 3.5 for more information on the impact on the poor). Policies to stabilize rice prices are therefore an important part of social protection.
Before the economic crisis, Indonesia had one of the best records for stabllizlng rice prlces In East Asia. Figure 6.2 shows that the real price of rice in Indonesia was held roughly constant for a period of 20 years prior to the crisis. Aside from the turbulence of the early 1970s, Bulog was successful in maintaining the real price of rice in Indonesia at or near the world price for a period of two decades. During this period Bulog had an explicit mandate to ensure price stability and was given monopoly import rights to enable it to achieve this. Growing corruption within Bulog, together with the economic crisis, led to the collapse of the rice price stabilization system. There followed a brief period of free trade in rice between January 1999 and December 2003, initially with no tariff and then with a specific tariff of Rp 430/kg from January 2000. Finally, in January 2004, the government announced a ‘seasonal’ import ban, which has been repeatedly extended so that it has effectively become a permanent ban.161 Meanwhile, Bulog has become a state-owned enterprise and claims to no longer have a mandate to stabilize prices. It does, however, have responsibility for purchases and sales from Bulog stocks (currently the only mechanism of price stabilization), as well as implementing the rice for the poor (Raskin) program (see Red Spotlight on Inefficiencies and Leakages: Where has all the Raskin gone?).
Figure 6.2 Real rice prlces were stable before the crisis 1700
1 500
- 0
0 t
e B
1300
g 5 n
.f loo
; .D 800
0
n - 2
700
500 Jan48 Jan-72 Jan-75 Jan-78 Jan-81 Jan-84 Jan-87 Jan-90 Jan-83 Jan-96 Jan-88 Jan-02 Jan-05
Source: Palaclos and Pallares, 2000.
The current system for preventing falls In the price faced by farmers Is not very effective. The government continues to set an official government purchase price for rice (HPP), which dictates the price that Bulog pays for paddy and rice. Bulog purchases around 2 million tonnes each year, primarily for the Raskin program. Since this constitutes around 6 percent of supply, government purchases could, in principle, have a significant impact upon prices. Whether such purchases do so or not depends on what the private sector would do in the absence of government purchases. If it simply increased purchases by the same amount, then government purchases would have no effect on prices. If private purchases remain unchanged in the absence of government purchases, then GKG prices could fall by up to 20 percent.
193
MAKING THE NEW INDONESIA WORK FOR THE POOR
However, the experience of 2003 and 2004, when the market price for GKG was frequently below the HPP, suggests that government purchases are not very effective at defending the floor price.
And the current system for preventlng large Increases in the price is serlously flawed. The rice import ban prevents imports acting as an automatic price stabilization mechanism. In its place, the government has a mechanism to release rice from its stockpile in locations when rice prices are rising too quickly (operasi pasar, or OP). However, the OP mechanism currently suffers from two drawbacks. First, it offers little relief from high prices since the quantities dispersed are rather small. Second, and more seriously, the formula used to determine whether an OP is necessary is seriously flawed. The formula recommends OP when rice prices rise by more than 25 percent above the average price of the previous three months. This in theory could allow rice prices to rise by 533 percent in the course of one year without triggering OP!162 If the government wishes to use the OP mechanism to stabilize prices then a more appropriate formula to prevent sudden increases in rice prices would be to set a rice price ceiling at a certain percentage above the world price for rice and to allow imports for a set period when the price of rice exceeds this ceiling.
The most effectlve way to prevent large increases in rice prices would be to allow the general importation of rice subject to a low tariff. This would prevent domestic prices from rising significantly above the tariff- inclusive price. It would also be more efficient since it would allow competition between different importers. During the brief period after the crisis when Indonesia enjoyed free importation of rice, domestic rice price fluctuations were just as stable as the period during which Bulog managed rice prices. Of course, it is still possible that domestic rice prices could increase sharply if a fall in local production coincided with a sharp increase in world prices or a major depreciation of the exchange rate. However, the world rice market is significantly larger and more stable than it was even 10 years ago, and the macroeconomy is significantly more stable too. Even if such an event did occur, a revised system of operasi pasar could compensate for temporarily high world prices.
Social insurance
As part of Indonesla’s social protectlon agenda much effort has recently focused on social Insurance. Recent legislation may imply fundamental changes to traditional (Le. pay-roll tax financed) social insurance in Indonesia. However, these changes are expected to be slowly phased in over the next five years. Indonesia’s current formal social insurance programs-covering the cost of healthcare, old-age income needs, the risk of disability, death of income earners and job loss-are fragmented. Coverage is low and deeply segments the formal labor force (Martineau and Geurard, 2005; Arifianto, 2004). Currently, there are four main providers of traditional social insurance: Asabri, which provides pensions and health cover for the armed forces and police; Taspen, which provides pensions to civil servants; PT Askes, which provides health cover to civil servants and has recently expanded its activities to include subsidized healthcare to the poor; and Jamsostek, which primarily provides old-age income support through a provident fund plan but also makes disability, survivor and health insurance available to private sector workers. These plans are complemented, and in many cases substituted, by a voluntary private pension sector providing a number of defined-benefit and defined-contribution products to workers through their employers. Furthermore, Indonesia’s labor law requires complying employers to pay large lump-sum termination benefits.
However, it must be recognized that in Indonesia’s current economy traditional social Insurance will have llmlted coverage and be of little relevance to poorer households. The vast majority of Indonesia’s labor forc-s many as 60 million workers, and possibly more-work beyond the reach of government- mandated social insurance. Many of these workers either cannot or choose not to rely on voluntary formal pension plans. The results of the risk and vulnerability analysis show that institutionally intensive forms of pay-roll-tax-financed social insurance do not reach the poor or the near-poor, and make little difference in mitigating the impact of shocks. Moreover, the risk factors in old age that typically concern policy-makers, and are one focus of the social security bill, do not seem to be contributing to household vulnerability in Indonesia. As shown in Figure 6.3, which presents data on the reach of pay-roll-tax-financed social
194

Chapter 6 Making Social Protection Work for the Poor
insurance in a wide selection of countries, these results should come as little surprise given Indonesia’s level of development.
Figure 6.3 The reach of traditlonal social Insurance: participants in the labor force by per capita Income, selected countries circa 1995
5 10 15 20 25 30
income per capita (‘000)
Source: Palacios and Pallares, 2000.
This does not mean that Indonesia should not proceed with cautlon in developing a soclal insurance scheme for the future. Immediately addressing the weaknesses of current traditional social insurance structures, which cover such a small segment of Indonesian households yet pose risks for the broader economy, would be prudent.163
However, an effective social protection strategy for today’s Indonesia, one aligned with the main risks and vulnerabilities faced by the population and consistent with adminlstrative capacity, would suggest a relatively modest role for traditional soclal Insurance. Keeping the above points in mind, it is primarily important for policy-makers to focus on covering the losses that are currently the most likely to impoverish households and threaten their human capital, as well as those that deepen the poverty of the current poor or prevent them from overcoming their poverty. The analysis of risk and vulnerability showed that households are most affected by catastrophic (and covariate) shocks best covered by simply designed, broad, national-level risk-pooling instruments, rather than the sophisticated, closed forms of traditional social insurance found in middle-income and OECD countries. In the medium term, a social protection strategy for Indonesia should thus focus primarily on the more generic three prongs of a social protection program laid out above rather than focus excessively on the development of highly structured social insurance-type instruments, such as contemplated in the recently passed National Social Security Law. Current low administrative capacity makes such instruments impractical and may even impose distortions on the broader economy.
Targeting
A keystone to targeted soclai protection programs is a quallty targeting system. Given Its budget Ilmltatlons, the government needs to ensure that poverty programs are well targeted. Countries have applied a variety of targeting instruments for social programs, including household (or individual) assessment mechanisms, broad categorical eligibility and self-targeting. Many programs adopt a combination of these three mechanisms. Health cards and Raskin are examples of programs using household assessment, where each household or individual is assessed for eligibility. IDT, KDP and
195

MAKING THE NEW INDONESIA WORK FOR THE POOR
UPPiS4 are examples of programs using category targeting, in this case the geographical location of poor communities. Workfare programs with low wages and price subsidies for lowquality items are examples of programs using self-targeting, as the benefits offered are only likely to be attractive to the poor.
Flgure 6.4 The targetlng performance of varlous targeted poverty programs In Indonesia are only slightly prepoor
Scholarshlps Program (2004) Health Cards (2004)
5 nousehold Expendituie Quintlies Per Capita Expenditure Quintlies 5
Raskin Program (2004) ., 1
UCT Program (2006)
O% Of this gulntiie Covered by the program
/o Of bsnefltr distributed to the
Y o f l h ~ ~ u l n f l l ~ r o r ~ n d ~ ~ f h ~ p r ~ l n m
QYl"tll q" nttie
5 Per Capita Household Quintiles Household Expendnure Quintlie6
Source: Susenas 2004, reflecting the distribution in 2003 for Raskin, scholarships and health cards. Note: For UCT targeting, Susenas 2005 panel data are used for preliminary findings.
Hlstorically, program targeting In Indonesia has not been partlcularly strong, As discussed above, evidence from various targeted programs (Figure 6.4) shows that the targeting performance of various safety net and poverty programs was low. The under-coverage error-the proportion of the first quintile of households that are not included in the program-is generally over 50 percent. Similarly, the leakage error-the proportion of beneficiaries who are classified as non-poor or above the bottom quintile-is around 50 to 70 percent. Several elements of safety net program design explain the reasons for less-than- efficient targeting of the poor.
First, thls weak performance Is llnked to problems wlth the use of the National Family Plannlng Coordination Board (BKKBN) system of classlfylng households as 'prosperous families' and 'pre prosperous famliles'. This classification system is in principle a proxy indicator based on a range of variables (food consumption, material of the floor, type of healthcare services, ownership of clothes, religious practices, etc). Unfortunately, the BKKBN indicators were chosen not based on a proper statistical exercise to find a set of variables and a scoring system that could discriminate between the poor and non-poor, but solely on their being the only data available up to the village level. Most of these indicators are not easily observable and could be easily manipulated. The indicators also include non-economic criteria, such as the ability to meet religious obligations. Moreover, the data were compiled by relatively poorly trained volunteers. As a result, the BKKBN indicators have only a weak correlation to the poverty expenditure indicator, with 43 percent of pre-welfare households not among the expenditure poor.
Second, as discussed, weak targetlng has also been Induced to some extent by cultural norms, whlch foster sharing (bag/ rata) or spreading program benefits at the community level. Such practices have
196
Chapter 6 Making Social Protection Work for the Poor
contributed, for example, to the benefits of the Raskin subsidized rice program being spread broadly and thinly.
Given Indonesia’s geographical diversity, there Is scope to build on both geographlc targeting of areas, as well as systems for household targeting. Geographic targeting has become easier to implement in recent years, as a result of the widespread availability of household survey and census data, and has overcome many of the data problems that still hinder the implementation of other forms of indicator targeting. By combining census with household survey data, estimates of poverty down to the sub-district level, and in some cases, even at the village level can be made (Elbers, et al 2002). A study by Alatas (2004) shows that the coverage of the poor (headcount) by the KDP I program could have been improved from 30 percent to 52 percent if such small area estimation maps had been used for determining its first-stage allocation. Indonesia has now completed small area estimation or poverty maps for the entire country by combining the information from Susenas, the Village Potential Survey (Podes), and the population census, and processing this information based on an econometric model (see Green Spotlight on Innovation at the end of this chapter). These poverty maps are able to provide reliable data on the number of poor people down to the village (kelurahan) level for districts in densely populated Java and to the sub-district (hecamatan) level for off-Java districts. The existence of these maps opens up huge potential for using such maps for targeting and placement of public investment.
Involving the community can improve targeting effectiveness. Current and past Indonesian welfare programs use a mixture of geographic targeting, household assessment and community participation to distribute benefits. Rather than targeting the poor through administrative measures executed by program administrators, these programs make the community central in delivering the project, including having a role in selecting the beneficiaries. Communities may have good information about the poor and the kinds of life shocks they experience. The community can also play an active role in monitoring programs-since they live where services are delivered-nd can even be involved in delivering the benefits. However, the community is not a single entity. Different stakeholders have different concepts of what constitutes poverty. Selecting beneficiaries becomes a collective-action problem and compromises the position of key community members. At the same time, connections through kinship and networks play a role in community decision-making (Alatas, Pradhan and Rao, 2006). In such a set-up, it is important to balance the gains from utilizing local information with the possible costs of local rent-seeking and elite capture of benefits. Conning and Kevane (2002) point out that community targeting can be more effective than outside agency when they have egalitarian preferences, open and transparent systems of decision- making, and clear rules for determining who the poor are. The best system should include hybrid mechanisms whereby the center defines and monitors targeting instead of solely relying on the community for control and selection.
The quality of household targetlng systems depends on the quality of the management informatlon system. Several issues need to be taken care of in designing a successful household targeting system. It is important to have a consolidated national database to avoid duplications and track beneficiaries. This database should be designed flexibly enough to serve multiple social programs. In addition, proper identification of individuals/households, preferably through unique social identification numbers, is crucial in linking registry information and beneficiaries with other systems and programs. While the actual design and implementation of household targeting systems vary significantly by country, most systems involve the following steps: (i) collecting data on specific (potentially eligible) households via interviews (and sometimes home visits) using pre-designed questionnaires (which depend on the type of household assessment mechanism); (ii) entering these data into a unified household information registry (with varying degrees of verification and consistency checks); (iii) comparing household characteristics with pre- established eligibility criteria (program-specific); and (iv) establishing program-specific beneficiary lists (sub-registries) for the purposes of program implementation and benefit payment (Castaneda and Lindert, 2005).
Indonesia took a big step forward recently in attempting to put together such a unified targeting registry wlth the compilation of a household database for the UCT program. In order to target the UCT program, Indonesia rapidly put together a database of poor and near-poor households using a combination of geographic, community-based and household targeting techniques. Initially, 15.5 million households were distributed cards, but later around 600,000 cards were cancelled following verification of eligibility. Upon
197

MAKING THE NEW INDONESIA WORK FOR THE POOR
opening up the registry for additional household applicants, an additional 3.7 million households of a total 12.2 million applicants were entered into the registry and will be beneficiaries, bringing the total registry up to 19.2 million households.
indonesla’s rapld development of a targeted household reglstry has imparted some key lessons and an assessment shows scope for Improvement. To some extent, the necessarily rapid roll-out of the targeted registry led to some inadequacies in the process of developing the household registry and to some shortcomings in the resulting database (see Box 6.8 on the poverty-targeting database). In particular, analysis of recent data as part of the assessment of the UCT program shows that there is substantial room for improving targeting. Both the under-coverage error and leakages error are high. Whereas the UCT program was targeted to the lowest 30 percent of households, survey data analysis indicates that only 45 percent of this group of households received the benefits, translating into 55 percent of under- coverage error. At the same time, the leakages e r ro r40 percent of the upper 70 percent of the population received benefits. By international standards, this would indicate room for improvement (see Table 6.7). Nevertheless, the targeting performance of the UCT program is better than that for health cards. While health cards can potentially reach 100 percent of the poorest decile, in reality only around 22 percent of them actually received cards.
Table 6.7 International comparison of targeting performance for cash transfer programs
Share of transfers going to :
10 percent 20 percent 40 percent Country Name of program Poorest Poorest Poorest
(%I (%I ( %I 1 Dominican Republic Cash transfer 60.0 2 Chile SUF cash transfer 57.0 83.0 3 Nicaragua RPS conditional cash transfer 32.6 55.0 80.9 4 Honduras PRAF cash transfer 22.1 42.5 79.5 5 Mexico Progresa conditional cash transfer 22.0 39.5 62.4 6 Indonesia Unconditional cash transfer 20.8 35.6 61.3 7 Brazil Bolsa Familia conditional cash transfer 73.0 94.0
Source: Coady, et al, 2004. Data for Indonesia are extracted from Susenas 2005 panel data and represent the percent of poorest households. The data for Brazil are taken from World Bank. 2006.
Some concrete steps can be taken to improve the UCT program database to make it the basis of a unified household targeting system. Close analysis of the database and the methodology used to derive the targeting mechanisms, while pointing to some of the weaknesses discussed, also point to some clear solutions: (i) devise a better scoring system, a better questionnaire and weights; (ii) combine proxy means test (PMT) targeting with geographic targeting by using geographic quotas based on estimates from poverty mapping: (iii) re-verify the eligibility of current beneficiaries based on the new scoring system; (iv) do an additional survey sweep in sub-districts with high poverty densities and high exclusion rates; and (v) resolve the ID problem. Coming up with technological solutions, such as fingerprinting, may be necessary in order to resolve problems of identification.
198

Chapter 6 Making Social Protection Work for the Poor
~~
Box 6.7 Poverty targeting database
Given the imperatives of rolling out the UCT program in conjunction with the fuel price increases of October 2005, the government worked rapidly with the BPS to compile a poverty-targeting database. This database was compiled uslng the following steps. First, survey rosters were developed through community-level identlfication of poorer households (usually by the administrative head of neighborhood). Second, a proxy means test of 14 questions was administered to these identified households. Third, these data were centrally analyzed and scored. Fourth, a cut-off point was drawn that identified beneficiaries. Fifth, in distributing beneficiary cards and vouchers to these households, enumerators were to verify that households met the criteria.
Whlle ail agencies invoked are to be commended for the rapid ro ikut of the UCT program, the expedlted schedule did result in some shortcomings, both technical and institutlonaL The BPS put a commendable amount of thought into the task, including selecting the variables using discriminant/logit models and taking into account regional disparities by doing the analysis separately for each district. However, due to time constraints, some sacrifices were made and resulted in discrepancies in comparisons with the gold standard of proxy means testing. The weights were not determined based on the results of the models but instead based on the standardized value of the mean of the selected 14 variables for the poor households. Due to time limitations in conducting the survey, the BPS also rationed the length of the questionnaire into a onepage questlonnaire, limiting the number of variables and sacrificing accuracy in the process. Moreover, there was often not time for enumerators to complete the secondary verification. The high under-coverage of the poor also indicates that the premise that community leaders know better the local conditions of community members and are prepared to convey accurate information needs to be reevaluated.
After the resulting database Is verified, updated, and refined, It Is Important that it is malntalned as an organic list that is frequently updated. Transitions in and out of poverty are common in Indonesia, as shown in previous sections. Verification, updates and re-certifications are important for tracking fraud, and allowing for turnover in beneficiaries. If the database is to be used more widely for sector programs targeting specific demographic target groups (e.g. infants, the disabled, children and the elderly), it will also be important to collect basic information about household members in the form of a household roster. In the future, this organic database and ranking can also provide the government with a continuous ordering of the poor and near-poor with various income and non-income dimensions of poverty to serve multiple social programs with differing thresholds for eligibility. Database management should be designed to allow flexible responses to changing policies and updates with the pre-testing of systems, well-designed manuals and adequate training for users.
Clarity on the Objectives of different social protection instruments Is critical In determining what type of targeting is appropriate and will lead to greater effectiveness. For example, for interventions aimed at helping households manage the acute losses from economic risks such as labor-intensive and cash-for- work, self-targeting is the most effective way to ensure that benefits reach those most in need. This type of risk-pooling mechanism will fail in meeting its consumption-smoothing objective (objectives (ii) and (iii) in Section IV) if it relies heavily on any type of administrative targeting, no matter how efficient. In sharp contrast, for those elements of the package aimed at preventing the longer-term, chronic disadvantage and vulnerability of households (objective (i) in the list in Section IV), administrative targeting is highly effective.
V Conclusion: Towards a ThirdGeneration System
Almost half the population of Indonesia Is either poor or vulnerable to poverty. With 49.0 percent of the population living on or below the US$2-a-day level, many Indonesians are vulnerable to shocks that could either make their poverty deeper, or drag them from near-poverty into poverty. While this in itself is of major concern, policy-makers in Indonesia also worry that shocks to poor or near-poor households can force them into using ‘bad coping’ strategies that erode their human capital and make it harder for them to escape from poverty subsequently. Therefore, protecting the poor and near-poor in Indonesia from shocks is an important component in any comprehensive poverty reduction strategy. Having experienced
199

MAKING THE NEW INDONESIA WORK FOR THE POOR
a highly turbulent decade triggered by the 1997/98 financial crisis, there is now growing interest among policy-makers in Indonesia in establishing a national social protection system to protect the vulnerable from future shocks and thereby contribute towards Indonesian poverty reduction goals.
Indonesia now has a window of opportunlty to establish a welldesigned social protection system. The combination of the government’s decision to reallocate fiscal resources away from regressive universal commodity subsidies, together with the growing recognition-even in the wake of the crisis-that there continues to be a critical need to protect the poor and near-poor from risks and lower their vulnerability, provides Indonesia with a unique opportunity. It is now possible to start to put into place a well-designed and effective social protection system that addresses the specific problem of vulnerability in Indonesia.
The time is right for Indonesia to move on to a third-generatlon social protectlon system. Similar to many developing countries, Indonesia has traditionally chosen to use universal commodity price subsidies, particularly through fuel products, as its major social protection strategy. Later, from the crisis through to 2005, the government employed a social protection system that was a mixture of universal subsidies and targeted safety net programs developed in the wake of the crisis. These short-term temporary targeted programs, such as Raskin (subsidized rice for the poor), educational scholarships and health cards, can be considered an attempt to establish a second-generation social protection system better geared to the needs and vulnerabilities of the poor. While undoubtedly an advance on universal subsidies, evaluation of these second-generation programs indicates that they require considerable improvement if they are to continue, as well as an improved performance in targeting. However, with the move away from burgeoning fuel subsidies in 2005, Indonesia is now ready to move on towards a more effective third- generation social protection system that is more comprehensive and better matched to the actual risks and vulnerabilities faced by Indonesia’s poor and near-poor.
The first step In developing a coherent social protection system is to understand the risks and vulnerabilities faced by poor and near-poor households. Section Ill of this chapter undertakes a risk and vulnerability assessment (RVA) for Indonesia. The implications of this RVA are important in pointing to ways of designing social protection policies for Indonesia. There are four primary findings: (1) given the similarities between the poor and the near-poor, both of these groups can be considered as one in addressing broad risks and vulnerabilities; (2) both the vulnerability profile and an assessment of the nature of shocks point to four primary sources of vulnerability that should be the focus of any social protection system in Indonesia. First, the risks to earning capacity and income are significantly higher among poor households. Second, there is evidence of relatively higher risks to children’s future earnings ability and welfare following shocks among poor and near-poor households. Third, health shocks are a particularly important source of vulnerability among poorer households. Finally, a further significant shock reported by households comes from losses stemming from changes in government regulations; (3) there is little evidence that the risk factors that arise with ageing are a major factor in contributing to household vulnerability; and (4) greater access to safe, competitively provided financial forms of saving, and formal risk-pooling is likely to aid household risk management considerably. This is because currently shocks among poor and near-poor households lead to the most severe cuts in food spending (Le. ‘bad coping’ strategies).
There needs to be a closer connection between social protectlon objectives and programs. The objectives of Indonesia’s crisis-era social safety net (JPS) are generally well-aligned to: (i) alleviate poverty by raising the consumption levels of the poor; (ii) prevent the near-poor from falling into poverty; and (iii) help poor and near-poor households to mitigate losses of income in the wake of shocks. However, the structure of the JPS muddles these objectives. Consequently, there is currently a mismatch between needs and many existing social protection programs. Looking forward, while the three objectives are sound, greater clarity is required on how each is best pursued.
Towards a natlonal social protection system that makes sense for indonesla. There is a clear need for more effective, public risk-pooling mechanisms to augment household risk management options, given the limited reach of private formal risking-pooling. Second, there is evidence that households would benefit from more efficient provision of privately provided risk-pooling and savings instruments, in particular safe but sophisticated and competitively priced financial instruments. Third, the chronic disadvantages that make the poor and near-poor most vulnerable call for more extensive and effective
200

Chapter 6: Making Social Protection Work for the Poor
prevention efforts. The first and the third of these three areas point towards the implementation of a three-pronged social protection strategy, as follows.
A four-pronged approach would form the core of a national social protection strategy. These four prongs would be: (i) a conditional cash transfer (CCT) program (‘cash for education and health’); (ii) a workfare program (‘cash for work’); (iii) a health insurance program; and (iv) rice price stabilization. The first addresses the ‘bad coping’ that can hinder human development outcomes. The second protects the poor against earnings and income shocks that are all too common for those working in informal and self- employed jobs, The third protects from one of the most frequently reported shocks by the poor, namely health-related shocks. The fourth prevents large increases in rice prices that are so harmful to the poor.
The government will also need to consider which existing social protection and social safety net programs it may need to cut. In order to develop the above three programs it will also be important for the government to streamline Indonesia’s existing programs in order to better address the most important risks and vulnerabilities that affect the poor and near-poor. Programs that do not address the major risk and vulnerability issues, such as some small safety net, subsidy and transfer programs, should be reviewed and possibly phased out.
201

MAKING THE NEW INDONESIA WORK FOR THE POOR
. < an Innovation ~ ’
Poverty maps: A powerful tool in targeting the poor
What are poverty maps? Poverty maps are a visual presentation of the spatial incidence of poverty that can facilitate more finely focused pro-poor interventions and guide the allocation of public spending to reduce poverty. A poverty map will be most useful if it can provide information at a fine level of geographic disaggregation. The innovation of the ‘small-area estimation’ method enables the creation of statistically accurate maps at much smaller administrative units than those given by household surveys or composite indices, such as the Human Development Index (HDI) or other basic needs indicators.
Small-area estimation maps Small-area estimation maps create detailed maps that that are accurate to the sub-district level. The unique aspect of this ‘small-area estimation’ method is that it enables the creation of statistically accurate maps at much smaller administrative units than ‘first generation’ poverty maps, which relied upon composite indices such as the HDI or other basic needs indicators. However, small-area estimation is technically more complex to undertake than mapping using composite indices.
The technique involves combining census data with household survey data, such as the Susenas. A model that identifies a relationship between Susenas and census variables is created and then applied to the census data, since they cover many more households than the Susenas. These household data can then be aggregated into sub-district findings and applied to a mapping program to show spatial distributions of poverty among all sub-districts in the country.
In Indonesia, poverty maps reliable down to the kecarnatan level-and even the kelurahan level for Java-have been developed by a small number of organizations, including the SMERU Research Institute and the Central Bureau of Statistics (BPS). While their development requires skills in the areas of geographic mapping and statistical analysis, the most severe constraint to date may be lack of funding and lack of time. Poverty maps can take up to six months to create and are expensive, and both SMERU and BPS received external funding.
However, poverty maps have limitations. While they are effective at identifying poverty correlates or geographical targeting of programs, they do not identify the causes of poverty, and are therefore less useful for project design.
202
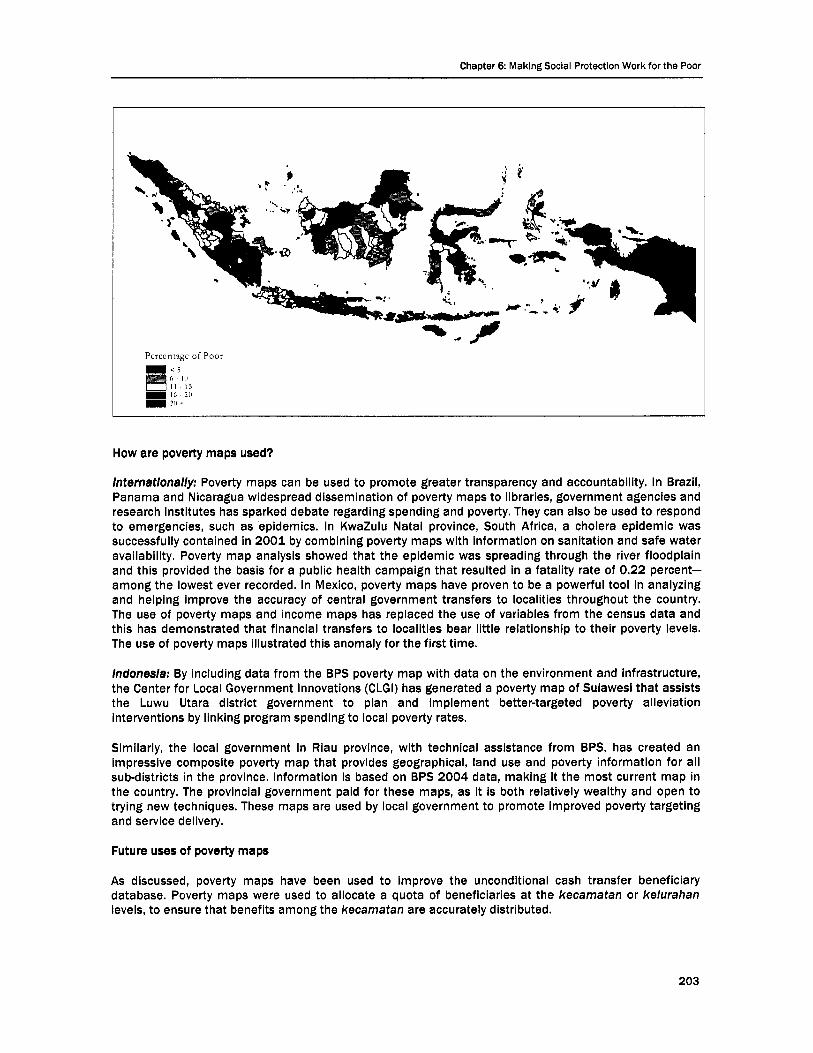
Chapter 6 Making Social Protection Work for the Poor
How are poverty maps used?
Internatlonally: Poverty maps can be used to promote greater transparency and accountability. In Brazil, Panama and Nicaragua widespread dissemination of poverty maps to libraries, government agencies and research institutes has sparked debate regarding spending and poverty. They can also be used to respond to emergencies, such as epidemics. In KwaZulu Natal province, South Africa, a cholera epidemic was successfully contained in 2001 by combining poverty maps with information on sanitation and safe water availability. Poverty map analysis showed that the epidemic was spreading through the river floodplain and this provided the basis for a public health campaign that resulted in a fatality rate of 0.22 percent- among the lowest ever recorded. In Mexico, poverty maps have proven to be a powerful tool in analyzing and helping improve the accuracy of central government transfers to localities throughout the country. The use of poverty maps and income maps has replaced the use of variables from the census data and this has demonstrated that financial transfers to localities bear little relationship to their poverty levels. The use of poverty maps illustrated this anomaly for the first time.
Indonesia: By including data from the BPS poverty map with data on the environment and infrastructure, the Center for Local Government Innovations (CLGI) has generated a poverty map of Sulawesi that assists the Luwu Utara district government to plan and implement better-targeted poverty alleviation interventions by linking program spending to local poverty rates.
Similarly, the local government in Riau province, with technical assistance from BPS, has created an impressive composite poverty map that provides geographical, land use and poverty information for all sub-districts in the province. Information is based on BPS 2004 data, making it the most current map in the country. The provincial government paid for these maps, as it is both relatively wealthy and open to trying new techniques. These maps are used by local government to promote improved poverty targeting and service delivery.
Future uses of poverty maps
As discussed, poverty maps have been used to improve the unconditional cash transfer beneficiary database. Poverty maps were used to allocate a quota of beneficiaries at the kecamatan or kelurahan levels, to ensure that benefits among the kecamatan are accurately distributed.
203
Chapter 6: Making Social Protection Work for the Poor
Poverty maps could also be used for project implementation. For example, the recently announced national community empowerment program that will provide small block grants to villages throughout the country could benefit from the use of poverty maps to help identify the poorest sub-districts in the country in a more systematic manner. Recent studies indicate that while the allocation of resources under the existing Kecamatan Development Program (KDP) is pro-poor, the targeting of resources could have been improved further through an improved regional targeting strategy using poverty maps (Alatas, 2005).
Local governments and NGOs could use poverty mapping to target their activities more precisely in the future. Many local governments recently interviewed had not heard of poverty mapping techniques. Their routine use could enable institutions to more precisely and cost-effectively target the poor.
Sources: (a) Aiatas. Vivi(2005), "An Evaluation of Kecamatan Development Project", Mimeo, World Bank Office Jakarta. (b) Ahmad, Yusuf, and Goh, Chorching. Indonesia's Poverty Maps: impacts and Lessons (draft mimeo), Washington, DC. World Bank, May 2006. (c) Coudouel, Aline, Poverty Maps for Poiicy-making: Beyond the Obvious Targeting Applications (presentation), World Bank, Washington, DC, 2006. (d) Henninger, Norbert and Mathlide, Snel, Where are the Poor: Experiences with the Development and Use of Poverty Maps, World Resources institute, Washington, DC. 2002. (e) Interview with Dipayan Bhattachatyya World Food Programme, 5 December, 2005. (f) Interview with Bina Desa, 25 November, 2005. (g) interview with Eko Susi Rosdianasari, information Specialist, Centre for Local Government Innovations. 10 December, 2005. (h) Interview with Dedi Walujadi Central Bureau for Statistics (BPS), 12 December, 2005. (i) Interview with Mario Boccucci, World Bank, 15 November, 2005. (j) Snel Mathiide, Ballance Anna, Workshop on the Impacts of Poverty Maps: Past Experiences and New Applications, 2004. (k) Szekely, Miguel, income/Consumption Maps: A Powerful Tool for Increasing Policy Effectiveness (presentation), World Bank, Washington, D.C., 2006. (h) Vishwanath, Tara, Poverty Maps: Uses and Caveats (presentation), World Bank, Washington, DC. (i) World Resources institute, 2005 (http://[email protected])
204

MAKING THE NEW INDONESIA WORK FOR THE POOR
Where has all the Raskin gone? Improving the effectiveness of the subsidized rice distribution program
With coverage of 57 percent of the poor, the Raskin (beras rnlshin) program has been one of the most important components of the government’s social protection system.165 Introduced as the operas1 pasar (OP) program in mid-1998 at the peak of the crisis, Raskin delivers subsidized rice to poorer households. However, it has been criticized for weak targeting and excessive leakages.
Under the Raskin program, the National Logistics Board (Bulog) planned to distribute about 2 million tons of subsidized rice to some 8.3 million households in 2005. Each selected household is supposed to have received 20kg of rice per month at the subsidized price of Rp 1,000 per kg. The rice is purchased by Bulog from wholesalers at a price determined annually by presidential decree (Inpres)166 using a budget allocation from the government to Bulog to cover the cost of the The price paid to Bulog for each kg of rice in 2005 was Rp 3,351 per kg, equivalent to a 2005 budget allocation of Rp 4.7 trillion.i68 The compensation program associated with the removal of the fuel subsidy in 2005 added a further Rp 765 billion to the 2005 Raskin budget.
The poverty targetlng of the Raskin program
Raskin reaches more than half of the poorer households in the country, making it an important instrument of social protection. However, it delivers rice to far more non-poor households than poor households, such that only around a quarter of all recipient households are classified as poor. The pie chart below shows that, of the Rp 4.7 trillion allocated to the program in 2005, only about one-fifth was actually received by the poor. The bulk (52 percent) went to the non-poor and more than a quarter of the money went to Bulog to cover operational running costs.
Distribution of the Raskin subsidy to the poor, the non-poor and Bulog
Operatlng Costs and BULOG Profit
Source: World Bank staff calculations.
205

MAKING THE NEW INDONESIA WORK FOR THE POOR
Leakages In the Raskln program
The three types of leakage in Raskin are lost rice, ‘lost’ money and high mark-up prices.
Lost rlce: Bulog distributes rice to distribution points in villages and sub-districts throughout the country, and leakages of rice occur at various levels in the distribution process. Comparing official administrative data on amount of rice distributed with the data from household surveys on the amount actually received by households, Olken (2005) finds that about 18 percent of the rice went missing.169 Olken estimates that the welfare losses from corruption may be so large that they offset the potential welfare gains of the program. An updated estimate of leakages calculated in 2006 using the same methodology it was found that more than 30 percent of rice went missing between Bulog’s warehouses and the households receiving it from November 2003 to January 2004.
This loss is equivalent to 164,000 tons of rice valued at Rp 433 billion (US$43 million). However, there is a wide variation in leakage by province (see map below): the greatest leakage is in Banten, where more than 75 percent of the Raskin was lost, and in another six provinces the leakage rates were over 50 percent. However, in six other provinces less than 10 percent of the rice went missing.
Missing rlce by provlnce (%)
Source: Susenas. 2004.
In addition, rice never reaches the poor in some areas because of the allocation mechanism used at the village level. In theory, rice is only supposed to be given to pre-welfare and welfare households (according to the BKKPN’s classification of households). However, in some places allocations are given out to all village members, or by alternative non-transparent allocation mechanisms. As a result, the amount received by households is typically much less than 20 kg. Surveys suggest that sometimes it can be as little as 5-6 kg, greatly diluting the benefit to poor househo1ds.170
‘Lost’ money: Distribution of the rice from the village (desa) or outside Java the subdistrict (kecamatan) level down to households is conducted by teams of village officials.171 The media have reported cases where village heads collected money from poor households and never paid Bulog for the rice received. However, a lack of transparency in the amounts of rice allocated to sub-districts or villages undermines the ability of poor communities to hold Bulog and village officials accountable.
In Madiun district, East Java, Ngawi village had the highest debt amount to Bulog for the rice distributed with their debt arrears at Rp 19.2 million. While the money is collected from villagers at the point of distribution by the village officials, Bulog has not received the money and is currently halting further allocations of subsidized rice to the village. (Media Indonesia, 25 January 20064172
206

Chapter 6: Making Social Protection Work for the Poor
The poor pay more: In many cases, the poor were asked to pay more than the Rp 1,000 per kg amount mandated by the program in 2005. On average, Raskin recipients had to paid an extra 19 percent ‘operational costs’ or some Rp 30.5 billion (US$3 million) between November 2003 and January 2004 (Susenas, 2004). The highest average mark-up was observed in Jakarta, where recipients paid Rp 2,900 for Raskin rice-almost three times the official price.
In many cases, mark-ups are far higher than justified by the costs of transpottation from distribution points to households. For instance, the estimated transportation costs to selected villages in Bengkulu were Rp 20-Rp 150 per kg, while most recipients in Bengkulu paid Rp 150 higher than even the highest estimate of transportation costs.
Reforms are needed to make Raskin work for the poor
It would be wrong to abolish Raskin, but some critical reforms should be considered.
Identifying clear lines of accountability within Bulog is a key first step in stemming losses. It is crucial to clarify responsibilities and penalties associated with corruption in program implementation. The creation of an investigative team at the highest level could send a message that corruption will be seriously punished by Bulog’s senior management.
Improving transparency regarding rice allocations and benefit amounts would increase community participation in the distribution process and reduce leakages at the village level. In addition, formalizing the rules regarding the operational costs for distributing the rice would give certainty to the Raskin selling price, avoiding misuse and mark-ups.
Independent monitoring should be encouraged. In this context, the government could undertake a study to identify the districts in which most leakages occur and try to pinpoint the biggest holes in the system. Understanding the incentives of officials involved in the program would also be useful in tackling the underlying causes.
Involving the private sector in the distribution process. Most villages in Indonesia well served by private rice traders. It therefore makes little sense for Bulog to play the same role as the private sector. If distribution costs were benchmarked by locality, then the private sector could compete for this business through a transparent bidding process. Thus, Bulog could devote its resources to managing and monitoring the performance of private operators rather than implementing the program itself. Only in remote areas where no private operators were willing to undertake distribution for a reasonable cost should Bulog continue to deliver rice directly.
207


Chapter 7 Making Government Work for the Poor

Chapter 7: Making Government Work for the Poor
I Introduction
With the launch of one of the biggest decentralization efforts In the world In 2001, It was Inevitable that Indonesia would experience some systemic challenges. Not all local governments were fully prepared for the new responsibilities that they had to shoulder, and some have had to focus on improving their capacity in order to fully take up their new obligations to provide basic service delivery. Five years on, the roles and responsibilities of different levels of government remain unclear in some cases. The system of unconditional and conditional block grants to district and municipal governments is still in its infancy, while resource flows to districts and municipalities (and ultimately to frontline service providers) remain fragmented, making it more difficult for beneficiaries to demand the accountability that should accompany decentralized decision-making. Furthermore, accountability of service providers to higher levels of government has also become less clear.
Together with decentralization, political democratization has recently been Introduced. The highly centralized and authoritarian approach of the Soeharto era brought with it a centralized approach to service provision that is now undergoing fundamental change. Following the economic and political crises of the late 199Os, the political process has become more democratic all the way down to the district level. There has been a move towards multi-party politics, with the direct election of the president, and at the district/municipal level, with the election of legislative assemblies (DPRD I and 11) and the direct election of district leaders (bupati in districts and walihota in municipalities). These transitions have had two impacts. First, they have allowed regions to articulate their own preferences and priorities for public investments. Second, they have created new ways of holding policy-makers accountable. Local-level democratization has also resulted in increased popular participation in some aspects of service provision. This is clearest in the case of education, where parent and community participation has been strengthened in newly reinvigorated school committees in some localities (World Bank, 2006k).
Indonesia has come a long way In the past ten years in Instltutlonalizlng democratic norms. Not only are there direct elections for both the executive and legislative branches at the national, provincial and district levels, but these elections are now contested by many political parties or, in the case of executive positions, by coalitions between parties. In 1996, as had been the case since 1975, only three political parties were allowed to legally functioMolkar, in effect the New Order regime’s political vehicle; the United Development Party (PPP); and, the Indonesian Democratic Party (PDI). In the last general election of the Soeharto era in early 1997, Golkar won almost three-quarters of the popular vote-but the ruling party effectively had even greater control in the DPR, because 15 percent of the seats (75 seats) were set aside for the military. In contrast, in the most recent legislative elections, over 20 parties competed for seats and 17 parties won at least one seat in the DPR, with seven parties winning 45 seats or more (KPU, 2005).173 The DPR today is no longer dominated by one party-coalitions have to be formed in order to draft legislation and the incumbent president’s party has only about 10 percent of the total 550 seats. As a result, the DPR is no longer a rubber stamp for executive decisions-laws, plans, and budgets are all now effectively negotiated between the executive and legislative branches.
209
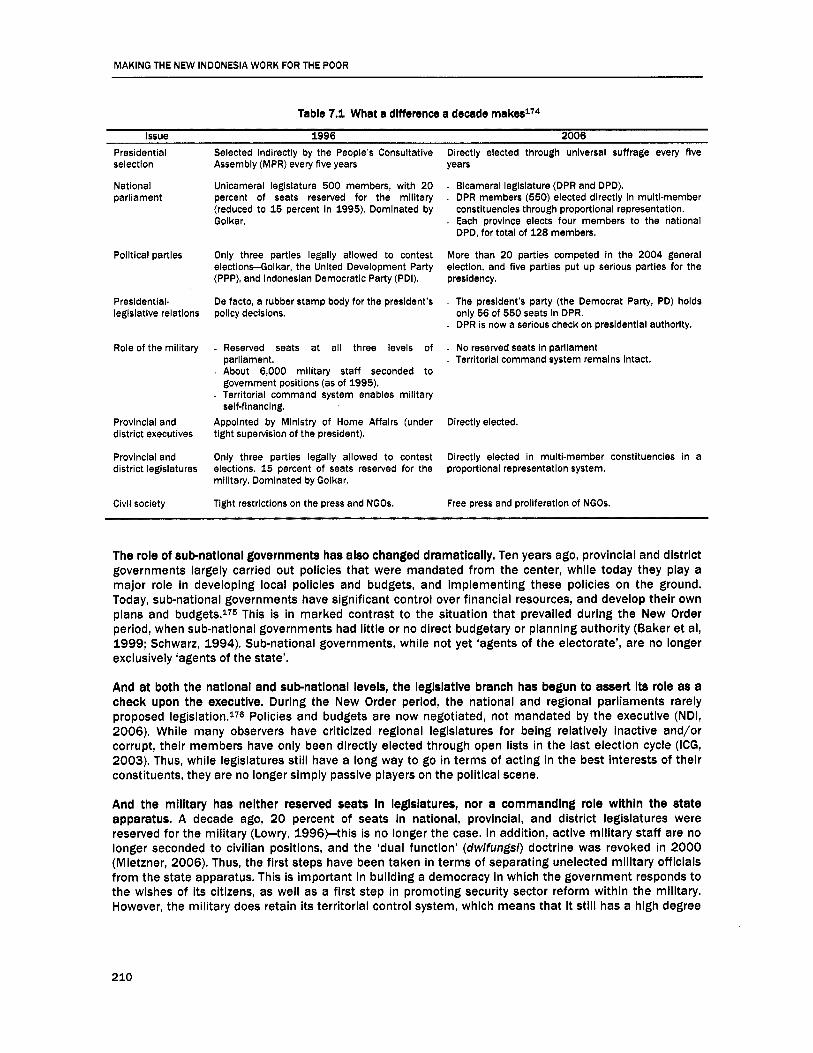
MAKING THE NEW INDONESIA WORK FOR THE POOR
Table 7.1 What a difference a decade
Issue 1996 2006 Presidential selection
National parliament
Political parties
Presldential- legislative relations
Role of the military
Provincial and district executives
Provincial and district legislatures
Civll society
Selected Indirectly by the People’s Consultative Assembly (MPR) every five years
Unicameral legislature 500 members, with 20 percent of seats reserved for the military (reduced to 15 percent in 1995). Dominated by Golkar.
Only three parties legally allowed to contest elections-Golkar, the United Development Party (PPP), and Indonesian Democratic Party (PDI).
De facto, a rubber stamp body for the president’s pollcy decisions.
Directly elected through universal suffrage every five years
- Bicameral leglslature (DPR and DPD). - DPR members (550) elected directly in multi-member
constituencies through proportional representation. - Each province elects four members to the national
DPD, for total of 128 members.
More than 20 parties competed in the 2004 general election, and five parties put up serious parties for the presidency.
- The president’s party (the Democrat Party, PD) holds only 56 of 550 seats In DPR.
- DPR is now a serious check on presidential authority.
- No reserved seats In parliament - Territorial command system remains intact.
- Reserved seats at all three levels of parliament.
- About 6,000 military staff seconded to government positions (as of 1995).
- Territorial command system enables military self-financing.
Appointed by Ministry of Home Affairs (under tight supervision of the president).
Only three parties legally allowed to contest Directly elected in multi-member constituencies in a elections. 15 percent of seats reserved for the milltary. Dominated by Golkar.
Tight restrictions on the press and NGOs.
Directly elected.
proportional representation system.
Free press and proliferation of NGOs.
The role of subnatlonal governments has also changed dramatically. Ten years ago, provincial and district governments largely carried out policies that were mandated from the center, while today they play a major role in developing local policies and budgets, and implementing these policies on the ground. Today, sub-national governments have significant control over financial resources, and develop their own plans and b ~ d g e t s . 1 ~ ~ This is in marked contrast to the situation that prevailed during the New Order period, when sub-national governments had little or no direct budgetary or planning authority (Baker et al, 1999; Schwarz, 1994). Sub-national governments, while not yet ‘agents of the electorate’, are no longer exclusively ‘agents of the state’.
And at both the national and subnatlonal levels, the leglslatlve branch has begun to assert Its role as a check upon the executive. During the New Order period, the national and regional parliaments rarely proposed legislation.i76 Policies and budgets are now negotiated, not mandated by the executive (NDI, 2006). While many observers have criticized regional legislatures for being relatively inactive and/or corrupt, their members have only been directly elected through open lists in the last election cycle (ICG, 2003). Thus, while legislatures still have a long way to go in terms of acting in the best interests of their constituents, they are no longer simply passive players on the political scene.
And the military has nelther resewed seats In legislatures, nor a commanding role within the state apparatus. A decade ago, 20 percent of seats in national, provincial, and district legislatures were reserved for the military (Lowry, 1996bthis is no longer the case. In addition, active military staff are no longer seconded to civilian positions, and the ‘dual function’ (dwifungs,) doctrine was revoked in 2000 (Mietzner, 2006). Thus, the first steps have been taken in terms of separating unelected military officials from the state apparatus. This is important in building a democracy in which the government responds to the wishes of its citizens, as well as a first step in promoting security sector reform within the military. However, the military does retain its territorial control system, which means that it still has a high degree
210
Chapter 7: Making Government Work for the Poor
of autonomy from civilian control and continues to engage in income generating activities that compromise its professionalism (Mietzner, 2006).
However, having shifted from being a ‘development state’ to a ‘democratic state’, Indonesia faces many challenges that are common to transitional societies. While a large majority of Indonesians polled recently said that they were in favor of the current democratic system,L77 there is also widespread frustration with ongoing corruption, weak formal sector job growth and a sense that the possibilities inherent in a democratic transition have not been fully realized (Robison and Hadiz, 2004). While citizens are free to demonstrate and the press is largely free to write what they want, many citizens are still subject to arbitrary decisions and/or rent-seeking by government officials, the police and the legal system (World Bank, 2004). It is still common for citizens to be required to pay bribes in order to acquire permits and settle legal disputes, for example.
Decentralization has resulted in less accountability of front-line service providers to central ministries, but thls has not yet been effectively substituted for by enhanced accountability to iocallyelected officlais or citizens. Money politics continues to be a serious problem at both local and national levels (IFES, 1999), and many analysts note that, although electoral reforms were introduced in 2003 to make parliamentarians more accountable to their constituents,17* they remain beholden to party bosses who place them on party electoral lists (ICG, 2004). Thus, while the promise of democratization and decentralization was that elected officials and civil servants would become more directly accountable towards the citizens they serve it is at best debatable whether this has yet happened in the majority of localities in the country.
This weak accountability to citizens Is exacerbated by a lack of clarity regarding functional allocations between central and subnational governments, making it difficult to hold elected officials and civil servants accountable for their actlons. While decentralization has placed significant administrative and fiscal authority in the hands of sub-national governments, the division of responsibilities and authority among central, provincial and local governments (not to mention service providers and communities), remains unclear in many cases (see Section Ill for more details). For example, both central ministries and local governments currently provide or facilitate services to clients. This creates significant accountability problems, as service providers are responsible to both central and local governments, but in many cases held accountable by neither.
And, In any case, lndonesla has moved from ‘first’ to ‘second’ generation poverty problems that are harder to address through the type of topdown planning and budgeting system that prevailed during the New Order period. While the New Order government was very successful at dramatically increasing the quantity of services-in the form of roads, schools, or health centers-these services were often neither of high quality, nor tailored to the specific needs of individual regions. For example, while there was a vast expansion in the number of teachers and healthcare workers, many providers were poorly trained, often did not (and still do not) regularly show up for work (World Bank, 2006k). These ‘second generation’ challenges mean fixing problems that have to do with the ‘software’ of government, namely training civil servants, and motivating them and supervising them appropriately. Ensuring that a well-trained, motivated teacher is in the classroom every day is in many respects more difficult than building the classroom.
Measuring the performance of government in this process of change Is far from easy or straightforward. Figure 7.1 illustrates that there was no clear trend in governance for Indonesia over the period 1996- 2004. It illustrates governance trends through (selected) indicators in voice and accountability, political stability and regulatory Each dimension of governance affects the environment and setting for both demand- and supply-side poverty interventions. However, several of the recent changes are notable: improvements in voice and accountability reflect the impacts of the post-crisis upheaval, with the subsequent emergence of a democratic, decentralized Indonesia and the return of political stability following a free-and-fair election process. Regulatory quality, however, remains weak. This situation directly affects investment and perceived competitiveness, and ultimately the overall performance of government at all levels in serving the citizens of Indonesia.
211

MAKING THE NEW INDONESIA WORK FOR THE POOR
Figure 7.1 Governance indicators for Indonesia Figure 7.2 Three key areas of government action
Incentives and Skills
0 5
z - 0 5
" J -1 -
; - 1 5 -
-2 - n! Voice and Pccountability +Political Stability -CrReguiatolyQuailty
Source WBI Governance hdicalon.2ffl lFartidpation a n T Consultation
4
budgeting systems
Enhance assessment and monitoring of poverty reduction
Functions
Orientation
Good governance Is a critlcal ingredient for successful poverty reductlon. It is not just the level of spending or the focus of that spending (described in Chapter 5 on Public Spending and Chapter 6 on Social Protection) that determines impact, but also the way government spends that matters: how decisions are made, how effectively the funds move, how delivery processes are aligned and how well programs are monitored. There are both successes and blockages in the institutions, systems and procedures adopted by national and sub-national governments for poverty reduction. This chapter considers the key ingredients of the systems and procedures necessary for the government to implement poverty reduction objectives and recommends three areas of action for government. Figure 7.2 sets out these areas of action and highlights the four recurring themes of the chapter.
I1 Policy, Planning and Budgeting Systems
The alignment of pollcy, planning and budgeting systems has a major Impact upon poverty reductlon outcomes. The systems for planning and budgeting at the national level have faced challenges, most importantly in ensuring that the priorities as outlined in medium-term and annual plans are properly aligned with the budget. Moreover, since decentralization, it has become more complex to coordinate both these processes among different tiers of government. The result has been a less predictable environment for sector and local spending characterized by ad hoc decision-making and both overlaps and gaps in efforts to alleviate poverty.
At the national level, untll recently, systems have been characterlzed by aserles of structural challenges. These challenges include: unique and sometimes overlapping sector-based budget classifications; separate planning and budgeting systems managed by separate agencies (Ministry of Finance and Bappenas), which sometimes leads to overlapping routine and development expenditures; and a focus only on inputs.i*O All these structural difficulties accumulate to make it difficult to align ministry spending with government poverty reduction priorities. These factors have been exacerbated by the one-year budgeting time horizon, making it all but impossible to translate the most well-intentioned efforts into longer-term responses to address poverty.
212

Chapter 7: Making Government Work for the Poor
Table 7.2 Translating poverty reduction prlorltles and objectives Into results on the ground
Step Issue
1. Broad poverty reduction objectives are agreed upon by the president and the cabinet.
2. Each year, these objectives are translated into an overall plan with priorities by Bappenas (RKP) and into a sector- specific pian by each ministry (Renja-KL) based on indicative budget ceilings (pagu indikatif).
3. RKP priorities with fiscal policy and indicative ceilings are discussed with parliament and revised. Based on the revised ‘temporary’ ceiling (pagu sementara), ministries prepare a work pian and budget (RKA-KL) and the MoF prepares the draft budget.
4. This budget is submitted to parliament, where it is reviewed and revised in the Budget Committee, as well as individual commissions.
5. Following parliament’s approval of the budget, a presidential regulation (Perpres) formally appropriates budget resources (pagu definitif). Ministries prepare concept DlPA (the authority to spend allocated funds) and the Ministry of Finance approves.
ministries and by subnational governments. 6. Programs/activities are implemented by central sectoral
There may not be full agreement regarding ail objectives or how best to achieve them.
Ministries may not have any incentive to revise their sectoral priorities to reflect the poverty reduction objectives. Ministries are not required to include either program monitoring data or evaluation results, so ineffective programs can continue.
The transition from the RKP to Budget and Renja-KL to RKA-KL preparation is not seamless, so poverty-related programs and associated budget proposals may change (Bappenas prepares guidelines for Renja-KL and reviews the substance of ministry plans while the MoF prepares guidelines for RKA-KL and reviews to ensure adherence to budget ceilings and national price standards. Within most ministries, the planning unit coordinates preparation of the Renja-KL, while the finance unit coordinates preparation of the
Discussions with parliament may lead to budget revisions not consistent with the government’s poverty reduction priorities and objectives.
The transition from the RKA-KL to DlPA is not seamless, so poverty- related programs and corresponding budget allocation may change (DG Treasury has separate manuals, formats and computer applications). Delays in receiving DlPAs delay program implementation, potentially affecting effectiveness.
a. Subnational governments have their own priorities and plans, which may be at variance with national objectives (although this is a legitimate exercise of local planning and budgeting authority in a decentralized system by elected local leaders and parliaments).
b. Both central ministries and local governments implement, or facilitate implementation of, programs simultaneously in the same localities. They often fail to coordinate effectively together, creating gaps and overlaps in services to the poor.
R KA-K L).
There is a complex process of translating broad policy objectives into concrete results on the ground. Unlike the centralized policy and program implementation system that prevailed during the New Order period, today many actors play a role in devising policies and implementing them. Not surprisingly, with so many steps involved, broad priorities and policy objectives are translated in an uneven fashion into results on the ground.
Efforts to remove the structural constraints have been facilitated by both changes In leglslatlon and strengthened government leadership. The State Finance Law No. 17/2003 and accompanying regulations foresee significant reforms in the rules governing budget development (see Table 7.3). Progress has been made in developing a unified budget using internationally consistent economic and functional budget classifications. Starting in 2005, Bappenas was instructed by the cabinet to prepare a ‘prioritized’ annual government work plan (RKP) for 2006, and ministries were asked to develop sector plans (Renja-KL) within indicative ceilings jointly set by Ministry of Finance (MoF) and Bappenas. Moreover, ministry budget proposals now include multi-year costs and indicators by program. The higher levels of collaboration between Bappenas and the MoF are serving to ensure that allocations to ministries reflect the RKP priorities, including those relating to poverty reduction. These are important first steps towards greater accountability in planning and budgeting.
213
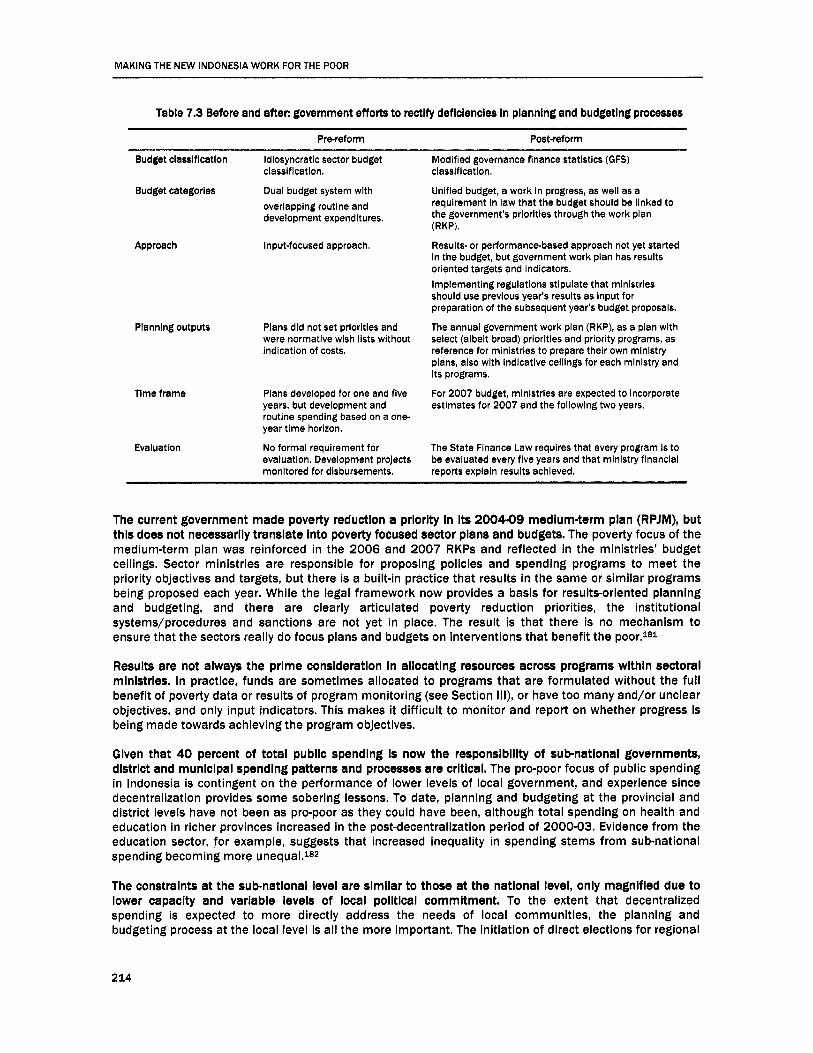
MAKING THE NEW INDONESIA WORK FOR THE POOR
Table 7.3 Before and after: government efforts to rectify deflclencles In planning and budgeting processes
Pre-reform Post-reform
Budget classlficatlon idiosyncratic sector budget
Budget categories
classification.
Dual budget system with overlapping routine and development expenditures.
Approach
Planning outputs
Time frame
Evaluation
Input-focused approach.
Plans did not set priorities and were normative wish lists without indication of costs.
Plans developed for one and five years, but development and routine spending based on a one- year time horizon.
No formal requirement for evaluation. Development projects monitored for disbursements.
Modified governance finance statistics (GFS) classification.
Unified budget, a work in progress, as well as a requlrement in law that the budget should be linked to the government’s priorities through the work plan (RKP).
Results- or performance-based approach not yet started in the budget, but government work plan has results oriented targets and indicators. Implementing regulations stipulate that ministries should use previous year’s results as input for preparation of the subsequent year’s budget proposals.
The annual government work plan (RKP), as a plan with select (albeit broad) priorities and prlority programs, as reference for ministries to prepare their own ministry plans, also with indicative ceilings for each mlnlstry and its programs.
For 2007 budget, ministries are expected to incorporate estimates for 2007 and the following two years.
The State Finance Law requires that every program is to be evaluated every five years and that mlnlstry financial reports explain results achieved.
The current government made poverty reduction a priority in its 200449 medium-term plan (RPJM), but this does not necessarily translate Into poverty focused sector plans and budgets. The poverty focus of the medium-term plan was reinforced in the 2006 and 2007 RKPs and reflected in the ministries’ budget ceilings. Sector ministries are responsible for proposing policies and spending programs to meet the priority objectives and targets, but there is a built-in practice that results in the same or similar programs being proposed each year. While the legal framework now provides a basis for results-oriented planning and budgeting, and there are clearly articulated poverty reduction priorities, the institutional systems/procedures and sanctions are not yet in place. The result is that there is no mechanism to ensure that the sectors really do focus plans and budgets on interventions that benefit the poor.l8I
Results are not always the prime consideration In allocating resources across programs within sectoral ministries. In practice, funds are sometimes allocated to programs that are formulated without the full benefit of poverty data or results of program monitoring (see Section Ill), or have too many and/or unclear objectives, and only input indicators. This makes it difficult to monitor and report on whether progress is being made towards achieving the program objectives.
Given that 40 percent of total public spending Is now the responsibility of subnatlonal governments, district and municipal spending patterns and processes are critical. The pro-poor focus of public spending in Indonesia is contingent on the performance of lower levels of local government, and experience since decentralization provides some sobering lessons. To date, planning and budgeting at the provincial and district levels have not been as pro-poor as they could have been, although total spending on health and education in richer provinces increased in the post-decentralization period of 2000-03. Evidence from the education sector, for example, suggests that increased inequality in spending stems from sub-national spending becoming more unequal.lS2
The constraints at the subnational level are similar to those at the national level, only magnified due to lower capacity and variable levels of local political commitment. To the extent that decentralized spending is expected to more directly address the needs of local communities, the planning and budgeting process at the local level is all the more important. The initiation of direct elections for regional
214

Chapter 7: Making Government Work for the Poor
government heads in 2005 is intended to improve political accountability which, when combined with incentives (such as conditional matching grants), may work to enhance the poverty focus of local government spending. But structural problems with district/municipal level planning and budgeting systems are compounded by the weak capacity in local government to manage these pr0cesses.~83 Plans and budgets are not usually supported by local-level poverty diagnostics and, where diagnostics do exist, these are not used for de~ision-making.l8~ Preparation of medium-term plans at the local level have been frequently ‘contracted out’ to universities or other organizations with the result that they are completed for official purposes but have little ownership by government officials.i85 The disconnect between plans (prepared by Bappeda)l86 and budgets (prepared by finance units) is equally problematic at the local level. Central government ministries exacerbate the inefficiencies and incapacity of local government by continuing to spend on local-level services, such as health and education, without coordinating effectively with the local governments mandated with the service delivery responsibility (see Chapter 5 on Public Spending). Performance-based budgeting was introduced in 2002 at the sub-national level, but has met with only limited success. There was neither sufficient socialization of the principles and concepts, nor sufficient training or support for their practical application.187
I Box 7.1 The challenges of Implementing good pro-poor planning and budgeting by subnational governments I The legal and regulatory framework for subnational planning and budgeting largely mirrors that at the national level. The National Development Planning Law (No. 25/2004) and the State Finances Law (No. 17/2003) and relevant regulations (Government Regulatlons [PPI No. 20 and No. 21) provide a somewhat coherent framework for subnatlonal planning and budgeting. The provisions of the new laws on regional autonomy (Regional Governance Law No. 33/2004) and Fiscal Decentralization (Law No. 33/2004) are generally consistent with the above laws.188 In practice, however, many subnatlonal governments face significant challenges to develop coherent plans and budgets. Reasons for this include:
Although there is a long history of formal bottom-up planning exercises, these were normally ineffective in involving the poor to Influence plans or budgets. Many planning documents are not of high quality, In part because subnational governments had only a minor role in planning and budgeting prior to decentralization. Planning and budgeting arrangements are less unified than at the central level.
Many local governments do not know the total amount of central transfers that they will receive and these transfers are often not disbursed In a timely manner.
Direct spending by central ministries in locallties makes It difficult t o coordinate local and central plans and budgets. There are no institutionalized mechanisms for citizen participation in the budget process.
Performance-based budgeting has been introduced, but there has not been adequate training and support for s u b national governments to be able to use it. Subnational governments have very limited monitoring systems to assess impact
Capaclty for translating priority objectives and targets into relevant and effective programs and actlvltles has varied by locale. Evidence from various districts/municipalities suggests that even where the medium-term and/ or annual plans set down results-oriented targets, service units (Dinas) have had difficulty in specifying how proposed programs and activities would contribute to the achievement of the targets (Kamelus, Ludwig, and Suhirman, 2004). An emphasis on good documentation of inputs and standard unit costs remains, with few sub-national government programs or projects moving towards a measurement of outcomes.i89
At present, the geographic ailocatlon of revenue to reglons In Indonesia Is not prepoor. Although about one-third of central government spending is allocated geographically across Indonesia through transfer payments to sub-national governments, this funding is not effectively used for poverty reduction (see Chapter 5 on Public Spending). The unequal distribution of the two largest transfers is the cause of the increasing inequality in this sub-national spending. Controlling for the amount of revenues received at the local level (aggregated at the provincial level), analysis shows that there is no relationship between health and education spending, and per capita expenditures by province. This suggests that low spending by sub-
2 15

MAKING THE NEW INDONESIA WORK FOR THE POOR
national governments post-decentralization is not as much determined by local decisions as by varying levels of revenue being channeled through established transfer mechanisms.
Evidence from the education and health sectors, for example, suggests that the Increased lnequallty In spending in these sectors at the provincial level stems from subnatlonai spending becoming more unequal, rather than the central government’s deconcentrated spending in the regions. In other words, while the increase in the central government’s deconcentrated spending has been neither strongly pro- poor nor pro-rich in terms of the provinces it has targeted in the period 2000-03, the richer provinces have posted greater increases in education and health spending than poorer provinces because of more province- and district-level spending. In Figure 7.3, a more positive slope indicates that more spending (in per capita terms) is allocated to richer provinces. The slope is more positive for decentralized spending in 2003 for both health and education compared with 2000.190 This means that decentralized spending became less pro-poor during this period, while deconcentrated spending become more pro-poor.lgl
216

E. E. I I I I. I. , N g % $ B R
m m
Y
II 0 21 I1
>I \I; . . * . .. * * . t**
. *
. * \\: . 5 .. * * %
. * * . *

MAKING THE NEW INDONESIA WORK FOR THE POOR
Local governments depend heavily on resource transfers from central government In order to finance the gap between their own-source revenues and expenditure levels. As of 2004, about 90 percent of sub- national government revenues came in the form of transfers from the central government. Transfers consisted mostly of:
Shared Revenue Fund: this fund consists of transfers from property-based and personal income taxes, as well as from natural-resource-based taxes (average 15 percent of sub-national revenues in 2004).
General Allocation Fund (DAU): a general purpose grant intended to be based on the size of the fiscal gap between expenditure needs and fiscal capacities (average 66 percent of sub-national revenues in 2004).
Special Allocation Fund (DAH): specific purpose, matching grants (average almost 4 percent of sub-national revenues in 2004).192
0
Pollcy towards natural-resource (NR) revenues results in a variance between resourcerich and resource poor regions. This apparent imbalance in allocations across Indonesia is the consequence of a political settlement in a nation with significant diversity in natural resources. The policy, legislated in 1999,193 ensures that 15 percent of revenues derived from oil and 30 percent of revenues derived from gas are returned to the originating province. In the autonomous provinces of Aceh and Papua (and also presumably the newly created province of West lrian Jaya), this ratio is even higher. As a result, about 75 percent of the NR revenue is distributed to the provinces of Aceh, East Kalimantan, Papua and Riau, and the districts/municipalities within them. Moreover, 10 percent of districts/municipalities receive 80 percent of shared NR revenues (Lewis, 2005). Being a significant proportion of the revenue of some provinces (accounting for more than 50 percent in East Kalimantan in 2003, for instance), this establishes very different fiscal capacity scenarios for resource-rich and resource-poor provinces-all without any consideration of their respective levels of poverty.
Figure 7.4 Shared natural-resource revenues are distributed to a few provinces only East Kalimntan
Riau DI Yogyakarta
Ball Nsrth Sulaw esi
West Java South Kalimntan
Central Kalimantan Papua
West Sumatra Maluku
Nsrth Sumatra Jami
West Kalimntan East Java
Central Sulaw esi Central Java
South East Sulawesi
N Aceh Darussalam 0 DAWEarrwrked 0 Shared NRRevenue
Bengkulu 0 SharedTaxes South Sulawesi 0 PAD/Own Revenue South Sumatra 0 Other Revenue
West N s a Tenggara Lanpung
East Wsa Tenggara ~
Per capita personal expenditures higher
Per capita personal expenditures lower
0 2,000,000 4,000,000 6,000,000 8,000,000 Fer capna revenues of districts (Rp) aggregated at the province level (2003)
Source: SlKD data and Susenas 2004.
Likewise, the DAU-which is the primary Instrument for equalizing subnatlonal fiscal resources4s not structured to target areas with a high Incidence of poveTty.l94 While there is a formula for the allocation of the DAU across districts that includes a poverty variable (or proxy in the formula), this ‘fiscal-gap’ formula only partially determines how much districts receive in DAU funds. Administrative costs, specifically civil- service salaries, have dominated the determination of DAU allocations and, together with the ‘hold- harmless’ provisions, have crowded out the fiscal-gap-formula portion of the DAU. As a result, there is little or no correlation between DAU transfers and poverty rates. In 2005, a one-percentage-point increase
218
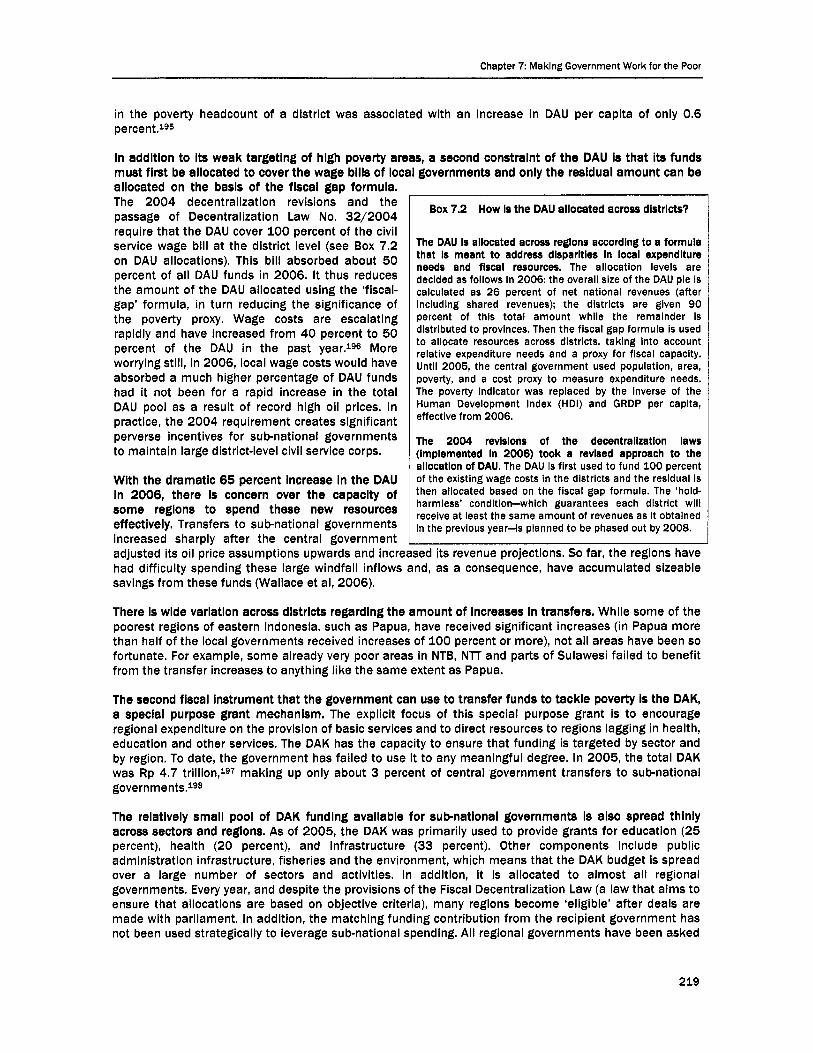
Chapter 7: Making Government Work for the Poor
in the poverty headcount of a district was associated with an increase in DAU per capita of only 0.6 percent.195
in additlon to its weak targetlng of hlgh poverty areas, a second constraint of the DAU is that its funds must first be allocated to coverthe wage bills of ioc, allocated on the basis of the fiscal gap formula. The 2004 decentralization revisions and the passage of Decentralization Law No. 32/2004 require that the DAU cover 100 percent of the civil service wage bill at the district level (see Box 7.2 on DAU allocations). This bill absorbed about 50 percent of all DAU funds in 2006. It thus reduces the amount of the DAU allocated using the ‘fiscal- gap’ formula, in turn reducing the significance of the poverty proxy. Wage costs are escalating rapidly and have increased from 40 percent to 50 percent of the DAU in the past year.I96 More worrying still, in 2006, local wage costs would have absorbed a much higher percentage of DAU funds had it not been for a rapid increase in the total DAU pool as a result of record high oil prices. In practice, the 2004 requirement creates significant perverse incentives for subnational governments to maintain large district-level civil service corps.
governments and only the residual amount can be
Wlth the dramatic 65 percent increase in the DAU In 2006, there is concern over the capacity of some regions to spend these new resources effectively. Transfers to subnational governments increased sharply after the central government adjusted its oil price assumptions upwards and increased its revenue projections. So far, the regions have . . . . - -. . . .. . . . _. . . . . . . had aitticulty spenatng tnese iarge winatall intiows ana, as a consequence, nave accumuiarea sizeame savings from these funds (Wallace et ai, 2006).
There is wide variation across districts regardlng the amount of increases in transfers. While some of the poorest regions of eastern Indonesia, such as Papua, have received significant increases (in Papua more than half of the local governments received increases of 100 percent or more), not all areas have been so fortunate. For example, some already very poor areas in NTB, N l l and parts of Sulawesi failed to benefit from the transfer increases to anything like the same extent as Papua.
The second fiscal Instrument that the government can use to transfer funds to tackle poverty is the DAH, a special purpose grant mechanism. The explicit focus of this special purpose grant is to encourage regional expenditure on the provision of basic services and to direct resources to regions lagging in health, education and other services. The DAH has the capacity to ensure that funding is targeted by sector and by region. To date, the government has failed to use it to any meaningful degree. In 2005, the total DAH was Rp 4.7 trillion,1g7 making up only about 3 percent of central government transfers to sub-national govern me nts.198
The relatively small pool of DAH funding available for subnational governments is also spread thinly across sectors and reglons. As of 2005, the DAH was primarily used to provide grants for education (25 percent), health (20 percent), and infrastructure (33 percent). Other components include public administration infrastructure, fisheries and the environment, which means that the DAH budget is spread over a large number of sectors and activities. In addition, it is allocated to almost all regional governments. Every year, and despite the provisions of the Fiscal Decentralization Law (a law that aims to ensure that allocations are based on objective criteria), many regions become ‘eligible’ after deals are made with parliament. In addition, the matching funding contribution from the recipient government has not been used strategically to leverage sub-national spending. All regional governments have been asked
Box 7.2 How Is the DAU allocated across districts?
The DAU is allocated across reglons according to a formula that Is meant to address disparlties in local expendlture needs and fiscal resources. The allocation levels are decided as follows in 2006: the overall size of the DAU pie is calculated as 26 percent of net national revenues (after including shared revenues); the districts are given 90 percent of this total amount while the remainder is distributed to provinces. Then the fiscal gap formula is used to allocate resources across districts, taking into account relative expenditure needs and a proxy for fiscal capacity. Until 2005, the central government used population, area, poverty, and a cost proxy to measure expenditure needs. The poverty indicator was replaced by the inverse of the Human Development index (HDI) and GRDP per capita, effective from 2006.
The 2004 revisions of the decentralizatlon laws (implemented In 2006) took a revised approach to the allocation of DAU. The DAU is first used to fund 100 percent of the existing wage costs in the districts and the residual is then allocated based on the fiscal gap formula. The ‘hoid- harmless’ condltlon-which guarantees each district wlli receive at least the same amount of revenues as it obtained in the previous y e a r i s planned to be phased out by 2008.
2 19

MAKING THE NEW INDONESIA WORK FOR THE POOR
for the same (and very low) 10 percent minimum, irrespective of their respective fiscal capacity or other criteria.
In the past, DAH funds were earmarked for Investment in facilities and infrastructure, whether or not this was a constralnt to pro-poor sector outcomes. Although the revised decentralization law leaves it open,i99 the precedent set by the 1999 legislation-that DAH funds be used for physical infrastructure and facilities-has not been unraveled either in practice or in the implementing regulations. Since alternative sources of funding have been fungible, this restriction has been managed at the district level through the flexibility of other revenue sources (allowing the DAH to be used for infrastructure, and the DAU or locally raised revenue [pendapatan asll daerah, or PAD] used to fund non-infrastructure activities). However, this restriction ultimately limits and counters the principle intention that the DAK be used as a pro-poor instrument.200
Poverty indicators are not used to determine DAH allocatlons. With the exception of the health sector, none of the sector DAK components has used poverty as a criterion in determining allocations to local governments. In education, for instance (see Figure 7.5) there is no relationship between DAH spending and enrollment rates in junior high schools (SMP). Conversely, where health indicators are used in the allocation calculation there is a much stronger correlation between the health DAK and infant mortality rates (see Figure 7.6).
Figure 7.5 The education DAH does not correlate wlth problem areas in terms of SMP enrollment rates. ..
40 000
D 30 000 r 5 2 8 : ; 20 000
g 10 000
3 2
0
**
y = 30208xt 10868 * R z = 0 0 3 5 1
* * * * * * * * * * *
* * . 0 10 20 30 40 50
XofschoolapchildrtnnotenrollrdinSMP
Figure 7.6 ... while the health DAK Is better targeted to reglons where Infant mortality rate Is high (2005)
25,000
- 20,000
c u g 15,000 O W = - .B
n
Y W
: ,s 10,000 I n
0 L
L 5,000
* * y=233.4x- 1056.2 * R'=0.123
*
* * , 0 *
10 15 20 25 30 35 40 45 50
infant Mortality Rates (ZOOS) Note: Per 1000 live births. based on Population Proi. 2000-2025, BPS
Source: BPS, MoF SlKD data, 2005.
Recommendations
There are four priority areas of action for strengthenlng policy, plannlng and budgetlng systems. First, improved systems for linking poverty reduction priorities with sectoral plans and budgets would help to translate political priorities into budgetary allocations that more closely reflect these priorities. Second, strengthened capacity and incentives for pro-poor planning and budgeting could be developed through improved technical guidance from Bappenas and the MoF. Third, district and municipal planning and budgeting systems can be made more effective in terms of poverty reduction by improving poverty analysis, capacity building, incentives, and the use of participatory processes. Finally, the DAU and DAK transfer-the main sources of local government revenues-can be used more effectively to address poverty in the poorest areas of the country, as well as to more effectively reward good local government performance.
220
Chapter 7: Making Government Work for the Poor
1. Linking broad poverty reduction priorities with sectoral plans and budgets
Linking broad poverty reduction priorities with sectoral plans and budgets-ln sector spending and program deslg+wlll be the key to progress. To ensure that government commitment to reducing poverty is carried through into expenditure allocations, efforts are necessary in two key areas: strengthening the link between stated national priorities (articulated through medium-term and annual plans), budget allocations, and line ministry programs and activities; and improving sectoral decision-making.
Ensure that the cabinet’s stated objectives are reflected In spending choices. This can be achieved by two key changes. When ministry ceilings are proposed to the cabinet at the start of the process (March), options should be put forward that include reallocations within and across ministries to correspond with stated priorities (as opposed to using priorities to allocate incremental resources only, as occurs currently). While structural rigidities may prevent the cabinet from selecting those options, cabinet members would at least understand how closely the ministry ceilings reflect their priorities. Second, the cabinet should dedicate sufficient time to reviewing the final budget in order to understand what changes occurred during line item budget negotiations with parliament and how these changes may affect (possibly adversely) the achieving of poverty reduction priorities.
Bappenas and the MoF should be given a mandate to ensure established poverty reduction priorities are Incorporated Into sector plans and budgets. Building on the ‘trilateral meetings’ process that began in 2006 for the 2007 budget year, Bappenas should rigorously analyze ministry work plans (Renja-KL) in a formal but transparent and inclusive review process, and provide constructive feedback as appropriate to line ministries. This analysis and a record of the results of the review process should be provided to the cabinet as necessary during the approval of the final RKP, and also shared with the Directorate General for Budget for use during the ministry planning and budgeting (RKA-KL) approval process.
2. lnvest In capacity and develop Incentives for prepoor planning and budgeting
Bappenas and the MoF should strengthen guidance and technical assistance. While the onus is on ministries to justify their expenditure requests-explaining how proposed plans and programs have achieved, or are expected to contribute to achieving, the government’s priorities-it is also necessary to ensure that ministries receive consistent technical guidance on the preparation of planning and budgeting proposals. To this end, the MoF and Bappenas are already collaborating on substance, as well as on the procedures and software used by sector ministries. Guidance for the Renja-KLs needs to specify the types of poverty-related data to be included (e.g. data by income quintiles, urban/rural areas, administrative regions, and gender, as appropriate to the particular program), as well as demonstrated evidence of program performance.
Line ministries should review and adapt organizational arrangements to ensure that these are Consistent with aligning budgets with plans. The practice whereby separate units within ministries prepare plans and budgets needs review. At a minimum, closer and more formally defined coordination would be beneficial. PlanninUFinance Bureaus also need to strengthen analytical skills-and be given the mandateto assess the poverty reducing or growth components, and their impacts of the programs proposed by directorates. All ministries should Introduce a resultsorlentatlon focused upon poverty reduction objectives. While theoretically a results-oriented system is now in place, this can be improved by focusing efforts towards outcomes associated with poverty reduction. A t present, the performance targets identified in annual plans are measured by a mixture of specific, measurable indicators and more general, ill-defined or unclear objectives needing refinement.
221

MAKING THE NEW INDONESIA WORK FOR THE POOR
3. Strengthen local-level performance budgeting systems that are evaluated against results on the ground
At the dlrtrict and municipal government level, linking analysis with spending allocations, improving incentives and capacity, as well as making processes more inclusive and results-oriented, will strengthen the pro-poor focus of local budgets and implementation.
Llnk poverty diagnosis to policy and program decision-making. To improve the poverty focus of regional and local government spending, poverty reduction planning and budgeting should be based on an understanding of the poor and their needs. Connecting the process of poverty assessment and program monitoring (discussed in Section IV) to the process of planning and budgeting is crucial.20i The experience of poverty reduction strategies being developed at the district level has shown how this can be done.202 (See Spotlight on Innovation at the end of this chapter for further details.)
Establish financial Incentives for pro-poor spending. Additional incentives for local governments to address poverty reduction can be provided by central government funding approaches that are tied to pro- poor outcomes and matching funds (e.g. in the form of DAH grants, see Section 11).
Develop local-level capacity for pattlclpatory, pro-poor planning and budgetlng. Embark on a concerted and sustained capacity-building effort to ensure staff are skilled and the organizational framework is established for improved local-level planning and budgeting. Efforts have been made to enhance linkages between planning and budgeting processes, and to introduce an explicit poverty focus, both in the development of new initiatives and within existing projects. This has been done by ensuring that processes are participatory and transparent, understanding local poverty determinants, and focusing on relevant pathways out of poverty. It is likely that a results orientation is best introduced gradually as capacity is built. This could start with: (i) defining overall poverty reduction priorities with measurable targets and performance indicators in the RKP-Ds (regional government annual work plans); and (ii) ensuring that programs have clear objectives and measurable indicators.
Pilot petformance-based subsidies to complement or replace user fees. Output-Based Aid (OBA) is the use of explicit, performance-based subsidies to complement or replace user fees. It involves the contracting out of basic services to a third party (be they private companies, NGOs, CBOs, or a public service provider) and the payment of a subsidy to that provider tied to the delivery of specified outputs (e.g. the number of connections or kilometers of roads constructed) (Brook and Smith, 2001). In contrast to traditional approaches of contracting out, OBA seeks to define objectives and performance in terms of outputs rather than inputs. It tries to mobilize commercial financing of service provision and differs from many private infrastructure schemes by complementing user fees with carefully targeted subsidy payments. These characteristics increase the potential for mobilizing private funding for public services, while ensuring a high level of accountability for the use of public funds. Indonesia could benefit from looking at successes in Cambodia, where subsidies for water services for low-income households are paid to providers when a household has received the service; in Peru, where telecommunications companies compete to expand in rural areas on the basis of the smallest subsidy required; and in Argentina, where contractors responsible for the maintenance and rehabilitation of rural roads are paid when they have achieved an agreed performance standard.
4. Revise the DAU transfer to be more pro-poor and use the DAK to attack poverty more effectlvely
The DAU, the maln source of revenue for local governments, Is not deslgned to address poverty. The DAH, a special purpose grant to local governments, has recently doubled in size, and there are tremendous opportunities to use it to provide both more direct assistance to the poorest governments, as well as to create incentives for better results on the ground.
More pro-poor allocations from the central government could be achieved by revising the DAU to include a stronger poverty component within the fiscal gap formula. Ideally, the formula for allocating the DAU203 should place greater weight upon local poverty rates. This could be achieved by increasing the weighting of the poverty variable in the formula. Currently, the inverse of the HDI index is used as the poverty variable in the DAU formula. This has two problems: it is only partially measurable at the district level
222

Chapter 7: Making Government Work for the Poor
(meaning that it does not accurately measure data for all districts) and, in addition, it incorporates GRDP per capita, which is already included in the DAU formula (see footnote). A better indicator may be the ‘poverty gap’, which measures the depth of poverty and is reliable and measurable at the district level. This would not only ensure a bias towards regions with a greater percentage of poor but would provide a more transparent and easily computable indicator.
Use the increased DAH funding to prlorltlze poverty reduction. The more than doubling of the DAH budget to Rp 11 trillion in 2006, and its further increase to Rp 14.4 trillion in 2007, present an enormous opportunity to address priority needs in resource-deficient districts and sectors. The DAK is a powerful instrument that should be used to focus sub-national spending towards national poverty reduction objectives. For instance, the key interventions discussed in Chapter 5 on Public Spending and Chapter 6 on Social Protection could be supported by more clearly defined DAH allocations to support the pathways out of poverty and better service delivery.
Although the development and lmplementatlon of an effective DAH Is urgent, a consultative process for its revision wlll ensure It Is better targeted and tailored to the capacities of each local government. Involving sub-national governments and other stakeholders in decision-making over key design features, such as conditions, allocation criteria and administrative arrangements will be paramount for the impending revision of the DAH. Given the large diversity in capacity, asymmetrical arrangements may be appropriate. More tightly earmarked grants with ex ante controls could be provided to weaker-capacity governments, while stronger-capacity governments would be given less rigid conditions with greater emphasis on ex post sanctioning.
Use the allocation crlterla in a manner that promotes prcbpoor geographical Incidence. A pro-poor DAH could explicitly have allocation criteria that promote the targeting of funds (geographically) to districts based on the relevant dimension of poverty (e.g. education poverty or infrastructure poverty). As noted elsewhere, for example, the supply of junior secondary school classrooms is sufficient in most areas of the country, but not in eastern Indonesia. Also, the poorest regions have the oldest subdistrict and village roads in the poorest condition, as well as the lowest all-year access.
Leverage local government resources by revising matching-funding requirements. District/municipal governments are required to match a minimum of 10 percent of central DAK funding, unless they have limited fiscal capacity. For more strategic effect, the matching amount could be made higher in order to leverage more sub-national spending, especially where it is expected that sub-national governments should be very responsive to achieving the national objective@); and/or the matching requirement could be varied with fiscal ~apacity.20~
Link the DAH to subnatlonal capacity building. Irrespective of a well-designed DAH, unless institutional capacity (and bottom-up and top-down accountability) is strengthened, service delivery performance to the poor may not significantly improve. Existing efforts by the government to strengthen sub-national government capacity should be linked to the transfer system.
Consider how the DAH allocations can be used as an incentive to Improve performance. Apart from revising and applying new criteria for the DAK, in order to improve the commitment and accountability of sub-national governments in achieving national-priority objectives and meeting their decentralized responsibilities, local governments also need incentives. Introducing a results orientation is vital to improvements in efficiency and effectiveness of funding, and is applicable to funding at other stages. This can be achieved through efforts to benchmark or measure the comparative performance of sub-national governments. For example, allocation of an education DAK could be conditional on a predefined age increase of junior secondary school completion rates. Or, allocation of a health DAK could be conditional on specific improvements in the accessibility and quality of health services, or a decline in the maternal mortality rate. Such a results orientation would help to measure both improvements for the total population and for the poor/near-poor). Efforts would be needed to pilot approaches to performance- linked grants to establish the basics (e.g. the conditions for the availability and size of grants, objective and transparent performance measurement), and to develop mechanisms to ensure that weaker-capacity government+ those that need the support most-were not further penalized for their lack of resources and capacity (e.g. support to prepare plans).
223

MAKiNG THE NEW iNDONESiA WORK FOR THE POOR
I I I I nst i t u t iona I Accou n ta b i I ity
The incomplete and dynamic nature of decentrallzatlon has created a challenging environment for service delivery and poverty reduction programs at the local level. The confusion over financing and responsibilities lies at the heart of the problem of effective and coordinated service delivery (Wallace et al, 2006). In addition, however, local governments have only just started to consider the best ways to deliver the services for which they are responsible. The following discussion highlights the key areas that require improvements and provides recommendations for action originating from both national and local levels.
At present the delivery and Implementation of poverty-related programs by local governments are characterized by uneven efficiency and effectiveness. A high proportion of the money that gets through to implementing agencies is used for salaries and other administrative costs. The lack of capacity, and the low level of success in delivery and implementation, can be attributed to both long- and short-term blockages in government systems, processes and organizational arrangements and are not simply an impact of decentralization.
Blockages In service delivery occur on both the demand and the supply sides: the government and delegated providers do not always perform their functions, and the users often do not demand accountablllty from them. The problems of basic services in Indonesia and a range of policy options to address blockages are the subject of a publication, Maklng Servlces Work for the Poor in Indonesia (World Bank, 2006k). This work highlights the relatively low levels of accountability in Indonesia of service providers to their clients and provides a set of recommendations for addressing this concern. There are a number of factors characterizing service delivery over a range of sectors in Indonesia: basic services (health, education and water, for instance) are predominately public; they are poorly coordinated across a range of agencies and tiers of government: and, these public agencies are neither accountable for the quality of the service they deliver, nor for the outcomes of their interventions.
Box 7.3 High levels of teacher absenteeism A recent study of teacher absenteeism in Indonesian primary schools found that, on average, 19 percent of teachers were absent for one reason or another each day. This is significantly higher than the figure for other developing countries. Of eight countries in the study, indonesia was third behind Uganda ( 3 9 percent) and India (25 percent).
In Indonesia, 45 percent of absent teachers had no clear excuse for their absence, 36 percent were either sick or on leave, and the remaining 19 percent gave the explanation that they were performing official duties outside the school, such as attending meetings or participating in training sessions.
Teacher absenteeism has a disproportionately negative effect on students’ learning in rural (i.e. usually poorer) areas, where substitute teachers are often unavailable. This usuaiiy means that two classes have to be merged or one teacher has to teach two classes in different rooms. in some cases, a senior student substitutes for the absent teacher, but in many cases students are simply sent home.
Source: Usman, Akhmadi and Suryadarma, 2004.
Whough there are, In practice, a range of servlce provlders in all the basic services, the government still identifies with its role and promotes a publlc system of service delivery. Chapter 5 on Public Spending provides a detailed description of public expenditure in health, education, water and sanitation services, and rural roads. In many sectors, however, this public funding may have hindered the effective delivery of services by deterring the development of alternatives. In the health sector, for example, while public spending has steadily increased, the rate of improvement in maternal mortality rate (MMR) has slowed, preventive healthcare has declined, the health gap between rich and poor provinces has increased and, consequently, there has been a shift towards demand for private services (World Bank, 2006k). While it is impossible to prove that government spending has crowded out private spending, it is notable that public spending alone appears not to correlate with improved outcomes in this case.
224

Chapter 7: Making Government Work for the Poor
Clarity of functions between central and sub-national government units
Service provlders are hindered by coordination difficulties, some outside thelr control. Many of the current arrangements governing public service provision are unclear on what providers are to deliver and how much they are to receive for doing so. The financing and provision of services is based on bureaucratic instructions, providing relatively little autonomy to providers or beneficiaries. A typical government health clinic (Puskesmas) has eight sources of cash income and 34 operational budgets, many of which are provided in kind by the central or local government (World Bank, 2005b). The system is characterized by overlaps-local government proposing interventions that central government has already programmed from Jakar tmnd gaps, and it is inevitably the poorest who fall through such a complex system.
Lack of clarity regarding central and local functions Impacts directly upon the provision of education and health servlces. Teacher managemen-in the form of decisions regarding recruitment, deployment, performance evaluation, and pay-are made at different levels of government. For example, hiring decisions are now decentralized, but compensation standards are still centralized. Similarly, it is not clear who has the authority to open and close health facilities. A 1986 ministerial decree gives this power to the Ministry of Health, and it remains unclear if and how this might change under decentralization (World Bank, 2006k).
However, the natlonal government plays too llmlted a role In water and sanitation. Although district governments now have authority over water maintenance, Article 9 allows higher levels of government to take decisions whenever a cross-district maintenance issue arises. This is leading to confusion, as in this case too much power may have devolved to district governments. According to the Water Resources Law No. 7/2004, the management principle is “one basin, one management, and basins may cross district or provincial boundaries”. For sanitation, no ministry at the national level is responsible at present. A key factor in Indonesia’s very low rate of urban sewerage coverage is the lack of institutional responsibility for making policy that would identify and set out a legal and regulatory framework, as well as define a strategy for involving households, communities, and the private sector in sanitation. Local governments require greater clarity and incentives regarding their roles (World Bank, 2006k).
And provlden do not have the autonomy to optlmlze service delivery. This is particularly true of the uncoordinated systems of delivery seen in the health sector and described above. Currently, government health clinics (Puskesmas) receive almost half of their revenues in the form of earmarked funding and in kind transfers (Figure 7.7). Of the cash revenue received at the Puskesmas about 80 percent goes to pay staff salaries. Most of the remaining funding comes from deconcentrated budgets, usually earmarked to assist the poor to access Puskesmas facilities. The non-earmarked funding, which could be used for improving the quality of services at the Puskesmas and expanding Puskesmas activities for information dissemination and immunization programs, is only about 2 percent of total Puskesmas revenues (World Bank, 2006k).
225

MAKING THE NEW INDONESIA WORK FOR THE POOR
Figure 7.7 Puskesmas recelve most of their revenues In the form of In kind transfers or earmarked funding
100
90
80
8 70
60
5 50 d % 40
8 30
20
10
0
3
0 Non-Earmarked funding 19 Earmarked Funding
Salaries In-kind Transfers
Distnct District Heaiih Province Central Patient or TOTAL Government Office Government Government P nvate Source
Source. GOS Y FinancialModule
The decentralization process is the baslc framework for government to effectively work towards poverty reduction and is characterized by both enormous potential and challenges. The decentralization reform implemented in 2001 is possibly the largest reform ever undertaken by the government. Political reform was accompanied by administrative and fiscal reform on an unprecedented scale (World Bank, 2003d). Five years on, the decentralization process is far from complete. While decentralization is not considered to have been regressive in terms of service delivery for Indonesia’s p00r,~O~ some major gaps are pertinent and need to be addressed. This section outlines the key problems that have emerged, and the structural changes needed to develop more accountable institutional frameworks, efficient organizations and staff systems capable of working together for the poor.206 One of the most critical tasks ahead is to reform the civil service and to improve the organizational and human capacity of government in support of poverty reduction processes and programs.
The continued lack of clarity In roles and responsibilities is a primary institutional constraint to improved servlce dellvery. Service delivery arrangements continue to be hindered by overlaps and gaps among various agencies and between levels of government.207 There are three issues. First, the central government does not focus as much as it could in terms of making good policies, setting standards, and/or oversight and monitoring roles, all of which would Improve the quality of service delivery. Second, overlaps and lack of coordination (uncoordinated spending) between the tiers of government208 in service delivery are common, making accountability ambiguous. Third, local governments and service delivery agencies often plan and budget in an unpredictable environment.
This lack of clarity results In suboptimal spending arrangements. In some sectors, the government has yet to decide who is funding and implementing which service. In many situations, there is weak coordination between centrally and locally funded programs, and how this coordination should be linked to local governments’ legally mandated service delivery obligations. Local governments plan and budget for services or improvements only to find that the central government is providing them directly. Ramifications at the delivery level are manifold. In education this is typified by schools receiving funding from four sources at various unknown times of the year. In hospitals, it results in the interruption of supplies, the delivery of unnecessary supplies (medicines, equipment), and duplication (World Bank, 2006k). Districts and provinces can go a long way in sharing information and cooperating so that programs create synergies instead of overlaps. However, such arrangements are voluntary and require local leadership commitment-not a long-term solution to what is a structural problem.
Clear functional divisions will promote greater clarity, more accountability, and higher quality and more efficlent implementation of plans. Table 7.4 below offers a detailed set of ideas regarding how authority and responsibilities could sensibly be allocated among different levels of government. The guiding principles are that overlapping authority and responsibilities among different levels of government should be avoided, and that the central government should focus on setting the rules of the game and holding
226

Chapter 7: Making Government Work for the Poor
lower levels of government accountable, but not on implementing policy directly. Thus, each level could take on the following roles:
0 National: Policy-making, staffing, information, core standards. 0 Provincial:
0 District: Develop local plans and budgets, implement services. 0 Providers: Deliver services and monitor outcomes. 0 Communities:
Fix regional targets and standards, build capacity, and implement cross-district services.
Provide feedback to service providers, manage targeted programs, and build/ maintain local infrastructure.
227

MAKING THE NEW INDONESIA WORK FOR THE POOR
Table 7.4 Suggested functional allocations for service dellveryzo9
Provider Function/role Related actions National Make policy. 0
government 0
. Organize and staff central ministries according to central functions.
Set core service standards.
0
0
Select key programs to fund at the national level using deconcentrated budget. Reduce cross-regional inequalities 8
Coiiect and disseminate information about
Finalize detailed function assignment for three tiers of government. Develop criteria for asymmetric decentralization, since not all regional governments are ready to take on new powers. Develop regulatory framework for using private sector and NGOs in service delivery. Establish systems whereby regional governments can collaborate to take advantage of scale economies.
Reeducate central agency staff about their roles and functions in a decentralized setting. Audit systematic management and governance skills, against assigned governance and management functions. Develop a small number of core standards for each sector. Disseminate information about standards through training programs for government officials and service providers. Develop systems for monitoring core standards (for example, national achievement tests for education, national surveillance system for health). Improve management and governance systems to reduce corruption.
Establish national mechanism to improve equity across regions.
innovations and good practice across regions. Develop detailed rules and regulations for
Develop regional service targets.
Provincial government implementing them.
Hold provincial and district officials accountable for their responsibilities.
0 Obtain support for targets from provincial and district levels. 0 Develop 'scorecard' systems for rating or ranking districts in their
performance of functions. Disseminate information about standards through training programs for government officials and service providers.
Set Service standards in line with national core standards.
8 Monitor service standards throughout the province. 0 Inventory the financlal management, personnel, and procurement systems In
all districts: address gaps and strengthen weak systems. Develop training programs on financial management, personnel management, and procurement procedures.
0 Require all districts to submit expenditure plans against performance targets.
Build district Implementation capacity.
Fund and manage services for which scale economies are high (for example, training programs for districts), but do not compete with districts.
District DevelOD local Dlans and budgets. with . government specific performance target;
Manage services to meet local targets, applying national and regional service standards.
0
(public or I
0
0
Inventory skills at the district level and undertake appropriate training to address skill gaps. Monitor performance against local targets. Report up the management line to bupat//wallkota and horizontally to the Dewan Perwakllan Rakyat Daerah or DPRD I (Provincial House of Representatives). Monitor and assess service standards In the district. Report on performance against standards. Manage decentralized financial, personnel, procurement, and information systems. Inform providers and user groups about service targets and standards. Ensure coverage of remote and disadvantaged groups. increase use of service agreements that focus on outputs and services, and
arivate) agreement. provide autonomy to providers in achieving these targets. Frontline providers Deliver services In accordance with Service
For public providers: monitor and report on outcomes in service area.
Budget block grants and human resources to providers based on what is needed to achieve targets. Reduce In kind financing.
8 Make civil servants working for providers more accountable to providers. IncorDorate user assessments In performance evaluations.
Communities Maintain and build village infrastructure. Ensure democratic processes within the community. Manage targeted programs for the poor within the community.
0 Move project-financed, communltydriven development programs on budget.
Provide feedback on Service Provision by Strengthen and create mechanisms for user feedback, such as the school providers and achievement of outcomes. committee.
A number of legislative and administrative blockages are thought to be the cause of this confusion. The first decentralization law (Law No. 22/1999) stipulated only the sectors that would be devolved to local
228

Chapter 7 Making Government Work for the Poor
governments, not the tasks to be performed, leaving it unclear as to who would and should perform the various functions within sectors. This has created confusion between district governments, provinces and line ministries. In principle, the latter relinquished the implementation and personnel management Jnctions and their main role changed to policy-making, standard-setting and monitoring.
Box 7.4 Leglslatlve blockage to local government action Decentralization has brought more ambiguity to civil servlce management. There is uncertainty about the roles and functions of the central agencies, the sectoral ministries (whose laws have not been revised in light of decentralization) and the regional governments. The problem is further compounded by the Law on the Civil Service No. 43/1999, which assumes the existence of a national civil service and mandates the creation of a new Civil Service Commission.
The recent revised decentralization Law No. 32/2004 places a question-mark over the entire essence of decentralization because it removes the regions’ right to manage their own public servants, partially negating the intent of the original decentralization law, namely Law No. 22/1999, which stipulated that so-called ‘obligatory’ sectors are the responsibility of iocai governments. For line ministries, this law required them to relinquish in principle their personnel management functlon,changing their main role mainly t o that of policy-making, standard-setting and monitoring.
However, this shift was never defined in law and the recent Law No.32/2004 has thus muddied the waters further. The specific functions of local governments within these so-called ‘obligatory’ sectors remain unclear. Some iocai governments have interpreted the new law to mean that they are responsible for ail tasks within the sectors.
Civil service functions and constraints
The strengths and weaknesses of the civil servlce In Indonesia have been extensively analyzed, and there Is broad agreement that significant challenges exist In reformlng the civll servlce. To build upon the broad literature and knowledge on the subject, this section addresses the roles, opportunities and constraints of the civil service to engage in, and deliver on, poverty reduction objectives. The framework below outlines three priority areas that will drive reforms: improving rules and restraints, enhancing voice, and stimulating competitive pressures. This section takes up rules and restraints, as well as stimulating competitive pressures. The following section addresses the use of voice.
l 1 I I
Source: World Bank, 2003. Reforming Public institutions and Strengthening Governance.
229

MAKING THE NEW INDONESIA WORK FOR THE POOR
In present day Indonesia, the clvll service Is both a potential asset for, as well as a significant hurdle In, the formulation and lmplementatlon of major government pollcles and programs to reduce poverty. The civil service is inefficient in part because of an overlapping regulatory framework, and inflexible organizational, procedural and management systems.210 Achieving highquality service-delivery results and being responsive to citizens appear in many cases to be relatively less important than following the lead of superiors. As with many other civil services, the Indonesian civil service is inclined towards rules rather than results. The poor, who lack voice and exit options, are more negatively impacted by this than are others.211 Indeed, the relative weakness of the civil service has led a major education sector review to recommend the establishment of a separate teaching servic-ne that would encourage the introduction of merit- and performance-based personnel management and continuing professional development.212
Rules and restralnts
Weak Incentives and a rigid personnel system make successful program lmplementatlon more difficult. Managers are in many cases not accountable for the outputs associated with service ~Jelivery.~~3 The lack of accountability is exacerbated by a closed promotion system and the lack of a performance-linked salary structure. Promotions are based on seniority, there is no lateral entry (promoting competition) and, as a consequence, there are few incentives to focus on results.214 This lack of accountability creates few incentives to, for example, implement a cabinet poverty reduction mandate, or to mobilize staff to engage in poverty reduction initiatives.
Staff have little Incentive to perform effectively. Few within the civil service see the benefits of striving for results in terms of poverty reduction. Incentives to perform depend on rewards (pay and allowances), as well as informal incentives that come with a meritocracy (such as recognition from supervisors and peers) and punishment for poor performance or for breaking the rules. In reality, however, rewards for integrity and punishments for poor performance of any kind are rare. Indonesian newspapers commonly report that civil servants accused of involvement in corrupt activities are simply transferred to other positions, but rarely sacked.
And the rigidity of the staffing system hinders the flexible hiring, transfer and promotion of good people. Following decentralization, overstaffing has become most common at the provincial level, but many districts are also overstaffed, with an imbalance favoring generalists over more needed technical staff.215 Transfers are the exception rather than the rule and civil servants with ill-adapted skills for their positions can stay put for years. The inflexible civil service structure (with structural and functional positions, see Box 7.5 on staffing) and employment terms, such as constraints on hiring and firing, and the lack of opportunities for early retirement, re-training, re-deployment and attrition, are significant stumbling blocks in developing capacity and improving personnel management. In some regional governments, for instance in West Sumatra (the provincial administration, the city of Solok, and the kabupaten of Solok and Tapanuli Selatan), innovative staff management practices have been applied, but the centrally governed set of rules is a straitjacket that prevents serious personnel management reform in the regions.216
The Intergovernmental transfer system now encourages local governments not to reduce the number of clvll servants. DAU funds are allocated to pay for staff and the current formula means that if regional governments reduce their staff numbers, their DAU grants will also be reduced, resulting in a strong disincentive for these governments to cut their staff. Overall, the structural deficiency of local-level governments to effectively deliver the services and perform the functions allocated to them is a major concern.217
230

Chapter 7: Making Government Work for the Poor
Box 7.5 The baslcs of better stafflng
Overstaffing in frontline institutions can partlaily be dealt wlth by moving excess personnel temporarily to a ‘pool of staff In walting‘. ‘Pool’ staff can reapply for positions once a reorganization has been completed and clear job descriptions are in place. If skiii-sets match and staff are trainable, employees can return to the mainstream of the organization. Those without potential for redeployment can be left in the ‘pool’ or encouraged to seek opportunities outside government. If voluntary departures do not occur, It is still better to keep such staff in a ‘pool’.
0 Ensure that recruitment and promotion are open and transparent, and based on clear job descriptions. Although candidates put forward for promotion stili have to fulfill certain rank criteria, the government can use specialized companies to carry out tests and assessments of candidates for recruitment and promotion to raise professionalism. The drafting of clear job descriptions for those recruited or promoted is also important because it clarifies and specifies their tasks, enables performance evaluation and Introduces performancebased incentive schemes. Set proper terms and condltlons for contract staff. Contracting is at present used to hire a large number of low-skilled staff in support functions, but if used wisely it can also be used to improve the skills of the civil service. This wiil ease the constraints posed by the rigid civil-service rules. Contract employment can also Introduce an element of flexibility within the iocai human-resources planning system.
0 Pian the use of human resources wisely. Building a database for human-resource planning and management is the basis for planning of organizational and personnel reforms. A modern database is a transparent and alternative human-resource planning and management tool and it will enable regions to do more independent and tailored planning of personnel actions. Develop predlctabie incentives for good performance and sanctions for bad performance. While schemes to enforce attendance and discipline abound in frontline institutions, government should add performancebased incentives either on a group or individual basis. Revamping policies so that the provision of training opportunities and monetary rewards promote good performance and a regime of sanctions deter bad performance would go a long way towards providing better services. Such a system should be transparent and monitored closely.
In the postdecentralization context, there is a great need for leadenhlp at central and local levels to bring about change. Leadership is needed to complete the most painful part of the decentralization process: to streamline the functions between different levels of government, to determine the right size and right tasks for staff, and to get the budget process on track. Although there is a dearth of leaders, there are some very successful walikota (municipal mayors) and bupati (district heads) who have seized the incentive to lead. Yet while these individuals have been noted by the central level, they have neither been used in the public policy debate, nor up-scaled through legal and regulatory changes. Political ownership of effective decentralization is critical to the delivery of effective poverty reduction programs.
And reformers are emerging throughout the country. A recent review of nine case studies of service delivery innovations found that high quality local leadership was the most important factor in determining the relative success of reforms. While in some cases, such as a community block grant program in Blitar city (see Box 7.9), or healthcare reforms in Jembrana district (see Box 7.8), local reforms have been successfully executed, there are also cases where well-intentioned reformers have found it difficult to make headway in implementing changes at the local level (see Box 7.6).
231

MAKING THE NEW INDONESIA WORK FOR THE POOR
Box 7.6 The challenges of Implementing local civil service reforms
An example of a local attempt at topdown clvil service reform to Improve transparency and accountability can be found In the case study of the district of Boalemo district, Gorontalo province. Since 2002, the bupatl has led a drive to improve civil servant performance and accountability. Reforms have Included a district regulation on transparency, the introduction of competitive bidding for procurement, and a new system of salaries for civil servants, together with fines and other sanctions t o improve civil servant discipline. But the success of such reforms has been limited so far.
While salaries of most civil servants in the district have increased by as much as 80 percent, performance improvements were only detectable In the limited form of better attendance. No fines were Imposed for poor quality services, probably because quality related violations were never investigated. The removal of secaiied ‘operational ailowances’--used mainly to pay for fieldtrip expenses-had a negative impact on staff performance, creating financial hardship for some staff and making them financially dependent on those who they were supposed t o be inspectlng. Transparency in bidding for lower- budget projects has improved but collusion remains in the larger proJects. These are usually conducted by non-local firms and represent a substantial portion of all constructlon project money belng spent In the district. But the reforms do seem to have made civil servants more accountable to the public. Citizens living near the capital have more opportunities to lodge complaints, and seem to do so more often: at least one such complaint has resulted in the firing of a corrupt official.
However, the llmlted success of the reforms has been largely due to the cornmltment and leadership of the bupatl, and to the flnancial promises and technical support offered by the World Bank-funded Initiatives for Local Governance Reform (ILGR) Project. But many factors have conspired to limit the reforms’ effectiveness t o date, including poorly designed incentives reform (the lack of any salary fines for service quality, the impracticality of the monitoring system for salary fines, and the short-sighted decislon t o remove operational allowances), over-dependence on the bupati as an individual, the marginalization of citizens living in distant and poor parts of the district, a very weak civil society and unfulfilled financial commitments from the ILGR project.
I Source: World Bank, 2006. lnnovatlons In Pr@Poor Servlce Dellvery : Nine Case Studles from Indonesla. I However, some subnatlonal governments have already successfully undertaken significant publlc sector reforms. In West Sumatra, a range of reforms have been initiated since decentralization that have attempted to professionalize the civil service, introduce more rigor into procurement procedures, and introduce greater participation into planning and budgeting procedures. While the outcomes of these reforms have yet to be seen, the new governor is a well-know reformer who was most recently the bupati of Solok district, indicating that local leaders can prosper and therefore continue to promote an ambitious reform agenda in the medium term.
Table 7.5 Locally Initiated governance reforms Implemented In West Sumatra province
Reform West Sumatra Kabupaten Solok Kota Soiok
Performance contracts for Echelon II officials
More equitable distribution of incentive payments
(province) (district) (dlstrlct)
J
J
Proper tests for Echelon II or Echelon Ill-IV officials J J J
External assessment for promotion J
Reorganization under PP 08 (regulatlon on organization) J J
J
J
Pakta Integritas (integrity pact) for transactions with the public and the private sector Giro (clearing account) to giro: financial transaction by bank wlthout interference Performance-based budgeting (Kepmendagri Ministry of Home Affalrs Decree No. 29/2002) J J J
Participatory planning and budgeting for service delivery J J
J J J
Pakta integritas (integrity pact) for procurement J J
Strengthened procurement processes (Kepres Presidential Decree No. 80/2003)
Source: World Bank, 2005e.
232

Chapter 7: Making Government Work for the Poor
Box 7.7 Informal patronage behavior In the Indonesian civil service Opaque arrangements for development budget-financed allowances appear to conceal an informal patronage network through which corrupt practices may occur. Through what many acknowledge to be a semi-formaiized system, significant discretionary allowances are distributed by top management in individual agencies to their subordinates in exchange for loyalty and, frequently, collusion in malfeasance. Membership in such personal ioyaity networks is reputed to be pervasive, ensuring that officials can accept bribes and kickbacks without fear of reprisal, since their coileagues are iikeiy to be engaged in the same practice. Bribery is, reportedly, cioseiy linked to the purchase of key positions. indeed, official positions with access to the development budget and control over the discretionary allowances it funds are reportedly a traded good, with a market value based on the estimated returns that might accrue from the access to rents provided by the position. The loyalty network thus makes the job purchase possible, and the job purchase in turn creates the demand for corruption since the position purchaser must recoup the purchase costs. In sum, the existence of discretionary allowances locks staff into a ioyaity network that enables extra-budgetary transactions to be conducted and shared under protected conditions.
This system of patronage also appears to allow civil servants to reap extra-budgetary rewards from unofficial payments, bribery, graft and returns from rent-seeking. The types of transactions have been outlined In assessments of leakages from World Bank-financed projects. Case studies suggest that the system allows management In a 'wet' agency (i.e. an agency with access to the development budget and the capacity to purchase access to a project listing, and hence eventual access to donor and counterpart funds) to reap informal benefits through the following representative transactions:
Payments from contractors and groups of contractors in exchange for selection (this may be recoverable subsequently through the project budget).
Payments from staff in exchange for hiring on projects. Loan accounts structured so that interest earned on cash in hand is retained by the agency; this may be in collusion with commercial banks for a share of the returns from the accumulated interest.
Provision of ghost services and/or inflated invoicing in collusion with contractors.
This system appears to be enabled by the significant contribution of the development (non-recurrent) budget to civii service rewards. Requirements for its continued operation include a continued commitment to project financing by donors across a wide spectrum of agencies, and the current dysfunctional split between the routine and development budgets, which allows for inadequate project supervision.
Source: World Bank, Indonesia: Priorities for Civil Service Reform, 2001. This box is adapted from "Pay and Patronage in the Core Civil Service in Indonesia," Nick Manning, PRMPS, World Bank, March 2000, pp. 3336. Also published in Combatlng Corruptlon: Enhanclng Accountablllty for Development. World Bank, 2004.
However, these ambitious reforms remain the exception at present. Many civil servants remain part of patronage networks in which earning income and satisfying superiors is more important than achieving work output targets (see Box 7.7). These networks have existed for years and became more deeply entrenched during the New Order period. It is not clear that they have changed significantly in the past five years. Thus, today, reformers are in a battle to change the status quo by attacking entrenched formal and informal 'rules of the game' that continue to prevail throughout much of the civil service.
Competltlve pressures
The private sector can both provide competition to the public sector, and also deliver some services more efficiently and effectively than public service providers. Much of the dialogue regarding government services and administration focuses upon how to improve efficiency and effectiveness through internal reforms. However, equal attention should be paid to use of the private sector. The private sector is not only more cost effective in delivering services in some cases, but the mere existence of private sector competition can, under the right conditions, stimulate the public sector to deliver higher quality services to citizens (see Box 7.8 on healthcare in Jembrana district). in addition, there are some tasks that the public sector can subcontract to the private sector, as these tasks do not fail within the core responsibilities and/or competencies of the public sector.
233

MAKiNG THE NEW INDONESiA WORK FOR THE POOR
100%
80%
60%
40%
20%
0%
100%
80%
60%
40%
20%
0%
Figure 7.8 Use of publlc and private service providers (by income quintile)
Source of drinking water Out-patient visits
Fubllc Rivate low end private high end
Average Utilization
5th (richest) 60%
40%
20%
11' (poorest)
0% income quintiie Pdblic Rivate low end private high end
Primary education Junior secondary education Borrowing 1 2 2
Rlbhe
0 5
RNate low end prwalc high end
100%
80%
60%
40%
20%
0%
3 5 n o 100%
80%
60%
40%
20%
0% RIbk RNatC Low end piNate hlgh end
Public Private low end pnvate high end
Source: Drinking water, outpatient visits, and education data are from Susenas (2003); borrowing data are from the Indonesian Family Life Survey (2000).
The private sector provldes both hlgh- and low-end servlces to cllents. Not surprisingly, the private sector provides high-quality services to wealthy clients in the form of private schools and hospitals. Perhaps more surprising, in almost every sector, in addition to private providers of high-quality services, there are low-end private sector providers that serve the poor (Figure 7.8). This opposite end of the spectrum exists for poor clients either because these services are closely tailored to their needs, or because they are the only ones available. However, the poor are often charged substantially more for these private services than by public facilities. A recent "Voices of the Poor" study found that prices charged by private water vendors in urban slums in Simukerto and Antasari were 15-30 percent higher than those charged by public water utilities (Mukherjee, 2006). Private religious schools provide education for the poorest, but their quality fails to measure up to that of public schools (Newhouse and Beegle, 2005).
Key factors that impact upon the private sector's ability to provide services to the poor Include: accreditation; knowledge of service standards; provision of demand subsldles; and selective s u b contracting to the private sector (World Bank, 2006k). If citizens have greater knowledge of the quality of private service providers, they can make more intelligent choices. For example, accreditation of midwives through a government-approved testing process can provide clients with better information, especially regarding a topic on which a layperson may have difficulty understanding. Demand subsidies, in the form of reimbursement to private providers by government-managed healthcare schemes, have already been piloted for healthcare in both Jembrana and East Sumba (see Box 7.8). This can be accompanied by an accreditation system for private providers. And finally, it is possible to contract out selected services to the private sector, especially in remote areas where the public sector does not deliver high-quality services. For example, there is a private market for mosquito spraying. Arguably, the private sector could arguably be sub-contracted to do this job as it is a task that the private sector can do more effectively than the public sector.
234

Chapter 7: Making Government Work for the Poor
Citizen and civil society voice
Decentralization and democratization offer an opportunity to bring providers of services and poverty reduction programs closer to the poor. Involving end-users and poor citizens in development efforts is critical, as it improves accountability and the likelihood that interventions will be designed to meet demand. The role of communities in poverty reduction programs can vary both in terms of the degree of their involvement and the stage at which they become involved in the process (project identification, planning, budgeting and programming, monitoring, delivery and implementation). Local governments can support users to become involved in service delivery by promoting their participation in the actual decision-making over their participation,21* and by appropriately assigning resources to communities or to partnerships between providers and communities.
Accountability relationships In Indonesia are still
Box 7.8 How publleprlvate competltlon can Improve healthcare for poor cllents
In Jembrana district, Bali, health sector reforms created a new health care program, the Jaminan Kesehatan Jembrana (Jembrana Health Insurance). The program provided free primary healthcare for all enrolled citizens and free secondary healthcare for all poor members. It also enhanced client choice by enabling members to choose between private and public healthcare providers, both of whom were reimbursed under the scheme. In addition to increasing coverage of health services, the scheme directly affected the behavior of public health staff, who had to compete for clients with private providers In the wake of this reform. As a result, public providers measurably Improved their client orientation by sending mobile clinics and doctors to remote areas at least once a month (rather than just providing health education in these remote areas, as had previously been the case); improving medicine packaging; and providing ‘full smile’ reception for patients. In addition, the management board of the project supervised quality control for reimbursements by both creating a clear set of service standards for all providers and investigating cases of malfeasance.
Source: Kuznezov and Ginting, 2005.
being developed and the-bureaucracy and the executive remain powerful. Currently, the paradigm of an authoritarian state with upward accountability remains very strong: citizens have a voice, but lack the power to enforce the accountability of law-makers, or tackle the bureaucracy. Oversight by an active civil society and parliamentarians is essential, but is currently missing in the triangle of policy-maker- provider-citizen accountability.
Throughout Indonesia there are examples of how democratic checks and balances are starting to function, but capacity remains a problem. Pro-poor leaders have tackled both the inefficiencies of local administrations and encouraged civil society to play a role in scrutinizing the management of public office and funds. However, at present, both sets of stakeholders-governmental and non-governmentaChave limited experience and capacity. Indonesian organizations are unfamiliar with the inputs necessary for planning or analyzing detailed budgets, and government is inexperienced in structuring consultations effectively to receive input. In Boalemo district, for example, an ambitious civil-service reform program was partially derailed because of capacity and institutional weaknesses in the district (see Box 7.6).
But to date, the failure of clvlkoclety organizations to effectively assert pressure and control over those who serve them Is a key problem In the development of an effective framework for accountability. Civii- society organizations have developed considerably since decentralization, and corruption watchdogs and consumer associations are emerging that will increasingly act as a check on government behavior. However, a great deal of scope exists for further empowering civil society and the public. There is a lack of transparency about rules, the fees and charges that the public are required to pay for services, and the standards it can expect to receive from the civil service. The experience with the Kecamatan Development Program (KDP) suggests that empowering communities to monitor development performance and facilitating this process through civil society and media coverage have helped moderate corruption (see Spotlight on Inefficiencies and Leakages at the end of this chapter).
Three factors Impact upon the ability of citizens to effectively exercise their voice. First, the degree to which citizens are involved in and influence planning and budgeting by their local governments; second, giving communities the power to deliver some services themselves (for example, small-scale infrastructure); and third, the provision of vouchers to the poor so that they are financially empowered to make choices.
235

MAKING THE NEW INDONESIA WORK FOR THE POOR
The government has had very mixed success In enabling and fostering the partlclpatlon In plannlng that Is needed to bring about the structural change In process. In developing its national strategy for poverty reduction (SNPK), the government made proactive efforts to elicit participation from non-government stakeholders, although their contributions to the preliminary draft varied. The process of revising the SNPK was a far more participatory one than previous national planning efforts, albeit for a small group of stakeholders. There have also been modest changes to the structure of national-level consultations with sub-national governments on the annual work plan (RKP).
The budget formulation process Is relatively closed to non-government stakeholders. There are several formal opportunities for parliamentarians to provide input to government: initially in discussions between the Budget Committee and central agencies on macroeconomic assumptions, fiscal policy, and government priorities; and subsequently, during sessions set aside for central agencies and the Budget Committee to discuss the draft budget. To date, however, it is only the sectoral C O ~ ~ ~ S S ~ O ~ S ~ ~ ~ that have engaged in any consultation with the public. Generally, this process has been ad hoc and conducted by invitation to a limited number of individuals or organizations rather than through any proactive, systematic or structured process. However, budget documents do meet a best-practice standard in terms of public availability of information.220
The central government has already issued laws recognlzing the roles users can play In planning and monitoring service provlders. Governments at all levels should now develop practical strategies for implementing these laws to promote the wider involvement of user groups in service delivery decision- making and monitoring.
Indonesia has enjoyed Impressive results from some community-based approaches to basic Infrastructure. Evidence on realized cost savings from four large community development projects shows that communities were able to build infrastructure for as much 66 percent less than contractors (Table 7.6). Savings were evident in both singlesector (water supply) and multi-sector programs. Using community-based approaches on large-scale projects has the potential to save hundreds of millions of dollars. Cost savings achieved by community methods are often particularly high for upland and isolated communities, where the costs of mobilizing contractors can be higher than the cost of the construction itself.
Table 7.6 Economic benefits from community-managed basic Infrastructure
Project Total value Communlty contribution Percentage savings of using (US$ (%) community rather than contractors (%)
million) P2D (phase 3) 200.0 - 23
Water Supply for Low- Income 106.7 Communities 2 Hecamatan Development Project 2 310.0
23
2 1
49
55
Urban Poverty Project 100.0 35 66
Source: Bappenas, 2005. Finding of PostConstruction Economic Impact Analysls, Jakarta
At the local level, Indonesia has long engaged In the rhetoric of bottom-up pIanning.22l However, until recently it has been usually described as a ‘ritualized performance’. Many studies have concluded that the participation of the poor and near-poor is not a genuinely participatory process.222 While the formal process elicits village proposals-mostly from formal village leaders or village elite-the results rarely connect to district-level planning processes, sector or otherwise.223 At the same time, there is no institutionalized mechanism for citizen participation in the budgeting process, and the process as a whole lacks transparency.224 Results from five rounds of the Indonesia Rapid Decentralization Appraisal (IRDA) during the period 2002-04 found that participation of civil-society organizations and citizens in decision making processes remains limited, and most consultations are in fact a token effort too socialize the government’s pre-determined positions and plans. The study found that bottom-up planning is still regarded as a ‘ritualized performance’.226 A study of three districts in eastern Indonesia found that only
236

Chapter 7: Making Government Work for the Poor
20 to 25 percent of the budgeted activities originated from the ‘bottom-up’ participatory development planning process.226
A number of institutional and attitudinal blockages hinder participatory processes being adopted by government. One of the underlying reasons why community participation has not been fully realized is that Indonesia’s implementing organizations and staff adhere to top-down norms and traditional attitudes. There has been a lack of leadership commitment and little organizational effort to create the structural change that is needed. Given the already limited capacity at the local level to deliver services, there is even less capacity to take on participatory processes with which civil servants are neither familiar nor committed.
However, localized block grant programs have the potential to both empower the poor and to provide better outcomes for local citizens. While many donor programs and localities have roiled out block grant programs in recent years, targeting and quality have been consistent problems. Administering a block grant program requires local civil servants to work in a more participatory manner, and to ‘learn by doing’ adjusting program rules as lessons are learned regarding those approaches that produce the best results.
Box 7.9 Developing a highquaiity, locally-initiated block grant program In Biitar city
The Biitar community block grant program, implemented since 2002, provides grants for development projects in the 20 urban villages (keiurahan) of Biitar city, East Java province. Community participation is a key element. Communities are very involved in selecting projects, mainly through annual city-led, government-mandated meetings (Musrenbang), which elicit citizen input into city planning. Biitar also holds ‘pre-Musrenbang’, basically Musrenbang at the local level. At both Musrenbang and pre-Musrenbang, the active participation of attendees is encouraged-something that is rare in Indonesia.
Communities’ financial and in kind contributions have ranged from 13 percent to 22 percent of the total program budget annually (which itself increased from Rp 3.62 billion, or about US$380,000, in 2002, to Rp 6.14 billion, or about US$646,000, in 2004). Funded projects reflect communities’ preference for infrastructure, but city government has been encouraging intangible but (in its view) more efficient projects, such as training: beginning in 2005, no more than 60 percent of program funds may be spent on infrastructure. The Village Community Empowerment institutions (Lembaga Pemberdayaan Masyarakat Keiurahan, or LPMKs) play an important role in mobilizing communities.
Although targeting the poor was not originally an explicit goal, there has been a pro-poor funding bias in two of Biitar’s three subdistricts, likely because of a new (2003) project selection criterion on the number of poor beneficiaries. Program funding for renovating slum housing has provided the most direct benefits to the poor. Recognizing this, the city government mandated that, starting in 2005,13 percent of program funds would have to be spent on this activity.
The community block grant program appears to be technically, institutionally, financially, and socially sustainable. i t is ais0 very low cost, representing less than 2 percent of the city budget. The mayor’s willingness to let communities make mistakes has increased the likelihood of sustainabiiity, not only because the program is able to improve based on lessons learned, but also because communities are learning how to implement programs over which they then have ownership.
Source: Kuznezov and Ginting, 2005.
Vouchers can increase end-user choke and promote competition among providers Vouchers allow communities or users to periodically decide which provider offers the best service. Both vouchers and formula-based programs-implemented in order to promote competition among providers-presume that users face a choice of providers and are able to accurately monitor local choices and respond accordingly. These conditions rarely exist in isolated areas. In urban areas and areas of high population density, however, both vouchers and formula-based funding strategies have considerable potential to improve provider performance (see Box 7.10).
237
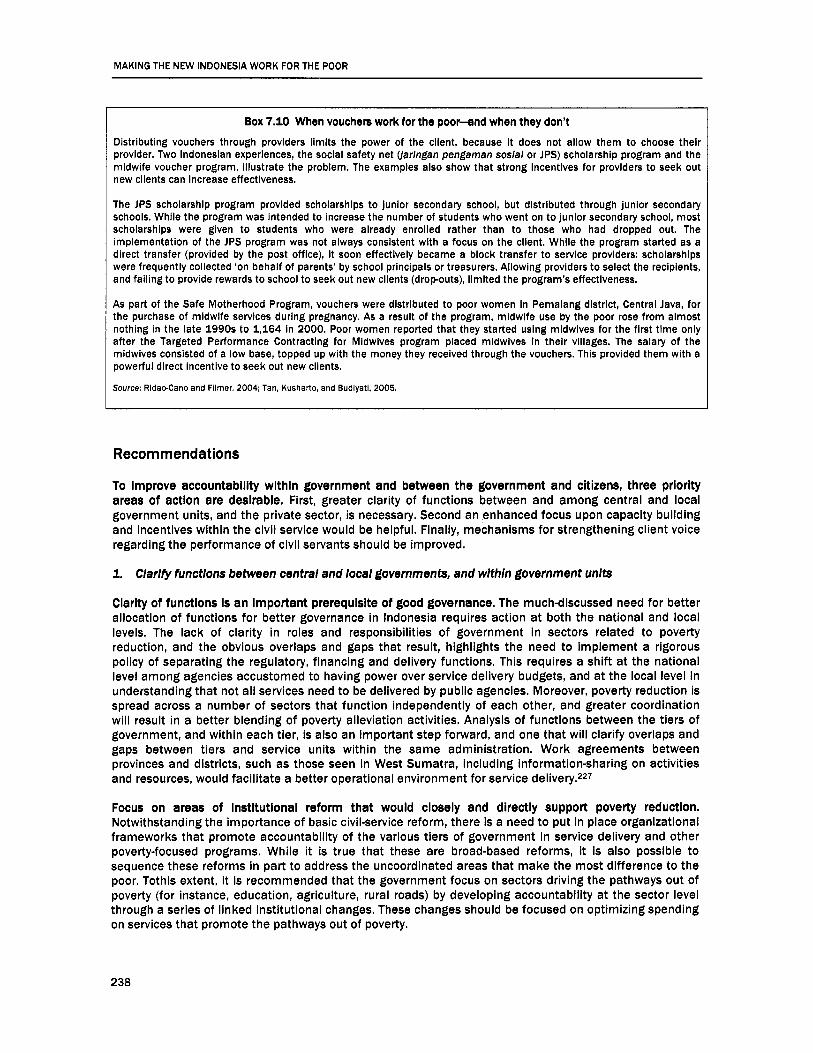
MAKING THE NEW iNDONESlA WORK FOR THE POOR
Box 7.10 When vouchers work for the poor-and when they don’t Distributing vouchers through providers llmlts the power of the client, because it does not allow them to choose their provider. Two Indonesian experiences, the social safety net Uarlngan pengaman sosial or JPS) scholarship program and the midwife voucher program, Illustrate the problem. The examples also show that strong incentives for providers to seek out new clients can increase effectiveness.
The JPS scholarship program provided scholarships to junlor secondary school, but distributed through junior secondary schools. While the program was intended to increase the number of students who went on to junior secondary school, most scholarships were given to students who were already enrolled rather than to those who had dropped out. The implementation of the IPS program was not always conslstent wlth a focus on the client. While the program started as a direct transfer (provided by the post office), it soon effectively became a block transfer to service provlders: scholarships were frequently collected ‘on behalf of parents’ by school principals or treasurers. Allowing provlders to select the recipients, and failing to provide rewards to school to seek out new clients (dropouts), limited the program’s effectiveness.
As part of the Safe Motherhood Program, vouchers were distributed to poor women in Pemalang district, Central Java, for the purchase of midwife Servlces during pregnancy. As a result of the program, midwife use by the poor rose from almost nothing in the late 1990s to 1,164 in 2000. Poor women reported that they started using midwives for the first t ime only after the Targeted Performance Contracting for Midwives program placed midwives In their villages. The salary of the midwives conslsted of a low base, topped up with the money they received through the vouchers. This provided them with a powerful direct incentive to seek out new clients.
Source: Ridac-Can0 and Flimer, 2004; Tan, Kusharto, and Budlyati, 2005.
Recommendations
To Improve accountabliity wlthln government and between the government and citizens, three prlorlty areas of action are deslrable. First, greater clarity of functions between and among central and local government units, and the private sector, is necessary. Second an enhanced focus upon capacity building and incentives within the civil service would be helpful. Finally, mechanisms for strengthening client voice regarding the performance of civil servants should be improved.
1. Clarify functions between central and local governments, and wlthln government units
Clarity of functlons Is an Important prerequisite of good governance. The much-discussed need for better allocation of functions for better governance in Indonesia requires action at both the national and local levels. The lack of clarity in roles and responsibilities of government in sectors related to poverty reduction, and the obvious overlaps and gaps that result, highlights the need to implement a rigorous policy of separating the regulatory, financing and delivery functions. This requires a shift at the national level among agencies accustomed to having power over service delivery budgets, and at the local level in understanding that not all services need to be delivered by public agencies. Moreover, poverty reduction is spread across a number of sectors that function independently of each other, and greater coordination will result in a better blending of poverty alleviation activities. Analysis of functions between the tiers of government, and within each tier, is also an important step forward, and one that will clarify overlaps and gaps between tiers and service units within the same administration. Work agreements between provinces and districts, such as those seen in West Sumatra, including information-sharing on activities and resources, would facilitate a better operational environment for service delivery.227
Focus on areas of lnstltutlonal reform that would closely and directly support poverty reduction. Notwithstanding the importance of basic civil-service reform, there is a need to put in place organizational frameworks that promote accountability of the various tiers of government in service delivery and other poverty-focused programs. While it is true that these are broad-based reforms, it is also possible to sequence these reforms in part to address the uncoordinated areas that make the most difference to the poor. Tothis extent, it is recommended that the government focus on sectors driving the pathways out of poverty (for instance, education, agriculture, rural roads) by developing accountability at the sector level through a series of linked institutional changes. These changes should be focused on optimizing spending on services that promote the pathways out of poverty.
238
Chapter 7: Making Government Work for the Poor
Promote and develop the role of the prlvate sector. Within the context of a more regulated environment, and recognizing that one size does not fit all, efforts are needed to develop and optimize the role of the private sector. The private sector already provides services in health, education and water to different stakeholder groups. The standard of service may be better or worse, or similar, to the government service. Price varies too and can be a major concern. The key is that there should be some structure to the delivery of basic services to the poor. There should be regulations that enable competition, and maintain the interest of the private sector, but nevertheless control the quality of basic services that are so important to the poor.
Box 7.11 Increasing the benefits from the private sector The private sector already delivers many services to the poor, but they are often of poor quality. The government can improve the services the poor receive from the private sector by:
informing the public of service standards of private sector provlders. Consumers can make better choices about the use of private service delivery if they are aware of the quality of the service they buy.
Extending tralning and recognitlon to quailfled private providers that serve the poor. A combination of training and certification of providers aiiows the poor to recognize quality through certification and enables private providers to improve the standards of services they deliver.
Making qualified private providers eiiglble for demand substdies. Government could promote choice by making private sector providers of recognized quality eligible to receive voucher-type subsidies. Districts such as Jembrana and East Sumba have already aiiowed private health providers to be reimbursed under a district managed health insurance program (Gaduh and Kuznezov 2006; and Arifianto et ai, 2005).
Selectively contracting out servlce deihrely to the private sector. in the short run, most contracting out to the private sector wiii be for services that the public sector does not deliver. But the private sector can also assist the public service provider in delivering on its service agreements. Spraying against mosquitoes, for instance, is usuaiiy carried out by public clinics. it would arguably be more efficient to use private providers, as there is a weii-developed private market for this service.
There Is already legislation that states the government’s Intention of providing more clarity In functional allocations. It states that the central government should relinquish, in all agreed sectors, the role of provider and concentrate efforts on creating an effective and conducive enabling environment for poverty reduction. As established in PP No. 25/2000,22* the central government should focus on: (i) making and clarifying policy and legislation; (ii) mobilizing funding for basic services, both through better inter- governmental systems (described above) and through good policy for leveraging private and community funding; (iii) supporting local government to play its role both through increased clarity and a capacity development function; (iv) setting the framework for, and monitoring service standards for, local governments to develop in the local regulatory context; and (v) supporting lagging regions through cross- regional initiatives and dissemination of information from good performers to poor performers. To this end, line ministries’ structure and staffing need to be rethought: the framework of functions, budgets and staffing of central ministries needs to be aligned, starting with those sectors hindered by a lack of clarity and directly affecting the lives of the poor.
2. Focus on civil service reform by addressing hiring practices, capacity-building, sanctions and rewards
While not easy, reform wlll be vital. While civil service reform is not easy, in the medium term it is a vital component to ‘unsticking’ other reform processes.
Review and provide clarity In the regulatory framework and Incentives for organizational and personnel management by instituting a less rigid employment regime and abolishing the system of structural and functional positions and the rigid ranking of posts. A more open and competitive recruitment system, combined with easier transfer mechanisms, early retirement and other schemes, could help ‘right size’ and strengthen the civil service in many regions. Review of the budget for a formula for intergovernmental transfers, such that regions are rewarded for rationalizing their personnel establishments and can keep the savings they make on personnel expenses, will provide them with appropriate incentives to have the right number of staff with the right skills. Finally, strengthening controls over, and rationalizing
239

MAKING THE NEW INDONESIA WORK FOR THE POOR
arrangements for, civil-service employment and compensation, and linking personnel information systems to payroll, could create cost savings.
Create more robust and predictable incentives for staff. Indonesia has pockets of success in developing appropriate incentive structures for frontline service providers. In the best cases, incentives that drive service-provider behavior are robust, timely, applied consistently, and linked to improved outputs and/or outcomes for clients. Examples in Box 7.12 below show that incentives have already been piloted successfully in selected localities.
Box 7.12 How can Incentives change the behavior of frontline service providers? Numerous experiments using incentives for local service providers have been conducted in Indonesia in recent years. In all cases, there was a marked change in the behavior of service providers in response to a changed incentive framework.
In Tanah Datar district, West Sumatra, a scheme was launched in 2002 to provide stronger incentives to English teachers and headmasters by offering them tours of Australia, Malaysla, and Singapore to study English and observe teaching methods. These trips motivated behavioral change in several ways:
The trips increased the motivation to do better work. Teachers returning from study trlps submitted a group report to the mayor, with follow-up observations and recommendations. Their observations included the need for stronger discipline of teachers, students, and parents; smaller class sizes; and improvement In the quality of education by providing classes in computer skills and English, changing the teaching methodology, and consulting with students. The trips effected changes in teaching methodology by some English teachers, including those who went abroad and some who did not but associated with those who did (as friends or colleagues). One English teacher began teaching her classes in English rather than Indonesian following her trip to Australia. She has also begun using a ‘student agenda,’ in which students record their activities In English, as well as what they have learned from them, as an aid in teaching. Interest In student performance and teaching hours Increased, due to both school-based management and the stronger incentives policy. On average students now study about 15 hours more a week. To demonstrate his commitment to raising student test scores, one headmaster actually signed an agreement wlth his school committee stating that if scores at his school were not above a certain level he would resign.
In Jembrana district, Bali, health sector reforms created a new health care program, the Jembrana Health Insurance program (Jaminan Kesehatan Jembrana). The program provided free primary healthcare for all enrolled citizens and free secondary care for all poor members. It also enhanced client choice by enabling members t o choose between private and public healthcare providers, both of whom were reimbursed under the scheme. In addition to Increasing coverage of health services, the scheme directly affected the behavior of public health staff, who had to compete for clients with private providers in the wake of this reform. As a result, public providers measurably improved their client orientation by sending mobile clinics and doctors to remote areas at least once a month (rather than Just providing health education in these remote areas, as they previously had); lmprovlng medicine packaging; and providing ‘full smile’ reception for patients. In addition, the management board of the proJect supervised quality control for reimbursements by both creating a clear set of service standards for all providers and investigating cases of malfeasance.
As part of the Safe Motherhood Program in Pemalang district, Central Java, poor women were issued vouchers that they could exchange for prenatal care from midwives. The midwives were usually responsible for distributing these vouchers. With the added incentive of additional fees earned from clients with vouchers, mldwlves substantially increased the number of poor women they treated. This had the additional beneficial impact of introducing poor women to the formal health system and inducing them to seek out healthcare from formal providers more frequently.
Source: Leisher and Nachuk, 2006.
Thus, developing skilled, organlzed and accountable institutions committed to poverty reduction requires the Introduction of a focus on Increased skills in, and knowledge of, poverty and poverty reduction. Steps towards more poverty-concerned and capable local-level delivery institutions would include: (i) defining what skills are needed for addressing poverty functions; (ii) assessing what skills exist to take on these tasks; and (iii) developing a staffing strategy that matches staff to functions, and develops pro-poor skills and tools (e.g. community participation through the citizen report card).
240

Chapter 7 Making Government Work for the Poor
3. Strengthen cltlzen and clvll society voice at both the natlonal and local levels
At the national level, enhance and institutionalize the consultative approaches developed to date. This process should occur at the overall and sector levels with efforts to inculcate the processes into systems and procedures. At the district and municipal level, pro-active efforts are needed to formalize and open up consultation processes.
Bappenas and the MoF should develop formal, regularized mechanisms for public input Into the annual planning and budgeting process. Formal consultations with academia, professional associations, labor unions, farmers' associations, service-provider NGOs, and business organizations should be held as a regular part of the process. To create demand and develop capacity, it may be prudent to incrementally increase the level of participation. Although formal consultations would by definition favor citizens who are presented by formal and established organizations over those who do not enjoy such representation, this is still a step forward from the current situation.
Encourage sector ministries to establish consultative processes on a more regular, ongoing basts to Inform prlorltles, policies and program budgets. Annual consultations regarding overall government priorities and expenditure allocations are not sufficient to develop effective inputs on the vast range of government programs and activities. Consultation strategies need to be articulated in terms of stakeholders, issues and processes. Irrespective of whether central government undertakes consultation directly with communities themselves or works with local governments, independent organizations and/or citizen groups, the process involves reaching out into the community and openly consulting the poor, and then effectively synthesizing citizen views on, inter alia, access, adequacy and quality of services and other supporting programs.
Integrate all forms of stakeholder provlslot-+publlc, private and community-ln sector delivery strategies. Local governments should develop strategies that bring together the benefits of all stakeholders (public, private and civil society) to perform the roles most suited to them. Effort is needed to develop a delivery environment in which a range of public, private and CSO agents has an incentive to deliver to the poor. To achieve this it is necessary to develop a receptive operating context and identify strengths and weaknesses in the context of effective strategies. Building the capacity of actors on both the supply and demand sides is critical to ensuring the most effective contribution to the overall sector marketplace. Coordinating any continuing inputs from other government agencies may also be important in the short term.
At the local level, improve access to meaningful information. Increasing transparency of government systems and decision-making processes by providing clear information at the right time is key to enhancing accountability and enabling participation in local-level planning and budgeting processes. With better knowledge of processes and better public access to plans, budgets, and supporting information, the bargaining power of citizens and civil-society groups will be radically improved. A range of low-cost approaches has been tested to improve the quality and quantity of information flows and thereby ensure citizens have at least a basic understanding of local government priorities and expenditures. To this end, district/municipal governments should be given incentives to establish minimum levels of transparency. These might include: availability/publication of statistical data, key priorities and targets in the overall government plan, as well as sectoral plans, and summary budget information (planned and actual). The central government could promote this process by providing sub-national governments with transparency/information guidelines based on appropriate best practice established in Indonesia and similar contexts.
Encourage multlatakeholder consultations during the formal annual planning and budgeting processes, and beyond. Opening up the planning and budgeting processes, and conducting consultations around key issues and sectors at the district/municipal level may enable organizations speaking on behalf of the poor and near-poor to participate, advocate, and possibly influence government priorities and spending. But, conversely, it is also possible that opening up the process will increase the influence of individuals and groups representing the elite. District/municipal governments can be encouraged to mitigate against this potential capture by integrating pro-poor processes in the consultations. Engaging appropriate civil-society
241
MAKING THE NEW INDONESIA WORK FOR THE POOR
groups to facilitate focus group discussions on specific issues and focusing on specific target groups (such as slum-dwellers, women, or youth) can also be beneficial.
Allocate block grants to villages and/or subdistricts to directly assess needs, and develop and implement community-based activities, using examples of best practice in community participation.229 Indonesia has wide experience of community-driven programs from which it can draw valuable lessons. Lessons learned point to the need to match responsibilities to communities’ comparative advantages, work with existing local institutions, invest in facilitation to ensure informed decision-making and encourage non-elites to participate, and monitor performance. Therefore, to make most effective use of the existing system of village block grants, district/municipal governments need to (i) explicitly define the responsibilities of village governments, (ii) ensure that grants are of a meaningful amount, (iii) support a participatory project proposal and selection process, (iv) promote community contributions, either in kind or in cash, to bolster local ownership, and (v) monitor both usage and results of the grants. In addition to using trained facilitators and manuals from the various community-driven development (CDD) projects, districts/municipalities can draw on the expertise of organizations such as The Forum for Village Reform.230 Blitar city is one example of a very successful, locally-initiated block grant program.
Utilize the strengths of communltles to manage and deliver services that target the poor. In many situations where incentives are low for government and the private sector to engage in service delivery, there is strong evidence that well facilitated community interventions, in the Indonesian context, yield more efficient construction and maintenance of village infrastructure.23i Communities also can play an important role in targeting the poor, as providers have little incentives to reach out to those who do not demand services. For instance, in the Kecamatan Development Program (KDP) communities have been instrumental in the delivery and implementation process of a wide range of activities (village roads and basic infrastructure). Ex post evaluations indicate lower costs and lower levels of corruption than in similar programs delivered by district administrations.
IV Monitoring and Assessment of Poverty and Poverty Reduction I n te rven t io ns
To reduce poverty more effectively, It is necessary to build more knowledge and information on the nature and determinants of poverty and then develop policies and programs that respond to empirical evldence. The key starting point and basis for better understanding is through the (continued) development of good data (both monetary and non-monetary indicators) that reflect the multi-dimensional nature of poverty and lead to better understanding of poverty determinants across the diverse regions of Indonesia. Regular assessment of the key dimensions of poverty at the regional level and better understanding of the differentiated needs of the poor are vital for Indonesia’s efforts to reach the MDGs.
To date, the government has assessed poverty through annual household surveys that have provided very sound quantitative data at the national level. Indonesia has been successful in collecting good quality monetary indicators, and has also developed some useful non-monetary indicators of poverty across the regions through the Susenas232 household survey. The National Socio-Economic Survey (Survei Sosial Ekonomi Nasional, or Susenas) was initiated in 1963-64 and has been fielded every year or two since then. Few developing countries have established such large-scale surveys that allow households’ welfare to be assessed.
Indonesia has systematically stepped up poverty monitoring as a key aspect of its development program, but these systems have deteriorated since decentralization. Since the elimination of the deconcentrated central government agencies,233 many ministries indicate that there has been a significant decline in the reporting of administrative or routine data. Moreover, while the Central Bureau of Statistics (BPS) had established a solid reputation in terms of the number and quality of its statistical products, since the financial crisis it has been subject to budget constraints and a freeze on staffing levels. This has raised questions about the quality of current technical and operational capabilities.
242

Chapter 7: Making Government Work for the Poor
Notwithstanding the commendable efforts In Indonesia In relation to data collection, there Is still a lack of Information at the regional and district level. Given fiscal and functional decentralization, this is where information is now urgently required. Many local governments do not have real-time access to information from many national surveys (see below), and thus are not as well equipped as they could be to make planning and spending decisions.
For some Important non-monetary indicators, such as infant mortality, maternal mortality and nutritional status, data compiled by the Indonesian Demographic and Health Survey (DHS) are not collected on an annual basis and in most cases are only aggregated at the national level.
II. Regional coverage of data Is lacking. Unfortunately, most household surveys are only reliable at the regional/provincial level, but program design and budget allocations (including the DAH) require a more precise definition (below the kabupaten level) of where the poor reside.
111. Quantitative data are not supported by systematic qualitative assessment. Indonesia has some experience in participatory poverty assessment. However, this is far from widespread and is not mainstreamed at the local levels of government or in national approaches to poverty assessm e nt .
IV. Routine and administrative data at the dlstrlct/munlclpal level are lacking. The regional branches (KanwiI/Kandep) of the central government that previously collected and reported these data no longer exist. While some districts now collect data, these are not necessarily fed into national- level information systems.
V. Data collection efforts are not well coordinated across departments. There is no system to coordinate the collection of data by the BPS and line ministries. incentives tend to foster independent data collection efforts (for example, data associated with individual programs or projects) and there are gaps in the development of the sorts of poverty diagnostics that are needed.
1.
But the most critical problem Is that the Information available Is not effectively used for decision-making on policies and budget allocations, Inevitably affecting outcomes. Quite irrespective of the limitations of the information being compiled, too often the data are not used to confirm suspected problems or issues, to develop policy and design programs, or to monitor implementation either at the national or the local level. BPS data are collected, published and used effectively by academics, but policy-makers rarely use them to make decisions on poverty reduction interventions. Line ministry data are not regularly published or disseminated (even within line departments) and also go unused in the design of sector policies and programs.
Monitoring Is a key aspect of poverty reduction and making progress towards the MDGs. It takes two forms: monitoring of poverty (as carried out by the government through Susenas, etc, and described above); and monitoring of the implementation of plans, programs and expenditures. Strengthening monitoring of interventions is particularly important if the central government is to adopt more results- oriented processes that increase incentives. Currently, most programs are monitored to some degree, but with ill-defined objectives and inconsistent indicators; and the data collected may not be fed back to make program adjustments or used to take other necessary actions.
Recommendations
1. Make better use of existing and emerging data sources to both better understand poverty and program impact
The national data system could be Improved. While Indonesia already has a good national data gathering system, the existing system could be improved to provide data in a more timely manner to a wider range of stakeholders. While data gathered is already comprehensive, the household survey could benefit from including a facilities survey as well, which would capture the characteristics of key local service-provision organizations.
243

MAKING THE NEW INDONESIA WORK FOR THE POOR
Strengthen systems to both understand and analyze poverty In the decentralized context. This means creating and analyzing data sets faster, so that they can be used by planners to revise programs and budgets in the light of new findings. In addition, it means making information more widely available to local planning bodies (Bappedas) so that they can use the information for local planning.
Use ‘small area’ poverty maps that are accurate to the sulxllstrlct level more systematically. Small-area mapping is a relatively new technique that holds great promise in illustrating key poverty variables, and is accurate to very local levels. It enables a much more precise understanding of local poverty, and can be a powerful tool in devising locally-appropriate solutions to these problems (see Spotlight on Innovation at the end of Chapter 6 on Social Protection for more information on this type of poverty mapping).
Although the potential for better poverty diagnosls exlsts, indonesla needs to meet a number of challenges to benefit from these new technologies and methods. These challenges include ensuring technical and financial sustainability by deepening government’s technical skills, utilizing and updating information more frequently, and blending qualitative and quantitative methods to understand better why people are p0or ,~3~ and promoting better program planning. A good first step would be to focus upon the technical and analytical skills of the Bappedas, which are directly responsible for understanding and using information provided by these surveys.
2. Llnk monltorlng flndlngs more effectlvely wlth feedback to, and deslgn of, sectoral programs and for use by local governments
Monitoring flndlngs should be made use of. While the generation of accurate and useful findings is important, it is also vital to use these findings to improve budgeting allocations and program design. The central government also has a key role to play in ensuring that these findings are easily available to local governments in a timely manner.
It would be desirable to strengthen the role of the central government to enable better monitorlng of reglonal poverty and links to poverty reduction expenditures. In order to enable (i) the expansion of the Susenas to cover specific remote and disadvantaged regions, and/or facilities (e.g. schools, health clinics); and to link this nationally to (ii) the development of aset of public expenditure tracking surveys (PETS), which tracks the flow of funds and determines the extent to which target groups are being reached, it may be necessary to enhance the role of the BPS and allocate it additional finances. In addition, at the sector level, line ministries need to work with regional sector offices (Dinas) to identify and agree on what information needs to be shared, in what way, and what incentives need to be provided to regional governments.
Develop approaches to feed the lnformatlon collected more systematically Into program design. The actual use of program results-in determining ceilings or ultimately budget allocations-is still some years away. Indeed, while many countries include integrated performance targets in budget processes, few use this information to determine the levels of allocation.235 As an immediate measure, however, ministries should document the findings of program assessments/evaluations as part of their annual work plans and budgets, and these should be proactively and widely disseminated, through ministry websites, workshops, legislative assemblies (the DPR, the DPRDs and the DPD), regional governments and their associations, universities, think-tanks and other CSOs.
Establish a multi-year program to proactively assess the poverty Impacts of selected programs. Due to limited funding and capacity, it is inevitable that only a few programs will be rigorously evaluated. Therefore, the government (central agencies with selected ministries) needs to strategically select major programs to evaluate for their poverty impacts. The lessons learned from these evaluations should then be used to inform decisions on the expansion, modification or elimination of the portfolio of programs.236 For key poverty-related initiatives, such as social protection, employment-creation, micro-credit, SME support, community-driven development and rural infrastructure-all central to the pathways out of poverty-program assessments should be undertaken. There are, for example, some 127 SME assistance programs operated by 13 government instit~tions.23~ It seems appropriate to ask if their objectives are still relevant and if they are all meeting their objectives.
244

Chapter 7: Making Government Work for the Poor
Develop systematic approaches to elicit and utilize cltizen reporting and feedback at central and reglonal levels. Any stakeholder, be they national and sub-national governments, citizen groups, or communities can solicit and compile citizen views on poverty reduction programs. Also known as ‘citizen scorecards’ or ‘report cards’, this form of participatory reporting can be used to monitor access, adequacy, quality and/or general citizen satisfaction, and is a powerful tool to obtain feedback from the poor and (socially and regionally) marginalized groups. The recent rapid appraisal of the unconditional cash transfer (UCT) program represents an example of such an effort, in which the views of beneficiaries and other stakeholders were sought in order to respond to policy-makers’ need for information. Best practice in Bangalore238 illustrates the benefits of report cards in improving service delivery to the poor. Findings can, indeed should, be used in the preparation of plans and budget proposals.239 Given the time and resources involved in their development, the focus initially could be on frontline services (e.g. health clinics, schools) and programs targeted specifically to the poor.
A number of effective lnltlatlves provide good practice for program monitoring and feedback. Following the rapid design and roll-out of the PKPS-BBM programs (the three main programs funded by reallocated fuel-subsidy funds, together with the UCT)-the government instigated a process to monitor program implementation. The recently conducted qualitative assessments of the implementation of these major fuel compensation programs (in health, education, and village infrastructure, and the UCT), are examples of good practice in conducting program assessments to improve design and implementation.
Build on the institutional successes of Indonesia’s rural development program. The Kecamatan Development Program (KDP) has achieved considerable success in providing basic services to the rural poor, connecting villages into the country’s growth and vastly improving their access to basic services. The scaling-up of this program-now a primary government goal-will require government to mimic the skills and organizational arrangements that have made the program so successful.
V Conclusion: Towards Government Services Focused on the Poor
The publlc sector has the potential to work much more effectively for the poor in Indonesia. While Indonesia may have made significant strides in reducing poverty over the past 30 years, the public sector has not always played its full role in contributing to this success. This situation must change going forward if Indonesia is to achieve the MDGs by 2015 and its own more ambitious medium-term poverty reduction goals. This chapter attempts to analyse the reasons behind the less-than-optimal performance of the public sector and to suggest ways of gearing in the policy and implementation framework in such a way as to better serve poverty reduction efforts. This exercise is also conducted in the context of decentralization, which now, in the post-crisis environment, offers Indonesia a unique window of opportunity for far-reaching changes and improvements in government performance.
Three key areas of government actlon need to be addressed If the public sector is to start to work more effectively for the poor. First, there is a need to improve policy alignment, and’also augment planning and budgeting systems. Second, there is a need to strengthen institutional accountability. Third, it will be necessary to enhance the assessment and monitoring of poverty reduction efforts by government if progress is to be measured and assured.
Achieving better policy alignment, together with Improved planning, budgeting and allocation systems. There are four priority areas requiring action in order to strengthen policy, planning and budgeting systems. First, improved systems for linking poverty reduction priorities with sectoral plans and budgets would help to translate political priorities into budgetary allocations that more closely reflect these priorities. Second, strengthened capacity and incentives for pro-poor planning and budgeting should be developed through improved technical guidance from Bappenas and the Ministry of Finance. Third, district and municipal planning and budgeting systems could be made more effective in terms of poverty reduction by improving poverty analysis, and by encouraging capacity building, and the use of incentives and participatory processes. Finally, the DAU and DAH transfers-the main sources of local government revenuewan be used more effectively both to address poverty in the poorest areas of the country, as well as more effectively reward good local government performance.
245
MAKING THE NEW INDONESIA WORK FOR THE POOR
Strengthening accountability both wlthln government, as well as between government and citizens. In order to improve accountability within government, and between the government and Indonesian citizens, there are three priority action areas: first, there is a need for greater clarity of functions between and among central and local government units, and the private sector; second, more focus should be placed upon capacity building and the use of incentives within the civil service; and, third, there is a need to strengthen client voice regarding the performance of civil servants.
Improving monltorlng and evaluatlon systems, and using the results more systematlcally In budgeting and design. First, it is important that the government makes better use of existing and emerging data sources to both better understand poverty and program impact. While Indonesia already has a good national data- gathering system, the existing system could be improved to provide information more frequently and to a wider range of stakeholders. While the data gathered are already comprehensive, the household survey could benefit from also including a survey of facilities. This would capture the characteristics of key local service-provision organizations. Second, there is a need to link monitoring findings more effectively with feedback to and design of sectoral programs, and for the use of these findings by local governments. While generating accurate and useful findings is important, it is also vital to use these findings to improve budgeting allocations and program design. The national government also has a key role to play in ensuring that these findings are easily and frequently available to local governments.
246

Chapter 7: Making Government Work for the Poor
Focus on Annual Plan and Budget Preparation for 2006 The government’s fiscal year begins on January 1, and preparation for each annual work pian and associated budget begins about one year beforehand.
Januaty-Aprll2005
Bappenas prepares prellmlnaty government work plan (RKP). Bappenas prepared a preilmlnary draft of the annual government work pian (RKP), which established priority policy areas based on Bappenas’ interpretation of how the three overarching development agendas in the medium-term pian (RPJM) translated on an annual basis (incorporating current realities, notably the need to respond to the natural disaster in Aceh and North Sumatra). The priorities were discussed in cabinet and revlsed based on its input. The most significant change was the introduction of strengthening defense capability as a priority, in response to a controversial border dispute with Malaysia that was ongoing at that time.
Fiscal pollcy, Indicative celllngs and final government work plan approved by cablnet. Parallel t o the above process, the Ministry of Finance developed the fiscal policy and, together with Bappenas, the indicative ceilings for each ministry. Flnance apportioned the ‘non-discretionary’ spending across ministries, while Bappenas allotted the ‘discretionary’, based on the cabinet-approved priorities. Allocations for the ministries of health, education and public works, as well as the army and police, were accordingly increased. Cabinet reviewed the proposed aggregate expenditure budget and sectoral ceilings together with the proposed RKP priorities (as above). A joint circular letter was sent to line ministries outlining the overall government priorities and the indicative ceilings as the basis for preparing their preliminary draft annual work plans (Renja- KL).
Mlnlstrles prepare work plans. The internal ministry processes varied, but generally the Planning Bureaus were responsible for coordinatlon. For 2006, the process was somewhat complicated as ministries were preparing their medium-term plans (Renstra-KL) at the same time. Bappenas sector Directorates informally liaised with ministries as they prepared their Renja- KL, and used ministry input to finalize the RKP. Ministries discussed their preliminary draft Renja-KL with the relevant parliamentary committee at the same time as the Ministry of Finance and Bappenas dlscussed fiscal policy and the overaii government pian with the Budget Committee (see below). Discussions tended to focus on details of deconcentrated spending in regions, with many committee members lobbying for their respective constituencies.
I May-August 2005
Dlscusslons with Parliament begin, and mlnlstrles prepare work plans and budgets (RKA-KLs). The Ministry of Finance presented the fiscal policy and Bappenas the government priorities to the Parliamentary Budget Committee. Based on the results of these discussions, the Ministry of Finance revised the ceilings that were used by ministries together with input from the parliamentary discussions to convert their Renja-KL into work plans and budget submissions (RKA-KLs). RKA-KLs included budget details at the program and activity level, as well as performance targets and indicators (which were of mixed quality). In many cases, the 2007 estimates are guesstimates, and it was widely acknowledged that the process of estimatlon will need to be improved upon in future years. It was also recognized that the budget is not yet truly integrated. For example, some ministries simply took their salary budget and put it against one program. The draft RKA-KLs were subsequently reviewed by Bappenas for congruence with the RKP priorities and the Ministry of Finance for consistency with the ceilings. This was a fairly cursory exercise due to the limited time available, as were the discussions with parliamentary committees on the draft RKA-KLs. The draft state budget was approved by cabinet before being submitted to the parliament by the president.
September-December 2005
Flnallzatlon and parllamentary approval of state budget and RKA-KLs. During September and October, iterative discussions between line ministries and the Ministry of Finance took place, focused on the detailed input norms for the proposed program spending. Ministries had further discussions with their respective Parliamentary committee, while the Ministry of Finance and Bappenas met again with the Budget Committee. Due to the significant reduction in fuel subsidies announced in September (effective October l), the Ministry of Finance and Bappenas agreed on a pian for reallocating the resources which was presented to a limited cabinet meeting (coordinating ministers and selected line ministers) for approval. A significant amount was reallocated to a new program of unconditional cash transfers to the poor and near-poor to mitigate the inflationary Impacts of the rise in kerosene and other fuel prices, as well as to doubling the size of the special aiiocation grant (DAK). Other savings were allocated to programs intended to increase access to quality health and education services for the poor. The revised state budget was approved by the parliament at the end of October. Ministries then have to apply for, and receive, spending authorization from the Ministry of Finance.
247

MAKING THE NEW INDONESIA WORK FOR THE POOR
Focus on Elements of Good DAK Design The DAH is a fiscal transfer to sub-national localities that has the potentlai to
Sector, oblectlve and expected results: The overall purpose of the DAH In law is twofold: (i) to address basic services that have not meet certain standards; and (ii) to support areas requiring accelerated development. At this level of generality, these are consistent with the government’s poverty reduction goals. Selection of the specific DAH objective@) should consider national poverty reduction objectives and targets, and spending trends. The capacity of the sector ministry could also be a factor.
Conditions: Closely linked to the decision above are the condltions to be applied. These could relate to how services are dellvered, which services are delivered, or to which users. Conslderation also has to be given to sanctions for breach of conditions, as well as incentives to meet the conditions (e.g. to build capacity of recipient governments to effectively spend the grant).
The law requires that district/municipal governments match a minimum of 10 percent of the DAK. If it is anticlpated that local governments wili be very responslve to achieving the national objective, then the matching amount could be higher. Since fiscal disparities remain high, the matching requirement could vary inversely wlth fiscal capacity. It could also vary inversely with per capita costs of providing the service@), although this might be difficult If the objective and conditions were resultsoriented. Since a matching requirement may only become a substitute for the expenditure that the subnational governments were funding, the government can include a ‘maintenance of effort’ condition, and then match additional effort to the DAK funding.
Open- or closeended: The DAK can be open-ended grants, that is, regions receive however much they are prepared to match (and spend). This could provide an incentive for greater regional spending on national priorities and, therefore, potentlally improved results (assuming regions have the matching resources and there is a strong monitoring of adherence to conditions). This makes it difficult, however, for the central government to predict what its expenditure will be. Moreover, there is a risk that If regional use of the grant was oversubscribed, the central government wlli need to stop disbursing, leaving a very messy situation. The more typical situation is to use closedended grants in which the central government sets the total pool, as well as individual district/municipal shares, upfront. This ensures that governments with greater fiscal capaclty are not able to access a greater proportion than needs- based criteria would suggest simply because they are better able to provide the matching funds.
Timeframe: Developing and allocating a DAK on an annual basis could be useful for ‘experimenting’. A multi-year timeframe, however, would enable district/municipal governments to more effectively plan-both for designing programs/services that will meet the grant objective and conditions, as well as for raising their matching share (assuming it Is ‘additional’ fundlng). A multi-year timeframe is also consistent with the move towards medium-term budgeting.
Allocation criteria: The allocation of the grant between districts/municipallties is the most political aspect of grant design and implementation. Good practice suggests that allocation should be based on objective, simple and transparent criteria, linked to the objective and conditions. In addition, the capacity to collect and analyze the relevant data needs to be taken into consideration. Data for each of the three types of criteria [(i) general criteria (defined as fiscal capacity); (ii) special criteria (defined as regional characteristics, specifically Aceh, Papua and eastern Indonesia, as well as regions near borders, underdeveloped areas, coastal areas, and postconflict regions); and, (iii) technical criteria as determined by sector minlstries (and implicltly related to grant objective and conditions)] should be statistlcally sound, regularly updated, and preferably come from an independent source that cannot be manipulated and is respected by all stakeholders.
Size of the funding pool: Individual DAHS need to be of a meaningful size, both to warrant the time and resources necessary to design and manage its implementation properly, and to ensure regional governments’ active interest in the process. The central government should have an idea of what it expects regions to achleve wlth the funds and how these might be allocated across reglons before setting the size of the pool.
Implementation: A range of administrative matters need to be determined before a grant is implemented, including timing. Ideally, there should be sufficient time between the dates by which the central government and subnational budgets are due to allow the central budget to be approved and sub-national governments to be advised of their grant before the subnational budgets are due. A key aspect of managing the DAH is the reporting, monitoring and evaluation arrangements. Subnationai governments are already expected to report on a regular basis to the MoF and relevant sector ministry. It is important that reporting requirements include data allowing an assessment of whether conditions have been met and the effectiveness of the DAH. The central government needs to both verify that the grants are used according to their intended use (including compliance with conditions), as well as analyze the information that is reported, to adjust as necessary grant conditions and criteria.
Consultation: At a minimum, subnational governments should be consulted on the various design features of a DAH, in particular on the condltions, criteria to be used in allocating across regions, and reporting and monitoring arrangements. Such consultation could be difficult to structure given the number of subnational governments, but it Is critical to ensuring that there is common understanding. Legal Instrument: Currently, description and allocation of DAH grants are legally enshrined annually In a Ministerial Decision (KMK) of the MoF, and sector ministries prepare and distribute technical guidance or a manual for their respective DAK. An alternative that could be considered Is to have a formal grant agreement between the two levels of government. This would: (i) ensure there is the necessary degree of specificity and clarity (particularly if there are asymmetrical arrangements); (ii) ensure that both levels of government are clear on their respective rights and obligations; and, (Hi) provide a solld basis for reporting and monitoring, Including by the community, The signing of a formal agreement can also be a visible indicator of the governments’ intentions, and can be the basis for socialization.
248

Chapter 7: Making Government Work for the Poor
i , on Innovation
Placing poverty reduction at the center of district annual plans and budgets
Lessons learned from the experience of developing district poverty reduction strategies and action plans (PRSAPs) under the Initiatives for Local Governance Reform (ILGR) Project are useful for improving the poverty orientation of the district annual plans and budgets. Under the project, multi-stakeholder groups worked to identify and agree on critical local poverty issues and then formulate a strategy and action plan to be implemented in order to reduce poverty.
(1) Consultation and partlcipation. In all ILGR districts, multiple stakeholders were involved at all stages in the formulation of PRSAPs, demonstrating that they have the capacity to formulate plans/strategies. Moreover, it shows that stakeholders are willing to become involved voluntarily given the ‘right’ facilitation and support. It needs to be recognized that participatory plan and policy formulation takes time, and usually requires building capacity of both government and non-government stakeholders. Moreover, specific efforts need to be made to include the views of the poor, including using participatory poverty assessment (PPA) tools and methodology.
(2) Poverty focus. Key to developing the PRSAPs was poverty diagnostics using district-level data, as well as information gathered directly from poor households. Where there was a well-rounded poverty diagnosis, that information was used as input in setting priorities and proposing new policy directions and/or programs. It was sometimes difficult, however, t o integrate the district level (often quantitative) data with the qualitative findings from the community levekequi r ing changes to the PPA tools. Whether it is quantitative or qualitative, poverty diagnostics should be used in the annual planning and budgeting processes by Dinas in considering the targets they set, as well as the programs/activities, but also in the setting of inter-sectoral priorities and budget allocations. BPS poverty maps, for example, can be used by districts to improve geographic targeting of their spending.
(3) Results Orientation. While an explicit orientation towards the attainment of results was not emphasized in the PRSAP process, it underpins the new national and sub-national planning and budgeting regulatory framework. A results orientation would need to gradually be integrated into the annual process of establishing plans and budgets and just as importantly, into implementation. At a minimum, Dinas can start to define priorities in a results-oriented way and ensure targets are measurable. This would allow for implementation monitoring and provide useful feedback if used appropriately. This will, however, require consistency and coherence between the annual plan and the budget.
As much as there are technical capacity issues associated with integrating poverty into plans and budgets, and in developing plans and budgets in a participatory manner, the politics matter just as much. The above assumes that there is a commitment from the head of government and the district parliament to poverty reduction, including funds to support a consultative process that includes the poor, and a willingness to allow the results of such a process to influence the decision-making process.
Formulating and institutionalizing reglonal poverty reduction strategies in Bulukumba district
Bulukumba was one of several districts that participated in ILGR. The bupati established a multi-stakeholder group (Pokja), dominated by civil society, that worked together to formula a strategy and action plan to reduce poverty.
The process was perceived as being participatory, not just consultative. The PRSAP was developed by all the stakeholders in the Pokja, and the public was involved in different ways throughout the process. While the Pokja found that it was difficult to get the involvement of the poor in district-level consultation meetings, women were active participants in the working group and at all steps in the formulation of the PRSAP. This success was, at least in part, due to previous experience in using participatory approaches and the willingness of civil servants to be responsive to civil society and the public, including the poor. Based on this experience, the formulation team for the medium-term development plan (RPJMD) was multi-stakeholder, and several focus group discussions and public consultations were held as part of plan formulation.
The bupati made the PRSAP a formal reference for all Dinas, and several proposals from the PRSAP were adopted: (i) introduction of cross subsidies and scholarships for poor students; (ii) establishment of a voucher system to increase access for the poor; (iii) formulation of a mobile training unit to provide skills training for microenterprises; and, (iv) clean-up of polluted areas.
249

MAKING THE NEW INDONESIA WORK FOR THE POOR
Intensive efforts to curb corruption in village infrastructure development: Lessons from Indonesia
All projects in Indonesia operate in a high-risk environment when faced with issues of leakage and corruption. Because of this, new World Bank projects in Indonesia are now required to include an anti-corruption action strategy as part of their project designs. One project that has seriously focused on fighting corruption is the Kecamatan Development Program (KDP). KDP is a US$1.3 billion World Bank community-driven development project that was piloted in 25 villages in 1997, just before the East Asia financial crisis, and has since scaled up to fund small-scale development activities in some 34,200 villages nationwide. Its approach to combating corruption is based on an analysis of the political economy of corruption in Indonesian villages and on mapping potential points of leakage. The case is useful to understand what works to limit corruption in a large, rural development project in a country with endemic corruption, a weak legal system and a history of top-down political control by a powerful state bureaucracy.
How does the KDP approach attack corruption?
KDP limits corrupt practices by: (i) significantly reducing the complexity of project design and procedures; (ii) ensuring that all information and transactions are transparent; and (iii) responding quickly to complaints.
Some of the concrete steps to reduce corruption in KDP include:
Simplifying Financial Formats So That They Can Be Understood Easily By Villagers;
Transferring Funds Directly Into Collective Village Bank Accounts;
Insisting That All Financial Transactions Have At Least Three Signatures And That At Least Three Quotations Are Found For The Procurement Of Goods, To Be Shared Publicly At Village Meetings;
Insisting That Basic Project Information And Details Of All Financial Transactions Are Posted On Village Notice-Boards;
Requiring That Regular Village Meetings Are Held To Account For Project Funds At Which Villagers Have The Right To Suspend Further Disbursements Of Funds If Irregularities Are Found;
Providing Village-Level Sources Of Information And Channels For Complaints Independent Of Local Government;
Applying Sanctions Or Suspending Projects, When Necessary;
Ensuring Intensive Field-Level Supervision By Elected Village Facilitators And Sub-District Level Project Facilitators;
Maintaining An Internal, Roving Financial Supervision And Training Team Who Provide Financial Training To Project Stakeholders As Well As Conduct Spot-checks Of Project Financial Records; And
Optimizing Independent Monitoring Of The Project By Provincial Ngos And Local Journalists.
While it is difficult t o reduce corruption in its entirety, even with the aforementioned measures, KDP has achieved some concrete evidence of success:
Over the past several years, World Bank-commissioned independent audits by Price Waterhouse and Moore Rowlands reported no significant qualifications. Fund irregularities were less than one percent of total project funds. Audits by the official government audit agency (BPKP) also found few leakages and no major abnormalities. KDP’s internal financial supervision and training team audits an average of 18 percent of KDP hecamatan throughout the country. Less than one percent of total grant funds that were checked indicated abnormalities. Several independent evaluations show that village infrastructure built through KDP methods costs significantly less-on average 56 percent l ese than works of equivalent quality built through the Ministry of Public Works or through local government contracts.
e
e
250
Chapter 7: Making Government Work for the Poor
There is evidence also of some governance spillovers from KDP, illustrated by examples of villagers using their experience from KDP as a precedent for protesting against corruption in other projects.
Experiments in measuring corruption
KDP has always attempted to learn from its experience and add to its anti-corruption arsenal. In 2002, the project commissioned field research to examine innovative approaches to reducing corruption. The study conducted a randomized, controlled analysis of corruption in 600 KDP road-building projects in East and Central Java during the period 2002 to 2004. The research examined three different approaches:
Normal KDP projects. Projects in which participation was deepened by inviting many villagers to public meetings, and/or by encouraging them to write anonymous comment cards regarding the local project. Projects in which villagers were told in advance that their project would definitely be audited, raising the chance of an audit from the normal 4 percent to 100 percent for these villages. Audit findings were then announced in public village meetings.
The study found that:
The intervention of announcing an increased probability of a government audit, combined with reporting the audit results directly to a public village forum, was more effective at reducing corruption than increasing villagers' participation in the monitoring process.
The increased probability of an audit reduced the percent of 'missing' funds, Le., funds that could not be accounted for by an engineering inspection of the completed infrastructure project-by about 8 percentage points from about 28 percent in control villages to 20 percent in villages receiving the audits. There was a significant decrease in missing funds in the audit intervention.
Three points however should be considered in interpreting these figures. I First, the project's estimate of the change in the percent missing, the 8 percentage-point reduction,
is substantially more reliable than the estimated level of the percent missing-28 percent in control villages. The numbers are much more useful for comparisons between villages than absolute levels per se.
Second, the absolute levels of corruption are heavily dependent upon calibration assumptions. Some of the missing amounts could be attributed to corruption but most of it could just as rationally be attributed to other factors such as standard engineering loss rates and sheer inefficiency. Factors such as weather, erosion, compacting of materials, transport losses, difficulties of field measurement, and incompetence are all difficult-to-measure ingredients in the missing amounts or 'loss ratios'.
Third, even in the audit intervention, community participation was critical because the plan to conduct audits was announced and disseminated to villagers beforehand, and audit results were read out publicly in village meetings.
i
I
The study further concludes that grassroots monitoring may be more effective in certain contexts than in others. For projects where villagers inherently have good information about potential corruption and a strong personal stake in minimizing theft of funds, such as subsidies for food, healthcare, education, or potentially microcredit projects, grassroots monitoring is likely to be effective. For projects where information gathering is difficult and benefits from reducing corruption are more diffuse, such as infrastructure projects, grassroots monitoring alone is unlikely to be sufficient.
Learning from this study, KDP is in the process of increasing its audit sample in project sites.
Sources: (1) (2) (3)
(4)
(5)
Alatas, Vivi. 'Evaluation of the Hecamatan Development Program (draft mimeo)". World Bank, Jakarta. (draft mimeo). The Economist, "Digging for Dirt." London, May 16, 2006. Guggenheim, Scott et ai. 2004. 'Indonesia's Hecamatan Development Program: A Largescale Use of Community Development to Reduce Poverty." World Bank, Jakarta. 2004. Olken, Ben. (2004). "Monitoring Corruption: Evidence from a Field Experiment In Indonesia." NBER Working Paper, Washington, D.C. November 2004. Woodhouse, Andrea. 2002. 'Village Corruption in Indonesia: Fighting Corruption in the World Bank's Hecamatan Development Program." World Bank, Jakarta. June 2002.
251

Chapter 8 Summary of Recommendations


Chapter 8: Summary of Recommendations
I Priorities for Poverty Reduction: An Agenda for Action
To conclude, Indonesia’s persisting but specific poverty problems, coupled with the government’s priorities and Its fiscal resources to address them, now positlons the country to make slgnlflcant headway In reducing poverty. The question is: where to start in addressing such a broad, multidisciplinary and interwoven issue as poverty reduction on a national scale? Action is urgently required in several areas in order to address the four poverty-reducing imperatives in Indonesia of (i) reducing income poverty through growth, (ii) strengthening human capabilities, and (iii) reducing vulnerabilities and risks among poorer households, while also (iv) strengthening the institutional framework to do so and to make public action more pro-poor. In the view of the authors of this report, and with these four areas in mind, the following 16 actions should be viewed as priorities to be addressed at the soonest opportunity going forward.
1.
2.
3.
4.
Remove the ban on rlce Imports. Lowering the rice price and creating greater price stability by removing the import ban on rice is the fastest way for the government to reduce poverty quickly. The ban should be replaced by a low specific tariff. Allowing general importation subject to a tariff will be a far more effective mechanism for stabilizing rice prices and preventing the large increases in the rice price that are so damaging to the poor. In addition, targeted provision of rural infrastructure, and agricultural research and extension services will help marginal farmers improve productivity or diversify into other higher-margin crops.
Invest In education with a focus on improving access and affordability of secondary schools and vocational training among the poor, whlie improving the quality and efficiency of primary schools. To improve attainment among the poor at the junior secondary school level will require supply- and demand-side interventions. On the supply side, more junior secondary classrooms and schools need to be made available. This can be done by converting primary schools where there is excess supply. On the demand side, junior secondary schools and vocational training schools (SMKs) can be made more affordable for the poor by targeting transfers to poor students through scholarships or conditional cash transfers (CCTs). Toimprove the quality of primary education, a priority action will be to undertake a program to improve teacher management so that fewer but better-quality teachers are present in schools and are also deployed in greater numbers to remote areas.
invest in health with a focus of Improving the quality of primary healthcare-public and prlvategnd access to higher level healthcare. The issue of public service delivery quality continues to require concerted efforts to improve provider accountability and civil service staffing. The poor are using the private sector as an alternative for primary healthcare, and efforts should be made to improve the quality of the private sector through regulatory and training programs. On the demand side, CCTs can help specifically in interventions where behavioral change is required to enhance demand, such as child well-being and nutrition status check-ups, and child immunization. For higher-level healthcare, affordability is an issue and targeted programs would make sense, such as a health insurance program. It will be important to build on and improve the recently launched program based on recent assessments, which points to the need to improve targeting and open up service provision.
A focused effort is required to address Indonesia’s shockingly high maternal mortality rate. The key to reducing maternal mortality is to increase the proportion of births attended by skilled professionals. Traditional birth attendants remain the principal choice of childbirth assistance provider for the poor in Indonesia as a result of both demand and supply constraints. First, in order to increase demand for skilled professionals there is a need for a national campaign informing communities of the benefits of professionally assisted birth delivery. To improve affordability of skilled professionals, the government needs to increase demand-side financing through voucher or health-card schemes. The health insurance system could also allow for a transport stipend for delivery at health clinics for prenatal visits and delivery. Second, on the supply side, formal and in- service training can be expanded for village midwives who are often the first line of defense,
253

MAKING THE NEW INDONESIA WORK FOR THE POOR
5.
6.
7.
8.
9.
especially in more remote areas. Toincrease the availability of skilled midwives in remote areas-a goal that will not be easy to achiev-ne approach may be to offer formal courses to train new skilled midwives.
improve the quality of water accessed by the poor using separate strategies for rural and urban areas. For rural areas, the existing community management supply model that has been shown to work should be expanded. This currently covers 25-30 percent of the rural population, but could be expanded to cover the 50 million people currently without adequate water supply. For urban areas, supply must be strengthened by improving capacity and incentives for water utilities (PDAMs) to plan, deliver and monitor service delivery. In addition, PDAMs need to be mandated and given incentives to scale up services to marginal areas inhabited by the poor. Consideration needs to be given to designing appropriate tariff structures for the poor who benefit from current or will have future connections. Consideration also needs to be given to enabling the poor to benefit if they do not have connections, such as geographic targeting or lower service level subsidies (e.$ promoting access to standpipes), which would also encourage incremental service improvements at lower cost to the poor.
Address the sanltatlon crisis facing Indonesia and its poor. Improving sanitation requires a two- pronged approach: stimulating demand while improving service delivery on the supply side. On the demand side, there is a lack of recognition of the widespread benefits of good sanitation. The government should undertake a simple national public awareness campaign aimed at improving sanitation practices by all and stimulating demand and pressure for change-a relatively low cost measure with potentially high returns. On the supply side, service delivery must be improved. A critical starting point is to finance increased but sustainable investment in sanitation. Two immediate options are: development of a national strategy to increase sanitation financing among all players; and, local government investment in sanitation infrastructure at the neighborhood and citywide levels, for example through a specific DAH for sanitation, or including sanitation services in minimum service standards.
Launch a large-scale program to Invest in rural and villagelevel roads. For district level roads, there is a need to increase financing, particularly for maintenance, through a concerted strategy. One option is a special DAH. These funds could be targeted (using poverty maps) to areas where access for the poor is worst. The DAH should leverage and increase district-level funding for road maintenance. Another possibility is the development of a road fund at the district or provincial level along with the establishment of a district-level road management system. Communitydriven programs have been shown to assist with labor-intensive approaches to the construction and maintenance of village and kecamatan roads. Scaling up such approaches will be useful to improving the access of the rural poor to markets.
Scale up to national level Indonesia’s successful communltydriven development (CDD) approach. Community-driven development projects (such as HDP) have had a history of success in Indonesia. The CDD approach has been shown to have high rates of return on investment; it addresses in an integrated fashion binding constraints to poverty reduction at the village level (whether it be village roads, water and sanitation, or other constraints to poverty and well-being); and it targets poorer areas and has had a demonstrable impact on poverty reduction. While doing so, the CDD approach also empowers the poor to have a say in how community resources are spent. Importantly, the approach is easily replicable. Indonesia should quickly scale up its CDD approach to cover the entire nation. It is estimated that such a national program could be up and running within three years.
Complete development of a comprehensive social protection system that addresses the rlsks and vulnerabilities faced by the poor and near-poor. A new social protection program for Indonesia can be made to address the four main risks and vulnerabilities faced by the poor in the country. Four programs could be considered to constitute a social protection system. First, a conditional cash transfer program could be used to target cash to poorer households while making this cash conditional on households or communities achieving certain human development conditions. These conditions can be those that are related to high priority outcomes for Indonesia and that mitigate
254

Chapter 8: Summary of Recommendations
10.
11.
12.
13.
against the tendency of households to cope with shocks by reducing spending on health and education, especially of children. Second, a workfare program could be considered to mitigate against unforeseen shocks to household income. For this to be successful it would need to self- target at a low relevant ‘safety net’ wage below the current minimum wage. Third, a health insurance program targeted to the poor and near-poor can help these households deal with health shocks-one of the most prevalent household level shocks that throw families into poverty. It would make sense to build this program around improvements of the newly launched health for the poor scheme. Fourth, policies to ensure low prices of staple commodities, such as rice, will be key to a comprehensive social protection policy. In developing such a social protection scheme, several complimentary actions will be key. There is scope for improving the current household targeting database. This should be done as a matter of priority, using a combination of geographic targeting and revised household proxy means-testing. While developing more effective and better-targeted social protection schemes will be key, so too will be the phasing-out of a number of programs that have been shown to be ineffective, either from a targeting, cost-effectiveness, or impact stand- point.
Revitalize agriculture through Investment in infrastructure and rebuilding research and extension services. With almost two-thirds of poor household heads still working in agriculture, boosting agricultural capability remains essential for broad-based poverty reduction. The government can contribute to this through: boosting investment in key infrastructure, notably farm-to-market roads and irrigation, while widening local water management; encouraging and supporting diversification into higher value-added crops; working with the private sector to ensure that exports meet world standards; boosting expenditure on agricultural research; and redesigning the decentralized extension service to allow for greater involvement of the private sector and civil society. These efforts to improve agricultural productivity should also include development of better marketing and information systems for rural-based businesses.
Accelerate land titling and reallocate degraded and deforested land to productive uses. Only about 25 percent of Indonesia’s estimated 80 million land parcels have been registered in the 40 years since land registration began. At the current pace of registration, it will be difficult for land registration to catch up with the growing number of parcels. The government needs to redouble its efforts to speed up land titling and more broadly ensure secure appropriate forms of tenure throughout the country. In addition, reallocating degraded, deforested land to productive uses by smallholders and the poor is one way of rationalizing land use and reducing poverty. Moreover, reclassifying Production Forest and Conversion Forest areas that are already allocated for productive economic uses will allow for more productive land-use and ownership patterns and could also lead to increased tree cover and protection of the land.
Make labor regulations more flexible. Stimulating faster growth of formal sector employment is key to reducing poverty because of the impact that this has on wages in the informal labor market. But there is ample evidence that the ‘jobless’ recovery since the financial crisis is largely a product of a poor investment climate for formal-sector firms. The National Manpower Law, No. 13/2003 is a significant contributing factor to this. Existing labor regulations are inherently ‘anti-poor’, largely because they discourage the employment of younger and unskilled workers, forcing them into the informal, unprotected sector. The government is right to have commissioned a thorough review of Indonesia’s labor laws. It should strive to build a new social contract with respect to minimum wages, severance pay and methods for settling industrial labor disputes. Such a social contract should be developed with a view to substantially reducing the costs associated with employment, particularly of younger and female workers, while protecting and enforcing basic labor rights and conditions appropriate to Indonesia’s stage of development.
Extend the reach of financial Services to the poor and boost access to commercial credlt for micro and small businesses. Surveys suggest that potential exists to almost double microfinance lending if ways can be found to address the constraints faced by households and firms that would qualify for loans and wish to borrow, but do not currently do so. One approach to doing this would be to develop a P4Kstyle outreach program for financing the household enterprises of rural low-income households. In addition, the government could encourage the development of free online savings
255

MAKING THE NEW INDONESIA WORK FOR THE POOR
products for poor households in underserved areas as a way of supporting capital accumulation and commerce. To stimulate local-level growth, the government should help small businesses gain access to commercial credit by improving the debtor information system. Developing this system to include repayment records both for loans, and ultimately other forms of regular payments too, would help small businesses access credit by using their good repayment history as an asset.
14. improve the poverty focus of national planning and budgeting for service dellvery. Several steps can be taken at the national level. First, with regard to planning and budgeting, a concerted effort is needed to ensure that sector work-programs line up with national planning priorities. Cabinet and central ministries should sign off on the final budget after parliamentary deliberations to ensure that it is in line with government priorities. Second, it is imperative for poverty reduction and service delivery that there is better clarity in functional responsibilities for the provision of specific services. This lack of clarity is paralyzing accountability in service delivery and must be addressed without delay. Third, a civil service reform process needs to be started that allows for the aligning of staff and incentives to match with functional responsibilities, and increases the quality of staff by moving to a merit-based system. Fourth, the intergovernmental fiscal framework can be better used to attain national poverty reduction objectives. Most importantly, government should design and pilot several performance-based DAH instruments, targeted to achieve key outcomes and possibly targeted to poorer areas. This should leverage increased local government funds for national priorities where there are perceived externalities. Key areas on which to start may be sanitation and rural road maintenance.
15. Undertake a major capacity-building initiatlve to strengthen local government capacity to plan, budget, and implement programs for poverty reduction. After decentralization, about one-third of total public expenditures are allocated and implemented at the district level. Yet local governments have weak capacity to plan, budget, and execute spending of these funds, particularly in a pro-poor fashion. In recent years, this is reflected in increased surpluses run by local governments. For more effective and pro-poor spending to take place, there needs to be a substantial improvement in the capacity of local governments, and the civil servants who work for them, to plan, budget and implement programs for service delivery and poverty reduction. It may be useful to complement this with actions aimed at changing incentives at the district level, for example by publicizing service performance and budget availability. Performance-based transfers from the central government could also induce improved service delivery.This is no quick-fix action, but it is a necessary condition for decentralization to work for the poor. The central government will need to work in partnership with local governments to develop a systematic, long-term strategy and program aimed at addressing these capacity issues. There is substantial scope to leverage support from international partners to address this broad, challenging and long-term agenda
16. Strengthen poverty monitoring and assessments of poverty programs. Poverty monitoring needs to be strengthened on several fronts. The capacity and budget of the Central Bureau of Statistics (BPS) needs to be enhanced following cuts during the crisis in order to improve coverage and quality of data. Poverty monitoring can be enhanced through more systematic use of qualitative measures and through improved monitoring over the course of the year by tracking market prices. A strategy is needed to reinstate regular, quality monitoring of administrative data (e.g. in health, education) in the context of decentralization by allocating responsibility and budgets for this task. Likewise, consideration is needed of what minimum poverty data requirements are necessary for decision- makers at the district level and how these data are to be collected. For decentralized decision- making, more use can and should be made of small-area poverty maps. The government needs to assess and evaluate poverty programs more systematically with a view to either improve them, scale them up, or eliminate them. Process and impact evaluations are both important. Assessments underway of the four large PKPS-BBM fuel subsidy reallocation-funded poverty programs are an important precedent in this regard. These assessments should be used to make program decisions and similar good practice needs to be applied more systematically to other programs.
256

6
6
c c c + c
c a c
m c 0 m 0 =
3
.- CI
Y
8 ti .- a 0
U
0 E I
.- 8 c 0
rll
5
c c c c
Q)
U m
5
E
2 E
z I a c c I-
s
s c c c c
0 m P - 5 b E r
U m U '0 e Y
8
E
'0 a
0 m
*
- -
+ I e * c * e I I C I * *


5 k v)
6
c c c
ln
m E GI 2 $
E
8 5
Q
, c .u
c ln

5 Li
Li
c c c
C M E r 0
f m 0
0 5
s
Li
c c c
r 0
3
n
c 0 2
s 5 5
L i z
c c c c c c c c

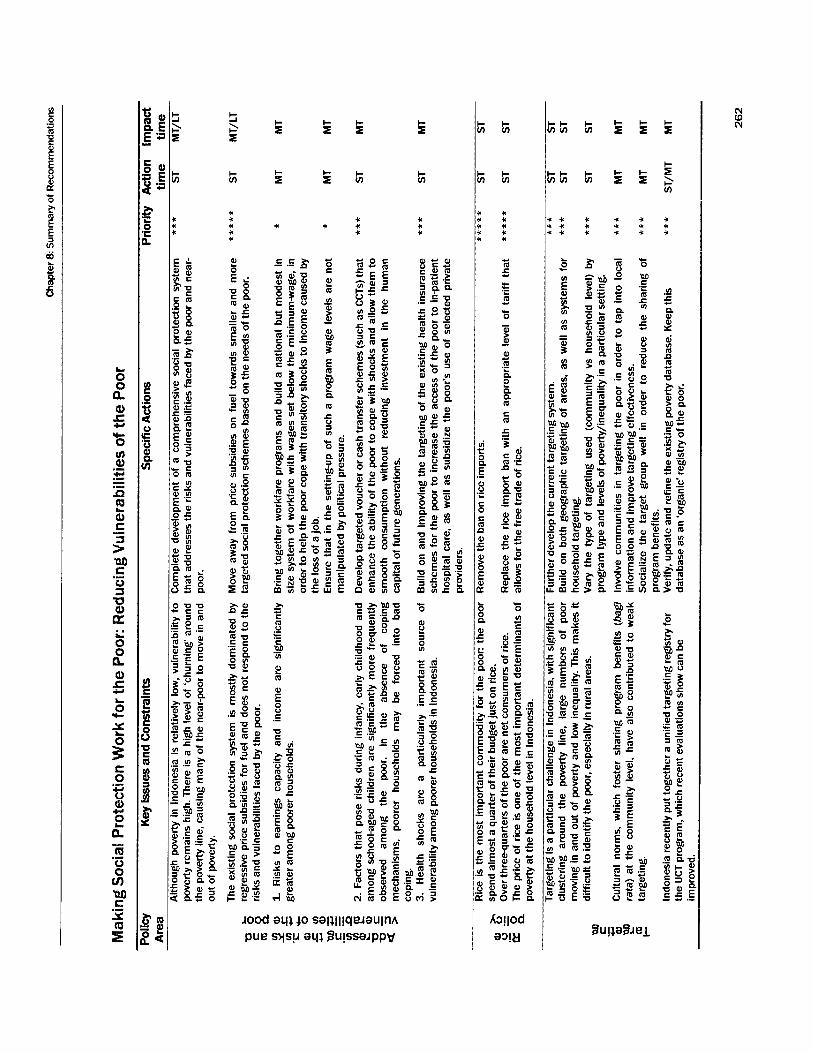
f S S
* * I * *
f 6 6 6 6 6 S S S
* * * + * + * * * * * * * * * * * + * * * * * * * * * * * + * ~i
C m

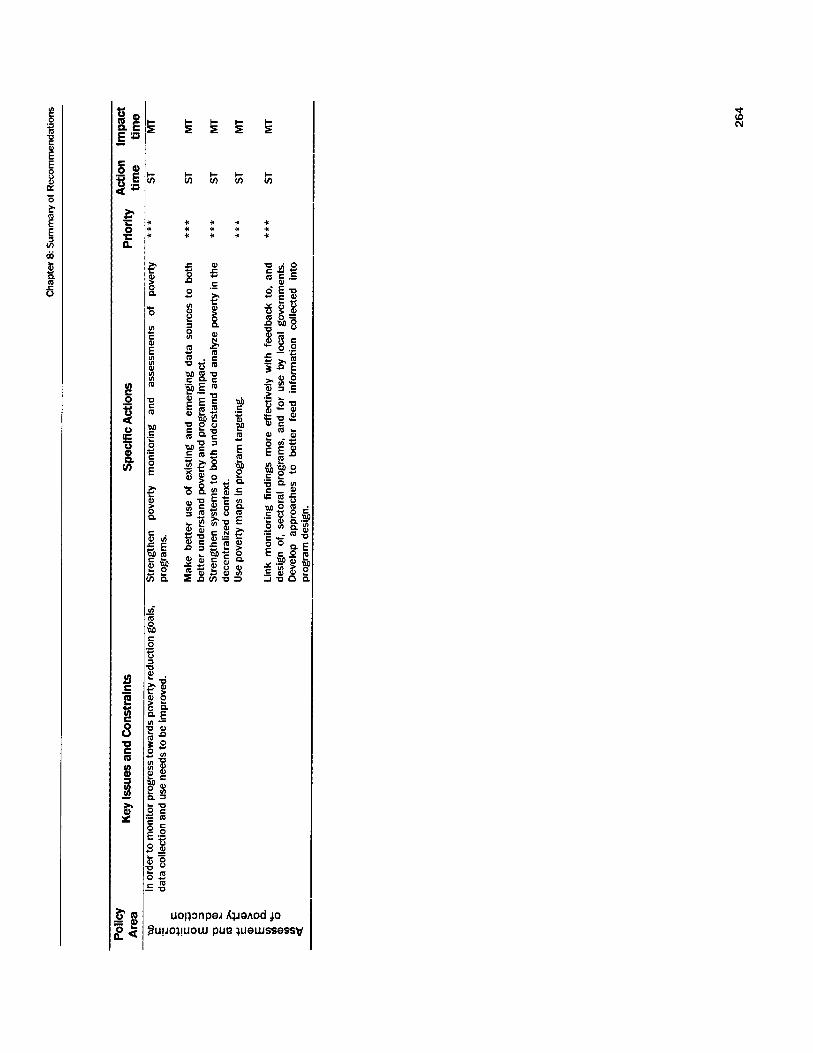

MAKING THE NEW INDONESIA WORK FOR THE POOR
Annexes
Annex II. 1 Poverty lines, percentage of poor and total numbers of poor in Indonesia By urban-rural areas, 197G2006
Year
(1) 1976 1978 1980 1981 1984 1987 1990 1993 1996 1996* 1999 2002 2003 2004 2005
Poverty line (Rp monthly per capita expenditure)
Urban Rural
(2) (3) 4,522 2,849 4,969 2,981 6,831 4,449 9,777 5,877 13,731 7,746 17,381 10,294 20,614 13,925 27,905 18,244 38,426 27,413 42,032 31,366 84,773 67,382 130,449 96,512 138,803 105,888 143,455 108,725
% of poor people
(headcount index)
Urban Rural Urban + Rural
(4) (5) (6) 38.79 40.37 40.08 30.84 33.38 33.31 29.04 28.42 28.56 28.06 26.49 26.85 23.14 21.18 21.64 20.14 16.14 17.42 16.75 14.33 15.08 13.45 13.79 13.67 9.71 12.30 11.34 13.62 19.77 17.55 19.41 26.03 23.43 14.46 21.10 18.20 13.57 20.23 17.42 12.13 20.11 16.70
15.97
Number of poor people
(mill ion)
Urban Rural Urban + Rural
(7) (8) (9) 10.0 44.2 54.2 8.3 38.9 47.2 9.5 32.8 42.3 9.3 31.3 40.6 9.3 25.7 35.0 9.7 20.3 30.0 9.4 17.8 27.2 8.7 17.2 25.9 7.2 15.3 22.5 9.6 24.6 34.2 15.6 32.3 48.0 13.3 25.1 38.4 12.3 25.1 37.3 11.4 24.7 36.1
35.1
Source: Central Bureau of Statistics (BPS). Note: * Using Standard' 1998.
265

MAKING THE NEW INDONESIA WORK FOR THE POOR
Annex 11.2 Framework for prepoor growth
Political Will and Commitment
Education Empowerment &Health \
Capabilities 0 Non-trada bles
Reducing Technology Corruption
costs of A Income
Distribution Food Staples \
< Demand > Macro Economy
and Rapid Growth v Exports, Exchange Rate and n v Trade
Rapid Pro- poor Growth
Source: Timmer, 2004.
266

MAKING THE NEW INDONESIA WORK FOR THE POOR
Annex 11. 3 Emplrlcs of structural transformatlon In Indonesia 1982 Industry Services Agriculture TOTAL
Output (Rp trillion) 58.2 69.5 32.3 162 Share of GDP (%) Number of workers (million workers) Labor productivity per worker (Rp million) Share of workers in total (%)
1992 Output (Rp trillion) Share of GDP (%) Number of workers (million workers) Labor productivity per worker (Rp million) Share of workers in total (%)
1996 Output (Rp trillion) Share of GDP (%) Number of workers (million workers) Labor productivity per worker (Rp million) Share of workers in total (56)
1999 Output (Rp trillion) Share of GDP (%) Number of workers (million workers) Labor productivity per worker (Rp million) Share of workers in total (%)
2002 Output (Rp trillion) Share of GDP (%) Number of workers (million workers) [6] Labor productivity per worker (Rp million) Share of workers in total (%)
2002 [2] Output (Rp trillion) Share of GDP (%) Number of workers (million workers) [6] Labor productivity per worker (Rp million) Share of workers in total (%)
2004 [2] Output (Rp trillion) Share of GDP (%) Number of workers (million workers) Labor productivity per worker (Rp million) Share of workers in total (%)
% growth of output
% growth of employment
1982-1992 1992-1996 1996-1999 1999-2002 2002-2004
1982-1992 1992-1996 1996-1999 1999-2002
36.0 8.7 6.7
15.0
119.2 40.0 12.0 10.0 15.0
171.2 42.0 14.1 12.2 17.1
151.3 39.9 14.7 10.3 16.4
179.1 40.8 15.7 11.4 17.9
635.7 43.3 15.7 40.6 17.9
677.4 42.1 16.2 41.8 18.0
7.2 9.0
-4.1 5.6 3.2
3.2 4.0 1.4 2.2
43.0 17.3 4.0
30.0
125.2 42.0 26.3 4.8
32.9
171.8 42.2 30.4 5.6
37.0
162.6 42.9 34.5
4.7 38.6
188.2 42.9 32.4
5.8 37.1
594.5 40.5 32.4 18.3 37.1
674.7 42.0 33.7 20.0 37.4
5.9 7.9
-1.8 4.9 6.3
4.2 3.6 4.2 -2.1
20.0 31.8
1.0 55.0
53.7 18.0 41.7
1.3 52.2
64.4 15.8 37.7
1.7 45.9
65.4 17.2 40.1
1.6 44.9
71.3 16.3 39.2
1.8 44.9
239.3 16.3 39.2
6.1 44.9
255.2 15.9 40.1
6.4 44.6
5.1 4.5 0.5 2.9 3.2
2.7 -2.6 2.1
-0.7
99.0 58 2.8
100.0
298 100.0
80 3.7
100.0
407.3 100.0 82.1
5.0 100.0
379.2 100.0 89.3
4.2 100.0
438.6 100.0 87.3
5.0 100.0
1,469.5 100.0 87.3 16.8
100.0
1,607 100.0
90.0 17.9
100.0
6.1 7.8
-2.4 4.8 4.5
3.2 0.7 2.8
-0.7
267
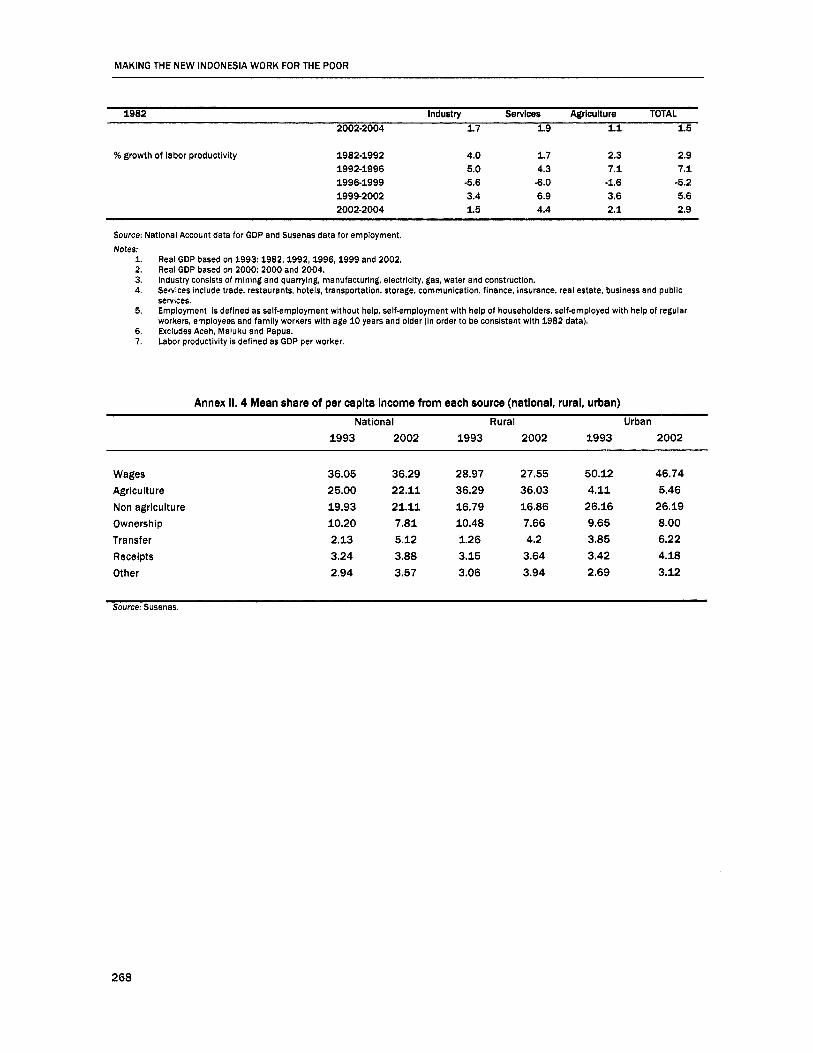
MAKING THE NEW INDONESIA WORK FOR THE POOR
1982 Industry Servlces Agrlculture TOTAL 2002-2004 1.7 1.9 1.1 1.5
% growth of labor productivity 1982-1992 1992-1996 1996-1999 1999-2002 2002-2004
4.0 1.7 2.3 2.9 5.0 4.3 7.1 7.1
3.4 6.9 3.6 5.6 1.5 4.4 2.1 2.9
-5.6 -6.0 -1.6 -5.2
Source: National Account data for GDP and Susenas data for employment. Notes:
Real GDP based on 1993: 1982,1992,1996,1999 and 2002. Real GDP based on 2000 2000 and 2004. Industry consists of mining and quarrying, manufacturing, electricity, gas, water and construction. Services include trade, restaurants, hotels, transportation, storage, communication, finance, insurance, real estate, business and public services. Employment is defined as self-employment without help, self-employment with help of householders, self-employed with help of regular workers, employees and family workers with age 10 years and older (in order to be consistent with 1982 data). Excludes Aceh, Maluku and Papua. Labor productivity i5 defined as GDP per worker.
1. 2. 3. 4.
5.
6. 7.
Annex II. 4 Mean share of per capita income from each source (national, rural, urban) National Rural Urban
1993 2002 1993 2002 1993 2002
Wages Agriculture Non agriculture Ownership Transfer Receipts Other
36.05 36.29 28.97 27.55 50.12 46.74 25.00 22.11 36.29 36.03 4.11 5.46 19.93 21.11 16.79 16.86 26.16 26.19 10.20 7.81 10.48 7.66 9.65 8.00 2.13 5.12 1.26 4.2 3.85 6.22 3.24 3.88 3.15 3.64 3.42 4.18 2.94 3.57 3.06 3.94 2.69 3.12
Source: Susenas.
268

Annexes
Annex II. 5 Increase In non-agrlcultural sector employment was hlgher than predlcted by average employment growth (1982-2002)
Actual Predicted Actual Difference 1982 1993 1993
Agrlculture Non-agrlculture Rural Urban All sectors
('000) 30,487 25,724 15,939 9,785 56,211
(Based on 3.03 percent annual average employment growth) Actual 1993
('000) 42,557 35,909 22,250 13,659 78,466
Predlcted 2002
('000) ('000)
39,329 3,420 18,992 -3,258 20,337 6,678 78,466 0
39,137 -3,420
Actual Difference 2002
Agriculture Non-agrlculture Rural Urban All sectors
('000) 39,137 39,329 18,992 20,337 78,466
(Based on 1.14 percent annual average employment growth) Actual 1982
('000) 43,348 43,561 21,035 22,526 86,909
Predicted 2002
('000) ('000)
47,874 4,313 16,785 -4,250 31,088 8,562 86,909 0
39,035 -4,313
Actual Difference 2002
('000) ('000) ('000) ('000) Agriculture 30,487 47,137 39,035 -8,102 Non-agrlculture 25,724 39,772 47,874 8,102
Urban 9,785 15,128 31,088 15,960
(Based on 2.18 percent annual average employment growth.) Source: McCulioch, Timmer, and Weisbrod. 2006.
Note: The predicted column provides the number of workers that would have been employed In a sector if ail sectors grew at the same annual average employment growth.
Rural 15,939 24,644 16,785 -7,859
All sectors 56,211 86,909 86,909 0
269

MAKING THE NEW INDONESIA WORK FOR THE POOR
Annex II. 6 Rural and informal economy absorbed workers during the crisis (Workers by sector, formal/informal 19962004)
Formal Informal Total Agriculture Industry Manufacturing Total Agriculture Industry Manufacturing Total
Number of WOI
1996 1997 1998 1999 2000 2001 2002 2003 2004
rkers ('000) 5,233 5,207 5,720 6,438 6,079 3,716 3,313 3,154 3,134
11,833 12,792 10,999 12,141 11,198 12,127 11,548 11,213 11,386
Share in employment (%) 1996 6.2 14.1 1997 6.1 15.0 1998 6.5 12.5 1999 7.2 13.7 2000 6.8 12.5 2001 4.1 13.4 2002 3.6 12.6 2003 3.4 12.1 2004 3.3 12.1
19,765 36,831 20,308 38,306 19,720 36,439 19,831 38,410 17,811 35,087 19,158 35,001 18,810 33,671 18,432 32,799 19,990 34,509
23.6 43.9 23.8 44.9 22.5 4L6 22.3 43.2 19.8 39.1 21.1 38.5 20.5 36.7 19.9 35.3 21.3 36.8
31,268 29,583 33,695 31,940 34,602 36,028 37,321 39,888 37,475
37.3 34.6 38.4 36.0 38.5 39.7 40.7 43.0 40.0
3,433 3,511 3,279 3,704 4,464 4,888 5,646 5,222 5,488
4.1 4.1 3.7 4.2 5.0 5.4 6.2 5.6 5.9
12,369 14,005 14,260 14,763 15,685 14,891 15,009 14,901 16,251
47,070 47,099 51,233 50,407 54,751 55,806 57,976 60,011 59,213
14.7 56.1 16.4 55.1 16.3 58.4 16.6 56.8 17.5 60.9 16.4 6L5 16.4 63.3 16.1 64.7 17.3 63.2
83,900 85,406 87,672 88,817 89,838 90,807 91,647 92,811 93,722
100.0 100.0 100.0 100.0 100.0 100.0 100.0 100.0 100.0
Source: Sakernas.
270
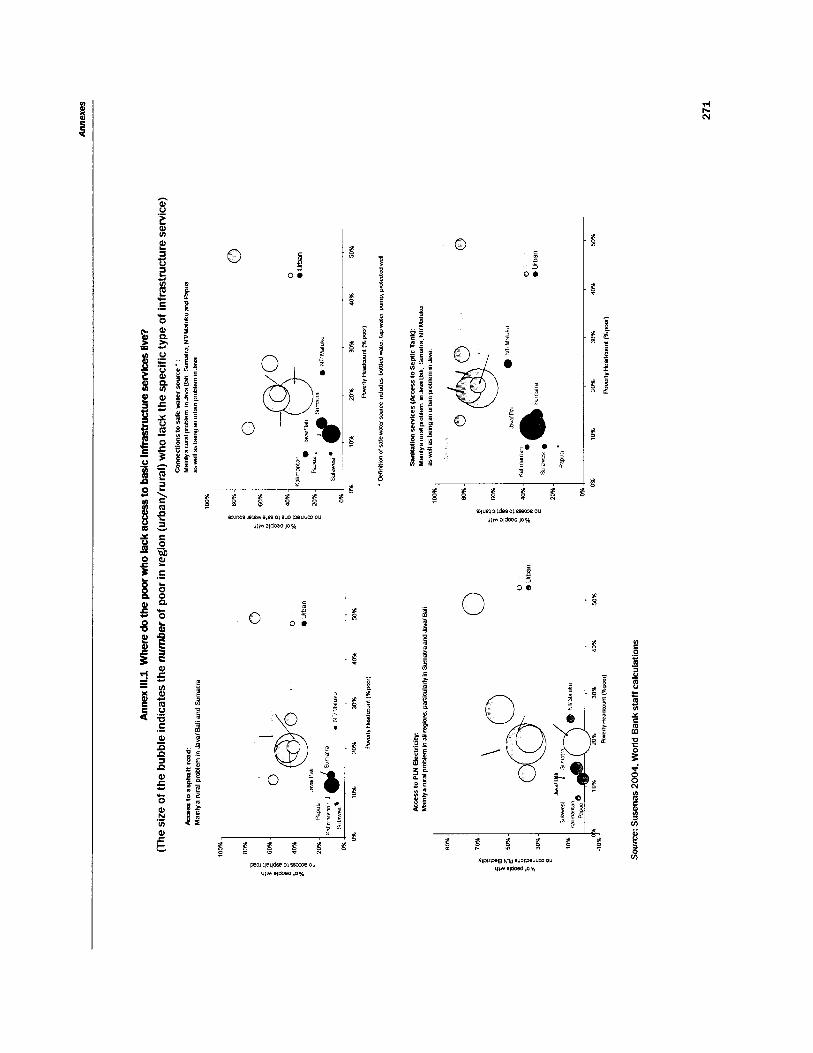
rl I- N
Q 0 . 4 I r
0 c z 0 .
4 o e

MAKING THE NEW INDONESIA WORK FOR THE POOR
Annex 111.2 Povetty growth elastlcltles (supportlng table for Figure 3.8)
Dependent variable: Poverty headcount (Po) Speclflcatlon
Ln Real Mean PCE (rmexp)
Ln Gini Ratio (ginibase)
Base Periode FGTO (pOubase)
Sumatra
Kalimantan
Sulawesi
NT/M a I u ku
Papua
Ln Gini Ratio (ginibase)* Sumatra
Ln Gini Ratio (ginibase)* Kalimantan
Ln Gini Ratio (ginibase)* Sulawesi
Ln Gini Ratio (ginibase)* NT/Maluku
Ln Gini Ratio (ginibase)* Papua
Ln Real Mean PCE (rmexp)* Sumatra
Ln Real Mean PCE (rmexp)* Kalimantan
Ln Real Mean PCE (rmexp)* Sulawesi
Ln Real Mean PCE (rmexp)* NT/Maluku
Ln Real Mean PCE (rmexp)* Papua
Constant
Observations Number of group(prov rural)
(1) -2.18
0.110*** -0.377
0.082***
-0.574 0.105***
304 52
(2) -2.102
0.110*** -0.494
0.088* * * -0.038
0.020*
-0.787 0.120***
304 52
(3) -2.09
0.109* * * -0.646
0.103***
0.025*** -0.092
-0.075 0.032**
-0.075 0.040* -0.049
0.03 0.108
0.038*** -0.115 0.131
-1.011 0.141***
304 52
(4) -2.483 0.123 -0.645
0.195*** -0.083
0.023* * *
0.335
0.537* -0.614 0.405 0.484
0.282* -0.294 0.576 0.011 0.252
-0.625 0.398 -0.45
0.318 0.347 0.216
-0.073
-0.922
-0.23 0.477
-0.025 0.138 -0.247 0.242 0.385 0.197
1.36 0.119 1.142 0.283
0.257*** 304
52
-0.926
Urban (4)
-2.612 0.265
-2.069 0.661* * *
0.061 1.344 0.881
-0.071
-3.982 1.717**
1.616 2.519
0.905* * * 0.831 0.864 1.282
0.752*
-1.116
-2.927 1.384* *
1.343 2.163
0.792*** 0.925 0.752
-0.032 0.264
0.434
0.696 0.565 0.428 -0.316 0.385
-0.691
-1.367
-0.548
-2.645 0.749***
153 26
Rural (4)
-2.519 0.144
-0.557 0.241**
-0.048 0.033 0.24
0.438 -0.244 0.591 -0.373
0.49 0.036 0.328 1.255
0.622** 0.22
0.317 -0.116 0.422 -0.28
0.368 0.012 0.246 0.934
0.516* 0.031 0.161 0.239 0.233 0.359 0.154 1.631 0.137 1.996 0.187
0.320** 151 26
-0.692
Standard errors in brackets * signlficant at 10%; * * significant at 5%; *** significant at 1%
Source: Friedman, 2006.
272

Annexes
Annex 111.3 Dlfferences In poverty correlates and constraints across reglons (Supportlng Table for Box 3.7)
(Decomposition of changes in poverty incidence: the absolute approach)
Sumatra to Java Kallmantan to Sulawesl to NT/Maiuku to Papua to Java Java Java Java
Initial values
End value (2002)
Change in poverty
Growth effect
Distribution effect
Overall price effect
Gender
Education of household head
Experience
Other member education
Asset: household status
Density
Access to secondary education
Access to informal courses
Access to credit
Access to Infrastructure
Access to communication
Occupationalchoice effect
Household occupation return
Other member occupation return
Endowment of occupational choice (oc)
Constant effect
Non observables. variance
Price + residual variance + occupational effect
Powlation eftect
17.6538
17.2192
-0.4346
-4.9840
4.5494
-9.0574
-4.5071
-2.5653
2.3506
-3.0354
0.1011
-0.1573
0.2261
-0.3796
-0.9602
-1.1262
0.9959
-0.4383
0.1043
1.2063
-1.7489
14.1327
0.5014
5.1384
.5.5730
12.3500
17.2192
4.8692
1.4220
3.4472
-3.2413
-1.2402
.2.7900
0.8942
-0.8445
0.2532
0.1516
0.0538
-0.3336
-0.6069
0.7863
0.4348
0.3194
-0.8473
1.4087
-0.2421
14.7461
0.6781
12.5023
-7.6331
18.5400
17.2192
-1.3208
-1.4700
0.1492
-9.8593
-2.1358
-4.5846
-2.3094
-2.6939
2.7575
0.1859
0.3456
A0.0734
-0.5792
-1.9201
1.1480
0.0373
-0.2655
1.7430
-1.4402
11.3083
0.09'-n
1.5795
-2.9003
29.2100
17.2192
-11.9908
-17.7180
5.7272
-5.2834
-3.6415
-6,1859
4.3264
0.7317
3.6566
-1.2997
0.5018
-0.0915
-0.4440
-0.5716
-0.8022
1.1552
1.3024
2.1657
-2.3128
11.1295
-0.1225
6.8787
. I8 8695
54.7500
23.3400
-31.4100
-23.7950
-7.6150
-23.6573
-18.7518
7.4315
-1.9533
-3.7876
-11.3646
-0.6172
1.3611
-0.0930
0.2368
3.8808
0.0000
4.7895
0.9739
2.2507
-8.0142
5.0596
0.4355
-22.9518
-8.4582
Source: Susenas.
273

MAKING THE NEW INDONESIA WORK FOR THE POOR
Annex 111.4 Mlcroeconomlc simulation of changes In poverty
Poverty reduction is a complex dynamic process. Several inter-related factors can affect the process at the same time: for example, the combined effects of changes in personal earnings, changes in occupational status, changes in the demographic composition of families, and replacement of older cohorts by younger, better-educated and more productive cohorts. We need to identify the economic and social causes behind these various phenomena, and the way they interact with each other.
How can we identify these factors and their related contributions to the change of poverty? We will use microeconomic simulations to decompose changes of poverty in two different years and among different regions, into contributions of three sets of phenomena: (i) changes in the socio-demographic structure of the population, the assets and personal or household characteristics in the population (endowment or population effect); (ii) changes in the structure of earnings/expenditures,-the returns to those assets and characteristics (price effect); and (iii) changes in occupational choice behavior, how people use those assets and characteristics in the labor market (occupational-choice effect).
Why do we need to do micro-simulation decomposition in addition to the scalar decomposition of changes in poverty by population subgroups? The scalar decomposition has several limitations. Although single inequality and poverty indices are useful summary statistics, they do not tell what happened to the distribution. Scalar inequality measures, such as Gini coefficient or poverty indices, are generally used to summarize distribution, but a single number does not tell the whole story. A decrease in Gini coefficient can be a story of the poor getting better or the rich getting worse. We cannot infer whether poverty increases or decreases, and what happens to the poor and the not-so-poor based on the Gini coefficient alone. Similarly a decline in the headcount index does not give us information on what happens to the upper part of the distribution. This scalar decomposition also does not easily allow for controls. Therefore, we cannot isolate impacts of key variables or distinguish contributions of changes in assets or changes in the market-returns to it. The simulation of entire distributions addresses the shortcomings of scalar decompositions.
Using this simulation method, we want to first evaluate the effect of the change in the coefficients of the expenditure functions-what we have called 'price effectl-on the distribution of expenditure. The price effect is obtained by comparing the initial distribution and the hypothetical distribution obtained by simulating the population observed at date t the remuneration structure observed at date t'. To get this simulated income, we replace in the 1999 sample the household expenditure by the value obtained using the function estimated for 2002, while keeping the observable and unobservable characteristics of the households constant. While the overall price effect is obtained by modifying all the coefficients p at the same time, it is also interesting to evaluate the effect of a change in only a subset of these coefficients, possibly a single coefficient. For instance, one may want to evaluate the effects of the change in the rate of return to education or to experience. The analysis is only partial in the sense that we do not seek to understand how these three forces may have interacted with each other and it also abstracts from general equilibrium impact. However, we believe this can yield insights into the evolution of poverty and its relationship with the process of economic development in Indonesia.
We conduct two different kinds of simulation. The first is what we called absolute-approach simulation where we applied the 2002 coefficient to the 1999 data. The second, called the relative approach, is done by holding the mean of expenditure constant while we did the partial simulations. The absolute approach will identify an effect as being pro-poor if it accompanied by absolute reduction of poverty, while the relative approach considers an effect as being pro-poor if the poor benefit more from the changes than the rich, in relative or absolute terms. The relative approach will identify the impact of the simulated changes on the distribution, whether it is an equalizing or an inequality-increasing factor.
274
Annexes
Annex V. 1 lnpres development grants
Prior to the introduction of the Dana Alokasi Umum (General Allocation Fund, or DAU) in 2001, Indonesia’s transfer system consisted of the Subsidi Daerah Otonom (Autonomous Region Subsidy, or SDO) and Inpres. The SDO was to fully support routine expenditures at the local level, while the lnstruksi Presiden (Presidential Instruction, or Inpres) gave grants for local development activities, which started as specific (earmarked) grants but developed into more general block grants over the period from the 1960s to the 1990s. During this period, the lnpres grants changed considerably in their structure and function.
In an attempt to address regional disparities and national development objectives, the government launched an intergovernmental financing scheme or development transfer known as lnstruksi President (Presidential Instruction, or lnpres for short). These transfers can be classified as specific or discretionary general purpose block grants from the national government to sub-national governments to finance basic education, health services, reforestation or small economic activities. The lnpres grants were divided into the following four categories: (i) lnpres Dati I are grants made to provincial level governments; (ii) lnpres Dati II are per capita grants provided for infrastructure projects at the district/municipality level; (iii) lnpres Desa are grants for village development; and (iv) lnpres Desa Tertinggal (IDT) are specific grants designed to assist village development in poor or ‘left-behind’ areas.
The IDT began in 1994 with geographical targeting to provide small-scale credit to poor households living in more than 200 villages in such ‘left-behind’ areas across Indonesia. A total of US$200 million per year over a three year period (1994-96) was disbursed (Pangestu and Azis, 1994, World Bank 1995). Each participating village receives a block grant of Rp 20 million (US$8,700)240 to Rp 60 million. These grants are used by village working groups (Kelompok Masyarakat, or Pokmas) for infrastructure development, to address the lack of quality infrastructure and its impact on poverty (Sumadiningrat).
Between 1995 and 2000, intergovernmental transfers made up a large portion of total regional government revenue of about 75 percent. Lewis (2002) finds that SDO transfers were most important of around 38 percent of total regional government revenues, 3 1 percent for provinces and 43 percent for districts/municipalities (Lewis, 2002). lnpres grants followed with 23 percent of total regional government revenues, 6 percent of provincial and 28 percent of district/municipality revenues (Lewis, 2002).
Most analysts seem to have concluded that, in general, the lnpres system had a relatively positive impact on regional social and economic development in Indonesia over three decades (Lewis, 2002). Furthermore, a significant amount of regional infrastructure was financed by lnpres grants. But while lnpres grants have financed substantial improvements in local infrastructure and social services they have not provided a lasting solution to the problem of financially weak or dependent local governments (Devas, 1989). Although lnpres grants are not specifically designed as a pro-poor policy and targeted to the poor, the increased access to basic services through the construction of schools and community health centers, rural electricity programs and expansion of roads and communication networks, and improvements in supply of clean water, all benefit the poor.
275
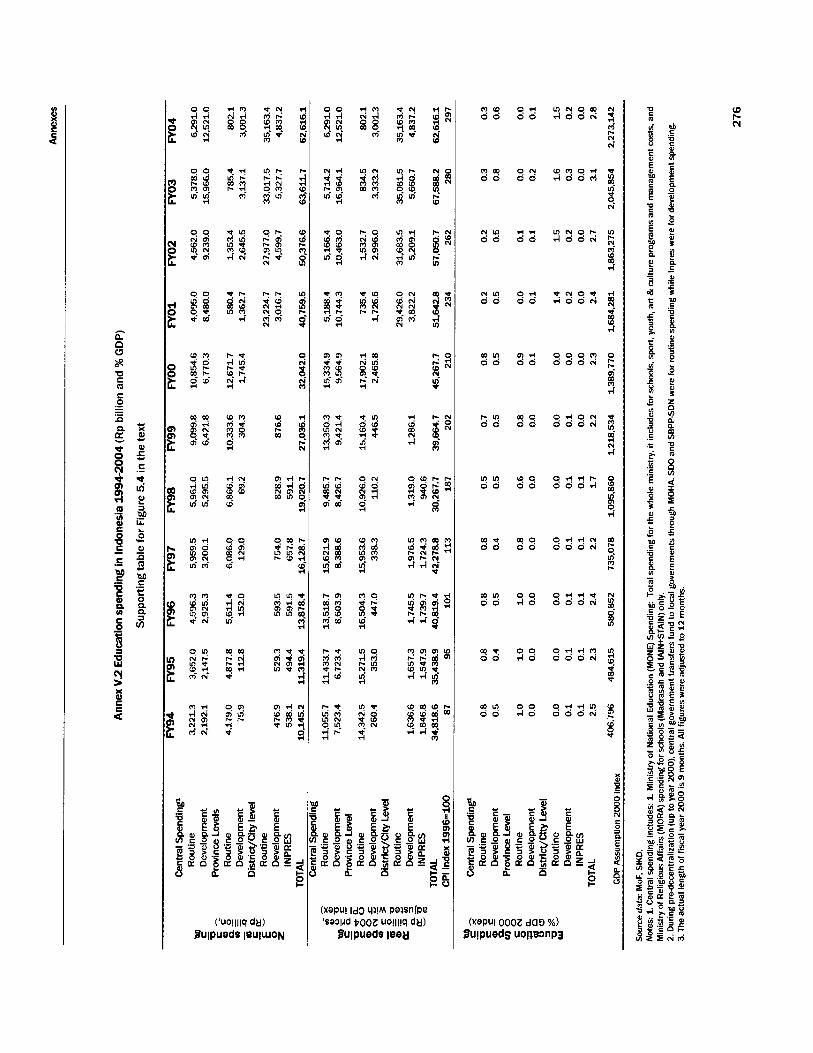
m N O m 4 0 0 N
w m o d 4 0 0 * i
m w o r - 4 0 0 N
* N O " 4 0 0 N
O O O ~ 0 0 0 N
O d O N d 0 0 N
O d d r - 0 0 0 4
O d d N 0 0 0 N
2;z:
o d d m 0 0 0 e i
o d d m 0 0 0 N
W P U ! 0002 da3 %) luipueds uoiimnp3

7 ° F $381 N
N d o r-N 0 0 0 0' 4-
P 2
~ d o m 0 0 0 0 s
3 &
? " 9 9 2 0 0 0 ON*
N " 9 r n $ 0 0 0 0 3 l-r
0 0 0 (Do 0 0 0 0 :
0 0 0 r -g u? 0 0 0 0
0 0 d "$l 0 0 0 0
d-
o o d m g 2 e
0 0 0 0
0 0 d (Dz 0 0 0 0 ,
%
0 0 d m 4
d
0 0 0 0 3 d
0 0 d (Dg 0 0 0 0 , w 0 *

4- N-
m o r l m
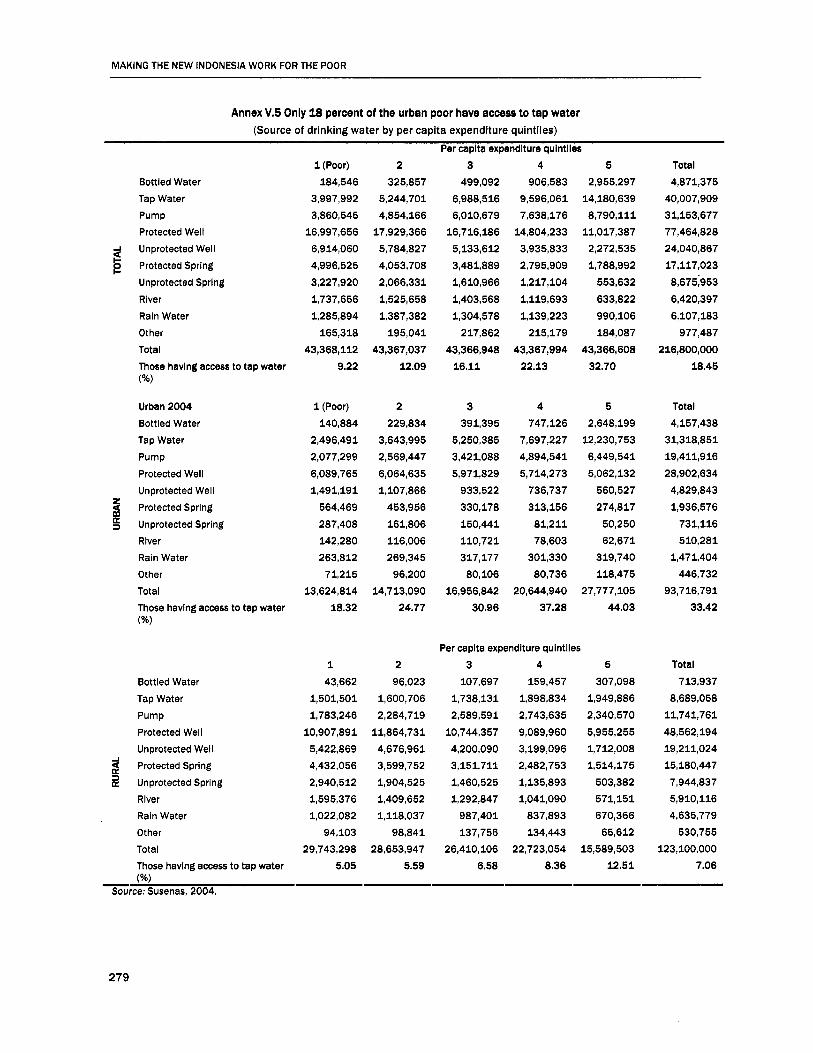
MAKING THE NEW INDONESIA WORK FOR THE POOR
Annex V.5 Only 18 percent of the urban poor have access to tap water (Source of drinking water by per capita expenditure quintiles)
Per capita expendlture qulntlles
Bottled Water Tap Water Pump Protected Well Unprotected Well
e Protected Spring Unprotected Spring River Rain Water Other Total Those havlng access to tap water (%)
2
Urban 2004 Bottled Water Tap Water Pump Protected Well Unprotected Well 3 Protected Spring
5 Unprotected Spring River Rain Water Other Total Those havlng access to tap water (“m)
Bottled Water Tap Water Pump Protected Well Unprotected Well Protected Spring Unprotected Spring River Rain Water Other Total
1 (Poor) 184,546
3,860,545 3,997,992
16,9 9 7,6 5 6 6,914,060 4,996,525 3,227,920 1,737,656 1,285,894
165,318 43,368,112
9.22
1 (Poor) 140,884
2,496,491 2,077,299 6,089,765 1,491,191
564,469 287,408 142,280 263,812 71,215
13,~i24,814 1a.32
1 43,662
1,501,501 1,7a3,246
10,907,a91 ~,422,a69 4,432,056 2,940,512 1,595,376 1,022,082
29,743,298 94,103
2 325,857
4,a54,166
5,784,827
5,244,701
17,929,366
4,053,708 2,066,331 1,525,658 1,387,382
195,041 43,367,037
12.09
2 229,834
3,643,995 2,569,447 6,064,635 1,107,866
161,806 453,956
116,006 269,345 96,200
14,713,090 24.77
2 96,023
1,600,706 2,284,719
11,a64,731 4,676,961 3,599,752 1,904,525 1,409,652 1,118,037
98,841 28,653,947
Those havlng access to tap water 5.05 5.59 (om)
3 499,092
~,9a8,516
16,71~,186
3,481,889
6,010,679
5,133,612
1,610,966 1,403,568 1,304,578
43,3mi,94a 217,862
16.11
3 391,395
5,250,385 3,421,088 5,971,829
330,178 933,522
150,441 110,721 317,177 80,106
ici,956,a42 30.96
4 906,583
9,596,061 7,638,176
14,804,233 3,935,833 2,795,909 1,217,104 1,119,693 1,139,223
215,179 43,367,994
22.13
4 747,126
7,697,227 4,894,541 5,714,273
736,737 313,156 81,211 78,603
80,736 301,330
20,644,940 37.28
5 2,955,297
14,180,639 a,790,111
11,017,3a7
1,788,992
m , a 2 2
184,087
2,272,535
553,632
990,106
43,366,608 32.70
5 2 , ~ ~ 9 9
12,230,753 6,449,541 5,062,132
560,527 274,817 50,250 62,671
319,740 118,475
27,777,105 44.03
Per capita expenditure qulntlles 3 4 5
107,697 159,457 307,098 1,738,131 1,aga,a34 1,949,886 2,5a9,591 2,743,635 2,340,570
4,200,ogo 3,199,096 1,712,008 3,151,711 2,482,753 1,514,175 1,460,525 1,135,893 503,382
987,401 837,893 670,366
26,410,106 22,723,054 15,589,503
10,744,357 9,089,960 5,955,255
1,292,847 1,041,090 571,151
137,756 134,443 65,612
6.58 8.36 12.51
Total 4,871,375
40,007,909 31,153,677 77,4ml82a 24,040,867 17,117,023 a,675;953 6,420,397 6,107,183
977,487 216,800,000
18.45
Total 4,157,438
31,318,851 19,411,916 28,902,634 4,829,843 1,936,576
731,116 510,281
1,471,404 446,732
93,716,791 33.42
Total 713,937
11,741,761 8,689,058
4a,562,194 19,211,024 15,180,447 7,944,837 5,910,116 4,635,779
530,755 123,100,000
7.06 . I -
Source: Susenas, 2004.
279
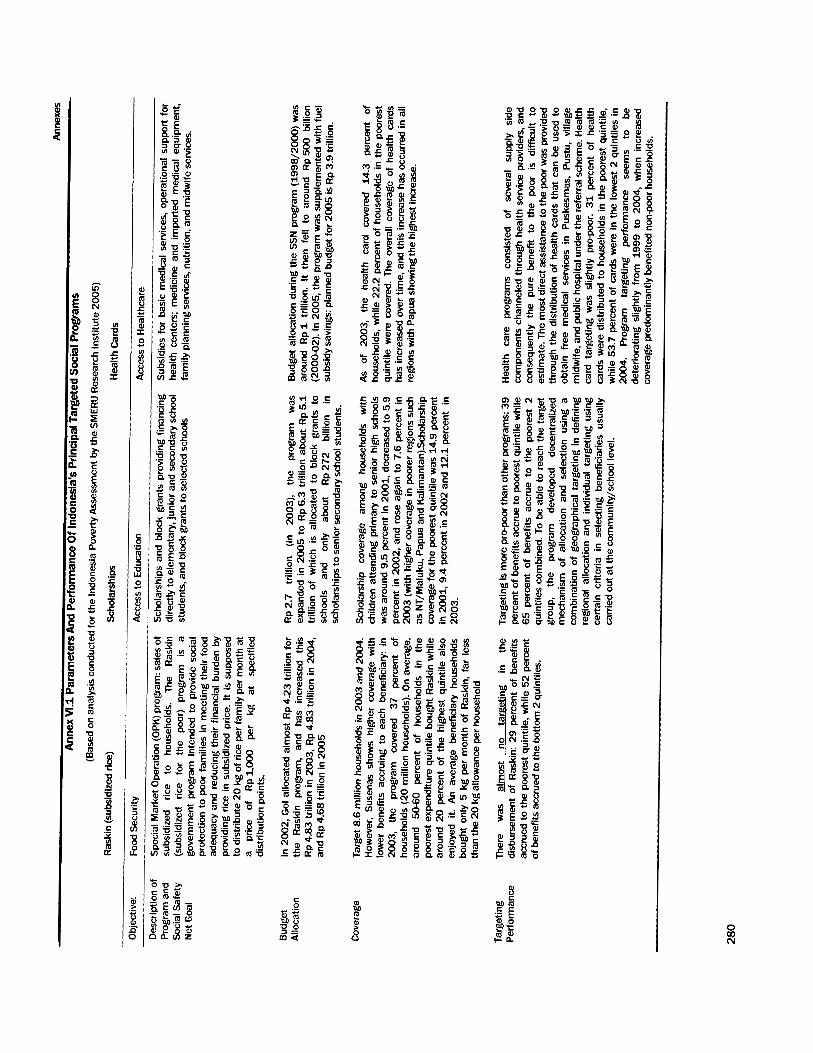

M

U I i I ri c
I I
+
a
E %
- + E
h
E %
3 - f - al 0
M 0
L
E
8
M
e
a E e C
U
P
e C
M 0 U m
0 S
- x 3 5 % 0
e C
g6
F a % qj '5 v
5 %
.-
h
N CQ N

m
C 0 'I E - C .- i! 8 C .-
E m
Q B
I I al -
z " $
$ 8 z a
b P
z s g $ 5 $ E
8 P

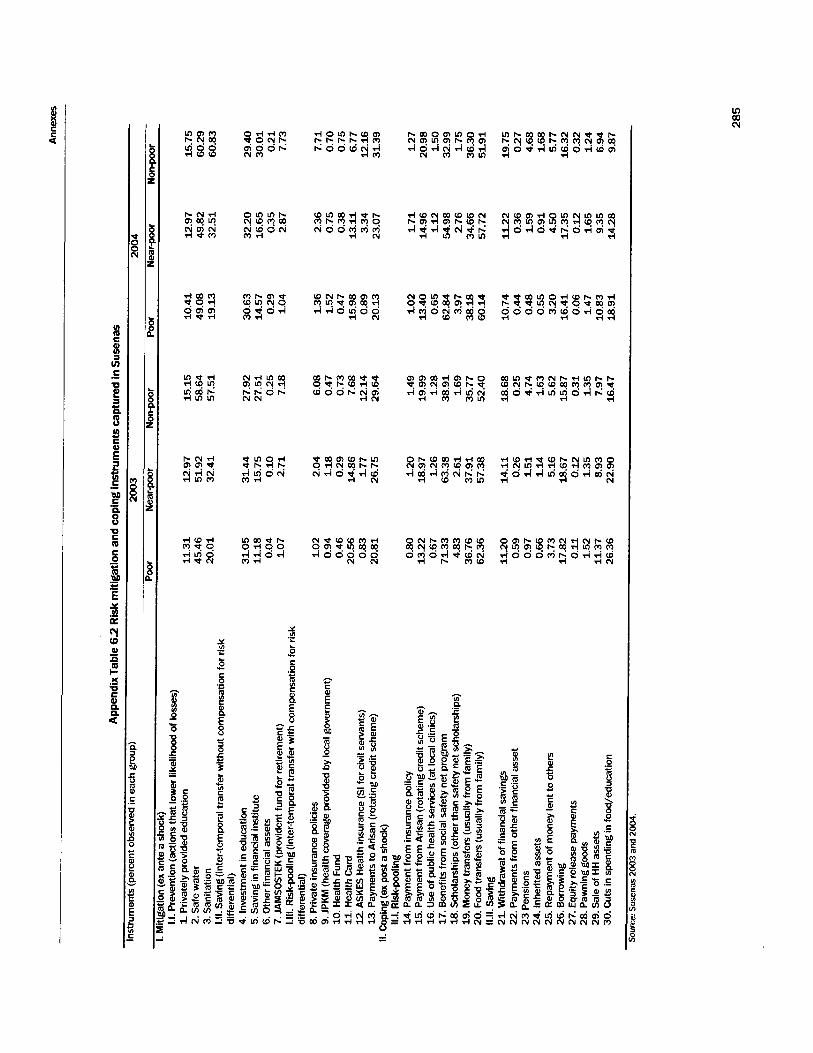
I
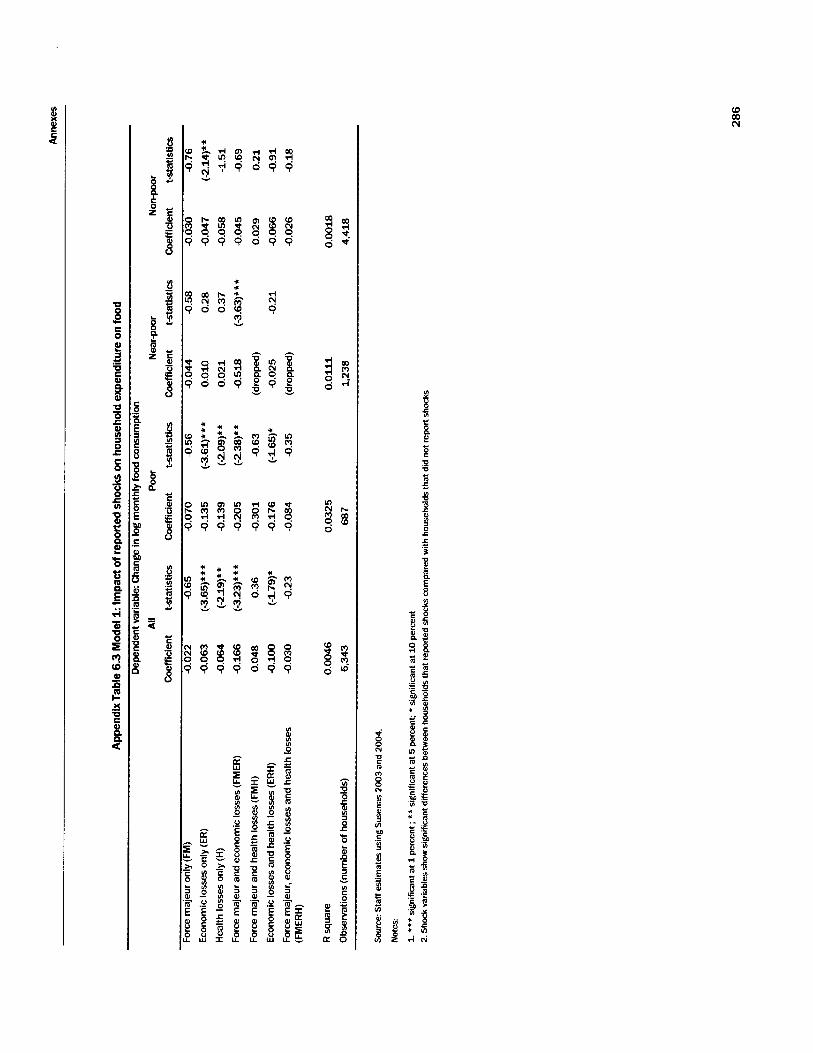
Y 8 S
s P e
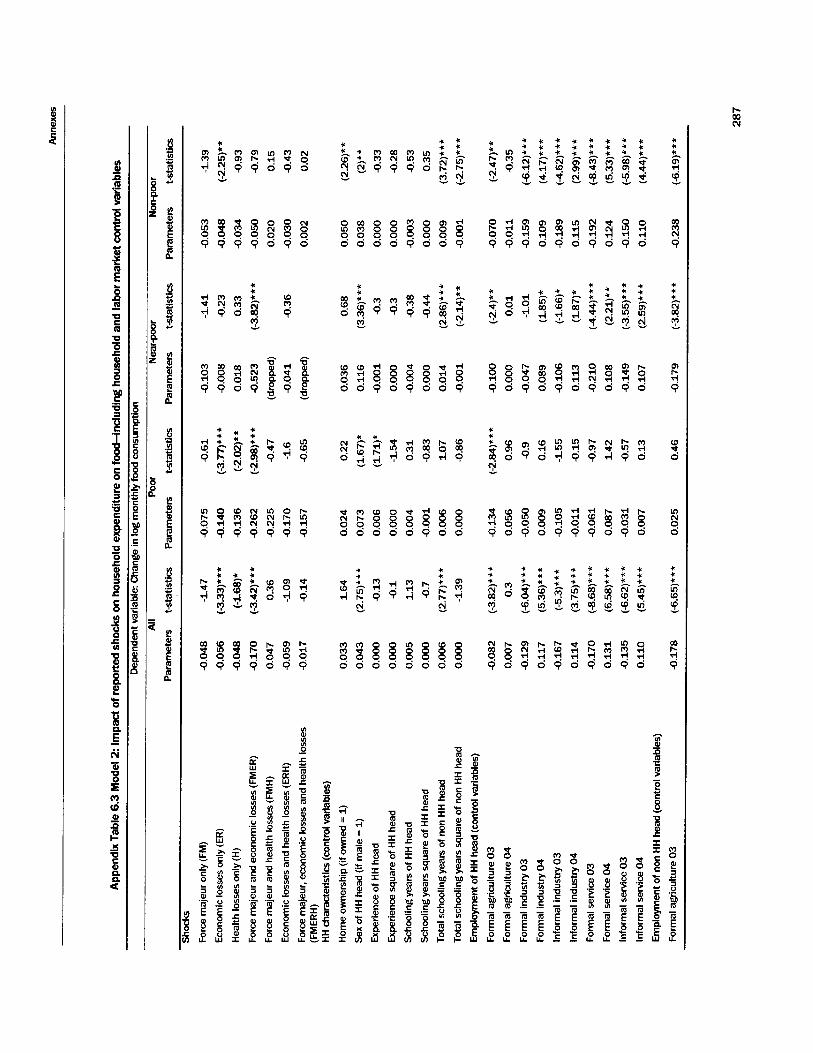
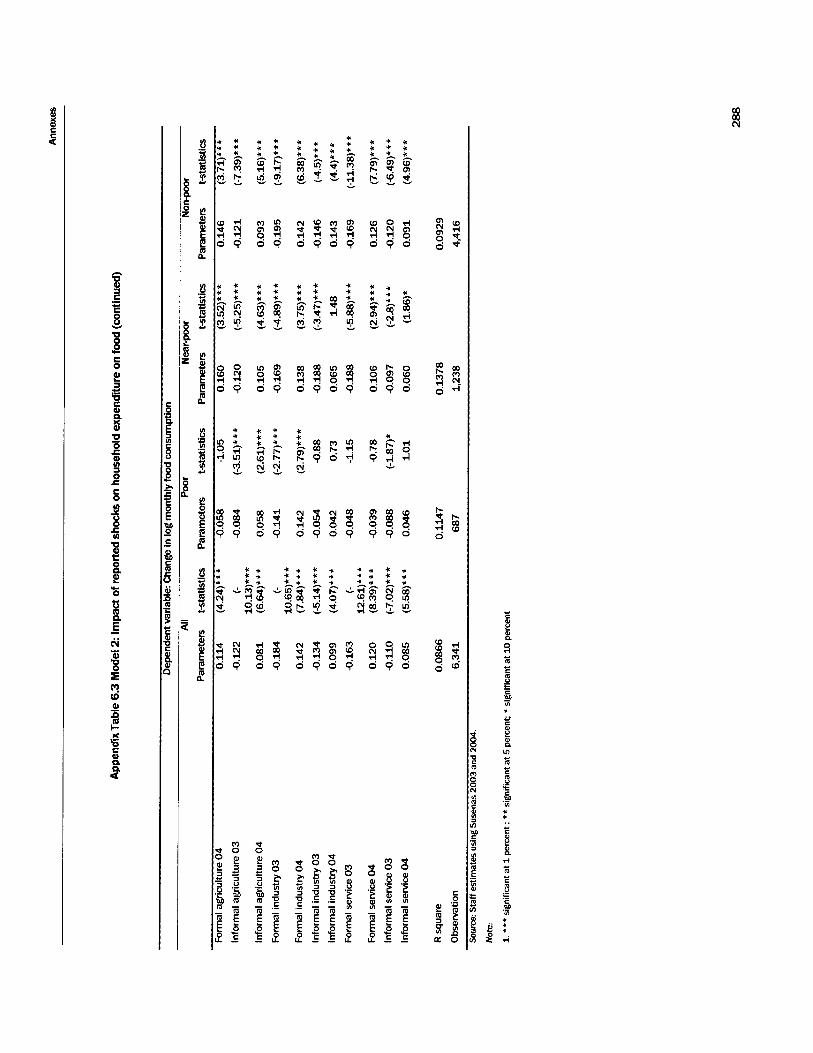
W b O a g g o q o
J

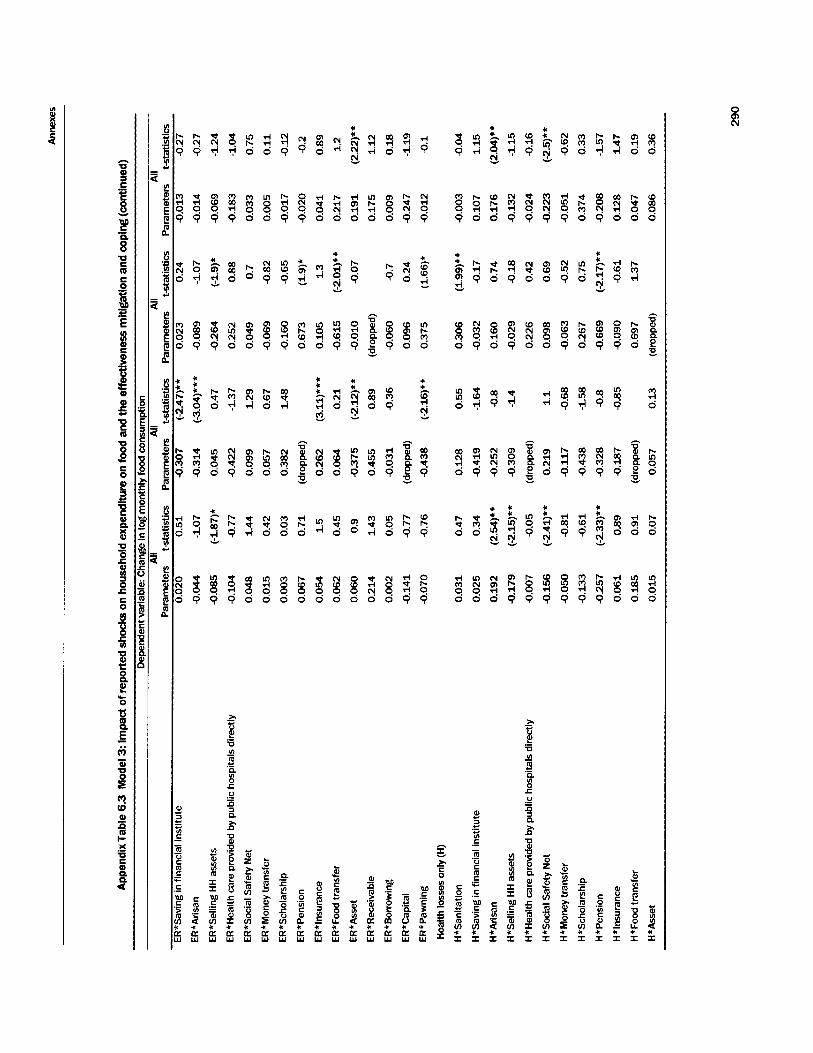

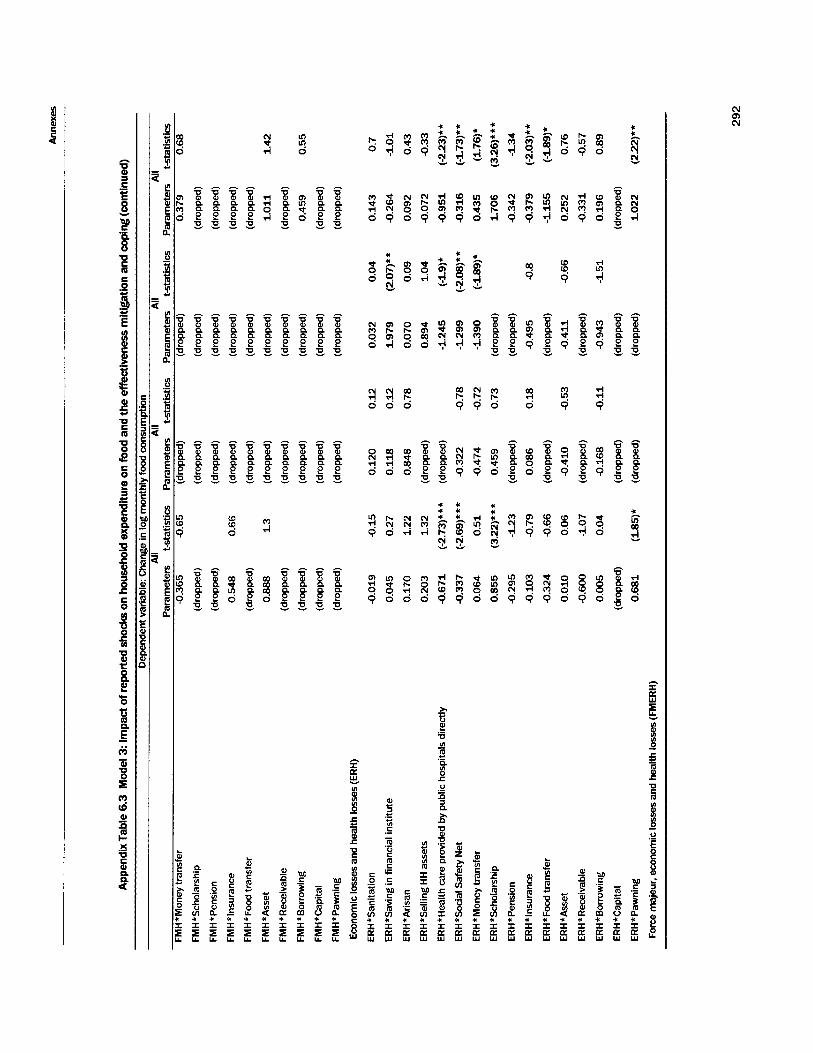
3 a 5
N Q, N

Y i - c 5 f i! i ._ Y
P f i! f
- 3 f E f
i
E
c
c ._
z
E .- U
c .-
i
8
2
.- e
e c
.-
i Y i E c a

MAKING THE NEW INDONESIA WORK FOR THE POOR
Annex V1.3 Indonesla: likely CCT program Impacts on the MDG In program areas by 2015 Indicators 1995 2002 Target Likely program Impact
2015
MDG f : Reduce poverty and hunger by half: - Extreme poverty (1 US/day) ( percent) -Child malnutrition (percent of 0-5 yr. olds)
MDG 2: Unlversal bask educatlonl - Net enrollment rate primary - Net enrollment rate junior secondary - Net enrollment rate senior secondary
MDG 3: Gender equality - Ratio of young literate females to males (percent ages 1524)
MDG 4: Reduce by two-thlrds under 5 mortalliy rate. - infant mortality (1000 live births) - Under 5 mortality (1000 live births) - Immunization measles ( percent of children under 12 months)
MDG 5: Reduce maternal mortallty by two- thirds.
- Maternal mortality rate (100,000 births) - Percent births attended by skilled staff
MDG 6: Combat HIV/AIDS, malarla and other diseases
Prevalence of HIV/AIDS, female (percent, ages 1524)
MDG 7: Promote sustalnable use of the envlronment. Reduce by half the percentage without: -Water (percent coverage) - Sanitation (percent coverage)
- 14.0
91.5 51.0 42.4
96.7
60.0 91.0 58.0
- 31.7
-
71.0 47.0
7.5 24.6
92.7 61.7 48.2
99.0
32.0 43.0 76.0
310.0 64.2
0.1
78.0 55.0
7.0
100 - -
100
20.4 30.9 100
c 100.0 100
84.5 73.5
Signlflcant. As shown in Mexico, Colombia, others. Reductions in poverty gap and in incidence of extreme poverty.
Significant increase in progression rates from primary to secondary (e.g., Mexico, Colombia, and Brazil).
Substantlal. Cash transfers are given to women who make a better use of funds.
Substantial. Vaccinations over 95 percent in program areas, health check ups and growth monitoring will prevent death by diarrhea and other diseases.
Substantlai. Prenatal care starting in first trimester, births attended by skilled staff, vitamins, folic acid, iron, other.
Llkely, if health package includes Component on health education.
Substantial. if program includes water and sanitation component in program areas.
1 Figures from World Bank (2004~) . Source: World Bank (2004b).
294

Annexes
Annex V1.4 Budgets for the PKPSBBM programs for 2006 Size of PKPSBBM programs (Rp billion)
2005 2006 PKPS-BBM for Rural infrastructure 3,342.1 3,342.1 PKPS-BBM for Healthcare 3,874 3,874
Basic Health 1,574 Askes Program 2,300
PKPS-BBM for Education Scholarships BOS
6,272 1,006.6 5,136.9
11,075.5 10,273.9
544,8
UCT 4,650 13,950
Total 18,138.1 32,241.6 Source: SMERU Research Institute.
295

References
References Abadi, Tulus. 2005. “Biaya Sosial Akibat Merokok.” www.antirokok.or.id Majalah Tarbawi, 17 March 2005.
Abdallah, H. 2002. “Cost-Effectiveness of Self-Assessment and Peer Review in Improving Family Planning Provider- Client Communication in Indonesia.” Quality Assurance Project Case Study. Maryland: US. Agency for International Development (USAID).
Abreu, Marla. 2005. “Changing Patterns on Child Malnutrition in Indonesia.” Background Paper for the Making Services Work for the Poor in Indonesia. World Bank Office Jakarta. Processed.
Aedo, Christian and Sergio Nunez. 2001. The lmpact of Training Policies in Latin America and the Caribbean: The Case o f “Programa loven”. Washington, DC: Inter-American Development Bank.
Aedo, Cristian, and Marcelo Pizarro Valdivia. 2004. “Rentabilidad Economica del Programa de Capacitacion Laboral de Jovenes ‘Chile Joven’.” INACAP and Mideplan. Santiago de Chile. Processed.
Afiff, Saleh, and C. Peter Timmer. 1971. “Rice Policy in Indonesia.” Food Research lnstitute Studies in Agricultural Economics, Trade, and Development. Vol. X, no. 2, pp. 131-159.
Akhmadi, Usman and Suryadharma D. 2004. When Teachers Are Absent: Where Do They Go and What Are the lmpacts on Students? SMERU Research Institute. Jakarta.
Alatas, Vivi. 2005. “An Evaluation of Kecamatan Development Project.” World Bank Office Jakarta. Draft Mimeo.
Alatas, Vivi and Lisa Cameron. 2003. “The lmpact of Minimum Wages on Employment in a Low Income Country: an Evaluation Using the Difference-in-Difference Approach.” Policy Research Working Paper 2985. Washington, DC: World Bank.
Alatas, Vivi, Menno Pradhan and Vijayendra Rao. 2006. “Conceptions, Connection and Compromise: How Community- Based Targeting Works in Indonesia.” World Bank Working Paper.
Alatas, Vivi and Francois Bourguignon. 2005. “The Evolution of Income Distribution during Indonesia’s Fast Growth, 1980-1996.” Microeconomics of Income Distribution Dynamics in East Asia and Latin America, World Bank and Oxford University Press.
Alatas, Vivi and Janelle Plummer. 2005. “Urban Poverty in Indonesia.” Background Paper for the Making the New Indonesia Work for the Poor. World Bank Office Jakarta.
Alatas, Vivi, Kurnya Roesad, and Hendratno Tuhiman. 2005. “Understanding Unemployment and Poverty Puzzle.” Background Paper for the Making the New Indonesia Work for the Poor. World Bank Office Jakarta.
Alatas, Vivi and Widya Sutiyo. 2005. “Poverty and Regional Disparities.” Background Paper for Making the New Indonesia Work for the Poor. World Bank Office Jakarta.
Alatas, Vivi and Hendratno Tuhiman. 2005a. “What Account for Indonesia’s Significant Decrease in Poverty since 1999?” Background Paper for Making the New Indonesia Work for the Poor. World Bank Office Jakarta.
. 2005b. “A Historical Validation Exercise of Poverty Changes.” Background Paper for Making the New Indonesia Work for the Poor. World Bank Office Jakarta.
Alisjahbana, Armida. 2004. “Indonesia’s Employment Protection Legislation: Swimming against the Tide?” Report prepared for Growth through Investment in Agriculture and Trade Project (GIAT) and Faculty of Economics, Padjadjaran University, Bandung.
Alisjahbana, Armida S., and Chris Manning. 2005. “Trends and Constraints Associated with Labor Faced by Non-Farm Enterprises.” Prepared for the Rural Investment Climate Assessment. World Bank Office Jakarta. Processed.
Ananta, Aris, and Evi Nurvidya Arifin. eds. 2004. lnternatlonal Migration in Southeast Asia. Institute of South East Asian Studies (ISEAS): Singapore.
296

References
Andrew, Matthew. 2005. ”Performance-Based Budgeting Reform: Progress, Problems and Priorities.” In Shah, Anwar .ed. Fiscal Management. World Bank.
Angelini, John and Kenichi Hirose. 2004. “Extension of Social Security Coverage for the Informal Economy in Indonesia: Surveys of the Urban and Rural Informal Economy.” International Labor Organization (ILO), Working Paper No. 11.
Aran, Meltem and Melanie Juwono. 2006a. ”Benefit Incidence of Education Expenditures in Decentralized Indonesia.” Background Paper for the Making the New Indonesia Work for the Poor. World Bank Office Jakarta.
.2006b. “Benefit Incidence of Health Expenditures in Decentralized Indonesia.” Background Paper for the Making the New Indonesia Work for the Poor. World Bank Office Jakarta.
Arifianto, Alex. 2004. “Social Security Reform in Indonesia: An Analysis of the National Social Security Bill (RUU Jamsosnas).’ SMERU Research Institute Working Paper.
Arifianto, Alex and Ellen Tan et al. 2005. “A Report on Health Financing Mechanism (JPK-Gakin) Scheme in Kabupaten Purbalinggo, East Sumba, and Tabanan.” Prepared for the Making Services Work for the Poor in Indonesia. World Bank Office Jakarta.
Asian Development Bank (ADB). 2000. “Assisting Girl Street Children at Risk of Sex Abuse.”
.2004a. ”Agricultural and Rural Development Strategy.” In collaboration with International Food Policy Research Institute - IFPRI. March 2004.
. 2004b. “Sustainable Social Protection and Providing Assistance for the Vulnerable and Poor in the Informal Sector.” Volumes I and II, INTEM Consulting Inc., Japan for ADB, DFID and Bappenas.
. 2006. Core Paper “Asia 2015: Promoting Growth, Ending Poverty.” Presented at the Asia 2015 Conference .ADB, World Bank and DFID. January 2006.
Asia Foundation. Indonesian Rapid Decentralization Appraisal (IRDA). Fifth Report, November 2004.
-. 2004. IRDA. Fourth Report
-. 2003. IRDA. Third Report
-. 2002. IRDA Second Report
-. 2002. IRDA. First Report
Attanasio, O., M. Syed and M. Vera Hernandez. 2004. “Early Evaluation of a New Nutrition and Education Program in Colombia.” The Institute for Fiscal Studies. Briefing Note 44: 11, London.
Badan Pusat Statistik Indonesia (BPS) and ORC Macro.2003. “Indonesia Demographic and Health Survey 2002-03.” BPS and ORC Macro, Calverton, Maryland.
Baeza, Cristian and Truman Packard. 2005. “Beyond Survival: Protecting Households from the Impoverishing Impact of Health Shocks.” Regional Study, Office of the Chief Economist, Latin America and Caribbean Regional Office. World Bank.
Baker, Richard W. et al . eds. 1999. Indonesia: The Challenge of Change. Institute of Southeast Asian Studies (ISEAS).
Beegle, K., E. Frankenberg and D. Thomas. 2000. “Labor Market Transitions of Men and Women during an Economic Singapore.
Crisis: Evidence from Indonesia.” Rand Labor and Population Working Paper 00-11.
Bergstrom, Staffan and Elizabeth Goodburn. 2001. “The Role of Traditional Birth Attendants within the Reduction of Maternal Mortality.” Vincent De Brouwere and Wim Van Lerberghe. eds. Safe Motherhood Strategy: A Review of Evidence. Antwerp: ITG Press.
Bitran, Ricardo and Ursula Giedion. 2003. “Waivers and Exemptions for Health Services in Developing Countries.” Social Protection Unit. World Bank. March 2003.
297

MAKING THE NEW INDONESIA WORK FOR THE POOR
. Health, Nutrition and Population. World Bank. httD://web.worldbank.org
Block, Steven. 2002. “Nutrition Knowledge Rice Prices and the Nutritional Impact of Indonesia’s Crisis of 1997/98.” September 17, 2002.
Booth, Anne. 2002. “Growth Collapses in Indonesia: A Comparison of the 1930s and the 1990s.” Working Paper. SOAS, University of London.
Bourchier, David, and Vedi Hadiz. ed. 2003. Indonesia: Politics and Society. London: Routledge.
Breierova, Lucia and Esther Duflo. 2002. “The Impact of Education on Fertility and Child Mortality: Do Fathers Really Matter Less than Mothers?” The Massachusetts Institute of Technology (MIT), the Center for Economic Policy Research (CEPR) and National Bureau of Economic Research (NBER).
Brook, Penelope and Suzanne Smith. eds. 2003. ‘Contracting for Public Services: Output-Based Aid and Its Applications.’ Washington, DC: World Bank.
Cameron, L., and C. Worswick. 2003. ”The Labor market as a Smoothing Device: Labor Supply Responses to Crop Loss.” Review of Development Economics 7(2): 327-341.
Castaneda, Tarsicio. 2005. ”How Can Conditional Cash Transfers (CCT) Help the Poor in Indonesia?” September 2005. Mimeo.
Castatieda, Tarsicio, Kathy Lindert, with Benedicte de la Briere, Luisa Fernandez, Celia Hubert, Osvaldo Larranaga, Monica Orozco, and Roxana Viquez. 2005. “Designing and Implementing Household Targeting Systems: Lessons from Latin American and the United States.”
Chaudhuri, Shubham. 2003. “Assessing Vulnerability to Poverty: Concepts, Empirical Methods and Illustrative
Chaudhuri, Shubham, Jyotsna Jalan, and Asep Suryahadi. 2002. ”Assessing Household Vulnerability t o Poverty from Cross-sectional Data: A Methodology and Estimates from Indonesla.” Department of Economics, Discussion Paper Series No. 0102-52. New York: Colombia University.
Examples.” New York: Columbia University.
Chaudhury, N., J. Hammer, M. Kremer, K. Muralidharan and H. F. Rogers. 2006. “Missing in Action: Teacher and Health Worker Absence in Developing Countries.” Journal of Economic Perspectives 20(1): 91-116.
Chetty, Raj, and Adam Looney. 2005. “Income Risk and the Benefits of Social Insurance: Evidence from Indonesia and the United States.” Mimeo.
Center for Health Research. 2001. “A Study of the Tobacco Industry.” University of Indonesia.
Coady, David, Margaret Grosh and John Hoddinott. 2004. “Targeting of Transfer in Developing Countries.” World Bank.
Conning, Jonathan and Michael Kevane. 2002. “Community-Based Targeting Mechanisms for Social Safety Nets: A Critical Review.”
de Ferranti, David, Guillermo E. Perry, lndermit S. Gill, Luis Serven with William Maloney, Nadeem Ilahi, Francesco Fereira and Martin Rama. 2000. Securing Our Future in a Global Economy. “Chapter 6: Helping Workers Deal with the Risk of Unemployment.” Washington, DC: World Bank.
de Janvry, Alain. 2006. ‘Conditional Cash Transfer Programs in the Bigger Picture of Social Policy.” Third International Conference on Conditional Cash Transfers. Turkey. June 2006.
De Pee S., M.W. Bloom et al. 2002. Breastfeeding and Complementary Feeding Practices in Indonesia, Nutrition & Health Surveillance System Annual Report. Jakarta, Indonesia: Helen Keller Worldwide.
Department of Public Works. 2005. “General Guidelines Program on Compensation for Reduction of Oil-Based Fuel Subsidy Rural Infrastructure Sector PKPS-BBM.” Directorate General of Housing, Planning and Urban Development of the Republic of Indonesia.
298

References
Deutsch, R., A. Morrison, C. Piras, H. Nopo. 2002. “Working Within Confines: Occupational Segregation by Gender for Three Latin American Countries.” Presented at the Seminar ’Women at Work: A Challenge for Development.’ Santiago, Chile. March 17, 2001.
Devas, Nick. 1989. ”Financing Local Government in Indonesia.” Monographs in lnternational Studies, Southeast Asia
Djaja, Sarimawar. 2000. ”Revealing Priority Problems in Effort to Reduce Maternal Death in Indonesia.” Badan Series No. 84. Athens: OhioUniversity.
Litbang Kesehatan dan Kesejahteraan Sosial.
Duflo, Esther. 2001. “Schooling and Labor Market Consequences of School Construction in Indonesia: Evidence from an Unusual Policy Experiment.” The American Economlc Review, Vol. 9 1 (4): 795813.
Eckardt, Sebastian and Stefan Nachuk. 2003. ”Measuring Governance: Art or Science?” World Bank Jakarta Office. Draft Mimeo.
Ehrlich, Isaac, and Gary Becker. 1972. “Market Insurance, Self-Insurance and Self-Protection.” Journal of Political Economy 80: 623-648.
Elbers, Chris, Jean 0. Lanjouw, and Peter Lanjouw. 2002. “Micro-Level Estimation of Welfare.” Research Working Paper 2911. Development Research Group. Washington, DC: World Bank.
Emmerson, Donald K., 1999. lndonesla Beyond Suharto: Polity, Economy, Society, Transition. M.E. Sharpe, Armonk.
Escobal, Javier and Carmen Ponce. 2002. “The Benefits of Rural Roads: Enhancing Income Opportunities for the Rural Poor.” Working Paper No. 40, GRADE. Lima.
Estache, A and A. Goicoechea. 2005. “How widespread were infrastructure reforms during the 1990s.” Research Working Paper 3595. Washington, DC: World Bank.
Filmer, Deon, S. Lieberman et ai. 2002. Indonesia and Education for All (EFA). Development Research Group and Human Development Unit of East Asia Region, World Bank, Washington, DC. Processed.
Frankenberg, E., Duncan Thomas and Kathleen Beegle. 1999. “Economic Shocks, Wealth and Welfare.” Journal o f Human Resources 38 (2): 280-321.
Frankenberg, E. and Duncan Thomas. 2001. “Women’s Health and Pregnancy Outcomes: Do Services Make a Difference?” Demography 38 (2): 253-265.
Frankenberg, E., W. Suriastini et ai. 2004. “Can Expanding Access to Basic Health Care Improve Children’s Health Status? Lessons from Indonesia’s Midwife in the Village Program.” escholarship Repository, University of California.
. 2005. “Can expanding access to basic healthcare improve children’s health status? Lessons from Indonesia’s ‘midwife in the village’ programme.” Population Studies 59 (1): 519.
Friedman, Jed. 2004. “The Varying Relationship between Poverty and Growth across Indonesia’s Disparate Regions.”
Friedman, Jed and James Levinsohn. 2002. “The Distributional Impacts of Indonesia’s Financial Crisis on Household Welfare: A ‘Rapid Response’ Methodology.” World Bank Economic Review. 2002.
Fugiie, Keith 0. 2004. “Productivity Growth in Indonesian Agriculture: 1961-2000.” Bulletin of lndonesian Economic Studies, Vol. 40 (2): 209-225.
Gadjah Mada University. 2004. “Study on Governance and Decentralization Survey, GDS+l.” Center for Population and Policy Studies. Yogyakarta.
Gaduh, Arya and Laila Kuznezov. 2005. “Case Study 6: Health Insurance reform in Jembrana District, Bali Province.” Prepared for the Making Services Work for the Poor in Indonesia Case Studies. World Bank Office Jakarta, the Ash Institute for Democratic Governance and Innovation, in collaboration with the Ford Foundation lnternational Innovation Liaison Group. www,innovations.harvard.edu
Galasso, Emmanuela and Martin Ravallion. 2001. “Decentralized Targeting of an Anti-Poverty Program.” Development Research Group. World Bank.
299

MAKING THE NEW INDONESIA WORK FOR THE POOR
Gannon and Zhi Liu. 1997. “Poverty and Transport.” World Bank TWU Series paper, TWU-30, September 1997.
Gertler, Paul J. 2000. “Final Report: The Impact of Progress on Health.” IFPRI: Washington DC.
Gertler, P., S. Martinez and M. Rubio. 2006. ”Investing Cash Transfers to Raise Long-Term Living Standards.” Mimeo.
Gibson, John. 2006. “The Constraints Associated with Infrastructure faced by Non-Farm Enterprises at the Kabupaten Level.’ Background paper for the Rural Investment Climate Assessment. University of Canterbury, New Zealand.
Gill, Indermit, and Nadeem Ilahi. 2000. ‘Economic Insecurity, Individual Behavior, and Social Policy.” Office of the Chief Economist, Latin America and Caribbean Region. Washington, DC: World Bank.
Gill, Indermit, Truman Packard and Juan Yermo. 2004. “Keeping the Promise of Social Security in Latin America.” Stanford University Press.
Government of Indonesia. 2003. “General Guideline Social Assistance Program for Informal Sector and Self-Employed Jobs.” Ministry of Social Affairs.
. 2001. “Anti-Poverty Programs in Indonesia: Analysis, Prospects and Policy Recommendations.” Puguh B. Irawan, Erman A. Rahman, Haning Romdiati and Uzair Suhaimi. BPS Catalogue: 1155.
. 2002. “Jamsostek: The Laws and Regulations of the Republic of Indonesia on the Employees Social Security.”
. 2004. Indonesia Progress Report on the Millennium Development Goals. National Development Planning Agency (Bappenas). Jakarta. February 2004.
, 2004. “Indonesia Educational Statistics in Brief, 2003/2004.” Ministry of National Education. Jakarta.
. 2004. The Tobacco Source Book: Data to Support a National Tobacco Control Strategy (English translation). Ministry of Health Republic of Indonesia. Jakarta.
. 2005. “National Land Policy Framew0rk.A Jakarta. June 2005.”
. 2005. “Implementation Manual Health Services Program at Puskesmas and In-patients Treatment at Third- Class Hospitals with Government Guarantee.” Ministry of Health Republic of Indonesia. Jakarta. July 2005.
. 2005. “Implementation Guidelines on Operational Aid for Schools Compensation for Fuel Subsidies Decrease Program in the Field of Education (PKPS-BBM).” Ministry of National Education and Ministry of Religious Affairs of the Republic of Indonesia. Jakarta.
Graham, W. J., J. S. Bell, et al. 2001. ”Can Skilled Attendance at Delivery Reduce Maternal Mortality in Developing Countries?” Safe Motherhood Strategies: A Review of the Evidence. Wim Van Lerberghe and V. D. Brouwere (eds). Antwerp: ITG Press.
Guggenheim, Scott et al. 2004. “Indonesia’s Kecamatan Development Program: A Large-Scale Use of Community Development to Reduce Poverty.” World Bank Office Jakarta.
Haggard, Stephan. 2000. The Political Economy of the Asian Financial Crisls. Institute for International Economics. Washington, DC.
Hartono, Djoko. 2005. “Analyzing and Explaining Human Development Outcomes Regarding Transition from P r h a r y to Junior Secondary School.” Background paper for the Making the New Indonesia Work for the Poor. World Bank Office Jakarta. Processed.
Heitzmann, Karin, R. Sudharshan Canagarajah, and Paul Siegel. 2002. “Guidelines for Assessing the Sources of Risk and Vulnerability.” Social Protection Discussion Paper, No. 0218.
Hill, Hal. 1996. The lndoneslan Economy since 1966: Southeast Asia’s Emerging Giant. Cambridge University Press.
300

References
Hofman, Bert, Ella Rodrick-Jones, and Thee Kian Wie. 2004. =Indonesia: Rapid Growth; Weak Institutions.” Paper prepared for the Shanghai Conference on Scaling Up Poverty Reduction. May 28-29,2004.
Hoizmann, Robert and Steen Jogensen. 2000. ”Social Protection as Social Risk Management: Conceptual Underpinnings for the Social Protection Sector Strategy Paper.“ Journal o f lnternational Development 11:1,005- 27.
Hoogeveen, Johannes, Emil Tesliuc. Renos Vakis and Stefan Dercon. 2005. ‘A Guide to the Analysis of Risk, Vulnerability and Vulnerable Groups.” Social Protection Unit. Washington, DC: World Bank.
Hull, Terence. ed. 2002. “The Marriage Revolution in Indonesia.” Paper for Conference of the Population Association of America, Atlanta. May 9-11, 2002.
. 2005. People, Populatlon and Policy in Indonesia. Institute of Southeast Asian Studies. Singapore: Equinox Publishing.
Hydroconseil. 2004. “Inception Report Small Scale Water Providers in Indonesia.” Supported by the Water and Sanitation Program. World Bank Jakarta Office.
Inter-American Development Bank (IADB). 2005.”Ex-post evaluation training programs: Youth Labor Training Program (Pro-Joven) in Peru.” Expost Project Report. IADB, April 2005.
International Foundation for Electoral Systems (IFES). Campaign Finance in Indonesia. Jakarta. December 1999.
Indonesian Demographic and Health Survey (DHS). 2002. “On Reported Deaths over the period 1998 to 2002.”
International Crisis Group (ICG). 2003. “Indonesia Backgrounder: A Guide to the 2004 Elections.” Jakarta. December 2003.
International Monetary Fund (IMF). 2006. “Draft Report on the Observance of Standards and Codes (ROSC): Fiscal Transparency Module.”
Ishihara, Yoichiro. 2005. “Indonesia: Public Expenditure Review: Public Investment, Fiscal Space and Expenditure Allocations.” World Bank Office Jakarta.
Ishihara, Yoichiro and Elif Yavuz. 2005. “Indonesia: Binding Constraints to Private Investment.” World Bank Jakarta Office. Processed.
Jenkins, Robert and Anne Marie Goetz. 1999. “Constraints on Civil Society’s Capacity to Curb Corruption: Lessons from the Indian Experience.” IDS Bulletin Vol. 30 No. 4 October 1999. Institute for Development Studies (IDS).
JHPIEGO. 2004. “Preventing Postpartum Hemorrhage: A Community-Based Approach Proves Effective in Rural Indonesia.” www.mnh.ihDieko.org.
Johnston, Don. 2005. “Notes on the Financial System and Poverty.” Prepared for the Rural Investment Climate Assessment. World Bank Jakarta Office. Processed.
Kamelus, Deno, Jessica Ludwig and Suhirman. 2004. “Study on the Efficiency and Effectiveness of the Planning and Budgeting Process in Selected Districts in NTB/NTf.” GTZ- PROMIS NT.
Kanbur, Ravi. ed. 2003. “Q-Squared: Qualitative and Quantitative Methods of Poverty Appraisal.” Delhi: Permanent Black.
Kearney, M. 2000. “Rise in teen prostitutes.” The Strait Times. 14 November 2000.
Knowles, J, and James Marzolf. 2003. “Health Financing for the Poor in Indonesia.” World Bank Paper Prepared for Regional Study on Pro-Poor Health Financing. World Bank Office Jakarta.
Komisi Pemilihan Umum (Indonesian Election Commission). 2005. Jakarta www.kou.go.id
Kuznezov, Laila and Janes Ginting. 2005. “Improving Budget Transparency in Bandung City, West Java.” Prepared for the Making Services Work for the Poor in Indonesia Case Studies. World Bank Office Jakarta, the Ash Institute for
301
MAKING THE NEW INDONESIA WORK FOR THE POOR
Democratic Governance and Innovation, in collaboration with the Ford Foundation International Innovation Liaison Group. www.innovations.harvard.edu
. 2005. “The Community Block Grant Program in Blitar City, East Java.” Prepared for the Making Services Work for the Poor in Indonesia Case Studies. World Bank Office Jakarta, the Ash Institute for Democratic Governance and Innovation, in collaboration with the Ford Foundation International Innovation Liaison Group. www.innovations.harvard.edu
Lanjouw, Peter. 2001. “Non-Farm Employment and Poverty in Rural El Salvador.” World Development 29 (3): 529-47.
Lanjouw, Peter, Menno Pradhan, Fadia Saadah, Haneen Sayed and Robert Sparrow. 2001. “Poverty, Education and Health in Indonesia: Who Benefits from Public Spending?” World Bank Policy Research Working Paper Series No. 2739. Washington, D.C.
Lebo, Jerry and Dieter Schelling. 2001. “Design and Appraisal of Rural Transport Infrastructure.” TWU Series Paper, TWU-45, April. World Bank.
Leipziger, Danny. 2003. Millennium Development Goals: The lnfrastructure Contribution. Presentation for Poverty Day 2003 Opening Session and Plenary on Infrastructure and Poverty Reduction.
Leisher, Susannah and Stefan Nachuk. 2005. “Creating Learning Communities for Children in Polman District, West Sulawesi.” Prepared for the Making Services Work for the Poor in Indonesia Case Studies. World Bank Office Jakarta, the Ash Institute for Democratic Governance and Innovation, in collaboration with the Ford Foundation International Innovation Liaison Group. www.innovations.harvard.edu
, 2005. “Participatory Planning in Maros District, South Sulawesi.” Prepared for the Making Services Work for the Poor in Indonesia Case Studies. World Bank Office Jakarta, the Ash Institute for Democratic Governance and Innovation, in collaboration with the Ford Foundation International Innovation Liaison Group. www.innovations.harvard.edu
Lewis, Blaine. 2002. “Revenue Sharing and Grant Making in Indonesia: The First Two Years of Fiscal
Lloyd, Grayson and Shannon Smith. eds. 2001. lndonesia Today: Challenges of History. Institute of Southeast Asian Decentralization.” Research Triangle Institute.
Studies (ISEAS), Singapore.
Lieberman, S., and Puti Marzoeki. 2000. lndonesia Health Strategy in a Post-Crisis: Decentralizing Indonesia. Washington, DC: World Bank.
Lindenthal, Roland. 2004a. ‘The Challenge of Social Protection for All: Policy Options for Indonesia.” Joint UNSFIR-ILO Working Paper, No. 04/11.
. 2004b. “Social Policy in Indonesia: Concepts and Categories.” UNSFIR, No. 04/10.
Lokshin, Michael and Martin Ravallion. 2005. “Lasting local impacts of an economy-wide crisis.“ Policy Research Working Paper Series 3503. Washington, DC: World Bank.
Lowry, Robert, 1996. The Armed Forces of Indonesia. Allen & Unwin: St. Leonards.
LP3E FE UNPAD and GIAT. 2004. “Indonesia’s employment protection legislation: Swimming against the tide.” Faculty of Economics, University of Padjajaran Bandung and Growth through Investment, Agriculture and Trade (GIAT) Project.
Manning, Chris. 2005. “Notes on Labor and Poverty.“ Prepared for the Rural Investment Climate Assessment. World Bank Jakarta Office. Processed.
Manning, Nick. 2000. “Pay and Patronage in the Core Civil Service in Indonesia.” PRMPS. World Bank.
Martineau, Jean-Noel and Yves Guerard. 2005. “Implementing an Indonesian National Social Security System.” Phase I Report, FIRST Initiative.
Martini, Santi and Muji Sulistyowati. 2005. “The Determinants of Smoking Behavior among Teenagers in East Java Province, Indonesia.” Economics of Tobacco Control. Paper No. 32. HNP Discussion Paper.
302

References
Marzolf, James. 2002. “The Indonesia Private Health Sector: Opportunities for Reform: an Analysis of Obstacles and Constraints to Growth.” Discussion Paper. World Bank Office Jakarta.
McCulloch, Neil, Peter Timmer and Julian Weisbrod. 2006. “The Pathways out of Poverty in Rural Indonesia- an empirical assessment.” World Bank Jakarta Office. Mimeo.
McGranahan, Gordon and David Satterthwaite. 2004. “Improving access to water and sanitation: rethinking the way forward in light of the Millennium Development Goals”, in Bigg, Tom (ed), Survival for a Small Planet - The Sustainable Development Agenda. London: Earthscan Publications, pp 268-282.
Mclntyre, Andrew. 2003. “Indonesia as a Poorly Performing State?” Australian National University. Processed.
McKinsey. 1997. “Banking in Asia: The End of Entitlement.” Counselor (Education, Science and Training), Australian Embassy; Directorate General of Customs and Excise.
McMahon, Walter, Nanik Suwaryani, and Elisabeth Appiah. 2001. lmproving Education Finance in Indonesia: Policy Review. Institute for Research and Development. Ministry of National Education, UNICEF and UNESCO.
Mietzner, Marcus. 2006. The Politics o f Military Reform in Post-Suharto Indonesia: €lite Conflict, Nationalism, and lnstitutional Resistance. East West Center: Washington.
Mukherjee, N. 2005. “Qualitative Study: Making Services Work for the Poor. Consultations with the Poor at Eight Sites in Indonesia.” World Bank WSP. Washington, DC.
Myrdal, Gunnar. 1968. Asian Drama: An lnquiry into the Poverty of Nations. Pantheon Books: New York.
National Democratic Institute (NDI). 2005. “Towards a More Effective lndonesian House of Representatives: Options for Positive Change by Legislators.” Washington, D.C.
Newhouse, D., and K. Beegle. 2005 ‘The Effect of School Type on Academic Achievement: Evidence from Indonesia.” World Bank Policy Research Working Paper No. 36043604, Washington, DC.
Organization for Economic Co-operation and Development (OECD). 2004.“Public Sector Modernization: Governing for Performance.” OECD Observer. October 2004.
Olken, Ben. 2004. “Monitoring Corruption: Evidence from a Field Experiment in Indonesia.” NBER Working Paper. Washington, DC. November 2004.
Packard, Truman. 2002. “Pooling, Saving and Prevention: Mitigating Old Age Poverty in Chile.“ Policy Research Working Paper No. 2849. Washington, DC: World Bank.
Packard, Truman, Vivi Alatas and Lina Marliani. 2005. “Indonesia: Risk and Vulnerability Assessment.” Background Paper for Making the New Indonesia Work for the Poor.
Pangestu, Mari and lwan J. Azis. 1994. =Survey of Recent Developments.” Bulletin o f lndonesian Economic Studies 30. no. 2.
Paqueo, Vicente and Robert Sparrow. 2005. “Free Basic Education in Indonesia: Policy Scenarios and Implications for School Enrollment.” Working Paper.
Parakesit, Danang. 2006. Unpublished paper for the Indonesia Rural Investment Climate Assessment. World Bank Jakarta Office.
Parker, E. and A. Roestam. 2002. “The Bidan di Desa Program: A Literature and Policy Review.” JHPIEGO Corporation, CEDPA, JHU/CCP, and PATH.
Parker, S. and Emanuelle Skoufias. 2000. “Final Report: The Impact of Progresa on Work, Leisure, and Time Allocation.” October. International Food Policy Research Institute (IFPRI), Washington, D.C.
Papanek, Gustav F. 2006. “Guaranteed Employment for the Poor or a Cash-for-Work Program: How is it Different from Existing Employment Programs? Can it Succeed?” January. Mimeo.
303

MAKING THE NEW INDONESIA WORK FOR THE POOR
Plummer, Janelle. 2006. “Making Infrastructure Expenditure Work for the Poor.” Background Paper for Making the New Indonesia Work for the Poor. World Bank Office Jakarta.
Pradhan, Menno, Fadia Saadah and Robert Sparrow. “Did the Health Card Program Ensure Access to Medical Care for the Poor during Indonesia’s Economic Crisis?” World
Bank Economic Review. Forthcoming.
Pritchett, Lant, Sudarno Sumarto and Asep Suryahadi. 2002. “Targeted Programs in an Economic Crisis: Empirical Findings from the Experience of Indonesia.” SMERU Research Institute. Working Paper.
. 2001. “Safety Nets and Safety Ropes: Comparing the Dynamic Benefit Incidence of Subsidized Rice and Public Works Programs in Indonesia.” Paper presented at Vulnerability and Poverty Workshop, Third Asian Development Forum, Bangkok. June 2001.
Purwoko, Bambang. 1999. “Towards a Social Security Reform: The Indonesian Case.” Jamsostek.
Rama, Martin. 1996. ‘Consequences of Doubling the Minimum Wage: the Case of Indonesia.” Policy Research Working Paper 1643. Washington, DC: World Bank.
Ravallion, Martin. “Inpres and Inequality: A Distributional Perspective on the Centre’s Regional Disbursement.” Australian National University.
Ravallion, Martin and S. Chen. 2003. “Measuring Pro-Poor Growth.” World Bank, Policy Research Working Paper 2666.
Ravallion, Martin and Michael Lokshin. 2003. “On the Utility Consistency of Poverty Line.” Policy Research Working Paper Series 3157. Washington, DC: World Bank.
Ravallion, Martin and Michael Lokshin. 2005. “Who Cares About Relative Deprivation?” December 2005. World Bank Policy Research Working Paper No. 3782.
Ravindra, Adikeshavalu. 2004. ”An Assessment of the Impact of Citizen Report Cards on the Performance of Public Agencies.” Washington, DC: World Bank.
Rawlings, Laura and Gloria Rubio. 2003. “Evaluating the Impact of Conditional Cash Transfer Programs: Lessons from Latin America. World Bank.
Reardon, Tom, and C. Peter Timmer. 2005. “Transformation of Markets for Agricultural Output in Developing Countries Since 1950: How Has Thinking Changed?” Chapter 13 in R.E. Evenson, P. Pingali, and T.P.
Schultz. eds. Handbook of Agricultural Economics: Agricultural Development: Farmers, Farm Production and Farm Markets, Volume 3A. Forthcoming.
Reynolds, Catherine. 1998. “Worshipping Cancer Sticks.” h i d e lndonesia No. 56, October-December 1998.
Ridao-Cano, Cristobal and Deon Filmer. 2004. “Indonesia: Evaluating the Performance of SGP and SIGP: A Review of the Existing Literature and Beyond.” Human Development Sector Unit, East Asia and Pacific Region. Working Paper 2004-3. Washington, DC: World Bank.
Robinson, J. S., B. R. Burkhalter et al. 2001. “Low-Cost on-the-Job Peer Training of Nurses Improved Immunization Coverage in Indonesia.” Bulletln of the World Health Organization 79: 150-158.
Robinson, Marc and Stephen Sherlock. 2004. “Assessing Capacity Building Needs for Effective Legislative Oversight of the Budget Process.“ Mimeo, May 2004.
Rodrik, Dani, Ricardo Hausmann, and Andres Velasco. 2004. “Growth Diagnostics.” Working Paper. October. Kennedy School of Government, Harvard University. Processed.
Rohdewohld, Rainer. 1995. Public Administration in Indonesia, Melbourne: Montech Pty. Ltd.
Sanghvi, Harshad et al. 2004. “Preventing Postpartum Hemorrhage in Homebirths in Indonesia through Community Education and Distribution of Misoprostol.” JHPIEGO Maternal and Neonatal Health Program. Maryland: JHPIEGO.
304

References
Sarimawar, Djaja. 2000. “Revealing Priority Problems in Effort to Reduce Maternal Death in Indonesia.” Badan Litbang Kesehatan Departemen Kesehatan dan Kesejahteraan Sosial. Jakarta.
Schwarz, Adam. 1994. A Nation in Waiting: Indonesia in 1990s. Westview Press.
Schady, Norbert R. 2006. “Conditional Cash Transfer Programs: Reviewing the Evidence.” Third International Conference on Conditional Cash Transfers. Turkey, June 2006.
Scheil-Adlung, Xenia. 2004. “Indonesia: Advancing Social Health Protection for the Poor.” Joint UNSFIR-ILO Working Paper.
Shoemaker, J. 2005. “International Family Planning Perspectives.” Vol. 3 1 (3). Baltimore: JHPIEGO.
Simatupang, Pantjar. 2005. “Agricultural Marketing and Competition.” Prepared for the Rural Investment Climate Assessment. World Bank Jakarta Office. Processed.
Singh, Janmejay and Parmesh Shah. 2003. “Making Services Work for Poor People-The Role of Participatory Public
Skoufias, Emmanuel. 2005. “PROGRESA and Its Impacts on the Welfare of Rural Households in Mexico.” IFPRI Expenditure Management.” Social Development Notes. World Bank. March 2003.
Research Report No. 139. International Food Policy Research Institute (IFPRI). Washington, D.C.
SMERU Research Institute. 2001. “Wage and Employment Effect of Minimum Wage Policy in the Indonesian Urban Labor Market.” Jakarta.
. 2002. ”An Impact Evaluation of Systematic Land Titling under the Land Administration Project (LAP).” June 2002.
.2004. “Mapping Assistance Programs to Strengthen Micro-business.” SMERU News No. 10. April-June 2004.
. 2005a. “Progress Report and Preliminary Assessment of District Government Capacity.” Part of Study on Capacity.
. 2005b. “Development of Local Government through Assisting Participatory Poverty Assessment (PPA).” August.
.2006a. “PKPSBBM Education Program Rapid Assessment: Preliminary Findings.” March 2006. Jakarta.
, 2006b. “PKPS-BBM for Rural Infrastructure and Clean Water.” Background Paper for the Making the New Indonesia Work for the Poor.
. 2006c. ”SSN and PKPS BBM for Education Sector School Grants and Scholarships.” Background Paper for the Making the New Indonesia Work for the Poor. January 2006.
. 2006d. “SSN and PKPS BBM for Health Sector.” Background Paper for the Making the New Indonesia Work for the Poor.
Songco, Jocelyn A. 2002. “Do Rural Infrastructure Investments Benefit the Poor? Evaluating Linkages: A Global View, a Focus on Vietnam.” Policy Research Working Paper 2796. Washington, DC: World Bank.
Sood, S., U. Chandra et al. 2004. Measuring the Effects of the SlAGA Behavior Change Campaign in Indonesia with Population-Based Survey Results.
Strauss, John, Kathleen Beegle, Agus Dwiyanto, Yulia Herawati, Daan Pattinasarany, Ewan Satriawan, Bondan Sikoki, Sukamdi, Firman Witoelar. 2004. “Indonesian Living Standards: Before and After the Financial Crisis.” Rand Corporation, USA and Institute of Southeast Asian Studies.
Strauss, John, Kathleen Beegle, Bondan Sikoki, Agus Dwiyanto, Yulia Herawati and Firman Witoelar. 2004. “The Third
Suharto, E. 2002. “Human Development and the Urban Informal Sector in Bandung, Indonesia: the Poverty Issue.” In Wave of the Indonesia Family Life Survey (IFLS): Overview and Field Report.”
New Zealand Journal o f Asian Studies, 4,2. December 2002.
Sulastomo. “Social Security Reform in Indonesia.” Mimeo.
305
MAKING THE NEW INDONESIA WORK FOR THE POOR
Sumarto, Sudarno, Asep Suryahadi, and Lant Pritchett. 2001. ”Safety Nets and Safety Ropes: Comparing the Dynamic Benefit Incidence of Subsidized Rice and Public Works Programs in Indonesia.” Paper for presentation at the Vulnerability and Poverty Workshop, Third Asian Development Forum. Bangkok. June 12-14.
Sumarto, Sudarno, Asep Suryahadi and Wenefrida Widyanti. 2004. “Assessing the Impact of Indonesian Social Safety Net Programs on Household Welfare and Poverty Dynamics.” SMERU Research Institute Working Paper.
Supratikto, G., G. Wirth, E. Achadi, S. Cohen and C. Ronsmans. 2002. “A District- Based Audit of the Causes and Circumstances of Maternal Deaths in South Kalimantan.” lndonesia Bulletin of the World Health Organization 80 (3): 228-34.
Suryadarma, Daniel, Rima Prama Artha, Asep Suryahadi, and Sudarno Sumarto. 2005. “A Reassessment of Inequality and its Role in Poverty Reduction in Indonesia.” SMERU Research Institute Working Paper.
Suryadarma, Daniel, Wenefrida Widyanti, and Asep Suryahadi. 2003. “Access to Income: An overview of the Broader Dimensions of Inequality in Indonesia.” SMERU Research Institute.
Tan, Ellen. 2005. “Determinants of Maternal Mortality in Indonesia.” Background Paper for the Making the New Indonesia Work for the Poor. World Bank Office Jakarta.
Tan, Ellen, C. Clarita Kusharto and Sri Budiyati. 2005. ”Rewarding Educational Performance in Tanah Datar, Sumatra.” Prepared for the Making Services Work for the Poor in Indonesia Case Studies. World Bank Office Jakarta, the Ash Institute for Democratic Governance and Innovation, in collaboration with the Ford Foundation International Innovation Liaison Group. www.innovations.harvard.edu
. 2005. “Vouchers for Midwife Services in Kabupaten Pemalang, Central Java.” Prepared for the Making Services Work for the Poor in Indonesia Case Studies. World Bank Office Jakarta, the Ash Institute for Democratic Governance and Innovation, in collaboration with the Ford Foundation International Innovation Liaison Group. www,innovations.harvard.edu
. 2005. “Water Supply and Health in Lumajang District, East Java Province.” Prepared for the Making Services Work for the Poor in Indonesia Case Studies. World Bank Office Jakarta, the Ash Institute for Democratic Governance and nnovation, in collaboration with the Ford Foundation International Innovation Liaison Group. www.innovations.harvard.edu
Temple, Jonathan. 2001. “Growing into Trouble: Indonesia after 1966.” Working Paper Department of Economics, University of Bristol. Processed.
The Economist. “Digging for Dirt.” London. 16 May 2006.
Thorbecke, Erik. 1995. The Political Economy of Development: lndonesla and the Philippines. The Frank H. Golay Memorial Lecture. Cornell Southeast Asia Program. Ithaca, NY.
Timmer, C. Peter. 1975. “The Political Economy of Rice in Asia: Indonesia.” Food Research Institute Studies, 14 (3): 197-231.
. 1992. =Agriculture and Economic Development Revisited.”Agriculture Systems (40): 21-58.
. 1997. “How Well do the Poor Connect t o the Growth Process?” Harvard Institute for International
.2002. “Agriculture and Economic Growth.” In Bruce Gardner and Gordon Rausser, eds., The Handbook of Development for the USAID/CAER project. Processed.
Agricultural Economics, Vol. II, 1,487-1,546. Amsterdam: North-Holland.
.2003. “Food Security and Rice Price Policy in Indonesia: The Economics and Politics of the Food Price Dilemma.” In Mew, T. W., Brar, D. S., Peng, S., Dawe, D., and Hardy, B. eds. Rice Science: lnnovations and Impact for Livelihood. Proceedings of the International Rice Research Conference, 16-19 September, 2002, Beijing, China. International Rice Research Institute, Chinese Academy of Engineering, and Chinese Academy of Agricultural Sciences, pp. 777-788.
,2004. “The Road to Pro-Poor Growth: The Indonesian Experience in Regional Perspective.” Bulletin of Indonesian Economic Studies. Vol. 40, No. 2 (August): 173-203.
306

References
. 2005. “Operationalizing Pro-Poor Growth: A Country Case Study of Indonesia.” Poverty Reduction and Economic Management. Washington, DC: World Bank. Processed.
Torrens, Anthony. 2005. “KDP Economic Impact Analysis Study.” World Bank Office Jakarta. Mimeo.
Townsend, R. 1994. “Risk and Insurance in Village India.” Econometrica 62(3): 539-591.
Transparency International. 2004. Transparency International: Global Corruption Report 2004. London: Pluto Press. www.transparency .org
UNDP and Government of Malaysia. 2005. “Malaysia: Achieving the Millennium Development Goals, Successes and Challenges.”
Usui, Norio and Armida Alisjahbana. 2004. “Local Development Planning and Budgeting in Decentralized Indonesia: Key Issues.”
Usui, Norio and Catur Sugiyanto. 2003. “Development Planning, Budgeting and Service Delivery: A Case of Lombok Tenga h .”
von Luebke, Christian. “Political Economy of Local Business Regulations: Findings on Local Taxation and Licensing Practices from Four District Cases in Central Java and West Sumatra.” Prepared for the Rural Investment Climate Assessment Case Studies. World Bank Office Jakarta. Forthcoming.
Wallace, W., Wolfgang Fengler, and Bastian Zaini. 2006. “Increasing subnational government resources: Magnitude and implications.” World Bank Office Jakarta. Mimeo.
Warr, Peter G. 1984. “Exchange Rate Protection in Indonesia.” Bulletln of lndonesian Economic Studies. Vol. XX (2): 53-89.
Wagstaff, A,, and Menno Pradhan. 2003. “Evaluating the Impacts of Health Insurance: Looking Beyond the Negative.”
West, Andrew. 2003. At the Marglns: Street Children in Asla and Paciflc Region. Asian Development Bank (ADB) Working Paper, Poverty and Social Development Unit.
Wetterberg, Anna. 2005. “Crisis, social ties, and household welfare: testing social capital theory with evidence from Indonesia.” Social Development Sector (EASSD). Report Number 34223. Washington, DC: World Bank.
Willoughby, Christopher. 2004. “How important is infrastructure for achieving pro-poor growth?” DAC Network on Poverty Reduction Global Picture for Infrastructure and Pro-Poor Growth Room Document One. Paris. March 29- 30.2004
Wodon, Quentin. 1997. “Food Energy Intake and Cost of Basic Needs: Measuring Poverty in Bangladesh.” journal of Development Studles No. 34: 66-101.
Woodhouse, Andrea. 2002. “Village Corruption in Indonesia: Fighting Corruption in the World Bank’s Kecamatan Development Program.” World Bank Office Jakarta.
World Bank. 1993. The East Asian Miracle: Economic Growth and Public Policy. New York: University Press.
, 1994. “Indonesia’s Health Work Force: Issues and Options.” Report No: 12834-IND Population and Human Resources Division, Washington, D.C.
, 1997. ‘Training and the Labor Market in Indonesia: Policies for Productivity Gains and Employment Growth.” Sector Report No. 16990.
, 2000. ”Managing Social Risks in Argentina.” Human Development Department, Latin America and Caribbean Regional Office. Washington, D.C.
, 2001a. “Social Protection Strategy: from Safety Net to Spring Board.” Social Protection Sector Board. Washington, D.C.
,2001b. Indonesia: The lmperative for Reform. World Bank Office Jakarta.
307

MAKING THE NEW INDONESIA WORK FOR THE POOR
. 2002a. “Indonesia Social Safety Net Adjustment Loan.” Implementation Completion Report. No. 24320. Washington, D.C.
,2002b. “Accountability to the Poor: Experiences in Civic Engagement in Public Expenditure Management.”
. 2002c. A Sourcebook for Poverty Reduction Strategies (2 Volumes). Edited by Jeni Klugman. Vol. 1: Core Techniques and Cross Cutting Issues. Washington, DC: World Bank.
. 2003a. “Achievements Indonesia Maternal and Neonatal Health Program.” Maternal and Neonatal Health Technical Review. World Bank Office Jakarta.
.2003b. “Health Financing in Indonesia.” World Bank Office Jakarta.
.2003c. “Indonesia Education Sector Review.” Human Development Network. World Bank Office Jakarta.
. 2003d. “Decentralizing Indonesia: A Regional Public Expenditure Review.” World Bank Office Jakarta.
. 2004a. “Concept Paper on Operationalizing Pro-Poor Growth.” A Research Project Sponsored by AFD, DFID, GTZ, KfW and PREM. May 11. Washington, D.C.
,2004b. Indonesia: Averting an lnfrastructure Crisis. Washington, D.C: World Bank.
. 2004c. “Shocks and Social Protection: Lessons from the Coffee Crisis in Central America.” Human
, 2004d. World Development Report 2004: Making Services Work for the Poor. A co-publication of the World Development Department, Latin America and Caribbean Regional Office. Washington, D.C.
Bank and Oxford University Press.
,2004. “Initiatives for Local Governance Reform Report.” World Bank Office Jakarta. July, 2004.
. 2005a. ”Indonesia - Tobacco Control Policy Options (draft).” Health, Nutrition and Population Unit, Human Development Network and East Asia and Pacific Region. Washington, DC: World Bank.
. 2005b. “Information and Communication Technologies for Rural Development: Issues and Options.” Washington, DC: World Bank.
. 2005c. “Pro-poor growth in the 1990s: Lessons and insight from 14 countries.” A Research Project
. 2005d.Teacher Employment and Deployment Study.” Human Development Network. World Bank Office
Sponsored by DFID, AFD, GTZ, Kfw. June. Washington, DC: World Bank.
Jakarta.
. 2005e. Civil Service Diagnostics and Road Map for Reform in Cluster 2 Region (West Sumatra), World Bank Off ice, Jakarta.
,2005. Public Expenditure Review. Forthcoming. World Bank Office. Jakarta.
,2005. East Asia Update. Washington, DC: World Bank.
, 2005. “Strategy Note for Government of Indonesia: Expansion of a National Poverty Reduction Program.” World Bank Jakarta Office. May 2005.
, 2006a. “Impediments to Effective Rural Infrastructure: Roads in Manggarai District, N l l Province.” Rural Investment Climate Case Study 5. World Bank Office Jakarta.
. 2006b. “Indonesia: An Assessment of Public Spending in Infrastructure Sectors.” World Bank Office Jakarta. Mimeo.
. 2006c. lndonesia Enabling Water Utilities to serve the Urban Poor. Infrastructure Network. A co- publication of the World Bank East Asia Infrastructure Department and Indonesia Country Program.
. 2006d. “Infrastructure and the Climate for Rural Investment in Indonesia: A Question of Resource Allocation.” Prepared for the Indonesia Rural Investment Climate Assessment. World Bank Office Jakarta.
308
References
.2006e. "Investing for Growth and Recovery." CGI Brief Paper. World Bank Jakarta Office.
. 2006f. "Making Services Work for the Poor in Indonesia, Case Study: Vouchers for Midwife Services in Pemalang District, Central Java." Prepared for the Making Services Work for the Poor in Indonesia. World Bank Office Jakarta.
.2006g. "Making Services Work for the Poor in Indonesia, Case Study: Water Supply and Health in Lumajang District, East Java." Prepared for the Making Services Work for the Poor in Indonesia. World Bank Office Jakarta.
.2006h. "Revitalizing the Rural Economy: An Assessment of the Rural Investment Climate in Indonesia." Consultative Draft. Jakarta. Forthcoming.
. 2006i. "The Impact of Formal and Informal Labor Regulation on Business in Serang District." Rural Investment Climate Case Study 2. Jakarta.
.2006j. World Development Report 2006: Equity and Development. Washington, DC: World Bank.
. 2006k. Making Services Work for the Poor in Indonesia: Focusing on Achieving Results on the Ground. Jakarta. Forthcoming.
. 20061. The Nuts and Bolts of Brazil's Bolsa Familia Program: Implementing Conditional Cash Transfers In a Decentralized Context. Draft for Discussion. June 2006.
. 2006m. Indonesia: Sustaining Economic Growth, Rural Livelihoods, and Environmental Benefits: Strateglc Options for Forestry Assistance in Indonesia. Jakarta.
. 2006. "Evaluation Fiscal Equalization in Indonesia." Policy Working Paper 3911. Washington, DC: World Bank. May 2006.
. 2006. "Opportunities and Constraints for Civil Service Reform in Indonesia." World Bank and Partnership for Governance Reform. World Bank Office Jakarta.
. 2006. Education Public Expenditure Review. Forthcoming. World Bank Jakarta Office.
. Poverty Library. http://povlibrary.worldbank.org/files/4978~chapl8.pdf
World Health Organization (WHO). 2003a. "Indonesia Reproductive Health Profile."
, 2003b. Country Profile: Indonesia. www.who.org
. 2004. "Indonesia Public Health Expenditure Survey 2004."
309