Individual-level, network-level and city-level factors associated with HIV prevalence among people...
13
Individual-level, network-level and city-level factors associated with HIV prevalence among people who inject drugs in eight Russian cities: a cross-sectional study Ksenia Eritsyan, 1,2 Robert Heimer, 3 Russell Barbour, 3 Veronika Odinokova, 1 Edward White, 3 Maia M Rusakova, 1 Tatiana T Smolskaya, 4 Olga S Levina 1 To cite: Eritsyan K, Heimer R, Barbour R, et al. Individual- level, network-level and city-level factors associated with HIV prevalence among people who inject drugs in eight Russian cities: a cross-sectional study. BMJ Open 2013;3: e002645. doi:10.1136/ bmjopen-2013-002645 ▸ Prepublication history for this paper are available online. To view these files please visit the journal online (http://dx.doi.org/10.1136/ bmjopen-2013-002645). Received 28 January 2013 Revised 3 April 2013 Accepted 5 April 2013 This final article is available for use under the terms of the Creative Commons Attribution Non-Commercial 2.0 Licence; see http://bmjopen.bmj.com For numbered affiliations see end of article. Correspondence to Ksenia Eritsyan; [email protected], [email protected] ABSTRACT Objectives: To ascertain HIV prevalence among people who inject drug (injection drug users (IDUs)) in the Russian Federation and identify explanations for the disparity in different cities. Design: Cross-sectional survey with serological testing for HIV and hepatitis C virus prevalent infections. Setting: 8 Russian cities—Irkutsk, Omsk, Chelyabinsk, Yekaterinburg, Naberezhnye Chelny, Voronezh, Orel and St Petersburg. Participants: In 2007–2009 active IDUs were recruited by respondent-driven sampling with a target sample size of 300 or more in each city. Main outcome measures: Participants were administered a questionnaire covering sociodemographics, injection risk and protective behaviours, sexual behaviours, HIV knowledge, experiences with drug treatment and harm reduction programmes and social networks. Participants were tested for HIV and hepatitis C by enzyme immunoassay. Data were analysed to identify individual-level, network-level and city-level characteristics significantly associated with HIV prevalence. Factors significant at p≤0.1 were entered into a hierarchical regression model to control for multicollinearity. Results: A total of 2596 active IDUs were recruited, interviewed and tested for HIV and hepatitis C virus infection. HIV prevalence ranged from 3% (in Voronezh) to 64% (in Yekaterinburg). Although individual-level and network-level variables explain some of the difference in prevalence across the eight cities, the over-riding variable that seems to account for most of the variance is the emergence of commercial, as opposed to homemade, heroin as the predominant form of opioid injected. Conclusions: The expansion of commercial heroin markets to many Russian cities may have served as a trigger for an expanding HIV epidemic among IDUs in that country. INTRODUCTION The Russian Federation has experienced one of the fastest growing HIV/AIDS epidemics observed anywhere in the world since ARTICLE SUMMARY Article focus ▪ To test the hypotheses that differences in HIV prevalence among injection drug users (IDUs) could be explained by different level variables such as individual injection practices, the type of drug(s) injected, average duration of drug use, structure of IDU populations, interaction within social networks of IDUs or a combination of these factors. Key messages ▪ The difference in HIV prevalence is best explained by city-level difference in the type of drug injected. ▪ HIV-prevention programmes targeting injectors that increase knowledge and reduce injection risk may reduce transmission, even in cities that have already experienced large epidemic. Strengths and limitations of this study ▪ The largest side-by-side comparison of HIV and hepatitis C virus prevalence among IDUs linked to individual level behavioural and higher order social network and city level data yet conducted in Russia. ▪ Change in the structure of the heroin market emerged as a possible explanation for the differ- ences in HIV prevalence detected in the eight cities. ▪ Non-random selection of the eight cities, non- probability respondent-driven sampling method. ▪ Cross-sectional design prevents determination of temporality needed to demonstrate causative link between changing heroin market and increasing HIV prevalence. Eritsyan K, Heimer R, Barbour R, et al. BMJ Open 2013;3:e002645. doi:10.1136/bmjopen-2013-002645 1 Open Access Research group.bmj.com on February 26, 2014 - Published by bmjopen.bmj.com Downloaded from
Transcript of Individual-level, network-level and city-level factors associated with HIV prevalence among people...

Individual-level, network-level andcity-level factors associated withHIV prevalence among peoplewho inject drugs in eight Russiancities: a cross-sectional study
Ksenia Eritsyan,1,2 Robert Heimer,3 Russell Barbour,3 Veronika Odinokova,1
Edward White,3 Maia M Rusakova,1 Tatiana T Smolskaya,4 Olga S Levina1
To cite: Eritsyan K, Heimer R,Barbour R, et al. Individual-level, network-level andcity-level factors associatedwith HIV prevalence amongpeople who inject drugs ineight Russiancities: a cross-sectionalstudy. BMJ Open 2013;3:e002645. doi:10.1136/bmjopen-2013-002645
▸ Prepublication history forthis paper are availableonline. To view these filesplease visit the journal online(http://dx.doi.org/10.1136/bmjopen-2013-002645).
Received 28 January 2013Revised 3 April 2013Accepted 5 April 2013
This final article is availablefor use under the terms ofthe Creative CommonsAttribution Non-Commercial2.0 Licence; seehttp://bmjopen.bmj.com
For numbered affiliations seeend of article.
Correspondence toKsenia Eritsyan;[email protected],[email protected]
ABSTRACTObjectives: To ascertain HIV prevalence amongpeople who inject drug (injection drug users (IDUs)) inthe Russian Federation and identify explanations for thedisparity in different cities.Design: Cross-sectional survey with serologicaltesting for HIV and hepatitis C virus prevalentinfections.Setting: 8 Russian cities—Irkutsk, Omsk,Chelyabinsk, Yekaterinburg, Naberezhnye Chelny,Voronezh, Orel and St Petersburg.Participants: In 2007–2009 active IDUs wererecruited by respondent-driven sampling with a targetsample size of 300 or more in each city.Main outcome measures: Participants wereadministered a questionnaire coveringsociodemographics, injection risk and protectivebehaviours, sexual behaviours, HIV knowledge,experiences with drug treatment and harm reductionprogrammes and social networks. Participants weretested for HIV and hepatitis C by enzymeimmunoassay. Data were analysed to identifyindividual-level, network-level and city-levelcharacteristics significantly associated with HIVprevalence. Factors significant at p≤0.1 were enteredinto a hierarchical regression model to control formulticollinearity.Results: A total of 2596 active IDUs were recruited,interviewed and tested for HIV and hepatitis C virusinfection. HIV prevalence ranged from 3% (inVoronezh) to 64% (in Yekaterinburg). Althoughindividual-level and network-level variables explainsome of the difference in prevalence across the eightcities, the over-riding variable that seems to accountfor most of the variance is the emergence ofcommercial, as opposed to homemade, heroin as thepredominant form of opioid injected.Conclusions: The expansion of commercial heroinmarkets to many Russian cities may have served as atrigger for an expanding HIV epidemic among IDUs inthat country.
INTRODUCTIONThe Russian Federation has experienced oneof the fastest growing HIV/AIDS epidemicsobserved anywhere in the world since
ARTICLE SUMMARY
Article focus▪ To test the hypotheses that differences in HIV
prevalence among injection drug users (IDUs)could be explained by different level variablessuch as individual injection practices, the type ofdrug(s) injected, average duration of drug use,structure of IDU populations, interaction withinsocial networks of IDUs or a combination ofthese factors.
Key messages▪ The difference in HIV prevalence is best
explained by city-level difference in the type ofdrug injected.
▪ HIV-prevention programmes targeting injectorsthat increase knowledge and reduce injection riskmay reduce transmission, even in cities that havealready experienced large epidemic.
Strengths and limitations of this study▪ The largest side-by-side comparison of HIV and
hepatitis C virus prevalence among IDUs linkedto individual level behavioural and higher ordersocial network and city level data yet conductedin Russia.
▪ Change in the structure of the heroin marketemerged as a possible explanation for the differ-ences in HIV prevalence detected in the eightcities.
▪ Non-random selection of the eight cities, non-probability respondent-driven sampling method.
▪ Cross-sectional design prevents determination oftemporality needed to demonstrate causative linkbetween changing heroin market and increasingHIV prevalence.
Eritsyan K, Heimer R, Barbour R, et al. BMJ Open 2013;3:e002645. doi:10.1136/bmjopen-2013-002645 1
Open Access Research
group.bmj.com on February 26, 2014 - Published by bmjopen.bmj.comDownloaded from

significant spread began in 1996.1 2 The number of offi-cially registered people with HIV increased over 250-foldbetween 1996 and 2011, from 2600 to more than650 000 officially diagnosed cases.3 Most recent estimatesplace the number of infections countrywide at around1 million (840 000–1 200 000), with an estimated HIVprevalence among Russian adults in 2009 around 1%(0.9–1.2%).2
Since 1996, the HIV epidemic in Russia has beenlargely driven by injection drug use.4 There are almost400 000 officially registered injection drug users (IDUs)in Russia5; the estimated number is several times higher:1.5–2.2 million.6–8 IDUs comprise nearly 80% of theregistered HIV cases.4 Surveillance data indicate greatregional differences in HIV prevalence among IDUpopulation; the rates of HIV-prevalence among IDUs ingovernmental treatment and rehabilitation programmesrange between 0% and 48%.5 These data are supportedby research that found HIV prevalence among IDUsranging from 3% to 56%.9–11 Factors that may give riseto the observed variation in HIV prevalence includeindividual-level parameters (eg, hygienic or unhygienicinjection and sex practices), social network parameters(eg, factors that may influence the proportions of IDUsin network who are exposed) and city-level parameters(eg, time of entry of the virus into the local IDUs popu-lation, size of IDU population, type of drug and charac-teristics of drug markets).By 2012, the official case notification surveillance data
at the outset of the study from the oblasts (provinces) inwhich these eight cities are located revealed a widerange in HIV prevalence for the province as a whole—from less than 40 cases/100 000 in Voronezh oblast(38.6) to more than 1000 cases/100 000 in Sverdlovskoblast (Yekaterinburg, 1063.5) and Irkutsk oblast(1349.3), with intermediate rates in the other regions.3
In addition to HIV, hepatitis C virus (HCV) is endemicamong IDUs.12–14 However, data on the prevalence ofHCV in Russian IDUs are insufficient. In the fewRussian locales where serological data on HIV and HCVare available, HCV prevalence exceeds that for HIV.11 15
This is not only true in Russia but also in most of theworld.16
Major differences among IDUs within Russia are thetype and formulation of the drugs they inject. The twodominant drugs are heroin and methamphetamine-typestimulants (MTS). Both have a history of home manufac-ture—heroin from poppies or opium gum and MTSfrom ephedrine, pseudoephedrine or phenylpropanola-mine—and are frequently prepared, stored and sold toIDUs as liquids.17–20 Homemade MTS involves reductionto methamphetamine or amphetamine, or oxidation tomethcathinone or cathinone. Since our ethnographicstudies of Russian IDUs who manufacture or use MTSsuggested that they often confused oxidation and reduc-tion and could not reliably report what MTS they eithermade or injected,18 21 we group all these drugs into asingle MTS category. Homemade heroin involves the
extraction of the morphine in alkaline, organic extrac-tion, acid back extraction and conversion of the mor-phine to heroin (diacetylmorphine). However, in manyparts of Russia, homemade heroin has been replaced bycommercial heroin trafficked directly from CentralAsia.7 22 This transition took place in the late 1990sjointly with a rapid increase of HIV epidemic in Russia.23
Our interest in the variation in HIV prevalence amongIDUs was engaged by the opportunity to conductbehavioural and serological data collection and analysisin eight diverse Russian cities—Irkutsk, Omsk,Yekaterinburg, Chelyabinsk, Naberezhnye Chelny,Voronezh, Orel and St Petersburg using the same sam-pling approach—respondent-driven sampling (RDS)—and virtually identical data collection instruments in alleight cities. The work has yielded the largest side-by-sidecomparison of HIV and HCV prevalence linked toindividual-level behavioural and higher order socialnetwork and city level data yet conducted in Russia.Observations from prior studies19 24–26 led us to formu-late the hypotheses that differences in HIV prevalencewill be explained by different level variables such as:individual injection practices, the type of drug(s)injected, average duration of drug use, percentage ofmen and women in particular IDU populations, inter-action within social networks of IDUs or a combinationof these factors. The resulting analysis permits an explor-ation of the associations of HIV infection withindividual-level, network-level and city-level parameters.Owing to the factors that influence the likelihood ofinfection acting on different levels, it is necessary todevelop a hierarchical approach in forging analyticalstrategies.
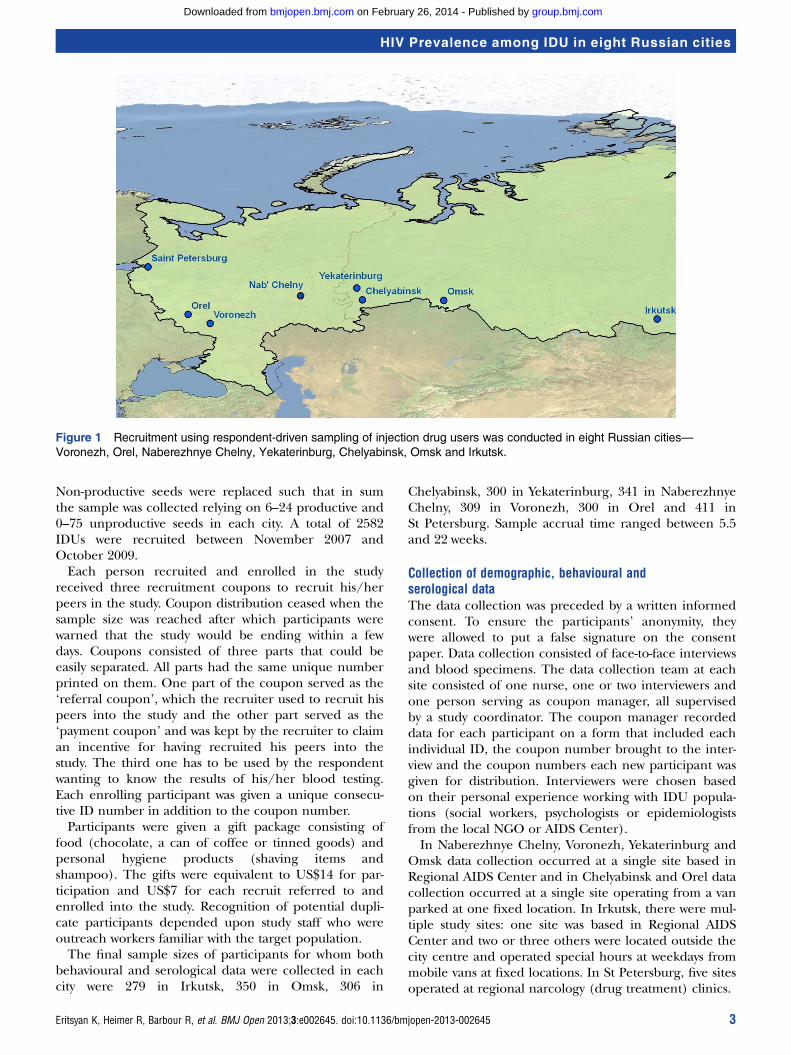
METHODSRecruitment procedureRecruitment using RDS of IDUs was conducted in eightRussian cities—Voronezh, Orel, Naberezhnye Chelny,Yekaterinburg, Chelyabinsk, Omsk and Irkutsk—with atarget of 300 IDUs in each city and St Petersburg withtarget sample of 400 IDUs (figure 1). The sample sizewas set by the study funders and based on many inter-national studies they were supporting at the same time.For inclusion in the study, participants had to be at least15 years old and to report having injected drugs in thelast month. In accordance with RDS methodology, theinitial participants of the study, known as ‘seeds’, weremembers of the target IDU population in their respect-ive cities, and were selected based on their willingness torecruit their peers into the study.27 28 Sample sizes wereset to achieve samples consistent with previous work thatheld such sample sizes reached sample equilibrium andreduced the biases introduced by non-random selectionof seeds.29–31 Recruitment was initiated with 6–7 seeds ineach city referred from local organisations, governmen-tal and/or non-governmental, conducting an outreachor the other kind of work with the IDU population.
2 Eritsyan K, Heimer R, Barbour R, et al. BMJ Open 2013;3:e002645. doi:10.1136/bmjopen-2013-002645
HIV Prevalence among IDU in eight Russian cities
group.bmj.com on February 26, 2014 - Published by bmjopen.bmj.comDownloaded from
Non-productive seeds were replaced such that in sumthe sample was collected relying on 6–24 productive and0–75 unproductive seeds in each city. A total of 2582IDUs were recruited between November 2007 andOctober 2009.Each person recruited and enrolled in the study
received three recruitment coupons to recruit his/herpeers in the study. Coupon distribution ceased when thesample size was reached after which participants werewarned that the study would be ending within a fewdays. Coupons consisted of three parts that could beeasily separated. All parts had the same unique numberprinted on them. One part of the coupon served as the‘referral coupon’, which the recruiter used to recruit hispeers into the study and the other part served as the‘payment coupon’ and was kept by the recruiter to claiman incentive for having recruited his peers into thestudy. The third one has to be used by the respondentwanting to know the results of his/her blood testing.Each enrolling participant was given a unique consecu-tive ID number in addition to the coupon number.Participants were given a gift package consisting of
food (chocolate, a can of coffee or tinned goods) andpersonal hygiene products (shaving items andshampoo). The gifts were equivalent to US$14 for par-ticipation and US$7 for each recruit referred to andenrolled into the study. Recognition of potential dupli-cate participants depended upon study staff who wereoutreach workers familiar with the target population.The final sample sizes of participants for whom both
behavioural and serological data were collected in eachcity were 279 in Irkutsk, 350 in Omsk, 306 in
Chelyabinsk, 300 in Yekaterinburg, 341 in NaberezhnyeChelny, 309 in Voronezh, 300 in Orel and 411 inSt Petersburg. Sample accrual time ranged between 5.5and 22 weeks.
Collection of demographic, behavioural andserological dataThe data collection was preceded by a written informedconsent. To ensure the participants’ anonymity, theywere allowed to put a false signature on the consentpaper. Data collection consisted of face-to-face interviewsand blood specimens. The data collection team at eachsite consisted of one nurse, one or two interviewers andone person serving as coupon manager, all supervisedby a study coordinator. The coupon manager recordeddata for each participant on a form that included eachindividual ID, the coupon number brought to the inter-view and the coupon numbers each new participant wasgiven for distribution. Interviewers were chosen basedon their personal experience working with IDU popula-tions (social workers, psychologists or epidemiologistsfrom the local NGO or AIDS Center).In Naberezhnye Chelny, Voronezh, Yekaterinburg and
Omsk data collection occurred at a single site based inRegional AIDS Center and in Chelyabinsk and Orel datacollection occurred at a single site operating from a vanparked at one fixed location. In Irkutsk, there were mul-tiple study sites: one site was based in Regional AIDSCenter and two or three others were located outside thecity centre and operated special hours at weekdays frommobile vans at fixed locations. In St Petersburg, five sitesoperated at regional narcology (drug treatment) clinics.
Figure 1 Recruitment using respondent-driven sampling of injection drug users was conducted in eight Russian cities—
Voronezh, Orel, Naberezhnye Chelny, Yekaterinburg, Chelyabinsk, Omsk and Irkutsk.
Eritsyan K, Heimer R, Barbour R, et al. BMJ Open 2013;3:e002645. doi:10.1136/bmjopen-2013-002645 3
HIV Prevalence among IDU in eight Russian cities
group.bmj.com on February 26, 2014 - Published by bmjopen.bmj.comDownloaded from
After the interview and pretest counselling, bloodspecimens were collected by venipuncture (3–5 ml ofblood) using closed vacuum systems into tubes markedwith the participant’s unique ID (a combination ofcoupon and consecutive participation number). HIVtesting was performed using an enzyme-linked immuno-assay with confirmatory western blot at the laboratoriesof Regional AIDS Center in each participating city.Participants were instructed to return in 7–14 days fortheir test results. During the post-test visit, theHIV-positive participants were counselled and referredfor long-term care to physicians working at RegionalAIDS Centers.Questionnaire topics included network sizes informa-
tion, sociodemographic indicators, sexual and druginjection risk behaviours during the 30 days prior tointerview, knowledge of HIV and STIs and previous HIVtesting. The questionnaire was based on FHI guidelinesfor conducting behavioural surveillance.32 Survey dur-ation was approximately 1 h.
Data analysisData from the eight cities were compiled into a singledatabase. Descriptive statistics, bivariate associationsbetween HIV prevalence and other variables and hier-archical models were produced using SPSS and R soft-ware. Initially, three models to identify the factorsassociated with HIV prevalence were generated. Becausemissing data represented <4% (106 of 2596) of indivi-duals, they were excluded from the models. In the firstmodel, only individual-level variables with bivariate asso-ciations with p≤0.1 were entered into a backward step-wise process using the ‘step’ command in R, which isbased on the best Akaike Information Criteria. In theresulting multivariate model, all remaining variableswere considered significant if p≤0.05. A second modeladded to the first model three measures of networkcharacteristics—participants’ self-reported network size(number of IDUs participant met personally during thelast 6 months), the mean number of participants in theRDS chain in the city and the frequency of meetingone’s recruiter. This second model contains all thosevariables that remained significant at p≤0.05. A thirdmodel added into the second model three city level vari-ables. The first two variables—the dominant form ofheroin (homemade vs commercial) and high or low pro-portions of individuals injecting MTSs—are dichotom-ous; the third—the average length of RDS chains ineach city—is a continuous variable. Again, the thirdmodel contains all those variables that remained signifi-cant at p≤0.05.The multicollinearity of the city-level variable of pre-
dominant commercial heroin and all other variablessignificant in the third model was tested using bivariateanalysis. A binomial distribution within generalisedlinear models (GLM) for both univariate and multivari-ate analyses was implemented using R software (http://r-forge.r-project.org). Hierarchical modelling applied
the <hglm> command within the hglm package in R,33
specifying commercial availability of heroin by city as arandom variable, with demographic, network andindividual injection risk behaviours that were found stat-istically significant in the aforementioned GLM specifiedas fixed variables.
RESULTSA comparison of the demographic data from across theeight cities revealed strong similarities for seven of theeight cities (table 1). In these seven cities, the percent-age of male IDUs ranged from 69% to 76% and themean and median ages were in the range 26–31 and26–30, respectively. The exception was Chelyabinsk,where 89% of IDUs were men and the mean andmedian ages were 24.7 and 24, respectively. In addition,the duration of injection among IDUs in Chelyabinskwas 6 years, less than in any city other than Orel. Themajority of participants had completed secondary educa-tion through the Russian equivalent of the 10th grade,and 7–27% in each city had at least some postsecondaryeducation.HIV prevalence, the primary dependent variable,
ranged from 3% in Voronezh to 64% in Yekaterinburg.HCV prevalence ranged from 49% in NaberezhnyeChelny to 90% in Yekaterinburg and St Petersburg.In terms of individual-level injection risk behaviours, the
majority of participants in each city reported never havingbeen injected with a used syringe during the 30 days priorto interview (range 61–86%). Many, however, during thissame period reported sharing other injection parapherna-lia (range 26–91%) and engaging in other practices withthe potential to transmit HIV or HCV (table 1).Engagement with services for IDUs was sporadic. Most hadno recent contact with harm-reduction programmes(range 65–95%) and only one-quarter were in a drug treat-ment programme in the preceding year (range 7–45%).The drug injected most frequently was one of several
forms of heroin—either commercially trafficked orhome manufactured (from opium, poppy straw orpoppy seeds). The data in table 1 reveal that most IDUsin any given city inject with either the homemade orcommercial variety, but not both. Prevalence of injectionof commercial heroin was 95–100% in six of the eightcities—Irkutsk, Omsk, Chelyabinsk, Yekaterinburg,Naberezhnye Chelny and St Petersburg—but uncom-mon in the other two cities. Injection of MTS was lesscommon, with prevalences ranging from 30% inYekaterinburg to 2% in Voronezh and 0% in Irkutsk.We developed stepwise models to identify factors asso-
ciated with HIV prevalence across the eight cities. In thefirst model, which included only the individual-level vari-ables from table 1, we found that 7 of the 14 were asso-ciated in bivariate analysis (table 2), but when theseseven were included in a multivariate model only fourremained significant. Injecting with someone known tobe HIV-positive and sharing rinse water were positively
4 Eritsyan K, Heimer R, Barbour R, et al. BMJ Open 2013;3:e002645. doi:10.1136/bmjopen-2013-002645
HIV Prevalence among IDU in eight Russian cities
group.bmj.com on February 26, 2014 - Published by bmjopen.bmj.comDownloaded from
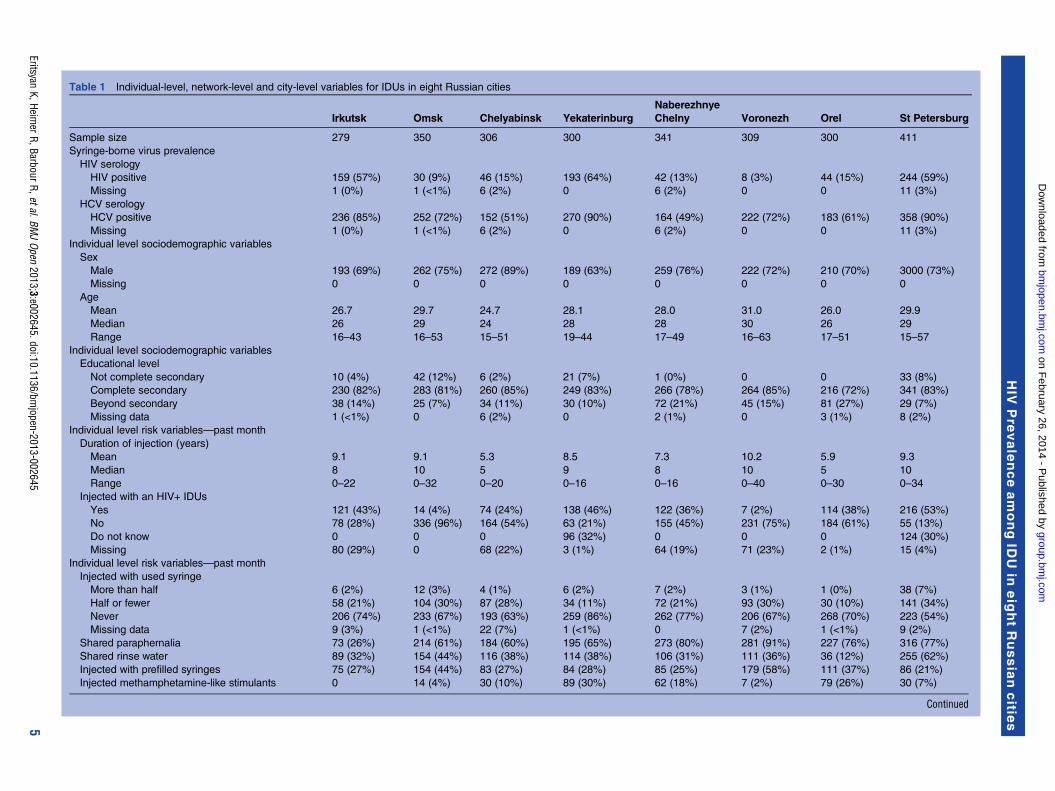
Table 1 Individual-level, network-level and city-level variables for IDUs in eight Russian cities
Irkutsk Omsk Chelyabinsk Yekaterinburg
Naberezhnye
Chelny Voronezh Orel St Petersburg
Sample size 279 350 306 300 341 309 300 411
Syringe-borne virus prevalence
HIV serology
HIV positive 159 (57%) 30 (9%) 46 (15%) 193 (64%) 42 (13%) 8 (3%) 44 (15%) 244 (59%)
Missing 1 (0%) 1 (<1%) 6 (2%) 0 6 (2%) 0 0 11 (3%)
HCV serology
HCV positive 236 (85%) 252 (72%) 152 (51%) 270 (90%) 164 (49%) 222 (72%) 183 (61%) 358 (90%)
Missing 1 (0%) 1 (<1%) 6 (2%) 0 6 (2%) 0 0 11 (3%)
Individual level sociodemographic variables
Sex
Male 193 (69%) 262 (75%) 272 (89%) 189 (63%) 259 (76%) 222 (72%) 210 (70%) 3000 (73%)
Missing 0 0 0 0 0 0 0 0
Age
Mean 26.7 29.7 24.7 28.1 28.0 31.0 26.0 29.9
Median 26 29 24 28 28 30 26 29
Range 16–43 16–53 15–51 19–44 17–49 16–63 17–51 15–57
Individual level sociodemographic variables
Educational level
Not complete secondary 10 (4%) 42 (12%) 6 (2%) 21 (7%) 1 (0%) 0 0 33 (8%)
Complete secondary 230 (82%) 283 (81%) 260 (85%) 249 (83%) 266 (78%) 264 (85%) 216 (72%) 341 (83%)
Beyond secondary 38 (14%) 25 (7%) 34 (11%) 30 (10%) 72 (21%) 45 (15%) 81 (27%) 29 (7%)
Missing data 1 (<1%) 0 6 (2%) 0 2 (1%) 0 3 (1%) 8 (2%)
Individual level risk variables—past month
Duration of injection (years)
Mean 9.1 9.1 5.3 8.5 7.3 10.2 5.9 9.3
Median 8 10 5 9 8 10 5 10
Range 0–22 0–32 0–20 0–16 0–16 0–40 0–30 0–34
Injected with an HIV+ IDUs
Yes 121 (43%) 14 (4%) 74 (24%) 138 (46%) 122 (36%) 7 (2%) 114 (38%) 216 (53%)
No 78 (28%) 336 (96%) 164 (54%) 63 (21%) 155 (45%) 231 (75%) 184 (61%) 55 (13%)
Do not know 0 0 0 96 (32%) 0 0 0 124 (30%)
Missing 80 (29%) 0 68 (22%) 3 (1%) 64 (19%) 71 (23%) 2 (1%) 15 (4%)
Individual level risk variables—past month
Injected with used syringe
More than half 6 (2%) 12 (3%) 4 (1%) 6 (2%) 7 (2%) 3 (1%) 1 (0%) 38 (7%)
Half or fewer 58 (21%) 104 (30%) 87 (28%) 34 (11%) 72 (21%) 93 (30%) 30 (10%) 141 (34%)
Never 206 (74%) 233 (67%) 193 (63%) 259 (86%) 262 (77%) 206 (67%) 268 (70%) 223 (54%)
Missing data 9 (3%) 1 (<1%) 22 (7%) 1 (<1%) 0 7 (2%) 1 (<1%) 9 (2%)
Shared paraphernalia 73 (26%) 214 (61%) 184 (60%) 195 (65%) 273 (80%) 281 (91%) 227 (76%) 316 (77%)
Shared rinse water 89 (32%) 154 (44%) 116 (38%) 114 (38%) 106 (31%) 111 (36%) 36 (12%) 255 (62%)
Injected with prefilled syringes 75 (27%) 154 (44%) 83 (27%) 84 (28%) 85 (25%) 179 (58%) 111 (37%) 86 (21%)
Injected methamphetamine-like stimulants 0 14 (4%) 30 (10%) 89 (30%) 62 (18%) 7 (2%) 79 (26%) 30 (7%)
Continued
EritsyanK,Heim
erR,BarbourR,etal.BMJOpen
2013;3:e002645.doi:10.1136/bmjopen-2013-002645
5
HIV
Pre
valenceamongID
Uin
eig
htRussiancitie
s
group.bm
j.com on F
ebruary 26, 2014 - Published by
bmjopen.bm
j.comD
ownloaded from

Table 1 Continued
Irkutsk Omsk Chelyabinsk Yekaterinburg
Naberezhnye
Chelny Voronezh Orel St Petersburg
Individual level protective factors
Injected with sterile syringe
Always in last 30 days 177 (63%) 215 (61%) 192 (63%) 241 (80%) 229 (67%) 193 (62%) 257 (86%) 280 (68%)
Harm reduction services
None 234 (84%) 294 (84%) 198 (65%) 225 (75%) 276 (81%) 271 (88%) 284 (95%) 361 (88%)
<Once/month 13 (5%) 27 (8%) 17 (6%) 17 (6%) 10 (3%) 7 (2%) 7 (2%) 32 (8%)
≥Once/month 20 (7%) 28 (8%) 90 (29%) 59 (20%) 52 (15%) 31 (10%) 7 (2%) 18 (4%)
Missing data 12 (4%) 1 (0%) 1 (0%) 0 3 (1%) 0 2 (1%) 0
Governmental drug treatment
Ever 162 (58%) 60 (17%) 89 (29%) 45 (15%) 204 (60%) 105 (34%) 63 (21%) 152 (37%)
Last year 126 (45%) 26 (7%) 49 (16%) 24 (8%) 146 (43%) 93 (30%) 27 (9%) 111 (27%)
Perfect HIV knowledge 145 (52%) 123 (35%) 199 (65%) 108 (36%) 204 (60%) 198 (64%) 66 (22%) 239 (52.8%)
Network level variable
RDS network size, past 6 months
Mean 35.8 39.9 10.8 49.7 16.6 21.9 17.3 10.4
Median 15 20 9 22 10 15 10 5
Range 1–500 1–1000 2–50 1–1000 1–500 1–200 1–150 1–500
City level variables
Commercial Heroin Dominant (% of IDUs
reporting
any use, past 30 days)
Yes (98%) Yes
(99%)
Yes (98%) Yes (99%) Yes (100%) No (1%) No (31%) Yes (95%)
Homemade heroin Dominant (% of IDUs
reporting any use, past 30 days)
No (6.5%) No (7.4%) No (6.5%) No (19.7%) No (2.6%) Yes
(96.8%)
Yes
(79.0%)
No (0.5%)
>1 in 6 IDUs reported Recent MTS use No (0%) No (4%) No (10%) Yes (30%) Yes (18%) No (2%) Yes (26%) No (7%)
RDS chain length
Mean 33.0 100.6 112.0 55.7 60.8 83.8 98.9 39.9
Median 33 86 169 55 48 83 156 35
Range 1–65 1–164 5–169 1–96 23–90 1–120 1–156 1–85
HCV, hepatitis C virus; IDU, injection drug user; RDS,respondent-driven sampling.
6Eritsyan
K,HeimerR,BarbourR,etal.BM
JOpen
2013;3:e002645.doi:10.1136/bmjopen-2013-002645
HIV
Pre
valenceamongID
Uin
eig
htRussiancitie
s
group.bm
j.com on F
ebruary 26, 2014 - Published by
bmjopen.bm
j.comD
ownloaded from

associated, whereas the recent use of a syringe exchangeprogramme and perfect score on the HIV knowledgetest was protective. None of the sexual risk behavioursconsidered in the survey instrument (unprotectedsexual intercourse, number of recent or HIV-positivepartners and engagement in commercial sex) was signifi-cantly associated with HIV prevalence.In the second model, we determined which of the three
network-level variables (RDS network size, mean chainlength and frequency of meeting the recruiter) were cor-related with HIV prevalence and added these to the fourindividual-level variables (table 3). Although both largerself-reported network size and shorter length of an indivi-dual’s referral chain were significantly associated withprevalence in bivariate analysis, the multivariate modelexcluded the length of the referral chain and did not elim-inate any of the four significant individual-level variables.In the third model, we determined which of the three
city-level variables were correlated with HIV prevalenceand added these to the five previously identified variables(table 4). All were found to be significantly associated withHIV prevalence in bivariate analysis, but only two were inthe multivariate analysis. The predominance of commer-cial heroin was positively associated with prevalence,whereas larger mean recruitment chain length was pro-tective. One of the individual-level variables, recent use of
syringe exchange, was no longer protective in this model.Of the six factors associated with HIV prevalence, the vari-able with the strongest predictive value was the city-levelvariable commercial heroin predominance. We exploredthe possibility of autocorrelation among these variables aswell as variables significantly associated with HIV preva-lence in all previous models (table 5). We found that ofthe eight variables, only two—sharing cookers and higherlevels of MTS injecting—were not correlated and all thevariables that remained significant in the third model werecollinear with commercial heroin predominance.Given the high degree of collinearity, we constructed
one final model using hierarchical modelling controllingfor commercial heroin predominance as a random effect(table 6). The results of this model are consistent with thethird model presented in table 4 despite the high collin-earity of the significant variable. It is interesting to notethat in the hierarchical model, the intercept is not statistic-ally significant, suggesting that incorporating the variableof commercial heroin predominance as a random variableaccounts for much of the variation in the data.
DISCUSSIONThis study, using bio-behavioural surveillance data on HIVprevalence among people who inject drugs from eight
Table 3 Association of individual-level and network-level factors with HIV prevalence in eight Russian cities
Variable Crude OR (95% CI) Adjusted OR (95% CI)
RDS network size, last 6 months 1.003 (1.001 to 1.004) 1.003 (1.001 to 1.005)**
Length of referral chain 0.998 (0.996 to 0.999) 0.999 (0.997 to 1.0006)
Frequency of meeting referrer 1.09 (0.91 to 1.32)
Injected with known HIV+, last 30 days – 1.86 (1.64 to 2.1)***
Shared rinse water, last 30 days – 2.26 (1.86 to 2.74)***
Used harm reduction services, last 12 months – 0.75 (0.57 to 0.98)*
Perfect score on HIV knowledge test – 0.76 (0.63 to 0.92)**
*p<0.05, **p<0.01, ***p<0.001.RDS, respondent-driven sampling.
Table 2 Association of individual-level demographic, risk and protective factors with HIV prevalence in eight Russian cities
Variable Crude OR (±95% CI) Adjusted OR (±95% CI)
Sex 1.09 (0.90 to 1.31)
Age 1.01 (0.99 to 1.02)
Educational level 0.78 (0.53 to 1.17)
Duration of injection 1.02 (1.01 to 1.04) 1.01 (0.99 to 1.03)
Injected with used syringe, last 30 days 1.46 (1.21 to 1.76) 0.86 (0.66 to 1.12)
Injected with known HIV+, last 30 days 1.96 (1.74 to 2.21) 1.86 (1.64 to 2.11)***
Shared paraphernalia, last 30 days 1.58 (1.33 to 1.88) 1.11 (0.89 to 1.38)
Shared rinse water, last 30 days 2.30 (1.93 to 2.74) 2.29 (1.78 to 2.96)***
Injected with prefilled syringes, last 30 days 1.06 (0.88 to 1.28)
Injected methamphetamine-like drugs, last 30 days 1.10 (0.88 to 1.39)
Always injected with sterile syringe, last 30 days 0.99 (0.82 to 1.19)
Used harm reduction services, last 12 months 0.77 (0.61 to 0.98) 0.74 (0.56 to 0.97)*
Ever in treatment for addiction 0.92 (0.76 to 1.10)
Perfect score on HIV knowledge test 0.73 (0.62 to 0.87) 0.78 (0.65 to 0.95)*
***p<0.001, **p<0.01, *p<0.05.
Eritsyan K, Heimer R, Barbour R, et al. BMJ Open 2013;3:e002645. doi:10.1136/bmjopen-2013-002645 7
HIV Prevalence among IDU in eight Russian cities
group.bmj.com on February 26, 2014 - Published by bmjopen.bmj.comDownloaded from

widely separated and divergent Russian cities, provides theclearest picture to date of the Russian HIV epidemic inthis at-risk group. The thrust of the analysis, which isexploratory in nature, seeks to identify the characteristicsat the individual, network and city level that might providesome explanation for the differences in HIV prevalenceacross the eight cities in the Russian Federation. Three dis-tinct features of the epidemic emerge from the analysis.First, among the best explanations for the substantial het-erogeneity in HIV prevalence, is a strong associationbetween the nature of the drug market and HIV preva-lence. Second, is the finding that there appears to beabout a 20% reduction in the likelihood of HIV infectionamong those individuals with greater HIV knowledge anda 25% reduction among those who availed themselves ofsyringe exchange programme (although the latter associ-ation disappeared when drug markets were considered).Third, on the individual-level shared paraphernalia otherthan syringes (in our case—shared rinse water) is animportant factor of HIV transmission. Each of these will beconsidered in the paragraphs below. High prevalence wasnot restricted to any one region of Russia, but was seen incities ranging from Irkutsk in central Siberia (and theeastern and southernmost city in the study) to StPetersburg (the western and northernmost city in thestudy). There was also no apparent association betweenpopulation size and HIV prevalence (Spearman rs=0.407,p>0.05), suggesting that the epidemic was not simply con-centrated in larger cities. Instead, HIV prevalence is
higher in cities in which the form of heroin has made thetransition from homemade to commercial. The explan-ation for this association is unclear, but several non-exclusive possibilities exist.First, it is possible that the relative ease of using com-
mercial heroin—no need to spend time manufacturingthe heroin or to inject large volumes of weak drug solu-tions—has led to increases in the number of IDUs andhence to changes in the social networks whose interrela-tionship and whose injection behaviours may foster thespread of blood-borne viruses. The correlation ofsmaller network sizes across different measures of thenetwork size may be a consequence of market changesin which fewer connections are needed to obtain com-mercial heroin compared with that needed to secure areliable supply of homemade opiates. That many of theinjection risk and network variables are collinear incities where commercial heroin is dominant (as shownin table 5) is supportive of but by no means proof ofsuch a hypothesis. Factors such as the structure, densityand stability of those networks could be the key onesthat lead to differences in HIV-related risks in amongIDU networks.34 35 A second possible explanation lies inthe differences in practices regarding the use of com-mercial and homemade heroin that include how thesedrugs are distributed, prepared and injected. Such phe-nomena have been described in other studies suggestingthat the formulation of heroin can play a significant rolein drug preparation and administration practices linked
Table 4 Association of individual-level, network-level and city-level factors with HIV prevalence in eight Russian cities
Variable Crude OR (95% CI) Adjusted OR (95% CI)
Mean city recruitment chain length 0.99 (0.98 to 0.99) 0.992 (0.989 to 0.995)***
Commercial heroin predominant in city 6.11 (4.53 to 8.24) 3.28 (2.36 to 4.56)***
Amphetamine-type drugs more common 1.29 (1.09 to 1.54) 1.17 (0.94 to 1.45)
RDS network size, last 6 months – 1.0025 (1.001 to 1.004)**
Injected with known HIV+, last 30 days – 1.58 (1.39 to 1.80)***
Shared rinse water, last 30 days – 1.94 (1.58 to 2.37)***
Used harm reduction services, last 12 months – 0.87 (0.66 to 1.16)
Perfect score on HIV knowledge test – 0.79 (0.65 to 0.96)*
*p<0.05, **p<0.01, ***p<0.001.RDS, respondent-driven sampling.
Table 5 Collinearity of city-level commercial heroin predominance and other variables
Variable name Variable level Z statistic p Value
Injected with known HIV+, last 30 days Individual 10.16 <0.00001
Shared sinse water, last 30 days Individual 8.192 <0.00001
Shared cooker Individual −1.713 0.0867
Used harm reduction Services, last 12 months Individual −3.354 <0.00001
Perfect score on HIV Knowledge test Individual 2.461 0.0138
Individuals’ RDS network size Network 1.993 0.0463
Mean city recruitment Chain length City −16.62 <0.00001
Amphetamine-type drugs more common City 1.233 0.218
RDS, respondent-driven sampling.
8 Eritsyan K, Heimer R, Barbour R, et al. BMJ Open 2013;3:e002645. doi:10.1136/bmjopen-2013-002645
HIV Prevalence among IDU in eight Russian cities
group.bmj.com on February 26, 2014 - Published by bmjopen.bmj.comDownloaded from

to the spread of HIV.36–40 Laboratory data simulatingRussian drug preparation practices demonstrated thatHIV is more easily transmitted when using commercialheroin. The replication of homemade heroin produc-tion, based upon ethnographic observations of theprocess, revealed that not only did HIV fail to survivethe manufacturing process but also that somethingextracted during the process reduced the viability ofHIV by 80% when the homemade drug was storedinside syringes contaminated with HIV-infected blood.36
There also appear to be modest protective effects fromincreased HIV knowledge and attendance at harm reduc-tion programmes. The one-fifth reduction in the odds ofbeing HIV positive among those who achieved the highestscore on the HIV knowledge test suggests an important rolefor expanding HIV educational activities targeting IDUs. Asdetailed in many theories of HIV prevention, knowledge isnecessary, but not necessarily sufficient to reduce risk beha-viours and disease transmission.41–43 Knowledge must becomplemented by motivation to reduce risk and access toprevention tools. On the other hand, according to the datapresented herein and from other studies, harm reductionprogrammes in Russia have usually attained insufficientcoverage to be effective in lowering HIV transmission.44 45
This may explain why the degree of protective effect is smalland becomes non-significant once city-level variables areconsidered: although the use of a local SEP may be protect-ive in cities where they exist, their existence itself is a city-level effect. There was no evidence of protective effect fromhaving been in drug abuse treatment, either ever or withinthe past year. This could be considered as an effect ofRussian narcology policy, which is focused on achievingabstinence but not on harm reduction for those who donot achieve sustained remission.46
Our study shows that sharing non-syringe injection para-phernalia is common among Russian IDUs and it signifi-cantly correlates which positive HIV status. This meansthat, along with the need to expand the access to clean syr-inges that is still insufficient due low NSP coverage andIDUs’ negative experience of purchasing syringes from thepharmacies,18 47–50 efforts to reduce sharing of parapher-nalia, including rinsing water, are urgently needed.There are several limitations to this study. Two have to
do with sampling. First, the selection of the eight cities was
arbitrary—no selection method was developed to ensurethat the eight cities were representative of the range ofcharacteristics of IDUs, drug markets or prevention activ-ities found in the Russian Federation. Thus, there is noway to generalise these finding to other Russian cities.Second, although the same recruitment method was usedto accrue samples in each city, the recruitment pattern wascity-specific. This is reflected in the differences in averagechain length, which ranged from 33 in Irkutsk to 112 inChelyabinsk. There is no sampling frame for randomselection within the hidden population of IDUs and noevidence that the samples of IDUs are representative ofthe underlying population from which the sample wasdrawn; therefore, they must be considered conveniencesamples. A major limitation is that its cross-sectional naturemakes the study exploratory rather than being definitelyable to establish causality. The outcome measure of inter-est, HIV prevalence, may have occurred at any time in thepast, whereas the assessment of individual level risk andprotective behaviours, network attributes and heroinmarket features were ascertained for the recent past only.There is a limitation resulting from the data we consideredin our models. As our modelling was hypothesis-driven,variables concerning risky sexual behaviours were notincluded in the models because they failed to predict HIVprevalence in any of the eight cities. A final limitation isthe absence of data on mortality, incarceration and migra-tion of IDU populations. Nevertheless, compared with thepast research, this was conducted in a way that covered thelargest range of Russian cities yet studied.In summary, despite the above limitations, this report,
which is based on the application of common recruit-ment, screening, survey and testing methods, providesthe best snapshot of the current HIV epidemic amongIDUs in Russia. The findings reveal that HIV prevalenceis very high among members of this risk group in severalcities and that the factor that goes farthest in explaininghigh prevalence is the predominance of a commercialheroin market. If a market transition is a pre-requisitefor increasing prevalence, then subsequent surveillanceshould be conducted in the cities that have experiencedthe transition, but still have low prevalence and in thecities that have yet to make this transition. Furthermore,more active prevention programmes are urgently
Table 6 Hierarchical Generalised Logistic Model of HIV prevalence in eight Russian cities
Variable Estimate t value p Value Adjusted OR (95% CI)
Mean city Recruitment chain length 0.0088 −4.729 <0.0001 0.99 (0.987 to 0.994)
Amphetamine-type drugs more common 0.084 0.685 0.49 –
RDS network size, last 6 month 0.0025 −2.898 0.0038 1.003 (1.001 to 1.004)
Injected with known HIV+, last 30 days 0.483 7.197 <0.0001 1.61 (1.41 to 1.84)
Shared rinse water, last 30 days 0.679 6.368 <0.0001 1.96 (1.58 to 2.42)
Used harm Reduction services, last 12 months 0.140 0.937 0.35 –
Perfect score on HIV knowledge test 0.235 −2.231 0.026 0.79 (0.64 to 0.97)
Intercept 1.204 −1.933 0.053 –
Eritsyan K, Heimer R, Barbour R, et al. BMJ Open 2013;3:e002645. doi:10.1136/bmjopen-2013-002645 9
HIV Prevalence among IDU in eight Russian cities
group.bmj.com on February 26, 2014 - Published by bmjopen.bmj.comDownloaded from
needed, including such measures as the increase ofHIV-related knowledge, expanded syringe and sterileequipment access, appropriate addiction treatment,increases in antiretroviral therapy specifically for IDUswho remain the risk group with highest incidence andprevalence and promotion of safer sex and sexual riskreduction among IDUs who are at risk of spreading HIVto their non-drug-using sex partners.
Author affiliations1NGO Stellit, St Petersburg, Russian Federation2Department of Psychology, Saint-Petersburg State University, St Petersburg,Russian Federation3Center for Interdisciplinary Research on AIDS, Yale University, School ofPublic Health, New Haven, Connecticut, USA4Northwest Regional AIDS Center, St Petersburg, Russian Federation
Acknowledgements Authors would like to thank regional organisationswhich participated in data collection: Voronezh AIDS Center, Voronezh NGOAnti-AIDS Center, Irkutsk AIDS Center, Irkutsk NGO ‘ANTI-AIDS Priangar’e’,Irkutsk Red Cross, Chelyabinsk AIDS Center, Chelyabinsk Center Compass,N. Chelny AIDS Center, Timur Islamov Foundation, Yekaterinburg NGO ‘Noviegrani’, Orel NGO ‘Phoenix Plus’, Siberian Interregional organization‘AntiAIDS-Siberia’ and Omsk AIDS Center. Authors would also like to thankDr Natalia Ladnaia for the valuable comments for the first draft of the article.
Contributors KE, OSL, RH, VO, MMR and TTS designed the study. KE, TTSand OSL were responsible for data collection, RH led the analysis with inputfrom RB, RH with input from RB and KE wrote the first draft of themanuscript and all authors contributed to and approved the final version.
Funding The overall work on Voronezh, N.Chelny, Irkutsk and Chelyabinskfor data collection and analysis was implemented within the framework ofWHO Russia HIV/AIDS programme activities and as a part of the UNODC project‘Scaling-up, and improving access to, HIV/AIDS prevention and careprogrammes for injecting drug users and in prison settings of RussianFederation (TD/RUS/J17)’ and performed by NGO Stellit in collaboration withFederal AIDS centre and regional partners. Research in Omsk, Yekaterinburg andOrel was performed by NGO Stellit and regional study partners with financial andtechnical support by Russian Harm Reduction Network (ESVERO). Research inSt Petersburg was carried out by NGO Stellit and North-West AIDS Center withfinancial support by Government of Finland and technical support of UNODCoffice in Russian Federation. Secondary data analysis was supported by grantsfrom the Civilian Research and Development Foundation (RUB7001-ST-08), theU.S. National Institute of Mental Health (5P30MH062294), and the FogartyInternational Center at NIH (5D43TW001028).http://www.icmje.org/coi_disclosure.pdf
Competing interests None.
Ethics approval Obtained from Saint-Petersburg State University (Russia)and Federal State Institution of Science ‘Central Research Institute ofEpidemiology’ by Rospotrebnadzor (Russia)
Provenance and peer review Not commissioned; externally peer reviewed.
Data sharing statement No additional data are available.
REFERENCES1. UNAIDS. The changing HIV/AIDS epidemic in Europe and Central
Asia. Geneva, Switzerland: UNAIDS, 2004.2. UNAIDS. UNAIDS Report on the Global AIDS Epidemic. Geneva,
Switzerland: UNAIDS, 2010.3. Federal AIDS Center. Number of registered HIV-positive among
Russian citizens on 31.12.2011, 2012.4. Goliusov AT, Dementyeva LA, Ladnaya NN, et al. Country Progress
Report of the Russian Federation on the Implementation of theDeclaration of Commitment on HIV/AIDS. Moscow: Federal Servicefor Surveillance of Consumer Rights Protection and HumanWell-Being of the Russian Federation, 2008.
5. National Research Narcology Center. Main indicators of narcologyservices in the Russian Federation in 2008–2009. Moscow, RF:National Research Narcology Center, 2010.
6. Human Rights Watch. Rehabilitation required: Russia’s human rightsobligation to provide evidence-based drug dependence treatment.New York, USA: Human Rights Watch, 2007.
7. UN Office on Drugs and Crime. World drug report, 2009. Vienna,Austria: UNODC, 2009.
8. Wingfield-Hayes R. The heroin epidemic advancing on Russia. BBCRadio 2010.
9. Niccolai LM, Toussova OV, Verevochkin SV, et al. High HIVprevalence, suboptimal HIV testing, and low knowledge ofHIV-positive serostatus among injection drug users inSt. Petersburg, Russia. AIDS Behav 2010;14:932–41.
10. Rhodes T, Lowndes C, Judd A, et al. Explosive spread and highprevalence of HIV infection among injecting drug users in TogliattiCity, Russia. AIDS 2002;16:F25–31.
11. Rhodes T, Platt L, Maximova S, et al. Prevalence of HIV, hepatitis Cand syphilis among injecting drug users in Russia: a multi-city study.Addiction 2006;101:252–66.
12. Chen CY, Lin KM. Health consequences of illegal drug use. CurrOpin Psychiatry 2009;22:287–92.
13. Lelutiu-Weinberger C, Pouget ER, Des Jarlais DD, et al. Ameta-analysis of the hepatitis C virus distribution in diverse racial/ethnic drug injector groups. Soc Sci Med 2009;68:579–90.
14. Thomson BJ. Hepatitis C virus: the growing challenge. Br Med Bull2009;89:153–67.
15. Paintsil E, Verevochkin SV, Dukhovlinova E, et al. Hepatitis C virusinfection among drug injectors in St. Petersburg, Russia: social andmolecular epidemiology of an endemic infection. Addiction2009;104:1881–90.
16. Aceijas C, Rhodes T. Global estimates of prevalence of HCVinfection among injecting drug users. Int J Drug Policy2007;18:352–8.
17. Dehne KL, Khodakevich L, Hamers FF, et al. The HIV/AIDSepidemic in eastern Europe: recent patterns and trends and theirimplication for policy making. AIDS 1999;13:741–9.
18. Heimer R, Booth RE, Irwin KS, et al. In: Twigg JL, ed. HIV/AIDS inRussia and Eurasia. Basingstoke, Hampshire, UK: PalgraveMacmillan, 2007.
19. Rhodes T, Sarang A, Bobrik A, et al. HIV transmission and HIVprevention associated with injecting drug use in the RussianFederation. Int J Drug Policy 2004;15:1–16.
20. Sergeyev B, Oparina T, Rumyantseva TP, et al. HIV Prevention fordrug injectors in Yaroslavl, Russia: a peer-driven intervention andneedle exchange. J Drug Issues 1999;29:777–804.
21. Heimer R, Kinzly ML, He H, et al. The effect of acids on the survivalof HIV during drug injection. J AIDS 2007:144–50.
22. UN Office on Drugs and Crime. World Drug Report, 2004. Vienna,Austria: UNODC, 2004.
23. Paoli L. The development of an illegal market. Drug consumptionand trade in post-Soviet Russia. Br J Criminol 2002;42:21–39.
24. Niccolai LM, Shcherbakova IS, Toussova OV, et al. The potential forbridging of HIV transmission in Russian Federation: sex riskbehaviors and HIV prevalence among drug users (DUs) and theirnon-DU sex partners. J Urban Health 2009;86(Suppl 1):131–43.
25. Platt L, Rhodes T, Hickman M, et al. Changes in HIV prevalenceand risk among new injecting drug users in a Russian city of highHIV prevalence. J AIDS 2008;47:623–31.
26. Shaboltas AV, Toussova OV, Hoffman IF, et al. HIV prevalence,socio-demographic and behavioral correlates and recruitmentmethods among injection drug users in St. Petersburg, Russia.J Acquir Immune Defic Syndr 2006;41:657–63.
27. Heckathorn DD. Respondent-driven sampling; a new approach tothe study of hidden populations. Soc Probl 1997;44:174–99.
28. Heckathorn DD, Semaan S, Broadhead RS, et al. Extensions ofrespondent-driven sampling: a new approach to the study ofinjection drug users aged 18–25. AIDS Behav 2002;6:55–67.
29. Heckathorn D. Respondent driven sampling II: deriving validpopulation estimates from chain-referral samples of hiddenpopulations. Soc Probl 2002;49:11–34.
30. Salganik MJ, Heckathorn DD. Sampling and estimation in hiddenpopulations using respondent-driven sampling. Sociol Methodol2004;34:193–240.
31. Volz E, Heckathorn DD. Probability based estimation theory forrespondent-driven sampling. J Official Stat 2008;24:79–97.
32. Family Health International. Behavioral surveillance surveys:guidelines for repeated behavioral surveys in populations at risk ofHIV. Arlington, VA, 2000.
33. Ronnegard L, Shen X, Alam M. hglm: a package for fittinghierarchical generalized linear models. R J 2010;2:20–8.
10 Eritsyan K, Heimer R, Barbour R, et al. BMJ Open 2013;3:e002645. doi:10.1136/bmjopen-2013-002645
HIV Prevalence among IDU in eight Russian cities
group.bmj.com on February 26, 2014 - Published by bmjopen.bmj.comDownloaded from
34. De P, Cox J, Boivin J, et al. The importance of social networks intheir association to drug equipment sharing among injection drugusers: a review. Addiction 2007;102:1730–9.
35. Neaigus A, Friedman SR, Curtis R, et al. The relevance of druginjectors’ social and risk networks for understanding and preventingHIV infection. Soc Sci Med 1994;38:67–78.
36. Abdala N, Grund J-PC, Tolstov Y, et al. Can homemade injectableopiates contribute to the HIV epidemic among injection drug users inthe countries of the former Soviet Union? Addiction 2006;101:731–7.
37. Ciccarone D. Heroin in brown, black and white: structural factors andmedical consequences in the US heroin market. Int J Drug Policy2009;20:277–82.
38. Ciccarone D, Bourgois P. Explaining the geographical variation ofHIV among injection drug users in the United States. Subst UseMisuse 2003;38:2049–63.
39. Clatts MC, Heimer R, Abdala N, et al. Illicit drug injection and HIV-1transmission: heating drug solutions may inactive HIV-1. J AquirImmune Defic Syndr 1999;22:194–9.
40. de la Fuente L, Saavedra P, Barrio G, et al. Temporal andgeographic variations in the characteristics of heroin seized in Spainand their relation with the route of administration. Drug AlcoholDepend 1996;40:185–94.
41. Avants SK, Warburton LA, Hawkins KA, et al. Continuation ofhigh-risk behavior by HIV-positive drug users. Treatmentimplications. J Subst Abuse Treat 2000;19:15–22.
42. Fisher JD, Fisher WA. Changing AIDS risk behavior. Psychol Bull1992;111:455–74.
43. Prochaska JO, Redding CA, Harlow LL, et al. The transtheoreticalmodel of change and HIV prevention: a review. Health Educ Q1992;21:471–86.
44. Burrows D, Sarang A. Mixed signals: responses to HIV/AIDS in theRussian Federation. Washington, DC: The World Bank, 2004.
45. Sarang A, Stuikyte R, Bykov R. Implementation of harm reduction inCentral and Eastern Europe and Central Asia. Int J Drug Policy2007;18:129–35.
46. Torban MN, Heimer R, Ilyuk RD, et al. Practices and attitudes ofaddiction treatment providers in the Russian Federation. J AddictRes Ther 2011;2.
47. Csete J. Lessons not learned: human rights abuses and HIV/AIDSin the Russian Federation. Hum Rights Watch 2004;16:1–62.
48. Fedorova EV, Skochilov RV, Heimer R, et al. Access to syringes forHIV prevention for injection drug user in St. Petersburg, Russia:syringe purchase test study. BMC Public Health 2013;epub ahead ofprint:13:183.
49. Sarang A, Rhodes T, Sheon N, et al. Policing drug users in Russia:risk, fear, and structural violence. Subst Use Misuse 2010;45:813–64.
50. Sarang A, T R, Platt L. Access to syringes in three Russian cities:implications for syringe distribution and coverage. Int J Drug Policy2008;19(Suppl 1):25–36.
Eritsyan K, Heimer R, Barbour R, et al. BMJ Open 2013;3:e002645. doi:10.1136/bmjopen-2013-002645 11
HIV Prevalence among IDU in eight Russian cities
group.bmj.com on February 26, 2014 - Published by bmjopen.bmj.comDownloaded from

doi: 10.1136/bmjopen-2013-002645 2013 3: BMJ Open
Ksenia Eritsyan, Robert Heimer, Russell Barbour, et al. Russian cities: a cross-sectional studyamong people who inject drugs in eightfactors associated with HIV prevalence Individual-level, network-level and city-level
http://bmjopen.bmj.com/content/3/6/e002645.full.htmlUpdated information and services can be found at:
These include:
References http://bmjopen.bmj.com/content/3/6/e002645.full.html#ref-list-1
This article cites 35 articles, 2 of which can be accessed free at:
Open Access
http://creativecommons.org/licenses/by-nc/3.0/legalcodehttp://creativecommons.org/licenses/by-nc/3.0/ and compliance with the license. See:work is properly cited, the use is non commercial and is otherwise in use, distribution, and reproduction in any medium, provided the originalCreative Commons Attribution Non-commercial License, which permits This is an open-access article distributed under the terms of the
serviceEmail alerting
the box at the top right corner of the online article.Receive free email alerts when new articles cite this article. Sign up in
CollectionsTopic
(573 articles)Public health � (204 articles)Infectious diseases �
(70 articles)HIV AIDS � (635 articles)Epidemiology �
(44 articles)Addiction � Articles on similar topics can be found in the following collections
http://group.bmj.com/group/rights-licensing/permissionsTo request permissions go to:
http://journals.bmj.com/cgi/reprintformTo order reprints go to:
http://group.bmj.com/subscribe/To subscribe to BMJ go to:
group.bmj.com on February 26, 2014 - Published by bmjopen.bmj.comDownloaded from

Notes
http://group.bmj.com/group/rights-licensing/permissionsTo request permissions go to:
http://journals.bmj.com/cgi/reprintformTo order reprints go to:
http://group.bmj.com/subscribe/To subscribe to BMJ go to:
group.bmj.com on February 26, 2014 - Published by bmjopen.bmj.comDownloaded from