Benchmarking a 2018 Toyota Camry UB80E Eight-Speed ...
13
2020-01-1286 Published 14 Apr 2020 INTERNATIONAL. Downloaded from SAE International by Andrew Moskalik, Wednesday, March 25, 2020 Benchmarking a 2018 Toyota Camry UB80E Eight-Speed Automatic Transmission Andrew Moskalik, Mark Stuhldreher, and John Kargul US Environmental Protection Agency Citation: Moskalik, A., Stuhldreher, M., and Kargul, J., “Benchmarking a 2018 Toyota Camry UB80E Eight-Speed Automatic Transmission,” SAE Technical Paper 2020-01-1286, 2020, doi:10.4271/2020-01-1286. Abstract A s part of the U.S. Environmental Protection Agency’s (EPA’s) continuing assessment of advanced light-duty automotive technologies in support of regulatory and compliance programs, a 2018 Toyota Camry front wheel drive eight-speed automatic transmission was benchmarked. Te benchmarking data were used as inputs to EPA’s Advanced Light-duty Powertrain and Hybrid Analysis (ALPHA) vehicle simulation model to estimate GHG emissions from light- duty vehicles. ALPHA requires both detailed engine fuel consumption maps and transmission torque loss maps. EPA’s National Vehicle and Fuels Emissions Laboratory has developed a streamlined, cost-efective in-house method of transmission testing, capable of gathering a dataset sufcient to characterize transmissions within ALPHA. Tis testing methodology targets the range of transmission operation observed during vehicle testing over EPA’s city and highway drive cycles. Introduction and Background T he National Center for Advanced Technology (NCAT), part of EPA’s National Vehicle and Fuel Emissions Laboratory, leads a team that assesses the efectiveness of advanced low emission and low fuel consumption technolo- gies by benchmarking a broad range of key light-duty vehicles, engines and transmissions. Te NCAT team benchmarks advanced technologies using laboratory test methods to char- acterize engine controls, fuel consumption, emissions, and component losses [1, 2, 3, 4, 5, 6, 7, 8, 9]. NCAT leverages in-depth, detailed engineering analyses along with extensive engine and chassis dynamometer labora- tory testing to evaluate advanced vehicle, engine and transmis- sion technologies. Te test data are used for a variety of purposes, including documenting transmission performance in complete transmission maps, performing technical analyses regarding technology efectiveness, and providing information for full vehicle simulations using EPA’s Advanced Light-Duty Powertrain and Hybrid Analysis (ALPHA) tool [10, 11, 12]. Both laboratory test data and ALPHA simulation results continue to be used to With this method, the transmission is tested as a complete system, as opposed to disassembling the transmission compo- nents and testing each separately. Tis paper describes the benchmarking process used to gather transmission data and the test results obtained. A UB80E eight-speed automatic transmission from a 2018 Toyota Camry was installed in an engine dynamometer test cell along with a 4-cylinder 2.5L A25A-FKS engine from the same vehicle. Te test dataset collected from the transmission includes gear efciencies, torque converter slippage and K factors, spin losses, oil temperature and pressure, and CAN bus data. Te transmission data collected with this benchmarking method were used as inputs to the ALPHA full vehicle simula- tion model. ALPHA simulation results were validated using vehicle chassis dynamometer test data from the 2018 Toyota Camry containing this engine and transmission. Te ALPHA simulation also allowed the Toyota UB80E transmission to be compared to other benchmarked transmissions. support evaluation of light-duty vehicle fuel economy, green- house gas and criteria pollutant emissions, and the divergence between laboratory test results and actual in-use emissions. Tis paper provides an overview of EPA’s complete bench- marking work on the 2018 Toyota Camry eight-speed trans- mission. To perform this work, a streamlined benchmarking method was used to test a UB80E eight-speed transmission from a 2018 Toyota Camry coupled to a 2.5L 4-cylinder A25A-FKS engine from the same vehicle. Te engine and transmission were mounted in an engine dynamometer test cell and tethered with a lengthened engine wiring harness to a complete vehicle outside the test cell. Tis benchmarking process allowed both the engine and transmission mapping to be conducted at EPA’s laboratory using the stock ECU and TCU with their factory production calibrations. Additional information on benchmarking of the Toyota Camry A25A-FKS engine can be found in an associated paper [1]. Data from both benchmarking tests were subsequently confgured as engine and transmission inputs for ALPHA, and a validation of the 2018 Camry was performed in the ALPHA
-
Upload
khangminh22 -
Category
Documents
-
view
7 -
download
0
Transcript of Benchmarking a 2018 Toyota Camry UB80E Eight-Speed ...
2020-01-1286 Published 14 Apr 2020
INTERNATIONAL.
Downloaded from SAE International by Andrew Moskalik, Wednesday, March 25, 2020
Benchmarking a 2018 Toyota Camry UB80E Eight-Speed Automatic Transmission Andrew Moskalik, Mark Stuhldreher, and John Kargul US Environmental Protection Agency
Citation: Moskalik, A., Stuhldreher, M., and Kargul, J., “Benchmarking a 2018 Toyota Camry UB80E Eight-Speed Automatic Transmission,” SAE Technical Paper 2020-01-1286, 2020, doi:10.4271/2020-01-1286.
Abstract
As part of the U.S. Environmental Protection Agency’s (EPA’s) continuing assessment of advanced light-duty automotive technologies in support of regulatory and
compliance programs, a 2018 Toyota Camry front wheel drive eight-speed automatic transmission was benchmarked. Te benchmarking data were used as inputs to EPA’s Advanced Light-duty Powertrain and Hybrid Analysis (ALPHA) vehicle simulation model to estimate GHG emissions from light-duty vehicles.
ALPHA requires both detailed engine fuel consumption maps and transmission torque loss maps. EPA’s National Vehicle and Fuels Emissions Laboratory has developed a streamlined, cost-efective in-house method of transmission testing, capable of gathering a dataset sufcient to characterize transmissions within ALPHA. Tis testing methodology targets the range of transmission operation observed during vehicle testing over EPA’s city and highway drive cycles.
Introduction and Background
The National Center for Advanced Technology (NCAT), part of EPA’s National Vehicle and Fuel Emissions Laboratory, leads a team that assesses the efectiveness
of advanced low emission and low fuel consumption technolo-gies by benchmarking a broad range of key light-duty vehicles, engines and transmissions. Te NCAT team benchmarks advanced technologies using laboratory test methods to char-acterize engine controls, fuel consumption, emissions, and component losses [1, 2, 3, 4, 5, 6, 7, 8, 9].
NCAT leverages in-depth, detailed engineering analyses along with extensive engine and chassis dynamometer labora-tory testing to evaluate advanced vehicle, engine and transmis-sion technologies. Te test data are used for a variety of purposes, including documenting transmission performance in complete transmission maps, performing technical analyses regarding technology efectiveness, and providing information for full vehicle simulations using EPA’s Advanced Light-Duty Powertrain and Hybrid Analysis (ALPHA) tool [10, 11, 12]. Both laboratory test data and ALPHA simulation results continue to be used to
With this method, the transmission is tested as a complete system, as opposed to disassembling the transmission compo-nents and testing each separately. Tis paper describes the benchmarking process used to gather transmission data and the test results obtained. A UB80E eight-speed automatic transmission from a 2018 Toyota Camry was installed in an engine dynamometer test cell along with a 4-cylinder 2.5L A25A-FKS engine from the same vehicle. Te test dataset collected from the transmission includes gear efciencies, torque converter slippage and K factors, spin losses, oil temperature and pressure, and CAN bus data.
Te transmission data collected with this benchmarking method were used as inputs to the ALPHA full vehicle simula-tion model. ALPHA simulation results were validated using vehicle chassis dynamometer test data from the 2018 Toyota Camry containing this engine and transmission. Te ALPHA simulation also allowed the Toyota UB80E transmission to be compared to other benchmarked transmissions.
support evaluation of light-duty vehicle fuel economy, green-house gas and criteria pollutant emissions, and the divergence between laboratory test results and actual in-use emissions.
Tis paper provides an overview of EPA’s complete bench-marking work on the 2018 Toyota Camry eight-speed trans-mission. To perform this work, a streamlined benchmarking method was used to test a UB80E eight-speed transmission from a 2018 Toyota Camry coupled to a 2.5L 4-cylinder A25A-FKS engine from the same vehicle. Te engine and transmission were mounted in an engine dynamometer test cell and tethered with a lengthened engine wiring harness to a complete vehicle outside the test cell. Tis benchmarking process allowed both the engine and transmission mapping to be conducted at EPA’s laboratory using the stock ECU and TCU with their factory production calibrations. Additional information on benchmarking of the Toyota Camry A25A-FKS engine can be found in an associated paper [1].
Data from both benchmarking tests were subsequently confgured as engine and transmission inputs for ALPHA, and a validation of the 2018 Camry was performed in the ALPHA
BENCHMARKING A 2018 TOYOTA CAMRY UB80E EIGHT-SPEED AUTOMATIC TRANSMISSION
2
Downloaded from SAE International by Andrew Moskalik, Wednesday, March 25, 2020
model. Results from the 2018 Camry’s chassis dynamometer tests were then used to validate the data from the engine and transmis-sion benchmarking. While a complete analysis of the results of the 2018 Camry model validation is outside the scope of this paper, the ALPHA validation results are provided to inform the discussion. Additional details on ALPHA simulations in general can be found in previously published papers [2, 3, 4, 11, 12, 13].
Finally, the ALPHA tool was used to compare the Camry’s UB80E transmission and its losses to previously benchmarked and modeled transmissions to characterize their technical and performance diferences over standard regulatory cycles.
Description of Test Article and Setup Te 2018 Toyota Camry engine and transmission used in this project were a 4-cylinder 2.5L A25A-FKS engine and a UB80E eight-speed automatic transmission (AT) [14]. Table 1 summa-rizes information that describes the vehicle and engine used in this test program.
Te UB80E is a front-wheel drive eight-speed automatic transmission, described as a Direct Shif 8-speed ECT-i auto-matic with sequential shif mode [14]. Te transmission, devel-oped by Toyota with Aisin AW [15], has a torque capacity of 280 Nm [16]. A similar transmission (designated UA80) with a higher torque capacity is described in reference [17]. Te gear ratios for the UB80E transmission are given in Table 2.
TABLE 1 Summary of vehicle and engine identifcation information. Regulatory test parameters and test results for this vehicle are given in Tables 8 and 10.
Vehicle (MY, Make, Model) 2018 Toyota Camry
Vehicle Identifcation Number JTNB11HKXJ3007695
Engine (displacement, name) 2.5L A25A-FKS four-cylinder
Rated Power 151 kW @ 6600 RPM
Rated Torque 249 Nm @ 4800 RPM
Recommended Fuel 87 octane Anti-Knock Index (AKI)
Transmission UB80E eight-speed AT US Environmental Protection Agency.
TABLE 2 Gear ratios for the Toyota Camry UB80E eight speed automatic transmission [14].
Gear Ratio First 5.250
Second 3.028
Third 1.950
Fourth 1.456
Fifth 1.220
Sixth 1.000
Seventh 0.808
Eighth 0.673
Reverse 4.014
Diferential 2.802 US Environmental Protection Agency.
Test Site and Data Collection Testing was performed in a light-duty engine dynamometer test cell located at the National Vehicle Fuels and Emissions Laboratory (NVFEL) in Ann Arbor, Michigan. Tis test cell was equipped with a Meidensha AC dynamometer and dual HBM torque sensors for data collection.
Test cell data acquisition and dynamometer control were performed by iTest, a sofware package developed by A&D Technology, Inc. Test cell data including temperatures, pres-sures, speed and torque were logged by iTest at a 10 Hz data rate. Engine and transmission ECU inputs and outputs were measured using RPECS, a hardware and sofware package for engine control and supplemental data acquisition developed by Southwest Research Institute. Te RPECS system was synchronized to the engine speed and samples data in the crank angle domain. RPECS data was logged by iTest via an Ethernet connection and combined with other test cell data into a single output fle.
Engine and Transmission System and TetheredWire Harness A production Toyota Camry 2.5L A25A-FKS engine was used to support this transmission testing. Specifc details for the engine setup and testing are described in reference [1]. Te chassis throttle pedal inputs were used to control engine torque during testing by duplicating the production vehicle throttle pedal signals and controlling them with the iTest dyno control.
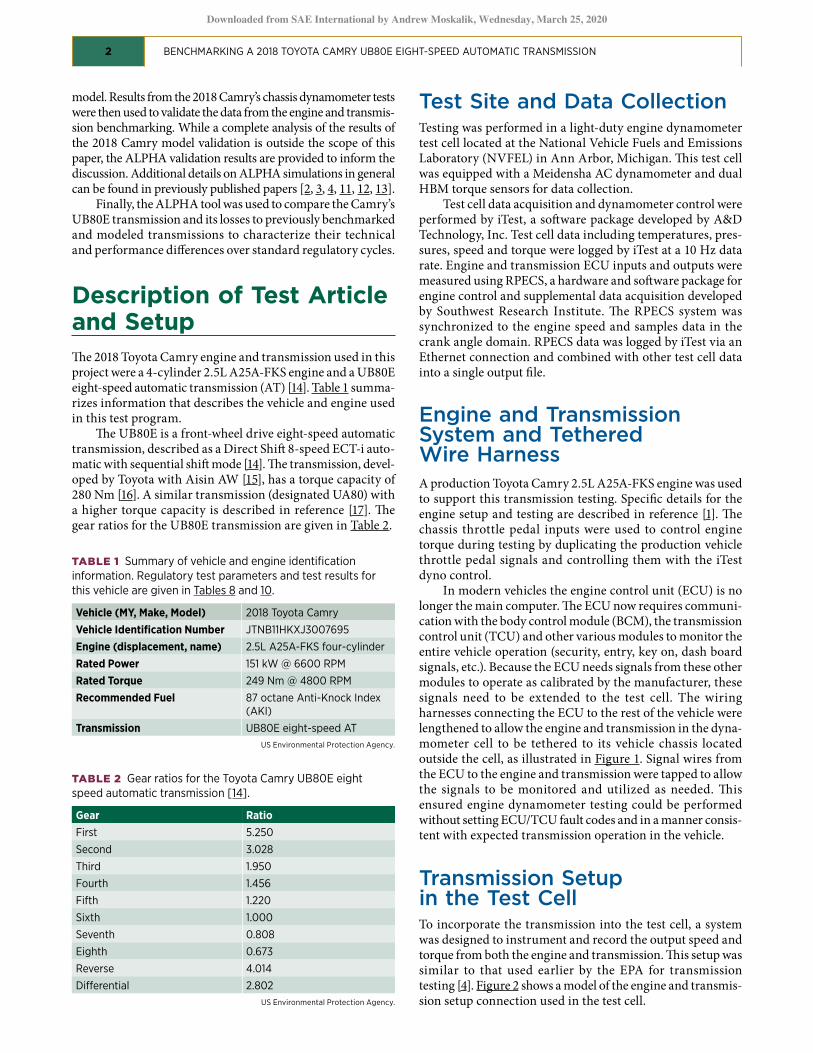
In modern vehicles the engine control unit (ECU) is no longer the main computer. Te ECU now requires communi-cation with the body control module (BCM), the transmission control unit (TCU) and other various modules to monitor the entire vehicle operation (security, entry, key on, dash board signals, etc.). Because the ECU needs signals from these other modules to operate as calibrated by the manufacturer, these signals need to be extended to the test cell. The wiring harnesses connecting the ECU to the rest of the vehicle were lengthened to allow the engine and transmission in the dyna-mometer cell to be tethered to its vehicle chassis located outside the cell, as illustrated in Figure 1. Signal wires from the ECU to the engine and transmission were tapped to allow the signals to be monitored and utilized as needed. Tis ensured engine dynamometer testing could be performed without setting ECU/TCU fault codes and in a manner consis-tent with expected transmission operation in the vehicle.
Transmission Setup in the Test Cell To incorporate the transmission into the test cell, a system was designed to instrument and record the output speed and torque from both the engine and transmission. Tis setup was similar to that used earlier by the EPA for transmission testing [4]. Figure 2 shows a model of the engine and transmis-sion setup connection used in the test cell.
BENCHMARKING A 2018 TOYOTA CAMRY UB80E EIGHT-SPEED AUTOMATIC TRANSMISSION
-
RPECS
Engine
!TEST
Log Data
Tq con lockup soleno d
D Transmission
-Dyna
Torque sensor
Cable PRNDL ti,,-+--• control
Torque sensor and spacer
Transmission
Engine
-Torque converter
Flex plate
-
Torque
sensor
Spacer Flywheel w ith ri ng gear
Ada pter plate
3
Downloaded from SAE International by Andrew Moskalik, Wednesday, March 25, 2020
FIGURE 1 Schematic of the engine and transmission FIGURE 3 Transmission inline torque sensor and tethered to the vehicle with an extended wire harness. spacers assembly.
US
Envi
ronm
enta
l Pro
tect
ion
Age
ncy.
US Environmental Protection Agency.
FIGURE 2 Test cell model with engine, transmission, and driveline main components.
US
Envi
ronm
enta
l Pro
tect
ion
Age
ncy.
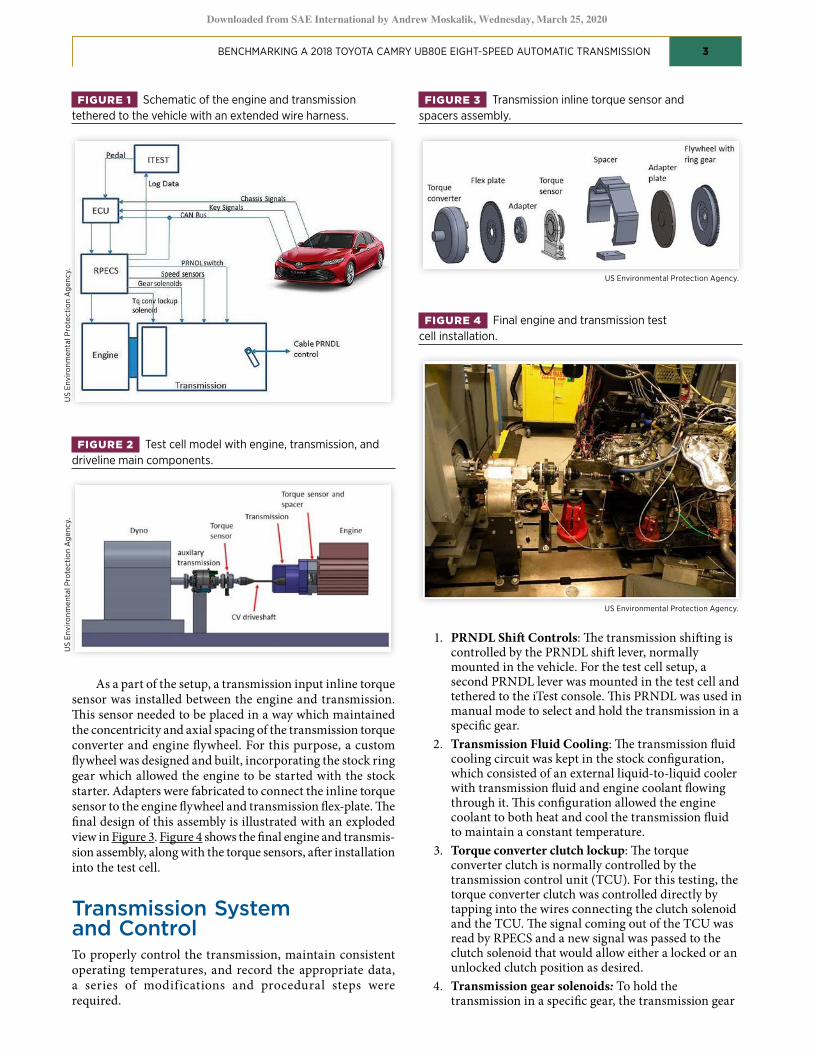
As a part of the setup, a transmission input inline torque sensor was installed between the engine and transmission. Tis sensor needed to be placed in a way which maintained the concentricity and axial spacing of the transmission torque converter and engine fywheel. For this purpose, a custom fywheel was designed and built, incorporating the stock ring gear which allowed the engine to be started with the stock starter. Adapters were fabricated to connect the inline torque sensor to the engine fywheel and transmission fex-plate. Te fnal design of this assembly is illustrated with an exploded view in Figure 3. Figure 4 shows the fnal engine and transmis-sion assembly, along with the torque sensors, afer installation into the test cell.
Transmission System and Control To properly control the transmission, maintain consistent operating temperatures, and record the appropriate data,
FIGURE 4 Final engine and transmission test cell installation.
US Environmental Protection Agency.
1. PRNDL Shif Controls: Te transmission shifing is controlled by the PRNDL shif lever, normally mounted in the vehicle. For the test cell setup, a second PRNDL lever was mounted in the test cell and tethered to the iTest console. Tis PRNDL was used in manual mode to select and hold the transmission in a specifc gear.
2. Transmission Fluid Cooling: Te transmission fuid cooling circuit was kept in the stock confguration, which consisted of an external liquid-to-liquid cooler with transmission fuid and engine coolant fowing through it. Tis confguration allowed the engine coolant to both heat and cool the transmission fuid to maintain a constant temperature.
3. Torque converter clutch lockup: Te torque converter clutch is normally controlled by the transmission control unit (TCU). For this testing, the torque converter clutch was controlled directly by tapping into the wires connecting the clutch solenoid and the TCU. Te signal coming out of the TCU was read by RPECS and a new signal was passed to the clutch solenoid that would allow either a locked or an unlocked clutch position as desired.
a series of modifications and procedural steps were 4. Transmission gear solenoids: To hold the required. transmission in a specifc gear, the transmission gear
BENCHMARKING A 2018 TOYOTA CAMRY UB80E EIGHT-SPEED AUTOMATIC TRANSMISSION
-18 --+-3000rpm
16 ---+-- 2500 rpm
14
f12 ~10 _g QI 8 ::,
!: 6 ,2
4
2
0
0 50
-12 ~
10
0
Fourth Gear
100 150 Input Torque (Nm)
- Third Gear
- Sixth Gear
- Eighth Gear
30 40 50 60 70 80 Temperature (degrees C)
200 250
90 100
´
4
Downloaded from SAE International by Andrew Moskalik, Wednesday, March 25, 2020
US
Envi
ronm
enta
l Pro
tect
ion
Age
ncy.
U
S En
viro
nmen
tal P
rote
ctio
n A
genc
y.
solenoids were controlled directly by the RPECS, which emulated the stock control signals.
5. Auxiliary transmission: Te transmission was tested as a complete unit, including the diferential gear assembly. With the diferential in place, the transmission output torque is much higher than the test cell dynamometer can absorb, so an auxiliary transmission was installed between the transmission under test and the dynamometer. Te auxiliary transmission had a 3.8:1 ratio to transform the speed and torque to a range that the dynamometer could absorb (see Figure 2).
6. Driveshaf: Te test transmission was connected to the auxiliary transmission with the stock CV shaf (see Figure 2). Te transmission diferential was modifed to lock the spider gears, so a single output shaf could be used.
Transmission Testing Procedure A series of tests were performed to determine the losses and operational characteristics of the transmission. Te testing process was generally similar to that followed earlier by the EPA for transmission testing [4]. Te test data collected included:
• total efciency in each gear at a constant temperature
• estimation of the efect of temperature on torque losses
• torque converter K factor
• required idle torque
• transmission coastdown losses
Te following subsections cover each test procedure and data set individually.
Transmission TorqueLoss/Efciency Testing Te transmission gearbox efciency test was performed afer the transmission was heated to a constant temperature between 85 °C and 90 °C. While at temperature, the transmis-sion was held in a selected gear and the torque converter was locked up. The transmission input speed and load were controlled to a fxed value, and the speed and load of both the transmission input shaf and output shaf were logged at a 10 Hz sampling frequency for 10 seconds, then averaged to create a single average data point. From the collected data, the input torque loss was calculated according to Equation (1).
æ Torque Out Speed Out´ ö Torque Loss = - ÷´ ç1 Torque In (1)
Torque In ́ Speed Inè ø
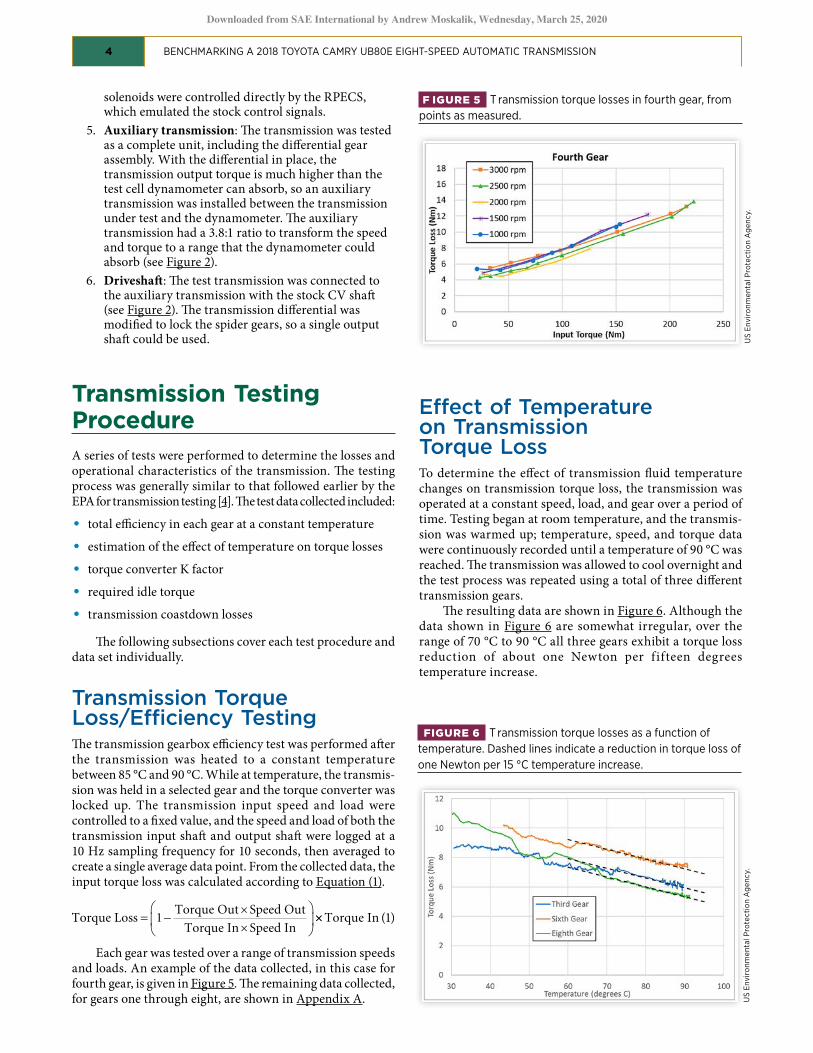
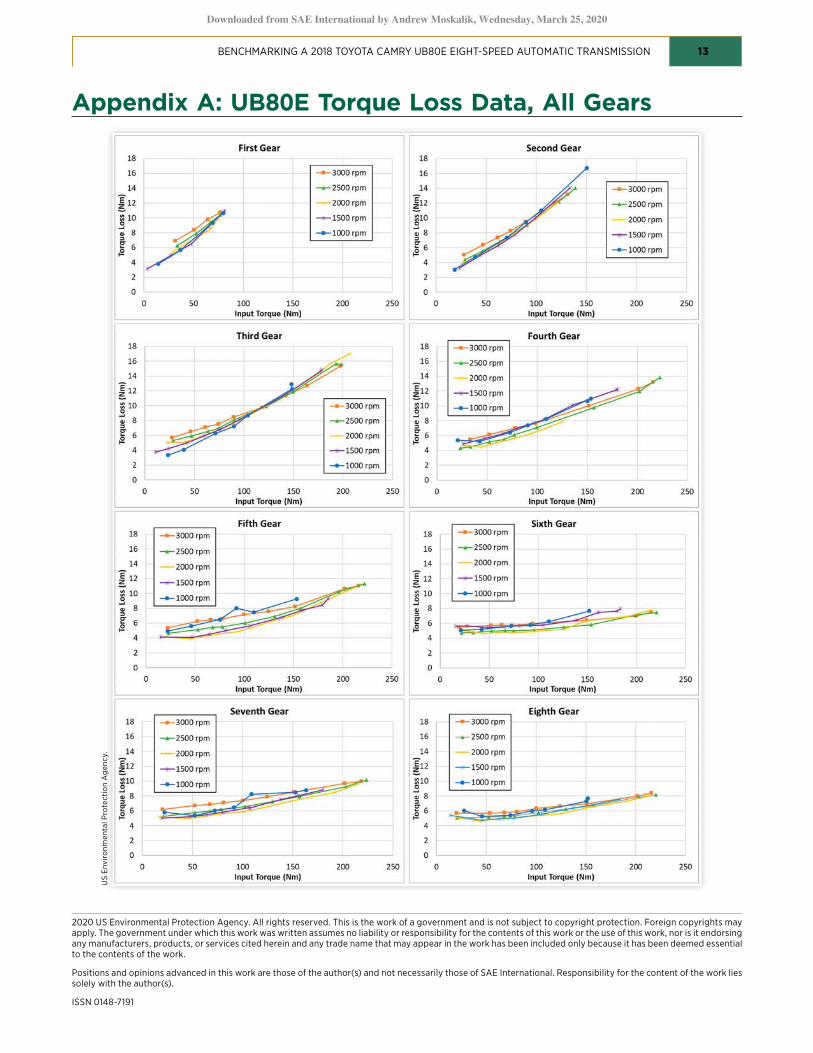
Each gear was tested over a range of transmission speeds and loads. An example of the data collected, in this case for fourth gear, is given in Figure 5. Te remaining data collected, for gears one through eight, are shown in Appendix A.
F IGURE 5 Transmission torque losses in fourth gear, from points as measured.
Efect of Temperature on Transmission Torque Loss To determine the efect of transmission fuid temperature changes on transmission torque loss, the transmission was operated at a constant speed, load, and gear over a period of time. Testing began at room temperature, and the transmis-sion was warmed up; temperature, speed, and torque data were continuously recorded until a temperature of 90 °C was reached. Te transmission was allowed to cool overnight and the test process was repeated using a total of three diferent transmission gears.
Te resulting data are shown in Figure 6. Although the data shown in Figure 6 are somewhat irregular, over the range of 70 °C to 90 °C all three gears exhibit a torque loss reduction of about one Newton per fifteen degrees temperature increase.
FIGURE 6 Transmission torque losses as a function of temperature. Dashed lines indicate a reduction in torque loss of one Newton per 15 °C temperature increase.
BENCHMARKING A 2018 TOYOTA CAMRY UB80E EIGHT-SPEED AUTOMATIC TRANSMISSION
- --------9
_ 8 E ~7 "' :,
E" 6 ~ '5 5 s-:, 04 C: 0 -~ 3 .E :£ 2 ~ .... 1
0
0 100 200 300 400 500 600 700 800
Transmission Output Speed (rpm)
.J
-Fourth Gear
18
16
14
E 12 ~ "' 10 "' --1200rpm .3 ., 8 --1400rpm --1600rpm ::, C'
6 --1800rpm --2000rpm
~ --2200rpm -- 2400rpm 4
--2600rpm --2800rpm 2 --3000rpm --3200rpm
0
0 so 100 150 200 250
lmput Torque (Nm)
5
Downloaded from SAE International by Andrew Moskalik, Wednesday, March 25, 2020
Torque Converter Stall Speed/K Factor Testing A stall speed test was conducted by holding the transmission in a selected gear (sixth), with the torque converter unlocked and the transmission output speed held to zero. Te transmis-sion temperature was held constant near 90 °C. Te pedal input signal to the engine was increased, increasing both engine speed and load, until the maximum signal was reached. At this point, the engine speed (the “stall speed”) and shaf load were recorded. Te data were used to determine the K factor (Equation 2), a semi-dimensionless parameter commonly used in industry to compare torque converters with the same diameter and fuid properties.
Input Speed K Factor = (2)
Torque In
Two tests were completed, with the resulting measure-ments shown in Table 4.
Idle Torque Testing Te engine torque required at idle to overcome transmission drag was also tested. Tis test was conducted by idling the engine, holding the transmission output speed to zero, unlocking the torque converter, and placing the transmis-sion either in drive or in neutral. Te transmission tempera-ture was held constant at 85 °C. Te results are shown in Table 5.
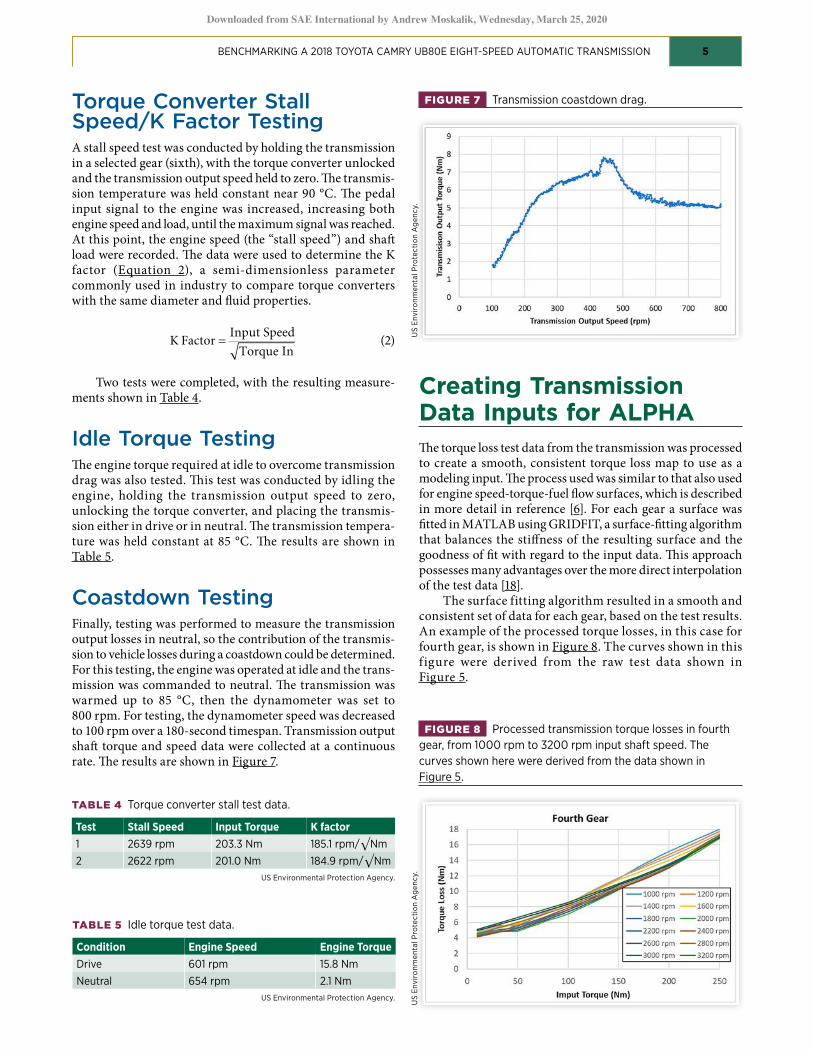
Coastdown Testing Finally, testing was performed to measure the transmission output losses in neutral, so the contribution of the transmis-sion to vehicle losses during a coastdown could be determined. For this testing, the engine was operated at idle and the trans-mission was commanded to neutral. Te transmission was warmed up to 85 °C, then the dynamometer was set to 800 rpm. For testing, the dynamometer speed was decreased to 100 rpm over a 180-second timespan. Transmission output shaf torque and speed data were collected at a continuous rate. Te results are shown in Figure 7.
TABLE 4 Torque converter stall test data.
Test Stall Speed Input Torque K factor 1 2639 rpm 203.3 Nm 185.1 rpm/√Nm
2 2622 rpm 201.0 Nm 184.9 rpm/√Nm US Environmental Protection Agency.
TABLE 5 Idle torque test data.
Condition Engine Speed Engine Torque Drive 601 rpm 15.8 Nm
Neutral 654 rpm 2.1 Nm US Environmental Protection Agency.
FIGURE 7 Transmission coastdown drag.
US
Envi
ronm
enta
l Pro
tect
ion
Age
ncy.
Creating Transmission Data Inputs for ALPHA Te torque loss test data from the transmission was processed to create a smooth, consistent torque loss map to use as a modeling input. Te process used was similar to that also used for engine speed-torque-fuel fow surfaces, which is described in more detail in reference [6]. For each gear a surface was ftted in MATLAB using GRIDFIT, a surface-ftting algorithm that balances the stifness of the resulting surface and the goodness of ft with regard to the input data. Tis approach possesses many advantages over the more direct interpolation of the test data [18].
The surface fitting algorithm resulted in a smooth and consistent set of data for each gear, based on the test results. An example of the processed torque losses, in this case for fourth gear, is shown in Figure 8. The curves shown in this figure were derived from the raw test data shown in Figure 5.
FIGURE 8 Processed transmission torque losses in fourth gear, from 1000 rpm to 3200 rpm input shaft speed. The curves shown here were derived from the data shown in Figure 5.
US
Envi
ronm
enta
l Pro
tect
ion
Age
ncy.
BENCHMARKING A 2018 TOYOTA CAMRY UB80E EIGHT-SPEED AUTOMATIC TRANSMISSION
-18
16
14
E 12 ~ ~ 10 .s QI 8 ::, C"
,2 6
4
2
0
0 so
UBSOE Torque Losses
--Fourth
- Sixth - Seventh - Eighth
100 150 Input Torque (Nm)
200 250
-18
16
14
E 12 ~ ~ 10 .s QI 8 ::,
!'. 6 ,2
4
2
0
0
84SRE Torque Losses
Gear
- Second --Third --Fourth
- Sixth --Seventh - Eighth
100 200 300 400 Input Torque (Nm)
6
Downloaded from SAE International by Andrew Moskalik, Wednesday, March 25, 2020
FIGURE 9 Average UB80E transmission torque losses in all TABLE 6 Comparison of gear ratios and torque limits for the gears, averaged from 1000 rpm to 3200 rpm input Toyota UB80E eight-speed AT (from Table 2), Chrysler 845RE shaft speed. eight-speed AT [21], and GM 6T40 six-speed AT [22].
US
Envi
ronm
enta
l Pro
tect
ion
Age
ncy.
Gear Ratios UB80E 845RE 6T40 First 5.250 4.717 4.584
Second 3.028 3.143 2.964
Third 1.950 2.106 1.912
Fourth 1.456 1.667 1.446
Fifth 1.220 1.285 1.000
Sixth 1.000 1.000 0.746
Seventh 0.808 0.893 -
Eighth 0.673 0.667 -
Reverse 4.014 3.295 2.940
Diferential 2.802 - 2.89
Torque Capacity 280 Nm 450 Nm 240 Nm
US
Envi
ronm
enta
l Pro
tect
ion
Age
ncy.
U
S En
viro
nmen
tal P
rote
ctio
n A
genc
y.
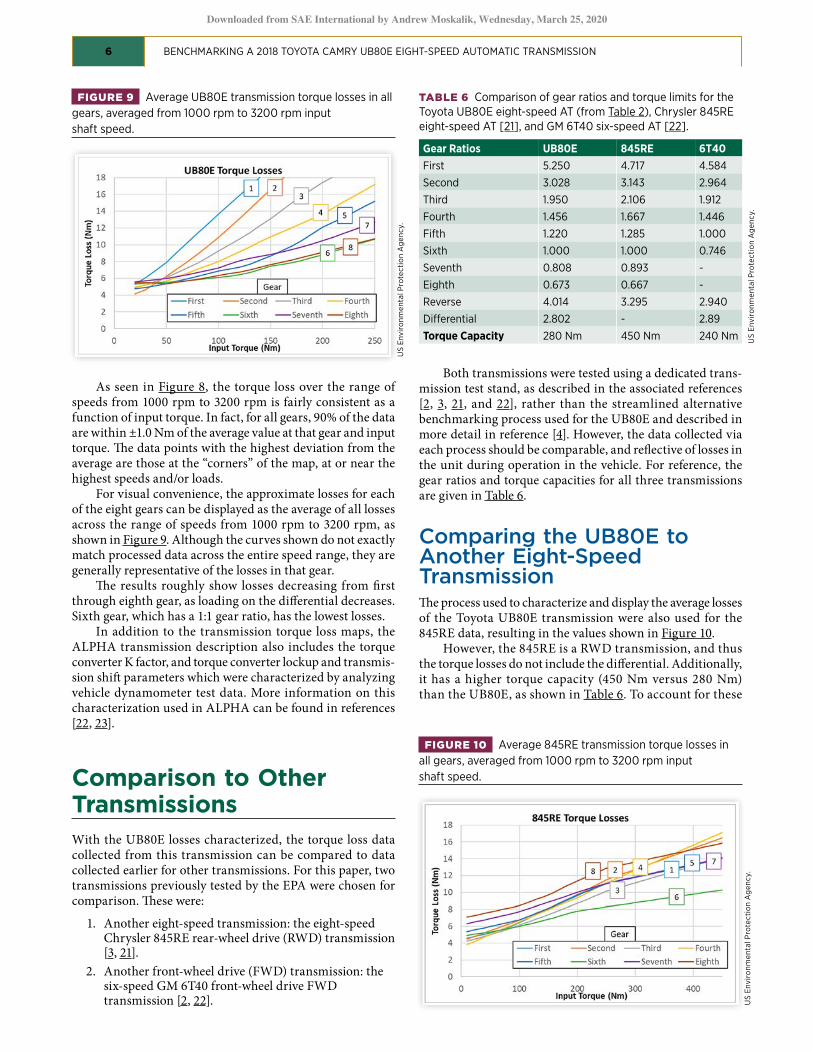
As seen in Figure 8, the torque loss over the range of speeds from 1000 rpm to 3200 rpm is fairly consistent as a function of input torque. In fact, for all gears, 90% of the data are within ±1.0 Nm of the average value at that gear and input torque. Te data points with the highest deviation from the average are those at the “corners” of the map, at or near the highest speeds and/or loads.
For visual convenience, the approximate losses for each of the eight gears can be displayed as the average of all losses across the range of speeds from 1000 rpm to 3200 rpm, as shown in Figure 9. Although the curves shown do not exactly match processed data across the entire speed range, they are generally representative of the losses in that gear.
Te results roughly show losses decreasing from frst through eighth gear, as loading on the diferential decreases. Sixth gear, which has a 1:1 gear ratio, has the lowest losses.
In addition to the transmission torque loss maps, the ALPHA transmission description also includes the torque converter K factor, and torque converter lockup and transmis-sion shif parameters which were characterized by analyzing vehicle dynamometer test data. More information on this characterization used in ALPHA can be found in references [22, 23].
Both transmissions were tested using a dedicated trans-mission test stand, as described in the associated references [2, 3, 21, and 22], rather than the streamlined alternative benchmarking process used for the UB80E and described in more detail in reference [4]. However, the data collected via each process should be comparable, and refective of losses in the unit during operation in the vehicle. For reference, the gear ratios and torque capacities for all three transmissions are given in Table 6.
Comparing the UB80E toAnother Eight-SpeedTransmission Te process used to characterize and display the average losses of the Toyota UB80E transmission were also used for the 845RE data, resulting in the values shown in Figure 10.
However, the 845RE is a RWD transmission, and thus the torque losses do not include the diferential. Additionally, it has a higher torque capacity (450 Nm versus 280 Nm) than the UB80E, as shown in Table 6. To account for these
FIGURE 10 Average 845RE transmission torque losses in all gears, averaged from 1000 rpm to 3200 rpm input shaft speed. Comparison to Other
Transmissions With the UB80E losses characterized, the torque loss data collected from this transmission can be compared to data collected earlier for other transmissions. For this paper, two transmissions previously tested by the EPA were chosen for comparison. Tese were:
1. Another eight-speed transmission: the eight-speed Chrysler 845RE rear-wheel drive (RWD) transmission [3, 21].
2. Another front-wheel drive (FWD) transmission: the six-speed GM 6T40 front-wheel drive FWD transmission [2, 22].
BENCHMARKING A 2018 TOYOTA CAMRY UB80E EIGHT-SPEED AUTOMATIC TRANSMISSION
-18
16
14
E 12 !=. ~ 10
_g "' 8 ::, C"
,2 6
4
2
0
0
-12
- First 10 - Third
8 - Fifth
E !=.
6
"' 4 .9 "' 2 ::,
E" 0 ~
-2
-4
-6
0
TRX21FWD
Gear
- Second - Third - Fourth
- Sixth - Seventh - Eighth
50 100 150 Input Torque (Nm)
200
Gear Difference: UBSOE - TRX21 FWD - Second - Fourth - Sixth
50 100 150 200 Input Torque (Nm)
250
250
-18
16
14
E 12 !=. ~ 10
_g "' 8 ::,
E" 6 ~
4
2
0
0 so
TRXll FWD Torque Losses
- First - Second
- Fourth - Fifth
100 150 Input Torque {Nm)
- Third
- Sixth
200 250
7
Downloaded from SAE International by Andrew Moskalik, Wednesday, March 25, 2020
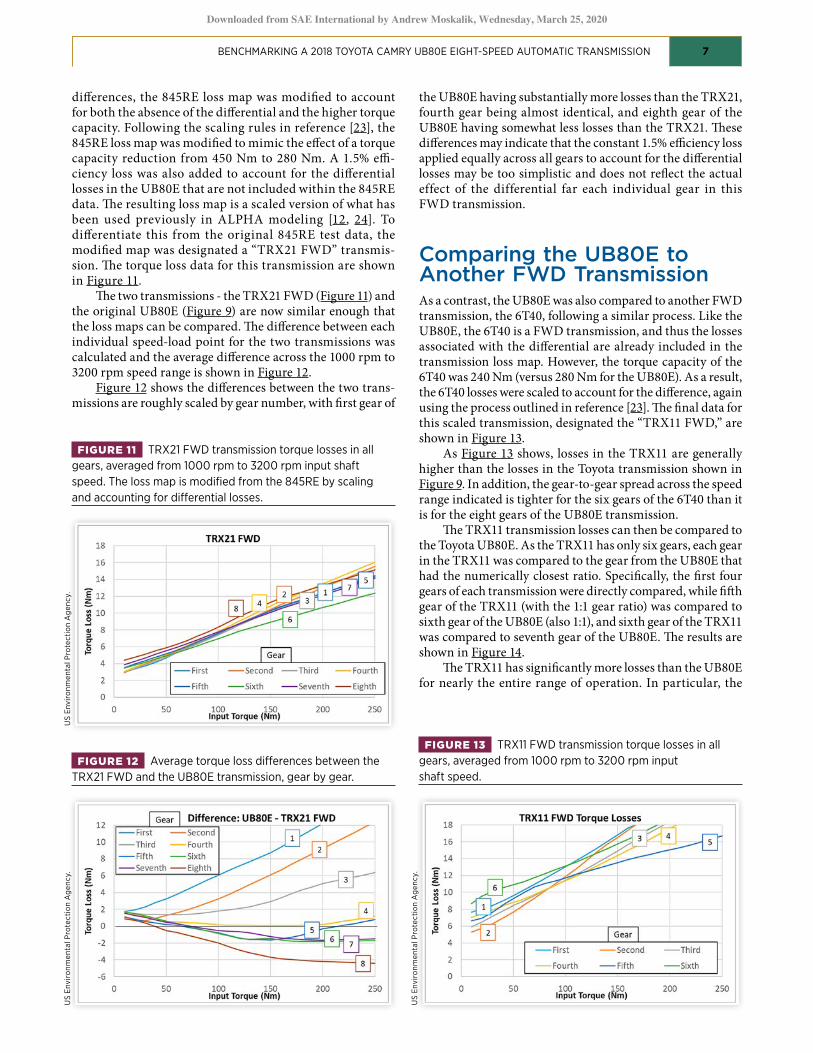
diferences, the 845RE loss map was modifed to account for both the absence of the diferential and the higher torque capacity. Following the scaling rules in reference [23], the 845RE loss map was modifed to mimic the efect of a torque capacity reduction from 450 Nm to 280 Nm. A 1.5% ef-ciency loss was also added to account for the diferential losses in the UB80E that are not included within the 845RE data. Te resulting loss map is a scaled version of what has been used previously in ALPHA modeling [12, 24]. To diferentiate this from the original 845RE test data, the modifed map was designated a “TRX21 FWD” transmis-sion. Te torque loss data for this transmission are shown in Figure 11.
Te two transmissions - the TRX21 FWD (Figure 11) and the original UB80E (Figure 9) are now similar enough that the loss maps can be compared. Te diference between each individual speed-load point for the two transmissions was calculated and the average diference across the 1000 rpm to 3200 rpm speed range is shown in Figure 12.
Figure 12 shows the diferences between the two trans-missions are roughly scaled by gear number, with frst gear of
the UB80E having substantially more losses than the TRX21, fourth gear being almost identical, and eighth gear of the UB80E having somewhat less losses than the TRX21. Tese diferences may indicate that the constant 1.5% efciency loss applied equally across all gears to account for the diferential losses may be too simplistic and does not refect the actual effect of the differential far each individual gear in this FWD transmission.
Comparing the UB80E toAnother FWD Transmission As a contrast, the UB80E was also compared to another FWD transmission, the 6T40, following a similar process. Like the UB80E, the 6T40 is a FWD transmission, and thus the losses associated with the diferential are already included in the transmission loss map. However, the torque capacity of the 6T40 was 240 Nm (versus 280 Nm for the UB80E). As a result, the 6T40 losses were scaled to account for the diference, again using the process outlined in reference [23]. Te fnal data for this scaled transmission, designated the “TRX11 FWD,” are shown in Figure 13.
TRX21 FWD transmission torque losses in all As Figure 13 shows, losses in the TRX11 are generally FIGURE 11 gears, averaged from 1000 rpm to 3200 rpm input shaft higher than the losses in the Toyota transmission shown in speed. The loss map is modifed from the 845RE by scaling Figure 9. In addition, the gear-to-gear spread across the speed and accounting for diferential losses. range indicated is tighter for the six gears of the 6T40 than it
is for the eight gears of the UB80E transmission. Te TRX11 transmission losses can then be compared to
the Toyota UB80E. As the TRX11 has only six gears, each gear in the TRX11 was compared to the gear from the UB80E that had the numerically closest ratio. Specifcally, the frst four gears of each transmission were directly compared, while ffh gear of the TRX11 (with the 1:1 gear ratio) was compared to sixth gear of the UB80E (also 1:1), and sixth gear of the TRX11 was compared to seventh gear of the UB80E. Te results are shown in Figure 14.
Te TRX11 has signifcantly more losses than the UB80E for nearly the entire range of operation. In particular, the
US
Envi
ronm
enta
l Pro
tect
ion
Age
ncy.
U
S En
viro
nmen
tal P
rote
ctio
n A
genc
y.
FIGURE 13 TRX11 FWD transmission torque losses in all FIGURE 12 Average torque loss diferences between the gears, averaged from 1000 rpm to 3200 rpm input TRX21 FWD and the UB80E transmission, gear by gear. shaft speed.
US
Envi
ronm
enta
l Pro
tect
ion
Age
ncy.

BENCHMARKING A 2018 TOYOTA CAMRY UB80E EIGHT-SPEED AUTOMATIC TRANSMISSION
-
Difference: UBSOE - TRXll FWD 10
Gear 8
- First 6
- Third
E 4
~ 2 - Fifth
"' _g 0 QJ :, -2 e-~ -4
-6
-8
-10
0 so
-:c-
90
80
70
~ 60 "C g: so C.
~ 40 u :C 30
:§! 20
10
0
1\A l
~
0
100 150 Input Torque (Nm}
UDDSCycle
200
I - Vehicle Speed
- Commanded Gear
~ lTI_ V\
SOO Time (sec} 1000
250
- 9
- 8
7
6 .; .0
5 E :, z
4 :;; QJ
3 l.9
2
0
8
Downloaded from SAE International by Andrew Moskalik, Wednesday, March 25, 2020
FIGURE 14 Average torque loss diferences between the TABLE 7 The percent operation in each gear over one UDDS, HWFET, and US06 cycle, weighted by time and by energy TRX11 FWD and the UB80E transmission, gear by gear. Gears delivered to the wheels. were matched to their counterpart with the nearest numeric
ratio (see Table 6); the gear numbers compared are indicated in the fgure.
US
Envi
ronm
enta
l Pro
tect
ion
Age
ncy.
U
S En
viro
nmen
tal P
rote
ctio
n A
genc
y.
Gear
UDDS HWFET US06
% time % energy % time % energy % time
% energy
First 27.0% 3.8% 1.3% 0.4% 12.7% 4.7%
Second 4.7% 12.7% 0.4% 0.4% 4.3% 12.5%
Third 15.8% 27.8% 1.9% 3.1% 7.% 9.4%
Fourth 8.3% 14.2% 1.1% 2.6% 3.1% 2.6%
Fifth 17.6% 15.9% 2.0% 3.6% 5.3% 11.5%
Sixth 14.5% 10.0% 8.2% 15.9% 6.9% 13.7%
Seventh 6.1% 7.7% 18.1% 20.9% 13.3% 16.2%
Eighth 6.0% 8.0% 66.9% 53.0% 46.6% 29.4% US
Envi
ronm
enta
l Pro
tect
ion
Age
ncy.
As Figure 15 shows, the transmission is ofen in frst gear. In fact, the transmission is in frst gear about a quarter of the time during the cycle. However, much of that time is during idle, with the output shaf at zero speed, and thus the power losses in the transmission itself (ignoring the torque converter) losses from gears three through six of the TRX11 are higher
than their counterpart at all loads, and losses for gears one are also zero.
FIGURE 15 Camry equipped with a UB80E. Gear 0 represents park.
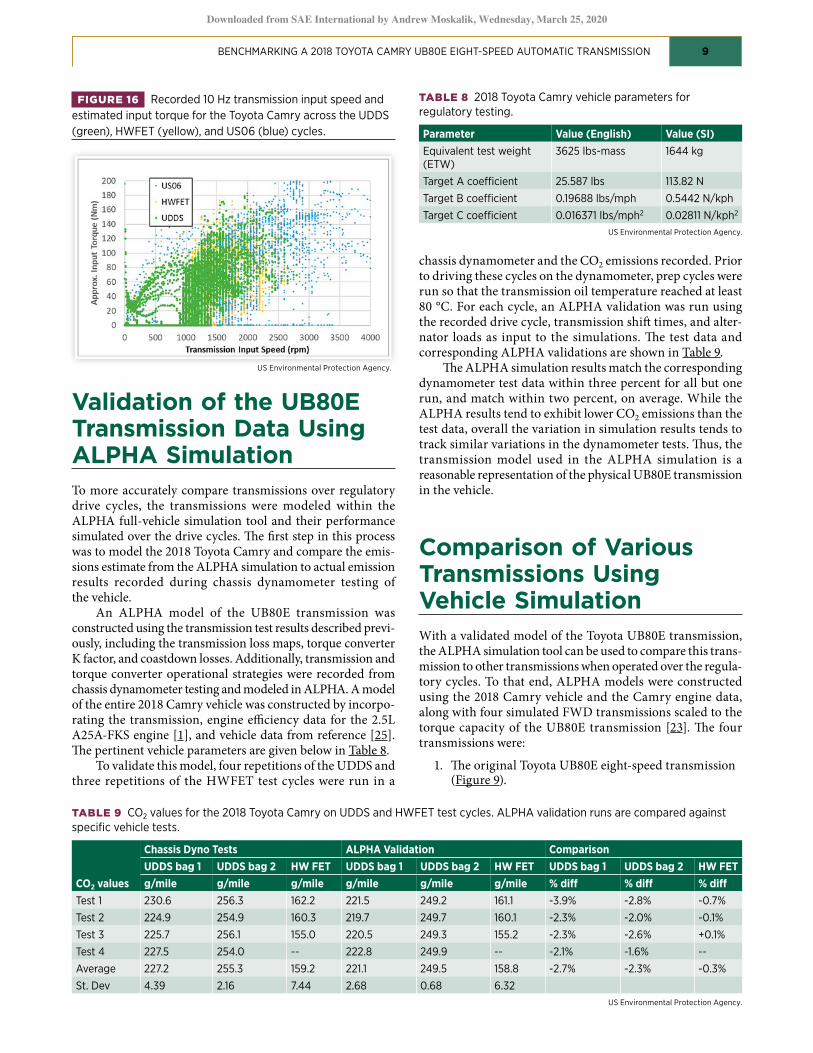
Table 7 establishes the usage of each gear over the three Gear shifts during a UDDS cycle for a Toyota cycles, but not necessarily the actual speed and torque deliv-ered to the transmission. To estimate this, a torque-speed operation map was created using the CAN-reported transmis-sion input speed, recorded at 10 Hz, along with an estimate of the transmission input torque based on the dynamometer power at the wheels and an approximate driveline efciency. Te resulting speed and torque data are shown in Figure 16 for all three cycles.
Over the UDDS and HWFET cycles, 99% of the opera-tion is below 125 Nm and 2500 rpm (for the US06, over 85% of the operation is below these values). In this operating zone, the torque loss for gears three through seven for the UB80E and TRX21 are within ±2 Nm of each other (as seen in Figure 12). Tese results suggest that when used over these regulatory cycles, the two transmissions are generally comparable.
and two are higher for torques below about 100-150 Nm.
Comparing Eight-SpeedTransmissions over Regulatory Drive Cycles Te signifcance of the diferences between transmissions, and the overall operational efciency of the transmission, depends on the operation during the drive cycle. To investigate this further, a Toyota Camry equipped with the UB80E was driven on a chassis dynamometer over the urban dynamometer drive cycle (UDDS), highway cycle (HWFET) and high-speed high-acceleration cycle (US06). Dynamometer data and CAN-reported shif events were recorded. Figure 15 shows the gear shifs of the Toyota Camry during one example UDDS cycle.
Rather than looking at time in gear, the operation of the transmission can be weighted by positive energy fow; in other words, the percent of energy delivered at the wheels while in each gear. To examine this, the transmission operation in each gear over each of the three cycles tested was both time- and energy-weighted. Results are given in Table 7. Note these example data were taken from specifc dynamometer tests; data from additional tests would likely have some variability due to test-to-test variation.
Less than fve percent of the energy was expended in frst gear for all three of the cycles. Generally, most of the energy-weighted operation is concentrated in gears three through six (for the UDDS) or gears six through eight (for the HWFET and US06). Tis suggests that the fairly high diference between gears one and two of the UB80E and TRX21 (Figure 12) may not be signifcant during cycle operation. In contrast, the differences between the UB80E and the TRX11 in the higher gears are likely to be much more signifcant.
BENCHMARKING A 2018 TOYOTA CAMRY UB80E EIGHT-SPEED AUTOMATIC TRANSMISSION
-200
180
E 160 z '; 140 ::,
E'. 120 ~ ':i 100 C. E 80 )(
60 0 a.
40 C. <(
20
0
0 500 1000 1500 2000 2500 3000 3500 4000 Transmission Input Speed {rpm)
9
Downloaded from SAE International by Andrew Moskalik, Wednesday, March 25, 2020
FIGURE 16 Recorded 10 Hz transmission input speed and estimated input torque for the Toyota Camry across the UDDS (green), HWFET (yellow), and US06 (blue) cycles.
US Environmental Protection Agency.
Validation of the UB80E Transmission Data Using ALPHA Simulation To more accurately compare transmissions over regulatory drive cycles, the transmissions were modeled within the ALPHA full-vehicle simulation tool and their performance simulated over the drive cycles. Te frst step in this process was to model the 2018 Toyota Camry and compare the emis-sions estimate from the ALPHA simulation to actual emission results recorded during chassis dynamometer testing of the vehicle.
An ALPHA model of the UB80E transmission was constructed using the transmission test results described previ-ously, including the transmission loss maps, torque converter K factor, and coastdown losses. Additionally, transmission and torque converter operational strategies were recorded from chassis dynamometer testing and modeled in ALPHA. A model of the entire 2018 Camry vehicle was constructed by incorpo-rating the transmission, engine efciency data for the 2.5L A25A-FKS engine [1], and vehicle data from reference [25]. Te pertinent vehicle parameters are given below in Table 8.
To validate this model, four repetitions of the UDDS and three repetitions of the HWFET test cycles were run in a
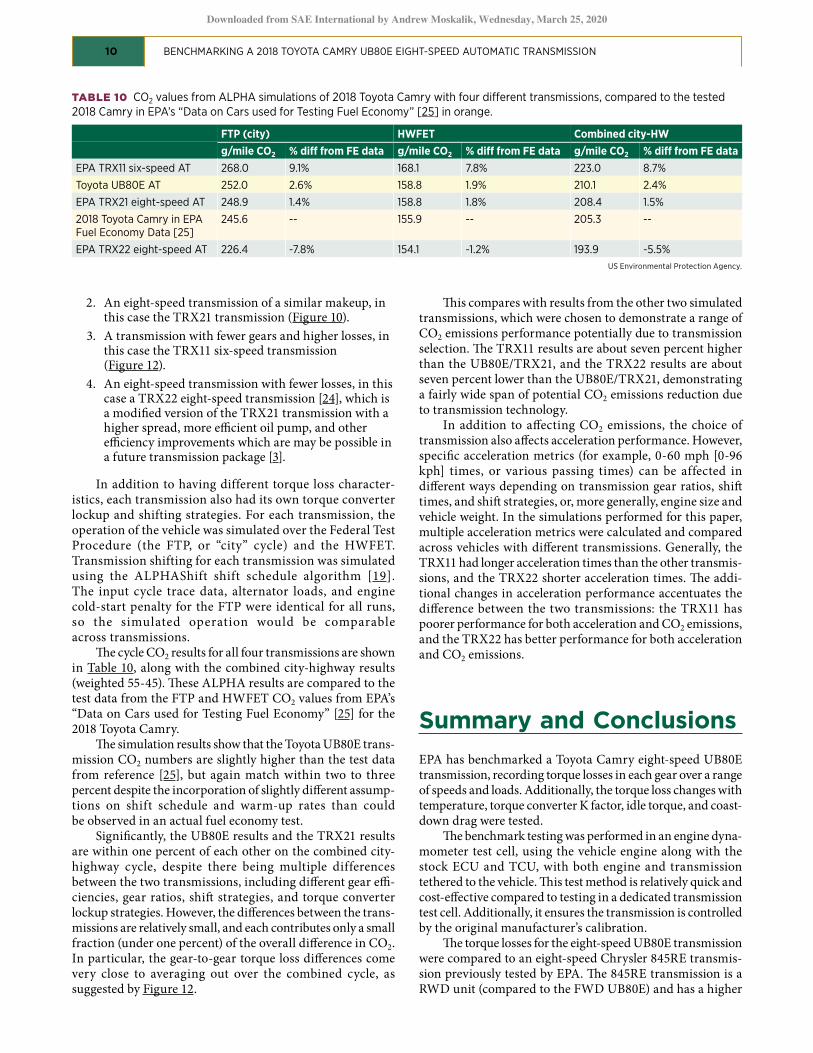
TABLE 8 2018 Toyota Camry vehicle parameters for regulatory testing.
Parameter Value (English) Value (SI) Equivalent test weight (ETW)
3625 lbs-mass 1644 kg
Target A coefcient 25.587 lbs 113.82 N
Target B coefcient 0.19688 lbs/mph 0.5442 N/kph
Target C coefcient 0.016371 lbs/mph2 0.02811 N/kph2
US Environmental Protection Agency.
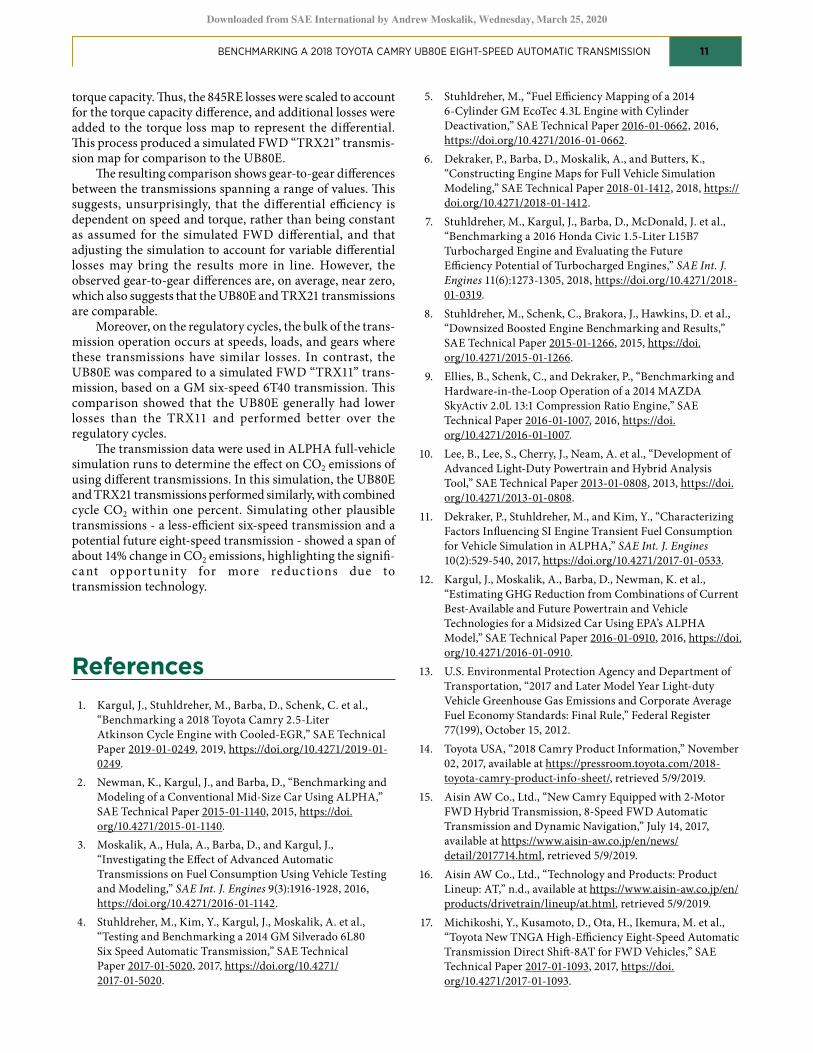
chassis dynamometer and the CO2 emissions recorded. Prior to driving these cycles on the dynamometer, prep cycles were run so that the transmission oil temperature reached at least 80 °C. For each cycle, an ALPHA validation was run using the recorded drive cycle, transmission shif times, and alter-nator loads as input to the simulations. Te test data and corresponding ALPHA validations are shown in Table 9.
Te ALPHA simulation results match the corresponding dynamometer test data within three percent for all but one run, and match within two percent, on average. While the ALPHA results tend to exhibit lower CO2 emissions than the test data, overall the variation in simulation results tends to track similar variations in the dynamometer tests. Tus, the transmission model used in the ALPHA simulation is a reasonable representation of the physical UB80E transmission in the vehicle.
Comparison of Various Transmissions Using Vehicle Simulation With a validated model of the Toyota UB80E transmission, the ALPHA simulation tool can be used to compare this trans-mission to other transmissions when operated over the regula-tory cycles. To that end, ALPHA models were constructed using the 2018 Camry vehicle and the Camry engine data, along with four simulated FWD transmissions scaled to the torque capacity of the UB80E transmission [23]. Te four transmissions were:
1. Te original Toyota UB80E eight-speed transmission(Figure 9).
TABLE 9 CO2 values for the 2018 Toyota Camry on UDDS and HWFET test cycles. ALPHA validation runs are compared against specifc vehicle tests.
CO2 values
Chassis Dyno Tests ALPHA Validation Comparison UDDS bag 1 UDDS bag 2 HW FET UDDS bag 1 UDDS bag 2 HW FET UDDS bag 1 UDDS bag 2 HW FET g/mile g/mile g/mile g/mile g/mile g/mile % dif % dif % dif
Test 1 230.6 256.3 162.2 221.5 249.2 161.1 -3.9% -2.8% -0.7%
Test 2 224.9 254.9 160.3 219.7 249.7 160.1 -2.3% -2.0% -0.1%
Test 3 225.7 256.1 155.0 220.5 249.3 155.2 -2.3% -2.6% +0.1%
Test 4 227.5 254.0 -- 222.8 249.9 -- -2.1% -1.6% --
Average 227.2 255.3 159.2 221.1 249.5 158.8 -2.7% -2.3% -0.3%
St. Dev 4.39 2.16 7.44 2.68 0.68 6.32 US Environmental Protection Agency.
BENCHMARKING A 2018 TOYOTA CAMRY UB80E EIGHT-SPEED AUTOMATIC TRANSMISSION
Downloaded from SAE International by Andrew Moskalik, Wednesday, March 25, 2020
10
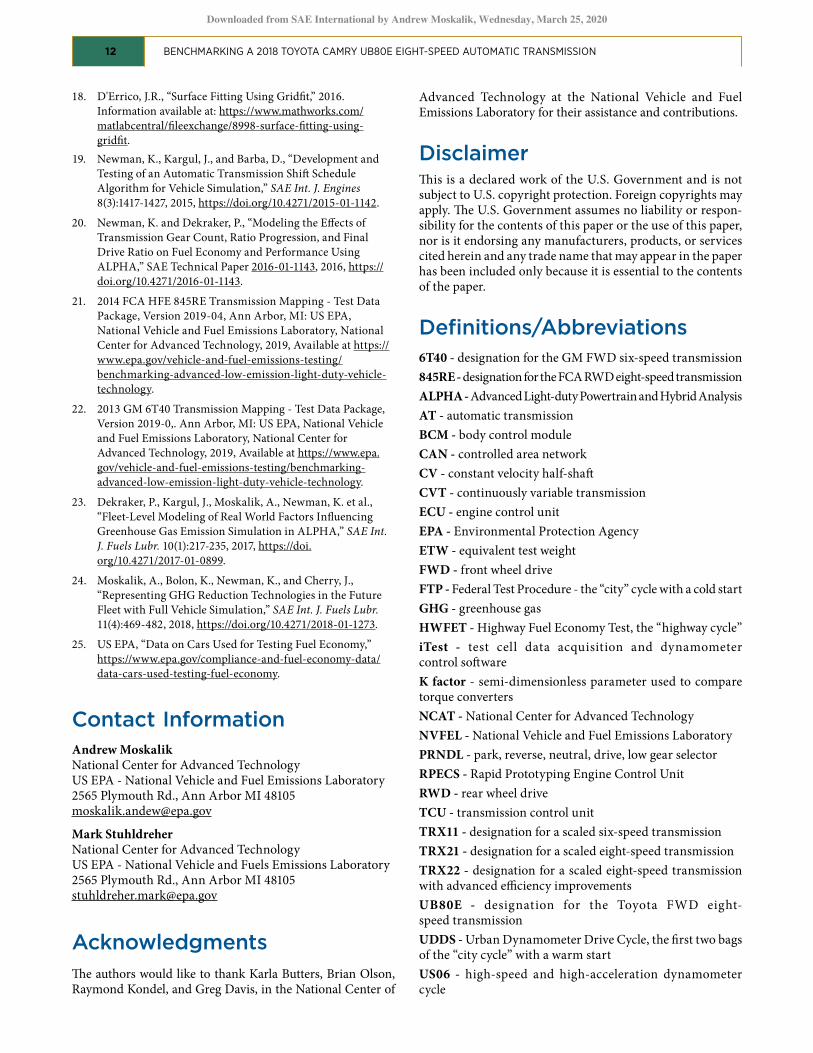
TABLE 10 CO2 values from ALPHA simulations of 2018 Toyota Camry with four diferent transmissions, compared to the tested 2018 Camry in EPA’s “Data on Cars used for Testing Fuel Economy” [25] in orange.
FTP (city) HWFET Combined city-HW g/mile CO2 % dif from FE data g/mile CO2 % dif from FE data g/mile CO2 % dif from FE data
EPA TRX11 six-speed AT 268.0 9.1% 168.1 7.8% 223.0 8.7%
Toyota UB80E AT 252.0 2.6% 158.8 1.9% 210.1 2.4%
EPA TRX21 eight-speed AT 248.9 1.4% 158.8 1.8% 208.4 1.5%
2018 Toyota Camry in EPA Fuel Economy Data [25]
245.6 -- 155.9 -- 205.3 --
EPA TRX22 eight-speed AT 226.4 -7.8% 154.1 -1.2% 193.9 -5.5%
2. An eight-speed transmission of a similar makeup, inthis case the TRX21 transmission (Figure 10).
3. A transmission with fewer gears and higher losses, inthis case the TRX11 six-speed transmission(Figure 12).
4. An eight-speed transmission with fewer losses, in thiscase a TRX22 eight-speed transmission [24], which isa modifed version of the TRX21 transmission with a higher spread, more efcient oil pump, and otherefciency improvements which are may be possible ina future transmission package [3].
In addition to having different torque loss character-istics, each transmission also had its own torque converter lockup and shifting strategies. For each transmission, the operation of the vehicle was simulated over the Federal Test Procedure (the FTP, or “city” cycle) and the HWFET. Transmission shifting for each transmission was simulated using the ALPHAShift shift schedule algorithm [19]. The input cycle trace data, alternator loads, and engine cold-start penalty for the FTP were identical for all runs, so the simulated operation would be comparable across transmissions.
Te cycle CO2 results for all four transmissions are shown in Table 10, along with the combined city-highway results (weighted 55-45). Tese ALPHA results are compared to the test data from the FTP and HWFET CO2 values from EPA’s “Data on Cars used for Testing Fuel Economy” [25] for the 2018 Toyota Camry.
Te simulation results show that the Toyota UB80E trans-mission CO2 numbers are slightly higher than the test data from reference [25], but again match within two to three percent despite the incorporation of slightly diferent assump-tions on shift schedule and warm-up rates than could be observed in an actual fuel economy test.
Signifcantly, the UB80E results and the TRX21 results are within one percent of each other on the combined city-highway cycle, despite there being multiple differences between the two transmissions, including diferent gear ef-ciencies, gear ratios, shif strategies, and torque converter lockup strategies. However, the diferences between the trans-missions are relatively small, and each contributes only a small fraction (under one percent) of the overall diference in CO2. In particular, the gear-to-gear torque loss diferences come very close to averaging out over the combined cycle, as suggested by Figure 12.
US Environmental Protection Agency.
Tis compares with results from the other two simulated transmissions, which were chosen to demonstrate a range of CO2 emissions performance potentially due to transmission selection. Te TRX11 results are about seven percent higher than the UB80E/TRX21, and the TRX22 results are about seven percent lower than the UB80E/TRX21, demonstrating a fairly wide span of potential CO2 emissions reduction due to transmission technology.
In addition to afecting CO2 emissions, the choice of transmission also afects acceleration performance. However, specifc acceleration metrics (for example, 0-60 mph [0-96 kph] times, or various passing times) can be affected in diferent ways depending on transmission gear ratios, shif times, and shif strategies, or, more generally, engine size and vehicle weight. In the simulations performed for this paper, multiple acceleration metrics were calculated and compared across vehicles with diferent transmissions. Generally, the TRX11 had longer acceleration times than the other transmis-sions, and the TRX22 shorter acceleration times. Te addi-tional changes in acceleration performance accentuates the diference between the two transmissions: the TRX11 has poorer performance for both acceleration and CO2 emissions, and the TRX22 has better performance for both acceleration and CO2 emissions.
Summary and Conclusions EPA has benchmarked a Toyota Camry eight-speed UB80E transmission, recording torque losses in each gear over a range of speeds and loads. Additionally, the torque loss changes with temperature, torque converter K factor, idle torque, and coast-down drag were tested.
Te benchmark testing was performed in an engine dyna-mometer test cell, using the vehicle engine along with the stock ECU and TCU, with both engine and transmission tethered to the vehicle. Tis test method is relatively quick and cost-efective compared to testing in a dedicated transmission test cell. Additionally, it ensures the transmission is controlled by the original manufacturer’s calibration.
Te torque losses for the eight-speed UB80E transmission were compared to an eight-speed Chrysler 845RE transmis-sion previously tested by EPA. Te 845RE transmission is a RWD unit (compared to the FWD UB80E) and has a higher
BENCHMARKING A 2018 TOYOTA CAMRY UB80E EIGHT-SPEED AUTOMATIC TRANSMISSION
11
Downloaded from SAE International by Andrew Moskalik, Wednesday, March 25, 2020
torque capacity. Tus, the 845RE losses were scaled to account for the torque capacity diference, and additional losses were added to the torque loss map to represent the diferential. Tis process produced a simulated FWD “TRX21” transmis-sion map for comparison to the UB80E.
Te resulting comparison shows gear-to-gear diferences between the transmissions spanning a range of values. Tis suggests, unsurprisingly, that the diferential efciency is dependent on speed and torque, rather than being constant as assumed for the simulated FWD diferential, and that adjusting the simulation to account for variable diferential losses may bring the results more in line. However, the observed gear-to-gear diferences are, on average, near zero, which also suggests that the UB80E and TRX21 transmissions are comparable.
Moreover, on the regulatory cycles, the bulk of the trans-mission operation occurs at speeds, loads, and gears where these transmissions have similar losses. In contrast, the UB80E was compared to a simulated FWD “TRX11” trans-mission, based on a GM six-speed 6T40 transmission. Tis comparison showed that the UB80E generally had lower losses than the TRX11 and performed better over the regulatory cycles.
Te transmission data were used in ALPHA full-vehicle simulation runs to determine the efect on CO2 emissions of using diferent transmissions. In this simulation, the UB80E and TRX21 transmissions performed similarly, with combined cycle CO2 within one percent. Simulating other plausible transmissions - a less-efcient six-speed transmission and a potential future eight-speed transmission - showed a span of about 14% change in CO2 emissions, highlighting the signif-cant opportunity for more reduct ions due to transmission technology.
References 1. Kargul, J., Stuhldreher, M., Barba, D., Schenk, C. et al.,
“Benchmarking a 2018 Toyota Camry 2.5-Liter Atkinson Cycle Engine with Cooled-EGR,” SAE Technical Paper 2019-01-0249, 2019, https://doi.org/10.4271/2019-01-0249.
2. Newman, K., Kargul, J., and Barba, D., “Benchmarking and Modeling of a Conventional Mid-Size Car Using ALPHA,” SAE Technical Paper 2015-01-1140, 2015, https://doi. org/10.4271/2015-01-1140.
3. Moskalik, A., Hula, A., Barba, D., and Kargul, J., “Investigating the Efect of Advanced Automatic Transmissions on Fuel Consumption Using Vehicle Testing and Modeling,” SAE Int. J. Engines 9(3):1916-1928, 2016, https://doi.org/10.4271/2016-01-1142.
4. Stuhldreher, M., Kim, Y., Kargul, J., Moskalik, A. et al., “Testing and Benchmarking a 2014 GM Silverado 6L80 Six Speed Automatic Transmission,” SAE Technical Paper 2017-01-5020, 2017, https://doi.org/10.4271/ 2017-01-5020.
5. Stuhldreher, M., “Fuel Efciency Mapping of a 2014 6-Cylinder GM EcoTec 4.3L Engine with Cylinder Deactivation,” SAE Technical Paper 2016-01-0662, 2016, https://doi.org/10.4271/2016-01-0662.
6. Dekraker, P., Barba, D., Moskalik, A., and Butters, K., “Constructing Engine Maps for Full Vehicle Simulation Modeling,” SAE Technical Paper 2018-01-1412, 2018, https:// doi.org/10.4271/2018-01-1412.
7. Stuhldreher, M., Kargul, J., Barba, D., McDonald, J. et al., “Benchmarking a 2016 Honda Civic 1.5-Liter L15B7 Turbocharged Engine and Evaluating the Future Efciency Potential of Turbocharged Engines,” SAE Int. J. Engines 11(6):1273-1305, 2018, https://doi.org/10.4271/2018-01-0319.
8. Stuhldreher, M., Schenk, C., Brakora, J., Hawkins, D. et al., “Downsized Boosted Engine Benchmarking and Results,” SAE Technical Paper 2015-01-1266, 2015, https://doi. org/10.4271/2015-01-1266.
9. Ellies, B., Schenk, C., and Dekraker, P., “Benchmarking and Hardware-in-the-Loop Operation of a 2014 MAZDA SkyActiv 2.0L 13:1 Compression Ratio Engine,” SAE Technical Paper 2016-01-1007, 2016, https://doi. org/10.4271/2016-01-1007.
10. Lee, B., Lee, S., Cherry, J., Neam, A. et al., “Development of Advanced Light-Duty Powertrain and Hybrid Analysis Tool,” SAE Technical Paper 2013-01-0808, 2013, https://doi. org/10.4271/2013-01-0808.
11. Dekraker, P., Stuhldreher, M., and Kim, Y., “Characterizing Factors Infuencing SI Engine Transient Fuel Consumption for Vehicle Simulation in ALPHA,” SAE Int. J. Engines 10(2):529-540, 2017, https://doi.org/10.4271/2017-01-0533.
12. Kargul, J., Moskalik, A., Barba, D., Newman, K. et al., “Estimating GHG Reduction from Combinations of Current Best-Available and Future Powertrain and Vehicle Technologies for a Midsized Car Using EPA’s ALPHA Model,” SAE Technical Paper 2016-01-0910, 2016, https://doi. org/10.4271/2016-01-0910.
13. U.S. Environmental Protection Agency and Department of Transportation, “2017 and Later Model Year Light-duty Vehicle Greenhouse Gas Emissions and Corporate Average Fuel Economy Standards: Final Rule,” Federal Register 77(199), October 15, 2012.
14. Toyota USA, “2018 Camry Product Information,” November 02, 2017, available at https://pressroom.toyota.com/2018-toyota-camry-product-info-sheet/, retrieved 5/9/2019.
15. Aisin AW Co., Ltd., “New Camry Equipped with 2-Motor FWD Hybrid Transmission, 8-Speed FWD Automatic Transmission and Dynamic Navigation,” July 14, 2017, available at https://www.aisin-aw.co.jp/en/news/ detail/2017714.html, retrieved 5/9/2019.
16. Aisin AW Co., Ltd., “Technology and Products: Product Lineup: AT,” n.d., available at https://www.aisin-aw.co.jp/en/ products/drivetrain/lineup/at.html, retrieved 5/9/2019.
17. Michikoshi, Y., Kusamoto, D., Ota, H., Ikemura, M. et al., “Toyota New TNGA High-Efciency Eight-Speed Automatic Transmission Direct Shif-8AT for FWD Vehicles,” SAE Technical Paper 2017-01-1093, 2017, https://doi. org/10.4271/2017-01-1093.
BENCHMARKING A 2018 TOYOTA CAMRY UB80E EIGHT-SPEED AUTOMATIC TRANSMISSION
12
Downloaded from SAE International by Andrew Moskalik, Wednesday, March 25, 2020
18. D'Errico, J.R., “Surface Fitting Using Gridft,” 2016. Information available at: https://www.mathworks.com/ matlabcentral/fleexchange/8998-surface-ftting-using-gridft.
19. Newman, K., Kargul, J., and Barba, D., “Development and Testing of an Automatic Transmission Shif Schedule Algorithm for Vehicle Simulation,” SAE Int. J. Engines 8(3):1417-1427, 2015, https://doi.org/10.4271/2015-01-1142.
20. Newman, K. and Dekraker, P., “Modeling the Efects of Transmission Gear Count, Ratio Progression, and Final Drive Ratio on Fuel Economy and Performance Using ALPHA,” SAE Technical Paper 2016-01-1143, 2016, https:// doi.org/10.4271/2016-01-1143.
21. 2014 FCA HFE 845RE Transmission Mapping - Test Data Package, Version 2019-04, Ann Arbor, MI: US EPA, National Vehicle and Fuel Emissions Laboratory, National Center for Advanced Technology, 2019, Available at https:// www.epa.gov/vehicle-and-fuel-emissions-testing/ benchmarking-advanced-low-emission-light-duty-vehicle-technology.
22. 2013 GM 6T40 Transmission Mapping - Test Data Package, Version 2019-0,. Ann Arbor, MI: US EPA, National Vehicle and Fuel Emissions Laboratory, National Center for Advanced Technology, 2019, Available at https://www.epa. gov/vehicle-and-fuel-emissions-testing/benchmarking-advanced-low-emission-light-duty-vehicle-technology.
23. Dekraker, P., Kargul, J., Moskalik, A., Newman, K. et al., “Fleet-Level Modeling of Real World Factors Infuencing Greenhouse Gas Emission Simulation in ALPHA,” SAE Int. J. Fuels Lubr. 10(1):217-235, 2017, https://doi. org/10.4271/2017-01-0899.
24. Moskalik, A., Bolon, K., Newman, K., and Cherry, J., “Representing GHG Reduction Technologies in the Future Fleet with Full Vehicle Simulation,” SAE Int. J. Fuels Lubr. 11(4):469-482, 2018, https://doi.org/10.4271/2018-01-1273.
25. US EPA, “Data on Cars Used for Testing Fuel Economy,” https://www.epa.gov/compliance-and-fuel-economy-data/ data-cars-used-testing-fuel-economy.
Contact Information Andrew Moskalik National Center for Advanced Technology US EPA - National Vehicle and Fuel Emissions Laboratory 2565 Plymouth Rd., Ann Arbor MI 48105 [email protected]
Mark Stuhldreher National Center for Advanced Technology US EPA - National Vehicle and Fuels Emissions Laboratory 2565 Plymouth Rd., Ann Arbor MI 48105 [email protected]
Acknowledgments Te authors would like to thank Karla Butters, Brian Olson, Raymond Kondel, and Greg Davis, in the National Center of
Advanced Technology at the National Vehicle and Fuel Emissions Laboratory for their assistance and contributions.
Disclaimer Tis is a declared work of the U.S. Government and is not subject to U.S. copyright protection. Foreign copyrights may apply. Te U.S. Government assumes no liability or respon-sibility for the contents of this paper or the use of this paper, nor is it endorsing any manufacturers, products, or services cited herein and any trade name that may appear in the paper has been included only because it is essential to the contents of the paper.
Defnitions/Abbreviations 6T40 - designation for the GM FWD six-speed transmission 845RE - designation for the FCA RWD eight-speed transmission ALPHA - Advanced Light-duty Powertrain and Hybrid Analysis AT - automatic transmission BCM - body control module CAN - controlled area network CV - constant velocity half-shaf CVT - continuously variable transmission ECU - engine control unit EPA - Environmental Protection Agency ETW - equivalent test weight FWD - front wheel drive FTP - Federal Test Procedure - the “city” cycle with a cold start GHG - greenhouse gas HWFET - Highway Fuel Economy Test, the “highway cycle” iTest - test cell data acquisition and dynamometer control sofware K factor - semi-dimensionless parameter used to compare torque converters NCAT - National Center for Advanced Technology NVFEL - National Vehicle and Fuel Emissions Laboratory PRNDL - park, reverse, neutral, drive, low gear selector RPECS - Rapid Prototyping Engine Control Unit RWD - rear wheel drive TCU - transmission control unit TRX11 - designation for a scaled six-speed transmission TRX21 - designation for a scaled eight-speed transmission TRX22 - designation for a scaled eight-speed transmission with advanced efciency improvements UB80E - designation for the Toyota FWD eight-speed transmission UDDS - Urban Dynamometer Drive Cycle, the frst two bags of the “city cycle” with a warm start US06 - high-speed and high-acceleration dynamometer cycle
13 BENCHMARKING A 2018 TOYOTA CAMRY UB80E EIGHT-SPEED AUTOMATIC TRANSMISSION
First Gear Second Gear 18 18
16 ........ 3000 rpm 16
14 ---- 2soo rpm 14 ........ 3000 rpm
E12 ---- 2000 rpm E 12 ---- 2500 rpm !:.
/ !:.
~ 10 ........ 1soorpm ~10 ---- 2000 rpm _g 0
a, 8 ----- 1000 rpm ~8 ........ 1soo rpm :, :,
l: 6 l: 6 --+- 1000 rpm ,>! ,>! 4 4
2 2
0 0
0 so 100 150 200 250 0 so 100 150 200 250 Input Torque (Nm) Input Torque (Nm)
Third Gear Fourth Gear 18 18 ........ 3000 rpm
16 16 ----2soo rpm
14 14
E12 !:.
E 12 !:.
~ 10 ~10 _g _g a, 8 a, 8 :, :,
l: 6 l: 6 ,>! ,>!
4 4
2 --+-1000 rpm 2
0 0
0 so 100 150 200 250 0 so 100 150 200 250 Input Torque (Nm) Input Torque (Nm)
Fifth Gear Sixth Gear 18 ........ 3000 rpm 18 ........ 3000 rpm
16 ---- 2500 rpm 16 ---- 2soo rpm
14 ......... 2ooorpm 14 ---- 2000 rpm
E 12 E 12 ........ 1soo rpm !:. !:. ~ 10 ~ 10 --+- lO00rpm _g _g a, 8 a, 8 ~ ..;;;:.~ :, :, C"
6 C"
6 ~ ~ "'f a ,) , ; 5 4 4
2 2
0 0
0 so 100 150 200 250 0 so 100 150 200 250 Input Torque (Nm) Input Torque (Nm)
Seventh Gear Eighth Gear 18 ........ 3000 rpm 18 ........ 3000 rpm
16 ----2soo rpm 16 ---- 2soo rpm
14 - 2000rpm 14 ......... 2000 rpm
E 12 !:. - 1soorpm E 12
!:. --+- 1500 rpm
~10 --+- lO00rpm ~10 --+- 1000 rpm 0 0
~ 8 ~ 8
s;d ...... ...
:, :,
l: 6 l: 6 ~ -- ;;,: : ,>! ,>! T 4 4
2 2
0 0
0 so 100 150 200 250 0 so 100 150 200 250 Input Torque (Nm) Input Torque (Nm)
Downloaded from SAE International by Andrew Moskalik, Wednesday, March 25, 2020
Appendix A: UB80E Torque Loss Data, All Gears U
S En
viro
nmen
tal P
rote
ctio
n A
genc
y.
2020 US Environmental Protection Agency. All rights reserved. This is the work of a government and is not subject to copyright protection. Foreign copyrights may apply. The government under which this work was written assumes no liability or responsibility for the contents of this work or the use of this work, nor is it endorsing any manufacturers, products, or services cited herein and any trade name that may appear in the work has been included only because it has been deemed essential to the contents of the work.
Positions and opinions advanced in this work are those of the author(s) and not necessarily those of SAE International. Responsibility for the content of the work lies solely with the author(s).
ISSN 0148-7191