Comparisons between original and current composition of indigenous tree species around Mount Kenya
Upload
khangminh22Category
view
1download
0
INDIGENOUS CHICKEN PRODUCTION IN KENYA; CHARACTERIZATION OF
THE PRODUCTION SYSTEMS AND INCLUSION OF MOLAPLUS PROBIOTIC IN
THE FEEDING STRATEGY IN BARINGO AND KISUMU COUNTIES
ATELA JUDITH AKINYI
A Thesis Submitted to the Graduate School in Partial Fulfillment for the Requirement of
the award of Doctor of Philosophy Degree in Animal Science of Egerton University
EGERTON UNIVERSITY
NOVEMBER, 2016

ii

iii
COPYRIGHT
© 2016, Atela Judith Akinyi
All rights reserved. No part of this thesis may be reproduced, stored in any retrieval system or
transmitted in any form or means, either, electronic, mechanical, photocopying, recording or
otherwise without prior written permission of the author or Egerton University.

iv
DEDICATION
I dedicate this work to the Almighty God of Israel for directing and guiding me all through.
Secondly, to my parents, Margaret and Joseph Atela, my daughter Pollitt Awuor and son Brian
Omondi, The LORD keep them.

v
ACKNOWLEDGEMENT
The accomplishment of this work was made possible through the Grace of the Almighty God. I
thank Him for the gift of health, energy and direction as I executed this task to the conclusion. I
acknowledge Egerton University for granting me an opportunity to pursue PhD studies in the
institution. My humble gratitude goes to the Teachers Service Commission (TSC) for granting
me study leave and permission to undertake this work. Support for this research was made
possible through a capacity building competitive grant training the next generation of scientists
provided by Carnegie Cooperation of New York through the Regional Universities Forum for
Capacity Building in Agriculture (RUFORUM), The National Council of Science and
Technology Innovations (NACOSTI), Egerton University Research Division and financial
support by Organization for Women in Science for Developing World (OWSD) & SIDA.
My thanks also go to a number of individuals who tirelessly guided me during proposal
development, data collection, laboratory analysis and thesis writing among whom were my
supervisors: Prof. James Tuitoek, Dr. Paul Onjoro and Dr. James Ondiek, Animal Science
Department; Dr Meshack Obonyo, Chairman of Biochemistry Department and Judith Chore, the
Laboratory technician of the Biochemistry Department, Egerton University who supported the
analysis of aflatoxins and amino acids. My recognition goes to the Livestock Production Officers
of Upper Nyakach, Mr. Paul Owiti and Emining Division, Ms Judith Chesire who sacrificed their
precious time to organize the farmer groups to give special attention on each questionnaire items.
I thank Mr. Robert Wafula and Johnson Mwove from the Department of Dairy Science and
Technology, Egerton University, for their assistance and guidance in data analysis, Pastor
Ekosile Fredrick for proofreading the thesis, Bishop Charles Gero, Bishop John Oduor and
Bishop Joseph Masinde of the Ministry of Repentance and Holiness for their moral support and
encouragement. Lastly, this work would not have been possible without the motivation from; my
daughter, Pollitt Awuor and my son, Brian Omondi who gave me the moral support.

vi
ABSTRACT
A study was conducted to characterize the production systems practiced by indigenous
chicken farmers in Kisumu and Baringo Counties, with a view to assess whether the
indigenous chicken feeding practices is appropriate and adequate in order to innovate
possible ways of improving feed utilization and efficiency. A survey was conducted; feed
resources were sampled, feeding trials done and the feedstuffs analyzed. A cafeteria feeding
experiment was designed under a complete randomized design and feed intake determined
for 15 female indigenous chicken for 21 days. Feeding trial was done using locally
compounded feed and body weights for 150 chicken used during the study were measured
weekly for an eight weeks trial with molaplus probiotic feed additive. The feedstuffs
collected in the field such as omena/ochonga, kienyeji mash, rice germ, sorghum grains,
millet grains and maize grains were analyzed for proximate composition, levels of critical
amino acids and aflatoxins. On-station evaluation for feeding value for appropriate chicken
feeds formulated using the collected feedstuffs, supplemented with probiotics feed additive
and fed to 150 indigenous chicken to establish the performance of the indigenous chicken.
Data management and analysis was done using SAS 9.0 and SPSS version 17. The survey
results showed that more educated young men from Baringo are practicing indigenous
chicken production compared to those from Kisumu. There are more indigenous chicken in
Baringo which attain maturity earlier in terms of point at first lay and crow compared to
indigenous chicken from Kisumu. There are significant differences in feeding strategies and
performance of indigenous chicken among the pastoral and fishing communities in both
Counties. Incidences of lack of all the critical amino acids in feed ingredients and high
contamination level of total aflatoxins was detected in local indigenous chicken feedstuffs.
Supplementation of local feeds with 5ml of molaplus poultry additive in 1000ml drinking
water improved growth rates in indigenous chicken. The source of aflatoxins contamination
in feedstuffs in IC should be investigated and the use of aflatoxin binders in indigenous
chicken feed should be studied. Amino acids profiling of commercial feeds used by
indigenous chicken farmers in Kisumu and Baringo Counties should be done. Further
culturing should be done on Molaplus poultry microbes to define its actual probiotic
composition and also determine its other beneficial effects on blood parameters, egg and
meat qualities of indigenous chicken.

vii
TABLE OF CONTENTS
DECLARATION AND RECOMMENDATION ....................................................................... ii
COPYRIGHT ............................................................................................................................... iii
DEDICATION.............................................................................................................................. iv
ACKNOWLEDGEMENT .............................................................................................................v
ABSTRACT .................................................................................................................................. vi
TABLE OF CONTENTS ........................................................................................................... vii
LIST OF TABLES ....................................................................................................................... xi
LIST OF FIGURES .................................................................................................................... xii
LIST OF ABBREVIATIONS ................................................................................................... xiii
CHAPTER ONE ............................................................................................................................1
INTRODUCTION..........................................................................................................................1
1.1 Background Information ............................................................................................................1
1.2 Statement of the problem ................................................................................................................... 3
1.3 Objectives .......................................................................................................................................... 3
1.3.1 Broad objective ............................................................................................................................... 3
1.3.2 Specific objectives .......................................................................................................................... 3
1.4 Hypotheses (Ho) ................................................................................................................................ 4
1.5 Justification........................................................................................................................................ 4
1.6 Scope of the study .............................................................................................................................. 5
1.7 Limitations of the study ..................................................................................................................... 5
1.8 Definition of terms ............................................................................................................................. 6
CHAPTER TWO ...........................................................................................................................9
LITERATURE REVIEW .............................................................................................................9
2.0 Ancestry and global distribution of indigenous chicken .................................................................... 9
2.1 Overview of indigenous chicken production in Kenya .................................................................... 10
2.2 Population and distribution of indigenous chicken in Kenya ........................................................... 10
2.3 Production systems of indigenous chicken in Kenya ....................................................................... 11
2.3.1 Free ranging production system .................................................................................................... 11
2.3.2 Semi intensive system ................................................................................................................... 12
2.3.3 Intensive system ........................................................................................................................... 13
2.4 Indigenous chicken Phenotypes ....................................................................................................... 14

viii
2.5 Indigenous chicken egg production and hatchability ....................................................................... 15
2.5.1 Meat Production of indigenous chicken ........................................................................................ 16
2.6 Pests and Diseases in indigenous chicken ........................................................................................ 16
2.7 Amino acids in chicken productivity ............................................................................................... 17
2.8 Aflatoxin residues in indigenous chicken products .......................................................................... 19
2.9 Indigenous chicken feeding trials .................................................................................................... 20
2.10 Indigenous chicken improvement strategies .................................................................................. 21
2.10.1 Feeding strategy and nutrition of chicken ................................................................................... 21
2.10.2 Probiotics in indigenous chicken nutrition .................................................................................. 23
2.10.3 Housing of indigenous chicken ................................................................................................... 26
2.10.4 Health and disease management of indigenous chicken .............................................................. 26
2.10.5 Marketing of indigenous chicken and Eggs ................................................................................ 27
CHAPTER THREE .....................................................................................................................29
MATERIALS AND METHODS ................................................................................................29
3.0 A comparative performance of indigenous chicken in Baringo and Kisumu Counties of Kenya ..... 29
3.1 Experimental Site and Research Locations ...................................................................................... 30
3.1.1 Description of the research locations: ........................................................................................... 30
3.2 Materials and Methods .................................................................................................................... 31
3.3 Results and Discussion .................................................................................................................... 33
3.3.1 Gender, education and age distribution of indigenous chicken farmers by County ....................... 33
3.3.2 Production systems, chicken ecotypes, feed types, health service provider and constraints
experienced by indigenous farmers ............................................................................................... 36
3.3.3 Performance of indigenous chicken .............................................................................................. 38
3.3.4 Market prices of IC products ........................................................................................................ 40
CHAPTER FOUR ........................................................................................................................42
TO OPTIMIZE THE NUTRIENT DIET FORMULATION USING LOCAL
FEEDSTUFFS FOR ENHANCED INDIGENOUS CHICKEN PERFORMANCE. ............42
4.0 Introduction ..................................................................................................................................... 42
4.1 Materials and Methods .................................................................................................................... 43
4.1.1 Extraction and determination of total free amino acids (TFAA) for feedstuffs ............................. 44
4.2 Results and discussion ..................................................................................................................... 44
4.3 Critical amino acids concentration in feed ingredients..................................................................... 47

ix
CHAPTER FIVE .........................................................................................................................51
DETERMINATION OF AFLATOXIN LEVELS IN THE FEEDSTUFFS FED TO
INDIGENOUS CHICKEN IN BARINGO AND KISUMU. ....................................................51
5.0 Introduction ..................................................................................................................................... 51
5.1 Materials and Methods .................................................................................................................... 52
5.1.1 Sampling of feedstuffs and extraction for aflatoxins test .............................................................. 52
5.2 Results and discussion ..................................................................................................................... 53
CHAPTER SIX ............................................................................................................................57
EFFECTS OF PROBIOTICS FEEDING TECHNOLOGY ON WEIGHT GAIN OF
INDIGENOUS CHICKEN IN KENYA .....................................................................................57
6.0 Introduction ..................................................................................................................................... 57
6.1 Materials and Methods .................................................................................................................... 58
6.1.1 Statistical model for Experiment ................................................................................................... 59
6.2 Results and Discussion .................................................................................................................... 59
CHAPTER SEVEN ......................................................................................................................63
THE EFFECTS OF DIETARY PROBIOTICS ON NATURAL IGM ANTIBODY
TITRES OF KENYAN INDIGENOUS CHICKEN .................................................................63
7.0 Introduction ..................................................................................................................................... 63
7.1 Materials and methods ..................................................................................................................... 65
7.1.1 Source of birds, feeding regime and management ........................................................................ 65
7.1.2 Natural antibodies (IgM) measurement......................................................................................... 65
7.1.3 Statistical analysis ......................................................................................................................... 66
7.2 Results ............................................................................................................................................. 66
7.2.1 Presence of natural IgM antibodies binding KLH in Serum of IC and effects of dietary
probiotics ....................................................................................................................................... 66
7.3 Discussion ....................................................................................................................................... 67
7.4 Conclusion ....................................................................................................................................... 69
CHAPTER EIGHT ......................................................................................................................70
CONCLUSIONS AND RECOMMENDATIONS .....................................................................70
8.1 Main findings................................................................................................................................... 70
8.2 Conclusions ..................................................................................................................................... 71
8.3 Recommendations ........................................................................................................................... 71

x
REFERENCES .............................................................................................................................72
APPENDICES ..............................................................................................................................85
Appendix 1: Indigenous Chicken Production and House Hold Survey:........................................85
Appendix 2: List of Abstracts ........................................................................................................89
Appendix 3. Effects Of Probiotics Feeding Technology On Weight Gain Of Indigenous
Chicken In Kenya .......................................................................................................90
Appendix 4: The effects of dietary probiotics on natural IGM antibody titres of Kenyan
indigenous chicken .....................................................................................................92
Appendix 5: List of extra tables .....................................................................................................93

xi
LIST OF TABLES
Table 1: Guidelines for the nutrient requirements of different ages and types of chicken ............24
Table 2: Recommended vaccination schedule for chicken ............................................................28
Table 3: Education levels by gender in the Counties (%) ..............................................................34
Table 4: Production Systems, chicken ecotypes, feed types, health service provider and
production constraints (%) ...............................................................................................37
Table 5: Performance of IC in different production systems .........................................................39
Table 6: Performance of IC by County ..........................................................................................40
Table 7: Mean Market price of IC products in Kes in April 2015. ................................................40
Table 8: % proximate composition of feedstuffs used and intake by IC .......................................45
Table 9: Feed intake, average daily gains and feed conversion ratio of IC in a cafeteria feed
trial....................................................................................................................................46
Table 10: Overall mean nutrient composition of feedstuffs given to indigenous chicken ............48
Table 11: % rate for the most limiting amino acids in feedstuffs given to indigenous chicken
aged 16-20 weeks .............................................................................................................49
Table 12: Cumulative weight gain means for indigenous chicken aged between 15-16
weeks, fed on Molaplus poultry microbes for chicken a period of 7 weeks ....................60
Table 13: The LSmeans and standard deviations (SD) of the dietary treatment of IgM titres
binding KLH.....................................................................................................................66

xii
LIST OF FIGURES
Figure 1: Map of Kenya showing the study Counties: Source-Internet D-Maps ......................... 32
Figure 2: Overall distribution of male and female farmers. .......................................................... 33
Figure 3: Education level by County ............................................................................................ 35
Figure 4: Farmers age distribution by County .............................................................................. 36
Figure 5: Aflatoxins levels in feedstuffs used in IC; B=Baringo, N=Kisumu .............................. 55
Figure 6: Cumulative weight gains for indigenous chicken fed on Molaplus poultry microbes. . 61
Figure 7: Weight gain trends for IC given molaplus poultry microbes for 4 weeks .................... 62
xiii
LIST OF ABBREVIATIONS
AA Amino Acids
ADG Average Daily Gain
CP Crude protein
DM Dry Matter
DMI Dry Matter Intake
EE Ether Extract
FCE Feed Conversion Efficiency
IC Indigenous Chicken
IgM Natural antibodies in serum
KALRO Kenya Agriculture &Livestock Research Organization
Kes Kenya shillings
ME Metabolizable Energy
MOLD Ministry of Livestock Development
NSP Non Starch Polysaccharides
SAS Statistical Analysis System
SPSS Statistical Package for Social Scientists
TA Total Aflatoxins
TAP Tatton Agricultural Park

1
CHAPTER ONE
INTRODUCTION
1.1 Background Information
Poultry is by far the highest number of livestock species worldwide, accounting for more
than 30% of all protein of animal origin consumed in the world (Mengeshaet al., 2011). The
estimated family population producing chicken in Africa is about 700 million, compared with 191
million for cattle, 182 million for goats, 158 millions for sheep and 15 million for pigs (FAO,
2000). Due to their availability in such large numbers, they make the greatest contribution to the
animal protein supply (Permin and Pedersen, 2010). The International Food Policy Research
Institute (IFPRI) estimated that by the year 2015 poultry will account for 40 % of all protein of
animal origin worldwide (Sonaiya, 1990).
In Kenya, 70% of approximately 31 million domesticated birds which are mainly kept by
the resource-poor living in the rural areas are indigenous chicken (IC) whilst improved chicken are
approximately 25% and mainly found in urban and peri-urban areas (Kingori et al.,2010). Out of
the estimated chicken population of 31 million, 25 million are indigenous chicken representing
81%, mainly reared under free range system (Gakige et al., 2015). Indigenous chicken are well
adapted to all ecological zones and nationally they contribute 47% and 55% of the total eggs and
meat consumed in Kenya respectively. The main constraints to small scale IC production include
poor nutrition, poor managerial skills, poor shelter, high overall mortality, low genetic potential for
traits which are important in productivity in different production systems and lack of market
information by farmers (Olwande et al., 2010). A good knowledge base exists on the nutritional
requirements of the exotic chicken but a few studies have been done on supplementation of
indigenous chicken in Kenya (Okitoi et al., 2008).
Feed resources for the scavenging indigenous chicken reared under the free range system
include diversity of insects, green grass, food wastes, leafy vegetables and broken mould cereal
grains that are high in mycotoxins (Khobondo et al., 2015). There are nutritional limitations with
these feeds that impact on the performance of IC. Digestibility is low due to presence of variable
levels of poorly digested ingredients and anti-nutritional factors. Anti-nutritional factors are inform
of aflatoxins, tannins and protease inhibitors present in substantial levels due to the variability in

2
chemical composition of these feeds. That could be as a result of both intrinsic and extrinsic factors
such as growing season, geographical location, growing conditions, post-harvest storage conditions
and period of storage (Badubi et al., 2006). Furthermore, the avian digestive system lack
endogenous non starch polysaccharides (NSP)degrading enzymes and the anti nutritional factors
thus interferes with digestion of other nutrients, especially proteins, fats and carbohydrates by
increasing the viscosity of digesta in the gut and by impairing the absorption of nutrients (Kabir,
2009).
The economic strength of IC lies in the low cost of production when compared to the value
of the outputs. The rearing of indigenous chicken has been presented as a promising tool for
poverty alleviation and improvement of livelihoods especially in the rural areas but the
development of the IC sub-sector has been widely neglected. Competition between animals and
man for limited supplies of grains and vegetable proteins have led to limiting the intensification of
indigenous chicken farming to exotic birds. For grain deficient countries like Kenya, the solution
may lie with the development of a feed technology for the IC sub-sector (Kingori et al., 2010).
Since indigenous chicken use very little space and low capital investment, there is renewed interest
in indigenous chicken farming as an alternative form of economic activity especially in
commercialization. Answers on how and what to best feed and supplement scavenging chicken on
free-range systems are therefore required in order to increase indigenous chicken production.
Feeding strategies for scavenging indigenous chicken are not clear although feeding
methods for egg type commercial pullets are at times used in scavenging indigenous chicken
situation and as pointed out, it is not economically viable to feed indigenous chicken with
commercial feeds as each production system requires its own feeding strategy (Okitoi et al.,2008).
Supplementing indigenous chicken provide an opportunity to develop a feeding strategy for
scavenging chicken and increasing their performance. The nutritional limitations like aflatoxins and
tannins in the cereal grains used by farmers to feed their indigenous chicken may be corrected with
use of mycotoxins binders and additives such as probiotics in the IC diet which improves
digestibility and apparent metabolisable energy (Alloui et al., 2013). Many rural communities keep
indigenous chicken in Kenya although the nutritional and management practices may differ from
one community to another. It is not clear how communities with different socio-economic
backgrounds approach the management of indigenous chicken and this need to be well understood
in order to come up with interventions geared towards improving productivity.

3
1.2 Statement of the problem
Pastoral and fishing communities keep indigenous chicken with varied challenges that need to be
understood in order to better and improve IC productivity. There are expected differences among
the fishing and pastoral communities in the two counties in terms of feeding strategies, production
systems and, therefore, there is need to document the nature and impact of the differences.
Reported poor performance of IC in free range production system may be due to lack of critical
nutrients such as amino acids and presence of aflatoxins in feedstuffs used by the farmers for
supplementation since most farmers supplement their IC with mouldy and broken cereal grains
which are not properly stored. Given the type of feeds the indigenous chicken are offered, it may be
possible that aflatoxicosis and lack of critical amino acids is affecting productivity and
growth.These nutritional limitations that negatively impact on the performance of IC may be
mitigated by the use of probiotics in avian diets (Ohimain et al., 2012). Taking the beneficial
effects of probiotics into account, the study aimed at testing the effects of use of probiotics as a
feed additive and supplementing the local feed resources available to IC plus their cumulative
effects on growth rates.
1.3 Objectives
1.3.1 Broad objective
To contribute to improved performance of IC through the use of locally available feedstuffs and
probiotic feed additives supplementation.
1.3.2 Specific objectives
1. To compare the production systems of farmers in Baringo and Kisumu Counties with
reference to farmers‟ profiles, available feedstuffs and feeding strategies.
2. To assess the performance of indigenous chicken in the production systems in Baringo and
Kisumu.
3. To determine the nutrient composition of feedstuffs used to feed the indigenous chicken in
Baringo and Kisumu.
4. To determine the levels of aflatoxins in the feedstuffs used to feed the indigenous chicken
in Baringo and Kisumu.
5. To determine the effect of probiotics inclusion levels on performance of indigenous
chicken from Baringo and Kisumu.

4
1.4 Hypotheses (Ho)
1. There are no differences in indigenous chicken keeping systems and farmers in Baringo
and Kisumu Counties with reference to farmers‟ profiles, available feedstuffs and feeding
strategies.
2. There are no differences in performance in the production systems used by the indigenous
chicken farmers in Baringo and Kisumu Counties.
3. There are no differences in the nutrient composition of the feedstuffs used to feed
indigenous chicken in Kisumu and Baringo Counties.
4. There are no aflatoxins in feedstuffs used to feed the indigenous chicken in Baringo and
Kisumu Counties.
5. Probiotics inclusion in the feeds has no effect on the performance of indigenous chicken in
Baringo and Kisumu Counties.
1.5 Justification
Indigenous chicken primarily depend on feed resources they obtain from scavenging which
are characterized by inadequate quantity and quality of nutrients (Gakige et al., 2015). Data and
literature on nutritional requirements are available for exotic poultry but there is very little
documented information for indigenous chicken (Okitoi et al., 2008). Studies on nutrient
requirements and feed intake of free range chicken done have indicated that there is a deficit in
protein intakes (King‟ori et al., 2010). Use of additives, locally available feed resources and
supplementation should be studied to improve performance of indigenous chicken and therefore
formulation of balanced feeds for chicken under free range is necessary. (Okitoi et al., 2007).
Given that the demand for indigenous chicken eggs, meat and income generation is high, there is
need to study and find out if supplementation with locally available feedstuffs and use of additives
like probiotics in indigenous chicken feeds can improve indigenous chicken productivity
andhencecome up with the correct formula for feeding and supplementing indigenous chicken
sustainably.

5
1.6 Scope of the study
The study was confined to all farmers that keep indigenous chicken within Kisumu and
Baringo Counties of Kenya. This is because the farmers from the two Counties are known to have
different economic activities such as fishing and pastoralism respectively. The study focused its
view on indigenous chicken performance with the use of a questionnaire whose main features
were; commonly used feedstuffs, household characteristics such as age, gender and education,
purpose of keeping chicken, livestock size, flock management, performance parameters, feeding
practices and prices of eggs and live birds. Baringo County is located in the former Rift Valley
Province of Kenya and its coordinates are 0o 28‟N 0” North 35
o 58‟0‟East and has a population of
555561, the coordinates for Kisumu are 0o 6‟ South 34
o 45‟ East and has a population of 968,909
(Kenya National Bureau of Statistics, 2009). Kisumu is the third largest City in Kenya, the
principal City of western Kenya and the immediate former capital of Nyanza province.
1.7 Limitations of the study
Difficulties in implementing the research project arose and operational funds were not
availed adequately in time, therefore it was difficult to achieve the objectives of the project on
time. On farm performance and evaluation depended on the willingness of the farmers to
cooperate. It was assumed farmers were willing to participate and would avail information about
their farming practices on indigenous chicken. A disease outbreak also occurred during the trials
that resulted in some mortality.

6
1.8 Definition of terms
Aflatoxins: Refers to a particular group of mycotoxins produced by some species of the genus
Aspergillus. There are four major aflatoxins named B1, B2, G1, G2 plus two additional metabolic
products known as M1 and M2 that are of significance as direct contaminants of foods and feeds.
Age at Crow: The age a rooster will first crow varies, but generally speaking, he will begin
crowing at about four or five months of age, it can certainly vary considerably, though some can
hold off crowing until they're eight or nine months old and others may start as early as two months.
This is determined by many factors, including breed, hormones, age, and the number of roosters in
the area.
Antibiotics: Are, also called antibacterials. They are a type of drug used in the treatment and
prevention of bacterial infection in animals. They may either kill or inhibit the growth of bacteria.
A limited number of antibiotics also possess antiprotozoal activity. Antibiotics are not effective
against viruses such as the common cold or influenza, and may be harmful when taken
inappropriately.
Critical amino acids: These are amino acids that are needed by chicken and are also called
essential amino acids. The birds are not capable of making these particular amino acids on its own,
so it‟s critical that they eat feeds that contain these compounds. The four essential amino acids in
chicken are: Lysine, Methionine, Threonine and Tryptophan.
Indigenous chicken: It is a term used to describe a mix-breed chicken commonly found in villages
throughout the world. Traditionally, it is used to describe the indigenous chicken which is a mixed
breed of various breeds of chickens indigenous to any part of the world. The chicken (Gallus
gallus domesticus) is a type of domesticatedfowl, a subspecies of the red jungle fowl. It is one of
the most common and widespread domestic animals, with a population of more than 19 billion as
of 2011. Humans keep chicken primarily as a source of food, consuming both chicken meat
andeggs.
Ecotype: In evolutionary ecology, an ecotype, sometimes called ecospecies, describes a
genetically distinct geographic variety, population or race within a species, which is adapted to
specific environmental conditions. Typically, indigenous chicken ecotypes exhibit phenotypic
differences (such as in morphology or physiology) e.g. dwarf size, naked necked, normal

7
feathered, fizzled feather and mottled feather, stemming from environmental heterogeneity and are
capable of interbreeding with other geographically adjacent ecotypes without loss of fertility or
vigor.
Feed additives: These are ingredients added to feed for purposes other than nutritive value, that is,
they do not provide nutrients but may increase nutrient utilization efficiency. They vary widely in
nature and may be organic or inorganic, natural or synthetic. Their effect may also be singular or
multiple in nature and can be added to the feeds at any stage during processing or even in drinking
water or in feeds.
Feeding Strategy: Is a complex behaviour and morphology best suited to gather food energy in a
particular environment which considers four key aspects such as the optimal diet, optimal foraging
space and period and optimal foraging group size for optimization of production.
Free range system: A system whereby during daytime birds roam freely close to the homestead,
they are supplemented with varying levels of energy and proteins, split or phase feeding may be
done and during the night they are confined in small houses.
Fishing community: A fishing community is a community that is substantially dependent on, or
substantially engaged in, the harvest or processing of fishery resources to meet social and
economic needs; the fishing vessel owners, operators, crew and fish processors that are based in
such a community.
Hatchability: Hatchability is described as the percentage of eggs surviving to the time of hatching
that produce a chick. It is commonly used to evaluate hatchery (and breeder flock) performance.
Simply said, percentage hatchability = (number of chicks/number of hatching eggs) * 100.
Kienyeji mash: This is a Swahili term for growers mash made from a mixture compounded local
feedstuffs (such as ochonga/omena, sorghum grain, millet grian, rice bran and maize bran) used for
feeding indigenous chicken from each specific ecological area.
Omena/ Ochonga: The silver cyprinid, Rastrineobola argentea, is a species of ray-finned fish in
the familyCyprinidae, the only member of the genusRastrineobola. It is found in the Lake Victoria
of Kenya, Tanzania, and Uganda. Its local names are omena (Kenya), dagaa (Tanzania), and
mukene (Uganda). It is an important fish in the diet of people in eastern and southern Africa. The

8
fish is caught during moonless nights and in the morning it is sold to women who spread it out for
drying in the sun. This takes one day or more, depending on the weather. Unfortunately, the best
catches are made during the rainy season when drying is difficult resulting in lower quality of the
dried product. The lowest quality known locally as ochonga (Kenya) is usable as chicken feed.
Pastoralism:Theherding or tending of cattle as a primaryeconomicactivity or occupation.
Performance: Include both reproductive and productive indices such as: Growth rates (measured
by body weight gain, feed conversion ratio, protein efficiency ratio, final size/weight), Feed
conversion efficiency, Age at crow/sexual maturity, age at laying, number of eggs per year, size of
clutch, length between two laying cycles, egg hatchability and average number of chicks weaned
per hen/mortality rates/flock sizes.
Point of Lay: Point of lay is a vague description of pullets that are in the process of developing to
an age where, in the near future, they will become mature and therefore start producing eggs. The
average age for chicken to come into normal lay is around 22-24 weeks, but this does depend on
the breed, the time of year and, in some cases, how they have been reared.
Prebiotics: Are defined as a non-digestible food ingredient that beneficially affects the host by
selectively stimulating the growth and/or activity of one or a limited number of bacteria in the
colon. Prebiotics are meant to provide a substrate for beneficial gastrointestinal microbes. Large
amounts of bacteria present in the monogastric small intestine are potentially capable of utilizing
these indigestible carbohydrate sources for energy.
Probiotics: Are defined as any feed additive with live microbes which affect the host animal
beneficially by improving its intestinal microbial balance.

9
CHAPTER TWO
LITERATURE REVIEW
2.0 Ancestry and global distribution of indigenous chicken
Chicken were first domesticated in South East Asia about 7500 years ago for food (eggs
and meat), religious or ceremonial purposes and recreation e.g. cock fighting. The main ancestor of
the domestic chicken (Gallus domesticus) is the red jungle fowl. Chicken originated from four wild
ancestors namely; Gallus gallus (main ancestor) from South East Asia (most likely North East
China), Gallus varius, Java or the green jungle fowl, Gallus lafayette, Ceylon or the Lafayette‟s
jungle fowl, and the grey jungle fowl (Gallus sonneratii). Chicken then spread from North East
China to Europe then Africa as was facilitated by colonialists who moved with chicken to Africa
(Gakige et al., 2015).
In South-east Asia, chicken are normal inhabitants of villages and sub-urban areas of cities.
Indigenous chicken kept under village based conditions, are still important especially in Indonesia,
Thailand and the Philippines (Ondwassy et al., 1999). Consumption patterns of these chickens are
said to be dictated by traditions, where their preferred use is during customary and religious
festivals or in honour of visitors or during family celebrations. Small holder poultry is
commanding an important role in the socio-economic life of citizens in Central American countries
such as Guatemala, Brazil and Honduras as a source of domestic animal protein. In Africa
indigenous chicken are widely distributed across the continent (King‟ori et al., 2010).
The estimated population of indigenous chicken vary from region to region and country to
country. Difference in flock sizes within the same area would be expected because chicken
populations fluctuate with time and season. Of the total population of chicken in the different
African countries, indigenous chicken make 95 percent in Ethiopia, 90 percent in Kenya and 93
percent in Tanzania (King‟ori et al., 2010). The birds are abundant and readily available in rural
areas albeit in small flocks of about 10-15 birds per household. The stock consists of 10 percent
cocks, 30 percent hens and 60 percent young stock respectively (Gakige et al., 2015). They are
found in most ecological zones and are kept by 90 percent of the rural population (King‟ori et al.,
2010)

10
2.1 Overview of indigenous chicken production in Kenya
The subsistence sector of poultry production in Africa is based on indigenous chicken
while the commercial sector is based on exotic chicken. Indigenous chicken make up between 70-
90 % of poultry population in Africa. In Kenya, 90 percent of the population keep poultry, 23% of
these keep exotic chicken, which produce 40% and 12% of the eggs and meat respectively.
Indigenous chicken in Kenya make 72% of the total population of poultry and in the year 2000
were estimated at 20.6 million (MOALD, 2000). They contribute 56% and 36% of the total poultry
meat and eggs production respectively (King‟ori et al., 2010). They are found in virtually all the
ecological zones and kept by 90% of the rural population. There has been poor development of
commercial poultry production in developing countries due to unavailability of good quality feed
and high prices of poultry feeds. Low consumption of eggs and poultry meat due to their high
prices is another drawback, besides lack of market infrastructure and sufficient credit allocation to
poultry production due to risks involved in the business (Gakige et al., 2015).
The productivity of indigenous chicken is low in terms of egg production, growth rate and
survival of chicks (Okeno et al., 2011). The reason for the low productivity is partially due to the
comparative little scientific research and development work carried out on indigenous chicken,
technologies applicable to indigenous chicken that have been developed but are poorly
disseminated to the farmers (Okitoi et al., 2008). The technologies are required for cost effective
feeding, disease control and housing. High chick mortality, unsuccessful brooding and periodic
wiping out of the birds by disease outbreaks reduce the efficiency of the extensive system. Despite
these, in developing countries there still remains a tremendous potential for increasing productivity
of indigenous chicken through providing appropriate housing, disease control, good nutrition and
genetic improvement (Khobondo et al., 2015).
2.2 Population and distribution of indigenous chicken in Kenya
Indigenous chicken is the dominant variety of chicken raised in developing countries like
Kenya especially in rural areas and of 21 countries in Africa reported, indigenous chicken
contributed more than 70% of the total chicken population in 18 countries (Okeno et al., 2012).
Indigenous chicken still make up more than 74% of all the chicken raised in Kenya despite the
introduction of exotic chicken in the 1920 with estimated poultry population of over 37 million
chicken (Nyaga, 2007). For most of the chicken kept, over 31 million are indigenous chicken,

11
which are kept by 90% of rural communities under free range conditions. Most households in
Kenya have at least 10 indigenous chicken but there is a large variation in the flock size ranging
from 1 to 81 with a mean size of 22 chicken per household (Okeno et al., 2011).
Chicks form the largest proportion of the flock of 35.6% while cocks are the least at 9%.
By the year 2006 there were an estimated 3.1 million layers, 2.1 million broilers and 31.4 million
indigenous chickens in Kenya (Nyoni et al., 2012). The balance is composed of other poultry
species such as ducks, geese, ostriches, pigeons, turkey, quails etc. Under improved housing,
disease control and feeding, egg production from these local birds could be increased to 150 eggs
per bird/year (Goromela et al., 2007). Commercial birds consisting of hybrid broilers and layers
are kept in the peri-urban areas of the major towns such as Nairobi, Nakuru and Mombasa. These
commercial birds make up to 26 percent of the poultry population where most farmers keep from
300 to 2,000 broilers and 100 to 1000 layers per batch and in most cases less than 500 layers
(Nyaga, 2007).
2.3 Production systems of indigenous chicken in Kenya
Indigenous chicken are kept under low-input low-output production systems, they are kept
under different management systems but may be broadly classified into 3 main categories namely:
intensive, semi intensive and extensive or scavenging or free ranging systems of production.
Different authors have their own way of describing each of the systems, but the classification is
broadly based on the flock size and input-output relationship (Islam et al., 2014).
Extensive chicken production is one of the most appropriate activities for the rural women,
youth, landless and farmers for whom they provide an income and are credited for their
adaptability in their management (King'ori, 2004). In Sub-Saharan Africa, more than 70% of the
ownership of indigenous chicken is in the hands of women as in most communities; women have
total control over the Indigenous chicken in terms of production, consumption and sale of products
(Dessie, 1996).
2.3.1 Free ranging production system
In most cases the chicken are let out in the morning to look for feeds (scavenge) and only
confined at night. They scavenge for insects, food wastes, green grass, leafy vegetables and any
scattered grains (Gakige et al., 2015). Occasionally they are supplemented with household wastes,

12
maize, cowpeas testa, amaranth seeds, plantain peels, millet, sorghum, ripe pawpaw seeds, cassava
meals, cereal bran, oil seed meals, brewer‟s grain, damaged wheat and fish meal (Nzioka, 2000).
The supplements are either broadcast on the floor or put into improvised feeders once or twice a
day, sometimes junks of anthills harbouring termites are brought home from fields (King‟ori et al.,
2010).
Drinking water is irregularly provided in tins or broken clay pot pieces. In management of
free ranging, indigenous chicken in particular, scavenging has been recognised as the major source
of feed in small holder poultry production (Ndegwa et al., 2012). All the age categories live and
scavenge together. There is no regular changing of breeding stock resulting in high level of
inbreeding (Okeno et al., 2012). The replacement stock originates from hatching own chicks or
from neighbours. There is no specialised housing for these birds but often, simple structures to
protect them from predators and bad weather are provided. Sometimes half drums without air
inlets placed under the bed are used for protecting them from predators. At times no shelter at all is
provided and chicken perch on high places and even on trees in home compound although this is a
rare occurrence.Other disadvantages of free range system include: losses of chicken or eggs,
chicken lay their eggs everywhere and are susceptible to predators, disagreements among
neighbours during cropping seasons as they destroy crops, easy spread of diseases, difficult to
control disease outbreaks and no control of inbreeding (King‟ori et al., 2004).
2.3.2 Semi intensive system
This system of production is practised in small households where families are more able
financially than the rest of the households who practice the free-range system. The indigenous
chicken reared under this system is sometimes crosses between the indigenous and the exotic
chicken. Scavenging can be for a few hours hence partial confinement is practiced during the day
and confined in shelters such as paddocks and folds or arcs; a system in which structure called fold
or arc is made for the chicken made of wire mesh to enhance feeding of grass, contain laying nests,
feeders and breeders. The fold is usually moved from one place to another (Okitoi et al., 2007).
A paddock is a systemwherethefield is enclosed and a house is raised at the centre for the
chicken to sleep in. Facilities like feeders and laying nets are put in the house and supplementation
of feeding is done in the house.Some improvements include;

13
a. Supplementary feeding during good grain harvest, thus there is supplement on protein and
energy. Grinded maize and protein source incorporated inform of soya bean and fish meal
thus a boost in the indigenous chicken growth and performance
b. Some form of disease control is done in form of vaccination and against internal parasites
which is important to enhance immunity (Okitoi et al.,2007).
2.3.3 Intensive system
Intensive system is practised near urban centres where market for eggs and meat is
available. The system requires high capital input in terms of housing, equipment, day-old chicks,
veterinary drugs and vaccines, commercial feeds and skilled personnel to achieve the high
production potential. The fluctuation of intensive poultry production is mainly due to unstable
product prices, high cost of feeds and fluctuating feed quality that is precipitated by climatic,
economic and political factors (Gakige et al., 2015). Characteristics of intensive system include
large number of chicken in a limited area, they have no access to runs and are fed on complete
rations. Examples of intensive system include deep litter, battery cage and slatted floor. The
intensive system began in 1930 and it is reported that most chicken suffer rickets and lay weak
shelled eggs because of lack of calcium, phosphorous and vitamin D (Kitalyi, 1998).
Battery cage system is the most intensive of all systems. Principle is based on confinement
of birds in cages, the number of birds per cage varies from one to four depending on the size of the
birds, size of the cage and farmers preference. The cages are arranged the whole length of the
building and placed in tiers completely off set such that they rest on top of another. The lowest
cage should be at least 0.75 -1m above the ground to allow easy cleaning. There should be enough
space between the cages to allow for walking at least 0.75 to 1 m apart. Some merits of battery
cage system include; operation can be mechanized for feeding and watering thus less human labor,
space economy reduce feed consumption, reduced risk of infections, allows better flock
supervision, clean eggs are laid, bird monitoring and broodiness is minimized (Mengesha, 2011).
In the deep litter system, chicken are kept under confinement without access to runs in a large
house without partition but has absorbent litter. The house can be permanent or fabricated with
wooden materials or iron sheets. The front side of the house and other side-two-thirds should be
sealed to the top and the remaining side should have wire mesh. The floor should be concrete for
easy cleaning and to keep away parasites. Litter should be able to absorb 40% of its weight and
remain dry. Litter materials commonly used are wood shavings, sawdust, chopped straw, dry

14
coffee husks, crushed maize cobs and dry rice husks. Litter at the beginning should be 2.5 cm in
thickness. It will increase due to droppings from birds, feed spillages and for broiler the thickness
builds up to 10 cm and layers to 40-45 cm. Facilities in litter houses include; feeders, watering
drinkers (fountain type, trough type and permanent channel type), perches or roosts, nests, grit and
shell container and dust birth pot or a hole in the ground filled with clean sand or ashes. Wooden
mesh or wooden slatted floor or raised floor are recommended due to animal welfare ban of battery
cage system, hence this housing system is advocated for (Kitalyi, 1998).
2.4 Indigenous chicken Phenotypes
The breeding system among the indigenous flocks is characterized with unplanned multiple
matings of various domesticated breeds, introduced into an area and this has made it difficult to
standardize IC characteristics and performance (Khobondo et al.,2014), thus indigenous chicken
form a very heterogeneous population (Okeno et al., 2011). Distinct local breeds have been
reported in Egypt, Morocco, Sudan and Cameroon. Although they have been given names, the
names seem not to be representing true breeds but they are more of phenotypic descriptions
(Chemjor, 1998). They exhibit a wide variation in size, plumage, comb-style, skin colour and
many other characteristics as seen in Plate 1 (Khobondo et al.,2015).
Mature weight for IC is variable but cocks are generally heavier than hens at maturity.
Khobondo et al., (2015) reported a live weight of 4.5kg and 2.7kg for cocks and hens respectively
for Indian chicken while Okeno et al., (2011) reported 2.6kg and 1.8kg for cocks and hens
respectively for Kenyan IC. Khobondo et al., (2014) showed that indigenous chicken originating
from a composite of indigenous chicken from Kericho, Nyeri and Taita Taveta weigh 2.0kg and
1.8kg for cocks and hens respectively. Gakige et al., (2015) further observed that naked-neck birds
tend to be heavier than the normal feathered ones. Okeno et al., (2012) reported that naked-neck is
a feature of some breeds, while others have naked or nearly naked thighs. They further observed
that the plumage colour varies widely with black; brown intermingled with red or gold. On the
same plumage, Nwosu et al., (1985) observed that the commonest plumage patterns of native
chicken of Nigeria were black, red or brown with various colours and mottling.
The head appendages of cockerels are relatively large but those of hens are small. King‟ori
et al., (2010) observed a considerable variation in comb-style, length and colour, wattles, earlobes
and beaks. He further notes that the overall comb length and height for cocks is 6.3 cm and 4.88

15
cm, respectively as compared to 3.64 cm and 1.63 cm for hens. Almost all combs and wattles
irrespective of plumage colour are red. Some proportions are mottled-red with white and black
spots. The majority of indigenous chicken have red earlobes. Other earlobes colours include white
and mottled-red occurring in small proportions. Black tends to be the most common beak colour.
Colour of the skin is generally white, yellow and red, with most of them having a cream skin.
Black and cream are the main feet and toe colours (Wondmeneh et al., 2015).
2.5 Indigenous chicken egg production and hatchability
In Kenya, the ages at first point of lay range from 154-196 days with approximately 60
percent of the pullets laying their first egg between 162-168 days (Okeno et al., 2011). The hen
lays a clutch of 10-12 eggs, they then become broody and sit on them. This is repeated 3 or 4 times
a year (King‟ori et al., 2010). At the traditional farm level, average egg production of indigenous
chicken in Kenya and Ethiopia is about 40-60 per year, but under improved housing, disease
control and feeding, egg production of indigenous chicken can be increased to about 150 eggs
(Khobondo et al., 2014). Badubi et al., (2006) reported an average egg weight of 49.3g and further
observed that naked-necked hens lay larger eggs weighing 52.3g on average. These egg weights
are in agreement with the conclusions by King‟ori et al., (2010).
Broodiness is a common feature of local chicken and the main cause of low egg production
because nearly half the life of a good laying hen is spent sitting on the eggs and brooding her
chicks (Chemjor, 1998). Broodiness is however essential for the farmer to increase the flock under
prevailing conditions. Brooding has been eliminated in highbred birds through selection and
breeding (Khobondo et al.,2014). To increase egg production in indigenous chicken, broodiness
should be suppressed. This may be achieved by isolating the hen in the small cage fixed about a
meter high above the rest of the flock. Feed and water is provided ad libitum then broodiness
would disappear after 3-4 days (Lauder, 1967). In the traditional village based systems, harsh
measures to discourage broodiness have been applied including immersion in cold water, hanging
the bird upside down, starving the hen and pulling out the vent feathers. These measures seem to
be too harsh for the purpose and may stop egg production completely or lead to death (King‟ori et
al., 2010).
In Kenya, hatchability ranges between 40-90 percent (Khobondo et al., 2015). Fertility and
hatchability of eggs are important in the production of indigenous chicken under the free-range

16
system where the replacement stock originates from hatching own chicks (King‟ori et al., 2010).
Fertility and hatchability are major parameters of reproductive performance that are most sensitive
to environment and genetic influence (Okeno et al., 2011). Factors affecting hatchability and
fertility include: plane of nutrition, condition and length of storage of eggs, strain, egg quality and
mating ratio. The diet mainly affects the number and size of eggs and egg size affects hatchability
(Khobondo et al., 2015). Hatchability for smaller eggs is lower compared to that of medium and
large eggs (Asuquo et al., 1993). Eggs stored for 1-15days at 12oC have a higher hatchability than
eggs stored for same duration but under higher temperatures (Leonarz, 1945). Poor shell quality
decreases hatchability and the effect is more evident when egg shell surface area to egg volume is
low (Okeno et al., 2011). Hatchability percentage varies between large (51-56g), medium (45-50g)
and small eggs (37.5-44g) from 88.2%, 84.2% and 72.1% respectively (Asuquo et al., 1993).
2.5.1 Meat Production of indigenous chicken
Information on meat production potential of indigenous chicken stock is limited however, it
is recognised that the Indigenous chicken are the major source of white meat production in Kenya
(Khobondo et al., 2015). Indigenous chicken account for about 85% of total poultry slaughtered in
Kenya, the other percentage being contributed by broilers (8%) and culled layers, 7% (Gakige et
al., 2015). Indigenous chicken are mainly kept for meat as illustrated by the fact that over 50
percent do not collect the eggs but leave them for hatching. Consumers prefer meat from
Indigenous chicken because of its characteristic leanness, pigmentation and flavour, there are also
few or no cultural and religious taboos relating to the consumption of poultry meat (King‟ori et al.,
2010).
2.6 Pests and Diseases in indigenous chicken
The problem of pests such as lice, chicken mites, fowl tick and stick tight fleas is also
prevalent among village based domestic fowl, sometimes causing death in chicks (FAO, 2007).
Pest infestation is controlled by good sanitation in the house and regular dusting by insecticides.
Usually the types of the housing structures such as mud walled and mud floor does not allow for
the maintenance of proper sanitation and there is also no regular dusting and giving of antibiotics
to the chicken. Mortality of the hatched chicks is usually very high (Okitoi et al., 2007).The time
of the year with the highest mortality in Kenya, is between November-December dry season and
during August, dry and cool season (Okitoi et al., 2007). Newcastle disease (NCD) is the most

17
prevalent and fatal in poultry in Kenya. The control of NCD is possible through vaccination and
vaccines are available at district and divisional veterinary offices and also at private local chemists
(Ondwassy et al., 1999).
However very few smallholder producers of indigenous chicken do vaccinate their poultry
since many of them are not aware that NCD can be controlled by vaccination. The vaccine requires
storage under refrigeration and packaged in different doses for chicken, the least dose packaged
being for 100 birds. This packing poses a limitation for the use of vaccines of NCD. There are no
routine vaccinations to control such infectious diseases. Treatments available are based on herbs
and human drugs (Okitoi et al., 2007). Chick mortality rates are high and a large number are due to
predation and accidents because they are rarely confined during the day. The major predators for
mature and young birds are feral cats and birds of prey such as hawks. It‟s estimated that about 15
percent and 40 percent adults and young stock respectively are lost annually (King‟ori, 2004).
Daytime housing of chicks improves productivity as a result of reduced predation. The gain of
reduced predation by confinement of chicks in simple pens is sufficient to cover the cost of
constructing them (Okuthe, 1999). Generally problems of disease may be attributed to lack of
technical know-how on managerial aspects of poultry keeping and to a smaller extent the farmers
ignorance, but mortality in indigenous chicken results mainly from predators and NCD (Chemjor,
1998).
2.7 Amino acids in chicken productivity
In poultry, 20 amino acids are needed to form body protein, some of which can be
synthesized by the bird (non-essential), whereas others cannot be made at all or in sufficient
quantities to meet metabolic needs (essential). Essential amino acids must be supplied by the diet,
and a sufficient amount of non-essential amino acids must also be supplied to prevent the
conversion of essential amino acids into non-essential amino acid. Additionally, if the amino acids
supplied are not in the proper or ideal, ratio in relation to the needs of the animal, then amino
acids in excess of the least limiting amino acid will be deaminated and likely used as a source of
energy rather than towards body protein synthesis. This breakdown of amino acids will also result
in higher nitrogenous excretions (Kimball et al., 2006).

18
Amino acids which are said to be essential cannot be synthesized by the bird. These
essential amino acids must therefore be fed in order to supply the building blocks needed in the
synthesis of body proteins thereby supporting growth. Once digested and absorbed, amino acids
are used as the building blocks of structural proteins (muscle, skin, ligaments), metabolic proteins,
enzymes and precursors of several body components. Because body proteins are constantly being
synthesized and degraded, an adequate amino acid supply is critical to support growth or egg
production (Todd et al., 2008). When supply of a single amino acid does not meet the bird‟s
requirement, it is considered to be “limiting”. At any given physiological stage of growth or age, a
specific amino acid profile is needed to support optimal growth, with no limiting amino acids or
surpluses. This profile has been termed an “ideal” ratio, or “ideal protein”. It is expressed as an
ideal ratio to lysine, from which the essential amino acid relationship to lysine remains relatively
unaffected by diet, environment, gender, and genetic background. Therefore, to minimize nitrogen
excretion, the “ideal” combination of essential and non-essential amino acids are needed to meet
growth and egg production by the bird. However, due to available feedstuffs and a limited number
of supplemental amino acids it is difficult to provide this optimal ratio to the bird (Tamminga,
2011).
Pierre et al., (2009) demonstrated that mild deficiencies of protein; lysine, threonine,
methionine in layers lead to small increase in intake and animals adapt very quickly (days in
layers) to such limited content variations. However, deficiencies in essential amino acids,
particularly tryptophan and methionine for broilers and layers strongly affect feed intake (Adi et
al., 2014). Excess dietary protein is often monitored through the plasma branched chain amino acid
levels such as leucine which are not metabolised in the liver. High levels of plasma leucine have
been demonstrated to activate intracellular receptor which will lead to a depressed food intake and
enhanced energy expenditure (Kimball et al., 2006). The dietary requirements for crude proteins
are actually requirements for the amino acids contained in the protein. Amino acids obtained from
dietary protein are used by the chicken to fulfil a diversity of functions such as growth, meat or egg
production. Protein is a key nutrient and its deficiency in a feed reduces growth (Todd & Roselina,
2008). There is therefore need to formulate rations that will fulfil all the nutritional requirements,
including protein and energy for growth.

19
2.8 Aflatoxinresidues in indigenous chicken products
Aflatoxins (AF) are mycotoxins that are produced by various Aspergillus species including
A. flavus, A.parasiticus and A. nominus. As secondary metabolites of these fungi, AF may
contaminate a variety of food and feedstuffs, especially corn, peanuts and cottonseed. Chemically,
aflatoxins are difuranocoumarin compounds and include aflatoxin B1, B2, G1, G2, M1 and M2
depending on their structures. Toxigenic Aspergilus flavus isolates generally produces aflatoxins
B1 and B2, whereas A. parasiticus produces aflatoxins B1, B2, G1 and G2. The major hosts of A.
flavus among food and feed commodities are cereal grains, rice germ, cotton seed, peanut and
protein sources such as rapeseed meal, soyabeen meal, cotton seed meal, sunflower meal, corn
gluten meal, copra meal, and palm kernel meal (Anjum et al., 2012).
Aflatoxin producing fungi utilize the nutrients present in the ingredients for their
metabolism and propagation, and thereby reduce the nutritional quality of the feed ingredients.
Indigenous chicken feedstuffs such as rice, maize and sorghum cultivation, are practiced in sub-
tropical environment which are characteristically warm and humid. They are generally dried after
harvesting, but under inappropriate storage conditions, they can be ideal substrates for mycotoxins
producing fungi, therefore they can be contaminated with fungi during cultivation and subsequent
handling if conditions are favorable. Most farmers supplement their chicken with mouldy and
broken grains that are not utilized by humans that may contain mycotoxins (Khan etal., 2011).
Aflatoxins sub types B1, B2, G1 and G2 present significant danger to humans if the
concentration is at a high level. Aflatoxin B1 is the most toxic and has been implicated in human
health disorders such as hepatocellular carcinoma, aflatoxicosis, Rey‟s syndrome and chronic
hepatitis (Helica Total Assay Kit, 2011). The International Agency for Research on Cancer (IARC,
1993) has designated AFBI as carcinogenic to humans. To ensure food safety in the European
Union the maximum aflatoxins level have been set within the commission Regulation No.
1881/2006. The limit for total aflatoxins in grains intended for direct consumption is 10 parts per
billion (European Commission, 2006). The United States Food and Drug Administration (FDA)
has established guidelines for the maximum toxin level that can be safely fed to immature poultry
in Corn & peanut products as 0.02 mg/kg or 20 ppb. Mycotoxins of importance causing
contaminations found world-wide, generally occurs in the tropical and sub-tropical regions in the
world. They are often found as natural contaminants in raw ingredients of poultry feed (Khan

20
etal.,2011). Poultry are highly susceptible to mycotoxicoses caused by aflatoxins (TA) and
ochratoxins (Anjum et al., 2012).
In chicken, Total Aflatoxins impairs most of the important production parameters including
weight gain, feed intake, feed conversion efficiency, pigmentation, processing yield, egg
production, and male and female reproductive performance (Hussain et al., 2010). As a common
rule, poultry should not get more than 10ppb total aflatoxins in the feed. Aflatoxin contamination
in feed may cause reduction of immune response in chicken, thus they become vulnerable to
several diseases (Dhanasekaran et al., 2009). Fungi producing aflatoxin utilize thenutrients present
in the ingredients for their metabolism and propagation, and thereby reducing the nutritional
quality of the feed ingredients (Akande et al., 2006).
2.9 Indigenous chicken feeding trials
Feeding trials as techniques in evaluating nutritional value of feedstuffs are very essential
in formulating livestock rations. They measure the effect of feed on production or growth
performance of animals. Before inclusion of any ingredient within the ration to be formulated, its
effectiveness on animal performance has to be assessed (Goromela et al., 2007). This can either be
through long-term or short-term feeding trials. The animals are given the conventional feed with
ingredient of interest at varying levels and their response in terms of performance (weight gain,
feed intake and feed conversion ratio) is monitored and compared to performance when fed on
conventional feed alone (Oviedo-Rondón and Waldroup, 2002).
Feeding trials can either be done on-farm where sometimes farmers are left in charge of
feeding the animals while the researcher only collect and analyze data or can be on station under
controlled environment. In this case, the researcher is in charge of all activities appertaining to the
study all the way from feeding the animals, data collection and analysis (Ramla et al., 1994).
Nutritional value of any feedstuff partly depends on its ability to release nutrients to the animal
(provided that nutrients are not limiting) for utilization following digestion. This ability is
consequently determined by digestibility of the feedstuff. Digestion trials are therefore sometimes
conducted during feeding trials to measure the digestibility of feed ingredient that is to be included
within a ration during feed formulation (Ghulam et al., 2014).

21
2.10 Indigenous chicken improvement strategies
2.10.1 Feeding strategy and nutrition of chicken
Chicken nutrition and feeding is an important part of production. Feeds account for
approximately 70 percent of the total cost of production and good nutrition is reflected in the bird's
performance and its products (Leeson and Summers, 2001). To optimize the feeding management,
dietary requirements should be determined by the age and type of poultry, as these differences
require that each diet be formulated to have specific quantities of required nutrients. Some
feedstuffs are high in one nutrient but low in another, which is why chicken feed is comprised of a
variety of feedstuffs. In addition to the nutrient composition of a diet, other factors such as the
physical form of the diet and storage needs of the feed may influence diet quality (Anjum et al.,
2012).
The most convenient way of feeding chicken is with a balanced pelleted ration, whether
they are confined indoors or allowed to range outdoors. Most diets contain corn for energy,
soybean meal for protein, and vitamin and mineral supplements. Commercial rations often contain
antibiotics and arsenicals to promote health and improve growth, coccidiostats for combating
coccidiosis, and sometimes mold inhibitors. In the industry, the feed is pelleted so the bird can eat
more at one time. Chicken are nibblers and make frequent trips to the feed trough for small meals,
which requires energy. Pelleting reduces the amount of energy required for a bird to feed (Cheeke,
1991).
Different rations are often used, depending on the production stage of the bird. Starter
rations are high in protein which is an expensive feed ingredient are given to chicks from 0-4
weeks old. However, grower and finisher rations can be lower in protein since older birds require
less. A starter diet is about 24% protein, grower diet 20% protein, and finisher diet 18% protein.
Layer diets generally have about 16% protein. Special diets are available for broilers, pullets,
layers, and breeders. Access to clean water is important ad libitum. Levels of total dissolved solids
above 3000 parts per million in the water can interfere with poultry health and production. The
quality of the protein is important since it is made up of individual amino acids, some amino acids
being essential to bird health (Oliveira et al., 2000).
For home-mixed rations, some producers decide to mix their own rations such that only
local natural ingredients are used. Ration balancing of home-made diets is important, to achieve

22
the right amounts of nutrients. If diets are not properly balanced, then birds will suffer from
nutritional diseases. The local feed ingredients used may include energy concentrates such as corn,
oats, wheat, barley, sorghum, millet and milling by-products. Protein concentrates include soybean
meal and other oilseed meals (peanut, sesame, safflower, sunflower, etc.), cottonseed meal, animal
protein sources (meat and bone meal, dried whey, fish meal, etc.), grain legumes such as dry beans
and field peas and alfalfa. Grains are usually ground to improve digestibility. Soybeans need to be
heated, usually by extruding or roasting before feeding in order to deactivate a protein inhibitor.
Soybeans are usually fed in the form of soybean meal, not in "full-fat" form, because the valuable
oil is extracted first. Whole, roasted soybeans are high in fat which provides energy to the birds.
Chicken feed usually contains soybean meal which is a by-product of the oilseed industry (Oliveira
et al., 2000).
In the industry, soybeans are dehulled and cut into thin pieces (flaked) to improve the
action of the solvent (usually hexane) which is passed through the soybean to extract the valuable
oil. Vegetable oils such as soybean oil are used for edible and industrial purposes. The soybean is
then roasted as a method of heat treatment to deactivate an inhibitor which would otherwise
interfere with protein digestion in the animal. However, chicken can also be fed unextracted (full-
fat) soybeans. An advantage of feeding unextracted soybeans is that they still contain the oil which
provides high energy fat to the bird. Unextracted soybeans need to be heat-treated-roasted with dry
heat and then ground, rolled, or flaked before mixing into a diet. Another method of heat treatment
is extruding. Extrusion involves forcing the beans through die holes in an expander-extruder which
creates friction which heats the beans sufficiently (sometimes steam is also applied). The result is a
powdery material which does not require further grinding. Roasted and extruded soybeans should
not be stored for long periods of time, especially in hot weather, because the oil turns rancid. Since
protein is generally one of the most expensive feed ingredients, the industry uses targeted rations
and reduce the amount of protein in the diet as the birds grow (chickens require less and less
protein as they age); however, it may not be cost-effective for small-scale producers to have
different diets for starters, growers, and finishers (Ohimain et al., 2012).
Vitamin pre-mix is usually added but may be reduced by using vitamin-rich plant sources such
as alfalfa. Other plants also provide vitamins in their leaves, hulls and brans. Fish oil can provide
vitamins A and D. Yeast provides some of the B vitamins. Sunlight is a good source of vitamin D
for free ranging chicken (converting a precursor to vitamin D). Poultry in cattle pastures may
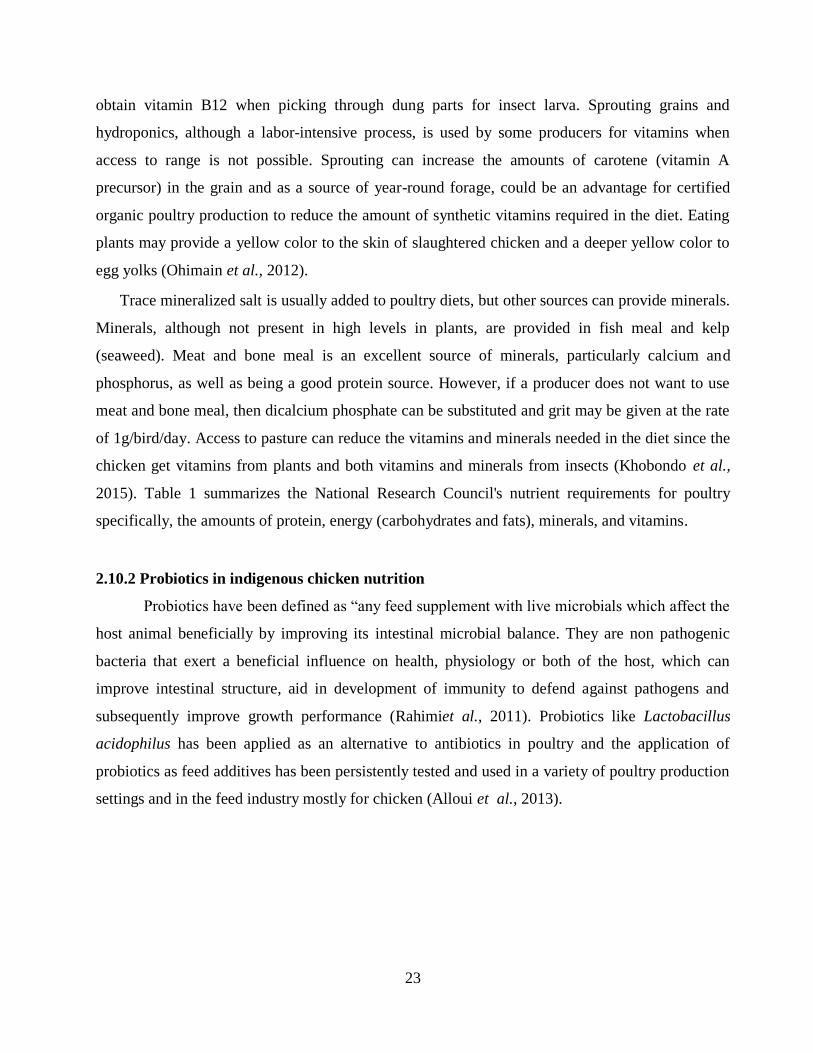
23
obtain vitamin B12 when picking through dung parts for insect larva. Sprouting grains and
hydroponics, although a labor-intensive process, is used by some producers for vitamins when
access to range is not possible. Sprouting can increase the amounts of carotene (vitamin A
precursor) in the grain and as a source of year-round forage, could be an advantage for certified
organic poultry production to reduce the amount of synthetic vitamins required in the diet. Eating
plants may provide a yellow color to the skin of slaughtered chicken and a deeper yellow color to
egg yolks (Ohimain et al., 2012).
Trace mineralized salt is usually added to poultry diets, but other sources can provide minerals.
Minerals, although not present in high levels in plants, are provided in fish meal and kelp
(seaweed). Meat and bone meal is an excellent source of minerals, particularly calcium and
phosphorus, as well as being a good protein source. However, if a producer does not want to use
meat and bone meal, then dicalcium phosphate can be substituted and grit may be given at the rate
of 1g/bird/day. Access to pasture can reduce the vitamins and minerals needed in the diet since the
chicken get vitamins from plants and both vitamins and minerals from insects (Khobondo et al.,
2015). Table 1 summarizes the National Research Council's nutrient requirements for poultry
specifically, the amounts of protein, energy (carbohydrates and fats), minerals, and vitamins.
2.10.2 Probiotics in indigenous chicken nutrition
Probiotics have been defined as “any feed supplement with live microbials which affect the
host animal beneficially by improving its intestinal microbial balance. They are non pathogenic
bacteria that exert a beneficial influence on health, physiology or both of the host, which can
improve intestinal structure, aid in development of immunity to defend against pathogens and
subsequently improve growth performance (Rahimiet al., 2011). Probiotics like Lactobacillus
acidophilus has been applied as an alternative to antibiotics in poultry and the application of
probiotics as feed additives has been persistently tested and used in a variety of poultry production
settings and in the feed industry mostly for chicken (Alloui et al., 2013).
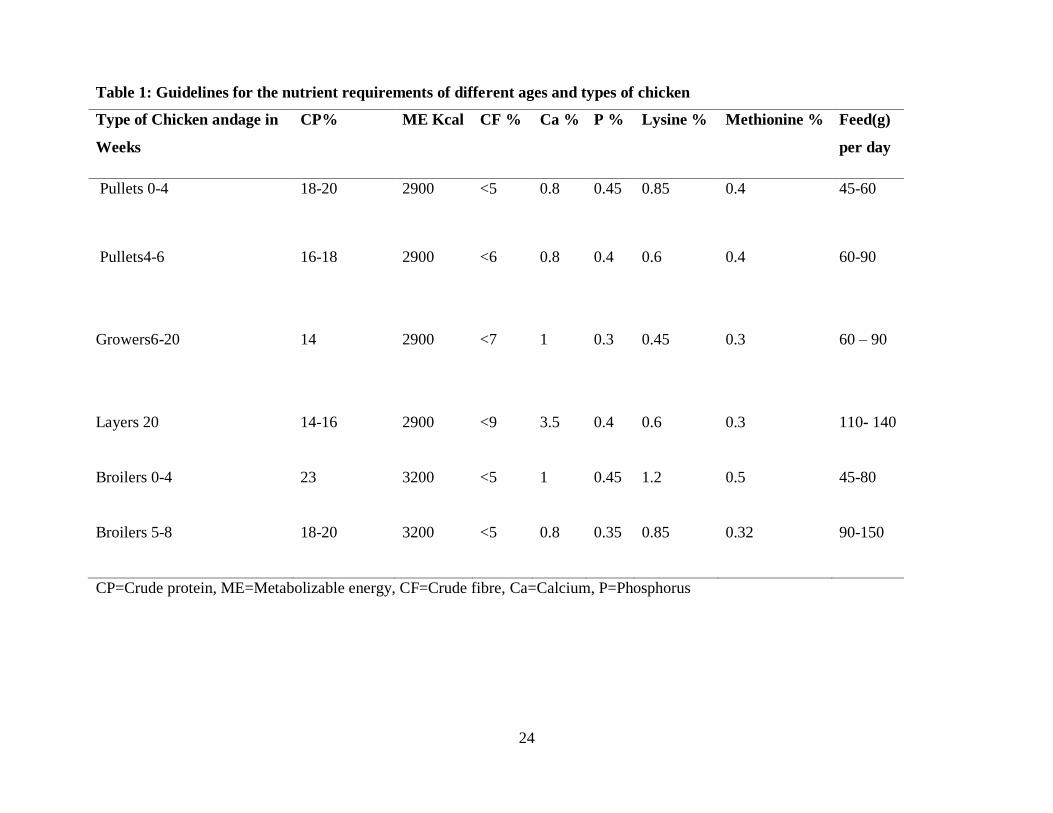
24
Table 1: Guidelines for the nutrient requirements of different ages and types of chicken
Type of Chicken andage in
Weeks
CP% ME Kcal
CF %
Ca %
P %
Lysine %
Methionine % Feed(g)
per day
Pullets 0-4 18-20 2900 <5 0.8 0.45 0.85 0.4 45-60
Pullets4-6
16-18 2900 <6 0.8 0.4 0.6 0.4 60-90
Growers6-20
14 2900 <7 1 0.3 0.45 0.3 60 – 90
Layers 20
14-16 2900 <9 3.5 0.4 0.6 0.3 110- 140
Broilers 0-4
23 3200 <5 1 0.45 1.2 0.5 45-80
Broilers 5-8
18-20 3200 <5 0.8 0.35 0.85 0.32 90-150
CP=Crude protein, ME=Metabolizable energy, CF=Crude fibre, Ca=Calcium, P=Phosphorus

25
Several selected probiotics have been applied in poultry production including
Lactobacillus, Streptococcus, Saccharomyces, Aspergillus, and Bacillus species (Huang et al.,
2004). Bacillus species are ideally suited as feed additives because of their stability as spore-
forming bacteria and ability to produce a variety of enzymes such as protease, amylase, and lipase.
Diets supplemented with Bacillus subtilis fermented product, or probiotic powder can improve
weight gain and feed efficiency (Midilli et al., 2008). Bacillus licheniformis has a strong ability to
produce protease, lipase, and amylase, which facilitates the degradation of feed for nutrient,
absorption, and utilization of feed (Yamanet al., 2006). It is reported that Bacillus licheniformis
can produce antimicrobial active substances and has a unique mechanism about reacting with
oxygen that inhibits the growth and reproduction of pathogens, and promotes the growth and
homeostasis of the intestine to adjust the intestinal flora for the recovery of bowel functions
(Ohimain& Ofongo, 2012).
It also has been shown that application of probiotics could improve weight gain and feed
conversion rate and reduce mortality in broiler chicken ( Kabir, 2009). Supplementation of
probiotics in a basal diet has been shown to be useful for ameliorating the adverse influence of
stress (Fuller, 2001), promoting the activities of antioxidant enzymes (Sun et al., 2011) and
improving the health of the host beyond their inherent basic nutrition (Waite & Taylor, 2015).
Studies have recently shown that supplementation of probiotics has the ability to inhibit the
adhesion of pathogenic bacteria to the intestinal wall and to enhance immune potency (Cox &
Dalloul, 2015). It has also been suggested that probiotics have a significant role in normalization of
colonic physiologic function and barrier integrity of conjunctions of the cells with a reduction in
mucosal pro-inflammatory cytokine levels (Huang et al., 2004).
Antibiotics can improve health and productive performance of animals, but also result in
the development of drug-resistant microorganisms, which can then pass the resistance on to
infectious microorganisms in humans (Cox & Dalloul, 2015). The European Union has banned the
use of antibiotics as growth-promoting agents in the poultry industry and many countries are
restricting the use of antibiotic as growth-promoting agents therefore, it is essential to find possible
alternatives to antibiotics for growth promotion and improvement in poultry production. (Amado,
2009).

26
2.10.3 Housing of indigenous chicken
In many countries, production systems for indigenous chicken vary widely from large
stationary houses with yards, to small portable folds or arks that are moved frequently to new
grounds (KARI, 2010). In Kenya, some of the resource poor small scale farmers share their
residential houses with their chicken or sometimes the chicken are housed overnight in the kitchen
(Ndegwa et al., 2012). Others construct a chicken house attached to the kitchen which is built on
the outside. In case housing is not available, little chicks are housed in the kitchen, as they are
more vulnerable to predators to assure their security. Saw dust is used as the main bedding material
for the chicken in the houses (Nyaga, 2007) where they sleep for the night. Other farmers use soil,
sacks or mats as bedding. This enables them to clear the droppings every morning. A woven basket
is the most common housing for confinement of chicken overnight. Its use may be because farmers
do not want to invest in chicken houses or they cannot afford to (Islam et al., 2014). Wooden
mesh/ wooden slatted floor/raised floor are recommended due to animal welfare ban of battery
cage system, hence this housing system is advocated for (Kitalyi, 1998).
2.10.4 Health and disease management of indigenous chicken
Disease outbreaks are a big challenge to farmers due to high costs of veterinary charges and
lack of knowledge on clinical symptoms of diseases. Mixing with other animal species (dogs,
cattle, wild birds etc) as they scavenge for food may create an opportunity for spreading of disease
pathogens between species (Perminet al., 2010). Houses constructed for indigenous chicken are
too small making cleaning difficult thereby increasing chances of disease infections and spread
especially ecto-parasites. Newcastle disease is the most prevalent and fatal disease in indigenous
chicken farming in Kenya leading to high mortality rate (Quintana et al., 2004). The mortality
rate in some cases is close to 50%, but falls to 10% when the flock is properly managed. During
disease outbreaks, mortality is highest in the dry seasons of August, November and December due
to limited scavenging material leading to poor nutrition that suppresses disease tolerance and few
farmers seek the services of the veterinary officers or the agricultural extension officers in their
regions (Okitoi et al., 2007).
Due to high cost of conventional medicines and vaccines coupled with the lack of knowledge
on their use, these drugs are usually out of reach of the small-scale farmers. Table 2 summarizes
the recommended vaccination schedule for chicken. Therefore, there is need for affordable, easy to

27
use and sustainable local poultry disease control programs. Treatment methods vary but most
farmers use alternative remedies also known as ethno-veterinary medicines. Farmers mix different
herbs depending on the individual farmer‟s knowledge but there is no analysis on the amount of
ingredients contained in the plants, which means the birds may receive an over or under dose
(Okitoi et al., 2007).The most common plants used are aloe vera, croton leaves, milk weed and hot
pepper (Nzioka, 2000). Others combine aloe vera with neem, sanchus spp., red pepper,
amaranthus spp. and guava leaves, a concoction reported to protect flocks against newcastle
disease (Nyaga, 2007). Sometimes the concoctions are offered in drinking water regardless of
whether the birds are sick or not. There is no age consideration when administering the
concoctions. These interventions by farmers could in a way be blamed for the high mortality rate
experienced (Okitoi et al., 2007).
Generally, stock reduction is due to many factors apart from mortality. Deaths due to
diseases and parasites contribute 44%, home consumption 21.5%, sales for income 17.1% and
losses due to predators 8%, donations and exchange contributed 5.5 and 4.4% respectively on flock
reduction (Okeno et al., 2011). The challenges in brooding are diseases and predators which cause
mortality of the chicks when they hatch. Poor chicken management especially feeding and
watering leads to production losses due to mortality. During the dry seasons, green vegetation and
insects are scarce contributing to high mortality rates of chicken in the rural areas. A study by
Okitoi et al., (2007) reported mortality of chicks to be the highest (85%) compared to 40% for
adults. This can be due to the fact that chicks as young as one day old are left to scavenge together
with their mothers leading to starvation. At this age chicks do not have enough competence and
experience in scavenging besides lack of adequate nutrients leads to chicks with low physical
defensive mechanism, weak and underdeveloped immune system (King‟ori et al., 2010).
2.10.5 Marketing of indigenous chicken and Eggs
Indigenous chicken are mainly kept for meat as illustrated by the fact that over 50% of the
farmers leave the eggs for hatching, while the other 50% are either consumed by the household or
sold for income (MOLD, 2008). The average cold dress weight of IC is estimated at 72% as
compared to 75-80% for culled layers and broilers respectively (MOALD, 1993). Indigenous
chicken meat is the most popular among poultry species in Kenya (MOLD, 2008).They contribute
47% and 55% of the national egg and meat production respectively (Gakige et al., 2015). One hen

28
lays an average of about 15 eggs per clutch and there are about 3-4 clutches per year.The total egg
production is approximately 1.182 million. Most birds are sold at between 5 to 6 months, at this
stage individual birds weigh 1.3-1.8 kilograms live weight. There is no organised marketing of
poultry and poultry products (Birech, 2004). Individual households have a few chicken and eggs
for sale at any given time which make it very expensive to transport them to urban areas where
they would fetch better prices. They therefore sell their chicken and eggs to middlemen at poor
prices.
Farmers can benefit if marketing groups are formed which can improve their bargaining
power and reduce marketing costs. These marketing groups will also acquire feed ingredients to
formulate feed supplements in bulk making them cheaper. It will also ensure that their products are
of high quality by doing some grading. This will create consumer confidence and sustain demand.
Table 2: Recommended vaccination schedule for chicken
AGE VACCINATION METHOD
Day 1
(Done by hatchery)
Mareks
IB + NCD
Intra muscular
Spray
Day 10-14 Gumboro Drinking water
Day 14-18 IB + NCD Eye drop
Day 24-28 Gumboro Drinking water
Day 28-32 IB + NCD Eye drop
Week 6-8 NCD killed/IB + NCD-live
Fowl typhoid
IM/Spray
Intra muscular
Week 8-10 Fowl pox
Fowl cholera
Wing stab
Sub cutaneous
Week 12-14 Fowl typhoid Intra muscular
Week 16-18 NCD+ IB +IBD(K)/IB+NCD
Fowl cholera
IM/Spray
Sub cutaneous

29
CHAPTER THREE
MATERIALS AND METHODS
A comparative performance of indigenous chicken in Baringo and Kisumu Counties of
Kenya
3.0 Introduction
The keeping of free-range chicken in rural areas in the tropics as a strategy towards
sustainable agriculture as well as urban and peri-urban agriculture had not come into focus until
quite recently. Indigenous chicken are important source of eggs, quality white meat as protein food
and income for the majority of the people living in the rural areas. The smallholder farmers usually
let the chicken scavenge for feed around the household during the daytime and let them in at night
for shelter. In some areas, it is a custom to supplement the birds‟ diet with cereal grains like maize,
millet or sorghum and occasionally household kitchen leftovers (Kingori et al., 2010). Besides
these feed supplements, free-range indigenous chicken are typically kept with the use of none or
few inputs such as antibacterials or vaccinations. About 90-95 % of the chicken reared in
backyards by rural households in most developing countries is based mainly on the scavenging
system with between 5-50 birds are raised per household (Gakige et al., 2015). The egg and meat
outputs of indigenous chicken are generally low due to poor nutrition, diseases, predators, parasites
and nematodes (Olwande et al., 2009). Their productivity is normally low due to poor feed
conversion efficiency, low adoption of modern technologies and genotype (Khobondo et al.,
2015).
In Kenya, indigenous chicken play a significant role in poverty alleviation. However, the
chicken need feeds that provide them with necessary nutrients for higher egg and meat production.
These requirements are not met adequately by the free-range production system due to the low
inputs associated with the scavenging system. It is therefore important to evaluate the systems used
in indigenous chicken production and extra effort put in the management of the indigenous chicken
in terms of supplementary feeding and genetic selection (Kobondo et al., 2015). This will enable
improved body weights, final weight gain, more clutch sizes, egg hatchability and increased
number of chicks weaned per hen. Some indigenous chicken have actually proved to have higher
number of eggs laid per clutch per year than commercial ones (Okitoi et al., 2008). Farmers in
Kisumu and Baringo have different socio-economic backgrounds and their approach to the

30
management of indigenous chicken may not be similar. It was therefore necessary to get a clear
understanding of these two communities with respect to raising of indigenous chicken.
3.1 Experimental Site and Research Locations
The preferred areas were Upper Nyakach in Kisumu County and Emining in Baringo
County. The major economic activity in Emining division is pastoralism or the rearing of cattle on
pastures while in Upper Nyakach is majorly fishing, thus the need to compare them. The two
communities are known for practicing free range indigenous chicken production, however the
challenges they face are not well documented.
3.1.1 Description of the research locations:
The coordinates for Baringo County are 0o 40‟N 36
o 00‟E and is located in the former Rift
Valley Province of Kenya. Baringo County has a total population of 555561, 50.2% males and
49.8% females. It has a moderate climate with temperatures ranging from a minimum of 10oC to a
maximum of 35oC in different parts. Baringo County‟s altitude varies from 1000m to 2600m and
has a very conspicuous topography accentuated by the Tugen hills. The Eastern parts of the
County have been covered by lake Baringo and Lake Bogoria. The temperature in Baringo varies
between 25 degrees celcius to 30 degrees celcius in the southern part and 30 degrees celcius to 35
degrees celcius in the northern parts.Rainfall in Baringo County occurs in two seasons and varies
from 1000mm to 1500mm in highlands and 600mm in lowlands. A major economic activity in
Baringo County is the rearing of livestock. There are livestock rearing activities like goats, sheep,
cattle, camel and a lot of bee rearing. During 1921 almost the entire county's land for arable
farming was taken by millet (Pennisetum typhoides) and sorghum (Sorghum vulgare). This
situation changed until 1945 by the replacement of millet by maize as a crop in certain areas
caused by promotion of the crop by the then government (google.com).
Nyakach Constituency is in Kisumu County which has a population of 968909, 51.1% are
females and 48.9% males. Nyakach is sandwiched between Nyando to the North, Karachuonyo on
the West, Kasipul Kabondo on the larger south and Belgut on the greater East. It is beautifully
surrounded by rivers, hills and plateaus. Most of its topography is mainly clay soil in the North and
red volcanic in the South. The rivers that sandwich Nyakach are the now very famous Sondu
Miriu, Awach , Nyando and other smaller ones. Has an annual relief rainfall between 1200 mm
and 1300 mm with a mean annual temperature of 23oC and ranges between 20
oC and 35
oC.

31
Nyakach boasts of fishing opportunities and there are quite a number of other economic activities
that include agricultural activities such as crop growing, poultry and livestock farming. Some of
the crops with great potential include bananas (Musa spp.), fruits (orange, avocado, passion,
blackcurrant berry, pineapple etc), maize (Zea mays), finger millet (Eleusine indica), bulrush
millet (Pennisetum typhoides), sunflower, peas, cassava, Napier grass (Pennisetum purpureum),
sugarcane for subsistence, sorghum (Sorghum vulgare), groundnuts, beans (Phaseolus vulgaris),
green grams, cow peas etc. There are also great prospects in development of later generation crops
like cucumbers, carrots (Daucus carota) and other vegetable plants in the south. Industrial
development include metal fish preservation and processing. Interest groups like „Maendeleo ya
wanawake‟, youth groups, various women and men groups, teacher groups, „boda boda‟ groups,
fishing groups, farmers association and many others are used as a genesis of a telescopic mass
movements for consolidation of resources and investments(google.com).
3.2 Materials and Methods
A structured interview schedule based on the scope of the study was developed and pre
tested at randomly chosen divisions in Kisumu and Baringo Counties which were not targeted for
study. Figure 1 shows the locations of the study Counties. A survey was conducted with
100farmers per county derived from purposively selected divisions from each County based on
farmers who specifically kept indigenous chicken. Interviews were conducted in vernacular
languages, Swahili or English depending on the level of education of the respondent.
The main feature of the interview schedule was to obtain information on commonly used
feedstuffs, household characteristics such as age, gender and education, purpose of keeping
chicken, flock size, flock management, performance parameters, feeding practices and prices of
eggs and live birds. Most questions were open ended. The enumerators ticked the answers given by
farmers against a prepared checklist for easy analysis. Sampling was done to purposively cover
only farmers keeping indigenous chicken. Data was analyzed using SPSS version 17 software to
test for significance between the variables in the two counties.

32
Figure1: Map of Kenya showing the study Counties: Source-Internet D-Maps
Kisumu County
Baringo County
Lake Victoria

33
3.3 Results and Discussion
The results of the farmer characteristics by gender, education and age distribution in
Baringo and Kisumu Counties are presented in Figures 2, 3, 4 and 5.
3.3.1 Gender, education and age distribution of indigenous chicken farmers by County
Most participants were females although more females were from Kisumu unlike Baringo
where most of the participants were men. There was a total 75 male farmers who practiced
indigenous chicken farming in both Counties as compared to 125 females (Figure 2). There was no
significant difference between female and male farmer participation in indigenous chicken farming
(P=0.270).
Figure 2: Overall distribution of male and female farmers.
Women participated more in indigenous chicken farming as compared to males in both
Counties, this could be probably due to the fact that many are housewives who have been keeping
chicken by tradition. Rearing IC is an activity for women and passion customarily in most African
cultures (Islam et al., 2014). Male farmers frequently stated that more profit was made through
other activities though in Baringo County more men kept IC mainly because it was a beneficial
economic activity; while in Kisumu, female farmers indicated that indigenous chicken production
generates income and create supplementary income for the household in addition to the husband‟s
Female
Male

34
earnings. In a similar study in Western region of Kenya, Okitoi et al., (2007) reported the same.
Women and children were responsible for most of the indigenous chicken‟ daily management
activities and that most decisions to dispose of the chicken and their products was done by women.
Table 3: Education levels by gender in the Counties (%)
EDUCATION P-Value
Sample
(n)
None Primary Secondary Post
Secondary
County 0.002
Baringo 100 3.0 37.0 41.0 19.0
Kisumu 100 7.0 50.0 40.0 3.0
Gender 0.003
Female 125 8.0 48.8 36.0 7.2
Male 75 0.0 34.7 48.0 17.3
Education levels by gender is presented in Table 3. There was a significant difference in
levels of education in the two Counties (P=0.002). More farmers from Baringo County were more
educated than Kisumu County where a higher number had primary education compared to their
counterparts in Baringo. Low levels of education observed in this study may explain the keeping
and reliance on indigenous knowledge for management by the indigenous chicken farmers.
Education levels have positive correlation with management of chicken, feeding and performance
since the more educated the persons were, the more likely they were to invest in better feeding and
management than others would.

35
Figure 3: Education level by County
Results in Figure 4 show that on average, the age of a farmer participating in indigenous
chicken farming from both Counties was 40 years. There was no significant age difference
between the two Counties (P=0.195). Most of the farmers were in the age bracket of 26-45 years
age in both Counties. In this study the younger (16-25) and older (66-85) farmers were from
Baringo than Kisumu respectively. It appeared that the farmers from Kisumu may have not taken
up IC farming very seriously probably due to lack of enough land, low education and negative
attitude towards farming in preference to office jobs. The older ones also had not taken it up either
maybe due to the intensity of care and managerial techniques involved in the economic activity. It
appeared that the younger men from Baringo have taken up indigenous chicken farming very
seriously probably because they are beginning to realize the economic viability of indigenous
chicken farming as a profitable business.
Nu
mb
er o
f fa
rmer
s
Baringo
Kisumu
Total

36
Figure4: Farmers age distribution by County
3.3.2 Production systems, chicken ecotypes, feed types, health service provider and
constraints experienced by indigenous farmers
The production systems, chicken ecotypes, feed types, health service provider and
constraints experienced by farmers in Baringo and Kisumu are presented in Table 4.The study
showed that the predominant IC production system in both Counties was free range system. There
was significant difference between the Counties in terms of production system practiced. More
farmers in Baringo practice free range system (67) compared to farmers in Kisumu (42) who
practiced semi confined system. This implies that farmers in Kisumu carry out supplementation for
their chicken more and also keep less number of chicken due to less land available. The farmers in
Baringo probably have large pieces of land and practice indigenous chicken farming as a
commercial activity.
Nu
mb
er o
f fa
rmer
s
Age of farmers
Baringo
Kisumu
Total

37
Table 4: Production Systems, chicken ecotypes, feed types, health service provider and
production constraints (%)
Characterization (%) Baringo Kisumu P-value
Production system
Free range
Semi Confined
Confined
67
29
4
42
53
5
0.002
Chicken ecotypes
Dwarf type
Giant type
Normal Feathered
Naked Neck
Total
Mean
59
116
4317
145
4637
43.37
35
75
2266
123
2499
24.99
0.372
Feed types
Kitchen left over eg kales.
Cereal grains eg maize, millet.
Commercial feeds eg growers mash.
All Above feed types.
1
8
4
87
5
5
0
90
0.06
Health services
Agro vet shops.
Public Service.
Private Vets.
None.
60
9
9
22
50
27
10
13
0.006
Production constraints
Lack of Feeds.
Diseases &Parasites.
Lack of knowledge on nutrition.
Other constraints eg cultural factors.
3
10
1
86
1
10
0
89
0.562
There were some variations in appearance in the IC. There was no significant difference
between the ecotypes kept in the two Counties (P-value=0.372). All the ecotypes in Baringo and
Kisumu were similar however Baringo County had the highest number of total and normal
feathered chicken kept compared to Kisumu. The naked type, dwarf and giant type were
distributed almost equally in each of the Counties.
The results show that there was no significant disparity between the two counties in terms
of the feeds they used (P-value=0.060). The farmers in Kisumu did not use commercial feeds to
38
supplement feeding to their birds at all, their chicken delay in maturity in terms of point at lay and
crow compared to those in Baringo. Okitoi et al., (2007) also reported lack of proper
supplementation by most farmers which affect the productivity of indigenous chicken.
The results show that majority of farmers in the study got their services from the agro-vet
shops. The farmers were served by the Government and private animal health service providers in
both counties. More farmers from Kisumu relied on government services because it was deemed
cheaper. Most of the farmers on their own, bought veterinary products from agro-vet shops for
treatment of their chicken and control of diseases and parasites. Okuthe (1999) reported the same
scenario in a similar study.
There was no significant difference in terms of constraints faced in both Counties (P-
value=0.562). Farmers from both Counties had similar constraints such as diseases, parasites, lack
of feeds and lack of management knowhow in terms of proper feeding and disease control in
indigenous chicken production. Olwande et al. (2010) reported mortality rates of 77% in
indigenous chicken in are attributed to diseases and wild animals. There is need to address the
problems by targeting farmer groups in order to solve these constraints and improve productivity of
indigenous chicken in both Counties.
3.3.3Performance of indigenous chicken
The results in Table 5 and 6 show the performance of IC under different production systems
and by county. The performance indices were much lower for those of free range production system
compared to semi confined and confined chicken. In this study there was no significant difference
in the above performance parameters in the two Counties. The mean egg produced per clutch was
16 eggs in about 3 clutches with 63% hatchability and 70% of chicks weaned. Mengesha (2011)
reported a hatchability percentage from total egg set in a study in Ethiopia to be between 60 to
88%.
At the traditional farm level, range egg production of indigenous chicken in Kenya and
other African countries is about 40-100 per year and are laid in 3-4 clutches, each consisting of 12-
20 eggs (Olwande et al., 2010). In a study by King‟ori et al., (2007) eggs per clutch was of 20
eggs. In this study the clutch size was 3 with 16 eggs per clutch, which projects to 48 eggs per year;
this is much lower than 300 eggs produced by exotic chicken under tropical conditions. Mengesha
et al., (2011) reported that due to the effects of management intervention, average annual egg
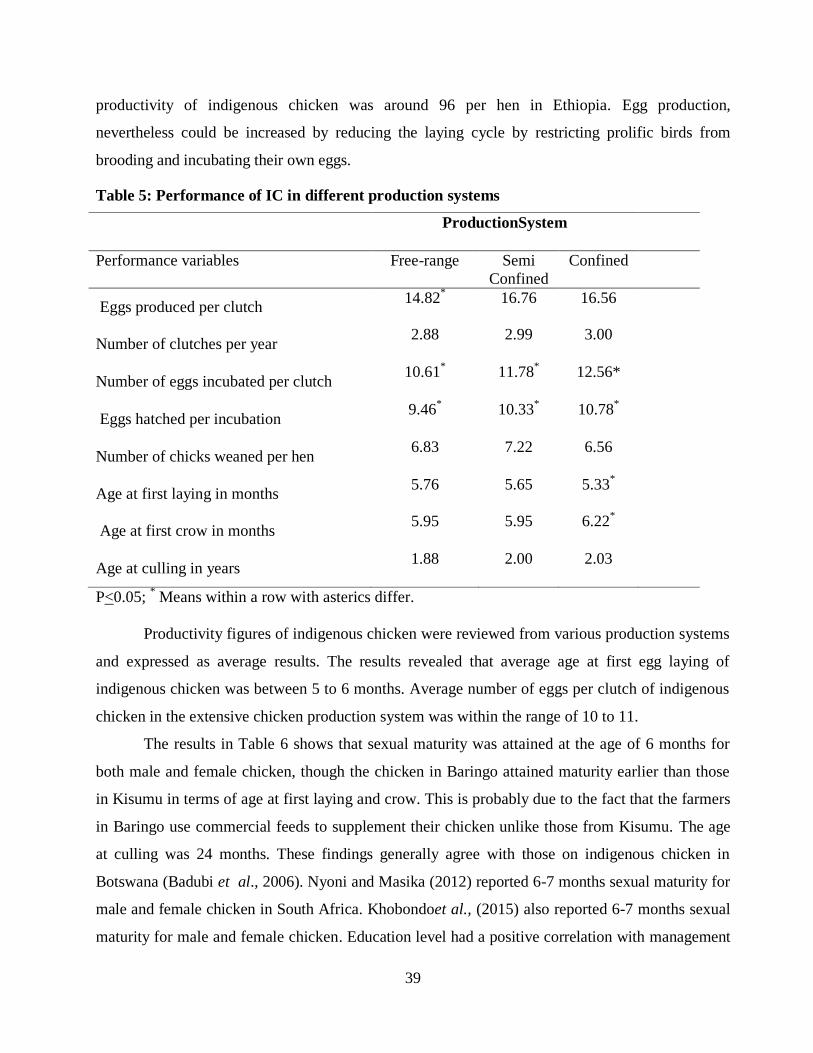
39
productivity of indigenous chicken was around 96 per hen in Ethiopia. Egg production,
nevertheless could be increased by reducing the laying cycle by restricting prolific birds from
brooding and incubating their own eggs.
Table 5: Performance of IC in different production systems
ProductionSystem
Performance variables Free-range Semi
Confined
Confined
Eggs produced per clutch 14.82
* 16.76 16.56
Number of clutches per year 2.88 2.99 3.00
Number of eggs incubated per clutch 10.61
* 11.78
* 12.56*
Eggs hatched per incubation 9.46
* 10.33
* 10.78
*
Number of chicks weaned per hen 6.83 7.22 6.56
Age at first laying in months 5.76 5.65 5.33
*
Age at first crow in months 5.95 5.95 6.22
*
Age at culling in years 1.88 2.00 2.03
P<0.05; * Means within a row with asterics differ.
Productivity figures of indigenous chicken were reviewed from various production systems
and expressed as average results. The results revealed that average age at first egg laying of
indigenous chicken was between 5 to 6 months. Average number of eggs per clutch of indigenous
chicken in the extensive chicken production system was within the range of 10 to 11.
The results in Table 6 shows that sexual maturity was attained at the age of 6 months for
both male and female chicken, though the chicken in Baringo attained maturity earlier than those
in Kisumu in terms of age at first laying and crow. This is probably due to the fact that the farmers
in Baringo use commercial feeds to supplement their chicken unlike those from Kisumu. The age
at culling was 24 months. These findings generally agree with those on indigenous chicken in
Botswana (Badubi et al., 2006). Nyoni and Masika (2012) reported 6-7 months sexual maturity for
male and female chicken in South Africa. Khobondoet al., (2015) also reported 6-7 months sexual
maturity for male and female chicken. Education level had a positive correlation with management

40
of chicken, feeding and performance of indigenous chicken. The more educated the persons are, the
more likely they are to invest in better feeding and management of chicken resulting in higher
productivity (Khobondo et al., 2015).
Table 6: Performance of IC by County
County
Performance variables Baringo Kisumu
Eggs produced per clutch 15.52 15.86
Number of clutches per year 2.96 2.90
Number of eggs incubated per clutch 11.11 11.25
Eggs hatched per incubation 9.96 9.79
Number of chicks weaned per hen 7.32 6.63
Age at first laying in months 5.43 5.96*
Age at first crow in months 5.59 6.34*
Age at culling in years 2.07 1.99
*=Figures with asterics are significantly different per row
Table 7: Mean Market price of IC products in Kes in April 2015.
County Cock (Kes) Pullet (Kes) Hen (Kes) Egg (Kes)
Baringo 549.5±9.85 331.7±8.31 412.3±9.39 12.0±0.35
Kisumu 572.5±8.34 378.1±6.41 456.2±6.02 18.0±0.35
P-value 0.01 0.00 0.00 0.00
3.3.4 Market prices of IC products
The results of the market prices are presented in Table 7. The mean market prices of selling
eggs, pullets, mature hens and cocks were Kes 15, 355, 434 and 573 respectively. The mean prices
in Kisumu were higher than mean prices in Baringo, probably due to high demand but less supply and
production of indigenous chicken in Kisumu. Live birds and eggs are sold at the nearest local market

41
for the petty cash requirements or during an outbreak of disease among birds within the estimated
area of neighborhood.
Eggs are sold when conditions indicate that they are not required for hatching. Live chicken
from farmers are transported to the nearest market at farm gate prices, thus partly contributing to
the low productivity of indigenous chicken for sale to urban markets. Eggs are also sold within
households or through the local shop outlets. King‟ori et al., (2010) reported that live birds are sold
when aged six months or when old enough to meet their maintenance requirements. In this study,
more young male educated farmers from Baringo engaged in indigenous chicken farming for
income unlike in Kisumu where the female population did it for both consumption and income.
Conclusions
1. Many young and educated males in Baringo County are beginning to venture in IC keeping
contrary to the notion that IC farming was meant for women and the uneducated. The men
are becoming more interested in IC farming probably because the young educated men
have realized the economic viability of IC business.
2. More farmers from Baringo County practice free range production system compared to
farmers from Kisumu who practiced semi confined and confined system, perhaps due
largeland sizes/pastoralists and higher education levels compared to Kisumu with small
land parcels, low levels of education and restraints during cropping seasons and also
pests/thieves/predators.

42
CHAPTER FOUR
TO OPTIMIZE THE NUTRIENT DIET FORMULATION USING LOCAL FEEDSTUFFS
FOR ENHANCED INDIGENOUS CHICKEN PERFORMANCE.
4.0 Introduction
Feed is a major 70-80% component of the total cost of indigenous chicken production. The
IC ration should be formulated to supply the correct balance of energy, protein and amino acids,
vitamins and fatty acids to optimize growth and performance. The choice of dietary nutrient levels
should be an economic decision to be made by each farmer in order to maximize live bird
profitability while minimizing feed cost per kilogram live weight. As the feed cost represents an
expensive input (70-80% of egg and meat production costs), the indigenous chicken farmer should
be aware of the dynamics of the feed in its influence on final product quantity and quality thus
direct the efforts towards improving feed formulation system (Khobondo et al., 2015). Formulating
IC feed ideally requires in-depth knowledge of several parameters such as the energy level to be
maintained in the diet, balancing the amino acid profile and electrolytes of feed which, otherwise,
if not properly monitored, could negatively influence the performance of indigenous
chicken.Adequate ration formulas, with the most limiting amino acids, can induce to high
performance results, reducing the dietetic protein and the nitrogen lost in feaces, which normally
determine reduced costs (Oliveira, 2000).
Feeding trials as techniques in evaluating nutritional value of feedstuffs are very essential
in formulating livestock rations. They measure the effect of feed on production or growth
performance of animals. Before inclusion of any ingredient within the ration to be formulated, its
effectiveness on animal performance has to be assessed (Goromela et al., 2007). This can either be
through long-term or short-term feeding trials. The animals are given the conventional feed with
ingredient of interest at varying levels and their response in terms of performance (weight gain,
feed intake and feed conversion ratio) is monitored and compared to performance when fed on
conventional feed alone (Oviedo-Rondón and Waldroup, 2002).
Feeding trials can either be done on-farm where sometimes farmers are left in charge of
feeding the animals while the researcher only collect and analyze data or can be on station under
controlled environment. In this case, the researcher is in charge of all activities appertaining to the
study all the way from feeding the animals, data collection and analysis (Ramla et al., 1994).
Nutritional value of any feedstuff partly depends on its ability to release nutrients to the animal

43
(provided that nutrients are not limiting) for utilization following digestion. This ability is
consequently determined by digestibility of the feedstuff. Digestion trials are therefore sometimes
conducted during feeding trials to measure the digestibility of feed ingredient that is to be included
within a ration during feed formulation (Ghulam et al., 2014).
4.1 Materials and Methods
Samples of all the feedstuffs (maize, rice germ, millet, ochon‟ga/omena and growers mash)
in the divisions were bought randomly from the farmers during survey from Baringo and Kisumu
Counties, packaged in sample bags labeled with date of collection, name the farmer, County and
brought to Egerton University. The samples of feedstuffs were analyzed for proximate composition
and amino acid profile at Egerton University animal nutrition and biochemistry Laboratories.
Egerton University is located in Njoro Sub County, Nakuru County, Kenya. Njoro Sub County lies
on the longitude 35.90 East of Greenwich Meridian and Latitude 0.33
0 South of the equator. It is
about 25 km west of Nakuru town. The altitude is between 1800- 2423 metres above sea level
(ASL) with a mean annual temperature of between 17 - 22° C and mean annual rainfall of 700 to
1200 mm range.
A cafeteria feeding trial was carried out at the poultry section in TAP. Fifteen female
indigenous chicken aged between 15-20 weeks sourced from Kisumu and Baringo, housed in a
deep liter house with partitioned rooms. The chicken (3 indigenous chicken each, having equal
body weights) were allocated in 5 different spacious deep litter rooms with wood shavings put to a
depth of 15 cm on the floor. The IC were dewormed, vaccinated against newcastle disease and
allowed an adaptation period of one week. They were allowed a free choice diet of 150 grammes
each of various feedstuffs such as omena/ochonga, millet, rice germ, sorghum, maize,
kienyeji/growers mash in a partitioned feeder and water provided adlibitum at 0900 hours daily.
The rejects/unused feedstuffs of each ingredient were collected at 0600 hours East African time,
daily and weighed in order to get the actual feed intake per day. The IC were fed in the cafeteria
feeding system for a period of 21 days; the feed intake for each chicken weighed daily and the
unused feed discarded. The weights of the chicken were taken weekly and their feed conversion
efficiency calculated (Ghulam et al., 2014).

44
4.1.1 Extraction and determination of total free amino acids (TFAA) for feedstuffs
Approximately 1g of each of the feed samples was suspended in 20ml of phosphate buffer
pH 7.0 in 250 ml beakers. The suspension was centrifuged in a refrigerated centrifuge at 300 rpm
for ten minutes and the supernatant poured into a separating funnel and shaken with 10 ml
petroleum ether to remove the organic pigments. The top phase was discarded and the aqueous
phase which contained protein and amino acids was retained. The proteins were precipitated from
aqueous phase by adding 5 ml of 10% (w/v) trichloroacetic acid (TCA) to 5 ml of the extract. The
mixture was shaken and kept in the freezer for 10 minutes. The precipitate formed was used for
total amino acids profile determination by thin layer chromatography. The supernatant of each feed
sample was prepared and used to determine the concentration of each amino acid present. Each
supernatant was made up to 2ml with distilled water and 1 ml ninhydrin solution was added. The
contents were heated in a boiling water bath for 15 minutes and then cooled to room temperature.
The absorbance was read at 570 nm using a spectrometer. The concentration of each amino acid
was extrapolated from a leucine standard curve prepared from serial dilutions of 50µg/ml standard
solution. The intensity of purple and yellow color produced represented α-amino acids and proline
or hydroxyproline respectively (Oviedo and Waldroup, 2002).
Aliquots of 50μl of each filtrate were spotted on thin layer glass plates along with 20 μl
reference standard amino acids (0.1% w/v). The standard amino acids used were isoleucine, lysine,
tryptophan and methionine. One dimensional ascending chromatography was used. The solvent
system employed for the separation was n-butanol: glacial acetic acid: water at a ratio of 4:1:2
(v/v/v) and separation was carried out for 3 hours. The chromatogram was air dried and amino
acids located by spraying with 0.2% (w/v) ninhydrin in ethanol. These were allowed to air dry and
then oven dried at 100°C for 5 minutes for the spots to develop. The Rf values of individual amino
acids were calculated by dividing the distance moved by each spot from the baseline and the
distance moved by the mobile phase. Identification of the separated amino acids was done using
the reference standard curve.
4.2 Results and discussion
Results of proximate composition, utilization and overall mean nutrient composition are
presented in Tables 8, 9 and 10 respectively. Results in Table 8 describe the proximate
composition and intake of major feedstuffs utilized by IC in the two Counties. The crude protein
and energy (dry matter) levels of the feedstuffs are similar to those in conventional tables for

45
specific feed composition by NRC (1994). However it is worth noting that the crude protein
content from omena/ochon‟ga was higher than the other feed ingredients, though the overall mean
crude protein (CP) was generally equal to the recommended CP in NRC (1994) tables for poultry.
Protein efficiency is better at the lower level of dietary protein provision in indigenous chicken
feeding. If dietary protein is inadequate, there is a reduction or cessation of growth and or
productivity and a withdrawal of protein from less vital body tissues to maintain the functions of
more vital tissues (Pierre-Andre, 2009). As such, protein requirements considerably vary according
to the physiological status of the indigenous chicken such as the stage of growth or egg production.
Table 8: % proximate composition of feedstuffs used and intake by IC
Feed sample CF CP DM EE Intake g/d
Omena/ ochonga 2.2 49.8 92.4 2705 5
Maize 3.0 10.6 89.8 2814 33
Rice germ 8.9 13.7 90.1 2987 1
Growers/kienyeji 7.3 16.6 90.8 3161 1
Millet 3.8 11.1 86.3 2693 4
Sorghum 3.5 10.7 87.8 3147 0.3
CF=Crude fibre, CP=Crude protein, DM=Dry matter, EE=Ether extract, g/d=grammes per day
Crude fibre in rice germ was slightly higher than the recommended 7% CF required for
intake in poultry feeds. Age is an important factor that contributes to a bird‟s response to crude
fibre in the diet as very higher levels of CF above seven per cent, reduce digestibility of the feed
by chicken. If the bird is eating a fibrous diet, grit such as oyster shells should be supplied to aid in
grinding up coarse feed in the gizzard and should be available, free choice, for 3 days per month.
Birds that kept indoors usually don't use grit because the diet is low in fiber (NRC, 1994).
The results in Table 8 show that maize was the most preferred feed (74%) while the intake
of sorghum was the least (1%) probably because of the tannin content which is an anti nutritive
factor limiting digestion in feeds. The preferred feed intake formular that the chicken gave after the
cafeteria feeding trial was 74% maize, 12% Omena, 9% millet, 2% rice germ and growers mash
and 1% sorghum which can therefore be used to formulate for them a ration for supplementation

46
by farmers. Given that the free ranging chicken were kept indoors and supplemented with
feedstuffs, and due to the fact that chicken has compensatory feed characteristics, the cafeteria
system gave the preferred feeds by indigenous chicken that can be applied in feeding for optimum
production since chicken can compound their feeding choice in order of preference and need,
given the free diet/feedstuffs choices. The primary concern when formulating a diet is to meet the
bird‟s nutrient requirements in general; chicken will eat to satisfy its energy or calorie needs,
therefore, all other dietary nutrients must be provided based on the amount of energy that the
chicken will consume and should have the proper balance of energy to other nutrients(Pierre-
Andre, 2009).
Table 9: Feed intake, average daily gains and feed conversion ratio of IC in a cafeteria feed
trial.
Age (Weeks) DMI(g) ADG(g) FCR P-value
15 124.29±70.23 14.00±79.31 8.88±2.88 0.0001
16 123.33±118.83 13.00±25.46 9.48±0.92
20 147.00±235.89 19.33±50.53 7.60±1.83
ADG=Average Daily Gain/weight gain; DMI=Dry Matter Intake; FCR=Feed Conversion Ratio;
g=grams
The results in Table 9indicate that initial weight of the indigenous chicken had an effect on
IC feed intake but was insensitive to weight gain and feed conversion efficiency. Most of the
chicken gained weight after three weeks of cafeteria feeding trial, but had very poor feed
conversion ratio (FCR) ranging from 7.60-9.48 in a period of 21 days, compared to the FCR for
broilers which is 3:1=gain:feed. King‟ori et al., (2010) reported a calculated feed conversion ratio
of between 7.0-9.02 for IC aged between 8-24 weeks under intensive system of production. Some
factors contributing to variations in growth rates in chicken include sex, age, breed and body size
(Khobondo et al., 2015).
Matching the feed protein and energy levels with animal protein requirements is crucial for
maximizing animal performance (Pierre-Andre, 2009). For optimum weight gain, complete grower

47
feed rations for chicken of 6 to 14 weeks old should contain at least 16 to 18 percent crude protein,
while complete developer feed ration for chicken of 14 to 20 weeks old should contain 14 to 16
percent crude protein and 3000 kcal/kg energy provided since they are limiting under the free
range system. Chicken usually consume just enough food to meet their energy requirements since
the control of feed intake is believed to be based primarily on the amount of energy in the diet.
Increasing the dietary energy concentration leads to a decrease in feed intake thus affect growth.
Gakige et al., (2015) reported that the villi of chicken respond better to supplementation in the
second growth phase (9 -14 weeks) and that the villi population increase due to supplementation
but reduces due to scavenging. Yaman et al., (2006) reported that increased villus numbers result
in increased surface area leading to greater absorption of available nutrients and increased body
weight gain.Oviedo and Waldroup (2002) reported that protein deficiency in a feed reduced
growth rates in chicken as a consequence of depressed appetite and intake of nutrients. Muscular
protein deposition decreases as the bird advances to maturity but indigenous chicken are known to
be slow growing with a low carcass weight (Khobondo et al., 2015).
4.3 Critical amino acids concentration in feed ingredients
Results of the critical amino acids present in feedstuffs are presented in Table 11. The
results show that most of the feedstuffs from the two Counties were lacking the most rated limiting
amino acids such as methionine, lysine, Threonine, cystein and tryptophan. Sorghum and the
locally compounded growers mash were lacking in methionine, tryptophan and lysine. For poultry,
methionine is usually the first limiting amino acid and lysine the second limiting amino acid and
specific amino acids must be provided in proper amounts and in some definite ratios to others. An
undersupply of a single essential amino acid will inhibit the responses to those in adequate supply
(Oladokun and Johnson, 2012).

48
Table 10: Overall mean nutrient composition of feedstuffs given to indigenous chicken
Nutrient Feed LSMEANS MEAN χ2- VALUE
Crude Fibre Growers mash 7.25 4.76 0.0001
Maize 3.00
Millet 3.80
Omena 2.34
Rice 9.09
Sorghum 3.43
Crude Protein Growers mash 16.63 16.97 0.0001
Maize 10.57
Millet 11.12
Omena 50.17
Rice 14.24
Sorghum 11.00
Dry Matter Growers mash 90.76 89.36 0.0001
Maize 92.76
Millet 86.33
Omena 89.92
Rice 90.50
Sorghum 87.50
Ether Extracts Growers mash 3161.21 2949.94 0.0001
Maize 2790.12
Millet 2692.67
Omena 2832.88
Rice 3401.68
Sorghum 3061.57
Methionine (Met) is the most important limiting amino acid in corn-based poultry diets.
Dietary supplementation with methionine and cysteine has indeed been proven beneficial in
chicken. Methionine is used for protein synthesis, while cystein predominantly serves in the

49
formation of cell membranes and neurotransmitters even though there is evidence that protein level
of methionine or cysteine affect nutrient digestibility in chicken (Sun et al., 2011).
Threonine (Thr) is classified as the third limiting amino acid for poultry, following sulfur amino
acids and lysine, especially in low protein diets. Results in Table 11 show that all the local
feedstuffs fed to IC contained threonine. This amino acid has important role in protein synthesis
and its catabolism generates important products like glycine, acetyl-CoA and pyruvate (Todd et
al., 2008). Accordingly, threonine requirements must consider the protein level of the ration and in
high-protein diets can be considered one of the most important essential amino acids in poultry
body protein deposition, which must consider the age and growing taxes. Threonine is also a major
component of plasma γ-globulin in animals. Dietary threonine intake also influences components
of the immune system increasing serum IgG levels in chicken, jejunal mucosal concentrations of
IgA and IgG in E. coli challenged chicken, while threonine often appears as the third limiting
amino acids, there is no clear report of a special need of threonine for immunity in poultry (Sun et
al., 2011).
Table 11: % rate for the most limiting amino acids in feedstuffs given to indigenous chicken
aged 16-20 weeks
Feed sample Methionine Lysine Threonine Tryptophan Cystein
Maize 0.6 0.2 0.3 0.6 -
Millet 0.6 0.2 0.3 0.6 -
Kienyeji Mash - - 0.3 0.6 0.2
Sorghum - - 0.3 - -
Results in Table 11 show that sorghum and the locally compounded kienyeji mash were
lacking lysine. Lysine, is one of the key amino acid for protein synthesis and muscle deposition
and has also been demonstrated to be involved in the synthesis of cytokines, proliferation of
lymphocytes and thus in the optimum functioning of immune system in response to infection. An
inadequate supply of lysine would reduce antibody response and cell-mediated immunity in
chicken (Adi et al., 2014). The NRC (1994) requirement for the most rate limiting amino acids for
broilers aged 6-8 weeks for methionine=0.32%, lysine=0.85%, Threonine=0.68% and
tryptophan=0.16%. When poultry are fed closer to requirements and strategies are implemented to

50
improve CP and amino acid digestibility, reductions in the amount of N excreted by the bird can be
10 to 20% depending on how much nitrogen is currently being fed. The IC farmer, however,
currently utilizes substantial feedstuffs for formulation, due in large part to uncertainty of nutrient
requirements and variability in ingredient amino acid content and digestibility. Supplementation
with additives with complementary amino acid profiles and use of ingredients with higher amino
acid digestibility, therefore, can have dramatic impacts on the growth rates of indigenous chicken.
By improving the traditional managements of indigenous chicken and supplementing the critical
amino acids deficit in the local diets/feedstuffs with synthetic amino acids additives, better growth
rates can be achieved from the IC.
Conclusion
Chicken can eat a compounded diet when put under a cafeteria system and the formula that the IC
gave in this study for their daily intake as: 74% maize, 12% omena, 9% millet, 2% rice germ, 2%
growers mash and 1% sorghum.

51
CHAPTER FIVE
DETERMINATION OF AFLATOXIN LEVELS IN THE FEEDSTUFFS FED TO
INDIGENOUS CHICKEN IN BARINGO AND KISUMU.
5.0 Introduction
Aflatoxins (AF) are mycotoxins that are produced by various Aspergillus species including
A. flavus, A.parasiticus and A. nominus. As secondary metabolites of these fungi, AF may
contaminate a variety of food and feedstuffs, especially corn, peanuts and cottonseed. Chemically,
aflatoxins are difuranocoumarin compounds and include aflatoxins B1, B2, G1, G2, M1 and M2
depending on their structures. Toxigenic Aspergilus flavus isolates generally produces aflatoxins
B1 and B2, whereas A.parasiticus produces aflatoxins B1, B2, G1 and G2.
The major hosts of A. flavus among food and feed commodities are cereal grains, rice
germ, cotton seed, peanut and protein sources such as rapeseed meal, soya bean meal, cotton seed
meal, sunflower meal, corn gluten meal, copra meal, and palm kernel meal (Anjum et al., 2012).
Aflatoxin producing fungi utilize the nutrients present in the ingredients for their metabolism and
propagation, thereby reducing the nutritional quality of the feed ingredients (Akande et al., 2006).
Aflatoxins sub types B1, B2, G1 and G2 present significant danger to humans if the concentration
is at a high level. Aflatoxin B1 is the most toxic and has been implicated in human health disorders
such as hepatocellular carcinoma, aflatoxicosis, Rey‟s syndrome and chronic hepatitis (Anjum et
al., 2012). The International Agency for Research on Cancer (IARC) has designated aflatoxins BI
as carcinogenic to humans.
Mycotoxins of importance causing contaminations found world-wide generally occur in the
tropical and sub-tropical regions in the world. They are often found as natural contaminants in raw
ingredients of poultry feed, as most farmers supplement their chicken with mouldy and broken
grains that cannot be utilized by humans and which may contain mycotoxins. (Khan et al., 2011).
Indigenous chicken feedstuffs such as rice, maize and sorghum cultivation are practiced in sub-
tropical environment which is characteristically warm and humid. The grains are generally dried
after harvesting, but under inappropriate storage conditions, they can be ideal substrate for
mycotoxins producing fungi therefore, they can be contaminated with fungi during cultivation and
subsequent handling if conditions are favorable (Khan et al., 2011). Fungi producing aflatoxins
utilize the nutrients present in the ingredients for their metabolism and propagation and reduce the
nutritional quality of the feed ingredients (Akande et al., 2006).

52
In chicken, aflatoxins impairs most of the important production parameters such as weight
gain, feed intake, feed conversion efficiency, pigmentation, processing yield, egg production, male
and female reproductive performance (Hussain et al., 2010). As a common rule, poultry should not
get more than 10 ppb total aflatoxins in the feed. Aflatoxins contamination in feed may also cause
reduction of immune response in chicken, thus they become vulnerable to several diseases
(Dhanasekaran et al., 2009). To ensure food safety in the European Union the maximum aflatoxins
level have been set within the commission Regulation No. 1881/2006. The limit for total aflatoxins
in grains intended for direct consumption is 10 parts per billion (ppb), while the U.S Food and
Drug Administration (FDA) has established guidelines for the maximum toxin level that can be
safely fed to immature poultry in Corn & peanut products as 0.02 mg/kg=20 ppb (1mg/kg=1
ppm=1000 ppb), (European Commission, 2006).
5.1 Materials and Methods
5.1.1 Sampling of feedstuffs and extraction for aflatoxins test
Samples of feedstuffs used by farmers such as rice germ, sorghum grains, millet grains,
kienyeji/growers mash and ochonga/omena were brought from indigenous chicken farmers during
the survey from Baringo and Kisumu counties. Two kilograms of composite sample collected from
IC farmers from both Counties (200grammes of each feedstuff) was transported to the
Biochemistry laboratory of Egerton University in one batch within 24hr of collection and stored at
40 C in the refrigerator until analysis. All samples were ground to a homogeneous particle size of
fine instant coffee and sub-samples of 500 grams each analyzed for aflatoxins. The concentration
of total aflatoxins in the feed samples was determined by a direct competitive Enzyme-Linked
Immunosorbent Assay (ELISA) test using Helica Total Aflatoxin Assay Kit-CAT. No.
941AFL01M-96 V. 05-April 2011 (Abidin et al., 2013). The samples that had been collected
according to established sampling techniques were used. An extraction solution (70% methanol)
was prepared by adding 30ml of distilled water to 70ml of methanol (reagent grade) for each
sample to be tested. The representative sample was ground to the particle size of a fine instant
coffee to pass through a 20 mm mesh screen. Twenty grams ground portion of the sample was
weighed and 100 ml of the extraction solvent added at a ratio of 1:5 of sample to extraction solvent
(w/v). It was mixed by shaking in a sealed blender for about 2 minutes. The particulate matter was

53
allowed to settle then 10 ml of the extract filtered through a whatman number 1 filter paper and
then the filtrate collected to be tested for the concentration of aflatoxins (Anjum et al., 2012).
All the reagents were brought to room temperature before use. One dilution well was
placed in a microwell holder for each standard plus each of the 16 samples to be tested. An equal
number of antibody coated microtiter wells were placed in another microwell holder. Two hundred
(200 ml) of the conjugate was dispensed into each dilution well. A new pipette tip was used for
each. One hundred milliliter of each standard sample was added to appropriate dilution well
containing conjugate. It was mixed by priming pipette at least three times, recording the location of
each standard and sample throughout the test. A new pipette tip for each was used to transfer
100ml of contents from each dilution well to a corresponding antibody coated microtiter well. It
was then incubated at room temperature for 15minutes.
The contents from the microwells were decanted into a discard basin and then microwells
washed by filling each with distilled water, then decanting the water into a discard basin; this was
repeated for a total of 5 washes. The microwells were tapped (face down) on a layer of adsorbent
towel to remove residual water. The required volume of substrate reagent (1ml/strip) was
measured and placed in a separate container. One hundred milliliter was added to each microwell
and incubated at room temperature for 5 minutes and covered to avoid direct light. The required
volume of stop solution (1ml/strip) was measured and placed in a separate container. One hundred
milliliter of stop solution was added in the same sequence and at the same pace as the substrate.
The optical density (OD) of each microwell was read with a microtiter place reader using a 450 nm
filter, and each record done for each microwell. A dose response curve was constructed using the
optical density (OD) values expressed as a percentage of the OD of the zero (0.0) standard against
the aflatoxins content of the standard. The unknowns were measured by interpolation from the
standard curve. The sample dilution resulted in a standard curve from 1ppb to 20ppb (Hellica,
2011).
5.2 Results and discussion
The results of incidences and contamination of total aflatoxins in feed ingredient samples
fed indigenous chicken collected from Baringo and Kisumu Counties are presented in Figure 5.
The results show that total aflatoxins contamination is more widespread than previously thought,
occurring in local kienyeji/ growers mash used in feeding indigenous chicken from both Baringo

54
and Kisumu Counties of Kenya. The higher the Absorbance/optical density read with a microtiter
(using a 450 nm filter) in a feedstuff, the lower the concentration of total aflatoxins in the feedstuff
and the lower the absorbance, the higher the level of total aflatoxins in the feed sample.
Most of the feedstuffs used by indigenous chicken farmers had higher levels of total
Aflatoxin above the recommended thresh hold level of 10 ppb which is permitted in Kenya grains,
as well as the United Nations World Food Programme in food and feedstuffs that is intended for
human consumption and chicken feed. In this study maize was the most commonly used feed
ingredient in supplementing chicken diets in Baringo County, in which almost 100% total
aflatoxins incidence was recorded.
Maize is more susceptible to total aflatoxins production throughout the world as compared
to canola, soybean and rapeseed (Firdous, 2003). Results indicated that, incidence and average
concentration of total aflatoxins were higher in the kienyeji/growers mash as compared to other
feedstuffs. Contamination levels were also higher in the maize and sorghum grains used by farmers
in both Counties to feed their chicken as they had total aflatoxins levels greater than 10 ppb.
Contamination levels varied from 13.4-17 ppb in sorghum from Baringo and Kisumu Counties and
from 18.6 to 19.7 ppb in maize and growers mash from both Counties. According to findings with
Scientists and Policymakers at International Workshop (2011) acute exposure to high levels of
aflatoxins can result in liver failure and rapid death in animals. Chronic exposure, in both humans
and animals, exacerbates infectious diseases and can lead to cancer, liver cirrhosis, weakened
immune systems, and stunted growth in children (IARC, 1999).
Total aflatoxins adversely affectsegg quality by decreasing shell thickness, egg weight and
egg energy deposition. The negative impacts of aflatoxins in layers can be induced when feed
contains 1-2 mg/kg (Anjum et al., 2012). In addition, total aflatoxins in layers feed can result in
total aflatoxins residues in the eggs; therefore it is very important to control AF concentrations in
feeds for laying hens (Oliveira et al, 2000). Total aflatoxins may also affect layers and lead to
reduced egg production, poor egg shell quality and increased mortality of challenged hens.
Following absorption of total aflatoxins in the upper part of the small intestine (since 80-90 percent
of what is eaten is absorbed), mycotoxins undergo extensive transformation into metabolites in the
liver.

55
Figure5: Aflatoxins levels in feedstuffs used in IC; B=Baringo, N=Kisumu
Total aflatoxins are not toxic per se, but require metabolic conversion by hepatic enzymes
(the cytochrome P450 family) to the metabolically active metabolite exo-AFB1-8, 9-epoxyde
(AFBO) to exert its toxicity. This metabolically active form of mycotoxins can bind with particular
cellular compounds (proteins, DNA and RNA) to influence normal cellular activities and is
considered the active form responsible for the carcinogenicity and mutagenicity of aflatoxins
(Anithaet al., 2014).
Total aflatoxins act as an inhibitor of protein synthesis thereby, dividing cells and tissues
with a high protein turnover such as those found in the liver, immune system or gut epithelium,
which is most susceptible to the toxic effects of total aflatoxins. In this respect, exposure to total
aflatoxins has been demonstrated to suppress the immune response in chicken. Total aflatoxins can
depress the development of the thymus gland or influence the relative weight of the bursa of
fabricius, which may result in serious deficiencies in both cellular and antibody responsiveness of
Co
nce
ntr
atio
n (
pp
b)
Feedstuffs
Concentration of total aflatoxins in feed ingredients (ppb) Absobance

56
the chicken‟s immune system (Celik et al., 2000). Inhibition of macrophage functions, T-
lymphocyte activity or cytokine expression by total aflatoxins result in vaccine failure or pathogen
persistence, as exemplified in many studies by reduced immunoglobulin production (Verma et al.,
2004; Yunus et al., 2011). Recent epidemiological data indicates a high correlation between
outbreaks of Newcastle disease and total aflatoxins contamination of broiler rations (Yunus et al.,
2011). In general, the dose of aflatoxins needed to affect the immune system is considered less
than the dose required to elicit a reduction in bird performance.
The threshold dose of total aflatoxins is reported to be approximately 0.4 and 1 mg/kg for
the negative effects on cell mediated and humoral immunity in broilers (Yunus et al., 2011).
Therefore, chronic consumption of feed contaminated with low Aflatoxin content may pose a
serious risk to animal health, increasing susceptibility to infections or reducing vaccination
efficacy. The gastrointestinal tract is the first organ coming into contact with mycotoxins of dietary
origin and should be expected to be affected by aflatoxins with greater potency as compared to
other organs. In addition, total aflatoxins have been shown to reduce energy utilization through a
significant increase in the maintenance energy requirement of the hen (Verma et al., 2007). There
is a loss of energy availability in the feeds because of feeding of moldy maize grains containing
mycotoxins.
Conclusion
Incidence of and high contamination level of aflatoxins was detected in indigenous chicken feed
ingredients especially in sorghum and growers mash.

57
CHAPTER SIX
EFFECTS OF PROBIOTICS FEEDING TECHNOLOGY ON WEIGHT GAIN OF
INDIGENOUS CHICKEN IN KENYA
6.0 Introduction
Probiotics has been defined as “any feed supplement with live microbials which affect the
host animal beneficially by improving its intestinal microbial balance” (Alloui et al., 2013). Lack
of a healthy diet as well as dietary changes can influence the balance of the microflora in the gut
thus predisposing birds to upsets of digestion (Nava et al., 2005). A well-balanced ration sufficient
in nutrients and energy is of great advantage in maintaining a healthy gut.
The use of probiotics for promotion of growth in poultry has recently received a great deal
of attention from nutritionists for proper utilization of nutrients (Kabir, 2009). In chicken
nutrition, probiotic species belonging to Lactobacillus, Streptococcus, Bacillus, Bifidobacterium,
Enterococcus, Aspergillus, Candida, and Saccharomyces have been shown to have a beneficial
effect on broiler performance, immunomodulation, modulation of intestinal microflora, pathogen
inhibition, intestinal histological changes, certain haematobiochemical parameters, improving
sensory characteristics of dressed broiler meat and promoting microbiological meat quality of
broilers (Alloui et al., 2013).
The increasing levels of antibiotic growth promoters (AGP) residues in animal products as
well as the resistance of pathogens to antibiotic growth promoters (AGP) and residues in the food
products and environment, has brought about a call for a worldwide ban on AGP. Alloui et al.,
(2012) reported that dietary supplementation with Lactobacillus-, Bacillus-, and Clostridium-based
probiotics could improve nutrient digestibility, increase gastrointestinal lactobacilli counts, meat
quality, growth performance, humoral immunity, as well as decrease coliform numbers and the
ammonia emission in the droppings of birds (Kabir, 2009).
Vani et al., (2008) reported inconsistent effects of probiotics, which are likely influenced
by administration dose, diet composition and the probiotic strains. Multi-strain probiotics when
used may be more effective than single-strain probiotics and could possibly amplify the protective
spectrum against infections by microbes. However, Huang et al., (2004) reported that higher
inclusion levels of probiotics in chicken diets did not always result in better performance in the
chicken.
This study was conducted to investigate the effect of probiotic feed additives on growth

58
rates of indigenous chicken fed local feeds and to find out the best concentration levelsto use for
the best weight gain. The probiotic additive product used in the present study was supplied by a
commercial company called, Molaplus Ltd. Kenya. The Molaplus poultry microbes are a complex
solution of various beneficial micro-organisms which are found naturally and are used in food
manufacturing. When fed to poultry, it avails chelated minerals, anti-oxidants, enzymes, vitamins,
organic acids, lactic bacteria, yeast and phototropic bacteria (Molaplus.com). The contents were in
liquid form. All chicken were fed a compounded diet consisting of: 33 grams maize grains, 5
grams ochonga/omena, 4 grams millet grains, 1 gram rice germ, 1 gram kienyeji mash and 0.3
grams sorghum grains, based on the formula developed from chicken during the cafeteria feeding
trial.
6.1 Materials and Methods
A feeding trial was conducted at tatton agricultural park (TAP) in Egerton, Njoro campus.
Egerton University is located in Njoro Sub County, Nakuru County, Kenya. Njoro Sub County lies
on the longitude 35.9o East of Greenwich Meridian and Latitude 0.33
oSouth of the equator. It is
about 25 km west of Nakuru town. The altitude is between 1800- 2423 metres above sea level
(ASL) with a mean annual temperature of between 17 - 22° C and mean annual rainfall of 700 to
1200 mm range.The feeding trial was carried out using one hundred and fifty (150) mixed sex
indigenous chicken sourced at two months old, weighing between 200-1200 grams, from free
range small scale farmers from Kisumu and Baringo Counties respectively Kenya.
The chicken were given one week adaptation period, dewormed and vaccinated against
Newcastle disease. The trial was done in a randomized complete block design. Five indigenous
chicken each of similar weights were randomly allocated in battery cages and given 5 different
levels of concentrations of Molaplus poultry microbes solution in the drinking water, giving rise to
25 IC per treatment level. They were each fed with same compounded diet consisting of: 33 grams
maize grains, 5 grams ochonga/omena, 4 grams millet grains, 1 gram rice germ, 1 gram kienyeji
mash and 0.3 grams sorghum grains. The control group were given water without Molaplus
poultry microbes solution but were fed with same compounded diet as the treatment group. The
Molaplus poultry microbes solution was added to the chicken‟s drinking water in different
concentrations of 5ml of solution in different volumes (250, 500, 1000, 1500, 2000 ml) of the
respective drinking water once a day at 0900 hours East African time.

59
The feeding trial experiment was done for a period of 60 days. Weight gain of the
indigenous chicken was monitored by weighing them weekly at 0900 hours before morning
feeding. The final weight gain of indigenous chicken was calculated for the 8 weeks experimental
period to get the best concentration level of Molaplus poultry microbes solution that gave the best
weight gain in indigenous chicken. Data from the experiment was subjected to analysis of variance
(ANOVA) using the statistical analysis systems software model containing treatment effects on the
parameters measured (SAS, 2002). Differences between treatment means were separated using
LSD.
6.1.1 Statistical model for Experiment
Yij= µ + PRi + eij
Where: µ= overall mean,
Yij= Body weight and body weight gain,
PRi=the fixed effect of treatment (Molaplus probiotics),
i= 5 treatment levels and
e= residual error
6.2 Results and Discussion
The cumulative weight gain means of indigenous chicken supplemented with varying
levels of molaplus poultry microbes is presented in Table 12. Body weight gains were higher for
chicken supplemented with molaplus probiotics compared to those on control. Weight gains were
highest (580grams) in chicken supplemented with 5ml of molaplus poultry microbes solution in
1000 ml drinking water at 7 weeks compared to the rest of the treatment levels. The results show
that treatment of 5ml/1000ml molaplus poultry microbes at week 7 had the best peak weights as
compared to the control (0ml) at significant level of (p˂ 0.05). There was a higher significant
weight gains in week 1 between the treatment levels of 250 ml, 500ml, 1000ml, 1500ml, 2000ml
and the control. It is clearly evident that the live weight gains were significantly higher in
experimental birds as compared to control ones at all levels during the period of 8weeks of trial.

60
Table 12: Cumulative weekly weight gain(g) means for indigenous chicken aged between 15-
16 weeks, fed on Molaplus poultry microbes for chicken a period of 7weeks
Molaplus (ml) 0 250 500 1000 1500 2000
Week1 40±0.02a 100±0.02
b 120±0.02
b 50±0.02
a 40±0.02
a 30±0.02
a
Week2 90±0.02a 280±0.02
b 240±0.02
b 230±0.03
b 180±0.02
b 120±0.02
a
Week3 190±0.03a 320±0.03
b 260±0.02
a 270±0.03
a 210±0.03
a 150±0.03
a
Week4 200±0.03a 420±0.03
b 360±0.03
b 290±0.03
a 300±0.03
b 200±0.03
a
Week5 210±0.03a 450±0.03
b 370±0.03
b 300±0.04
a 330±0.03
b 220±0.03
a
Week6 220±0.04a 540±0.04
b 440±0.04
b 380±0.05
a 460±0.04
b 250±0.04
a
Week7 230±0.04a 460±0.04
bc 360±0.03
b 580±0.04
c 440±0.04
c 260±0.04
ab
abcMeans with different superscripts within rows are significantly different (p˂ 0.05); Mean±SE
Studies on the beneficial effect of probiotics on indigenous chicken performance have
indicated that probiotic feed additives have positive effects on the performance of chicken,
according to Alloui et al., (2012) the use of probiotics in broilers results in higher weight gain for
the same amount of food consumed. In this study the body weights of probiotics adminstered
chicken were significantly increased at treatment with 5 ml in 1000 ml drinking water in 7th
week
in comparison with those of chicken on control. The effect of probiotics started after two weeks of
treatment and at the 3rd
week, the probiotics supplementation showed higher increase in the body
weights in the chicken on treatments compared with the control group. This positive effect of
probiotics on body weight increased at an increasing rate until the 7th
week of trial compared to the
other treatment levels. At week 6, the three treatment levels (5ml/250ml, 5ml/500ml and
5ml/1500ml) of indigenous chicken groups showed significant increase in the body weight
compared with the 5ml/1000ml and 5ml/2000ml group as well as the control group.
The IC fed on treatment level of 5ml/1000ml exhibited consistent increase in body weights
amongst all the groups at all times of this trial. In a similar study, Alloui et al., (2012) reported that
the administration of probiotics via the drinking water had beneficial effects on broiler
performance. Moreover, the birds fed on probiotics level of 5ml/1000ml water showed best
cummulative weight gain than the other levels of probiotics as well as control group towards the
end of the feeding trial. This finding is in agreement with Alkhalf et al., (2010) who demonstrated
that probiotics supplemented to the chicken improve the body weight and daily weight gain.

61
Figure 6: Cumulative weight gains for indigenous chicken fed on Molaplus poultry microbes.
Timmerman et al., (2006) reported inconsistent effects of probiotics bywhich were likely
influenced by administration dose, diet composition and the probiotic strains. These results are also
in agreement with Kabir (2009) who demonstrated increased live weight gain in probiotic fed
chicken. Multi-strain probiotics when used may be more effective than single-strain probiotics
(Alloui et al., 2013). In a related study, Higgins (2007) reported that higher inclusion levels did not
always result in better performance in chicken. Cummulative weight gains for indigenous chicken
given supplementary diets with varying levels of Molaplus poultry microbes are presented in
Figure 6 It shows that treatment of 5ml/1000ml Molaplus had the highest cumulative body weight
gain with the highest peak at 8weeks compared to the rest of treatment levels. Similar studies by
Alloui et al., (2012) on effects probiotic feed additives on broilers performance reported positive
effects on body weight gain.
Weig
ht
gain
s (
Gram
s)
Age (Weeks)
5:250 ml
5:500 ml
5:1500
ml5:1000
ml

62
The results in Figure 7 show that the control (0) and treatment (1000 ml) results for weight
gains were significantly different (p˂ 0.05). There was a significant difference in weight gain in
the 2nd
and 4th
week between the treatment and control. The birds on molaplus poultry microbes
treatment had the best weight gain compared to the birds in control. The live weight gains were
significantly higher in experimental birds as compared to control ones at all levels during the
period from 2nd
to 4th
weeks of trial. This result is in agreement with reports of Alkhalf et al.,
(2010) who reported increased live weight gain in probiotic fed broilers.
Figure 7: Weight gain trends for IC given molaplus poultry microbes for 4 weeks
Conclusion
Supplementation of local feeds with molaplus probiotics at the concentration of 5ml in 1000ml in
the IC drinking water could improve weight gains in indigenous chicken.
Mean
weig
ht
gain
(G
ram
s)
Age (Weeks)
5:1000 ml
control

63
CHAPTER SEVEN
THE EFFECTS OF DIETARY PROBIOTICS ON NATURAL IGM ANTIBODY TITRES
OF KENYAN INDIGENOUS CHICKEN
7.0 Introduction
The indigenous chicken (IC) industry has become an important economic activity in Kenya
and many countries. In large-scale rearing facilities, where chicken are exposed to stressful
conditions, problems related to diseases and deterioration of environmental conditions often occur
and result in serious economic losses. Prevention and control of these diseases have led in recent
decades to a substantial increase in the chemical usage. The usage of these chemicals as a
preventive measure has been questioned; there exist extensive documentation of the evolution of
pathogens resistant to chemicals. The possibility of alternative to drug usage may be the use of
probiotics and/ or breeding for disease resistance (Khobondo et al., 2015). Probiotics are being
considered to fill this gap and already some farmers are using them in preference to antibiotics
(Nava et al., 2005).
Probiotic, meaning „for life‟ in Greek, are defined as „a live microbial feed supplement,
which beneficially affects the host animal by improving intestinal balance (Fuller, 2001). The
species currently being used in probiotic preparations are varied and many. These are mostly
Lactobacillus bulgaricus, Lactobacillus acidophilus, Lactobacillus casei, Lactobacillus helveticus,
Lactobacillus lactis, Lactobacillus salivarius, Lactobacillus plantarum, Streptococcus
thermophilus, Enterococcus faecium, Enterococcus faecalis, Bifidobacterium spp. and Escherichia
coli (Kabir, 2009). Some other probiotics are microscopic fungi such as strains of yeasts belonging
to Saccharomyces cerevisiae species (Fuller, 2001). Probiotics may be composed of one or a
combination of many strains. Probiotics are used to help maintain a healthy microbial balance
within the intestine to promote gut integrity and prevent enteric disease (Cox and Dalloul, 2015).
This is accomplished through three main mechanisms: competitive exclusion, bacterial
antagonism, and stimulation of the immune system (Ohimain and Ofongo, 2012). The
manipulation of gut microbiota via the administration of probiotics influences the development of
the immune response (McCracken and Gaskins, 1999). It has been shown that probiotics stimulate

64
different subsets of immune system cells to produce cytokines, which in turn modulate the immune
response (Lammers et al., 2003) and activate other cells.
Amongst the subset of B cells, B-1 cells constitute the predominant subset of B cells in
mammals, while B-2 cells produce the majority of circulating specific antigen induced antibodies
possessing high binding affinities (Islam et al., 2004). The antibodies secreted by B-1 cells called
natural antibodies. They typically have low binding affinities and broad specificities (Parmentier et
al., 2004). Natural antibodies are usually produced without prior exposure to antigens (Khobondo
et al., 2015). Foreign antigens like lipopolysaccharides (LPS), lipoteichoic acid, keyhole limpet
hemocyanin, and bovine serum albumin (BSA) (Higgins et al., 2007) that bind natural antibodies
in the sera of unimmunized chickens have been found. In higher organisms including chicken,
natural antibodies may be of isotype IgM, IgG, or IgA, but IgM is the predominant isotype. In
mammals, B-1 cells are responsible for production of the natural IgM antibodies in serum
(Khobondo et al., 2015) but in chicken B1 cells have not been defined yet. Natural IgM antibodies
possess a wide range of activities, including regulation of immune response, induction of specific
IgG antibodies, and protection against bacterial and viral infections (Nava et al., 2005).
Natural antibodies in the chicken bind to antigens in a specific manner and the affinity of
these interactions increases with age, suggesting a role for external stimuli. These roles can be
exploited for breeding of disease resistance. Due to consumer concern on the use of antibiotics as
growth promoters and prophylaxis in poultry diets, investigations evaluating the potential of
dietary probiotics as substitutes for antibiotics do receive high priority and IC should not be
exemptions. This is because, the IC are predominantly raised under extensive production system
(Khobondo et al., 2014). This exposes the IC to various environmental challenges and disease
causing pathogens hence the rationale of this study. Earlier, it was shown that probiotics stimulate
natural antibodies in poultry (Haghighi et al., 2006).This experiment was carried out to determine
possible effects of dietary probiotics on serum natural IgM levels in IC. The findings could be used
to prevent disease burden or compliment breeding for disease resistance.

65
7.1 Materials and methods
7.1.1 Source of birds, feeding regime and management
A feeding trial was conducted using one hundred and fifty (150) indigenous chicken
sourced at two months from free range small scale farmers. The farmers were from Nyakach and
Emining of Kisumu and Baringo countries, Kenya. The trial was done in a randomized complete
block design with control. The birds were randomly allocated the 5 test diets with 25 replicates (25
birds/replicate) per treatment. 25 birds had no supplementation (control). The dietary treatments
and water were offered ad libitum. The probiotic was added into drinking water by giving a
specific concentration of 5 ml of Molaplus microbes (Molaplus.com) in different volumes (250,
500, 1000, 1500, 2000 ml) of the respective water once a day at 0900 hours. The Molaplus is a
complex solution of various beneficial micro-organisms which are found naturally and are used in
food manufacturing. When used in poultry production, they avail, chelated minerals, anti-oxidant,
enzymes, vitamins, organic acids, lactic bacteria, yeast and phototropic bacteria (Molaplus.com).
The experiment was done for a period of two months (60 days), thereafter IC were left for two
weeks (14 days) for immunological stabilization, then blood sample was taken for natural antibody
assay.
7.1.2 Natural antibodies (IgM) measurement
Blood samples (~2 ml in EDTA) from 150 IC was drawn from the wing vein of each bird
and serum was separated immediately by centrifugation at 2000 rpm for 10 minutes for measuring
IgM antibodies binding KLH. Isotype specific IgM antibody titres to keyhole limpet hemocyanin
(KLH) in serum from the IC was determined by indirect enzyme-linked immunosorbent assay
(ELISA). Briefly, 96 well plates were coated with 2 μg/ml KLH (MP Biomedicals Inc., Aurora,
OH) and incubated overnight at 4oC. Following washing with deionized water, the plates were
incubated for 1.5 hours at 25oC temperature with IC serum diluted 1:10 with dilution fluid
(phosphate buffered saline (PBS) containing 0.5% horse serum and 0.05% Tween). Unbound
serum was removed through washing. To detect IgM antibodies binding to KLH a 1:20,000 diluted
affinity purified goat anti-chicken IgM (Fc specific), conjugated with horseradish peroxidase
(GACh/IgM (Fc) /PO) antibody (Nordic Immunological Laboratories, Eindhoven, The Netherlands
was added and incubated for 1.5 hours for 25oC. After incubation with the conjugate and

66
subsequent washing, 100 μl substrate-buffer (containing aquadest, 10% tetramethylbenzidine-
buffer and 1.33% tetramethylbenzidine) per well was added and incubated for 10 minutes at room
temperature. The reaction was stopped with 1.25M H2SO4. Absorbance levels per sample were
measured with a spectrophotometer (mrc Scientific Instrument-UT- 6100, Israel) at a wavelength
of 450 nm.
7.1.3 Statistical analysis
The data was analysed by using one way ANOVA using Proc GLM of SAS (SAS 2002). The
following model was used;
Yij = µ+PRi+eij
Where y is the IgM absorbance level (titre value), µ is the overall mean, PRi is the fixed effect of
treatment (i=2), e is the residual error.
7.2 Results
7.2.1 Presence Of Natural Igm Antibodies Binding KLH In Serum Of IC And Effects Of
Dietary Probiotics
Table 13:The LSmeans and standard deviations (SD) of the dietary treatment of IgM titres
binding KLH
Isotype IgM
Parameter LSMeans Std error p
Control 1.75 0.121
0.873
Probiotic 1.73 0.065
LS means = least square means; S.D = standard deviation
Natural IgM antibodies binding KLH were detected in IC serum but, there was no
significant difference between the IC fed probiotics and the birds not fed probiotics (control) (P ˃
0.05, the Control group showed higher IgM titres but not significant) Neither was there significant

67
difference in the titres of KLH binding IgM at 17 days after treatments (P ˃ 0.05) between the
treatments (different inclusion levels of probiotic concentration). However, the control group (no
probiotic fed) had higher Least Square Means than the birds fed probiotics of 1.753 and 1.730
respectively (Table 13).
7.3 Discussion
In accordance with previous findings, the present study revealed that serum antibodies
(IgM binding KLH) are present in unimmunized IC. Since the IC likely did not encounter before,
will not encounter KLH and cross reactivity with other antigen is unknown, this IgM antibodies
bindin KLH can be regarded as natural antibodies. Natural IgM antibodies isotype are amongst the
innate immunity (Vani et al., 2008). Innate immunity as the first line of defense plays an important
role in preventing or combating infection (Ehrenstein and Notley, 2010). Natural antibodies have
been detected in non-immunized cattle (van Knegsel et al., 2007), humans (Ehrenstein and Notley,
2010), rats, rabbits, fish, snakes and poultry (Sun et al., 2011). In mammals, the Nabs are mostly
produced by CD5+ B cells in the peritoneal cavity and intestines but also CD5- B cells (Casali and
Notkins, 1989) were described to produce Nab. Natural antibodies may arise independently of
known antigenic stimulation. They are mostly poly-reactive, and poly-specific (Baccala et al.,
1989) with low binding affinity, and are generally encoded by the unmutated V genes in germ line
configuration (Khobondo et al., 2015). Evidence from various studies show that they are
genetically controlled and inherited (Sun et al., 2011).
Most of Nab are of the IgM isotype class in lower vertebrates, fetus and neonates, but IgG
and IgA Nab are also present as well in higher vertebrates (Marianne, 2000). Production of Nabs
may also be induced by the contact with non-pathogenic microbes, food, intestinal flora, probiotics
and self-antigens (Quintana and Cohen, 2004). Most of Nab bind pathogen-associated molecular
patterns (PAMP), eg lipopolysaccharide, lipoteichoic acid or peptidoglycan conserved along
different genera and these serve as targets for identification of microbes by the innate immune
system (Parmentier et al., 2004). The levels of Nabs are likely dependent on several factors,
amongst them the environment (Kachamakova et al., 2006), genetic background (Ardia et al.,
2011) and age (Berghof et al., 2010).

68
Despite the plethora of data demonstrating the positive effects of probiotics on immune
performance (Haghighi et al., 2006), this study and some others have reported no significant
enhancements due to probiotic supplementation (Rahimi et al., 2011). It has to be kept in mind,
however, that titres of IgM to KLH were measured 14 days after dietary treatment, so short term
temporary effects could not be found. Also there was information on the IgG levels KLH. It is
clear from the present study and other published research that responses to probiotic
supplementation are inconsistent. Numerous investigations were done on possible factors that
could influence the responses to these additives. For example, in broilers possible causes of
variations in response to probiotic supplementation could be differences between strains, hybrids,
age, sex, plane of nutrition, nutrient composition of the diet, microbial population of
gastrointestinal tract, levels of inclusion of probiotics in the diet, duration of supplementation or
other environmental conditions (Midili et al., 2008).
In this study involving IC, administration of probiotics did not significantly enhance serum
IgM antibodies reactive to KLH. In this case, probiotic treatment resulted in the reduction of the
mean reactive IgM antibodies in serum of the IC. These discrepancies could be due to a variety of
factors including, but not limited to, strain(s) of bacteria utilized, composition and viability of the
probiotic, preparation method, dosage, application method, frequency of application, overall diet,
drug interactions, and condition of the animal (Huang et al., 2004). The experimental design,
source of birds and early stage production system in this study could be the cause of discrepancies
in result. It is worth noting that the IC used in this study were naturally hatched and bred, the
rearing was free range as well. This management system from incubation, hatching to the time they
were sourced (2 months old) might have exposed them to these commensal microbes from the
feces and environment. The chicken could have received a complete gut flora from the mother‟s
faeces and would infer immune response similar to probiotic microbes. The shell microbial
contamination during incubation and hatching could play a role. The extensive system of IC
production may have predominantly exposed the IC to plethora of microbes, infested the gut with
several microflora and consequently influenced Nab levels. These results are in agreement with the
results of other studies in which probiotics (Huang et al., 2004) or prebiotics (Franklin et al., 2002)
or combinations of probiotics and prebiotics (Midili et al., 2008) were used in different animal
species.

69
Several studies reported the role of probiotic in augmenting immune response (Cox and
Dalloul, 2015). There are evidence that probiotics stimulate production of natural antibodies
(Haghighi et al., 2006) and different subsets of immune system cells to produce cytokines, which
in turn play a role in the induction and regulation of the immune responses (Maassen et al., 2000).
It was found recently Nab levels in elite improved breeds reflect different physiological health
status (in this case enhanced survival) as opposed to IC kept in confinement (in which Nab levels
may signal a status of stress (Wondneneh et al., 2015). Thus enhancement or decrease of Nab in
birds may mimic sensitivity to stress or changing (dietary) conditions, indirectly reflecting the
animals, condition to respond. In IC conditions due to husbandry may have been such that
probiotics could not further enhance or decrease immune sensitivity.
The induction of immune response and the preimmune antibody repertoire is a subject of
debate. It is possible that resident dendritic cells (DCs) in the lamina propria, which directly
sample the intestinal lumen and engulf commensal bacteria, could play a role (Yaman et al., 2006).
DCs express a repertoire of Toll-like receptors (TLRs) (Kabir et al., 2005), and binding of
structural components of commensal bacteria or probiotics to TLRs expressed on the surface of
DCs may lead to activation and maturation of these cells (Apata, 2008). Upon activation, DCs
process and present antigens to other cells thereby promoting the activation and differentiation of
different subsets of immune system cells, leading to the production of Th2 cytokines, such as
interleukin 4 (IL-4), IL-10, and transforming growth factor, that are important for antibody
production and isotype switching (Apata, 2008). The former may have the implications on the
Nabs level witnessed in this study. Most microbes used in probiotic may have shared PAMPs with
the microbes already ingested by the chicken in the free range production system.
7.4 Conclusion
This study provides no evidence that the administration of probiotics to IC diets caused any
significant changes in systemic natural IgM antibody concentration. Further studies are needed to
understand the effects of these additives and to clarify the effect on the immune status of IC. More
comprehensive experimental designs examining performance and humoral immunities especially
natural IgG and IgA and levels of adaptive IgA, IgG and IgM responses, age of exposure and
production systems should be conducted.

70
CHAPTER EIGHT
CONCLUSIONS AND RECOMMENDATIONS
8.1Main findings
1. Many young and educated men in Baringo County are beginning to venture in indigenous
chicken keeping contrary to the notion that indigenous chicken farming was meant for
women and the uneducated. The young educated men are becoming more interested in
indigenous chicken farming probably because they are beginning to realize the economic
viability of indigenous chicken business.
2. Indigenous chicken farmers in Baringo use commercial feeds to supplement their chicken
compared to their counterparts in Kisumu who do use commercial feeds to supplement at
all. Due to improved feed supplementation with commercial feeds, the indigenous chicken
in Baringo came into lay and crow earlier than those from Kisumu County.
3. There are significant differences in feeding strategies and performance of indigenous
chicken among the pastoral and fishing communities in both Counties.
4. Baringo County had the highest total number of indigenous chicken and normal feathered
ecotypes, nearly double the number kept in Kisumu County. This was probably due to
more land available, better market and more educated young men entering into indigenous
chicken business as opposed to semi confined subsistence system in Kisumu due lack of
enough land, low levels of education and confinement of indigenous chicken during
cropping seasons.
5. Chicken can compound their own diet when put under a cafeteria system and the formular
given by indigenous chicken during the cafeteria feeding trial for their daily intake was: 33
grams maize, 5 grams ochonga, 4 grams millet, 1 gram rice germ, 1 gram kienyeji mash
and 0.3 grams sorghum.
6. Incidence and high contamination levels of total aflatoxins were detected in indigenous
chicken feedstuffs especially in sorghum grains and kienyeji mash.
7. Supplementation of local feeds with Molaplus poultry microbes at the concentration of 5
ml in 1000 ml in the IC drinking water could improve weight gains and growth rates of
indigenous chicken.

71
8.2 Conclusions
1. More educated young men from Baringo are practicing indigenous chicken production
compared to those from Kisumu. More farmers in Kisumu confine their indigenous
chicken.
2. There are more indigenous chicken in Baringo than Kisumu and they attain maturity earlier
in terms of point at first lay and crow compared to indigenous chicken from Kisumu.
3. The major feedstuffs utilized by indigenous chicken in the two Counties were lacking most
rated critical amino acids such as methionine, lysine and tryptophan.
4. Higher contamination levels of total aflatoxins above 10 ppb were detected in local
indigenous chicken feedstuffs.
5. Supplementation of local feeds with Molaplus poultry microbes at the concentration level
of 5ml in 1000ml in the IC drinking water daily could improve growth rates of IC.
8.3 Recommendations
1. The source of aflatoxins contamination in feedstuffs in IC should be investigated and
the use of aflatoxin binders in IC should be studied.
2. Amino acids profiling of commercial feeds used by IC farmers in Kisumu and Baringo
Counties should be done.
3. Further culture assay should be done on molaplus poultry microbes to define its actual
probiotic bacterial culture and also determine its other beneficial effects on blood
parameters, egg and meat qualities of IC.
4. More comprehensive studies should be done on the economics/cost benefit analysis of
use of probiotics in extensive production system and the kinetics of its use at different
growing stages of IC.
5. Commercialization of IC production should be promoted among the farmers in Kisumu
County.

72
REFERENCES
Abidin, Z.U., Khatoon A., Qureshi M.A., Butt T.M. 2013. Determination of aflatoxin B1 in
finished poultry feed samples collected from different poultry farms and markets of Lahore,
Pakistan. International Journal of Veterinary Science, 2: 28-31.
Adi Ratriyanto, Rysca Indreswari and Sunarto. 2014. Effects of Protein Levels and
Supplementation of Methyl Group Donor on Nutrient Digestibility and Performance of
Broiler Chickens in the Tropics.International. Journal of Poultry Science 10: 575-581
Akande, K.E., Abubakar MM, Adegbola TA, Bogoro SE 2006. Nutritional and health implications
of mycotoxins in animal feeds: a review. Pakistan Journal of Nutrition, 5: 398-403.
Alkhalf, A., Alhaj, M., & Al-homidan I. 2010. Influence of probiotic supplementation on blood
parameters and growth performance in broiler chickens. Saudi Journal of Biological
Sciences, 3: 219–225.
Alloui N., Chafai S., Alloui M. N. 2012. Effect of probiotics feed additives on broiler chickens
health and performance. Journal of Animal feed and research, 2: 104-107.
Alloui, M., Szczurek, W. and Świątkiewicz, S. 2013.The Usefulness of Prebiotics and Probiotics in
Modern Poultry Nutrition: a Review.Annals of Animal Science, 13: 17-32.
Amado Renato 2009.Enzymes in food and food processing- a review. Swiss Federal Institute of
Technology, department of food science, Switzerland.
Anitha S., Raghunadharao D., Waliyar F., Sudini H., Parveen M., Ratna Rao, Lavakumar P. 2014.
The association between exposure to aflatoxins, mutation in TP53, infection with hepatitis
B virus and occurrence of liver disease in a selected population in Hyderabad, India.
Elsevier journal B.V. 766: 23-28.
Anjum, M.A., Khan S.H., Sahota A. W., Sardar R. 2012.Assessment of aflatoxin B1 in
commercial poultry feed and feed ingredients. The Journal of Animal and Plant Sciences,
22: 268-272.

73
AOAC, 2011.Official methods of analytical chemist. 18th ed. Gaithersburg (MA): AOAC
International. pp 100-105.
Apata, D. F. 2008. Growth performance, nutrient digestibility and immune response of broiler
chicks fed diets supplemented with a culture of Lactobacillus bulgaricus. Journal of
Science and Food Agriculture. 88: 1253-1258.
Asuquo, B.O., Okon, B. 1993. Effects of age and egg size on fertility and hatchability of chicken
eggs. East Africa. 59:79-83.
Azzam, A. H. & Gabal, M. A.1998. “Aflatoxin and immunity in layer hens. ”Avian Pathology, 27:
570-777.
Baccala R., Quang T. V., Gilbert M., Ternynck T. and Avrameas S. 1989. Two murine natural
polyreactive autoantibodies are encoded by nonmutated germ-line genes. Proceedings of
the National Academy of Sciences, 86: 4624-4628.
Badubi, S. S., Rakereng M., &Marumo, M. 2006. Morphological characteristics and feed resources
available for indigenous chickens in Botswana. Livestock Research for Rural
Development. 18:1-4.
Berghof ,T. V. L., De Vries Reilingh G., Nieuwland M. G. B. and Parmentier H. K. 2010. Effect of
aging and repeated intratracheal challenge on levels of cryptic and overt natural antibodies
in poultry. Poultry Science, 89: 227-235.
Birech, E.K. 2004.Feed and nutrient intake for free-ranging chicken in Nakuru District,
Kenya.Msc thesis.Egerton University, Njoro, Kenya.
Celik, I., Oguz H., Demet O., Donmez H. H., Boydak M. & Sur E. 2000. “Efficacy of polyvi-
nylpolypyrrolidone in reducing the immunotoxicity of aflatoxin in growing broilers. British
Poultry Science, 41: 430-439.
Cheeke, Peter R. 1991. Applied Animal Nutrition: Feeds and Feeding.Macmillan, New York,
NY.Pp 504.

74
Chemjor, W. 1998.Energy and protein requirements of growing indigenous chicken of Kenya.Msc
thesis. Pp. 5-10. Unpublished.
Cox, C. M. and Dalloul R A 2015. Immunomodulatory role of probiotics in poultry and potential
in ovo application. Beneficial Microbes 6, 45–52. 10.3920/BM2014.0062
Dessie, T., 1996. Studies on village poultry production systems in central Highlands of
Ethiopia.Msc thesis. Swedish University of Agricultural Sciences, Uppsala, Sweden.
Unpublished.
Dhanasekaran D, Annamalai P, Noorudin T. 2009. Evaluation of aflatoxicosis in hens fed with
commercial poultry feed. Turkish Journal of Veterinary and Animal Sciences, 33: 385-391.
Ehrenstein M. R. and Notley C. A. 2010. The importance of natural IgM: scavenger, protector
and regulator. Nature Review Immunology, 10: 778-786.
European Commission. 2006. Commission regulation (EC) No 1881/2006 of 19 December 2006
setting maximum levels for certain contaminants in foodstuffs. Official Journal of the
European Union, 364: 5–24 .
FAO, 2000.FAOSTAT.Statistical database of Food and Agriculture Organisation of the United
Nations, Rome., Italy.
Firdous S. 2003. Effect of storage, temperature and moisture on the total aflatoxin growth in
indigenous feed ingredients by HPLC. M. Phil. Thesis. GC University, Lahore, Pakistan;
pp 30-39.
Food and Agriculture Organization of the United Nations (FAO). 2007. Animal production and
health division. emergency centre for trans-boundary animal diseases, socio economics,
production and biodiversity. Poultry sector country review- Kenya. Pp. 3-13.
Franklin S. T., Newman K. E. and Newman M. C. 2002.Evaluation of mannanoligosaccharide
on the immune status of dairy cows and their calves. Journal of Animal Science.80:192

75
Fuller, R 2001.The chicken gut microflora and probiotic supplements. Journal of Poultry Science,
38: 189-196.
Gakige, J. K., King‟ori A. M, Bebe B. O. and Kahi A. K. 2015.Effects of targeted phase
supplementary feeding on gut morphology of scavenging ecotypes of indigenous chickens
in Kenya. Livestock Research for Rural Development. 27:193.
Ghulam Fareed, Sohail Hassan Khan, Muhammad Ashraf Anjum and Naveed Ahmed. 2014.
Determination of Aflatoxin and Ochratoxin in poultry feed ingredients and finished feed in
humid semi-tropical environment. Journal of Advanced Veterinary and Animal Research,
1: 201-207.
Goromela E. H., Kwakkel R. P., Verstegen M. W. A. and Katule A. M. 2007.Identification,
characterization and composition of scavengeable feed resources for rural poultry
production in Central Tanzania. African Journal of Agricultural Research 2: 380-393
Haghighi R. H., Gong J., Gyles L. C., Hayes M. S., Zhou H., Sanei B., James R., Chambers R. J.
and Sharif S. 2006. Probiotics stimulate production of natural antibodies in chicken.
Clinical Vaccine Immunology. 13: 975–980.
Hellica, 2011.Total Aflatoxin Assay Kit CAT No. 941AFL01M-96 V. 05
Higgins, J. P., Higgins S. E., Vicente J. L., Wolfenden A. D., Tellez G. and Hargis B.
M.2007.Temporal effects of lactic acid bacteria probiotic culture on Salmonella in neonatal
broilers. Poultry Science. 86: 1662-1666.
Huang, M. K., Choi Y. J., Houde R., Lee J. W., Lee B. and Zhao X. 2004.Effects of Lactobacilli
and an acidophilic fungus on the production performance and immune responses in broiler
chickens. International Journal of Poultry Science, 83: 788–795.
Hussain, Z., Muhammad Z.K., Ahrar K., Ijaz J., Muhammad K.S., Sultan M., Muhammad R.A.
2010. Residues of aflatoxin B1 in broiler meat: Effect of age and dietary aflatoxin B1
levels. Food and Chemical Toxicology, 48: 3304-3307.

76
IARC. 1993. International agency for research on cancer, monographs on the evaluation of
carcinogenic risks to humans, some naturally occurring substances: Food items and
constituents, heterocyclic aromatic amines and mycotoxins. Lyon: International Agency for
Research on Cancer. 56: 489–521.
IARC. 1999. International agency for research on cancer, monographs on the overall evaluation of
carcinogenic risks to humans. Lyon: International Agency for Research on Cancer 74:1–36.
IFPRI (International Food Policy Research Institute), 2000. www.cgiar.org/IFPRI.
Islam, M. W., Rahman M. M., Kabir S. M. L., Kamruzzaman S. M. and Islam M. N.2004.Effects
of probiotics supplementation on growth performance and certain haemato-biochemical
parameters in broiler chickens. Bangladesh. Journal of Veterenary Medicine, 2: 39-43.
Islam, R., Kalita, N., & Nath, P. 2014. Comparative performance of Vanaraja and Indigenous
chicken under backyard system of rearing. Journal of Poultry Science and Technology, 2:
22-25.
Kabir S. M. L., Rahman M. M. and Rahman M.B. 2005.Potentiation of probiotics in promoting
microbiological meat quality of broilers. Journal of Bangladesh Social and Agricultural
Science Technology, 2: 93-96.
Kabir S. M. 2009.The Role of Probiotics in the Poultry Industry. International Journal of
Molecular Science, 10: 3531–3546.
Kabir, S M L, Rahman M M and Rahman MB. 2005. Potentiation of probiotics in promoting
microbiological meat quality of broilers. Journal of Bangladesh Social and Agricultural
Science Technology, 2: 93-96.
Kachamakova N. M., Irnazarow I., Parmentier H. K., Savelkoul H. F. J., Pilarczyk A. and
Wiegertjes G. F. 2006. Genetic differences in natural antibody levels in common carp
(Cyprinus carpio L). Fish & Shellfish Immunology, 21:404-413.
Kenya Agricultural Research Institute (KARI). 2010. Annual report. Pp.1-3

77
Khan, SH, Shamsul H, Rozina S, Muhammad AA 2011. Occurrence of Aflatoxin B1 in Poultry
Feed and Feed Ingredients in Pakistan. International Journal of Agro Veterinary and
Medical Sciences, 5: 30-42.
Khobondo J O, Okeno T O, Lihare G O, Wasike C B and Kahi A K 2014. The past, present and
future genetic improvement of indigenous chicken of Kenya. Animal Genetic Resources,
pp125.
Khobondo J. O., Mike G. B., Nieuwland, Laura E., Webb and Eddie A. M. Bokkers and Henk
K. Parmentier 2015a Natural (auto) antibodies in calves are affected by age and diet.
Veterinary Quarterly, DOI: 10.1080/01652176.2015.1009657.
Khobondo, J O, Muasya T K, Miyumo S, Okeno T O, Wasike C B, Mwakubambanya R, Kingori
A M and Kahi A K 2015.Genetic and nutrition development of indigenous chicken in
Africa.Livestock Research for Rural Development. Volume 27:122.
Khobondo, J O, Ogore P B, Atela J A, Onjoro P S, Ondiek J O and Kahi A K. 2015.The effects of
dietary probiotics on natural IgM antibody titres of Kenyan indigenous chicken. Livestock
Research for Rural Development. 27:230.
Kimball S.R. & Jefferson L.S. 2006.signaling pathways and molecular mechanisms through which
branched-chain amino acids mediate translational control of protein synthesis. Journal of
Nutrition. 136:227-231.
King‟ori, A. M., Tuitoek J. K., Muiruri, H. K. and Wachira, A.M. 2004. Demand-driven
agricultural research for sustainable natural resource base, food security and incomes;
proceedings of the 8th KARI biennial scientific conference. KARI, Nairobi (Kenya). Pp.
598-599.
King‟ori, A.M., 2004.The protein and energy requirements of indigenous chickens (Gallus
domesticus) of Kenya.PhD thesis. Egerton University, Kenya.

78
King‟ori, A.M., Tuitoek, J.K, Birech, E.K and Wachira, A.M., 2007.Protein intake of growing
indigenous chickens on free-range and their response to supplementation. International
Journal of Poultry Science 6:617-621.
Kingori, A. M., Wachira, A. M. and Tuitoek, J. K. 2010. Indigenous chicken production in
Kenya.International Journal of Poultry Science. 9: 309-316.
Kitalyi, A.J., 1998. Village chicken production systems in rural Africa. FAO Animal production
and Health paper 142. FAO, Rome.
Lammers, K M, Brigidi P, Vitali B, Gionchetti P, Rizzello F, Caramelli E, Matteuzzi D and
Campieri M 2003. Immunomodulatory effects of probiotic bacteria DNA: IL-1 and IL-10
response in human peripheral blood mononuclear cells. FEMS Immunology Medical
Microbiology, 38:165-172.
Lauder, W., 1967. The Hatchability of chicken eggs as influenced by environment and hereditary.
Storrs Agric. Experimental station, Connecticut
Leeson S. and Summers J. D. 2001.Scott‟s Nutrition of the Chicken. University Books,
Guelph, ON, Canada.
Leonarz, H., 1945. The care and selection of hatching eggs. Paper prepared for presentation at
meeting of texas Baby chick Association, Dallas. Texas.
Maassen C. B., Van Holten-Neelen C., Balk F., Den Bak-Glashouwer M. J., Leer R. J., Laman J.
D., Boersma W. J. and Claassen E. 2000. Strain dependent induction of cytokine profiles
in the gut by orally administered Lactobacillus strains. Vaccine, 18, 2613-2623.
Mandleker, H.H., 1981. A note on fertility and hatchability and egg weight in broiler chicken. Ind.
Poult. Review 12:33-34.
Marianne B. 2000.Role of natural and immune IgM antibodies in immune responses. Molecular
Immunology, 37: 1141-1149.

79
McCracken V. J. and Gaskins H. R. 1999. Probiotics and the immune system. In Probiotics, a
Critical Review; Tannock G W Ed, Horizon Scientific Press: Norfolk, UK pp. 85-112.
Mengesha, M. and W. Tsega, 2011.Phenotypic and genotypic characteristics of indigenous
chickens in Ethiopia: A review. African Journal Agricultural Research., 6: 5398-5404.
Mengesha, M., B. Tamir and T. Dessie, 2011.Village chicken constraints and traditional
management practices in Jamma District, South Wollo, Ethiopia. Livestock Research for
Rural Development, Vol. 23.
Midilli M, Alp M, Kocabağli N, Muğlalı Ö H, Turan N, Yılmaz H and Çakır S 2008. Effects of
dietary probiotic and prebiotic supplementation on growth performance and serum IgG
concentration of broilers. South African Journal of Animal Sciences, 38: 21-27.
Ministry of Agriculture, Livestock development and marketing, 1993.Animal production Division,
Kenya.Annual report.
Ministry of Agriculture, Livestock development and marketing, 2000.Animal production Division,
Kenya.Annual report.
Ministry of Agriculture, Livestock development and marketing,1990. Animal production Division,
Kenya.Annual report.
Ministry of Agriculture, Livestock development and marketing,1996. Animal production Division,
Kenya.Annual report.
Ministry of Livestock Development, 2008.Annual Report for the year 2008.Ministry of Livestock
Development, Republic of Kenya Nairobi
Molaplus.com, Kenya. 2015. Poultry Microbes.
National Research Council (NRC), 1994.Nutrient Requirements for Poultry.No. 1, 9th
Edition.National Academy of Science, Washington, DC. pp155

80
Nava G M, Bielke L R, Callaway T R and Castañeda M P 2005. Probiotic alternatives to reduce
gastrointestinal infections: The poultry experience. Animal Health Research Review, 6:
105-118.
Ndegwa, J. M., Mead, R., Norrish, P. and Shephered, D. 2012.Growth characteristics of six
reciprocal crosses of Kenyan indigenous chicken.Journal of Agricultural Science. 4:208-
212.
Nwosu, C. C., 1990. The state of smallholder rural poultry production in Nigeria.In proceeding
of an international workshop. Thessaloniki, Greece.
Nyaga, P. 2007. The structure, marketing and importance of the commercial and village poultry
industry: an analysis of the poultry sector in Kenya. FAO Poultry sector country review.
1:15- 50.
Nyoni, N. M. and Masika, P. J. 2012. Village chicken production practices in the Amatola basin
of the eastern Cape province, South Africa. African Journal of Agricultural Research.
7:26-47
Nzioka, 2000. Indigenous poultry production in Katumani mandate districts: constraints and
prospects. National Poultry Research Program (NARP II). 2: 213- 225.
Ohimain E I and Ofongo R T 2012. The effect of probiotic and prebiotic feed supplementation
on chicken health and gut microflora: a review. International Journal of Animal and
Veterinary Advances, 4: 135-143.
Okeno, T. O., Kahi, A. K. and Peter, S. I. 2011. Characterization of indigenous chicken
production systems in Kenya: household flock structure, dynamics and breeding
practices. Tropical animal health and production,1: 24-26.
Okeno, T. O., Kahi, A. K., and Peters, K. J. 2012.Characterization of indigenous chicken
production systems in Kenya.Tropical animal health and production, 44: 601-608.
Okitoi, L. O., Kabuage, L. W., Muinga, R. E. and Badamana, M. S. 2007. The potential of
morning and afternoon supplementation of scavenging chickens on diets with varying
energy and protein levels.Livestock Research for Rural Development. 19:2-3.

81
Okitoi, L. O., Ondwasy, H. O., Obali, M. P. and Murekefu, F. 2007. Gender issues in poultry
production in rural households of western Kenya. Livestock Research for Rural
Development.19:23-24.
Okitoi, L. O., Ondwasy, H. O., Siamba, D. N. and Nkurumah, N. 2007.Traditional herbal
preparations for indigenous poultry health management in western Kenya.Livestock
Research for Rural Development .19:5-7.
Okitoi, L.O., Ondwassy, H., Obali, M., Linyonyi, A., Mukisira, E.A, R. 2008.The potential on-
farm impact of appropriate technologies on productivity of Indigenous chicken in Western
Kenya. In: The 7th Biennial scientific conference, 13-17th November, Nairobi, Kenya.
Okuthe, S.O., 1999. Participatory Epidemiology Assessment of livestock productivity in western
Kenya Highlands. PhD. Thesis.Dept. Of Agric. Veterinary Epidemiology and Economics
Research unit, the University of Reading, UK
Oladokun V.O. and Johnson A., 2012. “Feed formulation problem in Nigerian poultry farms: a
mathematical programming approach.” American journal of scientific and industrial
research.
Oliveira, C. A., Kobashiqawa, E., Reis, T. A., Mestieri, L., Albuquerque, R., Correa, B.2000.
“Aflatoxin B1 residues in eggs of laying hens fed a diet containing different levels of the
mycotoxin.” Food Additives and Contaminants.17:459-62.
Olwande, P.O., Ogara, W.O., Okuthe, S.O., Muchemi, G., Okoth, E., Odindo, M.O. and
Adhiambo, R.F. 2010.Assessing the productivity of indigenous chickens in an extensive
management system in Southern Nyanza, Kenya.Tropical Animal Health and
Production. 42:283-288.
Ondwassy, H.O., Nankare, J., Ligono, W., Nelima, K., 1999. Improved management packages for
indigenous farmers in Ileho and Lubao sub-location of Ileho Division, Kakamega District.
Unpublished manuscript.Ministry of Agriculture and Rural Development, Kenya.
Oviedo-Rondón, E. O. and Waldroup P. W 2002. Models to Estimate Amino Acid Requirements
for Broiler Chickens:A Review. International Journal of Poultry Science 1: 106-113.
Parmentier H., Lammers A., Hoekman J. J., Reilingh G. D. V., Zaanen I. T. A. and Savelkoul, H.
F. J. 2004. Different levels of natural antibodies in chickens divergently selected for
specific antibody responses. Developmental & amp; Comparative Immunology, 28: 39-
49.

82
Permin, A. and G. Pedersen, 2010.Problems related to poultry production at village level.
Proceedings of the Possibilities Smallholder Poultry Projects in Eastern and Southern
Africa, May 22-25, Morogoro, Tanzania, pp: 65-69.
Pierre-André Geraert and Yves Mercier.2009.Amino Acids: Beyond the Building Blocks.
ADISSEO France SAS, 10 Place du Général de Gaulle, 92160 ANTONY, FRANCE.
Quintana F J and Cohen I R2004. The natural autoantibody repertoire and autoimmune disease
Biomedicine & Pharmacotherapy, 58: 276-281.
Rahimi S, Kathariou S, Grimes J L and Siletzky R M 2011.Effect of direct-fed microbials on
performance and Clostridium perfringens colonization of turkey poults. Poultry Science,
90: 2656-2662.
Ramla, A.H., Mohd-Husni, Sarineh, A.H., 1994.Effect of choice feeding on performance of village
chicken after peak egg production.Asia-Australasian journal of Animal Science 7: 317-320.
SAS institute. 2002.SAS® user‟s guide: statistics version 9.1. SAS institute Cary, N.C, USA.
Scientists Discuss Findings with Policymakers at International Workshop. 2011. New Study
Documents Spread of Aflatoxins in Kenya, United States.
Sonaiya, E.B. 1990.The context and prospects for development of smallholder rural poultry
production in Africa. In Smallholder Rural Poultry Production, Proceedings of an
International workshop held on October 9-13, 1990, Thesaloniki, Greece, I: 35-52.
Sun Y., Parmentier H. K., Frankena K. and Van Der Poel J. J. 2011. Natural antibody isotypes as
predictors of survival in laying hens. Poultry Science, 90: 2263-2274.
Tamminga S. 2011.Biotechnology in animal nutrition, Swiss Federal Institute of Technology,
department of food science, Switzerland.
Timmerman, H. M., Veldman, A., Van den Elsen, E., Rombouts F. M. and Beynen A. C. 2006.
Mortality and growth performance of broilers given drinking water supplemented with
chicken-specific probiotics. Poultry Science, 85: 1383-1388.
83
Todd J. Applegate and Roselina Angel 2008.Protein and amino acid requirements poultry. Purdue
University and University of Maryland, College Park.
Van Knegsel A. T. M., De Vries Reilingh G., Meulenberg S., Van Den Brand H., Dijkstra J.,
Kemp B. and Parmentier H. K. 2007. Natural Antibodies Related to Energy Balance in
Early Lactation Dairy Cows. Journal of Dairy Science, 90: 5490-5498.
Vani J., Elluru S., Negi V.S., Lacroix-Desmazes S., Kazatchkine M. D., Bayary J. and Kaveri, S.
V. 2008. Role of natural antibodies in immune homeostasis: IVIg perspective.
Autoimmunity Review, 7: 440-444.
Verma, J., Johri, T. S. and Swain B. K. 2007.“Effect of aflatoxin, ochratoxin and their combination
on protein and energy utilisation in white leghorn laying hens. Journal of the Science of
Food and Agriculture, 87: 760-764.
Verma, J., Johri, T. S., Swain, B. K. and Ameena, S.2004. “Effect of graded levels of aflatoxin,
ochratoxin and their combinations on the performance and immune response of broilers.
British Poultry Science, 45: 512-518.
Waite D. W. and Taylor M. W. 2015.Exploring the avian gut microbiota: current trends and future
directions.Frontiers in microbiology, Vol. 6.
Wondmeneh E. Van Arendonk J. A. M. Van der Waaij E.H. Ducro B. J. and Parmentier, H. K.
2015. High natural antibody titers of indigenous chickens are related with increased hazard
in confinement. Poultry Science, 94: 1493-1498.
Yaman H., Ulukanli Z., Elmali M. and Unal Y. 2006. The effect of a fermented probiotic, the
kefir, on intestinal flora of poultry domesticated geese (Anser anser). Review Médical and
Véterinary, 157: 379-386.
Yunus, A. W., Razzazi-Fazeli, E. & Bohm, J. 2011. “Aflatoxin B1 in Affecting Broiler‟s
Performance, Immunity, and Gastrointestinal Tract: A Review of History and
Contemporary Issues. Vol. 3: 566-590.

84

85
APPENDICES
Appendix 1: Indigenous Chicken Production and House Hold Survey:
INDIGENOUS CHICKEN PRODUCTION AND HOUSE HOLD SURVEY
QUESTIONNAIRE;
The overall objective of the survey is to contribute to improved performance of IC through the
use of locally available feedstuffs and probiotics supplementation in Kisumu and Baringo County.
A: QUESTIONNAIRE NO: -----------Name------------------------Mobile-----------------------------
1. Gender: 1. Male 2. Female
2. County: 1. Baringo 2. Kisumu
3. Division: 1. Mogotio 2. Nyakach
4. Age (yrs):------------------
5. Level of education of the head: 1. None 2. Primary 3.Secondary 4. Post secondary
6.Marital status: 1. Single 2. Married 3.Divorced 4. Widowed
7. Farm type: 1.Mixed farming 2. Subsistence 3.Large scale
8. Number of dependants/people in the household: ---------------
9. Livestock currently kept in the farm:
1. Cattle (No Kept------- 2. Sheep & Goats (No. kept------ 3. IC chicken (No. kept--------)
4.Donkeys (No. kept---------)
10. What are the main reasons for keeping indigenous chicken (tick appropriately):
1. Home consumption 3.Cultural/ceremonies/rituals
2. Cash income 4. All the above

86
11. Which production system do you practice?
1.Free range 2.Semi confined 3.Confined
12. Which Indigenous chicken ecotypes do you rear?
1. Naked necked (No. kept) --------------- 2.Normal feathered (No. kept) ------------------
3. Dwarf type (No. kept) ----------------- 4. Giant type (No. kept) ---------------------------
13. Indicate the type of housing on indigenous chicken (tick appropriately)
1. Deep litter---- 2. Battery cage system-----3.Traditional houses-----4. Housed in family house---
14. What are the main types of feedstuffs given to the indigenous chicken? Tick
appropriately.
1. Kitchen left over---2.maize, millet, sorghum---3.chick, growers &layers mash---4.All above---
15. Which other management practice do you practice in the farm? (Tick appropriately)
1. Supplementation-------------------------- 2.Watering-----------------------
3. Flock health management (e.g. vaccinations, dusting) ------------------------------
4. Flock selection, breeding & hatching chicks------- 5) All the above. -----------------
16. Please indicate the indigenous chicken production performance for the last 12 months
Products Quantity
a) Eggs produced per clutch--------------------------------------------------
b) Number of clutches per year-----------------------------------------------
c) Number of eggs incubated per clutch------------------------------------
d) Eggs hatched per incubation-----------------------------------------------
e) Number of chicks weaned per hen----------------------------------------
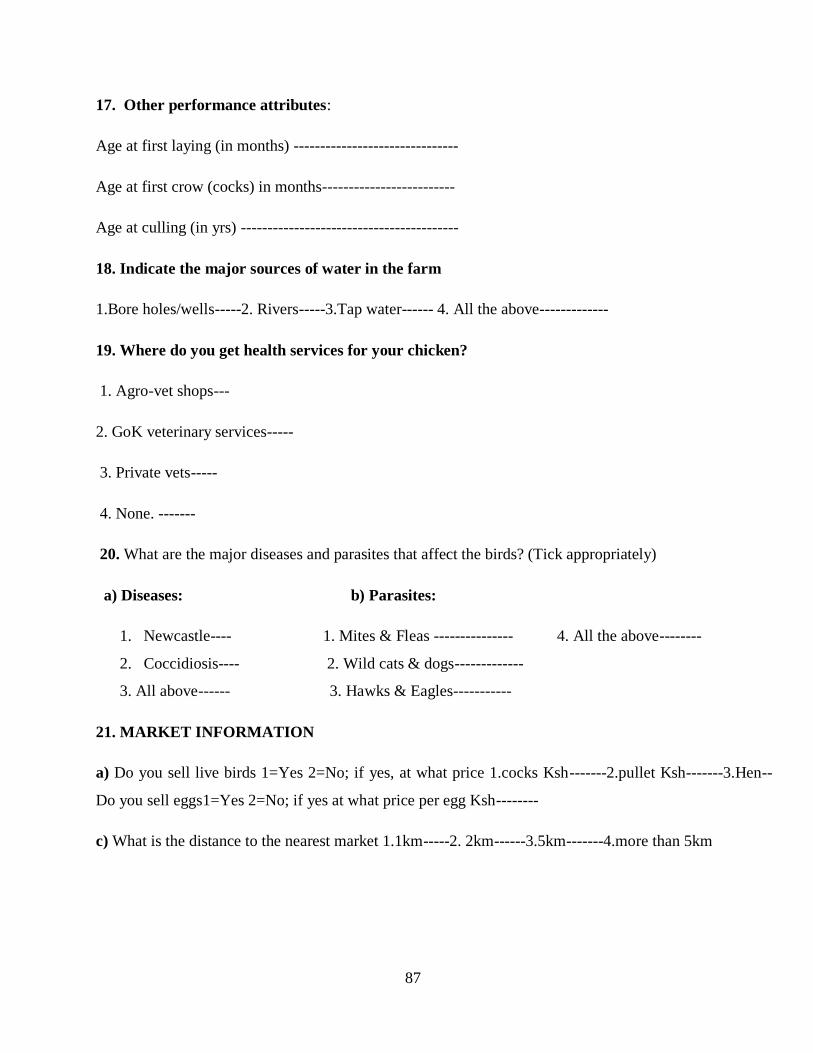
87
17. Other performance attributes:
Age at first laying (in months) -------------------------------
Age at first crow (cocks) in months-------------------------
Age at culling (in yrs) -----------------------------------------
18. Indicate the major sources of water in the farm
1.Bore holes/wells-----2. Rivers-----3.Tap water------ 4. All the above-------------
19. Where do you get health services for your chicken?
1. Agro-vet shops---
2. GoK veterinary services-----
3. Private vets-----
4. None. -------
20. What are the major diseases and parasites that affect the birds? (Tick appropriately)
a) Diseases: b) Parasites:
1. Newcastle---- 1. Mites & Fleas --------------- 4. All the above--------
2. Coccidiosis---- 2. Wild cats & dogs-------------
3. All above------ 3. Hawks & Eagles-----------
21. MARKET INFORMATION
a) Do you sell live birds 1=Yes 2=No; if yes, at what price 1.cocks Ksh-------2.pullet Ksh-------3.Hen--
Do you sell eggs1=Yes 2=No; if yes at what price per egg Ksh--------
c) What is the distance to the nearest market 1.1km-----2. 2km------3.5km-------4.more than 5km

88
22. State the major constraints in feeding and managing indigenous chicken in this region. (Tick
appropriately)
1. Lack of feeds------------------------------------
2. Diseases & Parasites----------------------------
3. Lack of management knowhow---------------
4. Lack of capital-----------------------------------
5. All the above-------------------------------------
-END-
THANK YOU

89
Appendix 2: List of Abstracts
Abstract 1: A comparative performance of indigenous chicken in Baringo and Kisumu
counties of Kenya for sustainable agriculture
Atela J. A. 1 ,Ouma P. O., 2 Tuitoek J. 1 , Onjoro P. A. 1 and Nyangweso S. E3.
1. Animal nutrition Group, Department of Animal Sciences, Egerton University, P.O Box 536, Egerton-
20115, Kenya. 2. Agricultural Education, University of Eldoret, P.O. Box 1125 Eldoret, Kenya. 3. The
Biochemistry Department Egerton University, P.O Box 536, Egerton-20115, Kenya.
*Corresponding Author Email: [email protected]
Abstract
The population of the world continues to increase especially in developing countries calling for increased food
production which puts great pressure to develop a more sustainable agricultural economic activity throughout the
world. The demand for white meat from chicken as a source of proteins has also increased. Production of free ranging
indigenous chicken could provide solution to cheaper proteins at lower production costs. Nutritional studies conducted
on indigenous chicken, Gallus domesticus showed that improved productivity can be achieved through improved
feeding using locally available feed and supplementation. The indigenous chicken sector plays an important role in
rural livelihoods and has great potential for development. A survey was conducted in April, 2015 in Baringo and
Kisumu counties in Kenya to obtain information on commonly used feedstuffs, household characteristics, purpose of
keeping chicken, flock size, flock management, performance parameters, feeding practices and prices of eggs and live
birds. Inferential and descriptive statistical analysis was done using SPSS. The results showed that many young and
educated men in Baringo County are beginning to venture in IC keeping contrary to the notion that IC farming was
meant for women and the uneducated. The men are becoming more interested in IC farming probably because the
young educated men are beginning to see the economic viability of IC business.The difference in the performance of
indigenous chicken between the two counties was not significant (p<0.0064). There was no significant disparity
between the two counties in terms of the feeds the farmers used (p<0.8413).
Key words: Feed resources, performance, free ranging, indigenous chicken, sustainable agriculture

90
Abstract 2: Effects of Probiotics Feeding Technology on weight gain of indigenous chicken In
Kenya
Atela J. A.a ,Tuitoek J. a and Onjoro P. A. a Kibitok N.Ka
aAnimal nutrition Group, Department of Animal Sciences, Egerton University, P.O Box 536, Egerton-20115,
Kenya.
Corresponding author: [email protected]
Abstract
This experiment was conducted and designed to evaluate the effects of feeding value of the feedstuffs utilized by
Indigenous Chicken in farms. The suitability and choice by chicken in a cafeteria feeding system and the possibility of
improvement using a selected commercial Molaplus poultry probiotics was done. Fifteen chicken were allocated in 5
cages (3 birds each) and allowed a free choice diet of various feedstuffs like maize, millet, sorghum, „‟omena‟‟, rice
germ, sunflower meal and soya bean meal and water provided adlibitum. The results indicated that maize grains was
the most preferred feed by the growing indigenous chicken (72%) compared to sorghum (1%) intake. The effect of
graded levels of multi-strain Molaplus probiotics on performance of indigenous chicken fed the local feedstuffs was
then done. One hundred and fifty (150) indigenous Chicken 16 weeks of age were randomly allocated in cages, into 6
groups, each group with 5 replicates (n = 25). The control group received the basal diet formulated. The treatment
groups received the same basal diets supplemented with 5ml of molaplus probiotic solution in 250ml, 500ml, 1000ml,
1500ml, and 2000ml drinking water adlibitum for a 7 week trial. The results showed that dietary supplementation with
molaplus probiotics significantly increased weight gain. Cummulative body weights were higher for the treatment
level with 5ml molaplus poultry probiotics in1000ml of drinking water at the 7th week of treatment than for the other
weeks and levels of treatment and control. In conclusion, Supplementing Indigenous Chicken with probiotics in
drinking water can significantly improve the weight gains.
Key words: Molaplus poultry microbes; probiotics; indigenous chicken feeding; chicken feed technology;
cumulative weight gain

91
Abstract 3: Occurrence of aflatoxins in feedstuffs used for feeding indigenous chicken in
Baringo and Kisumu counties, Kenya.
Atela J. A.a ,Tuitoek J.
a and Onjoro P. A.
a Obonyo M.
b, Judith C. K
b
aAnimal nutrition Group, Department of Animal Sciences,
b The Biochemistry Department;
Egerton University, P.O Box 536, Egerton-20115, Kenya.
Corresponding author: [email protected]
Abstract
Aflatoxins (AF) were analyzed in 16 feed ingredient samples fed to Indigenous Chicken collected from Baringo and
Kisumu Counties, Kenya. The concentrations of Total Aflatoxins in the samples were determined using direct
competitive Enzyme-Linked Immunosorbent Assay (ELISA) and overall incidence of Total Aflatoxins recorded.
According to the results, most of the samples were found contaminated with Total Aflatoxins. The highest mean level
of Total Aflatoxins were found in growers mash fed to indigenous chicken, that is 19.4ppb in Kisumu County and 19.7
ppb in Baringo County. Similarly, Maize grains was the highest contaminated feed ingredient used for supplementing
indigenous chicken in Baringo County with Total Aflatoxins of 18.6ppb, while millet grain was the least contaminated
with Total Aflatoxins (2.9-3.2parts per billion) in both Baringo and Kisumu Counties of Kenya. The results showed
that the levels of the Total Aflatoxins in the feed ingredients are above regulatory limits of 10 parts per billion and the
feedstuffs not generally safe. It also indicates the need to establish a continuous monitoring program to prevent and
manage the occurrence of the Total Aflatoxins in feed ingredients of indigenous Chicken in order to improve the
health status of the chicken and consumers of indigenous chicken and products.
Keywords; Aflatoxins, Chicken feed ingredients, Indigenous Chicken.
92
Abstract 4: The effects of dietary probiotics on natural IGM antibody titres of Kenyan
indigenous chicken
J O Khobondo, P B Ogore1, J A Atela
1, P S Onjoro
1, J O Ondiek
1 and A K Kahi
Animal Breeding and Genomics Group, Department of Animal Sciences, Egerton University, PO
Box 536, 20115 Egerton, Kenya
1 Animal Nutrition Group, Department of Animal Sciences, Egerton University, PO Box 536,
20115 Egerton, Kenya
Abstract
This study was conducted to investigate the effects of probiotic supplementation on serum natural IgM levels binding
keyhole limpet hemocyanin in indigenous chicken (IC). One hundred and fifty two months old chicken raised under
low input-output system were sourced from small scale indigenous chicken farmers from Nyakach and Emining sub
counties of Kisumu and Baringo, Kenya respectively. The IC were of mixed sex, randomly divided into five treatment
groups of 25 birds each. The treatments were 5 ml of Molaplus dissolved into 250, 500, 1000, 1500 and 2000 ml of
drinking water. The birds were raised into group cages, and fed commercial grower mash for two months during the
study period. A window of 14 days was left for immune stabilization, blood was then drawn from the web vein and
serum separated immediately. Levels of IgM binding was assayed using an indirect ELISA technique. IgM binding
KLH was found but dietary probiotic supplementations did not significantly affect levels of IgM binding KLH in the
serum. Probiotic supplementation in the diet did not further enhance KLH binding IgM in IC reared under village
production system.
Keywords: immunoglobulin M, scavenging, supplementation

93
Appendix 3: List of extra tables
Table 18: % Age distribution of the heads of the households by county and gender
AGE Years P-value
16-25 26-35 36-45 46-55 56-65 66-75 76-85
Sample
County 0.195
Baringo 100 19.0 25.0 23.0 17.0 12.0 2.0 2.0
Kisumu 100 9.0 30.0 23.0 15.0 18.0 5.0 0.0
Gender 0.270
Female 125 10.4 28.8 25.6 14.4 17.6 2.4 0.8
Male 75 20.0 25.3 18.7 18.7 10.7 5.3 1.3
Table 19:% Education levels and Gender in the Counties
EDUCATION P-Value
Sample
(n)
None Primary Secondary Post
Secondary
County 0.002
Baringo 100 3.0 37.0 41.0 19.0
Kisumu 100 7.0 50.0 40.0 3.0
Gender 0.003
Female 125 8.0 48.8 36.0 7.2
Male 75 0.0 34.7 48.0 17.3

94
Table 20: % Indigenous Chicken Production systems
Frequency Percent
Free range 109 54.5
Semi confined 82 41.0
Confined 9 4.5
Total 200 100.0
Table 21:% Major Feed resources for IC in the selected regions
Frequency Percent
Kitchen left over 6 3.0
Cereal grains 13 6.5
Chick, growers &layers mash 4 2.0
All the above 177 88.5
Total 200 100.0
Table 22: % Major constraints to IC production in the selected regions
Frequency Percent
Lack of feeds 4 2.0
Diseases¶site 20 10.0
Lack of management knowhow 1 .5
All the above 175 87.5
Total 200 100.0

95
Table 23: % Ecotypes kept and the Production Systems
Ecotype Sample(n) Production
System
Mean Total P-Value
Naked neck 109 Free range 1.21 0.88
82 Semi
confined 1.45
9 Confined 1.89 200
Normal feathered 109 Free range 25.12 0.00
82
Semi
confined 33.33
9 Confined 123.56 200
Dwarf type 109 Free range 0.48 0.75
82
Semi
confined 0.51
9 Confined 0.00 200
Giant type 109 Free range 1.13 0.89
82
Semi
confined 0.83
9 Confined 0.00 200
Table 24:% Available sources of Extension services to farmers in the selected regions
Frequency Percent
Agro-vet shops 110 55.0
Gov-Kenya Vet. service 36 18.0
Private vets 19 9.5
None 35 17.5
Total 200 100.0

96
Table 25: % Major constraints to IC production in the selected Counties
County Production System Constraints
Feeds Diseases Management All Total
Baringo Free range 1 9 1 56 67
Semi confined 2 1 0 26 29
Confined 0 0 0 4 4
Total 3 10 1 86 100
Kisumu Free range 0 5 - 37 42
Semi confined 1 3 - 49 53
Confined 0 2 - 3 5
Total 1 10 - 89 100
Percent 2.0 10.0 0.5 87.5 100.0
Table 26: LSD Means and standard errors for 4 weeks probiotics treatment on IC weights
Treatment Week 2 (g) Week 3 (g) Week 4 (g)
1000ml 150±0.02a
190±0.02a 210±0.02
a
0ml 50±0.02b 150±0.02
a 150±0.02
b
Means with different superscripts within rows are significantly different (p˂ 0.05)
Copyright © 2022 FDOKUMEN