
Comparisons between original and current composition of indigenous tree species around Mount Kenya
12
Comparisons between original and current composition of indigenous tree species around Mount Kenya Roeland Kindt 1 , Jens-Peter B. Lillesø 2 and Paulo van Breugel 3 1 World Agroforestry Centre (ICRAF), PO Box 30677-00100, Nairobi, Kenya, 2 Forest and Landscape Centre, Faculty of Life Sciences, Copenhagen University, Denmark and 3 PO Box 30709-00100, Nairobi, Kenya Abstract As the ecology and distribution of most tree species remain poorly understood, biogeographical maps offer spatial surrogates for analysis of biodiversity patterns. We used a 1 : 250,000 potential natural vegetation map to compare the current indigenous tree species composition of 250 0.5-ha quadrats surveyed around Mount Kenya (1999– 2004) with the original species composition of ten poten- tial natural vegetation types (PNVTs). The original 1960 vegetation map was based on intensive fieldwork and detailed aerial photographs by Trapnell et al. For each PNVT, we compiled original species lists from literature and her- barium voucher information. The percentage of species that overlap between the current list and the original list ranged from 30% to 75% for seven frequent PNVTs, but was only above 45% for dry Combretum savanna (DC). When only investigating the six to ten species with highest frequencies, these species were shared 70–100% for the four forest PNVTs, 90% for lowland Acacia-Commiphora, 67% for evergreen and semi-evergreen bushland and 50% for DC savanna. To promote agroecosystem diversification, ecological and socio-economic reasons for low current frequencies of most indigenous tree species need to be better understood. Key words: agroforestry, diversification, Mount Kenya, species composition Re ´sume ´ Alors que l’e ´cologie et la distribution de la plupart des espe `ces d’arbres sont encore mal comprises, des cartes bioge ´ographiques offrent des substituts spatiaux qui per- mettent d’analyser les sche ´mas de la biodiversite ´. Nous avons utilise ´ une carte au 1/250.000 de la ve ´ge ´tation naturelle potentielle pour comparer la composition actuelle des espe `ces d’arbres de 250 quadrats de 0,5 ha e ´tudie ´s autour du mont Kenya entre 1999 et 2004 avec la com- position originelle de 10 types de ve ´ge ´tation naturelle potentielle (PNVT). La carte originelle de la ve ´ge ´tation de 1960 e ´tait base ´e sur un travail de terrain intensif et sur les photographies ae ´riennes de Trapnell et al. Pour chaque PNVT, nous avons compile ´ les listes des espe `ces originelles dans la litte ´rature et les informations de re ´fe ´rence des herbiers. Le pourcentage de recouvrement des espe `ces entre les listes actuelles et les listes originelles va de 30 a ` 75% pour sept PNVT fre ´quents, mais de ´passait a ` peine 45% pour la savane se `che a ` Combretum. Lorsqu’on ne tient compte que des six a ` dix espe `ces les plus fre ´quentes, celles-ci se retrouvent a ` 70–100% dans les quatre PNVT forestiers, a ` 90% dans les Acacia-Commiphora de plaine, a ` 67% dans la brousse sempervirente et semi-sempervirente et a ` 50% dans la savane se `che a ` Combretum. Afin d’encourager la diversification de l’e ´cosyste `me agricole, il est ne ´cessaire de mieux comprendre les raisons e ´cologiques et socioe ´conomiques des faibles fre ´quences actuelles de la plupart des espe `ces d’arbres indige `nes. Introduction Tropical trees are sedentary for most of their lifespan and spatial distribution data are available for many plant species (e.g., McClean et al., 2005). However, little is known of the ecology and distribution of the majority of African tree species. Only a small fraction of terrestrial species has been described to date and fine-scale distri- butional data are available only for a few species. As such, global assessments of biodiversity distribution have been based on surrogates such as ranges of vertebrate species or ecoregions (Ferrier et al., 2002, 2004). One such ecoregional map that has been used within the *Correspondence: E-mail: [email protected] Ó 2007 The Authors. Journal compilation Ó 2007 Blackwell Publishing Ltd, Afr. J. Ecol., 45, 633–644 633
-
Upload
independent -
Category
Documents
-
view
0 -
download
0
Transcript of Comparisons between original and current composition of indigenous tree species around Mount Kenya

Comparisons between original and current composition ofindigenous tree species around Mount Kenya
Roeland Kindt1, Jens-Peter B. Lillesø2 and Paulo van Breugel3
1World Agroforestry Centre (ICRAF), PO Box 30677-00100, Nairobi, Kenya, 2Forest and Landscape Centre, Faculty of Life Sciences, Copenhagen
University, Denmark and 3PO Box 30709-00100, Nairobi, Kenya
Abstract
As the ecology and distribution of most tree species remain
poorly understood, biogeographical maps offer spatial
surrogates for analysis of biodiversity patterns. We used a
1 : 250,000 potential natural vegetation map to compare
the current indigenous tree species composition of 250
0.5-ha quadrats surveyed around Mount Kenya (1999–
2004) with the original species composition of ten poten-
tial natural vegetation types (PNVTs). The original 1960
vegetation map was based on intensive fieldwork and
detailed aerial photographs by Trapnell et al. For each PNVT,
we compiled original species lists from literature and her-
barium voucher information. The percentage of species
that overlap between the current list and the original list
ranged from 30% to 75% for seven frequent PNVTs, but
was only above 45% for dry Combretum savanna (DC).
When only investigating the six to ten species with highest
frequencies, these species were shared 70–100% for the
four forest PNVTs, 90% for lowland Acacia-Commiphora,
67% for evergreen and semi-evergreen bushland and 50%
for DC savanna. To promote agroecosystem diversification,
ecological and socio-economic reasons for low current
frequencies of most indigenous tree species need to be
better understood.
Key words: agroforestry, diversification, Mount Kenya,
species composition
Resume
Alors que l’ecologie et la distribution de la plupart des
especes d’arbres sont encore mal comprises, des cartes
biogeographiques offrent des substituts spatiaux qui per-
mettent d’analyser les schemas de la biodiversite. Nous
avons utilise une carte au 1/250.000 de la vegetation
naturelle potentielle pour comparer la composition actuelle
des especes d’arbres de 250 quadrats de 0,5 ha etudies
autour du mont Kenya entre 1999 et 2004 avec la com-
position originelle de 10 types de vegetation naturelle
potentielle (PNVT). La carte originelle de la vegetation de
1960 etait basee sur un travail de terrain intensif et sur les
photographies aeriennes de Trapnell et al. Pour chaque
PNVT, nous avons compile les listes des especes originelles
dans la litterature et les informations de reference des
herbiers. Le pourcentage de recouvrement des especes
entre les listes actuelles et les listes originelles va de 30 a
75% pour sept PNVT frequents, mais depassait a peine
45% pour la savane seche a Combretum. Lorsqu’on ne tient
compte que des six a dix especes les plus frequentes,
celles-ci se retrouvent a 70–100% dans les quatre PNVT
forestiers, a 90% dans les Acacia-Commiphora de plaine, a
67% dans la brousse sempervirente et semi-sempervirente
et a 50% dans la savane seche a Combretum. Afin
d’encourager la diversification de l’ecosysteme agricole, il
est necessaire de mieux comprendre les raisons ecologiques
et socioeconomiques des faibles frequences actuelles de la
plupart des especes d’arbres indigenes.
Introduction
Tropical trees are sedentary for most of their lifespan and
spatial distribution data are available for many plant
species (e.g., McClean et al., 2005). However, little is
known of the ecology and distribution of the majority of
African tree species. Only a small fraction of terrestrial
species has been described to date and fine-scale distri-
butional data are available only for a few species. As
such, global assessments of biodiversity distribution have
been based on surrogates such as ranges of vertebrate
species or ecoregions (Ferrier et al., 2002, 2004). One
such ecoregional map that has been used within the*Correspondence: E-mail: [email protected]
� 2007 The Authors. Journal compilation � 2007 Blackwell Publishing Ltd, Afr. J. Ecol., 45, 633–644 633

context of global biodiversity assessment (Olson et al.,
2001) is the vegetation map of Africa showing bound-
aries for continental patterns of plant endemism (White,
1983).
Agroforestry agroecosystems tend to mimic character-
istics of natural ecosystems (Leakey, 1996), such as
imitating tree diversity levels as a way of increasing
stability of production (Van Noordwijk & Ong, 1999).
Expected benefits of diversification of agroforestry systems
have recently been described (Kindt, Van Damme &
Simons, 2006b; Kindt et al., 2006c) and similar arguments
exist for the diversification of forestry plantations (Lamb,
Erskine & Parrotta, 2005). We investigated how current
tree species composition could be diversified around
Mount Kenya. As the survey area is one of the topo-
graphically complex areas of sub-Sahara tropical Africa
that require a detailed analysis of species distribution
patterns (Linder, 2001), we used a high-resolution
vegetation map for the highlands of Kenya. The results
show the level of similarity in species composition
between current and natural vegetation types, using maps
and species lists for potential natural vegetation types
(PNVTs) [defined as the vegetation structure that would
become established if all successional sequences were
completed without interference by mankind under the
present climatic and edaphic conditions (Mueller-Dombois &
Ellenberg, 1974)]. Under the assumption that the maps
and species lists are correct, these results can then be
used to plan how species similarity levels can be
increased by reintroducing suitable indigenous tree species
in anthropogenic landscapes using the PNVTs as a
criterion for ecological suitability.
Materials and methods
Study area and vegetation survey
A stratified-random sampling technique was used to
inventory five or more quadrats between 1999 and 2004
within each agro-ecological zone (Jaetzhold & Schmidt,
1983) on privately owned land in each of the five districts
that surround Mount Kenya. All exotic and indigenous
woody perennial species were inventoried in a total 265
quadrats of 50 · 100 m2 [Fig. 1; this map was generated
with ArcView GIS (ESRI, 2000)]. Beentje (1994) was used
as the main reference for the identification of indigenous
species. Herbarium specimens were collected for species
that could not be identified in the field. Only results for
trees that could be identified to the species level were
included in the analyses. The position of each quadrat was
established using a Magellan Global Positioning System
receiver.
Potential natural vegetation map for central and south-western
Kenya and original species lists
Trapnell and others (Trapnell, Birch & Brunt, 1966; Trapnell
et al., 1969, 1976; Trapnell, Brunt & Birch, 1986; Trapnell
& Brunt, 1987) produced four sheets of a 1960 vege-
tation map for central and south-western Kenya in an
attempt to define vegetation boundaries at a scale of
1 : 250,000 based on aerial photographs and intensive
fieldwork. We reclassified the original vegetation types into
seventeen PNVTs and produced a new map of PNVTs
(Kindt et al., 2006a). The secondary vegetation types
Fig 1 Potential natural vegetation types
around Mount Kenya and positions of
survey quadrats (map created in ArcView
GIS with UTM coordinates)
634 Roeland Kindt et al.
� 2007 The Authors. Journal compilation � 2007 Blackwell Publishing Ltd, Afr. J. Ecol., 45, 633–644

enabled identification of the PNVT, as Trapnell et al.
determined the climax vegetation for secondary vegetation
types from remnants of climax species, understorey species
that are associated with the climax species and pioneer
species (Trapnell & Brunt, 1987).
However, the original vegetation map and its doc-
umentation provide little information on the exact criteria
that were used to distinguish between the different vege-
tation types. We consulted some references on vegetation
types of Kenya, East Africa or Africa to obtain physiog-
nomic and floristic differences between the seventeen
PNVTs (Trapnell & Langdale-Brown, 1972; Greenway,
1973; Lind & Morrison, 1974; White, 1983). From these
references, we inferred that the main classification scheme
was based on physiognomy with categories of forest,
woodland, bushland, thickets, savanna (or wooded grass-
land) and grassland. Floristic differences explained the
differences among vegetation types of the same physio-
gnomic category. Trapnell et al. described climatic and soil
conditions such as ‘moist’ or ‘impeded drainage’ for some
vegetation types, although environmental data were not
used to determine boundaries between PNVTs.
We used information from five different data sources to
compile original species lists for each PNVT: (i) species that
were listed as part of names of the original vegetation
types; (ii) species that were listed by Trapnell (1997) for
the different forest and bamboo vegetation types based on
the original fieldwork; (iii) information from other sources
of literature on vegetation types (as listed above, but
including Beentje, 1990); (iv) information from herbarium
vouchers available from the East Africa Herbarium and (v)
information on habitat from Beentje (1994). Information
from source 4 was compiled on indigenous species listed in
Maundu & Tengnas (2005) and Simons et al. (2005),
whereas information from source 5 was compiled on spe-
cies encountered frequently in the survey. Species that
were listed for secondary vegetation types in the original
map or indicated to be secondary in the literature were
marked with the letter ‘S’.
Compilation of current species lists and statistical analyses
The PNVT of each quadrat was established by overlaying
their positions on the PNVT map with the Geoprocessing
extention in ArcView GIS (ESRI, 2000). The PNVT for
each location of the herbarium vouchers was determined
by the same method. Frequent PNVTs were characterized
as PNVTs with ten or more quadrats. All subsequent
analyses were made with the freely available biodiversity.r
statistical software (Kindt & Coe, 2005) that was developed
for the R 2.1.1 statistical language and environment (R
Development Core Team, 2005) and uses the vegan
community ecology package (Oksanen et al., 2005).
Current species lists were compiled for each PNVT by
pooling all indigenous species encountered in the quadrats
belonging to the PNVT. The species frequency (percentage
of quadrats), total number of species and number of species
that only occurred in a single quadrat were calculated for
each PNVT. The species with the highest frequencies were
identified for each PNVT by listing the species that occu-
pied the first ten frequency rankings, and then shortening
the list so that no species of rank 11 had the same fre-
quency as the highest ranked species (e.g., if the ninth
species had frequency of 50%, and the tenth and eleventh
species had frequencies of 40%, then only the first
nine species were listed). The hypothesis that species
frequencies were larger within particular PNVTs was tested
with Generalized Linear Models (GLM) with logit link and
quasi-binomial variance functions (Hastie & Pregibon,
1993; Kindt & Coe, 2005), using PNVT as a categorical
explanatory variable, species presence–absence as response
variable and dry Combretum savanna (DC) as base. The
hypothesis that the indicator value (IndVal) for a partic-
ular species and PNVT was larger than expected by ran-
dom chance was tested by 1000 randomizations. The
IndVal was calculated by multiplying the frequency of the
species within the PNVT (the fidelity of a species) with the
mean abundance of the species within the PNVT divided
by the average of the mean abundances within the other
PNVTs (the specificity of a species) (Dufrene & Legendre,
1997; Legendre & Legendre, 1998).
Distance-based Redundancy Analysis was used to test
for differences in species composition among quadrats
sampled in different PNVTs using 10,000 randomizations
(Legendre & Anderson, 1999; Kindt & Coe, 2005). The
pairwise ecological distances between all the original and
all the current species lists were calculated by the Bray-
Curtis, Kulczynski and Jaccard distances (Legendre &
Legendre, 1998; Kindt & Coe, 2005). The smallest ecological
distance between the current species list and the original
species list of each PNVT was reported. In cases where the
current species list had smaller distance with another
PNVT than the original PNVT, then the other PNVT with
the smallest distance was also reported. We also calculated
the ecological distances after removing those species that
exclusively occurred in the assemblages of all original or
Species composition patterns around Mt Kenya 635
� 2007 The Authors. Journal compilation � 2007 Blackwell Publishing Ltd, Afr. J. Ecol., 45, 633–644

Table 1 Original species lists of potential natural vegetation types (sorted by number of quadrats) and their frequencies, only listing species
of the common species pool
Potential natural vegetation
type (abbreviation)a
Species [S: secondary species; 1–5: minimum of information sources (see
methods); % percentage on quadrats if species occurs on at least one quadrat]
Moist intermediate forest (MI)
STO ¼ 105
SCP ¼ 51
SSH ¼ 31 (30%, 61%)
n ¼ 57
Albizia gummifera (S2, 7.0%), Anthocleista grandiflora (2),
Bersama abyssinica (2, 1.8%), Bridelia micrantha (S2, 51%), Carissa edulis (4),
Casaeria battiscombei (2), Cassipourea malosana (2), Combretum molle (4, 3.5%),
Cordia africana (S2, 67%), Croton macrostachyus (S2, 60%), Croton megalo-
carpus (1, 32%), Diospyros abyssinica (2), Dracaena steudneri (2, 3.5%), Ehretia
cymosa (2, 12%), Ekebergia capensis (S2, 1.8%), Erythrina abyssinica (S3, 33%),
Ficus lutea (2, 1.8%), Ficus sur (2, 7.0%), Ficus thonningii (2, 3.5%), Hagenia
abyssinica (4), Harungana madagascariensis (2, 1.8%), Kigelia africana (4,
10.5%), Lecaniodiscus fraxinifolius (2, 1.8%), Macaranga kilimandscharica (3),
Markhamia lutea (2, 37%), Milicia excelsa (2), Millettia dura (5, 16%), Myri-
anthus holstii (S2, 1.8%), Neoboutonia macrocalyx (2), Newtonia buchananii (1),
Ozoroa insignis (S3), Podocarpus falcatus (4), Prunus africana (3, 21%), Rapanea
melanophloeos (3), Rauvolfia caffra (2, 8.8%), Rhus natalensis (S3), Sapium
ellipticum (2, 19%), Sesbania sesban (4, 1.8%), Spathodea campanulata (2, 12%),
Syzygium guineense (4), Tabernaemontana stapfiana (3), Tabernaemontana
ventricosa (2, 5.3%), Teclea nobilis (2, 1.8%), Trema orientalis (S2, 7.0%),
Trichilia degreana (2), Trichilia emetica (2, 14%), Vangueria infausta (4, 14%),
Vernonia auriculifera (S3, 1.8%), Warburgia ugandensis (2), Xymalos monospora
(3), Ziziphus abyssinica (4)
Dry Combretum savanna (DC)
STO ¼ 24
SCP ¼ 21
SSH ¼ 18 (75%, 86%)
n ¼ 40
Acacia senegal (4, 10%), Acacia seyal (4, 2.5%), Azanza garckeana (4, 30%),
Boscia angustifolia (4, 2.5%), Cadaba farinosa (4), Carissa edulis (4), Combretum
aculeatum (4, 2.5%), Combretum collinum (3, 35%), Combretum molle (3, 42%),
Combretum zeyheri (3, 10%), Commiphora africana (3, 15%), Cordia africana (4,
20%), Dichrostachys cinerea (4, 15%), Ekebergia capensis (4, 5%), Erythrina
abyssinica (4, 7.5%), Faurea saligna (1, 2.5%), Senna singueana (4, 25%),
Terminalia brownii (3, 12%), Vangueria madagascariensis (4), Vitex payos (4,
10%), Ziziphus abyssinica (4, 2.5%)
Dry montane forest (DM)
STO ¼ 91
SCP ¼ 58
SSH ¼ 31 (34%, 53%)
n ¼ 37
Abutilon longicuspe (S2, 2.7%), Acacia drepanolobium (S1, 22%), Acacia gerrardii
(S1), Acacia seyal (S1), Albizia gummifera (S2), Bersama abyssinica (2, 2.7%),
Bridelia micrantha (4), Calodendrum capense (3, 2.7%), Carissa edulis (4, 22%),
Casaeria battiscombei (2), Cassipourea malosana (2, 2.7%), Celtis africana (2),
Croton macrostachyus (S2), Croton megalocarpus (3, 62%), Cussonia holstii (2,
8%), Cussonia spicata (2, 2.7%), Diospyros abyssinica (2), Dodonaea viscosa (S2,
13%), Dombeya burgessiae (S2), Dovyalis abyssinica (2, 2.7%), Dracaena
steudneri (2), Ehretia cymosa (2), Ekebergia capensis (S2, 2.7%), Elaeodendron
buchananii (3, 2.7%), Erythrina abyssinica (S3, 2.7%), Euclea divinorum (S2,
51%), Faurea saligna (2), Ficus sur (2), Ficus thonningii (2), Galiniera saxifraga
(2), Hagenia abyssinica (2), Juniperus procera (1, 49%), Macaranga kilimands-
charica (4), Maytenus heterophylla (3, 19%), Mystroxylon aethiopicum (2, 14%),
Neoboutonia macrocalyx (3), Olea europaea (S2, 22%), Olinia rochetiana (2,
2.7%), Ozoroa insignis (S3), Pistacia aethiopica (2, 2.7%), Podocarpus falcatus
(1), Prunus africana (2), Rapanea melanophloeos (2, 5.4%), Rhus natalensis (S3,
38%), Schrebera alata (3, 2.7%), Spathodea campanulata (4, 2.7%), Syzygium
guineense (2), Tabernaemontana stapfiana (3), Tarchonanthus camphoratus (S2,
2.7%), Teclea nobilis (2, 2.7%), Teclea simplicifolia (3, 2.7%), Teclea trichocarpa
(3), Trema orientalis (4), Vangueria infausta (4, 2.7%), Vernonia auriculifera
(S3),Warburgia ugandensis (3, 2.7%), Xymalos monospora (3), Zanthoxylum
usambarense (2, 8.1%)
636 Roeland Kindt et al.
� 2007 The Authors. Journal compilation � 2007 Blackwell Publishing Ltd, Afr. J. Ecol., 45, 633–644
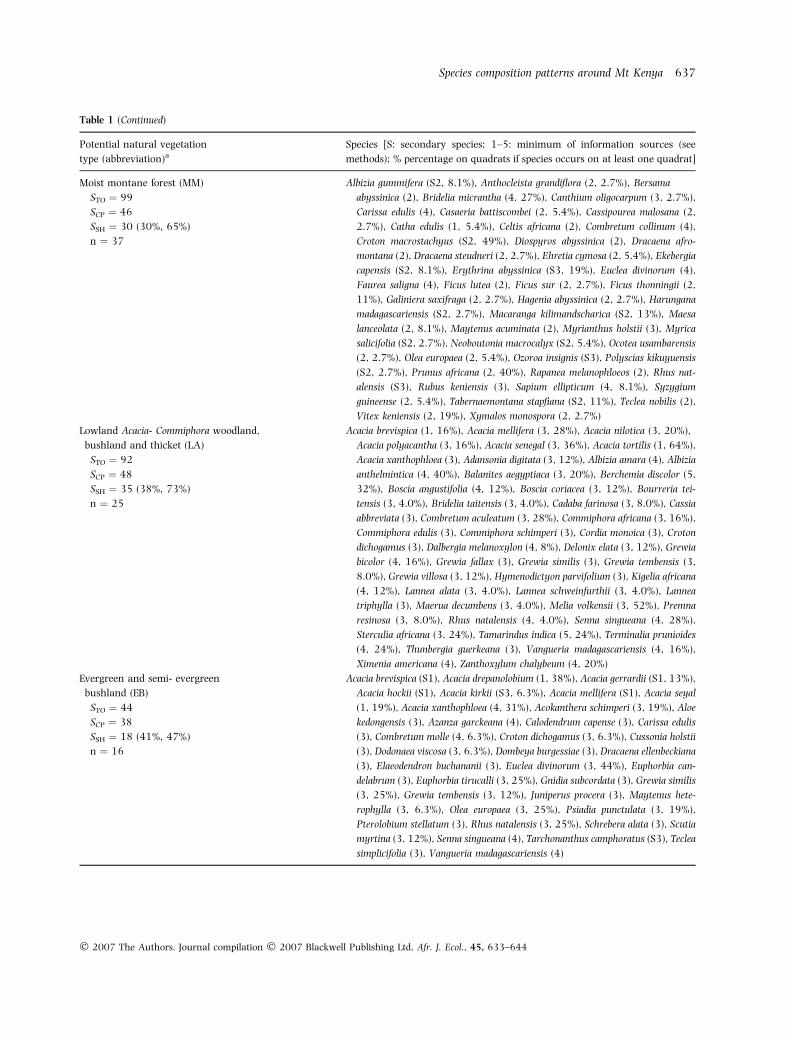
Table 1 (Continued)
Potential natural vegetation
type (abbreviation)a
Species [S: secondary species; 1–5: minimum of information sources (see
methods); % percentage on quadrats if species occurs on at least one quadrat]
Moist montane forest (MM)
STO ¼ 99
SCP ¼ 46
SSH ¼ 30 (30%, 65%)
n ¼ 37
Albizia gummifera (S2, 8.1%), Anthocleista grandiflora (2, 2.7%), Bersama
abyssinica (2), Bridelia micrantha (4, 27%), Canthium oligocarpum (3, 2.7%),
Carissa edulis (4), Casaeria battiscombei (2, 5.4%), Cassipourea malosana (2,
2.7%), Catha edulis (1, 5.4%), Celtis africana (2), Combretum collinum (4),
Croton macrostachyus (S2, 49%), Diospyros abyssinica (2), Dracaena afro-
montana (2), Dracaena steudneri (2, 2.7%), Ehretia cymosa (2, 5.4%), Ekebergia
capensis (S2, 8.1%), Erythrina abyssinica (S3, 19%), Euclea divinorum (4),
Faurea saligna (4), Ficus lutea (2), Ficus sur (2, 2.7%), Ficus thonningii (2,
11%), Galiniera saxifraga (2, 2.7%), Hagenia abyssinica (2, 2.7%), Harungana
madagascariensis (S2, 2.7%), Macaranga kilimandscharica (S2, 13%), Maesa
lanceolata (2, 8.1%), Maytenus acuminata (2), Myrianthus holstii (3), Myrica
salicifolia (S2, 2.7%), Neoboutonia macrocalyx (S2, 5.4%), Ocotea usambarensis
(2, 2.7%), Olea europaea (2, 5.4%), Ozoroa insignis (S3), Polyscias kikuyuensis
(S2, 2.7%), Prunus africana (2, 40%), Rapanea melanophloeos (2), Rhus nat-
alensis (S3), Rubus keniensis (3), Sapium ellipticum (4, 8.1%), Syzygium
guineense (2, 5.4%), Tabernaemontana stapfiana (S2, 11%), Teclea nobilis (2),
Vitex keniensis (2, 19%), Xymalos monospora (2, 2.7%)
Lowland Acacia- Commiphora woodland,
bushland and thicket (LA)
STO ¼ 92
SCP ¼ 48
SSH ¼ 35 (38%, 73%)
n ¼ 25
Acacia brevispica (1, 16%), Acacia mellifera (3, 28%), Acacia nilotica (3, 20%),
Acacia polyacantha (3, 16%), Acacia senegal (3, 36%), Acacia tortilis (1, 64%),
Acacia xanthophloea (3), Adansonia digitata (3, 12%), Albizia amara (4), Albizia
anthelmintica (4, 40%), Balanites aegyptiaca (3, 20%), Berchemia discolor (5,
32%), Boscia angustifolia (4, 12%), Boscia coriacea (3, 12%), Bourreria tei-
tensis (3, 4.0%), Bridelia taitensis (3, 4.0%), Cadaba farinosa (3, 8.0%), Cassia
abbreviata (3), Combretum aculeatum (3, 28%), Commiphora africana (3, 16%),
Commiphora edulis (3), Commiphora schimperi (3), Cordia monoica (3), Croton
dichogamus (3), Dalbergia melanoxylon (4, 8%), Delonix elata (3, 12%), Grewia
bicolor (4, 16%), Grewia fallax (3), Grewia similis (3), Grewia tembensis (3,
8.0%), Grewia villosa (3, 12%), Hymenodictyon parvifolium (3), Kigelia africana
(4, 12%), Lannea alata (3, 4.0%), Lannea schweinfurthii (3, 4.0%), Lannea
triphylla (3), Maerua decumbens (3, 4.0%), Melia volkensii (3, 52%), Premna
resinosa (3, 8.0%), Rhus natalensis (4, 4.0%), Senna singueana (4, 28%),
Sterculia africana (3, 24%), Tamarindus indica (5, 24%), Terminalia prunioides
(4, 24%), Thunbergia guerkeana (3), Vangueria madagascariensis (4, 16%),
Ximenia americana (4), Zanthoxylum chalybeum (4, 20%)
Evergreen and semi- evergreen
bushland (EB)
STO ¼ 44
SCP ¼ 38
SSH ¼ 18 (41%, 47%)
n ¼ 16
Acacia brevispica (S1), Acacia drepanolobium (1, 38%), Acacia gerrardii (S1, 13%),
Acacia hockii (S1), Acacia kirkii (S3, 6.3%), Acacia mellifera (S1), Acacia seyal
(1, 19%), Acacia xanthophloea (4, 31%), Acokanthera schimperi (3, 19%), Aloe
kedongensis (3), Azanza garckeana (4), Calodendrum capense (3), Carissa edulis
(3), Combretum molle (4, 6.3%), Croton dichogamus (3, 6.3%), Cussonia holstii
(3), Dodonaea viscosa (3, 6.3%), Dombeya burgessiae (3), Dracaena ellenbeckiana
(3), Elaeodendron buchananii (3), Euclea divinorum (3, 44%), Euphorbia can-
delabrum (3), Euphorbia tirucalli (3, 25%), Gnidia subcordata (3), Grewia similis
(3, 25%), Grewia tembensis (3, 12%), Juniperus procera (3), Maytenus hete-
rophylla (3, 6.3%), Olea europaea (3, 25%), Psiadia punctulata (3, 19%),
Pterolobium stellatum (3), Rhus natalensis (3, 25%), Schrebera alata (3), Scutia
myrtina (3, 12%), Senna singueana (4), Tarchonanthus camphoratus (S3), Teclea
simplicifolia (3), Vangueria madagascariensis (4)
Species composition patterns around Mt Kenya 637
� 2007 The Authors. Journal compilation � 2007 Blackwell Publishing Ltd, Afr. J. Ecol., 45, 633–644

all current species lists and referred to those species that
occurred at least once in the original and the current
species lists as the common species pool.
Results
A total of 286 indigenous tree species were identified in the
survey, with an average of 8.4 species per quadrat. Fifteen
of the 265 quadrats were located outside the boundaries of
the PNVT map (Fig. 1), whereas four quadrats were in the
broad-leaved savanna-evergreen bushland mixtures for
which only a limited list of original species was compiled.
No quadrats fell within the three high mountain and one
moist Combretum-Terminalia PNVTs (Fig. 1). We identified
seven frequent PNVTs (>10 quadrats). These included the
four forest PNVTs (n ¼ 15–57, 58% of 250 quadrats), DC
(n ¼ 40, 16%), lowland Acacia-Commiphora woodland,
bushland and thicket (‘LA’, n ¼ 25, 10%) and evergreen
Table 1 (Continued)
Potential natural vegetation
type (abbreviation)a
Species [S: secondary species; 1–5: minimum of information sources (see
methods); % percentage on quadrats if species occurs on at least one quadrat]
Dry intermediate forest (DI)
STO ¼ 74
SCP ¼ 49
SSH ¼ 27 (36%, 55%)
n ¼ 15
Acokanthera schimperi (S2, 20%), Albizia gummifera (S2, 6.7%), Albizia
schimperiana (2), Bersama abyssinica (2), Brachylaena huillensis (1, 13%),
Bridelia micrantha (S2, 6.7%), Calodendrum capense (S2, 13%), Carissa edulis
(4, 6.7%), Cassipourea malosana (2), Combretum molle (S4, 6.7%), Cordia
africana (4, 33%), Croton macrostachyus (S1, 47%), Croton megalocarpus (1,
87%), Diospyros abyssinica (2, 13%), Dodonaea viscosa (S4), Dombeya bur-
gessiae (3), Dracaena steudneri (2), Ehretia cymosa (2, 27%), Ekebergia capensis
(S2), Elaeodendron buchananii (2, 20%), Erythrina abyssinica (S3, 13%),
Erythrococca bongensis (3, 13%), Euclea divinorum (S2, 33%), Ficus sur (2),
Ficus thonningii (2, 13%), Juniperus procera (3, 27%), Kigelia africana (4),
Margaritaria discoidea (2), Markhamia lutea (2, 13%), Newtonia buchananii (4,
6.7%), Ochna ovata (3), Olea europaea (S2, 6.7%), Ozoroa insignis (3), Podo-
carpus falcatus (4), Psydrax schimperiana (2, 6.7%), Rauvolfia caffra (4), Rhus
natalensis (S3), Sapium ellipticum (2), Schrebera alata (2), Sesbania sesban (4,
6.7%), Strychnos henningsii (2), Teclea nobilis (2), Teclea simplicifolia (2, 20%),
Teclea trichocarpa (2), Trema orientalis (S2), Vangueria infausta (4, 13%),
Vangueria madagascariensis (4), Vernonia auriculifera (S3, 13%), Warburgia
ugandensis (2, 20%)
Upland Acacia woodland,
savanna and bushland (UA)
STO ¼ 22
SCP ¼ 20
SSH ¼ 6 (27%, 30%)
n ¼ 7
Acacia brevispica (1), Acacia drepanolobium (1), Acacia gerrardii (1), Acacia
mellifera (1, 43%), Acacia nilotica (3, 71%), Acacia polyacantha (1), Acacia
senegal (3), Acacia seyal (3, 29%), Acacia tortilis (1, 29%), Acacia xanthophloea
(1, 29%), Albizia amara (1), Boscia angustifolia (4), Combretum molle (4),
Dichrostachys cinerea (4), Euclea divinorum (4), Garcinia livingstonei (4),
Juniperus procera (4), Kigelia africana (4), Rhus natalensis (4, 29%), Vangueria
madagascariensis (4)
Acacia and allied vegetation on
soils with impeded drainage (AI)
STO ¼ 28
SCP ¼ 18
SSH ¼ 5 (18%, 28%)
n ¼ 6
Acacia drepanolobium (3, 17%), Acacia gerrardii (1), Acacia mellifera (1, 17%),
Acacia polyacantha (1), Acacia senegal (4, 17%), Acacia seyal (1, 17%), Acacia
tortilis (3, 17%), Acacia xanthophloea (4), Albizia amara (3), Balanites
aegyptiaca (4), Cadaba farinosa (4), Combretum molle (4), Commiphora schim-
peri (3), Dalbergia melanoxylon (3), Phoenix reclinata (4), Sclerocarya birrea (3),
Sesbania sesban (4), Syzygium guineense (4)
Semi-evergreen thicket (ST)
STO ¼ 29
SCP ¼ 19
SSH ¼ 6 (21%, 32%)
n ¼ 6
Acacia brevispica (1, 17%), Acacia gerrardii (S3), Acacia hockii (S3, 17%), Acacia
kirkii (S3), Acacia senegal (S3), Acacia seyal (1), Capparis tomentosa (3), Carissa
edulis (3), Erythrococca bongensis (3), Euphorbia candelabrum (S3, 17%),
Grewia bicolor (3, 17%), Grewia villosa (4), Harrisonia abyssinica (3), Maerua
triphylla (3), Olea europaea (3, 33%), Psydrax schimperiana (3), Rhus natalensis
(3, 17%), Tarenna graveolens (3), Teclea nobilis (3)
aSTO, total number of species in original species list, SCP, total number of species based on the common species pool, SSH, number of species
shared between current and original species lists (percentages based on STO and SCP), n, number of quadrats.
638 Roeland Kindt et al.
� 2007 The Authors. Journal compilation � 2007 Blackwell Publishing Ltd, Afr. J. Ecol., 45, 633–644

Table 2 Statistical results for the correspondence between current and original species lists, with most frequent species surveyed within
each potential natural vegetation type
Potential natural vegetation type
(abbreviation)a Most frequent species Rank
Frequency
(%) GLMb IndValb Source
Moist intermediate forest (MI) Cordia africana 1 67 2.1*** 26*** S2
STS ¼ 82 Croton macrostachyus 2 60 0.6 o 12*** S2
Savg ¼ 7.5 Commiphora eminii 3 53 1.8*** 14*** DI5
S1 ¼ 37 Bridelia micrantha 4 51 1.4*** 25*** S2
n ¼ 57 Markhamia lutea 5 37 2.0** 2
Sb9 ¼ 7 (78%) Erythrina abyssinica 6 33 1.8** S3
DK(DI) ¼ 0.653<0.663 Croton megalocarpus 7 32 1
DKC ¼ 0.414 Catha edulis 8 23 1.7** MMS1
Prunus africana 9 21 3
Dry Combretum savanna (DC) Croton macrostachyus 1 45 DIS1
STS ¼ 108 Combretum molle 2 42 3
Savg ¼ 8.7 Euphorbia tirucalli 3 40 EB3
S1 ¼ 53 Combretum collinum 4 35 3
n ¼ 40 Croton megalocarpus 5 32 DID1
Sb8 ¼ 4 (50%) Piliostigma thonningii 5 32 18*** MC3
DK ¼ 0.542 Azanza garckeana 7 30 4
DKC ¼ 0.450 Senna singueana 8 25 4
Dry montane forest (DM) Croton megalocarpus 1 62 1.3* 3
STS ¼ 83 Euclea divinorum 2 51 3.0*** 12** S2
Savg ¼ 8.0 Juniperus procera 3 49 37*** 1
S1 ¼ 47 Plectranthus barbatus 4 41 3.3** 11*** 5
n ¼ 37 Rhus natalensis 5 38 1.5** S3
Sb10 ¼ 8 (80%) Lippia javanica 6 35 11*** S5
DK(EB) ¼ 0.600 <0.643 Scutia myrtina 7 30 2.8*** EB3
DKC ¼ 0.423 Psiadia punctulata 8 27 EB3
Solanum incanum 8 27 S5
Olea europaea 10 22 2.4** S2
Moist montane forest (MM) Croton megalocarpus 1 70 1.6** MI1
STS ¼ 85 Croton macrostachyus 2 49 15*** S2
Savg ¼ 6.7 Commiphora eminii 3 41 1.4* 15*** DI5
S1 ¼ 42 Prunus africana 3 41 31*** 2
n ¼ 37 Bridelia micrantha 5 27 4
Sb10 ¼ 7 (70%) Clerodendrum johnstonii 6 22 Genus 1
DK(DM) ¼ 0.625<0.672 Cordia africana 7 19 Genus 1
DKC(MI) ¼ 0.401 <0.406 Erythrina abyssinica 7 19 S3
Vitex keniensis 7 19 1.5* 2
Vangueria infausta 10 16 1.3 o MI4
Lowland Acacia-Commiphora woodland,
bushland and thicket (LA)
Acacia tortilis 1 64 2.1*** 44*** 1
STS ¼ 102 Terminalia brownii 2 60 2.4*** 21*** DC3
Savg ¼ 11.7 Melia volkensii 3 52 1.8*** 29*** 3
S1 ¼ 49 Albizia anthelmintica 4 40 36*** 5
n ¼ 25 Acacia senegal 5 36 1.6*** 27*** 3
Sb10 ¼ 9 (90%) Acacia ataxacantha 6 32 2.9*** 5
DB ¼ 0.639 Berchemia discolor 6 32 24*** 5
DKP ¼ 0.362 Acacia mellifera 8 28 1.6*** 19*** 3
Combretum aculeatum 8 28 2.7*** 24*** 3
Senna singueana 8 28 18** 4
Species composition patterns around Mt Kenya 639
� 2007 The Authors. Journal compilation � 2007 Blackwell Publishing Ltd, Afr. J. Ecol., 45, 633–644

Table 2 (Continued)
Potential natural vegetation type
(abbreviation)a Most frequent species Rank
Frequency
(%) GLMb IndValb Source
Evergreen and semi-evergreen bushland (EB) Croton megalocarpus 1 63 1.2* DI1
STS ¼ 52 Euclea divinorum 2 44 2.7*** 3
Savg ¼ 7.9 Ipomoea kituiensis 2 44 33*** ST5
S1 ¼ 26 Acacia drepanolobium 4 38 29*** 1
n ¼ 16 Plectranthus barbatus 4 38 3.2** 5
Sb6 ¼ 4 (67%) Acacia xanthophloea 6 31 4
DK ¼ 0.622
DKC ¼ 0.473
Dry intermediate forest (DI) Croton megalocarpus 1 87 2.6** 16* D1
STS ¼ 63 Croton macrostachyus 2 47 10* S1
Savg ¼ 8.7 Cordia africana 3 33 4
S1 ¼ 31 Euclea divinorum 3 33 2.6*** S2
n ¼ 15 Ehretia cymosa 5 27 15*** 2
Sb8 ¼ 8 (100%) Juniperus procera 5 27 3
DK ¼ 0.603 Acokanthera schimperi 7 20 S2
DKC ¼ 0.431 Elaeodendron buchananii 7 20 11** 2
upland Acacia woodland,
savanna and bushland (UA)
Euphorbia tirucalli 1 86 2.2* 19** EB3
STS ¼ 35 Acacia nilotica 2 71 3.1*** 39*** 3
Savg ¼ 9.0 Acacia hockii 3 57 3.2*** 12* EBS1
S1 ¼ 19 Acacia mellifera 4 43 2.2*** 1
n ¼ 7 Croton megalocarpus 4 43 DI1
Sb6 ¼ 2 (33%) Grewia bicolor 4 43 2.2*** 24** ST3
DK(ST) ¼ 0.748 <0.778
DKC(ST) ¼ 0.608 <0.714
Acacia and allied vegetation
on soils with impeded drainage (AI)
Euphorbia tirucalli 1 50 23** EB3
STS ¼ 18 Acacia nilotica 2 33 1.5* LA3
Savg ¼ 4.0 Cordia africana 2 33 DC3
S1 ¼ 13 Croton macrostachyus 2 33 DIS1
n ¼ 6 Croton megalocarpus 2 33 DI1
Sb5 ¼ 0 (0%)
DK(DC) ¼ 0.757 <0.772
DKC(UA) ¼ 0.663 <0.705
semi-evergreen thicket (ST) Azanza garckeana 1 83 2.5* 52*** EB4
STS ¼ 52 Catha edulis 1 83 4.6*** 81*** MM1
Savg ¼ 14.2 Ficus thonningii 1 83 4.1*** 42*** DI2
S1 ¼ 35 Melia volkensii 1 83 3.3*** 33** LA3
n ¼ 6 Terminalia brownii 5 67 2.6*** 29** DC3
Sb7 ¼ 0 (0%) Combretum collinum 6 50 37*** DC3
DK(DC) ¼ 0.604 <0.839 Vitex payos 6 50 2.2** 38** DC4
DKC(DC) ¼ 0.539 <0.772
aSTS, total number of species surveyed, Savg, average number of species surveyed per quadrat, S1, number of species surveyed in only one
quadrat, n, number of quadrats, Sbx, number of species shared between current and original species lists for x most frequent species,
DK, Kulczynski distance, indicating the original species list and distance first in case this distance was smaller than the distance for the
original list for the same PNVT, DKP, Kulczynski distance based on the common species pool, DB, Bray-Curtis distance.bSignificance: *<0.05 <**<0.01 <***£ 0.001.
640 Roeland Kindt et al.
� 2007 The Authors. Journal compilation � 2007 Blackwell Publishing Ltd, Afr. J. Ecol., 45, 633–644

and semi-evergreen bushland (‘EB’, n ¼ 16, 6.4%) (Fig. 1,
Tables 1 and 2).
The LA and forest PNVTs shared more species (27–35)
than the remaining PNVTs (5–18, Table 1). LA and the
forest PNVTs are also the PNVTs with greatest total rich-
ness in the literature (STO >70, Table 1) and the survey
(STS >60, Table 2), except for the DC (STO ¼ 24, STS ¼108). Only DC shared more than 50% of the species bet-
ween the original and current species lists. The other fre-
quent PNVTs shared 30–41% of the species. No PNVT had
fewer than 5 or 18% shared species (Table 1). When limi-
ting the species to the common pool, the shared species was
above 50% for all frequent PNVTs, except for EB (47%).
Constrained ordination analysis provided a statistical
evidence that current species composition was different
between quadrats belonging to different PNVTs, although
PNVT explained <20% of differences in ecological distance
among quadrats. The results for three commonly used
ecological distance measures for differences in species
composition were 19.0% explanation of squared Bray-
Curtis distance (P ¼ 0.0001, n ¼ 250), 19.6% of squared
Kulczynski distance (P ¼ 0.0001, n ¼ 249 after leaving
out one quadrat without any indigenous tree species) and
15.8% of squared Jaccard distance (P ¼ 0.0001, n ¼250).
Although percentages of shared species were relatively
small (<50% except for DC), the similarity in species
composition was greatest between the current and original
lists of four frequent PNVTs (dry intermediate forest, LA,
DC and EB) (Table 2). The current species composition of
less frequent PNVTs was more similar to the original spe-
cies composition of a minimum of three other PNVTs.
When limiting species to the common pool, moist montane
forest was the only frequent PNVT that did not have the
smallest ecological distance between the original and
current species lists, although the difference in distance for
original lists for moist montane and moist intermediate
forest was very small (Table 2).
For the seven frequent PNVTs, only twelve species
occurred in more than 50% of the quadrats and only two
species occurred in more than 80% (Table 2). Of the fre-
quent PNVTs, only moist intermediate forest (four species)
and LA (three species) had more than two species that
occurred on more than 50% of the quadrats (Table 2).
For the frequent PNVTs, the most frequent species were
shared by 70–100% for forest PNVTs, 90% for LA, 67% for
EB and 50% for DC (Table 2). Among the frequent PNVTs,
moist montane forest and EB were the only PNVTs where
the highest ranked species did not occur in the original
lists. Several of the most frequent species of forest PNVTs
were secondary, with two secondary species being most
frequent in the moist intermediate forest. None of the
remaining PNVTs shared the highest ranked species with
the original list, whereas the percentage of shared species
among the top ranked species was <33%.
Evidence for higher frequencies of occurrence was pro-
vided by GLM or IndVal analysis for 50% or more of the
frequent species of each PNVT, except for DC (only one
confirmation) and Acacia and allied vegetation found on
soils with impeded drainage (only two confirmations).
Discussion
The fact that the percentages of species overlap was at least
30% for frequent vegetation types and that overlaps were
larger for the common species pool and for frequent species
indicates that the species composition of present vegetation
resembles the original species composition of the PNVTs.
However, not all species are shared and there is some
similarity in current species composition with the original
species composition of different forest PNVTs.
As DC was the only PNVT with more than 50% shared
species, it is possible that this is a result from the fact that
this PNVT contained a large number of quadrats with
natural habitats (30%). However, the percentage of shared
species of LA that contained the highest number of quad-
rats with natural habitats (48%) was only 38%, whereas
only two quadrats contained natural habitats in the
evergreen and semi-evergreen bushland (41% shared
species) and only one quadrat contained a natural but
secondary Acacia woodland in a forest PNVT (30–36%).
Inclusion of natural patches of vegetation in a PNVT
cannot be the only explanation for tree species composition
and similarity around Mount Kenya.
The fact that species overlaps were smaller for the less
frequent PNVTs points to sampling effects, which result
from low frequencies of most species. Yirdaw & Luukkanen
(2003) observed that distance from natural forests had an
effect on average but not total species richness in wood-
lands, which seems to suggest that deviation from PNVT
mainly affects species frequencies but not their presence–
absence within the entire area. Such pattern suggests that
extensive sampling schemes should be used to detect spe-
cies in anthropogenic vegetation types. These patterns also
mean that higher alpha diversity can be achieved by
increasing the frequency of species that are currently
Species composition patterns around Mt Kenya 641
� 2007 The Authors. Journal compilation � 2007 Blackwell Publishing Ltd, Afr. J. Ecol., 45, 633–644

present in the PNVT. Such increases in frequencies could
have an additional benefit of increasing population sizes
and genetic diversity of promoted species (Kindt et al.,
2006b).
Vegetation maps with fixed boundaries between distinct
vegetation types are abstractions of reality that are
inherent features of any map. No single biogeographic
framework is optimal for all taxa but is a compromise for as
many taxa as possible (Olson et al., 2001). The existence of
ecotones between vegetation types does not preclude the
use of vegetation classification schemes, as the current
view on plant communities is that some communities
repeat themselves in time and space, but that a considerable
fraction of landscape mosaics consists of ecotones (Kent &
Coker, 1995; van der Maarel, 2005). The confusion
between moist montane and moist intermediate forest is
probably related to an ecotone between both forest types,
as most quadrats within the moist montane forest occurred
close to the boundary between the two PNVTs. Whether
species composition patterns reflect some characteristics of
ecotones is a hypothesis that could be investigated by
comparing the distance to the boundary of quadrats to
similarity in species composition. The hypothesis that
PNVT boundaries delimit populations of different evolu-
tionary adaptations of the same species could also be tested
by provenance trials.
Lwanga (2003) reported that natural succession is the
preferred method of ecosystem restoration as artificial
restoration is expensive. However, allowing natural pat-
terns requires that seed sources and dispersal vectors are in
close proximity to the target site (Lejju, Oryem-Origa &
Kasenene, 2001; Lwanga, 2003; Mwima & McNeilage,
2003; Yirdaw & Luukkanen, 2003; Karlowski, 2006).
Moreover, it has been suggested that ecosystem restoration
efforts should focus first on abiotic thresholds of commu-
nity assembly such as climate and substrate if these con-
ditions have degraded below certain thresholds levels
(Whisenant, 1999; Hobbs & Norton, 2004). Allowing
natural succession is also difficult as the long-term suc-
cessional pathways in African montane forest zones are
little understood (Chapman et al., 1999; Bussmann, 2004;
Fashing et al., 2004; Karlowski, 2006). Where primary
species are the most valuable, restoration pathways may
need to be shortened by growing these species in tree
nurseries and directly planting them (Lamb et al., 2005).
However, restoration efforts should not reduce the ability
of the ecosystem to adapt to changes by tying assemblages
to one place (Harris et al., 2006).
Our results could be used to select those species for
promotion in indigenous tree planting projects for which
statistical evidence was provided for their higher frequen-
cies within particular PNVTs, by interpreting this as evi-
dence that these species are adapted to the local ecological
conditions and are preferred by land owners. As slow
growth rates of indigenous tree species are consistently
mentioned by farmers and NGOs as hurdles to tree plant-
ing, an alternative approach could be to promote indi-
genous tree species that are expected to grow faster, ideally
accompanied by information on appropriate silvicultural
management practices and sources of genetically diverse
planting materials. Especially faster growing primary spe-
cies that occurred in relatively higher frequencies in our
survey such as Juniperus procera in dry forests and Vitex
keniensis in moist forests could be promoted. These are the
two primary species that had the fastest diameter incre-
ments for young trees (1–5 years), but were ranked third
and fourth for older trees (>20 years) in a study conducted
by Bussmann (1999). The other three primary species
identified by this study as fast growing primary species
were not observed in the survey (Zanthoxylum gillettii,
Podocarpus latifolius) or only in low frequencies (Hagenia
abyssinica), but could also be promoted.
As slower growth rates of native species may be com-
pensated by significantly higher and increasing market
prices and also by the ecological services that native spe-
cies provide, such as contributing to biodiversity conser-
vation or watershed protection (Lamb et al., 2005; Kindt
et al., 2006c), slower-growing primary forest species
should not be overlooked in tree planting promotions. In
the Mount Kenya area, Ocotea usambarensis has dominated
illegal logging (Gathaara, 1999). Whether this valuable
but slow-growing and slowly regenerating species (Buss-
mann, 2004) can be integrated in agroforestry systems
within the moist montane forest PNVT could be explored
further, as could be the integration of other slow-growing
but valuable and overexploited species such as Cassipourea
malosana, Olea europaea or Podocarpus falcatus. It should be
obvious that any diversification strategy for the area
around Mount Kenya should involve farmers and other
stakeholders, and not be merely a desktop study of com-
parisons between species compositions of original and
current vegetation types (Kindt et al., 2006c). Also, if
biodiversity conservation is one of the objectives of diver-
sification efforts, landscape-level planning of how biodi-
versity within remaining natural fragments can be better
protected should remain a priority as habitat loss remains
642 Roeland Kindt et al.
� 2007 The Authors. Journal compilation � 2007 Blackwell Publishing Ltd, Afr. J. Ecol., 45, 633–644

the biggest threat to biodiversity conservation (Green et al.,
2005; Grenyer et al., 2006).
Conclusions and recommendations
We showed that current species composition in privately
owned land around Mount Kenya resembles the species
composition of the original vegetation types. Based on the
finding that PNVT can be used as an indicator of ecological
suitability, we recommend that future landscape diversifi-
cation and tree promotion efforts consider original species
composition, for which information is available from the
new maps and species lists that we produced. As we can
only speculate about the ecological and socio-economic
reasons why some tree species are currently more frequent
than other species (such as overexploited timber species),
whereas landscape diversification can be achieved by
increasing frequencies of indigenous tree species, we
recommended that future research efforts are dedicated to
improving our understanding of species frequency pat-
terns.
Acknowledgements
We highly appreciate Zenroku Oginosako (formerly ICRAF)
for allowing us to use part of the results of the survey he
conducted around Mount Kenya, Meshack Nyabenge
(ICRAF) for assistance for GIS analysis and Siro Masinde
(East Africa Herbarium) for collating herbarium specimen
information. We thank VVOB, Danida and the Danish
Centre for Forest and Landscape Research for funding our
projects at the World Agroforestry Centre (ICRAF).
References
Beentje, H.J. (1990) The forests of Kenya. Mitt. Inst. Allg. Bot.
Hamburg 23a, 265–286.
Beentje, H. (1994) Kenya Trees, Shrubs and Lianas. National
Museums of Kenya, Nairobi.
Bussmann, R.W. (1999) Growth rates of important East African
montane forest trees, with particular reference to those of
Mount Kenya. J. East Afr. Nat. Hist. 89, 69–78.
Bussmann, R.W. (2004) Regeneration and succession patterns in
African, Andean and Pacific tropical mountain forests: the role
of natural and anthropogenic disturbance. Lyonia 6, 93–111.
Chapman, C.A., Chapman, L.J., Kaufman, L. & Zanne, A.E. (1999)
Potential causes of arrested succession in Kibale National Park,
Uganda: growth and mortality of seedlings. Afr. J. Ecol. 37,
81–92.
Dufrene, M. & Legendre, P. (1997) Species assemblages and
indicator species: the need for a flexible asymmetrical approach.
Ecol. Monogr. 67, 345–366.
Environmental Systems Research Institute [ESRI] (2000) ArcView
GIS 3.2a. ESRI, Redlands.
Fashing, P.J., Forrestel, A., Scully, C. & Cords, M. (2004) Long-
term tree population dynamics and their implications for the
conservation of the Kakamega Forest, Kenya. Biodivers. Conserv.
13, 753–771.
Ferrier, S., Watson, G., Pearce, J. & Drielsma, M. (2002) Extended
statistical approaches to modelling spatial pattern in biodiversity
in northeast New South Wales. I. Species level modelling. Bio-
divers. Conserv. 11, 2275–2307.
Ferrier, S., Powell, G.V.N., Richardson, K.S., Manion, G., Overton,
J.K., Allnutt, T.F., Cameron, S.E., Mantle, K., Burgess, N.D.,
Faith, D.P., Lamoreux, J.F., Kier, G., Hijmans, R.J., Funk, V.A.,
Cassis, G.A., Fisher, B.L., Flemons, P., Lees, D., Lovett, J.C. & Van
Rompaey, R.S.A.R. (2004) Mapping more of terrestrial bio-
diversity for global conservation assessment. BioScience 54,
1101–1109.
Gathaara, G.N. (1999) Aerial survey of the destruction of Mt. Kenya,
Imenti and Ngare Ndare forest reserves. Kenya Wildlife Service,
Nairobi.
Green, R.E., Cornell, S.J., Scharlemann, J.P.W. & Balmford, A.
(2005) Farming and the fate of wild nature. Science 307, 550–
555.
Greenway, P.J. (1973) A classification of the vegetation of East
Africa. Kirkia 9, 1–68.
Grenyer, R., Orme, C.D.L., Jackson, S.F., Thomas, G.H., Davies, R.G.,
Davies, T.J., Jones, K.E., Olson, V.A., Ridgely, R.S., Rasmussen,
P.C., Ding, T., Bennett, P.M., Blackburn, T.M., Gaston, K.J.,
Gittleman, J.L. & Owens, I.P.F. (2006) Global distribution and
conservation of rare and threatened vertebrates. Nature 444, 93–96.
Harris, J.A., Hobbs, R.J., Higgs, E. & Aronson, J. (2006) Ecological
restoration and global climate change. Restor. Ecol. 14, 170–176.
Hastie, T.J. & Pregibon, D. (1993) Generalised linear models. In:
Statistical models in S (Eds J. M. Chambers and T. J. Hastie).
Chapman and Hall, London.
Hobbs, R.J. & Norton, D.A. (2004) Ecological filters, thresholds,
and gradients in resistance to ecosystem assembly. In: Assembly
Rules and Restoration Ecology (Eds V. M. Temperton, R. J. Hobbs,
T. Nuttle and S. Halle). Island Press, Washington DC.
Jaetzhold, R. & Schmidt, H. (1983) Farm Management Handbook of
Kenya, Vol.II/C. Ministry of Agriculture, Nairobi.
Karlowski, U. (2006) Afromontane old-field succession: secondary
succession and the return of indigenous species. Afr. J. Ecol. 44,
264–272.
Kent, M. & Coker, P. (1995) Vegetation Description and Analysis.
John Wiley & Sons, Chichester.
Kindt, R. & Coe, R. (2005) Tree Diversity Analysis. A Manual and
Software for Some Common Statistical Methods for Biodiversity and
Ecological Analysis. World Agroforestry Centre (ICRAF), Nairobi,
URL: http://www.worldagroforestry.org/treesandmarkets/
tree_diversity_analysis.asp
Species composition patterns around Mt Kenya 643
� 2007 The Authors. Journal compilation � 2007 Blackwell Publishing Ltd, Afr. J. Ecol., 45, 633–644

Kindt, R., Lillesø, J.P.B., Van Breugel, P. & Nyabenge, M. (2006a)
Potential Natural Vegetation of South-western Kenya for Selection of
Indigenous Tree Species. World Agroforestry Centre (ICRAF),
Nairobi.
Kindt, R., Van Damme, P. & Simons, A.J. (2006b) Tree diversity in
western Kenya: using profiles to characterise richness and
evenness. Biodivers. Conserv. 15, 1253–1270.
Kindt, R., Van Damme, P., Simons, A.J. & Beeckman, H. (2006c)
Planning tree species diversification in Kenya based on differ-
ences in tree species composition between farms. I. Analysis of
tree uses. Agroforest. Syst. 67, 215–228.
Lamb, D., Erskine, P.D. & Parrotta, J.A. (2005) Restoration
of degraded tropical forest landscapes. Science 310, 1628–
1632.
Leakey, R.R.B. (1996) Definition of agroforestry revisited. Agrofor.
Today 8, 5–7.
Legendre, P. & Anderson, M.J. (1999) Distance-based redundancy
analysis: testing multi-species responses in multi-factorial eco-
logical experiments. Ecol. Monogr. 69, 1–24.
Legendre, P. & Legendre, L. (1998) Numerical Ecology. Elsevier
Science, Amsterdam.
Lejju, J.B., Oryem-Origa, H. & Kasenene, J.M. (2001) Regeneration
of indigenous trees in Mgahinga Gorilla National Park, Uganda.
Afr. J. Ecol. 39, 65–73.
Lind, E.M. & Morrison, M.E.S. (1974) East African Vegetation.
Longman Group Ltd, London.
Linder, H.P. (2001) Plant diversity and endemism in sub-Saharan
tropical Africa. J. Biogeogr. 28, 169–182.
Lwanga, J.S. (2003) Forest succession in Kibale National Park,
Uganda: implications for forest restoration and management.
Afr. J. Ecol. 41, 9–22.
van der Maarel, E. (2005) Vegetation ecology – an overview. In:
Vegetation Ecology (Ed. E. Van Der Maarel). Blackwell Publish-
ing, Oxford.
Maundu, P. & Tengnas, B. (2005) Useful Trees and Shrubs for Kenya.
World Agroforestry Centre (ICRAF), Nairobi.
McClean, C.J., Lovett, J.C., Kuper, W., Hannah, L., Sommer, J.H.,
Barthlott, W., Termansen, M., Smith, G.F., Tokumine, S. &
Taplin, J.R.D. (2005) African plant diversity and climate
change. Ann. Missouri Bot. Gard. 92, 139–152.
Mueller-Dombois, D. & Ellenberg, H. (1974) Aims and Methods of
Vegetation Ecology. The Blackburn Press, Caldwell.
Mwima, P.M. & McNeilage, A. (2003) Natural regeneration and
ecological recovery in Bwindi Impenetrable National Park,
Uganda. Afr. J. Ecol. 41, 93–98.
Oksanen, J., Kindt, R., Legendre, P. & O’Hara, R.B. (2005) Vegan:
Community Ecology Package version 1.7–82. URL:http://cc.ou-
lu.fi/ jarioksa/.
Olson, D.M., Dinerstein, E., Wikramanayake, E.D., Burgess, N.D.,
Powell, G.V.N., Underwood, E.C., D’Amico, J.A., Itoua, I.,
Strand, H.E., Morrison, J.C., Loucks, C.J., Allnutt, T.F., Ricketts,
T.H., Kura, Y., Lamoreux, J.F., Wettengel, W.W., Hedao, P. &
Kassem, K.R. (2001) Terrestrial ecoregions of the world: a new
map of life on earth. BioScience 51, 933–938.
R Development Core Team (2005) R: A Language and Environment
for Statistical Computing. R Foundation for Statistical Computing,
Vienna. URLhttp://www.R-project.org.
Simons, A.J., Salim, A.S., Orwa, C., Munjuga, M. & Mutua, A.
(2005) Agroforestree Database: A Tree Species Reference and
Selection Guide. World Agroforestry Centre (ICRAF), Nairobi.
Trapnell, C.G. (1997) Biodiversity and conservation of the indigenous
forests of the Kenya highlands. Sansom and company, Bristol.
Trapnell, C.G. & Brunt, M.A. (1987) Vegetation and Climate Maps of
South-western Kenya. Land Resources Centre, Tolworth Tower.
Trapnell, C.G. & Langdale-Brown, I. (1972). Natural vegetation.
In: East Africa: Its People and Resources (Ed. W. T. W. Morgan).
Oxford University Press, Nairobi.
Trapnell, C.G., Birch, W.R. & Brunt, M.A. (1966) Kenya
1:250,000 Vegetation Sheet 1. Results of a Vegetation Land Use
Survey of South-western Kenya. British Government’s Ministry of
Overseas Development (Directorate of Overseas Surveys) under
the Special Commonwealth African Assistance Plan, Tolworth
Tower.
Trapnell, C.G., Brunt, M.A., Birch, W.R. & Trump, E.C. (1969)
Kenya 1:250,000 Vegetation Sheet 3. Results of a Vegetation –
Land Use Survey of South-western Kenya. British Government’s
Ministry of Overseas Development (Directorate of Overseas
Surveys) under the Special Commonwealth African Assistance
Plan, Tolworth Tower.
Trapnell, C.G., Birch, W.R., Brunt, M.A. & Lawton, R.M. (1976)
Kenya 1:250,000 Vegetation Sheet 2. Results of a Vegetation –
Land Use Survey of South-western Kenya. British Government’s
Ministry of Overseas Development (Directorate of Overseas
Surveys) under the Special Commonwealth African Assistance
Plan, Tolworth Tower.
Trapnell, C.G., Brunt, M.A. & Birch, W.R. (1986) Kenya
1:250,000 Vegetation Sheet 4. Results of a Vegetation – Land Use
Survey of South-western Kenya. British Government’s Overseas
Surveys Directorate, Ordnance Survey under the UK Govern-
ment’s Technical Co-operation Programme, Tolworth Tower.
Van Noordwijk, M. & Ong, C.K. (1999) Can the ecosystem mimic
hypotheses be applied to farms in African savannahs. Agroforest.
Syst. 45, 131–158.
Whisenant, S.G. (1999) Repairing Damaged Wildlands: A Process-
Oriented, Landscape-Scale Approach. Cambridge University Press,
Cambridge.
White, F. (1983) The Vegetation of Africa: A Descriptive Memoir to
Accompany the UNESCO/AETFAT/UNSO Vegetation Map of Africa
by F White. UNESCO, Paris.
Yirdaw, E. & Luukkanen, O. (2003) Indigenous woody species
diversity in Eucalyptus globulus Labill. ssp. globulus plantations in
the Ethiopian highlands. Biodivers. Conserv. 12, 567–582.
(Manuscript accepted 27 March 2007)
doi: 10.1111/j.1365-2028.2007.00787.x
644 Roeland Kindt et al.
� 2007 The Authors. Journal compilation � 2007 Blackwell Publishing Ltd, Afr. J. Ecol., 45, 633–644