Development of EU Ecolabel Criteria for Sanitary Products ...
i
India’s Agricultural Exports and United States
Sanitary and other Regulatory Measures: Special Focus on Exports in Spices and Vegetable Products from
Maharashtra and Gujarat
Authors
Dr. Murali Kallummal Associate Professor,
Centre for WTO Studies, IIFT
Ms. Hari Maya Gurung Research Fellow,
Centre for WTO Studies, IIFT
Draft Paper
Presented at International Conference on
Indian Agriculture Sector under Trade Liberalisation and WTO:
Issues and Challenges
Session 6: Agriculture and Indian Economy December 11 -12, 2014
New Delhi
ii
Table of Contents
Introduction ......................................................................................................... 1
Data Sources and the Methodology................................................................ 4
State-wise trends of India’s Exports ................................................................. 5
Sectoral Trends in the US Refusals across Agricultural Sectors ................. 10
Comparison of Firm-level Refusal of Consignments from two States ......... 13
Sector I- Spices, Flavours and Salts Exports ................................................... 14
Public Health Concerns for the US .............................................................. 15
Other Serious Public health concerns ........................................................... 16
Questionable - may require further research ............................................. 16
Labelling and Process and Production related Issues ................................ 16
Sector II - Vegetable and Vegetable Products Exports .............................. 17
Labelling and Process and Production related Issues ................................ 18
Process Related Issues .................................................................................. 18
Labelling Related Issues ............................................................................... 18
Packaging Related Issue ............................................................................... 19
Public Health Concerns for the US .............................................................. 19
Questionable - may require further research ............................................. 19
By way of Conclusion ........................................................................................ 20
Recommendations and Policy Suggestion....................................................... 21
1
India’s Agricultural Exports and United States
Sanitary and other Regulatory Measures: Special Focus on Exports in Spices and Vegetable Products from
Maharashtra and Gujarat
Murali Kallummal
Hari Maya Gurung
Introduction
Protectionism is defined as the economic policy of restraining trade between countries. The
methods can be tariffs on imported goods, restrictive quotas, and a variety of other
government regulations designed to allow inputs in order to create fair competition between
imported and domestically produced goods and services.
The voluntary tariff liberalisation by individual countries and the corresponding tariff
liberalisation efforts under the WTO’s Uruguay Round1 and other Plurilateral and other
NAMA sectoral2 together leads to an imbalance in the global market access. This imbalance
was caused by another hidden important trade policy measure, that was hidden until now, this
was the behind the border measures known as non-tariff measures (NTMs). There was a
dramatic shift towards the increased use of such non-tariff measures by the governments to
protect the health and safety of their citizens and the environment.3
In the present world with the decrease in an average MFN tariff rates, behind the border
qualitative measures are increasing and becoming important factor in the determination of
market access for any country’s exports. These NTMs are standards/regulations/legislations
which are primarily applied on the domestic sales of the products which get applied on
imported products too. The analysis of NTMs are difficult because of their opaque nature
which arises from many reasons like: non-association of these measures to product[s] at dis-
aggregated tariff lines or harmonised nomenclature; multiple standards on the same set of
products4 and the differential interpretations drawn at the border on the issue of compatibility.
1 The inclusions of sectors like agricultural and textiles and clothing through removal of quota and import
bans/restrictions; tariffication was adopted to liberalise global trade. 2 The Plurilateral like information technology agreement (ITA-1) and the attempts to bring tariff disciplines
under the Doha Round for the 14 Sectorals proposal had some impact on tariff liberalisation- moving the
average tariffs downwards. 3 Chapter 8,
4 See Kallummal, 2013,
2
Under a high applied tariff regime, (before 1995) the countries resorted to lesser application
of NTMs in order to provide protection to those sectors which they considered sensitive.
However, in the recent years there has been a surge in non-tariff measures of all kinds in
these sectors. The non-tariff measures like sanitary and phytosanitary (SPS) and technical
barriers to trade (TBT) are applied on imported products so as to protect human, animal, plant
life and the environment. A more stringent regulatory policy is largely driven by factors like:
higher standards of living; national security or cultural reasons. Therefore, there is a
perception that these may have boosted consumers’ demand for high-quality and so-called
safe goods. Encouraged by the modern societies with higher incomes the standards have
been tuned to address these issues, which has led to growing regulations on water, air, and
soil pollutants led by the unhealthy process of production, which gets transmitted through
trade under a free trade regime.
Quote:
In a world where many forms of protection – including tariffs – are constrained
by WTO disciplines the NTMs are the new frontier of trade policy. NTMs that are
poorly designed or captured by special interests can hurt competitiveness and
fragment markets; whereas well-designed ones can effectively overcome
informational and other market failures. Assisting governments in the design of
NTMs is a critical challenge for donors and development agencies. However,
many issues relating, for example, to regional harmonisation and the interaction
of NTMs with market structure are still imperfectly understood. 5
The countries notification of standards under the WTO can be broadly categorised two
categories: international standards or harmonised standards; and national standards. National
standards provide a much greater level of protection than Codex, IPPC or OIE "trade
barriers" unless the WTO decides that the stricter national standard is based on a proper "risk
assessment". It demonstrates that the standard, guidelines or recommendations by the three
sisters of SPS Agreement does not provide sufficient protection or that the country
maintaining the stricter standard has other scientific justification. Article 2.4 of the TBT
Agreement provides that countries shall use Codex or other international standards "as a basis
for their technical regulations except when such international standards or relevant parts
would be an ineffective or inappropriate means for the fulfilment of a" legitimate objective.
To quote
…as explained above, under Article 2 of the SPS Agreement, a food safety
measure -- even if it does not treat imports differently than domestic products -- is
illegal if it is maintained "without sufficient scientific evidence." Article 5 of the
5 Jurgen, et all., 2012, Editor(s)Non-Tariff Measures - A Fresh Look at Trade Policy's New Frontier, world Bank.
3
SPS provides that "Members shall ensure that such measures are not more trade-
restrictive than required to achieve their appropriate level of sanitary or
phytosanitary protection, taking into account technical and economic feasibility."6
At the border and behind the border measures in the developed countries have been stringent,
the case of EU was highlighted by Kallummal, et.all., in 2012.7 In the total refusal of imports
by the US, Food and Drug Administration (FDA) from across the Globe, nearly 2,96,294
consignments were refused market access in the US during the period of January 2002 to
June 2014. Mexico was on the top with 84,733 consignments8 refused followed by China
with 23,533 with refused consignments and India closely behind with 23,208 consignments
refused.
India and China have recorded almost similar scale of refusal with completely large
differences in terms of market access with China having an edge in terms of value and
quantity of exports to the US. The impacts of all these border measures have been the trends
seen in nominal exports by India to the US and EU. There has been a decrease in shares over
the period of six decades. Clearly in terms of percent shares to total imports of the US it has
seen a decreasing trend from 43 percent in 1962 to 12 percent in 2013 and a similar drop was
observed in case of EU from 14 to 8 percent respectively.
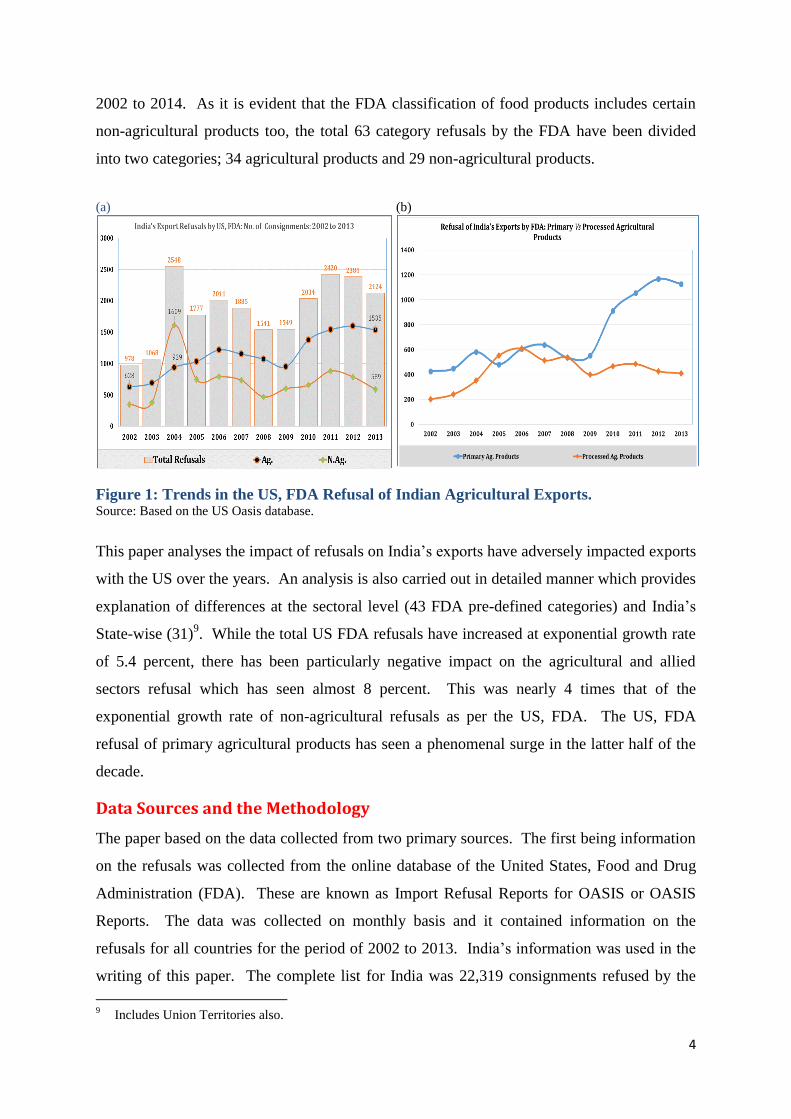
Interestingly, it suggested an increase in agricultural products export refusals by the FDA in
US, see Figure 1(a). However, this increase in agricultural products was primarily driven by
an increase seen in the primary products refusal by the US, see Figure 1 (b). Here there is as
need to identify how many of these actions were genuinely required to protect health of US
citizens? It would be also important to understand and check the notifications notified by US
to the WTO to analyse whether the refusals were WTO compatible or not? Another aspect is
to improve quality and processes of India’s exports, it would trace repeated offences recorded
by India’s exports to US market.
This paper will therefore analyse the impact of refusals of India’s agricultural products
exports to the United States based on the OASIS Refusal database of Food and Drug
Administration (FDA). The analysis will be carried-out for nearly one decade beginning from
6 CSPI, 2000, ‘The Impact of the TBT and SPS Agreements on Food Labelling and Safety Regulations’, A
Report by the Centre for Science in the Public Interest, March. 7 Kallummal Murali, Aditi Gupta and Poornima Varma, 2013, “Agricultural Trade from South-Asia and the
Impact of SPS Measures: A Case Study European Rapid Alert System for Food and Feed (RASFF)”, Journal
of Economic Policy and Research, vol. 8, no. 2, pp. 8 The case of Mexico has been highly unusual, it recorded 62,496 consignments refusals in one year (2011).
In an economic analysis it can only be considered as a spike or aberration to the normal trend over the
decade.
4
2002 to 2014. As it is evident that the FDA classification of food products includes certain
non-agricultural products too, the total 63 category refusals by the FDA have been divided
into two categories; 34 agricultural products and 29 non-agricultural products.
(a)
(b)
Figure 1: Trends in the US, FDA Refusal of Indian Agricultural Exports. Source: Based on the US Oasis database.
This paper analyses the impact of refusals on India’s exports have adversely impacted exports
with the US over the years. An analysis is also carried out in detailed manner which provides
explanation of differences at the sectoral level (43 FDA pre-defined categories) and India’s
State-wise (31)9. While the total US FDA refusals have increased at exponential growth rate
of 5.4 percent, there has been particularly negative impact on the agricultural and allied
sectors refusal which has seen almost 8 percent. This was nearly 4 times that of the
exponential growth rate of non-agricultural refusals as per the US, FDA. The US, FDA
refusal of primary agricultural products has seen a phenomenal surge in the latter half of the
decade.
Data Sources and the Methodology
The paper based on the data collected from two primary sources. The first being information
on the refusals was collected from the online database of the United States, Food and Drug
Administration (FDA). These are known as Import Refusal Reports for OASIS or OASIS
Reports. The data was collected on monthly basis and it contained information on the
refusals for all countries for the period of 2002 to 2013. India’s information was used in the
writing of this paper. The complete list for India was 22,319 consignments refused by the
9 Includes Union Territories also.
5
US, FDA, which has been divided into non-agriculture10
and agricultural products by the
authors. The second source is WITS online data, which was used for estimating the exports
by India to the United States. Using these two secondary data sources we have carried out
this study.
We have divided our objectives into four specific objectives and they are the following:
Objectives
1. To analyse the state-wise trends seen in the US, FDA refusals;
2. To analyse the sectoral trends in terms of the US, FDA refusals;
3. To identify the top refusal reasons in the India’s agricultural exports – also will look
at two top state-wise differentials;
4. To suggest policy recommendation for boosting exports (short-term and long-term)
based on the results of 1 to 3 objectives.
Therefore, this paper will also look at the various measures that have shown a prominence in
different sectors and states. By doing so, it would highlight the regional and Sectoral trends
of India and the movements observed in terms of reasons for the export refusal. Finally, it
would conclude by making policy suggestions based on the trends observed in the Region-
wise, State-wise, Sectoral trends.
State-wise trends of India’s Exports
Behind the border measures have been one of the biggest stumbling blocks in the India and
United States bilateral trade. As also discussed in the introduction, the US, FDA refusal of
total global imports were nearly 0.2 million number of consignments citing the SPS
measures, during the period of January 2002 to June 2014. The top three countries which
recorded consignment refusal were Mexico with 84.7 thousand consignments refused,
followed by China with 23.5 thousand and marginally below it was India with 23.3 thousand
consignments refused.
In this paper, we want to understand the reasons for India’s export refusal by the US behind
border measures. The numbers of consignments refused in the US were under 1,511 different
10
The non-agriculture contained some thirty products like: anaesthesiology; animal devices & diagnostic products; antibiotics (human/animal); bio & licensed in-vivo & in-vitro diagnostics; cardiovascular; Chemistry; Colour Additives; Food/Drug/Cosmetic; Dental; Dietary Conventional Food/Meal Replacements; Dressing/Condiment; Ear, Nose & Throat; Gastroenterological & Urological; General & Plastic Surgery; General Hospital/Personal Use; Haematology; Human and Animal Drugs; Ionizing Non-Medical Devices and Components; Light Emitting Non-Device Products; Microbiology; Neurological; Obstetrical & Gynaecological; Ophthalmic; Orthopaedic; Pathology; Pharmacy Necessary & Ctnr For Drug/Bio; Physical Medicine; Radiological; Toxicology and Type A Medicated Articles.
6
violations under various Sections of the US domestic laws11
of Food and Drugs Authority
(FDA) which concerns the quality of India’s exports. These can be broadly classified under
six broad heads which are misbranding, adulteration, unapproved new drugs, non-standards,
failure to file initial report, adulteration and misbranding.
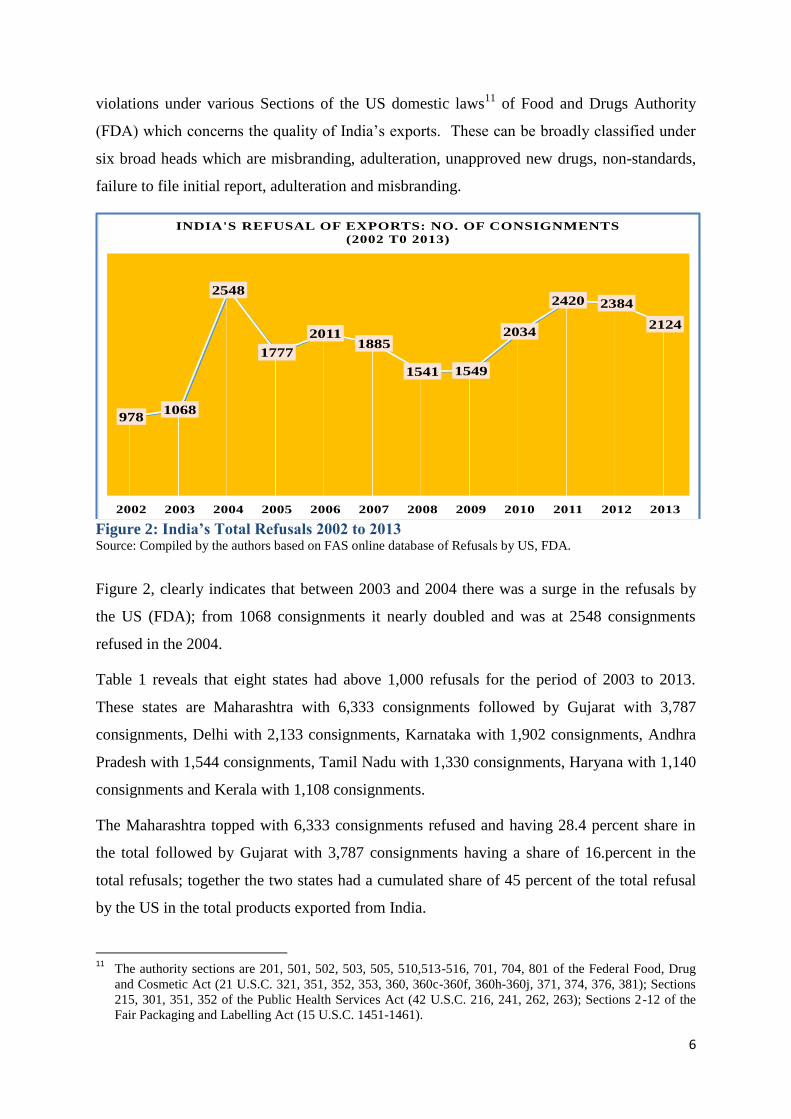
Figure 2: India’s Total Refusals 2002 to 2013 Source: Compiled by the authors based on FAS online database of Refusals by US, FDA.
Figure 2, clearly indicates that between 2003 and 2004 there was a surge in the refusals by
the US (FDA); from 1068 consignments it nearly doubled and was at 2548 consignments
refused in the 2004.
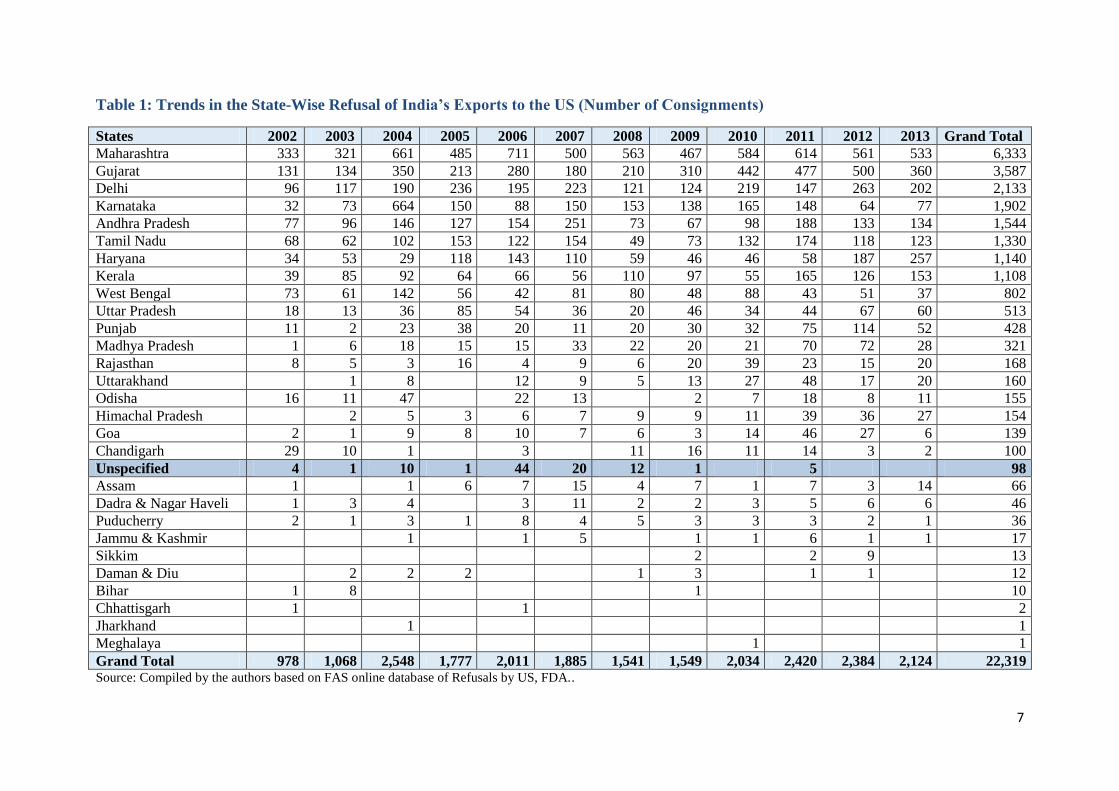
Table 1 reveals that eight states had above 1,000 refusals for the period of 2003 to 2013.
These states are Maharashtra with 6,333 consignments followed by Gujarat with 3,787
consignments, Delhi with 2,133 consignments, Karnataka with 1,902 consignments, Andhra
Pradesh with 1,544 consignments, Tamil Nadu with 1,330 consignments, Haryana with 1,140
consignments and Kerala with 1,108 consignments.
The Maharashtra topped with 6,333 consignments refused and having 28.4 percent share in
the total followed by Gujarat with 3,787 consignments having a share of 16.percent in the
total refusals; together the two states had a cumulated share of 45 percent of the total refusal
by the US in the total products exported from India.
11
The authority sections are 201, 501, 502, 503, 505, 510,513-516, 701, 704, 801 of the Federal Food, Drug
and Cosmetic Act (21 U.S.C. 321, 351, 352, 353, 360, 360c-360f, 360h-360j, 371, 374, 376, 381); Sections
215, 301, 351, 352 of the Public Health Services Act (42 U.S.C. 216, 241, 262, 263); Sections 2-12 of the
Fair Packaging and Labelling Act (15 U.S.C. 1451-1461).
9781068
2548
1777
20111885
1541 1549
2034
2420 2384
2124
2002 2003 2004 2005 2006 2007 2008 2009 2010 2011 2012 2013
INDIA'S REFUSAL OF EXPORTS: NO. OF CONSIGNMENTS
(2002 T0 2013)
7
Table 1: Trends in the State-Wise Refusal of India’s Exports to the US (Number of Consignments)
States 2002 2003 2004 2005 2006 2007 2008 2009 2010 2011 2012 2013 Grand Total
Maharashtra 333 321 661 485 711 500 563 467 584 614 561 533 6,333
Gujarat 131 134 350 213 280 180 210 310 442 477 500 360 3,587
Delhi 96 117 190 236 195 223 121 124 219 147 263 202 2,133
Karnataka 32 73 664 150 88 150 153 138 165 148 64 77 1,902
Andhra Pradesh 77 96 146 127 154 251 73 67 98 188 133 134 1,544
Tamil Nadu 68 62 102 153 122 154 49 73 132 174 118 123 1,330
Haryana 34 53 29 118 143 110 59 46 46 58 187 257 1,140
Kerala 39 85 92 64 66 56 110 97 55 165 126 153 1,108
West Bengal 73 61 142 56 42 81 80 48 88 43 51 37 802
Uttar Pradesh 18 13 36 85 54 36 20 46 34 44 67 60 513
Punjab 11 2 23 38 20 11 20 30 32 75 114 52 428
Madhya Pradesh 1 6 18 15 15 33 22 20 21 70 72 28 321
Rajasthan 8 5 3 16 4 9 6 20 39 23 15 20 168
Uttarakhand 1 8 12 9 5 13 27 48 17 20 160
Odisha 16 11 47 22 13 2 7 18 8 11 155
Himachal Pradesh 2 5 3 6 7 9 9 11 39 36 27 154
Goa 2 1 9 8 10 7 6 3 14 46 27 6 139
Chandigarh 29 10 1 3 11 16 11 14 3 2 100
Unspecified 4 1 10 1 44 20 12 1 5 98
Assam 1 1 6 7 15 4 7 1 7 3 14 66
Dadra & Nagar Haveli 1 3 4 3 11 2 2 3 5 6 6 46
Puducherry 2 1 3 1 8 4 5 3 3 3 2 1 36
Jammu & Kashmir 1 1 5 1 1 6 1 1 17
Sikkim 2 2 9 13
Daman & Diu 2 2 2 1 3 1 1 12
Bihar 1 8 1 10
Chhattisgarh 1 1 2
Jharkhand 1 1
Meghalaya 1 1
Grand Total 978 1,068 2,548 1,777 2,011 1,885 1,541 1,549 2,034 2,420 2,384 2,124 22,319 Source: Compiled by the authors based on FAS online database of Refusals by US, FDA..
8
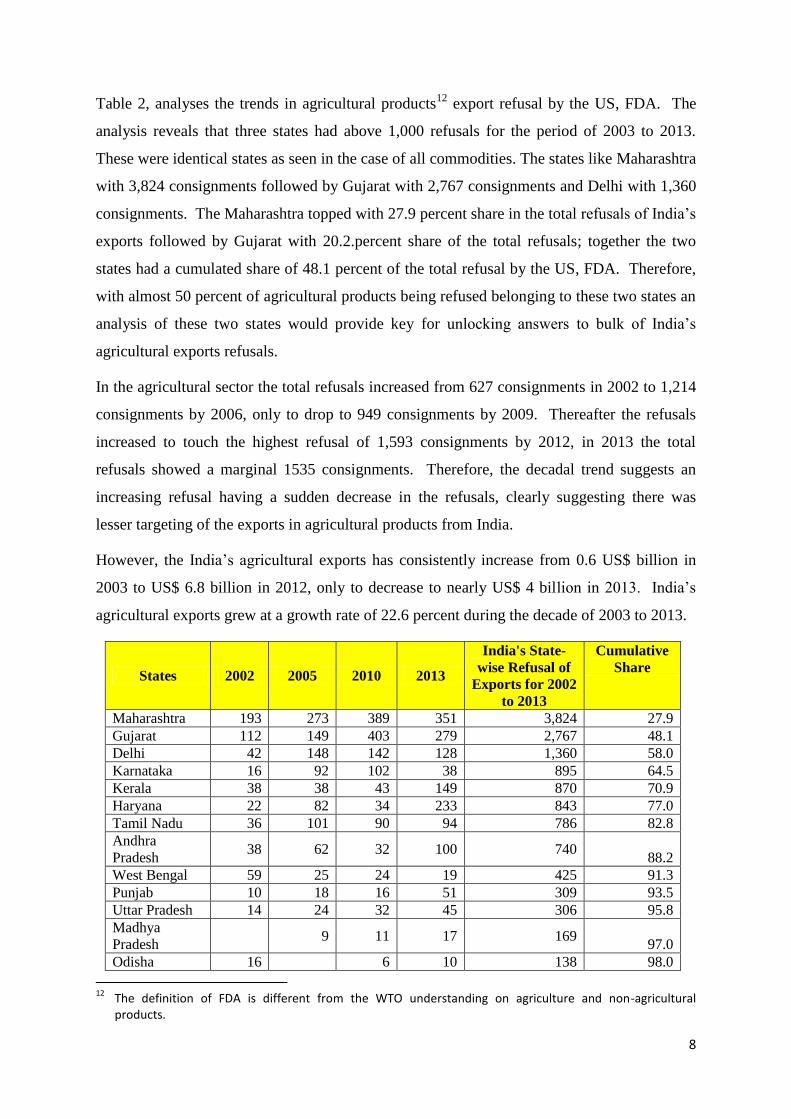
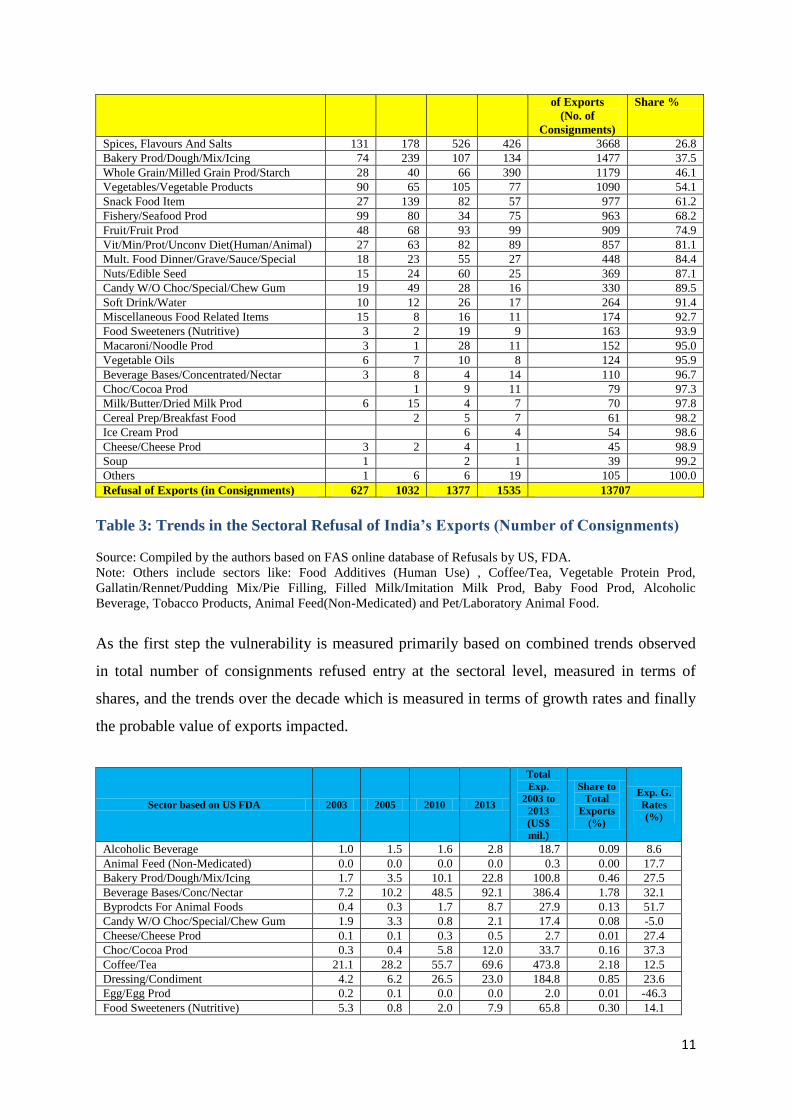
Table 2, analyses the trends in agricultural products12
export refusal by the US, FDA. The
analysis reveals that three states had above 1,000 refusals for the period of 2003 to 2013.
These were identical states as seen in the case of all commodities. The states like Maharashtra
with 3,824 consignments followed by Gujarat with 2,767 consignments and Delhi with 1,360
consignments. The Maharashtra topped with 27.9 percent share in the total refusals of India’s
exports followed by Gujarat with 20.2.percent share of the total refusals; together the two
states had a cumulated share of 48.1 percent of the total refusal by the US, FDA. Therefore,
with almost 50 percent of agricultural products being refused belonging to these two states an
analysis of these two states would provide key for unlocking answers to bulk of India’s
agricultural exports refusals.
In the agricultural sector the total refusals increased from 627 consignments in 2002 to 1,214
consignments by 2006, only to drop to 949 consignments by 2009. Thereafter the refusals
increased to touch the highest refusal of 1,593 consignments by 2012, in 2013 the total
refusals showed a marginal 1535 consignments. Therefore, the decadal trend suggests an
increasing refusal having a sudden decrease in the refusals, clearly suggesting there was
lesser targeting of the exports in agricultural products from India.
However, the India’s agricultural exports has consistently increase from 0.6 US$ billion in
2003 to US$ 6.8 billion in 2012, only to decrease to nearly US$ 4 billion in 2013. India’s
agricultural exports grew at a growth rate of 22.6 percent during the decade of 2003 to 2013.
States 2002 2005 2010 2013
India's State-
wise Refusal of
Exports for 2002
to 2013
Cumulative
Share
Maharashtra 193 273 389 351 3,824 27.9
Gujarat 112 149 403 279 2,767 48.1
Delhi 42 148 142 128 1,360 58.0
Karnataka 16 92 102 38 895 64.5
Kerala 38 38 43 149 870 70.9
Haryana 22 82 34 233 843 77.0
Tamil Nadu 36 101 90 94 786 82.8
Andhra
Pradesh 38 62 32 100 740
88.2
West Bengal 59 25 24 19 425 91.3
Punjab 10 18 16 51 309 93.5
Uttar Pradesh 14 24 32 45 306 95.8
Madhya
Pradesh 9 11 17 169
97.0
Odisha 16
6 10 138 98.0
12
The definition of FDA is different from the WTO understanding on agriculture and non-agricultural products.
9
Rajasthan 1 10 18 11 83 98.6
Chandigarh 28
11
81 99.2
Uttarakhand
13 6 50 99.6
Others 2 1 11 4 61
India's
Refusal of
Exports
627 1,032 1,377 1,535 13,707
Table 2: Trends in the State-Wise Refusal of India’s Exports to the US (Number of
Consignments) Source: Compiled by the authors based on FAS online database of Refusals by US, FDA.
Note: Other include states like Goa, Himachal Pradesh, Puducherry, Dadra & Nagar Haveli, Jammu &
Kashmir, Bihar, Sikkim and unknown.
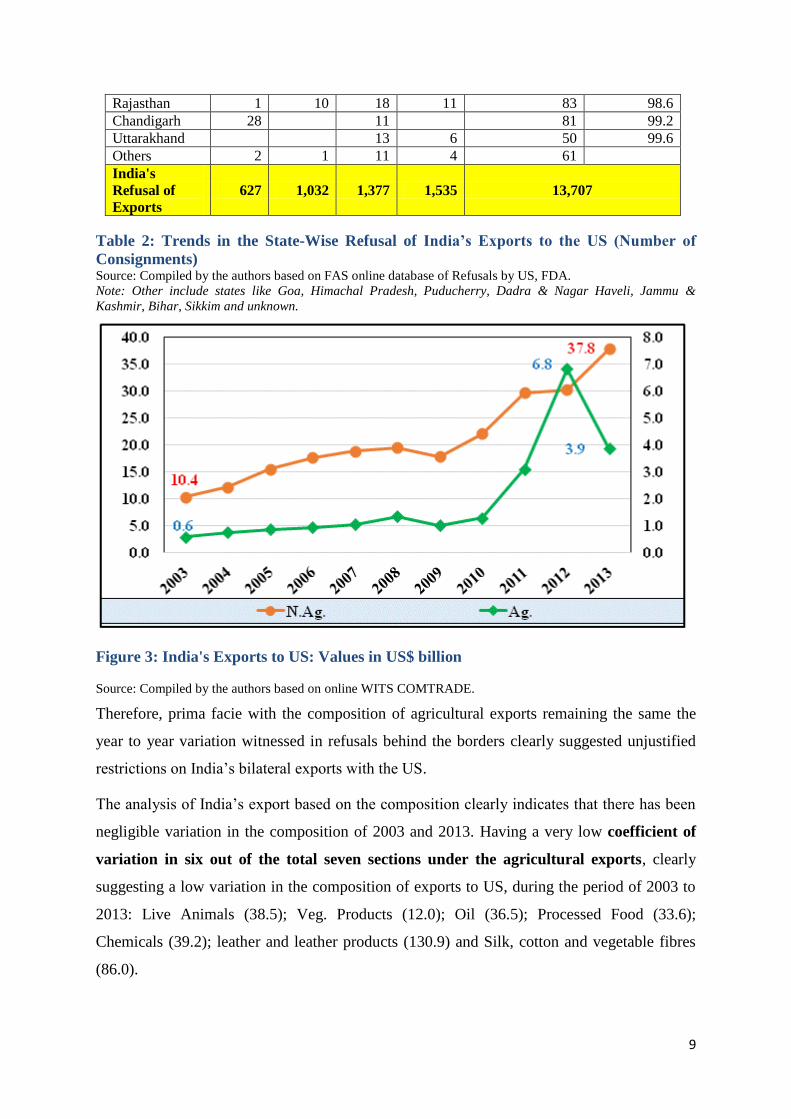
Figure 3: India's Exports to US: Values in US$ billion
Source: Compiled by the authors based on online WITS COMTRADE.
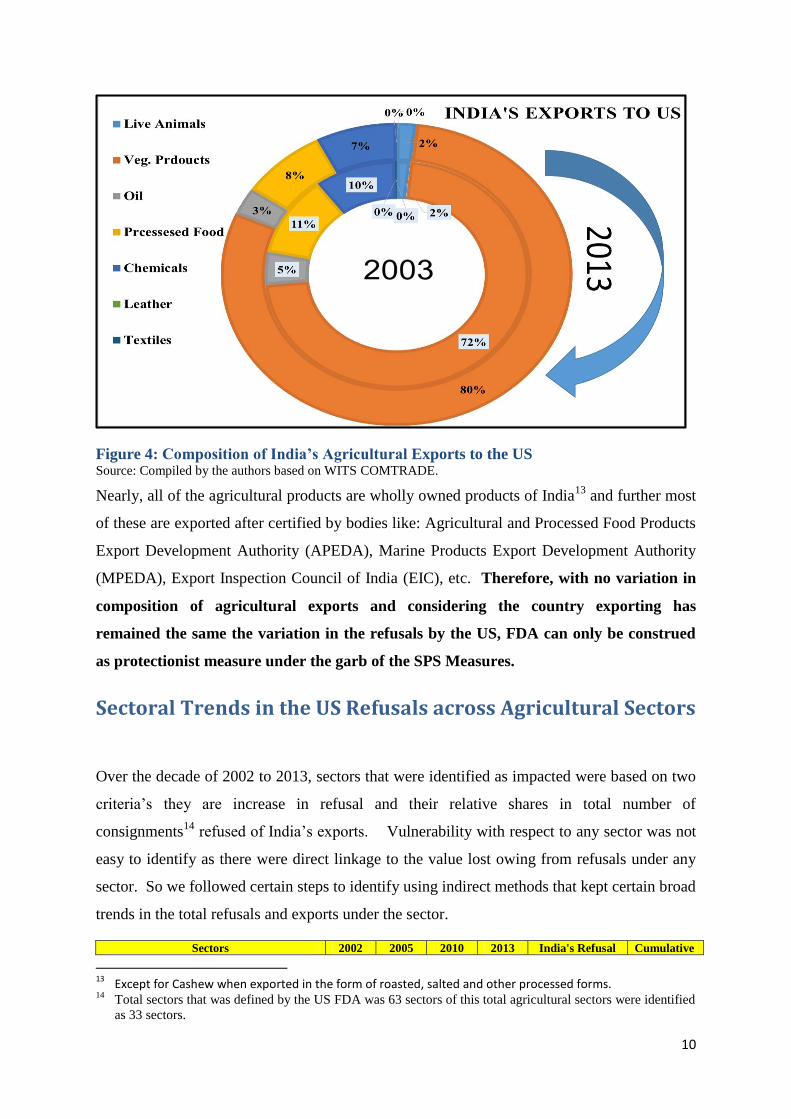
Therefore, prima facie with the composition of agricultural exports remaining the same the
year to year variation witnessed in refusals behind the borders clearly suggested unjustified
restrictions on India’s bilateral exports with the US.
The analysis of India’s export based on the composition clearly indicates that there has been
negligible variation in the composition of 2003 and 2013. Having a very low coefficient of
variation in six out of the total seven sections under the agricultural exports, clearly
suggesting a low variation in the composition of exports to US, during the period of 2003 to
2013: Live Animals (38.5); Veg. Products (12.0); Oil (36.5); Processed Food (33.6);
Chemicals (39.2); leather and leather products (130.9) and Silk, cotton and vegetable fibres
(86.0).
10
Figure 4: Composition of India’s Agricultural Exports to the US Source: Compiled by the authors based on WITS COMTRADE.
Nearly, all of the agricultural products are wholly owned products of India13
and further most
of these are exported after certified by bodies like: Agricultural and Processed Food Products
Export Development Authority (APEDA), Marine Products Export Development Authority
(MPEDA), Export Inspection Council of India (EIC), etc. Therefore, with no variation in
composition of agricultural exports and considering the country exporting has
remained the same the variation in the refusals by the US, FDA can only be construed
as protectionist measure under the garb of the SPS Measures.
Sectoral Trends in the US Refusals across Agricultural Sectors
Over the decade of 2002 to 2013, sectors that were identified as impacted were based on two
criteria’s they are increase in refusal and their relative shares in total number of
consignments14
refused of India’s exports. Vulnerability with respect to any sector was not
easy to identify as there were direct linkage to the value lost owing from refusals under any
sector. So we followed certain steps to identify using indirect methods that kept certain broad
trends in the total refusals and exports under the sector.
Sectors 2002 2005 2010 2013 India's Refusal Cumulative
13
Except for Cashew when exported in the form of roasted, salted and other processed forms. 14
Total sectors that was defined by the US FDA was 63 sectors of this total agricultural sectors were identified
as 33 sectors.
11
of Exports
(No. of
Consignments)
Share %
Spices, Flavours And Salts 131 178 526 426 3668 26.8
Bakery Prod/Dough/Mix/Icing 74 239 107 134 1477 37.5
Whole Grain/Milled Grain Prod/Starch 28 40 66 390 1179 46.1
Vegetables/Vegetable Products 90 65 105 77 1090 54.1
Snack Food Item 27 139 82 57 977 61.2
Fishery/Seafood Prod 99 80 34 75 963 68.2
Fruit/Fruit Prod 48 68 93 99 909 74.9
Vit/Min/Prot/Unconv Diet(Human/Animal) 27 63 82 89 857 81.1
Mult. Food Dinner/Grave/Sauce/Special 18 23 55 27 448 84.4
Nuts/Edible Seed 15 24 60 25 369 87.1
Candy W/O Choc/Special/Chew Gum 19 49 28 16 330 89.5
Soft Drink/Water 10 12 26 17 264 91.4
Miscellaneous Food Related Items 15 8 16 11 174 92.7
Food Sweeteners (Nutritive) 3 2 19 9 163 93.9
Macaroni/Noodle Prod 3 1 28 11 152 95.0
Vegetable Oils 6 7 10 8 124 95.9
Beverage Bases/Concentrated/Nectar 3 8 4 14 110 96.7
Choc/Cocoa Prod 1 9 11 79 97.3
Milk/Butter/Dried Milk Prod 6 15 4 7 70 97.8
Cereal Prep/Breakfast Food 2 5 7 61 98.2
Ice Cream Prod 6 4 54 98.6
Cheese/Cheese Prod 3 2 4 1 45 98.9
Soup 1 2 1 39 99.2
Others 1 6 6 19 105 100.0
Refusal of Exports (in Consignments) 627 1032 1377 1535 13707
Table 3: Trends in the Sectoral Refusal of India’s Exports (Number of Consignments)
Source: Compiled by the authors based on FAS online database of Refusals by US, FDA.
Note: Others include sectors like: Food Additives (Human Use) , Coffee/Tea, Vegetable Protein Prod,
Gallatin/Rennet/Pudding Mix/Pie Filling, Filled Milk/Imitation Milk Prod, Baby Food Prod, Alcoholic
Beverage, Tobacco Products, Animal Feed(Non-Medicated) and Pet/Laboratory Animal Food.
As the first step the vulnerability is measured primarily based on combined trends observed
in total number of consignments refused entry at the sectoral level, measured in terms of
shares, and the trends over the decade which is measured in terms of growth rates and finally
the probable value of exports impacted.
Sector based on US FDA 2003 2005 2010 2013
Total
Exp.
2003 to
2013
(US$
mil.)
Share to
Total
Exports
(%)
Exp. G.
Rates
(%)
Alcoholic Beverage 1.0 1.5 1.6 2.8 18.7 0.09 8.6
Animal Feed (Non-Medicated) 0.0 0.0 0.0 0.0 0.3 0.00 17.7
Bakery Prod/Dough/Mix/Icing 1.7 3.5 10.1 22.8 100.8 0.46 27.5
Beverage Bases/Conc/Nectar 7.2 10.2 48.5 92.1 386.4 1.78 32.1
Byprodcts For Animal Foods 0.4 0.3 1.7 8.7 27.9 0.13 51.7
Candy W/O Choc/Special/Chew Gum 1.9 3.3 0.8 2.1 17.4 0.08 -5.0
Cheese/Cheese Prod 0.1 0.1 0.3 0.5 2.7 0.01 27.4
Choc/Cocoa Prod 0.3 0.4 5.8 12.0 33.7 0.16 37.3
Coffee/Tea 21.1 28.2 55.7 69.6 473.8 2.18 12.5
Dressing/Condiment 4.2 6.2 26.5 23.0 184.8 0.85 23.6
Egg/Egg Prod 0.2 0.1 0.0 0.0 2.0 0.01 -46.3
Food Sweeteners (Nutritive) 5.3 0.8 2.0 7.9 65.8 0.30 14.1
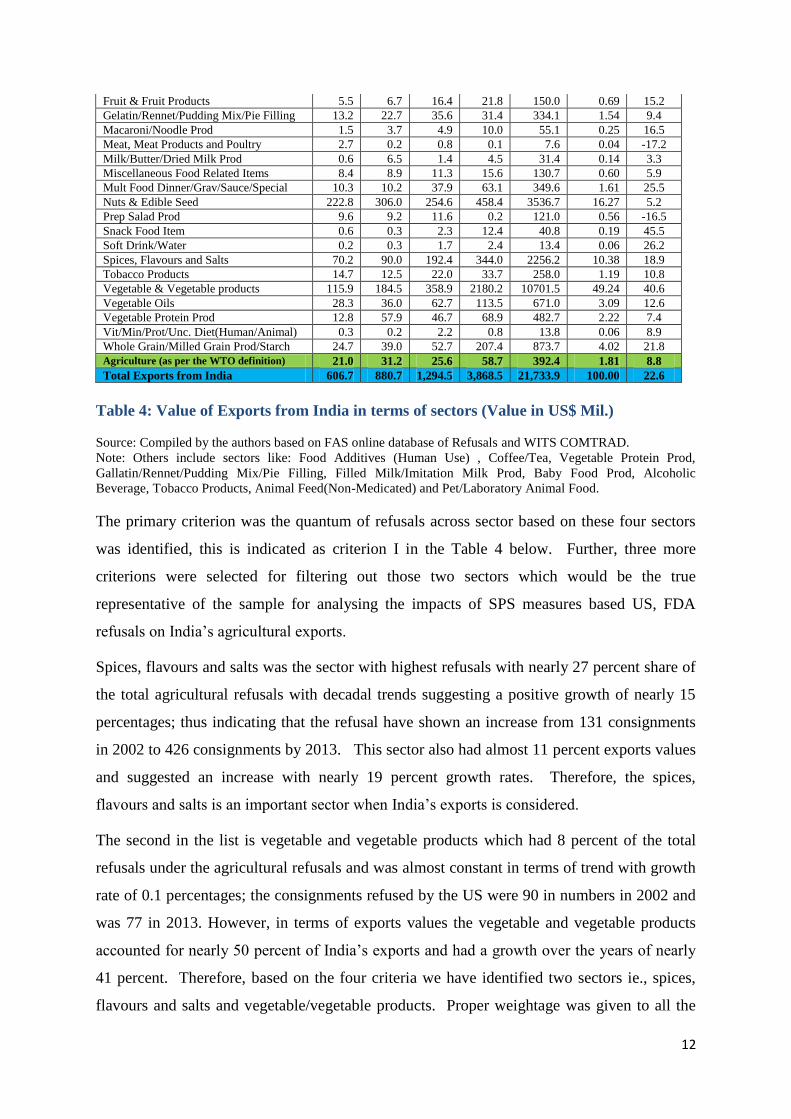
12
Fruit & Fruit Products 5.5 6.7 16.4 21.8 150.0 0.69 15.2
Gelatin/Rennet/Pudding Mix/Pie Filling 13.2 22.7 35.6 31.4 334.1 1.54 9.4
Macaroni/Noodle Prod 1.5 3.7 4.9 10.0 55.1 0.25 16.5
Meat, Meat Products and Poultry 2.7 0.2 0.8 0.1 7.6 0.04 -17.2
Milk/Butter/Dried Milk Prod 0.6 6.5 1.4 4.5 31.4 0.14 3.3
Miscellaneous Food Related Items 8.4 8.9 11.3 15.6 130.7 0.60 5.9
Mult Food Dinner/Grav/Sauce/Special 10.3 10.2 37.9 63.1 349.6 1.61 25.5
Nuts & Edible Seed 222.8 306.0 254.6 458.4 3536.7 16.27 5.2
Prep Salad Prod 9.6 9.2 11.6 0.2 121.0 0.56 -16.5
Snack Food Item 0.6 0.3 2.3 12.4 40.8 0.19 45.5
Soft Drink/Water 0.2 0.3 1.7 2.4 13.4 0.06 26.2
Spices, Flavours and Salts 70.2 90.0 192.4 344.0 2256.2 10.38 18.9
Tobacco Products 14.7 12.5 22.0 33.7 258.0 1.19 10.8
Vegetable & Vegetable products 115.9 184.5 358.9 2180.2 10701.5 49.24 40.6
Vegetable Oils 28.3 36.0 62.7 113.5 671.0 3.09 12.6
Vegetable Protein Prod 12.8 57.9 46.7 68.9 482.7 2.22 7.4
Vit/Min/Prot/Unc. Diet(Human/Animal) 0.3 0.2 2.2 0.8 13.8 0.06 8.9
Whole Grain/Milled Grain Prod/Starch 24.7 39.0 52.7 207.4 873.7 4.02 21.8
Agriculture (as per the WTO definition) 21.0 31.2 25.6 58.7 392.4 1.81 8.8
Total Exports from India 606.7 880.7 1,294.5 3,868.5 21,733.9 100.00 22.6
Table 4: Value of Exports from India in terms of sectors (Value in US$ Mil.)
Source: Compiled by the authors based on FAS online database of Refusals and WITS COMTRAD.
Note: Others include sectors like: Food Additives (Human Use) , Coffee/Tea, Vegetable Protein Prod,
Gallatin/Rennet/Pudding Mix/Pie Filling, Filled Milk/Imitation Milk Prod, Baby Food Prod, Alcoholic
Beverage, Tobacco Products, Animal Feed(Non-Medicated) and Pet/Laboratory Animal Food.
The primary criterion was the quantum of refusals across sector based on these four sectors
was identified, this is indicated as criterion I in the Table 4 below. Further, three more
criterions were selected for filtering out those two sectors which would be the true
representative of the sample for analysing the impacts of SPS measures based US, FDA
refusals on India’s agricultural exports.
Spices, flavours and salts was the sector with highest refusals with nearly 27 percent share of
the total agricultural refusals with decadal trends suggesting a positive growth of nearly 15
percentages; thus indicating that the refusal have shown an increase from 131 consignments
in 2002 to 426 consignments by 2013. This sector also had almost 11 percent exports values
and suggested an increase with nearly 19 percent growth rates. Therefore, the spices,
flavours and salts is an important sector when India’s exports is considered.
The second in the list is vegetable and vegetable products which had 8 percent of the total
refusals under the agricultural refusals and was almost constant in terms of trend with growth
rate of 0.1 percentages; the consignments refused by the US were 90 in numbers in 2002 and
was 77 in 2013. However, in terms of exports values the vegetable and vegetable products
accounted for nearly 50 percent of India’s exports and had a growth over the years of nearly
41 percent. Therefore, based on the four criteria we have identified two sectors ie., spices,
flavours and salts and vegetable/vegetable products. Proper weightage was given to all the
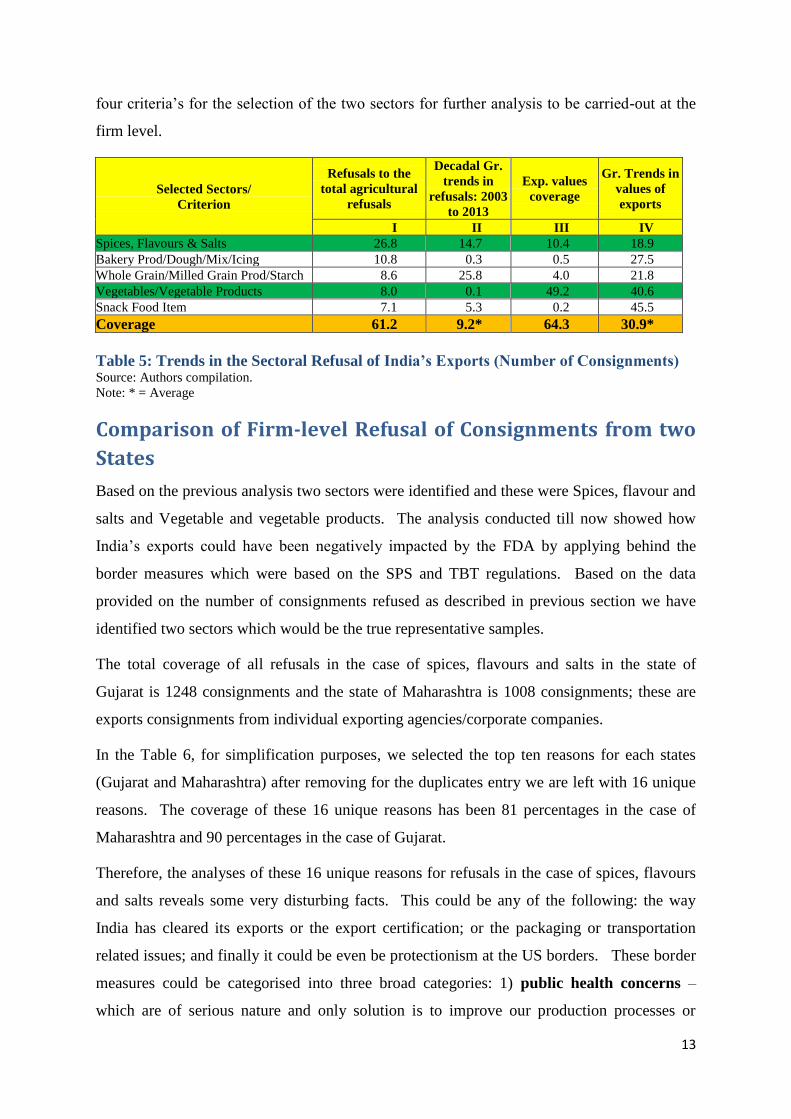
13
four criteria’s for the selection of the two sectors for further analysis to be carried-out at the
firm level.
Selected Sectors/
Criterion
Refusals to the
total agricultural
refusals
Decadal Gr.
trends in
refusals: 2003
to 2013
Exp. values
coverage
Gr. Trends in
values of
exports
I II III IV
Spices, Flavours & Salts 26.8 14.7 10.4 18.9
Bakery Prod/Dough/Mix/Icing 10.8 0.3 0.5 27.5
Whole Grain/Milled Grain Prod/Starch 8.6 25.8 4.0 21.8
Vegetables/Vegetable Products 8.0 0.1 49.2 40.6
Snack Food Item 7.1 5.3 0.2 45.5
Coverage 61.2 9.2* 64.3 30.9*
Table 5: Trends in the Sectoral Refusal of India’s Exports (Number of Consignments) Source: Authors compilation. Note: * = Average
Comparison of Firm-level Refusal of Consignments from two
States
Based on the previous analysis two sectors were identified and these were Spices, flavour and
salts and Vegetable and vegetable products. The analysis conducted till now showed how
India’s exports could have been negatively impacted by the FDA by applying behind the
border measures which were based on the SPS and TBT regulations. Based on the data
provided on the number of consignments refused as described in previous section we have
identified two sectors which would be the true representative samples.
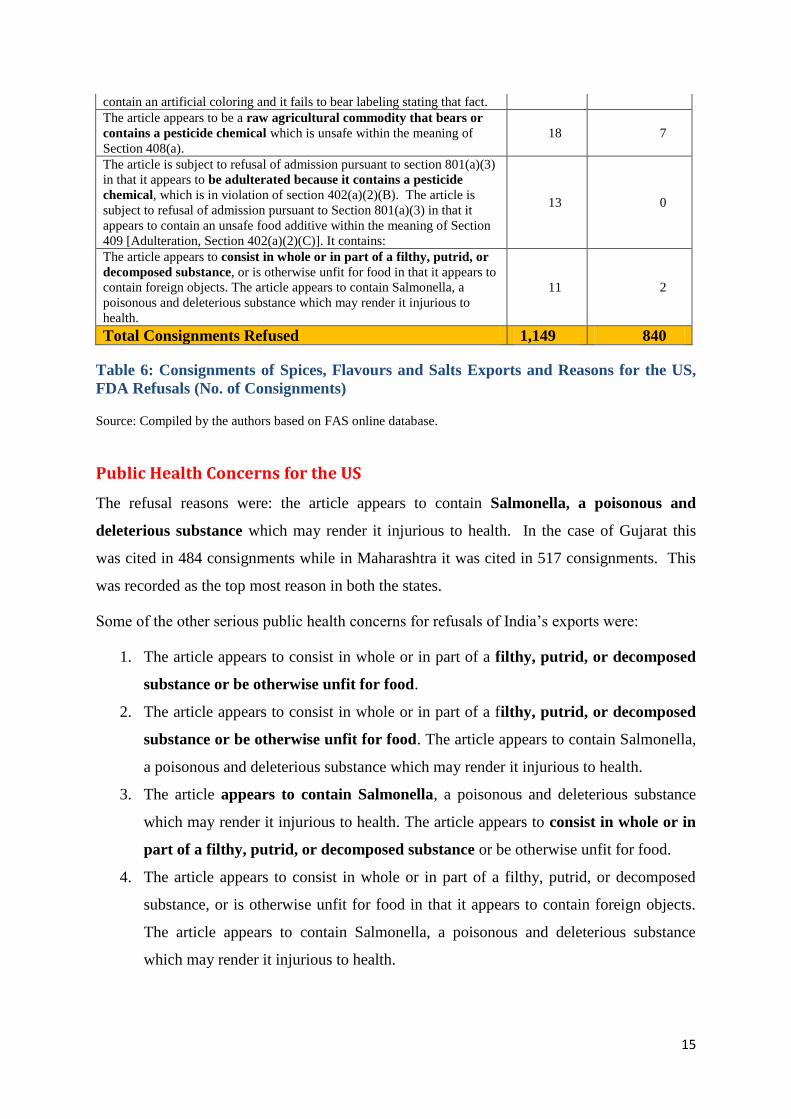
The total coverage of all refusals in the case of spices, flavours and salts in the state of
Gujarat is 1248 consignments and the state of Maharashtra is 1008 consignments; these are
exports consignments from individual exporting agencies/corporate companies.
In the Table 6, for simplification purposes, we selected the top ten reasons for each states
(Gujarat and Maharashtra) after removing for the duplicates entry we are left with 16 unique
reasons. The coverage of these 16 unique reasons has been 81 percentages in the case of
Maharashtra and 90 percentages in the case of Gujarat.
Therefore, the analyses of these 16 unique reasons for refusals in the case of spices, flavours
and salts reveals some very disturbing facts. This could be any of the following: the way
India has cleared its exports or the export certification; or the packaging or transportation
related issues; and finally it could be even be protectionism at the US borders. These border
measures could be categorised into three broad categories: 1) public health concerns –
which are of serious nature and only solution is to improve our production processes or
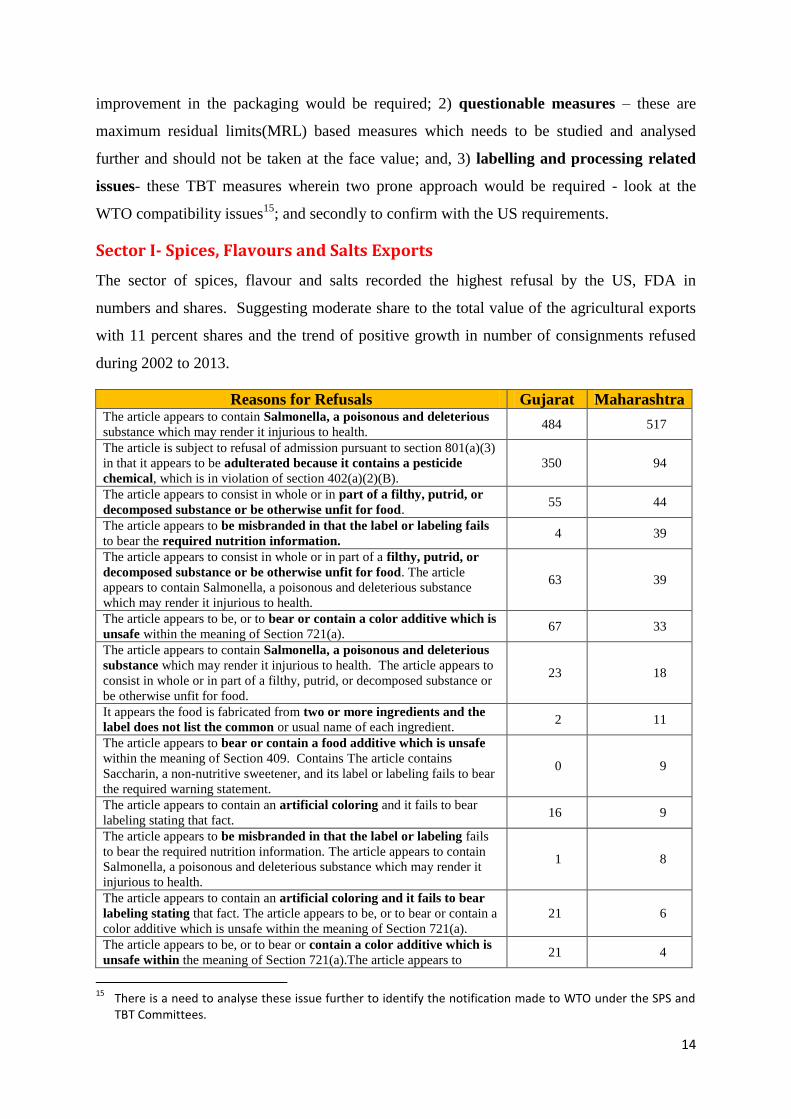
14
improvement in the packaging would be required; 2) questionable measures – these are
maximum residual limits(MRL) based measures which needs to be studied and analysed
further and should not be taken at the face value; and, 3) labelling and processing related
issues- these TBT measures wherein two prone approach would be required - look at the
WTO compatibility issues15
; and secondly to confirm with the US requirements.
Sector I- Spices, Flavours and Salts Exports
The sector of spices, flavour and salts recorded the highest refusal by the US, FDA in
numbers and shares. Suggesting moderate share to the total value of the agricultural exports
with 11 percent shares and the trend of positive growth in number of consignments refused
during 2002 to 2013.
Reasons for Refusals Gujarat Maharashtra The article appears to contain Salmonella, a poisonous and deleterious
substance which may render it injurious to health. 484 517
The article is subject to refusal of admission pursuant to section 801(a)(3)
in that it appears to be adulterated because it contains a pesticide
chemical, which is in violation of section 402(a)(2)(B).
350 94
The article appears to consist in whole or in part of a filthy, putrid, or
decomposed substance or be otherwise unfit for food. 55 44
The article appears to be misbranded in that the label or labeling fails
to bear the required nutrition information. 4 39
The article appears to consist in whole or in part of a filthy, putrid, or
decomposed substance or be otherwise unfit for food. The article
appears to contain Salmonella, a poisonous and deleterious substance
which may render it injurious to health.
63 39
The article appears to be, or to bear or contain a color additive which is
unsafe within the meaning of Section 721(a). 67 33
The article appears to contain Salmonella, a poisonous and deleterious
substance which may render it injurious to health. The article appears to
consist in whole or in part of a filthy, putrid, or decomposed substance or
be otherwise unfit for food.
23 18
It appears the food is fabricated from two or more ingredients and the
label does not list the common or usual name of each ingredient. 2 11
The article appears to bear or contain a food additive which is unsafe
within the meaning of Section 409. Contains The article contains
Saccharin, a non-nutritive sweetener, and its label or labeling fails to bear
the required warning statement.
0 9
The article appears to contain an artificial coloring and it fails to bear
labeling stating that fact. 16 9
The article appears to be misbranded in that the label or labeling fails
to bear the required nutrition information. The article appears to contain
Salmonella, a poisonous and deleterious substance which may render it
injurious to health.
1 8
The article appears to contain an artificial coloring and it fails to bear
labeling stating that fact. The article appears to be, or to bear or contain a
color additive which is unsafe within the meaning of Section 721(a).
21 6
The article appears to be, or to bear or contain a color additive which is
unsafe within the meaning of Section 721(a).The article appears to 21 4
15
There is a need to analyse these issue further to identify the notification made to WTO under the SPS and TBT Committees.
15
contain an artificial coloring and it fails to bear labeling stating that fact.
The article appears to be a raw agricultural commodity that bears or
contains a pesticide chemical which is unsafe within the meaning of
Section 408(a).
18 7
The article is subject to refusal of admission pursuant to section 801(a)(3)
in that it appears to be adulterated because it contains a pesticide
chemical, which is in violation of section 402(a)(2)(B). The article is
subject to refusal of admission pursuant to Section 801(a)(3) in that it
appears to contain an unsafe food additive within the meaning of Section
409 [Adulteration, Section 402(a)(2)(C)]. It contains:
13 0
The article appears to consist in whole or in part of a filthy, putrid, or
decomposed substance, or is otherwise unfit for food in that it appears to
contain foreign objects. The article appears to contain Salmonella, a
poisonous and deleterious substance which may render it injurious to
health.
11 2
Total Consignments Refused 1,149 840
Table 6: Consignments of Spices, Flavours and Salts Exports and Reasons for the US,
FDA Refusals (No. of Consignments)
Source: Compiled by the authors based on FAS online database.
Public Health Concerns for the US
The refusal reasons were: the article appears to contain Salmonella, a poisonous and
deleterious substance which may render it injurious to health. In the case of Gujarat this
was cited in 484 consignments while in Maharashtra it was cited in 517 consignments. This
was recorded as the top most reason in both the states.
Some of the other serious public health concerns for refusals of India’s exports were:
1. The article appears to consist in whole or in part of a filthy, putrid, or decomposed
substance or be otherwise unfit for food.
2. The article appears to consist in whole or in part of a filthy, putrid, or decomposed
substance or be otherwise unfit for food. The article appears to contain Salmonella,
a poisonous and deleterious substance which may render it injurious to health.
3. The article appears to contain Salmonella, a poisonous and deleterious substance
which may render it injurious to health. The article appears to consist in whole or in
part of a filthy, putrid, or decomposed substance or be otherwise unfit for food.
4. The article appears to consist in whole or in part of a filthy, putrid, or decomposed
substance, or is otherwise unfit for food in that it appears to contain foreign objects.
The article appears to contain Salmonella, a poisonous and deleterious substance
which may render it injurious to health.
16
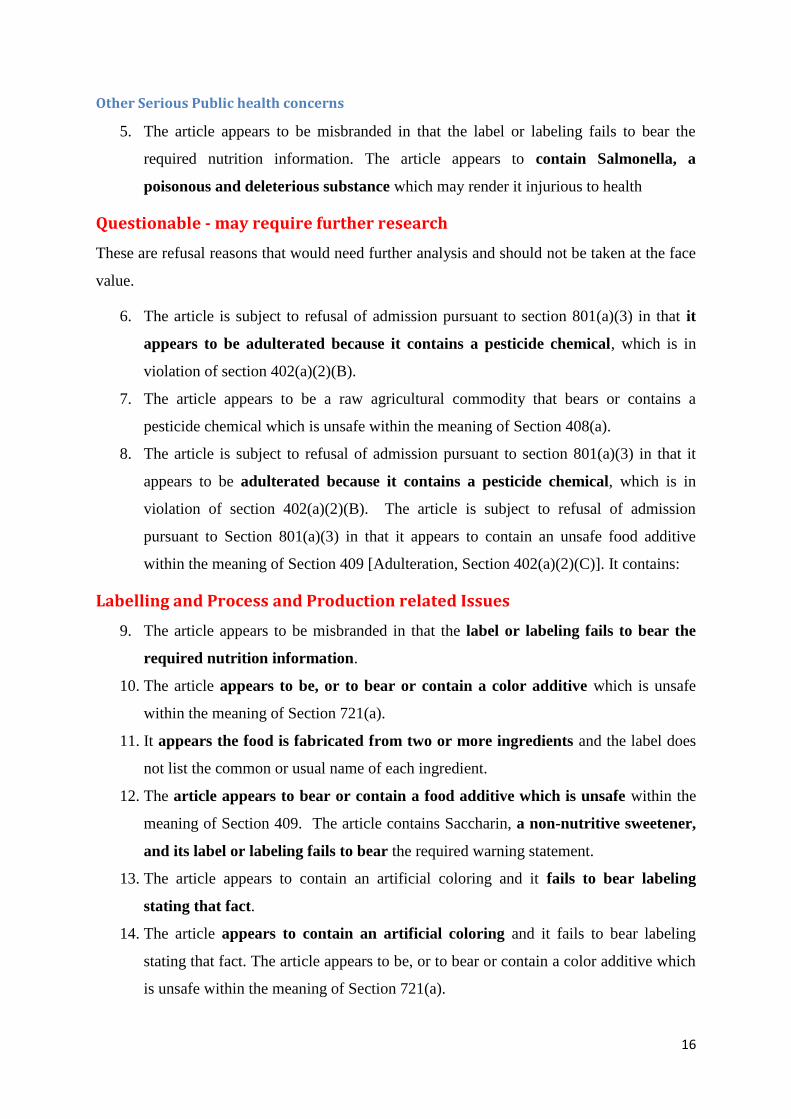
Other Serious Public health concerns
5. The article appears to be misbranded in that the label or labeling fails to bear the
required nutrition information. The article appears to contain Salmonella, a
poisonous and deleterious substance which may render it injurious to health
Questionable - may require further research
These are refusal reasons that would need further analysis and should not be taken at the face
value.
6. The article is subject to refusal of admission pursuant to section 801(a)(3) in that it
appears to be adulterated because it contains a pesticide chemical, which is in
violation of section 402(a)(2)(B).
7. The article appears to be a raw agricultural commodity that bears or contains a
pesticide chemical which is unsafe within the meaning of Section 408(a).
8. The article is subject to refusal of admission pursuant to section 801(a)(3) in that it
appears to be adulterated because it contains a pesticide chemical, which is in
violation of section 402(a)(2)(B). The article is subject to refusal of admission
pursuant to Section 801(a)(3) in that it appears to contain an unsafe food additive
within the meaning of Section 409 [Adulteration, Section 402(a)(2)(C)]. It contains:
Labelling and Process and Production related Issues
9. The article appears to be misbranded in that the label or labeling fails to bear the
required nutrition information.
10. The article appears to be, or to bear or contain a color additive which is unsafe
within the meaning of Section 721(a).
11. It appears the food is fabricated from two or more ingredients and the label does
not list the common or usual name of each ingredient.
12. The article appears to bear or contain a food additive which is unsafe within the
meaning of Section 409. The article contains Saccharin, a non-nutritive sweetener,
and its label or labeling fails to bear the required warning statement.
13. The article appears to contain an artificial coloring and it fails to bear labeling
stating that fact.
14. The article appears to contain an artificial coloring and it fails to bear labeling
stating that fact. The article appears to be, or to bear or contain a color additive which
is unsafe within the meaning of Section 721(a).
17
15. The article appears to be, or to bear or contain a color additive which is unsafe
within the meaning of Section 721(a).The article appears to contain an artificial
coloring and it fails to bear labeling stating that fact.
To summarise the spices, flavours and salts have shown relatively high cases of public health
concern for the US market. It appears to be dangerous to argue that these are minor offences
and may be corrected with proper packaging solutions. The labelling and process and
production related issues itself stands to be a major issue when it comes to the refusals. So as
the issues of packing are streamlined the prevalence of these refusal in the future may come
down.
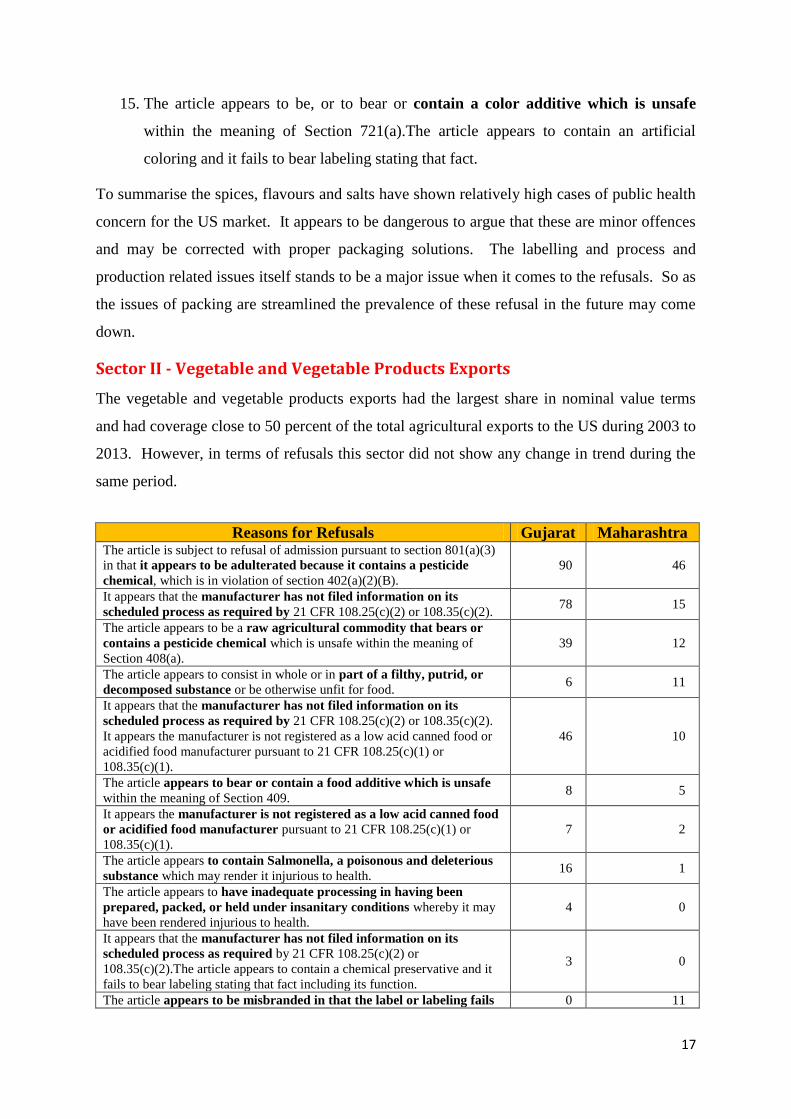
Sector II - Vegetable and Vegetable Products Exports
The vegetable and vegetable products exports had the largest share in nominal value terms
and had coverage close to 50 percent of the total agricultural exports to the US during 2003 to
2013. However, in terms of refusals this sector did not show any change in trend during the
same period.
Reasons for Refusals Gujarat Maharashtra The article is subject to refusal of admission pursuant to section 801(a)(3)
in that it appears to be adulterated because it contains a pesticide
chemical, which is in violation of section 402(a)(2)(B).
90 46
It appears that the manufacturer has not filed information on its
scheduled process as required by 21 CFR 108.25(c)(2) or 108.35(c)(2). 78 15
The article appears to be a raw agricultural commodity that bears or
contains a pesticide chemical which is unsafe within the meaning of
Section 408(a).
39 12
The article appears to consist in whole or in part of a filthy, putrid, or
decomposed substance or be otherwise unfit for food. 6 11
It appears that the manufacturer has not filed information on its
scheduled process as required by 21 CFR 108.25(c)(2) or 108.35(c)(2).
It appears the manufacturer is not registered as a low acid canned food or
acidified food manufacturer pursuant to 21 CFR 108.25(c)(1) or
108.35(c)(1).
46 10
The article appears to bear or contain a food additive which is unsafe
within the meaning of Section 409. 8 5
It appears the manufacturer is not registered as a low acid canned food
or acidified food manufacturer pursuant to 21 CFR 108.25(c)(1) or
108.35(c)(1).
7 2
The article appears to contain Salmonella, a poisonous and deleterious
substance which may render it injurious to health. 16 1
The article appears to have inadequate processing in having been
prepared, packed, or held under insanitary conditions whereby it may
have been rendered injurious to health.
4 0
It appears that the manufacturer has not filed information on its
scheduled process as required by 21 CFR 108.25(c)(2) or
108.35(c)(2).The article appears to contain a chemical preservative and it
fails to bear labeling stating that fact including its function.
3 0
The article appears to be misbranded in that the label or labeling fails 0 11
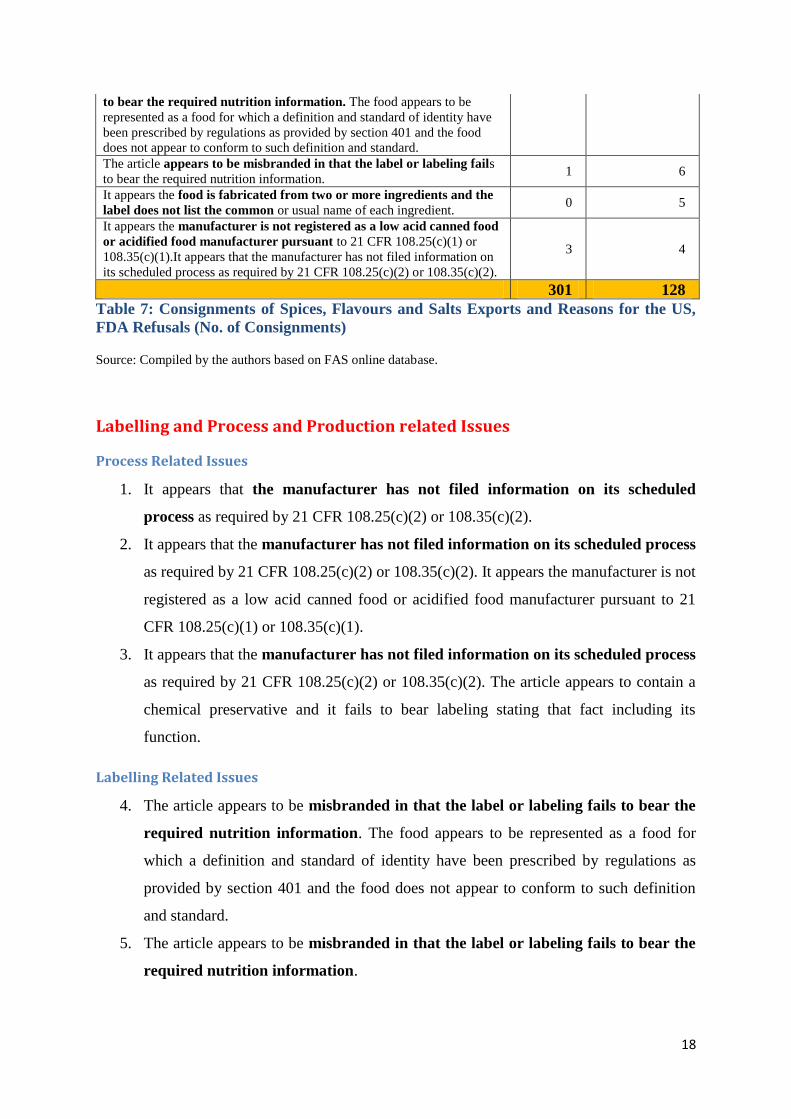
18
to bear the required nutrition information. The food appears to be
represented as a food for which a definition and standard of identity have
been prescribed by regulations as provided by section 401 and the food
does not appear to conform to such definition and standard.
The article appears to be misbranded in that the label or labeling fails
to bear the required nutrition information. 1 6
It appears the food is fabricated from two or more ingredients and the
label does not list the common or usual name of each ingredient. 0 5
It appears the manufacturer is not registered as a low acid canned food
or acidified food manufacturer pursuant to 21 CFR 108.25(c)(1) or
108.35(c)(1).It appears that the manufacturer has not filed information on
its scheduled process as required by 21 CFR 108.25(c)(2) or 108.35(c)(2).
3 4
301 128
Table 7: Consignments of Spices, Flavours and Salts Exports and Reasons for the US,
FDA Refusals (No. of Consignments)
Source: Compiled by the authors based on FAS online database.
Labelling and Process and Production related Issues
Process Related Issues
1. It appears that the manufacturer has not filed information on its scheduled
process as required by 21 CFR 108.25(c)(2) or 108.35(c)(2).
2. It appears that the manufacturer has not filed information on its scheduled process
as required by 21 CFR 108.25(c)(2) or 108.35(c)(2). It appears the manufacturer is not
registered as a low acid canned food or acidified food manufacturer pursuant to 21
CFR 108.25(c)(1) or 108.35(c)(1).
3. It appears that the manufacturer has not filed information on its scheduled process
as required by 21 CFR 108.25(c)(2) or 108.35(c)(2). The article appears to contain a
chemical preservative and it fails to bear labeling stating that fact including its
function.
Labelling Related Issues
4. The article appears to be misbranded in that the label or labeling fails to bear the
required nutrition information. The food appears to be represented as a food for
which a definition and standard of identity have been prescribed by regulations as
provided by section 401 and the food does not appear to conform to such definition
and standard.
5. The article appears to be misbranded in that the label or labeling fails to bear the
required nutrition information.
19
6. It appears the food is fabricated from two or more ingredients and the label does
not list the common or usual name of each ingredient.
Packaging Related Issue
7. The article appears to consist in whole or in part of a filthy, putrid, or decomposed
substance or be otherwise unfit for food.
8. It appears the manufacturer is not registered as a low acid canned food or
acidified food manufacturer pursuant to 21 CFR 108.25(c)(1) or 108.35(c)(1).
9. The article appears to have inadequate processing in having been prepared,
packed, or held under insanitary conditions whereby it may have been rendered
injurious to health.
10. It appears the manufacturer is not registered as a low acid canned food or
acidified food manufacturer pursuant to 21 CFR 108.25(c)(1) or 108.35(c)(1).It
appears that the manufacturer has not filed information on its scheduled process as
required by 21 CFR 108.25(c)(2) or 108.35(c)(2).
Public Health Concerns for the US
11. The article appears to contain Salmonella, a poisonous and deleterious substance
which may render it injurious to health.
Questionable - may require further research
12. The article is subject to refusal of admission pursuant to section 801(a)(3) in that it
appears to be adulterated because it contains a pesticide chemical, which is in
violation of section 402(a)(2)(B).
13. The article appears to be a raw agricultural commodity that bears or contains a
pesticide chemical which is unsafe within the meaning of Section 408(a).
14. The article appears to bear or contain a food additive which is unsafe within the
meaning of Section 409.
To summarise in the section of vegetable and vegetable products reasons for refusal of export
from India’s top two states at the prima-facia seems not of serious nature. As 16
consignments which belonged to Gujarat and one consignment of Maharashtra appears to
contain salmonella, a poisonous and deleterious substance which may render it injurious to
health where found as reasons; this was only one of the 14 reasons. While close to 13
reasons for refusals are manageable by way of packaging solutions.
20
By way of Conclusion
This paper clearly establishes that there is substantial coverage of exports which is refused.
From across the global, the top three countries which recorded consignment refusal were
Mexico with 84.7 thousand consignments refused, followed by China with 23.5 thousand and
marginally below it was India with 23.3 thousand consignments refused. The total US FDA
refusals have increased at exponential growth rate of 5.4 percent; there has been particularly
negative impact on the agricultural and allied sectors refusal which has seen almost 8 percent.
Eight states of India had above 1,000 refusals for the period of 2003 to 2013. These states are
Maharashtra with 6,333 consignments followed by Gujarat with 3,787 consignments, Delhi
with 2,133 consignments, Karnataka with 1,902 consignments, Andhra Pradesh with 1,544
consignments, Tamil Nadu with 1,330 consignments, Haryana with 1,140 consignments and
Kerala with 1,108 consignments.
While ranking the Maharashtra topped with 6,333 consignments refused and having 28.4
percent share in the total followed by Gujarat with 3,787 consignments refused having a
share of 16.percent in the total refusals; together the two states had a cumulated share of 45
percent of the total refusal by the US in the total products exported from India.
Nearly, all of the agricultural products are wholly owned products of India16
and further most
of these are exported after certified by bodies like: Agricultural and Processed Food Products
Export Development Authority (APEDA), Marine Products Export Development Authority
(MPEDA), Export Inspection Council of India (EIC), etc. Therefore, with no variation in
composition of agricultural exports and considering the country exporting has remained the
same the variation in the refusals by the US, FDA can only be construed as protectionist
measure under the garb of the SPS Measures.
Spices, flavours and salts was the sector with highest refusals with nearly 27 percent share of
the total agricultural refusals with decadal trends suggesting a positive growth of nearly 15
percentages; thus indicating that the refusal have shown an increase from 131 consignments
in 2002 to 426 consignments by 2013.
The second in the list is vegetable and vegetable products which had 8 percent of the total
refusals under the agricultural refusals and was almost constant in terms of trend with growth
16
Except for Cashew when exported in the form of roasted, salted and other processed forms.
21
rate of 0.1 percentages; the consignments refused by the US were 90 in numbers in 2002 and
was 77 in 2013.
As there was no comparable datasets, mapping export refusals by the US, FDA to that of
India’s exports to the US; the Sectoral categorised based the premise that anything which is
consumed by human being and animals and the exports are based on HS codes. Another
issue is that while the information on refusal are indicated in number of consignments and
exports are in values and quantity. Therefore, nearly all these refusals would fall under the
preview of analysis and studies to be undertaken by the Government of India. As these are
questionable as they undermine the system of export inspection put in place India for a long
time. However, considering the SPS agreement which support the use of risk based standards
the US can resort to such actions only if they are notified to the WTO.
Recommendations and Policy Suggestion
There is a need to identify how many of these actions were genuinely required to protect
health of US citizens? It would be also important to understand and check the notifications
notified by US to the WTO to analyse whether the refusals were WTO compatible or not?
Another aspect is to improve quality and processes of India’s exports, it would trace repeated
offences recorded by India’s exports to US market. The following are the key
recommendation that emerge from this study:
1. There is a need to seek data which are directly comparable, for example: when
exports happen in value terms the refusal should also reflect the same unit and not
consignments as is presently available;
2. An urgent need to carry-out follow up using primary surveys to seek information on
verification of the costs for the identified firms in this study;
3. SPS and TBT notifications of the measures notified to the WTO will have to be
carried out to find out if US was acting contrary to the claims for refusals of exports;
4. Each sector would have different solutions there cannot be one size fit all solution to
the problem of NTMs like SPS and TBT measures. The treatment provided would
need to differ depending upon the nature of these measures.; and
5. There is urgent need for the improvement/tightening of domestic regulations and
processes in the certification process of exports in particular and in general an urgent
need to increase in quality awareness across the industry.
22
Select Reference
CSPI, 2000, ‘The Impact of the TBT and SPS Agreements on Food Labelling and Safety
Regulations’, A Report by the Centre for Science in the Public Interest, March.
Dhar Biswajit and Murali Kallummal, 2007, "Trade policy off the hook: The making of
Indian trade policy since the Uruguay Round", pp 183 -237, in edited book by
Halle Mark and Wolfe Robert, ‘Process Matters: Sustainable Development and
Domestic Trade Transparency’, International Institute for Sustainable
Development (USD), Geneva. www.iisd.org/pdf/2007/process_matters.pdf
Dhar Biswajit and Murali Kallummal, 2007, "Taming Non-Tariff Barriers: Can WTO find
a solution?" published by Trade and Investment Division, United Nations
Economic and Social Commission for Asia and the Pacific [UN-ESCAP] as
Studies on Trade and Investment, No. 61, pp.131-180, Bangkok, Thailand.
Jurgen, R. et all., 2012, Editor(s)Non-Tariff Measures - A Fresh Look at Trade Policy's New
Frontier, world Bank.
Kallummal Murali, 2012, “SPS Measures and Possible Market Access Implications for
Agricultural Trade in Doha Round: An Analysis of Systemic Issues”, IDEAS
working paper September, an earlier version was published at ARTNET Working
Paper 116, 2012, UNESCAP, Bangkok, Feature Articles,
http://networkideas.org/featart/sep2012/fa26_Murali_Kallummal.htm
Kallummal Murali, 2013, “SPS Measures and Market Access Implications for Agricultural
Trade”, ISBN 978-3-659-40808-3, Lambert Academic Publishers, Germany.
Kallummal Murali, Aditi Gupta and Poornima Varma, 2013, “Agricultural Trade from
South-Asia and the Impact of SPS Measures: A Case Study European Rapid
Alert System for Food and Feed (RASFF)”, Journal of Economic Policy and
Research, vol. 8, no. 2.
Copyright © 2022 FDOKUMEN