Indian Oil Corporation Ltd.
16
1 Indian Oil Corporation Ltd. –– Stock Update Indian Oil Corporation Ltd. April 11, 2022
-
Upload
khangminh22 -
Category
Documents
-
view
0 -
download
0
Transcript of Indian Oil Corporation Ltd.

1
Indian Oil Corporation Ltd.
––
Stock Update Indian Oil Corporation Ltd.
April 11, 2022
2
Indian Oil Corporation Ltd.
Our Take:
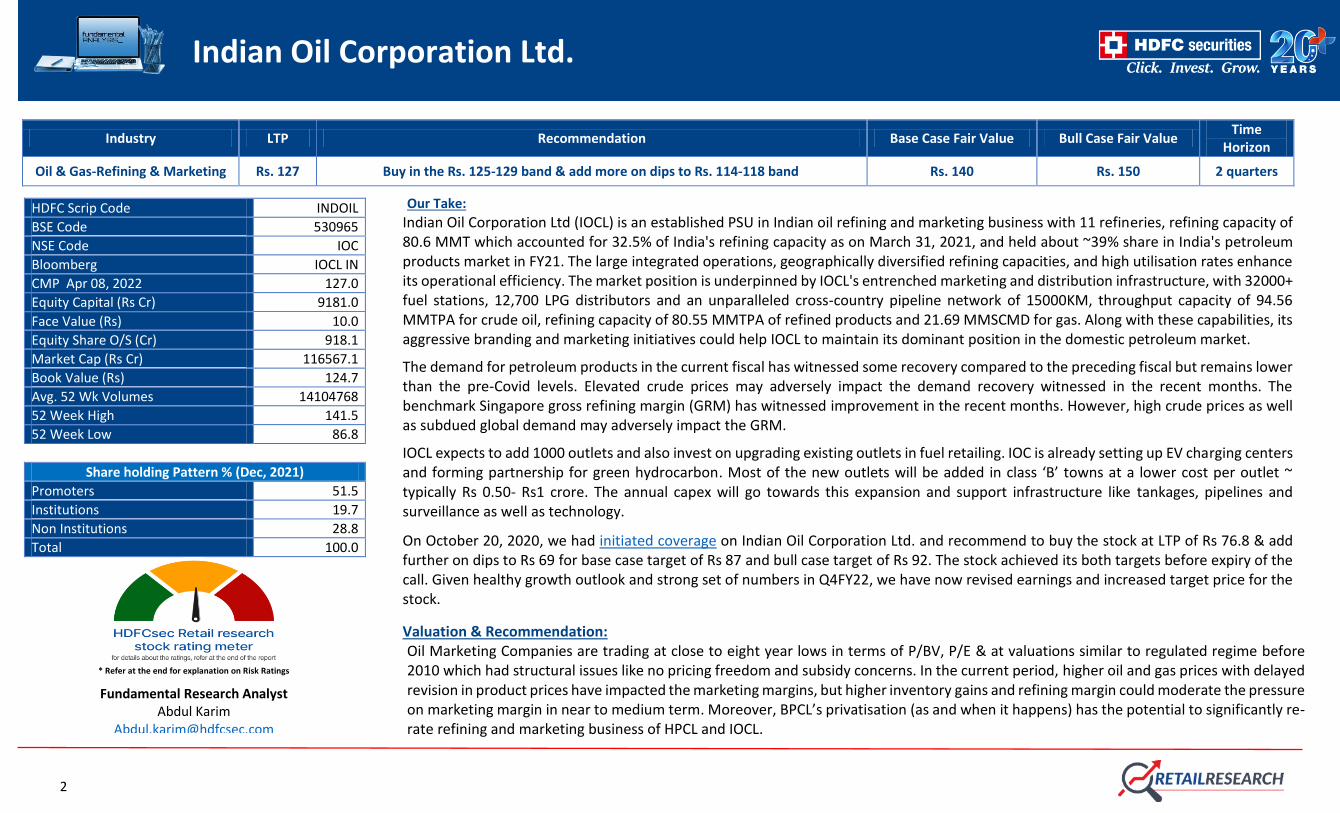
Indian Oil Corporation Ltd (IOCL) is an established PSU in Indian oil refining and marketing business with 11 refineries, refining capacity of 80.6 MMT which accounted for 32.5% of India's refining capacity as on March 31, 2021, and held about ~39% share in India's petroleum products market in FY21. The large integrated operations, geographically diversified refining capacities, and high utilisation rates enhance its operational efficiency. The market position is underpinned by IOCL's entrenched marketing and distribution infrastructure, with 32000+ fuel stations, 12,700 LPG distributors and an unparalleled cross-country pipeline network of 15000KM, throughput capacity of 94.56 MMTPA for crude oil, refining capacity of 80.55 MMTPA of refined products and 21.69 MMSCMD for gas. Along with these capabilities, its aggressive branding and marketing initiatives could help IOCL to maintain its dominant position in the domestic petroleum market.
The demand for petroleum products in the current fiscal has witnessed some recovery compared to the preceding fiscal but remains lower than the pre-Covid levels. Elevated crude prices may adversely impact the demand recovery witnessed in the recent months. The benchmark Singapore gross refining margin (GRM) has witnessed improvement in the recent months. However, high crude prices as well as subdued global demand may adversely impact the GRM.
IOCL expects to add 1000 outlets and also invest on upgrading existing outlets in fuel retailing. IOC is already setting up EV charging centers and forming partnership for green hydrocarbon. Most of the new outlets will be added in class ‘B’ towns at a lower cost per outlet ~ typically Rs 0.50- Rs1 crore. The annual capex will go towards this expansion and support infrastructure like tankages, pipelines and surveillance as well as technology.
On October 20, 2020, we had initiated coverage on Indian Oil Corporation Ltd. and recommend to buy the stock at LTP of Rs 76.8 & add further on dips to Rs 69 for base case target of Rs 87 and bull case target of Rs 92. The stock achieved its both targets before expiry of the call. Given healthy growth outlook and strong set of numbers in Q4FY22, we have now revised earnings and increased target price for the stock.
Valuation & Recommendation: Oil Marketing Companies are trading at close to eight year lows in terms of P/BV, P/E & at valuations similar to regulated regime before 2010 which had structural issues like no pricing freedom and subsidy concerns. In the current period, higher oil and gas prices with delayed revision in product prices have impacted the marketing margins, but higher inventory gains and refining margin could moderate the pressure on marketing margin in near to medium term. Moreover, BPCL’s privatisation (as and when it happens) has the potential to significantly re-rate refining and marketing business of HPCL and IOCL.
Industry LTP Recommendation Base Case Fair Value Bull Case Fair Value Time
Horizon
Oil & Gas-Refining & Marketing Rs. 127 Buy in the Rs. 125-129 band & add more on dips to Rs. 114-118 band Rs. 140 Rs. 150 2 quarters
HDFC Scrip Code INDOIL
BSE Code 530965
NSE Code IOC
Bloomberg IOCL IN
CMP Apr 08, 2022 127.0
Equity Capital (Rs Cr) 9181.0
Face Value (Rs) 10.0
Equity Share O/S (Cr) 918.1
Market Cap (Rs Cr) 116567.1
Book Value (Rs) 124.7
Avg. 52 Wk Volumes 14104768
52 Week High 141.5
52 Week Low 86.8
Share holding Pattern % (Dec, 2021)
Promoters 51.5
Institutions 19.7
Non Institutions 28.8
Total 100.0
* Refer at the end for explanation on Risk Ratings
Fundamental Research Analyst Abdul Karim
3
Indian Oil Corporation Ltd.
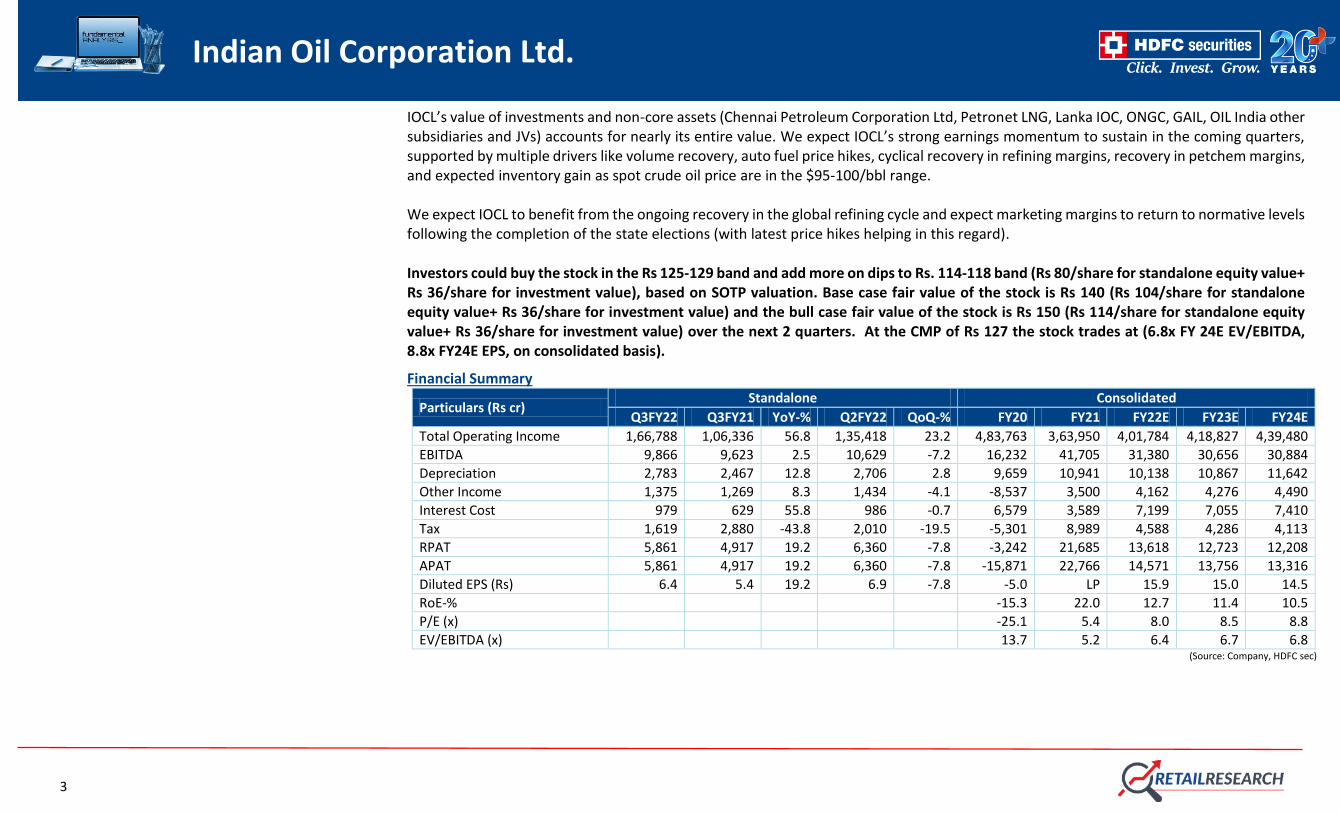
IOCL’s value of investments and non-core assets (Chennai Petroleum Corporation Ltd, Petronet LNG, Lanka IOC, ONGC, GAIL, OIL India other subsidiaries and JVs) accounts for nearly its entire value. We expect IOCL’s strong earnings momentum to sustain in the coming quarters, supported by multiple drivers like volume recovery, auto fuel price hikes, cyclical recovery in refining margins, recovery in petchem margins, and expected inventory gain as spot crude oil price are in the $95-100/bbl range. We expect IOCL to benefit from the ongoing recovery in the global refining cycle and expect marketing margins to return to normative levels following the completion of the state elections (with latest price hikes helping in this regard). Investors could buy the stock in the Rs 125-129 band and add more on dips to Rs. 114-118 band (Rs 80/share for standalone equity value+ Rs 36/share for investment value), based on SOTP valuation. Base case fair value of the stock is Rs 140 (Rs 104/share for standalone equity value+ Rs 36/share for investment value) and the bull case fair value of the stock is Rs 150 (Rs 114/share for standalone equity value+ Rs 36/share for investment value) over the next 2 quarters. At the CMP of Rs 127 the stock trades at (6.8x FY 24E EV/EBITDA, 8.8x FY24E EPS, on consolidated basis).
Financial Summary
Particulars (Rs cr) Standalone Consolidated
Q3FY22 Q3FY21 YoY-% Q2FY22 QoQ-% FY20 FY21 FY22E FY23E FY24E
Total Operating Income 1,66,788 1,06,336 56.8 1,35,418 23.2 4,83,763 3,63,950 4,01,784 4,18,827 4,39,480
EBITDA 9,866 9,623 2.5 10,629 -7.2 16,232 41,705 31,380 30,656 30,884
Depreciation 2,783 2,467 12.8 2,706 2.8 9,659 10,941 10,138 10,867 11,642
Other Income 1,375 1,269 8.3 1,434 -4.1 -8,537 3,500 4,162 4,276 4,490
Interest Cost 979 629 55.8 986 -0.7 6,579 3,589 7,199 7,055 7,410
Tax 1,619 2,880 -43.8 2,010 -19.5 -5,301 8,989 4,588 4,286 4,113
RPAT 5,861 4,917 19.2 6,360 -7.8 -3,242 21,685 13,618 12,723 12,208
APAT 5,861 4,917 19.2 6,360 -7.8 -15,871 22,766 14,571 13,756 13,316
Diluted EPS (Rs) 6.4 5.4 19.2 6.9 -7.8 -5.0 LP 15.9 15.0 14.5
RoE-% -15.3 22.0 12.7 11.4 10.5
P/E (x) -25.1 5.4 8.0 8.5 8.8
EV/EBITDA (x) 13.7 5.2 6.4 6.7 6.8 (Source: Company, HDFC sec)

4
Indian Oil Corporation Ltd.
Q3FY22 Result Update
IOCL revenue was above expectations in Q3FY22, while profitability was below expectations. Standalone net revenue grew by 57% YoY and 23.2% QoQ to Rs 166,788 crore. Capacity utilisation plunged 270bp YoY to 99% on planned shutdown of the Haldia refinery in Q3. Since all maintenance-related work is behind, utilisation could normalise Q4 onwards.
EBITDA was up by 2.5% YoY, stood at Rs 9,866 crore in Q3FY22, and declined 7.2% QoQ. EBITDA margin stood at 5.9% in Q3FY22 vs. 9.1% in Q3FY21 and 7.8% in Q2FY22. The company’s Net Profit was up by 19.2% to Rs 5,861 crore in Q3FY22 supported by lower tax expenses in the quarter. Tax rate in the quarter was at 21.6% vs. 36.9% in Q3FY21. Marketing business incurred an EBITDA loss, mainly due to inventory loss resulting from a sharp excise duty cut during Q3FY22.
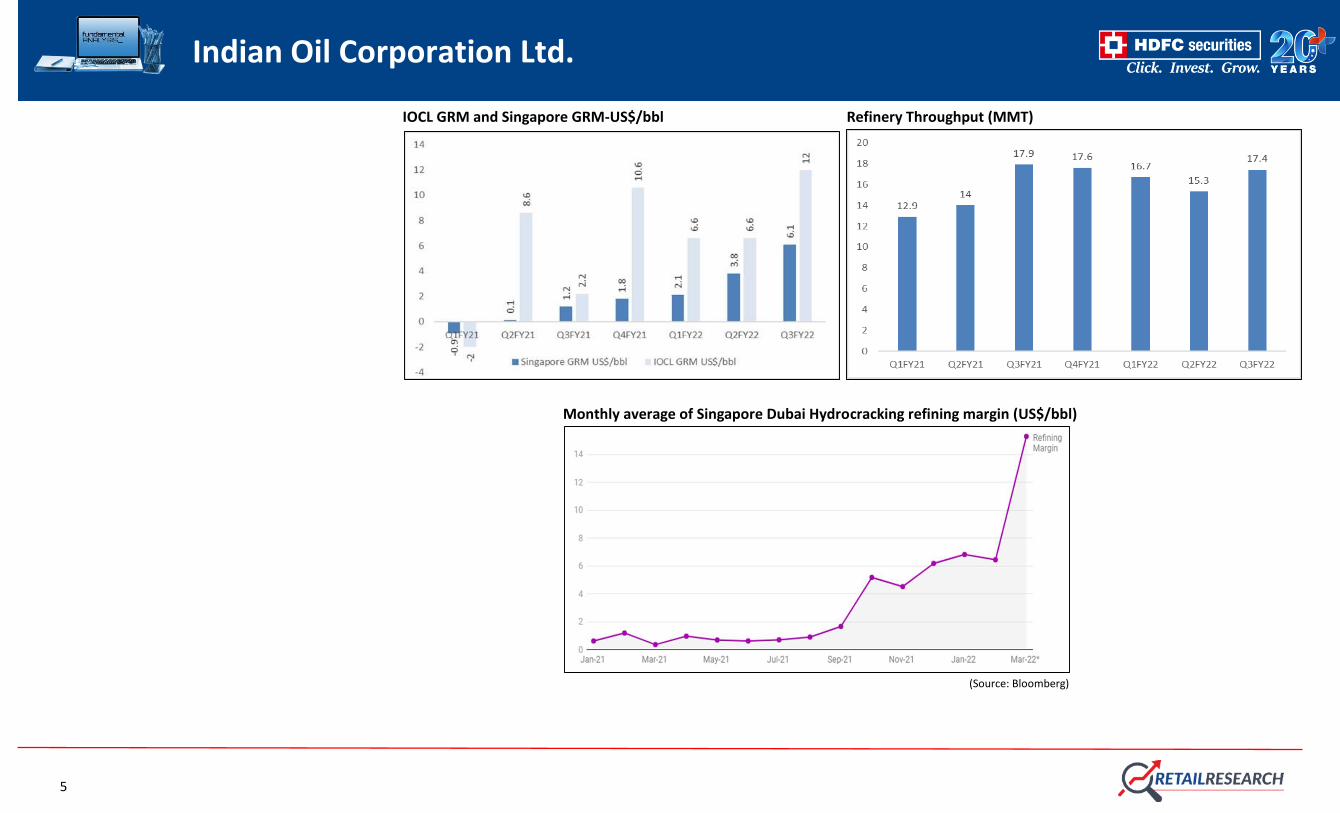
On Operating metrics, IOCL refinery throughput reported at 17.404 MMT in Q3FY22 vs. 15.277 MMT in Q2FY22 and 17.866 MMT in Q3FY21. Its pipeline throughput stood at 21.779 MMT in Q3FY22 vs. 19.533 MMT in Q2FY22 and 21.806 MMT in Q3FY21.
Domestic product sales was at 21.021 MMT in Q3FY22 vs. 18.938 MMT in Q2FY22 and 21.425 MMT in Q3FY21. Export product sales was at 1.57 MMT in Q3FY22 vs. 1.243 MMT in Q2FY22 and 1.608 MMT in Q3FY21.
Key Updates
Expectation of robust GRM in near future
The covid-19 pandemic had adversely impacted the condition of refining business and refining margin had been sluggish in CY2020 though
it has shown a decent recovery trends in CY2021. Benchmark Singapore Gross Refining Margins (GRM’s) averaged at $6.1/barrel in the
Q3FY22, up $2.2 a barrel sequentially, primarily led by improvement in diesel and ATF cracks.
According to FG Energy – a global energy consultancy firm, global refinery runs is anticipated to increase in CY22 as global oil demand
recovers resulting in higher throughput. Inventory levels are nearing 2019 lows. Hence, refinery utilisation is expected to rise with upward
traction in demand.
IOCL reported average Gross Refining Margin (GRM) for the period April- December 2021 at US$ 8.52 per bbl vs. US$ 2.96 per bbl for the
same period of previous year. The core GRM or the current price GRM for the period April - December 2021 after offsetting inventory loss/
gain comes to US$5.40 per bbl. The company’s GRM stood at US$12/bbl (up 83.7% QoQ) in Q3FY22 vs. US$ 6.6/bbl in Q2FY22 and US$
2.2/bbl in Q3FY21 and its core GRM was at US$ 8.9/bbl in Q3FY22 vs. US$ 4.8/bbl in Q2FY22 and US$ 1.3/bbl in Q3FY21. Utilization of high
sulphur crude oil was at 59% in Q3FY22 vs. 54.5% in FY21, and refinery capacity utilization rate was at 99.1% in Q3FY22.
The benchmark refining margin, however, has spiked in the past few weeks. IOCL is likely to benefit the most among its peers from an uptick
in refining margin, further supported by robust petchem margin in the near term.
5
Indian Oil Corporation Ltd.
IOCL GRM and Singapore GRM-US$/bbl Refinery Throughput (MMT)
Monthly average of Singapore Dubai Hydrocracking refining margin (US$/bbl)
(Source: Bloomberg)

6
Indian Oil Corporation Ltd.
Sharp price hikes could add marketing margin going forward
IOCL earnings could improve with cyclical recovery in GRM, higher polymer spreads, and marketing margin. We expect IOCL’s strong earnings
momentum to sustain in the coming quarters, supported by multiple drivers like volume recovery, price hikes of petroleum products, cyclical
recovery in refining margins, recovery in petchem margins and expectation of inventory gain as spot crude oil price could trade at $95-
100/bbl. Price hike of petroleum products could help to ramp up marketing margins in near to medium terms. Fuel prices in India have gone
up 16 times over the past two weeks, with the hikes occurring almost on a daily basis since March 23, after a four-month gap without a rise,
taking the total increase to Rs 10 per litre. IOCL’s petchem margins improved 13%/1%/31% QoQ in January 2022 for PE/PP/PVC, respectively,
supported by a stiff price hike in product prices. This could help IOCL to improve its margins in the coming quarter.
Expansion in city gas distribution (CGD) could generate additional revenue
IOCL is swiftly expanding its presence in the CGD business. Along with its two joint venture companies, Green Gas Ltd (with GAIL India Ltd)
and Indian Oil Adani Gas Pvt. Ltd (with Adani Total Gas Ltd), it has authorisation for 40 Geographical Areas (GAs) spread across the length
and breadth of the country. The company commissioned its first standalone GA in Rewa (Madhya Pradesh) in FY21, while eight GAs were
commissioned by its joint ventures.
IOCL is planning to expand its CGD business and investing Rs 7,282 crore over for development of City Gas Distribution (CGD) network in 9
Geographical areas (GAs) awarded to the Company by PNGRB in the 11" Round of CGD bidding. The company will now have its presence in
26 number of GAs on its own and 23 number of GAs through its Joint Venture companies. After 11" Round of CGD Bidding, IOCL along with
its 2 Joint Venture companies is now present in 49 GAs and 105 Districts spread across 21 States and UTs, making it one of the major CGD
players in the country. The pipeline infrastructure and expansions will take some time to complete while the bidding has been aggressive.
There may be more upfront investments in terms of capex.
Besides, IOCL acquired a 4.93% equity share in Indian Gas Exchange Ltd (IGX) – the country’s first automated national level gas exchange.
The acquisition of an equity stake in IGX is a strategic opportunity to become part of India’s natural gas market. These investments can create
value and will be earnings accretive, but the gains will accrue only over time.
IOCL plans to invest ~Rs 1 lakh crore in the next 4-5 years to expand its refining, marketing, petrochemicals and natural gas business.
IOCL is expanding almost all its refineries and also clubbing petrochemicals in all the refineries. The company is making necessary investments
in pipeline and marketing infrastructure so that there will be no shortage in meeting the growing energy demand. IOCL accounts 80.6 million
metric tons per annum (mtpa) installed refining capacity with 10 refineries (including Chennai Petroleum Corporation Ltd) which is about
7
Indian Oil Corporation Ltd.
one-third of India’s refining capacity of 249.4 mmtpa. Any material time or cost overruns in the group projects could lead to an increase in
the company’s borrowing levels and moderation of credit metrics. The company intends to enhance crude refining capacity from 70.05 MMT
to 87.55 MMT by 2024-25, to meet the growing demand for petroleum products.
IOCL operates a network of more than 15,000 km long crude oil with the commissioning of the 144 km Ramanathapuram - Tuticorin section
of the 1,444 km long Ennore – Thiruvallur – Bengaluru – Puducherry – Nagapattinam – Madurai - Tuticorin (ETBPNMT) Natural Gas pipeline.
The company reported petroleum product and gas pipelines with a throughput capacity of 94.56mmtpa of oil and 21.69 million metric
standard cubic meters per day (mmscmpd) of gas.
IOCL added 337 km of additional pipeline length in FY21, as part of its plans to continuously expand the network in line with growth in
business. Projects currently under implementation could further increase the length of the pipelines network to about 21,000 km, and
throughput capacity to 102 mmtpa.
IOCL has wide marketing infrastructure of petrol/diesel stations, Indane (LPG) distributorships, SERVO lubricants & greases outlets and large
volume consumer pumps are backed by bulk storage terminals and installations, inland depots, aviation fuel stations, LPG bottling plants
and lube blending plants amongst others. The countrywide marketing operations are coordinated by 16 State Offices and over 100
decentralised administrative offices. The company added 310 new CNG, 17 Compressed Biogas (CBG), 205 electric vehicle (EV) charging and
27 battery swapping stations in FY21. The company is operating 1,059 CNG, 21 CBG, 257 EV charging and 29 battery swapping stations in
the country.
IOCL has taken crucial mega-investment decisions - 9 MMTPA greenfield refinery at Nagapattinam in Tamil Nadu through a Joint Venture
with CPCL, Panipat Refinery expansion from 15 to 25 MMTPA and Gujarat Refinery expansion from 13.7 to 18 MMTPA. All refinery expansion
and petrochemical integration projects viz. PX-PTA at Paradip and Ethylene Glycol at Paradip (Odisha) and Oxo Alcohol project at Dumad
(Gujarat) are on track. The newly approved projects translate into an investment commitment of close to Rupees One Lakh crore over the
next 4 to 5 years.
8
Indian Oil Corporation Ltd.
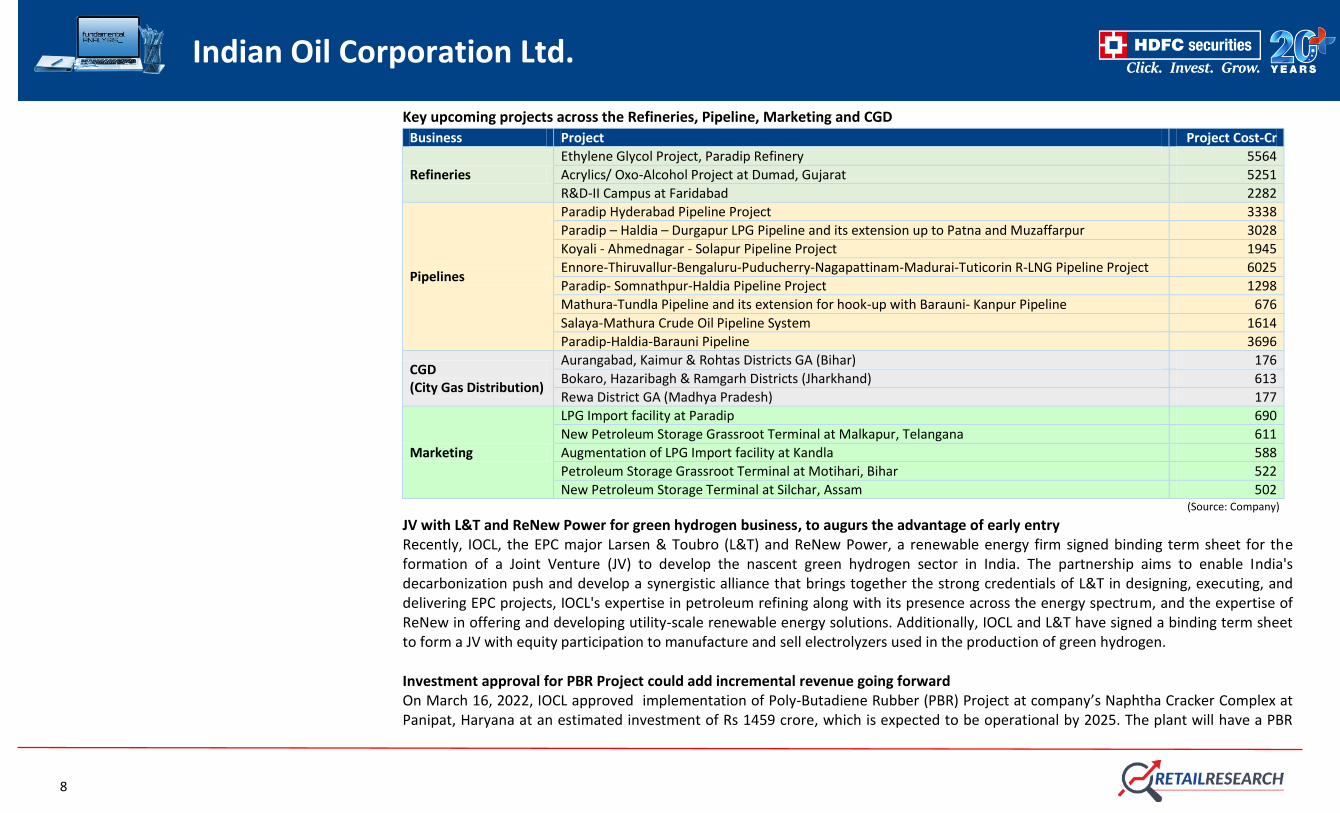
Key upcoming projects across the Refineries, Pipeline, Marketing and CGD
Business Project Project Cost-Cr
Refineries
Ethylene Glycol Project, Paradip Refinery 5564
Acrylics/ Oxo-Alcohol Project at Dumad, Gujarat 5251
R&D-II Campus at Faridabad 2282
Pipelines
Paradip Hyderabad Pipeline Project 3338
Paradip – Haldia – Durgapur LPG Pipeline and its extension up to Patna and Muzaffarpur 3028
Koyali - Ahmednagar - Solapur Pipeline Project 1945
Ennore-Thiruvallur-Bengaluru-Puducherry-Nagapattinam-Madurai-Tuticorin R-LNG Pipeline Project 6025
Paradip- Somnathpur-Haldia Pipeline Project 1298
Mathura-Tundla Pipeline and its extension for hook-up with Barauni- Kanpur Pipeline 676
Salaya-Mathura Crude Oil Pipeline System 1614
Paradip-Haldia-Barauni Pipeline 3696
CGD (City Gas Distribution)
Aurangabad, Kaimur & Rohtas Districts GA (Bihar) 176
Bokaro, Hazaribagh & Ramgarh Districts (Jharkhand) 613
Rewa District GA (Madhya Pradesh) 177
Marketing
LPG Import facility at Paradip 690
New Petroleum Storage Grassroot Terminal at Malkapur, Telangana 611
Augmentation of LPG Import facility at Kandla 588
Petroleum Storage Grassroot Terminal at Motihari, Bihar 522
New Petroleum Storage Terminal at Silchar, Assam 502 (Source: Company)
JV with L&T and ReNew Power for green hydrogen business, to augurs the advantage of early entry Recently, IOCL, the EPC major Larsen & Toubro (L&T) and ReNew Power, a renewable energy firm signed binding term sheet for the formation of a Joint Venture (JV) to develop the nascent green hydrogen sector in India. The partnership aims to enable India's decarbonization push and develop a synergistic alliance that brings together the strong credentials of L&T in designing, executing, and delivering EPC projects, IOCL's expertise in petroleum refining along with its presence across the energy spectrum, and the expertise of ReNew in offering and developing utility-scale renewable energy solutions. Additionally, IOCL and L&T have signed a binding term sheet to form a JV with equity participation to manufacture and sell electrolyzers used in the production of green hydrogen. Investment approval for PBR Project could add incremental revenue going forward On March 16, 2022, IOCL approved implementation of Poly-Butadiene Rubber (PBR) Project at company’s Naphtha Cracker Complex at Panipat, Haryana at an estimated investment of Rs 1459 crore, which is expected to be operational by 2025. The plant will have a PBR

9
Indian Oil Corporation Ltd.
production capacity of 60,000 tons per annum based on state-of-the-art technology provided by Goodyear Tire & Rubber Company which is also the leading global manufacturer of automotive tyres.
Butadiene is the primary raw material for the production of PBR which will be available from existing Naphtha Cracker Complex of the Company. Tyre industry is the largest consumer of PBR in India with more than 80%, while balance is for other industries such as footwear, conveyor belts, etc. In view of the present deficit in PBR production in India and the steadily growing demand, the demand-supply deficit is expected to grow considerably in the future. With the commissioning of this project, the Petrochemical Intensity Index of Panipat Refinery & Petrochemical Complex will increase from 15.9% to 18.05% along-with other upcoming projects. Sound financial profile with decent dividend yield
IOCL, on a consolidated basis, reported total operating income of Rs. 363,950 crore in FY21 as against Rs. 483,763 crore in FY20, revenue is likely grow FY21-24E CAGR of 6%. We expect EBITDA margin at 7-8% and PAT margin at 3-4% in FY22E to FY24E, respectively.
The oil & gas industry is a capital-intensive industry, which requires large funds and substantial time to develop a sound infrastructure, the interest coverage ratio also remained comfortable at 8.6x in FY21. However, the company has wide capex plan over the next three to four years. Therefore, we expect it could go down at ~3x in next two to three years.
The company paid dividend of Rs 14 in FY21, dividend yield stood at 11.2%. The company has recommended first interim dividend of Rs 5 per share and declared 2nd Interim dividend of Rs 4/- per equity share for FY22 which resulted in total interim dividend till date of Rs 9 per share (Face Value @ Rs 10) during the FY22.
What could go wrong?
Economic slowdown, volatility in oil and gas prices and regulatory changes in Oil and Gas industry could impact its growth story in the future. The changing macro-economic scenario can have an impact on the growth plans of the company.
Given the volatility in Crude oil and petroleum product prices, inventory gains/losses in each quarter can be large affecting the estimates. Any decrease in the price of the crude oil may hamper the profitability of the company. Prices of crude oil depend on various factors including policies by major producers of crude oil, global as well as regional demand variations, geopolitical situations and market sentiment.
The company’s profitability is also exposed to the forex rates (INR-US$) given the business is largely depending on the volatility of INR against the US$ on sales, crude procurement and foreign currency loans.
IOCL’s core business of refining and marketing of petroleum products is an inherently low margin business. Any extreme vagaries like economic slowdown, volatility in oil and gas prices and regulatory changes in Oil and Gas industry could impact its growth story in near future. The changing macro-economic scenario can have an impact on the growth plans of the company.

10
Indian Oil Corporation Ltd.
The oil prices and crack spreads are a function of many dynamic factors and fundamental factors such as global demand supply dynamics, geo-political stability in countries with oil reserves, OPEC policies, exchange rates, etc. These factors have translated in high level of volatility in oil prices. Thus, Company’s profitability is exposed to volatility of crude prices and crack spreads as well as foreign exchange fluctuations. Regulatory change in the form of reduction in duty protection will lower refining margins. Significant increase in sales-related under-recoveries on account of adverse movement in crude oil prices and foreign exchange rates, with inadequate pass-through in retail price or compensation from GoI.
Shift in consumption to green fuels over time could impact the demand for fossil fuels which so far is the mainstay of the company.
While IOCL is pursuing a large investment plan of Rs 25000 – 28000 cr annually, most of its expansion projects are targeted for completion in FY25 and beyond.
With inland refineries, IOCL needs to maintain a higher level of inventory for its operations, which tends to increase earnings volatility relative to peers.
Revenue Mix
Operating Metrics
Segment Revenue (Rs,Cr) Q1FY20 Q2FY20 Q3FY20 Q4FY20 Q1FY21 Q2FY21 Q3FY21 Q4FY21 Q1FY22 Q2FY22 Q3FY22
Petroleum products 146612 128139 140482 132861 85197 110715 140233 156982 149193 161743 188339
Petrochemicals 3926 3358 4152 4291 2832 4440 5514 6383 5829 7308 6983
Others 2027 2830 2950 5481 1601 2649 3252 3696 3516 4779 6622
Total 152565 134327 147584 142633 89630 117804 149000 167060 158538 173830 201944

11
Indian Oil Corporation Ltd.
Segment Results (PBIT)
Petroleum products 5600 1272 3675 -81 2617 6615 5643 8978 6709 5821 6153
Petrochemicals 474 494 513 526 495 979 1721 2023 1738 1609 768
Others 234 235 231 191 29 -243 39 52 193 404 288
Total 6309 2000 4420 637 3142 7352 7403 11053 8640 7834 7209
Oil & Gas Price:
Crude Oil WTI Fut-US$/bbl Natural Gas Price-US$/mbtu
(Source: Investing.com, HDFC sec)
Peer Comparison
Company, Rs in Cr Mkt Cap,
Cr Sales EBITDA PAT ROE-% P/E (x) EV/EBITDA(x)
FY22E FY23E FY24E FY22E FY23E FY24E FY22E FY23E FY24E FY22E FY23E FY24E FY22E FY23E FY24E FY22E FY23E FY24E
IOCL 119513 4,01,784 4,18,827 4,39,480 31,380 30,656 30,884 14,571 13,756 13,316 12.7 11.4 10.5 8.0 8.5 8.8 6.4 6.7 6.8
HPCL 41564 246700 265600 280400 8700 12000 15000 5100 6900 9000 12.9 15.8 18.2 8.3 6.1 4.8 9.0 6.2 4.8
BPCL 83050 339300 366100 392100 18500 18900 21400 10600 10800 12600 19.3 18.2 19.4 7.6 7.5 6.4 6.4 6.1 5.1

12
Indian Oil Corporation Ltd.
IOCL Valuation
Business EBIDTA (Rs Cr) Base Case Bull Case Add on Dips
Valuation basis Multiple Value (Rs Cr) Value (Rs/sh) Multiple Value (Rs Cr) Value (Rs/sh) Multiple Value (Rs Cr) Value (Rs/sh)
Standalone
Refining 2,544 6.0 15,266 17 6.5 16538 18 5.0 12722 14 EV/EBIDTA on Mar 24E
Marketing 10,086 5.5 55,473 60 6.0 60516 66 5.0 50430 55 EV/EBIDTA on Mar 24E
Pipeline 6,999 5.5 38,492 42 6.0 41991 46 4.5 31493 34 EV/EBIDTA on Mar 24E
Petchem 7,552 6.0 45,310 49 6.0 45310 49 5.0 37758 41 EV/EBIDTA on Mar 24E
Standalone net Debt (59,191) -64 (59,191) -64 (59,191) -64 As on Mar 24E
Standalone Equity Value 95,350 104 1,05,164 114 73,212 80
Investments
Traded investments 191 21 21 21 25% disc. to CMP
Non traded investments 138 15 15 15 Investments at 25% disc. to BV
Investments Equity Value 36 36 36
Value per share 140 150 116

13
Indian Oil Corporation Ltd.
Financials (Consolidated) Income Statement Balance Sheet
(Rs Cr) FY20 FY21 FY22E FY23E FY24E As at March FY20 FY21 FY22E FY23E FY24E
Net Revenues 483763 363950 401784 418827 439480 SOURCE OF FUNDS
Growth (%) -8 -24.8 10.4 4.2 4.9 Share Capital 9181 9181 9181 9181 9181
Operating Expenses 467531 322245 370404 388170 408596 Reserves 86217 102657 108020 114786 121441
EBITDA 16232 41705 31380 30656 30884 Shareholders' Funds 95398 111838 117201 123967 130622
Growth (%) -53.9 156.9 -24.8 -2.3 0.7 Long Term Debt 56071 60935 42220 45256 48293
EBITDA Margin (%) 3.4 11.5 7.8 7.3 7.0 Net Deferred Taxes 11439 13964 14872 14691 15420
Depreciation 9659 10941 10138 10867 11642 Long Term Provisions & Others 4435 5028 5552 6041 6579
EBIT 6572 30763 21242 19789 19241 Minority Interest 876 976 1025 1076 1130
Other Income -8537 3500 4162 4276 4490 Total Source of Funds 168219 192741 180870 191031 202044
Interest expenses 6579 3589 7199 7055 7410 APPLICATION OF FUNDS
PBT -8543 30674 18205 17010 16321 Net Block & Goodwill 147021 157084 161549 166545 175392
Tax -5301 8989 4588 4286 4113 CWIP 32846 36292 38862 41718 42440
RPAT -3242 21685 13618 12723 12208 Other Non-Current Assets 39135 45332 45793 46627 47489
APAT -15871 22766 14571 13756 13316 Total Non Current Assets 219002 238707 246203 254889 265321
Growth (%) -191.3 LP -36.0 -5.6 -3.2 Current Investments 0 0 0 0 0
EPS -5.0 23.6 15.9 15.0 14.5 Inventories 67011 83427 71361 74942 79282
Trade Receivables 13259 13800 11824 12320 12915
Cash & Equivalents 10587 11757 31975 31513 31555
Other Current Assets 19878 7224 7448 7666 7881
Total Current Assets 110735 116209 122608 126441 131632
Short-Term Borrowings 69897 47580 48736 50486 52486
Trade Payables 27576 37248 36115 36076 37910
Other Current Liab & Provisions 64044 77347 103091 103737 104513
Total Current Liabilities 161518 162175 187942 190299 194909
Net Current Assets -50783 -45966 -65333 -63858 -63277
Total Application of Funds 168219 192741 180870 191031 202044 (Source: Company, HDFC sec)

14
Indian Oil Corporation Ltd.
Cash Flow Statement Key Ratios
(Rs Cr) FY20 FY21 FY22E FY23E FY24E Particulars FY20 FY21 FY22E FY23E FY24E
Reported PBT -8,543 30,674 18,205 17,010 16,321 Profitability Ratio (%)
Non-operating & EO items -4,092 -2,419 -3,209 -3,243 -3,382 EBITDA Margin 3.4 11.5 7.8 7.3 7.0
Interest Expenses 6,579 3,589 7,199 7,055 7,410 EBIT Margin 1.4 8.5 5.3 4.7 4.4
Depreciation 9,659 10,941 10,138 10,867 11,642 APAT Margin -3.3 6.3 3.6 3.3 3.0
Working Capital Change 4,295 18,671 38,428 -3,686 -2,540 RoE -15.3 22.0 12.7 11.4 10.5
Tax Paid 230 -6,463 -3,680 -4,467 -3,385 RoCE -5.7 10.6 8.5 8.1 7.6
OPERATING CASH FLOW ( a ) 8,129 54,993 67,081 23,536 26,067 Solvency Ratio (x)
Capex -28,752 -24,450 -17,173 -18,719 -21,212 Net Debt/EBITDA 7.1 2.3 1.9 2.1 2.2
Free Cash Flow -20,623 30,543 49,908 4,817 4,854 Net D/E 1.2 0.9 0.5 0.5 0.5
Investments 8,313 -8,155 -408 -417 -425 PER SHARE DATA (Rs)
Non-operating income -8,537 3,500 4,162 4,276 4,490 EPS -5.0 23.6 15.9 15.0 14.5
Others -2,630 1,957 -52 -417 -437 CEPS 5.6 35.5 26.9 26.8 27.2
INVESTING CASH FLOW ( b ) -31,606 -27,148 -13,472 -15,277 -17,584 Dividend 5.0 14.2 10.0 7.6 7.3
Debt Issuance / (Repaid) 33,256 -17,453 -17,559 4,786 5,038 BVPS 103.9 121.8 127.6 135.0 142.3
Interest Expenses -6,579 -3,589 -7,199 -7,055 -7,410 Turnover Ratios (days)
FCFE 6,054 9,501 25,151 2,547 2,482 Debtors 10 14 11 11 11
Share Capital Issuance 0 0 0 0 0 Inventory 51 84 65 65 66
Dividend -4,609 -13,014 -9,207 -6,991 -6,660 Creditors 24 49 41 39 39
Others 2,415 7,381 573 540 592 VALUATION (x)
FINANCING CASH FLOW ( c ) 24,484 -26,675 -33,392 -8,720 -8,441 P/E -25.6 5.4 8.0 8.5 8.8
NET CASH FLOW (a+b+c) 1,007 1,170 20,217 -461 41 P/BV 1.2 1.0 1.0 0.9 0.9
EV/EBITDA 13.7 5.2 6.4 6.7 6.8
EV / Revenues 0.5 0.6 0.5 0.5 0.5
Dividend Yield (%) 4.0 11.2 7.9 6.0 5.7
(Source: Company, HDFC sec)
15
Indian Oil Corporation Ltd.
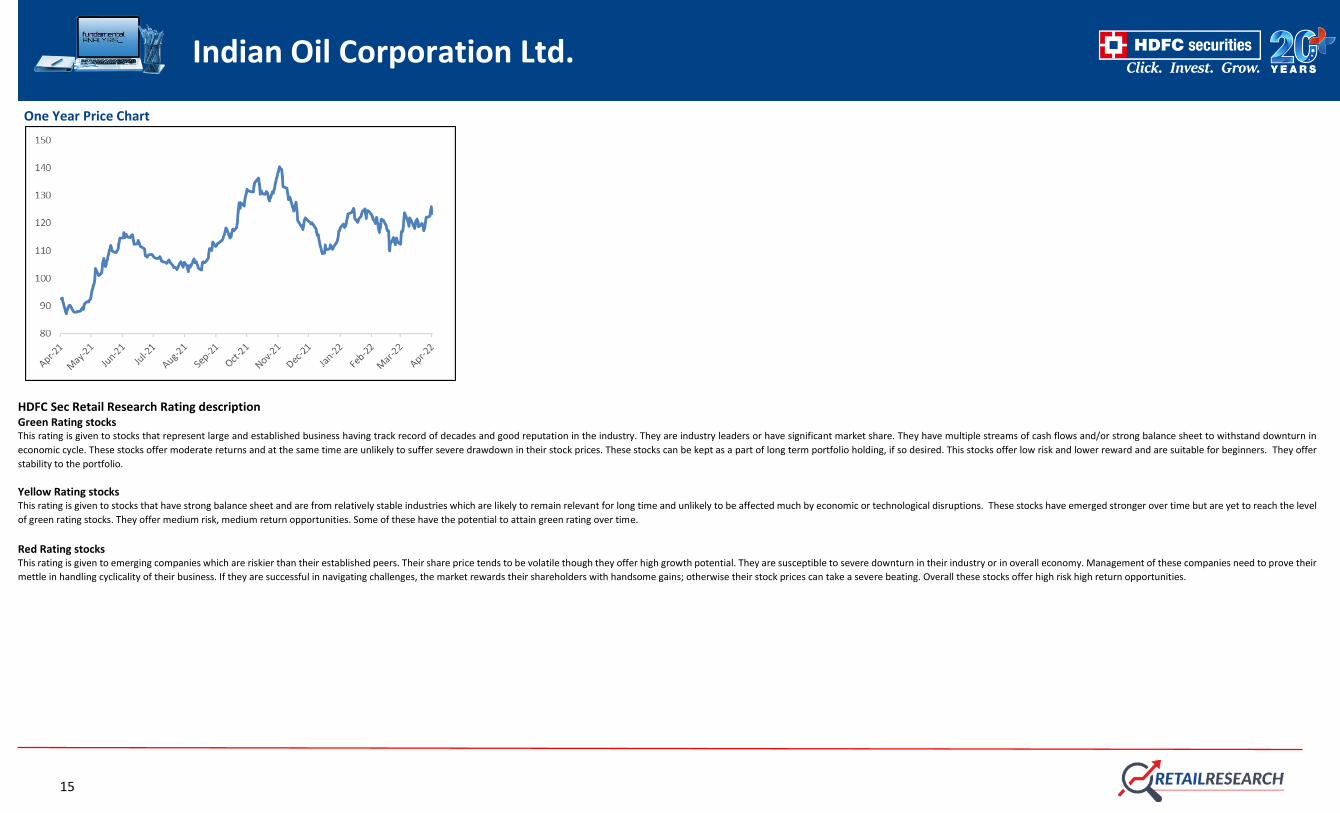
One Year Price Chart
HDFC Sec Retail Research Rating description Green Rating stocks This rating is given to stocks that represent large and established business having track record of decades and good reputation in the industry. They are industry leaders or have significant market share. They have multiple streams of cash flows and/or strong balance sheet to withstand downturn in
economic cycle. These stocks offer moderate returns and at the same time are unlikely to suffer severe drawdown in their stock prices. These stocks can be kept as a part of long term portfolio holding, if so desired. This stocks offer low risk and lower reward and are suitable for beginners. They offer
stability to the portfolio.
Yellow Rating stocks This rating is given to stocks that have strong balance sheet and are from relatively stable industries which are likely to remain relevant for long time and unlikely to be affected much by economic or technological disruptions. These stocks have emerged stronger over time but are yet to reach the level
of green rating stocks. They offer medium risk, medium return opportunities. Some of these have the potential to attain green rating over time.
Red Rating stocks This rating is given to emerging companies which are riskier than their established peers. Their share price tends to be volatile though they offer high growth potential. They are susceptible to severe downturn in their industry or in overall economy. Management of these companies need to prove their
mettle in handling cyclicality of their business. If they are successful in navigating challenges, the market rewards their shareholders with handsome gains; otherwise their stock prices can take a severe beating. Overall these stocks offer high risk high return opportunities.

16
Indian Oil Corporation Ltd.
Disclosure: I, Abdul Karim, (MBA), authors and the names subscribed to this report, hereby certify that all of the views expressed in this research report accurately reflect our views about the subject issuer(s) or securities. HSL has no material adverse disciplinary history as on the date of publication
of this report. We also certify that no part of our compensation was, is, or will be directly or indirectly related to the specific recommendation(s) or view(s) in this report.
Research Analyst or her relative or HDFC Securities Ltd. does not have any financial interest in the subject company. Also Research Analyst or his relative or HDFC Securities Ltd. or its Associate may have beneficial ownership of 1% or more in the subject company at the end of the month
immediately preceding the date of publication of the Research Report. Further Research Analyst or her relative or HDFC Securities Ltd. or its associate does not have any material conflict of interest.
Any holding in stock – No
HDFC Securities Limited (HSL) is a SEBI Registered Research Analyst having registration no. INH000002475.
Disclaimer:
This report has been prepared by HDFC Securities Ltd and is meant for sole use by the recipient and not for circulation. The information and opinions contained herein have been compiled or arrived at, based upon information obtained in good faith from sources believed to be reliable.
Such information has not been independently verified and no guaranty, representation of warranty, express or implied, is made as to its accuracy, completeness or correctness. All such information and opinions are subject to change without notice. This document is for information
purposes only. Descriptions of any company or companies or their securities mentioned herein are not intended to be complete and this document is not, and should not be construed as an offer or solicitation of an offer, to buy or sell any securities or other financial instruments.
This report is not directed to, or intended for display, downloading, printing, reproducing or for distribution to or use by, any person or entity who is a citizen or resident or located in any locality, state, country or other jurisdiction where such distribution, publication, reproduction,
availability or use would be contrary to law or regulation or what would subject HSL or its affiliates to any registration or licensing requirement within such jurisdiction.
If this report is inadvertently sent or has reached any person in such country, especially, United States of America, the same should be ignored and brought to the attention of the sender. This document may not be reproduced, distributed or published in whole or in part, directly or
indirectly, for any purposes or in any manner.
Foreign currencies denominated securities, wherever mentioned, are subject to exchange rate fluctuations, which could have an adverse effect on their value or price, or the income derived from them. In addition, investors in securities such as ADRs, the values of which are influenced
by foreign currencies effectively assume currency risk.
It should not be considered to be taken as an offer to sell or a solicitation to buy any security. HSL may from time to time solicit from, or perform broking, or other services for, any company mentioned in this mail and/or its attachments.
HSL and its affiliated company(ies), their directors and employees may; (a) from time to time, have a long or short position in, and buy or sell the securities of the company(ies) mentioned herein or (b) be engaged in any other transaction involving such securities and earn brokerage or
other compensation or act as a market maker in the financial instruments of the company(ies) discussed herein or act as an advisor or lender/borrower to such company(ies) or may have any other potential conflict of interests with respect to any recommendation and other related
information and opinions.
HSL, its directors, analysts or employees do not take any responsibility, financial or otherwise, of the losses or the damages sustained due to the investments made or any action taken on basis of this report, including but not restricted to, fluctuation in the prices of shares and bonds,
changes in the currency rates, diminution in the NAVs, reduction in the dividend or income, etc.
HSL and other group companies, its directors, associates, employees may have various positions in any of the stocks, securities and financial instruments dealt in the report, or may make sell or purchase or other deals in these securities from time to time or may deal in other securities
of the companies / organizations described in this report.
HSL or its associates might have managed or co-managed public offering of securities for the subject company or might have been mandated by the subject company for any other assignment in the past twelve months.
HSL or its associates might have received any compensation from the companies mentioned in the report during the period preceding twelve months from t date of this report for services in respect of managing or co-managing public offerings, corporate finance, investment banking or
merchant banking, brokerage services or other advisory service in a merger or specific transaction in the normal course of business.
HSL or its analysts did not receive any compensation or other benefits from the companies mentioned in the report or third party in connection with preparation of the research report. Accordingly, neither HSL nor Research Analysts have any material conflict of interest at the time of
publication of this report. Compensation of our Research Analysts is not based on any specific merchant banking, investment banking or brokerage service transactions. HSL may have issued other reports that are inconsistent with and reach different conclusion from the information
presented in this report.
Research entity has not been engaged in market making activity for the subject company. Research analyst has not served as an officer, director or employee of the subject company. We have not received any compensation/benefits from the subject company or third party in connection
with the Research Report.
HDFC securities Limited, I Think Techno Campus, Building - B, "Alpha", Office Floor 8, Near Kanjurmarg Station, Opp. Crompton Greaves, Kanjurmarg (East), Mumbai 400 042 Phone: (022) 3075 3400 Fax: (022) 2496 5066
Compliance Officer: Binkle R. Oza Email: [email protected] Phone: (022) 3045 3600
HDFC Securities Limited, SEBI Reg. No.: NSE, BSE, MSEI, MCX: INZ000186937; AMFI Reg. No. ARN: 13549; PFRDA Reg. No. POP: 11092018; IRDA Corporate Agent License No.: CA0062; SEBI Research Analyst Reg. No.: INH000002475; SEBI Investment Adviser Reg. No.: INA000011538; CIN
- U67120MH2000PLC152193
Mutual Funds Investments are subject to market risk. Please read the offer and scheme related documents carefully before investing.