Sustainability Report 2014-15 - Indian Oil Corporation Ltd.
104
Transformational Leadership Transformational Leadership Transformational Leadership Transformational Leadership Sustainability Report 2014-15 Sustainability Report 2014-15 Sustainability Report 2014-15 Sustainability Report 2014-15 Sustainability Report 2014-15 Sustainability Report 2014-15
-
Upload
khangminh22 -
Category
Documents
-
view
0 -
download
0
Transcript of Sustainability Report 2014-15 - Indian Oil Corporation Ltd.

Transformational LeadershipTransformational LeadershipTransformational LeadershipTransformational Leadership
Sustainability Report 2014-15Sustainability Report 2014-15Sustainability Report 2014-15Sustainability Report 2014-15Sustainability Report 2014-15Sustainability Report 2014-15
TRANSFORMATIONAL LEADERSHIP
1
IndianOil
Our Vision Report Profile, Scope & Boundary

2
SUSTAINABILITY REPORT 2014-15
This report provides an insight to the Sustainability ac�vi�es stand advancements made by IndianOil during the period 1
stApril 2014 to 31 March 2015. We have been publishing Annual Sustainability Report since 2005-06 and this is the
th10 edi�on in the series.
This Sustainability Report 2014-15: Transforma�onal Leadership complies to the fourth genera�on Global Repor�ng Ini�a�ve (GRI-G4) guidelines. The informa�on shared in this report is in accordance with GRI-G4’s comprehensive repor�ng op�on. We also adhere to the principles of the United Na�ons Global Compact (UNGC) and this report describes ini�a�ves we have taken for systema�c implementa�on of these principles and guidelines.
Report Profile, Scope & Boundary
To prepare sustainability report 2014-15, we have iden�fied and priori�zed the issues that are most relevant to our opera�ons & stakeholders and are under our direct control. Addi�onally, through stakeholder engagement, we seek internal and external perspec�ves to help us iden�fy, understand and consider the risks and opportuni�es associated with new and emerging issues, regula�ons, standards and leadership prac�ces.
While preparing the sustainability report, we con�nued to seek quality and transparency in our performance management and data valida�on. This report has not been assured by a third party. Although, we acknowledge the value of external assurance, we have opted to give priority to developing our in-house process in an effort to further improve our work.
The sustainability performance of our subsidiaries/ Group’s Associates is not included in the Sustainability Report 2014-15, though their financial performances are included in IndianOil’s Consolidated Financial Statements, as a part of the Annual Report, for the year 2014-15. For doing the materiality analysis, only the installa�ons under the direct control of IndianOil have been considered, JVs and subsidiaries are not included. There have been no significant changes from the last repor�ng period in the scope, boundary, or measurement methods applied in the report. There are no restatements from the previous year.
Report Profile, Scope & Boundary
Our Vision Contents
3
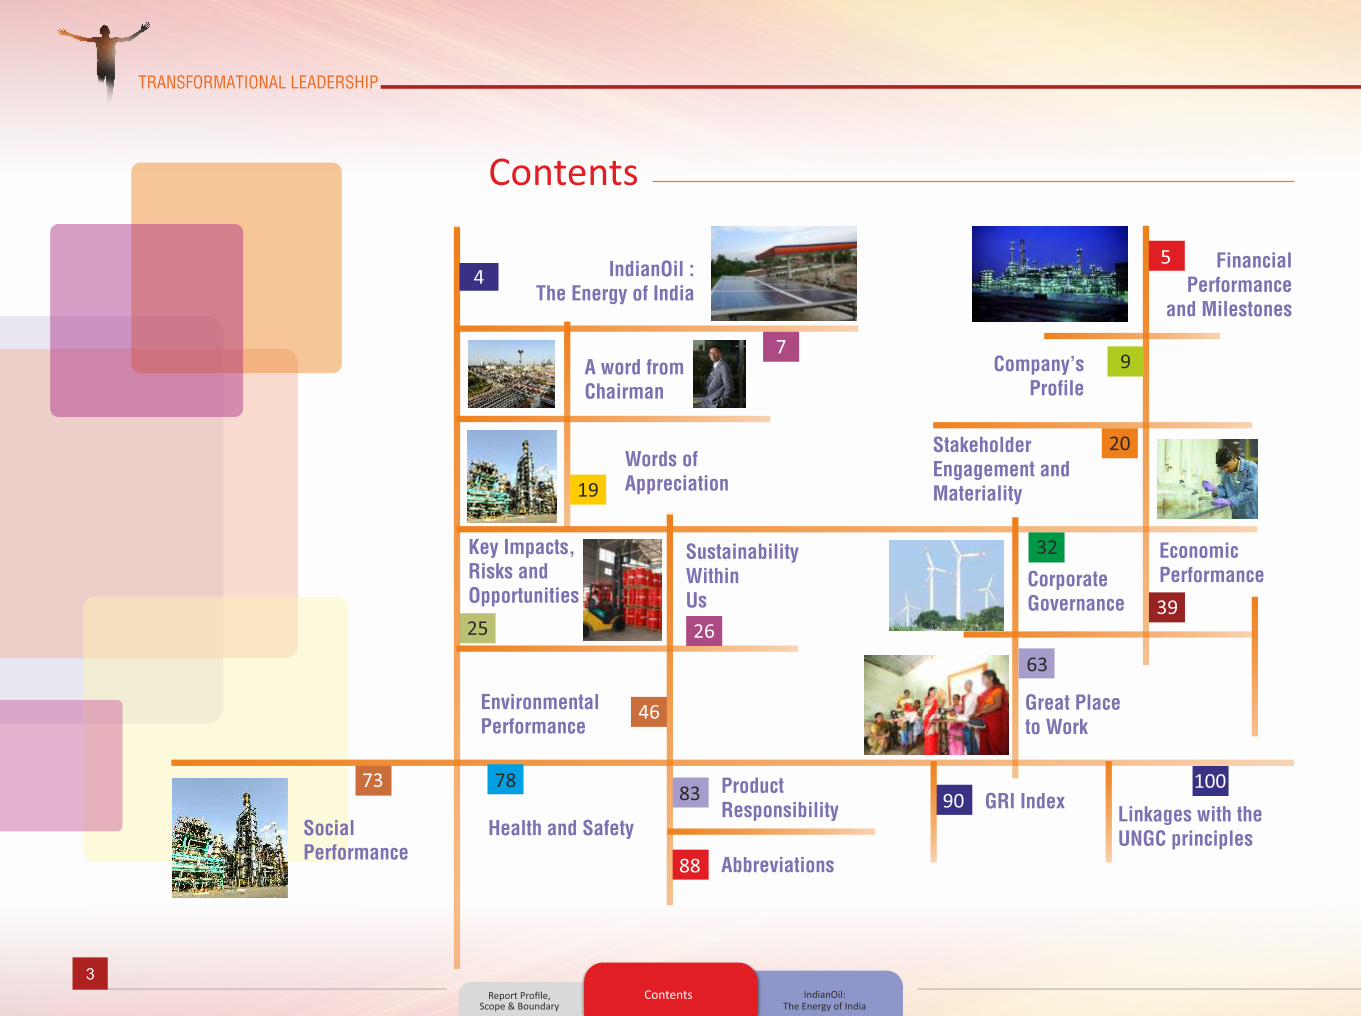
Contents
IndianOil : The Energy of India
A word from Chairman
Words of Appreciation
Key Impacts,Risks and Opportunities
SustainabilityWithinUs
EnvironmentalPerformance
FinancialPerformance
and Milestones
Company’s Profile
StakeholderEngagement andMateriality
CorporateGovernance
EconomicPerformance
Great Place to Work
Contents
TRANSFORMATIONAL LEADERSHIP
45
79
19
20
25 26
32
39
46
63
73
Social Performance
78
Health and Safety
83 ProductResponsibility
88 Abbreviations
90 GRI Index100
Linkages with theUNGC principles
Report Profile, Scope & Boundary
IndianOil: The Energy of India

4
SUSTAINABILITY REPORT 2014-15
IndianOil: The Energy of India
• Maharatna Company; GoI Control: 68.57%
• Government nominated Directors on IOC Board
• Overa l l 384 patents as on 31.03.2015
• New focus on Alternate and Renewable Energy (Wind, Solar, Biofuels, Nuclear)
• Consistent growth and profitability
FY11-FY15 Revenue CAGR: 10.37%
Debt-to-Equity ra�o of 0.81 (as on March 31, 2015)
Strong Support from the Govt. of India
Strong Focus on Innova�on through R&D and Alternate Energy Sources
Driven by a Management Team that has Delivered Results
• 10 refineries (including subsidiaries) with 65.7 MMTPA Capacity
• 31% of Domes�c Refining Capacity
Largest Refiner of the na�on
• 11,000+ km pipelines of crude oil, products and natural gas with a total capacity of 80.5 MMTPA
Pan-India Pipeline Infrastructure
• 46.7% petroleum market share with over 42,900 touch points
Leading Market Share Across Por�olio
• 2nd largest domes�c player in Petrochemicals
• E&P: 10 domes�c and 7 overseas blocks
Integrated Opera�ons Across the en�re Energy Value Chain
IndianOil: The Energy of India
ContentsFinancial Performance
& Milestones

5Financial Performance
& Milestones
TRANSFORMATIONAL LEADERSHIP
Highest ever crude oil pipelines throughput achieved, a capacity utilization of 118%
47.78 MMT 75.68 MMTHighest ever pipelines throughput achieved
41% Procurement from MSMEs during 2014-15
Capacity utilization at refineries.
98.9%
Ethanol procured for blending into petrol during 2014-15.
186100 KLs
Highest throughput achieved by gas pipeline.
1364 MMSCM
Best ever combined distillate yield achieved.
78.8wt%
New domestic LPG connections released.
72.6 lakh
New crudes processed for the first time across the refineries.
14
New lubricant formulations developed during the year.
18
INDANE customer strength
887.6 lakh
Naphtha cracker, Panipat is the largest
operating cracker capacity in India producing polymer intermediaries.
New customers enrolled under 5-kg free trade LPG (FTL) cylinders
15975
Best ever MBN achieved during 2014-15
54.4
Regular fuel stations fully-automated.
7687
Financial Performance & Milestones
IndianOil: The Energy of India
Indane Story

6
SUSTAINABILITY REPORT 2014-15
Indane:A Superbrandafter 50 yearsthat nowlights re in 9 crorekitchens
Indane StoryFinancial Performance & Milestones
A word from Chairman
Source: The Times of India

7
A word
from
Chairman
Dear Stakeholders,
Warm greetings on behalf of IndianOil.
As IndianOil comes out with the tenth edition of its Annual S u s t a i n a b i l i t y Re p o r t , fo c u s s i n g t h i s t i m e o n 'Transformational Leadership,' I take this opportunity to share my thoughts on the subject with you all.
For me, sustainability is the pursuit of growth and development while ensuring that our natural capital and environmental resources are managed in a judicious way and preserved undiminished and unspoiled for similar use by our future generations.
With this concept gaining ground as the new yardstick of economic, environmental and social performance of nations, various new or modified indices are being proposed worldwide to gauge water, energy and carbon footprints across the value chain and life-cycle of products, processes and services in our ecosystem. This would help us measure, manage and curb the adverse affects of climate change, which is no longer a distant threat but a stark reality today.
With the growing population density of the planet, the coming decade will usher in significant changes in the energy sector, with new technologies, demographic shifts and infrastructure growth leading the impact. In India too, the surge in economic growth in recent years is straining energy supply, infrastructure and transportation systems. Ensuring energy security while at the same time reducing the negative impact of carbon emissions on climate is indeed a major challenge.
IndianOil, as a public sector enterprise, well understands that its role goes beyond profits. For over five decades, we have been working on providing energy access for people in every nook and corner of the country. With countrywide operations, we are uniquely well-placed to fuel the growing
TRANSFORMATIONAL LEADERSHIP
A word from ChairmanIndane Story Company's Profile

8
SUSTAINABILITY REPORT 2014-15
Indian economy by optimising energy consumption, besides expanding infrastructure and operations in line with future demands. Our sustainable development agenda helped us ingrain sustainable practices into all our core business activities, setting aggressive energy efficiency and renewable energy targets.
Since inception, we have been pursuing pipeline transport of crude oil and petroleum products, through ‘underground highways,’ for its proven environmental and other benefits over road and rail transport. In fact, IndianOil’s 432-km Guwahati-Siliguri petroleum products pipeline was the first to be built east of the Suez Canal, way back in 1964. Over the years, our cross-country pipelines network has expanded to over 11,220 km and serves as a low-carbon channel to be able to transport up to 80 million metric tonnes of crude oil and products annually. And this network is being further expanded by 6,000 km in length and 22 million tonnes in throughput capacity per annum.
Similarly, IndianOil’s 10 operating refineries are setting new benchmarks year after year in boosting distillate yield and reducing fuel & loss and energy consumption intensity. In 2014-15 itself, structured energy conservation projects at each of these refineries enabled us save 1,07,000 tonnes of standard refinery fuel.
On the marketing front, IndianOil has already extended avai labi l i ty of Bharat Stage- IV compl iant green transportation fuels to over 50 major cities, with countrywide rollout targeted by the year 2017. At the same time, plans are underway to introduce fuels meeting BS-VI norms by 2020. The ethanol-blended petrol programme and introduction of bio-diesel are also significant steps in greening fuels. Gas as another green fuel in place of conventional liquid fuels has been another focus area for IndianOil, with sales touching 3.4 million metric tonnes per annum in less than a decade.
Renewables are indispensable to the energy mix of the future. With this perspective, IndianOil has grown its generation capacity for renewables, that is, wind and solar energy, to 75 MW, and generated 140 million units of clean electricity last year, thereby reducing its carbon footprint by 0.1 million tonnes.
Conversion of fuel stations to operate on solar energy, in place of electricity or diesel gensets, is a thrust area. As of now, over 2,660 IndianOil fuel stations run on solar energy, and their cumulative installed capacity is about 10.2 MW. And their number is rising fast. Switching over to automated, efficient plant equipment across the supply chain and Corporation-wide use of LED lights have been other thrust areas.
Water is another indispensable and scarce resource, more so in India, which sustains 17% of the world’s population with merely 4% of the world’s fresh-water reserves. Falling water levels can severly impact industrialisation. To tackle this challenge in its own way, IndianOil has imbibed water conservation and waste management measures in its day-to-day operations. Our rainwater systems harvest 2.7 million cubic metres of water annually. Additionally, many inititiatives are being practised to save water & steam, and to treat & reuse effluents at our refineries to maximise water-use efficiency.
With an aim at providing an overarching framework of sustainability within which CSR is firmly ingrained, our Sustainability Policy and Corporate Social Responsibility Policy have been merged as Sustainability & CSR Policy in pursuant to the new guidelines by DPE. The merged policy envisions energy solutions with minimum environmental impact and enhanced quality of life of the community, towards sustaining a holistic business.
Our R&D Centre has pioneered cutting-edge innovations in
bio-remediation, lubricant formulations, fuel technologies and fuel additives to offer better and cleaner products. We are investing in futuristic clean technologies like synthetic fuels, bio-fuels from lignocellulose & algae, fuel cells, Hydrogen-CNG blends, shale oil, etc. Harnessing futuristic energy sources will be the hallmark of a better tomorrow. In this direction, IndianOil has taken initiative of setting up IndianOil Centre for Alternative & Renewable Energy (i-CARE) at Manesar, near Delhi. i-CARE will focus on bio, solar, thermal & hydrogen energy and fuel cells.
To us, business is about creating partnerships and giving back to the communities in which we operate and seek support from. We are touching and transforming lives through our CSR programmes in healthcare and sanitation, education and vocational skills and empowerment of women and marginalised groups.
Leadership in sustainability-driven transformation requires not just an all-encompassing vision but a detailed action plan at the systemic level, within organisations and from individuals. Each time we do undertake a green initiative, we set in motion rejuvenation and renewal of the resources on Planet Earth. Such ripples created by each one of us will have a cascading effect and help us bring the desired change to build a low-carbon future.
We, at IndianOil, have realised that life is filled with choices. But a good choice can only be made with the knowledge of what we stand for and the path we want to take. To create a better world together. We look forward to your valuable suggestions at [email protected]
B. AshokChairman
A word from ChairmanIndane Story Company's Profile

9
IndianOil Corpora�on Limited is India’s flagship Maharatna na�onal oil company with a sales turnover of ` 4,50,756 crore (US$ 73.7 billion) and a profit of ` 5,273 Crore for the year 2014-15. With a ranking of 119 in the “Global 500” Lis�ng of world’s largest corporates, we are the highest ranked Indian Corporate. Its network of over 43,000 customer touch-points takes petroleum products to every nook and corner of the country. Having set up 6 overseas subsidiaries including Sri Lanka, Mauri�us, Sweden, USA, the Netherlands and UAE, 3 Indian subsidiaries and jo int–venture with 17 companies, IndianOi l i s simultaneously scou�ng for new business opportuni�es in the energy markets of Asia and Africa.
Since our incep�on more than half a century ago, we have grown from strength to strength. IndianOil accounts for nearly half of India's petroleum products market share, 31% na�onal refining capacity (together with its subsidiary Chennai Petroleum Corpora�on Ltd., or CPCL), and 71% downstream sector pipelines throughput capacity which equals 80.5 MMTPA. IndianOil’s avia�on service has 63.6% market share in avia�on fuel business and serves na�onal and interna�onal flag carriers, private airlines and the Indian defence services.
The IndianOil Group owns and operates 10 of India's 22 refineries with a combined refining capacity of 65.7 MMTPA (million metric tonnes per annum), i.e., approx. 1.31 million barrels per day. The pipelines network has a crude oil and petroleum products throughput capacity of 80.49 MMTPA and 9.5MMSCMD for gas. The 15-MMTPA refinery under commissioning at Paradip on the east coast will raise the capacity to over 80 MMTPA.
IndianOil has largest LAB (Linear Alkyl Benzene) plant. An integrated PX/PTA (Paraxylene/Purified Terephthalic Acid) complex is the single largest unit in India, with a world-scale
capacity of 5,53,000 MTPA, and produces polyester intermediates. We have a worldclass Naphtha Cracker with downstream polymer units, is the largest opera�ng cracker capacity in India producing polymer (plas�cs) intermediates. IndianOil is the second largest player in the domes�c petrochemicals market, besides expor�ng to about 70 countries.
Significant progress has been made in the Corpora�on's drive to build its Explora�on & Produc�on por�olio, which now consists of par�cipa�ng interests in 10 domes�c and 7 overseas ac�ve assets. The Corpora�on has three producing assets, viz., Niobrara Shale Project (USA), Pacific Northwest LNG Project (Canada) and Carabobo Project (Venezuela).
IndianOil is also broadening its energy basket with alterna�ve energy op�ons such as wind, solar, bio-fuels and nuclear power.
IndianOil has a strong por�olio of powerful and much-loved energy brands that include Indane (LP Gas), SERVO (lubricants), XTRAPREMIUM (petrol), XTRAMILE (diesel) and a full slate of petrochemical products and intermediates under the brand name PROPEL.
IndianOil has successfully combined its corporate social responsibility agenda with its business offerings, mee�ng the energy needs of millions of people. The Corpora�on partners communi�es in which it operates by suppor�ng innumerable ini�a�ves connected with health, family welfare, educa�on, environment protec�on, provision of potable water, sanita�on, and empowerment of women and other marginalised groups.
IndianOil ‘The Energy of India’ is mee�ng the growing energy needs of billions of people in economically, environmentally and socially responsible way. This involves running our opera�ons responsibly today and building a dependable and sustainable energy system for tomorrow.
Company's Profile
TRANSFORMATIONAL LEADERSHIP
Company's Profile
A word from Chairman Words of Apprecia�on

10
SUSTAINABILITY REPORT 2014-15
Company's Profile
• Make safety an a�tude• Improve opera�onal
efficiency, safety and reliability, which enables much more than just cost saving
• Focus on safety and reliability of infrastructure
• Keep the workforce a�uned to produc�vity and possible dangers
Operational excellence
• Excel in customer service delivery• Be ahead of the compe��on• Aim to be the 'Company of Choice'• Design processes for the sole benefit
of customers
Sustaining leadershipin core business
Enhancing our reputation& brand value
• Build our brand value through ac�ons• Let our ac�ons reflect• Imbibe and reflect the core values of Care,
Innova�on, Passion and Trust in our demeanour
• Need to reduce costs to be�er financial standing
• Minimise costs and maximise speed• Op�mise crude and product slates• Simplify our processes and
procedures• Seek out technology that enhances
simplicity and sustainability
Financial Prudence
• Shape aspira�ons and form common goals
• Help each employee find purpose in his/her work
• Invest in building competencies and capabili�es
• Develop the next genera�on of leaders
• Encourage people to take defini�ve, bolder decisions
Investing in our peopleLeveraging our assets
• Find be�er ways of execu�on that ensures quality, �me and cost-effec�ve implementa�on
• Keep reviewing strategies periodically
• Stay relevant for the future• Be open to opportuni�es
Shaping the future of IndianOil
Excellent
Very Good
Good
Average
Poor
A word from Chairman Words of Apprecia�on

11Company’s Profile
TRANSFORMATIONAL LEADERSHIP
Refineries
10 out of 22 refineries in the country
65.7 MMTPA Capacity
Pipelines
Gas
E&P
Total length of 11221 km of crude oil, product and gas pipeline
Marke�ng
42753 touch points* 24405 ROs including KSKs 8.88 crore Indane LPG
customers
R&D
Pioneer in Lube Formula�ons 384 patents INDANE nanocut - first
commercialised nanotechnology ini�a�ve
nd 2 largest player in India 25% market share with
18% capacity share
Petrochemicals
City gas distribu�on Gas marke�ng Co-promoter in M/s
PETRONET LNG Limited
Wind: 69.3 MW On-grid Solar: 5 MW 1398 ROs Solarised
during 2014-15
10 domes�c blocks 7 overseas blocks
Alternate Energy
* Customer touchpoints include AFS terminals, ROs, KSKs, SKO/LDO dealers, Consumer pumps and LPG distributors)
Our Businesses
A word from Chairman Words of Apprecia�on

12
SUSTAINABILITY REPORT 2014-15
Company’s Profile
Our Brands
A word from Chairman Words of Apprecia�on

13
TRANSFORMATIONAL LEADERSHIP
Sri Lanka UAE USA
Foreign Subsidiaries
E & P Sites
Libya Gabon Nigeria Yemen Venezuela Canada USA
Global footprint
Company’s ProfileA word from Chairman Words of Apprecia�on

14
SUSTAINABILITY REPORT 2014-15
Company’s Profile
Our Supply Chain
24405 Retail Outlets
136Oil Depots & Terminals
7934 LPG Distributors
96Aviation Fuelling Stations
6399Consumer Pumps
91LPG Bottling Plants
80Pipelines Terminals
3919SKO/LDO Dealers
3 Wind Power Projects
1 New Refinery under commissioning
11Explosives Plants
10 Lube Blending Plants
8 Operating Refineries
3 Petrochemical Producing Plants
1 R&D Centre
1 CryogenicPlant
Oil
1 Solar Power Plant
A word from Chairman Words of Apprecia�on

15
Group Companies
Name Business
Chennai Petroleum Corpora�on Limited Refining of petroleum products
IndianOil - CREDA Biofuels Limited Planta�on of Jatropha and extrac�on of oil for Bio-diesel
Indian Catalyst Pvt. Limited Manufacturing of FCC catalyst / addi�ve
IndianOil (Mauri�us) Ltd., Mauri�us Terminalling, Retailing & Avia�on refuelling
Lanka IOC PLC, Sri Lanka Retailing, Terminalling & Bunkering
IOC Middle East FZE, UAE Lube blending & marke�ng of lubricants
IOC Sweden AB, Sweden Investment company for E&P Project in Venezuela
IOCL (USA) Inc., USA Par�cipa�on in Shale Gas Asset Project
IndOil Global B.V. , The Netherlands Investment company for integrated LNG Project in Canada
Indian Subsidiaries
Foreign Subsidiaries
Company’s Profile
TRANSFORMATIONAL LEADERSHIP
Group Companies
A word from Chairman Words of Apprecia�on

16
SUSTAINABILITY REPORT 2014-15
Name Business Partners
Avi-Oil India Pvt. Ltd. Speciality lubricants NYCO SA, France and Balmer Lawrie & Co. Ltd.
Delhi Avia�on Fuel Facility Private Limited Se�ng up and opera�on of Avia�on Fuel Facility at Delhi Airport.
DIAL and BPCL
Green Gas Ltd. City gas distribu�on GAIL
GSPL India Transco Ltd. Se�ng up of Natural Gas Pipelines GSPL, HPCL, BPCL
IOT Infrastructure & Energy Services Ltd. Terminalling services Oiltanking GmbH, Germany.
IndianOil Adani Gas Pvt. Ltd. City gas distribu�on Adani Gas Ltd.
IndianOil Petronas Pvt. Ltd. Terminalling services and parallel marke�ng of LPG Petronas, Malaysia.
IndianOil Ruchi BioFuels LLP Bio Fuel related ac�vi�es Ruchi Soya
IndianOil Skytanking Ltd. Avia�on fuel facility projects IOT Infrastructure & Energy Services Ltd ., SkytankingGmbH, Germany.
Kochi Salem Pipelines Pvt Limited BPCLLaying pipeline for transport of LPG from Kochi to Salem
Indian Synthe�c Rubber Limited Manufacturing of Styrene Butadiene Rubber at Panipat TSRC Taiwan and Marubeni Japan
Lubrizol India Pvt. Ltd. Lube Addi�ves Lubrizol Inc., USA
Mumbai Avia�on Fuel Farm Facility Pvt. Ltd. BPCL, HPCL, & MIALSe�ng up of common -user integrated avia�on fuel infrastructure.
NPCIL – IndianOil Nuclear Energy Corpora�on Limited For se�ng up Nuclear Power Plant Nuclear Power Corpora�on of India Limited
Petronet LNG Ltd. LNG Imports/distribu�on BPCL, ONGC, GAIL, GDFI and ADB
Suntera Nigeria 205 Limited Oil explora�on ac�vi�es Oil India Ltd. and Suntera Resources Ltd., Cyprus
Joint Ventures
BPCL - Bharat Petroleum Corpora�on Ltd., HPCL - Hindustan Petroleum Corpora�on Ltd., ONGC - Oil and Natural Gas Corpora�on Ltd., GAIL - GAIL (India) Ltd., RIL - Reliance Industries Ltd., IL&FS - Infrastructure Leasing & Financial Services Ltd., ICICI - ICICI Bank, SBI - State Bank of India, EOL - Essar Oil Ltd., PIL – Petronet India Ltd., KPT - Kandla Port Trust, GIIC - Gujarat Industrial Investment Corpora�on Ltd., CB - Canara Bank., DIAL - Delhi Interna�onal Airport Pvt. Ltd., TSRC – TSRC Corpora�on, Taiwan, ADB - Asian Development Bank, GSPL - Gujarat State Petronet Ltd., GDF - Gaz de France, MIAL - Mumbai Interna�onal Airport Limited
Company’s Profile
Joint Ventures
A word from Chairman Words of Apprecia�on

17
Adver�sing Standards Council of India (ASCI) Na�onal
Associa�on of Business Communicators of India Na�onal
Indian Society of Adver�sers (ISA) Na�onal
Interna�onal Adver�sing Associa�on (IAA) Na�onal
Council of Indian Employers (CIE) Na�onal
All India Management Associa�on (AIMA) Na�onal
Na�onal HRD Network (NHRD) Na�onal
India Interna�onal collabora�ons (U21 Global Universitas,, Singapore, ifpFrance, etc.)
Interna�onal
Transparency Interna�onal India (TII) Interna�onal
United Na�ons Global Compact (UNGC) Interna�onal
Indian Auto LPG Coali�on (IAC) Na�onal
Indian Ins�tu�on of Industrial Engineering Na�onal
Indian LP Gas Industry Associa�on (ILPGIA) Na�onal
Interna�onal Air Transport Associa�on (IATA) Interna�onal
World LP Gas Associa�on, Paris Interna�onal
Associated Chambers of Commerce and Industry of India (ASSOCHAM) Na�onal
Confedera�on of Indian Industry (CII) Na�onal
Federa�on of Indian Chambers of Commerce and Industry (FICCI) Na�onal
Petroleum Federa�on of India (PetroFed) Na�onal
Standing Conference of Public Enterprises (SCOPE) Na�onal
TERI-Business Council for Sustainable Development Na�onal
Associa�ons Region
Company’s Profile
TRANSFORMATIONAL LEADERSHIP
Associa�ons, Charters & Membership
A word from Chairman Words of Apprecia�on
18
SUSTAINABILITY REPORT 2014-15
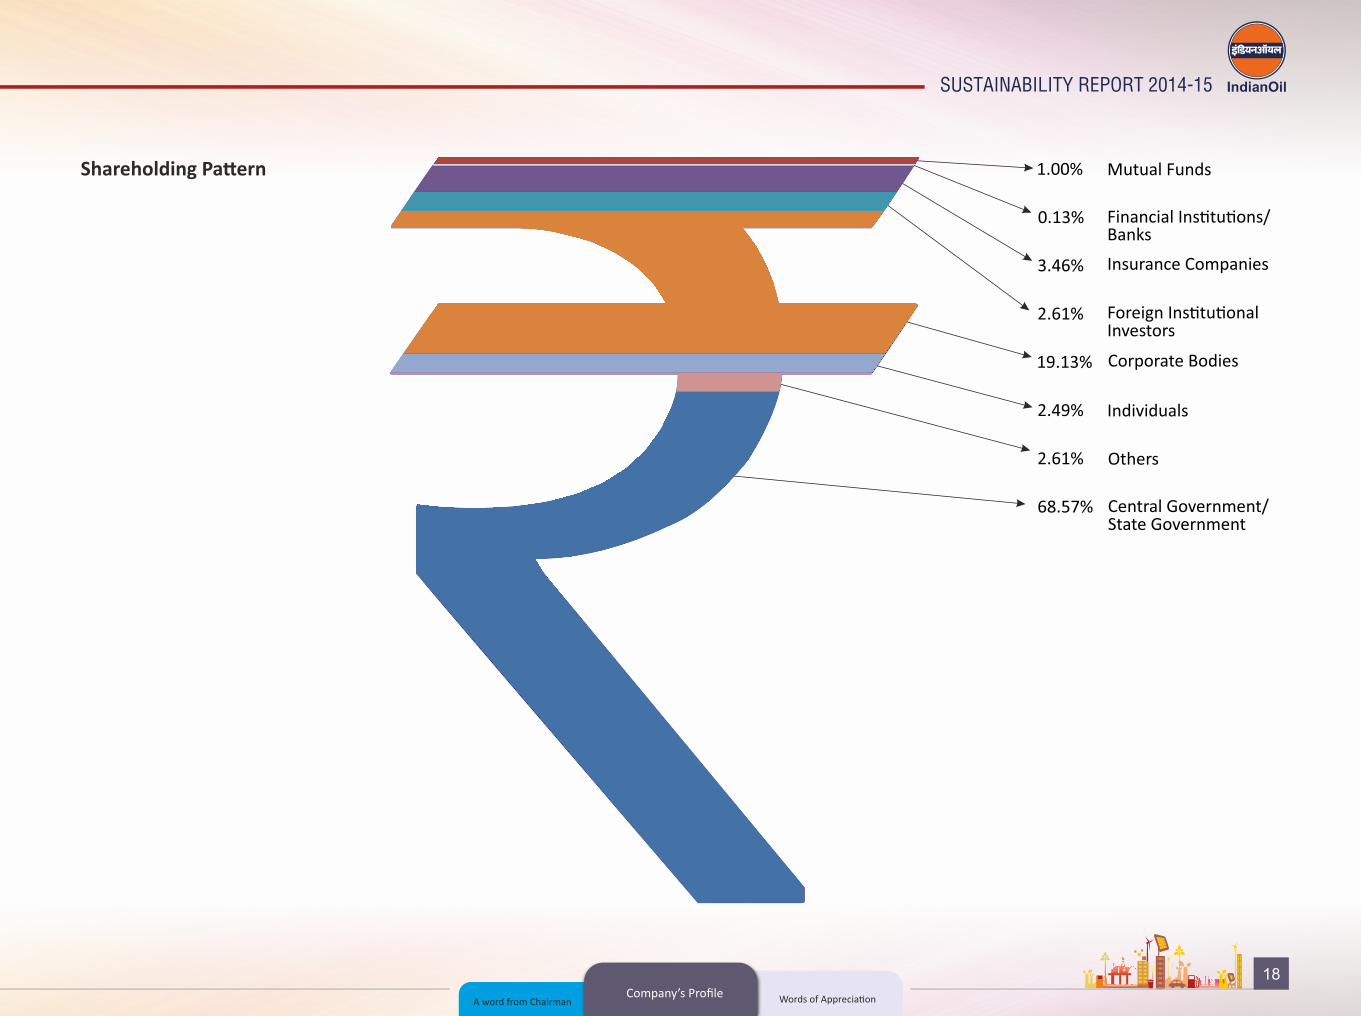
68.57%
1.00%
0.13%
3.46%
2.61%
19.13%
2.49%
2.61%
Company’s Profile
Central Government/State Government
Mutual Funds
Financial Ins�tu�ons/Banks
Insurance Companies
Foreign Ins�tu�onal Investors
Corporate Bodies
Individuals
Others
Shareholding Pa�ern
A word from Chairman Words of Apprecia�on

19Words of Apprecia�on
IndianOil was ranked 119th among the world's largest corporates (and first among Indian enterprises) in the pres�gious Fortune 'Global 500‘ lis�ng for the year 2015
IndianOil retained its top posi�on among corporate lis�ngs by Fortune 'India 500', Financial Express 500 and The Economic Times 500 lis�ngs in 2014
IndianOil was conferred the SCOPE Meritorious Award-2014 (Gold Trophy) for CSR and Responsiveness by the President of India. The award was ins�tuted by the Standing Conference of Public Enterprises.
IndianOil won the 'Reader's Digest Most Trusted Brand' Gold Award for the 8 th �me in a row in the Petrol Sta�on category. The award is in recogni�on of IndianOil's constant endeavour to provide world-class fuels and services to customers at its fuel sta�ons.
IndianOil won the annual Express Logis�cs and Supply-chain Leadership Award for the seventh �me in a row, in the category of 'Excellence-Oil & Gas.' The award is one of the most coveted industry recogni�ons.
IndianOil has been adjudged as the second Best Company in Public Sector in India by the annual survey conducted by the Great Place to Work (GPW) Ins�tute, India, and The Economic Times in 2014.
IndianOil won the 'Global Human Resources Development Award-2014‘ in the category 'Improved Quality of Working Life' ins�tuted by the Interna�onal Federa�on of Training & Development Organisa�ons (IFTDO).
IndianOil's R&D Centre was adjudged the winner in the category of Innova�on in Green Polymeric Materials & Products at the 4th Na�onal Awards for Technology Innova�on in Petrochemical & Downstream Plas�cs Processing Industry. IndianOil's Petrochemicals Group was adjudged runner-up for 'Innova�on in Polymeric Material' at the same event.
Project Chetna training programme for customer a�endants manning IndianOil fuel sta�ons bagged the coveted ATD (Associa�on for Talent Development, USA) 'Excellence in Prac�ce' cita�on for 2014
IndianOil also won the 9th BML Munjal Award for Business Excellence through Learning and Development in the Public Sector category.
IndianOil Marke�ng Division has bagged an award under the 'Innova�on Architect' category for a bouquet of applica�ons designed and developed by its IS group at the 9th Annual Symposium & Awards ceremony organised by CIO-100, an exclusive forum of corporate representa�ves who have contributed significantly to the IT industry.
IndianOil's Haldia and Panipat refineries won the pres�gious Greentech Environment Award-2015 and Greentech Safety Award-2014 in Pla�num category for outstanding achievement in environment protec�on and safety respec�vely. Panipat refinery was conferred the Greentech Environment Award-2014 in Gold category. The awards were conferred by Greentech Founda�on, Delhi.
The Quality Control Department of Marke�ng Division HO was conferred the Golden Peacock Na�onal Quality Award-2014 given out by the Ins�tute of Directors, being one of the most well-known corporate excellence awards worldwide.
The Governor of Maharastra, Mr. C Vidyasagar Rao, presented the Navshak� Sanman Sandhya CSR award to IndianOil, in recogni�on of its stellar efforts in enriching Corporate Social Responsibility with various social ini�a�ves.
IndianOil - North Zone won the pres�gious OISD (Oil Industry Safety Directorate) award in the POL Marke�ng Organisa�ons category for the year 2012-13.
IndianOil was bestowed with the 'Best Vendor' award by M/s. Hyundai Motors in 'Oil & Chemicals - A�er-Market' category.
TRANSFORMATIONAL LEADERSHIP
Words of Apprecia�on
Company’s ProfileStakeholder Engagement
& Materiality

20
SUSTAINABILITY REPORT 2014-15
In IndianOil, stakeholder engagement is an on-going process to connect with stakeholders in a variety of ways. We regularly communicate the progress on material aspects concerning our stakeholders using earmarked channels. As our opera�ons are spread over the geographical span of the na�on, we cater to diverse stakeholder group and resolve the issues with mutual concern.
Stakeholder analysis helps to review and consider the impact our stakeholders can have on our business and its goodwill. At IndianOil, we understand the importance of listening to our stakeholders and act accordingly. We have a vast number of forums in place, for our stakeholders, to communicate with us regularly. These channels help us to gain deeper insights into the expecta�ons that our stakeholders have. Considering the vast expanse of the organiza�on, we cater to a wide array of stakeholders and resolve issues, if any, with mutual concern. We have adopted a structured approach in sustainable business prac�ces while crea�ng enduring value for all our stakeholders.
IndianOil has endeavoured to ins�tu�onalise these exis�ng rela�onships through a formal process that includes:
Shareholders BuisnessPartner/Vendor Customer
Community
Employees /Contractors Government/
RegulatoryBodies
NGOs
Academia
Media
Industry/TradeAssociation
Advocacy/Advisory groups
FinancialInstitutions
Stakeholder Engagement & Materiality
Iden�fica�on and
priori�sa�on of concerns and needs
Iden�fica�on of key
stakeholders
Consulta�on with the key stakeholders
Addressing the priori�sed concerns and
needs in a consistent
and transparent manner
Our pan-India presence and nature of business enables usremain engaged with a versatile array of stakeholders.
Stakeholder Engagement & Materiality
Our Stakeholders
Words of Apprecia�onKey impacts, Risks &
Opportuni�es

21
Stakeholders EngagementWe develop and maintain communica�on prac�ces and ongoing rela�onships to learn more about our stakeholders’
Stakeholder Engagement & Materiality
Minutes of Mee�ng, Ac�on
Plan
Feedback on company's
website
Mee�ngs
Shareholders/ Investors GrievanceCommi�ee
(SIGC)
Dedicated email, Mee�ngs etc. Mee�ngs
Community feedback,
Minutes of Mee�ng
- Investor Service Cell
- Dedicated email
Employee Sa�sfac�on
Survey
Customer Sa�sfac�on
Survey, Feedback
Government/Regulatory
BodiesMedia
Industry/ Trade
Associa�ons Shareholders
Business Partners/
ContractorsNGOs Financial
Ins�tu�ons
Employees
Customers
Community
Mee�ngs, Industry forum
Website, EventsMee�ngs/ Seminar/
Workshops
Annual General Mee�ngs,
Regular Communica�on
through website, Report
etc
Dealer/ Distributor/ KSK
Conven�ons, Transporters
Meet, Mee�ng with
Contractors/ Vendors, Seminar/
Workshops
Mee�ngs Mee�ngs, Public Hearing
Investor MeetMee�ngs,
Workshops, Surveys
Customer Surveys,
Customer Mee�ngs,
Training,Customer Educa�on Programmes/
Meet/ Grievance re-
dressal forums
Monthly Need based Monthly
Annual, Quarterly, Need
based
Annually, Quarterly, Need
basedNeed based Daily
Annually, Quarterly, As
required
Annual, Quarterly,
Monthly, WeeklyAs required
Policy implementa�on
review, Apprising the
Gov. on organiza�on
Plans and progress,
Communica�ng Industry’s
challenges and issues
Sharing informa�on to stakeholders
Policy advoca�ng,
Interfacing for policy
framing/implementa�on
Financial Performance,
Future strategies,
Shareholders concern
Supply & Distribu�on,
Q&Q, Customer sa�sfac�on
CSR Project Review/
implementa�on
Corporate Social Responsibility
ini�a�ves, Capturing
societal issues
Financial Performance,
Future strategies,
Shareholders concern
Communica�ng Policies &
Performance-Resolving
issues/ Concerns
Understand product
feedback, Sugges�ons and
Complains redressel
EngagementMechanism
Stakeholders Group
Frequency of Engagement
Key Agenda
Feedback Assessment
TRANSFORMATIONAL LEADERSHIP
opinions, percep�ons and expecta�ons. Other than conduc�ng regular surveys, we monitor the brand’s social media profile, press rela�ons and published content, communica�on and engagement prac�ces, and other
aspects. We have endeavoured to iden�fy stakeholders and successfully engaged with them to derive a mileage on all sustainability related issues and to minimise nega�ve impacts on our businesses.
Words of Apprecia�onKey impacts, Risks &
Opportuni�es

22
SUSTAINABILITY REPORT 2014-15
Customers – Exclusive website facilita�ng e-commerce as part of our business and opera�onal processes.
Communi�es – In our area of influence, we develop ini�a�ves around our opera�ng loca�ons. Addi�onally, we have social inclusion programs for local communi�es.
Academic and Scien�fic Community – Communica�on ini�a�ves for universi�es and partner ins�tu�ons, student rela�ons programs, science and technology sponsorship ini�a�ves.
C o n s u m e rs – C a l l c e nte rs , ca m p a i g n s , d i g i ta l communica�on ac�ons, and promo�onal campaigns focusing products and services.
Suppliers – Targeted communica�on ini�a�ves, events and conferences; rela�onship campaigns related to incen�ve programs.
Press – Responding to press demands, producing and sending notes, press conferences.
Investors – Specific website, telephones and e-mail addresses, Reports etc.
Civil- society organiza�ons – Systema�cally responding by mail; holding periodic mee�ngs and conferences; mobile vehicle outreach specifically for replying to ques�ons and giving advice to applicants preparing projects for public selec�on processes.
Government – Systema�c monitoring through periodic contacts with ministries.
Employees – Intranet covering all our internal sites in a single environment, IndianOil magazines, Reports, Newsle�er, campaigns and ini�a�ves. There is also a commi�ee monitoring collec�ve bargaining.
Retailers – Targeted publica�on for retailers.
Stakeholder Engagement & Materiality
Dialogue with Stakeholders
CustomerFirst
Words of Apprecia�onKey impacts, Risks &
Opportuni�es

23
Materiality Analysis
Materiality
Materiality assessment carried out in the year 2014 and our internal assessment of stakeholder needs con�nue to drive sustainability ini�a�ves at IndianOil. The management and a robust in-house repor�ng system provide mandatory assurance over the materiality of the informa�on and data which is reproduced in this report from our database maintained at respec�ve loca�ons. Our materiality analysis is based upon the following three �er structured approach:-
Iden�fica�on of Material Aspects
IndianOil assessed its relevance in terms of the boundary of the impacts for each GRI-G4 defined aspect. Addi�onally, IndianOil also cognised for business sector specific topics based on GRI Sustainability Topics for Sectors.
The vast range of internal and external data, including analyst reports, media ar�cles and stakeholder feedback was evaluated and the most relevant issues were iden�fied. The result was a list of material aspects considering their significance to the business and a matrix of aspects iden�fied to be material for the key stakeholders.
Priori�za�on of Issues
In order to priori�se the material aspects iden�fied, the degree of importance for each material aspect to its key stakeholders and the business is further assessed.
The basis for material issues priori�za�on are the key concerns, needs and expecta�ons of stakeholders iden�fied through past as well as on-going engagement.
Valida�on
We conducted an in-depth stakeholder mapping exercise and iden�fied important key external stakeholders. Subsequently, Cross sec�ons of internal stakeholders were surveyed through personal interviews and an online ques�onnaire to determine the issues material to IndianOil.
Based on the inputs, the materiality matrix was prepared which provided a reasonable and balanced picture of the organisa�on’s Triple Bo�om Line impacts and its performance. However, in this report, only the cri�cal issues, which are of high concern to stakeholders and Company are considered. The cri�cal material issues together with our ac�on plan are described under respec�ve topics as Disclosure on Management Approach.
Sustainability Hub is an innova�ve idea to adopt a collabora�ve approach in resolving the Sustainability issues which are common to CPSEs, especially in implemen�ng the sustainability agenda. The key issues were also discussed among the other PSUs like ONGC, OVL, BPCL, HPCL GAIL, PCRA and NTPC through an established forum.
The Hub members have formed four thema�c groups viz. carbon, water, waste and sustainability repor�ng to analyse the Sustainability issues which are of high relevance to the business and stakeholders.
Hig
hLo
w
Low
Stakeholder Engagement & Materiality
High
• Labour Rights• Regulatory & Legal
Challenges• Product Reach &
Availability
• Economic Performance• Opera�onal Efficiency• Safety of Property &
People• Statutory Compliance
• Sustainable Supply Chain• Climate Change• Customer Reten�on• Responsible Sourcing• Product Service Quality & safety• Materials Usage Efficiency• Training & Development• An�-Corrup�on Measures• Security & Safety of Informa�on
System
• Human Rights• Impact on
Communi�es• Impacts on
Biodiversity
TRANSFORMATIONAL LEADERSHIP
Imp
ort
ance
to
Sta
keh
old
ers
Impact to IndianOil
Sustainability Hub
Words of Apprecia�onKey impacts, Risks &
Opportuni�es

24
SUSTAINABILITY REPORT 2014-15
Materiality Table Linkages
Stakeholder Engagement & Materiality
Topics Materiality Issues for IndianOil Corresponding GRI G4 Material AspectAspect Boundary outside IndianOil
Environmental Performance
Opera�onal Efficiency Energy, Water, Products & Service, Transport Our Transport Service Provider
Impacts on Bio - Diversity Biodiversity Not Material
Social Performance
Labour Rights Labor/Management Rela�ons , Diversity and Equal Opportunity, Equal Remunera�on for Women and Men
Not Material
Training & Development Training and Educa�on Not Material
Impact on Communi�es Local Communi�es , Grievance Mechanisms for Impacts on Society Communi�es in which we operate
Economic Performance Economic Performance Economic Performance Not Material
Product Responsibility
Product Reach & Availability Market Presence Not Material
Sustainable Supply Chain Supplier Assessment for Labor Prac�ces Our Supplier and Contractors
Customer Reten�on Marke�ng Communica�ons Our Customers
Product Service Quality & safetyProducts and Services, Product and Service Labelling
Not Material
Materials Usage Efficiency Materials Not Material
Sustainability Within UsClimate Change
Emissions, Effluents and WasteCommuni�es in which we operate
Corporate Governance
Regularity & Legal Challenges, An�-compe��ve Not Material
Statutory Compliance Compliance Not Material
Responsible Sourcing Procurement Prac�ces Our Suppliers & Distributors
An� – Corrup�on An� – Corrup�on Our Suppliers & Distributors
Security & Safety of Informa�on System
Customer Privacy Our Customers
Human RightsSupplier Human Rights Assessment , Human Rights Grievance Mechanisms
Our Suppliers & Distributors
Health & safety Safety of Property & People Customer Health and Safety, Occupa�onal Health and Safety Our Customers and Community where we operate
Key impacts, Risks & Opportuni�es Words of Apprecia�on

25
Risk Management
We recognise that risk is an integral part of business and we are commi�ed to managing it in a proac�ve and effec�ve manner. The Corpora�on's Enterprise Risk Management involves Risk Iden�fica�on, Assessment and Categorisa�on (based on risk appe�te) and is reviewed through risk owners to op�mise risks with appropriate mi�ga�on plan.
Some of the major risks which were iden�fied during the year 2014-15 are:
Crude oil price fluctua�on: During 2014-15, there has been very sharp movements in the crude oil and product prices in the interna�onal market. During this period, Brent crude prices moved between $115-$45/barrel. As we are required to hold large crude oil inventory at any given �me in the refinery tanks, pipelines feeding inland refineries and in transit from supplier countries, any sharp varia�on in prices results in huge inventory gain/loss depending upon the price movement.
Exposure to borrowings and foreign exchange fluctua�ons: Instability in the global economy, vola�lity in exchange rate movement and capital flows pose a Risk. Given the high dependency on import of crude oil and exposure to foreign
borrowings, sharp fluctua�ons in these have a bearing on IndianOil’s financials.
Safety and security of assets and people: The huge risk poten�al of the hazards in the hydrocarbon industry calls for preven�ve ac�ons in our processes and work culture. Behaviours and human factors are widely recognised as having an important effect on accident causa�on and its preven�on. Therefore, in addi�on to strict compliance with the exis�ng s a fe t y syste m s a n d p ro c e d u re s , improvement in safety culture and personal safety behaviour is required to be addressed effec�vely for sustenance of safe working environment. Similarly, increased sensi�vity towards physical and cyber security also entails appropriate technological and human interven�ons.
Pipeline pilferage: This is emerging as a major area of concern for us. Pipeline pilferage poses a major risk to the smooth and safe management of our supply chain of the Corpora�on. Pilferages in pipelines lead to disrup�ons in crude oil and product supplies and put at risk life and property. The Corpora�on is taking a number of pro-ac�ve ini�a�ves to curtail such incidents of pilferage, such as round-the-clock monitoring, physical monitoring of right-of-
way, engagement with villagers, electronic surveillance and engagement with local police.
We have laid down the Enterprise Risk Management Policy and Procedures thereof for periodical informa�on to the Board about the risk assessment and mi�ga�on procedures. As per the ‘Risk Management Policy’ of IndianOil, a ‘Risk Management Compliance Board’ is also established which reviews the various risks associated with our businesses. The commi�ee debates all risks and related issues threadbare and devises ac�on plans to mi�gate those risks. These are, then, appraised to the Execu�ve Commi�ee, which consists of Chairman and func�onal Directors of the Board.
Six-monthly or morefrequently
Board or individual/sub-set ofthe Board or commi�ee appointed by the Board
All over India and the countries from which input crude oil is sourced.
3 to 6 years
Frequency of monitoring
To whom are results reported?
Geographical areas considered
How far into the future are risks considered?
Working of the commi�ee
Key impacts, Risks & Opportuni�es
TRANSFORMATIONAL LEADERSHIP
Key Impacts, Risks & Opportuni�es
Risk Management Commi�ee comprising of senior execu�ves monitors, accesses and discusses both, internal & external risks associated with business, diversifica�on, pricing, climate change etc. and categorizes them as ‘A’ and ‘B’ category risks. A category risk are material to the organisa�on and need immediate ac�on plan.
Stakeholder Engagement & Materiality
Sustainability Within Us
26
SUSTAINABILITY REPORT 2014-15
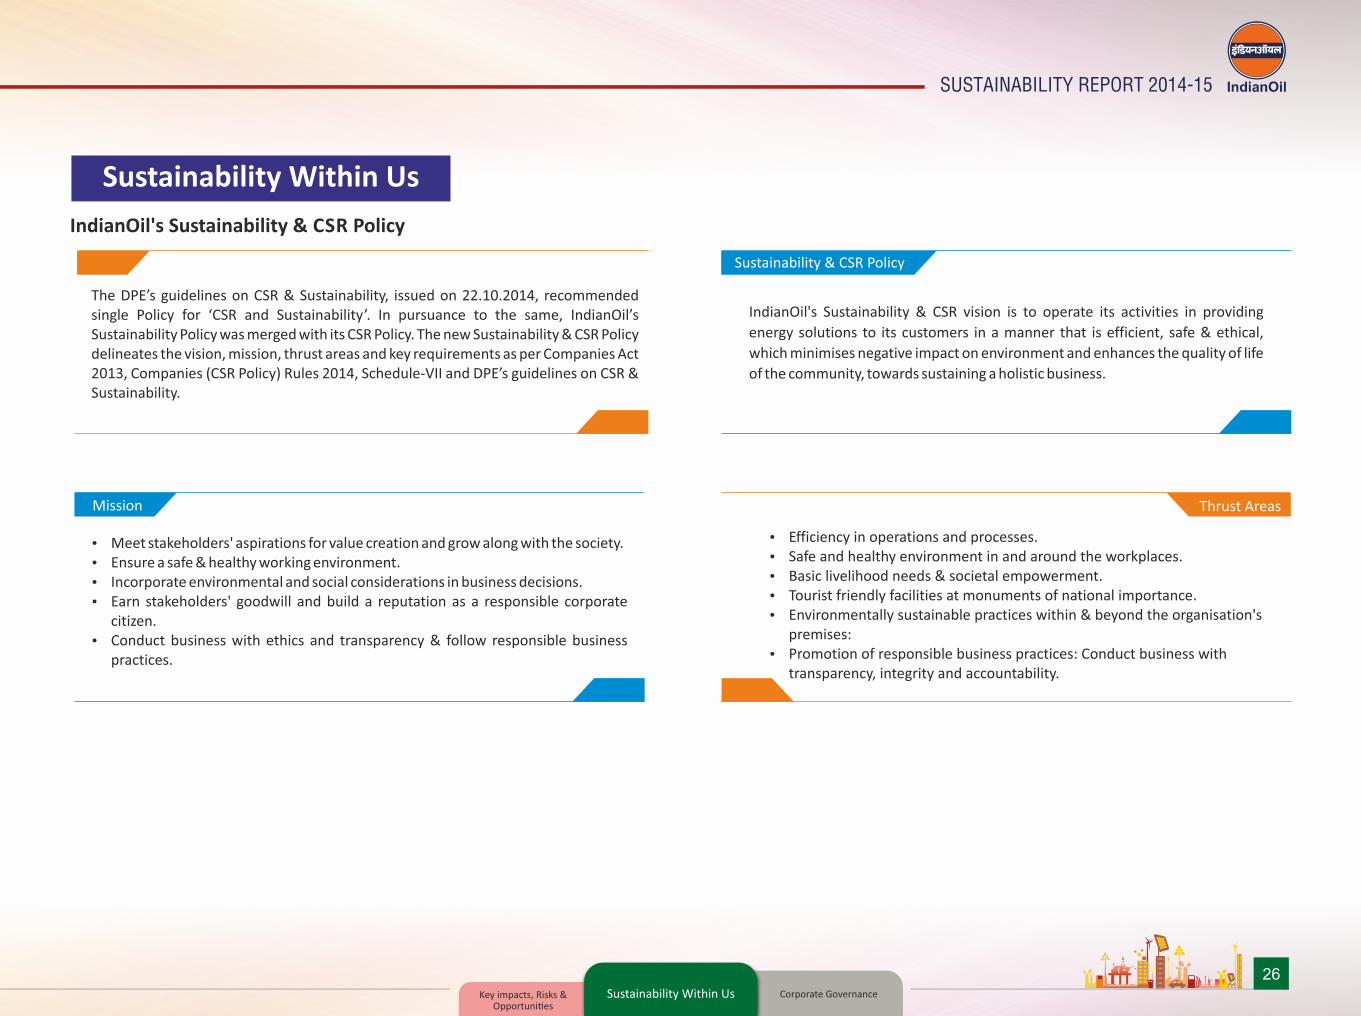
IndianOil's Sustainability & CSR Policy
Sustainability Within Us
Meet stakeholders' aspirations for value creation and grow along with the society. Ensure a safe & healthy working environment. Incorporate environmental and social considerations in business decisions. Earn stakeholders' goodwill and build a reputation as a responsible corporate
citizen. Conduct business with ethics and transparency & follow responsible business
practices.
Mission
Efficiency in operations and processes. Safe and healthy environment in and around the workplaces. Basic livelihood needs & societal empowerment. Tourist friendly facilities at monuments of national importance. Environmentally sustainable practices within & beyond the organisation's
premises: Promotion of responsible business practices: Conduct business with
transparency, integrity and accountability.
Thrust Areas
IndianOil's Sustainability & CSR vision is to operate its activities in providing
energy solutions to its customers in a manner that is efficient, safe & ethical,
which minimises negative impact on environment and enhances the quality of life
of the community, towards sustaining a holistic business.
Sustainability & CSR Policy
The DPE’s guidelines on CSR & Sustainability, issued on 22.10.2014, recommended single Policy for ‘CSR and Sustainability’. In pursuance to the same, IndianOil’s Sustainability Policy was merged with its CSR Policy. The new Sustainability & CSR Policy delineates the vision, mission, thrust areas and key requirements as per Companies Act 2013, Companies (CSR Policy) Rules 2014, Schedule-VII and DPE’s guidelines on CSR & Sustainability.
Sustainability Within Us
Corporate GovernanceKey impacts, Risks & Opportuni�es

27
We are in cognizance of the fact, that our ac�ons have an influence on the natural resources as well as our responsibility towards society and our role in addressing the menace of climate change and other sustainability challenges.
Our agenda for Sustainability stands on the pillars of minimizing our carbon, water and waste footprint. The apex body, Board Commi�ee on CSR & Sustainable Development, plans the strategies and monitors the Sustainable Development ini�a�ves. An independent department named ‘Renewable Energy and Sustainable Development” formulates strategies and implements ac�ons plans to address environmental issues such as climate change, global warming, etc. The Corporate Sustainability and CSR policy encompasses environmental, social and economical aspects of the en�re business opera�ons and iden�fies roles and responsibili�es of various departments to achieve goals of sustainable development.
During the year, Carbon and water foot prin�ng of all the loca�ons was undertaken through an IT enabled data collec�on portal, for the first �me, prior to which it used to be carried out by physical data collec�on methods. Over 50,000 trees were planted, 17 carbon neutral events were hosted and 11.5 tonnes of waste paper was recycled across our loca�ons. Measures are being undertaken to improve ground-water table by harves�ng 2,700 tkl water through 437 Rainwater Harves�ng systems. Solar power systems of about 900 kW have been installed at our installa�ons and offices across the country.
Over 2600 fuel sta�ons have been converted to operate on solar energy. Cumula�ve capacity of 8.6 MW from the solar photo-voltaic power systems installed at Retail Outlets/KSKs, with an annual genera�on capacity of 103 lakh units, has carbon emission reduc�on poten�al of 8,500 tonnes per year. Our extensive rural network has helped to sell over 1.4 lakh rechargeable solar lanterns to help replace the tradi�onal kerosene wick lamps in rural households which are yet to be grid-connected.
Sustainability planning and implementa�on in IndianOil is a combina�on of top-down and bo�oms-up approach. The philosophy and policies are designed by the senior groups and proposals as well as plans are created by the field level groups. The flow of wisdom and feedback of ac�vi�es impacts is con�nuous which helps fine-tune the policies and processes.
Sustainability Within Us
TRANSFORMATIONAL LEADERSHIP
Corporate Level
Unit Level
Head Office Level
Board Committee on CSR and SD
Alternate Energy and SustainableDevelopment Department (AE&SD)
MarketingDivision
RefineriesDivision
PipelinesDivision
R&DDivision
Installations/Office
Sustainability Grid
A total expenditure of Rs. 31.80 Crore was incurredon RE&SD ac�vi�es during the year 2014-15.
We have the largest biofuel produc�on cap�ve planta�on covering 8,000 hectares in India in the States of Chha�sgarh, Madhya Pradesh and U�ar Pradesh. Our two joint ventures, IndianOil CREDA Biofuels Ltd. and IndianOil Ruchi Biofuels LLP, have ensured our presence across the b io-fue l va lue cha in . Ethanol produc�on f rom lignocellulosic sources such as rice straw, co�on stalk, bamboo, etc., is also being ac�vely explored.
We have diversified into wind and solar energy, demonstra�ng our commitment to ensure energy availability for future genera�ons. In 2014-15, we have added 6.3 MW wind capacity to our alterna�ve energy por�olio, taking the total wind capacity to 69.3 MW. A 5 MW solar plant at Rawra, running successfully since 2012, along
with the wind capacity takes the net renewable capacity to 74.3 MW.
Steps are being taken to set up an addi�onal 200 MW of wind power and 60 MW of solar power systems. We are in the process of further expanding our renewable energy por�olio and are commi�ed to long-term value in adop�ng sustainable ini�a�ves and best-in-class technology.
Resource foot-prin�ng exercise
Under a long term plan, Carbon and water foot-prin�ng has been completed for the en�re organiza�on and waste foot-prin�ng exercise is currently in progress. Addi�onally, IOC has also undertaken SCOPE 3 carbon foot prin�ng of some of the loca�ons.
Corporate GovernanceKey impacts, Risks & Opportuni�es

28
SUSTAINABILITY REPORT 2014-15
Rain Water Harvesting
Tree Plantation
Wind Power Generation
Carbon & Water Footprinting
Solar Power Generation
Sustainability Awareness
Green Building
Energy Auditing
Sustainability Reporting
Solar Lantern Organic and Waste Paper Recycling
Energy Conservation and Energy Efficiency
Sustainability Within Us
Sustainability Initiatives
Corporate GovernanceKey impacts, Risks & Opportuni�es

29
Parameter Unit Target Actual
Energy Savings by various measures kWh 5,00,000 5,50,000
Renewable energy capacity addi�on (off-grid)
MW 3 4.9
Carbon Footprin�ng (Scope 1& 2) % 100 100
Carbon Footprin�ng (Scope 3) No. 5 5
Renewable energy genera�on (off-grid)
GWh 3 8.5
Carbon Neutral Events No. of events 15 17
Tree planta�on No. of trees planted
30,000 51,817
Waste Footprin�ng No. of loca�ons 60 64
Waste paper Recycling Kg 10,000 11,500
2014-15
Rainwater Harvested (in '000 kls)
2013-142012-132011-12
21
04
25
31
24
85
27
07
Sustainability Within Us
TRANSFORMATIONAL LEADERSHIP
Rainwater harves�ng TKl 1530 2707
Capacity addi�on of rain water harves�ng structures
Nos. 55 66
Water Footprin�ng % of loca�ons 100 100
2014-152013-14
Wind Solar Total
131 132 139 140
7.9 7.9
Total AlternateEnergy Power Genera�on (GWh)
Carbon management
Water Management
Waste Management
Corporate GovernanceKey impacts, Risks & Opportuni�es

30
SUSTAINABILITY REPORT 2014-15
Sustainability Within Us
Alternate Energy
Wind Energy Generation
In 2014-15, we have added 6.3 MW w i n d c a p a c i t y t o o u r
alternative energy portfolio, taking
the total wind capacity to 69.3 MW.
69.3
21
16.810.5
14.76.3
21
37.848.3
63
2008-11 2011-12 2012-13 2013-14 2014-15
Over fuel stations have been converted to operate 2600on solar energy. Cumulative capacity of from 8.6 MWthe solar photo-voltaic power systems installed at Retail Outlets/KSKs, with an annual generation capacity of
103 lakh units, has carbon emission reduction
potential of per year.8,500 tonnes
RO Solarization
4 MW grid interactive solar power plant under
commissioning at Narimanam, Tamil Nadu
5MW grid connected solar power plant commissioned
in 2012 at Rawra, Jodhpur, Rajasthan has been operating successfully.
Over of off-grid power generated during 8.5 GWh2014-15 through installation of Alternate Energy solutions
Solar Energy Generation
Corporate GovernanceKey impacts, Risks & Opportuni�es

31
TRANSFORMATIONAL LEADERSHIP
Sustainability Within Us
The 3rd Na�onal Seminar on Sustainable Development: Transforma�onal leadership
thThe Seminar was held on 16 March 2015 at India Interna�onal Centre, New Delhi. The seminar was inaugurated by Chairman, in the presence of Director (P&BD) & GM (AE&SD), CO. About 100 par�cipants from Oil & Gas, Energy PSUs, various ins�tu�ons, senior execu�ves from Marke�ng ,Refineries and Pipelines Divisions, CO, IIPM etc par�cipated in the seminar. Faculty support was drawn from professional experts, academicians from IIT, JNU, TERI, Na�onal Agencies, government ministries etc. Various topics including Carbon Management, Water Management, Waste Management, PAT Scheme of BEE and Societal aspects of Sustainabilty were discussed during the Seminar.
We are commi�ed to reduce our specific
carbon footprint by and specific 18% water footprint by by 20% 2020
with 2012-13 as the base year.
Corporate GovernanceKey impacts, Risks & Opportuni�es

32
SUSTAINABILITY REPORT 2014-15
The corporate governance philosophy at IndianOil draws its strength from the pillars of accountability, transparency and integrity. In an endeavor to ensure that there is an ethical as well as efficient conduct of business along with a maximiza�on of the benefits for all stakeholders, we have been striving to build an environment of trust and confidence around us. A well-defined policy framework, containing of the following, ascertains that there is an effec�ve implementa�on of corporate governance prac�ces.
Executive (Whole Time)
DirectorChairman
Government &
Non-ExecutiveIndependent
Directors
The Board Committees
Corporate Office
MarketingRefineriesPipelinesPlanning & Business
DevelopmentR&D Centre
Co
de
of
Co
nd
uct
fo
r p
reve
n�
on
of
insi
der
tra
din
g
Ente
rpri
se R
isk
Man
agem
ent
Polic
y
Inte
grit
y Pa
ct t
o e
nh
ance
tra
nsp
aren
cy in
bu
sin
ess
Wh
istl
e-B
low
er P
olic
y
Co
nd
uct
, Dis
cip
line
and
Ap
pea
l Ru
les
for
emp
loye
es
Co
rpo
rate
So
cial
Res
po
nsi
bili
ty/S
ust
ain
able
Dev
elo
pm
ent
Hu
man
res
ou
rces
ini�
a�ve
s
Polic
y o
n R
elat
ed P
arty
Tra
nsa
c�o
ns
and
Po
licy
for
det
erm
inin
g M
ater
ial S
ub
sid
iari
es
Co
de
of
Co
nd
uct
fo
r D
irec
tors
an
d S
enio
r M
anag
emen
t Pe
rso
nn
el
Corporate Governance
Corporate Governance
Sustainability Within Us Economic Performance

33
The Board Of Directors
IndianOil, being a Central Public Sector Enterprise, is under the administra�ve control of the Ministry of Petroleum & Natural Gas. The Board of directors is the highest governing body in the organiza�on. The Directors are nominated by the government and an op�mum combina�on of Execu�ve (Whole-Time) Directors and Non- Execu�ve (Part-Time) Directors represents the Board. Non-Execu�ve Directors are Independent and Government Nominated Directors and are imminent personali�es with proven records in various fields including energy, law, marke�ng, academics, administra�on, finance etc.
As on 31.03.2015, the Board had a strength of 10 members out of which 6 were Execu�ve Directors (Including Chairman) and 4 were Non-Execu�ve Directors. Among the Non-Execu�ve Directors, 3 were Independent Directors while 1 was a Government Nominee Director. There was a 10% women representa�on on the Board.
IndianOil has not been able to comply with the requirement of 50% Independent Directors on its Board. Therefore, we are pursuing with the Government of India to induct the requisite number of Independent Directors as required under the provisions of the Companies Act 2013, as well as the guidelines on Corporate Governance issued by the Department of Public Enterprises (DPE).
All the requisite disclosures pertaining to any directorial/commi�ee posi�ons held by any directors have been made in the Annual report.The Senior Management signs a Memorandum of understanding with the Government of India which governs their performance targets. MoU targets are based around the long-term targets of the organiza�on as well as cri�cal opera�ons including Crude Throughput, Product Pipeline Throughput, Project Implementa�on, Capital Expenditure, Dis�llate Yield, Energy Factor, Safety, Quality and new areas of Business Development. CSR, Sustainable Development, Human Resource Management and R&D are assigned specific weightage.
Func�onal Directors, IndianOil
Corporate Governance
TRANSFORMATIONAL LEADERSHIP
Sustainability Within Us Economic Performance

34
SUSTAINABILITY REPORT 2014-15
AuditCommittee
ProjectEvaluationCommittee
Corporate SocialResponsibility (CSR)
& Sustainable Development
CommitteeDe-leasing ofImmoveablePropertiesCommittee
ContractsCommittee
Spot LNGPurchase
Committee
EstablishmentCommittee
Marketing Strategies
Committee
Planning & Projects
Committee
RemunerationCommittee
ShareholdersInvestorsGrievance
Committee
LNG SourcingCommittee
Oil Price RiskManagement
Committee
Health, Safety &EnvironmentCommittee
Corporate Governance
Board Commi�ees
Sustainability Within Us Economic Performance

35
Board Mee�ngs
The board of directors hold a mee�ng monthly to review the strategies and oversee their management to ensure that the long-term objec�ves are met. Various board commi�ees are cons�tuted to ensure efficient and smooth flow of decision making process. During the year 2014-15, 13 board mee�ngs were held.
Remunera�on Of Directors
Being a Government undertaking, the nomina�on and fixa�on of remunera�on of directors is decided by the government. There is, however, a remunera�on commi�ee which approves the perquisites for the directors and performance related pay, which are within the powers of the Board. The remunera�on, however, does not include any provision made on actuarial valua�on of re�rement benefit schemes or any provision made during the year towards post re�rement benefits as the same are not ascertainable individually for Directors. As per policy applicable to all employees, performance linked incen�ves are paid to the Whole-�me func�onal directors as employees of the organiza�on. During the year under review, no Stock Op�ons were issued to Whole-�me Func�onal Directors. As per the direc�ves issued by the Government of India, the terms of appointment of the Whole-�me Func�onal Directors provide for a 3 month no�ce or salary in lieu of release from service.
A ra�o of 4.17:1 was observed as the ra�o of the total annual compensa�on of the organiza�on’s highest paid individual to the median annual total compensa�on.
Whistle Blower Policy
Indian Oil has a robust whistle blower policy which gives the right to all the employees to report any ac�vity which
violates the laws, rules, regula�ons or code of conduct by an employee to the Chairman of the Audit Commi�ee or the competent authority. The audit commi�ee is accessible to all employees and maintains strict confiden�ality or any such repor�ng to shield any discrimina�on at workplace, whatsoever.
The policy on Vigil Mechanism/Whistle-blower can be accessed on our corporate website at the l ink h�ps://www.iocl.com/InvestorCentre/Whistle_Blower_policy.pdf
Corrup�on And An�-Compe��ve Behavior
The conduct, disciplines and appeal rules of the organiza�on outline the approach to assess and ascertain fraud risks and repor�ng, inves�ga�ng and responding to suspected incidents of corrup�on. There is an inbuilt mechanism at IndianOil to check an�-compe��ve behaviors which comply with all government policies. Adequate measures are in place to address issues rela�ng to ethics, bribery and corrup�on in the context of appropriate policy guidelines
issued by the Government from �me to �me. It is mandatory for all our employees to comply with an�-corrup�on policies. Preven�ve ac�vi�es like genera�ng awareness through training/ workshop on the Central Vigilance Commission (CVC) rules/guidelines, ensuring quality and quan�ty of products in transit as well as sales points across the country, studies to bring out irregulari�es/ inconsistencies, bringing transparency and economy in awarding as well as execu�on of contracts are carried out by the vigilance department. Widely accepted ini�a�ves like the Grievance Redressal Mechanism and Whistle Blower’s policy are implemented. These policies cover all the employees of the organiza�on as well as the business partners.
All our units are reviewed for any corrup�on or related risks. During the year no incidents of corrup�on were reported. 68 vigilance awareness programs were conducted to promote transparency and promote efficiency in the working during the year and were a�ended by about 1600 employees. Two cases were filed against the company regarding an�-
Corporate Governance
TRANSFORMATIONAL LEADERSHIP
Sustainability Within Us Economic Performance

36
SUSTAINABILITY REPORT 2014-15
compe��ve behavior. One Case is pending before Compe��on Commission of India (CCI) wherein complainant has alleged carteliza�on by Oil Marke�ng Companies, for collusive bidding in a tender for ATF supplies. The Delhi High Court has stayed the proceedings before CCI. In another case, a party has alleged non-compe��ve price due to carteliza�on by Sugar Manufacturers & joint tendering by OMCs for ethanol. The party had appealed before Compe��on Appellate Tribunal (COMPAT) CCI's interim order and also filed applica�on for interim relief of stay of the tender process. The COMPAT dismissed both Appeal and Applica�on for stay. The party has now filed Civil Appeal before the Supreme Court against COMPAT's order. The ma�er is pending in the Supreme Court.
Public Procurement Policy For Micro, Smal l & Medium Enterpr ises (MSME)
As per the Public Procurement Policy of the Govt. of India for procurement from Micro, Small and Medium Enterprises (MSME), necessary steps have been ini�ated by the various divisions of the Corpora�on for its implementa�on. Endeavors are made to procure items specified for procurement from MSMEs. Necessary provision has been made in all the tenders sta�ng the eligibility of MSMEs to par�cipate in the tender. The MSMEs and NSICs are exempted from
payment of tender fees / earnest money deposit. As against the target of procurement of 20% from MSMEs, the procurement from MSMEs during the year by various divisions was around 41%.
External Commitments & Public Policy Par�cipa�on
In associa�on with various na�onal and interna�onal professional bodies, IOC ac�vely par�cipates and firms up opinions on Industry related issues which have significant impact on public policy. References of different ministries of the government are a�ended to with in-depth analysis.
IndianOil, a founder member and now permanent m e m b e r o f U N G C , ex te n d s s u p p o r t i n implemen�ng the ten guiding principles in United Na�ons’ agenda on human rights, labour standards, environment and an�- corrup�on.
IndianOil also ac�vely par�cipates with various commi�ees of Government of India and other organiza�ons for advancement or improvement of public good by contribu�ng to Economic Reforms, Sustainable Business Principles, Energy Security, Inclusive Development Policies, etc.
Corporate GovernanceSustainability Within Us Economic Performance
37
Human Rights
In pursuance to our commitment to meet the societal needs and safeguard human rights, we have Zero Tolerance towards any kind of discrimina�on, whatsoever, for employment, growth, remunera�on or development on the grounds of caste, colour, gender, religion or region- across all our establishments. There is a structured grievance handling mechanism accessible to all the employees. As per the terms and condi�ons laid down in the General Condi�ons of Contract (GCC), all our vendors and suppliers have to comply with the human rights aspects including separate toilets, washing places for men and women, compulsory canteen facili�es and medical services for all employees. Con�nuous monitoring and review is undertaken at all the loca�ons to minimise and reduce human rights viola�ons. There were no incidents of human rights viola�ons reported during the year. No incidents involving rights of indigenous people and discriminated prac�ces or significant disputes involving local communi�es and indigenous people were reported during the year 2014-15. There is also a well defined policy on preven�on of sexual harassment at the workplace which is implemented across all our installa�ons.
IndianOil stands tall against all forms of forced or compulsory labour. Salary paid to all employees fulfils the norms of the
minimum wages act as prescribed by the norms of the minimum wages act prescribed by the Government of India. As per the provisions of the Minimum wages Act 1971, the minimum wages payable to employees/ contractors are revised at regular intervals. No instances of forced, compulsory or bonded labour were reported during the last fiscal.
As per the condi�ons of the General Condi�ons of Contract (GCC)- the guidelines for any contract drawn with IndianOil, a wri�en declara�on has to be submi�ed by the bidder that no child labour is engaged at his/her facili�es. IndianOil does not encourage business ac�vity with industries deploying child labour. No child labour is employed at any of our establishments and a minimum age limit of 18 years for permanent and contract labour is maintained. No complaints, whatsoever, were reported during the year pertaining to child labour.
No poli�cal contribu�ons – financial or in-kind - were made directly or indirectly to any recipient or beneficiary by IndianOil.
Sustainable Sourcing
Oil & Gas sector is par�cularly vulnerable to sectoral threats like deple�on of resources and geo-poli�cal uncertain�es. It has also diversified its global fuel sourcing centers.
As pipeline transporta�on is the most sustainable mode of transporta�on for petroleum products, IndianOil has been expanding the pipeline network relentlessly. As on 31.3.2015 the total length of pipelines stands at 11,221 KMs.
IndianOil purchases LNG, crude oil, gas and other raw material under long term as well as short term purchase contract from na�onal and global sources. Also e-Tendering, e- Procurement and e-Payment procedures are followed relentlessly as a mode for sustainable sourcing.
As per the terms laid down in the GCC, all vendors and suppliers have to ensure compliance to all environmental and societal regula�ons and rules.
Inclusiveness
IndianOil scrupulously follows the presiden�al direc�ves and guidelines issued by Government of India regarding reserva�on in services for SC/ ST/ OBC/ PWD (Persons with Disabili�es)/ Ex-servicemen to promote inclusive growth. Grievance/ Complaint Registers are also maintained at Division/ Region/ Unit levels for registering grievances. Efforts are made to promptly dispose off representa�ons / grievances received from OBC/ SC/ ST employees. Reported cases of sexual harassment are inquired into by a Complaint Commi�ee and disciplinary ac�on, as per Conduct, Discipline and Appeal Rules, against the delinquent employees is taken. Facili�es like Braille machine, ramp, etc. are provided for PWDs.
For engagement of disadvantaged, vulnerable and marginalized external stakeholders, various ini�a�ves viz. allotment of dealership/ distributorship, pe�y contracts, CSR ini�a�ves, etc. are undertaken.
Corporate Governance
TRANSFORMATIONAL LEADERSHIP
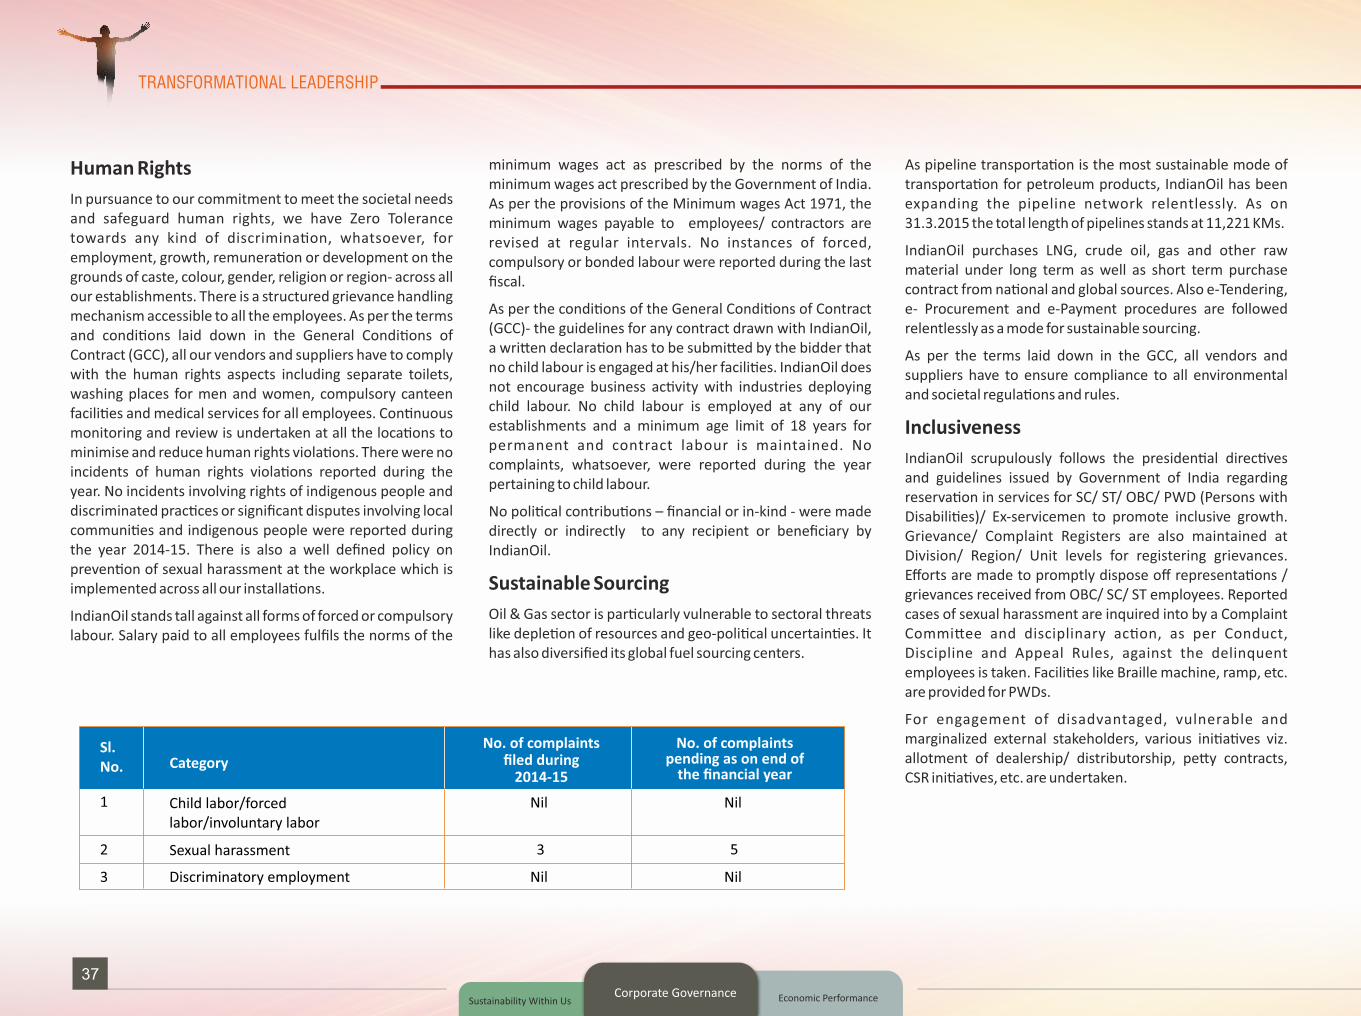
1 Child labor/forced labor/involuntary labor
Nil Nil
2 Sexual harassment 3 5
3 Discriminatory employment Nil Nil
Sl.No. Category
No. of complaints filed during
2014-15
No. of complaints pending as on end of
the financial year
Sustainability Within Us Economic Performance

38
SUSTAINABILITY REPORT 2014-15
Integrity and Accountability
IndianOil believes in total transparency, integrity and accountability in its func�oning. IndianOil values its business rela�onships with all its domes�c & interna�onal contractors and vendors of goods & services, and is dedicated to deal with them in a fair and transparent manner by maintaining the highest ethical standards in all the transac�ons with them. Standing tall to its value of trust, IndianOil signed a MoU with Transparency Interna�onal India (TII) in 2008 for implemen�ng Integrity Pact (IP) in all its major procurement and work contract ac�vi�es. There is an enhanced emphasis on ensuring transparency, probity, equity and compe��veness in procurement processes. The Integrity pact has not only strengthened the trust and support of the Central Vigilance Commission but has also toughened up the exis�ng systems. Four Independent External Monitors have been nominated by TII in consulta�on with the Central Vigilance Commission (CVC) to monitor all tenders of value ` 10 Crore and above, across IndianOil.
During the year 12 mee�ngs of IEM’s were conducted. Based on the above threshold value, 318 tenders came under the purview of IP during the year. Against 11 tenders floated by the Corpora�on complaints were received under the Integrity Pact (IP) with regard to tenders and same were dealt in line with the extant guidelines on Integrity Pact and resolved. 570668 complaints were received rela�ng to sales, services, tenders and through public grievance redressal system, out of which 569416 (99.8%) were resolved.
Informa�on on varied issues is shared under the ‘Right To Informa�on’ to all stakeholders. Addi�onally, other ini�a�ves like bill watch system, standardisa�on of schedule of rates, file tracking system etc. have also been implemented.
Compliance
As a good corporate governance prac�se, a Secretarial Audit of the records and documents is carried out every year. The report confirms that all the applicable provisions of Corporate Law, guidelines and rules etc have been complied with fully by the organiza�on during the year under purview. Duly cer�fied by a prac�sing Company secretary, the report is published as a part of the Annual report.
To ensure implementa�on of government direc�ves, liaison
e-Tendering
Xtrainfo(e-Ledger)
e-ledger
Dealer/Distributor
Annual Returns (DAR)
e-SuggestionScheme
e-Payment File Tracking System
e-CFS
IndaneTransparency
Protal
VTS-VehicleTrackingSystem
SMSIndenting
e-Communciation
Employee SelfServicePortal
EmployeePerformanceManagement
System
e-Procurement
E-Governance Ini�a�ves
Corporate Governance
officers are appointed at various loca�ons across our installa�ons.
Con�nued efforts were made during the year to increase the use of Hindi in official works. There are commi�ees working in all loca�ons for effec�ve implementa�on of Hindi and its progress.
1444 complaints were received from shareholders which were subsequently resolved.
Sustainability Within Us Economic Performance

39
Ongoing Projects 15-MMTPA grassroots refinery at Paradip, Odisha 5-MMTPA LNG import terminal project at Ennore
(through a Joint Venture company) Polypropylene project at Paradip Refinery Dis�llate yield improvement project at Haldia Refinery Coke chamber replacement at Coker-A in Barauni
Refinery Demonstra�on unit of INDADeptG at Guwaha� Refinery Reverse osmosis units at Gujarat Refinery and Barauni
Refinery Installa�on of feed prepara�on unit at Haldia Refinery Paradip-Raipur-Ranchi product pipeline and associated
tap-off points Debo�lenecking of Salaya-Mathura crude oil pipeline Paradip-Haldia-Durgapur LPG pipeline Augmenta�on of Paradip-Haldia-Barauni crude oil
pipeline Paradip-Hyderabad Pipeline
In line with our vision to be the energy of India, we are fully aware of the trends concerning the energy basket of the country. We are building the requisite capaci�es, infrastructure and capabili�es to maintain our posi�on. Crude oil procurement accounts for almost 92% of our overall costs. We are expanding our crude oil basket to include high-value grades and new suppliers. We are processing higher volumes of cheaper, heavy crude oil to bring down costs.
Our refining capacity (including that of CPCL) will cross 80 million tonnes per annum capacity once the Paradip refinery gets commissioned.
To supplement capacity addi�on, new pipeline grids and marke�ng facili�es are being built to enable smooth evacua�on of finished products.
Investments - They Key to Growth
XII Plan
BE56,200
XI Plan
Actual48,655
X Plan
Actual17,930
` crore
Five Year Plans
Completed Projects Installa�on of a gas turbine along with Heat Recovery
Steam Generator (HRSG) at Gujarat Refinery Sulphur pelle�sing units at Panipat Refinery and Mathura
Refinery New tap-off point at Jasidih, Jharkhand, on the Haldia-
Barauni-Kanpur pipeline Tikri Kalan terminal on Panipat-Delhi pipeline Effluent treatment plant modernisa�on project at
Barauni Refinery LPG bo�ling plants at Mysore and Tirunelveli
Impact of Projects
15 MMTPA Refining Capacity
12 MMTPA PipelineCapacity
6000 km PipelineNetwork
680 TMTPA PP Plant
5 MMTPA LNG Import Terminal
Economic Performance
TRANSFORMATIONAL LEADERSHIP
During the XII Plan period (2012-17), we have plans to invest ` 56,200 crore in a host of projects that include augmenta�on of our refining capacity, expansion of petrochemicals infrastructure, and building our E&P por�olio.
Augmenta�on of Paradip-Haldia-Durgapur LPG pipeline and its extension up to Patna and Muzaffarpur
Ja ipur-Panipat Naphtha P ipel ine, a long with augmenta�on of Koyali- Sanganer pipeline
Ennore-Trichy-Madurai LPG pipeline Cauvery Basin Refinery-Trichy product pipeline LPG import terminal at Paradip and Kochi
Economic Performance
Corporate GovernanceEnvironmental Performance

40
SUSTAINABILITY REPORT 2014-15
Economic Performance
The network, comprising of over 43,000 customer touch points in 2014-15 was strengthened from a previous count of 41,640. Largest and most extensive network of retail outlets, numbering 24,405 (Including 6230 Kisan Seva Kendras), 136 oil depots and terminals and 6399 consumer pumps for the convenience of large consumers, are some of the vital components of this network, ensuring availability of products and inventory at the doorstep of customers. Domes�c Fuel (LPG) needs are fulfilled through 91 bo�ling
Contribu�on to Exchequer
States (Rs Crore) Central (Rs Crore)
2012 -13
26489
53330
2013 -14
58871
27293
2014 -15
62136
36190
Earning per share
2009 -10 2010 -11 2011 -12 2012 -13 2013 -14 2014 -15
42.1
30.67
16.2920.61
28.9121.72
261849271074 328744
409957 414909457553 450756
2008-09 2009-10 2014-152013-142012-132011-122010-11
Turnover (Rs Crore)
Net Worth (` Crore)
2013 -14
65992
2012 -13
61124
2014 -15
67970
2008-09
2950
10221
7445
5005
7019
5273
3955
2014-152013-142012-132011-122010-112009-10
`
`
`
``
` `
` Profit A�er Tax (Rs. Crore)
plants and 7934 LPG distributors, serving over 887.6 lakh customers. IndianOil has con�nuously extended its reach to the rural India, with 6230 KSKs and 2096 RGGLVYs as on 31.03.2015.
We are operators with 100 per cent par�cipa�ng interest in two onshore explora�on blocks in the Cambay Basin and hold non-opera�ng par�cipa�ng interest in the range of 20 to 44 per cent in the remaining domes�c blocks. In the 7
overseas blocks located across 7 countries, we hold non-opera�ng par�cipa�ng interest in the range of 3.5 to 50 per cent. During the year, we acquired 10 per cent par�cipa�ng interest in the mul�billion dollar integrated upstream & LNG project-Pacific North West LNG in Canada with ini�al investment of USD 1 billion, making it our biggest overseas acquisi�on so far.
Corporate GovernanceEnvironmental Performance

41Economic Performance
TRANSFORMATIONAL LEADERSHIP
47.6 47.4 45.9 47.8
28 28.1 27.2 27.9
2011-12 2012-13 2013-14 2014-15
Pipeline Throughput
Crude Pipeline (million tonnes) Product Pipeline (million tonnes)
1168
1364
2013 -14 2014 -15
Gas pipeline Throughput
Operational Performance (in million tonnes)
Gas Pipeline (mmscm)
Corporate GovernanceEnvironmental Performance

42
SUSTAINABILITY REPORT 2014-15
Economic Performance
2008 -09 2009 -10 2010 -11 2011 -12 2012 -13 2013 -14 2014 -15
-
64 6259 57 56.3 55.8 54.4
2008-09 2009-10 2010-11 2011-12 2012-13 2013-14 2014-15
74.6
75.3 75.4
77.8 78 78.1
78.8
Fuel & Loss (%)
2014-15
8.8
2013-14
9
2012-13
9.1
2011-12
9.1
Since 2008, dis�llate yield has followed an upward trend in our refineries. During the year 2014-15, highest ever combined dis�llate yield of 78.8% was achieved by our refineries, as against a previous high on 78.1 % during the year 2012-13 and 2013-14. An overall capacity u�liza�on of
Dis�llate Yield (wt%)
98.9% resulted in a crude throughput of 53.6MMT for the refineries. The pipelines division recorded their highest ever combined throughput of 75.59 MMT surpassing the previous high of 75.55 MMT achieved in 2011-12.
Specific Energy Consump�on
Corporate GovernanceEnvironmental Performance

43
Domes�c Blocks(10)Overseas Blocks(7)
Explora�on
Discovery
Appraisal
Under Development
Produc�on
3
3
3
1
3
2
1
1
Our polymer product por�olio included 48 grades by the end of the year in domes�c markets, thereby covering over 90% of the applica�ons in the user industry.Five new PP/PE Improved/High Performance Grades were launched by the state-of-the-art Product Applica�on & Development Centre, Panipat. The centre also develops new grades that are benchmarked against na�onal and interna�onal products. Our petrochemicals, under the brand PROPEL, are exported to 70 countries.
Economic Performance
TRANSFORMATIONAL LEADERSHIP
Produc�on Towards Equity
We have par�cipa�ng assets in 10 domes�c and 7 overseas ac�ve assets.We have three producing assets at Niobrara Shale Project (USA), Pacific Northwest LNG Project (Canada) and Carabobo Project (Venezuela), the produc�on from which increased to 3299 mboe 9million barrels oil equivalent) from 1754 mboe in 2013-14.
Over ` 10,700 crore invested in
upstream ac�vi�es �ll date
Explora�on & Produc�on (E&P)
Petrochemicals
Corporate GovernanceEnvironmental Performance

44
SUSTAINABILITY REPORT 2014-15
Economic Performance
Various factors like the low penetra�on of natural gas in India’s energy mix along with significant scaling up of supply sources, present the case for the sector to have a high growth rate in the future. Our ini�a�ve 'LNG at the doorstep' has benefited bulk users located away from the gas pipelines. We have, also, formed a consor�um with M/s. Adani Gas Ltd. to develop city gas distribu�on networks on a pan-India basis.
Gas
Gas-Stepping on the PedalCrea�ng infrastructure• LNG Import terminal at Ennore, Tamil Nadu— 5 MMTPA capacity@`5,151 croreCity Gas Distribu�on (CGD)• Network in 7 ci�es— Opera�onal: Agra and Lucknow— Upcoming: Chandigarh and Allahabad— Awarded in 2014-15: Ernakulam, Daman and Panipat
Corporate GovernanceEnvironmental Performance

45
Domes�c Product Sales (in MMT) Total Domes�c Sales
2009 -10 2010 -11 2011 -12 2012 -13 2013 -14 2014 -15
65.42
67.93
71.3672.49
71.15
72.76
Economic Performance
TRANSFORMATIONAL LEADERSHIP
Petroleum products
Gas
Petrochemicals
Explosives
63.03
1.68
0.65
0.06
65.31
1.64
0.91
0.07
68.10
1.72
1.47
0.07
68.75
1.83
1.82
0.08
67.14
1.93
1.99
0.08
68.47
1.80
2.39
0.10
Product 2009 -10 2010 -11 2011 -12 2012 -13 2013 -14 2014 -15
Corporate GovernanceEnvironmental Performance

46
SUSTAINABILITY REPORT 2014-15
Environmental Performance
IndianOil has always given prime importance to the
environmental protection. For efficient dispersion on flue gas,
tall stacks have been built; elaborate wastewater treatment
facilities and recycling ensure that the burden on the
environment on account of wastage of water is reduced.
Ever changing climate
Though the world is trying hard to mitigate the challenges of
global warming, the steps taken are clearly not adequate. In
the past few years, the world has been a witness to the wrath
of the nature – from Kashmir floods to devastating
earthquake in Nepal, from Boston snow storms to Typhoon in
Philippines. World is running past the ‘Now or Never’ stance
at an alarming rate.
At IndianOil, such grave is our task that we, on one hand have
to put in the most sincere efforts to ensure energy sufficiency
and security for all while on the other, be even more
committed towards ascertaining that our actions have the
minimalistic negative impact on the environment.
We have made huge investments at our refineries to
implement ENCON (Energy Conservation) projects in order to
further reduce the CO2 emissions. Replacing diesel generator
sets used at ROs by Solar PV to generate electricity is another
feat that 2664 IndianOil’s ROs/KSKs have achieved.
Considering the renewable energy intensive future we have
also forayed into off and on grid solar energy and wind energy.
Making major events carbon neutral and generating
awareness about sustainability in the organization among the
employees are the other thrust areas of sustainable
development initiatives. During the year 2014-15, an
investment of ` 31.80 Cr was done for Alternate Energy and
Sustainable Development related activities.
There were no significant fines, monetary or non-monetary,
and no non-monetary sanctions for non-compliance with
environmental laws and regulations. No grievances were
filed regarding adverse environmental and societal impacts
caused by our operations.
Environmental Performance
Economic Performance Great Place to Work

Environmental Performance
47
Material
Material use
Being in a business where a continuous inflow of raw materials is of utmost
importance, a strategically designed sourcing mechanism takes care of
uninterrupted supply of raw materials at IndianOil. Continuous efforts to
increase operational efficiency, improving the Gross Refinery Mechanism
(GRM) and ensuring optimum use of raw materials form the basis of our
sustained growth trajectory.
Material Actual production ('000MTs)
2014-15 2013-14 2012-13
Petroleum 47,194 47,247 48,561
LAB 105 103 118
PTA 534 388 567
PNCP 1,815 1,552 1,440
Total 49,648 49,290 50,686
Product Specific Energy Consumption (per MT of Product)
Electricity (KWH) Natural Gas (MT)
2014-15 2013-14 2012-13 2014-15 2013-14 2012-13 2014-15 2013-14 2012-13 2014-15 2013-14 2012-13
Petroleum 77.57 77.18 76.87 0.03 0.03 0.03 0.03 0.04 0.04 0.01 0.01 0.01
LAB 603.46 568.09 577.84 0.53 0.54 0.54 0.21 0.24 0.17 0 0 0
PTA 427.19 525.99 385.14 0.11 0.15 0.14 0.24 0.29 0.22 0.07 0.07 0.06
PNCP 626.43 695.88 725.01 0.02 0.01 0.01 0.25 0.25 0.238 0.09 0.119 0.14
Liquid Fuel (MT) Fuel Gas/ LDO/ Coke (MT)
Material Quantity of Raw Material Consumed (MTs)
2014-15 2013-14 2012-13
Crude Oil 535.86 530.95 530.61
Natural Gas/RLNG 6.30 4.18 3.44
Base Oil 4.18 4.25 4.01
MaterialQuantity of Raw Material Consumed in 2014-15 (MTs) (by source)
Imported Indigenous
Other Raw Materials 241.88 1812.02
Stores & Spares 285.22 1224.12
Packing Materials Consumed 0.00 462.89
Components/ Others 80.40 681.86
Environmental PerformanceEconomic Performance Great Place to Work

48
SUSTAINABILITY REPORT 2014-15
With every additional capacity installed and with each barrel
of extra crude processed, the relative energy demand goes
up. We, at IndianOil, are making continuous efforts to
compensate this increase in energy demand by up grading
the technology used in our installations as well as making the
current systems more energy efficient. Though we are on a
carbon-intensive growth trajectory, we are putting constant
efforts to mitigate the impacts of increasing carbon
emissions.
Environmental Performance
Energy
Energy sourcing and consumption
Power Consumption by Type (KWh)
Purchased Electricity
Electricity through Dual Fuel (HSD/Natural Gas Generators)
Fuel Consumption By Type (MT)
Fuel Consumption By Type
Liquid Fuel (FO/ Naphtha/ Diesel)
Fuel Gas
Coke
2.17%
81.04%
16.78%
37.44%
14.33%
41.17%
7.05%
Electricity through Steam Turbine/Generators
Economic Performance Great Place to Work

Environmental Performance
49
49291
50687
51394
48000
49000
50000
51000
52000
2014-15
Total Actual Production
(‘000 MTs)
2013-14 2012-13 2011-12
49648
102.513101.222
99.919
97.918
95
100
105
2014-15 2013-14 2012-13 2011-12
Total Electricity Consumption Per MT of Total Production
(KWh/MT)
0.045 0.047 0.046 0.043
0.04
0.05
2014-15 2013-14 2012-13 2011-12
Total Fuel Gas/LDO/Coke Consumption Per MT of Total Production
(MT/MT)
0.035 0.035 0.036
0.038
0.03
0.035
0.04
2014-15
Total Liquid Fuel Consumption Per MT of Total Production
(MT/MT)
2013-14 2012-13 2011-12
Total Natural gas Consumption Per MT of Total Production
0
0.01
0.02
2014-15 2013-14 2012-13 2011-12
(MT/MT)
Environmental PerformanceEconomic Performance Great Place to Work

50
SUSTAINABILITY REPORT 2014-15
Unit Electricity
‘000 KWH 1,10,685 65,238 57,596
‘000 KWH 41,24,811 39,87,238 39,46,144
‘000 KWH 8,54,094 9,36,864 10,60,953
‘000 KWH 50,89,591 49,89,340 50,64,693
MTs NIL NIL NIL
MTs 17,30,433 17,17,181 18,05,212
MTs 19,02,823 19,98,965 20,03,430
MTs 3,25,913 3,19,747 3,24,159
MTs 6,62,142 7,39,356 8,58,142
2014-15 2013-14 2012-13
Electricity Purchased
Electricity GenerationThrough Duel Fuel (HSD/Natural Gas Generators)
Through Steam Turbine/Generators
Electricity Consumed
Coal
Liquid Fuel (FO/ Naphtha/ Diesel)
Others / Internal Fuel
Internal fuel
Purchased Fuel
Fuel gas
Coke
Natural gas
Total Energy Consumption (TJ)
2010-11 2014-152013-142011-12 2012-13
Direct Energy Consumption (TJ)
202313
220394
222979
212833
205949
In-direct Energy Consumption (TJ):Electricity from Grid
2009-10 2014-152013-142011-12 2012-132010-11
162.92 151.65189.93 207.35
234.86
398.47
2,02,465
2,20,584 2,23,187
2,13,068
2,06,348
Total Electricity & Fuel Consumption
Environmental PerformanceEconomic Performance Great Place to Work

Environmental Performance
51Environmental Performance
Since we are working in an energy intensive sector, Energy conservation
(ENCON) measures are a boon for us. They help in curtailing the total energy
consumed, thereby resulting in reduced carbon emissions. During the year
2014-15, savings of 1,07,000 Standard Refinery Fuel Tonnes (SRFT) equivalent to
about 400 Crore were achieved by implementing 106 ENCON projects. An
estimated savings of 39,000 SRFT can be expected in lieu of the investments
being made during 2015-16.
0.27
ENCON: Carbon Saving MTCO2e
2009-10 2010-11 2011-12 2012-13 2013-14 2014-15
0.3 0.31
0.39
0.330.35
Estimated Savings by ENCON Projects
Standard Refinery Fuel Tonnes (SRFT)
2010-11 2011-12 2012-13 2013-14 2014-15
1,07,0001,02,8001,20,000
95,80093,600
ENCON: Energy Saving TJ
2010-11 2011-12 2012-13 2013-14 2014-152009-10
3433.18 3918.84 4010.955024.16
4304.03 4479.88
ENCON Projects ESTIMATED FUEL
SAVING MT/Year
Utilization of Straight Run Gas Oil (SRGO) Circulating Reflux (CR) and KERO CR 1223
for replacing Naphtha Splitter Furnaces (F-001 & F-002) at Guwahati Refinery.
Routing of hot condensate from process units to Deaerator-4 in Thermal 1050
Power Station (TPS) at Guwahati Refinery
Coker-A Single Furnace Operation at Barauni Refinery 5000
Installation of Kettle type heat exchanger in Diesel Hydrotreater Unit (DHDT) 3200
at Barauni Refinery
Low Pressure steam generation from Light Cycle Oil (LCO) stream in Fluidized 500
Catalytic Cracking Unit (FCC) at Gujarat Refinery
Routing Hydrogen Rich off gases of Catalytic Reforming Unit (CRU) to 7850
Hydrogen header instead of Fuel Gas at Gujarat Refinery.
Pre-heat Improvement in Crude Distillation Unit (CDU-I) by 14 ° C by 1020
installation of Helical exchangers at Haldia
Replacement of Supplementary Naphtha firing in HRSG-2&3 with Fuel Gas 14000
resulting in saving of Naphtha and there by reduction of flare loss at
Haldia Refinery
Direct routing of Continuous Catalytic Reforming Unit (CCRU) rich gas to H2 400
header at Mathura Refinery
Enhancement of Power Sale to APDCL up to 8 MW from existing 5 MW 2041
at Digboi Refinery
New SRU Incinerator (WHB 57-E-108 A/B) tube bundle replacement at 3310
Panipat Refinery.
Floating of Atmospheric Vacuum Unit (AVU-2) Main-fractionator with 3098
Resid Fluidized Catalytic Cracking Unit (RFCCU) Wet Gas Compressor
at Panipat Refinery
CDU-II crude preheat train revamp (Crude preheat improvement from
234 °C to 265 °C) at Bongaigaon Refinery. 3207
Stepless capacity control for DHDT MUG compressor at Bongaigaon Refinery 2669
Energy Conservation (ENCON) Measures
Economic Performance Great Place to Work
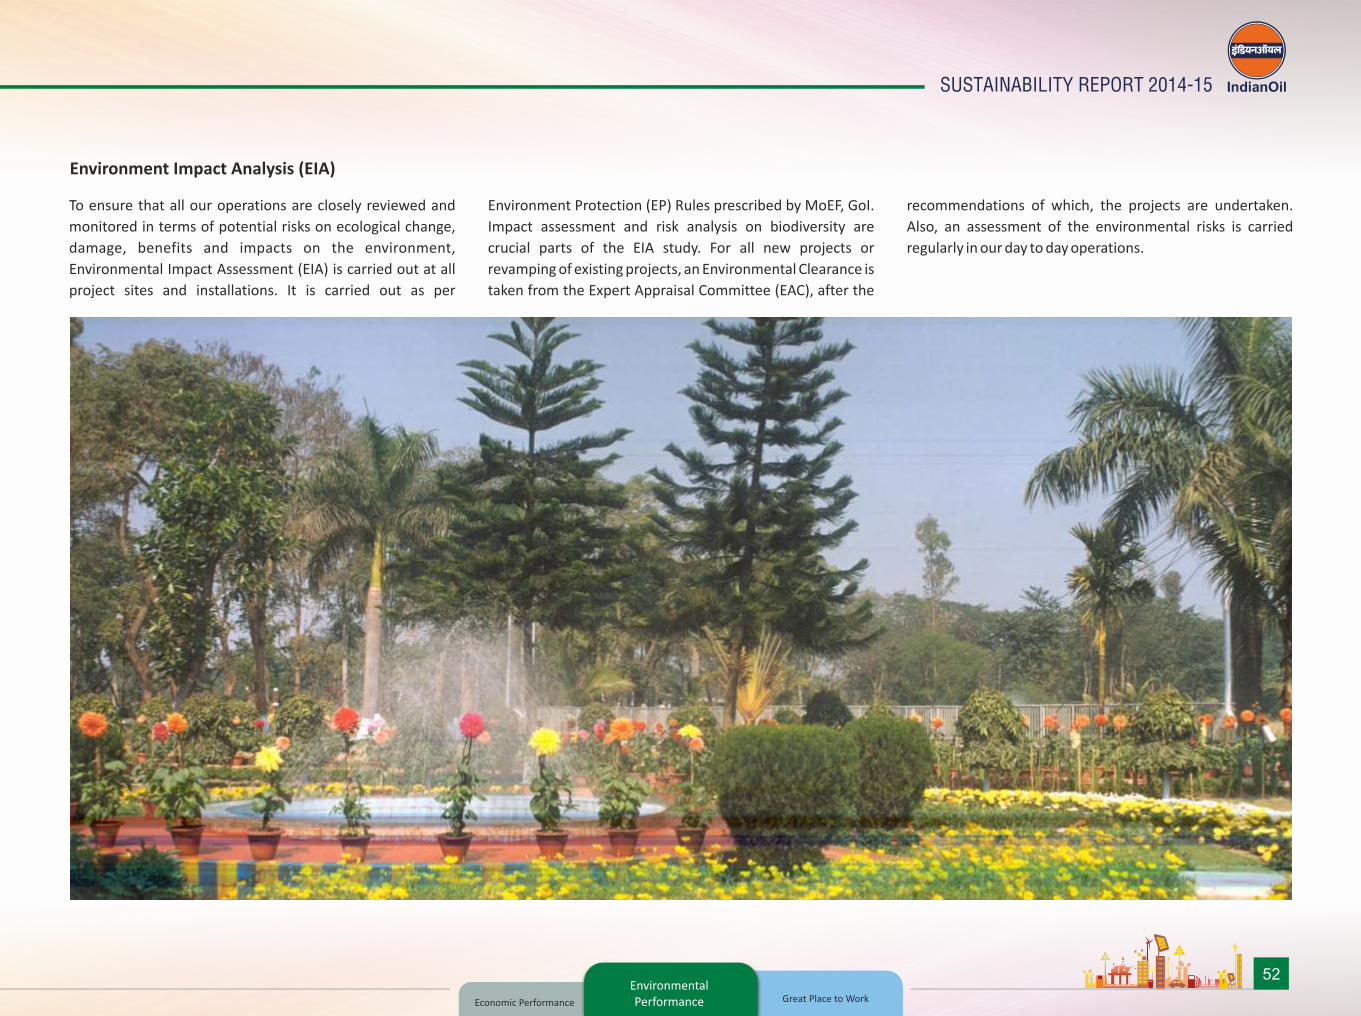
52
SUSTAINABILITY REPORT 2014-15
Environmental Performance
To ensure that all our operations are closely reviewed and
monitored in terms of potential risks on ecological change,
damage, benefits and impacts on the environment,
Environmental Impact Assessment (EIA) is carried out at all
project sites and installations. It is carried out as per
Environment Protection (EP) Rules prescribed by MoEF, GoI.
Impact assessment and risk analysis on biodiversity are
crucial parts of the EIA study. For all new projects or
revamping of existing projects, an Environmental Clearance is
taken from the Expert Appraisal Committee (EAC), after the
recommendations of which, the projects are undertaken.
Also, an assessment of the environmental risks is carried
regularly in our day to day operations.
Environment Impact Analysis (EIA)
Economic Performance Great Place to Work

Environmental Performance
53
it for further use in housekeeping, horticulture and other
industrial purposes, rain water harvesting systems across
locations reduce our dependency on fresh water by
recharging the ground water aquifers wherever possible.
Apart from this, automatic water sensing taps, water free
urinals, water sprinkling systems and quarter turn/self
closing taps have been provided. In many LPG Bottling
Plants, cylinder washing units have been provided with re-
circulation tanks where water is collected for cleaning the
cylinders again. Continuous monitoring of utility water
networks, taps etc. is carried out to check any leakages. Pop-
up water sprinklers are installed and are used for
horticulture purpose.
*Specific water consumption for the year 2014-15 was 1.66 per metric tonne of crude processed. This year we have included PNCC water consumption data while calculating the specific water consumption as well as total water
consumption.
Specific Water Consumption
2014-151.66
2013-14
1.4
2012-13
1.1
2011-12
1.14
Metric cube per metic tonne of crude processed (Refineries+PNCC)
Total Water Consumption
Million cubic metre (Refineries+PNCC)
2012-13 2013-14 2014-15
88.87
73.2276.48
Environmental Performance
Water
Water Conservation
Recycling and reusing of water are the foundations on which
water conservation is built. Canals, lakes, rivers and ponds are
the main sources of water at IndianOil’s refineries whereas
pipelines and marketing division installations are heavily
dependent on municipality and ground water to meet their
daily water need. While ensuring that water withdrawal is
within the limits prescribed by the statutory bodies, it is also
ascertained that there is no significant impact on any water
source due to our operations.
A number of steps are being taken across the locations to
reduce water consumption and ensure recycle and reuse of
water. While ETPs and STPs treat the used water and prepare
Economic Performance Great Place to Work

54
SUSTAINABILITY REPORT 2014-15
Environmental Performance
Recharging Ground Water through Rain
Water Harvesting
IndianOil has been installing rain water harvesting systems
across its installations . Till 2014-15, we had installed 437 rain
water harvesting units spread across refinery, marketing and
pipelines locations. Rain water harvesting systems not only
ensure recharging of ground water aquifers, but also reduce
the need for imported water. A dedicated excavation process
has been carried out in green belts to channelize the
rainwater to open wells from existing drains. Roof top rain
water harvesting systems have been installed at many
locations and also ground water level is monitored,
periodically through piezometer.Water Recycled/ Reused Total water
reused/recycled
3Total volume of water recycled/reused 3,10,53,467 m /yr
Total % water Recycled/ Reused 34.94%
Total Water Withdrawn by Sources (2014-15)
Surface water, including water from wetlands, rivers, lakes and oceans
Ground Water
28%
72%
Effluent recycle and reuse
Recycle and reuse of effluents helps in not only conservation
of resources but also result in reduced fresh water
consumption. Reduction in discharge of treated effluent
outside the location is an additional benefit that is attributed
to the recycling and reusing the effluents. Treated effluents
are put to use in varied functions across the refineries
including fire water & cooling tower make up, coke cutting in
Delayed Coker Unit (DCU), as DM Water in boilers and process
plants. They are also used for captive irrigation in our green
belts, eco-parks and eco-ponds. About 34.94% of total water
consumed is reused/recycled in refineries during 2014-15.
Economic Performance Great Place to Work
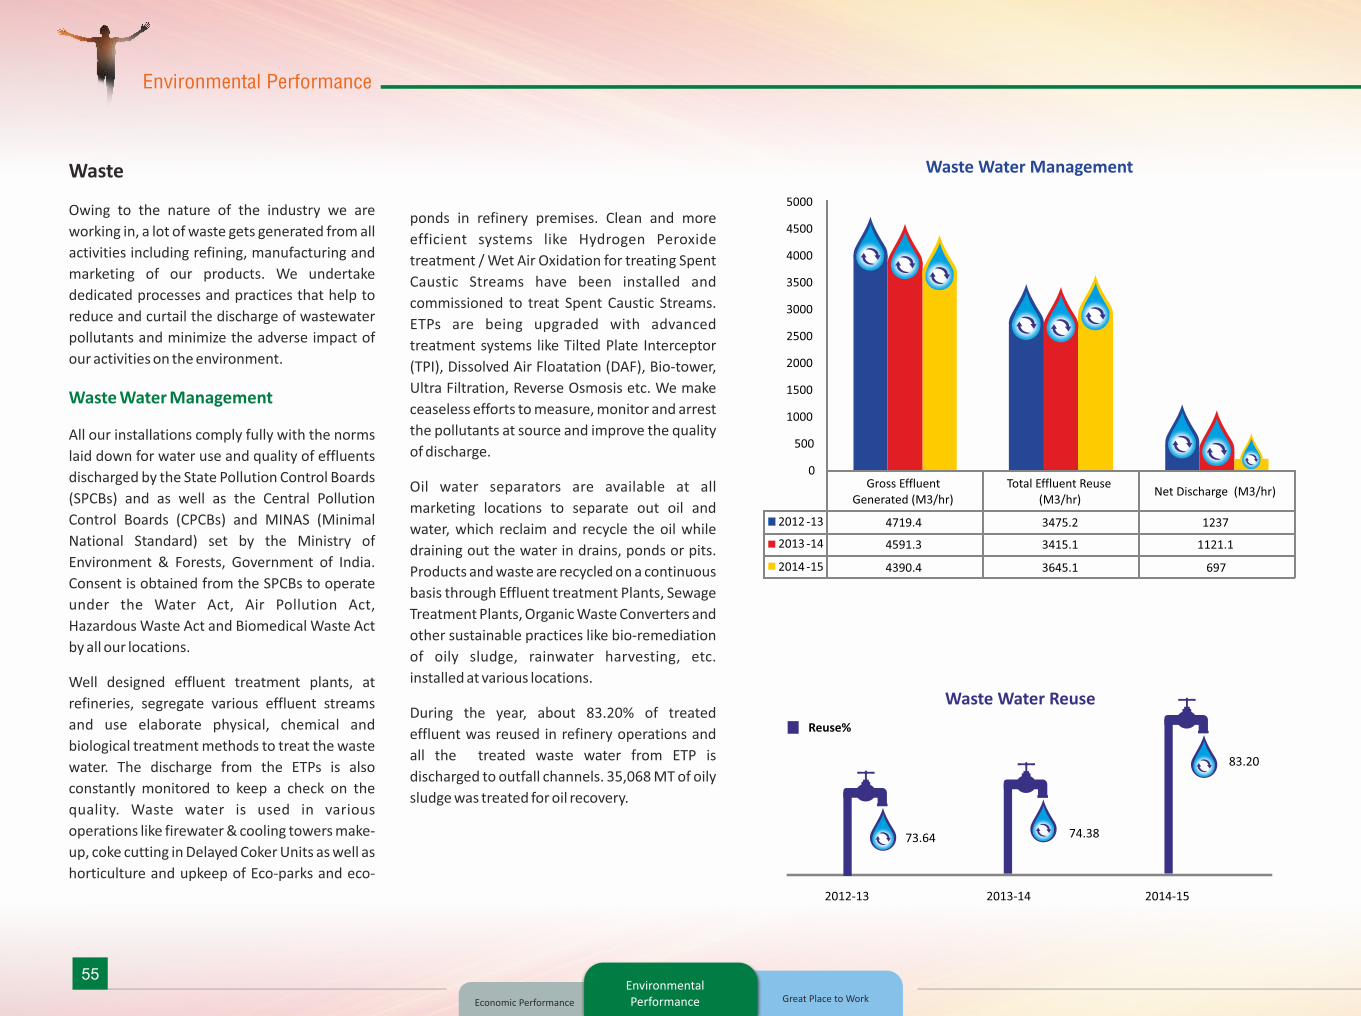
Environmental Performance
55Environmental Performance
Waste
Owing to the nature of the industry we are
working in, a lot of waste gets generated from all
activities including refining, manufacturing and
marketing of our products. We undertake
dedicated processes and practices that help to
reduce and curtail the discharge of wastewater
pollutants and minimize the adverse impact of
our activities on the environment.
Waste Water Management
All our installations comply fully with the norms
laid down for water use and quality of effluents
discharged by the State Pollution Control Boards
(SPCBs) and as well as the Central Pollution
Control Boards (CPCBs) and MINAS (Minimal
National Standard) set by the Ministry of
Environment & Forests, Government of India.
Consent is obtained from the SPCBs to operate
under the Water Act, Air Pollution Act,
Hazardous Waste Act and Biomedical Waste Act
by all our locations.
Well designed effluent treatment plants, at
refineries, segregate various effluent streams
and use elaborate physical, chemical and
biological treatment methods to treat the waste
water. The discharge from the ETPs is also
constantly monitored to keep a check on the
quality. Waste water is used in various
operations like firewater & cooling towers make-
up, coke cutting in Delayed Coker Units as well as
horticulture and upkeep of Eco-parks and eco-
Waste Water Management
Gross Effluent Generated (M3/hr)
Total Effluent Reuse (M3/hr)
Net Discharge (M3/hr)
2012 -13 4719.4 3475.2 1237
2013 -14 4591.3 3415.1 1121.1
2014 -15 4390.4 3645.1 697
0
500
1000
1500
2000
2500
3000
3500
4000
4500
5000
ponds in refinery premises. Clean and more
efficient systems like Hydrogen Peroxide
treatment / Wet Air Oxidation for treating Spent
Caustic Streams have been installed and
commissioned to treat Spent Caustic Streams.
ETPs are being upgraded with advanced
treatment systems like Tilted Plate Interceptor
(TPI), Dissolved Air Floatation (DAF), Bio-tower,
Ultra Filtration, Reverse Osmosis etc. We make
ceaseless efforts to measure, monitor and arrest
the pollutants at source and improve the quality
of discharge.
Oil water separators are available at all
marketing locations to separate out oil and
water, which reclaim and recycle the oil while
draining out the water in drains, ponds or pits.
Products and waste are recycled on a continuous
basis through Effluent treatment Plants, Sewage
Treatment Plants, Organic Waste Converters and
other sustainable practices like bio-remediation
of oily sludge, rainwater harvesting, etc.
installed at various locations.
During the year, about 83.20% of treated
effluent was reused in refinery operations and
all the treated waste water from ETP is
discharged to outfall channels. 35,068 MT of oily
sludge was treated for oil recovery.
73.64 74.38
2012-13 2013-14 2014-15
83.20
Waste Water Reuse
Reuse%
Economic Performance Great Place to Work

56
SUSTAINABILITY REPORT 2014-15
Environmental Performance
Hazardous Waste Management
IndianOil makes continuous efforts to recycle products and
waste through installation of Effluent Treatment Plants,
Sewage Treatment Plants, Organic Waste Converters and
other sustainable practices like bio-remediation of oily
sludge, rainwater harvesting, etc.
Oil water separators are available at all marketing locations to
separate out oil and water, which reclaim and recycle the oil
while draining out the water in drains, ponds or pits. Products
and waste are recycled on a continuous basis through
Effluent treatment Plants, Sewage Treatment Plants, Organic
Waste Converters and other sustainable practices like bio-
remediation of oily sludge, rainwater harvesting, etc.
installed at various locations.
The three R phenomenon of Reduce-Reuse-Recycle is
applicable across our installations. During 2014-15, we
recycled around recycled 11.5 Tonnes of waste paper. Spent
catalyst, bio-sludge and oily sludge generated in crude and
product tanks are the primary hazardous wastes generated
in refinery units. Oily sludge is also generated in product and
crude tanks at pipelines and marketing locations.
Minimization of generation at source, advanced in-situ tank
cleaning methods, bio-degradation using advanced
microbial treatment and safe disposal in secured landfill sites
is some of the methods refineries resort to, to dispose off the
hazardous waste. While in marketing division, hazardous
waste is stored as per PCB norms in HDPE lined pits and
treated through bio-remediation method under guidance of
R&D Centre, Faridabad; at many locations oilivorous is used
for bio-remediation of oily-sludge. Biological Sludge
generated in the Activated Sludge Treatment Plant of ETPs of
Refinery Units is used as manure in eco-parks in refineries.
The spent catalyst generated in the catalytic reformer unit
(CRU) and hydrogen generation unit (HGU) is collected back
by the supplier. Fluid catalytic cracking (FCC) spent catalyst is
used for construction of roads and by cement industry as a
filler material.
Spent Catalyst MT 6410 112.95
Oil Slope MT 261950 227739
Bio Medical Waste kg 1567 -
Total Volume recycled during
2014-15
Type of Waste UnitTotal weight or volume generated during 2014-15
Economic Performance Great Place to Work

Environmental Performance
57Environmental Performance
Clean Development Mechanism
Six projects of the company were registered as CDM projects
under the United Nations Framework Convention on Climate
Change (UNFCCC) with total emission reduction potential of
89,341 MT CO2 equivalent/year. 2693 CERs has been issued
for our AVU Energy Optimization project at Digboi Refinery in
2014.
S.No. Project Location Reduction of Date of Present Status
CO2e (MT/Yr.) Registration
1 AVU Energy optimization Digboi Refinery 2,693 4.12.2008 2693 CERs issued by UNFCCC up to Dec. 2010 on 3rd Jan. 2014
2 Flare Gas Recovery System Haldia Refinery 17,610 19.2.2009 Project is under Technical Review comments by TUV (DOE); reply
awaited from consultant M/s E&Y
3 Flare Gas Recovery System Barauni Refinery 8,320 4.5.2009 TUV-India sent verification repor t for Technical Review at TUV-
Germany on 28 May 2013. Response awaited
4 Flare Gas Recovery System Gujarat Refinery 27,834 30.10.2009 Project is under Technical Review comments by TUV (DoE) reply
awaited from consultant M/s E&Y
5 Flare Gas Recovery System Guwahati 3,690 27.10.2010 Monitoring report (for 1 year operation) to be submitted
by IOC to M/s TUV
6 21-MW wind power project Gujarat Refinery 29,377 23.5.2011 -
Total Annual Reduction 89,524
Carbon Disclosure Project
Indian Oil has been taking an active part in Carbon Disclosure Project
(CDP) every year. CDP works with shareholders and corporations to
disclose the greenhouse gas emissions of major corporations. Being a
voluntary disclosure, it also emphasizes that fact that IndianOil is
committed to conduct its business with strong environmental
conscience.
IndianOil has participated in the Carbon Disclosure Project (CDP), India
2014 and this being the third year of our association with CDP. In 2012
and 2013, IndianOil had scored 53 and 58 points in the disclosure score.
This year as per The India 200 Climate Change Report 2014, IndianOil
scored 83 points on the disclosure score, putting IndianOil into the
Carbon Disclosure Leadership Index (CDLI) for the first time.
Economic Performance Great Place to Work
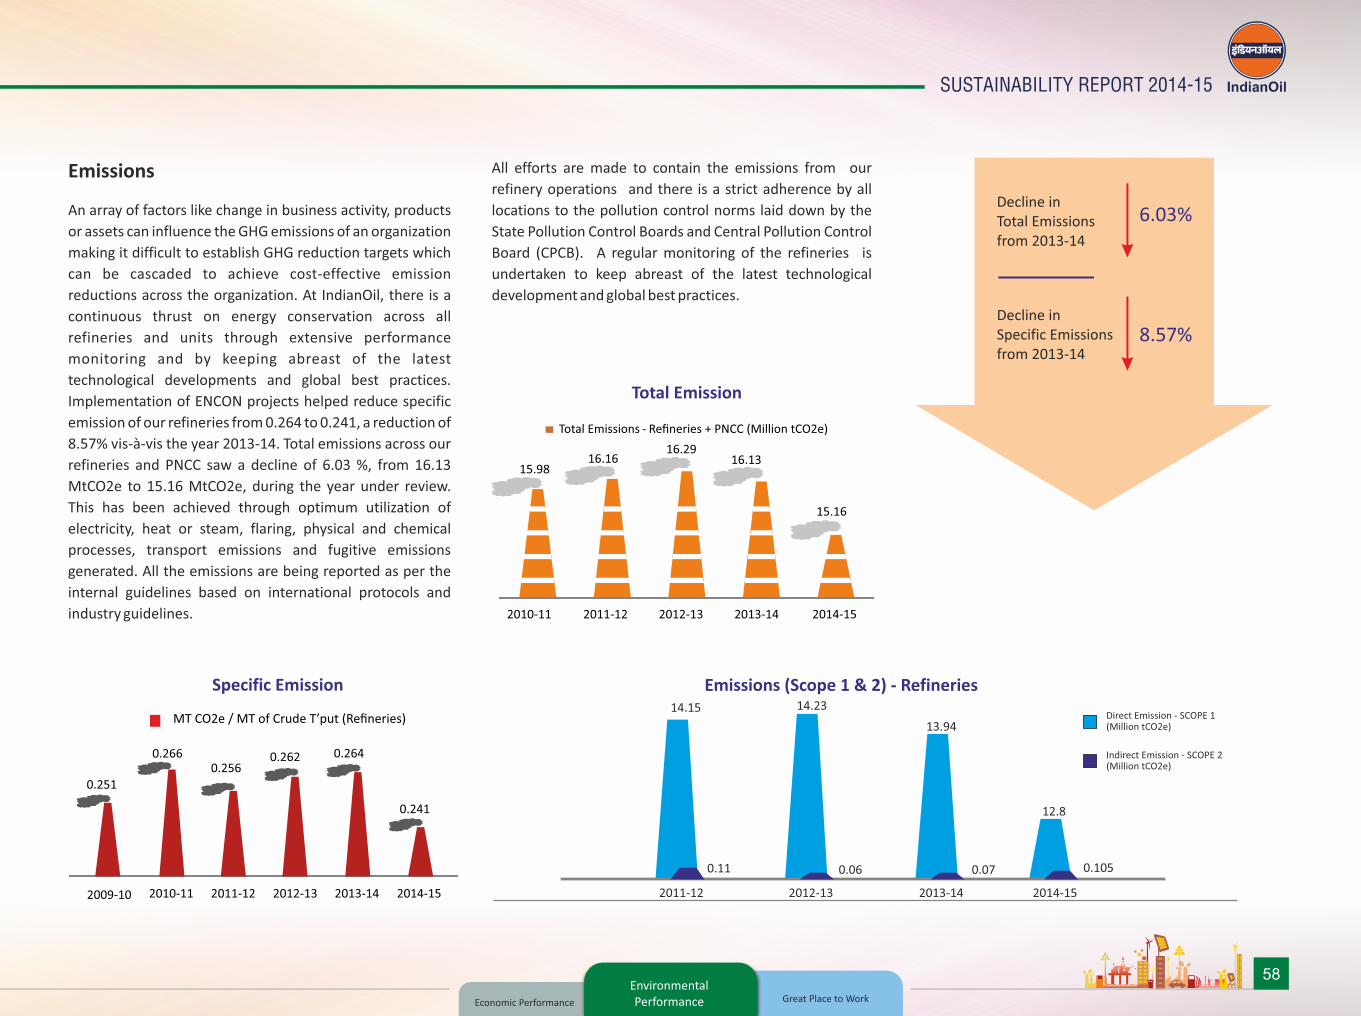
58
SUSTAINABILITY REPORT 2014-15
Emissions
An array of factors like change in business activity, products
or assets can influence the GHG emissions of an organization
making it difficult to establish GHG reduction targets which
can be cascaded to achieve cost-effective emission
reductions across the organization. At IndianOil, there is a
continuous thrust on energy conservation across all
refineries and units through extensive performance
monitoring and by keeping abreast of the latest
technological developments and global best practices.
Implementation of ENCON projects helped reduce specific
emission of our refineries from 0.264 to 0.241, a reduction of
8.57% vis-à-vis the year 2013-14. Total emissions across our
refineries and PNCC saw a decline of 6.03 %, from 16.13
MtCO2e to 15.16 MtCO2e, during the year under review.
This has been achieved through optimum utilization of
electricity, heat or steam, flaring, physical and chemical
processes, transport emissions and fugitive emissions
generated. All the emissions are being reported as per the
internal guidelines based on international protocols and
industry guidelines.
15.9816.16
16.2916.13
15.16
Total Emissions -
2010-11 2011-12 2012-13 2013-14 2014-15
0.251
0.2660.256
0.262 0.264
0.241
2009-10 2010-11 2011-12 2012-13 2013-14 2014-15
Environmental Performance
All efforts are made to contain the emissions from our
refinery operations and there is a strict adherence by all
locations to the pollution control norms laid down by the
State Pollution Control Boards and Central Pollution Control
Board (CPCB). A regular monitoring of the refineries is
undertaken to keep abreast of the latest technological
development and global best practices.
Specific Emission
Total Emission
Decline in Total Emissions from 2013-14
Decline in Specific Emissions from 2013-14
6.03%
8.57%
0.11
14.15
0.06
14.23
0.07
13.94
0.105
12.8
2011-12 2012-13 2013-14 2014-15
Emissions (Scope 1 & 2) - Refineries
Direct Emission - SCOPE 1 (Million tCO2e)
Indirect Emission - SCOPE 2 (Million tCO2e)
Economic Performance Great Place to Work

Environmental Performance
59
Prevention Of Air Pollution
We are working in an industry that is highly emission
intensive. Our major operation, refining of crude, is the major
source of emissions. Flue gases from boilers, heaters, FCC
regenerators and Sulphur Recovery Units, hydrocarbon leaks
and evaporation during storage, handling and transportation
of petroleum products and crude oil are among the major
emissions. Various measures to contain atmospheric
emissions, monitor stack emissions and to ensure effective
dispersion of gases is undertaken at all our refineries.
Measures, such as fixed monitoring stations, have been to
ensure that the air quality is maintained across various
installations. Mobiles van’s equipped with sophisticated
monitoring equipment are being used at Mathura, Panipat
and Gujarat Refineries.
Environmental Performance
NOISE POLLUTION CONTROL
Our refineries have adopted following measures to control noise all source.
Personnel Protective Equipment (PPEs) like ear plugs, earmuffs, noise helmets etc are also used. Acoustic insulation is provided for DG sets at Pipeline location(s) to
achieve 20 dB noise reduction.
Suitably Designed Enclosure for Both Source and Receiver
Regular Maintenance of Machines Use of low Noise Machines
Use of Sound Absorbing Material
60000
50000
40000
30000
20000
10000
0
2SO 31807.56
12099
58148
NOX
Flare Gas
Total Ozone Depleting
8.66 tonnes
Substances (R22 gas, CFC, etc) generated
Stack and fugitive
emissions
9771 To
nn
es
Pollutions
Economic Performance Great Place to Work
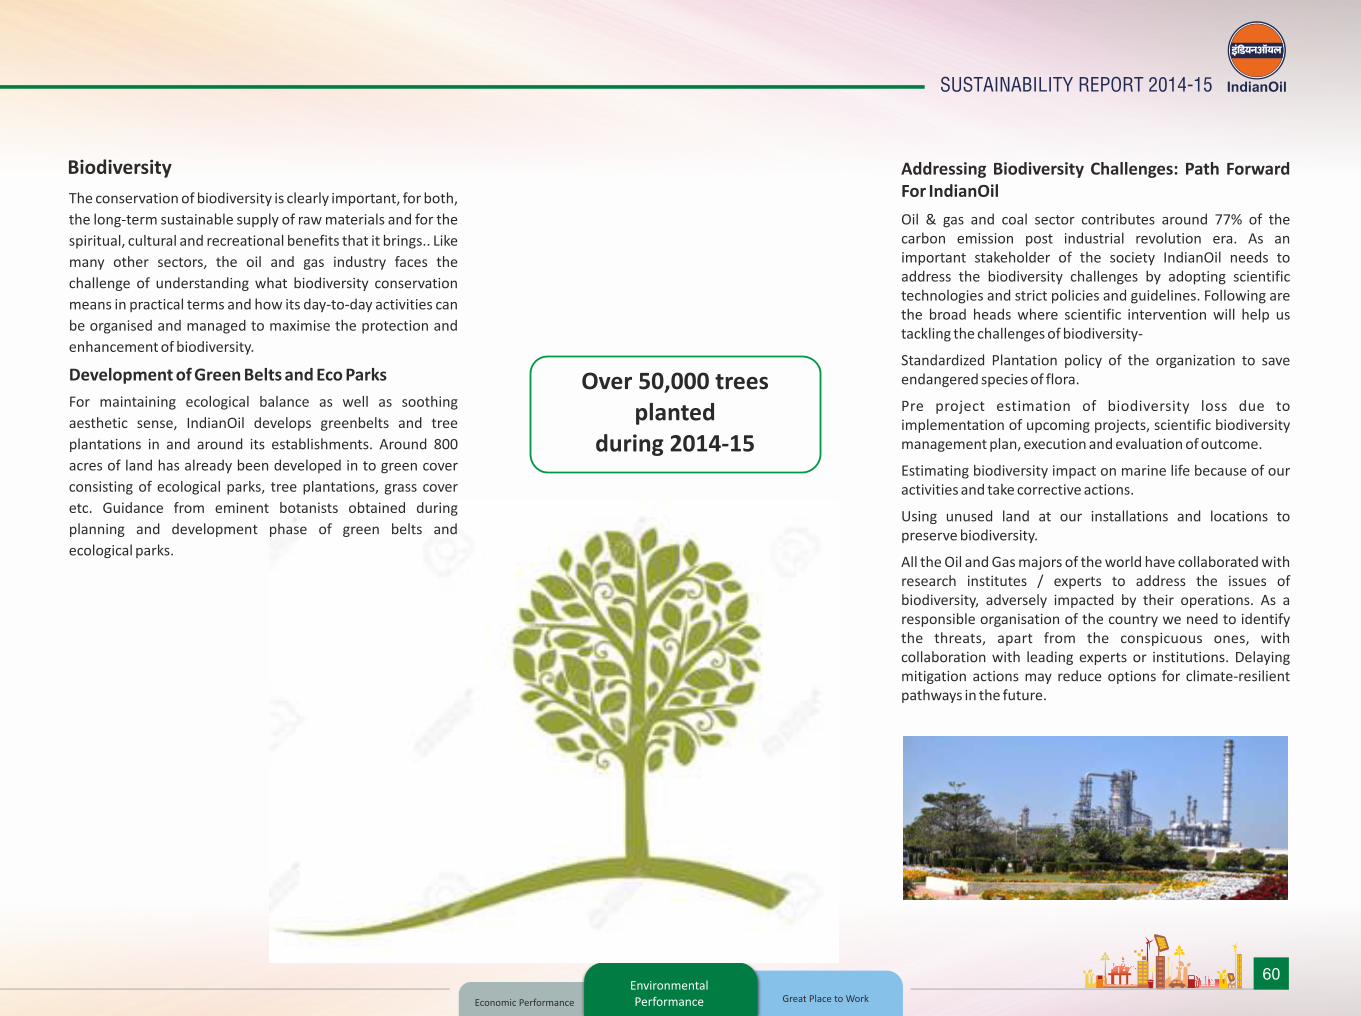
60
SUSTAINABILITY REPORT 2014-15
The conservation of biodiversity is clearly important, for both,
the long-term sustainable supply of raw materials and for the
spiritual, cultural and recreational benefits that it brings.. Like
many other sectors, the oil and gas industry faces the
challenge of understanding what biodiversity conservation
means in practical terms and how its day-to-day activities can
be organised and managed to maximise the protection and
enhancement of biodiversity.
Development of Green Belts and Eco Parks
For maintaining ecological balance as well as soothing
aesthetic sense, IndianOil develops greenbelts and tree
plantations in and around its establishments. Around 800
acres of land has already been developed in to green cover
consisting of ecological parks, tree plantations, grass cover
etc. Guidance from eminent botanists obtained during
planning and development phase of green belts and
ecological parks.
Addressing Biodiversity Challenges: Path Forward For IndianOil
Oil & gas and coal sector contributes around 77% of the carbon emission post industrial revolution era. As an important stakeholder of the society IndianOil needs to address the biodiversity challenges by adopting scientific technologies and strict policies and guidelines. Following are the broad heads where scientific intervention will help us tackling the challenges of biodiversity-
Standardized Plantation policy of the organization to save endangered species of flora.
Pre project estimation of biodiversity loss due to implementation of upcoming projects, scientific biodiversity management plan, execution and evaluation of outcome.
Estimating biodiversity impact on marine life because of our activities and take corrective actions.
Using unused land at our installations and locations to preserve biodiversity.
All the Oil and Gas majors of the world have collaborated with research institutes / experts to address the issues of biodiversity, adversely impacted by their operations. As a responsible organisation of the country we need to identify the threats, apart from the conspicuous ones, with collaboration with leading experts or institutions. Delaying mitigation actions may reduce options for climate-resilient pathways in the future.
Environmental Performance
Biodiversity
Over 50,000 treesplanted
during 2014-15
Economic Performance Great Place to Work

Environmental Performance
61
Gujarat refinery
A 100 M wide green belt with area of 30 acres around two
sides of Hydrocracker Project has been developed wherein
30,000 trees are in grown up stage. Also a 500-M wide green-
belt with area of 96 acres in the down-wind direction with
more than 1,75,000 trees has been developed to maintain
ecological balance as well as soothing aesthetic sense.
Additional nos. of around 2000-3000 trees are planted each
year by Gujarat Refinery at Green Belt as well as neighboring
areas.
A beautiful ECO-PARK has been developed within this green
belt with a pond spreading across 13,000 M2 area. About
10,000 nos. Rahu & Katla fishes inhabit the water and ducks
roam at leisure on the banks. 4 nos of surface aerators are
continuously running in pond, which oxygenates the water to
support aquatic life. Several species of migratory birds have
also found a place for themselves in the Eco-Park.
Guwahati Refinery
Tree plantation adopting Japanese Akira Miyawaki model,
which elaborates how to plant a ‘dense forest’ for
environmental protection instead of ‘planting a tree’, has
been carried out in Refinery Township.
Tree plantation is an annual activity with total of 2500 tree
saplings planted in 2014-15 & 2475 in 2013-14. Around
80,000 saplings were planted over the period of last five
years.
Environmental Performance
Bongaigaon Refinery
There are total 84545 numbers of trees, shrubs and Bamboo
culms inside BGR. About one third of BGR plant area is
covered by trees.
Economic Performance Great Place to Work

62
SUSTAINABILITY REPORT 2014-15
Panipat Refinery
PR & PNC jointly have developed a buffer green belt of about 500 acres with 6 lakhs + trees of different varieties to ensure biodiversity and maintain ecological balance.
Digboi Refinery
IndianOil is aware of the rich legacy it has inherited at Digboi and is working hard to ensure that its operations do not sully the pristine settings. Over 20,000 old trees flourish in the refinery complex acting as first-level sinks for residual pollutants. All intense efforts are aimed to let nature flourish unhindered by development. Additionally about 5000 Nos of Trees were planted during the year.
Environmental PerformanceEconomic Performance Great Place to Work

TRANSFORMATIONAL LEADERSHIP
63
Big Family The most important resource for the success of an organization is its human capital. Businesses reap the benefits of proper management and fostering of available human resource in the long-term. With a country-wide presence, we offer huge exposure to talented individuals and ample opportunities for an all-round development. Therefore it is inevitable to nurture talent in order to create a mutually rewarding environment, for both, business as well as individual performance.
Employee categorization by(2014-15)
General - 60.53%
OBC - 13.77%
SC - 18.00%
ST - 7.71%
Employment Type
Marketing - 41.73%Refineries - 48.73
Pipelines - 7.78%R&D - 1.22%
IBP - 0.52
Division (%)
Total Employees
by Gender
7.88%
92.12% Male Female
Gender
< 30 Years
15%
44%41%
Total Employees
By Age
Age
30-50 Years
Great Place to Work
Divisions and Gender
Male
Female
Marketing Refineries Pipelines R&D IBP
13033
723
14377
1690
2452
114
34754
157
15
Human CapitalIndianOil is a congregation of 32,962 employees with their presence across the country. Apart from permanent employees, a large quantum of contractual employees, at various locations, help in support services and other allied activities. To take care of the operational needs and labor demand, job contractors are employed who further engage contract workers. During the year 2014-15, 54,173 contract workers were employed with us. IndianOil, as a principle employer, ensures that all statutory requirements are duly complied with.
Great Place to Work
Environmental Performance
Social Perfromance

64
SUSTAINABILITY REPORT 2014-15
Great Place to Work
Hiring Process
Owing to the diversity of operations, IndianOil has a tough task hunting the best talent from across the country to take the baton of development in every field. Diverse operations, ranging from exploration to production to refining to marketing, require specialized and devoted individuals. The recruitment in all fields happens at the entry level through open category via various competitive exams as well as campus recruitments. Since the past 2 years, recruitments are also being done at assistant officer level.
Environmental Performance
Social Perfromance

65Great Place to Work
TRANSFORMATIONAL LEADERSHIP
Employee Requirement by (2014-15)
Male
Female92.37%
7.63%
< 30 Year
30-60 Years
17.67%
82.33%
AgeGroup
Marketing - 28.47%
Refineries - 43.19%
Pipelines - 16.76%
CO - 10.49%
R&D - 1.09%
Division (%)
Rate of employees recruited (2014-15)
317 209 123 77 8
Age Group
<30 Years 30-60 Years >50 Years
13.77 0.23 0
Gender
Female Male
2.16 2.23
Division
Pipeline Marketing Refinery R&D CO
4.79 1.3 2.3 2 0
Gender
No. employees
Environmental Performance
Social Perfromance

66
SUSTAINABILITY REPORT 2014-15
Great Place to Work
10.30%
89.70% Male
Female
Gender
< 30 Years
30-60 Years
82.98%
Age
> 50 Years
14.01%
3.01
Employees Turnover by Divisions
Marketing - 38%
Refineries - 46%
Pipelines - 8%
IBP - 5%
CO - 2%
R&D - 1%
Age Group
<30 Years 30-60 Years >50 Years
4.31 0.33 9.58
Gender
Female Male
6.20 4.62
Employees Turnover (2014-15)
Rate of Employees Turnover (2014-15)
Division
Pipeline Marketing Refinery R&D IBP CO
5.03 3.70 5.22 4.99 46.51 0
595 129 80 21 2071816114021297 219 47
Environmental Performance
Social Perfromance

67
Career TransitionWith a huge section of our experienced capital moving towards superannuation, it is our responsibility to aide them in a smooth transition from work life to retirement. Various sessions addressing retirement and old age concerns, psychological aspects of retirement, investment and tax planning, post retirement benefits and health re lated i s s u es a re co n d u c ted fo r s en io r management and employees nearing retirement. Sessions emphasizing the importance of a healthy lifestyle are also held for ex-employees as well as regular employees.
Employee Performance Management System (EPMS)
Structural changes were introduced in the earlier performance management scheme to incorporate transparency by making the system web-based. The new e-PMS system allows employees to identify Key Result Areas (KRAs) which are defined on the basis of Key Performance Index (KPI). Each KPI is given a weightage, on the basis of which individual performances are assessed at the end of the year, depending on the degree of the fulfillment of the KPI. Performance Related Pay, individual rating and departmental promotions are all linked to the e-PMS rating. All employees have been covered under the new scheme. The policy is also applicable to the whole time functional directors, who are paid performance related pay as employees of the company.
Great Place to Work
As part of the corporate HR initiative 'Investing in our people', an Ideas Utsav and an internal customer survey were conducted to generate ideas and seek suggestions for simplifying and enhancing HR services.
UTSAV
New training programmes on behaviour based safety were launched to develop the capabilities of junior management cadres. New programs featuring Succession planning through leadership and development centres and multi-rater feedback mechanism, were also undertaken.
SHAPING YOUNG MINDS, MASTERING CHANGE
A new, structured program has been implemented to enhance profitability and margins along with improving systems and procedures in our refineries.
SAMRIDDHI
Special initiatives
TRANSFORMATIONAL LEADERSHIP
Environmental Performance
Social Perfromance

68
SUSTAINABILITY REPORT 2014-15
Great Place to Work
The existence of a formal joint representation helps the workforce in striving hard to work towards the achievement of organizational goals. A formal arrangement between the employees and the union also provides a platform to both parties to discuss and indulge in fruitful conversations. At IndianOil, 53.59% of the total employees are covered by collective bargaining agreements. There are 23 recognized unions which represent the executive and non-executive employees. All unions/collectives are ‘recognized’ under the code of discipline. Over 91% of all employees are a member of recognized unions and officers associations. As per the Industrial Dispute Act, collective bargaining is both bilateral and tripartite agreement. ‘Open House’ sessions with the chairman and directors, regular meetings and discussions are held by the management with workers union as well as officers association to address the concerns raised. These meetings are also webcasted across all locations to instill in employees a feel ing of inclusion and collaboration. Information pertaining to the financial and physical parameters, major corporate challenges, health and safety etc is also discussed with the collectives in meetings. Any discussions regarding revision of wages and allowances are first conducted at the divisional level with the recognized unions and thereafter, settled through a tripartite Long Term Settlement (LTS).Various committees like Joint Management Council, Works Committee, Management Safety Committee, Grievance Committee, Canteen Committee, Total Productive Maintenance (TPM) etc. present
the employees with a wide array to choose from and inculcate in them a participative culture. Employees’ right to exercise freedom of association or collective bargaining is regulated by the Trade Union Act. Various schemes like Suggestions scheme, quality circles and mentoring etc. are held round the year to increase employees’ participation in
Employee Engagement
management. The employer can propose any change in the conditions of the services applicable to any workman in any matter whatsoever, by giving a notice of 21 days. There are no operations, whatsoever, which might pose a risk to the right to exercise freedom of association and collective bargaining
Environmental Performance
Social Perfromance

69
We, at IndianOil, realize the immense potential that is endowed upon our organization in the form of human capital. Relentless efforts are made to polish and hone the skills of the individuals. Focused training programs are undertaken all throughout the year, on varied topics, to enhance the performance of all.
The IndianOil family strongly believes in knowledge sharing and various training programs are conducted with trainings given by both in-house as well as foreign faculty. Numerous training programs are conducted for various sections of employees: induction training for new recruits; strategic location management, performance feedback and training the trainers etc. for middle management and career transition programs for higher management and superannuating employees. According highest importance to safety and security of company operations, assets and people, safety and skills upgradation training is given to employees at regular intervals across our installations.
During 2014-15, each employee was given 18.56 manhours of training on an average. Around 6.12 lakh training manhours were recorded in total for all employees, during last year.
Under Project Chetna, over 98,000 customer attendants engaged at retail outlets were given training to help them make fuelling experience enjoyable for customers and also act as a differentiator for sustaining business.
Mentoring ProgramKnowledge sharing is an integral part of IndianOil culture. It is very important to provide a friendly platform to the new recruits to adjust to the corporate culture and look for career growth opportunities. ‘Mentor-mentee’ program is designed in such a way that the new recruits can take professional and personal help from their colleagues without hesitation. The duration of the program is usually one-year where the mentor and mentee develop a cordial relationship with each other and usually enjoy it life-long.
Divisions
Great Place to Work
Marketing - 16.99 Refinery - 16.92
Pipelines - 32.64
IBP - 18.09
R&D - 47.80
Female 18.47
Male 18.58
TrainingArea
PersonalDevelopment
Anti-Corruption
Sustainability
FunctionalDomain
Technical
HumanRights
Health &Safety
CareerDevelopment
Gender
Average Training Hours per employee by (2014-15)
TRANSFORMATIONAL LEADERSHIP
Training and Development
Environmental Performance
Social Perfromance

70
SUSTAINABILITY REPORT 2014-15
Great Place to Work
IndianOil is an equal opportunity employer where no discrimination is made on the basis of gender, caste or creed. Women have been given 33% reservation for Kisan Seva Kendra dealerships. There are various forums where women employees are encouraged to represent the organization, nationally and internationally. To promote gender sensitivity and to improve transactional relationship, workshops and training programs are conducted by well-known activists across our establishments. Women’s cells, headed by an Apex Level WIPS (Forum for Women In Public Sector) have been established across IndianOil.
2010 -11 2011 -12 2012 -13 2013 -14 2014 -15
7.73
7.83
7.75
7.82
7.87
7.65
7.7
7.75
7.8
7.85
7.9
% of female employees
Benefits to Female Employees
Maternity Leave 135 days maternity leaves
Child Care Leave 2 years child care leave without pay, once in entire service
Child Adoption Leave Child Adoption leave with pay for a period of 135 days in order to facilitate them to take care of the adopted child. exceeding three years.
Husband Joining Leave To join their husbands at outstations / abroad for period not exceeding three years.
Maternity Leave Nos. (2014-15) Employees entitled to maternal leave All Female Employees
Employees that took maternal leave 71
Employees who returned to work after maternal 59
leave ended
Employees who returned to work after maternal 59
leave ended and who were still employed 12 months
after their return to work
Return to work rate and retention rates 83.10 of employees who took maternal leave
Equality for All
Environmental Performance
Social Perfromance

71
Women Empowerment
International Women’s Day (IWD) on 8th March, is celebrated by several hundred talented, skilled and determined women workforce, across IndianOil locations. It is also an occasion for looking ahead to the untapped potential and opportunities that await women employees. In our company, as well as in most industry sectors across the world, women workforce has a long way to go.
In IndianOil, women workforce has been an integral part of business, however, we all would certainly like to see many more women in important roles and positions of leadership in the years ahead, as our company grows and prospers. For all these reasons and many more, the cover story of March issue not only reveals the spirit of Women’s Day, but also celebrates the diversity in our organisation. The wide range of women engineers, IndianOil News interviewed, particularly in the Grade A, B, and C, posted at the varied field locations; definitely proved the point that these young field-officers are increasingly defining success, at their respective work locations.
Great Place to Work
TRANSFORMATIONAL LEADERSHIP
Women Empowerment
Environmental Performance
Social Perfromance

72
SUSTAINABILITY REPORT 2014-15
Great Place to Work
Social Security BenefitsContributory Provident Fund
GratuityGroup Linked Insurance scheme
EPS 1995Compensation on Death
Super Annuation Benefit Fund SchemePost Retirement Medical Benefits
Benefits to OBC/SC/ST employees Reservation in Recruitment and PromotionsRelaxation/ Concession in Recruitment and
Promotions Pre promotional inputs for Grade VI to Grade
A promotionsin Marketing Division SC/ST cell, Complaint Register, Liaison Officer to address issues
Specific Trainings
Benefits to Physically Challenged employees
Reservation in Recruitment and PromotionsRelaxation/ Concession in Recruitment and
Promotions Various Allowances such as
Conveyance allowance, medical equipment Special training, special equipment aid
Provision of Barrier free access'Preference in terms of posting
to the extent possible
Remuneration and AllowancesIndianOil engages with job contactors to take care of non-core activities. Supplementary activities relating to civil construction & maintenance, housekeeping, security, material handling, shut down/ revamp jobs, lifting & movement of materials, providing transport services, catering services, etc. are taken care of by contractual labor at all locations. Contractual labors engaged by the contractors
are all governed by the Contract Labor (Regulation and Abolition) Act, 1970. Since IndianOil is the principal employer, it ensures that there is strict adherence to the provisions of EPF & MP Act, 1952/ESI Act 1948 among other social security schemes like PF, ESI etc. The terms and conditions of the contractual labor’s service are regulated as per their contract with their respective contractor.
Environmental Performance
Social Perfromance
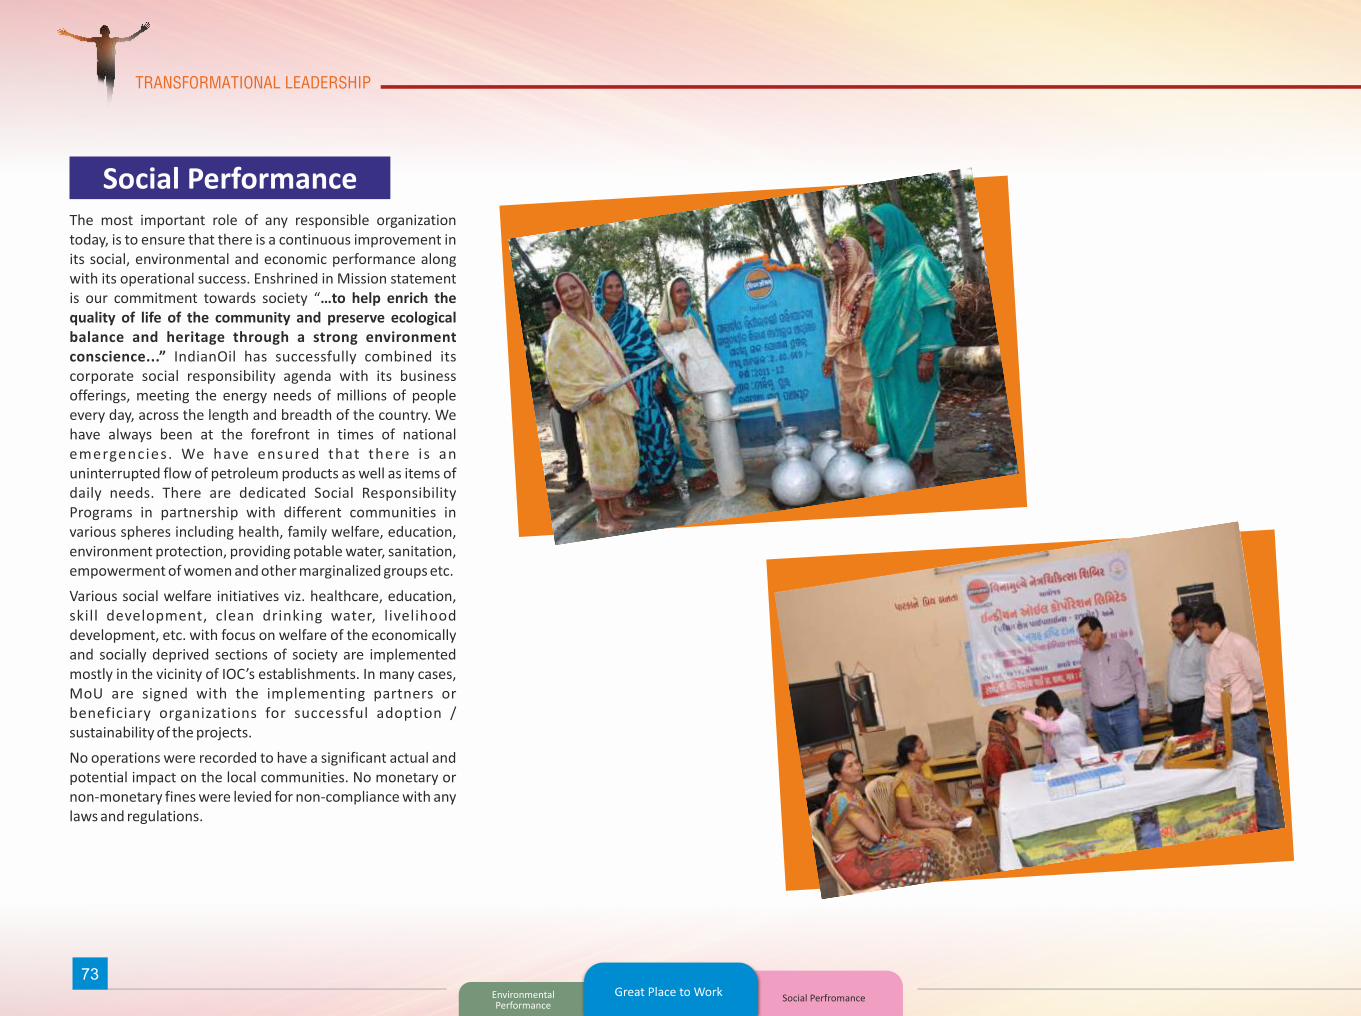
73
The most important role of any responsible organization today, is to ensure that there is a continuous improvement in its social, environmental and economic performance along with its operational success. Enshrined in Mission statement is our commitment towards society “…to help enrich the quality of life of the community and preserve ecological balance and heritage through a strong environment conscience...” IndianOil has successfully combined its corporate social responsibility agenda with its business offerings, meeting the energy needs of millions of people every day, across the length and breadth of the country. We have always been at the forefront in times of national emergencies. We have ensured that there is an uninterrupted flow of petroleum products as well as items of daily needs. There are dedicated Social Responsibility Programs in partnership with different communities in various spheres including health, family welfare, education, environment protection, providing potable water, sanitation, empowerment of women and other marginalized groups etc.
Various social welfare initiatives viz. healthcare, education, skill development, clean drinking water, livelihood development, etc. with focus on welfare of the economically and socially deprived sections of society are implemented mostly in the vicinity of IOC’s establishments. In many cases, MoU are signed with the implementing partners or beneficiary organizations for successful adoption / sustainability of the projects.
No operations were recorded to have a significant actual and potential impact on the local communities. No monetary or non-monetary fines were levied for non-compliance with any laws and regulations.
Great Place to Work
TRANSFORMATIONAL LEADERSHIP
Social Performance
Environmental Performance
Social Perfromance

74
SUSTAINABILITY REPORT 2014-15
Social Perfromance
IndianOil pursued Corporate Social Responsibility initiatives with renewed vigour during the year, especially as part of Swachh Bharat Abhiyan. Construction of toilets and sanitation facilities in schools was taken up in a big way under the Swachh Vidyalaya Abhiyan.
The most important role of any organization today, is to ensure that there is a continuous improvement in its social, environmental and economic performance along with its operational success. Enshrined in our Mission statement is our commitment towards society “…to help enrich the quality of life of the community and preserve ecological balance and heritage through a strong environment conscience...” IndianOil has successfully combined its corporate social responsibility agenda with its business offerings, meeting the energy needs of millions of people every day, across the length and breadth of the country. We have always been at the forefront in times of national emergencies. We have ensured that there is an uninterrupted flow of petroleum products as well as items of daily needs. There are dedicated Social Responsibility Programs in partnership with different communities in various spheres including health, family welfare, education, environment protection, providing potable water, sanitation and empowerment of women and other marginalized groups.
Total expenditure incurred during 2014-15 Rs.113.79 crore on CSR related activities
5% 5%
27%
26%
5%
32%
42.56%
25.91%
6.74%
13.34%
11.02%
0.43%
Healthcare Sports Misc
6%5%6%
33%
6% 22%
22%
CSR Project undertaken
during in 2014-15
CummulativeAmount spentin CSR Projectby Category
(%)
CSR Projectto be under taken during2015-16 by
category
Great Place to Work Healthy & Safety

75Social Perfromance
SCHEME BENEFITS
IndianOil Education Scholarship Scheme During 2014-15, 2600 scholarships awarded to poor and deserving students on merit-cum-means basis.
Industrial Training Centre, Digboi Assam During 2014-15, 25 students completed various courses and so far, about 1200 students were benefitted from this scheme.
IndianOil Sachal Swasthya Seva: 52 Mobile Medical Units in During 2014-15, 14.44 lakh patients were treated and cumulatively, more than 40 lakh patients have been treated.
Andhra Pradesh, Telengana & Uttar Pradesh
AOD Hospital, Digboi, Assam- 200 Bed Hospital During 2014-15, 19,586 non-employee patients were treated and since 2005-06, about 2 lakh non-employee patients have been treated in this hospital.
Swarna Jayanti Samudaik Hospital, Mathura, Uttar Pradesh: During 2014-15, 48,588 non-employee patients were treated; Since 1999, about 7.4 lakh patients have been treated.50 Bed Hospital
Assam Oil School of Nursing and Assam College of Nursing, Since inception, 354 students have successfully completed the course with 100% placement record. Assam Oil College
Digboi, Assam of Nursing (AOCN) started functioning in November 2014 with intake of 30 students B.Sc. (Nursing) course.
Swacch Vidyalaya Abhiyan (SVA) across india IndianOil has plans to construct/repair over 2700 toilets in Government Schools across 16 states in India.
IndianOil Multi-Skill Development Institute, Digboi, Assam 162 students in 2 batches were enrolled during the year, classes for which commenced in September 2014.
Rajiv Gandhi Grameen LPG Vitaran Yojana of the One-Time grant to Below Poverty Line (BPL) families in the rural areas for release of new LPG connection under Rajiv Government of India Gandhi Grameen LPG Vitaran Yojana. During 2014-15, 5.6 lakh new connections were released.
Shikshak Dakshyata Vikas Abhiyan, Digboi, Assam Aims to improve soft skills of government school teachers. During 2014-15, 87 teachers covering 10 villages in and around Digboi were trained under the program so far, 248 teachers have been trained under this project.
Sarve Santu Niramaya, Digboi, Assam Aims to provide free health consultation and medicines for both human beings and livestock population. During 2014-15, over 1500 poor patients and 16000 cattle/poultry were treated.
TRANSFORMATIONAL LEADERSHIP
CSR Schemes
Great Place to Work Healthy & Safety
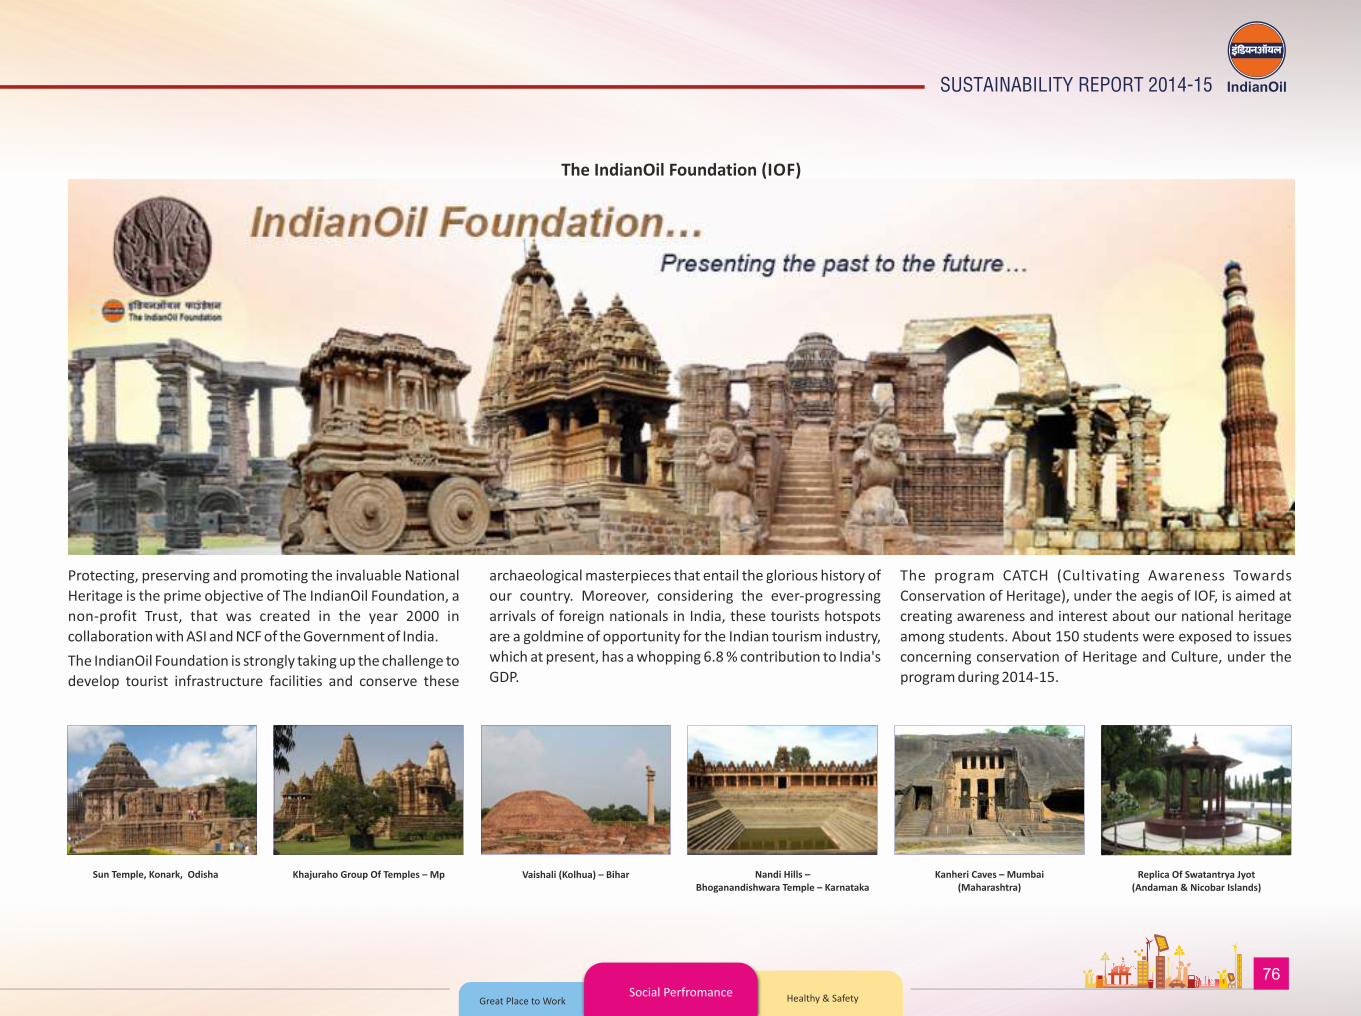
76
SUSTAINABILITY REPORT 2014-15
Social Perfromance
Protecting, preserving and promoting the invaluable National
Heritage is the prime objective of The IndianOil Foundation, a
non-profit Trust, that was created in the year 2000 in
collaboration with ASI and NCF of the Government of India.
The IndianOil Foundation is strongly taking up the challenge to
develop tourist infrastructure facilities and conserve these
The IndianOil Foundation (IOF)
archaeological masterpieces that entail the glorious history of
our country. Moreover, considering the ever-progressing
arrivals of foreign nationals in India, these tourists hotspots
are a goldmine of opportunity for the Indian tourism industry,
which at present, has a whopping 6.8 % contribution to India's
GDP.
The program CATCH (Cultivating Awareness Towards
Conservation of Heritage), under the aegis of IOF, is aimed at
creating awareness and interest about our national heritage
among students. About 150 students were exposed to issues
concerning conservation of Heritage and Culture, under the
program during 2014-15.
Sun Temple, Konark, Odisha Khajuraho Group Of Temples – Mp Vaishali (Kolhua) – Bihar Nandi Hills – Bhoganandishwara Temple – Karnataka
Kanheri Caves – Mumbai (Maharashtra)
Replica Of Swatantrya Jyot (Andaman & Nicobar Islands)
Great Place to Work Healthy & Safety

77
The IndianOil Aviation team worked shoulder to shoulder with IAF and ensured continuous supply of aviation fuel.“The Aviation team commenced round-the-clock supplies within two hours of the earthquake from its Gorakhpur and
TRANSFORMATIONAL LEADERSHIP
Hindon aviation fuel stations, to aid the relief operations to the quake-devastated Nepal.”
A Corporate with its heart in the right placeResponding quickly and constructively in times of calamities
has become a strong corporate ethic of IndianOil. Rising up to the challenges unravelling after an earthquake devastated Nepal, IndianOil has proved, once again, that human spirit can triumph in the worst disasters.
Action for Road SafetyDescribing the global road death and injury as a “Major public health problem with a broad range of social and economic consequences, which if unaddressed, may affect the sustainable development of countries, and hinder the progress towards the millennium development goals”, the UN General Assembly proclaimed the UN Decade of Action for Road Safety 2011-20, in a landmark resolution co-sponsored by 100 countries. Officially launched on 11th May’11, the ‘Decade of Action’ has the official goal of
‘Stabilizing and then reducing’ global road traffic fatalities by 2020.India observes ‘Road Safety Week’ in the month of January every year, in order to spread road safety awareness. IndianOil locations use this opportunity to promote road safety in their workplaces and nearby communities in general.
Social PerfromanceGreat Place to Work Healthy & Safety

78
SUSTAINABILITY REPORT 2014-15
The policy on Health, Safety and Environment (HSE) covers all the employees and locations. We are committed to conduct business with a strong environmental conscience ensuring sustainable development, safe work places and enrichment of quality of life of employees, customers and the community at large.Refineries, which contribute to almost 98% of our emissions, are under constant vigil by the CPCB and SPCB with respect to their emission standards and are certified to ISO:14064 standards for sustainable development as well as for the Occupational Health & Safety Management System (OHSMS/OHSAS-18001). There are various surprise and planned safety audits carried out at various locations throughout the year. A public disclosure of environmental and social impact
assessments results are done for all the installations every year. Works councils, occupational health and safety committees and other employee representation bodies to deal with impacts are present at all installations and make sure that the rights of all workers are protected at all times.
Health & Safety
Healthy & SafetySocial Perfromance Product Responsibility

79
2014-15 Refineries Marketing Pipelines R&D Total
(Nos.) (Nos.) (Nos.) (Nos.) (Nos.)
Fatal Accidents 1 3 Nil Nil 4
Fatalities 1 5 Nil Nil 6
Near miss 74850 1933 19 15 76817
Occupational Diseases Nil Nil Nil Nil Nil
Mandays lost 421 758 Nil Nil 1179
No of loss time accidents 2 7 Nil Nil 9
Major Fire incidents Nil 3 Nil Nil 3
Minor fire incidents Nil 8 Nil 4 12 Casual/Temporary/Contractual Employees/ Contract labor
% of employees given safety & skill up-gradation training during 2014-15
Permanent Women Employees 75%
76.47%
Permanent Male employees 79.5%
Permanent Employees with Disability 21.67%
TRANSFORMATIONAL LEADERSHIP
Yes
Yes
Yes
Yes
Yes
Yes
Yes Yes
Yes
Yes
YesYes
Program Recipients
Workers
Worker’sFamilies
Community Members Education Training
Counseling
Prevention Risk Control
Treatment
Assistance Program for Family Members of Workers
Healthy & SafetySocial Perfromance Product Responsibility
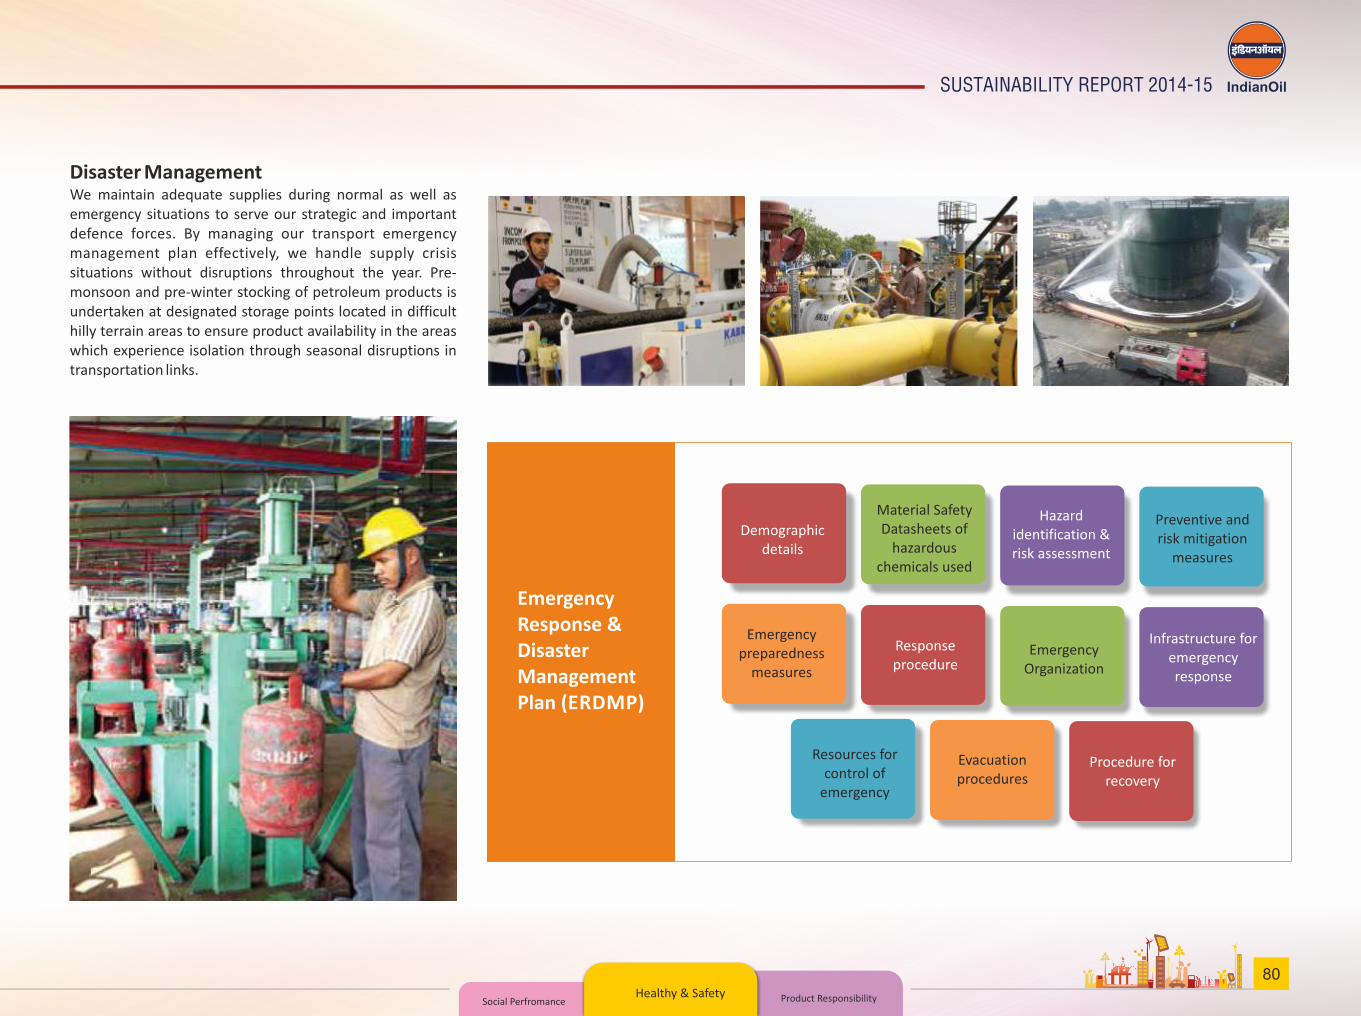
80
SUSTAINABILITY REPORT 2014-15
Disaster ManagementWe maintain adequate supplies during normal as well as emergency situations to serve our strategic and important defence forces. By managing our transport emergency management plan effectively, we handle supply crisis situations without disruptions throughout the year. Pre-monsoon and pre-winter stocking of petroleum products is undertaken at designated storage points located in difficult hilly terrain areas to ensure product availability in the areas which experience isolation through seasonal disruptions in transportation links.
Emergency Response & Disaster Management Plan (ERDMP)
Demographicdetails
Material SafetyDatasheets of
hazardouschemicals used
Hazardidentification & risk assessment
Preventive and risk mitigation
measures
Emergencypreparedness
measures
Responseprocedure
EmergencyOrganization
Infrastructure foremergencyresponse
Resources forcontrol of
emergency
Evacuationprocedures
Procedure forrecovery
Healthy & SafetySocial Perfromance Product Responsibility

81
Oil Spills Response
Oil spills are inevitable part of businesses like ours which deal with Refining & Marketing of Crude Oil. Oil Spill Response facilities are available at all our port locations. IndianOil has placed measure for Oil spill response. Oil spill response facilities are provided at IndianOil portlocations. Tier I facilities are being maintained by respective Port Trusts. For Tier II (1000 tonnes) and Tier III (beyond 1000 tonnes) the services of East Asia Response Limited, Singapore are being used. Oil spill response facilities such as oil dispersant liquid & absorbent pads are made available at all installations. No significant Oil Spills reported during the year.
Oil spill mock drills are conducted on high seas at the Single Point Mooring (SPM) system. Associated oil spill equipments like skimmers, floating tanks, OSD spray arms, beach cleaning equipments, etc. are also demonstrated.
Oil Spill Response Facilities:
Inter-Tidal Boom Disk and Mop Skimmers
Floating Tanks Off-Loading Pump
Anti-Pollution Vessels Ballast Water Treatment
Plant
Oil spills often result in both immediate and long-term environmental damage. Some of the environmental damage caused by an oil spill can last for decades after the spill occurs. The long-term damage to various species, and to the habitat and nesting or breeding grounds those species depend upon for their survival, is one of the most far-reaching environmentaleffects caused by oil spills.
TRANSFORMATIONAL LEADERSHIP
Healthy & SafetySocial Perfromance Product Responsibility

82
SUSTAINABILITY REPORT 2014-15
SafetyNational Safety Day and Fire Service Day are observed on 4th March and 14th April each year, respectively at all our installations. On site and off site mock drills are carried out at all our locations as per the schedule. These drills are aimed at assessing the in-house preparedness and alertness during the crisis situation. A scenario of leakage of crude oil and subsequently culminating into minor fire are also envisaged. Operation and maintenance of fire extinguishers, ensuring electrical safety at pump island, sales building, regular checks of equipments like air compressor are some of the topics covered during the training modules, both classrooms as well as mock drill session.Operations having significant potential are provided with safety and security measures to Prevent and mitigate negative impacts on local communities, employees, or property.Our all establishments are provided with security arrangements inline with threat perception. Our major establishments like refineries, R&D etc are guarded by CISF security personnel. The security arrangements at all Marketing & Pipeline locations is through Directorate General Resettlement except for Hyper sensitive Locations, which are manned by CISF or State Guards. All security personnel are trained in the organization's policies or procedures concerning aspects of human rights that are relevant to operations. External Safety Audit (ESA) in all the refineries, pipelines and marketing installations is carried out by Oil Industry Safety Directorate (OISD) to audit the compliance of Safety Systems and Procedures as per the norms set by the Central Pollution Control Board (CPCB) and State Pollution Control Board (SPCB), identify areas of specific potential hazards, if any, and suggest necessary corrective actions. Near Misses are often less obvious than accidents. Despite their limited impact, near misses provide insight into potential accidents that could happen. At IndianOil each and every incident including near- miss incident is analyzed to
ascertain the underlying causes. Such findings are not only disseminated among the concerned personnel but also shared with all others units.
Safety Committee To co-ordinate the Health, Safety and Environment activities of all the divisions, the Corporate H, S &E department head directly reports to the Chairman. The refineries, pipelines, marketing divisions and R&D centre have independent HSE departments. A designated Safety Officer is placed at all marketing and pipelines installations. We have two tier Safety Committee: Management Safety Committee & Shop-floor Safety Committee. Management safety Committee is headed by unit head consisting of other members upto HOD levels and workmen representatives. Shop floor committees are formed at various sections in the refinery with intensive participation from the workmen. To ensure continuity and personnel involvement, designated officers from the non-executive cadre represent the shop floor committees. 100% of our employees are represented by Safety committees.No workers are involved in any activities which can have a high risk of specific diseases.
Healthy & SafetySocial Perfromance Product Responsibility

83
TRANSFORMATIONAL LEADERSHIP
IndianOil has an advanced, state-of the-art R&D Centre, which has developed a number of environment friendly formulations and is conducting research in Bio-Energy and Hydrogen Fuel. In a world where new technologies are invented every second, the importance of indigenous research and constant improvement in the existing products cannot be undermined. IndianOil places significant thrust on knowledge and research based growth by developing economical, environmentally and socially responsible technology solutions and has a dedicated world class R&D Centre spread across 65 acres in Faridabad. The R&D centre was the first one to get ISO 14001 and 9002 certifications. For changes in the fields of international crude oil prices and domestic price regime, the R&D centre is viewed as a key competitive advantage driver. IndianOil has been making continuous investments in proprietary research in lubricants, catalyst, refinery and pipelines operations and product offerings. Research in Nanotechnology, Petrochemicals and Polymers, Coal Gasification / Liquidation, Gas to Liquid and Alternative Energy is emerging as a thrust area for IndianOil.
42%
Refining Technology Bio Technology
Technical services Fuel Additives
Petrochemicals & Polymers Nanotechnology
Alternate Energy Future Energy Sources
Lubricant Technology
Total expenditure on R&D activities 262.97 Crore incurred during 2014-15
Product Responsibility
No. of patents filed
Product ResponsibilityHealthy & Safety Abbreviations

84
SUSTAINABILITY REPORT 2014-15
Indigenous TechnologiesThe most significant criteria for the evaluation of a research and development centre is its intellectual wealth. During the year 2014-15, our R&D centre took a quantum leap in developing its intellectual wealth. IndianOil R&D filed 92 patents -13 in India, 20 in USA, 59 in other Countries, during the year 2014-15. It is the highest ever patent filing in 44 years of R&D centre’s existence. Receiving 14 patent grants, the patent portfolio of our R&D expanded this year into 384, with 83 US patents, 151 Indian patents and 150 patents of other countries. 125 product formulations were developed during the year and over 60 endorsements, from original equipment manufacturers and defense services, were obtained. The year under review experienced a renewed thrust on technology commercialization. Many of our patents have been deployed into commercially viable technologies while others are in various stages of commercialization. With over 4000 lubricant formulations, the SERVO product line is the hallmark of the vibrant and ongoing research at the Centre. A single step process 2 has been developed and patented to convert CO to dialkyl- 2 carbonates using novel catalyst for application as fuel additives as well as solvent in paint industry.
Alternate EnergyThe alternative energy programs of IndianOil include Bio-energy, Solar Hydrogen / HCNG, Synthetic fuels and Shale oil. A state-of-the-art test rig has been set-up to evaluate the heat transport properties of Solar grade heat transfer fluids.
Hydrogen & Fuel Cell Research In-principle approval was received from MNRE for 10 acres of land in the campus of National Institute of Solar Energy at Gwal Pahari, Gurgaon for jointly setting up the Centre of Excellence for Hydrogen and Fuel Cell.
Gas And Related ActivitiesBasic Design Engineering, along with cost estimate, has been carried out jointly with L&T for 1TPD coal plus 1TPD petcoke Integrated Gasification Pilot Plant based on in-house patented concept. The scientists have developed a hi-therm LPG-based metal cutting gas with a proprietary additive. It was launched as Indane Nanocut after a successful field evaluation and is our first nanotechnology initiative to be commercialized. It is expected to give a huge boost to the use of LPG in the metal-cutting segment as a superior product.
Revamping of existing systemsA revamp of existing 0.6 MMTPS Coker –A unit at Barauni Refinery was carried out by IndianOil R&D and EIL jointly. It involved changing of coke drums, modification of heater / fractionators / coke yard, change of pumps, etc. A feasibility study was undertaken at Gujarat Refinery to revamp FCC unit to maximize the yield of propylene, ensuring reliability of the unit, licensor selection, etc.
Lower negative impact on Environment
Efficiency in crude oil sourcing & vessel utilization: Cost of sea-borne transportation of crude oil was
optimized adopting the following strategy:
Approximately 82% of crude oil was transported thru Very Large Crude Carrier (VLCC) parcels.
Increasing parcel size of BH Crude Cargo from 50 to 65 TMT leading to savings in port charges .
Optimum utilization of Time Charter (TC) vessels: Judicious use of TC vessels in spot chartering market
led to softening of charter rates.
TC vessel utilization has been 98%.
Increasing the credit period for Basrah loading from 30 to 60 days resulting in benefit of US $ 0.47 per bbl.
Efficiency improvement in transportation of LPG by taking one VLGC on time charter basis for 3 years .
Product ResponsibilityHealthy & Safety Abbreviations

85
1,86,000
2014-152013-14
1,49,000
OUR AIM
31st March, 2015
1st April,2017
April, 2020
Implemented in63 cities
To be extended to rest of country
Direct switchover to BS-VI
Bharat Stage Fuels
Auto GasAuto Gas (brand name for Auto-LPG) is a clean, high octane and eco-friendly fuel (lower emissions with respect to Petrol and Diesel). IOCL has set up 374 Auto LPG dispensing stations covering 207 cities/towns across India and is the Market Leader in this product.
Ethanol Blended Petrol (EBP)IndianOil procured around 1,86,100 kilolitres of ethanol for blending into p e t r o l d u r i n g 2 0 1 4 - 1 5 , t h e r e b y substituting precious fossil fuels to that extent. Ethanol procurement also helps in rural development, i.e. improvement in employment/ income generation for sugarcane farmers.
Over the years, the Company has spent more than ` 20,000 crore towards quality improvement of its transportation fuels, namely Motor Spirit (MS) & High Speed Diesel (HSD), which constitute two of its major products.
Product Development initiatives not only meet the stringent environmental norms but additionally through a constant up-gradation of processes and absorption of technology, have led us towards attaining product stewardship. We continuously strive to enhance the quality of our products and services categories and carry out assessment for their health and safety impacts.
BS-IV productsFurther in order to supply 100% BS-IV grade products from its existing refineries, the company has plan to spend about ` 7000 Crore. Supply of low-Sulphur transportation fuels (petrol & diesel) and alternate fuels have led to fossil-fuel substitution and relatively lower negative impact on the environment. At present, maximum sulphur content in IndianOil’s BS-IV petrol & diesel is as low as 50 ppm (vs. 500 ppm in BS-II grades, which were supplied earlier). Improvement in the quality of fuels helps improve the environment and the quality of life. In line with the fuel quality upgradation programme of the Government of India,
BS-IV fuels have been introduced in stnorthern India w.e.f. 1 April, 2015, as per
timeline. It will be extended in phases to the st
rest of the country by 1 April, 2017. The G o v e r n m e n t i s a d v o c a t i n g d i r e c t switchover to BS-VI fuels by April 2020, which is being evaluated. We have drawn up the required plans for up gradation of its refineries at an investment of about ` 12,000 crore.
TRANSFORMATIONAL LEADERSHIP
Green Fuel
Target Date
st1 Apr. 2016
st1 Apr. 2017
States to be covered
All of Goa, Kerala, karnataka, Telangana, Odisha and the Union Territories of Daman & Diu, Dadra-Nagar-Haveli and Andaman & Nicobar, parts of Maharashtra and Gujarat
Rest of the Country
BS-IV Grades MS/HSD Coverage as per expert committee report on the Auto Fuel Vision & Policy 2025
ComplianceWe don’t indulge in sale of any banned or disputed products. No cases were registered in respect of non-compliance with regulatory or voluntary codes concerning health and safety impacts of products and services or product and service information and labelling. No incidents of non-compliance concerning marketing communication or breach of customer privacy and loss of customer data were reported. No significant monetary fines were levied during the year for the provision and use of products and services.
Target Date
Product ResponsibilityHealthy & Safety Abbreviations

86
SUSTAINABILITY REPORT 2014-15
Corporate Information systemsA cent percent uptime of SAP operations was maintained during the year. There was also an introduction of a new warehouse management system at a CFA in Bengaluru.
A new mobile application, m-power, was launched for sales officers dealing with bulk customers.
We have put in processes of e-tendering for all our procurements. Our IT tem works continuously to provide solutions to internal and external customers and extends services across the entire procurement-to-pay process. .
Customer SatisfactionApart from the regular customer engagement initiatives, consumer survey / market feedbacks are conducted at regular intervals to improve upon deliverables to meet customer expectations. Provisions are in place for rating of LPG Distributor Services. Customer feedback can also be obtained on non-fuel services provided through the IndianOil retail outlets.Time schedules have been drawn out to enable customers to meet the higher officials. Meetings are fixed at Head Office and State Office level on Tuesdays, Wednesdays & Thursdays between 3 pm & 4 pm and at Divisional, Area Offices and LPG bottling plants on Mondays, Wednesdays and Fridays between 3 pm and 4 pm to understand customer needs better and offer customized solutions. Total 434727 complaints were received, out of which 6505 customer complaints are pending at the end of the financial year.
The Stakeholders’ Relationship Committee (SRCO), previously called the Sharholders/ Investors Grievance Committee (SIGC), deals with the complaints received from the shareholders.
Publishing half yearly/ annual reports of the corporation in various leading National Newspapers and on the corporation’s webs i te w w w. ioc l . com and seek ing feedback/ comments from our stakeholders.
Investor Service Cell with offices in Mumbai and in New Delhi address issues/grievances/ queries of stakeholders.
Dedicated email to address investors’ grievances: [email protected].
Organizing seminars, workshops, co-ordination meetings to seek feedback and to improve our services.
Through RTI anyone can seek information
Key Accounts Management (KAM)Key Accounts Management (KAM) was introduced some time back on All India basis for all KAM customers. Annual KAM meetings are conducted by State Offices to review various issues. For each KAM customer, quarterly feedback is obtained for measuring their satisfaction level and reviewed regularly at State Office for further improvement.
A set of questions is forwarded to customers after every quarter and their response is sought. Customers record their response against each question and forward the same to our State Offices. Based on the feedback, Customer Satisfaction Index (CSI) is evaluated by the concerned State Office and necessary actions are taken.
Product labelling It is necessary for the customers and end users to have access to information about the impacts of products and services to make informed decisions. All our products follow Bureau of Indian Standards guidelines for product information and labelling. For products like naphtha, further value additions are done as per consumer applications. All our packed lubricants display safety and disposal instructions. Petrochemical products adhere to corresponding Food Grade Certificates, compliance to Restriction of Hazardous Substances, Durability properties, BTU/lb i.e. heat capacity details, Material Safety Data Sheet.We do not reclaim any of our sold products or the packaging material involved. There is a 100% reuse of the domestic and commercial LPG cylinders.
Feedback Mechanism for shareholders
Product ResponsibilityHealthy & Safety Abbreviations

87
TRANSFORMATIONAL LEADERSHIP
Product ResponsibilityHealthy & Safety Abbreviations

88
SUSTAINABILITY REPORT 2014-15
AE&SD Alternate Energy & Sustainable Development AFS Aviation Fuel Station AOCN Assam Oil College of Nursing AOD Assam Oil Division ASI Archaeological Survey of India ATF Aviation Turbine Fuel AU Atmospheric Unit BN Billion BPCL Bharat Petroleum Corporation limited BPL Below Poverty Line BOD Biological Oxygen Demand BS – IV/ VI Bharat Stage IV / VI CAGR Compound Annual Growth Rate CATCH Cultivating Awareness Towards Conservation of Heritage CCI Competition Commission of India CDM Clean Development Mechanism CDP Carbon Disclosure Project CDU Crude oil Distillation Unit CERs Certified Emission Reductions CFC Chlorofluorocarbons CII Confederation Indian Industry CO Corporate Office COMPAT Competition Appellate Tribunal CPCB/SPCB Central Pollution Control Board/ State Pollution Control Board CPCL Chennai Petroleum Corporation Limited CREDA Chhattisgarh Renewal Energy Development Authority CRU Catalytic Reformer Unit CSI Customer Satisfaction Index CSR Corporate Social Responsibility CVC Central Vigilance Commission DCU Delayed Coker Unit DPE Department of Public enterprises E & P Exploration and Production EAC Expert Appraisal Committee EBP Ethanol Blended Petrol Eco Parks Ecological Parks EIA Environmental Impact Assessment
EIL Engineers India Limited ENCON Energy Conservation EP Environment Protection EPF & MP Act Employees Provident Funds and Miscellaneous Provisions Act EPS Employees Pension Scheme ERDMP Emergency Response & Disaster Management Plan ESA External Safety Audit ETP Effluent Treatment Plants FCC Fluidised Catalytic Cracker FICCI Federation of Indian Chambers of Commerce and Industry FO Fuel Oil FTL Free trade LPG FY Financial Year GAIL Gas Authority of India Limited GCC General Conditions of Contract GHG Greenhouse Gases GoI Government of India GPW Great Place to WorkGRI Global Reporting Initiatives GRM Gross Refining Margin GSPL Gujarat State Petronet Ltd GWh Gigawatt hour G4 GRI’s fourth generation indicators HGU Hydrogen Generation Unit HOD Head Of Department HPCL Hindustan Petroleum Corporation Limited HRSG Heat Recovery Steam GeneratorHSD High Speed Diesel HSE Health, Safety and Environment IAF Indian Air Force IndianOil IndianOil Corporation Limited IOC Indian Oil Corporation Limited IOF Indian Oil Foundation IOT Indian Oil Tanking IP Integrity Pact ISO International Organization for Standardization KAM Key Accounts Management
Abbreviations
AbbreviationsProduct Responsibility GRI Index

89
TRANSFORMATIONAL LEADERSHIP
KL Kilo litre KM Kilo MeterKPI Key Performance IndexKRA Key Result Areas KSK Kisan Seva Kendra KW / KWh Kilowatt/ Kilowatt Hour LAB Linear Alkyl Benzene LDO Light Diesel Oil LNG Liquefied Natural Gas LPG Liquefied Petroleum Gas LTS Long Term Settlement MBN (MBTU/BBL/NRGF) It refers to total heat value of fuel and loss in thousand BTU, BBL refers to barrel of crude processed and NRGF is a derived factor that depends upon actual intake in both primary and secondary processing units as per industry standard MINAS Minimal National Standard MMSCMD Million Metric Standard Cubic Meters per day MMSCM Million Metric Standard Cubic Meters MMT Million metric tons MMTPA Million metric tons Per Annum MoP&NG Ministry Of Petroleum and Natural Gas MoU Memorandum of Understanding MSME Micro, Small and Medium Enterprises MSQ Motor Spirit MT Metric Tonne MTCO2e Million Metric Tonne of Carbon Dioxide Equivalent MW Mega Watt NCF National Culture Fund NTPC National Thermal Power Corporation OGSS Oil and Gas Sector Supplement OHSMS/OHSAS Occupational Health and Safety Management System/Occupational Health and Safety Assessment System OISD Oil Industry Safety Directorate OMC Oil Marketing Company ONGC Oil and Natural Gas Corporation OSD Oil Spill Dispersant OVL ONGC Videsh Limited PCRA Petroleum Conservation Research Association PF Provident Fund
PL Pipeline PMS Performance Management System PNCC Panipat Naptha Cracker Complex PNCP Panipat Naptha Cracker Plant PP/ PE Poly Propylene / Poly Ethylene PPE Personal Protective Equipment PSU Public Sector Undertaking PTA Purified Terephthalic Acid PX Paraxylene PV Photovoltaic R & D Research and Development RLNG Re-gasified Liquefied Natural gas RGGLVY Rajiv Gandhi Gramin LPG Vitran Yojana RO Retail Outlets RTI Right To Information SC/ST/OBC /PWD Scheduled Caste / Scheduled Tribe / Other Backward Castes / Persons with Disabilities SIGC Shareholders’ / Investors Grievance Committee SKO Superior Kerosene Oil SPM Single Point Mooring SRC Stakeholders' Relationship Committee SRFT Standard Refinery Fuel in Tonnes STP Sewage Treatment Plant TC Time Charter TII Transparency International India TJ Tera joules TKL Thousand kilo Litre TMTPA Thousand Metric Tonnes Per Annum TPM Total Productive Maintenance UAE United Arab Emirates UN United Nations UNFCCC United Nations Framework Convention on Climate Change UNGC United Nations Global Compact USA United States of America VLCC Very Large Crude Carrier WIPS Forum for Women In Public Sector
Abbreviations GRI IndexProduct Responsibility

90
SUSTAINABILITY REPORT 2014-15
Disclosures Location of disclosure Identified Omission(s) Reason(s) for Omission(s) Explanation for Omission(s) Page No.
STRATEGY AND ANALYSIS
G4-1 A Word from Chairman Not applicable Not applicable Not applicable 7
G4-2 Stakeholder Engagement & Materiality- Materiality Analysis Not applicable Not applicable Not applicable 21
ORGANIZATIONAL PROFILE
G4-3 Back cover Not applicable Not applicable Not applicable Back cover
G4-4 Brands Not applicable Not applicable Not applicable 12
G4-5 Back cover Not applicable Not applicable Not applicable Back cover
G4-6 Company’s Profile Not applicable Not applicable Not applicable 9
G4-7 Shareholding Not applicable Not applicable Not applicable 18
G4-8 Reach Not applicable Not applicable Not applicable 14
G4-9 Economic Performance, Reach Not applicable Not applicable Not applicable 39, 14
G4-10 Great place to Work- Human Capital Not applicable Not applicable Not applicable 63
G4-11 Great place to Work- Employee Engagement Not applicable Not applicable Not applicable 68
G4-12 Supply Chain Not applicable Not applicable Not applicable 14
G4-13 Report Profile, Scope & Boundary, Economic Performance Not applicable Not applicable Not applicable 2, 39
G4-14 Key Impacts, Risks and Opportunities Not applicable Not applicable Not applicable 25
G4-15 Company’s Profile- Associations, Charters And Membership, Corporate Governance – External Commitments And Public Policy Participations Not applicable Not applicable Not applicable 17, 36
G4-16 Company’s Profile- Associations, Charters And Membership Not applicable Not applicable Not applicable 17
GRI Index
GRI IndexAbbreviations
Linkage with UNGC Principles

91
IDENTIFIED MATERIAL ASPECTS AND BOUNDARIES
G4-17 Report Profile, Scope & Boundary Not applicable Not applicable Not applicable 1
G4-18 Report Profile, Scope & Boundary Not applicable Not applicable Not applicable 1
G4-19 Stakeholder Engagement & Materiality-Materiality Table Linkages Not applicable Not applicable Not applicable 24
G4-20 Stakeholder Engagement & Materiality- Materiality Analysis Not applicable Not applicable Not applicable 23
G4-21 Stakeholder Engagement & Materiality- Materiality Analysis Not applicable Not applicable Not applicable 23
G4-22 Report Profile, Scope & Boundary Not applicable Not applicable Not applicable 1
G4-23 Report Profile, Scope & Boundary Not applicable Not applicable Not applicable 1
STAKEHOLDER ENGAGEMENT
G4-24 Stakeholder Engagement & Materiality- Our Stakeholders Not applicable Not applicable Not applicable 20
G4-25 Stakeholder Engagement & Materiality- Our Stakeholders Not applicable Not applicable Not applicable 20
G4-26 Stakeholder Engagement & Materiality- Stakeholder Engagement Not applicable Not applicable Not applicable 21
G4-27 Stakeholder Engagement & Materiality- Dialogue With Stakeholders Not applicable Not applicable Not applicable 22
REPORT PROFILE
G4-28 Report Profile, Scope & Boundary Not applicable Not applicable Not applicable 1
G4-29 Report Profile, Scope & Boundary Not applicable Not applicable Not applicable 1
G4-30 Report Profile, Scope & Boundary Not applicable Not applicable Not applicable 1
G4-31 Report Profile, Scope & Boundary Not applicable Not applicable Not applicable 1
G4-32 Report Profile, Scope & Boundary Not applicable Not applicable Not applicable 1
G4-33 Report Profile, Scope & Boundary Not applicable Not applicable Not applicable 1
GRI Index
Disclosures Location of disclosure Identified Omission(s) Reason(s) Explanation Page No. for Omission(s) for Omission(s)
Abbreviations
Linkage with UNGC Principles

92
SUSTAINABILITY REPORT 2014-15
Disclosures Location of disclosure Identified Omission(s) Reason(s) for Omission(s) Explanation for Omission(s) Page No.
GOVERNANCE
G4-34 Corporate Governance Not applicable Not applicable Not applicable 32
G4-35 Corporate governance – The Board of Directors 33
G4-36 Corporate governance – Board Committees 34
G4-37 Corporate governance – Board Meetings 35
G4-38 Corporate Governance- The Board Of Directors 33
G4-39 Corporate Governance- The Board Of Directors 33
G4-40 Corporate Governance- The Board Of Directors 33
G4-41 Corporate Governance- The Board Of Directors 33
G4-42 Corporate Governance- Board Meetings 35
G4-43 Corporate Governance- Board Meetings 35
G4-44 Corporate Governance- The Board Of Directors 33
G4-45 Key Impacts, Risks and Opportunities 25
G4-46 Key Impacts, Risks and Opportunities 25
G4-47 Key Impacts, Risks and Opportunities 25
G4-48 Sustainability Within Us 26
G4-49 Sustainability Within Us 26
G4-50 Sustainability Within Us 26
G4-51 Corporate Governance - Remuneration of Directors 35
G4-52 Corporate Governance - Remuneration of Directors 35
G4-53 Corporate Governance - Remuneration of Directors 35
G4-54 Corporate Governance - Remuneration of Directors 35
G4-55 Corporate Governance - Remuneration of Directors 35
ETHICS AND INTEGRITY
G4-56 Corporate Governance 32
G4-57 Corporate Governance – Integrity and Accountability 38
G4-58 Corporate Governance - Whistle blower policy 35
GRI IndexAbbreviations
Linkage with UNGC Principles

93
MATERIAL ASPECT: ECONOMIC PERFORMANCE
G4-DMA Economic Performance 39
G4-EC1 Economic Performance, Social Performance 39, 73
G4-EC2 Environmental Performance – Ever changing climate 46
G4-EC3 Great place to work 63
G4-EC4 Note – 20, Revenue from Operations (Gross) Annual Report, P age 128
MATERIAL ASPECT: MARKET PRESENCE
G4-DMA Corporate Governance 32
G4-EC5 Corporate governance - Human Rights 37
G4-EC6 Great place to work – Hiring Process 64
MATERIAL ASPECT: INDIRECT ECONOMIC IMPACTS
G4-DMA Social Performance 73
G4-EC7 Social Performance 73
G4-EC8 Social Performance 73
G4-DMA Corporate Governance 32
G4-EC9 Corporate governance - Public Procurement Policy for Micro, Small and Medium Enterprises 36
OG1 Economic Performance – E & P 43
CATEGORY: ENVIRONMENTAL
MATERIAL ASPECT: MATERIALS
G4-DMA Environmental Performance - Material 47
G4-EN1 Environmental Performance - Material 47
G4-EN2 Environmental Performance - Waste 55
MATERIAL ASPECT: ENERGY
G4-DMA Environmental Performance - Energy 48
G4-EN3 Environmental Performance - Energy 48
G4-EN4 Environmental Performance - Energy 48
G4-EN5 Environmental Performance - Energy 48
G4-EN6 Environmental Performance - Energy 48
G4-EN7 Environmental Performance - Energy 48
MATERIAL ASPECT: WATER
G4-DMA Environmental Performance - Water 53
G4-EN8 Environmental Performance - Water 53
G4-EN9 Environmental Performance - Water 53
G4-EN10 Environmental Performance - Water 53
GRI Index
Disclosures Location of disclosure Identified Omission(s) Reason(s) Explanation Page No. for Omission(s) for Omission(s)
Abbreviations
Linkage with UNGC Principles

94
SUSTAINABILITY REPORT 2014-15
MATERIAL ASPECT: BIODIVERSITY
G4-DMA Environmental Performance – Biodiversity 60
G4-EN11 Environmental Performance – Biodiversity 60
G4-EN12 Environmental Performance – Biodiversity 60
G4-EN13 Environmental Performance – Biodiversity 60
G4-EN14 Environmental Performance – Biodiversity 60
MATERIAL ASPECT: EMISSIONS
G4-DMA Environmental Performance - Emissions 58
G4-EN15 Environmental Performance - Emissions 58
G4-EN16 Environmental Performance - Emissions 58
G4-EN17 Sustainability Within Us 26
G4-EN18 Environmental Performance - Emissions 58
G4-EN19 Environmental Performance- Energy Conservation Measures, Emissions, Prevention of Air Pollution 51, 58, 59
G4-EN20 Environmental Performance – Prevention of Air Pollution 59
G4-EN21 Environmental Performance – Prevention of Air Pollution 59
MATERIAL ASPECT: EFFLUENTS AND WASTE
G4-DMA Environmental Performance –Waste 55
G4-EN22 Environmental Performance –Water 53
G4-EN23 Environmental Performance –Waste 55
G4-EN24 Health & Safety – Oil Spills Response 81
G4-EN25 Not Applicable
G4-EN26 Environmental Performance – Biodiversity 60
GRI Index
MATERIAL ASPECT: PRODUCTS AND SERVICES
G4-DMA Product Responsibility 83
G4-EN27 Product Responsibility 83
G4-EN28 Product Responsibility – Product Labelling 86
MATERIAL ASPECT: COMPLIANCE
G4-DMA Product Responsibility - Compliance 85
G4-EN29 Environmental Performance – Ever Changing Climate 46
MATERIAL ASPECT: TRANSPORT
G4-DMA Product Responsibility 83
G4-EN30 Product Responsibility – Compliance 86
Disclosures Location of disclosure Identified Omission(s) Reason(s) for Omission(s) Explanation for Omission(s) Page No.
Abbreviations
Linkage with UNGC Principles

95
MATERIAL ASPECT: OVERALL
G4-DMA Product Responsibility 83
G4-EN31 Product Responsibility 83
G4-DMA Corporate Governance 32
G4-EN32 Corporate Governance – Sustainable Sourcing 37
G4-EN33 Corporate Governance – Sustainable Sourcing 37
MATERIAL ASPECT: ENVIRONMENTAL GRIEVANCE MECHANISMS
G4-DMA Environmental Performance 46
G4-EN34 Environmental Performance – Ever Changing Climate 46
OG2 Sustainability Within Us 26
OG3 Sustainability Within Us – Alternate Energy 30
OG4 Environmental Performance - Energy 48
OG5 Environmental Performance - Waste 55
OG6 Environmental Performance - Emissions 58
OG7 Not Applicable
OG8 Product Responsibility- BS –IV Products 85
GRI Index
Disclosures Location of disclosure Identified Omission(s) Reason(s) for Omission(s) Explanation for Omission(s) Page No.
Abbreviations
Linkage with UNGC Principles

96
SUSTAINABILITY REPORT 2014-15
CATEGORY: SOCIAL
SUB-CATEGORY: LABOR PRACTICES AND DECENT WORK
MATERIAL ASPECT: EMPLOYMENT
G4-DMA Great Place to Work 63
G4-LA1 Great Place to Work- Hiring process 64
G4-LA2 Great Place to Work- Remuneration and allowances 72
G4-LA3 Great Place to Work – Equality for all 70
MATERIAL ASPECT: LABOR/MANAGEMENT RELATIONS
G4-DMA Great Place to Work 63
G4-LA4 Great Place to Work- Employee Engagement 68
MATERIAL ASPECT: OCCUPATIONAL HEALTH AND SAFETY
G4-DMA Health & Safety 78
G4-LA5 Health & Safety - Safety Committee 82
G4-LA6 Health & Safety 79
G4-LA7 Health & Safety - Safety Committee 82
G4-LA8 Great Place to Work- Employee Engagement 68
MATERIAL ASPECT: TRAINING AND EDUCATION
G4-DMA Great Place to Work 63
G4-LA9 Great Place to Work- Training & Development 69
G4-LA10 Great Place to Work- Career Transition 67
G4-LA11 Great Place to Work- Employee Performance Management System 67
MATERIAL ASPECT: DIVERSITY AND EQUAL OPPORTUNITY
G4-DMA Corporate Governance 32
G4-LA12 Corporate Governance- The Board of Directors 33
MATERIAL ASPECT: EQUAL REMUNERATION FOR WOMEN AND MEN
G4-DMA Corporate Governance 32
G4-LA13 Corporate Governance- Human Rights 37
MATERIAL ASPECT: SUPPLIER ASSESSMENT FOR LABOR PRACTICES
G4-DMA Corporate Governance 32
G4-LA14 Corporate Governance- Human Rights 37
G4-LA15 Corporate Governance- Human Rights 37
MATERIAL ASPECT: LABOR PRACTICES GRIEVANCE MECHANISMS
G4-DMA Corporate Governance- Human Rights 37
G4-LA16 Corporate Governance- Human Rights 37
Disclosures Location of disclosure Identified Omission(s) Reason(s) for Omission(s) Explanation for Omission(s) Page No.
GRI IndexAbbreviations
Linkage with UNGC Principles

97
SUB-CATEGORY: HUMAN RIGHTS
MATERIAL ASPECT: INVESTMENT
G4-DMA Corporate Governance 32
G4-HR1 Corporate Governance- Human Rights 37
G4-HR2 Great Place to Work – Training & Development 69
MATERIAL ASPECT: NON-DISCRIMINATION
G4-DMA Corporate Governance 32
G4-HR3 Corporate Governance- Human Rights 37
MATERIAL ASPECT: FREEDOM OF ASSOCIATION AND COLLECTIVE BARGAINING
G4-DMA Great Place to Work 63
G4-HR4 Great Place to Work - Employee engagement 68
MATERIAL ASPECT: CHILD LABOR
G4-DMA Corporate Governance 32
G4-HR5 Corporate Governance- Human Rights 37
MATERIAL ASPECT: FORCED OR COMPULSORY LABOR
G4-DMA Corporate Governance 32
G4-HR6 Corporate Governance- Human Rights 37
MATERIAL ASPECT: SECURITY PRACTICES
G4-DMA Health & Safety 78
G4-HR7 Health & Safety- Safety 82
MATERIAL ASPECT: INDIGENOUS RIGHTS
G4-DMA Corporate Governance 32
G4-HR8 Corporate Governance- Human Rights 37
MATERIAL ASPECT: ASSESSMENT
G4-DMA Corporate Governance 32
G4-HR9 Corporate Governance- Human Rights 37
MATERIAL ASPECT: SUPPLIER HUMAN RIGHTS ASSESSMENT
G4-DMA Corporate Governance 32
G4-HR10 Corporate Governance- Human Rights 37
G4-HR11 Corporate Governance- Human Rights 37
MATERIAL ASPECT: HUMAN RIGHTS GRIEVANCE MECHANISMS
G4-DMA Corporate Governance 32
G4-HR12 Corporate Governance- Human Rights 37
OG9 Corporate Governance- Human Rights 37
Disclosures Location of disclosure Identified Omission(s) Reason(s) for Omission(s) Explanation for Omission(s) Page No.
GRI IndexAbbreviations
Linkage with UNGC Principles

98
SUSTAINABILITY REPORT 2014-15
SUB-CATEGORY: SOCIETY
MATERIAL ASPECT: LOCAL COMMUNITIES
G4-DMA Social Performance 73
G4-SO1 Social Performance 73
G4-SO2 Social Performance 73
MATERIAL ASPECT: ANTI-CORRUPTION
G4-DMA Corporate Governance 32
G4-SO3 Corporate Governance - Corruption and Anti Competitive Behaviour 35
G4-SO4 Corporate Governance - Corruption and Anti Competitive Behaviour 35
G4-SO5 Corporate Governance - Corruption and Anti Competitive Behaviour 35
MATERIAL ASPECT: PUBLIC POLICY
G4-DMA Corporate Governance 32
G4-SO6 Corporate Governance - Human Rights 37
MATERIAL ASPECT: ANTI-COMPETITIVE BEHAVIOR
G4-DMA Corporate Governance 32
G4-SO7 Corporate Governance - Corruption and Anti Competitive Behaviour 35
MATERIAL ASPECT: COMPLIANCE
G4-DMA Social Performance 73
G4-SO8 Social Performance 73
MATERIAL ASPECT: SUPPLIER ASSESSMENT FOR IMPACTS ON SOCIETY
G4-DMA Corporate Governance 32
G4-SO9 Corporate Governance - Human Rights 37
G4-SO10 Social Performance 73
MATERIAL ASPECT: GRIEVANCE MECHANISMS FOR IMPACTS ON SOCIETY
G4-DMA Social Performance 73
G4-SO11 Social Performance 73
OG10 Corporate Governance - Human Rights 37
OG11 No sites decommissioned
OG12 Social Performance 73
OG13 Health & Safety- Oil Spills Response 81
OG14 Product Responsibility- Ethanol Blended Petrol 85
Disclosures Location of disclosure Identified Omission(s) Reason(s) for Omission(s) Explanation for Omission(s) Page No.
GRI IndexAbbreviations
Linkage with UNGC Principles

99
SUB-CATEGORY: PRODUCT RESPONSIBILITY
MATERIAL ASPECT: CUSTOMER HEALTH AND SAFETY
G4-DMA Product Responsibility 83
G4-PR1 Product Responsibility 83
G4-PR2 Product Responsibility - Compliance 85
MATERIAL ASPECT: PRODUCT AND SERVICE LABELING
G4-DMA Product Responsibility - Product Labelling 86
G4-PR3 Product Responsibility- Product Labelling 86
G4-PR4 Product Responsibility - Compliance 85
G4-PR5 Product Responsibility- Customer Satisfaction 86
MATERIAL ASPECT: MARKETING COMMUNICATIONS
G4-DMA Product Responsibility - Compliance 85
G4-PR6 Product Responsibility - Compliance 85
G4-PR7 Product Responsibility - Compliance 85
MATERIAL ASPECT: CUSTOMER PRIVACY
G4-DMA Product Responsibility 83
G4-PR8 Product Responsibility - Corporate Information Systems 86
MATERIAL ASPECT: COMPLIANCE
G4-DMA Product Responsibility 83
G4-PR9 Product Responsibility - Compliance 85
Disclosures Location of disclosure Identified Omission(s) Reason(s) for Omission(s) Explanation for Omission(s) Page No.
GRI IndexAbbreviations
Linkage with UNGC Principles

100
SUSTAINABILITY REPORT 2014-15
Linkage with UNGC Principles
UNGC Principles
Page No.
Principle 1: Human Rights Businesses should support and respect the protection of internationally proclaimed human rights
Great Place to Work: Training & Development
Health & Safety
Corporate Governance: Human Rights
Principle 2: Human Rights Business should make sure they are not complicit in human rights abuses.
Principle 3: LabourBusinesses should uphold the freedom of association and the effective recognition of the right to collective bargaining.
Principle 4: Labour Businesses should uphold the elimination of all forms of forced and compulsory labour.
GRI Disclosures to report actions taken to implement UNGC Principles and outcomes from implementing UNGC Principles
Report Heading
Principle 5: Labour Businesses should uphold the effective abolition of child labour.
Principle 6: Labour Businesses should uphold the elimination of discrimination in respect of employment and occupation.
Social Performance
Great Place to Work: Employee Engagement
Corporate Governance: Human Rights
Corporate Governance: Human Rights
Corporate Governance: Human Rights
Great Place to Work: Big Family
Corporate Governance: Human Rights
Great Place to Work: Hiring Process
Great Place to Work: Equity for All
Great Place to Work: Training & Development
Corporate Governance: The Board of Directors
Corporate Governance: Human Rights
69
78
37
73
37
68
37
37
63
37
64
70
69
33
37
Linkage with UNGC PrinciplesGRI Index

101
UNGC Principles
Page No.
Principle 7: Environment: Businesses should support a precautionary approach to environmental challenges.
GRI Disclosures to report actions taken to implement UNGC Principles and outcomes from implementing UNGC Principles
Report Heading
Environmental Performance: Ever Changing Climate
Environmental Performance: Material
Environmental Performance: Energy
Environmental Performance: Water
Environmental Performance: Emissions
Product Responsibility
Principle 8: Environment Businesses should undertake initiatives to promote greater environmental responsibility.
Environmental Performance: Material
Environmental Performance: Energy
Environmental Performance: Water
Environmental Performance: Biodiversity
Environmental Performance: Emissions
Environmental Performance: Waste
Health & Safety
Product Responsibility
Sustainability Within Us
Corporate Governance: Sustainable Sourcing
46
47
48
53
58
83
47
48
53
60
58
55
78
83
26
37
Linkage with UNGC Principles

102
SUSTAINABILITY REPORT 2014-15
UNGC Principles
Page No.
Principle 9: Environment Businesses should encourage the development and diffusion of environmentally friendly technologies.
GRI Disclosures to report actions taken to implement UNGC Principles and outcomes from implementing UNGC Principles
Report Heading
Principle 10: Anti-corruption Businesses should work against corruption in all its forms, including extortion and bribery.
Corporate Governance
Corporate Governance: Integrity & Accountability
Corporate Governance: Whistle Blower Policy
Corporate Governance: Corruption & Anti – Competitive Behavior
Corporate Governance: Human Rights
Environmental Performance: Energy
Environmental Performance: Emissions
Product Responsibility
Sustainability Within Us
48
58
83
26
32
38
35
35
37
Linkage with UNGC Principles