INDIAN ECONOMY – AN OVERVIEW - MCX
253
Commodity Insights Yearbook 2011 54 MARKET DATA FOR READY REFERENCE INDIAN ECONOMY – AN OVERVIEW India has entered the club of top 20 exporters of goods and reclaimed its position among top 10 services exporters in the world during 2010-11. PROLOGUE EXPERTS' VIEWS INDIAN ECONOMY
-
Upload
khangminh22 -
Category
Documents
-
view
0 -
download
0
Transcript of INDIAN ECONOMY – AN OVERVIEW - MCX

Commodity Insights Yearbook 20115454
MARKET DATA FOR READY REFERENCE
INDIAN ECONOMY – AN OVERVIEWIndia has entered the club of top 20 exporters of goods and reclaimed its position among top 10 services exporters in the world during 2010-11.
MARKET COMMENTRYPROLOGUE EXPERTS' VIEWS INDIAN ECONOMY
054-073_CYIB_2011_Indian Economy_final.indd 54054-073_CYIB_2011_Indian Economy_final.indd 54 1/19/2012 1:57:24 AM1/19/2012 1:57:24 AM

A PwC & MCX Joint Endeavour 55www.mcxindia.com / www.pwc.com/in/en
A PwC & MCX Joint Endeavour 55www.mcxindia.com / www.pwc.com/in/en
DATABANK - AGRI COMMODITYDATABANK - NON-AGRI COMMODITIES DATABANK - AGRI COMMODITIES
054-073_CYIB_2011_Indian Economy_final.indd 55054-073_CYIB_2011_Indian Economy_final.indd 55 1/19/2012 1:58:16 AM1/19/2012 1:58:16 AM

EXPERTS' VIEWSEDITORIALSPROLOGUE
As per the Revised Estimate (RE) of Central Statistics
Offi ce (CSO), Ministry of Finance, the growth in
India’s Gross Domestic Product (GDP) at factor cost
at constant (2004-05) prices was estimated at 8.5%
in 2010-11 compared with 8.0% in 2009-10. At disaggregated
level, this (RE 2010-11) comprises growth of 6.6% in agriculture
and allied activities, 7.9% in industry and 9.4% in services
against a growth of 0.4%, 8.0% and 10.1%, respectively, during
2009-10. During 2010-11, IIP growth was 7.8% compared with
10.5% during 2009-10. The growth in India is second to China
and way above the average growth rates for the world, OECD
countries and the developing countries (see chart)
The index for six core industries (comprising crude oil,
petroleum refi nery products, coal, electricity, cement
and fi nished carbon steel) with a weight of 26.68%
in the IIP grew by 5.9% during April-March 2010-11,
compared with growth rate of 5.5% achieved during
the corresponding period of 2009-10 (source: CSO).
Notably, according to India Brand Equity Foundation,
India has entered the club of top 20 exporters of goods
and reclaimed its position among top 10 services
exporters in 2010-11. While exports, in US dollar
terms and customs basis, during 2010-11 increased
by 41.2% to US $252.35 billion, imports increased by
22.3% to $352.57 billion vis-a-vis the same period a
year ago. Further, while oil imports increased by 21.7%,
non-oil imports too rose, by 22.5%, during 2010-11
over 2009-10.
The Indian Economy An Overview
According to Ministry of Finance, in 2010-11, during the
south west-monsoon period (June 1 to September 30), the
cumulative rainfall received in the country as a whole was 912.8
mm, which is 2% above the normal. During this period, out of
36 meteorological sub-divisions in the country, 31 received
excess/normal rainfall and fi ve received defi cient rainfall.
The impact of good monsoon reflected in a robust growth
in agriculture and allied activities. And the Indian growth
story remained solid in 2010-11. Even though develop-
ments in the developed world, including Europe, do not paint
a very rosy picture of world economic recovery, analysts and
economists expect the momentum to continue in 2011-12
and beyond.
Real GDP growth rates (%)
Source: The Global Economic Outlook, World bank, June 2011, e-estimates, f-forecast
2008 2009 2010e 2011f
15
10
5
0
-5
World OECD Countries Developing countriesChina India
Commodity Insights Yearbook 201156
INDIAN ECONOMY
054-073_CYIB_2011_Indian Economy_final.indd 56054-073_CYIB_2011_Indian Economy_final.indd 56 1/19/2012 1:58:39 AM1/19/2012 1:58:39 AM

DATABANK - NON-AGRI COMMODITIES DATABANK - AGRI COMMODITIES
A PwC & MCX Joint Endeavour 57www.mcxindia.com / www.pwc.com/in/en
054-073_CYIB_2011_Indian Economy_final.indd 57054-073_CYIB_2011_Indian Economy_final.indd 57 1/19/2012 2:00:34 AM1/19/2012 2:00:34 AM

EXPERTS' VIEWSEDITORIALSPROLOGUE
Key Economic indicatorsData categories and components Units 2010-11 2009-10 2008-09 2007-08 2006-07
GDP and Related IndicatorsGDP at factor cost (current market prices) Rs crore 7,875,627 6,550,271 5,582,623 4,986,426 4,293,6722004-05 pricesGrowth Rate % 20.2% 17.3% 12.0% 16.1% 16.3%GDP at factor cost (constant market prices) Rs crore 4,877,842 4,493,743 4,162,509 3,898,958 3,566,0112004-05 pricesGrowth Rate % 8.5RE 8QE 6.8 9.3 9.6Savings Rate % of GDP 37.5 37 35.4 39.8 37Capital Formation (rate) % of GDP - 36.5QE 34.5 38.1 35.5Per Cap. Net National Income (factor cost at current prices) Rs 54,835 46,492 40,605 35,430 31,080
Production Foodgrains Mn tonnes 241.6 218.1 234.5 230.8 217.3Index of Industrial Production (growth) % 8.2 5.3 2.5 8.5 11.6Electricity Generation (growth) % 6.0 5.5 2.7 6.3 7.3
Prices Inflation (WPI) (52-week average) % change 9.6 3.8 8.1 4.7 5.4Inflation CPI-(IW) (average) % change 10.4 12.4 9.1 6.2 6.7
External Sector Export Growth (US$) % change 37.4 -3.6 13.7 29.0 22.6Import Growth (US$) % change 26.7 -2.6 19.8 35.5 24.5Current Account Balance (CAB)/GDP % -2.6 -2.8 -2.3 -1.3 -1.0Foreign Exchange Reserves US $Bn. 305.0 279.0 252.0 309.7 199.2Average Exchange Rate Rs/US$ 45.6 47.4 46.0 40.3 45.3
Money and Credit Broad Money (M3) annual % change 16.0 16.8 19.3 21.4 21.7Scheduled Commercial Bank Credit (growth) % change 21.5 16.9 17.5 22.3 28.1
Fiscal Indicators (Centre) Gross Fiscal Deficit % of GDP 5.1 6.4 6.0 2.6 3.3Revenue Deficit % of GDP 3.4 5.2 4.5 1.1 1.9Primary Deficit % of GDP 2.0 3.1 2.6 -0.9 -0.2
Population Million 1210 1170 1154 1138 1122
Note: AE GDP fi gures for 2009-10 are advance estimates; QE quick estimates; RE: Revised Estimates; p: provisional na not yet available / released for 2009-10Source: Economic Survey 2009-10; RBI annual report 2010-11
Gross domestic product by economic activity at constant 2004-05 prices (per cent) 2010-11 2009-10 2008-09 2007-08 2006-07Agriculture, Forestry & Fishing 6.61 0.44 -0.15 5.80 4.16Mining & Quarrying 5.78 6.95 1.30 3.69 7.47Manufacturing 8.34 8.79 4.25 10.28 14.31Electricity, Gas & Water Supply 5.65 6.37 4.93 8.27 9.29Construction 8.07 7.02 5.44 10.74 10.33Trade, hotel, transport & comm. 10.26 9.72 7.49 11.00 11.61Financing, Insurance, Real Estate & Business Services 9.89 9.20 12.47 11.93 13.99Community, Social & Personal Services 7.00 11.84 12.68 6.87 2.85GDP at factor cost 8.50 8.00 6.80 9.30 9.60
Source: Central Statistical Organisation (CSO)
Commodity Insights Yearbook 201158
INDIAN ECONOMY
054-073_CYIB_2011_Indian Economy_final.indd 58054-073_CYIB_2011_Indian Economy_final.indd 58 1/19/2012 2:00:34 AM1/19/2012 2:00:34 AM
DATABANK - NON-AGRI COMMODITIES DATABANK - AGRI COMMODITIES
Money supply (in Rs crore) 2010-11 2009-10 2008-09 2007-08 2006-07 2001-02M1 1,635,569 1,489,301 1,259,707 1,155,837 967,955 422843Currency with the public 914,197 767,492 665,450 568,410 482,854 240795Deposit money of the public 721,372 721,809 594,258 587,427 485,100 182049M2 1,640,610 1,494,342 1,264,748 1,160,878 972,996 427884M1 1,635,569 1,489,301 1,259,707 1,155,837 967,955 422843Post office savings bank deposits 5,041 5,041 5,041 5,041 5,041 5041M3 6,499,548 5,602,731 4,794,812 4,017,883 3,310,068 1498355M1 1,635,569 1,489,301 1,259,707 1,155,837 967,955 422843Time deposits with banks 4,863,979 4,113,430 3,535,105 2,862,046 2,342,113 1075512M4 6,525,517 5,628,700 4,820,781 4,043,852 3,336,037 1524324M3 6,499,548 5,602,731 4,794,812 4,017,883 3,310,068 1498355Total post office deposits 25,969 25,969 25,969 25,969 25,969 25969
Source: RBI, Various Economic Surveys
Foreign trade (exports, imports and trade balance) in Rs. croreYear 2010-11 2009-10 2008-09 2007-08 2006-07 2001-02Exports (including re-exports) 1,118,823 845,534 840,755 655,864 571,779 209,018Imports 1,596,869 1,363,736 1,374,436 1,012,312 840,506 245,199.7Trade balance -478,046 -518,202 -533,680 -356,448 -268,727 -36,181.8Rate of change (%) Export 32.3 0.6 28.2 14.7 25.3 2.7Rate of change (%) Import 17.1 -0.8 35.8 20.4 27.3 6.2
Source : RBI Bulletin
Index numbers of Industrial production (Base 1993-94=100)Major Groups Weights Full fi scal year averages based on 1993-94=100 2010-11 2009-10 2008-09 2007-08 2006-07 2001-02
General Index 100.0 341.0 316.2 286.1 277.1 255.0 166.99Mining and Quarrying 10.5 204.9 193.4 176.0 171.6 163.2 131.93Manufacturing 79.4 370.6 342.5 308.6 298.6 273.5 172.72Electricity 10.2 250.5 237.2 223.7 217.7 204.7 159.21
Source: Central Statistical Organisation (CSO)
Foreign exchange reserves (end period)End of SDRs## Gold* Foreign Currency Reserve Tranche TotalFinancial Assets* PositionYear Rs crore USD Rs crore USD Rs crore USD Rs crore USD Rs crore USD million million million million million
2010-11 20,401 4,569 102,572 22,972 1,224,883 274,330 13,158 2,947 1,361,013 304,8182009-10 22,596 5,006 81,188 17,986 1,149,650 254,685 6,231 1,380 1,259,665 279,0572008-09 6 1 48,793 9,577 1,230,066 241,426 5,000 981 1,283,865 251,9852007-08 74 18 40,124 10,039 1,196,023 299,230 1,744 436 1,237,965 309,7232006-07 8 2 29,573 6,784 836,597 191,924 2,044 469 868,222 199,1792001-02 50 10 14,868 3,047 249,118 51,049 264,036 54,106
Note: *: FCA excludes US $ 250.00 million (as also its equivalent value in Indian Rupee) invested in foreign currency denominated bonds; issued by MFC (UK) since March 20, 2009; #: Includes rs. 31463 crore (US $ 6699 million) refl ecting the purchase of 200 metric tonnes of gold from IMF on November 3, 2009; ##: Includes SDRs 3082.5 million allocated un-der general allocation and SDRs 214.6 million allocated under special allocation by the IMF done on August 28, 2009 and September 9, 2009, respectively. Also see Notes on Tables.Source: RBI Statistical Handbook
A PwC & MCX Joint Endeavour 59www.mcxindia.com / www.pwc.com/in/en
054-073_CYIB_2011_Indian Economy_final.indd 59054-073_CYIB_2011_Indian Economy_final.indd 59 1/19/2012 2:00:34 AM1/19/2012 2:00:34 AM

EXPERTS' VIEWSEDITORIALSPROLOGUE
Wholesale Price Index - Annual averageYear AC PA FA NF FPL&L MP
2010-11 143.3 182.4 179.6 166.6 148.3 130.12009-10 130.4 154.9 155.4 136.2 132.1 122.42008-09 125.9 137.5 134.8 129.2 134.9 120.22007-08 116.5 123.8 123.6 114.4 121.0 113.32006-07 111.2 114.3 115.5 102.3 120.9 108.02001-02 161.3 168.4 176.1 152.9 226.7 144.3
Note: AC: All commodities; PA: Primary articles; FA: Food articles; NF: Non-food articles; FPL&L: Fuel, power, light & lubricants; MP: Manufactured products; FA and NF are part of PA; Data from 1991-92 to 2004-05 is from 1993-94 series and for rest 2004-05 series Source: Offi ce of the Economic Adviser, Ministry of Commerce and Industry, GOI
India's imports and exports of agricultural commodities vis- -vis total national imports/ exports (in Rs crores) 2010-11 2009-10 2008-09 2007-08 2006-07 2001-02
Total national imports 1,605,315 1,363,736 1,374,436 1,005,159 838,048 245,200Food & related items imports 45,454 47,419 26,567 21,501 22,237 11,081% Food & related items imports 34.32 27.76 50.73 45.75 36.69 21Total national exports 1,148,170 845,534 840,755 655,864 571,779 209,018Agricultural & allied products export 112,539 84,136 80,649 74,209 57,392 28,144% Agricultural & allied products export 9.20 9.05 9.42 7.84 8.96 6.43
Source: RBI
India: Commodity wise crop calendar
Sowing Growth Harvesting
Commodity Jan Feb Mar Apr May Jun Jul Aug Sep Oct Nov DecWheatRiceCornChanaTurUrad (K)Urad (R)GuarseedSugarcanePotato (Northern India)MenthaCottonCoffeeCardamomPepperTurmericChilliesJeeraSoyRapeseedNote: Abbr: K - Kharif, R - RabiSource: www.agricoop.nic.in; Spices Board of India; Coffee Board of India
Commodity Insights Yearbook 201160
INDIAN ECONOMY
054-073_CYIB_2011_Indian Economy_final.indd 60054-073_CYIB_2011_Indian Economy_final.indd 60 1/19/2012 2:00:35 AM1/19/2012 2:00:35 AM

DATABANK - NON-AGRI COMMODITIES DATABANK - AGRI COMMODITIES
Conversion factors between important Primary and Secondary agricultural commoditiesCommodity Conversion Factor
Cotton Cotton lint production 1/3 of Kapas ProductionCotton seed production 2/3 of Kapas Production 2 Times of Cotton Lint Production
Jute100 Yards of hessian 54 lbs. of Raw Jute4148 Yards of hessian 1 Ton of Raw Jute 5.55 Bales of Raw Jute (of 180 Kgs. Each)1 Ton of sacking 1.11 Tons of Raw Jute 6.17 Bales of Raw Jute (of 180 Kgs. Each)1 Ton of hessian 1.05 Tons of Raw JuteSacking etc. 5.85 Bales of Raw Jute (of 180 Kgs. Each)
Rapseed and Mustard Oil to seeds crushed 33 PercentCake to seeds crushed 67 Percent
Castorseed Oil to seeds crushed 37 PercentCake to seeds crushed 63 Percent
Soyabean Seed Oil to soyabean seed crushed 18 PercentMeal to soyabean seed crushed 73 PercentHull from soyabean seed crushed 8 PercentWastage from soyabean seed crushed 1 Percent
Sugar Gur from cane crushed 11.20 Percent to 11.50 PercentCrystal sugar from gur refined (gur refineries) 62.5 PercentCrystal sugar from cane Crushed (cane factories) 10.20 PercentKhandasari sugar (Sulpher and Non-sulpher) from standard gur refined 46 Percent Molasses from cane crushed 4.0 Percent to 4.5 PercentCane - trash from cane harvested 8.0 Percent to 12.0 Percent
Source: Department of Agriculture and Cooperation
Agency-wise credit flow to farmers in India Target Vs Acheivement (Rs. in Crore)Agency 2010-11 2009-10 (Provisional) 2008-09 2007-08 2006-07 Target Achievement^ Target Achievement Target Achievement Target Achievement Target Achievement
Commercial 2,800,000 66,580 250,000 274,963 195,000 228,951 150,000 181,088 119,000 140,382BanksCo-operative 55,000 14,630 45,000 57,500 55,000 46,192 52,000 48,258 41,000 42,480Banks Regional 40,000 8,477 30,000 34,456 30,000 26,765 23,000 25,312 15,000 20,434Rural BanksTotal 375,000 89,687 325,000 366,919 280,000 301,908 225,000 254,657 175,000 203,296
Note :^30.06.2010Source: Compiled from various Lok Sabha questions
A PwC & MCX Joint Endeavour 61www.mcxindia.com / www.pwc.com/in/en
054-073_CYIB_2011_Indian Economy_final.indd 61054-073_CYIB_2011_Indian Economy_final.indd 61 1/19/2012 2:00:35 AM1/19/2012 2:00:35 AM

EXPERTS' VIEWSEDITORIALSPROLOGUE
India - Scheduled commercial bank's monthly outstanding - Food and Non-food credit (in Rs crore)Month SCB credit Food credit Non-Food credit Mar-11 3,942,083 64,283 3,877,800Feb-11 3,813,016 65,292 3,747,724Jan-11 3,737,677 61,182 3,676,495Dec-10 3,765,372 65,948 3,699,424Nov-10 3,568,380 59,125 3,509,255Oct-10 3,526,665 50,683 3,475,982Sep-10 3,425,228 50,232 3,374,996Aug-10 3,353,977 47,285 3,306,692Jul-10 3,379,999 51,427 3,328,572Jun-10 3,354,193 53,710 3,300,483May-10 3,247,061 50,592 3,196,469Apr-10 3,234,595 54,273 3,180,322Mar-10 3,244,788 48,489 3,196,299Feb-10 3,092,750 47,891 3,044,859Jan-10 3,031,224 43,915 2,987,309Dec-09 2,971,932 45,239 2,926,693Nov-09 2,909,141 42,355 2,866,786Oct-09 2,887,191 39,904 2,847,287Sep-09 2,874,670 42,418 2,832,252Aug-09 2,806,741 49,111 2,757,630Jul-09 2,805,224 48,891 2,756,333Jun-09 2,777,576 56,416 2,721,160May-09 2,745,978 58,780 2,687,198Apr-09 2,744,490 48,976 2,695,514Mar-09 2,775,549 46,211 2,729,338Feb-09 2,667,928 48,430 2,619,498Jan-09 2,637,780 45,521 2,592,259Dec-08 2,647,241 53,123 2,594,118Nov-08 2,642,543 50,394 2,592,149Oct-08 2,648,660 51,473 2,597,187Sep-08 2,551,026 45,175 2,505,851Aug-08 2,460,754 44,343 2,416,411Jul-08 2,399,347 43,891 2,355,456Jun-08 2,414,025 50,636 2,363,388May-08 2,371,579 48,379 2,323,200Apr-08 2,325,134 41,024 2,284,110Mar-08 2,361,914 44,399 2,317,515Feb-08 2,254,761 44,311 2,210,449Jan-08 2,185,898 39,817 2,146,081Dec-07 2,149,285 41,011 2,108,274Nov-07 2,097,007 38,967 2,058,041Oct-07 2,026,708 35,867 1,990,842Sep-07 2,037,479 37,008 2,000,471Aug-07 1,962,309 38,490 1,923,820Jul-07 1,914,514 41,059 1,873,455Jun-07 1,916,378 44,228 1,872,149May-07 1,883,720 44,864 1,838,856Apr-07 1,887,837 49,887 1,837,950Mar-07 1,931,189 46,521 1,884,668Feb-07 1,818,843 43,898 1,774,945Jan-07 1,780,725 42,071 1,738,654Dec-06 1,770,015 42,161 1,727,854Nov-06 1,683,257 33,458 1,649,799Oct-06 1,654,089 36,633 1,617,456Sep-06 1,661,491 33,458 1,628,033Aug-06 1,578,585 36,366 1,542,219Jul-06 1,556,343 36,076 1,520,267Jun-06 1,551,482 37,955 1,513,527May-06 1,493,433 39,062 1,454,371Apr-06 1,485,777 37,258 1,448,520
Note: 1. Data relate to amount outstanding as on the last reporting Friday of the month; 2. SCB - scheduled commercial bankSource: RBI Handbook of Statistics on Indian Economy
Commodity Insights Yearbook 201162
INDIAN ECONOMY
054-073_CYIB_2011_Indian Economy_final.indd 62054-073_CYIB_2011_Indian Economy_final.indd 62 1/19/2012 2:00:35 AM1/19/2012 2:00:35 AM

DATABANK - NON-AGRI COMMODITIES DATABANK - AGRI COMMODITIES
Schedule commercial bank credit to agriculture sector (in Rs crore)India 2009-10 2008-09 2007-08 2006-07 2001-02SBI and its Associates Direct Credit to Agri. Sector 77,289 63,627 59,203 47,766 14,540SBI and its Associates Indirect Credit to Agri. Sector 15,004 11,697 14,125 8,294 4,992SBI and its Associates Credit to Agri. Sector 92,293 75,324 73,328 56,060 19,533 Nationalised Banks Direct Credit to Agri. Sector 139,642 112,971 94,945 81,433 22,254Nationalised Banks Indirect Credit to Agri. Sector 64,395 44,833 37,139 40,342 9,694Nationalised Banks Credit to Agri. Sector 204,037 157,804 132,084 121,776 31,948 Foreign Banks Direct Credit to Agri. Sector 275 101 186 2,787 22Foreign Banks Indirect Credit to Agri. Sector 457 322 323 1,180 202Foreign Banks Credit to Agri. Sector 732 423 509 3,966 224 Regional Rural Banks Direct Credit to Agri. Sector 42,845 34,976 30,803 25,090 8,403Regional Rural Banks Indirect Credit to Agri. Sector 1,861 1,461 1,337 1,095 338Regional Rural Banks Credit to Agri. Sector 44,706 36,438 32,140 26,185 8,741 Other SCBs Direct Credit to Agri. Sector 36,798 27,028 27,430 14,421 2,212Other SCBs Indirect Credit to Agri. Sector 11,732 12,454 8,651 7,784 1,352Other SCBs Credit to Agri. Sector 48,530 39,481 36,080 22,204 3,563 SCBs Direct Credit to Agri. Sector 296,850 238,703 212,567 171,497 47,430SCBs Indirect Credit to Agri. Sector 93,449 70,767 61,574 58,694 16,578SCBs total Credit to Agri. Sector 390,298 309,469 274,141 230,191 64,009
Source: RBI
Performance of South-west monsoon in India Number of meteorological Percentage of Actual rainfallYear sub-divisions @ districts with as % of normal Rainfall Excess/Normal Defi cient/Scanty normal/ excess rainfall in mm rainfall rainfall rainfall (All India)2009* 15 21 42 80 873.22008 32 4 76 98 936.92007 30 6 72 105 886.62006 26 10 59 99 879.32005 32 4 72 99 781.22004 23 13 56 87 922.5
Note: mm - millimeter, Source: Ministry of Agriculture, Govt. of India.
India - Pattern of land use for agricultural production (000 Hectares)Year 2007-08 2006-07 2001-02
Net sown area 140,861 139,946 140,733Area sown more than once 54,973 53,282 47,552Gross sown area 195,835 193,228 188,286Forest area 69,626 69,708 69,406
Area under non-agricultural uses 25,923 25,537 24,049Barren and unculturable land 17,295 17,423 17,524Not available for cultivation 43,218 42,960 41,573
Permanent pasture and grazing lands 10,388 10,425 10,532Land under misc. tree crops and groves not included in net area sown 3,311 3,365 3,450Culturable waste land 13,121 13,261 13,520Other uncultivated land excl. fallow land 26,820 27,052 27,501
Current fallow 14,810 15,470 15,345Other fallows 10,338 10,503 10,560Fallow land 25,148 25,972 25,905Reporting area 305,674 305,638 305,118
Source: Department of Agriculture, GOI
A PwC & MCX Joint Endeavour 63www.mcxindia.com / www.pwc.com/in/en
054-073_CYIB_2011_Indian Economy_final.indd 63054-073_CYIB_2011_Indian Economy_final.indd 63 1/19/2012 2:00:37 AM1/19/2012 2:00:37 AM

EXPERTS' VIEWSEDITORIALSPROLOGUE
India major statewise - Pattern of land use for agricultural production (000 Hectares)States 2007-08 2006-07 2001-02
PunjabNet sown area 4,187 4,184 4254Area sown more than once 3,683 3,676 3687Gross sown area 7,870 7,861 7941Forest area 287 298 306Area under non-agricultural uses 483 477 402Barren and unculturable land 24 27 32Not available for cultivation 507 504 434Permanent pasture and grazing lands 3 2 3Land under misc. tree crops and 3 4 6groves not included in net area sownCulturable waste land 3 4 4Other uncultivated land excl. 10 10 13fallow landCurrent fallow 41 35 24Other fallows 1 1 1Fallow land 42 36 26Reporting area 5,033 5,033 5033
HaryanaNet sown area 3,594 3,556 3566Area sown more than once 2,864 2,838 2752Gross sown area 6,458 6,394 6318Forest area 40 39 45Area under non-agricultural uses 457 421 425Barren and unculturable land 103 103 101Not available for cultivation 561 524 526Permanent pasture and grazing lands 26 27 25Land under misc. tree crops and 12 12 7groves not included in net area sownCulturable waste land 28 65 30Other uncultivated land excl. 66 104 61fallow landCurrent fallow 104 141 173Other fallows 8 8 0Fallow land 112 149 173Reporting area 4,372 4,372 4372
Uttar PradeshNet sown area 16,417 16,573 16,812Area sown more than once 8,510 9,232 8,635Gross sown area 24,927 25,806 25,447Forest area 1,658 1,657 1,689Area under non-agricultural uses 2,761 2,729 2,514Barren and unculturable land 507 507 595Not available for cultivation 3,268 3,236 3,109Permanent pasture and grazing lands 65 64 71Land under misc. tree crops and 374 373 355groves not included in net area sownCulturable waste land 440 440 518Other uncultivated land excl. 879 877 943fallow landCurrent fallow 1,408 1,285 1,026Other fallows 540 542 624Fallow land 1,948 1,827 1,649Reporting area 24,170 24,170 24,202
India major statewise - Pattern of land use for agricultural production (000 Hectares)States 2007-08 2006-07 2001-02
RajasthanNet sown area 17,096 16,764 16,765Area sown more than once 5,113 4,770 4,033Gross sown area 22,208 21,534 20,798Forest area 2,727 2,698 2,645Area under non-agricultural uses 1,847 1,835 1,752Barren and unculturable land 2,418 2,427 2,521Not available for cultivation 4,264 4,262 4,272Permanent pasture and grazing lands 1,703 1,706 1,699Land under misc. tree crops and 16 20 13groves not included in net area sownCulturable waste land 4,573 4,611 4,731Other uncultivated land excl. 6,292 6,337 6,442fallow landCurrent fallow 1,724 1,939 1,819Other fallows 2,167 2,265 2,321Fallow land 3,891 4,204 4,141Reporting area 34,270 34,265 34,265
UttarakhandNet sown area 765 765 776Area sown more than once 496 445 445Gross sown area 1,261 1,210 1,221Forest area 3,465 3,465 3,465Area under non-agricultural uses 161 161 152Barren and unculturable land 312 312 310Not available for cultivation 472 472 462Permanent pasture and grazing lands 220 220 229Land under misc. tree crops and 269 269 251groves not included in net area sownCulturable waste land 367 367 386Other uncultivated land excl. 856 856 866fallow landCurrent fallow 44 44 36Other fallows 64 64 67Fallow land 108 108 102Reporting area 5,667 5,667 5,672
BiharNet sown area 5,665 5,665 5,664Area sown more than once 2,245 2,054 2,233Gross sown area 7,910 7,719 7,897Forest area 622 622 622Area under non-agricultural uses 1,647 1,647 1,642Barren and unculturable land 436 436 436Not available for cultivation 2,083 2,083 2,079Permanent pasture and grazing lands 17 17 18Land under misc. tree crops and 241 241 235groves not included in net area sownCulturable waste land 46 46 46Other uncultivated land excl. 303 303 299fallow landCurrent fallow 566 566 563Other fallows 120 120 135Fallow land 686 686 697Reporting area 9,360 9,360 9360
Commodity Insights Yearbook 201164
INDIAN ECONOMY
054-073_CYIB_2011_Indian Economy_final.indd 64054-073_CYIB_2011_Indian Economy_final.indd 64 1/19/2012 2:00:37 AM1/19/2012 2:00:37 AM

DATABANK - NON-AGRI COMMODITIES DATABANK - AGRI COMMODITIES
India major statewise - Pattern of land use for agricultural production (000 Hectares)States 2007-08 2006-07 2001-02
OrissaNet sown area 5,624 5,654 5,845Area sown more than once 3,392 3,306 2,954Gross sown area 9,016 8,960 8,799Forest area 5,813 5,813 5,813Area under non-agricultural uses 1,298 1,298 999Barren and unculturable land 840 840 843Not available for cultivation 2,138 2,138 1,842Permanent pasture and grazing lands 494 494 443Land under misc. tree crops and 342 342 482groves not included in net area sownCulturable waste land 375 375 392Other uncultivated land excl. 1,211 1,211 1,317fallow landCurrent fallow 556 526 320Other fallows 229 229 434Fallow land 785 755 754Reporting area 15,571 15,571 15,571
West BengalNet sown area 5,296 5,296 5,522Area sown more than once 4,456 4,339 4,257Gross sown area 9,752 9,635 9,779Forest area 1,174 1,174 1,184Area under non-agricultural uses 1,762 1,733 1,548Barren and unculturable land 22 21 25Not available for cultivation 1,783 1,754 1,573Permanent pasture and grazing lands 6 5 4Land under misc. tree crops and 61 58 56groves not included in net area sownCulturable waste land 33 34 38Other uncultivated land excl. 100 97 98fallow landCurrent fallow 311 341 289Other fallows 20 22 28Fallow land 331 363 318Reporting area 8,684 8,684 8,695
JharkhandNet sown area 1,536 1,619 1,488Area sown more than once 855 114 601Gross sown area 2,391 1,732 2,088Forest area 2,239 2,239 2,239Area under non-agricultural uses 754 757 759Barren and unculturable land 564 564 564Not available for cultivation 1,319 1,322 1,323Permanent pasture and grazing lands 110 110 110Land under misc. tree crops and 93 93 93groves not included in net area sownCulturable waste land 333 334 334Other uncultivated land excl. 536 537 537fallow landCurrent fallow 1,428 1,318 14,52Other fallows 913 935 931Fallow land 2,341 2,253 2,383Reporting area 7,970 7,970 7,970
India major statewise - Pattern of land use for agricultural production (000 Hectares)States 2007-08 2006-07 2001-02
GujaratNet sown area 9,747 9,747 9,622Area sown more than once 2,478 2,428 1,112Gross sown area 12,224 12,175 10,734Forest area 1,854 1,854 1,706Area under non-agricultural uses 1,147 1,147 1,131Barren and unculturable land 2,608 2,608 2,595Not available for cultivation 3,754 3,754 3,726Permanent pasture and grazing lands 851 851 850Land under misc. tree crops and 4 4 4groves not included in net area sownCulturable waste land 1,977 1,977 1,988Other uncultivated land excl. 2,831 2,831 2,842fallow landCurrent fallow 670 670 733Other fallows 12 12 11Fallow land 682 682 744Reporting area 18,868 18,868 18,639
MaharashtraNet sown area 17,473 17,475 17,222Area sown more than once 5,183 5,096 3769Gross sown area 22,655 22,571 20,991Forest area 5,213 5,214 5,150Area under non-agricultural uses 1,428 1,412 1,368Barren and unculturable land 1,718 1,719 1,544Not available for cultivation 3,146 3,131 2,912Permanent pasture and grazing lands 1,249 1,252 1,168Land under misc. tree crops and 248 249 328groves not included in net area sownCulturable waste land 916 914 959Other uncultivated land excl. 2,413 2,415 2,454fallow landCurrent fallow 1,327 1,325 1,717Other fallows 1,188 1,199 1,304Fallow land 2,515 2,524 3,020Reporting area 30,758 30,758 30,758
Madhya PradeshNet sown area 14,687 14,735 14,859Area sown more than once 5,729 5,378 4,185Gross sown area 20,416 20,113 19,044Forest area 8,703 8,699 8,683Area under non-agricultural uses 2,012 1,992 1,860Barren and unculturable land 1,379 1,406 1,396Not available for cultivation 3,392 3,397 3,255Permanent pasture and grazing lands 1,352 1,348 1,481Land under misc. tree crops and 20 19 18groves not included in net area sownCulturable waste land 1,170 1,177 1,218Other uncultivated land excl. 2,541 2,544 2,718fallow landCurrent fallow 790 769 636Other fallows 643 612 604Fallow land 1,433 1,381 1,241Reporting area 30,756 30,756 30,755
A PwC & MCX Joint Endeavour 65www.mcxindia.com / www.pwc.com/in/en
054-073_CYIB_2011_Indian Economy_final.indd 65054-073_CYIB_2011_Indian Economy_final.indd 65 1/26/2012 12:15:53 PM1/26/2012 12:15:53 PM

EXPERTS' VIEWSEDITORIALSPROLOGUE
India major statewise - Pattern of land use for agricultural production (000 Hectares)States 2007-08 2006-07 2001-02
ChhattisgarhNet sown area 4,727 4,722 4,800Area sown more than once 1,020 1,010 796Gross sown area 5,748 5,732 5,595Forest area 6,350 6,355 6,247Area under non-agricultural uses 687 683 687Barren and unculturable land 312 313 342Not available for cultivation 999 996 1,029Permanent pasture and grazing lands 857 857 849Land under misc. tree crops and 1 1 4groves not included in net area sownCulturable waste land 344 350 334Other uncultivated land excl. 1,201 1,208 1,186fallow landCurrent fallow 255 271 243Other fallows 258 238 231Fallow land 513 509 474Reporting area 13,790 13,790 13,736
KarnatakaNet sown area 10,419 10,105 10,031Area sown more than once 2,474 2,333 1,638Gross sown area 12,893 12,438 11,670Forest area 3,072 3,072 3,070Area under non-agricultural uses 1,369 1,363 1,325Barren and unculturable land 788 788 788Not available for cultivation 2,157 2,151 2,113Permanent pasture and grazing lands 930 934 956Land under misc. tree crops and 290 292 302groves not included in net area sownCulturable waste land 415 416 423Other uncultivated land excl. 1,635 1,643 1,681fallow landCurrent fallow 1,262 1,565 1,728Other fallows 505 515 426Fallow land 1,767 2,080 2,154Reporting area 19,050 19,050 19,050
India major statewise - Pattern of land use for agricultural production (000 Hectares)States 2007-08 2006-07 2001-02
KeralaNet sown area 2,089 2,101 2,191Area sown more than once 672 816 802Gross sown area 2,761 2,918 2,992Forest area 1,082 1,082 1,082Area under non-agricultural uses 463 449 392Barren and unculturable land 26 26 30Not available for cultivation 488 475 422Permanent pasture and grazing lands 0 0 0Land under misc. tree crops and 6 9 14groves not included in net area sownCulturable waste land 93 90 64Other uncultivated land excl. 99 100 78fallow landCurrent fallow 83 82 79Other fallows 45 47 34Fallow land 128 129 114Reporting area 3,886 3,886 3885
Tamil NaduNet sown area 5,062 5,126 5,172Area sown more than once 753 717 1,054Gross sown area 5,815 5,843 6,226Forest area 2,106 2,106 2,132Area under non-agricultural uses 2,169 2,160 1,998Barren and unculturable land 492 502 477Not available for cultivation 2,661 2,662 2,476Permanent pasture and grazing lands 110 110 118Land under misc. tree crops and 261 268 271groves not included in net area sownCulturable waste land 347 354 387Other uncultivated land excl. 718 733 777fallow landCurrent fallow 981 907 1,026Other fallows 1,499 1,493 1,409Fallow land 2,479 2,400 2,435Reporting area 13,027 13,027 12,991
Source: Ministry of Agriculture, GOI
Commodity Insights Yearbook 201166
INDIAN ECONOMY
054-073_CYIB_2011_Indian Economy_final.indd 66054-073_CYIB_2011_Indian Economy_final.indd 66 1/19/2012 2:00:38 AM1/19/2012 2:00:38 AM

DATABANK - NON-AGRI COMMODITIES DATABANK - AGRI COMMODITIES
Selected state/crop-wise area insured & premium collected weather based crop insurancescheme (during rabi) 2007-08 2008-09States Crop Area Insured Premium Area Insured Premium (In Hect.) (Rs. in Lakh) (In Hect.) (Rs. in Lakh)Bihar Gram 10056 106.83 1593 19.12 Wheat 6334 73.23 126584 2278.52 Lentil - - 4437 53.24 Potato - - 7614 365.49 Total 16390 180.06 140228 2716.37
Chhattisgarh Gram 26614 290.34 4014 37.71 Wheat - - 6478 45.27 Potato 72 4.30 Total 26686 294.64 10492 82.98
Madhya Pradesh Rape & Mustard 3960 47.52 - - Wheat 2260 39.70 - - Gram 7810 93.72 - - Potato 3611 230.04 - - Total 17641 410.98 - -
Rajasthan Barley 7845 84.90 116 1.40 Gram 267561 3107.48 10226 122.71 Coriander 11054 202.75 3799 55.09 Cumin 79083 2096.95 3065 53.53 Mustard 210849 2251.96 12473 83.00 Wheat 301114 4391.99 55721 921.16 Total 877506 12136.03 85400 1236.89
Haryana Potato - - 19 1.13 Total - - 19 1.13
Karnataka Bengalgram (I) - - 156 1.88 Bengalgram (RF) - - 1247 11.97 Potato - - 360 21.59 Total - - 1763 35.44
Tamil Nadu Maize - - 682 8.19 Chilly - - 669.2 28.11 Cotton - - 725.2 21.75 Total - - 2076.4 58.05
West Bengal Mustard - - 3.98 0.05 Wheat - - 8.19 0.10 Total - - 12.17 0.15
India 938223 13021.71 236120 4036.25Source: Ministry of Agriculture,GOI
A PwC & MCX Joint Endeavour 67www.mcxindia.com / www.pwc.com/in/en
054-073_CYIB_2011_Indian Economy_final.indd 67054-073_CYIB_2011_Indian Economy_final.indd 67 1/19/2012 2:00:38 AM1/19/2012 2:00:38 AM

EXPERTS' VIEWSEDITORIALSPROLOGUE
Statewise season-wise consumption of fertilizer in India (in '000 tonnes) 2009-10 2008-09 2007-08 2006-07 2001-02
India Nitrogen fertiliser cons. during kharif 7,475.99 7,362.79 6,944.54 6,575.96 5,397.39India Phosphatic fertiliser cons. during kharif 3,886.81 3,314.65 2,731.08 2,674.40 1,912.93India Potassic fertiliser cons. during kharif 1,449.02 1,770.45 1,341.24 1,004.15 774.33India Total fertiliser cons. during kharif 12,811.82 12,447.89 11,016.86 10,254.51 8,084.65 India Nitrogen fertiliser cons. during rabi 8,008.93 7,699.69 7,474.58 7,198.15 5,912.83India Phosphatic fertiliser cons. during rabi 3,606.76 3,178.22 2,783.66 2,868.92 2,469.47India Potassic fertiliser cons. during rabi 1,867.28 1,530.80 1,295.03 1,330.66 892.76India Total fertiliser cons. during rabi 13,482.97 12,408.72 11,553.27 11,397.73 9,275.06 India Total fertiliser cons. 26,294.79 24,856.60 22,570.13 21,652.24 17,359.71 Punjab Nitrogen fertiliser cons. during kharif 639.11 632.69 628.08 576.06 480.79Punjab Phosphatic fertiliser cons. during kharif 207.31 152.11 120.28 111.82 105.52Punjab Potassic fertiliser cons. during kharif 35.74 38.91 26.60 22.33 20.60Punjab Total fertiliser cons. during kharif 882.15 823.71 774.96 710.21 606.91 Punjab Nitrogen fertiliser cons. during rabi 719.09 699.09 687.38 722.93 549.50Punjab Phosphatic fertiliser cons. during rabi 226.29 227.18 223.64 236.03 185.87Punjab Potassic fertiliser cons. during rabi 38.09 17.61 11.78 16.27 7.48Punjab Total fertiliser cons. during rabi 983.46 943.88 922.80 980.99 742.84 Punjab Total fertiliser cons. 1,865.61 1,767.59 1,697.76 1,691.20 1,349.75 Haryana Nitrogen fertiliser cons. during kharif 382.60 397.23 399.29 340.91 276.52Haryana Phosphatic fertiliser cons. during kharif 128.07 139.42 88.53 83.43 71.47Haryana Potassic fertiliser cons. during kharif 19.23 16.98 14.54 10.44 3.00Haryana Total fertiliser cons. during kharif 529.90 553.63 502.36 434.78 350.98 Haryana Nitrogen fertiliser cons. during rabi 579.28 549.04 540.22 521.73 465.53Haryana Phosphatic fertiliser cons. during rabi 205.09 174.09 168.74 160.68 160.69Haryana Potassic fertiliser cons. during rabi 41.42 12.38 9.05 7.78 6.75Haryana Total fertiliser cons. during rabi 825.79 735.51 718.00 690.20 632.98 Haryana Total fertiliser cons. 1,355.69 1,289.14 1,220.37 1,124.98 983.96 Uttar Pradesh Nitrogen fertiliser cons. during kharif 1,214.59 1,221.96 1,135.26 1,153.29 1,157.04Uttar Pradesh Phosphatic fertiliser cons. during kharif 41.84 378.09 280.41 281.29 216.76Uttar Pradesh Potassic fertiliser cons. during kharif 74.97 121.82 80.84 56.13 39.25Uttar Pradesh Total fertiliser cons. during kharif 1,331.40 1,721.87 1,496.51 1,490.71 1,413.05 Uttar Pradesh Nitrogen fertiliser cons. during rabi 1,673.84 1,660.48 1,618.17 1,563.75 1,346.50Uttar Pradesh Phosphatic fertiliser cons. during rabi 648.98 523.36 540.83 566.15 533.00Uttar Pradesh Potassic fertiliser cons. during rabi 166.83 128.23 101.20 105.47 59.58Uttar Pradesh Total fertiliser cons. during rabi 2,489.65 2,312.07 2,260.20 2,175.63 1,939.08 Uttar Pradesh Total fertiliser cons. 4,197.61 4,033.94 3,756.49 3,726.07 3,352.13 Rajasthan Nitrogen fertiliser cons. during kharif 287.82 307.88 283.66 229.21 239.94Rajasthan Phosphatic fertiliser cons. during kharif 170.95 187.26 136.40 133.54 117.18Rajasthan Potassic fertiliser cons. during kharif 17.01 12.27 13.56 6.66 3.64Rajasthan Total fertiliser cons. during kharif 475.78 507.40 433.61 369.41 360.75 Rajasthan Nitrogen fertiliser cons. during rabi 455.17 401.66 421.68 435.68 342.38Rajasthan Phosphatic fertiliser cons. during rabi 159.12 131.76 124.06 124.71 82.52Rajasthan Potassic fertiliser cons. during rabi 16.77 11.23 7.36 6.34 3.21Rajasthan Total fertiliser cons. during rabi 631.06 544.65 553.10 566.72 428.11 Rajasthan Total fertiliser cons. 1,106.84 1,052.06 986.22 936.09 788.87
Contd…
Commodity Insights Yearbook 201168
INDIAN ECONOMY
054-073_CYIB_2011_Indian Economy_final.indd 68054-073_CYIB_2011_Indian Economy_final.indd 68 1/19/2012 2:00:38 AM1/19/2012 2:00:38 AM

DATABANK - NON-AGRI COMMODITIES DATABANK - AGRI COMMODITIES
Statewise season-wise consumption of fertilizer in India (in '000 tonnes) 2009-10 2008-09 2007-08 2006-07 2001-02
Uttarakhand Nitrogen fertiliser cons. during kharif 53.81 57.72 60.67 60.17 50.36Uttarakhand Phosphatic fertiliser cons. during kharif 14.28 14.66 9.55 9.02 9.07Uttarakhand Potassic fertiliser cons. during kharif 1.95 6.77 3.73 3.77 4.77Uttarakhand Total fertiliser cons. during kharif 70.04 79.14 73.95 72.96 64.20 Uttarakhand Nitrogen fertiliser cons. during rabi 60.06 52.74 54.78 48.34 36.56Uttarakhand Phosphatic fertiliser cons. during rabi 14.96 14.97 15.20 16.59 14.03Uttarakhand Potassic fertiliser cons. during rabi 5.08 5.59 6.55 5.26 4.47Uttarakhand Total fertiliser cons. during rabi 80.10 73.30 76.54 70.19 55.05 Uttarakhand Total fertiliser cons. 150.14 152.44 150.48 143.14 119.25 Bihar Nitrogen fertiliser cons. during kharif 391.93 434.04 384.63 334.21 294.16Bihar Phosphatic fertiliser cons. during kharif 96.32 110.42 71.38 70.21 51.99Bihar Potassic fertiliser cons. during kharif 48.73 79.36 28.39 32.64 15.45Bihar Total fertiliser cons. during kharif 536.98 623.81 484.40 437.06 361.60 Bihar Nitrogen fertiliser cons. during rabi 502.59 504.42 508.01 475.16 303.36Bihar Phosphatic fertiliser cons. during rabi 151.12 142.59 112.53 108.86 59.43Bihar Potassic fertiliser cons. during rabi 119.26 86.19 49.57 50.61 33.94Bihar Total fertiliser cons. during rabi 772.97 733.20 670.11 634.63 396.73 Bihar Total fertiliser cons. 1,309.95 1,357.01 1,154.51 1,071.69 758.33 Orissa Nitrogen fertiliser cons. during kharif 213.19 210.35 194.51 185.09 168.35Orissa Phosphatic fertiliser cons. during kharif 101.45 89.83 76.47 64.56 49.30Orissa Potassic fertiliser cons. during kharif 49.12 60.97 44.88 32.14 34.50Orissa Total fertiliser cons. during kharif 363.75 361.16 315.87 281.79 252.15 Orissa Nitrogen fertiliser cons. during rabi 79.10 87.41 77.59 71.44 52.82Orissa Phosphatic fertiliser cons. during rabi 47.14 58.10 40.29 28.21 22.65Orissa Potassic fertiliser cons. during rabi 29.34 28.20 18.15 21.43 17.05Orissa Total fertiliser cons. during rabi 155.58 173.71 136.04 121.09 92.52 Orissa Total fertiliser cons. 519.34 534.87 451.90 402.88 344.67 West Bengal Nitrogen fertiliser cons. during kharif 305.43 281.63 263.44 263.19 230.70West Bengal Phosphatic fertiliser cons. during kharif 209.60 173.45 168.98 157.79 112.21West Bengal Potassic fertiliser cons. during kharif 136.73 180.95 128.07 88.17 98.91West Bengal Total fertiliser cons. during kharif 651.75 636.03 560.50 509.15 441.81 West Bengal Nitrogen fertiliser cons. during rabi 425.27 416.61 421.10 415.25 356.14West Bengal Phosphatic fertiliser cons. during rabi 257.75 241.97 216.78 228.46 217.57West Bengal Potassic fertiliser cons. during rabi 309.80 224.70 176.36 212.30 162.65West Bengal Total fertiliser cons. during rabi 992.82 883.28 814.24 856.01 736.37 West Bengal Total fertiliser cons. 1,644.57 1,519.31 1,374.74 1,365.15 1,178.18 Jharkhand Nitrogen fertiliser cons. during kharif 53.46 62.13 61.11 60.01 45.80Jharkhand Phosphatic fertiliser cons. during kharif 27.87 31.32 30.24 28.26 28.30Jharkhand Potassic fertiliser cons. during kharif 8.34 9.18 5.07 2.47 0.80Jharkhand Total fertiliser cons. during kharif 89.66 102.63 96.42 90.73 74.90 Jharkhand Nitrogen fertiliser cons. during rabi 40.57 26.46 28.30 32.12 19.84Jharkhand Phosphatic fertiliser cons. during rabi 25.97 14.63 15.59 14.19 13.17Jharkhand Potassic fertiliser cons. during rabi 11.15 3.56 4.69 1.78 1.25Jharkhand Total fertiliser cons. during rabi 77.70 44.64 48.58 48.09 34.25 Jharkhand Total fertiliser cons. 167.36 147.27 145.00 138.83 109.16
Contd…
A PwC & MCX Joint Endeavour 69www.mcxindia.com / www.pwc.com/in/en
054-073_CYIB_2011_Indian Economy_final.indd 69054-073_CYIB_2011_Indian Economy_final.indd 69 1/19/2012 2:00:39 AM1/19/2012 2:00:39 AM

EXPERTS' VIEWSEDITORIALSPROLOGUE
Statewise season-wise consumption of fertilizer in India (in '000 tonnes) 2009-10 2008-09 2007-08 2006-07 2001-02
Gujarat Nitrogen fertiliser cons. during kharif 557.66 540.68 514.82 435.71 312.62Gujarat Phosphatic fertiliser cons. during kharif 276.8 252.35 209.22 175.34 119.43Gujarat Potassic fertiliser cons. during kharif 86.3 93.25 72.4 51.3 31.62Gujarat Total fertiliser cons. during kharif 920.76 886.28 796.44 662.36 463.67 Gujarat Nitrogen fertiliser cons. during rabi 543.94 528.14 537.81 444.13 293.02Gujarat Phosphatic fertiliser cons. during rabi 214.86 212.82 215.31 168.61 120.81Gujarat Potassic fertiliser cons. during rabi 120.16 89.74 73.7 66.73 37.74Gujarat Total fertiliser cons. during rabi 878.96 830.71 826.82 679.47 451.57 Gujarat Total fertiliser cons. 1,799.72 1,716.99 1,623.26 1,341.83 915.23 Maharashtra Nitrogen fertiliser cons. during kharif 915.87 828.2 797.84 681.71 591.86Maharashtra Phosphatic fertiliser cons. during kharif 665.65 429.09 402.52 387.85 259.11Maharashtra Potassic fertiliser cons. during kharif 269.64 266.66 242.67 158.51 121.89Maharashtra Total fertiliser cons. during kharif 1,851.16 1,523.95 1,443.03 1,290.83 972.86 Maharashtra Nitrogen fertiliser cons. during rabi 562.73 512.7 465.67 493.74 400.81Maharashtra Phosphatic fertiliser cons. during rabi 350.86 318.37 238.99 273.98 200.57Maharashtra Potassic fertiliser cons. during rabi 300.71 211.09 178.18 200.41 114.98Maharashtra Total fertiliser cons. during rabi 1,214.29 1,042.16 882.83 968.14 716.36 Maharashtra Total fertiliser cons. 3,065.45 2,566.11 2,325.86 2,258.97 1,689.22 Madhya Pradesh Nitrogen fertiliser cons. during kharif 382.89 372.81 334.46 278.52 175.31Madhya Pradesh Phosphatic fertiliser cons. during kharif 360.25 310.23 228.19 215.24 133.44Madhya Pradesh Potassic fertiliser cons. during kharif 49.21 64.97 46.85 33.78 15.65Madhya Pradesh Total fertiliser cons. during kharif 792.35 748 609.51 523.86 324.39 Madhya Pradesh Nitrogen fertiliser cons. during rabi 558.93 430.61 461.22 446.59 256.72Madhya Pradesh Phosphatic fertiliser cons. during rabi 245.38 219.81 202.07 194.58 174.97Madhya Pradesh Potassic fertiliser cons. during rabi 64.5 24.99 28.89 31.45 16.38Madhya Pradesh Total fertiliser cons. during rabi 868.82 675.41 692.18 647.57 448.07 Madhya Pradesh Total fertiliser cons. 1,661.18 1,423.41 1,301.69 1,205.11 772.46 Chhattisgarh Nitrogen fertiliser cons. during kharif 259.36 212.57 216.82 218.03 155.55Chhattisgarh Phosphatic fertiliser cons. during kharif 136.56 100.36 91.57 86.69 64.78Chhattisgarh Potassic fertiliser cons. during kharif 45.07 47.23 42.56 35.84 16.93Chhattisgarh Total fertiliser cons. during kharif 440.99 360.16 350.96 340.55 237.26 Chhattisgarh Nitrogen fertiliser cons. during rabi 56.47 55.04 55.43 54.19 18.14Chhattisgarh Phosphatic fertiliser cons. during rabi 25.76 33.9 25.39 29.32 9.09Chhattisgarh Potassic fertiliser cons. during rabi 13.92 13.72 10.09 12.17 2.56Chhattisgarh Total fertiliser cons. during rabi 96.15 102.66 90.92 95.68 29.79 Chhattisgarh Total fertiliser cons. 537.13 462.82 441.87 436.23 267.05 Karnataka Nitrogen fertiliser cons. during kharif 549.31 486.5 491.61 480.67 384.24Karnataka Phosphatic fertiliser cons. during kharif 373.7 301.06 254.68 279.44 192.39Karnataka Potassic fertiliser cons. during kharif 208.89 242.14 194.5 156.07 121.36Karnataka Total fertiliser cons. during kharif 1,131.90 1,029.69 940.8 916.17 697.99 Karnataka Nitrogen fertiliser cons. during rabi 413.58 377.64 298.79 285.5 286.44Karnataka Phosphatic fertiliser cons. during rabi 256.15 257.77 132.11 158.93 168.05Karnataka Potassic fertiliser cons. during rabi 256.84 166.78 135.7 135.24 96.90Karnataka Total fertiliser cons. during rabi 926.57 802.19 566.6 569.66 551.40 Karnataka Total fertiliser cons. 2,058.48 1,831.88 1,507.39 1,485.84 1,249.39
Contd…
Commodity Insights Yearbook 201170
INDIAN ECONOMY
054-073_CYIB_2011_Indian Economy_final.indd 70054-073_CYIB_2011_Indian Economy_final.indd 70 1/19/2012 2:00:39 AM1/19/2012 2:00:39 AM

DATABANK - NON-AGRI COMMODITIES DATABANK - AGRI COMMODITIES
Statewise season-wise consumption of fertilizer in India (in '000 tonnes) 2009-10 2008-09 2007-08 2006-07 2001-02
Kerala Nitrogen fertiliser cons. during kharif 61.3 63.67 48.56 53.2 40.12Kerala Phosphatic fertiliser cons. during kharif 32.19 27.93 23.77 27.71 19.17Kerala Potassic fertiliser cons. during kharif 48.4 55.81 37.03 38.7 35.16Kerala Total fertiliser cons. during kharif 141.89 147.4 109.36 119.61 94.45 Kerala Nitrogen fertiliser cons. during rabi 53.2 48.06 44.67 39.18 36.30Kerala Phosphatic fertiliser cons. during rabi 28 27.09 18.95 18.94 18.07Kerala Potassic fertiliser cons. during rabi 43.89 38.34 35.28 35.87 28.31Kerala Total fertiliser cons. during rabi 125.09 113.49 98.9 93.99 82.68 Kerala Total fertiliser cons. 266.98 260.9 208.26 213.6 177.12 Tamil Nadu Nitrogen fertiliser cons. during kharif 251.05 264.28 213.07 280.91 187.47Tamil Nadu Phosphatic fertiliser cons. during kharif 133.92 119.02 115.9 137.73 81.45Tamil Nadu Potassic fertiliser cons. during kharif 121.87 167.33 143.02 100.69 92.46Tamil Nadu Total fertiliser cons. during kharif 506.84 550.63 471.98 519.33 361.38 Tamil Nadu Nitrogen fertiliser cons. during rabi 373.91 382.41 330.27 305.27 317.52Tamil Nadu Phosphatic fertiliser cons. during rabi 129.79 135.97 112.22 131.93 123.69Tamil Nadu Potassic fertiliser cons. during rabi 202.74 196.22 161.18 169.66 135.44Tamil Nadu Total fertiliser cons. during rabi 706.44 714.6 603.68 606.86 576.64 Tamil Nadu Total fertiliser cons. 1,213.27 1,265.22 1,075.66 1,126.18 938.02
Source: Ministry of Fertilizers
State wise Storage capacity available with different storage agencies in India in lakh tonnes (2009-10)States/UTs FCI CWC SWC Grand Total
Andhra Pradesh and A&N 38.18 15.04 20.32 73.54Arunachal Pradesh 0.22 - - 0.22Assam 2.73 0.65 2.5 5.88Bihar 6.72 1.26 2.57 10.55Chhatisgarh 8.43 2.84 10.24 21.51Delhi 3.67 1.51 - 5.18Goa 0.15 0.41 - 0.56Gujarat 6.8 7.65 1.53 15.98Haryana 24.45 5.37 16.24 46.06Himachal Pradesh 0.25 0.07 - 0.32Jammu & Kashmir 1.31 - - 1.31Jharkhand 1.19 0.35 - 1.54Karnataka 8.37 7.11 10.44 25.92Kerala 5.37 1.23 2.25 8.85Madhya Pradesh 9.5 5.17 20.82 35.49Maharashtra 19.98 16.64 12.48 49.1Manipur 0.2 - - 0.2Meghalaya 0.26 - 0.14 0.4Mizoram 0.23 - - 0.23Nagaland 0.34 0.13 - 0.47Orissa 6.43 3.17 4.06 13.66Philippines 0.8 - 0.8Puducherry UT/Chandigarh 3.55 0.19 - 3.74Punjab 73.73 6.95 57 137.68Rajasthan 16.08 4.01 7.72 27.81Sikkim 0.11 - - 0.11Tamil Nadu 9.7 6.31 6.47 22.48Tripura 0.51 0.24 - 0.75Uttar Pradesh 26.87 11.63 32.33 70.83Uttra Khand 2.37 0.71 - 3.08West Bengal 11.06 6.54 2.15 19.75Grand total 288.36 105.98 209.26 603.6
Note: CWC's 105.98 lakh MT includes 0.80 lakh MT capacity at Philippines; The capacity of FCI includes 105.54 lakh MT capacity hired from CWC and SWCs. FCI - Food Corporation of India; CWC - Central Warehousing Corporation; SWC - State Warehousing Corporation. Data as on 31.03.2010.Source: Ministry of Consumer Affairs and PDS
A PwC & MCX Joint Endeavour 71www.mcxindia.com / www.pwc.com/in/en
054-073_CYIB_2011_Indian Economy_final.indd 71054-073_CYIB_2011_Indian Economy_final.indd 71 1/19/2012 2:00:39 AM1/19/2012 2:00:39 AM
EXPERTS' VIEWSEDITORIALSPROLOGUE
Storage capacity with Food Corporation of India (in million tonnes)Capacity 1st Apr. 2011 1st Apr. 2010 1st Apr. 2009 1st Apr. 2008 1st Apr. 2007 1st Apr. 2006 1st Apr 2002
CoveredOwned 12.99 12.97 12.97 12.95 12.94 12.93 12.7Hired 15.46 12.89 10.12 8.71 9.34 9.9 15.1Total 28.45 25.86 23.09 21.66 22.28 22.83 27.9
CAP ( Cover and Plinth)Owned 20.62 2.51 2.17 2.2 2.29 2.21 2.35Hired 0.54 0.47 0.02 0.03 0.63 0.51 5.59Total 3.16 2.98 2.19 2.23 2.92 2.72 7.94Grand Total 31.61 28.84 25.28 23.89 25.2 25.55 35.84
Source: FCI
State-wise number and capacity of cold storages functioning in IndiaState/UTs Number of cold storages Capacity in tonnes 2009 2008 2007 2006 2009 2008 2007 2006Andaman & Nicobar 2 2 2 2 210 210 210 210Andhra Pradesh 290 286 281 276 900,606 875,956 845,811 820,808Arunachal Pradesh 1 1 1 1 5,000 5,000 5,000 5,000Assam 24 24 25 23 88,068 88,068 90,826 70,916Bihar 246 260 252 238 1,147,041 1,439,629 1,310,466 910,582Chandigarh 6 6 6 6 12,216 12,216 12,216 12,216Chhattisgarh 69 65 60 55 341,885 286,206 278,706 266,022Delhi 95 94 93 93 126,158 126,131 126,091 126,091Gujarat 398 377 377 374 1,267,304 1,112,254 1,112,254 973,768Goa 29 29 28 28 7,705 7,705 7,105 7,105Haryana 244 243 243 243 393,121 392,121 392,121 392,121Himachal Pradesh 18 18 17 17 19,858 19,858 18,375 18,375Jammu & Kashmir 19 19 19 19 42,869 42,869 42,869 42,869Jharkhand 45 45 43 25 170,148 170,148 170,148 80,625Kerala 193 187 184 177 58,105 57,130 56,765 47,298Karnataka 170 161 157 138 407,165 421,676 397,034 253,168Lakshadweep 1 1 1 1 15 15 15 15Maharashtra 466 460 448 437 546,748 564,196 527,737 510,854Madhya Pradesh 197 192 185 179 808,052 796,506 775,156 762,802Manipur 0 0 0 0 0 0 0 0Meghalaya 3 3 3 3 3,200 3,200 3,200 3,200Mizoram 0 0 0 0 0 0 0 0Nagaland 2 2 2 2 2 6,150 6,150 6,150Orissa 101 109 94 90 291,039 307,647 224,240 216,420Pondicherry 3 3 3 3 85 85 85 85Punjab 422 420 420 420 1,345,193 1,337,517 1,337,517 1,337,517Rajasthan 110 107 107 106 324,226 314,747 314,747 312,130Sikkim 1 0 0 0 2,000 0 0 0Tamil Nadu 148 139 139 136 238,536 236,853 236,853 227,229Tripura 11 11 11 8 29,450 29,450 29,450 18,450Uttar Pradesh & Uttaranchal 1,604 1,591 1,588 1,567 10,186,499 9,060,010 9,039,047 8,931,918West Bengal 463 531 527 434 5,682,000 5,949,259 5,973,500 5,340,042India 5,381 5,386 5,316 5,101 24,450,652 23,662,812 23,333,694 21,693,986
Source: Compiled from several Lok Sabha proceedings and Question
Occupation-wise average daily wage rates in agricultural occupations in India (in Rs)Zear Ploughing Sowing Weeding Transplanting Harvesting Winnowing Threshing Picking* Herdsman Well Digging Cane Crushing2010-11 Men 153.07 130.79 115.39 123.04 127.18 115.11 122.68 122.31 79.62 177.87 129.45Women 89.55 100.87 100.52 108.01 106.67 97.89 99.3 103.83 62.75 95.86 103.67Children - 72.78 73.31 70.41 74.59 59.45 70.63 84.46 56.27 - @2009-10 Men 123.35 130.79 95.49 102.72 103.6 98.64 100.22 99.39 63.33 143.02 97.08Women 61.88 100.87 81.68 90.35 87.04 82.18 84.87 79.31 47.41 78.47 76.33Children - 72.78 60.74 59.81 67.69 50.24 52.62 61.72 44.03 - -2008-09 Men 102.9 90 80.15 83.28 87.05 81.23 85.06 81.1 53.48 116.28 87.27Women 55.43 65 68.02 71.43 71.58 65.08 67.66 66.37 41.32 63.47 61.23Children @ 48.91 49.46 52.51 50.49 43.4 46.06 45.78 36.22 @ @2007-08 Men 91.38 79.28 70.07 73.79 75.24 71.06 73.5 72.46 47.64 106.96 77.92Women 49.96 57.18 58.27 61.93 62.31 56.09 59.41 58.15 37.78 58.33 54.93Children @ 44.72 42.35 45.7 42.54 40.79 40.18 40.9 31.4 @ @2006-07 Men 81.79 73.29 64.97 69.47 68.45 66.18 67.4 67.45 43.46 99.48 72.46Women 42.37 51.41 52.82 56.44 55.69 51.04 54.41 51.06 34.43 53.37 47.05Children @ 41.32 37.81 42.67 38.69 40.95 40.71 34.39 29.62 @ @
Note: * : Picking including picking of cotton bolls/seed pods, Jute stalks and tea leaves etc.; @ : Quotations are Less than FiveSource : Ministry of Labour and Employment, Govt. of India.
Commodity Insights Yearbook 201172
INDIAN ECONOMY
054-073_CYIB_2011_Indian Economy_final.indd 72054-073_CYIB_2011_Indian Economy_final.indd 72 1/19/2012 2:00:39 AM1/19/2012 2:00:39 AM

DATABANK - NON-AGRI COMMODITIES DATABANK - AGRI COMMODITIES
Freight indices and world fleet size of crude oil vessels (International)
Baltic Freight Indices Vessel Fleet Status Crude Oil Tanker TotalMonth Dry Index Capessize Panamax In Service DWT Weight On Order Under Launched Percentage Brokenup Constructuion Orderbook (cumulative)Mar-11 1530 1768 1968 2147 335114 296 90 42 25.99 613Feb-11 1251 1310 1820 2147 334469 308 83 46 26.91 613Jan-11 1107 1351 1310 2136 332225 344 72 40 28.09 609Dec-10 1773 2346 1845 2124 328809 383 62 35 29.81 603Nov-10 2099 2910 2377 2123 328633 374 61 35 29.46 601Oct-10 2678 4262 2410 2118 326949 366 65 38 29.39 598Sep-10 2446 3370 2462 2118 326553 402 59 24 30.16 587Aug-10 2713 3516 2950 2121 326927 384 59 30 28.93 582Jul-10 1967 1922 2632 2120 326711 373 59 37 28.87 581Jun-10 2406 2711 2748 2095 322684 374 60 33 28.69 575May-10 4078 5217 4247 2093 322365 356 61 34 28.07 573Apr-10 3354 3936 3900 2087 320664 360 65 32 28.48 567Mar-10 2998 3425 3674 2089 319958 373 64 33 29.2 552Feb-10 2738 3174 3399 2090 319658 369 72 31 29.39 540Jan-10 2848 3494 3420 2085 318903 383 76 24 30.11 534Dec-09 3005 3887 3567 2083 317794 395 80 23 30.98 525Nov-09 3887 6189 3757 2068 315474 402 85 28 31.99 521Oct-09 3103 5047 3150 2107 321315 415 75 31 31.28 523Sep-09 2220 2846 2276 2106 320506 431 78 27 32.34 512Aug-09 2421 3946 2157 2106 320522 436 84 25 32.98 507Jul-09 3350 5385 3183 2100 319597 462 73 18 32.85 504Jun-09 3757 7241 2904 2082 316601 483 59 25 33.91 501May-09 3494 6125 2900 2076 315154 487 70 24 34.91 498Apr-09 1786 2348 1523 2060 312446 482 75 34 35.73 496Mar-09 1615 2066 1374 2054 310930 493 77 23 36.26 492Feb-09 1986 2963 1542 2035 308296 524 73 31 38.17 489Jan-09 1070 1981 795 2022 305439 544 54 24 38.63 489Dec-08 774 1337 558 2001 302016 549 73 22 40.16 486Nov-08 715 838 622 1996 300858 555 75 25 40.97 485Oct-08 851 1265 677 1987 298529 554 76 31 41.9 482Sep-08 3217 4318 2382 1982 297905 576 74 16 42.67 480Aug-08 6809 10506 5993 1979 296386 555 71 20 42.03 479Jul-08 8341 13005 7517 1980 296453 538 75 15 40.14 476Jun-08 9589 13978 9627 1982 296336 527 66 13 38.49 475May-08 11440 18749 9912 1972 294504 508 62 21 37.37 472Apr-08 9356 14173 8972 2000 298959 489 65 21 35.04 471Mar-08 8081 11993 7867 1998 298202 489 59 11 33.91 461Feb-08 7613 10743 7435 1997 297962 486 64 12 34.11 461Jan-08 6052 8766 5686 1994 298218 471 63 22 32.94 459Dec-07 9143 13603 8277 1988 297020 483 63 19 33.56 459Nov-07 10210 15357 9967 1985 297159 473 69 17 32.95 459Oct-07 10656 14078 11515 1976 295073 469 71 16 32.82 459Sep-07 9474 14002 9410 1969 293941 478 68 17 33.41 458Aug-07 7702 10715 7620 1973 294280 473 70 16 33.13 458Jul-07 6967 8930 7384 1962 293405 457 77 19 33.12 457Jun-07 6278 8643 6426 1950 291236 406 129 16 33.45 455May-07 5971 8359 5601 1947 290457 388 129 13 32.21 451Apr-07 6248 9127 5826 1938 289388 389 129 17 32.3 451Mar-07 5388 7810 5003 1926 287261 440 83 14 32.98 448Feb-07 4765 6917 4640 1919 285906 428 80 17 32.52 444Jan-07 4225 6045 3923 1913 284398 420 82 18 32.38 441Dec-06 4397 5972 4258 1900 282045 437 68 17 33 438Nov-06 4336 6036 4211 1914 285419 418 69 17 31.8 437Oct-06 4037 5616 3722 1886 279561 370 76 22 29.65 435Sep-06 3944 5120 3881 1855 273887 363 80 14 29.93 433Aug-06 3847 5182 3709 1853 273598 324 83 15 27.49 430Jul-06 3285 4583 2960 N/A N/A N/A N/A N/A N/A N/AJun-06 2964 3645 3038 1843 271520 293 87 8 25.74 429May-06 2436 2975 2335 1832 269891 281 90 13 25.41 422Apr-06 2368 3040 2172 1829 269283 272 91 16 25.02 418
Note: In USD; DWT - Dead Weight Tonne; N/A - Not AvailableSource: Baltic Freight Indices and Trade Sources
A PwC & MCX Joint Endeavour 73www.mcxindia.com / www.pwc.com/in/en
054-073_CYIB_2011_Indian Economy_final.indd 73054-073_CYIB_2011_Indian Economy_final.indd 73 1/19/2012 2:00:40 AM1/19/2012 2:00:40 AM

I
P
In
E
Commodity Insights Yearbook 20117474
There are billions of people elsewhere (not just China) who have been let out of their economic cages... have become investors and consumers, consequently boosting demand for metals (precious and industry metals), over the past two decades.
Jeffrey M. Christian, Managing Director, CPM Group
The demand-supply equation of energy is playing an increasingly important role in national security and economic output of nations.
MARKET DATAFOR READY REFERENCE
NON-AGRICULTURALCOMMODITIES
MARKET COMMENTRYPROLOGUE EXPERTS' VIEWS INDIAN ECENOMYINDIAN ECONOMY
074-177_CYIB_2011_Non-Agri_Final.indd 74074-177_CYIB_2011_Non-Agri_Final.indd 74 1/18/2012 11:43:04 PM1/18/2012 11:43:04 PM

Inside...
Precious Metals >> 76
Gold >> 78
Platinum >> 85
Silver >> 91
Industrial Metals >> 98
Aluminium >> 100
Copper >> 106
Iron Ore >> 113
Lead >> 118
Nickel >> 124
Steel >> 130
Zinc >> 138
Energy >> 144
Carbon >> 146
Crude Oil >> 154
Natural Gas >> 162
Power/Electricity >> 169
A PwC & MCX Joint Endeavour 75www.mcxindia.com / www.pwc.com/in/en
75www.mcxindia.com / www.pwc.com/in/en
DATABANK - AGRI COMMODITYDATABANK - AGRI COMMODITIESDATABANK NON-AGRI COMMODITIES
074-177_CYIB_2011_Non-Agri_Final.indd 75074-177_CYIB_2011_Non-Agri_Final.indd 75 1/18/2012 11:44:02 PM1/18/2012 11:44:02 PM

EDITORIALSPROLOGUE INDIAN ECONOMYEXPERTS' VIEWS
Gold, along with silver, categorized under the bullion
segment, considered a symbol of wealth, good luck
and success over the centuries. Both precious
metals played a pivotal role in the growth
and functioning of large central banks worldwide.
Owing to scarcity, these metals have historically
been considered a form of currency, and currently
despite being regarded only as investment and
industrial commodities, gold, silver, platinum and
palladium possess an ISO4217 currency code. From
ancient times bullion has a special place in Indians’
heart. Naturally, the country has emerged as the largest
consumer of gold and one of the top consumers of silver.
According to World Gold Council, of about a total of 158,000 tonnes
gold have been mined until today, Indians’ private holdings stand
the highest in the world at about 15,000 tonnes (almost 40% of its
annual GDP) vis-a-vis Americans’ at a mere 4,000 tonnes.
According to QNB Capital, Central bank gold reserves for all
countries cumulatively rose by over 2% between 2008
and 2010. The central banks of Brazil, Russia, India
and China, as well as those in the Middle East, are
major buyers of gold, while developed regions like the
US and Eurozone hold more than 75% and 60% of their
total reserves in the yellow metal.
Continuing the bull run of the past few years, gold
and silver futures on MCX moved up almost through
the year. While gold futures prices clocked a yearly
rise of over 24%, silver futures jumped by over 72% in
2010. Enhancement in its appeal as a safe haven amid
fragile global economic recovery and rising infl ation
worries worldwide helped bullion prices maintiain the
uptrend throughout. In the fi rst half of the year, lingering
concerns over the Greek debt issue, Standard & Poor’s
Commodity Exchange (contract) Price Unit Open High Low Close Annualised
VolatilityVolume (in lots)
GoldMCX (1 kg) Rs/ 10 gms 16,683.00 20,924.00 15,950.00 20,728.00 11.95% 31,581,484^
COMEX (100 tr. oz) US$/ tr. oz 1,099.00 1,432.50 1,044.50 1,421.40 16.06% 44,578,447
SilverMCX (30 kgs) Rs/ kg 26,730.00 46,383.00 23,610.00 46,217.00 21.88% 37,766,114^
COMEX (5000 tr. oz) US$/ tr. oz 16.94 30.98 14.65 30.94 31.97% 12,809,591Source: Respective exchanges’ website; ^ all contracts-all variants
downgrading of Spain’s sovereign debt rating, which came a day
after S&P had slashed Greek debt to junk status and downgraded
Portugal, weaker than expected US econmic data raising fears
about economic recovery, and political unrests in Korea
helped the rally in bullion, especially in gold prices.
Subsequently, the upside was capped and the prices
slid a tad and traded fl at as demand for physical
bullion in India became slack on high prices and
seasonal factors. Later, the prices rebounded soon
and edged up on weaker-than-expected US jobs
data, raising doubts over global economic recovery,
and Fed Chairman’s announcement of quantitative easing
(QE) worth $600 billion to provide impetus to the US economy,
which caused infl ation worries. Silver prices zoomed on strong
investment demand in addition to industrial demand. With the
rally lasting right until the year-end, gold and silver futures on MCX
touched their all-time high of Rs.20,924/10 gm and Rs.46,383/
kg in the last month of 2010.
“When we have gold we
have fear, and when we have none, we
are in danger”
(Old English proverb)
Bullion price movement in 201048000
41500
35000
28500
22000
Source: Metastocks Gold (Rs./10 grams) Silver (Rs./kg)
European debt concerns & fragile global economic
recovery
Strong investment demand in silver
Weak physical demand and seasonal slack period
1-Jan
-10
29-Ja
n-10
26-F
eb-1
0
26-M
ar-1
0
23-A
pr-1
0
21-M
ay-1
0
18-Ju
n-10
16-Ju
l-10
13-A
ug-1
0
10-S
ep-1
0
8-Oc
t-10
5-No
v-10
3-De
c-10
31-D
ec-1
0
21000
19500
18000
16500
15000
Bullion: A symbol of wealth
Commodity Insights Yearbook 201176
074-177_CYIB_2011_Non-Agri_Final.indd 76074-177_CYIB_2011_Non-Agri_Final.indd 76 1/18/2012 11:44:23 PM1/18/2012 11:44:23 PM

DATABANK - AGRI COMMODITIES
A PwC & MCX Joint Endeavour 77www.mcxindia.com / www.pwc.com/in/en
DATABANK - NON-AGRI COMMODITIES
074-177_CYIB_2011_Non-Agri_Final.indd 77074-177_CYIB_2011_Non-Agri_Final.indd 77 1/18/2012 11:44:34 PM1/18/2012 11:44:34 PM

EDITORIALSPROLOGUE INDIAN ECONOMYEXPERTS' VIEWS
Gold fundamentals (tonnes) 2010 2009 2008 2007 2006 2001World
Global total supply 3757 3745 3602 3455 3247 3278Mine supply 2102 2062 1938 2022 2037 2239Secondary supply 1313 1341 1291 1082 890 743Transitional economy sales 342 342 373 351 320 295 Global demand 3760 3745 3601 3455 3247 3278Fabrication jewellery 1888 1891 2217 2385 2351 2762Dental/medical use 68 72 75 78 78 81Electronics 280 258 299 299 252 159Other industrial use 156 152 168 143 96 50World gold investment 1051 849 837 1045 834 507Official transaction 317 523 6 -495 -364 -280
India
Mine production 3 3 3 3 3 4Consumption 941 832 961 918 974 670Jewellery & giftware 230 255 292 283 290 275Industrial use 159 152 171 155 84 35Investment demand 552 425 498 480 600 360 Indian imports 958 459 720 862 753 594
ETF holdings*
SPDR Trust-US NYSE 1281 1134 780 628 453 -Gold ETFs in India (all combined) 15 9 5 4 - - COMEX inventory* 361 305 265 229 234 38
Official reserves (Central Bank)*
US 8133 8133 8133 8133 8133 8148IMF 2815 3004 3216 3216 3216 3216China 1054 1054 600 600 600 501Russia 789 649 520 450 402 423Germany 3399 3405 3412 3418 3421 3455India 558 558 358 358 358 358World 30696 30378 29856 29850 30344 32776 Average daily volatility (MCX spot prices) 0.8% 1.1% 1.6% 0.8% 1.2% -
Note: * at year-end; Source: CPM Gold Yearbook 2011, World Gold Council, GFMS Gold Survey 2011, COMEX, MCX
Gold market during 2004-2010, 2001 (million ounces)
2010 2009 2008 2007 2006 2001
Physical market flow 120.8 120.4 115.8 127 116.1 114.3
Futures and Options exchanges' trading volume 6438.8 5327.2 6133.4 4609.8 3995 1203.1
London Bullion Market Association clearing volume 4727.7 5166.3 5605.5 5130.3 5413.9 5288.8
Total 11287.3 10613.9 11854.7 9867.1 9525 6606.2
Average price ($/troy ounce) 1228.03 974.7 872.82 700.11 606.67 271.67
Dollar value ($billion) 13861 10345 10347 6908 5779 1795
Note: Gold supply includes offi cial transactions; Average prices is annual average of gold COMEX futures settlement prices.Source: CPM Group, LBMA
Commodity Insights Yearbook 201178
074-177_CYIB_2011_Non-Agri_Final.indd 78074-177_CYIB_2011_Non-Agri_Final.indd 78 1/18/2012 11:45:02 PM1/18/2012 11:45:02 PM

DATABANK - AGRI COMMODITIES
Top 5 gold producing countries - mine production (tonnes) Country 2010 2009 2008 2007 2006 2001China 340.8 314.0 282.1 270.6 237.9 171.1Australia 256.7 223.0 214.6 246.6 247.2 284.6United States 230.0 223.0 233.0 238.0 248.0 335.0Russia 202.4 206.8 183.5 162.7 163.9 152.5South Africa 194.4 204.9 220.5 254.6 275.1 393.5
Source: CPM Gold Yearbook 2011, World Gold Council
Gold fabrication demand by country/region (tonnes) Country / Region 2010 2009 2008 2007 2006 2001China 408.2 372.9 353.0 326.9 266.2 207.9Middle East 478.3 466.5 578.5 643.8 590.9 416.7India 388.8 407.4 463.4 438.0 373.9 337.9Far East (excluding Japan & China) 566.7 559.8 659.3 690.4 711.4 788.2Western Europe 230.1 253.2 323.0 383.2 396.9 798.0
Source: CPM Gold Yearbook 2011, World Gold Council
Global financial assets (US $ trillion) Year Bank Government Private debt Equity Investor gold Total Gold as % of deposits debt securities securities holdings total financial securities assets1980 5 2 2 3 0.3 12.3 2.4%1990 19 9 10 9 0.3 47.2 0.6%1995 25 13 14 17 0.3 69.4 0.4%2000 34 19 24 31 0.2 108.3 0.2%2001 36 18 27 27 0.2 108.2 0.2%2002 38 18 28 23 0.3 107.7 0.3%2003 40 21 31 32 0.3 124.0 0.2%2004 43 25 34 38 0.4 139.7 0.3%2005 46 27 37 43 0.4 153.5 0.3%2006 51 26 42 53 0.6 173.1 0.3%2007 56 28 48 65 0.8 197.6 0.4%2008 61 31 51 34 1.0 177.6 0.6%2009 63 34 50 49 1.1 197.5 0.6%2010e 63 39 50 55 1.5 208.1 0.7%
Note: e - source estimatesSource: CPM Gold Yearbook 2011
Average gold production cost in South Africa Year 2010 2009 2008Period Q2 Q1 Q4 Q3 Q2 Q1 Q4Cost (US $/troy ounce) 1180.3 1050.3 687.3 645.0 544.2 435.4 426.5
Source: CPM Gold Yearbook 2011
Gold mining companies by production, 2009 (tonnes) Company Production % of total world Cumulative Cumulative production production %Barrick Gold Corp 230.9 9.6% 230.9 9.6%Newmont Mining Corp 202.8 8.4% 433.7 18.1%Anglogold Ashanti Ltd 143.0 6.0% 576.7 24.0%Gold Fields Ltd 120.4 5.0% 697.1 29.0%Goldcorp Inc 75.3 3.1% 772.4 32.2%Freeport-McMoran Copper & Gold Inc 74.8 3.1% 847.2 35.3%Kinross Gold Corp 69.6 2.9% 916.8 38.2%Navoi Mining & Mettalurgical Combine 55.0 2.3% 971.8 40.5%Rio Tinto Plc 49.4 2.1% 1021.3 42.6%Newcrest Mining Ltd 48.8 2.0% 1070.1 44.6%
Source: CPM Gold Yearbook 2011
A PwC & MCX Joint Endeavour 79www.mcxindia.com / www.pwc.com/in/en
DATABANK - NON-AGRI COMMODITIES
074-177_CYIB_2011_Non-Agri_Final.indd 79074-177_CYIB_2011_Non-Agri_Final.indd 79 1/18/2012 11:45:02 PM1/18/2012 11:45:02 PM

EDITORIALSPROLOGUE INDIAN ECONOMYEXPERTS' VIEWS
Economic parameters impacting gold prices 2010 2009 2008 2007 2006 2001
Real GDP (annual % change) US 2.8 -2.6 1.1 2 2.9 0.8Japan 4.3 -6.3 -0.3 1.9 2.8 0.7Eurozone 1.8 -4.1 1 2.3 2.6 1.9China 10.3 9.2 9 11.5 11.1 8.3India 9.7 5.7 7.3 8.9 9.7 3.9
OECD 2.8 -3.4 1 2.6 3.2 2.4
Consumer Price Inflation (annual % change) US 1.6 -0.3 1 2.5 2.7 2.8Japan -0.9 -1.4 0.5 1.4 0.3 -0.7Eurozone 1.5 0.3 1 3 2.2 2.4China 3.1 0.8 3 5.9 2 -0.1India 13.2 10.9 5 7 6.7 5.2
OECD 1.5 0.1 1 3 2.2 2.8
Industrial Output (annual % change) US 7 -2.9 -11.3 1.5 3 -3.7Japan 15.4 -21.3 -3.3 2.8 4.4 -6.3Eurozone 8.9 -3.7 -12.4 1.3 3.9 0.4China 15.7 11 12.9 17.4 15.4 9.9India 2.5 18 0.5 7.6 10.3 2.1
OECD 7.9 -12.3 -2.1 3.3 3.8 -2.2
Interest rates (%) US 0.1 0.1 0.1 4.3 6.3 1.3Japan 0.3 0.3 0.3 0.8 0.4 0.1Eurozone 1.8 1.8 3 5 4.5 4.3China 3.3 2.8 2.8 3.3 3.3 3.2
India (repo rate ) 6.3 4.8 6.5 7.8 7.3 8.5
Money Supply (annual % change) US 3.4 3.5 10 6.1 5.9 10.5Japan 2.3 3.1 1.8 2.1 0.7 3.3Eurozone 1.7 -0.4 7.6 11.6 10 8.0China 19.7 27.7 17.8 16.7 16.9 14.4
India 19.1 17.7 19.9 22.8 19.3 13.6
Equity Index (end of period) US (Dow Jones) 11578 10428 8776 13265 12463 10022
India (Sensex) 20509 17464 9647 20287 13787 3262
OECD indicators (annual % change) OECD total monetary aggr. & comp. broad money index 3.2 6.7 8.9 8.5 7.3 9.2OECD Total PPI Economic Activities Domestic Manufacturing 3.8 .4 6.8, 3.2 3.7 2.0OECD Total CPI OECD Groups Total Energy 7.8 -10.4 12.4 4 9.3 4.9
Note: Interest rates mentioned are central Bank discount rate. For India, interest rates mentioned are repo ratesSource: OECD, IMF, CPM Gold Yearbook, World Bank, Various Central Banks, BSE, NYSE
Commodity Insights Yearbook 201180
074-177_CYIB_2011_Non-Agri_Final.indd 80074-177_CYIB_2011_Non-Agri_Final.indd 80 1/18/2012 11:45:02 PM1/18/2012 11:45:02 PM

DATABANK - AGRI COMMODITIES
Gold trading activityMonth MCX COMEX TOCOM (1 kg contracts) LBMA clearing (all contracts) (100 troy ounce contracts) turnover Daily averages (million ounces) Volume Open Interest Volume Open Interest Volume Open Interest Dec-10 2068046 88491 2969707 585114 880991 117566 18.0Nov-10 2684053 81085 5540000 600158 1226332 103431 18.1Oct-10 2646608 101048 3847886 608083 947927 108657 17.1Sep-10 2397666 95238 2714492 612454 789939 108422 16.8Aug-10 2347500 78693 2184922 577352 714124 106897 17.0Jul-10 2920976 93508 4097319 521667 935158 113163 17.6Jun-10 3411263 101565 2909817 605792 920633 121966 20.7May-10 3207824 75714 4824448 547525 1194348 105174 24.7Apr-10 2216211 69032 2921343 545340 1040449 107197 16.0Mar-10 2620427 93656 4385864 471055 898854 103746 16.5Feb-10 2664536 62115 3608104 467387 1154743 107035 18.0Jan-10 2396374 81022 4574545 478471 1161059 122411 19.8Dec-09 3044093 81331 4003863 489766 1578769 134163 20.6Nov-09 2240126 70458 4160583 526335 1159670 118060 21.5Oct-09 1887002 62297 3203369 481961 976061 99791 20.8Sep-09 1932644 54623 2823519 458691 811173 95578 20.6Aug-09 1302700 42316 1815640 382383 780660 89875 16.4Jul-09 1584550 43270 2758293 377992 753498 92374 17.7Jun-09 2117538 53326 2304989 379199 654211 99586 20.5May-09 2331799 50400 2766651 388632 498469 86322 21.9Apr-09 2710372 49341 1755835 329066 673734 76362 20.5Mar-09 4176328 52867 3384964 368618 1121167 90006 22.2Feb-09 3632601 64419 2292224 369553 1113024 76630 23.8Jan-09 3463904 90370 2824455 342626 805101 70479 18.8Dec-08 2994119 64129 1895603 306650 885274 72439 17.5Nov-08 2359220 51131 2638572 276092 786559 72074 18.3Oct-08 2871088 46060 3045145 305451 1225126 77819 24.0Sep-08 3174201 53205 3900044 336598 1013308 97273 24.8Aug-08 2413714 47655 3066120 384999 1115044 123825 23.3Jul-08 2608610 36732 4269942 430332 1201678 159550 21.5Jun-08 1758453 33433 2624030 428557 975924 175855 21.2May-08 1387762 22887 3282907 408860 825875 168656 22.1Apr-08 1224388 18626 2765541 431914 1152382 166773 21.1Mar-08 1508535 16330 3901752 405841 1441948 174243 25.7Feb-08 1669117 23009 2617556 493265 1671064 190515 22.9Jan-08 2032012 24137 4041693 498384 1958020 174809 24.3Dec-07 1070345 24216 1843919 541854 952206 177089 24.0Nov-07 1325455 16986 3837100 482278 2032490 195150 25.2Oct-07 1087049 19712 2645459 522284 2073433 173403 20.9Sep-07 792352 19352 2002773 436927 1426741 168213 21.5Aug-07 613491 16492 1753206 326255 1773281 201593 18.2Jul-07 724076 18187 2292306 351185 1395749 250607 17.5Jun-07 728887 26231 2301038 377361 1231713 247089 21.8May-07 793654 26378 3638335 364922 1014258 238085 19.5Apr-07 616063 21465 2570650 393709 1261194 216540 20.2Mar-07 948569 18024 3754756 341951 1607801 245403 20.6Feb-07 863504 21790 2604913 417316 1366050 285114 16.0Jan-07 803260 20534 3161609 351381 1218539 243325 17.1Dec-06 677338 33236 1302013 344915 973138 242743 19.9Nov-06 1012448 29009 1419569 349490 1248361 281686 19.3Oct-06 1158019 49129 953870 323481 1408481 245516 21.6Sep-06 1209212 36336 994310 326828 1729659 265587 20.5Aug-06 1004003 30383 897015 310762 1886384 318336 19.5Jul-06 1232612 13190 1527276 273099 2548380 135735 23.2Jun-06 964206 12903 1287299 292295 2508986 318328 25.8May-06 1121467 12953 2366489 292481 2488947 377593 24.5Apr-06 890491 16342 1508344 355700 2086257 332773 26.1
Note: Vol and OI in lots (unless specifi ed); aggregate volume in all contracts during the month; cumulative OI in all contracts at the month-end.Source: Exchanges' websites, LBMA
A PwC & MCX Joint Endeavour 81www.mcxindia.com / www.pwc.com/in/en
DATABANK - NON-AGRI COMMODITIES
074-177_CYIB_2011_Non-Agri_Final.indd 81074-177_CYIB_2011_Non-Agri_Final.indd 81 1/18/2012 11:45:03 PM1/18/2012 11:45:03 PM

EDITORIALSPROLOGUE INDIAN ECONOMYEXPERTS' VIEWS
Gold pricesMonth MCX futures prices (Rs/10gms) Spot prices (Rs/10gms) COMEX futures prices (US$/troy ounce) (1 kg contract) (Monthly average) (100 troy ounce contract) Open High Low Close Mumbai Ahmd Delhi Kolkata Open High Low Dec-10 20492 20924 20371 20728 20504 20503 - - 1386.8 1431.1 1362.5 Nov-10 19840 20624 19310 20538 20134 20073 - - 1359.7 1424.3 1325.5 Oct-10 19120 20028 18925 19807 19485 19478 - - 1309.0 1383.9 1309.0 Sep-10 19107 19257 18803 19035 19087 19102 - - 1249.0 1315.2 1236.5 Aug-10 17755 19147 17505 19134 18492 18479 - - 1181.8 1250.5 1174.7 Jul-10 18865 18875 17660 17770 18279 18253 - - 1243.0 1244.8 1155.6 Jun-10 18440 19198 18226 18852 18735 18710 - - 1215.5 1264.8 1196.9 May-10 17139 18648 17102 18385 18080 18032 - - 1181.0 1249.7 1156.2 Apr-10 16280 17140 16262 17125 16682 16479 - - 1112.9 1182.5 1111.3 Mar-10 16812 17095 16211 16295 16564 16592 - - 1119.7 1145.8 1084.8 Feb-10 16185 16889 15950 16789 16531 16520 - - 1081.0 1127.4 1045.2 Jan-10 16683 17104 16167 16200 16704 16686 - - 1099.0 1163.0 1073.2 Dec-09 17668 18294 16447 16686 17147 17128 - - 1181.0 1226.4 1075.0 Nov-09 15985 18047 15985 17614 17137 16990 - - 1043.4 1195.0 1042.2 Oct-09 15701 16066 15530 15957 15859 15842 - - 1007.4 1070.2 986.8 Sep-09 15102 16009 15068 15703 15726 15792 - - 951.4 1024.7 946.4 Aug-09 14803 15156 14690 15125 14962 14933 - - 952.6 971.1 931.5 Jul-09 14454 14993 14408 14802 14722 14681 - - 926.1 960.0 904.8 Jun-09 14885 14970 14381 14451 14639 14621 - - 978.8 990.3 917.3 May-09 14245 14940 14121 14923 14603 14610 - - 888.9 980.4 880.5 Apr-09 15115 15244 13931 14503 14477 14412 - - 918.6 932.5 865.0 Mar-09 15525 15968 14640 15132 15244 15265 - - 940.3 967.8 882.7 Feb-09 14370 16040 13890 15504 14779 14857 - - 929.0 1004.9 889.8 Jan-09 13699 14490 12731 14452 13492 13490 - - 883.0 930.3 801.5 Dec-08 13060 13790 11736 13630 12905 12859 12843 12868 817.2 886.0 740.0 Nov-08 11671 13240 11450 13125 12159 12130 12170 12242 719.0 833.5 698.2 Oct-08 13351 14320 11290 11630 12757 12649 12672 12648 878.0 925.7 681.0 Sep-08 11900 13576 11170 13192 12221 12193 12197 12247 817.6 922.0 736.4 Aug-08 12610 12733 11126 11895 11863 11804 11816 11821 904.9 916.1 780.9 Jul-08 12880 13764 12284 12618 13028 13004 13006 13014 928.0 989.6 893.3 Jun-08 12102 12996 11923 12879 12356 12329 12324 12324 887.3 937.7 858.2 May-08 11399 12999 11155 12199 12139 12107 12102 12117 879.0 935.4 846.4 Apr-08 11880 12287 11345 11370 11834 11827 11826 11847 915.0 948.7 864.1 Mar-08 12420 13397 11831 11920 12636 12615 12636 12648 975.6 1033.9 904.7 Feb-08 11700 12425 11321 12396 11889 11855 11869 11866 923.1 978.5 884.7 Jan-08 10609 11800 10582 11707 11284 11251 11245 11277 837.5 936.3 837.5 Dec-07 10086 10720 9938 10598 10293 10277 10263 10288 783.9 847.4 776.5 Nov-07 10092 10685 9882 10033 10358 10304 10249 10313 799.4 848.0 773.4 Oct-07 9540 10126 9200 10083 9695 9670 9645 9667 745.1 800.8 724.3 Sep-07 8934 9544 8927 9530 9322 9287 9272 9298 675.5 745.7 674.1 Aug-07 8701 8960 8650 8935 8828 8815 8798 8814 663.2 677.9 642.9 Jul-07 8656 8964 8542 8708 8749 8732 8725 8736 651.6 688.4 646.7 Jun-07 8714 8994 8595 8662 8707 8687 8690 8702 661.5 673.7 640.0 May-07 9192 9246 8594 8694 8883 8868 8867 8876 681.2 693.3 651.5 Apr-07 9261 9598 9052 9203 9331 9306 9300 9315 665.5 692.5 656.1 Mar-07 9648 9703 9196 9339 9366 9343 9380 9353 672.8 680.2 634.5 Feb-07 9251 9898 9171 9628 9541 9491 9507 9505 652.9 692.5 642.5 Jan-07 9251 9326 8775 9242 9072 9069 9094 9063 639.2 655.5 603.0 Dec-06 9250 9420 9022 9265 9127 9151 9161 9132 645.7 649.5 612.0 Nov-06 8904 9280 8904 9269 9141 9166 9175 9143 607.5 648.0 607.5 Oct-06 8860 8980 8320 8894 8699 8707 8760 8714 598.9 613.2 560.5 Sep-06 9568 9710 8671 8859 9016 9028 9073 9029 628.0 642.5 571.0 Aug-06 9625 9987 9328 9554 9539 9559 9552 9550 635.4 656.0 609.0 Jul-06 9223 10179 9214 9560 9570 9550 9565 9556 617.0 677.5 602.5 Jun-06 9500 9700 8315 9220 8958 8957 8960 8948 642.8 645.1 555.0 May-06 9630 10763 9382 9526 9928 9933 9828 9939 654.1 732.0 636.0 Apr-06 8410 9771 8350 9609 8963 8936 8958 8587 582.0 658.2 582.0
Note: Future prices are for near month continuous futures contract Source: Exchanges' websites, RBI, LBMA, ICE
Commodity Insights Yearbook 201182
074-177_CYIB_2011_Non-Agri_Final.indd 82074-177_CYIB_2011_Non-Agri_Final.indd 82 1/18/2012 11:45:03 PM1/18/2012 11:45:03 PM

DATABANK - AGRI COMMODITIES
ce) US spot prices LBMA (monthly average) RBI Rate Dollar Gold-Silver US$/troy ounce US$/troy ounce Euro/troy ounce GBP/troy ounce USD/INR index Ratio
Close (Monthly average) AM fi xing PM fi xing AM fi xing PM fi xing AM fi xing PM fi xing Monthly average 5 1421.4 1392.6 1393.5 1391.9 1053.2 1044.8 892.2 899.0 45.16 80.30 47.485 1385.0 1371.8 1371.8 1369.9 1003.2 1003.8 858.8 857.9 45.02 78.45 51.460 1357.6 1344.8 1343.2 1342.0 966.2 965.5 847.1 846.2 44.41 77.72 57.255 1307.8 1272.3 1271.5 1271.0 972.8 971.9 816.6 816.7 46.06 81.35 61.797 1249.0 1217.9 1213.5 1215.8 939.5 941.4 774.7 776.3 46.57 82.22 66.016 1181.7 1193.0 1196.0 1193.0 937.2 933.5 782.8 780.3 46.84 83.43 66.619 1245.9 1234.0 1232.4 1232.9 1008.9 1009.3 835.8 835.4 46.56 86.77 66.852 1212.2 1206.6 1204.3 1205.4 959.9 962.2 823.2 823.9 45.80 85.48 65.433 1180.7 1149.5 1148.5 1148.7 856.0 857.0 749.1 749.6 44.50 81.35 63.338 1113.3 1114.6 1115.6 1113.3 821.7 820.4 741.0 739.6 45.50 80.81 65.142 1118.9 1097.8 1095.8 1095.4 800.2 801.1 701.5 701.8 46.33 80.27 69.182 1083.0 1117.1 1119.6 1118.0 783.6 783.4 691.8 691.6 45.96 77.98 63.010 1096.2 1126.7 1135.0 1134.7 775.3 775.7 698.0 697.7 46.63 77.00 64.052 1181.1 1131.7 1126.1 1127.0 754.8 754.1 678.2 679.2 46.59 75.40 63.058 1040.4 1045.0 1043.5 1043.2 703.9 703.9 644.8 644.3 46.72 76.17 60.654 1008.0 998.0 996.4 996.6 684.3 684.5 610.5 610.7 48.39 77.19 60.565 952.2 949.7 949.5 949.4 665.7 665.9 573.6 573.9 48.36 78.53 65.958 953.7 935.1 934.3 934.2 663.3 663.4 571.2 571.0 48.47 79.71 69.783 927.4 945.6 947.8 945.7 676.3 675.1 579.5 578.5 47.78 80.26 64.635 978.8 930.4 926.9 928.6 679.9 680.1 601.8 602.4 48.61 82.11 65.750 891.2 890.8 892.7 890.2 676.7 674.8 608.0 605.4 50.08 85.55 71.217 922.6 927.2 926.3 924.6 710.1 708.5 652.5 652.0 51.23 86.71 70.448 942.5 941.8 939.8 943.2 734.5 737.7 652.3 655.0 49.22 86.84 70.065 927.3 862.7 857.7 858.7 647.0 648.5 594.9 595.9 48.83 84.83 75.520 884.3 826.0 819.9 816.1 608.9 607.6 551.6 547.6 48.64 83.65 79.412 816.2 760.5 757.9 760.9 594.7 597.1 493.8 496.6 49.00 86.77 77.070 718.2 805.0 815.3 806.6 609.4 605.9 480.0 476.2 48.64 83.53 77.694 874.2 828.7 824.9 829.9 573.9 577.2 458.6 460.8 45.56 78.37 67.579 831.2 836.8 840.4 839.0 560.4 560.2 444.0 444.0 42.94 76.21 57.703 913.9 940.1 941.2 939.8 596.5 596.2 473.3 472.6 42.84 72.79 52.002 928.3 890.6 889.5 889.5 571.9 571.8 453.0 452.5 42.82 73.41 52.334 887.3 890.8 889.1 888.7 571.5 571.5 452.5 452.6 42.13 73.05 52.121 865.1 910.5 911.6 909.7 578.1 577.5 460.3 459.2 40.02 72.38 51.997 916.2 960.9 971.1 968.4 625.2 623.8 484.5 483.3 40.36 72.72 50.317 975.0 925.6 924.3 922.3 626.6 625.6 470.6 469.7 39.73 75.77 52.435 922.7 888.4 887.8 890.4 603.8 604.1 451.0 451.7 39.37 76.00 55.615 838.0 807.1 803.6 803.2 551.9 551.2 397.7 397.0 39.44 76.79 56.184 782.2 806.2 808.3 806.2 550.7 549.1 390.1 389.3 39.44 75.67 54.993 795.3 756.9 754.5 754.6 530.2 530.2 369.2 369.1 39.51 77.78 55.201 742.8 713.6 710.6 712.7 511.4 512.4 352.3 353.1 40.34 79.14 55.399 675.8 665.9 664.5 665.4 488.0 488.5 330.9 331.0 40.82 80.87 54.097 666.9 665.6 665.3 665.3 485.1 484.9 327.1 327.1 40.42 80.61 51.520 650.9 655.4 655.7 655.5 488.9 488.5 330.2 330.0 40.77 82.21 49.985 661.0 667.6 668.3 666.9 494.4 493.4 337.0 336.2 40.78 82.01 50.731 683.5 679.8 680.0 679.4 503.2 502.6 341.7 341.3 42.15 81.95 49.465 663.0 654.5 655.9 654.9 495.4 494.6 336.8 336.3 44.03 83.17 49.855 672.5 665.2 665.1 664.7 508.8 508.3 340.0 339.6 44.16 84.28 47.730 652.0 631.3 630.4 631.2 484.8 486.0 321.7 322.3 44.33 84.58 49.090 638.0 628.5 629.5 629.8 476.3 476.5 320.5 320.7 44.63 83.07 47.555 646.9 628.2 626.8 627.8 486.5 487.1 327.8 328.4 44.85 84.72 48.335 606.8 587.0 586.6 585.8 465.1 464.4 312.9 312.4 45.47 86.11 50.560 598.6 598.6 600.2 598.2 471.1 470.1 318.2 317.4 46.12 85.25 51.550 628.2 630.6 631.6 632.6 492.8 493.2 333.7 333.7 46.54 84.91 51.485 634.2 633.7 633.1 633.7 499.1 499.4 343.4 343.5 46.46 85.61 56.420 616.0 596.3 597.9 596.1 471.8 470.8 324.1 323.3 46.06 85.37 55.340 642.5 673.0 676.8 675.4 529.6 528.5 361.9 361.0 45.41 84.69 50.060 654.5 611.9 611.9 610.7 498.2 497.4 346.2 345.5 44.95 88.13 48.10
A PwC & MCX Joint Endeavour 83www.mcxindia.com / www.pwc.com/in/en
DATABANK - NON-AGRI COMMODITIES
074-177_CYIB_2011_Non-Agri_Final.indd 83074-177_CYIB_2011_Non-Agri_Final.indd 83 1/18/2012 11:45:03 PM1/18/2012 11:45:03 PM

EDITORIALSPROLOGUE INDIAN ECONOMYEXPERTS' VIEWS
Others52%
Australia10%
India31%
China19%
China14%
Others35%
Saudi Arabia
3%
USA9%
South Africa7%
USA8%
Turkey4%
Russia8%
Gold Mine Production (2010) Gold Consumption (2010)
Source: USGS Source: WGC
Gold Value and Inflation
Source: Comex, Bureau of Labour Statistics
2000
1800
1600
1400
1200
1000
800
600
400
200
0
OSD/OZ16
14
12
10
8
6
4
2
0
-2
-4
Gold price (March ‘11 dollers) Gold price (nominal) CPI YOY (US) (RHS)
Jan-
65
Jul-
66
Jan-
68
Jul-
69
Jan-
71
Jul-7
2
Jan-
74
Jul-7
7
Jul-7
8
Jul-8
0
Jul-8
1
Jan-
83
Jul-8
4
Jan-
86
Jul-8
7
Jan-
89
Jul-9
0
Jan-
92
Jul-9
3
Jan-
95
Jul-9
6
Jan-
98
Jul-9
9
Jan-
01
Jul-0
2
Jan-
04
Jul-
05
Jan-
07
Jul-
08
Jan-
10
16
14
12
10
8
6
4
2
0
-2
-4
65 66 68 69 71 72 74 77 78 80 81 83 84 86 87 89 90 92 93 95 96 98 99 01
02
04 05 07 08 10
Commodity Insights Yearbook 201184
074-177_CYIB_2011_Non-Agri_Final.indd 84074-177_CYIB_2011_Non-Agri_Final.indd 84 1/18/2012 11:45:03 PM1/18/2012 11:45:03 PM

DATABANK - AGRI COMMODITIES
Platinum fundamentals ('000 ounce) 2010 2009 2008 2007 2006 2001
World
Mine production 6,186 6,048 6,155 6,583 6,994 5,860Auto catalyst recycling 898 780 998 921 841 690Old jewellery scrap 603 463 906 543 - 50Total supply 7,687 7,291 8,059 8,047 7,835 6,600 Autocatalyst 3006 2588 3616 4,139 4,092 2,520Jewellery 1894 2292 1635 1,872 1,709 2,590Retail investment 76 305 452 -7 0 90Industrial and others 1750 1230 1778 1,957 1,844 1,030Total Demand 6726 6415 7481 7961 7645 6230 Gross surplus deficit 961 876 578 86 190 370Industry de-stocking - 665 -300 - - -Exchange traded funds# -550 -384 -102 -194 - -Residual surplus deficit 411 1157 176 108 190 -95
India
India platinum imports (in jewellery & other forms) - kgs^ 1580 1340 50310 1600 450 470India platinum exports 670(in jewellery & other forms) - kgs^ 14590 290 44570 230 160 Inventory levels - year-end NYMEX (PL 50 troy ounces contracts) 2162 2790 1562 969 638 246 Average daily volatility (MCX spot prices) 1.20% 1.50% 2.80% - - -
# net additional investment, ^ Financial Year; Source: Platinum 2011 Johnson Matthey Plc, GFMS Platinum, Palladium Survey - Presentation, USGS, DGCIS, MCX, NYMEX
Platinum mine production by region (000 ounce)Region 2010 2009 2008 2007 2006 2001
South Africa 4635 4635 4515 5070 5295 4100Russia 825 785 805 915 920 1300North America 210 260 325 325 345 360Zimbabwe 280 230 180 170 165 15Others 236 138 330 103 269 85
Source: Platinum Today, Johnson Matthey Plc
Platinum demand by region (000 ounce) Region 2010 2009 2008 2007 2006 2001
Europe 2110 1830 2610 2800 2590 1510Japan 1155 1050 1735 1315 1375 1310North America 1505 860 1145 1525 1440 1295Others 1956 2675 1991 2321 2240 2115
Source: Platinum Today, Johnson Matthey Plc
A PwC & MCX Joint Endeavour 85www.mcxindia.com / www.pwc.com/in/en
DATABANK - NON-AGRI COMMODITIES
074-177_CYIB_2011_Non-Agri_Final.indd 85074-177_CYIB_2011_Non-Agri_Final.indd 85 1/18/2012 11:45:06 PM1/18/2012 11:45:06 PM

EDITORIALSPROLOGUE INDIAN ECONOMYEXPERTS' VIEWS
Economic parameters impacting platinum prices 2010 2009 2008 2007 2006 2001Real GDP (annual % change)
US 2.8 -2.6 1.1 2 2.9 0.8Japan 4.3 -6.3 -0.3 1.9 2.8 0.7Eurozone 1.8 -4.1 1 2.3 2.6 1.9China 10.3 9.2 9 11.5 11.1 8.3India 9.7 5.7 7.3 8.9 9.7 3.9OECD 2.8 -3.4 1 2.6 3.2 2.4
Consumer Price Inflation (annual % change)
US 1.6 -0.3 1 2.5 2.7 2.8Japan -0.9 -1.4 0.5 1.4 0.3 -0.7Eurozone 1.5 0.3 1 3 2.2 2.4China 3.1 0.8 3 5.9 2 -0.1India 13.2 10.9 5 7 6.7 5.2OECD 1.5 0.1 1 3 2.2 2.8
Industrial Output (annual % change)
US 7 -2.9 -11.3 1.5 3 -3.7Japan 15.4 -21.3 -3.3 2.8 4.4 -6.3Eurozone 8.9 -3.7 -12.4 1.3 3.9 0.4China 15.7 11 12.9 17.4 15.4 9.9India 2.5 18 0.5 7.6 10.3 2.1OECD 7.9 -12.3 -2.1 3.3 3.8 -2.2
Interest rates (%)
US 0.1 0.1 0.1 4.3 6.3 1.3Japan 0.3 0.3 0.3 0.8 0.4 0.1Eurozone 1.8 1.8 3 5 4.5 4.3China 3.3 2.8 2.8 3.3 3.3 3.2India (repo rate ) 6.3 4.8 6.5 7.8 7.3 8.5
Money Supply (annual % change)
US 3.4 3.5 10 6.1 5.9 10.5Japan 2.3 3.1 1.8 2.1 0.7 3.3Eurozone 1.7 -0.4 7.6 11.6 10 8.0China 19.7 27.7 17.8 16.7 16.9 14.4India 19.1 17.7 19.9 22.8 19.3 13.6
Equity Index (end of period)
US (Dow Jones) 11578 10428 8776 13265 12463 10022India (Sensex) 20509 17464 9647 20287 13787 3262
OECD indicators (annual % change)
OECD total monetary aggr. & comp. broad money index 3.2 6.7 8.9 8.5 7.3 9.2OECD Total PPI Economic Activities Domestic Manufacturing 3.8 -4 6.8 3.2 3.7 2.0OECD Total CPI OECD Groups Total Energy 7.8 -10.4 12.4 4 9.3 4.9OECD Total Registration of Passenger Cars 0.5 -5.4 -7.9 -0.6 0.1 -0.8 US ISM Manufacturing Index 58.5 56.4 33.3 49 52 45.3US auto sales (YoY % change) 11.1 15.1 -35.6 -2.9 -3.6 5.6US pending home sales (YoY % change) -3.3 9.2 5.7 -23.9 -6.3 -
Note: Interest rates mentioned are central Bank discount rate. For India, interest rates mentioned are repo ratesSource: OECD, IMF, CPM Gold Yearbook, World Bank, Various Central Banks, BSE, NYSE
Commodity Insights Yearbook 201186
074-177_CYIB_2011_Non-Agri_Final.indd 86074-177_CYIB_2011_Non-Agri_Final.indd 86 1/18/2012 11:45:06 PM1/18/2012 11:45:06 PM

DATABANK - AGRI COMMODITIES
Platinum trading activityMonth MCX NYMEX TOCOM Volume Open Interest Volume Open Interest Volume Open InterestDec-10 1 - 185858 39093 244815 57417Nov-10 - - 153078 34501 302319 55437Oct-10 - - 99204 37867 257652 51520Sep-10 - - 187787 37808 269214 50133Aug-10 - - 74099 31010 312438 52675Jul-10 - - 71028 30260 321764 51535Jun-10 - - 144397 29406 369404 55222May-10 - - 133665 30165 488127 50858Apr-10 3 - 91226 37396 417984 43390Mar-10 96 1 176594 37977 373091 46470Feb-10 34 5 83630 34848 298474 44143Jan-10 22 6 85448 34509 422713 46192Dec-09 183 8 134504 32553 287885 42414Nov-09 289 59 63896 35475 268700 41585Oct-09 203 93 55226 30905 235829 38330Sep-09 138 64 134463 28652 243182 33641Aug-09 2441 192 48652 26890 290930 34767Jul-09 6503 251 46061 22268 279836 34704Jun-09 2154 49 104427 22996 373005 34023May-09 0 0 34962 22909 238961 37592Apr-09 0 0 30849 19835 465844 29624Mar-09 26 0 82949 20101 262139 35780Feb-09 8 2 35199 20440 207474 31494Jan-09 7 1 31090 18740 220137 33337Dec-08 6 7 69079 18217 288120 33863Nov-08 7 9 30011 17259 308803 34982Oct-08 16 7 38107 15319 456834 36321Sep-08 165 2 74165 14679 501954 43544Aug-08 276 80 47539 12524 528655 49169Jul-08 1320 75 43127 13284 644464 68862Jun-08 2000 136 66398 15094 604867 71714May-08 - - 53981 15760 570518 57714Apr-08 - - 41288 13668 576917 49411Mar-08 - - 84901 11864 463326 47325Feb-08 - - 71981 15277 986211 59916Jan-08 - - 54231 17684 780278 75212Dec-07 - - 66352 17562 581378 92721Nov-07 - - 36150 13203 799157 87854Oct-07 - - 34100 15661 947797 88887Sep-07 - - 58091 14595 552946 88963Aug-07 - - 35975 10452 924492 86329Jul-07 - - 35379 14773 677618 111907Jun-07 - - 66968 14472 906282 108704May-07 - - 35525 14319 845439 117695Apr-07 - - 26458 14399 754154 98070Mar-07 - - 59099 11566 737964 77781Feb-07 - - 25793 12527 568139 100684Jan-07 - - 20534 10091 537290 91819Dec-06 - - 34671 7978 706853 92344Nov-06 - - 45793 8394 969449 97786Oct-06 - - 21182 7648 814415 81563Sep-06 - - 44000 7832 997755 80238Aug-06 - - 21428 9740 790231 97528Jul-06 - - 16194 8682 969332 50503Jun-06 - - 45985 7383 938725 94845May-06 - - 34684 9500 1123087 109669Apr-06 - - 17215 9849 949161 127200
Note: Vol and OI in lots (unless specifi ed); aggregate volume in all contracts during the month; cumulative OI in all contracts at the month-end. Source: Exchanges’ websites
A PwC & MCX Joint Endeavour 87www.mcxindia.com / www.pwc.com/in/en
DATABANK - NON-AGRI COMMODITIES
074-177_CYIB_2011_Non-Agri_Final.indd 87074-177_CYIB_2011_Non-Agri_Final.indd 87 1/18/2012 11:45:06 PM1/18/2012 11:45:06 PM

EDITORIALSPROLOGUE INDIAN ECONOMYEXPERTS' VIEWS
Platinum prices MCX futures prices MCX spot prices NYMEX futures prices US spot Month (Rs/gm) Mumbai (Rs/gm) (USD/oz) prices (USD/oz) Open High Low Close Monthly average Open High Low Close Monthly average Dec-10 2451 2475 2451 2475 2487 1664.2 1773.0 1658.4 1773.3 1716.0 Nov-10 2361 2553 2361 2451 2452 1709.6 1811.8 1628.0 1666.4 1693.7 Oct-10 2361 2361 2361 2361 2416 1658.6 1713.6 1658.6 1707.1 1691.9 Sep-10 2343 2361 2343 2361 2361 1524.1 1659.9 1518.8 1652.0 1597.4 Aug-10 2343 2343 2343 2343 2309 1576.8 1607.5 1491.1 1523.5 1540.9 Jul-10 2343 2343 2343 2343 2303 1516.0 1579.0 1493.3 1576.8 1526.1 Jun-10 2442 2442 2343 2343 2329 1542.5 1609.3 1492.4 1530.9 1554.5 May-10 2442 2442 2442 2442 2401 1744.6 1753.4 1446.2 1549.4 1625.9 Apr-10 2384 2524 2384 2442 2462 1649.1 1755.0 1648.5 1745.1 1715.2 Mar-10 2341 2530 2310 2384 2343 1540.0 1646.6 1540.0 1639.8 1602.8 Feb-10 2214 2356 2170 2341 2270 1505.0 1594.0 1452.0 1539.9 1524.5 Jan-10 2200 2355 2172 2214 2295 1477.2 1635.5 1477.2 1506.0 1562.1 Dec-09 2229 2236 2105 2200 2166 1458.2 1514.8 1382.0 1460.0 1445.9 Nov-09 2036 2240 2005 2146 2103 1325.1 1487.9 1323.0 1460.2 1407.1 Oct-09 1975 2069 1946 1964 2014 1298.5 1368.4 1270.3 1326.3 1334.1 Sep-09 1971 2088 1933 2000 2033 1241.0 1356.3 1205.3 1295.6 1292.9 Aug-09 1880 2017 1876 1963 1940 1215.9 1296.3 1208.5 1244.0 1247.8 Jul-09 1846 1939 1751 1885 1817 1173.1 1218.1 1090.0 1214.2 1166.4 Jun-09 1793 1975 1793 1850 1883 1197.2 1301.9 1155.6 1176.7 1220.3 May-09 1793 1793 1793 1793 1778 1105.5 1204.0 1075.0 1196.0 1137.0 Apr-09 1870 1945 1867 1867 1901 1129.4 1242.3 1078.1 1106.6 1170.3 Mar-09 1642 1879 1642 1870 1787 1078.8 1167.4 1030.5 1120.8 1084.0 Feb-09 1506 1780 1506 1709 1654 996.0 1119.9 956.7 1085.3 1040.9 Jan-09 1430 1572 1379 1506 1509 932.4 996.5 914.0 991.3 955.6 Dec-08 1321 1375 1270 1375 1319 881.9 943.3 783.0 936.2 846.9 Nov-08 1366 1376 1211 1376 1328 831.0 896.0 772.0 882.3 841.1 Oct-08 1702 1702 1366 1366 1441 1003.0 1045.0 761.8 831.6 914.1 Sep-08 2120 2120 1640 1640 1802 1490.0 1499.8 995.2 1015.1 1219.5 Aug-08 2342 2379 1863 2115 2071 1754.1 1759.0 1307.0 1489.8 1485.8 Jul-08 2881 2940 2280 2436 2644 2084.1 2089.6 1726.0 1761.9 1900.3 Jun-08 2845 2900 2770 2885 2824 2013.5 2125.0 1966.1 2069.5 2037.9 May-08 - - - - - 1930.0 2234.9 1835.0 2013.8 2059.9 Apr-08 - - - - - 1948.0 2055.0 1880.0 1935.2 1991.4 Mar-08 - - - - - 2164.0 2308.8 1802.2 2024.4 2030.2 Feb-08 - - - - - 1731.2 2214.5 1722.0 2180.7 2013.7 Jan-08 - - - - - 1529.9 1746.1 1523.6 1737.4 1592.2 Dec-07 - - - - - 1436.7 1551.5 1436.1 1528.4 1496.2 Nov-07 - - - - - 1454.9 1498.8 1384.1 1444.1 1448.5 Oct-07 - - - - - 1407.5 1473.3 1355.0 1447.6 1412.9 Sep-07 - - - - - 1271.5 1395.5 1269.8 1395.2 1311.3 Aug-07 - - - - - 1301.9 1308.9 1226.5 1271.6 1263.6 Jul-07 - - - - - 1282.9 1350.0 1271.0 1302.6 1304.0 Jun-07 - - - - - 1287.4 1320.0 1264.0 1279.0 1286.7 May-07 - - - - - 1298.0 1353.8 1255.1 1285.8 1302.8 Apr-07 - - - - - 1242.0 1348.0 1245.5 1298.4 1276.9 Mar-07 - - - - - 1255.0 1264.0 1164.0 1248.3 1217.7 Feb-07 - - - - - 1187.0 1269.9 1156.1 1256.4 1205.3 Jan-07 - - - - - 1135.0 1188.0 1119.0 1182.3 1148.5 Dec-06 - - - - - 1186.5 1186.5 1096.0 1139.3 1121.5 Nov-06 - - - - - 1085.2 1289.0 1085.0 1176.7 1182.2 Oct-06 - - - - - 1159.5 1159.5 1070.0 1086.5 1082.6 Sep-06 - - - - - 1253.0 1287.9 1124.0 1141.2 1183.6 Aug-06 - - - - - 1241.6 1268.0 1216.0 1251.2 1233.6 Jul-06 - - - - - 1245.0 1275.0 1203.0 1241.6 1229.9 Jun-06 - - - - - 1252.0 1263.5 1095.0 1246.7 1188.0 May-06 - - - - - 1163.7 1347.0 1163.0 1246.8 1259.5 Apr-06 - - - - - 1070.8 1163.8 1065.0 1163.3 1102.0
Note: Future prices are for near month continuous futures contract, LPPM - London Platinum and Palladium Market Source: Exchanges' websites, RBI, ICE, The London Platinum and Palladium Market
Commodity Insights Yearbook 201188
074-177_CYIB_2011_Non-Agri_Final.indd 88074-177_CYIB_2011_Non-Agri_Final.indd 88 1/18/2012 11:45:07 PM1/18/2012 11:45:07 PM

DATABANK - AGRI COMMODITIES
TOCOM LPPM (monthly average) RBI Rate Dollarz) (JPY/gm) US$/troy ounce Euro/troy ounce GBP/troy ounce USD/INR indexge Open High Low Close AM fi xing PM fi xing AM fi xing PM fi xing AM fi xing PM fi xing Monthly average
4473 4690 4473 4626 1711.8 1707.7 1095.9 1093.4 1293.7 1290.5 45.16 80.304464 4696 4383 4464 1696.3 1692.8 1061.7 1059.3 1239.9 1238.6 45.02 78.454463 4578 4355 4399 1688.5 1688.7 1065.1 1064.6 1215.0 1215.1 44.41 77.724117 4500 4113 4410 1591.4 1591.8 1022.6 1022.6 1218.0 1217.2 46.06 81.35
4398 4456 4048 4102 1541.1 1541.1 983.6 983.3 1192.6 1192.9 46.57 82.224389 4417 4199 4352 1526.8 1525.6 999.2 998.0 1195.3 1194.0 46.84 83.434598 4718 4346 4346 1552.5 1553.2 1052.8 1052.7 1271.2 1271.7 46.56 86.775279 5280 4214 4615 1630.2 1622.6 1112.5 1108.2 1297.4 1294.1 45.80 85.484953 5373 4936 5265 1717.5 1715.6 1119.4 1119.1 1279.6 1279.6 44.50 81.354429 4935 4423 4930 1600.0 1599.4 1062.6 1062.3 1178.5 1178.6 45.50 80.814437 4605 4220 4430 1521.0 1520.4 972.9 973.7 1110.4 1111.4 46.33 80.274395 4835 4338 4373 1563.8 1562.8 966.2 966.6 1094.5 1094.6 45.96 77.984023 4395 3970 4365 1448.1 1442.3 890.9 887.1 990.0 985.7 46.63 77.003875 4197 3827 4039 1402.2 1400.6 844.2 844.0 939.5 938.9 46.59 75.403756 4188 3650 3890 1333.4 1332.8 824.2 823.0 899.6 899.6 46.72 76.173709 3950 3607 3694 1289.7 1288.7 789.8 789.3 885.5 885.0 48.39 77.193662 3950 3662 3729 1244.7 1244.6 751.9 751.8 872.7 872.4 48.36 78.533657 3739 3211 3659 1161.3 1162.3 710.0 710.0 824.6 824.8 48.47 79.713628 4020 3550 3706 1221.0 1217.9 746.3 744.2 871.1 868.8 47.78 80.263500 3720 3373 3640 1133.7 1130.4 736.5 733.7 832.1 828.5 48.61 82.113584 4010 3377 3493 1165.1 1162.5 792.8 790.9 882.8 881.6 50.08 85.553341 3653 3233 3578 1082.3 1081.2 762.2 761.8 829.6 828.0 51.23 86.712859 3321 2736 3306 1038.1 1035.7 720.9 718.7 811.4 809.7 49.22 86.842848 3028 2624 2799 952.9 949.8 660.7 657.4 718.4 716.1 48.83 84.832749 2749 2374 2646 844.9 834.8 567.6 560.6 627.2 622.9 48.64 83.652612 2854 2325 2691 842.3 840.3 548.8 547.5 661.2 659.1 49.00 86.773485 3586 2306 2458 914.3 912.6 539.7 538.2 685.1 684.4 48.64 83.535165 5165 3485 3485 1225.4 1223.0 681.5 680.3 852.3 849.9 45.56 78.376114 6114 4622 5134 1491.9 1488.5 787.8 786.8 994.3 992.9 42.94 76.217059 7123 5939 6099 1916.0 1904.4 963.8 957.8 1214.5 1207.7 42.84 72.796829 7270 6717 7027 2040.6 2038.2 1038.9 1037.2 1311.4 1310.3 42.82 73.416438 7395 6168 6675 2054.5 2054.7 1045.9 1046.2 1320.5 1321.6 42.13 73.056351 6807 6228 6415 1989.8 1988.4 1004.9 1004.1 1262.3 1263.7 40.02 72.387143 7584 5892 6499 2058.3 2046.5 1027.5 1021.0 1326.3 1318.2 40.36 72.725870 7575 5867 7209 1995.1 1999.7 1016.1 1018.5 1352.2 1356.0 39.73 75.775442 5896 5144 5752 1582.1 1585.8 803.6 804.9 1076.0 1077.2 39.37 76.005105 5584 5105 5534 1487.4 1484.9 736.1 733.5 1021.5 1018.7 39.44 76.795379 5441 4916 5116 1448.8 1448.7 699.2 699.4 987.0 986.6 39.44 75.675100 5386 5003 5312 1409.5 1410.7 689.6 690.0 989.2 991.5 39.51 77.784739 5066 4705 5048 1307.0 1307.7 647.8 648.0 940.5 940.6 40.34 79.144932 4932 4442 4733 1264.2 1264.7 629.3 629.1 928.4 928.3 40.82 80.875039 5200 4875 4934 1304.2 1303.1 641.2 640.7 950.9 949.9 40.42 80.615005 5161 4980 5038 1287.2 1286.2 648.3 647.5 959.7 958.3 40.77 82.214962 5151 4934 4962 1303.3 1301.3 657.0 656.0 964.1 962.6 40.78 82.014709 5082 4650 4954 1278.3 1278.4 642.5 642.4 945.9 945.3 42.15 81.954749 4759 4351 4709 1219.2 1218.8 626.2 626.1 920.9 920.5 44.03 83.174555 4837 4516 4663 1205.4 1204.6 616.1 615.4 922.0 921.2 44.16 84.284282 4604 4237 4544 1147.3 1148.4 585.6 586.4 882.4 884.1 44.33 84.584415 4418 4063 4282 1121.3 1121.5 570.8 570.9 848.5 848.2 44.63 83.074069 4852 4069 4376 1182.7 1183.0 618.7 619.1 918.0 918.5 44.85 84.724349 4396 4052 4069 1085.0 1082.5 578.8 577.4 860.1 858.4 45.47 86.114685 4760 4230 4355 1185.7 1183.6 628.6 627.9 930.7 930.6 46.12 85.254510 4660 4486 4644 1233.5 1234.0 651.7 651.3 962.4 962.5 46.54 84.914536 4659 4451 4500 1229.1 1228.8 666.6 666.1 968.9 968.4 46.46 85.614521 4563 4062 4488 1189.3 1188.6 644.7 644.8 938.6 939.1 46.06 85.374236 4695 4212 4596 1263.9 1264.9 675.8 676.0 988.8 989.9 45.41 84.694006 4281 4002 4198 1101.8 1101.4 623.7 623.3 897.4 897.6 44.95 88.13
A PwC & MCX Joint Endeavour 89www.mcxindia.com / www.pwc.com/in/en
DATABANK - NON-AGRI COMMODITIES
074-177_CYIB_2011_Non-Agri_Final.indd 89074-177_CYIB_2011_Non-Agri_Final.indd 89 1/18/2012 11:45:07 PM1/18/2012 11:45:07 PM

EDITORIALSPROLOGUE INDIAN ECONOMYEXPERTS' VIEWS
Platinum Mine Production (2010e) Platinum Jewellery Demand (2010)
Source: USGS; e estimates Source: Platinum 2011, Johnson Matthey PLC
SouthAfrica75%
Russia13%
Others2%
USA2%
Canada3%
Zimbabwe5%
China72%
North America
11%
Europe10%
Japan2%
Others5%
Platinum, Palladium, Gold & Silver Prices in USD/troy oz
Source: COMEX (CME)
2500
2000
1500
1000
500
0
40
35
30
25
20
15
10
5
0
Platinum Palladium
Gold Silver (RHS)
Nov
-93
Jul-9
4
May
-95
Jan-
96
Oct
-96
Jul-9
7
Apr
-98
Jan-
99
Oct
-99
Aug-
00
May
-01
Mar
-02
Jan-
03
Oct
-03
Jul-
04
Apr
-05
Jan-
06
Oct
-06
Jul-
07
Mar
-08
Dec
-08
Sep-
09
Jun-
10
Mar
-11
Commodity Insights Yearbook 201190
074-177_CYIB_2011_Non-Agri_Final.indd 90074-177_CYIB_2011_Non-Agri_Final.indd 90 1/18/2012 11:45:07 PM1/18/2012 11:45:07 PM

DATABANK - AGRI COMMODITIES
Silver fundamentals (tonnes) 2010 2009 2008 2007 2006 2001
World Global supply 30693 29433 28307 27847 27611 25247Mine supply 20746 20292 19567 19253 18451 17384Secondary supply (scraps etc.) 9885 9110 8647 8190 8196 6619Others 62 31 93 404 964 1244 Global demand 28220 27100 28186 27751 27387 27219Fabrication demand 26276 25020 26494 26842 26537 26482Jewellery and Silverware 8734 8606 8675 8855 8053 9116Photography 3216 3515 3953 4846 5216 7704Electronics and Batteries 6855 6535 6504 6127 5882 4208Others 7471 6364 7362 7014 7387 5452Coinage and others 1944 2081 1692 908 849 737 Surplus/Deficit 2473 2333 121 96 224 -1972
India Total supply 2924 2732 4790 3384 2908 4958Mine production 131 130 96 134 108 91Secondary supply (including scraps) 927 1002 544 501 700 300Imports 1866 1600 4150 2500 1300 4562Government disposals & others 0 0 0 249 800 5
Fabrication demand 3739 3639 3897 3760 3260 4345Industrial use 2753 2644 2750 2662 2258 1844Electroplating 1512 1462 1490 1499 1201 299Electrical/Electronics 647 622 600 600 501 149Brazing alloys 498 473 467 299 249 50others 96 87 193 264 308 1347Jewellery and silverware 986 995 1148 1098 1002 2501Jewellery 258 261 299 299 401 998Silverware 728 734 849 799 600 1502
ETF Physical Silver Holdings World 18409 14593 10631 7091 4782 615SLV (i-Shares ) Trust 10922 9493 5059 3642 3768 - COMEX silver inventories 3261 3498 3972 4125 3455 3251 Average daily volatility (MCX spot prices) 1.5% 1.8% 2.0% 1.2% 2.2% -
Source: USGS, MCX, CPM Silver Yearbook 2011, CPM Silver Yearbook 2010, COMEX, www.silverinstitute.org
Silver Market during 2004-2010, 2001 (million ounces) 2010 2009 2008 2007 2006 2001
Annual supply 998.7 951.0 910.1 895.3 887.7 800.9Futures and Options exchanges' trading volume 92894.9 60462.1 69661.2 58725.8 52458.4 15911.0London Bullion Market Association clearing volume 22515.2 24454.4 31517.8 28951.3 36784.7 26552.5Total 116408.8 85867.5 102089.2 88572.4 90130.8 43275.2Average price ($/troy ounce) 20.3 14.7 15.0 13.5 11.6 4.4Dollar value ($billion) 2364.0 1260.0 1528.0 1192.0 1046.0 189.0
Source: CPM Group, LBMA
Top 5 silver producing countries - mine production (tonnes) 2010 2009 2008 2007 2006 2001
Mexico 3999.4 3553.9 3236.3 3094.8 2987.7 2768.2Peru 3637.4 3922.7 3685.9 3493.9 3470.7 2581.6China 3193.6 3001.5 2799.3 2699.8 2600.3 1897.3Australia 1850.0 1633.0 1926.0 1881.8 1741.8 1968.9Russia 1451.8 1400.0 1297.0 1259.7 1306.3 404.3
Source: CPM Silver Yearbook 2011
A PwC & MCX Joint Endeavour 91www.mcxindia.com / www.pwc.com/in/en
DATABANK - NON-AGRI COMMODITIES
074-177_CYIB_2011_Non-Agri_Final.indd 91074-177_CYIB_2011_Non-Agri_Final.indd 91 1/18/2012 11:45:10 PM1/18/2012 11:45:10 PM

EDITORIALSPROLOGUE INDIAN ECONOMYEXPERTS' VIEWS
Silver fabrication demand by country/region - top 5 (tonnes) 2010 2009 2008 2007 2006 2001
China 4768.2 4320.3 3788.4 34804.8 3228.5 1430.8Europe 5496.0 5570.6 6037.2 6513.1 6640.6 7181.8India 3496.0 3328.1 3567.6 3471.1 2957.9 4345.2Japan 2006.2 1993.7 2531.8 2998.4 3194.3 3125.9United States 5082.3 5144.5 5754.1 6133.6 6410.4 6003.0Russia 1451.8 1400.0 1297.0 1259.7 1306.3 404.3
Source: CPM Silver Yearbook 2011
Silver mining companies by production, 2010 (tonnes) Country Name Company Production % of Total Cumulative Cumulative World Production % ProductionMexico Fresnillo Silver Mine Fresnillo plc 1116.9 4.96% 1116.9 4.96% Russia Dukat Silver/Gold Mine Polymetal MNPO 345.0 1.53% 1461.9 6.50%Peru Pallancata Hochschild 315.2 1.40% 1777.2 7.90%Peru Uchucchacaua Cia De Minas 289.3 1.29% 2066.4 9.18% Silver Mine BuenaventuraPeru Arcata Silver Mine Hochschild 258.9 1.15% 2325.4 10.33%USA Greens Creek Hecla 222.0 0.99% 2547.3 11.32%Mexico Alamo Dorado Pan American Silver 209.0 0.93% 2756.4 12.25% Silver MineBolivia San Bartolome Coeur d Alene 208.7 0.93% 2965.1 13.18% Silver MineMorocco Imiter Silver Mine Societe Metallurgique 200.0 0.89% 3165.1 14.07% D`ImiterArgentina Pirquitas Silver Standard 196.0 0.87% 3361.1 14.94%
Source: CPM Silver Yearbook 2011
Global financial assets (US $ trillion) Bank Govt. Private Equity Investor Gold as % Investor Silver as ofYear deposits debt debt securities gold of total silver total Total securities securities holdings fi nancial holdings fi nance assets asset1980 5 2 2 3 0.26 2.1% 0.04 0.345% 12.301990 19 9 10 9 0.24 0.5% 0.01 0.027% 47.141995 25 13 14 17 0.28 0.4% 0.01 0.015% 69.412000 34 19 24 31 0.21 0.2% 0.01 0.005% 108.232001 36 18 27 27 0.21 0.2% 0.00 0.004% 108.182002 38 18 28 23 0.24 0.2% 0.00 0.004% 107.702003 40 21 31 32 0.29 0.2% 0.00 0.003% 123.942004 43 25 34 38 0.35 0.3% 0.00 0.300% 139.662005 46 27 37 43 0.4 0.3% 0.00 0.003% 153.422006 51 26 42 53 0.53 0.3% 0.01 0.004% 173.002007 56 28 48 65 0.63 0.3% 0.01 0.004% 197.432008 61 31 51 34 0.75 0.4% 0.01 0.005% 177.352009 63 34 50 49 0.88 0.4% 0.01 0.005% 197.222010e 63 39 50 55 1.18 0.6% 0.01 0.007% 207.88
Note: e - source estimatesSource: CPM Silver Yearbook 2011
Commodity Insights Yearbook 201192
074-177_CYIB_2011_Non-Agri_Final.indd 92074-177_CYIB_2011_Non-Agri_Final.indd 92 1/18/2012 11:45:10 PM1/18/2012 11:45:10 PM

DATABANK - AGRI COMMODITIES
Economic parameters impacting silver prices 2010 2009 2008 2007 2006 2001
Real GDP (annual % change)
US 2.8 -2.6 1.1 2 2.9 0.8Japan 4.3 -6.3 -0.3 1.9 2.8 0.7Eurozone 1.8 -4.1 1 2.3 2.6 1.9China 10.3 9.2 9 11.5 11.1 8.3India 9.7 5.7 7.3 8.9 9.7 3.9OECD 2.8 -3.4 1 2.6 3.2 2.4
Consumer Price Inflation (annual % change)
US 1.6 -0.3 1 2.5 2.7 2.8Japan -0.9 -1.4 0.5 1.4 0.3 -0.7Eurozone 1.5 0.3 1 3 2.2 2.4China 3.1 0.8 3 5.9 2 -0.1India 13.2 10.9 5 7 6.7 5.2OECD 1.5 0.1 1 3 2.2 2.8
Industrial Output (annual % change)
US 7 -2.9 -11.3 1.5 3 -3.7Japan 15.4 -21.3 -3.3 2.8 4.4 -6.3Eurozone 8.9 -3.7 -12.4 1.3 3.9 0.4China 15.7 11 12.9 17.4 15.4 9.9India 2.5 18 0.5 7.6 10.3 2.1OECD 7.9 -12.3 -2.1 3.3 3.8 -2.2
Interest rates (%)
US 0.1 0.1 0.1 4.3 6.3 1.3Japan 0.3 0.3 0.3 0.8 0.4 0.1Eurozone 1.8 1.8 3 5 4.5 4.3China 3.3 2.8 2.8 3.3 3.3 3.2India (repo rate ) 6.3 4.8 6.5 7.8 7.3 8.5
Money Supply (annual % change)
US 3.4 3.5 10 6.1 5.9 10.5Japan 2.3 3.1 1.8 2.1 0.7 3.3Eurozone 1.7 -0.4 7.6 11.6 10 8.0China 19.7 27.7 17.8 16.7 16.9 14.4India 19.1 17.7 19.9 22.8 19.3 13.6
Equity Index (end of period)
US (Dow Jones) 11578 10428 8776 13265 12463 10022India (Sensex) 20509 17464 9647 20287 13787 3262
OECD indicators (annual % change)
OECD total monetary aggr. & comp. broad money index 3.2 6.7 8.9 8.5 7.3 9.2OECD Total PPI Economic Activities Domestic Manufacturing 3.8 -4 6.8 3.2 3.7 2.0OECD Total CPI OECD Groups Total Energy 7.8 -10.4 12.4 4 9.3 4.9OECD Total Registration of Passenger Cars 0.5 -5.4 -7.9 -0.6 0.1 -0.8 US ISM Manufacturing Index 58.5 56.4 33.3 49 52 45.3US auto sales (YoY % change) 11.1 15.1 -35.6 -2.9 -3.6 5.6US pending home sales (YoY % change) -3.3 9.2 5.7 -23.9 -6.3 -
Note: Interest rates mentioned are central Bank discount rate. For India, interest rates mentioned are repo ratesSource: OECD, IMF, CPM Gold Yearbook, World Bank, Various Central Banks, BSE, NYSE
A PwC & MCX Joint Endeavour 93www.mcxindia.com / www.pwc.com/in/en
DATABANK - NON-AGRI COMMODITIES
074-177_CYIB_2011_Non-Agri_Final.indd 93074-177_CYIB_2011_Non-Agri_Final.indd 93 1/18/2012 11:45:11 PM1/18/2012 11:45:11 PM

EDITORIALSPROLOGUE INDIAN ECONOMYEXPERTS' VIEWS
Silver pricesMonth MCX futures prices (30 kgs contract) Spot prices (Rs/kg) COMEX futures prices (Rs/kg) Monthly average (US$/troy ounce) Open High Low Close Mumbai Ahmedabad Open High Low Close Dec-10 42851 46383 42653 46217 45380 44426 28.10 30.90 28.01 30.91 Nov-10 37188 43231 35956 43009 41106 40006 24.75 29.34 23.94 28.19 Oct-10 32910 37193 32900 37105 36063 35223 21.77 24.95 21.73 24.56 Sep-10 30850 33390 30700 32962 32664 31912 19.39 22.13 19.30 21.82 Aug-10 28721 30964 28713 30915 29871 29309 18.00 19.40 17.74 19.40 Jul-10 29550 29569 28026 28636 29412 28783 18.59 18.66 17.43 18.00 Jun-10 29320 30118 28031 29604 29821 29293 18.41 19.46 17.20 18.67 May-10 28220 30163 26855 29292 29363 28876 18.63 19.80 17.09 18.42 Apr-10 26905 28360 26806 28304 28057 27517 17.51 18.77 17.48 18.61 Mar-10 25797 27309 25420 26935 27080 26611 16.50 17.65 16.32 17.53 Feb-10 25560 26340 23610 25767 25661 24981 16.17 16.95 14.65 16.50 Jan-10 26730 28680 25292 25500 28091 27408 16.89 18.80 16.02 16.19 Dec-09 28327 29580 26602 26771 28357 27697 18.47 19.43 16.76 16.82 Nov-09 26251 28860 25960 28300 28264 27616 16.51 18.94 16.25 18.50 Oct-09 26451 27680 25761 25933 26884 26769 16.67 18.18 15.92 16.26 Sep-09 23790 27960 23610 26486 25786 26231 14.89 17.56 14.65 16.66 Aug-09 22465 24270 22457 23822 23609 23172 13.90 15.19 13.50 14.90 Jul-09 21830 22820 21103 22468 22342 21865 13.60 14.05 12.48 13.94 Jun-09 24209 24690 21744 21768 23070 22807 15.77 16.25 13.44 13.57 May-09 20466 24217 20290 24195 22591 22284 12.34 15.80 12.04 15.61 Apr-09 21800 21990 19718 21319 21343 20847 12.96 13.24 11.73 12.31 Mar-09 22085 22936 20435 21855 22293 22084 13.09 13.85 11.94 12.99 Feb-09 19800 23681 19438 21820 21422 21431 12.66 14.60 12.14 13.09 Jan-09 18475 20038 17392 19893 18735 18501 11.20 12.66 10.37 12.57 Dec-08 16789 18450 15539 18355 17323 17024 10.24 11.41 9.14 11.27 Nov-08 16898 17610 15782 16779 17186 16741 9.84 10.80 8.77 10.19 Oct-08 20166 20770 16111 16858 18639 17859 12.14 13.08 8.40 9.73 Sep-08 20265 21389 17660 20109 20173 19476 13.77 13.77 10.28 12.28 Aug-08 24681 24705 18919 20232 22247 21454 17.77 17.81 12.20 13.61 Jul-08 24290 27234 23670 24720 25164 24943 17.44 19.38 16.85 17.79 Jun-08 23245 24909 23000 24260 24203 23855 16.88 17.88 16.25 17.42 May-08 22290 25494 21470 23376 23747 23450 16.97 18.29 16.00 16.87 Apr-08 22222 24265 21327 22121 23506 23007 17.26 18.77 16.30 16.50 Mar-08 24750 27500 21970 22274 24204 24093 19.78 21.19 16.77 17.31 Feb-08 21620 24965 20961 24707 21983 21798 16.95 19.93 16.23 19.81 Jan-08 19422 21770 19422 21676 20428 20278 15.34 17.09 15.09 17.00 Dec-07 18101 19633 17921 19463 19018 18732 13.96 14.83 13.60 14.80 Nov-07 19019 20925 17975 18159 19547 19233 14.55 16.28 13.76 13.96 Oct-07 18468 19079 17651 18981 18393 18032 13.94 14.65 13.15 14.44 Sep-07 16514 18489 16400 18479 17687 17283 12.10 14.00 12.00 13.92 Aug-07 17545 17858 15975 16523 17422 16941 12.91 13.25 11.06 12.06 Jul-07 16850 18250 16710 17583 17828 17429 12.41 13.39 12.41 13.02 Jun-07 18320 18760 16656 16786 18325 17913 13.50 13.87 12.13 12.35 May-07 18596 18972 17710 18300 18551 18089 13.42 13.59 12.79 13.47 Apr-07 19633 20039 18080 18508 19693 19316 13.46 14.17 13.02 13.45 Mar-07 20480 20650 18270 19622 19495 19247 14.23 14.31 12.47 13.45 Feb-07 19960 21174 19500 20486 20337 20058 13.60 14.75 13.26 14.10 Jan-07 19400 20062 18186 19933 19377 18922 12.73 13.70 12.20 13.57 Dec-06 20340 21502 18661 19424 19851 19618 13.90 14.19 12.35 12.82 Nov-06 18500 20449 18466 20395 19336 19168 12.29 14.00 12.29 13.93 Oct-06 18165 18537 16933 18484 18286 17764 11.55 12.31 10.65 12.27 Sep-06 19321 20486 16811 18115 18595 18073 12.87 13.26 10.45 11.54 Aug-06 17781 19595 17680 19344 19028 18785 11.40 12.93 11.33 12.90 Jul-06 17000 18333 16550 17748 17802 17327 10.91 11.78 10.65 11.37 Jun-06 19078 19175 14450 16651 16764 16426 12.48 12.58 9.45 10.83 May-06 20006 20890 19533 20381 20302 20155 13.58 14.97 12.00 12.46 Apr-06 16770 23148 16725 19786 19489 18780 11.49 14.69 11.47 13.51
Note: Future prices are for near month continuous futures contractSource: Exchanges’ websites, RBI
Commodity Insights Yearbook 201194
074-177_CYIB_2011_Non-Agri_Final.indd 94074-177_CYIB_2011_Non-Agri_Final.indd 94 1/18/2012 11:45:11 PM1/18/2012 11:45:11 PM

DATABANK - AGRI COMMODITIES
US spot prices LBMA Silver fi xings (AM fi xing) RBI rate Dollar Gold-SilverMonthly average Monthly average USD/INR Index ratio(US$/troy ounce) US$/troy ounce Euro/troy ounce GBP/troy ounce Monthly average
91 29.33 29.35 22.18 18.80 45.16 80.30 47.489 26.66 26.54 19.43 16.62 45.02 78.45 51.466 23.49 23.39 16.83 14.75 44.41 77.72 57.252 20.59 20.55 15.71 13.20 46.06 81.35 61.790 18.45 18.36 14.22 11.72 46.57 82.22 66.010 17.91 17.96 14.07 11.75 46.84 83.43 66.61
67 18.46 18.45 15.11 12.50 46.56 86.77 66.852 18.44 18.42 14.69 12.59 45.80 85.48 65.43
61 18.15 18.10 13.50 11.81 44.50 81.35 63.333 17.11 17.11 12.60 11.37 45.50 80.81 65.140 15.87 15.87 11.60 10.16 46.33 80.27 69.189 17.73 17.79 12.46 11.00 45.96 77.98 63.012 17.59 17.67 12.08 10.87 46.63 77.00 64.050 17.95 17.82 11.94 10.74 46.59 75.40 63.056 17.23 17.24 11.63 10.65 46.72 76.17 60.656 16.48 16.39 11.25 10.03 48.39 77.19 60.560 14.40 14.35 10.06 8.67 48.36 78.53 65.954 13.40 13.36 9.48 8.17 48.47 79.71 69.787 14.63 14.65 10.45 8.94 47.78 80.26 64.63
61 14.15 14.03 10.28 9.10 48.61 82.11 65.7531 12.51 12.51 9.48 8.51 50.08 85.55 71.219 13.16 13.12 10.06 9.24 51.23 86.71 70.449 13.44 13.41 10.49 9.31 49.22 86.84 70.067 11.42 11.29 8.52 7.84 48.83 84.83 75.527 10.40 10.29 7.64 6.92 48.64 83.65 79.419 9.87 9.87 7.74 6.42 49.00 86.77 77.073 10.36 10.44 7.82 6.16 48.64 83.53 77.698 12.26 12.37 8.61 6.88 45.56 78.37 67.57
61 14.50 14.69 9.78 7.75 42.94 76.21 57.709 18.08 18.03 11.43 9.07 42.84 72.79 52.002 17.02 16.97 10.91 8.64 42.82 73.41 52.33
87 17.09 17.05 10.96 8.68 42.13 73.05 52.120 17.51 17.50 11.10 8.83 40.02 72.38 51.99
31 19.10 19.51 12.56 9.73 40.36 72.72 50.3181 17.65 17.57 11.91 8.94 39.73 75.77 52.430 15.97 15.96 10.85 8.10 39.37 76.00 55.610 14.37 14.30 9.82 7.07 39.44 76.79 56.186 14.66 14.70 10.02 7.10 39.44 75.67 54.994 13.71 13.67 9.61 6.69 39.51 77.78 55.20
92 12.88 12.83 9.23 6.36 40.34 79.14 55.396 12.31 12.36 9.08 6.15 40.82 80.87 54.092 12.92 12.91 9.41 6.35 40.42 80.61 51.525 13.11 13.14 9.80 6.62 40.77 82.21 49.987 13.16 13.15 9.73 6.63 40.78 82.01 50.735 13.74 13.74 10.16 6.90 42.15 81.95 49.465 13.13 13.18 9.96 6.77 44.03 83.17 49.850 13.94 13.91 10.64 7.11 44.16 84.28 47.737 12.86 12.84 9.88 6.55 44.33 84.58 49.092 13.22 13.36 10.11 6.80 44.63 83.07 47.553 13.00 12.93 10.04 6.76 44.85 84.72 48.337 11.61 11.56 9.16 6.16 45.47 86.11 50.564 11.61 11.68 9.17 6.19 46.12 85.25 51.550 12.25 12.18 9.50 6.43 46.54 84.91 51.487 11.23 11.23 8.86 6.09 46.46 85.61 56.423 10.78 10.80 8.52 5.85 46.06 85.37 55.346 13.44 13.45 10.53 7.19 45.41 84.69 50.06
51 12.72 12.61 10.28 7.14 44.95 88.13 48.10
A PwC & MCX Joint Endeavour 95www.mcxindia.com / www.pwc.com/in/en
DATABANK - NON-AGRI COMMODITIES
074-177_CYIB_2011_Non-Agri_Final.indd 95074-177_CYIB_2011_Non-Agri_Final.indd 95 1/18/2012 11:45:11 PM1/18/2012 11:45:11 PM

EDITORIALSPROLOGUE INDIAN ECONOMYEXPERTS' VIEWS
Silver trading activityMonth MCX COMEX TOCOM LBMA clearing (All contracts) (5000 troy ounce contracts) (10 kg contracts) turnover Volume Open Interest Volume Open Interest Volume Open Interest Daily averages (million ounces)Dec-10 3954385 53717 1269578 135970 37568 9773 99.7Nov-10 5019135 55805 2269122 133139 47052 9312 108.6Oct-10 4093266 82739 1314164 154866 25499 8278 92.2Sep-10 2854405 104599 754459 152540 13446 7107 88.5Aug-10 2956440 100967 978609 130813 11102 5028 65.5Jul-10 2697838 48672 641229 119111 7622 4444 57.2Jun-10 2940814 47199 1080507 127990 11253 4317 85.0May-10 2879419 42677 936901 120952 12734 3776 104.3Apr-10 2306351 47200 993781 124216 12750 2367 92.7Mar-10 2623227 34424 750210 114787 14267 3666 94.0Feb-10 3014731 31671 1065168 107635 15057 3818 89.0Jan-10 2426103 55451 755863 123393 12285 3396 70.4Dec-09 2729099 48623 664831 124057 10621 3305 88.0Nov-09 2926605 37276 1077309 131516 8695 2367 81.0Oct-09 2562961 39913 807613 130427 10295 2157 101.1Sep-09 2832361 34031 656218 128160 9564 1769 113.0Aug-09 2161531 34494 842907 105057 4810 1257 79.3Jul-09 1695690 26257 454114 99411 5736 2136 90.5Jun-09 2617203 39864 869114 104594 9879 2398 100.0May-09 1961241 44108 418399 102631 5089 2415 97.5Apr-09 1781983 15276 553961 89263 8577 2173 101.1Mar-09 2368782 19794 433757 94506 9873 2542 98.8Feb-09 2345494 16680 619633 94102 11291 3261 105.8Jan-09 2527274 37873 381837 92990 7956 5097 111.7Dec-08 1984421 25586 329047 85923 8839 5464 102.1Nov-08 1960673 27942 568072 86180 10553 5814 107.6Oct-08 2544248 52466 594307 93779 24442 5932 136.2Sep-08 2875765 43447 746310 103812 26444 6289 143.7Aug-08 2111397 25691 953123 115590 26066 7034 150.0Jul-08 2055536 15845 687936 131599 28139 9189 105.5Jun-08 1650314 11650 859976 126121 18213 9517 119.5May-08 1362887 11635 578951 124655 19417 8981 121.2Apr-08 1625961 12561 912952 123841 22390 8653 119.2Mar-08 1994755 13237 881776 146632 39811 10111 154.7Feb-08 1800439 27151 989601 166678 31184 9144 132.4Jan-08 1919723 30913 719316 185540 29806 8662 117.6Dec-07 1223221 20931 393272 152888 16447 9542 119.1Nov-07 1812705 23243 1018502 135914 38137 10329 129.0Oct-07 1549302 23997 596495 136393 38503 11118 106.4Sep-07 1229147 22494 463666 117643 32072 13006 108.1Aug-07 1290422 23786 738703 107421 63224 13948 120.8Jul-07 1034273 26378 404108 118550 44763 18388 114.9Jun-07 1098449 29349 900716 116705 58482 18683 112.4May-07 1038399 29994 712183 112563 34448 16388 137.5Apr-07 1093888 23182 1110891 111447 45414 15080 105.7Mar-07 1437994 23137 847073 110549 51524 12805 112.0Feb-07 1281590 13319 979174 124697 43178 14673 108.1Jan-07 1352259 19097 614161 114336 47299 14427 98.8Dec-06 1078773 19526 406389 101155 59949 15007 107.7Nov-06 1064886 16163 464305 106667 38652 13253 108.8Oct-06 1097901 15402 267464 110237 31319 9730 98.6Sep-06 1191386 20086 301048 99007 46359 9986 110.4Aug-06 1084692 12594 490047 108854 46033 13504 94.7Jul-06 879918 6645 281501 98942 48093 4328 169.5Jun-06 1050812 13198 557495 97874 56782 16386 164.3May-06 1166751 11865 581966 110238 86547 22084 205.7Apr-06 1413030 15346 939093 116254 183118 25296 238.1
Note: Vol and OI in lots (unless specifi ed); aggregate volume in all contracts during the month; cumulative OI in all contracts at the month-end; LBMA - London Bullion Market Association. Source: Exchanges’ websites, LBMA
Commodity Insights Yearbook 201196
074-177_CYIB_2011_Non-Agri_Final.indd 96074-177_CYIB_2011_Non-Agri_Final.indd 96 1/18/2012 11:45:11 PM1/18/2012 11:45:11 PM

DATABANK - AGRI COMMODITIES
Silver Mine Production (2010) Silver Consumption (2010)
Source: USGS Source: CPM Silver Yearbook 2011
Others33%
Mexico19%Peru
18%
China15%
United States6%
Australia9%
Others46%
USA20%
India14%
Japan8%
Thailand6%
Italy6%
Silver Vs. Oil prices, Gold Silver Ratio and Dollar Index
Source: CME (COMEX & NYMEX)
180
160
140
120
100
80
60
40
20
0
40
35
30
25
20
15
10
5
0
Silver prices (RHS) WTI Prices (USD/bbl)
Gold Silver Ratio Dollar Index
USD/Oz
Mar
-84
Jan-
85
Nov
-85
Sep-
86
Jul-8
7
May
-88
Mar
-89
Jan-
90
Nov
-90
Sep-
91
Jul-9
2
May
-93
Mar
-94
Jan-
95
Nov
-95
Sep-
96
Jul-9
7
May
-98
Mar
-99
Jan-
95
Nov
-95
Sep-
06
Jul-
07
May
-
08
Mar
-09
Jan-
10
Nov
-10
Silver prices (RHS) WTI Prices (USD/bbl)
Gold Silver Ratio Dollar Index
84 85 85 86 87 88 89 90 90 91 92 93 94 95 95 96 97 98 99 95 95 06 07 y- 08
09 10 10
A PwC & MCX Joint Endeavour 97www.mcxindia.com / www.pwc.com/in/en
DATABANK - NON-AGRI COMMODITIES
074-177_CYIB_2011_Non-Agri_Final.indd 97074-177_CYIB_2011_Non-Agri_Final.indd 97 1/18/2012 11:45:12 PM1/18/2012 11:45:12 PM

EDITORIALSPROLOGUE INDIAN ECONOMYEXPERTS' VIEWS
Currently, there are over 85 known metals in the world.
People had been using only a few metals during BC,
but increased realisation of their utility led to rapid
discovery of new metals later (Material Science
& Engineering, Carnegie Mellon University). Metals and
metal alloys possess high structural strength per unit
mass, making them useful materials for carrying
large loads or resisting impact damage. Metal alloys
can be engineered to have high resistance to shear,
torque and deformation. Strength and resilience
have led to metals’ frequent use in high-rise building,
bridge construction, vehicles, tools, pipes, non-illumi-
nated signs, railroad tracks and numerous other appliances.
Thus, metals play a vital role in the developmental process. The
two most commonly used structural metals – iron and aluminium –
are also the most abundant metals in the earth’s crust.
India produces 89 minerals, comprising four fuel minerals, 11
metallic, 52 non-metallic and 22 minor minerals. Besides being
the world’s largest producer of mica blocks, it is one
of the world’s top producers of iron ore, manganese,
aluminium, crude steel, etc.
Futures prices of base metals on MCX were a mixed
bag in 2010. While copper futures jumped 28%, zinc
futures fell 9%, y-o-y. As 2010 dawned, combination
of factors – concerns over market regulation in the
US, expectations of monetary tightening in China and
increases in LME stocks – triggered a sharp fall in
the prices of base metals, including copper and zinc.
However, upbeat global economic data lent support
for a short-term revival. Later, in June, metals’ prices,
especially zinc’s, eased to a year low on growing doubts
over Greece’s ability to manage its debt crisis. What
also added to the downward pressure were data such
Commodity in 2010 Exchange (contract) Price Unit Open High Low Close Annualised
VolatilityVolume (in lots)
Copper MCX (1 tonne) Rs/ kg 343.95 439.80 284.10 439.50 20.70% 31,341,022
LME (25 tonnes) US$/ Tonne 7,405.00 9,687.00 6,037.50 9,600.00 28.82% 29,665,041
ZincMCX (5 tonne) Rs/ kg 118.70 123.20 74.35 109.00 29.25% 11,927,214^
LME (25 tonnes) US$/ Tonne 2,588.00 2,736.00 1,577.00 2,454.00 39.77% 17,911,059
as a rise in jobless claims in the US and China’s intent on curbing
lending activity. Thereafter, the prices of base metals, particularly
of copper, rose on upbeat US economic data: unemployment
claims fell to a six-week low and orders of durables dropped
more than expected in May 2010 and copper mining
major BHP Billiton announced that its output could
fall 5-10% in 2010 (www.erbakir.com.tr). Besides,
news such as Escondida, the world’s largest
copper mine, was expecting its output to dip 5-10%
on lower ore grades aided a rally in copper www.
erbakir.com.tr). A halt in production, due to labour
disputes at Collahausi (Chile), the world’s third-largest
mine, helped metals edge up. Zinc prices also recovered
as China’s third-largest zinc producer closed down its smelter to
comply with government pollution investigation in October 2010,
the full recovery could not materialize in early 2010. Finally, a rally
led copper futures prices on MCX to touch an all-time high of Rs.
439.80 in the fi nal trading session of the year.
Source: Respective exchanges’ website; ^ all contracts-all variants
MCX base metals futures prices (in Rs./kg) - 2010
450
416
382
348
314
280
125
115
105
95
85
75
Source: Metastocks Copper - LHS Zinc - RHS
Expectations of Chinese monetary tightening
labour union disputes at Collahausi, Copper mine
labour union disputes at Collahausi, Copper mine
Greek debt Crisis
1-Jan
-10
29-Ja
n-10
26-F
eb-1
0
26-M
ar-1
0
23-A
pr-1
0
21-M
ay-1
0
18-Ju
n-10
16-Ju
l-10
13-A
ug-1
0
10-S
ep-1
0
8-Oc
t-10
5-No
v-10
3-De
c-10
31-D
ec-1
0
“Put a coward to his metal an’ he’ll
fi ght the de’il”
(An Irish Proverb)
MetalsThe base for development
Commodity Insights Yearbook 201198
074-177_CYIB_2011_Non-Agri_Final.indd 98074-177_CYIB_2011_Non-Agri_Final.indd 98 1/18/2012 11:45:13 PM1/18/2012 11:45:13 PM

DATABANK - AGRI COMMODITIES
A PwC & MCX Joint Endeavour 99www.mcxindia.com / www.pwc.com/in/en
DATABANK - NON-AGRI COMMODITIES
074-177_CYIB_2011_Non-Agri_Final.indd 99074-177_CYIB_2011_Non-Agri_Final.indd 99 1/18/2012 11:45:42 PM1/18/2012 11:45:42 PM

EDITORIALSPROLOGUE INDIAN ECONOMYEXPERTS' VIEWS
Aluminium Fundamentals ('000 tonnes) 2010 2009 2008 2007 2006 2001Global
Primary aluminium production 40,800 36,900 39,600 38,000 33,900 24,300Primary smelting capacity 52,700 48,600 48,600 41400 38500 -Capacity utilisation 77.40% 75.90% 81.50% 91.80% 88.10% -Aluminium recovered from scrap - 2,417 2,696 2,888 3,025 2,567Primary aluminium consumption 39720 34810 37020 37,250 33,990 23,650World balance 1080 2090 2580 750 -90 650Total stocks 6450 6400 4650 2,900 2,750 -
China
Primary aluminium production 16200 12900 13200 12,600 9,360 3,250Primary aluminium consumption 15800 14300 12400 12,300 8,600 3,300Unwrought aluminum & aluminum products import 83 117 69 86 93 78Unwrought aluminum & aluminum products export 270 220 180 228 220 49
India
Primary aluminium production 1525 1349 1237 1153 1003 643Primary aluminium consumption 1481 1299 1240 1140 1033 568Primary aluminium imports 240.7 183.8 169.8 111.8 126.3 46.4Primary aluminium exports 284.9 233.8 166.7 123.8 96.4 121.2 Aluminium foils Production 49.2 47.4 51.1 47.4 44.9 -Aluminium sheets/plates Production 287.1 256.2 317.5 314.4 297.3 -Aluminium wires & extrusions Production 413.2 345.4 311 279.2 271.5 -Inventory levels - year-end LME 4277.1 4628.9 2328.9 930 699.3 819.2SHFE 441.2 297.5 206.5 89.1 18.5 - Average daily volatility (MCX spot prices) 1.50% 1.90% 1.80% 1.20% 1.60% -
Source: USGS, IAI, WBMS, DGCIS, GFMS, LME, SHFE, MCX
Top 5 refined aluminium producersCountry 2010 2009 2008 2007 2006
China 16200 12900 13200 12600 9360Russia 3871 3815 4190 3955 3718Canada 2963 3030 3119 3083 3051Australia 1928 1943 1974 1959 1929United States 1727 1727 2659 2560 2281
Source: Thomson Reuters GFMS, ILZSG;
Top 5 refined aluminium consumers Country 2010 2009 2008 2007 2006
China 15800 14300 12400 12300 8600United States 4240 3850 4900 5550 6150Japan 2025 1523 2250 2197 2323Germany 1912 1277 1936 2008 1823India 1481 1299 1240 1140 1033
Source: Thomson Reuters GFMS, ILZSG;
Commodity Insights Yearbook 2011100
074-177_CYIB_2011_Non-Agri_Final.indd 100074-177_CYIB_2011_Non-Agri_Final.indd 100 1/18/2012 11:45:48 PM1/18/2012 11:45:48 PM

DATABANK - AGRI COMMODITIES
Economic parameters impacting Aluminium prices 2010 2009 2008 2007 2006 2001Real GDP (annual % change)
US 2.8 -2.6 1.1 2 2.9 0.8Japan 4.3 -6.3 -0.3 1.9 2.8 0.7Eurozone 1.8 -4.1 1 2.3 2.6 1.9China 10.3 9.2 9 11.5 11.1 8.3India 9.7 5.7 7.3 8.9 9.7 3.9OECD 2.8 -3.4 1 2.6 3.2 2.4
Consumer Price Inflation (annual % change) US 1.6 -0.3 1 2.5 2.7 2.8Japan -0.9 -1.4 0.5 1.4 0.3 -0.7Eurozone 1.5 0.3 1 3 2.2 2.4China 3.1 0.8 3 5.9 2 -0.1India 13.2 10.9 5 7 6.7 5.2OECD 1.5 0.1 1 3 2.2 2.8
Industrial Output (annual % change) US 7 -2.9 -11.3 1.5 3 -3.7Japan 15.4 -21.3 -3.3 2.8 4.4 -6.3Eurozone 8.9 -3.7 -12.4 1.3 3.9 0.4China 15.7 11 12.9 17.4 15.4 9.9India 2.5 18 0.5 7.6 10.3 2.1OECD 7.9 -12.3 -2.1 3.3 3.8 -2.2
Interest rates (%) US 0.1 0.1 0.1 4.3 6.3 1.3Japan 0.3 0.3 0.3 0.8 0.4 0.1Eurozone 1.8 1.8 3 5 4.5 4.3China 3.3 2.8 2.8 3.3 3.3 3.2India (repo rate ) 6.3 4.8 6.5 7.8 7.3 8.5
Money Supply (annual % change) US 3.4 3.5 10 6.1 5.9 10.5Japan 2.3 3.1 1.8 2.1 0.7 3.3Eurozone 1.7 -0.4 7.6 11.6 10 8.0China 19.7 27.7 17.8 16.7 16.9 14.4India 19.1 17.7 19.9 22.8 19.3 13.6
Equity Index (end of period) US (Dow Jones) 11578 10428 8776 13265 12463 10022India (Sensex) 20509 17464 9647 20287 13787 3262
OECD indicators (annual % change) OECD total monetary aggr. & comp. broad money index 3.2 6.7 8.9 8.5 7.3 9.2OECD Total PPI Economic Activities 2.0Domestic Manufacturing 3.8 -4 6.8 3.2 3.7 4.9OECD Total CPI OECD Groups Total Energy 7.8 -10.4 12.4 4 9.3 -0.8OECD Total Registration of Passenger Cars 0.5 -5.4 -7.9 -0.6 0.1
US ISM Manufacturing Index 58.5 56.4 33.3 49 52 45.3US auto sales (YoY % change) 11.1 15.1 -35.6 -2.9 -3.6 5.6US pending home sales (YoY % change) -3.3 9.2 5.7 -23.9 -6.3 -
Note: Interest rates mentioned are central Bank discount rate. For India, interest rates mentioned are repo ratesSource: OECD, IMF, CPM Gold Yearbook, World Bank, Various Central Banks, BSE, NYSE
Top 10 aluminum-producing companies in 2010 ('000 tonnes) Company Rank OutputUnited Co. Rusal 1 4,083Rio Tinto Alcan Inc. 2 3,790Alcoa Inc. 3 3,444Aluminum Corp. of China 4 2,940Norsk Hydro ASA 5 1,505BHP Billiton Ltd. 6 1,242Dubai Aluminium Co. 7 1,170China Power Investment Co. 8 957Aluminium Bahrain BSC 9 864Shandong Xinfa Aluminum and Electricity Group 10 862
Source: CRU
A PwC & MCX Joint Endeavour 101www.mcxindia.com / www.pwc.com/in/en
DATABANK - NON-AGRI COMMODITIES
074-177_CYIB_2011_Non-Agri_Final.indd 101074-177_CYIB_2011_Non-Agri_Final.indd 101 1/18/2012 11:45:48 PM1/18/2012 11:45:48 PM

EDITORIALSPROLOGUE INDIAN ECONOMYEXPERTS' VIEWS
Aluminium pricesMonth MCX futures price (Rs./kg)^ MCX spot price (Rs/kg) LME 3-month price (USD/tonne) L Open High Low Close Monthly average Open High Low Close Dec-10 104.40 111.40 101.65 110.50 106.15 2285.00 2488.00 2253.00 2470.00 Nov-10 105.80 110.10 100.75 103.25 104.83 2360.00 2500.00 2185.00 2275.00 Oct-10 104.70 107.95 101.20 102.05 104.05 2337.00 2459.00 2273.50 2344.00 Sep-10 97.05 104.10 96.60 103.90 99.89 2048.00 2354.00 2048.00 2351.00 Aug-10 99.90 103.20 93.15 95.95 98.23 2165.00 2249.00 1982.25 2058.00 Jul-10 91.55 99.10 90.45 98.85 93.41 1961.00 2175.25 1921.75 2175.00 Jun-10 94.25 94.65 85.90 89.95 89.88 2031.00 2043.00 1828.00 1977.50 May-10 99.10 99.70 89.85 94.40 94.03 2237.00 2239.00 1950.00 2043.00 Apr-10 103.95 109.20 92.90 96.80 103.56 2325.00 2494.00 2110.00 2255.00 Mar-10 97.60 103.70 97.10 103.45 100.53 2150.00 2343.00 2112.00 2323.00 Feb-10 95.50 98.95 91.60 94.75 94.81 2086.00 2179.00 1967.50 2134.00 Jan-10 104.25 108.50 94.10 95.55 102.52 2248.00 2394.00 2069.00 2079.00 Dec-09 94.85 106.30 94.50 103.05 101.71 2057.00 2305.00 2051.00 2230.00 Nov-09 89.75 95.40 88.30 93.25 90.56 1908.00 2095.00 1882.00 2058.00 Oct-09 89.60 93.40 83.95 89.15 87.85 1885.00 2030.00 1776.00 1908.00 Sep-09 91.00 93.90 82.55 89.10 89.23 1878.00 1978.00 1778.00 1890.00 Aug-09 91.45 99.45 88.40 91.85 93.57 1889.00 2115.00 1840.00 1899.50 Jul-09 77.95 90.40 75.45 89.75 80.69 1630.00 1914.75 1545.00 1890.00 Jun-09 68.15 80.75 67.55 77.20 75.54 1440.00 1701.00 1440.00 1630.00 May-09 75.25 77.60 64.65 65.40 70.90 1499.00 1605.00 1383.00 1440.00 Apr-09 71.00 78.90 68.10 70.40 71.44 1395.00 1555.00 1350.00 1494.00 Mar-09 67.70 73.95 66.05 69.50 68.61 1335.00 1492.00 1292.25 1392.00 Feb-09 65.10 70.95 62.20 65.50 65.96 1349.00 1479.00 1279.00 1342.00 Jan-09 74.40 78.75 63.15 64.30 69.28 1525.00 1648.00 1316.50 1349.00 Dec-08 87.45 88.50 67.40 70.80 72.42 1770.00 1787.00 1430.50 1540.00 Nov-08 101.00 102.45 84.75 84.85 91.03 2076.00 2130.00 1744.00 1772.00 Oct-08 114.80 114.80 91.50 97.05 102.66 2442.00 2450.00 1925.00 2040.00 Sep-08 119.40 120.45 110.50 112.35 115.01 2723.00 2725.00 2404.85 2425.00 Aug-08 125.30 125.70 115.50 117.45 118.74 2971.00 2975.00 2714.00 2714.00 Jul-08 132.00 144.20 122.70 124.35 131.79 3119.00 3380.15 2928.25 2979.00 Jun-08 122.85 136.90 121.10 132.00 126.80 2935.00 3169.00 2859.00 3114.00 May-08 115.00 130.40 114.55 122.75 122.06 2930.00 3071.00 2828.00 2931.00 Apr-08 117.00 123.40 114.05 117.05 118.28 2990.00 3133.00 2875.00 2907.00 Mar-08 124.80 130.25 112.25 117.30 121.40 3095.00 3255.00 2805.00 2990.00 Feb-08 105.50 125.50 102.30 123.20 110.16 2708.00 3160.25 2591.00 3106.00 Jan-08 94.25 104.60 93.25 104.05 96.00 2410.00 2717.00 2377.00 2710.00 Dec-07 98.90 98.90 92.55 92.60 94.05 2512.00 2512.00 2393.00 2409.00 Nov-07 99.30 103.25 96.40 97.80 98.92 2545.00 2661.00 2472.00 2500.00 Oct-07 99.30 100.20 94.15 97.85 96.47 2512.00 2573.00 2376.00 2545.00 Sep-07 103.60 103.60 93.65 96.85 96.71 2550.00 2550.00 2375.00 2520.00 Aug-07 110.85 110.85 99.85 102.30 102.66 2744.00 2760.00 2450.00 2544.00 Jul-07 111.10 113.90 105.60 109.15 110.31 2725.00 2870.00 2712.00 2751.00 Jun-07 113.20 114.10 107.65 109.45 109.24 2790.00 2829.00 2657.75 2725.00 May-07 118.05 119.40 108.30 111.25 114.09 2853.00 2927.00 2745.00 2790.00 Apr-07 121.30 127.50 112.30 116.75 118.89 2789.50 2932.00 2734.75 2860.00 Mar-07 125.20 126.45 117.30 121.60 121.52 2838.00 2856.75 2664.00 2780.00 Feb-07 123.75 130.50 116.50 127.95 124.99 2730.00 2905.00 2614.00 2815.00 Jan-07 125.75 131.65 114.60 124.75 124.38 2802.00 2847.00 2550.00 2730.00 Dec-06 122.20 127.80 122.20 126.05 125.56 2732.00 2875.00 2727.00 2803.00 Nov-06 129.80 129.80 115.90 120.25 121.16 2788.00 2848.00 2566.00 2738.00 Oct-06 118.35 128.70 113.00 125.05 120.89 2581.00 2835.00 2440.75 2790.00 Sep-06 116.00 121.85 109.00 116.95 114.27 2495.00 2687.00 2405.00 2584.00 Aug-06 118.70 119.50 110.00 112.65 114.55 2553.00 2595.25 2440.00 2505.00 Jul-06 121.80 125.00 111.30 116.25 116.65 2625.00 2710.00 2449.85 2570.00 Jun-06 126.50 126.80 107.00 117.60 114.16 2670.00 2687.00 2413.00 2630.00 May-06 133.20 151.45 116.80 125.15 129.33 2768.00 3310.00 2644.00 2650.00 Apr-06 113.10 144.00 111.50 123.85 117.71 2456.00 2845.00 2446.00 2755.00
Note: Future prices are for near month continuous futures contract; ^ till Feb 2009, prices are for 2MT contract, later 5 MT contractSource: Exchanges’ websites, RBI
Commodity Insights Yearbook 2011102
074-177_CYIB_2011_Non-Agri_Final.indd 102074-177_CYIB_2011_Non-Agri_Final.indd 102 1/18/2012 11:45:49 PM1/18/2012 11:45:49 PM

DATABANK - AGRI COMMODITIES
LME cash (USD/tonne) RBI rate - USD/INR SHFE futures price (Yuan/tonne) CNY/INR spot Dollar IndexMonthly average Open High Low Close Monthly average
0 2356.67 45.16 15860.00 16500.00 15840.00 16430.00 6.79 80.300 2324.05 45.02 16270.00 16795.00 15300.00 15860.00 6.76 78.450 2342.18 44.41 15600.00 16500.00 15600.00 16135.00 6.66 77.720 2171.24 46.06 15330.00 15705.00 15185.00 15590.00 6.83 81.350 2110.44 46.57 15360.00 15510.00 15000.00 15220.00 6.86 82.220 1989.05 46.84 14500.00 15320.00 14100.00 15165.00 6.91 83.430 1929.41 46.56 14830.00 14990.00 13750.00 14490.00 6.83 86.770 2044.71 45.80 15890.00 15890.00 14500.00 14985.00 6.72 85.480 2314.28 44.50 16210.00 16715.00 15350.00 15880.00 6.52 81.350 2210.53 45.50 16530.00 16630.00 16020.00 16220.00 6.66 80.810 2053.27 46.33 15995.00 16790.00 15675.00 16400.00 6.78 80.270 2230.11 45.96 16620.00 18010.00 15705.00 15900.00 6.73 77.980 2181.26 46.63 15400.00 16850.00 15300.00 16700.00 6.83 77.000 1956.55 46.59 14930.00 15580.00 14820.00 15315.00 6.83 75.400 1875.66 46.72 15000.00 15210.00 14620.00 15065.00 6.84 76.170 1835.60 48.39 15000.00 15370.00 13880.00 14825.00 7.09 77.190 1927.64 48.36 15100.00 15390.00 14250.00 14980.00 7.08 78.530 1670.56 48.47 13550.00 15180.00 13500.00 15005.00 7.09 79.710 1579.63 47.78 12850.00 13850.00 12850.00 13555.00 6.99 80.260 1466.67 48.61 13000.00 13100.00 12670.00 12800.00 7.12 82.110 1431.81 50.08 13550.00 14900.00 12560.00 12825.00 7.34 85.550 1338.08 51.23 12000.00 13720.00 11885.00 13495.00 7.50 86.710 1338.06 49.22 11760.00 12560.00 11610.00 12045.00 7.21 86.840 1420.36 48.83 12120.00 12690.00 11405.00 11715.00 7.14 84.830 1504.42 48.64 12450.00 12600.00 10040.00 11520.00 7.11 83.650 1857.13 49.00 13960.00 14065.00 12510.00 12565.00 7.18 86.770 2122.03 48.64 14635.00 14635.00 13020.00 13780.00 7.12 83.530 2524.15 45.56 17440.00 17450.00 14930.00 15245.00 6.67 78.370 2762.56 42.94 18750.00 18820.00 17200.00 17450.00 6.28 76.210 3067.46 42.84 18735.00 19500.00 18340.00 18820.00 6.26 72.790 2967.87 42.82 18460.00 19020.00 18400.00 18735.00 6.22 73.410 2908.28 42.13 18500.00 19200.00 18120.00 18465.00 6.04 73.050 2968.03 40.02 19000.00 19200.00 18505.00 18545.00 5.72 72.380 3012.05 40.36 19650.00 20900.00 18700.00 19180.00 5.70 72.720 2784.89 39.73 18750.00 19850.00 18590.00 19760.00 5.55 75.770 2456.13 39.37 17780.00 19600.00 17700.00 19440.00 5.43 76.000 2382.83 39.44 17820.00 18490.00 17500.00 17820.00 5.35 76.790 2507.15 39.44 17820.00 18600.00 16710.00 17750.00 5.32 75.670 2444.53 39.51 19230.00 19260.00 17740.00 17880.00 5.27 77.780 2394.96 40.34 19450.00 19460.00 19200.00 19380.00 5.36 79.140 2512.60 40.82 19680.00 19750.00 18990.00 19440.00 5.38 80.870 2738.09 40.42 19850.00 20260.00 19500.00 19730.00 5.34 80.610 2681.31 40.77 20470.00 20600.00 19610.00 19830.00 5.34 82.210 2804.60 40.78 20700.00 21650.00 20050.00 20250.00 5.32 82.010 2817.05 42.15 19290.00 20490.00 19110.00 20330.00 5.46 81.950 2757.08 44.03 19750.00 19800.00 19260.00 19310.00 5.68 83.170 2839.05 44.16 19900.00 20220.00 19520.00 19730.00 5.69 84.280 2799.06 44.33 21000.00 21090.00 19590.00 19730.00 5.69 84.580 2823.67 44.63 20970.00 21390.00 20680.00 21320.00 5.70 83.070 2702.14 44.85 19950.00 21730.00 19810.00 20770.00 5.70 84.720 2657.15 45.47 21400.00 21810.00 19960.00 20210.00 5.75 86.110 2484.38 46.12 19500.00 22360.00 19500.00 20980.00 5.81 85.250 2461.55 46.54 18600.00 19880.00 18470.00 19580.00 5.84 84.910 2511.83 46.46 19690.00 19780.00 18200.00 18590.00 5.82 85.610 2490.95 46.06 20950.00 21250.00 19340.00 19640.00 5.75 85.370 2852.07 45.41 21640.00 24000.00 20710.00 21150.00 5.66 84.690 2623.86 44.95 19580.00 21570.00 19550.00 20810.00 5.61 88.13
A PwC & MCX Joint Endeavour 103www.mcxindia.com / www.pwc.com/in/en
DATABANK - NON-AGRI COMMODITIES
074-177_CYIB_2011_Non-Agri_Final.indd 103074-177_CYIB_2011_Non-Agri_Final.indd 103 1/18/2012 11:45:49 PM1/18/2012 11:45:49 PM

EDITORIALSPROLOGUE INDIAN ECONOMYEXPERTS' VIEWS
Aluminium trading activityMonth MCX^ LME* SHFE
Volume Open Interest Volume Open Interest Volume Open InterestDec-10 180925 3863 4028428 1071653 1072972 237290Nov-10 157945 2408 3901637 1067157 4509448 243418Oct-10 198505 3201 4600566 1069746 2609926 330720Sep-10 196137 3692 3673819 1035983 1888954 266578Aug-10 188267 3727 4032057 1023922 2525310 267858Jul-10 154011 2480 3309617 1082351 1662140 254604Jun-10 136118 2223 3860352 1121739 2563106 249332May-10 129929 1742 3831007 1091962 2452674 275958Apr-10 155525 4362 3879284 1098566 2527774 289628Mar-10 117165 1918 3747097 1078060 2467220 293358Feb-10 113419 2063 3675790 1056236 2603262 324690Jan-10 138235 2317 3503574 1054655 6936394 350384Dec-09 90944 2489 3725214 1018934 3565428 353256Nov-09 45088 1340 3320250 1029551 1730312 247592Oct-09 66485 1803 3641614 1032343 1400168 257310Sep-09 71809 2095 3651341 1072174 1961336 227858Aug-09 126281 1886 3990521 1091170 6071864 279162Jul-09 66266 2364 4327427 1137912 2707210 332978Jun-09 69241 2843 4867402 1142756 2092862 235446May-09 20439 2719 3925063 1175347 1378218 261164Apr-09 19288 1362 3376429 1067912 4981448 313696Mar-09 12510 936 4402706 1079402 3562884 315454Feb-09 9048 469 3237977 1185393 4025304 206854Jan-09 13079 844 3961127 1144486 5407652 204064Dec-08 12505 1047 3891582 1147244 8998316 218308Nov-08 5683 311 4105974 1222411 3116358 230090Oct-08 5177 296 4164090 1141838 5765682 175042Sep-08 6624 629 4451799 1131953 1632002 143888Aug-08 6900 451 3417584 1083517 875690 127142Jul-08 15815 656 4374429 1059868 1294954 145812Jun-08 5284 455 3922624 1071871 629052 142952May-08 6797 482 3605668 1070780 834904 155630Apr-08 4243 476 4066376 1058685 965516 183126Mar-08 13706 516 3436546 1098363 2784906 236440Feb-08 12397 752 4270510 1085193 1213886 206642Jan-08 16673 882 4284300 1077327 594998 104892Dec-07 5746 1260 2721137 1002937 539118 86032Nov-07 13924 1448 3794448 983972 956700 104408Oct-07 21255 1821 3344147 948194 493336 137620Sep-07 22316 1673 3238107 911348 249952 118706Aug-07 14390 1540 3984265 602112 426996 117186Jul-07 15098 1326 2828592 554239 497166 101156Jun-07 24668 1409 3127698 552443 512580 129698May-07 32568 3376 2663584 541715 1047936 127224Apr-07 27444 2499 3163817 546539 1378792 143506Mar-07 74211 1172 3187580 517799 659546 132196Feb-07 30987 1141 3624835 518625 598492 151094Jan-07 24888 1350 3727477 512739 1742964 145130Dec-06 16114 1242 2745285 509113 1124100 154058Nov-06 19143 1298 3600751 528264 2898718 155678Oct-06 13345 781 3309058 534894 2797230 190772Sep-06 25935 450 2802510 527105 3581738 221444Aug-06 15608 708 2775342 510197 1403808 194320Jul-06 14583 526 2428054 528311 1403150 179538Jun-06 15868 1844 2667079 535014 2275784 159588May-06 37094 2187 2975539 542297 3196230 226270Apr-06 24303 1246 3073930 540079 3249358 244188
Note: Vol and OI in lots; Aggregate volume in all contracts during the month; Cumulative open interest in all contracts at the month-end; ^ inlcudes both major contract and mini contract; * LME Aluminium Futures Total Market OI (includes member as well as client positions) & LME Aluminium Futures Volume Total.Source: Exchanges’ websites
Commodity Insights Yearbook 2011104
074-177_CYIB_2011_Non-Agri_Final.indd 104074-177_CYIB_2011_Non-Agri_Final.indd 104 1/18/2012 11:45:50 PM1/18/2012 11:45:50 PM

DATABANK - AGRI COMMODITIES
Others34%
China39%China
41%United States11%
Canada7%
Others36%
Russia9%
United States4%
Germany5%
Japan5%
Australia 5%
India4%
Aluminium Mine Production (2010e) Refined Aluminium Consumption (2010)
Source: USGS; e estimates Source: GFMS, IAI, WBMS
LME Aluminium Prices and U.S. & China Industrial Production YoY
Source: LME & respective govt. websites IP - Industrial Production
40
30
20
10
0
-10
-20
-30
3500
3000
2500
2000
1500
1000
500
0
LME Prices ( USD tonne ) -RHS US IP YOY China IP YOY
in % Prices
Jun-
87Fe
b-88
Oct-8
8Ju
n-89
Feb-
90Oc
t-90
Jun-
91Fe
b-92
Oct-9
2Ju
n-93
Feb-
94Oc
t-94
Jun-
95Fe
b-96
Oct-9
6Ju
n-97
Feb-
98Oc
t-98
Jun-
99Fe
b-00
Oct-0
0Ju
n-01
Feb-
02 O
ct-0
2Ju
n-03
Feb-
04Oc
t-04
Jun-
05Fe
b-06
Oct-0
6Ju
n-07
Feb-
08Oc
t-08
Jun-
09Fe
b-10
Oct-1
0
3
2
2
1
1
5
0
LME Prices ( USD tonne ) RHS US IP YOY China IP YOY
87 88 88 89 90 90 91 92 92 93 94 94 95 96 96 97 98 98 99 00 00 01 02 02 03 04 04 05 06 06 07 08 08 09 10 10
A PwC & MCX Joint Endeavour 105www.mcxindia.com / www.pwc.com/in/en
DATABANK - NON-AGRI COMMODITIES
074-177_CYIB_2011_Non-Agri_Final.indd 105074-177_CYIB_2011_Non-Agri_Final.indd 105 1/18/2012 11:45:51 PM1/18/2012 11:45:51 PM

EDITORIALSPROLOGUE INDIAN ECONOMYEXPERTS' VIEWS
Copper fundamentals (`000 tonne) 2010 2009 2008 2007 2006 2001
Global
World mine production 16116 15954 15547 15483 14990 13632World mine capacity 19898 19523 18740 18111 17174 14418Mine capacity utilization (%) 81 82 83 85.5 87.3 94.5Primary refined production 15725 15439 15403 15191 14678 13748Secondary refined production 3356 2839 2823 2743 2613 1846World refinery production (secondary + primary) 19081 18278 18226 17934 17291 15594World refinery capacity 23908 23625 22723 21784 20555 17659Refineries capacity utilization (%) 80 77 80 82 84 88World refined usage 19327 18090 18039 18197 17034 14903Refined stocks - end of period 1289 1433 1159 1028 1132 1992Period stock change -145 274 132 -105 265 702
China
Mine production 1150 995 960 946 889 605Refined production 4570 4100 3800 3500 3000 1518Refined consumption 7250 6400 5130 4880 3690 1875Refined copper imports 229 244 212 112 96 115Refined copper exports 10 13 1 7 3 3
India
Mine production 35 31 31 34 27 32Refined production 650 717 680 718 625 233Refined consumption 635 570 507 510 400 265Copper and copper products imports 207 220 227 193 278 132Copper and copper products exports 304 279 416 450 356 63
Inventory levels - year-end
LME 377.6 502.4 339.8 197.5 182.8 798.7SHFE 131.9 95.3 15.3 25.6 31.3 - Average daily volatility (MCX spot prices) 1.70% 1.90% 3.30% 2.50% 2.20% -Source: Ministry of Mines, ICSG, DGCIS, USGS, GFMS Copper Survey 2009, base metal report, LME, SHFE, MCX, ICA
Global refined production - break-up ('000 tonne) 2010 2009 2008 2007 2006
Primary from concentrate 12384 12913 12250 12141 11934Primary SX-EW 3341 3314 3157 3060 2749Secondary 3356 2839 2823 2743 2613Total refined production 19081 18278 18226 17934 17291Source: GFMS Copper Survey 2010, 2011, ICSG
Intensity of copper use Country 2010 2008 Rank Intensity of Use Rank Intensity of Use
China 1 0.79 5 0.41South Korea 2 0.7 1 0.66Germany 3 0.48 3 0.51Japan 4 0.27 4 0.49Brazil 5 0.23 8 0.12Russia 6 0.23 2 0.54India 7 0.16 7 0.12United States 8 0.13 6 0.27 Note: Intensity of use = tonnes of copper consumption per million dollars of GDP (ppp, 2005 International $) Source: GFMS Copper Survey 2011
Commodity Insights Yearbook 2011106
074-177_CYIB_2011_Non-Agri_Final.indd 106074-177_CYIB_2011_Non-Agri_Final.indd 106 1/18/2012 11:45:53 PM1/18/2012 11:45:53 PM

DATABANK - AGRI COMMODITIES
Top 5 copper (refined) producing countries ('000 tonne)Country 2010 2009 2008 2007 2006China 4573 4110 3779 3497 3003Chile 3240 3272 3058 2936 2811Japan 1549 1440 1540 1577 1532United States 1089 1161 1280 1311 1250Russia 892 874 862 949 951
Source: GFMS, ICSG
Top 5 copper (refined) consuming countries ('000 tonne)Country 2010 2009 2008 2007 2006China 7249 6409 5132 4882 3688United States 1663 1502 1945 2146 2168Germany 1304 1144 1390 1407 1416Japan 1060 876 1185 1247 1282South Korea 919 891 819 838 831
Source: GFMS, ICSG
Top 10 copper refineries by capacity, 2010 ('000 tonne)Rank Refinery Country Process Capacity 1 Guixi China Electrolytic 9002 Yunnan Copper China Electrolytic 5002 Birla India Electrolytic 5004 Chuquicamata Refinery Chile Electrolytic 4905 Codelco Norte (SX-EW) Chile Electrowinning 4706 Toyo/Niihama (Besshi) Japan Electrolytic 4506 Amarillo United States Electrolytic 4508 El Paso (refinery) United States Electrolytic 4159 Jinchuan China Electrolytic 40010 Las Ventanas Chile Electrolytic 400
Source: The World Copper Factbook, 2010, ICSG
Top 10 copper smelters by capacity, 2010 ('000 tonne) Rank Smelter Country Process Capacity 1 Guixi (smelter) China Outokumpu Flash 9002 Birla Copper (Dahej) India Outokumpu Flash, Ausmelt, 500 Mitsubishi Continuous3 Codelco Norte (smelter) Chile Outokumpu/ Teniente Converter 4604 Saganoseki/ Ooita (smelter) Japan Outokumpu Flash 4504 Hamburg Germany Outokumpu, Contimelt, Electric 4504 Besshi/ Ehime (Toyo) Japan Outokumpu Flash 4507 Norilsk (Nikelevy, Medny) Russia Reverb, Electric, Vanyukov 4007 Jinchuan (smelter) China Reverberatory/ Kaldo Conv. 4007 El Teniente (Caletones) Chile Reverberatory/ Teniente Conv. 40010 Altonorte (La Negra) Chile Noranda Continuous 390
Source: The World Copper Factbook, 2010, ICSG
Top 10 copper mines by capacity, 2010 ('000 tonne)Rank Mine Country Source Capacity 1 Escondida Chile Concs & SX-EW 1,3002 Codelco Norte (includes Chuquicamata, Chile Concs & SX-EW 920 Radomiro Tomic, Mina Ministro Hales project)3 Grasberg Indonesia Concentrates 7804 Collahuasi Chile Concs & SX-EW 5205 El Teniente Chile Concs & SX-EW 4546 Taimyr Peninsula (Norilsk/ Talnakh Russia Concentrates 4307 Antamina Peru concentrates 4007 Los Pelambres Chile concentrates 4009 Morenci United States Concs & SX-EW 39010 Bingham Canyon United States Concentrates 28010 Batu Hijau Indonesia Concentrates 28010 Andina Chile concentrates 280
Source: The World Copper Factbook, 2010, ICSG
A PwC & MCX Joint Endeavour 107www.mcxindia.com / www.pwc.com/in/en
DATABANK - NON-AGRI COMMODITIES
074-177_CYIB_2011_Non-Agri_Final.indd 107074-177_CYIB_2011_Non-Agri_Final.indd 107 1/18/2012 11:45:53 PM1/18/2012 11:45:53 PM

EDITORIALSPROLOGUE INDIAN ECONOMYEXPERTS' VIEWS
Economic parameters impacting copper prices 2010 2009 2008 2007 2006 2001
Real GDP (annual % change)
US 2.8 -2.6 1.1 2 2.9 0.8
Japan 4.3 -6.3 -0.3 1.9 2.8 0.7
Eurozone 1.8 -4.1 1 2.3 2.6 1.9
China 10.3 9.2 9 11.5 11.1 8.3
India 9.7 5.7 7.3 8.9 9.7 3.9OECD 2.8 -3.4 1 2.6 3.2 2.4
Consumer Price Inflation (annual % change)
US 1.6 -0.3 1 2.5 2.7 2.8
Japan -0.9 -1.4 0.5 1.4 0.3 -0.7
Eurozone 1.5 0.3 1 3 2.2 2.4
China 3.1 0.8 3 5.9 2 -0.1
India 13.2 10.9 5 7 6.7 5.2OECD 1.5 0.1 1 3 2.2 2.8
Industrial Output (annual % change)
US 7 -2.9 -11.3 1.5 3 -3.7
Japan 15.4 -21.3 -3.3 2.8 4.4 -6.3
Eurozone 8.9 -3.7 -12.4 1.3 3.9 0.4
China 15.7 11 12.9 17.4 15.4 9.9
India 2.5 18 0.5 7.6 10.3 2.1OECD 7.9 -12.3 -2.1 3.3 3.8 -2.2
Interest rates (%)
US 0.1 0.1 0.1 4.3 6.3 1.3
Japan 0.3 0.3 0.3 0.8 0.4 0.1
Eurozone 1.8 1.8 3 5 4.5 4.3
China 3.3 2.8 2.8 3.3 3.3 3.2India (repo rate ) 6.3 4.8 6.5 7.8 7.3 8.5
Money Supply (annual % change)
US 3.4 3.5 10 6.1 5.9 10.5
Japan 2.3 3.1 1.8 2.1 0.7 3.3
Eurozone 1.7 -0.4 7.6 11.6 10 8.0
China 19.7 27.7 17.8 16.7 16.9 14.4India 19.1 17.7 19.9 22.8 19.3 13.6
Equity Index (end of period)
US (Dow Jones) 11578 10428 8776 13265 12463 10022India (Sensex) 20509 17464 9647 20287 13787 3262
OECD indicators (annual % change)
OECD total monetary aggr. & comp.
broad money index 3.2 6.7 8.9 8.5 7.3 9.2
OECD Total PPI Economic Activities
Domestic Manufacturing 3.8 -4 6.8 3.2 3.7 2.0
OECD Total CPI OECD Groups Total Energy 7.8 -10.4 12.4 4 9.3 4.9
OECD Total Registration of Passenger Cars 0.5 -5.4 -7.9 -0.6 0.1 -0.8
US ISM Manufacturing Index 58.5 56.4 33.3 49 52 45.3
US auto sales (YoY % change) 11.1 15.1 -35.6 -2.9 -3.6 5.6
US pending home sales (YoY % change) -3.3 9.2 5.7 -23.9 -6.3 -
Note: Interest rates mentioned are central Bank discount rate. For India, interest rates mentioned are repo ratesSource: OECD, IMF, CPM Gold Yearbook, World Bank, Various Central Banks, BSE, NYSE
Commodity Insights Yearbook 2011108
074-177_CYIB_2011_Non-Agri_Final.indd 108074-177_CYIB_2011_Non-Agri_Final.indd 108 1/18/2012 11:45:54 PM1/18/2012 11:45:54 PM

DATABANK - AGRI COMMODITIES
Copper trading activityMonth MCX LME* SHFE Volume Open Interest Volume Open Interest Volume Open InterestDec-10 2305344 38829 2837677 464737 6049322 373124Nov-10 2417831 28734 2780784 461076 8704278 289322Oct-10 2327883 35092 2371973 447390 4467320 311294Sep-10 2306182 41272 2402259 450372 5164564 289864Aug-10 2975270 38246 2142723 432963 9552704 345178Jul-10 3129047 50254 2374180 438893 11106234 392028Jun-10 3161226 29708 2580490 421306 11801920 355042May-10 2541672 27416 2523693 421788 11663074 372684Apr-10 2229657 25439 2133990 419473 7472162 347226Mar-10 2706875 28860 2677258 425778 9127818 387756Feb-10 3006321 19109 2572386 414528 6443898 398950Jan-10 2233714 26301 2267628 403863 8460164 386270Dec-09 1840574 31609 1902413 403734 7038264 302750Nov-09 2138686 30367 2020273 421021 7397160 357234Oct-09 2293803 25854 2064646 408826 6620316 336118Sep-09 2549646 24337 2032421 401290 12722510 305826Aug-09 3130380 24446 1986494 402269 15452970 374320Jul-09 2940752 33729 1960979 400338 19918484 448700Jun-09 3148890 21583 2165255 401240 15306970 426042May-09 2672464 26146 1870927 399933 13410360 404172Apr-09 2692519 20413 2350852 406387 17493624 402338Mar-09 2175657 18590 2284177 411286 13334674 439066Feb-09 1877051 15178 1702722 481490 8621472 324534Jan-09 2141842 25082 2314469 491820 6108054 266182Dec-08 1495127 22176 1908795 486962 8676564 343614Nov-08 1847627 11984 2546098 550760 5197084 262170Oct-08 1694342 14105 3004252 521086 2353198 159046Sep-08 1044217 14983 2619189 496407 3274924 205972Aug-08 920891 9315 1863668 463749 2815716 177792Jul-08 914542 11792 2248126 450061 1313756 128874Jun-08 769001 16182 1828570 450316 1589422 146068May-08 896748 10514 1724399 444647 1747730 160086Apr-08 1032376 11164 2004746 467061 2037268 149586Mar-08 1007753 9144 1960112 486002 3049558 154856Feb-08 1378689 13275 2231546 497810 2665180 182148Jan-08 1276483 12604 2335854 481440 5158030 175908Dec-07 912928 15695 1424933 427225 5928002 183716Nov-07 1159320 10949 2165031 430963 4227808 199102Oct-07 1023183 16433 1735112 403830 1377392 131320Sep-07 1007536 13682 1674178 393590 1698136 133956Aug-07 1480144 12226 2214438 237662 3211484 138914Jul-07 1225331 15565 1713515 243282 3896062 155206Jun-07 1607857 13266 1739912 245422 3112020 126614May-07 1672952 12807 1711033 250544 2181252 115830Apr-07 1577270 10940 1661035 244262 2641610 120162Mar-07 1280007 10035 1711176 239035 1526036 117194Feb-07 1223224 11961 1538992 241525 734540 101622Jan-07 1205754 22864 1751103 239883 1146412 96362Dec-06 636579 19532 1289754 216457 610830 77744Nov-06 871936 18552 1516229 224000 701874 75848Oct-06 539737 11657 1320963 217759 304364 64456Sep-06 492788 7330 1580518 223339 1015788 70904Aug-06 572901 6606 1472340 223185 1303582 85376Jul-06 503552 4508 1238460 217765 1191158 56888Jun-06 660822 5323 1398156 225347 1252768 83430May-06 517588 7216 1706156 243177 765734 86976Apr-06 278370 6368 1785516 247115 1085446 84036
Note: Vol and OI in lots; Aggregate volume in all contracts during the month; Cumulative open interest in all contracts at the month-end. * LME Copper Futures Total Market OI (includes member as well as client positions) & LME Copper Futures Volume TotalSource: Exchanges' Websites
A PwC & MCX Joint Endeavour 109www.mcxindia.com / www.pwc.com/in/en
DATABANK - NON-AGRI COMMODITIES
074-177_CYIB_2011_Non-Agri_Final.indd 109074-177_CYIB_2011_Non-Agri_Final.indd 109 1/18/2012 11:45:54 PM1/18/2012 11:45:54 PM

EDITORIALSPROLOGUE INDIAN ECONOMYEXPERTS' VIEWS
Copper pricesMonth MCX futures price (Rs./kg) MCX spot price (Rs/kg) LME 3-month price (USD/tonne) L Open High Low Close Monthly average Open High Low Close Dec-10 388.05 439.80 387.00 439.50 413.25 8353.25 9687.00 8338.00 9600.00 Nov-10 368.50 399.40 367.70 388.05 381.40 8266.50 8966.00 7920.00 8360.00 Oct-10 362.65 382.40 359.40 369.10 369.81 8042.00 8554.00 8015.00 8200.00 Sep-10 350.00 363.65 347.80 362.15 358.52 7430.00 8075.00 7415.00 8014.00 Aug-10 338.60 352.75 329.80 348.90 340.64 7290.00 7527.00 7028.25 7440.00 Jul-10 305.00 338.70 298.60 338.35 316.28 6460.00 7310.00 6318.00 7296.50 Jun-10 318.55 320.50 284.10 301.65 301.36 6890.00 6892.00 6037.50 6515.00 May-10 330.05 330.05 296.05 319.30 315.47 7288.00 7342.00 6415.00 6939.00 Apr-10 351.75 359.00 325.40 327.00 347.68 7820.00 8043.75 7341.00 7430.00 Mar-10 338.15 355.50 332.55 351.35 340.79 7521.75 7878.00 7245.25 7790.00 Feb-10 310.50 344.40 290.90 332.50 317.67 6755.00 7450.00 6225.00 7195.00 Jan-10 343.95 354.20 311.10 311.45 339.68 7405.00 7796.00 6700.00 6745.00 Dec-09 324.30 347.15 318.10 344.00 328.57 6940.00 7423.75 6762.75 7375.00 Nov-09 308.80 325.45 300.60 322.70 311.67 6502.00 7060.00 6372.25 6930.00 Oct-09 297.80 315.40 280.80 307.95 297.10 6180.00 6732.00 5810.00 6480.00 Sep-09 308.00 319.20 286.50 297.10 301.79 6310.00 6530.00 5855.25 6159.00 Aug-09 276.25 317.15 276.20 302.60 299.65 5781.00 6549.00 5765.00 6475.00 Jul-09 242.50 278.00 234.70 276.30 253.47 4984.00 5755.00 4710.00 5719.00 Jun-09 229.85 256.75 229.85 238.30 240.68 4819.75 5388.00 4685.00 4967.00 May-09 228.20 241.75 212.65 229.20 224.96 4450.00 4848.00 4315.00 4830.00 Apr-09 206.50 242.75 202.15 222.55 225.30 4040.00 4925.00 3960.75 4431.00 Mar-09 173.50 209.45 171.50 207.10 193.60 3390.00 4168.00 3340.00 4040.00 Feb-09 157.05 177.30 153.15 171.05 164.42 3224.50 3669.00 3096.00 3449.00 Jan-09 155.00 174.65 150.85 157.65 160.27 3055.00 3610.00 3025.00 3155.00 Dec-08 189.05 191.45 138.55 152.75 150.71 3640.00 3710.00 2817.25 3070.00 Nov-08 207.50 214.75 172.50 184.05 183.84 4215.00 4435.00 3375.00 3620.00 Oct-08 303.50 305.00 188.50 206.95 234.15 6395.00 6530.00 3590.00 4099.00 Sep-08 327.45 328.40 293.30 302.20 316.15 7520.00 7520.00 6170.00 6360.00 Aug-08 342.85 343.80 302.40 331.15 323.73 8065.00 8082.00 7120.00 7510.00 Jul-08 365.80 387.35 331.55 343.55 353.54 8530.00 8940.00 7840.00 8055.00 Jun-08 335.10 371.65 330.80 368.80 347.40 7945.00 8620.00 7760.00 8510.00 May-08 332.80 361.20 331.15 336.50 347.74 8585.00 8625.00 7855.00 7935.00 Apr-08 335.10 355.50 327.05 351.20 345.20 8380.00 8880.00 8160.00 8549.00 Mar-08 335.80 353.90 310.40 335.90 338.21 8415.00 8820.00 7611.00 8390.00 Feb-08 286.55 342.35 278.15 338.95 311.64 7299.75 8570.00 7025.00 8430.00 Jan-08 265.95 292.95 265.35 287.20 277.73 6750.00 7450.00 6675.00 7350.00 Dec-07 279.50 280.60 252.35 266.00 265.21 7050.00 7075.00 6317.00 6675.00 Nov-07 302.80 304.25 251.65 275.55 272.67 7760.00 7774.75 6430.00 7000.00 Oct-07 317.85 327.65 300.10 302.35 314.47 8025.50 8315.00 7645.00 7725.00 Sep-07 304.55 321.30 289.60 317.75 306.55 7480.00 8155.00 7085.00 8020.00 Aug-07 322.50 322.50 281.30 308.10 302.11 7980.25 7985.00 6730.00 7460.00 Jul-07 314.75 332.05 311.55 322.80 319.77 7580.00 8212.00 7550.00 8010.00 Jun-07 305.00 315.05 292.05 310.25 304.17 7455.00 7695.00 7050.00 7560.00 May-07 333.50 345.60 287.55 305.30 314.06 7760.00 8335.00 6952.00 7380.00 Apr-07 303.05 343.15 299.65 322.30 325.47 6900.00 8100.00 6807.00 7761.00 Mar-07 272.90 305.00 260.75 302.70 282.28 6100.00 6935.00 5796.00 6860.00 Feb-07 256.70 282.80 235.00 266.80 253.10 5760.00 6374.00 5250.00 6015.00 Jan-07 285.60 286.55 246.60 256.20 255.33 6300.00 6344.00 5430.00 5735.00 Dec-06 320.15 327.40 283.20 285.60 298.94 7095.00 7229.25 6250.00 6330.00 Nov-06 336.85 338.60 296.65 312.80 313.39 7420.00 7500.25 6645.00 7080.00 Oct-06 351.55 361.50 327.65 336.55 341.78 7602.00 7890.00 7002.00 7380.00 Sep-06 358.50 375.45 335.65 352.90 351.78 7615.00 8110.00 7150.00 7545.00 Aug-06 348.40 360.05 347.00 356.05 360.01 7800.00 8150.00 7180.00 7700.00 Jul-06 343.90 383.25 333.90 363.50 360.16 7475.00 8210.00 7000.00 7950.00 Jun-06 371.50 374.00 291.00 351.75 337.15 7915.00 8010.00 6410.00 7320.00 May-06 328.40 397.85 325.00 373.30 361.81 7240.00 8800.00 7060.00 7900.00 Apr-06 242.45 343.00 242.45 322.35 284.15 5405.00 7385.00 5390.00 6990.00
Note: Future prices are for near month continuous futures contract Source: Exchanges' websites, ICE, RBI
Commodity Insights Yearbook 2011110
074-177_CYIB_2011_Non-Agri_Final.indd 110074-177_CYIB_2011_Non-Agri_Final.indd 110 1/18/2012 11:45:54 PM1/18/2012 11:45:54 PM

DATABANK - AGRI COMMODITIES
LME cash (USD/tonne) RBI rate - USD/INR SHFE futures price (Yuan/tonne) CNY/INR spot Dollar IndexMonthly average Open High Low Close Monthly average
0 9147.26 45.16 62700.00 71000.00 62600.00 70440.00 6.79 80.300 8469.89 45.02 62750.00 68970.00 61000.00 62060.00 6.76 78.450 8292.40 44.41 60000.00 67460.00 60000.00 62750.00 6.66 77.720 7709.30 46.06 58960.00 61100.00 57620.00 59920.00 6.83 81.350 7283.95 46.57 56750.00 59450.00 56250.00 58680.00 6.86 82.220 6735.25 46.84 52200.00 56450.00 51610.00 56190.00 6.91 83.430 6499.30 46.56 54560.00 54790.00 49300.00 52160.00 6.83 86.770 6837.68 45.80 58050.00 58070.00 52000.00 55470.00 6.72 85.480 7745.08 44.50 60990.00 63130.00 57360.00 58400.00 6.52 81.350 7462.83 45.50 60690.00 61400.00 57220.00 60890.00 6.66 80.810 6848.18 46.33 55100.00 58920.00 51610.00 57800.00 6.78 80.270 7386.25 45.96 59400.00 63000.00 55500.00 56240.00 6.73 77.980 6981.71 46.63 54350.00 60380.00 53330.00 59440.00 6.83 770 6675.60 46.59 50210.00 55000.00 50100.00 54210.00 6.83 75.40 6287.98 46.72 49320.00 51580.00 48400.00 51100.00 6.84 76.170 6196.43 48.39 49100.00 50930.00 46000.00 47680.00 7.09 77.190 6165.30 48.36 46920.00 51490.00 45940.00 49860.00 7.08 78.530 5215.54 48.47 40500.00 45520.00 38820.00 45260.00 7.09 79.710 5013.95 47.78 38400.00 43000.00 37500.00 40710.00 6.99 80.260 4568.63 48.61 38850.00 40720.00 35100.00 37400.00 7.12 82.110 4406.55 50.08 34450.00 45000.00 34420.00 37280.00 7.34 85.550 3749.75 51.23 28540.00 35810.00 27400.00 34140.00 7.50 86.710 3314.73 49.22 26400.00 30200.00 25400.00 28640.00 7.21 86.840 3220.69 48.83 26080.00 30100.00 25900.00 26370.00 7.14 84.830 3071.98 48.64 29350.00 29800.00 23650.00 24610.00 7.11 83.650 3717.00 49.00 32410.00 34200.00 28550.00 29530.00 7.18 86.770 4925.70 48.64 53820.00 53820.00 31140.00 32350.00 7.12 83.530 6990.86 45.56 59750.00 59910.00 53850.00 56070.00 6.67 78.370 7634.70 42.94 61650.00 61800.00 57500.00 59920.00 6.28 76.210 8414.04 42.84 63200.00 64800.00 61260.00 61980.00 6.26 72.790 8260.60 42.82 61100.00 63440.00 59930.00 63160.00 6.22 73.410 8382.75 42.13 64700.00 65510.00 60130.00 60900.00 6.04 73.050 8684.93 40.02 65450.00 66960.00 63750.00 65210.00 5.72 72.380 8439.29 40.36 68000.00 69880.00 63430.00 66040.00 5.70 72.720 7887.69 39.73 62800.00 69300.00 62000.00 67900.00 5.55 75.770 7061.02 39.37 58900.00 64480.00 58000.00 61990.00 5.43 76.000 6587.67 39.44 61180.00 63000.00 54850.00 58730.00 5.35 76.790 6966.70 39.44 64500.00 64560.00 52700.00 59540.00 5.32 75.670 8008.43 39.51 67310.00 67450.00 64140.00 65130.00 5.27 77.780 7648.98 40.34 65400.00 67850.00 64060.00 67610.00 5.36 79.140 7513.50 40.82 68030.00 68150.00 61360.00 65240.00 5.38 80.870 7973.91 40.42 63100.00 70340.00 62900.00 67820.00 5.34 80.610 7475.88 40.77 64720.00 66200.00 60100.00 63150.00 5.34 82.210 7682.17 40.78 71730.00 72900.00 60320.00 63890.00 5.32 82.010 7766.47 42.15 62900.00 74930.00 62620.00 68980.00 5.46 81.950 6452.48 44.03 57650.00 63300.00 55040.00 62090.00 5.68 83.170 5676.45 44.16 55500.00 59980.00 52140.00 57740.00 5.69 84.280 5669.66 44.33 61390.00 61390.00 52150.00 54470.00 5.69 84.580 6675.11 44.63 66610.00 66700.00 59990.00 61090.00 5.70 83.070 7029.18 44.85 69800.00 70200.00 62100.00 66010.00 5.70 84.720 7500.39 45.47 71250.00 72800.00 69100.00 69600.00 5.75 86.110 7602.36 46.12 69700.00 75200.00 68340.00 71030.00 5.81 85.250 7695.66 46.54 68120.00 70280.00 65610.00 67630.00 5.84 84.910 7712.10 46.46 64000.00 72100.00 60540.00 67270.00 5.82 85.610 7197.61 46.06 71500.00 72000.00 54050.00 61440.00 5.75 85.370 8045.86 45.41 70120.00 83770.00 69920.00 73370.00 5.66 84.690 6387.78 44.95 50200.00 69990.00 50200.00 67430.00 5.61 88.13
A PwC & MCX Joint Endeavour 111www.mcxindia.com / www.pwc.com/in/en
DATABANK - NON-AGRI COMMODITIES
074-177_CYIB_2011_Non-Agri_Final.indd 111074-177_CYIB_2011_Non-Agri_Final.indd 111 1/18/2012 11:45:54 PM1/18/2012 11:45:54 PM

EDITORIALSPROLOGUE INDIAN ECONOMYEXPERTS' VIEWS
Chile34%
China37%Others
38%United States9%
China7%
Others37%
Peru8%
United States
7%Germany
7%
Japan5%Australia
6%South Korea5%
Copper Mine Production (2010e) Refined Copper Consumption (2010)
Source: USGS; e estimates Source: GFMS, WBMS, GFMS
Copper Prices, Chinese Imports & Rolling correlation of LME Prices Vs Inventory
Source: LME, China Customs Department
12000
10000
8000
6000
4000
2000
0
1
0.5
0
-0.5
-1
-1.5
LME futures (USD/tons) -LHS
Rolling correlation prices Vs LME stocks -1yr.
Chinese import (100 tons) -LHS
Apr-
86Ja
n-87
Oct-8
7Ju
l-88
Apr-
89Ja
n-90
Oct-9
0Ju
l-91
Apr-
92Ja
n-93
Oct-9
3Ju
l-94
Apr-
95Ja
n-96
Oct-9
6Ju
l-97
Apr-
98Ja
n-99
Oct-9
9Ju
l-00
Apr-
01Ja
n-02
Oct-0
2Ju
l-03
Apr-
04Ja
n-05
Oct-0
5Ju
l-06
Apr-
07Ja
n-08
Oct-0
8Ju
l-09
Apr-1
0Ja
n-11
0
0
-
-1
-1
Rolling correlation prices Vs LME stocks 1yr.
Chinese import (100 tons) -LHS
86 87 87 88 89 90 90 91 92 93 93 94 95 96 96 97 98 99 99 00 01 02 02 03 04 05 05 06 07 08 08 09 10 -11
Commodity Insights Yearbook 2011112
074-177_CYIB_2011_Non-Agri_Final.indd 112074-177_CYIB_2011_Non-Agri_Final.indd 112 1/18/2012 11:45:55 PM1/18/2012 11:45:55 PM

DATABANK - AGRI COMMODITIES
Iron ore fundamentals (million tonnes) 2010 2009 2008 2007 2006 2001GlobalIron ore production - gross weight 2400.0 2240.0 2210.0 2040.0 1840.0 1046.4Iron ore production - metal content - 1110.0 1130.0 1070.0 969.0 584.2Pig iron production 1025.8 914.0 935.4 961.4 879.8 586.9Direct reduced iron production 69.9 64.5 66.1 66.8 56.4 37.8Iron ore apparent consumption - 2243.7 2197.0 2006.7 1805.0 -
China Iron ore production - gross weight 900.0 880.0 824.0 707.0 601.0 220.0Iron ore production - metal content - 280.0 270.0 233.0 198.0 72.6Pig iron production 590.2 549.4 469.3 476.5 412.5 155.5Direct reduced iron production 0.1 0 0.2 0.6 0.2 0.1Iron ore apparent consumption - 1509.4 1268 1090.1 914.5 - Imports of pig iron 1.1 3.6 0.4 0.7 0.2 0.5Exports of pig iron 0.7 0.2 0.3 0.7 0.9 0.7Imports of iron ore 618.6 628.2 444 383.1 326.3 92.4Exports of iron ore 0.0091 0.0003 0.0003 0.0719 0 -
India Iron ore production - gross weight 260.0 245.0 220.0 202.0 181.0 79.2Iron ore production - metal content - 157.0 142.0 129.0 117.0 50.7Pig iron production 38.7 38.2 37.3 36.5 28.3 21.9Direct reduced iron production 26.3 23.4 20.9 20.1 15 5.7Iron ore apparent consumption - 167.3 113.2 114.3 79 - Imports of pig iron 0.255 0.008 0.027 0.02 0.004 0.001Exports of pig iron 0.521 0.397 0.613 0.82 0.68 0.264Import of iron ore - 0.62 0.6 1.12 0.81 0.30Export of iron ore 104 114 101.4 93.7 86.8 36.6
Source: USGS, Steel Statistical Yearbook 2011, CRU, UNCTAD, DGCIS, China Customs General Administration, International Steel Statistical Bureau
World's leading iron ore producerCountry Company Capacity in million tonnes (early 2010)Australia BHP Billiton Group 188.5 Fortescue Metals Group 55.0Brazil Vale Group 417.1 CSN Group 28.0China AnBen Group 44.7 Shougang Beijing Group 26.5 Wuhan Iron & Steel Group 18.6India NMDC Group 32.6Iran Imidro Group 29.8Kazakhstan ENRC - Eurasian Natural Resources 19.7Russia Evrazholding Group 50.4 Metalloinvest Group 44.7South Africa Anglo American Group 41.1Sweden LKAB Group 38.5UK Rio Tinto Group 273.7 ArcelorMittal Group 78.9Ukraine Metinvest Holding Group 42.8USA Cliffs Natural Resources 34.6 US Steel Group 23.5Venezuela CVG Group 37.9Rest of the World Others 650.7Total Capacity (All) 2177.3
Source: www.steelonthenet.com
World iron ore pelletizing capacity, 2009 (mn tonne)Country Rated capacityUnited States 56.6Brazil 56.0China 45.0Ukraine 33.5Russia 31.4Canada 27.5India 26.7Sweden 21.0Mexico 15.0Others 58.9Total 371.6
Source: USGS iron ore 2009 yearbook
A PwC & MCX Joint Endeavour 113www.mcxindia.com / www.pwc.com/in/en
DATABANK - NON-AGRI COMMODITIES
074-177_CYIB_2011_Non-Agri_Final.indd 113074-177_CYIB_2011_Non-Agri_Final.indd 113 1/18/2012 11:45:57 PM1/18/2012 11:45:57 PM

EDITORIALSPROLOGUE INDIAN ECONOMYEXPERTS' VIEWS
Economic parameters impacting iron ore prices 2010 2009 2008 2007 2006 2001Real GDP (annual % change) US 2.8 -2.6 1.1 2 2.9 0.8Japan 4.3 -6.3 -0.3 1.9 2.8 0.7Eurozone 1.8 -4.1 1 2.3 2.6 1.9China 10.3 9.2 9 11.5 11.1 8.3India 9.7 5.7 7.3 8.9 9.7 3.9OECD 2.8 -3.4 1 2.6 3.2 2.4
Consumer Price Inflation (annual % change) US 1.6 -0.3 1 2.5 2.7 2.8Japan -0.9 -1.4 0.5 1.4 0.3 -0.7Eurozone 1.5 0.3 1 3 2.2 2.4China 3.1 0.8 3 5.9 2 -0.1India 13.2 10.9 5 7 6.7 5.2OECD 1.5 0.1 1 3 2.2 2.8
Industrial Output (annual % change) US 7 -2.9 -11.3 1.5 3 -3.7Japan 15.4 -21.3 -3.3 2.8 4.4 -6.3Eurozone 8.9 -3.7 -12.4 1.3 3.9 0.4China 15.7 11 12.9 17.4 15.4 9.9India 2.5 18 0.5 7.6 10.3 2.1OECD 7.9 -12.3 -2.1 3.3 3.8 -2.2
Interest rates (%) US 0.1 0.1 0.1 4.3 6.3 1.3Japan 0.3 0.3 0.3 0.8 0.4 0.1Eurozone 1.8 1.8 3 5 4.5 4.3China 3.3 2.8 2.8 3.3 3.3 3.2India (repo rate ) 6.3 4.8 6.5 7.8 7.3 8.5
Money Supply (annual % change) US 3.4 3.5 10 6.1 5.9 10.5Japan 2.3 3.1 1.8 2.1 0.7 3.3Eurozone 1.7 -0.4 7.6 11.6 10 8.0China 19.7 27.7 17.8 16.7 16.9 14.4India 19.1 17.7 19.9 22.8 19.3 13.6
Equity Index (end of period) US (Dow Jones) 11578 10428 8776 13265 12463 10022India (Sensex) 20509 17464 9647 20287 13787 3262
OECD indicators (annual % change) OECD total monetary aggr. & comp. broad money index 3.2 6.7 8.9 8.5 7.3 9.2OECD Total PPI Economic Activities Domestic Manufacturing 3.8 -4 6.8 3.2 3.7 2.0OECD Total CPI OECD Groups Total Energy 7.8 -10.4 12.4 4 9.3 4.9OECD Total Registration of Passenger Cars 0.5 -5.4 -7.9 -0.6 0.1 -0.8
US ISM Manufacturing Index 58.5 56.4 33.3 49 52 45.3US auto sales (YoY % change) 11.1 15.1 -35.6 -2.9 -3.6 5.6US pending home sales (YoY % change) -3.3 9.2 5.7 -23.9 -6.3 -
Note: Interest rates mentioned are central Bank discount rate. For India, interest rates mentioned are repo rates Source: OECD, IMF, CPM Gold Yearbook, World Bank, Various Central Banks, BSE, NYSE
Trade in Ferrous Scrap (in million tonnes)Region/year Exports Imports 2009 2010 2009 2010 European Union (27) 39.6 47.9 28 40.3Other Europe 1.5 2.5 16.4 20.9CIS 0.4 0.6 0.5 0.4NAFTA 27.9 26.7 5.3 15.6Central and South America 0.4 0.6 0.2 0.7Africa 3.2 3.9 1.6 4.7Middle East 0.3 0.4 0 0Asia 11.5 9.2 30.3 24Australia and New Zealand 2.2 2 0 1.3World 87.8 94.8 82.5 107.9
Source: World steel in fi gures 2011
Commodity Insights Yearbook 2011114
074-177_CYIB_2011_Non-Agri_Final.indd 114074-177_CYIB_2011_Non-Agri_Final.indd 114 1/18/2012 11:45:57 PM1/18/2012 11:45:57 PM

DATABANK - AGRI COMMODITIES
Australia18%
Brazil15%
Others15%
India11%
China67%
China37%
Others17%
India7%
Japan5%Russia
4% South Korea2%
Brazil 2%
Iron Ore Production (2010e) Iron Ore Apprarent Consumption (2009)
Source: USGS Source: World Steel in Figures 2011
Pig iron prices on various factors
Source: steelonthenet, WSIF
mn tonne Price700
600
500
400
300
200
100
0
600
500
400
300
200
100
0
China Imports of iron ore
China fi nished steel consumption
India exports of iron ore
Brazilian pig iron exports prices (USS/ tonns)-RHS
2005 20072004 2006 2008 2009 2010
A PwC & MCX Joint Endeavour 115www.mcxindia.com / www.pwc.com/in/en
DATABANK - NON-AGRI COMMODITIES
074-177_CYIB_2011_Non-Agri_Final.indd 115074-177_CYIB_2011_Non-Agri_Final.indd 115 1/18/2012 11:45:57 PM1/18/2012 11:45:57 PM

EDITORIALSPROLOGUE INDIAN ECONOMYEXPERTS' VIEWS
Iron ore prices and trading activity
Month MCX futures price (Rs./kg) MCX futures trading S Open High Low Close Volume Open Interest Dec-10 - - - - - - Nov-10 - - - - - - Oct-10 - - - - - - Sep-10 - - - - - - Aug-10 - - - - - - Jul-10 - - - - - - Jun-10 - - - - - - May-10 - - - - - - Apr-10 - - - - - - Mar-10 - - - - - - Feb-10 - - - - - - Jan-10 - - - - - - Dec-09 - - - - - - Nov-09 - - - - - - Oct-09 - - - - - - Sep-09 - - - - - - Aug-09 - - - - - - Jul-09 - - - - - - Jun-09 - - - - - - May-09 - - - - - - Apr-09 - - - - - - Mar-09 - - - - - - Feb-09 - - - - - - Jan-09 - - - - - - Dec-08 - - - - - - Nov-08 - - - - - - Oct-08 - - - - - - Sep-08 - - - - - - Aug-08 - - - - - - Jul-08 - - - - - - Jun-08 - - - - - - May-08 - - - - - - Apr-08 - - - - - - Mar-08 - - - - - - Feb-08 - - - - - - Jan-08 - - - - - - Dec-07 - - - - - - Nov-07 - - - - - - Oct-07 - - - - - - Sep-07 - - - - - - Aug-07 - - - - - - Jul-07 - - - - - - Jun-07 - - - - - - May-07 - - - - - - Apr-07 - - - - - - Mar-07 - - - - - - Feb-07 - - - - - - Jan-07 - - - - - - Dec-06 - - - - - - Nov-06 - - - - - - Oct-06 - - - - - - Sep-06 - - - - - - Aug-06 - - - - - - Jul-06 - - - - - - Jun-06 - - - - - - May-06 - - - - - - Apr-06 - - - - - -
Note: DMTU: Dry metric ton unit; Futures prices are for near month continuous futures contract; Vol and OI in lots; Aggregate volume in all contracts during the month; Cumulative open interest in Source: Exchanges’ websites, www.Steelonthenet.com, RBI.
Commodity Insights Yearbook 2011116
074-177_CYIB_2011_Non-Agri_Final.indd 116074-177_CYIB_2011_Non-Agri_Final.indd 116 1/18/2012 11:45:58 PM1/18/2012 11:45:58 PM

DATABANK - AGRI COMMODITIES
Spot prices - Chennai - Rs. /dmtu Chinese imported prices - Brazilian pig iron RBI Rate USD/ INR Dollar IndexMonthly average 62% Fe fi nes (USD/dmtu) export prices (US$/tonne) Monthly average
6671.19 169 421 45.16 80.306133.76 161 425 45.02 78.455705.79 149 455 44.41 77.725609.77 141 455 46.06 81.355973.94 145 463 46.57 82.225136.82 126 476 46.84 83.435871.29 144 483 46.56 86.775953.01 161 407 45.80 85.486462.07 173 417 44.50 81.355010.42 140 390 45.50 80.814672.20 128 338 46.33 80.274402.57 126 334 45.96 77.98
- 105 317 46.63 77.00- 99 316 46.59 75.4- 87 335 46.72 76.17- 81 309 48.39 77.19- 98 294 48.36 78.53- 84 246 48.47 79.71- 72 309 47.78 80.26- 63 239 48.61 82.11- 60 471 50.08 85.55- 64 366 51.23 86.71- 76 395 49.22 86.84- 73 527 48.83 84.83- 61 614 48.64 83.65- 61 596 49.00 86.77- 61 699 48.64 83.53- 61 653 45.56 78.37- 61 605 42.94 76.21- 61 537 42.84 72.79- 61 471 42.82 73.41- 61 403 42.13 73.05- 61 366 40.02 72.38- 61 353 40.36 72.72- 61 346 39.73 75.77- 61 339 39.37 76.00- - 335 39.44 76.79- - 331 39.44 75.67- - 330 39.51 77.78- - 332 40.34 79.14- - 333 40.82 80.87- - 333 40.42 80.61- - 322 40.77 82.21- - 311 40.78 82.01- - 299 42.15 81.95- - 292 44.03 83.17- - 273 44.16 84.28- - 269 44.33 84.58- - 275 44.63 83.07- - 284 44.85 84.72- - 288 45.47 86.11- - 302 46.12 85.25- - 284 46.54 84.91- - 259 46.46 85.61- - 253 46.06 85.37- - 236 45.41 84.69- - 230 44.95 88.13
rest in all contracts at the month-end.
A PwC & MCX Joint Endeavour 117www.mcxindia.com / www.pwc.com/in/en
DATABANK - NON-AGRI COMMODITIES
074-177_CYIB_2011_Non-Agri_Final.indd 117074-177_CYIB_2011_Non-Agri_Final.indd 117 1/18/2012 11:45:58 PM1/18/2012 11:45:58 PM

EDITORIALSPROLOGUE INDIAN ECONOMYEXPERTS' VIEWS
Lead Fundamentals (tonnes) 2010 2009 2008 2007 2006 2001
GlobalMine production (lead content of concentrate) 4,130,000 3,860,000 3,860,000 3,690,000 3,590,000 3,050,000 World refinery production 9,414,000 8,820,000 8,700,000 8,250,000 7,970,000 6,600,000Of which: Primary 4,673,000 3,960,000 4,080,000 3,790,000 3,720,000 3,170,000Secondary 4,826,000 4,680,000 4,430,000 4,230,000 4,050,000 3,200,000Undifferentiated - 173,000 196,000 222,000 206,000 233,000 Refined lead consumption 9,395,000 8,842,000 8,615,000 8,243,000 8,008,000 6,480,000
ChinaMine production (lead content of concentrate) 1,850,000 1,600,000 1,500,000 1,410,000 1,330,000 676,000
Refinery production 4,164,000 3,710,000 3,200,000 2,790,000 2,720,000 1,200,000Of which: Primary - 2,480,000 2,350,000 2,140,000 2,130,000 984,000Secondary - 1,230,000 850,000 650,000 590,000 211,000
Refined lead consumption 4,020,000 3,660,000 3,050,000 2,650,000 2,270,000 700,000Refined lead Imports 2,554 4,793 2,589 3,609 3,581 897Refined lead exports 2,802 3,220 1,731 15,988 57,467 49,024
India Mine production (lead content of concentrate) - 92,000 87,300 77,500 69,200 32,000 Refinery production 167,000 143,000 138,000 124,000 105,000 96,400Of which: Primary - 65,000 62,000 54,000 49,000 74,400Secondary - 78,000 76,000 70,000 56,000 22,000 Refined lead consumption 310,000 295,000 290,000 280,000 275,000 - Lead ores Imports 912 335 724 277 531 0Lead ores exports 39,640 0 0 6 0 2,010Refined lead Imports 11,204 8,568 11,806 4,889 7,526 9Refined lead exports 3,049 5,516 551 424 52 699
Inventory levels - year-end LME 208275 146500 45150 45475 41125 97050 Average daily volatility (MCX spot prices) 2.30% 2.90% 3.40% 2.50% 2.20% -
Source: Ministry of Mines, ILZSG, WBMS, DGFT, MCX, LME
Top 5 refined lead producers ('000' tonnes)Country 2010 2009 2008 2007 2006China 4164 3710 3200 2790 2720United States 1256 1214 1280 1303 1303Germany 405 391 415 405 379South Korea 321 297 273 260 240United Kingdom 301 312 303 275 298
Source: Thomson Reuters GFMS, ILZSG;
Top 5 refined lead consumers ('000' tonnes) Country 2010 2009 2008 2007 2006China 4020 3660 3050 2650 2270United States 1445 1397 1515 1510 1622South Korea 382 328 315 342 337Germany 342 314 369 409 387Spain 262 245 248 260 272
Source: Thomson Reuters GFMS, ILZSG;
Commodity Insights Yearbook 2011118
074-177_CYIB_2011_Non-Agri_Final.indd 118074-177_CYIB_2011_Non-Agri_Final.indd 118 1/18/2012 11:45:58 PM1/18/2012 11:45:58 PM

DATABANK - AGRI COMMODITIES
Economic parameters impacting lead prices 2010 2009 2008 2007 2006 2001Consumer Price Inflation (annual % change) US 2.8 -2.6 1.1 2 2.9 0.8Japan 4.3 -6.3 -0.3 1.9 2.8 0.7Eurozone 1.8 -4.1 1 2.3 2.6 1.9China 10.3 9.2 9 11.5 11.1 8.3India 9.7 5.7 7.3 8.9 9.7 3.9OECD 2.8 -3.4 1 2.6 3.2 2.4
Consumer Price Inflation (annual % change) US 1.6 -0.3 1 2.5 2.7 2.8Japan -0.9 -1.4 0.5 1.4 0.3 -0.7Eurozone 1.5 0.3 1 3 2.2 2.4China 3.1 0.8 3 5.9 2 -0.1India 13.2 10.9 5 7 6.7 5.2OECD 1.5 0.1 1 3 2.2 2.8
Industrial Output (annual % change) US 7 -2.9 -11.3 1.5 3 -3.7Japan 15.4 -21.3 -3.3 2.8 4.4 -6.3Eurozone 8.9 -3.7 -12.4 1.3 3.9 0.4China 15.7 11 12.9 17.4 15.4 9.9India 2.5 18 0.5 7.6 10.3 2.1OECD 7.9 -12.3 -2.1 3.3 3.8 -2.2
Interest rates (%) US 0.1 0.1 0.1 4.3 6.3 1.3Japan 0.3 0.3 0.3 0.8 0.4 0.1Eurozone 1.8 1.8 3 5 4.5 4.3China 3.3 2.8 2.8 3.3 3.3 3.2India (repo rate ) 6.3 4.8 6.5 7.8 7.3 8.5
Money Supply (annual % change) US 3.4 3.5 10 6.1 5.9 10.5Japan 2.3 3.1 1.8 2.1 0.7 3.3Eurozone 1.7 -0.4 7.6 11.6 10 8.0China 19.7 27.7 17.8 16.7 16.9 14.4India 19.1 17.7 19.9 22.8 19.3 13.6
Equity Index (end of period) US (Dow Jones) 11578 10428 8776 13265 12463 10022India (Sensex) 20509 17464 9647 20287 13787 3262
OECD indicators (annual % change) OECD total monetary aggr. & comp. broad money index 3.2 6.7 8.9 8.5 7.3 9.2OECD Total PPI Economic Activities Domestic Mfg 3.8 -4 6.8 3.2 3.7 2.0OECD Total CPI OECD Groups Total Energy 7.8 -10.4 12.4 4 9.3 4.9OECD Total Registration of Passenger Cars 0.5 -5.4 -7.9 -0.6 0.1 -0.8
US ISM Manufacturing Index 58.5 56.4 33.3 49 52 45.3US auto sales (YoY % change) 11.1 15.1 -35.6 -2.9 -3.6 5.6US pending home sales (YoY % change) -3.3 9.2 5.7 -23.9 -6.3 -
Note: Interest rates mentioned are central Bank discount rate. For India, interest rates mentioned are repo ratesSource: OECD, IMF, CPM Gold Yearbook, World Bank, Various Central Banks, BSE, NYSE
A PwC & MCX Joint Endeavour 119www.mcxindia.com / www.pwc.com/in/en
DATABANK - NON-AGRI COMMODITIES
074-177_CYIB_2011_Non-Agri_Final.indd 119074-177_CYIB_2011_Non-Agri_Final.indd 119 1/18/2012 11:45:59 PM1/18/2012 11:45:59 PM

EDITORIALSPROLOGUE INDIAN ECONOMYEXPERTS' VIEWS
Lead prices
Month MCX futures prices - 5 MT contract (Rs/tonne) MCX spot prices (Rs/kg) Open High Low Close Monthly average Dec-10 102.75 115.95 102.70 115.65 108.67 Nov-10 110.80 116.75 98.20 101.60 106.58 Oct-10 101.65 114.70 97.80 108.30 105.95 Sep-10 97.15 103.75 97.05 101.60 100.53 Aug-10 95.80 102.80 90.95 94.95 96.44 Jul-10 81.20 95.95 80.00 95.45 86.49 Jun-10 85.85 85.90 72.55 78.90 79.19 May-10 98.05 98.90 79.10 84.75 86.82 Apr-10 97.20 105.60 96.10 96.55 100.66 Mar-10 100.00 105.15 90.90 95.75 98.83 Feb-10 93.50 108.65 90.20 98.80 98.28 Jan-10 113.50 121.95 93.05 95.20 108.85 Dec-09 107.90 115.85 104.80 111.65 108.43 Nov-09 107.60 112.20 100.30 106.40 107.44 Oct-09 108.05 113.90 98.55 109.10 104.98 Sep-09 102.10 121.45 97.65 109.35 107.38 Aug-09 89.80 103.80 83.95 103.50 92.37 Jul-09 81.45 89.70 75.20 88.65 81.18 Jun-09 74.65 86.30 73.85 82.80 80.28 May-09 66.90 74.60 65.60 72.35 69.97 Apr-09 64.30 77.85 62.35 66.55 69.39 Mar-09 54.05 70.25 53.15 64.80 63.38 Feb-09 55.65 59.30 47.80 52.00 54.28 Jan-09 49.35 60.30 48.10 56.45 54.81 Dec-08 57.00 57.60 40.50 45.95 46.43 Nov-08 76.00 76.00 53.15 53.80 63.85 Oct-08 87.20 88.20 57.75 72.35 70.93 Sep-08 87.20 94.50 79.50 84.55 85.20 Aug-08 94.30 95.45 70.70 85.75 82.97 Jul-08 77.20 98.85 66.40 94.70 82.96 Jun-08 83.90 88.90 74.45 74.50 79.67 May-08 104.60 107.00 80.75 82.60 93.80 Apr-08 113.25 120.40 107.40 108.40 113.08 Mar-08 133.85 140.65 107.10 111.55 121.65 Feb-08 109.65 137.70 107.65 135.50 121.82 Jan-08 101.30 109.15 96.00 108.05 102.41 Dec-07 121.25 121.70 94.35 99.80 103.41 Nov-07 144.95 148.95 110.15 120.95 132.18 Oct-07 136.50 154.35 134.10 145.15 147.98 Sep-07 127.80 142.05 117.40 137.15 130.49 Aug-07 127.05 139.25 115.65 134.50 127.70 Jul-07 115.60 142.30 112.60 126.05 124.65 Jun-07 91.15 109.80 91.15 108.10 98.91 May-07 82.10 92.45 82.10 92.00 85.66 Apr-07 84.55 86.50 80.15 82.75 84.56 Mar-07 84.60 88.00 84.60 84.85 84.11 Feb-07 77.00 84.65 70.90 83.85 78.52 Jan-07 74.25 77.30 69.00 77.30 74.05 Dec-06 72.00 80.95 72.00 78.40 77.00 Nov-06 72.50 75.00 70.00 74.00 72.93 Oct-06 64.85 73.50 64.85 73.50 69.92 Sep-06 57.25 64.75 54.50 64.75 61.91 Aug-06 51.35 55.00 51.35 55.00 54.67 Jul-06 44.00 53.45 43.00 50.50 48.92 Jun-06 54.10 54.10 42.50 43.20 44.32 May-06 56.35 59.00 51.40 53.35 52.76 Apr-06 54.50 58.00 51.90 56.35 52.65
Note: Future prices are for near month continuous futures contractSource: Exchanges’ websites, RBI.
Commodity Insights Yearbook 2011120
074-177_CYIB_2011_Non-Agri_Final.indd 120074-177_CYIB_2011_Non-Agri_Final.indd 120 1/18/2012 11:45:59 PM1/18/2012 11:45:59 PM

DATABANK - AGRI COMMODITIES
LME 3-month prices (USD/tonne) LME cash (USD/tonne) RBI rate USD/ INR Dollar IndexOpen High Low Close Monthly average
2231.00 2569.75 2231.00 2550.00 2413.20 45.16 80.302440.00 2650.00 2150.00 2230.00 2364.98 45.02 78.452270.00 2619.00 2205.00 2449.00 2383.55 44.41 77.722060.00 2321.00 2060.00 2278.00 2192.85 46.06 81.352070.00 2250.00 1952.00 2070.00 2082.80 46.57 82.221735.00 2081.00 1697.50 2077.50 1843.97 46.84 83.431820.00 1860.15 1535.00 1750.00 1707.28 46.56 86.772210.00 2230.00 1721.25 1850.00 1876.79 45.80 85.482141.00 2400.00 2130.00 2230.00 2272.15 44.50 81.352217.00 2333.75 2007.00 2147.00 2163.00 45.50 80.81
2020.00 2368.00 1911.00 2165.00 2126.00 46.33 80.272464.00 2690.00 2010.00 2025.00 2352.00 45.96 77.982340.00 2525.50 2255.00 2432.00 2326.00 46.63 77.002275.00 2447.75 2145.00 2345.00 2303.00 46.59 75.402280.00 2485.00 2070.00 2305.00 2228.00 46.72 76.172095.50 2517.25 2025.00 2284.00 2205.00 48.39 77.191878.00 2149.00 1741.00 2107.00 1893.00 48.36 78.531690.00 1879.00 1548.00 1879.00 1674.00 48.47 79.711570.00 1833.50 1570.00 1690.00 1667.00 47.78 80.261325.00 1570.25 1320.00 1570.00 1447.00 48.61 82.111270.00 1570.00 1219.80 1330.00 1394.00 50.08 85.551050.00 1380.00 1025.00 1270.00 1247.00 51.23 86.711135.00 1219.00 980.00 1046.00 1099.63 49.22 86.84980.00 1230.00 957.00 1120.50 1144.90 48.83 84.83
1095.00 1140.00 851.00 999.00 968.17 48.64 83.651525.00 1557.00 1073.00 1103.00 1286.43 49.00 86.771845.00 1873.00 1145.00 1508.00 1494.26 48.64 83.531975.00 2080.00 1729.75 1830.00 1872.31 45.56 78.372215.00 2222.50 1626.00 1975.00 1902.85 42.94 76.211780.00 2293.75 1531.00 2210.00 1960.04 42.84 72.792000.00 2090.00 1745.00 1790.00 1860.51 42.82 73.412700.00 2730.00 1912.00 1975.00 2216.09 42.13 73.052780.00 3000.00 2677.00 2714.00 2834.88 40.02 72.383335.00 3480.00 2655.00 2790.00 3012.93 40.36 72.722810.00 3420.00 2719.00 3330.00 3089.61 39.73 75.772555.00 2831.00 2405.00 2820.00 2621.78 39.37 76.003060.00 3060.00 2371.00 2550.00 2616.08 39.44 76.793680.00 3775.00 2805.00 3060.00 3319.91 39.44 75.673380.00 3890.15 3345.00 3660.00 3722.61 39.51 77.783120.00 3520.00 2845.00 3380.00 3228.03 40.34 79.143110.00 3355.00 2760.00 3110.00 3115.19 40.82 80.87
2680.00 3500.00 2670.00 3105.00 3072.43 40.42 80.612360.00 2745.00 2231.00 2660.00 2436.64 40.77 82.212015.00 2360.00 1980.00 2331.00 2106.00 40.78 82.011920.00 2045.00 1905.00 2015.00 1984.16 42.15 81.951825.00 1975.15 1771.85 1920.00 1908.98 44.03 83.171680.00 1955.00 1525.00 1820.00 1775.08 44.16 84.281685.00 1725.25 1505.00 1679.00 1664.34 44.33 84.581660.00 1785.00 1580.00 1665.00 1709.16 44.63 83.071615.00 1755.00 1440.00 1663.00 1626.02 44.85 84.721390.00 1630.00 1340.00 1617.00 1525.66 45.47 86.111220.00 1410.50 1214.00 1380.00 1346.53 46.12 85.251095.00 1250.00 1082.25 1210.00 1179.32 46.54 84.911020.00 1180.00 995.00 1092.00 1053.26 46.46 85.611065.00 1080.00 924.75 1015.00 963.61 46.06 85.371230.00 1360.00 1060.00 1071.00 1167.50 45.41 84.691180.00 1260.00 1139.85 1210.00 1170.56 44.95 88.13
A PwC & MCX Joint Endeavour 121www.mcxindia.com / www.pwc.com/in/en
DATABANK - NON-AGRI COMMODITIES
074-177_CYIB_2011_Non-Agri_Final.indd 121074-177_CYIB_2011_Non-Agri_Final.indd 121 1/18/2012 11:45:59 PM1/18/2012 11:45:59 PM

EDITORIALSPROLOGUE INDIAN ECONOMYEXPERTS' VIEWS
Lead trading activityMonth MCX^ LME* Volume Open Interest Volume Open Interest Dec-10 736860 10916 664693 145177Nov-10 824705 7264 721628 152023Oct-10 916761 5691 706941 138909Sep-10 824671 7773 634529 129890Aug-10 927590 8139 581347 125002Jul-10 671476 11993 644167 132294Jun-10 780761 15719 657952 128907May-10 606739 6697 661808 134434Apr-10 612538 8519 661124 123855Mar-10 578649 9446 633637 125925Feb-10 548550 4666 546908 113332Jan-10 516536 7376 567403 108234Dec-09 368884 3899 479278 100018Nov-09 364568 2473 463983 103436Oct-09 432767 2574 522231 102818Sep-09 573158 3204 597913 107792Aug-09 336663 3820 515465 104305Jul-09 262801 3405 494804 108364Jun-09 309687 2785 508573 105843May-09 210388 2080 393306 100024Apr-09 161244 1992 483781 98282Mar-09 130344 1380 535331 93619Feb-09 72614 1550 402582 102852Jan-09 146851 1354 534515 102959Dec-08 144343 3235 483905 109344Nov-08 128765 3994 470743 117209Oct-08 114594 2276 610973 123930Sep-08 156400 1765 540511 139610Aug-08 158614 1301 609001 143131Jul-08 226034 2740 729273 142077Jun-08 126749 5245 482949 116295May-08 139900 3449 483893 113582Apr-08 78768 1255 423544 105527Mar-08 110436 866 415194 102617Feb-08 139959 1817 454711 98288Jan-08 129851 1980 428100 96419Dec-07 167541 1933 341485 96146Nov-07 180997 1898 494098 102672Oct-07 259390 2829 493731 98587Sep-07 179574 1557 406280 92649Aug-07 213613 1652 434971 66274Jul-07 90279 847 374775 66822Jun-07 339 19 382190 64802May-07 4 4 366261 66439Apr-07 9 5 302402 63116Mar-07 8 0 323205 63240Feb-07 8 2 330473 60786Jan-07 54 0 371393 58260Dec-06 116 0 320163 57662Nov-06 552 1 374854 61192Oct-06 28 0 356364 58032Sep-06 336 0 396199 56693Aug-06 46 1 379169 55523Jul-06 1774 20 318504 57775Jun-06 430 29 308105 62057May-06 1691 16 440203 62315Apr-06 628 8 343260 59505
Note: Vol and OI in lots; Aggregate volume in all contracts during the month; Cumulative open interest in all contracts at the month-end; ^ Includes both MCX Lead (5 MT) futures contract & MCX Lead mini (1 MT) futures contract; * LME Lead Futures Total Market OI (includes member as well as client positions) & LME Lead Futures Volume Total Source: Exchanges' websites
Commodity Insights Yearbook 2011122
074-177_CYIB_2011_Non-Agri_Final.indd 122074-177_CYIB_2011_Non-Agri_Final.indd 122 1/18/2012 11:45:59 PM1/18/2012 11:45:59 PM

DATABANK - AGRI COMMODITIES
Lead Prices, Inventory and Spread Between Cash & Futures
Others21%
Australia15%
United States11%
China45%
China43%
Others31%
United States15%
Germany4%
Peru7%
Mexico 4% South Korea
3%
Spain 2%
Lead Mine Production (2010e) Refined Lead Consumption (2010)
Source: Source: USGS; e estimates Source: GFMS
Source: LME
Inventory & Spread Prices400
350
300
250
200
150
100
50
0
-50
4000
3500
3000
2500
200
1500
1000
500
0
LME futures (USD/tonnes)
Lead invetory (000s metric tonnes)
Cash - Month Spread (USD/tonnes)
Jan-
87Se
p-87
May
-88
Jan-
89Se
p-89
May
-90
Jan-
91Se
p-91
May
-92
Jan-
93Se
p-93
May
-94
Jan-
95Se
p-95
May
-96
Jan-
97Se
p-97
May
-98
Jan-
99Se
p-99
May
-00
Jan-
01
Sep-
01
May
-02
Jan-
03Se
p-03
May
-04
Jan-
05
Sep-
05
may
-06
Jan-
07Se
p-07
May
-08
Jan-
09
Sep-
09
May
-10
Jan-
11
A PwC & MCX Joint Endeavour 123www.mcxindia.com / www.pwc.com/in/en
DATABANK - NON-AGRI COMMODITIES
074-177_CYIB_2011_Non-Agri_Final.indd 123074-177_CYIB_2011_Non-Agri_Final.indd 123 1/18/2012 11:46:00 PM1/18/2012 11:46:00 PM

EDITORIALSPROLOGUE INDIAN ECONOMYEXPERTS' VIEWS
Nickel fundamentals (Tonnes) 2010 2009 2008 2007 2006 2001
Global
Mine production Of which: 1,550,000 1,400,000 1,560,000 1,670,000 1,570,000 1,350,000Concentrate - 436,000 552,000 556,000 541,000 451,000Ore and ore milled - 309,000 269,000 293,000 280,000 537,000Laterite ore - 339,000 385,000 480,000 394,000 230,000Ferronickel produced - 12,000 15,000 15,300 10,900 2,970Nickel sulfate - 100 100 100 80 151Unspecified and (or) undifferentiated - 309,000 338,000 326,000 340,000 124,000 Plant production (refined) Of which: 1,425,000 1,380,000 1,400,000 1,440,000 1,350,000 1,190,000Ferronickel, including ferronickel magnesium - 363,000 350,000 395,000 332,000 232,000Metal - 775,000 742,000 748,000 741,000 683,000Oxide sinter - 91,700 89,400 100,000 95,700 104,000Chemicals, including nickel sulfate - 13,800 14,600 14,800 16,200 16,900Unspecified - 138,000 203,000 179,000 168,000 152,000 Refined nickel consumption 1,463,700 1,241,000 1,244,000 1,425,000 1,365,000 1,211,000
China
Mine production 77,000 79,355 72,000 67,000 82,100 51,500Plant production (refined) 350,000 273,000 207,900 206,500 138,000 49,700Refined nickel consumption 560,000 540,000 305,000 330,000 230,000 70,000Refined nickel imports 14,869 13,241 10,715 9,563 10,374 -Refined nickel exports 2,893 7,673 449 478 2,874 -
India
Semi-refined nickel consumption 27,834 24,478 20,815 19,279 17,751 24,700Nickel metal import 1,982 2,167 692 1,202 1,202 386Nickel metal export 0 0 0 0 0 -Nickel ores imports (gross weight) 12 0 0 24 0 487Nickel ores exports (gross weight) 0 0 0 0 0 -Inventory levels - year-end LME 135672 158010 78390 47946 6648 18966 Average daily volatility (MCX spot prices) 2.10% 2.90% 3.20% 2.50% 2.60% -
Source: USGS, INSG, DGCIS, MCX, LME, GFMS, 7economy.com, World Bureau of Metal Statistics, China Customs General Administration
Top 5 refined nickel producers Country 2010 2009 2008 2007 2006China 350,000 273,000 207,900 206,500 138,000Japan 166,000 144,000 156,000 161,000 152,000Canada 105,000 117,000 168,000 154,000 147,000Australia 102,000 131,000 108,000 114,000 116,000Norway 92,000 89,000 89,000 88,000 82,000
Source: Thomson Reuters GFMS, INSG
Top 5 refined nickel consumers Country 2010 2009 2008 2007 2006China 560,000 540,000 305,000 330,000 230,000Japan 177,000 148,000 185,000 196,000 181,000United States 119,000 91,000 117,000 119,000 145,000South Korea 101,000 93,000 76,000 71,000 93,000Germany 100,000 62,000 91,000 110,000 106,000
Source: Thomson Reuters GFMS, INSG
Commodity Insights Yearbook 2011124
074-177_CYIB_2011_Non-Agri_Final.indd 124074-177_CYIB_2011_Non-Agri_Final.indd 124 1/18/2012 11:46:01 PM1/18/2012 11:46:01 PM

DATABANK - AGRI COMMODITIES
Economic parameters impacting nickel prices 2010 2009 2008 2007 2006 2001Real GDP (annual % change) US 2.8 -2.6 1.1 2 2.9 0.8Japan 4.3 -6.3 -0.3 1.9 2.8 0.7Eurozone 1.8 -4.1 1 2.3 2.6 1.9China 10.3 9.2 9 11.5 11.1 8.3India 9.7 5.7 7.3 8.9 9.7 3.9OECD 2.8 -3.4 1 2.6 3.2 2.4
Consumer Price Inflation (annual % change) US 1.6 -0.3 1 2.5 2.7 2.8Japan -0.9 -1.4 0.5 1.4 0.3 -0.7Eurozone 1.5 0.3 1 3 2.2 2.4China 3.1 0.8 3 5.9 2 -0.1India 13.2 10.9 5 7 6.7 5.2OECD 1.5 0.1 1 3 2.2 2.8
Industrial Output (annual % change) US 7 -2.9 -11.3 1.5 3 -3.7Japan 15.4 -21.3 -3.3 2.8 4.4 -6.3Eurozone 8.9 -3.7 -12.4 1.3 3.9 0.4China 15.7 11 12.9 17.4 15.4 9.9India 2.5 18 0.5 7.6 10.3 2.1OECD 7.9 -12.3 -2.1 3.3 3.8 -2.2
Interest rates (%) US 0.1 0.1 0.1 4.3 6.3 1.3Japan 0.3 0.3 0.3 0.8 0.4 0.1Eurozone 1.8 1.8 3 5 4.5 4.3China 3.3 2.8 2.8 3.3 3.3 3.2India (repo rate ) 6.3 4.8 6.5 7.8 7.3 8.5
Money Supply (annual % change) US 3.4 3.5 10 6.1 5.9 10.5Japan 2.3 3.1 1.8 2.1 0.7 3.3Eurozone 1.7 -0.4 7.6 11.6 10 8.0China 19.7 27.7 17.8 16.7 16.9 14.4India 19.1 17.7 19.9 22.8 19.3 13.6
Equity Index (end of period) US (Dow Jones) 11578 10428 8776 13265 12463 10022India (Sensex) 20509 17464 9647 20287 13787 3262
OECD indicators (annual % change) OECD total monetary aggr. & comp. broad money index 3.2 6.7 8.9 8.5 7.3 9.2OECD Total PPI Economic Activities Domestic Manufacturing 3.8 -4.0 6.8 3.2 3.7 2.0OECD Total CPI OECD Groups Total Energy 7.8 -10.4 12.4 4.0 9.3 4.9OECD Total Registration of Passenger Cars 0.5 -5.4 -7.9 -0.6 0.1 -0.8 US ISM Manufacturing Index 58.5 56.4 33.3 49 52 45.3US auto sales (YoY % change) 11.1 15.1 -35.6 -2.9 -3.6 5.6US pending home sales (YoY % change) -3.3 9.2 5.7 -23.9 -6.3 -
Note: Interest rates mentioned are central Bank discount rate. For India, interest rates mentioned are repo ratesSource: OECD, IMF, CPM Gold Yearbook, World Bank, Various Central Banks, BSE, NYSE
A PwC & MCX Joint Endeavour 125www.mcxindia.com / www.pwc.com/in/en
DATABANK - NON-AGRI COMMODITIES
074-177_CYIB_2011_Non-Agri_Final.indd 125074-177_CYIB_2011_Non-Agri_Final.indd 125 1/18/2012 11:46:01 PM1/18/2012 11:46:01 PM

EDITORIALSPROLOGUE INDIAN ECONOMYEXPERTS' VIEWS
Nickel prices
Month MCX futures prices (Rs/tonne) MCX spot prices (Rs/kg) Open High Low Close Monthly average Dec-10 1053.0 1135.0 1051.2 1111.8 1085.7 Nov-10 1039.0 1097.4 957.9 1037.7 1028.4 Oct-10 1053.2 1120.7 1005.8 1010.3 1054.7 Sep-10 983.7 1082.7 983.7 1047.3 1041.6 Aug-10 981.0 1055.7 940.7 969.3 994.8 Jul-10 917.0 976.6 881.5 953.3 916.1 Jun-10 984.0 984.0 823.6 900.0 900.4 May-10 1169.1 1178.3 935.3 1002.2 1015.2 Apr-10 1121.1 1224.7 1081.6 1145.4 1163.0 Mar-10 985.0 1128.0 958.1 1125.2 1025.1 Feb-10 857.3 955.8 796.2 946.3 881.7 Jan-10 878.7 891.8 795.5 866.5 849.6 Dec-09 758.1 908.4 736.0 863.1 798.9 Nov-09 853.0 866.5 732.0 744.8 791.0 Oct-09 852.3 918.1 819.0 866.7 866.1 Sep-09 924.5 938.3 796.5 833.0 839.2 Aug-09 859.0 1022.4 859.0 956.4 948.0 Jul-09 744.0 858.4 702.2 851.1 773.6 Jun-09 660.0 768.9 651.4 762.5 717.3 May-09 589.0 666.6 572.6 650.4 616.6 Apr-09 502.0 637.1 494.7 565.6 558.4 Mar-09 504.1 533.5 478.3 479.3 495.8 Feb-09 545.0 585.0 462.0 488.6 512.5 Jan-09 576.0 654.8 498.1 537.6 550.8 Dec-08 515.0 540.8 442.3 522.8 470.5 Nov-08 623.8 649.3 476.2 484.8 526.3 Oct-08 764.4 769.0 447.8 556.5 579.0 Sep-08 906.0 906.5 721.0 741.9 807.2 Aug-08 795.1 935.0 736.6 887.8 819.2 Jul-08 960.0 974.5 763.0 791.6 863.4 Jun-08 935.0 1073.5 914.5 930.5 967.9 May-08 1160.0 1180.0 927.0 942.5 1077.0 Apr-08 1183.5 1205.5 1127.5 1169.5 1149.5 Mar-08 1259.0 1416.0 1126.0 1190.5 1260.9 Feb-08 1086.5 1275.0 1042.0 1258.0 1109.3 Jan-08 1040.5 1203.0 1038.5 1084.0 1089.2 Dec-07 1088.0 1104.5 998.0 1017.5 1030.3 Nov-07 1277.0 1350.0 1042.0 1047.5 1211.2 Oct-07 1230.0 1306.0 1188.0 1212.9 1228.5 Sep-07 1217.0 1362.0 1101.7 1232.9 1195.3 Aug-07 1279.0 1286.0 1035.0 1237.9 1120.1 Jul-07 1495.0 1519.9 1223.4 1275.7 1350.6 Jun-07 1941.1 2009.0 1430.2 1460.8 1700.7 May-07 2105.0 2185.5 1925.0 2073.2 2130.9 Apr-07 2007.8 2253.9 1953.9 2066.5 2133.3 Mar-07 1891.1 2247.0 1790.0 1982.8 2036.7 Feb-07 1945.0 1990.0 1925.0 1967.6 1817.1 Jan-07 1504.0 1855.0 1355.0 1727.0 1626.6 Dec-06 1498.0 1603.0 1433.0 1512.9 1543.5 Nov-06 1429.8 1547.3 1267.3 1539.0 1439.7 Oct-06 1408.3 1640.0 1327.1 1420.2 1491.9 Sep-06 1515.0 1524.2 1205.0 1430.5 1394.6 Aug-06 1287.5 1618.5 1210.0 1581.3 1445.0 Jul-06 976.1 1380.0 976.1 1324.3 1234.2 Jun-06 1080.0 1081.0 844.1 1031.2 954.0 May-06 905.0 1064.0 821.0 1064.0 956.8 Apr-06 675.0 832.7 675.0 827.9 801.7
Note: Future prices are for near month continuous futures contract Source: Exchanges’ websites, RBI
Commodity Insights Yearbook 2011126
074-177_CYIB_2011_Non-Agri_Final.indd 126074-177_CYIB_2011_Non-Agri_Final.indd 126 1/18/2012 11:46:01 PM1/18/2012 11:46:01 PM

DATABANK - AGRI COMMODITIES
LME 3-month prices (USD/tonne) LME cash (USD/tonne) RBI rate USD/ INR Dollar IndexOpen High Low Close Monthly average22850 25001 22850 24750 24111 45.16 80.3023090 24849 20450 23050 22909 45.02 78.4523300 25200 22661 22990 23807 44.41 77.7220775 23570 20775 23400 22643 46.06 81.3521025 22898 20000 20700 21413 46.57 82.2219358 21204 18401 21150 19518 46.84 83.4321050 21051 17375 19745 19389 46.56 86.7726150 26469 20450 21350 22008 45.80 85.4825001 27595 24269 26300 26031 44.50 81.3521188 25085 20990 24995 22461 45.50 80.8118550 21176 16975 21175 18976 46.33 80.2718800 19400 17325 18500 18439 45.96 77.9816200 19450 15720 18525 17066 46.63 77.0018180 18400 15751 16400 16991 46.59 75.4017800 19750 16900 18250 18525 46.72 76.1718800 19150 16282 17895 17473 48.39 77.1917900 21325 17900 19030 19642 48.36 78.5315350 17950 14120 17950 15985 48.47 79.7113945 16100 13800 15375 14960 47.78 80.2611700 13950 11625 13945 12635 48.61 82.119800 12850 9625 11680 11166 50.08 85.559975 10420 9425 9850 9696 51.23 86.7111180 12051 9250 10000 10409 49.22 86.8411700 13550 10180 11200 11307 48.83 84.83
10000 11900 9000 11700 9686 48.64 83.6512675 13125 9720 10200 10702 49.00 86.7716050 16400 8850 12100 12140 48.64 83.5320250 20350 15588 15850 17795 45.56 78.3718599 21525 17370 20225 18928 42.94 76.2121950 22599 18049 18350 20160 42.84 72.7922290 24950 21400 21950 22549 42.82 73.4128725 29149 21355 22100 25735 42.13 73.0529750 30325 27900 28550 28763 40.02 72.3831500 35150 28000 29755 31225 40.36 72.7227650 32050 26250 31500 27955 39.73 75.7726650 30750 26350 27400 27690 39.37 76.0027450 27800 25177 26300 25992 39.44 76.7932380 34250 26752 27095 30610 39.44 75.6730849 33490 29701 32050 31055 39.51 77.7829800 34500 26612.5 30500 29538 40.34 79.1431450 31450 24800 29800 27652 40.82 80.8736450 37500 30199 31445 33426 40.42 80.6146100 50448.5 35350 36200 41719 40.77 82.2148000 51800 44900 46000 52179 40.78 82.0145000 50200 44950 47800 50267 42.15 81.9540800 48500 39000 44800 46325 44.03 83.1736500 41990 34350 41395 41184 44.16 84.2833350 38950 30000 37000 36811 44.33 84.5833750 34950 31999 33325 34570 44.63 83.0731400 34100 28650 33950 32114 44.85 84.7229375 32625 28000 31350 32703 45.47 86.11
28000 29450 25500 29350 30131 46.12 85.2525400 29950 24175 28800 30744 46.54 84.9121400 26900 21400 25500 26586 46.46 85.6121500 21750 17050 21350 20755 46.06 85.3719175 23050 18600 21900 21077 45.41 84.69
15200 20250 15150 19275 17942 44.95 88.13
A PwC & MCX Joint Endeavour 127www.mcxindia.com / www.pwc.com/in/en
DATABANK - NON-AGRI COMMODITIES
074-177_CYIB_2011_Non-Agri_Final.indd 127074-177_CYIB_2011_Non-Agri_Final.indd 127 1/18/2012 11:46:01 PM1/18/2012 11:46:01 PM

EDITORIALSPROLOGUE INDIAN ECONOMYEXPERTS' VIEWS
Nickel trading activityMonth MCX LME* Volume Open Interest Volume Open Interest Dec-10 991720 11189 609303 129267Nov-10 1102297 10556 549301 131018Oct-10 1303409 15593 578265 131308Sep-10 1545719 13074 618557 135930Aug-10 1575374 17892 565238 137497Jul-10 1513239 11042 581376 133022Jun-10 1831835 14782 689045 130815May-10 1895405 13124 624309 128978Apr-10 2005692 16800 564557 135685Mar-10 1688859 22136 681780 138772Feb-10 1298373 10181 659007 132646Jan-10 1177285 11674 534970 119026Dec-09 938083 20549 583087 127969Nov-09 1017457 25176 509446 119369Oct-09 1090155 11089 634481 122518Sep-09 1138791 10581 652785 133157Aug-09 1480793 8201 688060 140138Jul-09 1034964 8947 573970 135933Jun-09 912814 6744 591738 123467May-09 708101 7855 459656 119384Apr-09 598581 8353 587940 112215Mar-09 326281 16168 457791 112738Feb-09 222376 4650 381938 124755Jan-09 324454 2263 528894 120817Dec-08 203662 3948 439020 117669Nov-08 206015 3039 405158 117387Oct-08 216060 3571 537443 126983Sep-08 148790 6332 509484 118006Aug-08 188189 3395 408295 121245Jul-08 186886 10310 393348 113786Jun-08 161359 5512 446347 107684May-08 113308 4291 432582 103674Apr-08 81540 2169 443789 97002Mar-08 147596 2152 349587 97320Feb-08 170479 4324 447305 95674Jan-08 198392 4466 353678 91977Dec-07 121275 5055 329927 88395Nov-07 117293 5294 362858 84517Oct-07 244786 4987 342322 77624Sep-07 250183 4288 274793 74882Aug-07 311290 5999 310368 54439Jul-07 315797 8279 266692 49576Jun-07 293894 3554 347708 45144May-07 144002 2764 278647 44480Apr-07 115707 1228 282269 41779Mar-07 128971 1354 268325 46467Feb-07 76841 710 291690 45936Jan-07 49710 527 353496 49227Dec-06 14522 74 292342 48765Nov-06 1307 10 235072 47665Oct-06 688 10 312979 47660Sep-06 288 4 264161 47852Aug-06 288 0 340962 47247Jul-06 1281 1 357523 53816Jun-06 2109 23 397067 55640May-06 356 13 379303 62328Apr-06 67 10 471598 66705
Note: Vol and OI in lots; Aggregate volume in all contracts during the month ; Cumulative open interest in all contracts at the month-end. * LME Nickel Futures Total Market OI (includes member as well as client positions) & LME Nickel Futures Volume Total Source: Exchanges' websites
Commodity Insights Yearbook 2011128
074-177_CYIB_2011_Non-Agri_Final.indd 128074-177_CYIB_2011_Non-Agri_Final.indd 128 1/18/2012 11:46:01 PM1/18/2012 11:46:01 PM

DATABANK - AGRI COMMODITIES
Russia17%
Indonesia15%
Canada10% China
37%
Others40%
Others30%
Japan12%
Germany6%
NewCaledonia
9%
Australia9%
UnitedStates8%
South Korea7%
Nickel Mine Production (2010e) Refined Nickel Consumption (2010)
Source: USGS; e estimates Source: GFMS, INSG, WBMS
Source: IISF, INSG, LME
1525
1425
1325
1225
1125
1025
925
825
40000
33000
26000
19000
12000
5000
Average LME prices USD/tonnes (RHS)
Steel Globle production (million tonnes)
Nickel Consumption (000s tonnes)
Nickel Prices, Consumption & Steel Production
2005 20072004 2006 2008 2009 20102001 2002 2003
Steel Globle production (million tonnes)
Nickel Consumption (000s tonnes)
2005 20072004 2006 2008 2009 20102001 2002 2003
A PwC & MCX Joint Endeavour 129www.mcxindia.com / www.pwc.com/in/en
DATABANK - NON-AGRI COMMODITIES
074-177_CYIB_2011_Non-Agri_Final.indd 129074-177_CYIB_2011_Non-Agri_Final.indd 129 1/18/2012 11:46:02 PM1/18/2012 11:46:02 PM

EDITORIALSPROLOGUE INDIAN ECONOMYEXPERTS' VIEWS
Steel fundamentals (million tonne, unless specified) 2010 2009 2008 2007 2006 2001Global
Crude steel production 1,417 1,232 1,329 1,347 1,247 851
Crude steel production Ex-China 791 659 829 857 828 699
Operating rate - crude steel (in %) 81 72 83 88 88 79
Crude steel consumption 1,386 1,216 1,309 1,325 1,239 854
Crude steel consumption Ex-China 786 645 856 885 846 683
Finished steel consumption 1,294 1,139 1,210 1,228 1,145 775
Ratio Finished/Crude - % 91 91 91 91 91 91
Finished steel use per capita (in kg) 164 174 188 199 194.4 150.4
China
Crude steel production 627 574 500 489 419 152
Finished steel consumption 576 548 435 423 378 158
Finished steel use per capita (in kg) 427 409 327 320 287.4 133.2
Exports of semi-finished and finished 41,646 23,969 56,304 66,357 51,706 7,276
steel products (thousand tonne)
Imports of semi-finished and finished 1,718 2,235 1,562 17,185 19,105 25,608
steel products (thousand tonne)
Steel scrap import (thousand tonne) 5,877 13,692 3,590 3,395 5,385 9,776
India
Crude steel production 68 64 58 53 49 27
Finished steel consumption 64 58 51 51 46 29
Finished steel use per capita (in kg) 51.7 47.8 45.1 45.8 41.2 30.2
Exports of semi-finished and finished 5850 5552 7485 6590 6870 3187
steel products (thousand tonne)
Imports of semi-finished and finished 9128 8288 6973 7700 5660 1775
steel products (thousand tonne)
Exports of finished steel products (thousand tonne) 4028 5011 5160 5479 4815 2394
Imports of finished steel products (thousand tonne) 8078 5872 6872 5338 4633 1143
Steel scrap import (thousand tonne) 3606 4727 4579 2990 3145 1100
Inventory levels - year-end (tonnes)
LME (billets) 56,485 20,020 45,955 - - -
SHFE (both rebar and wire rod) - on warrant 25,548 98,155 - - - -
Average daily price volatility (MCX spot prices) 1.00% 1.70% 1.70% 0.60% 0.70% -
Note: Average daily price volatility is for Bhavnagar variety except for Govindgargh variety for year 2010Source: Steel Statistical Yearbook 2008, 2009, 2010, 2011 and World Steel in fi gures 2011 by World Steel Association, USGS, DGCIS, MCX
Commodity Insights Yearbook 2011130
074-177_CYIB_2011_Non-Agri_Final.indd 130074-177_CYIB_2011_Non-Agri_Final.indd 130 1/18/2012 11:46:03 PM1/18/2012 11:46:03 PM

DATABANK - AGRI COMMODITIES
World trade in finished steel Year 2010 2009 2008 2007 2006 2001Production 1316.6 1147 1234.6 1251.4 1158.6 784.9
Exports 386.6 326.3 436.2 443.8 418.3 300.4
Exports % 29.4 28.4 35.3 35.5 36.1 38.3Source: World steel in fi gures 2011, Steel Statistical Yearbook 2011
Top 10 steel producing companies - 2010 Rank Member Company Production
1 ArcelorMittal 98.2
2 Baosteel 37.0
3 POSCO 35.4
4 Nippon Steel (2) 35.0
5 JFE 31.1
6 Jiangsu Shagang 23.2
7 Tata Steel (3) 23.2
8 U. S. Steel 22.3
9 Ansteel (4) 22.1
10 Gerdau 18.7
Note: (1) does not include member companies that are part of consolidations with non - members; (2) includes Osaka steel and Nippion steel & Sumikin steel corporation, but does not include Usiminas; (3) includes Natsteel; (4) does not include panzhihuaSource: World steel in fi gures 2011
Top 5 crude steel producers Country 2010 2009 2008 2007 2006 2001China 626.7 573.6 500.5 489.2 423 150.9
Japan 109.6 87.5 118.7 120.2 116.2 102.8
United States 80.5 58.2 91.4 98.2 98.6 90.1
India 68.3 63.5 55.2 53.1 49.5 27.2
Russia 66.9 60 68.5 72.4 70.8 58.9Source: World steel in fi gures 2011, 2008, 2006
Top 5 finished steel products consumers Country 2010 2009 2008 2007 2006 2001China 576 548.1 434.7 422.5 377.7 158
Unites States 80.1 59.2 98.4 108 119.6 106
Japan 63.8 52.8 77.9 81.2 79 73.2
India 60.6 55.3 51.4 51.5 45.6 28.5
South Korea 52.4 45.4 58.6 55.2 50.2 38.3Source: World steel in fi gures 2011, 2008
A PwC & MCX Joint Endeavour 131www.mcxindia.com / www.pwc.com/in/en
DATABANK - NON-AGRI COMMODITIES
074-177_CYIB_2011_Non-Agri_Final.indd 131074-177_CYIB_2011_Non-Agri_Final.indd 131 1/18/2012 11:46:03 PM1/18/2012 11:46:03 PM

EDITORIALSPROLOGUE INDIAN ECONOMYEXPERTS' VIEWS
World's Largest Steel Long Product Producers, early 2010 Company Base Capacity - million tonne/yr ArcelorMittal Group UK 51.2Gerdau Group Brazil 22.6Evrazholding Group Russia 18.7Tata Corus Group India 11.1Nippon Steel Group Japan 10.8JFE Steel Group Japan 10.0Nucor Group USA 9.4Hebei Steel Group China 8.9Riva Group Italy 8.8Shanghai Baosteel Group China 8.6Celsa Group Spain 8.5Metinvest Holding Group Ukraine 7.8Wuhan Iron & Steel Group China 7.5Hyundai Group Korea Republic 6.9Severstal Group Russia 6.8Shougang Beijing Group China 6.7NLMK Russia 6.7Sumitomo Group Japan 6.0Imidro Group Iran 5.3Jiangsu Shagang Group China 5.3Total World 663.2
Source: www.steelonthenet.com
World's largest steel flat product producers, early 2010 Company Base Capacity - million tonne/yr ArcelorMittal Group UK 104.0Shanghai Baosteel Group China 32.2JFE Steel Group Japan 31.5Nippon Steel Group Japan 30.8US Steel Group USA 28.6AnBen Group China 27.6Posco Group Korea Republic 27.1Thyssen Krupp Group Germany 20.8Severstal Group Russia 18.7Tata Corus Group India 17.1Wuhan Iron & Steel Group China 15.4China Steel Group Taiwan 13.5Jiangsu Shagang Group China 13.3MMK Russia 12.9Riva Group Italy 12.3Nucor Group USA 10.4AK Steel Group USA 9.3Hebei Steel Group China 9.2Erdemir Turkey 8.9NLMK Russia 8.8Total World 766.2
Source: www.steelonthenet.com
Commodity Insights Yearbook 2011132
074-177_CYIB_2011_Non-Agri_Final.indd 132074-177_CYIB_2011_Non-Agri_Final.indd 132 1/18/2012 11:46:03 PM1/18/2012 11:46:03 PM

DATABANK - AGRI COMMODITIES
Economic parameters impacting Steel prices 2010 2009 2008 2007 2006 2001Real GDP (annual % change)US 2.8 -2.6 1.1 2.0 2.9 0.8Japan 4.3 -6.3 -0.3 1.9 2.8 0.7Eurozone 1.8 -4.1 1.0 2.3 2.6 1.9China 10.3 9.2 9.0 11.5 11.1 8.3India 9.7 5.7 7.3 8.9 9.7 3.9OECD 2.8 -3.4 1.0 2.6 3.2 2.4
Consumer Price Inflation (annual % change) US 1.6 -0.3 1.0 2.5 2.7 2.8Japan -0.9 -1.4 0.5 1.4 0.3 -0.7Eurozone 1.5 0.3 1.0 3.0 2.2 2.4China 3.1 0.8 3.0 5.9 2.0 -0.1India 13.2 10.9 5.0 7.0 6.7 5.2OECD 1.5 0.1 1.0 3.0 2.2 2.8
Industrial Output (annual % change) US 7.0 -2.9 -11.3 1.5 3.0 -3.7Japan 15.4 -21.3 -3.3 2.8 4.4 -6.3Eurozone 8.9 -3.7 -12.4 1.3 3.9 0.4China 15.7 11.0 12.9 17.4 15.4 9.9India 2.5 18.0 0.5 7.6 10.3 2.1OECD 7.9 -12.3 -2.1 3.3 3.8 -2.2
Interest Rates (%) US 0.1 0.1 0.1 4.3 6.3 1.3Japan 0.3 0.3 0.3 0.8 0.4 0.1Eurozone 1.8 1.8 3.0 5.0 4.5 4.3China 3.3 2.8 2.8 3.3 3.3 3.2India (repo rate ) 6.3 4.8 6.5 7.8 7.3 8.5
Money Supply (annual % change) US 3.4 3.5 10.0 6.1 5.9 10.5Japan 2.3 3.1 1.8 2.1 0.7 3.3Eurozone 1.7 -0.4 7.6 11.6 10.0 8.0China 19.7 27.7 17.8 16.7 16.9 14.4India 19.1 17.7 19.9 22.8 19.3 13.6
Equity Index (end of period) US (Dow Jones) 11578 10428 8776 13265 12463 10022India (Sensex) 20509 17464 9647 20287 13787 3262
OECD indicators (annual % change) OECD total monetary aggr. & comp. broad money index 3.2 6.7 8.9 8.5 7.3 9.2OECD Total PPI Economic Activities Domestic Manufacturing 3.8 -4.0 6.8 3.2 3.7 2.0OECD Total CPI OECD Groups Total Energy 7.8 -10.4 12.4 4.0 9.3 4.9OECD Total Registration of Passenger Cars 0.5 -5.4 -7.9 -0.6 0.1 -0.8 US ISM Manufacturing Index 58.5 56.4 33.3 49 52 45.3US auto sales (YoY % change) 11.1 15.1 -35.6 -2.9 -3.6 5.6US pending home sales (YoY % change) -3.3 9.2 5.7 -23.9 -6.3 -
Note: Interest rates mentioned are central Bank discount rate. For India, interest rates mentioned are repo ratesSource: OECD, IMF, CPM Gold Yearbook, World Bank, Various Central Banks, BSE, NYSE
A PwC & MCX Joint Endeavour 133www.mcxindia.com / www.pwc.com/in/en
DATABANK - NON-AGRI COMMODITIES
074-177_CYIB_2011_Non-Agri_Final.indd 133074-177_CYIB_2011_Non-Agri_Final.indd 133 1/18/2012 11:46:03 PM1/18/2012 11:46:03 PM

EDITORIALSPROLOGUE INDIAN ECONOMYEXPERTS' VIEWS
Steel prices
Month MCX spot prices (Rs/tonne) - monthly average LME 3-month steel billet prices (USD/tonne) Steel fl at Steel long Steel long Steel long Open High Low Close cash
Mumbai Govindgargh* Bhavnagar Ghaziabad* MDec-10 - 27036.0 - 26890.4 523.0 565.0 510.0 570.0 Nov-10 - 25896.2 - 25828.1 515.0 523.0 506.5 520.0 Oct-10 - 26058.0 - 25743.6 460.0 508.0 430.0 500.5 Sep-10 - 25825.6 - 25060.8 500.0 529.0 440.0 457.5 Aug-10 - 25425.4 - 24534.6 495.0 513.0 490.0 501.0 Jul-10 31414.1 25077.4 26487.0 24154.8 430.0 500.0 420.0 499.5 Jun-10 32091.9 25170.2 26051.2 24191.2 430.0 445.0 400.0 430.0 May-10 35066.8 25528.4 26739.2 25009.2 530.0 530.0 419.0 465.0 Apr-10 36859.6 27464.4 29698.8 26996.0 600.0 620.0 485.0 525.0 Mar-10 33500.0 26555.0 28794.8 26368.8 450.0 617.5 448.0 586.5 Feb-10 30864.6 24420.8 26014.6 23550.4 415.0 450.0 415.0 448.5 Jan-10 31512.0 25626.8 27350 25305.6 418.0 448.0 412.0 412.5 Dec-09 30394.2 23819.2 24493.5 23656.2 400.0 413.0 390.0 409.5 Nov-09 29891.3 21765.4 21680.8 20884.2 370.0 430.0 370.0 405.0 Oct-09 30555.8 22646.2 21244 21708.1 395.0 395.0 365.0 370.0 Sep-09 31791.2 23698.6 23973.1 23355.8 410.0 420.5 405.0 435.0 Aug-09 30840.8 22521.2 22542.4 21490.0 400.0 415.0 400.0 405.0 Jul-09 29895.6 21825.9 21645.6 20828.1 390.0 391.0 356.5 385.0 Jun-09 28941.2 23045.8 22721.1 25131.9 339.0 395.0 339.0 385.0 May-09 29228.4 24907.6 24169.2 24959.7 330.0 350.0 325.0 322.5 Apr-09 28988.7 24268.7 24018.7 - 309.0 335.0 295.0 325.0 Mar-09 28746.4 23994.0 23288.0 - 275.0 329.0 255.0 325.0 Feb-09 29077.9 23875.0 24286.1 - 320.0 336.0 282.0 295.0 Jan-09 30493.5 23891.0 25275.0 - 385.0 385.0 305.0 340.0 Dec-08 31469.6 24796.9 26241.9 - 330.0 390.0 320.0 380.0 Nov-08 33698.3 24749.3 26794.3 - 290.0 445.0 279.0 320.0 Oct-08 39318.8 25269.2 27575.0 - 515.0 515.0 260.0 290.0 Sep-08 44000.4 30859.8 33484.0 - 700.0 700.0 470.0 515.0 Aug-08 46249.2 31793.8 35121.2 - 960.0 960.0 685.0 685.0 Jul-08 45685.6 35268.1 39732.2 - 1170.0 1200.0 965.0 950.0 Jun-08 41267.2 34717.8 38567.4 - 1175.0 1270.0 1175.0 1195.0 May-08 36203.0 31200.0 33346.4 - 1030.0 1185.0 1030.0 1192.5 Apr-08 35869.6 - 35613.8 - 1005.0 1010.0 985.0 1015.0 Mar-08 34782.9 - 36557.9 - - - - - Feb-08 31102.9 - 31865.6 - - - - - Jan-08 29095.0 - 28416.2 - - - - - Dec-07 28042.8 - 25830.4 - - - - - Nov-07 28057.6 - 25452.4 - - - - - Oct-07 28290.4 - 25478.1 - - - - - Sep-07 28472.5 - 24813.8 - - - - - Aug-07 27730.0 - 23763.1 - - - - - Jul-07 27663.1 24331.9 22472.3 - - - - - Jun-07 28238.1 25001.0 23190.0 - - - - - May-07 29248.5 25097.4 24160.4 - - - - - Apr-07 29830.4 25349.6 25022.1 - - - - - Mar-07 29385.8 24304.6 23968.1 - - - - - Feb-07 27342.9 23693.8 23292.5 - - - - - Jan-07 26391.5 23401.2 22804.2 - - - - - Dec-06 26444.4 22528.4 21661.6 - - - - - Nov-06 26716.2 22315.8 21413.8 - - - - - Oct-06 26469.2 22380.8 21426.2 - - - - - Sep-06 26737.3 21717.7 20827.3 - - - - - Aug-06 27232.3 21463.1 19416.9 - - - - - Jul-06 26954.4 21021.6 19009.2 - - - - - Jun-06 26045.8 20390.8 19041.2 - - - - - May-06 26019.3 20937.4 20071.1 - - - - - Apr-06 24874.5 21848.3 21438.3 - - - - -
Note: * Monthly average for March 2011 is for daily spot prices till Mar 18 2011; LME Mediterranean variety has been renamed as Steel billet; Future prices are for near month continuous futures contSource: Exchanges’ websites, RBI
Commodity Insights Yearbook 2011134
074-177_CYIB_2011_Non-Agri_Final.indd 134074-177_CYIB_2011_Non-Agri_Final.indd 134 1/18/2012 11:46:03 PM1/18/2012 11:46:03 PM
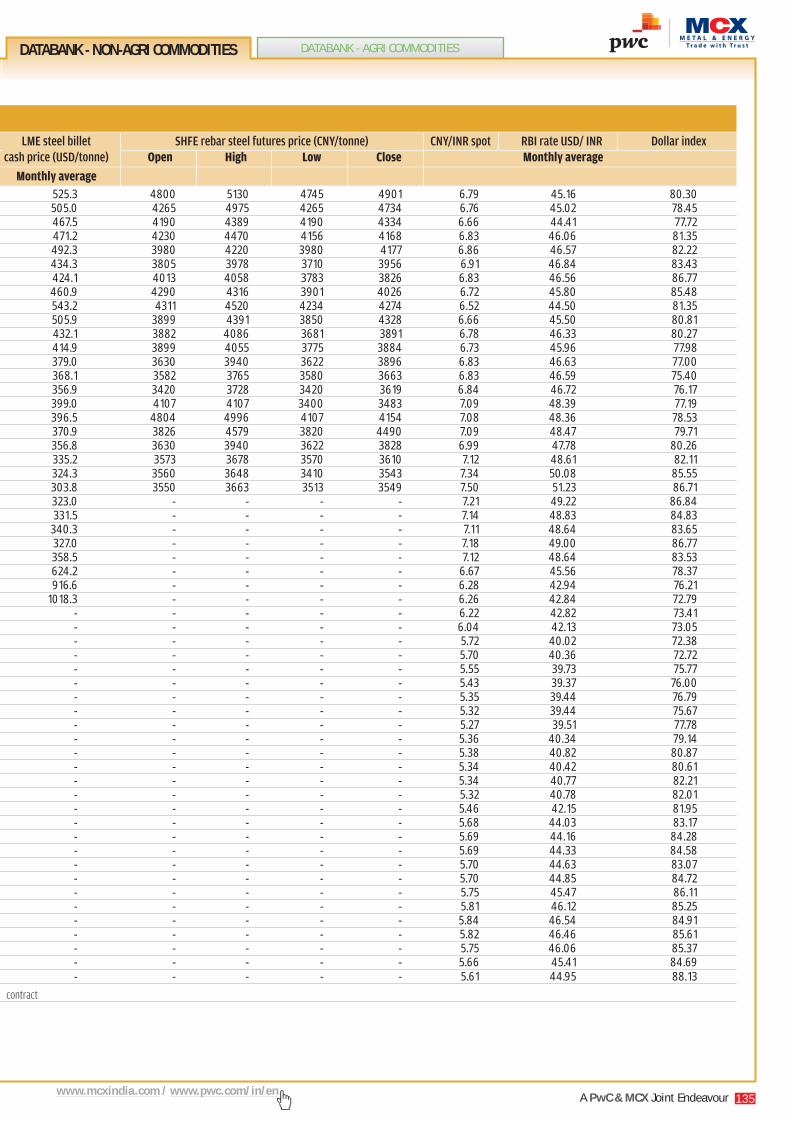
DATABANK - AGRI COMMODITIES
LME steel billet SHFE rebar steel futures price (CNY/tonne) CNY/INR spot RBI rate USD/ INR Dollar indexe cash price (USD/tonne) Open High Low Close Monthly average
Monthly average0 525.3 4800 5130 4745 4901 6.79 45.16 80.300 505.0 4265 4975 4265 4734 6.76 45.02 78.455 467.5 4190 4389 4190 4334 6.66 44.41 77.725 471.2 4230 4470 4156 4168 6.83 46.06 81.350 492.3 3980 4220 3980 4177 6.86 46.57 82.225 434.3 3805 3978 3710 3956 6.91 46.84 83.430 424.1 4013 4058 3783 3826 6.83 46.56 86.770 460.9 4290 4316 3901 4026 6.72 45.80 85.480 543.2 4311 4520 4234 4274 6.52 44.50 81.355 505.9 3899 4391 3850 4328 6.66 45.50 80.815 432.1 3882 4086 3681 3891 6.78 46.33 80.275 414.9 3899 4055 3775 3884 6.73 45.96 77.985 379.0 3630 3940 3622 3896 6.83 46.63 77.000 368.1 3582 3765 3580 3663 6.83 46.59 75.400 356.9 3420 3728 3420 3619 6.84 46.72 76.170 399.0 4107 4107 3400 3483 7.09 48.39 77.190 396.5 4804 4996 4107 4154 7.08 48.36 78.530 370.9 3826 4579 3820 4490 7.09 48.47 79.710 356.8 3630 3940 3622 3828 6.99 47.78 80.265 335.2 3573 3678 3570 3610 7.12 48.61 82.110 324.3 3560 3648 3410 3543 7.34 50.08 85.550 303.8 3550 3663 3513 3549 7.50 51.23 86.710 323.0 - - - - 7.21 49.22 86.840 331.5 - - - - 7.14 48.83 84.830 340.3 - - - - 7.11 48.64 83.650 327.0 - - - - 7.18 49.00 86.770 358.5 - - - - 7.12 48.64 83.530 624.2 - - - - 6.67 45.56 78.370 916.6 - - - - 6.28 42.94 76.210 1018.3 - - - - 6.26 42.84 72.790 - - - - - 6.22 42.82 73.415 - - - - - 6.04 42.13 73.050 - - - - - 5.72 40.02 72.38- - - - - - 5.70 40.36 72.72- - - - - - 5.55 39.73 75.77- - - - - - 5.43 39.37 76.00- - - - - - 5.35 39.44 76.79- - - - - - 5.32 39.44 75.67- - - - - - 5.27 39.51 77.78- - - - - - 5.36 40.34 79.14- - - - - - 5.38 40.82 80.87- - - - - - 5.34 40.42 80.61- - - - - - 5.34 40.77 82.21- - - - - - 5.32 40.78 82.01- - - - - - 5.46 42.15 81.95- - - - - - 5.68 44.03 83.17- - - - - - 5.69 44.16 84.28- - - - - - 5.69 44.33 84.58- - - - - - 5.70 44.63 83.07- - - - - - 5.70 44.85 84.72- - - - - - 5.75 45.47 86.11- - - - - - 5.81 46.12 85.25- - - - - - 5.84 46.54 84.91- - - - - - 5.82 46.46 85.61- - - - - - 5.75 46.06 85.37- - - - - - 5.66 45.41 84.69- - - - - - 5.61 44.95 88.13
ures contract
A PwC & MCX Joint Endeavour 135www.mcxindia.com / www.pwc.com/in/en
DATABANK - NON-AGRI COMMODITIES
074-177_CYIB_2011_Non-Agri_Final.indd 135074-177_CYIB_2011_Non-Agri_Final.indd 135 1/18/2012 11:46:03 PM1/18/2012 11:46:03 PM

EDITORIALSPROLOGUE INDIAN ECONOMYEXPERTS' VIEWS
Steel trading activityMonth MCX (includes all variety) LME (Steel billet)* SHFE (both rebar and wire rod)
Volume Open Interest Volume Open Interest Volume Open InterestDec-10 10 0 30751 2016 9375458 759172Nov-10 0 0 16436 2940 13913936 667316Oct-10 0 0 13338 2703 12822910 710256Sep-10 0 0 27788 2607 20530772 721192Aug-10 3 0 24853 2105 7398968 801040Jul-10 11 0 18906 2110 6697108 726906Jun-10 0 0 14765 2314 13047716 654038May-10 0 0 13788 3049 44190516 745156Apr-10 0 0 11961 2914 33046512 1238872Mar-10 553 81 10531 2171 39041962 1144976Feb-10 257 72 3446 1630 48381742 1389604Jan-10 668 85 3006 1223 47396698 1693396Dec-09 551 105 3530 863 35997614 1115356Nov-09 790 129 2596 432 60370258 1405582Oct-09 2203 180 2212 285 32810986 1378516Sep-09 2505 192 3058 215 43339018 1465266Aug-09 3871 354 4000 369 17659134 1294606Jul-09 3290 107 3226 486 27536738 1255514Jun-09 1341 43 2446 567 49035710 1404462May-09 1194 40 1645 635 76237438 1334556Apr-09 0 0 2267 591 58766414 1323970Mar-09 24 0 1756 704 58070196 818050Feb-09 0 0 2156 640 11889604 1041490Jan-09 1 0 1994 922 8529956 621794Dec-08 5 0 1424 856 7208178 437314Nov-08 6 0 3165 1118 2289560 381120Oct-08 0 0 2302 1239 3782594 343170Sep-08 0 0 4203 1024 192346 59946Aug-08 5 0 1740 826 - -Jul-08 12 4 761 550 - -Jun-08 60 3 517 358 - -May-08 100 14 475 186 - -Apr-08 0 0 311 85 - -Mar-08 0 0 162 - - -Feb-08 0 0 128 - - -Jan-08 2 0 - - - -Dec-07 0 0 - - - -Nov-07 0 0 - - - -Oct-07 0 0 - - - -Sep-07 0 0 - - - -Aug-07 0 0 - - - -Jul-07 0 0 - - - -Jun-07 0 0 - - - -May-07 0 0 - - - -Apr-07 0 0 - - - -Mar-07 0 0 - - - -Feb-07 0 0 - - - -Jan-07 441 0 - - - -Dec-06 1111 110 - - - -Nov-06 1101 41 - - - -Oct-06 2270 4 - - - -Sep-06 2038 27 - - - -Aug-06 1364 58 - - - -Jul-06 1828 108 - - - -Jun-06 2013 49 - - - -May-06 940 43 - - - -Apr-06 1162 87 - - - -
Note: Vol and OI in lots; Aggregate volume in all contracts during the month; Cumulative open interest in all contracts at the month-end; LME volume and open interest are for both Mediterranean variety (renamed as steel billet) and Far East variety (now delisted); * LME Steel billet Futures Volume Total and Open Interest Total (All currencies)Source: Exchanges’ websites
Commodity Insights Yearbook 2011136
074-177_CYIB_2011_Non-Agri_Final.indd 136074-177_CYIB_2011_Non-Agri_Final.indd 136 1/18/2012 11:46:03 PM1/18/2012 11:46:03 PM

DATABANK - AGRI COMMODITIES
Others32%
Japan8%
China45%
China44%
Others35%
South Korea4%
USA6%
Russia5%
Japan5%
India5%
United States6%
India5%
Crude Steel Production (2010) Finished Steel Consumption (2010)
Source: World Steel In Figures 2011 Source: World Steel in Figures 2011
Source: Steel Statistical Year Book 2011, The Conference Board, WSA, World Bank
Million tonnesYoY (%)9
7
5
3
1
-1
1400
1250
1100
950
800
650
500
Globle Demand (crude steel)-LHS GlOble GDP (%)
Globle GDP developing market (%)
Steel Demand & GDP Growth in World & Developing Market
14
12
11
9
8
6
50
Globle Demand (crude steel) LHS GlOble GDP (%)
Globle GDP developing market (%)
Dec-01 Dec-02 Dec-03 Dec-04 Dec-05 Dec-06 Dec-07 Dec-08 Dec-09 Dec-10
Average : 6.1%
Average : 3.7%
CAGR: 5.5%
A PwC & MCX Joint Endeavour 137www.mcxindia.com / www.pwc.com/in/en
DATABANK - NON-AGRI COMMODITIES
074-177_CYIB_2011_Non-Agri_Final.indd 137074-177_CYIB_2011_Non-Agri_Final.indd 137 1/18/2012 11:46:03 PM1/18/2012 11:46:03 PM

EDITORIALSPROLOGUE INDIAN ECONOMYEXPERTS' VIEWS
Zinc fundamentals (`000' tonne) 2010 2009 2008 2007 2006 2001
Global
World mine production (zinc content of concentrate) 12220 11371 11677 10900 10300 8910World smelter production 12670 11100 11660 11452 10826 9270Of which: Primary 11980 10480 11020 4780 4670 4230Secondary 68000 620 640 362 416 295Undifferentiated - - - 6310 5740 4750 Refined zinc consumption 12440 10854 11436 11333 10995 8920
China
Mine production 3700 3100 3200 3040 2840 1700Smelter production (primary & secondary) 5150 4360 4000 3740 3170 2040 Refined zinc consumption 5350 4700 4140 3560 3150 1499 Zinc slab imports 35.2 19.1 3.3 4.7 41.9 2.2Zinc slab exports 3.3 12.1 4.8 11.7 80.9 42.2
India
Mine production 740 695 614 539 502 146Smelter production 700 582 568 454 444 232Of which: Primary - 560 546 431 421 207Secondary - 22 22 23 23 25
Refined zinc consumption 525 515 500 450 425 285
Zinc slab imports 4.1 5.9 3 3.9 7.2 -Zinc slab exports 39.1 17.6 29.7 4.6 37.2 4.7
Inventory levels - year-end
LME 701.43 488.05 253.5 89.15 88.45 433.38SHFE 310.74 171.9 63.53 54.4 - - Average daily volatility (MCX spot prices) 2.20% 2.30% 2.70% 2.30% 3.90% -
Source: ILZSG; USGS; WBMS; Exchanges' websites; Thomson Reuters GFMS; DGCIS
Top 5 refined zinc producers Country 2010 2009 2008 2007 2006
China 5164 4286 4042 3743 3163South Korea 750 722 739 691 667India 735 640 589 441 415Canada 691 686 764 802 824Japan 574 541 616 598 614
Source: Thomson Reuters GFMS, ILZSG;
Top 5 refined zinc consumers Country 2010 2009 2008 2007 2006China 5350 4700 4140 3560 3150United States 890 912 1003 1016 1153South Korea 554 465 504 512 534India 525 515 500 450 425Japan 516 433 564 588 594
Source: Thomson Reuters GFMS, ILZSG;
Commodity Insights Yearbook 2011138
074-177_CYIB_2011_Non-Agri_Final.indd 138074-177_CYIB_2011_Non-Agri_Final.indd 138 1/18/2012 11:46:05 PM1/18/2012 11:46:05 PM

DATABANK - AGRI COMMODITIES
Top zinc miners in Western World - 2010 Rank Name Production1 Glencore 7342 Hindustan Zinc 7143 Xstrata (free float) 6664 Minmetals Australia (MMG) 6645 Teck Resources 646
Source: ILZSG, CRU Group, Reuters
Top refined zinc producers in WesternWorld - 2010 Rank Name Production1 Nyrstar 10772 Korea Zinc Group 9403 Hindustan Zinc 6694 Votorantim 4885 Boliden 456
Source: ILZSG, CRU Group, Reuters
Economic parameters Impacting zinc prices 2010 2009 2008 2007 2006 2001Real GDP (annual % change) US 2.8 -2.6 1.1 2 2.9 0.8Japan 4.3 -6.3 -0.3 1.9 2.8 0.7Eurozone 1.8 -4.1 1 2.3 2.6 1.9China 10.3 9.2 9 11.5 11.1 8.3India 9.7 5.7 7.3 8.9 9.7 3.9OECD 2.8 -3.4 1 2.6 3.2 2.4
Consumer Price Inflation (annual % change) US 1.6 -0.3 1 2.5 2.7 2.8Japan -0.9 -1.4 0.5 1.4 0.3 -0.7Eurozone 1.5 0.3 1 3 2.2 2.4China 3.1 0.8 3 5.9 2 -0.1India 13.2 10.9 5 7 6.7 5.2OECD 1.5 0.1 1 3 2.2 2.8
Industrial Output (annual % change) US 7 -2.9 -11.3 1.5 3 -3.7Japan 15.4 -21.3 -3.3 2.8 4.4 -6.3Eurozone 8.9 -3.7 -12.4 1.3 3.9 0.4China 15.7 11 12.9 17.4 15.4 9.9India 2.5 18 0.5 7.6 10.3 2.1OECD 7.9 -12.3 -2.1 3.3 3.8 -2.2
Interest rates (%) US 0.1 0.1 0.1 4.3 6.3 1.3Japan 0.3 0.3 0.3 0.8 0.4 0.1Eurozone 1.8 1.8 3 5 4.5 4.3China 3.3 2.8 2.8 3.3 3.3 3.2India (repo rate ) 6.3 4.8 6.5 7.8 7.3 8.5
Money Supply (annual % change) US 3.4 3.5 10 6.1 5.9 10.5Japan 2.3 3.1 1.8 2.1 0.7 3.3Eurozone 1.7 -0.4 7.6 11.6 10 8.0China 19.7 27.7 17.8 16.7 16.9 14.4India 19.1 17.7 19.9 22.8 19.3 13.6
Equity Index (end of period) US (Dow Jones) 11578 10428 8776 13265 12463 10022India (Sensex) 20509 17464 9647 20287 13787 3262
OECD indicators (annual % change) OECD total monetary aggr. & comp. broad money index 3.2 6.7 8.9 8.5 7.3 9.2OECD Total PPI Economic Activities Domestic Manufacturing 3.8 -4 6.8 3.2 3.7 2.0OECD Total CPI OECD Groups Total Energy 7.8 -10.4 12.4 4 9.3 4.9OECD Total Registration of Passenger Cars 0.5 -5.4 -7.9 -0.6 0.1 -0.8
US ISM Manufacturing Index 58.5 56.4 33.3 49 52 45.3US auto sales (YoY % change) 11.1 15.1 -35.6 -2.9 -3.6 5.6US pending home sales (YoY % change) -3.3 9.2 5.7 -23.9 -6.3 -
Note: Interest rates mentioned are central Bank discount rate. For India, interest rates mentioned are repo ratesSource: OECD, IMF, CPM Gold Yearbook, World Bank, Various Central Banks, BSE, NYSE
A PwC & MCX Joint Endeavour 139www.mcxindia.com / www.pwc.com/in/en
DATABANK - NON-AGRI COMMODITIES
074-177_CYIB_2011_Non-Agri_Final.indd 139074-177_CYIB_2011_Non-Agri_Final.indd 139 1/18/2012 11:46:05 PM1/18/2012 11:46:05 PM

EDITORIALSPROLOGUE INDIAN ECONOMYEXPERTS' VIEWS
Zinc pricesMonth MCX futures prices - 5 MT contract (Rs/kg) MCX spot price (Rs/kg) LME 3-month price (USD/tonne) L Open High Low Close Monthly average Open High Low Close Dec-10 98.30 109.05 97.70 108.85 102.78 2115.00 2455.00 2110.00 2454.00 Nov-10 109.50 114.65 93.40 96.85 102.55 2430.00 2599.00 2019.50 2112.00 Oct-10 99.25 115.60 98.45 106.45 105.32 2186.00 2638.75 2186.00 2423.00 Sep-10 97.50 103.40 96.80 97.55 99.45 2066.00 2284.75 2066.00 2195.00 Aug-10 93.10 99.55 90.65 96.00 95.13 2005.00 2179.00 1951.00 2065.00 Jul-10 82.70 92.05 81.55 91.40 86.56 1771.00 2025.00 1736.50 2025.00 Jun-10 88.90 89.05 74.35 80.60 80.88 1930.00 1930.00 1577.00 1792.50 May-10 101.20 101.85 83.45 88.40 90.71 2275.00 2290.00 1823.75 1936.00 Apr-10 106.45 111.85 99.10 100.05 105.69 2370.00 2550.00 2260.00 2285.00 Mar-10 101.90 108.80 99.15 106.45 103.50 2245.00 2425.00 2175.00 2375.00 Feb-10 97.55 109.45 90.85 99.70 99.80 2110.00 2394.00 1935.00 2195.00 Jan-10 118.70 123.20 96.65 98.35 111.90 2588.00 2736.00 2097.00 2110.00 Dec-09 106.10 120.65 104.75 120.00 111.40 2310.00 2615.00 2260.00 2560.00 Nov-09 102.40 106.55 98.60 103.50 102.00 2160.00 2328.75 2126.25 2322.00 Oct-09 92.75 109.00 87.85 102.95 97.00 1950.00 2365.75 1855.00 2160.00 Sep-09 89.80 97.15 87.10 91.85 91.00 1850.00 2015.00 1781.00 1969.00 Aug-09 83.60 92.40 83.60 88.90 87.80 1750.00 1948.00 1750.00 1881.00 Jul-09 74.80 83.70 71.05 83.20 76.30 1543.00 1764.00 1440.00 1750.00 Jun-09 73.35 80.90 71.00 74.30 74.70 1567.00 1720.25 1487.00 1549.00 May-09 72.90 80.05 67.35 71.35 72.20 1425.00 1638.00 1420.00 1567.00 Apr-09 66.30 76.80 65.15 69.05 69.10 1322.00 1566.00 1281.50 1425.00 Mar-09 57.50 67.50 56.75 66.30 62.41 1125.00 1359.00 1090.00 1320.00 Feb-09 54.25 59.15 52.60 54.60 54.79 1120.00 1229.00 1070.00 1128.00 Jan-09 58.60 65.90 53.30 54.00 57.82 1220.00 1365.00 1089.75 1096.50 Dec-08 60.80 62.15 49.85 54.35 53.43 1200.00 1225.00 1038.00 1208.00 Nov-08 58.50 63.95 52.40 59.60 56.44 1168.00 1310.00 1077.00 1210.00 Oct-08 80.00 80.30 52.50 53.90 62.00 1684.00 1699.00 1076.00 1125.00 Sep-08 79.95 86.95 75.25 77.70 79.36 1834.50 1905.00 1633.00 1680.00 Aug-08 81.60 82.05 68.90 75.35 74.41 1904.75 1905.00 1605.00 1811.00 Jul-08 84.00 90.70 76.25 81.00 79.25 1936.00 2120.00 1750.00 1902.00 Jun-08 85.35 86.25 79.60 80.35 81.14 2013.00 2025.00 1850.00 1932.00 May-08 88.80 99.90 82.25 84.25 91.32 2255.00 2374.50 1955.00 2005.00 Apr-08 92.00 96.45 87.50 88.80 90.44 2313.00 2420.00 2206.00 2230.00 Mar-08 110.10 116.75 90.85 92.00 101.29 2750.00 2900.00 2252.00 2320.00 Feb-08 98.05 112.10 91.70 108.60 96.67 2500.00 2824.00 2310.00 2740.00 Jan-08 93.35 102.60 85.40 94.20 92.18 2380.00 2605.95 2150.00 2515.00 Dec-07 102.35 103.35 89.30 90.15 93.32 2645.00 2645.00 2251.00 2370.00 Nov-07 113.40 113.90 86.00 100.40 100.76 2818.00 2870.00 2135.00 2595.00 Oct-07 124.20 126.50 109.45 109.85 117.68 3060.00 3205.00 2811.00 2825.00 Sep-07 128.15 128.85 113.20 121.55 116.75 3100.00 3120.00 2680.00 3050.00 Aug-07 144.75 145.90 123.45 125.65 132.46 3525.00 3570.00 2949.80 3110.00 Jul-07 142.50 152.85 137.50 145.20 143.25 3360.00 3780.00 3351.00 3545.00 Jun-07 151.30 157.20 133.95 134.45 146.60 3710.00 3850.00 3290.00 3350.00 May-07 161.60 170.85 143.80 150.05 156.58 3742.00 4170.50 3535.00 3695.00 Apr-07 144.60 158.80 140.25 152.30 149.88 3275.00 3845.00 3119.85 3756.00 Mar-07 157.10 160.10 138.20 142.90 143.98 3505.00 3575.00 3119.75 3255.00 Feb-07 159.60 162.75 137.60 153.70 146.27 3490.00 3775.00 2990.00 3480.00 Jan-07 191.10 191.90 149.75 151.95 170.02 4230.00 4270.00 3340.00 3480.00 Dec-06 199.60 205.50 185.50 191.50 195.90 4365.00 4548.00 4120.50 4230.00 Nov-06 190.70 208.30 182.45 196.50 196.45 4220.00 4580.00 3975.00 4375.00 Oct-06 155.50 196.00 152.85 193.25 174.83 3360.00 4290.00 3260.00 4220.00 Sep-06 158.65 172.10 147.25 154.15 157.41 3420.00 3740.00 3140.00 3330.00 Aug-06 158.60 164.35 150.60 155.65 154.45 3400.00 3545.00 3190.00 3450.00 Jul-06 150.45 168.75 145.60 157.00 155.60 3260.00 3620.00 3065.00 3415.00 Jun-06 171.25 173.00 132.10 150.15 149.05 3595.00 3670.00 2810.00 3220.00 May-06 154.25 180.95 136.50 180.55 161.84 3250.00 4000.00 3100.00 3670.00 Apr-06 130.50 171.20 123.70 144.65 138.15 2660.00 3445.00 2620.00 3175.00
Note: Future prices are for near month continuous futures contract Source: Exchanges’ websites, RBI
Commodity Insights Yearbook 2011140
074-177_CYIB_2011_Non-Agri_Final.indd 140074-177_CYIB_2011_Non-Agri_Final.indd 140 1/18/2012 11:46:05 PM1/18/2012 11:46:05 PM

DATABANK - AGRI COMMODITIES
LME cash (USD/tonne) RBI rate - USD/INR SHFE futures price (Yuan/tonne) CNY/INR spot Dollar IndexMonthly average Open High Low Close Monthly average
0 2287.32 45.16 17000 19240 16995 19070 6.79 80.300 2283.30 45.02 19000 20500 16005 16885 6.76 78.450 2373.56 44.41 17745 21100 17650 19255 6.66 77.720 2150.94 46.06 16950 17945 16360 17310 6.83 81.350 2047.48 46.57 16250 17440 16150 16895 6.86 82.220 1847.03 46.84 14570 16100 14350 15950 6.91 83.430 1746.51 46.56 15570 15620 12655 14405 6.83 86.770 1969.79 45.80 17720 17845 14435 15650 6.72 85.480 2367.50 44.50 18520 19205 17640 17940 6.52 81.350 2277.00 45.50 18380 18830 17600 18475 6.66 80.810 2159.00 46.33 17210 19090 16515 17950 6.78 80.270 2415.00 45.96 21095 21990 17100 17610 6.73 77.980 2374.00 46.63 18100 20930 17360 20805 6.83 77.000 2197.00 46.59 16240 18145 15705 17690 6.83 75.400 2071.00 46.72 15715 16980 15200 16470 6.84 76.170 1879.00 48.39 14800 15510 14360 15045 7.09 77.190 1818.00 48.36 14500 15600 13700 14740 7.08 78.530 1581.00 48.47 13230 14365 12625 14255 7.09 79.710 1557.00 47.78 12900 14000 12765 13325 6.99 80.260 1493.00 48.61 12900 13395 12315 12645 7.12 82.110 1388.00 50.08 11800 13890 11740 12405 7.34 85.550 1223.22 51.23 10425 11940 10410 11675 7.50 86.710 1118.00 49.22 11290 11290 10080 10430 7.21 86.840 1202.52 48.83 10625 11600 10220 10565 7.14 84.830 1112.90 48.64 9420 10290 8780 10025 7.11 83.650 1169.36 49.00 9080 9760 8850 9395 7.18 86.770 1303.00 48.64 13880 13880 8420 8930 7.12 83.530 1744.52 45.56 14320 14450 13495 14045 6.67 78.370 1734.65 42.94 15400 15800 13465 14180 6.28 76.210 1856.45 42.84 16300 16870 15000 15535 6.26 72.790 1906.17 42.82 15625 17000 15500 16130 6.22 73.410 2178.33 42.13 18000 19140 16625 16625 6.04 73.050 2278.51 40.02 19000 19495 18000 18220 5.72 72.380 2511.18 40.36 21600 22815 18650 19350 5.70 72.720 2458.48 39.73 20495 21990 18785 21530 5.55 75.770 2364.41 39.37 19645 20900 17455 19710 5.43 76.000 2378.60 39.44 19450 20005 17900 19245 5.35 76.790 2554.60 39.44 25280 25305 17000 19795 5.32 75.670 2979.99 39.51 27000 27300 24780 25620 5.27 77.780 2887.60 40.34 28650 28790 26520 27315 5.36 79.140 3244.17 40.82 28750 29235 26330 28385 5.38 80.870 3546.30 40.42 26480 29700 25780 28660 5.34 80.610 3628.65 40.77 31010 31095 24315 26480 5.34 82.210 3847.52 40.78 33705 35590 28900 30520 5.32 82.010 3566.86 42.15 29390 34100 28660 32410 5.46 81.950 3256.18 44.03 28600 29870 28580 29365 5.68 83.170 3321.38 44.16 - - - - 5.69 84.280 3784.86 44.33 - - - - 5.69 84.580 4381.45 44.63 - - - - 5.70 83.070 4378.61 44.85 - - - - 5.70 84.720 3829.60 45.47 - - - - 5.75 86.110 3394.06 46.12 - - - - 5.81 85.250 3339.97 46.54 - - - - 5.84 84.910 3320.74 46.46 - - - - 5.82 85.610 3197.59 46.06 - - - - 5.75 85.370 3544.64 45.41 - - - - 5.66 84.690 3068.34 44.95 - - - - 5.61 88.13
A PwC & MCX Joint Endeavour 141www.mcxindia.com / www.pwc.com/in/en
DATABANK - NON-AGRI COMMODITIES
074-177_CYIB_2011_Non-Agri_Final.indd 141074-177_CYIB_2011_Non-Agri_Final.indd 141 1/18/2012 11:46:05 PM1/18/2012 11:46:05 PM

EDITORIALSPROLOGUE INDIAN ECONOMYEXPERTS' VIEWS
Zinc trading activityMonth MCX^ LME* SHFE Volume Open Interest Volume Open Interest Volume Open InterestDec-10 1285750 16941 1418459 334465 17512636 402422Nov-10 1439267 24362 1635615 337832 33356318 418454Oct-10 1314534 11261 1397327 325245 21957878 467756Sep-10 1226783 21233 1380133 324599 27907392 322180Aug-10 1231814 11259 1548085 345042 34830044 518878Jul-10 938520 9936 1417690 336532 44844764 478570Jun-10 1033329 16947 1604146 349848 37597902 479144May-10 743169 8543 1617765 357703 21269414 455844Apr-10 669128 7988 1576565 334825 10050616 321116Mar-10 720220 4584 1550316 317294 15390678 305288Feb-10 725893 4695 1343827 310659 12264356 297914Jan-10 598807 4281 1421131 300274 12490124 300870Dec-09 431072 9955 1379038 309313 8101628 257586Nov-09 386839 4658 1237611 314033 6965304 243588Oct-09 464102 3682 1445559 338919 4321796 217926Sep-09 396556 4996 1265179 312891 4754316 131114Aug-09 397665 3718 1255210 313135 5694002 174108Jul-09 385926 4367 1212974 305102 5490288 200596Jun-09 401199 7108 1428267 328341 5106474 199196May-09 299304 4352 1159741 322081 5493170 196906Apr-09 251359 3111 1414154 312663 6507700 223266Mar-09 208772 2740 884436 307105 4241702 234574Feb-09 155974 2601 780222 391553 3636084 240004Jan-09 254582 4146 957686 390247 3163662 150666Dec-08 170750 3620 758835 396749 3185326 127550Nov-08 214723 3334 880094 430267 2770670 94554Oct-08 215097 6478 965248 425892 2641524 114582Sep-08 261182 5835 990045 408392 2524492 114620Aug-08 281672 7203 708243 396810 2998404 144404Jul-08 344578 9196 827575 377249 3965520 179716Jun-08 211818 7839 765926 361915 3888514 182698May-08 252370 7324 833372 337482 3108752 156316Apr-08 225903 10752 959410 324962 3707804 105850Mar-08 323656 7420 912077 307858 5821132 125432Feb-08 345186 6722 647411 307031 5075648 148340Jan-08 319858 8510 832986 297898 6252516 106514Dec-07 244308 9439 783104 269745 5150590 58702Nov-07 305480 8775 941899 269315 3997610 78864Oct-07 309670 12169 1089690 246288 996644 98684Sep-07 346451 6563 1014805 225910 1734622 89672Aug-07 326264 8142 838075 150176 1520740 56184Jul-07 310111 6456 999716 145605 2731960 35704Jun-07 317771 7501 1068516 146604 1143186 42876May-07 383919 4926 1146266 144714 1298366 30168Apr-07 288371 4586 1235912 139114 1501988 32224Mar-07 262631 5716 1192616 142705 35414 10736Feb-07 237740 3772 1051089 141068 - -Jan-07 219193 4177 935311 131724 - -Dec-06 112724 2423 728803 132409 - -Nov-06 157018 2693 841226 132213 - -Oct-06 45350 1646 792861 129447 - -Sep-06 31366 648 770995 122605 - -Aug-06 21914 708 854086 118872 - -Jul-06 35279 351 901705 130069 - -Jun-06 46180 543 1177418 136969 - -May-06 58311 1483 984070 154603 - -Apr-06 53798 2110 823877 167777 - -
Note: Vol and OI in lots; Aggregate volume in all contracts during the month; Cumulative open interest in all contracts at the month-end; ^ Includes both MCX Zinc (5 MT) futures contract & MCX Zinc mini (1 MT) futures contract; * LME Zinc Futures Total Market OI (includes member as well as client positions) & LME Zinc Futures Volume TotalSource: Exchanges’ websites
Commodity Insights Yearbook 2011142
074-177_CYIB_2011_Non-Agri_Final.indd 142074-177_CYIB_2011_Non-Agri_Final.indd 142 1/18/2012 11:46:06 PM1/18/2012 11:46:06 PM

DATABANK - AGRI COMMODITIES
Others34%
Australia12%
China43%
China29%
Others38%
South Korea4%
Peru13%
Canada6%
Japan4%
India4%
United States
7%
United States6%
Zinc Mine Production (2010e) Refined Zinc Consumption (2010)
Source: USGS; e estimates Source: GFMS, ILZSG, WBMS
Source: LME, OECD
USD/tonne120
100
80
60
40
20
0
-20
-40
-60
5000
4500
4000
3500
3000
2500
2000
1500
1000
500
0
LME Zinc prices (RHS) OECD Total Composite Leading Index Correlation with Copper(1 year)
Zinc Prices, OECD Leading Indicator & Rolling correlation with Copper
Dec
-89
Mar
-91
Jun-
92
Sep-
93
Dec
-94
Mar
-96
Jun-
97
Sep-
98
Dec
-99
Mar
-01
Jun-
02
Sep-
03
Dec
-04
Mar
-06
Jun-
07
Sep-
08
Dec
-09
Mar
-11
A PwC & MCX Joint Endeavour 143www.mcxindia.com / www.pwc.com/in/en
DATABANK - NON-AGRI COMMODITIES
074-177_CYIB_2011_Non-Agri_Final.indd 143074-177_CYIB_2011_Non-Agri_Final.indd 143 1/18/2012 11:46:06 PM1/18/2012 11:46:06 PM

EDITORIALSPROLOGUE INDIAN ECONOMYEXPERTS' VIEWS
Energy is a vital force that powers business, manufac-
turing, and transportation of goods to serve economies
worldwide. The demand-supply equation of energy
is playing an increasingly key role in national
security and economic output of a nation. Sources
of energy vary from coal and crude oil to natural
gas to renewables. Crude oil (petroleum) is chara-
terised by high demand and limited supply (Russia
is the leading producer) and is the most traded
energy commodity in the world, which makes oil a
highly politically sensitive commodity. The petroleum
industry generally classifi es crude oil by it geographic
location it is produced in (West Texas Intermediate, Brent, or
Oman), its API gravity (an oil industry measure of density) and
its sulfur content. Another energy commodity, natural gas is an
important fuel source and major feedstock for fertilizers, with
the US being the leading producer. A clean and safe source
of energy, this combustible mixture of hydrocarbon gases is
gaining a lot of importance in the backdrop of a rising
global chorus on climate change.
As in 2009, MCX crude oil and natural gas futures
prices traded in opposite directions even in 2010.
While oil futures rose by 9.7% annually, natural gas
futures dipped by 23.8%. After an initial period of
uncertainty, oil prices rose on upbeat US economic
data and intermittent geopolitical tensions (e.g.
Nigeria). But then, renewed debt concerns in Europe
pulled oil down to a year low of Rs.3,127 in May.
Later, the prices fi rmed up, after hitting a year low in
May, on concerns over effects of an oil spill in the Gulf
of Mexico; forecasts of more-than-earlier expected
expansion of global economy in 2010 and 2011;
and sustained stimulus programmes by major global
EnergyThe economy mover
Commodity in 2010 Exchange (contract) Price Unit Open High Low Close Annualised
VolatilityVolume (in lots)
Crude oil (light sweet)
MCX (100 barrels) Rs/ bbl 3,720.00 4,173.00 3,127.00 4,088.00 21.9% 41,537,053NYMEX (1,000 barrels) US$/ bbl 79.76 92.06 64.24 91.38 27.8% 168,571,354
Natural gasMCX (250 mmBtu) Rs/mmBtu 260.20 279.40 144.7 197.80 42.4% 11,176,937
NYMEX (10,000 mmBtu) US$/mmBtu 5.71 6.11 3.21 4.41 45.9% 64,326,691
economies. By year-end, reports of rising crude oil imports in
China, and colder temperatures (heating demand) and upbeat
data in the US pushed oil to a year high of Rs.4,173.
MCX futures of natural gas, whose fundamentals
are largely driven by local factors than global factors,
slipped almost through the year. Consequently,
gas futures clocked a year high at Rs.279.40 in
the fi rst fortnight of the year itself. Thereafter,
forecasts of unusually low temperatures in the
US, raising prospects for lower demand, pushed
gas prices down. Later, by mid-year, gas prices
briefl y recovered taking cues from some economic data
releases, concerns over effects of an oil spill in the Gulf of
Mexico and cooling demand due to hot summers in the US.
However, the increase in gas prices quickly fi zzled out, as
robust inventories and lack of a major hurricane-led disruptions
pushed the prices down. Eventually, gas futures registered a
year low of Rs.144.70 in late October.
Source: Respective exchanges’ website
MCX energy futures prices in 2010
285
260
235
210
185
160
135
Source: Metastocks Crude (Rs./barrel) Natural gas (Rs./mm Btu)
Oil: Upbeat US economic data release
Gas: Ample inventories
Gas: Forecast for low temperatures in US
1-Jan
-10
29-Ja
n-10
26-F
eb-1
0
26-M
ar-1
0
23-A
pr-1
0
21-M
ay-1
0
18-Ju
n-10
16-Ju
l-10
13-A
ug-1
0
10-S
ep-1
0
8-Oc
t-10
5-No
v-10
3-De
c-10
31-D
ec-1
0
Oil & gas: Concerns on oil spil
Oil: Increasing Chinese oil
imports, up-beat US data
releases
Oil: Renewed European debt concerns
“The oil can is mightier than the
sword”
- Mr. Everett Dirksen (An American senator)
4200
4000
3800
3600
3400
3200
3000
Commodity Insights Yearbook 2011144
074-177_CYIB_2011_Non-Agri_Final.indd 144074-177_CYIB_2011_Non-Agri_Final.indd 144 1/18/2012 11:46:07 PM1/18/2012 11:46:07 PM

DATABANK - AGRI COMMODITIES
A PwC & MCX Joint Endeavour 145www.mcxindia.com / www.pwc.com/in/en
DATABANK - NON-AGRI COMMODITIES
074-177_CYIB_2011_Non-Agri_Final.indd 145074-177_CYIB_2011_Non-Agri_Final.indd 145 1/18/2012 11:46:33 PM1/18/2012 11:46:33 PM

EDITORIALSPROLOGUE INDIAN ECONOMYEXPERTS' VIEWS
Carbon fundamentals 2010 2009 2008 2007 2006 2005Carbon market Vol Val Vol Val Vol Val Vol Val Vol Val Vol Val (MtCO2e) (MUS$) (MtCO2e) (MUS$) (MtCO2e) (MUS$) (MtCO2e) (MUS$) (MtCO2e) (MUS$) (MtCO2e) (MUS$)Project based transactions Primary CDM 149 1.3 211 2.7 404 6.5 552 7.4 450 4.8 341 2.4Secondary CDM 1004 15.8 1055 17.5 1072 26.3 240 5.5 25 0.4 10 0.2Sub total (including JI and 1153 17.1 1338 20.9 1558 33.6 876 13.6 508 5.5 382 2.9voluntary market)Allowances market EU ETS 5505 105.1 6326 118.5 3093 100.5 2060 49.1 1101 24.4 321 7.9New South Wales 29 - 34 0.1 31 0.2 25 0.2 20 0.2 6 0.1Chicago Climate Exchange 1.6 - 41 0.1 69 0.3 23 0.1 10 0.0 1 -Sub total (including others) 5732 105.1 7362 122.8 3278 101.5 2108 49.4 1131 24.6 328 8.0Total carbon market 6885 122.2 8700 143.7 4836 135.1 2984 63.0 1639 30.1 710 10.9
Source: State and Trends of the Carbon Market 2010, 2009, 2008, 2007, 2006 by The World Bank, Bloomberg New Energy Finance
Historic Volumes exchanged (MtCO2e) per market segmentYear Total project-based Compliance Voluntary Retail* Transactions
1998 17.98 0.00 17.91 0.071999 35.42 0.00 35.27 0.162000 17.09 0.39 16.51 0.202001 13.00 4.72 8.16 0.122002 28.78 14.68 13.89 0.212003 77.64 70.43 6.77 0.442004 107.01 104.60 2.30 0.11
Note: All volumes are for vintages up to 2012 only. Data for retail incomplete; Source: State and Trends of the Carbon Market 2005 by the World Bank
CDM projects Annual average CERs* Expected CERs until end of 2012**
CDM project pipeline: > 5600 of which: N/A > 2,700,000,0003354 are registered 502,192,508 > 2,040,000,00077 are requesting registration 8,973,020 > 10,000,000
* Assumption: All activities deliver simultaneously their expected annual average emission reductions
** Assumption: No renewal of crediting periods, N/A - Not available Source:UNFCCC, as on 16th August, 2011
Status of CDM projects NumberAt validation 3109Request for registration 44Request for review 66Correction requested 3Under review 0Total in the process of registration 113Withdrawn 52Rejected by EB 199Validation negative by DOE 184Validation terminated by DOE 945Registered, no issuance of CERs 2202Registered. CER issued 1135Total registered 3337Total number of projects (incl. rejected & withdrawn) 7939
Source: www.cdmpipeline.org, as on 1st August, 2011
Commodity Insights Yearbook 2011146
074-177_CYIB_2011_Non-Agri_Final.indd 146074-177_CYIB_2011_Non-Agri_Final.indd 146 1/18/2012 11:46:33 PM1/18/2012 11:46:33 PM

DATABANK - AGRI COMMODITIES
Host country Registered All years 2004 2005 2006 2007 2008 2009 2010 2011 Country's projects share of Investments in million US$ investmentsChina 1510 88191 0 62 1440 5697 11160 19788 31512 18532 68.6%India 705 20907 5 110 1367 4137 1306 4248 6805 2930 16.3%Latin America 540 9343 18 449 2646 1640 1610 1296 555 1129 7.3%Rest of Asia 446 5668 0 84 1033 434 347 985 1837 949 4.4%Africa 66 2467 0 119 373 301 73 329 660 612 1.9%Middle-East 39 1637 0 0 3 305 64 523 27 714 1.3%Europe and 31 400 0 6 124 5 5 84 44 132 0.3%Central AsiaTotal 3337 128612 23 830 6985 12518 14566 27253 41440 24998 100.0%(Rejected projects excluded)
Source: www.cdmpipeline.org, as on 1st August, 2011
CDM projects in the pipeline Expected issuance from CDM projects in Pipeline CDM project with CERs issued Projects 1000 CERs 2012 kCERs 2020 kCERs Projects Issued kCERs IssuanceType (rejected projects excluded) successAfforestation 11 411 2161 5292 Agriculture 1 10 18 100 Biomass energy 771 48917 171116 533435 151 19231 84%Cement 49 8549 33598 86419 9 1544 53%CO2 usage 4 116 287 1268 1 10 31%Coal bed/mine methane 81 35226 106660 387146 16 6167 44%Energy distribution 22 5810 11094 58703 1 316 83%EE households 72 2947 5218 29845 2 28 60%EE industry 132 5252 17959 52501 28 1650 82%EE own generation 473 58303 204856 606851 79 30528 80%EE service 26 317 1007 3172 1 6 63%EE supply side 105 57813 61889 581934 9 667 81%Fossil fuel switch 132 54053 173980 580702 37 17458 56%Fugitive 44 21474 70486 225052 3 7767 124%Geothermal 18 4636 13402 48153 5 1977 64%HFCs 23 81727 476504 1082475 19 315892 105%Hydro 1714 200921 442438 2070146 335 49128 86%Landfill gas 352 53545 202638 595372 73 16947 41%Methane avoidance 671 31083 108267 325443 90 7891 49%N2O 76 51102 253263 658215 33 152282 115%PFCs and SF6 18 5050 11796 50929 4 405 68%Reforestation 52 4273 18636 57428 Solar 121 3839 5389 37311 5 107 108%Tidal 1 315 1104 3631 Transport 42 4796 10492 49993 2 359 47%Wind 1548 138135 326489 1408258 232 39769 86%Total 6559 878620 2730745 9539775 1135 670128 93.5%
Note: Projects rejected by DOEs or EB or withdrawn are not included; 1 k CERs = 1000 CERSource: www.cdmpipeline.org, as on 1st August, 2011
Total new investment in clean energy by region ($BN) Year EMEA AMER ASOC2007 61.9 47.7 41.22008 70.2 59.4 50.52009 75.5 48.6 62.42010 94.4 65.8 82.8
Note: Includes corporate and government R&D, and small distributed capacity. Adjusted for re-invested equity. Does not include proceeds from acquisition transactions Source: Bloomberg New Energy Finance
A PwC & MCX Joint Endeavour 147www.mcxindia.com / www.pwc.com/in/en
DATABANK - NON-AGRI COMMODITIES
074-177_CYIB_2011_Non-Agri_Final.indd 147074-177_CYIB_2011_Non-Agri_Final.indd 147 1/18/2012 11:46:35 PM1/18/2012 11:46:35 PM

EDITORIALSPROLOGUE INDIAN ECONOMYEXPERTS' VIEWS
Top 20 PDD consultants ProjectsEcoSecurities 335Beijing Tianqing Power International CDM Consulting 187Carbon Resource Management 152AgCert 146CWEME 131CAMCO 130CasperVanderTak 127PricewaterhouseCoopers 118WB-CF 116Easy Carbon 104Ecoinvest 100Agrinergy 99Mitsubishi UFJ Securities 96Tsinghua University 87AGET 79Zenith Energy Services 75Econergy 73Hunan CDM Project Service Center 67MGM 62Senergy Global 57
Source: www.cdmpipeline.org, as on 1st August, 2011
Top 20 buyers ProjectsEcoSecurities 293Tricorona Carbon Asset Management Sweden 204Vitol 169EDF Trading 158Carbon Resource Management 147RWE 133Mitsubishi 105CAMCO 103AgCert 97Bunge Emissions Group 90Noble Carbon 91Danish Ministry of Climate & Energy 76Kommunalkredit 75MGM Carbon Portfolio 67Trading Emissions 67Agrinergy 66ENEL 64KfW 61Marubeni 57Cargill International 56
Source: www.cdmpipeline.org, as on 1st August, 2011
Historic Transacted and Retired Volumes, OTC Voluntary Market (MtCO2e)Year Sold OTC RetiredPre-2002 44 72002 11 42003 6 42004 10 52005 11 82006 18 72007 45 132008 61 162009 55 142010 69 13
Note: Based on 153 survey respondents Source: Back to the Future State of the Voluntary Carbon Markets 2011 by Ecosystem Marketplace & Bloomberg New energy Finance.
Historic Volume in the Voluntary Carbon Markets (MtCO2e)Year OTC OTC CCX -single CCX Exchanges (Other) Total sale (outlier)Pre-2002 44 - - - 442002 11 - - - 112003 6 - 1 - 72004 10 - 2 1 132005 11 - 1 - 122006 18 - 10 - 282007 45 - 23 0.1 682008 61 - 69 0.2 1302009 55 - 41 2 982010 69 59 1 2 131
Notes: Based on 153 survey respondents. Annual totals may not equal sum of categories due to rounding Source: Back to the Future State of the Voluntary Carbon Markets 2011 by Ecosystem Marketplace & Bloomberg New energy Finance.
Historic Value in the Voluntary CarbonMarkets(US$ Millions)Year OTC OTC CCX CCX Exchanges Total -single sale (Other) (outlier)Pre-2002 180 - - - 1802002 44 - - - 442003 27 - 0.3 - 272004 42 - 3 - 452005 44 - 3 - 472006 72 - 38 - 1102007 275 - 72 1 3482008 447 - 307 2 7552009 354 50 12 4152010 413 0.2 - 10 424
Notes: Based on 125 survey respondentsSource: Back to the Future State of the Voluntary Carbon Markets 2011 by Ecosystem Marketplace & Bloomberg New energy Finance.
Commodity Insights Yearbook 2011148
074-177_CYIB_2011_Non-Agri_Final.indd 148074-177_CYIB_2011_Non-Agri_Final.indd 148 1/18/2012 11:46:35 PM1/18/2012 11:46:35 PM

DATABANK - AGRI COMMODITIES
Economic parameters impacting carbon prices 2010 2009 2008 2007 2006 2001
Real GDP (annual % change) US 2.8 -2.6 1.1 2 2.9 0.8Japan 4.3 -6.3 -0.3 1.9 2.8 0.7Eurozone 1.8 -4.1 1 2.3 2.6 1.9China 10.3 9.2 9 11.5 11.1 8.3India 9.7 5.7 7.3 8.9 9.7 3.9OECD 2.8 -3.4 1 2.6 3.2 2.4
Consumer Price Inflation (annual % change) US 1.6 -0.3 1 2.5 2.7 2.8Japan -0.9 -1.4 0.5 1.4 0.3 -0.7Eurozone 1.5 0.3 1 3 2.2 2.4China 3.1 0.8 3 5.9 2 -0.1India 13.2 10.9 5 7 6.7 5.2OECD 1.5 0.1 1 3 2.2 2.8
Industrial Output (annual % change) US 7 -2.9 -11.3 1.5 3 -3.7Japan 15.4 -21.3 -3.3 2.8 4.4 -6.3Eurozone 8.9 -3.7 -12.4 1.3 3.9 0.4China 15.7 11 12.9 17.4 15.4 9.9India 2.5 18 0.5 7.6 10.3 2.1OECD 7.9 -12.3 -2.1 3.3 3.8 -2.2
Interest rates (%) US 0.1 0.1 0.1 4.3 6.3 1.3Japan 0.3 0.3 0.3 0.8 0.4 0.1Eurozone 1.8 1.8 3 5 4.5 4.3China 3.3 2.8 2.8 3.3 3.3 3.2India (repo rate ) 6.3 4.8 6.5 7.8 7.3 8.5
Money Supply (annual % change) US 3.4 3.5 10 6.1 5.9 10.5Japan 2.3 3.1 1.8 2.1 0.7 3.3Eurozone 1.7 -0.4 7.6 11.6 10 8.0China 19.7 27.7 17.8 16.7 16.9 14.4India 19.1 17.7 19.9 22.8 19.3 13.6
Equity Index (end of period) US (Dow Jones) 11578 10428 8776 13265 12463 10022India (Sensex) 20509 17464 9647 20287 13787 3262
OECD indicators (annual % change) OECD total monetary aggr. & comp. broad money index 3.2 6.7 8.9 8.5 7.3 9.2OECD Total PPI Economic Activities Domestic Manufacturing 3.8 -4 6.8 3.2 3.7 2.0OECD Total CPI OECD Groups Total Energy 7.8 -10.4 12.4 4 9.3 4.9
Note: Interest rates mentioned are central Bank discount rate. For India, interest rates mentioned are repo rates Source: OECD, IMF, CPM Gold Yearbook, World Bank, RBI, BSE, Dow Jones
A PwC & MCX Joint Endeavour 149www.mcxindia.com / www.pwc.com/in/en
DATABANK - NON-AGRI COMMODITIES
074-177_CYIB_2011_Non-Agri_Final.indd 149074-177_CYIB_2011_Non-Agri_Final.indd 149 1/18/2012 11:46:35 PM1/18/2012 11:46:35 PM

EDITORIALSPROLOGUE INDIAN ECONOMYEXPERTS' VIEWS
Carbon prices
Month MCX CER spot prices ICE-ECX CER futures prices (EUR/tonne)
(Rs/tonne) Open High Low Close Monthly average Dec-10 695.52 11.82 12.01 11.35 11.78 Nov-10 757.42 12.4 12.53 11.6 11.76 Oct-10 827.83 13.74 14.06 12.4 12.44 Sep-10 828.9 13.36 13.99 13.36 13.69 Aug-10 767.17 - - - 13.42 Jul-10 726.98 - - - 12 Jun-10 739.08 - - - 13.01 May-10 759.4 - - - 12.5 Apr-10 759.1 - - - 14.25 Mar-10 717.63 11.96 12.26 11.32 11.5 Feb-10 736.71 11.85 11.85 11.85 11.68 Jan-10 759.64 11.35 12.08 10.08 11.32 Dec-09 820.17 12.21 13.83 12.18 11.03 Nov-09 882 13.51 13.63 11.75 12.2 Oct-09 896.38 11.95 13.9 11.68 13.62 Sep-09 894.96 12.44 12.44 11.65 11.99 Aug-09 889.5 12.68 13.48 12.62 13.35 Jul-09 847.89 11.96 13.05 11.85 12.29 Jun-09 780.38 12.74 12.74 10.61 11.81 May-09 813.24 11.52 12.94 11.52 12.71 Apr-09 720.13 10.92 11.59 10.31 11.51 Mar-09 695.16 10.75 11.2 9.5 10.46 Feb-09 561.63 10.25 10.25 7.75 8.96 Jan-09 770.63 13.1 13.1 10.05 10.66 Dec-08 874.17 14.25 14.4 12.9 13.64 Nov-08 928.63 14.95 16.39 13.25 13.91 Oct-08 1177.42 19 20.45 14.25 15.05 Sep-08 1309.23 21.1 21.1 17.3 18.45 Aug-08 1267.12 17.74 21.25 16.75 21.2 Jul-08 1437.83 21.6 23.38 17.2 17.72 Jun-08 1353.5 17.85 21 17.78 20.86 May-08 - 16.9 17.95 16.85 17.85 Apr-08 - 15.5 16.5 15.25 16.07 Mar-08 - 16.46 16.61 15.31 15.43 Feb-08 - - - - - Jan-08 - - - - - Dec-07 - - - - - Nov-07 - - - - - Oct-07 - - - - - Sep-07 - - - - - Aug-07 - - - - - Jul-07 - - - - - Jun-07 - - - - - May-07 - - - - - Apr-07 - - - - - Mar-07 - - - - - Feb-07 - - - - - Jan-07 - - - - - Dec-06 - - - - - Nov-06 - - - - - Oct-06 - - - - - Sep-06 - - - - - Aug-06 - - - - - Jul-06 - - - - - Jun-06 - - - - - May-06 - - - - - Apr-06 - - - - -
Note: *Standard Certifi ed Emission Reduction Forward Agreement Year 1 -contract month 2010; Future prices are for near month continuous futures contractSource: Exchanges’ websites, RBI
Commodity Insights Yearbook 2011150
074-177_CYIB_2011_Non-Agri_Final.indd 150074-177_CYIB_2011_Non-Agri_Final.indd 150 1/18/2012 11:46:36 PM1/18/2012 11:46:36 PM

DATABANK - AGRI COMMODITIES
ICE-ECX EUA futures prices (EUR/tonne) CER OTC* EUA spot RBI rate -
Open High Low Close (EUR/tonne) OTC (EUR/tonne) USD/INR Monthly average
14.7 15.07 13.7 14.02 11.13 14.04 45.1614.59 15.37 14.15 14.76 12.17 14.76 45.0215.37 15.9 14.59 14.63 13.36 15.2 44.4115.03 15.76 15.03 15.41 13.57 15.17 46.06
- - - 15.22 12.71 14.6 46.57- - - 14.08 12.15 14.17 46.84
15.55 15.55 15.55 15.19 12.87 15.21 46.56- - - 15.02 12.86 15.2 45.8- - - 15.84 12.7 14.2 44.5- - - 12.71 11.53 12.76 45.5
13.2 13.2 13.2 12.86 11.48 12.77 46.3313.49 13.49 13.49 12.71 11.51 12.91 45.9613.27 14.93 12.97 12.31 12.9 12.99 46.6314.71 14.71 12.47 13.14 12.57 13.6 46.5913.45 15.04 12.92 14.54 12.92 13.96 46.7213.8 13.9 12.9 13.36 12.8 14.02 48.39
15.05 15.3 15.05 14.89 13.05 14.43 48.36- - - 13.66 12.41 13.54 48.47- - - 13.15 11.41 13 47.78- - - 14.65 12.31 14.28 48.61- - - 13.92 10.82 12.83 50.08
10.5 12.05 10.05 11.45 10.45 11.1 51.2311.07 11.07 8.5 9.96 8.86 9.47 49.2215.05 15.05 11.7 11.57 11.44 12.69 48.83
15.3 16.1 13.5 15.45 13.45 14.9 48.6418.25 19.2 14.78 15.52 14.86 16.93 4922.95 23.62 17.1 17.94 17.85 20.89 48.6425.17 25.43 21.57 22.35 19.75 23.67 45.5621.4 25.47 20.41 25.19 19.77 23.05 42.94
28.78 29.69 21.75 22.06 21.06 25.23 42.8426.1 28.88 25.89 28.77 20.06 26.71 42.82
23.71 26.85 23.52 26.1 17.07 24.58 42.1321.9 25.67 21.8 23.88 16.03 23.54 40.020.01 0.03 0.01 0.02 15.92 0.01 40.360.01 0.01 0.01 0.01 15.19 0.01 39.730.03 0.03 0.03 0.02 16.58 0.01 39.370.04 0.04 0.01 0.02 55.62 0.01 39.440.08 0.12 0.01 0.01 56.74 0.06 39.440.06 0.12 0.06 0.09 52.52 0.03 39.510.07 0.08 0.07 0.08 48.04 0.06 40.34
- - - 0.1 46.46 0.08 40.82- - - 0.12 14.61 0.1 40.42- - - 0.12 0 0.17 40.77- - - 0.28 0 0.34 40.78- - - 0.51 0 0.66 42.151 1.1 1 1.26 4.02 1.06 44.03
2.2 1.55 0 0.9 4.12 1.22 44.165.9 5.9 0 2.3 5.51 3.69 44.337.5 7.85 6.3 6.45 41.53 6.67 44.63
11.2 11.4 7.2 8.1 44.51 8.95 44.8512.55 13.05 10.4 11.05 47.04 11.99 45.4716.35 16.55 11.5 12.95 48 14.79 46.1215.65 16.65 15.65 15.8 48.52 15.72 46.5416.85 16.85 16.85 16.05 47.19 16.14 46.4615.85 15.95 14.3 15.65 48.55 14.92 46.0613.4 13.4 13.4 17.05 50.52 14.89 45.4127.2 28.9 27.2 13.3 51.46 26.42 44.95
A PwC & MCX Joint Endeavour 151www.mcxindia.com / www.pwc.com/in/en
DATABANK - NON-AGRI COMMODITIES
074-177_CYIB_2011_Non-Agri_Final.indd 151074-177_CYIB_2011_Non-Agri_Final.indd 151 1/18/2012 11:46:36 PM1/18/2012 11:46:36 PM

EDITORIALSPROLOGUE INDIAN ECONOMYEXPERTS' VIEWS
Carbon trading activityMonth MCX ICE-ECX Volume Open Interest Volume Open Interest Dec-10 0 0 73667 150596Nov-10 0 0 106044 166222Oct-10 0 0 70120 168826Sep-10 0 0 60124 166164Aug-10 0 0 74497 170537Jul-10 0 0 56714 160184Jun-10 0 0 89041 152922May-10 0 0 80374 151066Apr-10 0 0 81966 148063Mar-10 0 0 77639 148103Feb-10 0 0 44239 140369Jan-10 0 0 50364 136100Dec-09 0 0 61503 130200Nov-09 0 0 64639 141827Oct-09 4 0 86093 137103Sep-09 44 0 76532 124138Aug-09 248 44 45428 121889Jul-09 214 5 87904 119804Jun-09 146 24 55742 115705May-09 159 0 54082 111413Apr-09 12 0 60523 107364Mar-09 2250 15 50315 110589Feb-09 2556 0 79498 114383Jan-09 1815 108 44013 111772Dec-09 561 152 40079 103556Nov-09 219 2 90272 112772Oct-09 85 111 65675 104717Sep-09 129 106 61724 87541Aug-09 1139 120 59537 71846Jul-09 14293 161 84508 62298Jun-09 18771 131 56597 48823May-09 - - 23142 29672Apr-09 - - 17656 16613Mar-09 - - 8240 5259Feb-09 - - - -Jan-09 - - - -Dec-08 - - - -Nov-08 - - - -Oct-08 - - - -Sep-08 - - - -Aug-08 - - - -Jul-08 - - - -Jun-08 - - - -May-08 - - - -Apr-08 - - - -Mar-08 - - - -Feb-08 - - - -Jan-08 - - - -Dec-07 - - - -Nov-07 - - - -Oct-07 - - - -Sep-07 - - - -Aug-07 - - - -Jul-07 - - - -Jun-07 - - - -May-07 - - - -Apr-07 - - - -Mar-07 - - - -Feb-07 - - - -Jan-07 - - - -Dec-06 - - - -Nov-06 - - - -Oct-06 - - - -Sep-06 - - - -Aug-06 - - - -Jul-06 - - - -Jun-06 - - - -May-06 - - - -Apr-06 - - - -
Note: Vol and OI in lots; aggregate volume in all contracts during the month; cumulative open interest in all contracts at the month-end.Source: Exchanges' websites
Commodity Insights Yearbook 2011152
074-177_CYIB_2011_Non-Agri_Final.indd 152074-177_CYIB_2011_Non-Agri_Final.indd 152 1/18/2012 11:46:36 PM1/18/2012 11:46:36 PM

DATABANK - AGRI COMMODITIES
EUAs, CERs & Their Spread Vs US GDP
CERs issued by host country (as on Aug 15, 2011)
Buyer countries - Projects participation (as on Aug 1, 2011)
Source: Source: www.unfccc.int Source: www.cdmpipeline.org
China58%
India15%
Republic of Korea
11%
Others8%
Brazil8%
Others44%
United Kingdom
24%
Switzerland14%
Japan8%
Sweden6%
Netherlands6%
Source: ICE, US Federal Reserve
6
4
2
0
-2
-4
-6
-8
-10
35
30
25
20
15
10
5
0
ICE EUAs futures
CER EUA Spread (LHS) - in €/tonne
ICE CERs futures
US GDP Q0Q (LHS) - %
in ¤/Tonne
Apr
-08
May
-08
Jul-
08
Sep-
08
Oct
-08
Dec
-08
Feb-
09
Mar
-09
May
-09
Jul-
09
Aug-
09
Oct
-09
Dec
-09
Jan-
10
Mar
-10
May
-10
Jun-
10
Aug
-10
Oct
-10
Nov
-10
Jan-
11
Mar
-11
20
15
10
5
0
08
08
08
08
08
08 9 9 9 9 9 9 9 0 0 0 0 0 0 0 11 11
A PwC & MCX Joint Endeavour 153www.mcxindia.com / www.pwc.com/in/en
DATABANK - NON-AGRI COMMODITIES
074-177_CYIB_2011_Non-Agri_Final.indd 153074-177_CYIB_2011_Non-Agri_Final.indd 153 1/18/2012 11:46:36 PM1/18/2012 11:46:36 PM

EDITORIALSPROLOGUE INDIAN ECONOMYEXPERTS' VIEWS
Crude oil fundamentals ('000 barrels/day unless specified) 2010 2009 2008 2007 2006 2001
World
Oil production 82095 80278 82015 81544 81729 74906Oil consumption 87382 84714 85999 86428 84958 77304Refinery capacity 91791 91068 89446 88552 87427 83469Refinery throughput 74816 73063 75038 75393 74553 69067Proven oil reserves ('000 mn barrels) 1383 1377 1335 1254 1234 1129Reserves from Canadian oil sands ('000 mn barrels) 143 143 143 150 152 163
OPEC
Oil production 34324 33365 35722 34757 35098 30640Proven oil reserves ('000 mn barrels) 1068 1069 1029 954 936 856
OECD
Oil production 18490 18471 18414 19114 19463 21314Oil consumption 46438 45963 48053 49611 49794 48139Refinery capacity 45124 45742 45784 45634 45422 44697Refinery throughput 37287 37016 38856 39764 40019 39712Proven oil reserves ('000 mn barrels) 91 92 91 89 89 92
India
Oil production 826 754 768 769 762 727Oil consumption 3319 3211 3068 2835 2571 2288Refinery capacity 3703 3574 2992 2983 2872 2261Refinery throughput 3903 3641 3213 3107 2860 2144Proven oil reserves ('000 mn barrels) 9 6 6 5 6 6Crude oil imports 3254 2928 2557 2370 2156 1574Oil products imports 344 217 458 440 362 156Crude oil exports 0 2 0 0 0 0Oil products exports 1196 740 718 826 671 213 Average daily volatility (MCX spot prices) 1.7% 2.3% 2.8% 1.6% 1.7% - Freight rate (Worldscale points)* - end of period 60 60 63 275 58 38
Note: * Dirty VLCC tanker rate for route Arabian Gulf to Japan; NA: not available; Source: BP statistical Review 2011, Ministry of Petroleum & Natural Gas, EIA, MCX.
World marketed energy consumption by country grouping - Outlook 2015 (Quadrillion Btu) Region Forecast release year
Global 2011 2010 2009 2008
OECD 250.4 246.0 252.4 260.5Americas 126.1 124.3 125.9 132.3Europe 83.6 82.0 84.8 86.5Asia 40.7 39.7 41.8 41.4Non-OECD 323.1 297.5 299.1 302.5Europe & Eurasia 51.4 52.4 57.6 59.5Asia 188.1 159.3 163.2 164.2Middle East 31.0 32.9 30.3 29.5Africa 21.5 20.8 17.7 18.9Central & South America 31.0 32.1 30.3 30.5Total World 573.5 543.5 551.5 563.0
Note: Totals may not equal sum of components due to independent rounding.Source: Energy Information Administration
Commodity Insights Yearbook 2011154
074-177_CYIB_2011_Non-Agri_Final.indd 154074-177_CYIB_2011_Non-Agri_Final.indd 154 1/18/2012 11:46:38 PM1/18/2012 11:46:38 PM

DATABANK - AGRI COMMODITIES
Top 5 crude oil producing countries (thousand barrels per day)Country 2010 2009 2008 2007 2006 2001
Russian Federation 10270 10035 9888 9978 9769 7056Saudi Arabia 10007 9893 10846 10449 10853 9209US 7513 7271 6734 6847 6841 7669Iran 4245 4199 4327 4322 4286 3892China 4071 3800 3809 3737 3705 3306
Source: BP statistical Review 2011
Top 5 crude oil consuming countries (thousand barrels per day) Country 2010 2009 2008 2007 2006 2001
US 19148 18771 19498 20680 20687 19649China 9057 8201 7937 7817 7437 4859Japan 4451 4391 4836 5029 5203 5394India 3319 3211 3068 2835 2571 2288Russian Federation 3199 2936 3036 2913 2893 2688
Source: BP statistical Review 2011
Top 5 countries with crude oil refinery capacities (thousand barrels per day) Country 2010 2009 2008 2007 2006 2001
US 17594 17688 17672 17594 17443 16785China 10121 9479 8722 8399 7865 5643Russian Federation 5555 5527 5549 5596 5599 5628Japan 4463 4621 4650 4598 4542 4705India 3703 3574 2992 2983 2872 2261
Source: BP statistical Review 2011
World tanker fleet by age (1,000 dwt) up to 1995 1996-2000 2001-2005 2006-2010 TotalVessel DWT range no dwt no dwt no dwt no dwt no dwt
GP 16.5-24.9 227 4,056.80 128 1,962.50 153 2,640.70 537 8,238.20 1,045 16,898.20MR 25.0-44.9 240 8,836.70 168 6,568.10 339 13,243.60 387 15,562.60 1,134 44,211.00LR1 45.0-79.9 140 7,650.40 104 5,465.60 275 15,701.80 611 34,641.80 1,130 63,459.60LR2 80.0-159.9 237 26,119.30 214 25,633.20 337 40,552.60 439 52,863.30 1,227 145,168.40VLCC 160.0-319.9 69 19,787.20 116 34,290.40 184 53,021.90 242 67,978.30 611 175,077.80Total world 913 66,450.50 730 73,919.80 1,288 125,160.50 2,216 179,284.20 5,147 444,815.00
Notes: Figures as at year-end. Totals may not add up due to independent rounding. Data includes clean, dirty and chemical tankers. GP = general purpose; MR = medium range; LR1 = large range 1; LR2 = large range 2; VLCC = very large crude carrier; dwt - dead weight tonnage Source: OPEC Annual Statistical Bulletin - 2010/11 edition
A PwC & MCX Joint Endeavour 155www.mcxindia.com / www.pwc.com/in/en
DATABANK - NON-AGRI COMMODITIES
074-177_CYIB_2011_Non-Agri_Final.indd 155074-177_CYIB_2011_Non-Agri_Final.indd 155 1/18/2012 11:46:38 PM1/18/2012 11:46:38 PM

EDITORIALSPROLOGUE INDIAN ECONOMYEXPERTS' VIEWS
Principal operaions of major oil companies (thousand barrels per day) 2010 2009 2008 2007 2006
BP
Crude oil & NGL reserves 5,559 5,658 5,665 5,492 5,893Crude oil produced 2,374 2,535 2,401 2,414 2,475Crude oil processed 2,426 2,287 2,155 2,127 2,198Refined products sold 5,927 5,887 5,698 5,624 5,801
ExxonMobil
Crude oil & NGL reserves 11,673 11,651 12,006 11,074 11,568Crude oil produced 2,422 2,387 2,405 2,616 2,681Crude oil processed 5,253 5,350 5,416 5,571 5,603Refined products sold 6,414 6,428 6,761 7,099 7,247
Total
Crude oil & NGL reserves 5,987 5,689 5,695 5,778 6,471Crude oil produced 1,340 1,381 1,456 1,509 1,506Crude oil processed 2,009 2,151 2,362 2,413 2,454
Refined products sold 3,776 3,616 3,658 3,774 3,682
Royal Dutch/Shell
Crude oil & NGL reserves 5,179 4,693 2,620 2,751 3,270Crude oil produced 1,619 1,581 1,693 1,818 1,948Crude oil processed 3,197 3,067 3,388 3,779 3,862Refined products sold 6,460 6,156 6,568 6,625 6,485
Chevron
Crude oil & NGL reserves 4,270 4,610 4,735 4,665 5,294Crude oil produced 1,923 1,846 1,649 1,756 1,732Crude oil processed 1,894 1,878 1,858 1,833 1,989
Refined products sold 3,113 3,254 3,429 3,484 3,621
Total majors
Crude oil & NGL reserves 32,668 32,301 30,721 29,760 32,496Crude oil produced 9,678 9,730 9,604 10,113 10,342Crude oil processed 14,779 14,733 15,179 15,723 16,106Refined products sold 25,690 25,341 26,114 26,606 26,836
Note: Reserves in million barrels, as at year-end Source: OPEC Annual Statistical Bulletin - 2010/11 edition
Commodity Insights Yearbook 2011156
074-177_CYIB_2011_Non-Agri_Final.indd 156074-177_CYIB_2011_Non-Agri_Final.indd 156 1/18/2012 11:46:38 PM1/18/2012 11:46:38 PM

DATABANK - AGRI COMMODITIES
Economic parameters impacting crude oil prices 2010 2009 2008 2007 2006 2001Inventory (Mn barrels) - end of period US total crude oil and petroleum products (exclding SPR) 1067.0 1049.8 1034.9 968.4 1030.9 1036.1US crude oil stocks (excluding SPR stocks) 332.0 325.2 325.8 286.1 312.3 312.0US crude oil stocks in SPR 726.5 726.6 701.8 696.9 688.6 550.2US total motor gasoline inventories 219.7 223.3 213.6 218.1 211.8 209.9US distillate fuel oil inventories 164.5 166.0 146.0 133.9 143.7 144.5 OECD annual Oil Stocks 4200.5 4181.2 4181.8 4054.8 4130.1 3912.0OECD Government Oil Stocks 1559.0 1562.0 1525.0 1522.0 1497.0 -
Hurricance activity - North Atlantic Ocean Dates active Jun 25 - May 28 - May 30 - May 9 - Jun 10 - Jun 5 - Nov 7 Nov 10 Nov 10 Dec 13 Oct 2 Dec 4Number of cyclones recorded 21 11 17 17 10 17Total landfalls 10 4 33 16 7 11Number of hurricanes recorded 12 3 8 6 5 9Approximate damage (in US$ billion) 12.04 0.077 47.5 3.0 0.5 7.9Deaths 259 6 855 394 7 93 OPEC surplus crude oil production capacity (million barrels per day) 3.99 3.93 1.37 2.07 1.42 4.07Days of supply of OECD commercial oil stocks - end of period 56 56 56 51 53 -US crude oil wells drilled (exploratory and development) (number) 17553 11650 16791 13350 13230 8888
Real GDP (annual % change) US 2.8 -2.6 1.1 2.0 2.9 0.8Japan 4.3 -6.3 -0.3 1.9 2.8 0.7Eurozone 1.8 -4.1 1.0 2.3 2.6 1.9China 10.3 9.2 9.0 11.5 11.1 8.3India 9.7 5.7 7.3 8.9 9.7 3.9OECD 2.8 -3.4 1.0 2.6 3.2 2.4
Consumer Price Inflation (annual % change) US 1.6 -0.3 1.0 2.5 2.7 2.8Japan -0.9 -1.4 0.5 1.4 0.3 -0.7Eurozone 1.5 0.3 1.0 3.0 2.2 2.4China 3.1 0.8 3.0 5.9 2.0 -0.1India 13.2 10.9 5.0 7.0 6.7 5.2OECD 1.5 0.1 1.0 3.0 2.2 2.8
Industrial Output (annual % change) US 7.0 -2.9 -11.3 1.5 3.0 -3.7Japan 15.4 -21.3 -3.3 2.8 4.4 -6.3Eurozone 8.9 -3.7 -12.4 1.3 3.9 0.4China 15.7 11.0 12.9 17.4 15.4 9.9India 2.5 18.0 0.5 7.6 10.3 2.1OECD 7.9 -12.3 -2.1 3.3 3.8 -2.2
Interest Rates (%) US 0.1 0.1 0.1 4.3 6.3 1.3Japan 0.3 0.3 0.3 0.8 0.4 0.1Eurozone 1.8 1.8 3.0 5.0 4.5 4.3China 3.3 2.8 2.8 3.3 3.3 3.2India (repo rate ) 6.3 4.8 6.5 7.8 7.3 8.5
Money Supply (annual % change) US 3.4 3.5 10.0 6.1 5.9 10.5Japan 2.3 3.1 1.8 2.1 0.7 3.3Eurozone 1.7 -0.4 7.6 11.6 10.0 8.0China 19.7 27.7 17.8 16.7 16.9 14.4India 19.1 17.7 19.9 22.8 19.3 13.6
Equity Index (end of period) US (Dow Jones) 11578 10428 8776 13265 12463 10022India (Sensex) 20509 17464 9647 20287 13787 3262
OECD indicators (annual % change) OECD total monetary aggr. & comp. broad money index 3.2 6.7 8.9 8.5 7.3 9.2OECD Total PPI Economic Activities Domestic Manufacturing 3.8 -4.0 6.8 3.2 3.7 2.0OECD Total CPI OECD Groups Total Energy 7.8 -10.4 12.4 4.0 9.3 4.9 US ISM Manufacturing Index 58.5 56.4 33.3 49 52 45.3US auto sales (YoY % change) 11.1 15.1 -35.6 -2.9 -3.6 5.6US pending home sales (YoY % change) -3.3 9.2 5.7 -23.9 -6.3 -
Note: SPR - Strategic Petroleum Reserve; Interest rates mentioned are central Bank discount rate. For India, interest rates mentioned are repo ratesSource: EIA, BP stats, CPM Gold Yearbook, IMF, OECD, World Bank, BSE, Dow Jones, Various Central Banks
A PwC & MCX Joint Endeavour 157www.mcxindia.com / www.pwc.com/in/en
DATABANK - NON-AGRI COMMODITIES
074-177_CYIB_2011_Non-Agri_Final.indd 157074-177_CYIB_2011_Non-Agri_Final.indd 157 1/18/2012 11:46:38 PM1/18/2012 11:46:38 PM

EDITORIALSPROLOGUE INDIAN ECONOMYEXPERTS' VIEWS
Crude oil pricesMonth MCX light sweet crude oil futures prices (Rs/bbl) MCX light sweet crude oil NYMEX light sweet-WTI crude oil futures prices (USD/bbl)
Open High Low Close spot prices (Rs/bbl)
Open High Low Close Monthly average Dec-10 3915 4173 3868 4088 4020 83.66 92.06 83.63 91.38 Nov-10 3634 3953 3634 3923 3787 81.45 88.63 80.06 84.11 Oct-10 3597 3735 3567 3630 3638 79.84 84.43 79.25 81.43 Sep-10 3439 3618 3336 3591 3470 71.7 80.18 71.67 79.97 Aug-10 3659 3825 3354 3449 3581 78.95 82.97 70.76 71.92 Jul-10 3519 3738 3367 3654 3573 75.37 79.69 71.09 78.95 Jun-10 3455 3655 3319 3523 3504 73.97 79.38 69.51 75.63 May-10 3819 3875 3127 3464 3411 86.2 87.15 64.24 73.97 Apr-10 3750 3870 3592 3814 3772 83.36 87.09 80.53 86.15 Mar-10 3680 3783 3599 3751 3697 79.79 83.85 78.06 83.76 Feb-10 3374 3727 3275 3669 3529 72.75 80.51 69.50 79.66 Jan-10 3720 3810 3372 3378 3615 79.76 83.95 72.43 72.89 Dec-09 3570 3735 3226 3727 3484 77.35 80.00 68.59 79.36 Nov-09 3684 3804 3412 3550 3637 77.02 81.06 72.39 77.28 Oct-09 3349 3796 3218 3638 3530 70.40 82.00 68.05 77.00 Sep-09 3432 3530 3146 3337 3381 69.56 73.16 65.05 70.61 Aug-09 3279 3648 3252 3431 3436 69.30 75.00 65.23 69.96 Jul-09 3354 3440 2879 3271 3130 70.45 71.85 58.32 69.45 Jun-09 3130 3508 3072 3344 3329 66.48 73.38 64.95 69.89 May-09 2542 3135 2542 3124 2874 50.95 66.64 50.43 66.31 Apr-09 2485 2698 2375 2555 2556 48.96 53.90 43.83 51.12 Mar-09 2250 2758 2071 2481 2468 44.34 54.66 39.44 49.66 Feb-09 2061 2284 1649 2259 1955 41.75 45.30 33.55 44.76 Jan-09 2015 2452 1626 2058 2079 43.72 50.47 32.70 41.68 Dec-08 2738 2738 1751 1996 2100 54.62 54.62 32.40 44.60 Nov-08 3225 3419 2498 2746 2853 67.37 71.77 48.25 54.43 Oct-08 4746 4799 3167 3207 3741 101.86 102.84 61.30 67.81 Sep-08 5139 5179 4251 4744 4741 117.89 130.00 90.51 100.64 Aug-08 5277 5450 4745 5123 5021 124.06 128.60 111.34 115.46 Jul-08 6061 6333 5106 5278 5774 140.18 147.27 120.42 124.08 1Jun-08 5380 6174 5212 6078 5725 127.63 143.67 121.61 140.00 May-08 4613 5822 4476 5403 5261 114.60 135.09 110.30 127.35 Apr-08 4040 4785 3984 4628 4490 101.57 119.93 99.55 113.46 1Mar-08 4060 4485 3961 4027 4257 101.63 111.80 98.65 101.58 Feb-08 3571 4083 3409 4058 3763 91.36 103.05 86.24 101.84 Jan-08 3772 3935 3395 3559 3671 96.05 100.09 86.11 91.75 Dec-07 3551 3847 3401 3763 3605 88.79 97.92 85.82 95.98 Nov-07 3699 3915 3510 3556 3750 95.15 99.29 88.45 88.71 Oct-07 3238 3698 3090 3687 3385 81.75 95.28 78.35 94.53 Sep-07 3017 3307 3008 3247 3197 74.24 83.90 73.48 81.66 Aug-07 3140 3168 2818 3019 2963 77.94 78.77 68.63 74.04 Jul-07 2863 3145 2821 3137 2986 70.52 78.28 69.57 78.21 Jun-07 2587 2869 2587 2863 2742 64.23 71.06 63.80 70.68 May-07 2736 2736 2492 2582 2597 65.66 66.38 60.68 64.01 Apr-07 2920 2947 2671 2744 2712 66.03 66.70 61.34 65.71 Mar-07 2765 2957 2653 2930 2659 61.82 68.09 56.10 65.87 Feb-07 2582 2790 2527 2755 2613 57.89 62.25 56.62 61.79 Jan-07 2729 2732 2302 2563 2430 60.98 61.55 49.90 58.14 Dec-06 2811 2883 2672 2730 2776 62.85 64.15 59.90 61.05 Nov-06 2616 2828 2605 2816 2635 58.60 63.77 54.86 63.13 Oct-06 2854 2854 2591 2611 2675 62.80 63.32 56.55 58.73 Sep-06 3267 3298 2744 2882 2973 70.29 70.66 59.52 62.91 Aug-06 3468 3605 3217 3256 3406 74.40 77.45 68.65 70.26 Jul-06 3398 3703 3362 3460 3455 73.92 78.40 71.65 74.40 Jun-06 3299 3404 3130 3395 3263 71.26 74.15 68.10 73.93 May-06 3265 3382 3081 3284 3211 71.70 74.99 67.42 71.29 Apr-06 2952 3418 2933 3239 3116 66.43 75.35 65.60 71.88
Note: Future prices are for near month continuous futures contractSource: MCX, RBI, Exchanges’ websites, ICE, OPEC, PPAC
Commodity Insights Yearbook 2011158
074-177_CYIB_2011_Non-Agri_Final.indd 158074-177_CYIB_2011_Non-Agri_Final.indd 158 1/18/2012 11:46:39 PM1/18/2012 11:46:39 PM

DATABANK - AGRI COMMODITIES
bbl) ICE Brent crude oil futures prices (USD/bbl) US WTI spot Monthly international OPEC basket RBI Rate USD/INR US Dollar Index
Open High Low Close prices (USD/bbl) prices of Indian prices (US$/bbl)
Monthly average crude oil basket Monthly average8 85.71 95.2 85.41 94.75 89.15 89.77 88.46 45.16 80.301 83.13 89.7 82.43 85.92 84.24 84.26 82.83 45.02 78.453 82.21 86.02 80.75 83.15 81.90 81.11 79.86 44.41 77.727 74.46 82.4 74.42 82.31 75.29 76.09 74.63 46.06 81.352 78.11 82.86 71.75 74.64 76.60 75.13 74.15 46.57 82.225 74.65 78.31 70.77 78.18 76.35 73.54 72.51 46.84 83.433 74.82 79.86 70.5 75.01 75.35 74.33 72.97 46.56 86.777 87.44 89.58 68.15 74.65 73.73 76.16 74.48 45.80 85.485 82.44 87.75 82.22 87.44 84.48 84.08 82.47 44.50 81.356 77.69 82.82 76.21 82.7 81.07 78.02 77.21 45.50 80.816 71.35 78.94 67.87 77.59 76.06 73.69 72.99 46.33 80.279 78.49 82.45 71.02 71.46 78.36 76.61 76.01 45.96 77.986 78.42 79.91 71.02 77.93 74.49 75.02 74.01 46.63 77.008 75.24 80.14 73.7 78.47 78.00 77.39 76.29 46.59 75.400 68.92 80.26 65.9 75.2 75.77 73.07 72.67 46.72 76.171 69.65 72.2 64.08 69.07 69.44 67.70 67.17 48.39 77.196 71.98 76 68.85 69.65 71.06 71.98 71.35 48.36 78.535 69.9 72.12 59.49 71.7 64.12 64.83 64.59 48.47 79.719 65.77 73.5 64.91 69.3 69.62 69.12 68.47 47.78 80.261 50.7 65.8 49.96 65.52 59.13 58.00 56.98 48.61 82.112 48.37 54.31 47.26 50.8 49.81 50.14 50.21 50.08 85.556 45.56 53.86 41.30 49.23 47.98 46.02 45.78 51.23 86.716 46.06 48.42 39.35 46.35 39.15 43.22 41.38 49.22 86.848 43.85 52.21 41.60 45.88 41.74 43.99 41.23 48.83 84.830 53.00 53.00 36.20 45.59 41.44 40.61 38.60 48.64 83.653 64.30 67.76 47.40 53.49 57.29 50.91 49.26 49.00 86.771 99.45 100.31 59.02 65.32 76.61 69.12 69.17 48.64 83.534 115.50 115.56 88.90 98.17 103.94 96.81 96.85 45.56 78.376 123.42 127.94 110.31 114.05 116.64 113.05 112.41 42.94 76.218 140.44 147.50 120.88 123.98 133.38 132.47 131.22 42.84 72.790 127.22 143.91 121.32 139.83 133.93 129.72 128.34 42.82 73.415 112.74 135.14 108.42 127.78 125.37 120.91 119.43 42.13 73.056 100.50 117.56 98.99 111.36 112.62 105.77 105.06 40.02 72.388 100.12 108.02 96.92 100.30 105.47 99.76 98.97 40.36 72.724 91.50 101.27 86.83 100.10 95.38 92.37 90.78 39.73 75.775 94.47 98.50 85.00 92.21 92.98 89.52 88.56 39.37 76.008 88.74 95.87 86.56 93.85 91.36 87.92 87.18 39.44 76.791 90.94 96.65 87.55 88.26 94.76 89.11 88.99 39.44 75.673 79.25 91.18 75.64 90.63 85.90 79.33 78.98 39.51 77.786 72.69 81.05 72.69 79.17 79.91 74.78 74.15 40.34 79.144 76.95 77.16 68.14 72.69 72.38 68.97 68.65 40.82 80.871 71.22 78.40 70.92 77.05 74.14 72.58 71.65 40.42 80.618 68.15 72.25 67.61 71.41 67.49 68.10 66.77 40.77 82.211 67.53 71.80 63.80 68.04 63.45 65.76 64.37 40.78 82.011 67.91 69.59 64.76 67.65 63.94 65.48 63.51 42.15 81.957 61.78 69.14 59.79 68.10 60.60 60.27 58.44 44.03 83.179 57.20 62.18 56.10 61.89 59.25 56.49 54.77 44.16 84.284 60.88 61.64 50.75 57.40 54.24 52.63 50.84 44.33 84.585 63.85 64.92 60.04 60.86 62.00 60.35 57.95 44.63 83.073 58.85 64.77 57.75 64.26 59.13 57.80 55.41 44.85 84.723 62.70 62.82 57.39 59.03 58.85 57.26 54.99 45.47 86.111 70.42 70.66 59.32 62.48 63.82 60.94 59.64 46.12 85.256 75.15 78.64 68.82 70.25 73.04 70.87 68.80 46.54 84.910 73.26 78.18 72.11 75.15 74.40 71.29 68.91 46.46 85.613 70.25 73.69 66.33 73.51 70.93 66.90 64.60 46.06 85.379 71.98 74.97 67.63 70.41 70.93 67.33 65.12 45.41 84.698 66.69 74.79 65.73 72.02 69.54 67.06 64.45 44.95 88.13
A PwC & MCX Joint Endeavour 159www.mcxindia.com / www.pwc.com/in/en
DATABANK - NON-AGRI COMMODITIES
074-177_CYIB_2011_Non-Agri_Final.indd 159074-177_CYIB_2011_Non-Agri_Final.indd 159 1/18/2012 11:46:39 PM1/18/2012 11:46:39 PM

EDITORIALSPROLOGUE INDIAN ECONOMYEXPERTS' VIEWS
Crude Oil trading activityMonth MCX (crude oil light sweet) NYMEX (crude oil light sweet-WTI) ICE (Brent crude oil) Volume Open Interest Volume Open Interest Volume Open InterestDec-10 3068659 30835 12415734 1430155 7430114 873116Nov-10 3162530 22911 13510747 1342325 8213381 836883Oct-10 3992584 25043 14422865 1416888 8261164 856736Sep-10 4794548 33834 15965291 1370514 8533147 817269Aug-10 4707162 52638 14493964 1308042 8029379 817066Jul-10 4442937 23614 11427080 1220292 7053387 794600Jun-10 3631230 28467 14459730 1263940 8026656 746713May-10 3614835 20590 17534395 1361943 8774904 768727Apr-10 2805302 25975 17377753 1446580 8544233 813137Mar-10 2681569 16317 13297737 1310328 8984535 937633Feb-10 2572046 14120 12771829 1274007 7796458 857981Jan-10 2063651 25272 10894229 1319629 6837761 776550Dec-09 2645063 15303 11906196 1193065 6000904 728331Nov-09 2968273 19625 11600195 1198406 6255219 698620Oct-09 3066007 16991 13103116 1243953 6600386 700787Sep-09 2867974 25601 11462233 1190853 6302192 684180Aug-09 3364276 17364 11823362 1162798 5333905 676497Jul-09 4122330 14071 11923549 1190714 6865215 707378Jun-09 3430757 15406 11367082 1159868 5843451 689091May-09 3389258 12740 9939223 1163773 5280318 721844Apr-09 3650692 17895 10106308 1167380 5102336 696396Mar-09 4379692 20786 11340347 1148687 6158270 677979Feb-09 3434198 23224 11411434 1191502 5495062 662850Jan-09 3774301 18972 11369073 1243967 6536771 637728Dec-08 3117157 28141 9910170 1189046 5107284 595295Nov-08 1883187 16189 8662209 1141336 5336546 565654Oct-08 1598334 11287 11638267 1108362 6417718 549842Sep-08 1900925 10052 12045565 1092411 5948919 525080Aug-08 1485585 10346 10589479 1182917 5044833 550431Jul-08 1877485 11922 11321293 1267200 5472918 563588Jun-08 1968091 15496 12452986 1285567 5778596 526467May-08 1745803 16121 13439173 1368551 6683008 562258Apr-08 1216976 20935 11065563 1366639 5682939 556070Mar-08 1251741 12317 12576859 1396612 5663793 594544Feb-08 1188877 19620 10100249 1445328 5421638 583335Jan-08 1272840 11188 10811520 1395278 5619214 541479Dec-07 1436288 12814 8694012 1361258 4035606 537359Nov-07 1388335 11593 11307522 1404579 5383219 578509Oct-07 1392318 23019 12389575 1468958 5575011 623051Sep-07 1003894 19668 10670194 1420823 4989287 647298Aug-07 1378084 15400 10646980 1466129 4980801 596662Jul-07 1175924 22988 9655899 1521237 5114738 645675Jun-07 1014159 21143 9862305 1474661 4912169 662755May-07 933112 11576 9486584 1396811 5427377 627008Apr-07 922023 11020 9286616 1329295 4296685 657327Mar-07 1220169 18463 10068962 1354924 5179846 686982Feb-07 1040775 10199 9092076 1286745 4290867 584786Jan-07 1033732 11230 10367198 1294571 5454265 611593Dec-06 586612 17186 6801761 1190543 3329011 548654Nov-06 629447 18622 7446062 1214068 4319084 588243Oct-06 610963 13743 7492383 1158612 4608117 577446Sep-06 429136 8435 6067095 1167337 3875739 487653Aug-06 243508 11344 5408568 1166144 4000533 478985Jul-06 175149 3022 4496916 1101492 3680839 347628Jun-06 129799 3164 5129950 1027066 3741729 455114May-06 200439 8127 5854647 1028165 3513993 440309Apr-06 234414 8996 5280355 1057804 2928362 464857
Note: Vol and OI in lots; aggregate volume in all contracts during the month; cumulative open interest in all contracts at the month-end. Source: Exchanges’ websites
Commodity Insights Yearbook 2011160
074-177_CYIB_2011_Non-Agri_Final.indd 160074-177_CYIB_2011_Non-Agri_Final.indd 160 1/18/2012 11:46:39 PM1/18/2012 11:46:39 PM

DATABANK - AGRI COMMODITIES
Crude Oil (WTI) prices in USD & Euro and Dollar Index
Crude Oil Production (2010) Crude Oil Consumption (2010)
Source: BP Statistical Review 2011 Source: BP Statistical Review 2011
Others56%
Russian Federation
13%
Saudi Arabia12%
China5%
USA9%
Iran5%
Others55%
USA22%
China10%
Russian Federation
4%
India4%
Japan5%
Source: NYMEX (CME)
160
140
120
100
80
60
40
20
0
180
160
140
120
100
80
60
40
20
0
Dollar Index Crude oil WTI Prices in USD Crude Oil WTI prices in EURO
price/bbl
May
-83
Apr
-84
Mar
-85
Feb-
86
Jan-
87
Dec
-87
Nov
-88
Oct
-89
Sep-
90
Aug-
91
Jul-9
2
Jun-
93
May
-94
Apr
-95
Mar
-96
Feb-
97
Jan-
98
Dec
-98
Nov
-99
Oct
-00
Sep-
01
Aug
-02
Jul-
03
Jun-
04
May
-05
Apr
-06
Mar
-07
Feb-
08
Jan-
09
Dec
-09
Nov
-10
1
1
1
1
8
6
4
2
0
83 84 85 86 87 87 88 89 90 91 92 93 94 95 96 97 98 98 99 00 01
02
03 04 05
06 07 08
09
09 10
A PwC & MCX Joint Endeavour 161www.mcxindia.com / www.pwc.com/in/en
DATABANK - NON-AGRI COMMODITIES
074-177_CYIB_2011_Non-Agri_Final.indd 161074-177_CYIB_2011_Non-Agri_Final.indd 161 1/18/2012 11:46:39 PM1/18/2012 11:46:39 PM

EDITORIALSPROLOGUE INDIAN ECONOMYEXPERTS' VIEWS
Natural gas fundamentals (billion cubic metre) 2010 2009 2008 2007 2006 2001
World
Natural gas production 3193 2976 3062 2951 2881 2478Natural gas consumption 3169 2950 3026 2947 2842 2455Natural gas trade (export/import) - Total 975 877 814 776 748 554Natural gas trade (export/import) - pipeline 678 634 587 550 537 411Natural gas trade (export/import) - LNG 298 243 227 226 211 143 Proven gas reserves 187142 186586 184387 176683 173211 168543Proven gas reserves - former Soviet Union 58514 58397 57449 51963 51870 50900Proven gas reserves - OECD 17097 16988 16536 15672 15056 16100 OECD natural gas prodution 1160 1126 1134 1102 1093 1097OECD natural gas consumption 1546 1453 1500 1476 1425 1340
India
Proven gas reserves 1500 1101 1101 1101 1101 763Natural gas production 51 39 31 30 29 26Natural gas consumption 62 51 41 40 37 26Natural gas (LNG) imports 12 13 11 10 8 -Natural gas exports - - - - - - Average daily volatility (MCX spot prices) 3.0% 5.1% 2.7% 2.7% 4.2% -
Note: LNG: Liquifi ed Natural Gas Source: Annual BP Statistical Review 2011, 2010, 2009, 2008, 2007, 2006, 2005, 2002; Ministry of Petroleum & Natural Gas; Energy Information Administration; MCX
World natural gas production by region & country - Outlook for 2015 (Quadrillion Btu)Region Forecast release year
World 2011 2010 2009 2008
OECD North America 31.3 25 27.9 27.1United States* 22.4 19.4 20.5 19.6Canada 7.0 5.6 5.4 5.7Mexico 1.9 - 2.1 1.8OECD Europe 8.1 9.6 11 11.2OECD Asia 2.8 3.5 2.8 2.9Japan 0.2 - 0.2 0.2South Korea 0.0 - 0 0Australia/New Zealand 2.6 3.5 2.6 2.7Other OECD 0.1 2.1 - -Total OECD 42.3 40.2 41.7 41.2Non-OECD Europe & Eurasia 30.5 32.2 35 36.1Russia 23 23 26.7 26.9Other 7.5 9.2 8.3 9.3Non-OECD Asia 15.6 15.8 15.6 17.2China 3.1 2.9 3.4 3.2India 2.5 - 2 2Other non-OECD Asia 10 12.9 10.3 12Middle East 19.7 20.9 17.8 16.9Africa 9.7 11.3 9.6 10.7Central & South America 5.8 6.6 7 7.3Brazil 1 - 1 0.7Other Central/South America 4.8 - 6 6.5Total Non-OECD 81.3 86.8 85 88.3Total World 123.6 126.9 126.7 129.5
Note: * includes supplemental production or forecast discrepancy Source: Energy Information Administration
Commodity Insights Yearbook 2011162
074-177_CYIB_2011_Non-Agri_Final.indd 162074-177_CYIB_2011_Non-Agri_Final.indd 162 1/18/2012 11:46:42 PM1/18/2012 11:46:42 PM

DATABANK - AGRI COMMODITIES
Principal operaions of major companies 2010 2009 2008 2007 2006
BPNatural Gas Reserves 37,809 40,388 40,005 41,130 42,168Natural Gas Sold 8,401 8,485 8,334 8,143 8,417ExxonMobil Natural Gas Reserves 78,815 68,007 65,879 68,262 67,560Natural Gas Sold 12,148 9,273 9,095 9,384 9,334Total Natural Gas Reserves 25,788 26,318 26,218 25,730 25,539Natural Gas Sold 5,648 4,923 4,837 4,839 4,674Royal Dutch/Shell Natural Gas Reserves 28,983 29,961 25,927 22,825 30,058Natural Gas Sold 9,305 8,483 8,569 8,214 8,368Chevron Natural Gas Reserves 20,755 22,153 19,022 19,137 19,910Natural Gas Sold 10,425 9,963 11,441 11,416 10,529Total majors Natural Gas Reserves 192,150 186,827 177,051 177,084 185,235Natural Gas Sold 45,927 41,127 42,276 41,996 41,322
Note: 1. Gas reserves in billion cubic feet, as at year-end; 2. Gas sold in Million cubic feet/day Source: OPEC Annual Statistical Bulletin - 2010/11 edition
US Summer cooling degree-days (Population-weighted) Month 2010 2009 2008 2007 2006 NormalAPR 34 29 31 23 53 33 MAY 126 117 91 119 109 104 JUN 285 222 263 236 236 216 JUL 385 284 334 310 388 323 AUG 356 307 283 366 337 292 SEP 196 169 171 191 138 160 Total Summer 1,382 1,127 1,173 1,246 1,261 1,128
Source: National Oceanic and Atmospheric Administration, National Weather Service
U.S. Winter heating degree-days (Population-weighted) Month 2010/11 2009/10 2008/09 2007/08 2006/07 NormalOCT 238 330 281 175 305 282 NOV 523 441 533 521 467 539 DEC 898 877 832 800 690 817 JAN 956 940 969 892 841 917 FEB 743 820 705 741 853 732 MAR 586 552 583 617 502 593 Total Winter 3,944 3,960 3,904 3,746 3,657 3,880
Source: National Oceanic and Atmospheric Administration, National Weather Service
World Liquid Gas carrier fleet size and type, 2010 (1,000 cu m) No LPG Ccpacity No LNG capacity Total no Total capacityUp to 999 61 42 - - 61 421,000 - 1,999 274 396 - - 274 3962,000 - 4,999 316 1,053 - - 316 1,0535,000 - 9,999 208 1,414 - - 208 1,41410,000 - 19,999 63 876 13 133 76 1,00920,000 - 39,999 105 3,043 3 94 108 3,13740,000 - 59,999 20 1,164 3 122 23 1,28660,000 - 99,999 142 11,367 17 1,295 159 12,662100,000 and over - - 326 50,254 326 50,254Total World 1,189 19,355 362 51,898 1,551 71,253
Note: Figures as at year-end. Totals may not add due to independent rounding. Source: OPEC Annual Statistical Bulletin - 2010/11 edition
A PwC & MCX Joint Endeavour 163www.mcxindia.com / www.pwc.com/in/en
DATABANK - NON-AGRI COMMODITIES
074-177_CYIB_2011_Non-Agri_Final.indd 163074-177_CYIB_2011_Non-Agri_Final.indd 163 1/18/2012 11:46:42 PM1/18/2012 11:46:42 PM

EDITORIALSPROLOGUE INDIAN ECONOMYEXPERTS' VIEWS
Economic parameters impacting natural gas prices 2010 2009 2008 2007 2006 2001Gas inventories (billion cubic metres)
US working natural gas in storage 83.8 88.3 80.1 77.9 85.7 79.0Five year average 82.3 81.7 79.9 76.4 75.5 -Five year maximum 89.1 87.8 87.6 87.2 83.8 -Five year minimum 74.7 74.8 74.2 68.1 67.7 -
Hurricance activity - North Atlantic Ocean Dates active Jun 25 - May 28 - May 30 - May 9 - Jun 10 - Jun 5 - Nov 7 Nov 10 Nov 10 Dec 13 Oct 2 Dec 4Number of cyclones recorded 21 11 17 17 10 17Total landfalls 10 4 33 16 7 11Number of hurricanes recorded 12 3 8 6 5 9Approximate damage (in US$ billion) 12.04 0.077 47.5 3.0 0.5 7.9Deaths 259 6 855 394 7 93
Real GDP (annual % change) US 2.8 -2.6 1.1 2.0 2.9 0.8Japan 4.3 -6.3 -0.3 1.9 2.8 0.7Eurozone 1.8 -4.1 1.0 2.3 2.6 1.9China 10.3 9.2 9.0 11.5 11.1 8.3India 9.7 5.7 7.3 8.9 9.7 3.9OECD 2.8 -3.4 1.0 2.6 3.2 2.4
Consumer Price Inflation (annual % change) US 1.6 -0.3 1.0 2.5 2.7 2.8Japan -0.9 -1.4 0.5 1.4 0.3 -0.7Eurozone 1.5 0.3 1.0 3.0 2.2 2.4China 3.1 0.8 3.0 5.9 2.0 -0.1India 13.2 10.9 5.0 7.0 6.7 5.2OECD 1.5 0.1 1.0 3.0 2.2 2.8
Industrial Output (annual % change) US 7.0 -2.9 -11.3 1.5 3.0 -3.7Japan 15.4 -21.3 -3.3 2.8 4.4 -6.3Eurozone 8.9 -3.7 -12.4 1.3 3.9 0.4China 15.7 11.0 12.9 17.4 15.4 9.9India 2.5 18.0 0.5 7.6 10.3 2.1OECD 7.9 -12.3 -2.1 3.3 3.8 -2.2
Interest Rates (%) US 0.1 0.1 0.1 4.3 6.3 1.3Japan 0.3 0.3 0.3 0.8 0.4 0.1Eurozone 1.8 1.8 3.0 5.0 4.5 4.3China 3.3 2.8 2.8 3.3 3.3 3.2India (repo rate ) 6.3 4.8 6.5 7.8 7.3 8.5
Money Supply (annual % change) US 3.4 3.5 10.0 6.1 5.9 10.5Japan 2.3 3.1 1.8 2.1 0.7 3.3Eurozone 1.7 -0.4 7.6 11.6 10.0 8.0China 19.7 27.7 17.8 16.7 16.9 14.4India 19.1 17.7 19.9 22.8 19.3 13.6
Equity Index (end of period) US (Dow Jones) 11578 10428 8776 13265 12463 10022India (Sensex) 20509 17464 9647 20287 13787 3262
OECD indicators (annual % change) OECD total monetary aggr. & comp. broad money index 3.2 6.7 8.9 8.5 7.3 9.2OECD Total PPI Economic Activities Domestic Manufacturing 3.8 -4.0 6.8 3.2 3.7 2.0OECD Total CPI OECD Groups Total Energy 7.8 -10.4 12.4 4.0 9.3 4.9
Note: Interest rates mentioned are central Bank discount rate. For India, interest rates mentioned are repo rates Source: OECD, EIA, NOAA, CPM Gold Yearbook, IMF, World Bank, BSE, Dow Jones
Commodity Insights Yearbook 2011164
074-177_CYIB_2011_Non-Agri_Final.indd 164074-177_CYIB_2011_Non-Agri_Final.indd 164 1/18/2012 11:46:43 PM1/18/2012 11:46:43 PM

DATABANK - AGRI COMMODITIES
Natural gas trading activityMonth MCX NYMEX (CME) ICE (UK) Volume Open Interest Volume Open Interest Volume Open InterestDec-10 1123916 20834 6002863 772404 177145 215313Nov-10 1064881 21129 5833648 758702 186185 217280Oct-10 1242427 18252 5920016 794741 179450 203747Sep-10 1481956 36045 5414287 782077 153780 205880Aug-10 1122912 24975 5790959 816477 140510 204860Jul-10 1001775 7645 5249597 786798 213545 154210Jun-10 748663 8068 5913497 767568 154830 131530May-10 469341 7230 4734149 833807 189720 154310Apr-10 913642 15814 5717025 857075 191505 140675Mar-10 597296 15801 4691010 830935 161540 119410Feb-10 508156 10170 4557698 816126 142470 97580Jan-10 901972 7003 4501942 776283 183560 81848Dec-09 1057446 9357 5347178 707590 113315 83575Nov-09 983755 11885 4413904 714288 151470 87665Oct-09 1306570 6817 5507775 695972 173805 93472Sep-09 1880018 9014 5597662 672952 166760 100430Aug-09 1419262 42877 4445944 713161 97880 105810Jul-09 1604219 43636 3979357 715227 124545 96645Jun-09 1395465 35251 4486552 712804 114050 93996May-09 696633 17709 3478986 685105 109785 89627Apr-09 335013 13771 2493091 659775 111935 82393Mar-09 239186 5402 2989920 624397 120325 75270Feb-09 118124 1505 2780551 671554 146665 56060Jan-09 88800 1903 2343719 682516 150775 46270Dec-08 76673 884 2384252 679760 65100 43869Nov-08 57192 457 2539865 718799 75045 43701Oct-08 37573 288 3151675 766597 91455 45475Sep-08 114983 1229 3458479 881561 71460 51974Aug-08 80679 823 3756124 919430 68850 49680Jul-08 75181 820 4273971 942703 77440 51210Jun-08 48145 508 3379074 974174 58310 45480May-08 40258 645 3141953 898031 59920 41635Apr-08 35838 901 3382892 872489 82985 36815Mar-08 50629 1008 2983598 865871 62185 34695Feb-08 58270 1456 3330580 928172 79120 28041Jan-08 72085 1170 2741217 898698 78945 28450Dec-07 52889 1333 2390939 849704 69925 24180Nov-07 75330 1689 2474062 818517 101725 25700Oct-07 145212 1828 3155437 748047 117705 29645Sep-07 220683 2046 2486465 750875 105870 31350Aug-07 194097 6720 3069117 765421 124230 32525Jul-07 116498 4646 2346727 809913 100110 31515Jun-07 56638 3060 2703626 803710 65570 27515May-07 64735 2560 2285014 760212 76305 28185Apr-07 72435 2172 2181057 732753 69025 27180Mar-07 214038 2467 1938669 740862 90755 27665Feb-07 252161 2870 2431720 758890 77970 24840Jan-07 268043 3433 2617276 899420 59125 20830Dec-06 264821 7209 1844836 874752 25860 18640Nov-06 350058 6538 1775475 889654 60255 18215Oct-06 266576 4992 1935134 907876 61575 18065Sep-06 383188 10178 2017651 943162 77810 19990Aug-06 546150 9012 2428749 927572 45850 17360Jul-06 142963 4519 1786249 908412 41925 13390Jun-06 - - 1920553 852733 36330 14675May-06 - - 2272497 833675 44765 13219Apr-06 - - 1911616 728557 34735 9795
Note: Vol and OI in lots; aggregate volume in all contracts during the month; cumulative open interest in all contracts at the month-end.Source: Exchanges websites
A PwC & MCX Joint Endeavour 165www.mcxindia.com / www.pwc.com/in/en
DATABANK - NON-AGRI COMMODITIES
074-177_CYIB_2011_Non-Agri_Final.indd 165074-177_CYIB_2011_Non-Agri_Final.indd 165 1/18/2012 11:46:43 PM1/18/2012 11:46:43 PM

EDITORIALSPROLOGUE INDIAN ECONOMYEXPERTS' VIEWS
Natural gas prices
Month MCX futures prices (Rs/mmBtu) MCX spot prices (Rs/mmBtu) NYMEX (CME) futures prices (USD/mmbtu)
Open High Low Close Monthly average Open High Low Close Dec-10 194.60 210.70 180.10 197.80 192.9 4.13 4.64 3.95 4.41 Nov-10 187.60 208.00 166.10 193.80 183.1 4.04 4.49 3.71 4.18 Oct-10 173.70 190.80 144.70 187.90 160.7 3.86 4.08 3.21 4.04 Sep-10 181.50 190.70 168.00 174.10 179.5 3.79 4.14 3.70 3.87 Aug-10 228.10 232.00 175.30 182.20 197.7 4.99 5.01 3.61 3.82 Jul-10 215.50 232.20 201.10 227.20 214.8 4.64 4.94 4.29 4.92 Jun-10 204.40 241.80 200.10 214.00 222.9 4.37 5.20 4.22 4.62 May-10 176.30 205.90 174.20 203.80 190.4 3.91 4.49 3.86 4.34 Apr-10 176.80 198.40 172.20 176.00 182.6 3.87 4.39 3.81 3.92 Mar-10 220.20 225.00 174.80 177.60 196.4 4.77 4.87 3.82 3.87 Feb-10 242.70 266.70 220.10 220.90 242.7 5.25 5.68 4.74 4.81 Jan-10 260.20 279.40 236.30 239.60 258.0 5.71 6.11 5.06 5.13 Dec-09 225.10 281.60 205.70 259.50 249.5 4.82 6.04 4.43 5.57 Nov-09 239.00 246.50 194.50 226.10 216.8 5.03 5.29 4.16 4.85 Oct-09 229.50 252.60 201.50 238.00 225.3 4.83 5.32 4.23 5.05 Sep-09 146.50 239.40 118.60 231.00 169.5 2.98 4.98 2.41 4.84 Aug-09 175.40 195.20 142.60 147.50 165.4 3.63 4.16 2.69 2.98 Jul-09 186.70 197.00 158.20 174.60 175.0 3.85 3.90 3.23 3.65 Jun-09 184.00 209.10 168.90 186.00 189.6 3.87 4.39 3.55 3.84 May-09 171.00 226.80 169.20 184.80 192.7 3.39 4.58 3.36 3.84 Apr-09 191.40 196.00 165.50 173.90 181.8 3.79 3.90 3.16 3.37 Mar-09 218.80 226.80 185.10 190.90 206.6 4.27 4.42 3.60 3.78 Feb-09 216.00 236.90 196.00 214.90 216.2 4.32 4.88 3.92 4.20 Jan-09 272.80 303.80 214.50 217.40 250.9 5.55 6.24 4.40 4.42 Dec-08 324.90 337.40 251.40 270.70 282.6 6.55 6.69 5.20 5.62 Nov-08 324.00 350.30 298.70 324.40 328.1 6.69 7.36 6.10 6.51 Oct-08 354.00 368.70 312.50 321.60 329.4 7.52 7.94 6.00 6.78 Sep-08 353.00 385.70 314.50 354.50 344.8 7.50 8.32 7.00 7.44 Aug-08 388.20 404.20 336.10 355.10 359.5 9.12 9.60 7.60 7.94 Jul-08 574.80 591.80 374.10 388.30 487.3 13.40 13.70 8.80 9.12 Jun-08 494.30 577.60 492.50 573.80 545.4 11.80 13.40 12.00 13.35 May-08 440.00 522.60 426.50 497.30 478.9 10.90 12.10 10.00 11.70 Apr-08 400.70 459.00 373.00 439.50 411.0 10.00 11.40 9.30 10.84 Mar-08 373.80 416.20 366.00 399.60 388.2 9.39 10.30 8.70 10.10 Feb-08 314.50 377.80 300.30 373.80 340.3 8.07 9.50 7.60 9.37 Jan-08 293.50 331.80 292.50 314.00 312.3 7.57 8.48 7.50 8.07 Dec-07 292.50 297.60 274.60 296.30 283.3 7.21 7.54 6.80 7.48 Nov-07 325.90 342.20 291.50 294.00 311.2 8.38 8.71 7.20 7.30 Oct-07 274.00 329.10 266.20 324.70 598.4 6.86 8.48 6.60 8.33 Sep-07 228.60 287.70 215.30 273.90 251.4 5.32 7.04 5.20 6.87 Aug-07 252.00 294.50 225.10 230.60 254.3 6.20 7.19 5.20 5.47 Jul-07 276.50 277.40 237.70 252.70 261.3 6.72 6.85 5.80 6.19 Jun-07 321.50 332.30 270.60 277.30 308.4 7.96 8.21 6.60 6.77 May-07 324.00 335.00 310.00 320.60 319.7 7.83 8.23 7.50 7.94 Apr-07 335.50 343.40 305.10 325.20 322.4 7.77 8.01 7.30 7.86 Mar-07 322.30 337.80 298.00 334.00 318.1 7.22 7.77 6.80 7.73 Feb-07 341.10 354.00 311.30 324.00 335.2 7.71 8.04 7.10 7.30 Jan-07 282.10 351.70 268.60 339.20 295.8 6.30 7.97 6.00 7.67 Dec-06 390.00 391.50 271.10 282.70 327.3 8.73 8.75 5.70 6.30 Nov-06 342.60 403.50 327.50 391.60 359.1 7.60 9.05 7.30 8.84 Oct-06 257.90 386.20 253.20 341.30 308.2 5.61 7.93 5.50 7.53 Sep-06 286.80 288.80 213.60 261.70 246.7 5.89 6.13 4.10 5.62 Aug-06 379.30 398.90 286.80 288.30 330.8 8.25 8.62 5.90 6.05 Jul-06 265.50 364.70 264.90 364.70 295.4 6.10 8.26 5.40 8.21 Jun-06 - - - - - 6.42 7.33 5.80 6.10 May-06 - - - - - 6.53 7.13 5.80 6.38 Apr-06 - - - - - 7.20 8.28 6.50 6.56
Note: Future prices are for near month continuous futures contractSource: Exchanges websites, RBI, ICE
Commodity Insights Yearbook 2011166
074-177_CYIB_2011_Non-Agri_Final.indd 166074-177_CYIB_2011_Non-Agri_Final.indd 166 1/18/2012 11:46:43 PM1/18/2012 11:46:43 PM

DATABANK - AGRI COMMODITIES
US spot prices (USD/mmbtu) ICE (UK) futures prices (GBP/therm) RBI rate USD/INR Dollar Index
Monthly average Open High Low Close Monthly average4.25 55.25 62.70 55.25 61.07 45.16 80.303.71 47.40 55.50 45.50 54.20 45.02 78.453.43 48.00 48.80 45.40 47.61 44.41 77.723.89 41.20 49.20 41.15 47.32 46.06 81.354.31 39.85 43.00 36.90 41.83 46.57 82.224.63 45.49 51.50 38.75 40.66 46.84 83.434.80 37.50 46.75 36.55 45.49 46.56 86.774.14 36.00 43.25 35.60 36.63 45.80 85.484.03 29.70 36.85 29.05 33.13 44.50 81.354.29 31.55 31.90 28.35 29.71 45.50 80.815.32 36.25 37.30 31.27 31.34 46.33 80.275.82 37.00 41.75 32.50 38.77 45.96 77.985.34 29.49 35.00 27.45 33.72 46.63 77.003.68 36.80 36.90 27.15 29.57 46.59 75.404.00 32.00 38.90 30.50 36.81 46.72 76.172.99 25.75 34.50 21.50 32.42 48.39 77.193.14 21.50 26.90 18.20 26.10 48.36 78.533.38 26.00 26.45 19.60 22.29 48.47 79.713.80 26.25 28.00 24.75 25.99 47.78 80.263.83 27.90 29.60 24.75 26.19 48.61 82.113.49 34.25 35.50 25.50 28.51 50.08 85.553.96 34.50 37.50 29.00 31.97 51.23 86.714.51 63.00 63.60 33.00 33.52 49.22 86.845.23 60.00 68.30 52.00 62.25 48.83 84.835.84 58.80 65.50 53.00 58.53 48.64 83.656.70 75.80 77.90 58.00 60.97 49.00 86.776.74 81.80 84.00 66.00 76.11 48.64 83.537.62 78.30 87.00 71.00 85.26 45.56 78.378.25 61.50 79.70 51.75 78.64 42.94 76.21
11.08 72.80 72.80 55.00 62.24 42.84 72.7912.68 65.00 73.60 64.00 73.30 42.82 73.4111.27 60.00 66.30 59.00 65.38 42.13 73.0510.18 57.70 67.00 58.00 60.58 40.02 72.389.41 53.30 58.30 51.00 57.93 40.36 72.728.55 50.30 55.00 47.00 53.54 39.73 75.777.98 52.00 61.00 51.00 51.18 39.37 76.007.11 50.40 56.90 50.00 52.28 39.44 76.797.11 52.50 60.80 45.00 50.58 39.44 75.67
6.74 44.70 55.30 41.00 54.27 39.51 77.786.07 27.50 42.80 27.00 42.55 40.34 79.146.23 26.80 28.00 24.00 27.51 40.82 80.876.22 23.30 32.60 22.00 28.07 40.42 80.617.35 21.40 21.80 17.00 21.36 40.77 82.217.64 17.90 26.00 18.00 20.88 40.78 82.017.60 20.00 20.20 14.00 17.15 42.15 81.957.11 20.00 24.50 18.00 20.29 44.03 83.17
8.00 22.90 23.00 16.00 18.81 44.16 84.286.53 31.30 33.60 23.00 23.27 44.33 84.586.73 45.00 45.40 32.00 32.22 44.63 83.077.41 57.40 57.40 38.00 46.89 44.85 84.72
5.84 51.90 58.00 43.00 56.27 45.47 86.114.90 43.40 56.50 33.00 54.82 46.12 85.257.13 37.40 43.60 33.00 43.46 46.54 84.916.17 39.00 42.00 38.00 37.71 46.46 85.616.20 39.10 40.20 36.00 39.57 46.06 85.376.24 39.00 39.50 31.00 38.80 45.41 84.697.17 43.60 44.10 39.00 39.46 44.95 88.13
A PwC & MCX Joint Endeavour 167www.mcxindia.com / www.pwc.com/in/en
DATABANK - NON-AGRI COMMODITIES
074-177_CYIB_2011_Non-Agri_Final.indd 167074-177_CYIB_2011_Non-Agri_Final.indd 167 1/18/2012 11:46:43 PM1/18/2012 11:46:43 PM

EDITORIALSPROLOGUE INDIAN ECONOMYEXPERTS' VIEWS
Natural Gas Production (2010) Natural Gas Consumption (2010)
Source: BP Statistical Review 2011 Source: BP Statistical Review 2011
Others49%
US19%
Russian Federation
19%
Qatar4%
Canada5%
Iran4%
Others55%
USA22%
Russian Federation
13%
Japan3%
China3%
Iran4%
Natural Gas Prices, Oil Gas Ratio and Spread Between
Natural Gas Second and First Month Contract
Source: NYMEX (CME)
30
25
20
15
10
5
0
2.5
2
1.5
1
0.5
0
-0.5
-1
-1.5
-2
-2.5
Natural Gas Prices (US$/mmBtu)
Oil Gas Ratio
Spread (NG1-NG2)
Jan-
91
Dec
-91
Nov
-92
Oct
-93
Sep-
94
Aug-
95
Jul-9
6
Jun-
97
May
-98
Apr
-99
Mar
-00
Feb-
01
Jan-
02
Dec
-02
Nov
-03
Oct
-04
Sep-
05
Aug-
06
Jul-
07
Jun-
08
May
-09
Apr
-10
Mar
-11
0
-0
-1
-1.
-2
-2
91 91 92 93 94 95 96 97 98 99 00 01
02
02
03 04 05
06 07 08
09 10 11
Commodity Insights Yearbook 2011168
074-177_CYIB_2011_Non-Agri_Final.indd 168074-177_CYIB_2011_Non-Agri_Final.indd 168 1/18/2012 11:46:43 PM1/18/2012 11:46:43 PM

DATABANK - AGRI COMMODITIES
Power/Electricity fundamentals 2010 2009 2008 2007 2006 2001
Global
Electricity generation (Terawatt-hours) 21325.1 20135.5 20342.0 19943.2 19056.0 15639.7Electricity consumption (Terawatt-hours) 18330.5 17220.3 17390.1 17055.2 16255.8 13355.6
Primary energy - consumption by fuel (Million tonnes oil equivalent)
Oil 4028.1 3908.7 3927.9 3939.4 3910.9 3510.6Natural gas 2858.1 2661.4 2726.1 2652.2 2558.3 2164.3Coal 3555.8 3305.6 3303.7 3194.5 3041.7 2255.1Nuclear energy 626.2 614.0 619.7 622.5 634.9 601.2Hydro electric 775.6 736.3 717.5 695.8 697.2 594.5Total 11843.7 11225.9 11294.9 11104.4 10843.0 9124.8
OECD
Electricity generation (Terawatt-hours) 10904.8 10513.1 10965.4 10919.2 10693.7 9734.7Electricity consumption (Terawatt-hours) 9476.8 9129.7 9509.2 9502.0 9289.1 8534.6Electricity balance of trade (Terawatt-hours) 11.6 12.1 11.1 3.1 14.5 13.8
Primary energy - consumption by fuel (Million tonnes oil equivalent)
Oil 2113.8 2094.8 2182.7 2246.1 2270.2 2189.6Natural gas 1397.6 1313.9 1346.9 1328.1 1274.3 1167.2Coal 1103.6 1049.5 1159.2 1189.4 1169.7 1108.2Nuclear energy 520.9 511.5 516.2 520.7 536.3 518.8Hydro electric 309.5 299.4 301.9 283.9 301.9 291.0Total 5445.3 5269.0 5507.0 5568.3 5552.4 5274.5
India
Electricity generation (Terawatt-hours) 922.2 869.8 824.5 797.9 738.7 574.6Electricity consumption (Terawatt-hours) 669.1 642.8 601.6 577.0 521.9 372.8Electricity balance of trade (Terawatt-hours) 6.9 8.0 8.9 4.9 2.7 1.3
Primary energy - consumption by fuel (Million tonnes oil equivalent)
Oil 155.5 151.0 135.0 128.5 120.4 97.1Natural gas 55.7 45.9 37.2 36.0 33.6 23.7Coal 277.6 250.6 231.4 212.9 195.1 173.5Nuclear energy 5.2 3.8 3.5 4.0 4.0 4.4Hydroelectric 25.2 24.0 26.2 27.7 25.4 16.1Total 519.2 475.4 433.3 409.2 378.5 314.7
Source: Enerdata Yearbook 2011, British Statistical Review, fi gures may not tally due to rounding
A PwC & MCX Joint Endeavour 169www.mcxindia.com / www.pwc.com/in/en
DATABANK - NON-AGRI COMMODITIES
074-177_CYIB_2011_Non-Agri_Final.indd 169074-177_CYIB_2011_Non-Agri_Final.indd 169 1/18/2012 11:46:44 PM1/18/2012 11:46:44 PM

EDITORIALSPROLOGUE INDIAN ECONOMYEXPERTS' VIEWS
State-wise installed capacity (India) (MW) 2010 2009 2008 2007 2006 2001
Andaman & Nicobar 65.3 65.3 65.3 65.4 70.6 34.1 Andhra Pradesh 10254.8 10254.8 8965.2 9452.0 9017.8 6756.4 Arunachal Pradesh 18.5 18.5 18.5 61.1 69.1 45.4 Assam 423.5 423.5 423.5 446.3 721.8 621.7 Bihar 354.9 354.9 364.9 590.4 603.9 2108.4 Chandigarh 2.0 2.0 2.0 2.0 2.0 2.0 Chhattisgarh 3517.0 3517.0 2917.0 2814.4 1687.6 - Delhi 982.9 982.9 982.9 932.4 932.4 602.0 Goa 48.0 48.0 48.0 78.1 48.1 48.2 Gujarat 10965.2 10965.2 8773.7 8351.3 8180.5 7223.4 Haryana 2132.4 2132.4 2202.4 3159.4 2559.4 1990.3 Himachal Pradesh 836.5 836.5 836.5 926.4 921.4 326.3 Jammu & Kashmir 933.5 935.7 625.8 625.8 504.2 416.6 Jharkhand 1680.0 1680.0 1750.0 1754.1 1754.1 - Karnataka 6991.2 6991.2 6362.4 7626.0 6784.4 4465.1 Kerala 2298.9 2298.9 2277.1 2287.1 2313.7 2217.6 Lakshadweep 10.0 10.0 10.0 10.7 10.0 10.0 Madhya Pradesh 3871.0 3871.0 3901.0 4484.0 3971.9 4373.0 Maharashtra 13371.3 13371.3 12871.8 14580.5 14053.3 12911.2 Manipur 36.0 36.0 36.0 50.9 50.9 12.6 Meghalaya 185.2 185.2 185.2 189.1 189.1 188.8 Mizoram 22.9 22.9 22.9 69.3 69.3 37.2 Nagaland 24.0 24.0 24.0 30.7 30.7 6.4 Orissa 2447.5 2447.5 2431.5 2498.4 2345.2 2298.1 Puducherry 32.5 32.5 32.5 32.5 32.5 32.5 Punjab 3762.4 3762.4 3762.4 4861.3 4592.5 4528.9 Rajasthan 4248.8 4248.8 3293.8 4519.6 4245.1 2489.4 Sikkim 37.0 37.0 37.0 44.1 44.1 37.9 Tamil Nadu 6809.7 6809.7 6828.5 10606.2 10093.1 6520.9 Tripura 142.5 142.5 142.5 148.4 148.4 85.4 Uttar Pradesh 4897.8 4897.8 4593.2 5077.5 5011.0 5612.8 Uttarakhand 1681.9 1681.9 1681.9 1734.8 1430.0 - West Bengal 7269.5 7269.5 6800.0 6590.1 4599.1 4783.3India 159398.5 147965.4 143061.0 132329.2 124287.2 101626.2
Commodity Insights Yearbook 2011170
074-177_CYIB_2011_Non-Agri_Final.indd 170074-177_CYIB_2011_Non-Agri_Final.indd 170 1/18/2012 11:46:44 PM1/18/2012 11:46:44 PM

DATABANK - AGRI COMMODITIES
Generating capacity addition (MW)Year Central Sector State Sector Private Sector Total2003-04 3035.0 816.6 100.0 3951.62004-05 2778.0 1571.3 70.0 4419.32005-06 1370.0 1531.5 660.8 3562.32006-07 4360.0 1693.0 551.8 6874.82007-08 3240.0 5273.0 750.0 9263.02008-09 750.0 1821.2 882.5 3453.72009-10 2430.0 3418.0 3737.0 9585.0
Note: The above fi gures do not include Deration, Retirement and Installed Capacity of Renewable Energy Sources. Source: Annual Report 2009-10, CEA
State-wise electricity requirement (million kwh) 2010 2009 2008 2007 2006 2001
Andaman & Nicobar 240.0 236.0 240.0 240.0 240.0 Andhra Pradesh 79014.0 71511.0 64139.0 60964.0 53030.0 47792.0 Arunachal Pradesh 406.0 426.0 391.0 286.0 208.0 127.7 Assam 5129.0 5107.0 4816.0 4297.0 4051.0 3092.9 Bihar 11763.0 10527.0 9155.0 8425.0 7955.0 9208.0 Chandigarh 1570.0 1414.0 1446.0 1343.0 1260.0 1072.0 Chhattisgarh 11035.0 14866.0 14079.0 14063.0 13012.0 - Delhi 24271.0 22398.0 22439.0 22397.0 21602.0 18575.0 Goa 3085.0 2801.0 2740.0 2624.0 2338.0 1766.0 Gujarat 70412.0 67482.0 68747.0 62464.0 57137.0 53038.0 Haryana 33520.0 29085.0 29353.0 26249.0 23132.0 17275.0 Himachal Pradesh 7009.0 6260.0 5992.0 5136.0 4302.0 3190.0 Jammu & Kashmir 12907.0 11467.0 11782.0 11725.0 9268.0 6410.0 Jharkhand 5866.0 5361.0 5139.0 4369.0 4033.0 - Karnataka 45607.0 43168.0 40320.0 40797.0 34601.0 30242.0 Kerala 17606.0 17645.0 15663.0 15023.0 13674.0 13564.0 Lakshadweep 24.0 24.0 24.0 25.0 24.0 - Madhya Pradesh 43159.0 42054.0 41560.0 38710.0 36846.0 39644.0 Maharashtra 124961.0 121901.0 114885.0 110005.0 102765.0 79527.0 Manipur 522.0 556.0 530.0 451.0 510.0 463.9 Meghalaya 1550.0 1713.0 1620.0 1368.0 1382.0 563.9 Mizoram 351.0 330.0 288.0 235.0 230.0 249.7 Nagaland 527.0 475.0 377.0 343.0 408.0 226.0 Orissa 21112.0 20519.0 18846.0 17101.0 15208.0 11710.0 Puducherry 2118.0 2020.0 1841.0 1808.0 1678.0 - Punjab 45770.0 41635.0 42372.0 38641.0 35682.0 27670.0 Rajasthan 44031.0 37797.0 36738.0 33236.0 32052.0 25080.0 Sikkim 383.0 343.0 286.0 223.0 212.0 - Tamil Nadu 76213.0 69668.0 65780.0 61499.0 54194.0 42702.0 Tripura 864.0 800.0 777.0 802.0 745.0 574.0 Uttar Pradesh 75822.0 69207.0 62628.0 57441.0 55682.0 46295.0 Uttarakhand 8904.0 7841.0 7047.0 5957.0 5155.0 - West Bengal 33853.0 31289.0 29020.0 26538.0 24936.0 18787.0India 830300.0 777039.0 739345.0 690587.0 631757.0 507216.0
Source: Central Electricity Authority, Central Electricity Regulatory Commission
A PwC & MCX Joint Endeavour 171www.mcxindia.com / www.pwc.com/in/en
DATABANK - NON-AGRI COMMODITIES
074-177_CYIB_2011_Non-Agri_Final.indd 171074-177_CYIB_2011_Non-Agri_Final.indd 171 1/18/2012 11:46:44 PM1/18/2012 11:46:44 PM

EDITORIALSPROLOGUE INDIAN ECONOMYEXPERTS' VIEWS
State-wise electricity availability (million kwh) 2010 2009 2008 2007 2006 2001
Andaman & Nicobar 180.0 184.0 180.0 190.0 168.0 - Andhra Pradesh 73784.0 66673.0 61511.0 58280.0 52332.0 44055.0 Arunachal Pradesh 332.0 271.0 302.0 259.0 206.0 130.1 Assam 4695.0 4567.0 4412.0 3984.0 3778.0 3332.8 Bihar 9939.0 8801.0 7933.0 7741.0 7218.0 8563.0 Chandigarh 1521.0 1414.0 1446.0 1341.0 1258.0 1068.0 Chhattisgarh 10766.0 14475.0 13409.0 13169.0 12540.0 - Delhi 24088.0 22273.0 22301.0 22012.0 21281.0 17667.0 Goa 3021.0 2754.0 2707.0 2606.0 2338.0 1576.0 Gujarat 67263.0 60851.0 57614.0 54083.0 52436.0 47877.0 Haryana 32006.0 26625.0 25652.0 23132.0 26249.0 16793.0 Himachal Pradesh 6762.0 6241.0 5814.0 4996.0 4258.0 3087.0 Jammu & Kashmir 9929.0 8698.0 8362.0 7983.0 7672.0 5361.0 Jharkhand 5409.0 5110.0 4458.0 4154.0 3868.0 - Karnataka 42098.0 40578.0 39230.0 39948.0 34349.0 27490.0 Kerala 17183.0 15562.0 15284.0 14716.0 13578.0 12670.0 Lakshadweep 24.0 24.0 24.0 25.0 24.0 - Madhya Pradesh 34953.0 34841.0 35700.0 32834.0 31619.0 34747.0 Maharashtra 101537.0 95761.0 93846.0 89138.0 84117.0 71184.0 Manipur 427.0 477.0 501.0 429.0 489.0 453.4 Meghalaya 1328.0 1386.0 1232.0 1063.0 1144.0 605.2 Mizoram 288.0 269.0 246.0 222.0 216.0 256.5 Nagaland 464.0 436.0 334.0 328.0 389.0 231.9 Orissa 20926.0 20214.0 18500.0 16796.0 15010.0 12070.0 Puducherry 1973.0 1773.0 1841.0 1808.0 1678.0 - Punjab 39451.0 37238.0 38795.0 34839.0 32591.0 26923.0 Rajasthan 42983.0 37388.0 35597.0 31715.0 30879.0 24178.0 Sikkim 340.0 330.0 267.0 218.0 210.0 - Tamil Nadu 71488.0 64208.0 63954.0 60445.0 53853.0 39462.0 Tripura 780.0 728.0 686.0 728.0 666.0 596.4 Uttar Pradesh 59390.0 54309.0 51335.0 48370.0 44033.0 39556.0 Uttarakhand 8321.0 7765.0 6845.0 5599.0 5008.0 - West Bengal 32919.0 30290.0 27902.0 25966.0 24509.0 18958.0India 746498.0 691038.0 666007.0 624496.0 578819.0 467400.0
Source:Central Electricity Authority, Central Electricity Regulatory Commission
Power scenario - Installed capaciy for all regions at a glance (MW), as on April 30, 2011Sr. No. Region Thermal Nuclear Hydro Renewables TOTAL Coal Gas Oil Total (MNRE)1 Northern 24232.50 4134.76 12.99 28380.25 1620 13822.75 3165.55 46988.552 Western 31130.50 7903.81 17.48 39051.79 1840 7447.50 5357.96 53697.253 Southern 20482.50 4690.78 939.32 26112.60 1320 11299.03 9341.67 48073.304 Eastern 18747.88 190.00 17.20 18955.08 0 3882.12 359.64 23196.845 N. Eastern 60.00 787.00 142.74 989.74 0 1116.00 223.60 2329.346 Islands 0.00 0.00 70.02 70.02 0 0.00 6.10 76.127 All India 94653.38 17706.35 1199.75 113559.48 4780 37567.4 18454.52 174361.4
Note: Installed capacity as on 30.04.2011; MNRE - Ministry of New and Renewable Energy Source: Central Electricity Authority
Power supply positionPeriod Peak demand Peak met Peak defi cit Peak defi cit Requirement Availability Defi cit Energy defi cit (MW) (MW) (MW) % (MU) (MU) (MU) %2004-05 87906 77652 10254 11.70% 591373 548115 43258 7.30%2005-06 93255 81792 11463 12.30% 631554 578819 52735 8.40%2006-07 100715 86818 13897 13.80% 690587 624495 66092 9.60%2007-08 108866 90793 18073 16.60% 739343 666007 72392 9.90%2008-09 109809 96785 13024 11.90% 777039 691038 86001 11.10%2009-10 119166 104009 15157 12.70% 830594 746644 83950 10.10%2010-11 122287 110256 12031 9.80% 861591 788355 73236 8.50%
Source: Central Electricity Authority
Commodity Insights Yearbook 2011172
074-177_CYIB_2011_Non-Agri_Final.indd 172074-177_CYIB_2011_Non-Agri_Final.indd 172 1/18/2012 11:46:44 PM1/18/2012 11:46:44 PM

DATABANK - AGRI COMMODITIES
Volume of electricity traded by the trading licencesYear 2010-11 2009-10 2008-09 2007-08 2006-07Name of trading Volume of % of total Volume of % of total Volume of % of total Volume of % of total Volume of % of totallicensee trade (MUs) volume trade (MUs) volume trade (MUs) volume trade (MUs) volume trade (MUs) volumePTC India Ltd 9725.47 35.11% 11460.21 42.89% 6520.57 26.93% 9552.79 45.57 6575.41 43.77NTPC Vidyut Vyapar Nigam Ltd 4728.39 17.07% 3540.40 13.25% 4831.48 19.96% 3324.07 15.86 2662.98 17.73National Energy Trading & Services Ltd 3745.04 13.52% - - - - - - - -Tata Power Trading Company (P) Ltd 2285.25 8.25% 2626.58 9.83% 2523.26 10.42% 1681.95 8.02 1206.38 8.03Reliance Energy Trading (P) Ltd 3179.96 11.48% 1966.59 7.36% 1856.07 7.67% 776.25 3.7 878.29 5.85Knowledge Infrastructure Systems (P) Ltd. 639.87 2.31% 400.80 1.50% 1.61 0.01% - - - -Adani Enterprises Ltd 362.87 1.31% 985.97 3.69% 2634.25 10.88% 1321.88 6.31 1844.66 12.28JSW Power Trading Company Ltd 1218.8 4.40% 2116.22 7.92% 2001.44 8.27% 1478.57 7.05 967.94 6.44Instinct Infra & Power Ltd 551.23 1.99% - - 2.4 0.01% 108.29 0.52 106.47 0.71GMR Energy Trading Ltd. 614.94 2.22% 619.90 2.32% 631.66 2.61% - - - -Shree Cement Ltd. 307.47 1.11% - - 52.51 0.22% 59.52 0.28 - -Mittal Power Processor Ltd. 74.79 0.27% 106.88 0.40% - - - - - -Pune Power Development (P) Ltd 116.34 0.42% 171.01 0.64% Essar Electric Power Development Corp. Ltd. 16.62 0.06% - - - - - - - -RPG Power Trading Co. Ltd. 72.02 0.26% 130.93 0.49% 16.65 0.07% - - - -Indrajit Power Technologies Ltd. 22.16 0.08% - - Godavari Power & Ispat Ltd 22.16 0.08% - - Global Energy (P) Ltd. 5.54 0.02% - - - - - - - -Jindal Power Trading Company Ltd. 8.31 0.03% - - - - 0 0 36.61 0.24Lanco Electric Utility Ltd - - 2517.02 9.42% 2841.12 11.74% 2600.02 12.4 744 4.95Visa Power Ltd - - - - - - 15.56 0.07 - -Kalyani Power Development (P) Ltd - - - - 168.11 0.69% 39.31 0.19 - -Patni Projects Private Ltd - - - - 6.58 0.03% 6.58 0.03 - -Vinergy International Private Ltd - - 8.02 0.03% 52.51 0.22% 59.52 0.28 - -Instinct Avertising & Marketing Ltd. - - 66.80 0.25% 66.74 0.28% - - - -Subhash Kabini Powor Corporation Ltd - - - - - - 0 0 36.61 0.24Karam Chand Thapar & Bros Ltd - - - - 2.4 0.01% 108.29 0.52 106.47 0.71Total 27700 100% 26720 100% 24209.36 100% 20964.77 100% 15022.74 100%
Note: For the year 2009-10, % of total volume is taken for the year 2009 from Annual Report - Short Term Power Market in India, 2009 and hence accordingly the volumes are calculated; Source: CERC
A PwC & MCX Joint Endeavour 173www.mcxindia.com / www.pwc.com/in/en
DATABANK - NON-AGRI COMMODITIES
074-177_CYIB_2011_Non-Agri_Final.indd 173074-177_CYIB_2011_Non-Agri_Final.indd 173 1/18/2012 11:46:45 PM1/18/2012 11:46:45 PM

EDITORIALSPROLOGUE INDIAN ECONOMYEXPERTS' VIEWS
Electricity prices and trading activityMonth ICE UK base electricity futures US residential electricity price
Close price GBP/mwh Aggregate vol (lots) Month-end OI (lots) USD/kwh
Dec-10 53.60 55 9890 11.04 Nov-10 48.90 170 10065 11.70 Oct-10 43.74 215 9950 11.93 Sep-10 42.66 55 10075 11.97 Aug-10 41.66 85 10470 12.04 Jul-10 40.56 100 4100 12.03 Jun-10 43.02 0 3735 11.95 May-10 41.31 190 3735 11.97 Apr-10 37.77 15 0 11.76 Mar-10 34.12 15 4330 11.20 Feb-10 34.50 80 4755 10.93 Jan-10 37.19 40 4830 10.54 Dec-09 36.68 0 5370 10.93 Nov-09 34.58 0 5010 11.33 Oct-09 38.79 5 4480 11.70 Sep-09 37.35 - 4210 12.00 Aug-09 36.20 20 5685 12.00 Jul-09 33.25 15 3845 11.90 Jun-09 32.34 120 3515 11.85 May-09 36.15 560 3203 11.80 Apr-09 35.14 10 1990 11.55 Mar-09 36.25 30 1730 11.33 Feb-09 35.87 75 910 11.23 Jan-09 54.12 60 1000 11.03 Dec-08 60.64 - 1170 11.00 Nov-08 62.77 10 1635 11.52 Oct-08 76.40 30 1800 11.91 Sep-08 130.00 - 2055 11.99 Aug-08 89.50 210 1720 12.15 Jul-08 81.27 40 955 12.14 Jun-08 85.02 70 650 11.84 May-08 76.57 - 690 11.48 Apr-08 64.87 - 760 11.02 Mar-08 57.80 - 830 10.57 Feb-08 56.74 - 820 10.28 Jan-08 53.30 10 875 10.24 Dec-07 60.16 30 920 10.33 Nov-07 56.20 40 1025 10.70 Oct-07 50.11 110 930 10.82 Sep-07 36.79 20 735 10.96 Aug-07 26.73 70 800 11.07 Jul-07 26.00 40 1135 11.07 Jun-07 24.45 40 1575 11.09 May-07 26.60 30 1830 10.77 Apr-07 22.55 180 2070 10.63 Mar-07 20.88 40 2345 10.27 Feb-07 20.35 140 2915 9.89 Jan-07 24.70 250 3430 10.06 Dec-06 35.37 180 3630 9.84 Nov-06 44.65 280 3770 10.18 Oct-06 49.17 650 3385 10.58 Sep-06 46.75 345 3110 10.94 Aug-06 40.43 175 3050 10.94 Jul-06 37.00 235 2735 10.96 Jun-06 37.38 170 2755 10.85 May-06 35.57 170 2920 10.61 Apr-06 36.95 265 2820 10.32
Note: Vol and OI in lots; aggregate volume in all contracts during the month; Cumulative open interest in all contracts at the month-end. * MCV - minimum clearing volume (Matched & Cleared); Source: Exchanges’ websites
Commodity Insights Yearbook 2011174
074-177_CYIB_2011_Non-Agri_Final.indd 174074-177_CYIB_2011_Non-Agri_Final.indd 174 1/26/2012 12:26:46 PM1/26/2012 12:26:46 PM

DATABANK - AGRI COMMODITIES
rice On-Peak day ahead LMP electricity Off-Peak day ahead LMP electricity IEX spot price/New England (NEPOOL) spot price/New England (NEPOOL)
MCV* (MW) Monthly average unit value (Rs) USD/mwh USD/mwh
47.66 38.50 1,121,375 2,45847.39 38.88 865,617 2,02540.49 29.59 1,089,461 2,73145.96 33.09 1,127,849 2,52093.60 38.65 1,181,299 3,41258.00 38.00 888,049 3,36544.79 42.50 748,389 3,49950.92 35.00 591,861 4,54449.43 33.00 579,198 7,80236.94 27.00 687,345 5,48248.68 36.00 727,207 3,23269.05 48.23 783,705 3,56077.12 57.00 623,545 3,240
48.24 35.94 647,156 3,16347.73 33.38 555,345 4,95034.97 22.60 500,179 4,00228.53 18.56 514,637 7,38338.29 26.00 577,176 4,81239.26 30.00 530,333 7,39139.03 29.50 373,725 6,84333.65 25.00 408,705 10,09940.62 30.16 362,173 8,40751.83 42.48 182,824 6,84054.10 44.00 296,151 6,18271.33 60.57 359,574 6,87367.00 48.00 450,643 7,47465.50 51.67 375,190 8,31766.61 56.50 278,597 7,95185.90 57.00 223,372 7,648
102.37 69.00 74,917 7,682140.44 94.00 424 7,143105.38 79.50 - -107.89 79.79 - -92.62 69.45 - -80.61 83.85 - -78.20 58.63 - -
106.18 55.60 - -84.76 61.68 - -65.88 51.55 - -63.40 44.00 - -66.58 44.50 - -85.83 55.95 - -61.77 51.00 - -81.05 55.00 - -76.67 44.55 - -78.49 47.15 - -71.33 52.76 - -78.63 59.80 - -51.32 32.44 - -75.70 46.00 - -70.99 49.53 - -49.37 32.00 - -67.05 33.15 - -
107.87 65.00 - -68.90 46.80 - -71.60 38.50 - -67.13 48.00 - -
ed); IEX commenced operations on June 28, 2009 , Note: Future prices are for near month continuous futures contract
A PwC & MCX Joint Endeavour 175www.mcxindia.com / www.pwc.com/in/en
DATABANK - NON-AGRI COMMODITIES
074-177_CYIB_2011_Non-Agri_Final.indd 175074-177_CYIB_2011_Non-Agri_Final.indd 175 1/26/2012 12:26:46 PM1/26/2012 12:26:46 PM

EDITORIALSPROLOGUE INDIAN ECONOMYEXPERTS' VIEWS
Economic parameters impacting power/electricity prices 2010 2009 2008 2007 2006 2001
Real GDP (annual % change) US 2.8 -2.6 1.1 2.0 2.9 0.8Japan 4.3 -6.3 -0.3 1.9 2.8 0.7Eurozone 1.8 -4.1 1.0 2.3 2.6 1.9China 10.3 9.2 9.0 11.5 11.1 8.3India 9.7 5.7 7.3 8.9 9.7 3.9OECD 2.8 -3.4 1.0 2.6 3.2 2.4
Consumer Price Inflation (annual % change) US 1.6 -0.3 1.0 2.5 2.7 2.8Japan -0.9 -1.4 0.5 1.4 0.3 -0.7Eurozone 1.5 0.3 1.0 3.0 2.2 2.4China 3.1 0.8 3.0 5.9 2.0 -0.1India 13.2 10.9 5.0 7.0 6.7 5.2OECD 1.5 0.1 1.0 3.0 2.2 2.8
Industrial Output (annual % change) US 7.0 -2.9 -11.3 1.5 3.0 -3.7Japan 15.4 -21.3 -3.3 2.8 4.4 -6.3Eurozone 8.9 -3.7 -12.4 1.3 3.9 0.4China 15.7 11.0 12.9 17.4 15.4 9.9India 2.5 18.0 0.5 7.6 10.3 2.1OECD 7.9 -12.3 -2.1 3.3 3.8 -2.2
Interest Rates (%) US 0.1 0.1 0.1 4.3 6.3 1.3Japan 0.3 0.3 0.3 0.8 0.4 0.1Eurozone 1.8 1.8 3.0 5.0 4.5 4.3China 3.3 2.8 2.8 3.3 3.3 3.2India (repo rate ) 6.3 4.8 6.5 7.8 7.3 8.5
Money Supply (annual % change) US 3.4 3.5 10.0 6.1 5.9 10.5Japan 2.3 3.1 1.8 2.1 0.7 3.3Eurozone 1.7 -0.4 7.6 11.6 10.0 8.0China 19.7 27.7 17.8 16.7 16.9 14.4India 19.1 17.7 19.9 22.8 19.3 13.6
Equity Index (end of period) US (Dow Jones) 11578 10428 8776 13265 12463 10022India (Sensex) 20509 17464 9647 20287 13787 3262
OECD indicators (annual % change) OECD total monetary aggr. & comp. broad money index 3.2 6.7 8.9 8.5 7.3 9.2OECD Total PPI Economic Activities Domestic Manufacturing 3.8 -4.0 6.8 3.2 3.7 2.0OECD Total CPI OECD Groups Total Energy 7.8 -10.4 12.4 4.0 9.3 4.9
Note: Interest rates mentioned are central Bank discount rate. For India, interest rates mentioned are repo rates Source: OECD, IMF, CPM Gold Yearbook, World Bank, RBI, BSE, Dow Jones
Commodity Insights Yearbook 2011176
074-177_CYIB_2011_Non-Agri_Final.indd 176074-177_CYIB_2011_Non-Agri_Final.indd 176 1/18/2012 11:46:45 PM1/18/2012 11:46:45 PM

DATABANK - AGRI COMMODITIES
Electricity Generation (2010) Electricity Consumption (2010)
Source: BP Statistical Review 2011 Source: Enerdata
Others46%
US20%
China20%
India4%
Japan5%
Russia5%
Others45%
USA21%
China20%
India4%
Russia5%
Japan5%
Price of Short-Term Transaction of Electricity
Source: CERC
12
10
8
6
4
2
0
(Rs/kwh)
Aug-
08
Oct
-08
Dec
-08
Feb-
09
Apr
-09
Jun-
09
Aug-
09
Oct
-09
Dec
-09
Feb-
10
Apr
-10
Jun-
10
Aug
-10
Oct
-10
Dec
-10
Feb-
1108
08
08
09
09
09
09
09
09 10 10 10 10 10 10 11
Price of PX Transactions (IEX) Price of Bilateral Transaction through traders Spread (NG1-NG2) Price of UI (SR Grid)
A PwC & MCX Joint Endeavour 177www.mcxindia.com / www.pwc.com/in/en
DATABANK - NON-AGRI COMMODITIES
074-177_CYIB_2011_Non-Agri_Final.indd 177074-177_CYIB_2011_Non-Agri_Final.indd 177 1/18/2012 11:46:45 PM1/18/2012 11:46:45 PM

Commodity Insights Yearbook 2011178178
Prices of agri-commodities were affected by higher energy prices, more frequent than usual adverse weather conditions, and the diversion of some food commodities to the production of biofuels (notably, maize in the US and edible oils in Europe).
John Baffes, Senior Economist, World Bank
In India, during 2010-11, the impact of good monsoon was visible in robust growth in agriculture and allied activities.The south-west monsoon (June 1-Sept 30) showered a cumulative rainfall of 912.8mm, 2% above normal.
IIIIIIIIIIIIIIIIIIIIIIIInnnnnnnnnnnnnnnnnnnnnnnnnnnnnnnnnnnn IIIIIIIIIIIIIIIIIIIIIInnnnnnnnnnnnnnnnnnnnnnnnnnnnnnndddddddddddddddddddddddddddddddddiiiiiiiiiiiiiiiiiiiiiiaaaaaaaaaaaaaaaaaaaaaaaaa,,,,,,,,,,,,,,,,,, ddddddddddddddddddddddddddddduuuuuuuuuuuuuuuuuuuuuuuuuurrrrrrrrrrrrrrrriiiiiiiiiiiiiiiiiiiiinnnnnnnnnnnnnnnnnggggggggggggggggggg 22222222222222222222222222220000000000000000000000000111111111111111111111100000000000000000000000000000-----1111111111111111111111111111111111111111111,,,,,,,,,,,,,,,,,,,,,,,,,,,,,,, tttttttttttttttttttttttttttttttttttttttttttthhhhhhhhhhhhhhhhhhhhhhhhhhhhhhhhhhhhhhhhhhheeeeeeeeeeeeeeeeeeeeeeeeeeeeeeeeeeeeeeeeeee iiiiiiiiiiiiiiiiiiiiiiiiiiimmmmmmmmmmmmmmmmmmmmmmmmmmmmmmmmmmmmmmmmmmmmmmmmmmmppppppppppppppppppppppppppppppppppppppppaaaaaaaaaaaaaaaaaaaaaaaaaaaaaaaaaaaaaaaaaaacccccccccccccccccccccccccccccccccccccccccctttttttttttttttttttttttttttttttttttttttttttt ooooooooooooooooooooooooooooooooooooooffffffffffffffffffffffffff gggggggggggggggggggggggggggggggggoooooooooooooooooooooooooooooooooooooooooooooooooooooooooooooodddddddddddddddddddddddddddddddddddddddddddddddd mmmmmmmmmmmmmmmmmmmmmmmmmmmmmooooooooooooooooooooooooooooonnnnnnnnnnnnnnnnnnnnnnnnnnnnnnnnnnsssssssssssssssssssssssssssssssssssssssssooooooooooooooooooooooooooooooooooooooooooooooooooooooooooooooooooooooooooooooooooooooooooooonnnnnnnnnnnnnnnnnnnnnnnnnnnnnnnnnnnnn wwwwwwwwwwwwwwwwwwwwwwwwwwwwwwwwwwwwwwwwwaaaaaaaaaaaaaaaaaaaaaaaaaaaaaaaasssssssssssssssssssssssssssssssssssss vvvvvvvvvvvvvvvvvvvvvvvvvvvvvvviiiiiiiiiiiiiiiiiiiiiiiissssssssssssssssssssssssssssssiiiiiiiiiiiiiiiiiiiiiiiibbbbbbbbbbbbbbbbbbbbbbbbbbbbbbbllllllllllllllllllleeeeeeeeeeeeeeeeeeeeeeeeee iiiiiiiiiiiiiiiiiiiiiinnnnnnnnnnnnnnnnnnnnnnnnnnnnnnnnnnnnnnnnn rrrrrrrrrrrrrrrrrrrrrrrrrrrroooooooooooooooooooooooooooooooobbbbbbbbbbbbbbbbbbbbbbbbbbbbbbbbbbbbbbbuuuuuuuuuuuuuuuuuuuuuuuuuuuuuuuuussssssssssssssssssssssssssssttttttttttttttttttttttttttttttttgggggggggggggggggrrrrrrrrrrrrrroooooooooooooowwwwwwwwwwwwwwttttttttttttttttttthhhhhhhhhhhhhhhhhh iiiiiiiiiiiiiiinnnnnnnnnnnnnnnnnnnnnnnnnn aaaaaaaaaaaaaaaaaaaaaaaaagggggggggggggrrrrrrrrrrrrrrrriiiiiiiiiiicccccccccccuuuuuuuuuuuuuulllllllllllllllllltttttttttttttttttttttttuuuuuuuuuuuuuuuuuuuuuuuuuuuuuuuurrrrrrrrrrrrrrrrrrrrrrrrrrrrrrrrrreeeeeeeeeeeeeeeeeeeeeeeeeeeeeeeeeeeeeeeeeeeee aaaaaaaaaaaaaaaaaaaaaaaaaaaaaaaaaaaaaaannnnnnnnnnnnnnnnnnnnnnnnnnnnnnnnnnnnnddddddddddddddddddddddddddddddddddddddddd aaaaaaaaaaaaaaaaaaaaaaaaaaaaaaaaaaallllllllllllllllllllllllllllliiiiiiiiiiiiieeeeeeeeeeeeeeeeeeeddddddddddddddddd aaaaaaaaaaaaaaaacccccccccccccccccccccttttttttttttttttttiiiiiiiiiiiiiivvvvvvvvvvvvvvvvviiiiiiiiiiiiiiiiiitttttttttttttttttttttttttttttttttttttttttttttttttiiiiiiiiiiiiiiiiiiiiiiiiiiiiiieeeeeeeeeeesssssssssssssss
AGRICULTURALCOMMODITIES
INDIAN ECENOMYINDIAN ECONOMYMARKET COMMENTRYPROLOGUE EXPERTS' VIEWS
178_300_CYIB_2011_Agri_final.indd 178178_300_CYIB_2011_Agri_final.indd 178 1/26/2012 1:27:33 AM1/26/2012 1:27:33 AM

A PwC & MCX Joint Endeavour 179www.mcxindia.com / www.pwc.com/in/en
179
DATABANK - NON-AGRI COMMODITIES
Inside...
Oil and oilseeds >> 180
Crude palm oil >> 182
Refined soybean oil >> 187
Soybean fundamentals >> 192
Rapeseed/Mustard seeds >> 196
Castor seeds >> 202
Fibres >>
Cotton fundamentals >> 210
Jute fundamentals >> 218
Cereals >> 222
Rice >> 224
Wheat >> 234
Maize >> 242
Pulses >> 252
Spices >> 268
Others >> 279
Mentha Oil >> 280
Potato >> 282
Sugar >> 286
Rubber >> 292
Coffee >> 296
AGRICULTURAL COMMODITIES
178_300_CYIB_2011_Agri_final.indd 179178_300_CYIB_2011_Agri_final.indd 179 1/26/2012 1:28:00 AM1/26/2012 1:28:00 AM

EDITORIALSPROLOGUE INDIAN ECONOMYEXPERTS' VIEWS
Vegetable oils are derived from oilseeds and plants.
Oilseed crops are grown primarily for the oil contained in
the seeds. The oil content of small grains (for example,
wheat) is only 1-2%; that of oilseeds ranges from
about 20% for soybeans to over 40% for sunfl ower and mustard
seed. Major sources of edible seed oils are soybean, sunfl ower,
rapeseed, cotton and peanuts. Seed oils from linseed and castor
beans are used for industrial purposes. Major oilseeds grown in
India are soybean, mustard seed, groundnut, cotton seed, castor
seed, sunfl ower seed, sesame seed, saffl ower seed, linseed and
niger seed, in that order.
India is a net importer of edible oil, with imports meeting over
52% of its domestic consumption (ICRA, USDA). Over a period,
Indian consumers’ preference has shifted to palm oil and the
country has become the largest importer of the commodity in
the world. As production of palm oil is miniscule, India is largely
dependent on imports from the world’s two largest producers,
Malaysia and Indonesia (ICRA, USDA).
Crude palm oil (CPO) and refi ned soy oil (RSO) futures
prices on MCX opened at Rs.366.70/10 kg and
Rs.484.85/10 kg, respectively, on January 1, 2010.
On January 29, CPO futures, following global funda-
mentals, touched a year low of Rs.345.10. During
the fi rst half of 2010, both CPO and RSO traded in
a narrow range as huge stocks of imported edible oil
in domestic markets on the back of the government’s
decision to continue imports of CPO at zero percent
duty weighed on the prices. Besides, good carryover
stocks of RSO, favourable crush margin in India and
stable international prices dulled the prices of the
edible oil complex.
In the second half of the year, warmer weather in
China raised expectations of higher Chinese imports
of palm oil in international markets, giving an upward
Commodity in 2010 Exchange (contract) Price Unit Open High Low Close Annualised
VolatilityVolume
(in lots)^
Ref. Soy OilMCX (10 tonnes) Rs/ 10 kg. 485.00 635.50 436.00 632.75 14.31% 126,292CBOT (27 tonnes) US Cent/ lb 40.35 57.91 35.75 57.74 21.16% 20,786,399
Crude Palm OilMCX (10 tonnes) Rs/ 10 kg 366.20 547.00 344.20 544.80 12.76% 425,377BMD (25 tonnes) MYR/ tonne 2,620.00 3,850.00 2,200.00 3,814.00 19.08% 4,031,930
Source: ^All contracts - all variants, Source: Exchanges’ websites
thrust to CPO prices. Subsequently, CPO prices reversed the
mixed trend and moved up as the-then prevailing confl ict between
China and Argentina on soybean oil imported by China lifted the
prices on hopes that the local users might substitute soybean
oil for palm oil. However, mixed factors such as Euro-zone debt
worries, rising crude mineral oil prices and larger-than-expected
soybean output in South America soon took CPO and RSO
prices on a yo-yo during August-September. October onwards,
the prices climbed up on tight supply as a prolonged dry spell
had adversely affected the harvest of CPO in Malaysia and
Indonesia. Additionally, increasing demand for edible oil applica-
tions for biodiesel production also lent support to the rally in
CPO as a cheaper substitute. Further, La Nina posed a serious
threat to oilseeds and edible oil supplies and, thus, an upswing
in CPO and RSO prices. All these factors pushed CPO and RSO
futures on MCX to a year high of Rs.544.80 and Rs.632.75,
respectively, by year-end (Information in the last paragraphs
is sourced from: USDA, MCX, DGFT, www.en.mercopress.com,
www.palmoilhq.com).
MCX CPO and RSO futures prices in 2010700
625
550
475
400
Source: Metastocks CPO (Rs./10 kg) Ref. Soy oil (Rs./10kg)
Prolonged dry spell adversely affecting the harvest of CPO in
Malaysia and Indonesia
Adverse weather in China; standoff between China and Argentina on soy trade – up-ward pressure on CPO prices
1-Jan
-10
29-Ja
n-10
26-F
eb-1
0
26-M
ar-1
0
23-A
pr-1
0
21-M
ay-1
0
18-Ju
n-10
16-Ju
l-10
13-A
ug-1
0
10-S
ep-1
0
8-Oc
t-10
5-No
v-10
3-De
c-10
31-D
ec-1
0
600
525
450
375
300
Oil and oilseeds Adding the zing
Commodity Insights Yearbook 2011180
178_300_CYIB_2011_Agri_final.indd 180178_300_CYIB_2011_Agri_final.indd 180 1/26/2012 1:28:20 AM1/26/2012 1:28:20 AM

DATABANK - NON-AGRI COMMODITIES
A PwC & MCX Joint Endeavour 181www.mcxindia.com / www.pwc.com/in/en
DATABANK - AGRI COMMODITIES
178_300_CYIB_2011_Agri_final.indd 181178_300_CYIB_2011_Agri_final.indd 181 1/26/2012 1:28:25 AM1/26/2012 1:28:25 AM

EDITORIALSPROLOGUE INDIAN ECONOMYEXPERTS' VIEWS
Crude palm oil fundamentals - World and India (in `000' tonnes) 2011-12e 2010-11 2009-10 2008-09 2007-08 2006-07 2001-02
World
Beginning stocks 4,427 5,237 4,885 4,132 4,389 4,211 3,201 Production 50,261 47,260 45,862 43,992 41,084 37,329 25,312 Imports 37,991 35,424 34,751 33,664 30,284 26,432 16,480 Consumption 49,896 47,292 44,629 42,108 39,318 35,981 24,510 Exports 38,820 36,202 35,632 34,795 32,307 27,602 17,693 Total Supply 92,679 87,921 85,498 81,788 75,757 67,972 44,993 Ending Stocks 3,963 4,427 5,237 4,885 4,132 4,389 2,790
India
Beginning stocks 605 940 727 40 52 24 440 Production 50 50 50 50 50 50 35 Imports 7,100 6,500 6,603 6,867 5,013 3,650 3,400 Consumption 7,550 6,885 6,440 6,230 5,075 3,670 3,725 Exports - - - - - 2 - Total Supply 7,755 7,490 7,380 6,957 5,115 3,724 3,875 Ending Stocks 205 605 940 727 40 52 150 Average daily volatility of - 0.97% 1.27% 1.45% - 1.40% -MCX spot prices* Indian Price (Rs. /10kg) - 524.08 367.13 307.39 563.11 396.66 -Bursa Malasia price (Rs./10 kg) - 396.38 310.1 280.79 357.34 236.1 146.43
Note: e - Source estimates, data retrieved on 29 July, 2011; Market Year (India): October to September; * Relaunched on 6th June 2008, Mumbai prices - 6th June-30th June 2008 and Kandla prices -1st July 2009-31st March 2010.Source: USDA
Crude palm oil balance sheet 2011-12e - World (in `000' tonnes) Supply DemandCountry Begining Production Imports Consumption Exports Ending stocks stocks
Indonesia 302 25,400 60 6,280 19,150 332Malaysia 1,588 18,400 1,400 4,070 15,800 1,518Thailand 146 1,450 50 1,418 90 138Nigeria 108 850 408 1,240 18 108Columbia 6 880 125 890 100 21Others 2,277 3,281 35,948 35,998 3,662 1,846Grand Total 4,427 50,261 37,991 49,896 38,820 3,963
Note: e - Source estimates, data retrieved on 29 July, 2011;Source: USDA
Selected State-wise Quantity of Crude Palm Oil Obtained under Oil Palm Development Programme in India (in tonnes)State 2009-10* 2008-09 2007-08 2006-07 2001-02
Andhra Pradesh 57,402 50,190 38,000 35,509 18,974Karnataka 1,165 1,081 1,037 974 574Tamil Nadu 365 366 266 249 0Kerala 6,605 7,371 5,732 6,888 980Others 952 0 0 345 2,086All India 66,488 59,007 45,036 43,965 22,614
Source : Ministry of Agriculture, Govt. of India
Commodity Insights Yearbook 2011182
178_300_CYIB_2011_Agri_final.indd 182178_300_CYIB_2011_Agri_final.indd 182 1/26/2012 1:28:27 AM1/26/2012 1:28:27 AM

DATABANK - NON-AGRI COMMODITIES
Crude palm oil - BRICS Nations fact sheet (in `000' tonnes)World Production Import Export Consumption Total Population Per capita Per capita Supply (in million) availability consumption (kg) (kg)
Brazil 275.00 175.00 20.00 435.00 488.00 206.47 2.36 2.11 Russia 0.00 550.00 0.00 574.00 599.00 137.97 4.34 4.162011-12e India 50.00 7,100.00 0.00 7,550.00 7,755.00 1,208.36 6.42 6.25 China 0.00 6,650.00 1.00 6,599.00 6,950.00 1,341.85 5.18 4.92 South Africa 0.00 380.00 2.00 378.00 380.00 49.83 7.63 7.59 Brazil 265.00 165.00 18.00 410.00 466.00 203.43 2.02 2.29 Russia 0.00 550.00 1.00 510.00 560.00 138.74 4.04 4.402010-11 India 50.00 6,500.00 0.00 6,885.00 7,490.00 1,189.17 6.52 6.59 China 0.00 5,950.00 1.00 5,977.00 6,278.00 1,336.72 4.70 4.92 South Africa 0.00 365.00 2.00 363.00 365.00 49.00 7.41 7.45 Brazil 240.00 156.00 17.00 375.00 428.00 201.10 1.86 2.13 Russia 0.00 527.00 0.00 527.00 537.00 139.39 3.78 3.852009-10 India 50.00 6,603.00 0.00 6,440.00 7,380.00 1,173.11 5.76 6.26 China 0.00 5,760.00 1.00 5,930.00 6,259.00 1,330.14 4.46 4.71 South Africa 0.00 349.00 2.00 347.00 349.00 49.11 7.07 7.11 Brazil 230.00 128.00 25.00 340.00 397.00 198.74 2.00 1.71 Russia 0.00 517.00 1.00 584.00 595.00 140.04 4.25 4.172008-09 India 50.00 6,867.00 0.00 6,230.00 6,957.00 1,166.08 5.97 5.34 China 0.00 6,118.00 1.00 5,618.00 6,118.00 1,338.61 4.57 4.20 South Africa 0.00 331.00 6.00 325.00 331.00 49.05 6.75 6.63 Brazil 205.00 153.00 4.00 315.00 358.00 196.34 1.60 1.82 Russia 0.00 739.00 1.00 705.00 784.00 140.70 5.01 5.572007-08 India 50.00 5,013.00 0.00 5,075.00 5,115.00 1,148.00 4.41 4.45 China 0.00 5,223.00 1.00 5,222.00 5,223.00 1,330.04 3.93 3.93 South Africa 0.00 315.00 2.00 313.00 315.00 48.78 6.42 6.46 Brazil 190.00 99.00 2.00 287.00 289.00 190.01 1.52 1.51 Russia 0.00 524.00 1.00 528.00 574.00 141.38 4.06 3.732006-07 India 50.00 3,650.00 2.00 3,671.00 3,720.00 1,129.87 3.29 3.25 China 0.00 5,139.00 1.00 5,138.00 5,139.00 1,321.85 3.89 3.89 South Africa 0.00 298.00 1.00 297.00 298.00 44.00 6.77 6.75
Note: e - Source estimates, Source: USDA, World Bank, IFM, CIA World Fact Book"
Palm Oil: Ending Stock & Prices
Source: BMD & USDA. ES - ending stock, Indian prices Rs/20 kg, Int. prices MYR/tonne
750
600
450
300
150
0
3500
2800
2100
1400
700
0
2005-06 2007-08 2009-102004-05 2006-07 2008-09 2010-11
India ES
World ES (In 10s )
Mumbai prices
Int. Prices
2003-042002-03
000 tones Prices
A PwC & MCX Joint Endeavour 183www.mcxindia.com / www.pwc.com/in/en
DATABANK - AGRI COMMODITIES
178_300_CYIB_2011_Agri_final.indd 183178_300_CYIB_2011_Agri_final.indd 183 1/26/2012 1:28:28 AM1/26/2012 1:28:28 AM

EDITORIALSPROLOGUE INDIAN ECONOMYEXPERTS' VIEWS
Crude palm oil prices and trading activity MCX Futures prices (Rs/10 Kg) Month Open High Low Close Volume in Open interest lots^ in lots^^ Dec-10 513.00 549.40 513.00 549.40 53922 5979 Nov-10 449.70 503.50 449.70 503.50 50207 5669 Oct-10 413.00 452.50 405.00 450.40 39847 4550 Sep-10 414.50 424.50 413.50 413.70 36862 4188 Aug-10 402.30 428.00 400.00 417.80 41951 5004 Jul-10 365.00 400.40 362.20 399.80 21332 3754 Jun-10 376.60 379.50 363.50 364.70 19202 3754 May-10 367.30 381.60 364.30 377.00 17918 4221 Apr-10 358.50 367.40 356.30 367.40 17293 4034 Mar-10 365.00 373.50 359.60 359.80 35918 4333 Feb-10 344.00 365.00 343.30 363.10 38579 6909 Jan-10 362.50 374.90 344.60 344.60 52346 6950 Dec-09 341.70 357.40 341.00 357.40 57351 5563 Nov-09 316.40 346.00 313.50 341.20 65041 8582 Oct-09 317.30 324.70 303.60 314.40 39279 4941 Sep-09 348.60 348.60 318.00 318.00 37931 3880 Aug-09 328.80 363.00 328.80 349.90 44261 5359 Jul-09 330.60 332.20 296.00 326.90 50997 3556 Jun-09 369.80 374.20 325.00 335.80 23530 3906 May-09 391.60 409.40 352.70 364.60 19590 2546 Apr-09 311.40 385.10 311.40 379.40 14577 1537 Mar-09 291.20 315.30 291.20 307.70 8828 1260 Feb-09 268.40 290.50 268.10 290.30 6615 1663 Jan-09 266.00 300.10 266.00 268.70 8156 1643 Dec-08 263.30 265.70 248.20 264.60 8037 1824 Nov-08 273.00 278.10 238.00 262.10 23386 3398 Oct-08 340.90 340.90 271.00 274.00 22639 2708 Sep-08 383.10 384.00 329.70 343.00 20622 2858 Aug-08 439.40 439.40 381.90 381.90 22972 2436 Jul-08 512.40 518.30 439.00 446.00 17452 3339 Jun-08 516.70 522.50 507.00 511.90 19462 1903 May-08 N/A N/A N/A N/A N/A N/A Apr-08 N/A N/A N/A N/A N/A N/A Mar-08 N/A N/A N/A N/A N/A N/A Feb-08 N/A N/A N/A N/A N/A N/A Jan-08 N/A N/A N/A N/A N/A N/A Dec-07 N/A N/A N/A N/A N/A N/A Nov-07 N/A N/A N/A N/A N/A N/A Oct-07 N/A N/A N/A N/A N/A N/A Sep-07 N/A N/A N/A N/A N/A N/A Aug-07 N/A N/A N/A N/A N/A N/A Jul-07 N/A N/A N/A N/A N/A N/A Jun-07 N/A N/A N/A N/A N/A N/A May-07 N/A N/A N/A N/A N/A N/A Apr-07 N/A N/A N/A N/A N/A N/A Mar-07 N/A N/A N/A N/A N/A N/A Feb-07 N/A N/A N/A N/A N/A N/A Jan-07 234.20 234.20 227.00 227.00 0 0 Dec-06 224.70 234.20 218.00 234.20 0 0 Nov-06 197.50 218.20 197.50 218.20 0 0 Oct-06 188.00 193.00 188.00 193.00 0 0 Sep-06 191.30 191.30 181.50 181.50 0 0 Aug-06 193.00 203.00 191.30 191.30 0 0 Jul-06 177.80 193.00 177.80 193.00 0 0 Jun-06 176.30 181.10 171.10 175.90 26 0 May-06 176.40 181.50 171.10 176.30 214 0 Apr-06 178.10 178.10 163.10 171.00 330 0
Note: MCX spot prices - April 06 - June 08 Mumbai market; July 08 onward - Kandla market, N/T-Traded, N/A- Not Available, ^Aggregate volume in all contracts during the month; ^^Cumulative opSource: Ministry of Commerce and Industry; Exchanges' websites
Commodity Insights Yearbook 2011184
178_300_CYIB_2011_Agri_final.indd 184178_300_CYIB_2011_Agri_final.indd 184 1/26/2012 1:28:28 AM1/26/2012 1:28:28 AM

DATABANK - NON-AGRI COMMODITIES
MCX Spot prices -Mumbai/Kandla (Rs/10 Kg) Prices of Crude palm oil Bursa Malaysia palm oil Closing price Volume Open
Monthly Month’s high Month’slow RBD: Mumbai (Malaysian in lots^ interestaverage (Rs./10 kg) Ringgit/MT in lots^527.66 549.40 514.90 563.00 3,814 365,042 87,668
483.88 503.50 450.70 519.50 3,506 451,843 79,484423.13 452.50 405.00 476.77 3,040 367,371 72,436418.92 423.60 412.00 462.09 2,737 303,856 68,718417.56 428.00 400.00 464.31 2,720 409,878 66,585379.09 401.00 363.30 415.77 2,589 356,832 69,684369.11 379.50 363.70 402.50 2,425 297,667 72,242371.42 381.20 365.00 397.48 2,499 248,503 68,982361.81 367.40 356.30 391.00 2,577 306,657 63,654365.98 373.50 359.60 400.00 2,628 342,862 77,494359.16 365.00 343.30 391.60 2,595 222,712 82,428355.76 373.60 344.60 391.66 2,450 358,707 74,332350.22 357.40 341.00 388.10 2,578 325,668 81,268326.73 346.00 313.50 365.28 2,436 300,242 91,125314.47 323.50 303.60 353.04 2,160 373,498 94,956330.56 343.00 318.00 372.38 2,136 305,961 95,200350.60 363.00 328.80 393.34 2,440 379,373 84,990312.16 332.20 296.00 359.37 2,274 355,283 83,906348.73 371.20 326.50 392.88 2,244 330,732 63,973384.08 408.30 352.70 431.60 2,615 378,381 79,041359.55 385.10 323.20 415.93 2,716 450,600 87,025306.92 314.90 293.10 362.18 2,103 328,707 88,926282.87 290.30 274.80 329.39 1,938 264,317 87,143280.54 298.50 266.50 332.68 1,780 237,543 83,343257.36 265.70 248.50 317.04 1,685 159,101 83,481254.70 276.20 240.00 316.83 1,610 242,097 91,820300.10 340.80 271.40 366.43 1,560 277,318 90,371352.97 384.00 333.70 437.66 2,073 290,468 65,273397.08 435.60 381.90 478.65 2,541 278,401 53,343488.13 517.80 439.50 556.17 3,050 267,300 58,317515.40 522.40 509.20 580.60 3,540 198,086 43,929
N/A N/A N/A 561.22 3,525 141,155 38,800N/A N/A N/A 548.76 3,370 240,709 39,394N/A N/A N/A 619.10 3,385 316,453 42,793N/A N/A N/A 573.51 3,972 183,121 43,659N/A N/A N/A 550.67 3,211 251,331 43,477N/A N/A N/A 512.02 3,070 148,480 38,080N/A N/A N/A 509.76 2,925 209,562 41,391N/A N/A N/A 492.59 2,890 254,044 44,706N/A N/A N/A 486.54 2,687 188,042 46,707N/A N/A N/A 487.13 2,490 233,178 54,169N/A N/A N/A 487.60 2,691 244,979 71,720N/A N/A N/A 484.61 2,513 321,556 76,191N/A N/A N/A 476.28 2,725 268,481 93,214N/A N/A N/A 474.23 2,320 254,288 82,693
228.83 230.50 227.90 454.81 2,064 151,078 66,969227.59 233.10 223.80 452.59 1,952 148,172 55,358228.92 235.30 223.10 473.77 1,902 301,233 70,211222.75 237.70 214.20 468.10 1,976 224,765 74,882
206.96 225.70 195.00 453.56 1,901 360,870 77,172188.79 197.50 184.50 431.40 1,622 228,531 75,583188.14 195.10 181.50 440.45 1,542 199,569 65,115197.71 204.80 191.30 459.71 1,557 275,379 64,384
184.81 196.20 174.70 434.14 1,590 226,687 43,069174.84 178.20 172.20 415.63 1,429 124,941 44,186172.55 175.50 170.90 411.39 1,411 140,586 36,515170.16 173.70 164.20 396.67 1,441 117,864 31,949
ive open interest in all contracts at the end of month, Future prices are for near month continuos futures contract.
A PwC & MCX Joint Endeavour 185www.mcxindia.com / www.pwc.com/in/en
DATABANK - AGRI COMMODITIES
178_300_CYIB_2011_Agri_final.indd 185178_300_CYIB_2011_Agri_final.indd 185 1/26/2012 1:28:28 AM1/26/2012 1:28:28 AM

EDITORIALSPROLOGUE INDIAN ECONOMYEXPERTS' VIEWS
2006-07
2007-08
2008-09
2009-10
2010-11
2011-12e
Indonesia Malaysia Thailand Nigeria Colombia Others
Production
Note: e - source estimates, Source: USDA
2006-07
2007-08
2008-09
2009-10
2010-11
2011-12e
2000010000 400000India China EU-27 Pakistan Malaysia Others
Imports
Note: e - source estimates, Source: USDA
2006-07
2007-08
2008-09
2009-10
2010-11
2011-12e
10000 20000 30000 400000 50000Indonesia Malaysia Papua New Guinea Benin UAE Others
Exports
Note: e - source estimates, Source: USDA
2006-07
2007-08
2008-09
2009-10
2010-11
2011-12e
India China Indonesia EU-27 Malaysia Others
Consumption
Note: e - source estimates, Source: USDA
10000 20000 30000 400000 6000050000
10000 20000 30000 400000 50000 60000
Data of top 5 countries (`000' tonnes)
Commodity Insights Yearbook 2011186
178_300_CYIB_2011_Agri_final.indd 186178_300_CYIB_2011_Agri_final.indd 186 1/26/2012 1:28:28 AM1/26/2012 1:28:28 AM

DATABANK - NON-AGRI COMMODITIES
Refined soybean oil (RSO) fundamentals (in `000' tonnes)Country 2011-12e 2010-11 2009-10 2008-09 2007-08 2006-07 2001-02
World
Opening stocks 3,066 3,181 3,120 3,319 3,790 3,446 3,008 Production 43,287 41,872 38,893 35,893 37,826 36,532 28,922 Imports 8,764 9,272 8,704 9,076 10,416 9,928 7,560 Consumption 43,272 41,356 38,279 35,991 37,722 35,473 28,176 Exports 9,364 9,903 9,257 9,177 10,991 10,643 8,229 Total supply 55,117 54,325 50,717 48,288 52,032 49,906 39,490 Closing stocks 2,481 3,066 3,181 3,120 3,319 3,790 3,085 Area (1000 Ha) 1,04,565 1,03,503 1,02,150 96,356 90,602 94,285 79,466
India
Opening stocks 267 279 103 58 172 76 106 Production 1,570 1,690 1,340 1,287 1,499 1,157 833 Imports 800 1,000 1,598 1,060 733 1,447 1,479 Consumption 2,550 2,700 2,760 2,300 2,330 2,500 2,231 Exports 2 2 2 2 16 8 4 Total supply 2,637 2,969 3,041 2,405 2,404 2,680 2,418 Closing stocks 85 267 279 103 58 172 183 Area (1000 Ha) 9600 9,400 9,600 9,600 8,800 8,120 6,000 Avg. daily volatility MCX spot prices - 0.92% 1.00% 2.31% 0.77% 0.63% -CBOT price (Rs/10 Kg) - 578 379 376 455 311 177Indian Price (Rs/10 Kg) - 450 450 593 480 400 -
Note: e - source estimates provided by USDA, data retrieved on July 28, 2011; market year (India): October to September Source: USDA, Dept. of Agriculture, GOI
RSO balance sheet 2011-12e - world (in `000' tonnes) Supply DemandCountry Begining Production Imports Consumption Exports Ending stocks stocks
Argentina 245 7,605 2,497 5,130 223Brazil 270 7,120 2 5,475 1,660 257China 175 10,847 1,700 12,450 40 232EU-27 230 2,412 750 2,840 350 202India 267 1,570 800 2,550 2 85US 1,302 8,573 84 8,142 816 1,001Others 577 5,160 5,428 9,318 1,366 481Grand Total 3,066 43,287 8,764 43,272 9,364 2,481
Note: e - source estimates provided by USDA, data retrieved on July 28, 2011 Source: USDA
A PwC & MCX Joint Endeavour 187www.mcxindia.com / www.pwc.com/in/en
DATABANK - AGRI COMMODITIES
178_300_CYIB_2011_Agri_final.indd 187178_300_CYIB_2011_Agri_final.indd 187 1/26/2012 1:28:29 AM1/26/2012 1:28:29 AM

EDITORIALSPROLOGUE INDIAN ECONOMYEXPERTS' VIEWS
RSO fact sheet - BRICS Nations (in `000' tonnes) Production Import Export Consumption Net Population Per capita Per capita availability (in million) availability consumption (kg) (kg)
Brazil 7,120 2 1,660 5,475 7,392 206.47 35.80 26.52 Russia 473 15 170 295 536 137.97 3.88 2.142011-12e India 1,570 800 2 2,550 2,637 1,208.36 2.18 2.11 China 10,847 1,700 40 12,450 12,722 1,341.85 9.48 9.28 South Africa 42 260 27 275 302 49.83 6.06 5.52 Brazil 6,890 16 1,625 5,245 7,140 203.43 35.10 25.78 Russia 398 15 130 240 418 138.74 3.01 1.732010-11 India 1,690 1,000 2 2,700 2,969 1,189.17 2.50 2.27 China 9,857 1,600 40 11,447 11,662 1,336.72 8.72 8.56 South Africa 38 265 25 278 303 49.00 6.18 5.67 Brazil 6,470 37 1,449 5,060 6,743 201.10 33.53 25.16 Russia 349 17 170 204 379 139.39 2.72 1.462009-10 India 1,340 1,598 2 2,760 3,041 1,173.11 2.59 2.35 China 8,726 1,514 77 10,435 10,717 1,330.14 8.06 7.85 South Africa 30 250 23 257 280 49.11 5.70 5.23 Brazil 6,120 6 1,909 4,275 6,420 198.74 32.30 21.51 Russia 266 22 127 226 366 140.04 2.61 1.612008-09 India 1,287 1,060 2 2,300 2,405 1,166.08 2.06 1.97 China 7,325 2,494 83 9,486 10,046 1,338.61 7.50 7.09 South Africa 27 172 12 187 199 49.05 4.06 3.81 Brazil 6,160 67 2,388 3,955 6,637 196.34 33.80 20.14 Russia 187 121 10 220 308 140.70 2.19 1.562007-08 India 1,499 733 16 2,330 2,404 1,148.00 2.09 2.03 China 7,045 2,727 102 9,693 10,022 1,330.04 7.54 7.29 South Africa 27 218 3 282 285 48.78 5.84 5.78 Brazil 5,970 4 2,462 3,395 6,367 190.01 33.51 17.87 Russia 143 19 5 163 168 141.38 1.19 1.152006-07 India 1,157 1,447 8 2,500 2,680 1,129.87 2.37 2.21 China 6,410 2,404 94 8670 9,014 1,321.85 6.82 6.56 South Africa 31 290 1 280 321 44 7.3 6.36
Note: e - source estimates provided by USDA, Data retrived on July 28, 2011, Population fi gures for 2011-12 is arrived at by calculating CAGR from 2004-05 to 2010-11; Source: USDA, World Bank, IFM, CIA World Fact Book
Soybean Oil: Ending Stock & Prices
Source:Agmarknet & USDA. ES - ending stock, Indian prices Rs/kg, Int. prices Rs/kg
‘000’ tonnes Prices
500
375
250
125
0
80
60
40
20
02005-06
India ES World Es(in 10s)
Int.Pricesa Mumbai Prices
2006-07 2007-08 2008-09 2009-10 2010-112004-052003-042002-03
Commodity Insights Yearbook 2011188
178_300_CYIB_2011_Agri_final.indd 188178_300_CYIB_2011_Agri_final.indd 188 1/26/2012 1:28:29 AM1/26/2012 1:28:29 AM

DATABANK - NON-AGRI COMMODITIES
2006-07
2007-08
2008-09
2009-10
2010-11
2011-12e
10,000 20,000 40,00030,000 50,0000
China United States Argentina Brazil EU-27 Others
Production
Note: e - source estimates, Source: USDA
2006-07
2007-08
2008-09
2009-10
2010-11
2011-12e
12,00010,0008,0006,0004,0002,0000
12,00010,0008,0006,0004,0002,0000
China India EU-27 Algeria Iran Other
Imports
Note: e - source estimates, Source: USDA
2006-07
2007-08
2008-09
2009-10
2010-11
2011-12e
Argentina Brazil United States EU-27 Paraguay Others
Exports
Note: e - source estimates, Source: USDA
2006-07
2007-08
2008-09
2009-10
2010-11
2011-12e
China United States Brazil EU-27 India Others
Consumption
Note: e - source estimates, Source: USDA
Data of top 5 countries (`000' tonnes)
10,000 20,000 40,00030,000 50,0000
A PwC & MCX Joint Endeavour 189www.mcxindia.com / www.pwc.com/in/en
DATABANK - AGRI COMMODITIES
178_300_CYIB_2011_Agri_final.indd 189178_300_CYIB_2011_Agri_final.indd 189 1/26/2012 1:28:29 AM1/26/2012 1:28:29 AM

EDITORIALSPROLOGUE INDIAN ECONOMYEXPERTS' VIEWS
Refined soybean oil prices and trading activity MCX futures prices (Rs/10 Kg) Month Open High Low Close Volume in lots^ Open Interest in lots^^ Dec-10 571.9 635.5 571.9 632.75 6699 255 Nov-10 532 582.75 526.9 569 4817 339 Oct-10 486.1 540.8 475 530.8 5906 477 Sep-10 484.1 503.25 471.65 488.7 6871 345 Aug-10 492.2 518.5 480.5 485.75 16966 682 Jul-10 443.2 491.4 436.15 489.9 8881 864 Jun-10 450.3 450.9 436 443.25 4484 301 May-10 448.7 456.55 439.6 449 9208 806 Apr-10 447.4 453 440.5 449.65 12105 999 Mar-10 459.4 462.9 447.6 448.1 15475 1137 Feb-10 440.5 464.1 440.0 459.4 14526 1047 Jan-10 485.0 493.5 443.0 443.5 20354 1278 Dec-09 500.0 505.4 465.3 484.1 29839 1109 Nov-09 450.0 509.5 446.6 500.3 36624 1165 Oct-09 434.0 455.9 417.1 450.0 34266 1469 Sep-09 458.0 464.2 421.0 435.4 33718 1521 Aug-09 452.6 484.0 452.0 458.2 25897 946 Jul-09 478.0 478.6 438.0 452.4 29038 751 Jun-09 499.1 503.8 467.2 477.3 26285 1241 May-09 495.3 526.7 480.0 494.3 33557 1630 Apr-09 450.5 519.4 449.7 495.3 32028 1240 Mar-09 451.9 464.2 438.0 447.2 27676 1192 Feb-09 455.0 471.0 435.9 451.8 25230 2187 Jan-09 473.8 520.0 454.6 457.0 33721 2526 Dec-08 457.0 478.7 438.4 470.0 19477 1858 Nov-08 N/A N/A N/A N/A N/A N/A Oct-08 N/A N/A N/A N/A N/A N/A Sep-08 N/A N/A N/A N/A N/A N/A Aug-08 N/A N/A N/A N/A N/A N/A Jul-08 N/A N/A N/A N/A N/A N/A Jun-08 N/A N/A N/A N/A N/A N/A May-08 N/A N/A N/A N/A 4856 1728 Apr-08 570.2 586.8 563.8 583.3 48162 1555 Mar-08 571.4 594.5 542.9 570.2 107951 2868 Feb-08 678.0 725.7 584.9 589.0 79864 3752 Jan-08 588.0 671.3 587.5 671.2 95697 4446 Dec-07 551.3 595.8 550.9 587.0 69720 3916 Nov-07 531.7 558.0 523.6 550.8 83184 4568 Oct-07 508.3 540.5 496.0 532.2 84054 5206 Sep-07 485.4 510.6 476.0 505.2 62809 4795 Aug-07 478.0 497.9 474.6 487.1 66662 4196 Jul-07 506.5 507.2 474.0 479.2 92430 4683 Jun-07 496.7 510.9 491.0 505.6 94699 4583 May-07 485.2 497.9 479.0 496.6 85738 4382 Apr-07 489.1 496.3 469.1 486.7 85188 5204 Mar-07 469.8 491.6 469.0 488.3 83427 5427 Feb-07 443.0 469.7 435.9 468.4 68630 4881 Jan-07 453.2 455.2 432.2 443.2 92888 4579 Dec-06 466.7 473.6 446.7 452.2 104632 4609 Nov-06 465.0 477.2 447.5 468.7 134142 6558 Oct-06 427.7 475.1 424.9 465.6 64930 4665 Sep-06 422.1 433.0 416.1 429.0 79548 2574 Aug-06 438.0 440.9 418.3 423.0 102580 3199 Jul-06 428.0 455.1 427.3 436.2 60904 2316 Jun-06 408.1 433.5 399.5 429.6 42389 2437 May-06 414.0 417.6 398.4 406.9 66688 4363 Apr-06 422.5 426.0 406.2 413.9 64534 2762
Note: ^Aggregate volume in all contracts during the month; ^^Cumulative open interest in all contracts at the end of month; Trading suspended between May 08 to Dec 08; N/A - Not available, WSource: The Ministry of Commerce and Industry; Exchanges' websites
Commodity Insights Yearbook 2011190
178_300_CYIB_2011_Agri_final.indd 190178_300_CYIB_2011_Agri_final.indd 190 1/26/2012 1:28:30 AM1/26/2012 1:28:30 AM

DATABANK - NON-AGRI COMMODITIES
MCX spot prices - Indore (Rs/10 Kg) Other market CBOT futurest Monthly Month High Month Low spot prices - WPI of Closing price Volume Open interest
Average Mumbai RSO (cents/pound) in lots^ in lots^^ (Rs/10 kg)
584.0 626.2 567.4 614.0 126.5 57.7 2,242,986 358,042555.0 574.8 518.2 557.6 125.2 50.7 2,313,891 326,408506.6 526.3 470.9 500.4 121.7 49.3 1,588,915 352,772480.7 492.0 470.0 474.3 120.8 44.7 1,561,754 315,355496.6 512.1 483.3 482.5 120.6 39.5 1,646,780 260,040459.6 484.1 437.6 444.4 119.5 39.8 1,713,903 283,462441.5 449.6 437.8 421.0 119.0 36.3 2,198,238 293,070448.1 453.3 443.5 420.5 118.8 37.6 1,224,385 325,947446.1 450.0 441.7 421.2 119.0 38.6 1,909,897 278,039455.4 461.0 450.7 438.3 117.5 38.3 1,414,232 283,263456.4 463.0 441.8 440.5 117.4 39.3 1,787,054 279,876468.7 488.0 445.2 450.9 118.2 36.2 1,184,364 245,355485.0 502.1 473.1 470.6 119.5 40.4 1,554,533 210,781470.7 504.4 443.7 454.6 116.6 40.2 1,527,138 256,432434.8 447.2 420.9 420.0 114.5 36.4 1,342,334 235,314434.5 448.1 429.6 423.5 114.7 34.0 1,217,988 209,594465.5 476.0 447.7 451.5 117.1 35.0 1,400,423 229,215452.4 468.3 438.2 434.7 117.4 35.1 1,537,569 251,364474.6 485.4 463.8 455.9 119.5 35.0 1,993,454 241,726496.2 518.1 480.8 470.4 119.4 39.1 1,191,159 230,614489.0 507.0 465.7 470.1 119.3 36.2 1,414,682 200,649453.3 462.0 445.9 447.5 119.7 33.6 1,189,876 207,505465.1 475.7 450.7 441.2 120.2 30.9 1,518,553 211,794493.0 514.3 468.4 481.8 121.3 32.7 1,211,893 208,505483.1 498.8 456.5 467.1 124.1 33.3 1,455,913 208,108443.4 488.8 387.8 434.9 123.6 32.6 1,252,370 241,056509.9 578.3 476.5 497.1 127.1 33.6 1,396,847 253,519584.9 606.3 563.7 564.9 130.1 44.0 1,441,656 247,229613.6 637.4 597.5 592.8 130.6 53.4 1,386,920 252,080680.2 704.1 637.0 654.4 130.4 58.3 1,624,174 246,175683.1 709.5 648.6 659.5 129.6 66.0 1,567,629 258,997611.8 652.5 570.5 602.0 127.9 61.3 1,106,828 252,276574.1 589.7 565.9 576.9 129.5 57.7 1,551,109 263,931
666.9 725.9 606.9 676.7 130.8 51.5 1,291,023 283,980607.2 669.2 583.1 616.2 126.2 68.2 1,541,373 301,932574.1 588.8 548.0 593.1 124.3 53.7 1,294,663 283,859533.1 550.1 522.0 550.0 120.5 48.9 1,337,864 291,089518.8 535.2 499.5 530.2 118.2 45.6 1,288,911 308,026487.3 507.4 476.3 496.3 116.6 42.3 1,213,635 291,463481.5 490.4 473.8 489.8 115.2 39.5 947,459 278,132487.7 503.7 473.7 492.3 115.6 36.5 1,092,034 262,507499.6 507.7 490.1 503.5 115.3 37.8 1,115,308 297,131485.2 490.1 480.4 485.3 114.2 36.6 1,442,726 293,689484.8 494.2 475.5 485.0 113.9 35.7 805,278 316,781479.7 488.4 469.7 483.1 113.0 33.4 1,218,347 304,326445.1 463.5 433.1 462.4 107.3 32.5 764,997 317,340437.8 448.5 428.3 455.8 106.5 30.3 1,091,931 285,130453.8 460.1 444.6 474.5 107.4 29.3 704,802 261,714455.4 463.6 443.3 471.3 106.3 29.3 857,922 260,307444.2 469.7 420.5 462.3 104.2 29.2 1,018,050 286,888423.1 426.7 420.2 430.8 104.1 26.8 938,242 261,414428.3 436.6 419.0 439.9 104.3 23.8 729,122 248,970433.7 442.1 423.5 446.6 103.5 25.2 816,795 257,433411.1 422.8 397.0 424.5 100.6 26.7 803,595 281,211
401.9 408.6 395.6 412.8 98.8 26.4 1,024,547 240,817412.0 417.4 407.2 412.7 97.8 25.2 688,808 249,518393.1 415.4 369.9 395.4 95.9 25.5 866,900 238,374
ble, WPI - Wholesale Price Index; Future prices are for near month continuos futures contract.
A PwC & MCX Joint Endeavour 191www.mcxindia.com / www.pwc.com/in/en
DATABANK - AGRI COMMODITIES
178_300_CYIB_2011_Agri_final.indd 191178_300_CYIB_2011_Agri_final.indd 191 1/26/2012 1:28:30 AM1/26/2012 1:28:30 AM

EDITORIALSPROLOGUE INDIAN ECONOMYEXPERTS' VIEWS
Soybean fundamentals - World and India (in `000' tonnes)Country 2011-12e 2010-11 2009-10 2008-09 2007-08 2006-07 2001-02
World
Beginning stocks 65,875 59,346 42,676 51,483 62,235 53,376 33,939Production 2,61,453 2,63,693 2,60,838 2,11,960 2,20,469 2,36,233 1,84,815Imports 94,866 89,820 86,801 77,376 78,111 69,063 54,385Consumption 2,62,651 2,54,192 2,38,320 2,21,301 2,30,557 2,25,576 1,84,472Exports 97,576 92,792 92,649 76,842 78,775 70,861 52,899Net Availability 4,22,194 4,12,859 3,90,315 3,40,819 3,60,815 3,58,672 2,73,139Ending Stocks 61,967 65,875 59,346 42,676 51,483 62,235 35,768Area (1000 Ha) 1,04,565 1,03,503 1,02,150 96,356 90,602 94,285 79,466Yield (MT/Ha) 2.50 2.55 2.55 2.20 2.43 2.51 2.33
India
Beginning stocks 600 1,695 766 146 218 75 134Production 9800 9,600 9,700 9,100 9,470 7,690 5,400Imports 0 0 0 0 0 0 0Consumption 10125 10,685 8,761 8,425 9,530 7,546 5,377Exports 10 10 10 55 12 1 1Net Availability 10,400 11,295 10,466 9,246 9,688 7,765 5,534Ending Stocks 265 600 1,695 766 146 218 156Area (1000 Ha) 9600 9,400 9,600 9,600 8,800 8,120 6,000Yield (MT/Ha) 1.02 1.02 1.01 0.95 1.08 0.95 0.90 Avg daily volatility MCX spot prices - 1.03% 2.20%* 1.04%^ 1.07% 0.83% -CBOT price (Rs/qntl) - 2,475 1,664 1,901 1,891 1,303 915India, Madhya Pradesh Price (Rs/qntl) - 2,195 1,905 2,188 2,121 1,405 1,018MSP Soyabean Black (Rs. /qtl) 1650 1400 1350 1350 910 900 795MSP Soyabean Yellow (Rs. /qtl) 1690 1440 1390 1390 1050 1020 885
Note: e - source estimates provided by USDA, data retrieved on July 28, 2011; market year (India): October to September; *: volatility calculated for the period from 9/9/2009 to 31/3/2010; ^: Volatility calculated for the period from 4/1/2008 to 9/22/2008;Source: USDA, Dept. of Agriculture, GOI, Agmarknet
Soybean state-wise area and production Area (`000' Hectares) Production ( `000' Tonnes)States/ UT 2009-10 2008-09 2007-08 2006-07 2001-02 2009-10 2008-09 2007-08 2006-07 2001-02Madhya Pradesh 5350 5124 5024 4757 4450 6406 5850 5481 4785 3735Maharashtra 3019 3063 2664 2521 1105 2197 2757 3976 2892 1386Rajasthan 778 830 798 641 656 915 806 1071 771 716Andhra Pradesh 156 142 88 103 19 129 194 173 156 20Karnataka 26 134 113 131 48 82 91 97 94 40Others 405 218 195 176 65 236 208 171 153 67
Source: USDA, Dept. of Agriculture, GOI
Commodity Insights Yearbook 2011192
178_300_CYIB_2011_Agri_final.indd 192178_300_CYIB_2011_Agri_final.indd 192 1/26/2012 1:28:30 AM1/26/2012 1:28:30 AM

DATABANK - NON-AGRI COMMODITIES
Data of top 5 countries (`000' tonnes)
2006-07
2007-08
2008-09
2009-10
2010-11
2011-12e
20,000 40,000 80,00060,000 120,000100,0000United States Brazil Argentina india China Others
Area harvested
Note: e - source estimates; Source: USDA
2006-07
2007-08
2008-09
2009-10
2010-11
2011-12e
50,000 100,000 250,000200,000 300,0000China United States Argentina Brazil EU-27 Other
Consumption
Note: e - source estimates; Source: USDA
2006-07
2007-08
2008-09
2009-10
2010-11
2011-12e
China EU-27 Mexico Japan Taiwan Others
Imports
Note: e - source estimates; Source: USDA
20,000 40,000 80,00060,000 120,000100,0000
2006-07
2007-08
2008-09
2009-10
2010-11
2011-12e
United States Brazil Argentina Paraguay Canada Others
Exports
Note: e - source estimates; Source: USDA
20,000 40,000 80,00060,000 120,000100,0000
2006-07
2007-08
2008-09
2009-10
2010-11
2011-12e
50,000 100,000 250,000200,000 300,0000United States Brazil Argentina China India Others
Production
Note: e - source estimates; Source: USDA
A PwC & MCX Joint Endeavour 193www.mcxindia.com / www.pwc.com/in/en
DATABANK - AGRI COMMODITIES
178_300_CYIB_2011_Agri_final.indd 193178_300_CYIB_2011_Agri_final.indd 193 1/26/2012 1:28:31 AM1/26/2012 1:28:31 AM

EDITORIALSPROLOGUE INDIAN ECONOMYEXPERTS' VIEWS
Soybean All-India sowing progress during kharif (in lakh ha) Average Area Sown reported Change vis-a vis prev yearDate area in As on date % of average Same period Absolute % kharif last year1-Oct-10 84 93.34 111.1 95.82 -2.5 -2.924-Sep-10 84 93.34 111.1 95.82 -2.5 -2.910-Sep-10 84 93.33 111.1 94.92 -1.6 -2.33-Sep-10 84 93.29 111.11 95.08 -1.8 -2.120-Aug-10 84 91.81 109.3 93.82 -2 -2.313-Aug-10 84 90.72 108 93.77 -3 -2.16-Aug-10 84 89.72 106.8 93.68 -4 -1.630-Jul-10 84 85.34 101.6 90.73 -5.4 -2.423-Jul-10 84 80.28 95.6 81.53 -1.3 -5.116-Jul-10 84 61.07 72.7 60.31 0.8 1.39-Jul-10 84 34.24 40.8 31.62 2.6 8.32-Jul-10 84 12.13 14.4 2.88 9.2 321.1 23-Oct-09 78.09 96.12 123.1 96.35 -0.2 -0.216-Oct-09 78.09 96.12 123.1 96.53 -0.2 -0.29-Oct-09 78.09 96.12 123.1 96.44 -0.3 -0.31-Oct-09 78.09 96.05 123 96.24 -0.2 -0.211-Sep-09 78.09 95.2 121.9 95.63 -0.4 -0.54-Sep-09 78.09 94.96 121.6 95.38 -0.4 -0.428-Aug-09 78.09 94.95 121.6 95.19 -0.2 -0.313-Aug-09 78.09 93.77 120.1 92.78 1 1.17-Aug-09 78.09 93.68 120 91.31 2.4 2.631-Jul-09 78.09 90.74 116.2 87.75 3 3.424-Jul-09 78.09 85.1 109 85.41 -0.3 -0.417-Jul-09 78.09 71.35 91.4 72.37 -1 -1.410-Jul-09 78.09 31.62 40.5 53.99 -22.4 -41.426-Jun-09 78.09 1.63 2.1 8.11 -6.5 -79.921-Jun-09 78.09 94.49 121 94.13 0.4 0.419-Jun-09 78.09 1.14 1.5 1.03 0.1 10.7 10-Oct-08 72.54 96.44 132.9 87.6 8.8 10.13-Oct-08 72.54 96.24 132.7 87.6 8.6 9.926-Sep-08 72.54 96.24 132.7 87.6 8.6 9.919-Sep-08 72.54 95.63 131.8 87.46 8.2 9.312-Sep-08 72.54 95.63 131.8 87.28 8.4 9.65-Sep-08 72.54 95.39 131.5 87.26 8.1 9.329-Aug-08 72.54 95.19 131.2 87.2 8 9.222-Aug-08 72.54 94.12 129.7 86.84 7.3 8.48-Aug-08 72.54 91.29 125.8 83.26 8 9.61-Aug-08 72.54 87.7 120.9 79.37 -9.5 -17.125-Jul-08 72.54 85.35 117.7 77.79 7.6 9.718-Jul-08 72.54 64.98 89.6 54.89 10.1 18.411-Jul-08 72.54 53.99 74.4 43.92 10.1 22.94-Jul-08 72.54 24.82 34.2 22.07 2.8 12.5 26-Oct-07 65.98 87.64 132.8 81.2 6.4 7.928-Sep-07 65.98 87.64 132.8 81.15 6.5 914-Sep-07 65.98 87.48 132.6 80.97 6.5 831-Aug-07 65.98 87.24 132.2 79.86 7.4 9.217-Aug-07 65.98 86.07 130.4 79.55 6.5 15.120-Jul-07 65.98 71.67 108.6 67.45 4.2 6.36-Jul-07 65.98 14.8 22.4 9.23 5.6 60.3
Source: Department of Agriculture Cooperation
Commodity Insights Yearbook 2011194
178_300_CYIB_2011_Agri_final.indd 194178_300_CYIB_2011_Agri_final.indd 194 1/26/2012 1:28:31 AM1/26/2012 1:28:31 AM

DATABANK - NON-AGRI COMMODITIES
Soybean State-wise monthly arrivals (in `000' tonnes)Month Andhar Pradesh Madhya Pradesh Rajasthan Karnataka MaharashtraMar-11 0.04 163.07 15.43 0.41 27.69Feb-11 4.94 371.01 46.45 1.69 56.68Jan-11 13.54 702.46 82.05 0.67 102.73Dec-10 44.80 1268.05 176.42 2.56 182.83Nov-10 37.71 1501.63 185.80 2.27 211.53Oct-10 59.72 2005.12 294.00 3.91 218.02Sep-10 1.79 368.51 40.23 1.18 25.78Aug-10 0.16 284.44 40.94 1.76 39.85Jul-10 0.05 368.04 43.86 2.37 38.86Jun-10 0.35 274.91 21.12 2.18 48.47May-10 N/A 152.90 10.71 1.65 50.57Apr-10 0.43 107.67 10.65 1.78 45.58Mar-10 0.21 102.39 4.64 1.73 30.62Feb-10 0.12 188.37 6.72 1.30 30.82Jan-10 0.03 314.69 13.70 1.95 52.99Dec-09 0.15 754.96 58.14 1.18 91.30Nov-09 0.49 1582.04 151.40 1.33 136.39Oct-09 4.15 1603.58 119.33 3.78 84.65Sep-09 0.12 161.12 6.10 0.13 9.26Aug-09 0.41 215.46 6.76 0.17 16.47Jul-09 0.01 66.72 10.41 0.25 16.48Jun-09 0.05 51.10 15.70 0.45 19.62May-09 0.04 178.10 11.94 0.68 41.42Apr-09 0.13 328.90 16.12 1.56 58.20Mar-09 0.13 18.87 12.21 1.58 41.26Feb-09 0.39 33.37 15.47 1.59 46.28Jan-09 1.00 79.25 44.69 3.98 93.48Dec-08 1.17 55.27 56.20 0.72 123.71Nov-08 1.68 64.35 76.81 1.86 142.15Oct-08 0.99 51.60 51.38 3.06 75.68Sep-08 N/A 10.46 3.76 1.24 2.73Aug-08 N/A 5.69 3.46 0.45 1.38Jul-08 0.03 28.17 8.25 0.44 3.35Jun-08 0.06 29.91 14.31 0.48 7.36May-08 0.04 7.39 7.73 0.33 11.40Apr-08 0.03 6.00 5.59 0.47 9.50Mar-08 0.04 8.35 8.25 0.54 11.39Feb-08 0.50 30.07 19.92 1.39 38.29Jan-08 0.00 44.35 27.82 3.12 64.78Dec-07 0.73 75.05 47.42 1.77 95.96Nov-07 4.42 175.37 111.03 5.99 184.60Oct-07 12.54 233.80 183.65 4.95 222.94Sep-07 1.00 17.04 3.44 0.94 5.03Aug-07 N/A 18.01 2.39 0.24 2.98Jul-07 0.00 45.05 4.81 0.50 5.23Jun-07 6.86 42.99 6.42 0.30 8.72May-07 4.57 24.15 3.66 0.14 7.68Apr-07 2.21 25.95 3.52 0.40 11.89Mar-07 2.89 41.74 6.22 0.93 17.09Feb-07 5.43 85.70 11.02 0.55 24.04Jan-07 10.17 123.09 18.77 0.30 46.47Dec-06 12.21 135.18 35.38 3.08 57.06Nov-06 49.97 480.06 100.15 4.24 213.15Oct-06 56.42 232.84 80.67 7.40 146.77Sep-06 4.51 33.12 4.96 2.50 3.57Aug-06 2.15 32.99 4.37 0.37 3.77Jul-06 7.84 100.38 6.86 0.32 4.15Jun-06 0.01 69.79 7.38 0.41 8.39May-06 0.22 52.62 4.23 0.08 9.71Apr-06 0.34 46.21 4.94 0.30 23.22
Note: N/A - Not Available Source: Dept. of Agriculture, GOI
A PwC & MCX Joint Endeavour 195www.mcxindia.com / www.pwc.com/in/en
DATABANK - AGRI COMMODITIES
178_300_CYIB_2011_Agri_final.indd 195178_300_CYIB_2011_Agri_final.indd 195 1/26/2012 1:28:32 AM1/26/2012 1:28:32 AM

EDITORIALSPROLOGUE INDIAN ECONOMYEXPERTS' VIEWS
Rapeseed/Mustard seeds fundamentals - World and India (in `000' tonnes) 2011-12e 2010-11 2009-10 2008-09 2007-08 2006-07 2001-02WorldBeginning stocks 5,453 7,795 6,576 3,517 4,668 5,514 2,693Production 58,750 59,227 60,533 57,805 48,500 45,127 36,010Imports 10,774 9,921 10,742 12,126 7,548 6,988 4,947Consumption 60,450 61,240 59,244 54,827 49,047 46,345 35,976Exports 10,805 10,250 10,812 12,045 8,152 6,616 4,896Total Supply 74,977 76,943 77,851 73,448 60,716 57,629 43,650Ending stocks 3,722 5,453 7,795 6,576 3,517 4,668 2,778Area (1000 Ha) 33,295 32,587 31,102 31,081 28,237 26,481 23,287
India Beginning stocks 900 785 631 65 473 1,122 521Production 7,000 7,000 6,400 6,700 5,450 5,800 4,500Imports 15 15 20 10 11 0 0Consumption 7,168 6,898 6,264 6,143 5,867 6,449 4,625Exports 2 2 2 1 2 0 6Total Supply 7,915 7,800 7,051 6,775 5,934 6,922 5,021Ending Stocks 745 900 785 631 65 473 390Area (1000 Ha) 7,000 7,000 6,450 6,600 5,700 6,640 5,250Certified Seed Distribution - - 16 17 14 9 Avg daily volatility MCX spot prices - 0 0 0 0 - -Winnepeg price (Rs./20kg) - 545.1 335.5 338.5 434.4 273.0 -Indian Price (Rs. /20kg) - 518.3 519.1 447.2 481.1 345.3 265.4MSP (Rs/qntl.) 1,850 1,850 1,830 1,830 1,800 1,715 1,300
Note: e - source estimates provided by USDA, data retrieved on August 1, 2011; Source: USDA; Ministry of Agriculture, Govt. of India; Agmarknet; Winnepeg Commodity Exchange
Rapeseed/Mustard seeds balance sheet 2011-12e - World (in `000' tonnes) Supply DemandCountry Begining stocks Production Imports Consumption Exports Ending stocksEU-27 1,323 18,800 3,050 22,125 180 868 China 1,264 12,800 1,050 14,700 - 414 Canada 1,150 12,600 190 6,400 6,700 840 India 900 7,000 15 7,168 2 745 Australia 323 2,300 - 739 1,615 269 Ukraine 1 1,900 2 102 1,800 1 Others 492 3,350 6,467 9,216 508 585 Grand Total 5,453 58,750 10,774 60,450 10,805 3,722
Note: e - source estimates provided by USDA, data retrieved on August 1, 2011;Source: USDA
Mustard: Ending Stock & Prices
Source: Agmarknet, & USDA. ES - ending stock, Indian prices Rs/Qntl, Int. prices of Winnepeg Futures Exchange in Rs/qntl
8000
6400
4800
3200
1600
0
3500
2800
2100
1400
700
0
2005-06 2007-08 2009-102004-05 2006-07 2008-09 2010-11
India ES
World ES
India prices
Winnipeg Prices
2003-042002-03
‘000’ tonnes Prices in Rs/qntl
Commodity Insights Yearbook 2011196
178_300_CYIB_2011_Agri_final.indd 196178_300_CYIB_2011_Agri_final.indd 196 1/26/2012 1:28:32 AM1/26/2012 1:28:32 AM

DATABANK - NON-AGRI COMMODITIES
Rapeseed/Mustard seeds - BRICS Nations fact sheet Production Import Export Consumption Net Population Per capita Per capita availability (in million) availability consumption (kg) (kg)
Brazil 0 0 0 0 0 206.47 0.00 0.00 Russia 1050 1 150 792 1144 137.97 8.29 5.742011-12e India 7000 15 2 7168 7915 1,208.36 6.55 5.93 China 12800 1050 0 14700 15114 1,341.85 11.26 10.95 South Africa 0 0 0 0 0 49.83 0.00 0.00 Brazil 0 0 0 0 0 203.43 0.00 0.00 Russia 670 5 50 626 769 138.74 5.54 4.512010-11 India 7000 15 2 6898 7800 1,189.17 6.56 5.80 China 13100 1070 0 15020 16284 1,336.72 12.18 11.24 South Africa 0 0 0 0 0 49.00 0.00 0.00 Brazil 0 0 0 0 0 201.10 0.00 0.00 Russia 667 1 111 687 892 139.39 6.40 4.932009-10 India 6400 20 2 6264 7051 1,173.11 6.01 5.34 China 13657 2177 0 15114 17228 1,330.14 12.95 11.36 South Africa 0 0 0 0 0 49.11 0.00 0.00 Brazil 0 0 0 0 0 198.74 0.00 0.00 Russia 752 1 63 607 894 140.04 6.38 4.332008-09 India 6700 10 1 6143 6775 1,166.08 5.81 5.27 China 12100 3034 0 13740 15134 1,338.61 11.31 10.26 South Africa 0 0 0 0 0 49.05 0.00 0.00 Brazil 0 0 0 0 0 196.34 0.00 0.00 Russia 630 11 64 514 719 140.70 5.11 3.652007-08 India 5450 11 2 5867 5934 1,148.00 5.17 5.11 China 10573 805 0 11378 11378 1,330.04 8.55 8.55 South Africa 0 0 0 0 0 48.78 0.00 0.00 Brazil 0 0 0 0 0 190.01 0.00 0.00 Russia 523 1 79 388 545 141.38 3.85 2.742006-07 India 5,800 0 0 6,449 6,922 1,129.87 6.13 5.71 China 10,966 961 1 11,926 11,927 1,321.85 9.02 9.02 South Africa 0 0 0 0 0 44.00 0.00 0.00
Note: e - source estimates provided by USDA, data retrieved on August 1, 2011; in `000' tonnes unless otherwise specifi ed, Population fi gures for 2011-12 is arrived at by calculat-ing CAGR from 2004-05 to 2010-11;Source: USDA, World Bank, IFM, CIA World Fact Book
Rapeseed/ Mustard seeds state-wise area and production Area (`000' Hectares) Production ( `000' Tonnes)States/ UT 2009-10 2008-09 2007-08 2006-07 2001-02 2009-10 2008-09 2007-08 2006-07 2001-02
Rajasthan 2,310 2,838 2,500 3,210 1,841 2,948 3,503 2,360 3,810 1,943 Uttar Pradesh 613 884 860 830 847 682 992 1,000 870 845 Haryana 513 515 500 600 535 849 895 600 800 796 Madhya Pradesh 791 713 580 690 506 849 737 540 690 459 Gujarat 216 294 340 360 247 341 334 550 500 292 West Bengal 410 413 410 420 440 443 315 360 340 337 Assam 245 226 240 240 272 129 123 120 120 137 Bihar 89 85 90 90 93 89 82 80 90 78 Others 402 331 310 350 293 278 221 220 220 195 All India 5,588 6,298 5,830 6,790 5,073 6,608 7,201 5,830 7,440 5,083
Source: Dept. of Agriculture, GOI
A PwC & MCX Joint Endeavour 197www.mcxindia.com / www.pwc.com/in/en
DATABANK - AGRI COMMODITIES
178_300_CYIB_2011_Agri_final.indd 197178_300_CYIB_2011_Agri_final.indd 197 1/26/2012 1:28:32 AM1/26/2012 1:28:32 AM

EDITORIALSPROLOGUE INDIAN ECONOMYEXPERTS' VIEWS
Rapeseed/Mustard seeds - All India sowing progress during rabi (in lakh ha) Average Area Sown reported Change vis-a vis prev yearDate area in As on date % of average Same period Absolute % rabi last year8-Apr-11 67.01 72.47 108.1 65.56 6.9 6.21-Apr-11 67.01 72.48 108.2 65.5 7 6.225-Mar-11 67.01 72.48 108.2 64.77 7.7 6.218-Mar-11 67.01 72.47 108.1 64.62 7.8 6.211-Mar-11 67.01 72.45 108.1 65.25 7.7 6.34-Mar-11 67.01 72.45 108.1 64.76 7.7 6.325-Feb-11 67.01 72.55 108.3 65.38 7.2 6.618-Feb-11 67.01 72.51 108.2 65.35 7.2 6.64-Feb-11 67.01 72.51 108.2 65.35 7.2 628-Jan-11 67.01 72.47 108.1 65.28 7.2 621-Jan-11 67.01 72.46 108.1 65.28 7.2 614-Jan-11 67.01 71.12 106.1 64.08 7 4.824-Dec-10 67.01 69.22 103.3 62.86 6.4 410-Dec-10 67.01 62.07 92.6 60.86 1.2 -1.226-Nov-10 67.01 55.52 82.8 59.68 -4.2 -2.9 9-Apr-10 65.27 65.13 99.8 66.9 -1.8 -2.626-Mar-10 65.27 65.07 99.7 66.91 -1.8 -2.812-Mar-10 65.27 65.07 99.7 66.87 -1.8 -2.75-Mar-10 65.27 64.92 99.5 66.87 -1.9 -2.926-Feb-10 65.27 64.43 98.7 66.62 -2.2 -3.312-Feb-10 65.27 64.42 98.7 66.54 -2.1 -3.25-Feb-10 65.27 64.38 98.6 66.51 -2.1 -3.222-Jan-10 65.27 64.05 98.1 66.31 -2.3 -3.415-Jan-10 63.25 66.24 104.7 57.74 8.5 14.78-Jan-10 65.27 64.02 98.1 66.24 -2.2 -3.418-Dec-09 65.27 62.56 95.8 63.98 -1.4 -2.211-Dec-09 65.27 60.85 93.2 63.29 -2.4 -3.9 27-Mar-09 63,25 66.24 104.7 59.63 6.6 11.127-Feb-09 63.25 65.94 104.3 59.89 6 10.120-Feb-09 63.25 65.91 104.2 59.85 6.1 10.113-Feb-09 63.25 65.91 104.2 59.85 6.1 10.16-Feb-09 63.25 66.51 105.2 59.82 6.7 11.230-Jan-09 63.25 66.49 105.1 59.05 7.4 12.623-Jan-09 63.25 66.45 105.1 58.8 7.7 1316-Jan-09 63.25 66.3 104.8 58.84 7.5 12.79-Jan-09 63.25 66.24 104.7 57.74 8.5 14.72-Jan-09 63.25 65.89 104.2 57.62 8.4 14.626-Dec-08 63.25 65.18 103.1 58.11 7.1 12.219-Dec-08 63.25 63.98 101.2 57.15 6.8 1212-Dec-08 63.25 63.28 100.1 57.02 6.3 115-Dec-08 63.25 62.29 98.5 55.32 7 12.628-Nov-08 63.25 58.4 92.3 52.81 5.6 10.621-Nov-08 63.25 56.25 88.9 43.81 12.4 28.414-Nov-08 63.25 46.84 74.1 31.44 15.4 497-Nov-08 63.25 34.8 55 21.18 13.6 64.3 28-Mar-08 59.28 59.63 100.6 66.1 -6.47 -9.814-Mar-08 59.28 59.61 100.6 66.1 -6.49 -9.87-Mar-08 59.28 59.61 100.6 66.06 -6.45 -9.829-Feb-08 59.28 59.6 100.5 66.06 -6.46 -9.822-Feb-08 59.28 59.55 100.5 66.3 -6.75 -10.215-Feb-08 59.28 59.55 100.5 66.3 -6.75 -10.21-Feb-08 59.28 59.05 99.6 66.67 -7.63 -11.425-Jan-08 59.28 58.96 99.5 66.63 -7.67 -11.54-Jan-08 59.28 58.66 99 66.37 -7.71 -11.628-Dec-07 59.28 59.55 100.5 63.36 -5.81 -8.97-Dec-07 59.28 55.93 94.4 63.44 -7.5 -11.816-Nov-07 59.28 52.76 89 61.31 -8.6 -13.9
Source: Department of Agriculture Cooperation
Commodity Insights Yearbook 2011198
178_300_CYIB_2011_Agri_final.indd 198178_300_CYIB_2011_Agri_final.indd 198 1/26/2012 1:28:33 AM1/26/2012 1:28:33 AM

DATABANK - NON-AGRI COMMODITIES
Rapeseed/Mustard seeds state-wise monthly arrivals (in tonnes)Month Uttar Pradesh Rajasthan Gujarat Madhya Pradesh Haryana
Mar-11 94,417 347,891 64,114 111,074 23,957 Feb-11 58,150 60,226 10,770 47,457 1,210 Jan-11 73,089 64,320 19,425 12,395 1,621 Dec-10 68,740 65,143 20,067 13,353 2,231 Nov-10 54,979 61,468 8,377 6,392 3,312 Oct-10 60,161 122,867 14,927 17,388 3,773 Sep-10 66,301 105,296 8,914 7,531 2,336 Aug-10 125,326 113,340 6,078 5,552 6,794 Jul-10 63,044 124,172 9,696 7,531 10,682 Jun-10 55,797 175,584 13,731 5,552 18,058 May-10 73,152 229,028 20,709 18,068 28,037 Apr-10 102,881 630,200 43,689 32,968 90,874 Mar-10 106,310 332,783 105,657 99,708 36,462 Feb-10 64,467 62,984 48,604 57,717 2,355 Jan-10 51,112 30,758 11,511 12,639 1,127 Dec-09 47,805 63,054 17,185 22,246 2,456 Nov-09 39,191 58,985 12,440 20,882 2,350 Oct-09 30,904 83,053 10,234 19,340 2,039 Sep-09 46,871 51,031 17,516 14,531 4,447 Aug-09 42,154 45,550 14,962 14,548 5,009 Jul-09 45,942 86,285 12,419 5,952 7,758 Jun-09 61,774 205,850 23,037 7,557 12,374 May-09 66,510 305,033 33,627 19,401 22,561 Apr-09 78,610 596,707 60,813 38,069 112,511 Mar-09 108,189 661,367 76,927 12,177 54,311 Feb-09 99,770 111,317 52,389 4,317 598 Jan-09 63,641 37,279 4,959 3,030 659 Dec-08 50,688 29,508 4,776 2,665 721 Nov-08 35,379 22,231 5,936 1,759 814 Oct-08 33,933 40,547 4,462 1,770 658 Sep-08 32,050 40,057 7,613 1,368 549 Aug-08 29,469 32,364 3,119 2,234 672 Jul-08 48,700 115,216 9,041 3,184 1,550 Jun-08 57,168 186,713 23,970 2,335 3,049 May-08 129,167 413,088 42,667 3,813 13,500 Apr-08 101,994 504,118 62,247 5,855 34,598 Mar-08 61,044 399,254 104,168 6,588 6,936 Feb-08 72,797 59,094 15,914 1,806 301 Jan-08 50,160 48,343 3,091 1,625 286 Dec-07 47,599 45,169 5,192 861 227 Nov-07 27,797 53,449 6,441 1,520 119 Oct-07 32,307 76,580 8,799 2,218 386 Sep-07 40,124 36,274 4,278 3,894 334 Aug-07 53,283 28,802 4,412 2,635 629 Jul-07 26,643 68,272 6,712 4,772 1,704 Jun-07 43,081 163,718 14,561 6,975 7,145 May-07 58,172 381,683 24,961 12,314 30,509 Apr-07 58,842 492,351 51,375 16,816 121,392 Mar-07 55,897 348,794 97,353 31,663 28,081 Feb-07 40,258 61,828 43,810 20,269 467 Jan-07 48,991 5,170 3,501 4,600 626 Dec-06 26,585 5,557 5,922 1,121 206 Nov-06 25,932 11,960 12,943 1,246 1,151 Oct-06 32,030 9,102 11,467 947 548 Sep-06 31,428 24,831 19,782 3,954 643 Aug-06 36,186 19,744 6,794 3,748 1,925 Jul-06 39,061 19,708 7,775 5,188 873 Jun-06 55,148 41,523 15,019 12,856 2,067 May-06 70,140 143,975 36,885 34,441 40,073 Apr-06 85,114 253,263 49,922 84,066 68,181
Source: Dept. of Agriculture, GOI
A PwC & MCX Joint Endeavour 199www.mcxindia.com / www.pwc.com/in/en
DATABANK - AGRI COMMODITIES
178_300_CYIB_2011_Agri_final.indd 199178_300_CYIB_2011_Agri_final.indd 199 1/26/2012 1:28:33 AM1/26/2012 1:28:33 AM

EDITORIALSPROLOGUE INDIAN ECONOMYEXPERTS' VIEWS
Rapeseed/ Mustard seeds prices and trading activity MCX Spot prices - Other market monthly average Rapeseed/ Mustard seeds Hapur/Jaipur/Sirsa (Rs/20 Kg) spot prices (Rs/20 kg) NYSE LIFFE Paris futures
Months Monthly Month Month Uttar Rajasthan Madhya WPI of Closing Volume Open average high low Pradesh Pradesh Mustard price in lots^ interest oil (Euro/ lots^^ tonne)Dec-10 573.8 586.3 568.1 2427.4 501.1 466.6 116.9 446.3 133,028 88,442Nov-10 570.3 578.2 551.1 2419.2 492.8 466.1 116.3 415.8 117,286 87,313Oct-10 549.3 558.9 533.5 2358.9 479.1 464.5 116.1 390.5 120,319 80,783Sep-10 541.2 553.1 532.0 2384.7 473.7 461.0 116.2 366.3 121,829 88,114Aug-10 551.9 569.8 535.0 2336.0 481.5 449.8 116.0 358.3 115,643 71,775Jul-10 529.5 549.2 512.6 2293.5 465.4 429.6 113.6 351.3 144,093 60,292Jun-10 511.1 520.0 502.7 2278.1 449.4 426.4 112.3 325.0 94,749 62,231May-10 500.5 520.3 490.0 2204.3 435.1 407.7 111.8 309.8 47,759 44,996Apr-10 499.6 514.0 487.3 2247.3 435.1 401.8 111.4 308.8 76,260 41,198Mar-10 496.2 513.7 476.0 439.4 438.2 406.6 114.1 306.3 79,828 48,619Feb-10 508.8 525.8 486.0 460.3 428.7 400.6 115.1 292.8 56,078 49,281Jan-10 575.0 607.5 498.5 495.7 497.2 457.6 119.3 281.3 87,693 40,765Dec-09 604.2 630.0 584.0 499.8 529.7 505.3 118.8 287.5 50,412 59,179Nov-09 589.7 608.4 566.0 483.6 507.0 479.1 115.8 282.0 56,187 61,351Oct-09 542.8 572.0 522.8 471.9 477.8 450.7 112.9 269.0 115,637 46,495Sep-09 526.7 530.1 525.0 480.2 466.2 452.9 112.7 259.0 80,879 64,340Aug-09 541.2 549.8 527.0 475.0 482.2 427.4 114.9 271.8 62,662 55,478Jul-09 522.9 535.0 509.6 465.1 465.2 447.8 115.3 259.8 123,140 44,281Jun-09 513.4 521.2 505.7 456.4 461.9 427.6 114.2 290.0 49,973 43,497May-09 516.7 523.7 505.7 467.2 465.4 439.5 115.6 318.3 34,568 36,404Apr-09 501.7 535.4 470.0 428.7 438.6 436.0 114.5 298.3 71,445 34,376Mar-09 449.2 461.4 430.0 404.3 395.5 402.7 117.0 266.8 50,231 35,144Feb-09 485.3 528.8 427.2 408.0 412.2 416.5 122.0 269.0 36,745 34,138Jan-09 557.5 593.5 500.0 505.0 485.7 448.2 129.6 285.0 70,280 31,883Dec-08 621.3 638.0 597.7 552.1 546.7 510.6 122.7 263.8 58,232 38,138Nov-08 616.4 637.1 594.8 567.8 538.4 528.3 121.3 299.8 34,407 40,489Oct-08 609.0 623.1 598.2 565.9 531.6 524.5 122.0 321.3 84,012 34,406Sep-08 610.9 630.5 589.6 566.2 522.0 522.1 123.0 346.8 75,613 41,814Aug-08 621.3 632.1 602.6 576.1 540.4 516.7 124.0 396.0 57,792 41,097Jul-08 648.1 662.0 628.0 578.8 551.5 522.9 126.8 412.3 86,016 33,136Jun-08 631.1 655.2 603.0 550.3 540.0 534.9 124.6 454.5 46,265 39,334May-08 562.7 604.1 525.1 487.9 485.5 494.5 117.8 432.5 30,832 32,963Apr-08 521.7 540.5 500.5 461.1 449.1 469.2 117.5 434.0 48,234 33,755Mar-08 582.6 628.9 539.9 497.9 505.4 513.6 121.3 425.0 55,473 38,449Feb-08 523.7 586.1 502.5 437.3 474.0 411.0 115.8 507.0 41,993 41,568Jan-08 502.1 516.7 487.9 424.4 444.8 419.9 114.0 435.5 63,190 38,676Dec-07 483.1 491.1 475.8 430.4 430.1 409.4 111.2 429.8 36,670 35,098Nov-07 475.6 487.1 462.3 417.8 413.8 403.8 110.4 394.8 39,234 31,734Oct-07 449.6 471.8 429.2 405.4 398.6 383.4 107.5 382.0 52,393 34,795Sep-07 431.9 439.2 423.5 405.4 380.7 374.8 107.1 360.8 45,219 40,313Aug-07 436.8 445.9 424.5 405.3 383.0 374.4 107.0 350.0 35,289 38,994Jul-07 445.0 450.8 437.9 396.4 390.9 381.8 106.1 309.0 58,493 39,509Jun-07 421.7 436.0 406.7 383.7 371.9 359.3 104.6 291.5 38,423 40,033May-07 400.5 405.3 396.8 379.5 352.7 358.5 103.4 276.0 21,301 36,108Apr-07 398.1 402.0 394.8 372.0 353.7 368.0 103.1 263.0 32,545 31,884Mar-07 357.4 381.5 345.5 339.9 334.0 341.1 100.8 249.0 31,915 32,435Feb-07 349.5 355.3 340.5 342.0 325.5 321.4 100.5 271.0 18,380 29,396Jan-07 350.3 352.4 347.4 354.4 327.0 327.8 102.2 268.5 33,742 29,985Dec-06 359.0 372.0 352.5 363.1 347.3 341.7 101.8 278.0 14,824 29,746Nov-06 361.3 375.3 348.1 348.3 342.9 347.5 98.2 280.5 17,125 27,779Oct-06 328.8 343.7 325.3 331.2 307.7 310.3 95.4 267.3 32,288 24,661Sep-06 327.4 329.9 324.1 332.2 313.4 311.8 95.4 257.5 18,616 27,547Aug-06 331.0 335.8 327.9 325.6 312.2 312.3 95.3 262.8 13,899 26,083Jul-06 327.6 330.0 324.0 322.4 308.2 300.7 94.4 258.5 30,469 17,072Jun-06 328.1 332.6 323.4 323.1 303.7 300.6 93.8 243.0 23,680 26,288May-06 329.9 332.7 325.4 322.0 316.5 300.7 93.1 253.3 25,265 23,445Apr-06 323.9 330.4 319.1 317.8 304.8 297.8 91.9 235.0 19,366 18,500
Note: April 06-Mar 07 Sirsa market; April 07-till date Jaipur market; WPI - Wholesale Price Index; N/A - Not Available; Futures price are for near month continuos futures contractSource: MCX, Agmarknet; Ministry of Commerce & Industry; Exchanges' websites
Commodity Insights Yearbook 2011200
178_300_CYIB_2011_Agri_final.indd 200178_300_CYIB_2011_Agri_final.indd 200 1/26/2012 1:28:33 AM1/26/2012 1:28:33 AM

DATABANK - NON-AGRI COMMODITIES
2006-07
2007-08
2008-09
2009-10
2010-11
2011-12e
10,000 20,000 30,000 40,000 50,000 60,000 70,0000
EU-27 Canada China India Australia Others
Production
Note: e - source estimates; Source: USDA
2006-07
2007-08
2008-09
2009-10
2010-11
2011-12e
2,000 4,000 6,000 8,000 10,0000 14,00012,000EU-27 Japan Mexico China Pakistan Others
Imports
Note: e - source estimates; Source: USDA
2006-07
2007-08
2008-09
2009-10
2010-11
2011-12e
Canada Ukraine Australia United States EU-27 Others
Exports
Note: e - source estimates; Source: USDA
2006-07
2007-08
2008-09
2009-10
2010-11
2011-12e
EU-27 China India Canada Japan Others
Consumption
Note: e - source estimates; Source: USDA
Data of top 5 countries (`000' tonnes)
2,000 4,000 6,000 8,000 10,0000 14,00012,000
10,000 20,000 30,000 40,000 50,000 60,000 70,0000
A PwC & MCX Joint Endeavour 201www.mcxindia.com / www.pwc.com/in/en
DATABANK - AGRI COMMODITIES
178_300_CYIB_2011_Agri_final.indd 201178_300_CYIB_2011_Agri_final.indd 201 1/26/2012 1:28:33 AM1/26/2012 1:28:33 AM

EDITORIALSPROLOGUE INDIAN ECONOMYEXPERTS' VIEWS
Castor seeds fundamentals - World and India (in `000' tonnes) 2010-11 2009-10 2008-09 2007-08 2006-07 2001-02
World
Production - 1484 1608 1439 1170 1114Imports (castor seeds) - - 3 1 18 26Exports (castor seeds) - - 26 37 21 21
India
Production 1190 978 1171 1054 762 797Exports (castor seeds) - - - - 0.12 16.44Exports (castor oil) 343.25 345.33 308.62 176.18 186.61 204.88Certified Seed Distribution - - 4.2 4.2 3.6 2.6 Average daily volatility of MCX spot prices* 0.22% 0.73% 0.99% 0.65% 0.76% -India Average Price (Rs. /qtl) 3738.51 2611.39 2090.71 2097.25 1815.54 -
Note: World data is for calendar year; data retrieved on May 4, 2011; * Kadi prices - 23rd Sept 2004-3rd May 2005, Ahmedabad prices - 2nd Jan 2006-14th Oct 2006, Rajkot prices 16th Oct 2006-31st March 2010;Source: FAO Stat; Solvent Extractors' Association of India; MCX
Castor seeds state-wise area and productionWorld Area (`000' hectares) Production (`000' tonnes)
2010 2009 2008 2007 2006 2001 2010 2009 2008 2007 2006 2001 -11* -10* -09 -08 -07 -02 -11* -10* -09 -08 -07 -02
Andhra Pradesh 198 148 159 199 202 284 138 85 81 129 87 83Gujarat 483 438 434 358 288 305 860 736 852 708 533 465Rajasthan 126 118 137 110 79 46 161 126 177 159 104 66Others 52 50 137 120 60 82 32 30 61 57 38 39All India 859 754 866 787 628 717 1190 978 1171 1054 762 653
Note: * Estimated; Figures may not tally due to rounding off.Source: Dept. of Agriculture, GOI, The Solvent Extractors Association of India
Castor: Seeds Prodn., Oil Exports & Prices
1400
1200
1000
800
600
400
200
0
4000
3500
3000
2500
2000
1500
1000
5002005-062004-05 2007-082006-07 2008-09 2009-10
Seeds production
Oil exports
Prices
in 000 tons Rs/qntl
2010-11
Castor: Seeds Production, Oil Exports & Prices
Source: SEA of India & Agmarknet. Average Prices of India for the month of March
Commodity Insights Yearbook 2011202
178_300_CYIB_2011_Agri_final.indd 202178_300_CYIB_2011_Agri_final.indd 202 1/26/2012 1:28:34 AM1/26/2012 1:28:34 AM

DATABANK - NON-AGRI COMMODITIES
Castor seeds monthly arrivals in select states (in `000' tonnes) Month Rajasthan Andhra Pradesh GujaratApr-11 3.4 23.9 178.6Mar-11 3.2 31.7 74.9Feb-11 2.4 38.3 62.1Jan-11 2.8 15.5 62.2Dec-10 1.2 39.6 18.2Nov-10 0.8 110.6 1.6Oct-10 0.8 180.6 3.5Sep-10 0.4 63.9 11.1Aug-10 0.1 4.7 15.9Jul-10 0.2 0.5 52.7Jun-10 0.3 6.6 84.5May-10 1.8 3.3 134.2Apr-10 2.5 11.5 204.9Mar-10 1.5 26.0 105.7Feb-10 1.5 14.1 100.7Jan-10 0.9 2.3 67.2Dec-09 0.9 5.0 55.7Nov-09 3.1 8.5 45.8Oct-09 0.4 4.1 34.0Sep-09 0.6 0.8 67.9Aug-09 0.3 0.2 55.9Jul-09 0.5 0.4 39.8Jun-09 1.4 0.8 64.3May-09 3.1 0.8 99.2Apr-09 2.5 0.9 158.2Mar-09 1.8 1.8 84.7Feb-09 1.3 1.6 61.0Jan-09 1.1 0.7 44.8Dec-08 3.5 1.2 25.9Nov-08 2.0 0.2 5.3Oct-08 0.2 0.9 3.6Sep-08 0.3 0.1 12.4Aug-08 0.6 0.0 11.0Jul-08 2.2 0.0 30.1Jun-08 6.5 0.0 55.7May-08 36.6 0.0 126.5Apr-08 13.4 0.0 109.7Mar-08 12.9 0.0 72.4Feb-08 13.2 0.0 85.3Jan-08 14.4 0.0 37.6Dec-07 11.1 2.6 15.0Nov-07 0.5 7.0 8.2Oct-07 0.1 8.1 13.6Sep-07 0.3 0.8 16.8Aug-07 0.4 0.1 14.1Jul-07 0.6 0.3 20.7Jun-07 2.7 0.2 23.3May-07 15.3 0.3 42.4Apr-07 5.9 0.9 51.8Mar-07 3.2 1.6 34.3Feb-07 3.0 1.1 27.2Jan-07 1.5 1.2 17.3Dec-06 0.3 1.8 15.4Nov-06 0.2 1.9 20.2Oct-06 0.6 3.9 29.0Sep-06 0.8 1.8 33.3Aug-06 0.9 0.5 9.4Jul-06 3.6 0.7 15.9Jun-06 4.2 1.1 35.6May-06 9.4 0.9 60.2Apr-06 10.7 0.5 43.5
Source: Dept. of Agriculture, GOI
A PwC & MCX Joint Endeavour 203www.mcxindia.com / www.pwc.com/in/en
DATABANK - AGRI COMMODITIES
178_300_CYIB_2011_Agri_final.indd 203178_300_CYIB_2011_Agri_final.indd 203 1/26/2012 1:28:34 AM1/26/2012 1:28:34 AM

EDITORIALSPROLOGUE INDIAN ECONOMYEXPERTS' VIEWS
Castor seeds prices and trading activity Monthly MCX Futures prices (Rs/qtl) MCX Spot prices - Other markets monthly average WPI ofMonth Rajkot (Rs/qtl) spot prices (Rs/qtl) Castor Volume Open Monthly Month's Month's Gujarat Karnataka Maharashtra seeds Open High Low Close in lots^ interest average high low Avg. Avg. Avg. in lots^^ variety variety variety
Dec-10 N/T N/T N/T N/T N/T N/T 4021.98 4245.00 3934.00 3833.28 2862.62 3092.71 225.80Nov-10 N/T N/T N/T N/T N/T N/T 4336.98 19952.00 3426.50 3553.54 3112.27 2467.55 209.90Oct-10 N/T N/T N/T N/T N/T N/T 3608.10 3744.50 3426.50 3522.63 2681.91 2680.16 206.60Sep-10 N/T N/T N/T N/T N/T N/T 3918.64 4258.00 3729.00 3848.51 3043.82 2864.14 221.00Aug-10 N/T N/T N/T N/T N/T N/T 3651.04 3715.00 3580.50 3529.23 2868.40 2885.92 212.70Jul-10 N/T N/T N/T N/T N/T N/T 3643.11 3697.00 3545.50 3502.77 2851.49 2817.33 205.10Jun-10 N/T N/T N/T N/T N/T N/T 3300.40 3499.50 3201.50 3213.98 1552.90 2628.69 191.40May-10 N/T N/T N/T N/T N/T N/T 3141.92 3208.50 3066.50 3028.49 2484.24 2575.22 181.70Apr-10 N/T N/T N/T N/T N/T N/T 2992.46 3090.50 2934.50 2890.66 2162.19 2441.39 175.70Mar-10 N/T N/T N/T N/T N/T N/T 2891.07 2934.50 2846.50 2788.91 2336.20 2295.77 165.40Feb-10 N/T N/T N/T N/T N/T N/T 2860.60 2910.00 2835.50 2736.97 2327.84 2390.70 163.60Jan-10 N/T N/T N/T N/T N/T N/T 2851.80 2874.50 2818.00 2725.13 2114.74 2938.57 160.50Dec-09 N/T N/T N/T N/T N/T N/T 2925.20 3071.50 2846.00 2795.36 2267.90 2321.00 158.80Nov-09 N/T N/T N/T N/T N/T N/T 2893.30 3069.00 2769.50 2757.25 2207.31 2300.74 159.50Oct-09 N/T N/T N/T N/T N/T N/T 2661.20 2771.00 2565.00 2551.04 1975.95 2197.67 152.00Sep-09 N/T N/T N/T N/T N/T N/T 2696.40 2752.00 2651.00 2586.21 1441.89 2188.36 156.50Aug-09 N/T N/T N/T N/T N/T N/T 2614.60 2748.00 2491.50 2555.69 N/T 2287.50 156.60Jul-09 N/T N/T N/T N/T N/T N/T 2449.00 2497.00 2411.50 2340.93 1926.67 2160.96 145.90Jun-09 N/T N/T N/T N/T N/T N/T 2392.10 2434.00 2346.50 2292.30 2107.03 2149.14 143.80May-09 N/T N/T N/T N/T N/T N/T 2423.40 2495.50 2359.00 2337.05 1263.80 2244.63 144.70Apr-09 N/T N/T N/T N/T N/T N/T 2365.90 2440.00 2279.00 2236.94 1377.68 2144.24 146.50Mar-09 2100.00 2273.00 2100.00 2273.00 0 0 2255.00 2289.00 2163.00 2010.28 1515.04 2143.68 147.30Feb-09 2075.00 2224.50 2070.00 2107.00 0 0 2244.90 2366.00 2122.00 2125.67 1696.90 2222.89 145.80Jan-09 N/A N/A N/A N/A N/A N/A 2349.30 2628.00 2205.00 2227.00 1749.44 2254.25 145.70Dec-08 N/A N/A N/A N/A N/A N/A 2877.40 2942.50 2672.00 2703.67 2624.51 2245.02 147.60Nov-08 N/A N/A N/A N/A N/A N/A 2930.70 3014.00 2781.00 2748.75 2594.65 2208.31 145.80Oct-08 N/A N/A N/A N/A N/A N/A 2917.70 3113.50 2781.00 2737.35 1923.34 2334.64 154.30Sep-08 3147.00 3147.00 3147.00 3147.00 N/A N/A 3115.50 3163.00 3085.50 2954.71 2263.77 2387.66 158.10Aug-08 3151.00 3278.50 3085.50 3147.00 N/A N/A 3135.20 3216.50 3060.50 3024.45 2554.57 2634.49 152.50Jul-08 2800.00 3281.00 2800.00 3151.00 N/A N/A 3086.20 3289.00 2883.00 2944.80 2609.09 2592.09 151.20Jun-08 2569.00 2781.00 2569.00 2781.00 N/A N/A 2716.20 2886.50 2582.50 2572.53 2524.99 2380.01 139.90May-08 2675.00 2675.00 2569.00 2569.00 N/A N/A 2595.40 2627.00 2541.00 2444.36 2279.18 2170.86 136.70Apr-08 2675.00 2675.00 2675.00 2675.00 N/A N/A 2629.00 2659.00 2586.50 2479.27 2100.33 2412.37 136.10Mar-08 2600.00 2703.50 2548.00 2615.00 N/A N/A 2628.10 2658.00 2569.00 2440.49 1732.80 2204.58 139.80Feb-08 2260.00 2575.00 2260.00 2555.00 N/A N/A 2429.50 2576.50 2302.00 2172.80 1779.62 482.23 132.40Jan-08 2158.00 2301.00 2156.00 2260.00 N/A N/A 2265.20 2309.50 2203.00 2180.68 1634.79 453.02 127.20Dec-07 2129.00 2251.00 2090.00 2237.50 N/A N/A 2172.90 2207.50 2140.00 2077.95 1772.59 1545.81 120.20Nov-07 2040.00 2135.00 2007.00 2126.50 N/A N/A 2091.00 2155.50 2063.50 2019.88 1777.38 1748.42 118.40Oct-07 1953.00 2036.00 1908.00 2030.00 N/A N/A 2020.10 2076.50 1966.00 1927.94 1427.95 1608.36 117.40Sep-07 2015.00 2056.50 1980.00 2005.50 N/A N/A 2011.60 2046.50 1989.00 1940.03 1260.22 1658.63 118.10Aug-07 2101.00 2104.00 1950.00 2013.50 N/A N/A 2003.50 2016.00 1989.00 1940.30 1189.46 1756.04 119.20Jul-07 2139.00 2176.00 2046.00 2094.00 N/A N/A 2006.20 2028.50 1949.00 1966.44 1310.09 1782.94 118.30Jun-07 1955.00 2055.00 1950.00 2015.00 N/A N/A 1967.50 2013.00 1904.00 1920.25 1110.53 1633.17 115.10May-07 2075.00 2075.00 1880.00 1945.00 N/A N/A 1974.70 2019.00 1923.00 1929.97 1536.71 1622.58 116.60Apr-07 2120.00 2230.00 2075.00 2112.00 N/A N/A 2043.50 2078.00 2008.00 2096.92 1189.60 1764.09 112.90Mar-07 1858.00 2080.00 1800.00 1999.00 N/A N/A 1931.60 2023.00 1857.00 2431.28 1400.19 1698.55 110.40Feb-07 1952.00 1960.00 1824.00 1831.00 N/A N/A 1891.20 1925.00 1850.00 2362.42 1510.95 1818.12 113.80Jan-07 1903.00 1948.00 1845.00 1940.00 N/A N/A 1801.90 1844.00 1767.00 2391.02 1482.18 1684.86 107.40Dec-06 1863.00 1863.00 1780.00 1800.00 N/A N/A 1765.00 1813.00 1732.00 2234.57 1434.90 1562.57 102.70Nov-06 1925.00 1945.00 1795.00 1854.00 N/A N/A 1801.40 1855.00 1760.00 2013.76 1423.08 1617.71 102.00Oct-06 1875.00 1947.50 1820.00 1928.00 N/A N/A 1716.80 1859.00 1634.00 1767.46 1393.98 1336.51 92.40Sep-06 N/A N/A N/A N/A N/A N/A 1620.30 1638.00 1582.00 1586.34 1140.18 894.17 88.90Aug-06 1585.00 1585.00 1524.00 1524.00 84 9 N/A N/A N/A 1627.57 1196.55 1243.99 85.80Jul-06 1525.00 1632.00 1525.00 1585.00 96 13 N/A N/A N/A 1999.11 982.34 1226.84 85.90Jun-06 1442.00 1525.00 1435.00 1525.00 301 11 N/A N/A N/A 1370.82 1069.90 1225.04 83.20May-06 1560.00 1560.00 1400.00 1400.00 5 3 N/A N/A N/A 1307.87 1113.69 1286.80 83.60Apr-06 1551.00 1560.00 1496.00 1560.00 373 14 N/A N/A N/A 1358.47 1120.81 1316.09 89.00
Note: ^Aggregate volume in all contracts during the month; ^^Cumulative open interest in all contracts at the end of month; N/A-Not Available; N/T-Not Traded; WPI - Wholesale Price Index, Avg.: average, Future prices are for near month continuos futures contract. Source: MCX, Agmarknet & Ministry of Commerce and Industry
Commodity Insights Yearbook 2011204
178_300_CYIB_2011_Agri_final.indd 204178_300_CYIB_2011_Agri_final.indd 204 1/26/2012 1:28:35 AM1/26/2012 1:28:35 AM

DATABANK - NON-AGRI COMMODITIES
A PwC & MCX Joint Endeavour 205www.mcxindia.com / www.pwc.com/in/en
DATABANK - AGRI COMMODITIES
Edible Oil Production
2008-11
2000-03
1990-93
1980-83
1970-73
Indonesia
Source: USDA
2008-11
2000-03
1990-93
1980-83
1970-73
Malaysia
Source: USDA
0% 20% 40% 60% 80% 100%
81,939
33,693
11,965
4,809
2,101
Cumulative prod in 000 tonnes
0% 20% 40% 60% 100%
58,775
41,570
21,874
10,142
2,315
Cumulative prod in 000 tonnes
Coconut Palm Palm Kernel
Palm Palm Kernel
80%
2008-11
2000-03
1990-93
1980-83
1970-73
19,655
14,219
13,709
7,667
3,928
0% 20% 40% 60% 80% 100%
Coconut Cottonseed Rapeseed Soybean Sunfl owerseed Others
India
Source: USDA; Others: Palm Oil,Palm Kernel Oil
Cumulative prod in 000 tonnes
Edible Oil Consumption
2008-11
2000-03
1990-93
1980-83
1970-73
Coconut Cottonseed Palm Palm Kernel Peanut Rapeseed Soybean Sunfl owerseed
Cottonseed Palm Peanut Rapeseed Soybean Others
India
Source: USDA
2008-11
2000-03
1990-93
1980-83
1970-73
Coconut Cottonseed Olive Rapeseed Soybean
USA
Source: USDA
0% 20% 40% 60% 80% 100%
46,238
32,681
15,457
11,388
4,271
29,263
27,868
21,054
15,181
11,447
Cumulative consumption in 000 tonnes Cumulative consumption in 000 tonnes
0% 20% 40% 60% 80% 100%
Cumulative consumption in 000 tonnes
2008-11
2000-03
1990-93
1980-83
1970-73
China
Source: USDA; Others: Palm Kernel Oil, Sunfl owerseed Oil
0% 20% 40% 60% 80% 100%
79,626
44,280
18,254
7,288
2,912
Major country-wise & commodity-wise distribution of edible oil production, imports, exports and consumption
178_300_CYIB_2011_Agri_final.indd 205178_300_CYIB_2011_Agri_final.indd 205 1/26/2012 1:28:35 AM1/26/2012 1:28:35 AM

EDITORIALSPROLOGUE INDIAN ECONOMYEXPERTS' VIEWS
Commodity Insights Yearbook 2011206
Edible Oil Import
2008-11
2000-03
1990-93
1980-83
1970-73
China
Source: USDA, Others: Coconut Oil, Peanut Oil
2008-11
2000-03
1990-93
1980-83
1970-73
USA
Source: USDA
0% 20% 40% 60% 80% 100%
27,875
10,978
4,701
250
160
Cumulative imports in 000 tonnes
0% 20% 40% 60% 100%
6.669
4,149
3,146
1,734
1,155
Cumulative imports in 000 tonnes
Coconut Olive Palm Kernel Peanut Rapeseed
80%
2008-11
2000-03
1990-93
1980-83
1970-73
26,824
16,351
603
3,537
333
0% 20% 40% 60% 80% 100%
India
Source: USDA, Others: Coconut Oil, Cottonseed oil, Rapeseed Oil
Cumulative imports in 000 tonnes
2008-11
2000-03
1990-93
1980-83
1970-73
Peanut Soybean Sunfl owerseed Coconut Palm Palm Kernel
Argentina
Source: USDA
2008-11
2000-03
1990-93
1980-83
1970-73
Coconut Palm Palm Kernel
Malaysia
Source: USDA
0% 20% 40% 60% 80% 100%
16,824
13,850
6,348
1,411
141
49,551
34,861
18,681
9,068
2,285
Cumulative imports in 000 tonnes Cumulative imports in 000 tonnes
0% 20% 40% 60% 80% 100%
Cumulative imports in 000 tonnes
2008-11
2000-03
1990-93
1980-83
1970-73
Indonesia
Source: USDA
0% 20% 40% 60% 80% 100%
57,178
20,388
5,797
935
787
Palm Palm Kernel Soybean Sunfl owerseed Others Palm Palm Kernel Rapeseed Soybean Others
Edible Oil Exports
178_300_CYIB_2011_Agri_final.indd 206178_300_CYIB_2011_Agri_final.indd 206 1/26/2012 1:28:36 AM1/26/2012 1:28:36 AM

DATABANK - NON-AGRI COMMODITIES
A PwC & MCX Joint Endeavour 207www.mcxindia.com / www.pwc.com/in/en
DATABANK - AGRI COMMODITIES
Production
Note: Average production in ‘000’ tonnes. Source: USDA
0% 20% 40% 60% 80% 100%
2008-11
2000-03
1990-93
1980-83
1970-73
153,251
101,914
62,506
41,406
19,962
Avg. Production
Imports
Note: Average production in ‘000’ tonnes. Source: USDA
0% 20% 40% 60% 80% 100%
2008-11
2000-03
1990-93
1980-83
1970-73
55,553
32,065
18,662
11,785
4,638
Avg. Imports
Exports
Note: Average production in ‘000’ tonnes. Source: USDA
0% 20% 40% 60% 80% 100%
2008-11
2000-03
1990-93
1980-83
1970-73
64,273
39,107
21,341
13,507
4,745
Avg. Exports
Consumption
Note: Average production in ‘000’ tonnes. Source: USDA
0% 20% 40% 60% 80% 100%
2008-11
2000-03
1990-93
1980-83
1970-73
144,430
94,923
59,550
39,606
19,801
Avg. Prodn.
Soybean Palm Rapeseed Sunfl owerseed Palm Kernel
Peanut Cottonseed Coconut Olive
Palm Soybean Sunfl owerseed Rapeseed Palm Kernel
Coconut Olive Peanut Cottonseed
Palm Soybean Sunfl owerseed Rapeseed Palm Kernel
Coconut Olive Peanut Cottonseed
Soybean Palm Rapeseed Sunfl owerseed Palm Kernel
Peanut Cottonseed Coconut Olive
Type-wise world distribution of edible oil production, imports, exports and consumption
178_300_CYIB_2011_Agri_final.indd 207178_300_CYIB_2011_Agri_final.indd 207 1/26/2012 1:28:37 AM1/26/2012 1:28:37 AM

EDITORIALSPROLOGUE INDIAN ECONOMYEXPERTS' VIEWS
Export
Consumption
2008-11
2000-03
1990-93
1980-83
1970-73
Brazil
Source: USDA
0% 20% 40% 60% 80% 100%
84,552
73,627
49,765
24,378
3,869
Cumulative exports in ‘000’ tonnes
Soybean
2008-11
2000-03
1990-93
1980-83
1970-73
173,442
105,162
40,962
5,991
581
0% 20% 40% 60% 80% 100%Soybean Sunfl owerseed Others
Argentina
Source: USDA ; Others: Meal, Cottonseed & Meal, Peanut
Cumulative exports in ‘000’ tonnes
2008-11
2000-03
1990-93
1980-83
1970-73
US
Source: USDA
26,506
20,620
17,566
19,057
11,943
Cumulative exports in ‘000’ tonnes
Cottonseed Soybean
0% 20% 40% 60% 100%80%
2008-11
2000-03
1990-93
1980-83
1970-73
China
Source: USDA
0% 20% 40% 60% 80% 100%
164,276
89,240
27,965
18,639
9,778
Cumulative Consumption in ‘000’ tonnes
Cottonseed Peanut Rapeseed Soybean Sunfl owerseed
2008-11
2000-03
1990-93
1980-83
1970-73
80,479
47,440
21,346
7,923
1,970
0% 20% 40% 60% 80% 100%Cottonseed Soybean
Brazil
Source: USDA
Cumulative Consumption in ‘000’ tonnes
2008-11
2000-03
1990-93
1980-83
1970-73
US
Source: USDA
92,378
94,135
69,207
54,505
40,295
Cumulative Consumption in ‘000’ tonnes
Cottonseed Rapeseed Soybean
0% 20% 40% 60% 100%80%
Production
2008-11
2000-03
1990-93
1980-83
1970-73
Brazil
Source: USDA
0% 20% 40% 60% 80% 100%
160,715
120,216
71,390
32,282
6,268
Cumulative production in ‘000’ tonnes
Cottonseed Soybean
2008-11
2000-03
1990-93
1980-83
1970-73
167,117
105,743
42,727
6,614
636
0% 20% 40% 60% 80% 100%Sunfl ower seed Soybean
Argentina
Source: USDA
Cumulative production in ‘000’ tonnes
2008-11
2000-03
1990-93
1980-83
1970-73
China
Source: USDA
163,671
91,330
35,086
18,517
9,739
Cumulative production in ‘000’ tonnes
Cottonseed Peanut Rapeseed Soybean
0% 20% 40% 60% 100%80%
Commodity Insights Yearbook 2011208
Major country-wise & commodity-wise distribution of oilseeds meal consumption, exports and production
178_300_CYIB_2011_Agri_final.indd 208178_300_CYIB_2011_Agri_final.indd 208 1/26/2012 1:28:38 AM1/26/2012 1:28:38 AM

DATABANK - NON-AGRI COMMODITIES
A PwC & MCX Joint Endeavour 209www.mcxindia.com / www.pwc.com/in/en
DATABANK - AGRI COMMODITIES
Production
Note: Average production in ‘000’ tonnes. Source: USDA
0% 20% 40% 60% 80% 100%
2008-11
2000-03
1990-93
1980-83
1970-73
296,782
218,585
140,476
102,885
49,964
Avg. Production
Soybean Rapeseed Cottonseed Sunfl owerseed Palm Kernel
Peanut Fish Copra
Imports
Note: Average production in ‘000’ tonnes. Source: USDA
0% 20% 40% 60% 80% 100%
2008-11
2000-03
1990-93
1980-83
1970-73
69,567
51,359
37,533
27,533
13,150
Avg. Imports
Soybean palm Kernel Rapeseed Sunfl owerseed Fish
Copra Cottonseed Peanut
Exports
Note: Average production in ‘000’ tonnes. Source: USDA
0% 20% 40% 60% 80% 100%
2008-11
2000-03
1990-93
1980-83
1970-73
111,850
81,846
52,076
37,248
12,500
Avg. Exports
Soybean Palm Kernel Sunfl owerseed Rapeseed Fish
copra Cottonseed Peanut
Consumption
Note: Average production in ‘000’ tonnes. Source: USDA
0% 20% 40% 60% 80% 100%
2008-11
2000-03
1990-93
1980-83
1970-73
252,862
188,629
125,864
92,869
50,735
Avg. Prodn.
Soybean Rapeseed Cottonseed Sunfl owerseed Peanut
Palm Kernel Fish Copra
Type-wise world distribution of oilseed meal production, imports, exports and consumption
178_300_CYIB_2011_Agri_final.indd 209178_300_CYIB_2011_Agri_final.indd 209 1/26/2012 1:28:39 AM1/26/2012 1:28:39 AM

EDITORIALSPROLOGUE INDIAN ECONOMYEXPERTS' VIEWS
Cotton fundamentals - World and India (in `000' 480 lbs bales) 2011-12e 2010-11 2009-10 2008-09 2007-08 2006-07 2001-02
World
Beginning stocks 44,399 44,275 60,540 60,725 62,270 61,887 49,408Production 123,156 114,555 101,384 107,081 119,676 121,812 98,703Imports 38,287 35,767 36,244 30,176 38,921 38,045 29,304Consumption 116,548 114,787 118,323 107,377 121,137 121,998 93,736Total Supply 205,842 194,597 198,168 197,982 220,867 221,744 177,415Exports 38,294 35,411 35,570 30,065 39,005 37,476 29,149Ending Stocks 51,000 44,399 44,275 60,540 60,725 62,270 54,530Area Under Production (000 Ha) 35,557 33,502 30,114 30,591 32,898 34,562 33,716Yield (Kg/Ha) 754 744 733 762 792 767 637
India
Beginning stocks 5,849 6,399 8,919 5,629 7,129 7,839 3,773Production 27,000 24,500 23,000 22,600 24,000 21,800 12,300Imports 500 450 480 800 600 465 2,388Consumption 21,000 20,500 19,450 17,750 18,600 18,100 13,275Exports 5,000 5,000 6,550 2,360 7,500 4,875 60Total Supply 33,349 31,349 32,399 29,029 31,729 30,104 18,461Ending Stocks 7,349 5,849 6,399 8,919 5,629 7,129 5,126Area Under Production (000 Ha) 12,000 11,160 10,310 9,406 9,439 9,166 8,730Yield (Kg/Ha) 490 478 486 523 554 518 307Certified Seed Distribution - - 22.7 18.9 24.5 26.2Average daily volatility of MCX spot prices Cotton Long - 0.80%# 0.87% 1.07% 0.59% 0.47% -Cotton Medium^ - 0.71%# 1.73% 0.90% 0.77% 0.67% - MSP Medium Staple) 2,800 2,500 2,500 2,500 1,800 1,770 1675MSP (Long Staple) 3,300 3,000 3,000 3,000 2,030 1,990 1875
Note: e - source estimates provided by USDA, data retrieved on July 29, 2011; ^ 1st Apr 2004 - 10th Oct 2009 - Abohar prices and 12th Oct 2009 - 31st March 2010 - Sriganganagar prices; # volatility calculated from 1st April 2010 to 31st July 2010.Source: USDA; Dept. of Agriculture, GOI; MCX; Press Information Bureau.
Cotton balance sheet 2011-12e - World (in `000' 480 lbs bales) Supply DemandCountry Begining Production Imports Consumption Exports Ending stocks stocks
China 11,621 33,000 15,250 46,500 50 13,321 India 5,849 27,000 500 21,000 5,000 7,349 US 2,750 16,000 5 3,755 12,000 3,000 Pakistan 2,657 10,300 1,150 10,525 400 3,182 Brazil 8,153 9,300 100 4,450 4,400 8,703 Uzbekistan 1,148 4,500 - 1,250 3,150 1,248 Others 12,221 23,056 21,282 29,068 13,294 14,197 World Total 44,399 123,156 38,287 116,548 38,294 51,000
Note: e - source estimates provided by USDA, data retrieved on July 29, 2011; Source: USDA
Commodity Insights Yearbook 2011210
178_300_CYIB_2011_Agri_final.indd 210178_300_CYIB_2011_Agri_final.indd 210 1/26/2012 1:28:39 AM1/26/2012 1:28:39 AM

DATABANK - NON-AGRI COMMODITIES
Cotton - BRICS Nations fact sheet (in `000' 480 lbs bales) Production Import Export Consumption Total Population Per capita Per capita Supply (in million) availability consumption (kg) (kg)
Brazil 9,300 100 4,400 4,450 17,553 206.47 85.02 21.55 Russia 0 600 0 600 717 137.97 5.20 4.352011-12e India 27,000 500 5,000 21,000 33,349 1,208.36 27.60 17.38 China 33,000 15,250 50 46,500 59,871 1,341.85 44.62 34.65 South Africa 100 110 0 190 295 49.83 5.92 3.81 Brazil 9,300 750 2,000 4,250 14,403 203.43 70.80 20.89 Russia 0 600 0 625 742 138.74 5.35 4.502010-11 India 24,500 450 5,000 20,500 31,349 1,189.17 26.36 17.24 China 30,500 12,000 125 46,000 57,746 1,336.72 43.20 34.41 South Africa 100 110 0 190 275 49.00 5.61 3.88 Brazil 5,450 151 1,990 4,250 10,593 201.10 52.67 21.13 Russia 0 845 0 875 1,017 139.39 7.30 6.282009-10 India 23,000 480 6,550 19,450 32,399 1,173.11 27.62 16.58 China 32,000 10,903 23 50,000 65,269 1,330.14 49.07 37.59 South Africa 39 132 0 185 250 49.11 5.09 3.77 Brazil 5,480 50 2,739 4,050 11,781 198.74 59.28 20.38 Russia 0 900 0 925 1,097 140.04 7.83 6.612008-09 India 22,600 800 2,360 17,750 29,029 1,166.08 24.89 15.22 China 36,700 6,996 84 41,750 64,200 1,338.61 47.96 31.19 South Africa 38 156 0 210 289 49.05 5.89 4.28 Brazil 7,360 164 2,231 4,450 12,932 196.34 65.86 22.66 Russia 0 1,075 0 1,100 1,297 140.70 9.22 7.822007-08 India 24,000 600 7,500 18,600 31,729 1,148.00 27.64 16.20 China 37,000 11,530 62 48,500 69,066 1,330.04 51.93 36.46 South Africa 46 175 0 235 330 48.78 6.76 4.82 Brazil 7,000 515 1,300 4,423 11,131 190.01 58.58 23.28 Russia 0 1,325 0 1,325 1,547 141.38 10.94 9.372006-07 India 21,800 465 4,875 18,100 30,104 1,129.87 26.64 16.02 China 35,500 10,588 88 48,000 68,624 1,321.85 51.92 36.31 South Africa 52 251 0 250 359 44.00 8.16 5.68
Note: e - source estimates provided by USDA, data retrieved on July 29, 2011; Market Year (India): August to July; Population fi gures for 2011-12 is arrived at by calculating CAGR from 2004-05 to 2010-11;Source: USDA
Cotton state-wise area and production Area (`000' Hectares) Production ('000 bales of 170kg each)States/ UT 2010 2009 2008 2007 2006 2001 2010 2009 2008 2007 2006 2001 -11 -10 -09 -08 -07 -02 -11 -10 -09 -08 -07 -02
Andhra Pradesh 1,776 1,467 1,399 1,134 972 1,108 5,300 3,265 3,569 3,491 2,181 2,675 Gujarat 2,633 2,464 2,354 2,422 2,390 1,750 10,200 7,875 7,014 8,276 8,787 3,250 Haryana 495 507 455 483 530 630 1,400 1,926 1,858 1,885 1,814 550 Karnataka 534 457 409 403 376 609 1,000 865 866 778 610 700 Madhya Pradesh 651 611 625 630 639 542 1,700 857 856 865 829 2,000 Maharashtra 3,973 3,495 3,146 3,195 3,107 3,105 8,200 5,881 4,752 7,015 4,618 3,425 Punjab 530 511 527 604 607 607 1,600 2,006 2,285 2,355 2,678 925 Rajasthan 334 444 303 369 350 510 900 903 726 862 747 700 Tamil Nadu 130 104 115 99 100 188 500 194 188 201 221 500 Others 5 71 75 74 74 85 400 162 163 156 148 1,075 All India 11,061 10,132 9,407 9,414 9,145 9,132 31,200 23,935 22,276 25,884 22,632 15,800
Note: NA: Not AvailableSource : Dept. of Agriculture, GOI; Cotton Advisory Board
A PwC & MCX Joint Endeavour 211www.mcxindia.com / www.pwc.com/in/en
DATABANK - AGRI COMMODITIES
178_300_CYIB_2011_Agri_final.indd 211178_300_CYIB_2011_Agri_final.indd 211 1/26/2012 1:28:40 AM1/26/2012 1:28:40 AM

EDITORIALSPROLOGUE INDIAN ECONOMYEXPERTS' VIEWS
Cotton - All India sowing progress during kharif (in lakh ha) Average Area Sown reported Change vis-a vis prev yearDate area in As on date % of Same period Absolute % kharif average last year
15-Oct-10 90.86 108.47 119.4 100.09 8.4 8.48-Oct-10 90.86 107.84 118.7 98.97 8.9 9.01-Oct-10 90.86 107.55 118.4 98.79 8.8 8.910-Sep-10 90.86 106.47 117.2 98.48 8.0 8.13-Sep-10 90.86 106.14 116.8 97.7 8.4 8.620-Aug-10 90.86 105.67 116.3 95.59 10.1 10.513-Aug-10 90.86 104.97 115.5 94.96 10.0 10.56-Aug-10 90.86 103.37 113.8 94.59 8.8 9.330-Jul-10 90.86 95.05 104.6 80.63 14.4 17.923-Jul-10 90.86 95.05 104.6 80.63 14.4 17.916-Jul-10 90.86 82.78 91.1 68.75 14.0 20.49-Jul-10 90.86 66.09 72.7 48.47 17.6 36.42-Jul-10 90.86 43.68 48.1 29.17 14.5 49.7 23-Oct-09 87.24 96.21 110.3 84.88 11.4 13.416-Oct-09 87.24 96.21 110.3 84.86 11.4 13.49-Oct-09 87.24 96.21 110.3 84.66 11.4 13.41-Oct-09 87.24 96.21 110.3 84.86 11.4 13.411-Sep-09 87.24 96.21 110.3 84.88 11.4 13.44-Sep-09 87.24 96.21 110.3 84.98 11.4 13.428-Aug-09 87.24 96.21 110.3 84.86 11.4 13.413-Aug-09 87.24 93.69 107.4 82.88 10.8 137-Aug-09 87.24 91.51 104.9 78.44 13.1 16.731-Jul-09 87.24 89.9 103 78.22 11.7 14.924-Jul-09 87.24 82.53 94.6 72.48 10.1 13.917-Jul-09 87.24 68.92 79 61.68 7.2 11.710-Jul-09 87.24 48.07 55.1 59.82 -11.8 -19.626-Jun-09 87.24 18.83 21.6 17.41 1.4 8.221-Jun-09 87.24 94.93 108.8 84.53 10.4 12.319-Jun-09 87.24 18.51 21.2 17.3 1.2 73-Oct-08 83.73 90.83 108.5 92.09 -1.3 -1.4 26-Sep-08 83.73 90.83 108.5 92.09 -1.3 -1.419-Sep-08 83.73 90.64 108.3 92.5 -1.9 -212-Sep-08 83.73 90.51 108.1 92.51 -2 -2.25-Sep-08 83.73 89.09 106.4 91.32 -2.2 -2.429-Aug-08 83.73 89.09 106.4 91.32 -2.2 -2.422-Aug-08 83.73 87.05 104 90.89 -3.8 -4.28-Aug-08 83.73 80.77 96.5 90.42 -9.7 -10.71-Aug-08 83.73 69.74 83.3 79.23 -9.5 -1225-Jul-08 83.73 69.74 83.3 79.23 -9.5 -1218-Jul-08 83.73 58.08 69.4 69.85 -11.8 -16.911-Jul-08 83.73 39.17 46.8 63.38 -24.2 -38.24-Jul-08 83.73 18.23 21.8 20.31 -2.1 -10.2 26-Oct-07 83.44 93.01 111.5 89.48 3.5 3.928-Sep-07 83.44 90.94 109 87.48 3.5 414-Sep-07 83.44 90.68 108.7 86.89 3.8 4.431-Aug-07 83.44 90.2 108.1 86.14 4.1 4.717-Aug-07 83.44 87.45 104.8 82.49 5 620-Jul-07 83.44 72.28 86.6 64.17 8.1 12.66-Jul-07 83.44 59.6 71.4 37 22.6 61.1
Source: Department of Agriculture Cooperation
Commodity Insights Yearbook 2011212
178_300_CYIB_2011_Agri_final.indd 212178_300_CYIB_2011_Agri_final.indd 212 1/26/2012 1:28:40 AM1/26/2012 1:28:40 AM

DATABANK - NON-AGRI COMMODITIES
State-wise cotton purchases (in `000' bales of 170 kgs. each)State 2009-10* 2008-09 2007-08 2006-07
Andhra Pradesh 217 3276 246 528Gujarat 12 1236 123 145Haryana 32 258 19 15Karnataka 4 163 16 12Madhya Pradesh 1 737 38 251Maharashtra 48 1997 377 384Punjab 96 1045 79 43Rajasthan 26 155 70 60Tamil Nadu 0 0 0 0Others 0 0 11 17All India 438 8868 979 1455
Note: year denotes to October to September; *: As on 28-01-2010Source: Ministry of Agriculture, Govt. of India; Ministry of Textiles, Cotton Corporation of India Ltd.,Navi Mumbai
Castor: Seeds Prodn., Oil Exports & Prices
70000
60000
50000
40000
30000
20000
10000
0
100
90
80
70
60
50
40
30
20
10
0
2003-04 2005-06 2007-082002-03 2004-05 2006-07 2008-09
India ES World ES India Prices New York Cotton no 2in Rsin ‘000’ Tons
2009-10 2010-11
Cotton: Ending Stock & Price
Source: Agmarknet, & USDA. ES - ending stock, Indian prices Rs/kg, Int. prices Rs/lb
A PwC & MCX Joint Endeavour 213www.mcxindia.com / www.pwc.com/in/en
DATABANK - AGRI COMMODITIES
178_300_CYIB_2011_Agri_final.indd 213178_300_CYIB_2011_Agri_final.indd 213 1/26/2012 1:28:40 AM1/26/2012 1:28:40 AM

EDITORIALSPROLOGUE INDIAN ECONOMYEXPERTS' VIEWS
Cotton state-wise monthly arrivals (`000') tonnesMonth Rajasthan Madhya Pradesh Gujarat Maharashtra
Mar-11 15.87 55.27 131.93 46.56Feb-11 30.70 49.41 169.65 51.00Jan-11 206.11 139.56 318.36 118.26Dec-10 429.54 177.20 412.83 186.46Nov-10 225.85 103.65 242.75 107.57Oct-10 198.65 119.72 265.52 21.99Sep-10 1.76 29.97 6.56 0.70Aug-10 N/A 0.28 2.99 0.22Jul-10 N/A 0.12 3.79 0.21Jun-10 N/A 1.29 13.52 0.73May-10 0.00 6.22 16.34 5.13Apr-10 20.76 35.96 51.19 114.64Mar-10 71.94 27.19 84.70 66.77Feb-10 122.96 56.24 142.31 123.57Jan-10 122.96 98.02 186.95 111.22Dec-09 294.10 142.00 329.36 138.22Nov-09 283.95 107.32 461.65 61.90Oct-09 165.32 53.97 297.09 5.29Sep-09 18.35 18.43 71.19 0.11Aug-09 0.34 0.41 4.79 0.40Jul-09 0.00 0.03 1.59 0.10Jun-09 0.00 - 4.72 0.06May-09 10.02 0.00 22.21 0.15Apr-09 5.87 15.75 104.82 0.45Mar-09 35.77 19.27 190.28 27.42Feb-09 61.08 12.31 283.86 81.96Jan-09 172.67 22.38 305.45 60.24Dec-08 277.42 9.54 347.34 109.52Nov-08 235.18 7.90 388.74 78.74Oct-08 159.95 1.80 207.08 1.58Sep-08 31.02 0.30 23.48 0.12Aug-08 0.16 1.68 0.12 0.08Jul-08 0.01 0.07 0.54 0.01Jun-08 0.03 0.01 5.63 -May-08 0.00 0.79 25.16 0.00Apr-08 3.66 2.98 73.88 3.51Mar-08 36.40 5.15 97.72 19.33Feb-08 129.53 11.69 132.80 58.71Jan-08 232.14 33.60 317.51 92.87Dec-07 195.42 47.63 184.58 98.72Nov-07 119.05 35.73 151.83 77.12Oct-07 143.04 18.93 142.79 25.70Sep-07 20.77 9.65 6.59 0.03Aug-07 0.18 0.67 0.47 0.00Jul-07 0.08 0.16 1.17 0.04Jun-07 - 0.70 5.09 0.04May-07 0.02 0.10 18.30 0.03Apr-07 1.18 3.56 39.18 5.98Mar-07 6.99 8.94 70.33 5.54Feb-07 29.36 36.24 102.64 30.04Jan-07 79.35 77.23 188.54 77.35Dec-06 82.63 62.30 220.33 72.16Nov-06 58.73 45.51 164.07 38.17Oct-06 20.59 18.28 74.53 4.00Sep-06 1.77 0.78 7.21 0.01Aug-06 0.00 0.05 0.30 0.37Jul-06 - 0.55 0.88 0.24Jun-06 0.00 0.04 5.16 1.42May-06 0.01 1.87 43.67 1.56Apr-06 0.81 11.53 89.11 17.52
Note: ' - ' : Not availableSource: Dept. of Agriculture, GOI
Commodity Insights Yearbook 2011214
178_300_CYIB_2011_Agri_final.indd 214178_300_CYIB_2011_Agri_final.indd 214 1/26/2012 1:28:41 AM1/26/2012 1:28:41 AM

DATABANK - NON-AGRI COMMODITIES
2006-07
2007-08
2008-09
2009-10
2010-11
2011-12e
China India United States Pakistan Brazil Others
Production
Note: e - source estimates, Source: USDA
2006-07
2007-08
2008-09
2009-10
2010-11
2011-12e
20,000 30,00010,000 40,0000
China Bangladesh Turkey Indonesia Vietnam Other
Imports
Note: e - source estimates, Source: USDA
2006-07
2007-08
2008-09
2009-10
2010-11
2011-12e
10000 20000 30000 400000 50000United States India Brazil Australia Uzbekistan Others
Exports
Note: e - source estimates, Source: USDA
2006-07
2007-08
2008-09
2009-10
2010-11
2011-12e
50000 1000000 150000China India Pakistan Turkey Brazil Others
Consumption
Note: e - source estimates, Source: USDA
20,000 40,000 60,000 80,000 100,0000 140,000120,000
Data of top 5 countries (`000' tonnes)
A PwC & MCX Joint Endeavour 215www.mcxindia.com / www.pwc.com/in/en
DATABANK - AGRI COMMODITIES
178_300_CYIB_2011_Agri_final.indd 215178_300_CYIB_2011_Agri_final.indd 215 1/26/2012 1:28:41 AM1/26/2012 1:28:41 AM

EDITORIALSPROLOGUE INDIAN ECONOMYEXPERTS' VIEWS
Cotton prices and trading activity MCX spot prices, Kadi - long cotton (in Rs/candy) MCX Spot prices - Abohar-Sriganganagar - Month medium cotton (in Rs/maund) Monthly average Month's high Month's low Average High Low Dec-10 N/A N/A N/A N/A N/A N/A Nov-10 N/A N/A N/A N/A N/A N/A Oct-10 N/A N/A N/A N/A N/A N/A Sep-10 N/A N/A N/A N/A N/A N/A Aug-10 N/A N/A N/A N/A N/A N/A 1Jul-10 N/A N/A N/A 2,956.11 3,012.50 2,921.00 Jun-10 N/A N/A N/A 2,924.54 2,980.00 2,892.00 May-10 N/A N/A N/A 2,924.74 3,050.00 2,790.00 Apr-10 N/A N/A N/A 2,831.18 2,880.00 2,770.00 Mar-10 28,050.74 28,680.00 27,550.00 2,715.52 2,800.00 2,609.50 Feb-10 26,647.92 27,550.00 25,970.00 2,540.40 2,620.00 2,483.50 Jan-10 26,656.40 27,440.00 25,960.00 2,521.10 2,570.00 2,470.00 Dec-09 26,528.85 27,380.00 25,790.00 2,545.63 2,597.00 2,470.50 Nov-09 24,893.33 25,980.00 24,180.00 2,373.00 2,544.50 2,282.50 Oct-09 23,289.23 24,180.00 22,810.00 2,234.75 2,320.50 2,176.00 Sep-09 23,001.92 23,500.00 22,850.00 2,241.06 2,429.00 2,172.00 Aug-09 23,618.80 23,950.00 23,430.00 2,502.20 2,523.00 2,466.00 Jul-09 23,830.74 24,240.00 23,450.00 2,497.06 2,537.50 2,467.00 Jun-09 23,448.85 23,570.00 23,330.00 2,452.29 2,521.00 2,415.00 May-09 23,629.60 24,020.00 22,670.00 2,466.23 2,537.00 2,378.50 Apr-09 22,506.67 22,740.00 22,240.00 2,390.50 2,474.00 2,340.00 Mar-09 N/A N/A N/A 2,126.62 2,257.00 2,018.50 Feb-09 20,696.36 21,540.00 20,330.00 2,108.67 2,178.00 2,028.00 Jan-09 21,417.31 21,740.00 21,160.00 2,197.67 2,243.00 2,136.00 Dec-08 21,783.85 22,000.00 21,330.00 2,204.12 2,247.00 2,175.00 Nov-08 22,224.78 22,900.00 21,510.00 2,251.80 2,361.50 2,150.00 Oct-08 23,440.00 27,350.00 22,020.00 2,453.96 2,648.50 2,347.00 Sep-08 28,530.80 29,000.00 28,100.00 2,753.22 2,855.00 2,628.50 Aug-08 27,904.40 28,790.00 27,420.00 2,772.18 2,842.50 2,746.00 Jul-08 27,682.59 28,480.00 27,360.00 2,809.43 2,910.00 2,703.50 Jun-08 25,486.80 27,360.00 24,340.00 2,703.10 2,894.00 2,584.00 May-08 23,496.67 24,520.00 22,830.00 2,523.80 2,636.00 2,418.50 Apr-08 22,491.58 22,860.00 22,160.00 2,313.14 2,418.50 2,220.00 Mar-08 22,383.54 23,190.00 21,760.00 2,223.35 2,270.00 2,170.00 Feb-08 21,425.92 22,210.00 21,259.00 2,177.82 2,246.00 2,139.00 Jan-08 20,945.46 21,424.00 20,232.00 2,147.54 2,200.00 2,077.50 Dec-07 19,843.20 20,210.00 19,650.00 2,008.30 2,070.00 1,960.00 Nov-07 19,926.88 20,090.00 19,840.00 1,970.82 2,020.00 1,926.00 Oct-07 19,653.31 20,500.00 19,140.00 1,847.90 1,954.00 1,759.00 Sep-07 20,747.67 20,930.00 20,570.00 2,013.17 2,070.00 1,901.00 Aug-07 20,485.77 20,760.00 20,290.00 2,084.23 2,172.00 2,025.00 Jul-07 20,352.69 21,080.00 19,460.00 2,135.89 2,186.50 2,055.00 Jun-07 19,054.54 19,260.00 18,895.00 2,019.85 2,036.00 2,004.50 May-07 18,987.52 19,230.00 18,720.00 1,977.72 2,036.00 1,924.50 Apr-07 19,611.50 20,030.00 19,000.00 1,983.00 2,024.50 1,927.00 Mar-07 19,185.65 19,440.00 18,705.00 1,951.65 2,024.50 1,850.50 Feb-07 18,565.88 19,110.00 17,919.00 1,773.15 1,884.50 1,694.00 Jan-07 17,841.31 18,050.00 17,650.00 1,689.14 1,740.00 1,635.00 Dec-06 18,035.20 18,150.00 17,800.00 1,727.52 1,750.00 1,710.00 Nov-06 18,221.88 18,440.00 17,800.00 1,710.42 1,720.00 1,693.00 Oct-06 18,463.46 19,200.00 18,100.00 1,725.27 1,762.00 1,705.00 Sep-06 18,715.77 19,900.00 2,000.00 1,816.62 1,900.00 1,755.00 Aug-06 19,572.69 20,200.00 18,850.00 1,871.73 1,905.00 1,835.00 Jul-06 18,379.60 18,800.00 17,950.00 1,831.48 1,845.00 1,820.00 Jun-06 17,083.08 17,950.00 1,760.00 1,810.42 1,820.00 1,800.00 May-06 17,824.07 18,100.00 17,450.00 1,798.89 1,840.00 1,775.00 Apr-06 18,139.58 18,300.00 18,000.00 1,802.71 1,860.00 1,725.00
Note: 1 Maund = 40Kg & 1Candy = 356 Kg; N/T=Not traded; N/A= Not available. Long Cotton: from Apr-09 the data is available from Mumbai. Medium Cotton: From Oct-09 the data available is from SriSource: MCX, Agmarknet; Ministry of Commerce and Industry
Commodity Insights Yearbook 2011216
178_300_CYIB_2011_Agri_final.indd 216178_300_CYIB_2011_Agri_final.indd 216 1/26/2012 1:28:42 AM1/26/2012 1:28:42 AM

DATABANK - NON-AGRI COMMODITIES
MCX Spot prices, Kapas- Other market spot prices, WPI of Cotton NYBOT – ICE futuresSurendra Nagar (in Rs/20kg) Mumbai (Rs/Kg) Raw Closing Volume Open
Average High Low DCH - Shankar-6/ V-797 cotton price (US (in lots)^ interest 32 (Si) Shankar-4 cents/lb) (in lots^^)
N/A N/A N/A 145.82 117.42 76.99 219.5 144.81 402,298 206,824N/A N/A N/A 145.19 125.44 75.23 204.3 126.23 816,199 194,575N/A N/A N/A 131.32 112.57 72.61 189.6 125.26 565,286 237,632N/A N/A N/A 124.43 103.13 71.00 180.2 104.18 411,504 238,117
1,123.46 1,127.00 1,119.30 118.24 89.70 61.80 153.1 89.08 307,433 219,593N/A N/A N/A 115.41 82.51 57.20 153.1 82.36 314,480 172,451N/A N/A N/A 117.69 82.67 58.14 155.7 82.60 472,619 164,188
584.39 588.40 582.00 120.20 80.10 56.87 152.0 80.05 341,874 189,901603.90 632.10 581.90 117.77 79.73 59.41 150.8 82.76 505,420 190,005600.36 618.50 582.40 118.12 77.56 56.74 149.0 80.55 322,185 192,841589.38 601.40 575.60 111.80 74.32 54.70 146.2 82.61 487,297 173,772568.83 574.20 564.00 113.38 75.26 60.05 148.2 69.03 274,990 171,178
N/A N/A N/A 118.47 74.88 59.77 148.8 75.60 204,646 187,081N/A N/A N/A 101.81 67.36 52.10 139.4 70.75 433,337 176,564N/A N/A N/A 92.53 64.69 50.74 131.9 67.64 327,499 187,299N/A N/A N/A 92.67 63.35 50.76 133.2 61.34 220,480 146,055N/A N/A N/A 93.09 66.09 51.41 135.4 57.76 170,995 123,789N/A N/A N/A 92.81 67.15 51.12 135.3 57.93 176,482 125,074N/A N/A N/A 90.21 65.18 49.71 132.7 53.30 344,591 108,256
509.90 509.90 509.90 90.73 66.26 48.82 132.7 56.97 261,923 133,749506.03 518.20 498.30 89.86 62.72 45.70 129.8 53.49 330,268 121,436461.51 502.00 434.60 76.99 58.85 40.64 124.2 46.47 260,781 140,318452.92 482.90 441.40 75.94 57.94 42.19 129.9 42.06 316,713 116,304
N/A N/A N/A 79.43 60.64 53.16 137.4 49.41 253,550 129,490N/A N/A N/A 82.47 61.17 53.16 139.2 49.02 169,346 125,564N/A N/A N/A 87.75 62.66 53.16 140.9 45.75 423,372 127,006N/A N/A N/A 90.00 68.27 56.88 147.0 44.29 387,846 170,969N/A N/A N/A 91.41 79.59 62.44 160.9 55.50 403,688 195,316N/A N/A N/A 94.33 79.76 62.15 158.3 67.53 293,429 213,856N/A N/A N/A 94.08 78.47 60.33 154.7 71.65 281,522 222,053N/A N/A N/A 91.55 72.21 55.48 144.8 71.40 690,183 215,451N/A N/A N/A 89.30 64.76 50.06 131.8 65.74 427,731 273,411
504.36 510.90 500.50 87.19 60.22 47.81 125.2 68.74 651,281 246,983505.16 508.10 501.20 84.48 60.18 46.85 121.7 69.34 730,160 268,675
N/A N/A N/A 82.67 59.05 46.40 116.3 79.66 929,808 301,645N/A N/A N/A 82.03 58.50 45.14 115.1 67.79 684,489 270,994N/A N/A N/A 80.16 55.29 43.03 111.3 68.01 338,439 231,807N/A N/A N/A 80.16 55.50 43.24 108.6 58.20 514,179 210,389N/A N/A N/A 84.37 55.31 44.25 107.9 64.08 278,600 248,032N/A N/A N/A 90.00 57.83 44.33 112.5 62.05 200,552 231,769N/A N/A N/A 90.00 57.66 45.07 113.5 58.87 215,267 203,217N/A N/A N/A 88.59 57.07 45.98 113.1 63.00 217,426 213,491N/A N/A N/A 90.00 53.78 42.86 106.7 58.50 421,689 204,192N/A N/A N/A 90.00 53.01 41.76 105.2 51.05 278,518 223,814
452.11 472.50 424.20 91.05 54.98 44.09 109.7 47.25 650,531 220,781451.39 466.90 440.10 92.81 54.17 42.75 99.2 53.57 326,818 232,652
N/A N/A N/A 90.70 51.47 38.74 93.2 55.55 711,346 202,169N/A N/A N/A 90.00 49.85 36.28 95.0 54.00 381,099 191,874N/A N/A N/A 90.56 50.17 36.84 96.2 56.19 264,396 170,421N/A N/A N/A 101.23 51.18 36.56 97.9 48.90 587,710 159,914N/A N/A N/A 100.17 50.80 37.26 99.9 49.28 324,911 185,353N/A N/A N/A 106.43 52.68 38.58 103.8 49.30 268,847 182,562N/A N/A N/A 102.29 51.38 37.61 102.5 53.05 259,259 172,081N/A N/A N/A 103.48 49.17 33.80 96.0 53.45 204,799 163,583N/A N/A N/A 104.04 47.99 31.92 91.8 49.75 601,971 160,069
334.70 334.70 334.70 104.04 48.62 32.06 91.3 50.94 338,300 179,676333.28 344.90 324.00 102.36 50.13 32.34 92.7 49.90 530,001 147,886
is from Sriganganagar, WPI - Wholesale Price Index; Future prices are for near month continuos futures contract.
A PwC & MCX Joint Endeavour 217www.mcxindia.com / www.pwc.com/in/en
DATABANK - AGRI COMMODITIES
178_300_CYIB_2011_Agri_final.indd 217178_300_CYIB_2011_Agri_final.indd 217 1/26/2012 1:28:42 AM1/26/2012 1:28:42 AM

EDITORIALSPROLOGUE INDIAN ECONOMYEXPERTS' VIEWS
Jute fundamentals - World and India (in `000' tonnes) 2010-11 2009-10 2008-09 2007-08 2006-07 2001-02WorldArea under production (in `000' ha) - 1,264.00 1,234.50 1,330.00 1,280.40 1,438.7 Production - 2,833.70 2,833.00 2,846.90 2,887.90 2,933.6 Imports - - 443.8 519.7 364 294.0 Exports - - 449.6 723.9 463.7 285.9
India Beginning stocks 216 144 396 414 144 126.0 Production 1,926.00 1,620.00 1,476.00 1,782.00 1,800.00 1,890.0 Raw jute imports 31.5^ 82.9 59 171.8 94.4 72.0 Consumption 2,016.00 1,602.00 1,764.00 1,944.00 1,602.00 1,800.0 Exports of Jute Goods 199.3 110.5 199.8 204.3 242.8 146.1 Ending Stocks 216 216 144 396 414 288.0
Variety wise Production of Jute goodsHessian 244.4 206.5 297.8 350.3 250.3 275.3 Sacking 1,076.90 921.6 1,071.40 1,143.00 874.7 1,034.3 Carpet Backing Cloth 4.7 2.4 4.5 6 2.9 5.0 Others 239.7 192.6 260 279.7 228.4 286.2 Total 1,565.70 1,323.30 1,633.70 1,776.00 1,356.30 1,600.8 Jute product imports 46.2^ 112.8 70.9 57.7 60.9 -Area under production (000 Ha) 785 912.7 900.3 960.3 935.1 986.0 Yield (Kg per Ha) - 1,217.00 1,151.00 1,167.00 1,210.00 1,850.0 Certified Seed Distribution - - 2.8 2.4 2.6 2.1 MSP (In Rs/Quintal) 1,575.00 1,375.00 1,250.00 1,055.00 1,000.00 810.0 Average daily volatility of MCX spot prices 1.87% 2.19% 0.78% 0.67% - -
Note: World data is for calander year. India data is for fi nancial year. India's raw jute exports are negligible; Data retrieved on July 10, 2010. Data was converted from bales to tonnes considering 1 bale equal to 180 kgs; MSP: Minimum Support Price; ^ Apr-Oct.Source: Jute Commissioner kolkata - Ministry of Textiles, 2009-10 - Fourth Advanced Estimates of production, Govt. of India, FAOSTAT
Raw jute procurement by Jute Corporation of India (in '000' bales of 180 kgs each) Year At support price (MSP) At commercial rates Total2010-11 9.6 0 9.62009-10 0 0 02008-09 103.7 0 103.72007-08 756 0 7562006-07 136 348 4842005-06 0 141 1412004-05 352 0 352
Note: MSP: Minimum Support Price; Source: Jute Corporation of India
Jute state-wise area and production Area (`000' hectares) Production (`000' Bales of 180kg each)States/ UT 2009-10 2008-09 2007-08 2006-07 2001-02 2009-10 2008-09 2007-08 2006-07 2001-02
West Bengal 624 592 617 606 518 8893 7966 8294 8506 604Bihar 142 151 154 141 108 1182 1220 1465 1390 95Assam 62 65 65 63 86 638 674 684 583 100Others 85 92 124 125 161 391 505 768 794 8201All India 913 901 960 935 873 11104 10365 11211 11273 9000
Note: Offi ce of the Jute Commissioner
Year End Status on No. of Jute Mills,Spindles Installed Workers Year No of Mills Workers on Rolls Spindles (Fine) Spindles (Coarse) Capacity Utilisation Mills (in '000') (in '000') (in '000') (%)
2009-10 78 80 600 100 622008-09 77 80 600 100 722007-08 77 90 600 100 712006-07 77 100 600 100 472005-06 77 110 580 100 852004-05 78 120 580 100 89
Note: Data as on March end; Source: Jute Commissioner, Kolkata
Commodity Insights Yearbook 2011218
178_300_CYIB_2011_Agri_final.indd 218178_300_CYIB_2011_Agri_final.indd 218 1/26/2012 1:28:42 AM1/26/2012 1:28:42 AM

DATABANK - NON-AGRI COMMODITIES
Jute - All India sowing progress during kharif (in lakh ha) Average Area Sown reported Change vis-a vis prev year area in kharif As on date % of Same period Absolute % average last year1-Oct-10 7.85 7.59 96.7 6.92 0.7 9.710-Sep-10 7.85 7.57 96.4 6.92 0.7 9.43-Sep-10 7.85 7.58 96.5 6.92 0.7 9.520-Aug-10 7.85 7.56 96.3 6.92 0.6 9.213-Aug-10 7.85 7.56 96.3 6.92 0.6 9.26-Aug-10 7.85 7.56 96.3 6.92 0.6 9.230-Jul-10 7.85 7.55 96.1 6.91 0.6 9.323-Jul-10 7.85 7.6 96.8 6.89 0.7 10.316-Jul-10 7.85 7.59 96.7 6.89 0.7 10.29-Jul-10 7.85 7.59 96.7 6.89 0.7 10.22-Jul-10 7.85 7.59 96.7 6.89 0.7 10.2 28-Aug-09 7.98 6.92 86.7 7.06 -0.1 -2.013-Aug-09 7.98 6.89 86.4 7.06 -0.2 -2.47-Aug-09 7.98 6.89 86.4 7.06 -0.2 -2.431-Jul-09 7.98 6.89 86.4 7.06 -0.2 -2.424-Jul-09 7.98 6.89 86.4 7.06 -0.2 -2.417-Jul-09 7.98 6.89 86.4 7.06 -0.2 -2.410-Jul-09 7.98 6.89 86.4 7 -0.1 -1.626-Jun-09 7.98 6.87 86.1 7 -0.1 -1.921-Jun-09 7.98 6.92 86.7 7.06 -0.1 -2.019-Jun-09 7.98 6.87 86.1 7 -0.1 -1.9 1-Aug-08 8.24 7.37 89.4 8.26 -0.9 -10.825-Jul-08 8.24 8.61 104.5 7.03 1.6 22.518-Jul-08 8.24 8.61 104.5 7.03 1.6 22.511-Jul-08 8.24 8.66 105.1 7.03 1.6 23.24-Jul-08 8.24 8.66 105.1 7.03 1.6 23.2 14-Sep-07 8.38 8.29 99 8.18 0.1 1.431-Aug-07 8.38 7.89 94.2 8.18 -0.3 -3.517-Aug-07 8.38 7.89 94.2 8.18 -0.3 -3.520-Jul-07 8.38 7.89 94.2 8.18 -0.3 -3.56-Jul-07 8.38 7.88 94.1 8.18 -0.3 -3.615-Jun-07 8.38 7.82 93.3 8.18 -0.4 -4.4
Source: Department of Agriculture Cooperation
Castor: Seeds Prodn., Oil Exports & Prices
Source: Source: SEA of India & Agmarknet. Average Prices of India for the month of March
2500
2000
1500
1000
500
0
3000
2500
2000
1500
1000
500
02005-06 2007-082004-05 2006-07 2008-09
Production
Consumption
Prices
2009-10
Rs/qntl000 tones
2010-11
Jute: Production, Consumption & Prices
Source: Ministry of Textiles & Agmarknet. Average Prices of India for the month of March
A PwC & MCX Joint Endeavour 219www.mcxindia.com / www.pwc.com/in/en
DATABANK - AGRI COMMODITIES
178_300_CYIB_2011_Agri_final.indd 219178_300_CYIB_2011_Agri_final.indd 219 1/26/2012 1:28:42 AM1/26/2012 1:28:42 AM

EDITORIALSPROLOGUE INDIAN ECONOMYEXPERTS' VIEWS
Jute state-wisemonthly arrivals (in tonnes) West Bengal Orissa
21603.66 2.5 24961.53 30.1 21082.02 615 32183.28 60.1 50599.25 N/A 25917.63 5 4715.35 6.99 6031.78 43.8 7382.05 15 7867.5 6 10153.53 6 10216.79 9.2 10644.21 36 9781.8 46.74 18132.69 24.5 41026.21 41.52 41047.49 3 24594.69 N/A 7724.13 N/A 4890 4 4865.81 15 6966.67 122.55 10847.52 94.48 21213.58 244.86 16428.13 244.46 24921.52 776.6 29691.27 780.98 29476.85 291.98 46022.35 204 26731.59 155.92 5104.89 308.12 7692.64 258.93 9531.93 285.42 8535.6 380.05 7202.03 1536.79 8531.78 80.05 0 173.3 18199.43 9 11977.7 215.31 21381.19 201 23857.79 154.04 13849.46 93.7 11986.27 182.96 10755.59 406.71 11515.34 182.96 9640.66 94.87 8236.03 237.96 5884.87 106.08 16376.06 94.24 10605.13 101.55 25678.7 234.12 26317.46 196.6 36406.27 15 25149.51 0 6582.27 8 5123.88 4 4954.15 166.24 4785.92 165
Note: N/A - Not AvailableSource: Department of Agriculture, GOI
Jute monthly spot prices at MCX and other major physical markets in India MCX Spot prices - Kolkata (Rs/qtl) Other markets monthly average Month spot prices (Rs/qtl) WPI of Monthly Month©s Month©s T.D.-5 T.D.-5 Raw Jute Jute average high low Barddhaman Medinipur Kolkata
Dec-10 3474.7 3608.0 3352.5 2904.4 3150.0 3436.0 234.4Nov-10 3518.9 3597.0 3398.0 2622.1 3066.7 3484.3 234.9Oct-10 3406.8 3486.5 3265.5 2819.3 3000.0 3384.7 239.3Sep-10 3235.2 3461.0 2945.0 2822.5 3175.0 3247.4 218.0Aug-10 2786.3 2993.0 2656.5 2422.2 N/A 2817.0 187.3Jul-10 2983.4 3261.5 2636.0 2703.6 N/A 2960.8 189.8Jun-10 3334.0 3580.0 2824.5 3022.2 N/A 3260.7 178.1May-10 3272.3 3411.0 3158.0 2982.7 3100.0 3233.0 175.1Apr-10 3149.9 3219.0 2936.0 2895.0 2800.0 3114.1 172.1Mar-10 3106.2 3247.0 2910.5 2838.9 3000.0 3065.8 173.0Feb-10 2760.3 2971.0 2683.0 2500.0 2525.0 2717.2 167.2Jan-10 2685.0 2685.0 2685.0 2532.5 2500.0 2684.1 164.1Dec-09 2679.2 2689.5 2619.0 2400.8 N/A 2675.4 162.7Nov-09 2394.2 2601.5 2227.5 2163.3 N/A 2407.4 167.8Oct-09 2306.5 2384.0 2220.0 2067.7 N/A 2322.9 178.2Sep-09 2109.9 2267.0 1898.5 1766.7 N/A 2097.9 151.6Aug-09 2196.3 2700.0 1894.5 1822.7 N/A 2235.8 152.4Jul-09 2700.9 2790.0 2644.0 2440.7 N/A 2765.5 153.3Jun-09 2704.7 2811.5 2550.0 2478.6 N/A 2771.5 155.0May-09 2464.1 2542.0 2369.0 2239.0 N/A 2519.7 154.0Apr-09 2311.2 2454.0 2183.0 2051.0 N/A 2377.5 146.1Mar-09 2137.6 2197.0 2036.0 1897.5 N/A 2185.3 141.6Feb-09 1979.5 2015.0 1961.5 1784.6 N/A 2035.9 140.1Jan-09 1925.2 1970.5 1836.0 1705.3 N/A 1972.4 139.5Dec-08 1618.8 1787.5 1570.0 1384.8 N/A 1655.8 139.4Nov-08 1552.6 1571.0 1529.5 1282.5 N/A 1559.1 138.5Oct-08 1560.9 1582.0 1540.5 1266.1 N/A 1559.2 138.8Sep-08 1548.9 1590.5 1518.5 1248.5 N/A 1546.0 138.8Aug-08 1538.9 1564.5 1512.5 1286.7 N/A 1540.5 137.8Jul-08 1403.7 1448.0 1364.0 1230.7 N/A 1489.1 136.6Jun-08 1477.5 1514.5 1455.5 1187.1 N/A 1487.0 135.9May-08 1455.2 1497.5 1414.0 1150.2 N/A 1463.3 134.8Apr-08 1431.9 1493.5 1400.0 1159.2 N/A 1429.2 132.8Mar-08 1338.3 1408.0 1258.5 1051.7 N/A 1339.2 129.5Feb-08 1217.1 1256.0 1192.0 940.0 N/A 1216.2 126.6Jan-08 1209.6 1234.5 1184.0 929.4 N/A 1211.7 125.4Dec-07 1218.1 1231.5 1208.5 960.0 N/A 1199.9 126.1Nov-07 1232.2 1252.5 1221.0 967.4 N/A 1204.4 126.5Oct-07 1215.2 1239.0 1171.0 984.3 N/A 1195.2 122.9Sep-07 1241.4 1298.5 1194.0 1059.5 N/A 1239.1 126.6Aug-07 1240.6 1313.0 1146.0 1046.1 N/A 1226.3 123.8Jul-07 1143.0 1143.0 1143.0 967.8 N/A 1115.5 114.3Jun-07 N/A N/A N/A 970.9 950.0 1113.6 115.5May-07 N/A N/A N/A 1009.7 N/A 1105.0 114.0Apr-07 N/A N/A N/A 1068.6 1150.0 1190.9 117.8Mar-07 N/A N/A N/A 1096.4 1194.4 1247.6 118.3Feb-07 N/A N/A N/A 1120.0 1200.0 1265.6 120.9Jan-07 N/A N/A N/A 1208.8 1236.9 1295.1 124.4Dec-06 N/A N/A N/A 1241.5 1280.0 1381.1 130.4Nov-06 N/A N/A N/A 1301.0 1337.5 1440.6 131.0Oct-06 N/A N/A N/A 1319.5 1343.8 1463.7 132.6Sep-06 N/A N/A N/A 1280.5 1224.3 1438.0 134.6Aug-06 N/A N/A N/A 1156.7 1174.7 1308.6 130.1Jul-06 N/A N/A N/A 1481.5 1375.0 1604.5 145.5Jun-06 N/A N/A N/A 1463.4 1528.1 N/A 153.5May-06 N/A N/A N/A 1558.0 1610.0 N/A 154.8Apr-06 N/A N/A N/A 1565.0 1500.0 N/A 155.5
Note: N/A - Not Available, WPI - Wholesale Price IndexSource: MCX, Agmarknet & Ministry of Commerce and Industry
Commodity Insights Yearbook 2011220
178_300_CYIB_2011_Agri_final.indd 220178_300_CYIB_2011_Agri_final.indd 220 1/26/2012 1:28:43 AM1/26/2012 1:28:43 AM

DATABANK - NON-AGRI COMMODITIES
Jute futures prices and trading activity Jute monthly MCX futures prices (Rs/qtl) Month
Open High Low Close Volume Open interest
in lots^ in lots^^
Dec-10 N/T N/T N/T N/T N/T N/TNov-10 N/T N/T N/T N/T N/T N/TOct-10 N/T N/T N/T N/T N/T N/TSep-10 N/T N/T N/T N/T N/T N/TAug-10 N/T N/T N/T N/T N/T N/TJul-10 N/T N/T N/T N/T N/T N/TJun-10 N/T N/T N/T N/T N/T N/TMay-10 N/T N/T N/T N/T N/T N/TApr-10 N/T N/T N/T N/T N/T N/TMar-10 N/T N/T N/T N/T N/T N/TFeb-10 N/T N/T N/T N/T N/T N/TJan-10 N/T N/T N/T N/T N/T N/TDec-09 N/T N/T N/T N/T N/T N/TNov-09 N/T N/T N/T N/T N/T N/TOct-09 2330 2473 2251 2319 9981 43Sep-09 1922 2321 1922 2259 21325 1449Aug-09 2320 2409 1900 1913 20102 1827Jul-09 2676 2838 2601 2659 15402 2126Jun-09 2639 2915 2639 2778 12610 1510May-09 2485 2603 2430 2540 8481 883Apr-09 2314 2509 2284 2440 7970 948Mar-09 2133 2248 2128 2183 9576 868Feb-09 2090 2093 2004 2041 7088 1062Jan-09 1904 2017 1895 1996 11376 950Dec-08 1632 1810 1625 1798 6393 957Nov-08 1620 1643 1580 1597 5178 664Oct-08 1675 1680 1558 1571 5372 607Sep-08 1617 1640 1581 1584 9008 767Aug-08 1620 1649 1533 1543 11749 1102Jul-08 1550 1550 1420 1466 11265 1507Jun-08 1614 1628 1555 1584 12733 1489May-08 1614 1643 1493 1513 10289 1208Apr-08 1525 1578 1495 1575 7354 498Mar-08 1383 1485 1372 1482 7769 629Feb-08 1324 1335 1261 1320 6589 767Jan-08 1332 1332 1274 1298 9483 1125Dec-07 1368 1374 1283 1216 10272 1169Nov-07 1341 1357 1286 1223 7645 1304Oct-07 1302 1344 1243 1306 14081 1408Sep-07 1401 1401 1230 1248 15487 1479Aug-07 1237 1430 1236 1339 19042 1131Jul-07 1189 1217 1181 1217 629 240
Note: Jute Futures were launched from July 2007; ^Aggregate volume in all contracts during the month; ^^Cumulative open interest in all contracts at the end of month. N/T-Not Traded; Source: MCX
A PwC & MCX Joint Endeavour 221www.mcxindia.com / www.pwc.com/in/en
DATABANK - AGRI COMMODITIES
178_300_CYIB_2011_Agri_final.indd 221178_300_CYIB_2011_Agri_final.indd 221 1/26/2012 1:28:43 AM1/26/2012 1:28:43 AM

EDITORIALSPROLOGUE INDIAN ECONOMYEXPERTS' VIEWS
The term ‘cereals’ is derived from Latin ‘Cerealis’
meaning ‘belonging to Ceres,’ the Roman goddess
of agriculture. Cereals, a type of grass — such
as wheat, oat, or maize — cultivated for
edible grains, are by far the most important group of
crops. Cereal crops constitute carbohydrates, mainly
starches, which act as a vital nutrient element along
with a little amount of protein and fat.
Cereals are particularly important to humans
because of their role as staple food crops in many parts
of the world. Besides, they are used to produce animal feed,
oils, starch, fl our, etc. The grass family, Poaceae or Gramineae,
has fi ve subfamilies with about 10,000 species. Grasses are
believed to have evolved more than 60-70 million years ago and
the diverse members of this family vary widely in appearance,
mating habit, zones of adaptation, physiology, number of chromo-
somes and genome size. The European Union is the world’s
largest producer of wheat, followed by China. India,
which produces around 84 million tonnes every year,
stands at No. 3.
The wheat market for the fi rst four months of 2010
had a downtrend, except a short period in mid-January
where price movements showed an upward blip due
to increased demand in north India pushing the
prices to a year high of Rs.1,488.30/quintal. Wheat
prices opened the year at Rs.1,422.9/qntl, and since
then remained under pressure due to huge carryover
stocks from previous two seasons and an expected
bumper harvest on the back of favorable weather
conditions boosting the yield. As the new season
was approaching, traders were anxious to offl oad old
stocks to avoid losses and make way for new season
Cereals Feeding the world
Commodity in 2010 Exchange (contract) Price Unit Open High Low Close Annualised
VolatilityVolume
(in lots)^
WheatMCX (10 tonnes) Rs/ qntl.* 1,422.90 1,488.30 1,138.30 1,323.30 10.56% 4676
CBOT (136 tonnes) US Cent/ bu 544.75 841.00 425.50 794.25 38.24% 23,058,783
Note: ^All contracts – all variants; *spot prices Source: Exchanges’ websites
harvest. By April 6, 2010, this pushed wheat prices to a year
low of Rs.1,138.3/qntl.
During the peak arrivals (late April-early May)
wheat prices consolidated in a narrow range of
Rs.1,150 to Rs.1,175/qntl and remained stable.
Given the lower prices, after selling a part of the
produce, initially, for meeting immediate cash need,
farmers held back the remaining portion for selling
later in expectations of gains from a seasonal rise
in prices. Their strategy paid-off, as the prices actually
rose since mid-May. Supply pressure was such that the prices
again consolidated, though in a higher range of Rs.1,200-
Rs.1,300/qntl during May to November 2010. In the second half
of November, wheat prices breached the Rs.1,300 mark as at
that time of season availability begins to dwindle and demand for
wheat for use as seed increases. Wheat prices closed the year at
Rs.1,323.3/qntl, a fall of 7% year-on-year.
MCX wheat spot prices in 2010
Source: MCX Wheat (Rs/qtl)
Huge inventories kept a check on price increases
Farmers holding back their produce in expectations
of higher prices
Expectation of a bumper harvest for the third
year in a row – stockiest offl oading inventories
1-Jan
-10
29-Ja
n-10
26-F
eb-1
0
26-M
ar-1
0
23-A
pr-1
0
21-M
ay-1
0
18-Ju
n-10
16-Ju
l-10
13-A
ug-1
0
10-S
ep-1
0
8-Oc
t-10
5-No
v-10
3-De
c-10
31-D
ec-1
0
1600
1500
1400
1300
1200
1100
1000
Wheat prices consolidated in the range of Rs.1,200-
Rs.1,300/qntl during May to November
2010.
Commodity Insights Yearbook 2011222
178_300_CYIB_2011_Agri_final.indd 222178_300_CYIB_2011_Agri_final.indd 222 1/26/2012 1:28:43 AM1/26/2012 1:28:43 AM
DATABANK - NON-AGRI COMMODITIES
A PwC & MCX Joint Endeavour 223www.mcxindia.com / www.pwc.com/in/en
DATABANK - AGRI COMMODITIES
178_300_CYIB_2011_Agri_final.indd 223178_300_CYIB_2011_Agri_final.indd 223 1/26/2012 1:28:50 AM1/26/2012 1:28:50 AM

EDITORIALSPROLOGUE INDIAN ECONOMYEXPERTS' VIEWS
Rice fundamentals - World and India (in `000' tonnes) 2011-12e 2010-11 2009-10 2008-09 2007-08 2006-07 2001-02
World
Beginning stocks 96,873 93,919 91,533 79,966 75,098 76,614 1,46,706 Production 4,56,248 4,51,160 4,40,058 4,47,498 4,32,654 4,19,992 3,99,694 Imports 30,044 30,271 28,111 27,177 29,908 28,367 26,077 Consumption 4,53,434 4,46,054 4,34,584 4,34,183 4,26,027 4,18,443 4,12,738 Exports 31,803 32,423 31,199 28,925 31,667 31,432 26,883 Total Supply 5,83,165 5,75,350 5,59,702 5,54,641 5,37,660 5,24,973 5,72,477 Ending Stocks 97,928 96,873 93,919 91,533 79,966 75,098 1,32,856 Area Harvested (1000 Ha) 1,60,029 1,58,615 1,56,022 1,57,872 1,55,325 1,54,596 1,51,364 Yield (Rough) (MT/Ha) 4.27 4.27 4.22 4.24 4.15 4.05 3.93
India
Beginning stocks 21,800 20,500 19,000 13,000 11,430 10,520 25,051 Production 97,000 95,300 89,090 99,180 96,690 93,350 93,340 Imports - - - - - - - Consumption 93,000 91,000 85,690 91,090 90,466 86,700 87,611 Exports 3,500 3,000 1,900 2,090 4,654 5,740 6,300 Total Supply 1,18,800 1,15,800 1,08,090 1,12,180 1,08,120 1,03,870 1,18,391 Ending Stocks 22,300 21,800 20,500 19,000 13,000 11,430 24,480 Area Harvested (1000 Ha) 44,500 44,000 41,850 45,400 43,770 44,000 44,600 Yield (Rough) (MT/Ha) 3.27 3.25 3.19 3.28 3.31 3.18 3.14 Certified Seed Distribution - - - 5,818.0 4,893.0 4,351.0 2,558.0 CBOT price* (Rs./qtl) - 1238.5 1094.0 1251.5 1564.2 873.5 356.9Indian Price (Rs. /qtl) - 2,351 2,238 1,883 1,568 1,440 1,315 MSP (Rs. /qtl) 1,120 1,100 1,080 1,000 850 700 610
Note: e - source estimates provided by USDA, Data retrived on August 29, 2011Source: USDA; Ministry of Agriculture, Govt. of India; Agmarknet; CBOT
Rice balance sheet 2011-12e - World (in `000' tonnes) Supply DemandCountry Begining Production Imports Consumption Exports Ending stocks stocks
China 42,572 138,000 475 136,500 600 43,947India 21,800 97,000 0 93,000 3,500 22,300United States 1,588 6,036 572 4,018 3,113 1,065EU-27 957 1,899 1,170 2,800 350 876Russia 105 725 130 725 130 105Australia 97 710 100 350 450 107Canada 0 0 350 350 0Others 29,754 211,878 27,247 215,691 23,660 29,528World Total 96,873 456,248 30,044 453,434 31,803 97,928
Note: e - source estimates provided by USDA, Data retrived on August 29, 2011. Source: USDA
Commodity Insights Yearbook 2011224
178_300_CYIB_2011_Agri_final.indd 224178_300_CYIB_2011_Agri_final.indd 224 1/26/2012 1:29:06 AM1/26/2012 1:29:06 AM

DATABANK - NON-AGRI COMMODITIES
Rice - BRICS Nations fact sheet (in `000' tonnes)World Production Import Export Consumption Net Population Per capita Per capita availability (in million) availability consumption (kg) (kg)
Brazil 7,900 600 600 8,400 9,645 206.47 46.71 40.68 Russia 725 130 130 725 960 137.97 6.96 5.252011-12e India 97,000 0 3,500 93,000 118,800 1,208.36 98.31 76.96 China 138,000 475 600 136,500 181,047 1,341.85 134.92 101.72 South Africa 0 800 30 760 837 49.83 16.80 15.25 Brazil 9,350 400 650 8,400 10,195 203.43 50.12 41.29 Russia 690 200 120 720 945 138.74 6.81 5.192010-11 India 95,300 0 3,000 91,000 115,800 1,189.17 97.38 76.52 China 137,000 540 502 135,000 178,074 1,336.72 133.22 100.99 South Africa 0 760 25 740 802 49.00 16.37 15.10 Brazil 7,657 688 502 8,310 9,257 201.10 46.03 41.32 Russia 590 240 154 670 879 139.39 6.31 4.812009-10 India 89,090 0 1,900 85,690 108,090 1,173.11 92.14 73.05 China 136,570 388 650 134,320 175,504 1,330.14 131.94 100.98 South Africa 0 786 23 759 824 49.11 16.78 15.46 Brazil 8,570 675 569 0 9,881 198.74 49.72 42.27 Russia 480 230 90 640 779 140.04 5.56 4.572008-09 India 99,180 0 2,090 91,090 112,180 1,166.08 96.20 78.12 China 134,330 201 747 133,000 172,293 1,338.61 128.71 99.36 South Africa 0 578 27 703 768 49.05 15.66 14.33 Brazil 8,199 422 550 8,350 9,536 196.34 48.57 42.53 Russia 460 237 21 676 766 140.70 5.44 4.802007-08 India 96,690 0 4,654 90,466 108,120 1,148.00 94.18 78.80 China 130,224 445 1,372 127,450 166,584 1,330.04 125.25 95.82 South Africa 0 1,026 9 927 1,126 48.78 23.08 19.00 Brazil 7,695 732 242 8,400 9,557 190.01 50.30 44.21 Russia 445 221 12 689 770 141.38 5.45 4.872006-07 India 93,350 0 5,740 86,700 103,870 1,129.87 91.93 76.73 China 127,200 472 1,340 127,200 164,455 1,321.85 124.41 96.23 South Africa 0 797 15 842 957 44.00 21.75 19.14
Note: e - source estimates provided by USDA, Data retrieved on August 29, 2011, Population fi gures for 2011-12 is arrived at by calculating CAGR from 2004-05 to 2010-11; Source: USDA, World Bank, IMF, CIA World Fact Book
Rice state-wise area and production Area (`000' hectares) Production (`000' tonnes)States/ UT 2010 2009 2008 2007 2006 2001 2010 2009 2008 2007 2006 2001 -11 -10 -09 -08 -07 -02 -11 -10 -09 -08 -07 -02
Andhra Pradesh 4,563 3,441 4,387 3,984 3,978 3,825 8,645 10,538 14,241 13,324 11,872 11,390Bihar 2,750 3,214 3,496 3,573 3,357 3,552 3,070 3,599 5,590 4,418 4,989 5,203Orissa 4,322 4,365 4,455 4,452 4,450 4,500 5,661 6,918 6,813 7,541 6,825 7,148Tamil Nadu 1,889 1,846 1,932 1,789 1,931 2,060 5,400 5,665 5,183 5,040 6,611 6,584uttar Pradesh 5,671 5,187 6,034 5,709 5,921 6,071 12,202 10,807 13,097 11,780 11,124 12,856West bengal 4,760 5,630 5,936 5,720 5,687 6,069 14,882 14,341 18,037 14,720 14,746 15,257Maharastra 1,581 1,470 1,522 1,574 1,529 1,514 3,221 2,183 2,284 2,996 2,569 2,651Others 18,464 16,698 17,639 17,114 16,960 17,313 27,332 35,042 33,937 36,874 34,619 32,251All India 44,000 41,850 45,400 43,914 43,814 44,904 80,412 89,093 99,182 96,693 93,355 93,340
Note: *-1st Advance estimates released on 23.09.2010.Source: Dept. of Agriculture, GOI and from various Lok Sabha Unstarred Questions
A PwC & MCX Joint Endeavour 225www.mcxindia.com / www.pwc.com/in/en
DATABANK - AGRI COMMODITIES
178_300_CYIB_2011_Agri_final.indd 225178_300_CYIB_2011_Agri_final.indd 225 1/26/2012 1:29:06 AM1/26/2012 1:29:06 AM

EDITORIALSPROLOGUE INDIAN ECONOMYEXPERTS' VIEWS
Rice - All India sowing progress during kharif/rabi (in lakh ha) Date Average a Area Sown reported Change vis-a visSeason are in As on % of Same prev year kharif/rabi date average period
Absolute % last year Rabi [2010-11] 4/8/2011 42.57 44.51 104.60 44.30 0.20 -2.60Rabi [2010-11] 4/1/2011 42.57 43.98 103.30 43.93 0.00 -2.50Rabi [2010-11] 3/25/2011 42.57 43.48 102.10 43.12 0.40 -3.00Rabi [2010-11] 3/18/2011 42.57 42.82 100.60 42.64 0.20 -1.80Rabi [2010-11] 3/11/2011 42.57 41.61 97.70 41.74 -0.10 -3.00Rabi [2010-11] 3/4/2011 42.57 39.79 93.50 40.57 -0.80 -3.20Rabi [2010-11] 2/25/2011 42.57 35.77 84.00 36.53 -0.80 0.20Rabi [2010-11] 2/18/2011 42.57 30.53 71.70 35.08 -4.60 -2.70Rabi [2010-11] 2/4/2011 42.57 24.12 56.70 26.93 -2.80 -0.60Rabi [2010-11] 1/28/2011 42.54 19.46 45.70 21.88 -2.40 6.30Rabi [2010-11] 1/21/2011 42.54 13.40 31.50 17.57 -4.20 0.30Rabi [2010-11] 1/14/2011 42.54 9.21 21.70 12.67 -3.50 -1.00Rabi [2010-11] 12/24/2010 42.57 2.74 6.40 4.22 -1.50 0.60Rabi [2010-11] 12/10/2010 42.57 1.87 4.40 3.03 -1.20 -0.10Rabi [2010-11] 11/26/2010 42.57 0.96 2.30 2.05 -1.10 0.10 Kharif [2010-11] 10/29/2010 395.10 358.64 90.80 335.33 23.30 -30.40Kharif [2010-11] 10/22/2010 395.10 355.12 89.90 332.87 22.30 -31.10Kharif [2010-11] 10/15/2010 395.10 354.78 89.80 332.74 22.00 -30.00Kharif [2010-11] 10/8/2010 395.10 352.80 89.30 331.42 21.40 -28.70Kharif [2010-11] 10/1/2010 395.10 351.17 88.90 330.30 20.90 -30.20Kharif [2010-11] 9/10/2010 395.10 336.75 85.20 313.53 23.20 -32.00Kharif [2010-11] 9/3/2010 395.10 318.75 80.70 298.94 19.80 -42.70Kharif [2010-11] 8/20/2010 395.10 297.53 75.30 276.84 20.70 -27.10Kharif [2010-11] 8/13/2010 395.10 274.06 69.40 251.24 22.80 -8.00Kharif [2010-11] 8/6/2010 395.10 244.83 62.00 225.75 19.10 -6.30Kharif [2010-11] 7/30/2010 395.10 212.32 53.70 191.93 20.40 -19.00Kharif [2010-11] 7/23/2010 395.10 169.71 43.00 157.67 12.00 -0.30Kharif [2010-11] 7/16/2010 395.10 124.78 31.60 122.40 2.40 1.90Kharif [2010-11] 7/9/2010 395.10 72.30 18.30 68.67 3.60 5.30Kharif [2010-11] 7/2/2010 395.10 46.46 11.80 45.43 1.00 2.30 Rabi [2009-10] 4/16/2010 39.80 44.42 111.60 47.69 -3.30 -6.90Rabi [2009-10] 4/9/2010 39.80 44.25 111.20 47.55 -3.30 -6.90Rabi [2009-10] 3/26/2010 39.80 4.44 106.60 46.69 -4.30 -9.10Rabi [2009-10] 3/12/2010 39.80 40.29 101.20 44.22 -3.90 -8.90Rabi [2009-10] 3/5/2010 39.80 39.59 99.50 43.23 -3.60 -8.40Rabi [2009-10] 2/26/2010 39.80 36.58 91.90 40.77 -4.20 -10.30Rabi [2009-10] 2/19/2010 39.80 34.92 87.70 36.59 -1.70 -4.60Rabi [2009-10] 2/12/2010 39.80 32.35 81.30 32.52 -0.20 -0.50Rabi [2009-10] 2/5/2010 39.80 22.61 56.80 23.75 -1.10 -4.80Rabi [2009-10] 1/15/2010 39.80 12.60 31.70 10.98 1.60 14.80Rabi [2009-10] 1/8/2010 39.80 6.38 16.00 5.23 1.20 22.00Rabi [2009-10] 12/18/2009 39.80 3.99 10.00 2.73 1.30 46.20Rabi [2009-10] 12/11/2009 39.80 3.36 8.40 2.11 1.30 59.20
Kharif [2009-10] 10/23/2009 391.97 328.17 83.70 389.19 -61.00 -15.70Kharif [2009-10] 10/16/2009 391.97 327.40 83.50 388.26 -60.90 -15.70Kharif [2009-10] 10/9/2009 391.97 324.28 82.70 386.89 -62.60 -16.20Kharif [2009-10] 10/1/2009 391.97 322.05 82.20 381.33 -59.30 -15.50Kharif [2009-10] 9/11/2009 391.97 308.72 78.80 371.07 -62.40 -16.80Kharif [2009-10] 9/4/2009 391.97 302.20 77.10 365.80 -63.60 -17.40Kharif [2009-10] 8/28/2009 391.97 289.28 73.80 358.17 -68.90 -19.20Kharif [2009-10] 8/21/2009 391.97 272.83 69.60 341.44 -68.60 -20.10Kharif [2009-10] 8/13/2009 391.97 247.39 63.10 304.49 -57.10 -18.80
Contd...
Commodity Insights Yearbook 2011226
178_300_CYIB_2011_Agri_final.indd 226178_300_CYIB_2011_Agri_final.indd 226 1/26/2012 1:29:06 AM1/26/2012 1:29:06 AM

DATABANK - NON-AGRI COMMODITIES
Rice - All India sowing progress during kharif/rabi (in lakh ha) Date Average a Area Sown reported Change vis-a visSeason are in As on % of Same prev year kharif/rabi date average period
Absolute % last year Kharif [2009-10] 8/7/2009 391.97 228.19 58.20 285.94 -57.80 -20.20Kharif [2009-10] 7/31/2009 391.97 191.30 48.80 256.76 -65.50 -25.50Kharif [2009-10] 7/24/2009 391.97 168.34 42.90 223.12 -54.80 -24.60Kharif [2009-10] 7/17/2009 391.97 114.63 29.20 145.21 -30.60 -21.10Kharif [2009-10] 7/10/2009 391.97 74.28 19.00 106.46 -32.20 -30.20Kharif [2009-10] 6/26/2009 391.97 18.28 4.70 25.20 -6.90 -27.50Kharif [2009-10] 6/19/2009 391.97 8.01 2.00 7.15 0.90 12.00
Rabi [2008-09] 4/17/2009 37.31 47.34 126.90 44.42 2.90 6.60Rabi [2008-09] 3/27/2009 37.31 46.47 124.50 43.67 2.80 6.40Rabi [2008-09] 3/13/2009 37.31 44.58 119.50 40.39 4.20 10.40Rabi [2008-09] 2/27/2009 37.31 35.62 95.50 31.83 3.80 11.90Rabi [2008-09] 2/20/2009 37.31 33.25 89.10 30.32 2.90 9.70Rabi [2008-09] 2/13/2009 37.31 29.18 78.20 26.83 2.30 8.80Rabi [2008-09] 2/6/2009 37.31 24.74 66.30 23.00 1.70 7.60Rabi [2008-09] 1/30/2009 37.31 13.13 35.20 12.19 0.90 7.70Rabi [2008-09] 1/23/2009 37.31 13.13 35.20 12.19 0.90 7.70Rabi [2008-09] 1/16/2009 37.31 10.23 27.40 10.25 0.00 -0.20Rabi [2008-09] 1/9/2009 37.31 5.60 15.00 6.02 -0.40 -7.00Rabi [2008-09] 1/2/2009 37.31 3.83 10.30 3.45 0.40 11.00Rabi [2008-09] 12/26/2008 37.31 2.17 5.80 2.49 -0.30 -12.90Rabi [2008-09] 12/19/2008 37.31 2.17 5.80 2.49 -0.30 -12.90Rabi [2008-09] 12/12/2008 37.31 1.98 5.30 2.15 -0.20 -7.90Rabi [2008-09] 12/5/2008 37.31 1.48 4.00 1.84 -0.40 -19.60Rabi [2008-09] 11/28/2008 37.31 0.87 2.30 1.27 -0.40 -31.50Rabi [2008-09] 11/21/2008 37.31 0.60 1.60 0.88 -0.30 -31.80Rabi [2008-09] 11/14/2008 37.31 0.15 0.40 0.29 -0.10 -48.30Rabi [2008-09] 11/7/2008 37.31 0.05 0.10 0.18 -0.10 -72.20 Kharif [2008-09] 10/17/2008 391.17 384.75 98.40 373.79 11.00 2.90Kharif [2008-09] 10/10/2008 391.17 381.54 97.50 370.87 10.70 2.90Kharif [2008-09] 10/3/2008 391.17 381.35 97.50 369.17 12.20 3.30Kharif [2008-09] 9/26/2008 391.17 379.74 97.10 367.33 12.40 3.40Kharif [2008-09] 9/19/2008 391.17 373.51 95.50 361.81 11.70 3.20Kharif [2008-09] 9/12/2008 391.17 368.78 94.30 350.32 18.50 5.30Kharif [2008-09] 9/5/2008 391.17 361.46 92.40 345.45 16.00 4.60Kharif [2008-09] 8/29/2008 391.17 344.76 88.10 329.52 15.20 4.60Kharif [2008-09] 8/22/2008 391.17 324.63 83.00 303.56 21.10 6.90Kharif [2008-09] 8/8/2008 391.17 251.10 64.20 234.61 16.50 7.00Kharif [2008-09] 8/1/2008 391.17 231.32 59.10 207.57 23.80 11.40Kharif [2008-09] 7/25/2008 391.17 170.06 43.50 143.06 27.00 18.90Kharif [2008-09] 7/18/2008 391.17 148.88 38.10 121.18 27.70 22.90Kharif [2008-09] 7/11/2008 391.17 92.38 23.60 86.90 5.50 6.30Kharif [2008-09] 7/4/2008 391.17 55.95 14.30 47.08 8.90 18.80
Contd...
A PwC & MCX Joint Endeavour 227www.mcxindia.com / www.pwc.com/in/en
DATABANK - AGRI COMMODITIES
178_300_CYIB_2011_Agri_final.indd 227178_300_CYIB_2011_Agri_final.indd 227 1/26/2012 1:29:07 AM1/26/2012 1:29:07 AM

EDITORIALSPROLOGUE INDIAN ECONOMYEXPERTS' VIEWS
Rice - All India sowing progress during kharif/rabi (in lakh ha) Date Average a Area Sown reported Change vis-a visSeason are in As on % of Same prev year kharif/rabi date average period
Absolute % last year Rabi [2007-08] 4/25/2008 37.32 42.22 113.10 42.12 0.10 0.24Rabi [2007-08] 4/11/2008 37.32 43.41 116.30 41.37 2.04 4.90Rabi [2007-08] 4/4/2008 37.32 43.17 115.70 40.70 2.47 6.10Rabi [2007-08] 3/28/2008 37.32 42.84 114.80 40.70 2.14 5.30Rabi [2007-08] 3/14/2008 37.32 40.66 109.00 39.15 1.51 3.90Rabi [2007-08] 3/7/2008 37.32 38.87 104.20 37.47 1.40 3.70Rabi [2007-08] 2/29/2008 37.32 38.08 102.00 35.92 2.16 6.00Rabi [2007-08] 2/22/2008 37.32 34.91 93.60 33.23 1.68 5.10Rabi [2007-08] 2/15/2008 37.32 34.10 91.40 32.41 1.69 5.20Rabi [2007-08] 2/8/2008 37.32 21.49 57.60 21.74 -0.25 -1.10Rabi [2007-08] 2/1/2008 37.32 19.84 53.20 20.06 -0.22 -1.10Rabi [2007-08] 1/25/2008 37.32 15.84 42.40 15.98 -0.14 -0.90Rabi [2007-08] 1/18/2008 37.32 8.54 22.90 9.05 -0.51 -5.60Rabi [2007-08] 1/4/2008 37.32 4.01 10.70 3.99 0.02 0.50Rabi [2007-08] 12/28/2007 37.32 4.01 10.70 3.99 0.02 0.50Rabi [2007-08] 12/14/2007 37.32 2.52 6.80 2.58 -0.06 -2.30Rabi [2007-08] 12/7/2007 37.32 1.94 5.20 1.84 0.10 5.40Rabi [2007-08] 11/30/2007 37.32 1.47 3.90 1.53 -0.10 -3.90Rabi [2007-08] 11/23/2007 37.32 0.90 2.40 1.18 -0.30 -23.70Rabi [2007-08] 11/16/2007 37.32 0.35 0.90 0.36 0.00 -2.80Rabi [2007-08] 11/2/2007 37.32 0.18 0.50 0.06 0.10 - Kharif [2007-08] 10/19/2007 381.89 372.75 97.60 371.02 1.70 0.50Kharif [2007-08] 10/12/2007 381.89 371.73 97.30 368.89 2.80 0.80Kharif [2007-08] 10/5/2007 381.89 369.32 96.70 366.62 2.70 0.70Kharif [2007-08] 9/28/2007 381.89 365.92 95.80 364.22 1.70 0.50Kharif [2007-08] 9/21/2007 381.89 363.15 95.10 361.65 1.50 0.40Kharif [2007-08] 9/14/2007 381.89 355.73 93.10 355.16 0.60 0.20Kharif [2007-08] 9/7/2007 381.89 346.91 90.80 345.32 1.60 0.50Kharif [2007-08] 8/31/2007 381.89 337.00 88.20 334.18 2.80 0.80Kharif [2007-08] 8/24/2007 381.89 319.04 83.50 322.76 -3.70 -1.20Kharif [2007-08] 8/17/2007 381.89 278.37 72.90 281.26 -2.90 -1.00Kharif [2007-08] 8/10/2007 381.89 260.77 68.30 261.74 -1.00 -0.40Kharif [2007-08] 8/3/2007 381.89 219.89 57.60 223.03 -3.10 -1.40Kharif [2007-08] 7/20/2007 381.89 116.78 30.60 115.37 1.40 1.20Kharif [2007-08] 7/13/2007 381.89 54.40 14.20 54.96 -0.60 -1.00Kharif [2007-08] 7/6/2007 381.89 46.02 12.10 47.72 -1.70 -3.60
Source: Department of Agriculture Cooperation, GOI
Commodity Insights Yearbook 2011228
178_300_CYIB_2011_Agri_final.indd 228178_300_CYIB_2011_Agri_final.indd 228 1/26/2012 1:29:07 AM1/26/2012 1:29:07 AM

DATABANK - NON-AGRI COMMODITIES
Rice public distribution system: procurement, off-take and stocks (in million tonnes) Procurement Procurement Issue Price (Rs/qtl) Offtake Stocks underYear price paddy under PDS Grade A APL BPL AAY TPDS % (Rs/qtl) 2010-11 25.35* 1100.00 830.00 565.00 300.00 - -2009-10 32.03 1080.00 830.00 565.00 300.00 23.40 22.882008-09 34.10 1000.00 830.00 565.00 300.00 22.10 21.602007-08 28.74 850.00 830.00 565.00 300.00 22.50 13.842006-07 25.08 700.00 830.00 565.00 300.00 21.10 13.17
Note: *: Oct-Apr 2010-11; APL - Above Poverty Line; BPL - Below Poverty Line; AAY - Antodaya Anna Yojana; TPDS - Targeted Public Distribution System; PDS - Public Distribution SystemSource: Food Corporation of India; Ministry of food and public Distribution Reserve Bank of India, GOI
Rice - Marketing year wise (April - March) procurement in major producing states (in `000' tonnes)State 2010-11* 2009-10^ 2008-09 2007-08 2006-07 2001-02
Punjab 8,630 9,275 8,554 7,981 7,828 7,282Andhra Pradesh 4,140 7,555 9,058 7,597 5,327 6,425Uttar Pradesh 2,150 2,901 4,007 2,891 2,549 1,936Orissa 1,550 2,497 2,801 2,357 1,993 1,253West Bengal 810 1,240 1,744 1,429 644 48Others 7,900 8,566 7,940 6,485 6,734 5,184All-India 25,180 32,034 34,104 28,740 25,075 22,128
Note: *: Data for Oct to Apr; ^:Position as on 15.11.2010,Source: Department of Food & Public Distribution, GOI
Rice: Ending Stock & Prices
Source: Agmarknet, CME & USDA. ES - ending stock, Indian prices Rs/qntl, Int. prices cents/CWT
Prices‘000’ tonnes
25000
20000
15000
10000
5000
0
2500
2000
1500
1000
500
0
2002-03 2003-04 2005-06 2007-08 2009-102004-05 2006-07 2008-09 2010-11
India ES
World ES (in 10X)
India prices
CBOT prices
A PwC & MCX Joint Endeavour 229www.mcxindia.com / www.pwc.com/in/en
DATABANK - AGRI COMMODITIES
178_300_CYIB_2011_Agri_final.indd 229178_300_CYIB_2011_Agri_final.indd 229 1/26/2012 1:29:07 AM1/26/2012 1:29:07 AM

EDITORIALSPROLOGUE INDIAN ECONOMYEXPERTS' VIEWS
Rice state-wise monthly arrivals (in `000' tonnes)Month West Bengal Andhar Pradesh Uttar Pradesh Punjab OrissaMar-11 82.79 0.65 134.78 - 14.97Feb-11 70.82 0.67 146.32 - 16.17Jan-11 82.02 1.18 263.95 - 17.47Dec-10 92.04 9.65 288.94 13.73 197.34Nov-10 75.10 6.83 237.88 52.06 10.58Oct-10 69.08 0.62 217.59 12.26 8.51Sep-10 91.43 671.63 197.82 0.10 11.75Aug-10 95.00 1.70 210.87 - 12.24Jul-10 85.83 0.86 155.76 - 8.27Jun-10 95.29 2.76 69.27 - 9.17May-10 85.09 0.05 71.00 - 10.84Apr-10 66.60 2.47 77.47 0.11 11.05Mar-10 90.77 2.72 98.57 0.01 13.09Feb-10 87.69 3.95 84.28 0.04 13.61Jan-10 68.46 0.42 110.41 0.01 12.93Dec-09 48.96 0.28 127.75 8.88 11.72Nov-09 46.79 0.55 141.44 65.84 8.90Oct-09 50.63 6.00 96.59 19.05 11.96Sep-09 38.31 82.02 68.21 0.34 13.44Aug-09 42.03 0.00 60.47 0.22 13.40Jul-09 54.44 - 58.61 - 13.75Jun-09 48.51 0.17 49.35 - 13.09May-09 73.74 0.34 49.63 - 10.81Apr-09 78.08 0.28 55.94 0.04 17.86Mar-09 98.04 0.21 64.24 - 34.93Feb-09 65.26 0.06 67.49 0.01 23.02Jan-09 50.87 0.00 107.60 - 26.04Dec-08 75.94 0.00 126.57 1.30 18.66Nov-08 55.03 0.00 116.74 14.26 13.43Oct-08 48.93 0.02 78.60 10.64 16.19Sep-08 73.25 1.33 53.28 - 38.19Aug-08 62.61 - 47.25 - 13.68Jul-08 45.60 0.00 56.34 - 24.11Jun-08 45.06 0.00 53.46 - 13.01May-08 44.48 0.00 62.33 - 11.06Apr-08 29.45 0.00 64.70 - 12.90Mar-08 38.11 0.00 71.40 - 30.10Feb-08 38.59 0.07 97.46 - 92.83Jan-08 47.29 0.15 118.26 - 179.83Dec-07 46.51 0.21 141.91 0.04 175.99Nov-07 53.80 0.26 192.24 - 37.40Oct-07 70.05 0.11 114.81 - 13.85Sep-07 228.00 0.07 77.58 - 17.19Aug-07 256.10 0.23 126.09 - 22.80Jul-07 284.38 0.38 136.88 - 23.49Jun-07 239.93 0.12 81.72 - 19.62May-07 212.12 0.32 86.06 - 34.45Apr-07 103.07 0.48 50.08 - 33.95Mar-07 86.98 0.20 64.20 - 38.94Feb-07 55.61 0.18 68.66 - 22.62Jan-07 27.05 0.10 94.80 - 42.89Dec-06 36.80 - 101.41 - 23.43Nov-06 57.58 0.04 84.86 - 19.25Oct-06 50.45 0.14 59.94 - 8.29Sep-06 66.43 0.15 69.10 - 12.53Aug-06 99.68 1.02 73.45 - 9.59Jul-06 81.05 1.44 87.20 1.37 24.51Jun-06 68.84 0.49 188.12 - 19.52May-06 50.44 0.36 197.30 - 22.45Apr-06 41.89 0.26 169.21 - 19.21
Source: Dept. of Agriculture, GOI
Commodity Insights Yearbook 2011230
178_300_CYIB_2011_Agri_final.indd 230178_300_CYIB_2011_Agri_final.indd 230 1/26/2012 1:29:08 AM1/26/2012 1:29:08 AM

DATABANK - NON-AGRI COMMODITIES
2006-07
2007-08
2008-09
2009-10
2010-11
2011-12e
100,000 200,000 400,000300,000 500,0000
China India Indonesia Bangladesh Vietnam Others
Production
Note: e - source estimates; Source: USDA
2006-07
2007-08
2008-09
2009-10
2010-11
2011-12e
5,000 10,000 15,,000 20,000 20,000 30,000 35,0000Philippines Nigeria Iran Indonesia Iraq Other
Imports
2006-07
2007-08
2008-09
2009-10
2010-11
2011-12e
Thailand Vietnam Pakistan India United States Others
Exports
2006-07
2007-08
2008-09
2009-10
2010-11
2011-12e
China India Indonesia Bangladesh Vietnam Other
Consumption
Data of top 5 countries (`000' tonnes)
5,000 10,000 15,,000 20,000 20,000 30,000 35,0000
100,000 200,000 400,000300,000 500,0000
Note: e - source estimates; Source: USDA
Note: e - source estimates; Source: USDA
Note: e - source estimates; Source: USDA
A PwC & MCX Joint Endeavour 231www.mcxindia.com / www.pwc.com/in/en
DATABANK - AGRI COMMODITIES
178_300_CYIB_2011_Agri_final.indd 231178_300_CYIB_2011_Agri_final.indd 231 1/26/2012 1:29:08 AM1/26/2012 1:29:08 AM

EDITORIALSPROLOGUE INDIAN ECONOMYEXPERTS' VIEWS
Andhra Pradesh
Orissa Uttar Pradesh West Bengal
Month
“Rice Average
(Rs./Quintal)”
“Rice Average (Rs./Quintal)”
“Rice Average (Rs./Quintal)”
“Rice Average (Rs./Quintal)”
“Barddhaman Kalna Rice
Fine(Rs./Quintal)”
“Birbhum Sainthia Rice
Fine(Rs./Quintal)”
“Koch Bihar Dinhata Rice
Fine(Rs./Quintal)”
“Barddhaman Kalna Rice Paddy fi ne
(Rs./Quintal)”
“Di
P(R
10-Dec 2426.54 1459.79 1453.81 1969.53 1946.18 NA 2015 1248.41 10-Nov 2413.65 1804.74 1549.73 2026.13 1933.33 NA 2021.67 1282.08 10-Oct 2195.03 1972.43 1543.28 2060.86 2027.14 NA 2271 1261 10-Sep 2112.23 1789.89 1540.39 2037.77 1969.75 NA 2221.11 1264.15 10-Aug 2447.47 1723.61 1523.45 2019.63 1914.44 NA 1957.5 1231.33 10-Jul 2437.67 1544.77 1507.38 2025.56 1948.57 NA 2168.33 1225.07 10-Jun 2436.96 1730.21 1471.61 1857.28 1861 NA 2068.89 1144.2 10-May 2442.22 1650.36 1454.89 1826.68 1848.67 1850 2074.44 1122.33 10-Apr 2410.45 1646.18 1442.46 1881.82 1903.33 1845 2059.38 1186.53 10-Mar 2703.94 1585.24 1439.93 1850.94 1940.56 1795 2025.2 1264.89 10-Feb 3155.42 1581.25 1451.52 1828.07 1993.53 1755 1963.89 1285.18 10-Jan 3117.01 1534.84 1451.03 1810.08 1906.88 1750 1931 1187.69 9-Dec 3072 1497.91 1429.08 1681.8 1782.14 1722 1895 1118.79 9-Nov 3142.35 1422.32 1469.89 1598.49 1522 1522.22 1652.22 967.67 9-Oct 2223.51 1405 1453.25 1644.55 1557.06 1518.25 1997.22 944.35 9-Sep 2137.43 1342.16 1419.44 1579.8 1552.5 1475 1945.83 938.92 9-Aug 2350 1313.1 1371.47 1536.8 1498.67 1418.64 1773.75 899.47 9-Jul NA 1286.16 1368.15 1425.85 1417.86 1362.5 1859.17 884.53 9-Jun 1999 1291.56 1354.7 1438.45 1378.57 1361.67 1831 845 9-May 1976.53 1311.18 1331.23 1374.59 1377 1375 1833.57 823.6 9-Apr 2200 1336.56 1325.12 1389.85 1387 1375 1801.67 814.3 9-Mar 1507.15 1251.42 1290.97 1404.18 1385.62 1375 1744.44 803 9-Feb 1508.95 1318.12 1291.44 1400.34 1407.69 1375 1725 794 9-Jan 1241.56 1296.17 1311.21 1395.03 1398.75 1363.89 1539.29 779.06 8-Dec 2200 1308.68 1327.36 1336.36 1392.29 1295.56 1754.17 764.92 8-Nov 2100 1322.07 1410.64 1371.33 1365 1290.77 1767.5 778 8-Oct 1699.35 1362.91 1451.73 1409.4 1395 1307.5 NA 839.14 8-Sep 1400.05 1499.99 1461.76 1410.27 1399.14 1333.33 1841.88 780.87 8-Aug NA 1381.88 1460.16 1394.66 1402.76 1336.25 1823.57 885.8 8-Jul 1800 1338.07 1383.81 1404.16 1392.86 1365 1784 728.44 8-Jun 1110 1276.78 1379.28 1362.99 1285.36 1308 1687.5 691.44 8-May 1592.5 1251.91 1352.39 1376.11 1358.33 1318.46 1673.12 762.5 8-Apr 1555 1263.81 1357.21 1441.55 1371.84 1355.71 1672.86 839.32 8-Mar 1110 1223.43 1273.89 1463.2 1390.67 1409.17 1668.75 878.93 8-Feb 1425.48 1213.56 1220.19 1462.7 1398.33 1401.67 1644.5 922.25 8-Jan 1426.68 1189.96 1173.22 1401.06 1407.78 1351.43 1621.92 919.06 7-Dec 1602.74 1073.84 1132.17 1347.49 1366.36 1305 1521.88 885.78 7-Nov 1633.04 1069.47 1070.98 1308.01 1372.14 1271.43 1436.88 886.28 7-Oct 1663.97 1016.44 1213.08 1316.74 1343.57 1285 1579 876.5 7-Sep 1201.72 1043.42 1211.94 1301.82 1340.95 1292 1581.67 863.14 7-Aug 1593.09 1053.26 1215.6 1231.67 1329.47 1210 1500.5 802.69 7-Jul 1449.9 1039.4 1196.52 1186.71 1276.94 1174.55 1402.14 766.5 7-Jun 1484.69 1009.3 1146.97 1168.75 1232.39 1157.78 1373.18 742.54 7-May 1478.21 975.47 1075.91 1241.03 1366.39 NA 1420 NA 7-Apr 1491.94 981.25 1105.5 1258.71 1411.11 1232.5 1455 881.4 7-Mar 1459.1 971.4 1153.1 1247.52 1377.86 1190 1439 857.29 7-Feb 1733.24 985.83 1131.95 1216.49 1340.42 1136.67 1362.67 794.73 7-Jan 1415 1027.16 1104.82 1233.6 1302.35 1087.5 1358 750.25 6-Dec NA 1039.79 1088.76 1207.38 1243.75 1055 1326.25 750.83 6-Nov 1057.87 1027.21 1113.38 1190.66 1194 1127.5 1351.47 738.83 6-Oct 1050.15 983.97 1112.02 1183.04 1197.5 1129.43 1365.83 736 6-Sep 1195.27 1030.61 1057.7 1153.43 1192.08 1094.44 1363.57 697.08 6-Aug 1372.6 977.3 1061.49 1122.57 1151.38 1060.71 1345.91 683.47 6-Jul 1367.98 967.53 1090.22 1125.72 1114.24 1042.5 1320.91 668 6-Jun 1388 984.91 1071.81 1109.34 1072.05 1047.69 1253.64 654.92 6-May 1383.05 991.49 1084.65 1148.51 1158.64 1062.73 1235.45 695.69 6-Apr 1366.56 992.12 1053.3 1168.76 1152.27 1065 1253.75 698.78
Note: N/A-Not available; ^ Aggregate volume in all contracts during the month; ^^ Cumulative open interest in all contracts at the end of month; Future prices are for near month continuos
Rice prices and trading activity
Commodity Insights Yearbook 2011232
178_300_CYIB_2011_Agri_final.indd 232178_300_CYIB_2011_Agri_final.indd 232 1/26/2012 1:29:08 AM1/26/2012 1:29:08 AM

DATABANK - NON-AGRI COMMODITIES
WPI of Rice (Base Year =
2004-05)
Thailand Vietnam Rice CBOT trading activity
man e e
al)”
“Koch Bihar Dinhata Rice
Paddy fi ne(Rs./Quintal)”
Rice 5% broken FOB Bangkok ($/
mt)
Rice 25% broken FOB Bangkok ($/
mt)
Rice A.1 Super FOB Bangkok
($/mt)
Rice 5% broken FOB
Hanoi ($/mt)
Futures closing price (US cents per
CWT)
Volume (in lots)^
Open interest (in
lots)^^
1097.78 171.1 532 479.8 413.4 528.29 14 46527 188581166.43 170.3 514.5 477.5 427.75 508.03 13.88 35869 17447
1343 168.7 486 457 428.25 477.68 14.43 63797 190791367.78 166.6 476.5 448 412 454.96 12.57 27028 17542
1327.5 164.4 452.75 412 369 422.86 11.09 50454 183801311.67 165.9 441.8 395.6 349.8 355.36 10.56 30201 172861236.11 164.3 440 392 329.5 358.22 9.43 42003 140531263.33 163.5 451.33 396.67 329 368.82 11.64 20088 154251241.25 163.5 466 408.67 343 371.17 12.36 40618 161431208.12 163.3 502.2 445.6 377 392.57 12.22 28025 169941162.22 164.1 535 474.67 405 421.79 13.43 42590 15452
1137 164.7 568.8 510.6 420.2 485.28 14.2 22279 149651100 164.5 591 515.25 403 NA 14.57 47972 15828
1000.56 162.6 542.75 460.25 337 NA 15.31 28406 163231091.25 160.2 493 412.8 298.4 NA 14.36 35917 137261163.57 157.6 518.75 428 303.25 NA 13.32 17685 11047
1132.5 153.1 526.25 432.75 305.5 NA 13.86 30889 108491057.5 151.4 572 463.5 320.25 NA 13.77 16453 9054
996.25 151.8 574.5 476 320.75 NA 12.23 19058 80121000.71 151 533 454 322.4 NA 12.35 14646 89901005.83 150.9 549.67 446 335.67 NA 12.9 18200 79781124.38 151.1 588.25 471.5 332 NA 12.41 13786 6863
1030 149.3 590.75 472.75 319.5 NA 12.37 18971 66031117.86 147 580 464 318.6 NA 11.77 15255 7310
1088.33 146.3 531.8 422 287 NA 15.34 15970 63721112.5 146.3 552 440.25 307 NA 13.21 12744 6712
NA 145 609.25 487.5 348.25 NA 15.05 28356 71591121.25 135.7 683.8 651 420.4 NA 18.9 19696 8977
1165 134.9 693.5 657.5 468.75 NA 18.9 23016 112451070 133.9 731.75 700 546.5 NA 16.58 19045 13202
1017.5 132.6 757 NA 591 NA 20.21 30675 148641018.33 132.7 901.8 NA 727.4 NA 19.1 37426 186391010.71 132.6 907 NA 762.67 NA 21.48 64043 21315
1035.56 130.9 594 NA 537.6 NA 19.69 31703 21388995 128.8 464.75 NA 432.75 NA 18 54928 20129
985.5 127.3 375.6 364.4 358 NA 14.82 24946 18674882.5 124.8 360.67 347.33 331.67 NA 13.55 39885 18015
883.75 125.4 342 327.75 311.25 NA 12.87 24666 19553956 126.1 329.2 313.4 293.2 NA 11.85 51487 17529
963.33 120.6 325 306.25 272.25 NA 11.73 18939 16184890.56 119.3 327.5 306.5 264.5 NA 10.85 26610 14153826.67 117.8 328.8 306.8 260.4 NA 10.43 19925 15833771.43 116.6 323.25 300.5 257 NA 10.39 32362 14835
NA 116.2 317.6 295.8 255.4 NA 10.21 20389 15552837.5 115.7 316.5 296 258.5 NA 9.95 26256 15310817.5 114.5 318.67 299.33 262.33 NA 10.08 28699 15866
756.11 113.9 315 291.75 257.5 NA 10.22 37463 17223765.22 113.3 313 286.6 243.8 NA 10.11 31570 17020738.33 111.9 305 280.25 228.25 NA 10.13 26007 14672741.25 112 296.25 273.25 220.75 NA 9.98 20839 14923
810 111.7 301 274.75 223.5 NA 9.49 29524 14422840 108.9 309.2 282.8 224.4 NA 9.67 23944 14014
800.22 107.8 312.67 284.33 220 NA 8.49 40275 14764769.5 107.3 315.4 286.6 218.6 NA 9.21 18704 14241732.5 107 312.5 280.5 216.5 NA 9.2 33268 13223
716.88 106.4 308 276 219.4 NA 9.12 27598 15417748.33 105.6 302.25 271.5 218.5 NA 8.22 20314 10374
futures contract. Source: World Bank, Agmarknet, CBOT
A PwC & MCX Joint Endeavour 233www.mcxindia.com / www.pwc.com/in/en
DATABANK - AGRI COMMODITIES
178_300_CYIB_2011_Agri_final.indd 233178_300_CYIB_2011_Agri_final.indd 233 1/26/2012 1:29:09 AM1/26/2012 1:29:09 AM

EDITORIALSPROLOGUE INDIAN ECONOMYEXPERTS' VIEWS
Wheat fundamentals - World and India (in `000' tonnes) 2011-12e 2010-11 2009-10 2008-09 2007-08 2006-07 2001-02
World
Beginning stocks 1,89,970 1,98,293 1,66,539 1,25,986 1,31,167 1,51,043 2,07,752 Production 6,62,418 6,48,242 6,84,251 6,82,790 6,12,095 5,96,253 5,83,555 Imports 1,26,352 1,27,203 1,33,577 1,36,949 1,13,378 1,13,919 1,06,163 Consumption 6,66,516 6,55,837 6,50,228 6,35,677 6,13,405 6,18,231 5,87,057 Exports 1,30,037 1,27,931 1,35,846 1,43,509 1,17,249 1,11,817 1,05,915 Total Supply 9,78,740 9,73,738 9,84,367 9,45,725 8,56,640 8,61,215 8,97,470 Ending Stocks 1,82,187 1,89,970 1,98,293 1,66,539 1,25,986 1,31,167 2,04,498 Area Harvested (1000 Ha) 2,23,560 2,22,381 2,27,312 2,25,262 2,18,196 2,13,045 2,15,429 Yield (MT/Ha) 2.96 2.92 3.01 3.03 2.81 2.80 2.71
India
Beginning stocks 14,445 16,120 13,430 5,800 4,500 2,000 21,500Production 84,000 80,800 80,680 78,570 75,810 69,350 69,680Imports 300 300 218 7 1,962 6,721 32Consumption 84,700 82,525 78,150 70,924 76,423 73,477 65,125Exports 300 250 58 23 49 94 3,087Total Supply 98,745 97,220 94,328 84,377 82,272 78,071 91,212Ending Stocks 13,745 14,445 16,120 13,430 5,800 4,500 23,000Area Harvested (1000 Ha) 29,400 28,360 27,750 28,150 28,000 26,400 25,700Yield (MT/Ha) 2.86 2.85 2.91 2.79 2.71 2.63 2.71 Average Daily volatility of MCX Spot Prices - 0.62% 1.86% - - 0.98% -CBOT price* (Rs./qtl) - 1262.2 753.2 1005.3 1375.3 707.1 515.1Indian Price (Rs. /qtl) Delhi Mkt - 1275.4 1227.2 1130.4 1040.4 983.0 -MSP (Rs. /qtl) 1180 1120$ 1100 1080 1000 750$$ 620
Note: e - source estimates provided by USDA, $:- An additional incentive bonus of Rs. 50 per quintal was payable over the Minimum Support Price (MSP). $$:- An additional incen-tive bonus of Rs. 100 per quintal is payable over the Minimum Support Price (MSP); Market Year (India): April to March; Trading suspended from Feb 28, 2007 till May 21, 2009. Data retrived on July 27, 2011Source: USDA, AgmarkNet, Ministry of Agriculture, GOI
Wheat balance sheet 2011-12e - World (in `000' tonnes) Supply DemandCountry Begining Production Imports Consumption Exports Ending stocks stocks
EU-27 11,672 132,124 7,500 124,000 15,000 12,296China 60,105 115,500 1,000 111,000 1,000 64,605India 14,445 84,000 300 84,700 300 13,745United States 23,427 57,319 2,722 33,925 31,298 18,245Russia 11,429 53,000 200 41,500 12,000 11,129Australia 4,157 25,000 100 8,000 17,000 4,257Canada 6,196 21,500 400 7,300 16,000 4,796Others 58,539 173,975 114,130 256,091 37,439 53,114World Total 189,970 662,418 126,352 666,516 130,037 182,187
Note: e - source estimates provided by USDA, Data retrieved on July 27, 2011 Source: USDA
Commodity Insights Yearbook 2011234
178_300_CYIB_2011_Agri_final.indd 234178_300_CYIB_2011_Agri_final.indd 234 1/26/2012 1:29:09 AM1/26/2012 1:29:09 AM

DATABANK - NON-AGRI COMMODITIES
Wheat - BRICS Nations fact sheet (in `000' tonnes) Production Import Export Consumption Net Population Per capita Per capita availability (in million) availability consumption (kg) (kg)
Brazil 4,800 6,700 500 10,800 12,317 206.47 59.66 52.31 Russia 53,000 200 12,000 41,500 64,629 137.97 468.41 300.782011-12e India 84,000 300 300 84,700 98,745 1,208.36 81.72 70.09 China 115,500 1,000 1,000 111,000 176,605 1,341.85 131.61 82.72 South Africa 1,700 1,400 200 2,990 3,576 49.83 71.77 60.01 Brazil 5,900 6,700 2,500 10,800 14,117 203.43 69.39 53.09 Russia 41,508 100 4,000 39,800 55,229 138.74 398.08 286.872010-11 India 80,800 300 250 82,525 97,220 1,189.17 81.75 69.40 China 115,180 1,000 1,000 109,500 170,605 1,336.72 127.63 81.92 South Africa 1,465 1,600 350 3,000 3,826 49.00 78.08 61.22 Brazil 5,026 7,126 1,162 11,000 13,679 201.10 68.02 54.70 Russia 61,770 164 18,556 40,500 72,677 139.39 521.39 290.552009-10 India 80,680 218 58 78,150 94,328 1,173.11 80.47 66.62 China 115,120 1,394 892 107,000 162,317 1,330.14 121.95 80.44 South Africa 1,960 1,396 373 3,000 4,134 49.11 84.18 61.09 Brazil 5,880 6,403 400 10,700 12,627 198.74 63.54 53.84 Russia 63,765 203 18,393 38,900 68,036 140.04 485.83 277.782008-09 India 78,570 7 23 70,924 84,377 1,166.08 72.36 60.82 China 112,464 481 723 105,500 152,026 1,338.61 113.49 78.81 South Africa 2,130 1,402 376 3,000 4,154 49.05 84.68 61.16 Brazil 3,825 6,772 770 10,300 11,414 196.34 58.13 52.46 Russia 49,368 440 12,220 37,650 53,938 140.70 383.35 267.592007-08 India 75,810 1,962 49 76,423 82,272 1,148.00 71.67 66.57 China 109,298 49 2,835 106,000 147,916 1,330.04 111.13 79.70 South Africa 1,905 1,484 343 2,860 3,825 48.78 78.41 58.63 Brazil 2,234 7,997 4 10,300 11,121 190.01 58.53 54.21 Russia 44,927 928 10,790 36,400 51,320 141.38 363.00 257.472006-07 India 69,350 6,721 94 73,477 78,071 1,129.87 69.10 65.03 China 108,466 388 2,783 102,000 143,241 1,321.85 108.36 77.16 South Africa 2,105 866 317 2,810 3,563 44.00 80.98 63.87
Note: e - source estimates provided by USDA, Data retrieved on July 27, 2011, Population fi gures for 2011-12 is arrived at by calculating CAGR from 2004-05 to 2010-11; Source: USDA, World Bank, IFM, CIA World Fact Book
Wheat state-wise area and production Area (`000' Hectares) Production ( `000' Tonnes)States/ UT 2009-10* 2008-09 2007-08 2006-07 2001-02 2009-10 2008-09 2007-08 2006-07 2001-02Uttar Pradesh 9668 9513 9115 9198 9256 27810 28554 25679 25031 25498Punjab 3522 3526 3488 3467 3420 15263 15733 15720 14596 15499Haryana 2492 2462 2462 2376 2300 10500 10808 10236 10055 9437Rajasthan 2394 2295 2592 2565 2288 6828 7287 7125 7056 6389Madhya Pradesh 4276 3785 3742 3993 3704 7846 6522 6033 7326 6001Bihar 2193 2158 2163 2050 2126 4623 4410 4450 3911 4391Gujarat 878 1091 1274 1201 470 2648 2593 3838 3000 1145Maharashtra 1081 1022 1253 1231 776 1757 1516 2079 1631 1077Others 1953 1900 1950 1915 2005 3434 3256 3411 3201 3329All India 28457 27752 28039 27995 26345 80710 80679 78570 75807 72766
Note: * : 4th advance estimates released on 19.07.2010.Source: Dept. of Agriculture, GOI and various lok sabha questions
A PwC & MCX Joint Endeavour 235www.mcxindia.com / www.pwc.com/in/en
DATABANK - AGRI COMMODITIES
178_300_CYIB_2011_Agri_final.indd 235178_300_CYIB_2011_Agri_final.indd 235 1/26/2012 1:29:09 AM1/26/2012 1:29:09 AM

EDITORIALSPROLOGUE INDIAN ECONOMYEXPERTS' VIEWS
Wheat - All India sowing progress during rabi (in lakh ha)Date Average area Area Sown reported Change vis-a vis prev year in rabi As on date % of average Same period Absolute % last year
25-Feb-11 273.30 292.83 107.10 283.60 9.20 3.2018-Feb-11 273.30 292.83 107.10 283.60 9.20 3.204-Feb-11 273.30 291.80 106.80 283.24 8.60 3.0028-Jan-11 273.30 291.36 106.60 282.41 8.90 3.2021-Jan-11 273.30 290.59 106.30 281.23 9.40 3.3014-Jan-11 273.30 288.43 105.50 279.12 9.30 3.3024-Dec-10 273.30 264.13 96.60 253.05 11.10 4.4010-Dec-10 273.30 207.11 75.80 212.90 -5.80 -2.7026-Nov-10 273.30 123.89 45.30 148.20 -24.30 -16.40 9-Apr-10 270.99 286.84 105.80 278.77 8.10 2.9026-Mar-10 270.99 278.17 102.60 275.89 2.30 0.8012-Mar-10 270.99 278.16 102.60 275.89 2.30 0.805-Mar-10 270.99 278.17 102.60 275.89 2.30 0.8026-Feb-10 270.99 278.17 102.60 275.89 2.30 0.8012-Feb-10 270.99 277.81 102.50 275.89 1.90 0.705-Feb-10 270.99 277.58 102.40 275.87 1.70 0.6015-Jan-10 270.99 274.91 101.40 274.82 0.10 0.008-Jan-10 270.99 268.50 99.10 272.54 -4.00 -1.508-Jan-10 265.30 269.70 101.70 265.76 3.90 1.5018-Dec-09 270.99 231.32 85.40 226.01 5.30 2.3011-Dec-09 270.99 217.28 80.20 216.02 1.30 0.60 20-Feb-09 265.30 277.98 104.80 280.73 -2.80 -1.0013-Feb-09 265.30 277.20 104.50 279.79 -2.60 -0.906-Feb-09 265.30 275.61 103.90 273.90 1.70 0.6030-Jan-09 265.30 275.61 103.90 273.90 1.70 0.6023-Jan-09 265.30 275.50 103.80 273.63 1.90 0.7016-Jan-09 265.30 274.05 103.30 272.44 1.60 0.609-Jan-09 265.30 269.70 101.70 265.76 3.90 1.502-Jan-09 265.30 262.66 99.00 262.14 0.50 0.2026-Dec-08 265.30 250.43 94.40 244.34 6.10 2.5019-Dec-08 265.30 229.58 86.50 229.79 -0.20 -0.1012-Dec-08 265.30 213.60 80.50 204.70 8.90 4.305-Dec-08 265.30 173.70 65.50 154.27 19.40 12.6028-Nov-08 265.30 118.03 44.50 114.20 3.90 3.4021-Nov-08 265.30 83.78 31.60 84.99 -1.20 -1.4014-Nov-08 265.30 26.90 10.10 21.92 5.00 22.707-Nov-08 265.30 22.67 8.50 21.01 1.70 7.90 15-Feb-08 262.00 277.31 105.80 282.14 -4.83 -1.701-Feb-08 262.00 275.67 105.20 280.63 -4.96 -1.8025-Jan-08 262.00 274.92 104.90 280.63 -5.71 -2.004-Jan-08 262.00 266.16 101.60 274.65 -8.49 -3.1028-Dec-07 262.00 249.40 95.20 26.10 -1.97 -5.307-Dec-07 262.00 174.82 66.70 213.74 -38.90 -18.2016-Nov-07 262.00 145.59 55.60 180.17 -34.60 -19.20
Source: Department of Agriculture Cooperation, GOI
Commodity Insights Yearbook 2011236
178_300_CYIB_2011_Agri_final.indd 236178_300_CYIB_2011_Agri_final.indd 236 1/26/2012 1:29:10 AM1/26/2012 1:29:10 AM
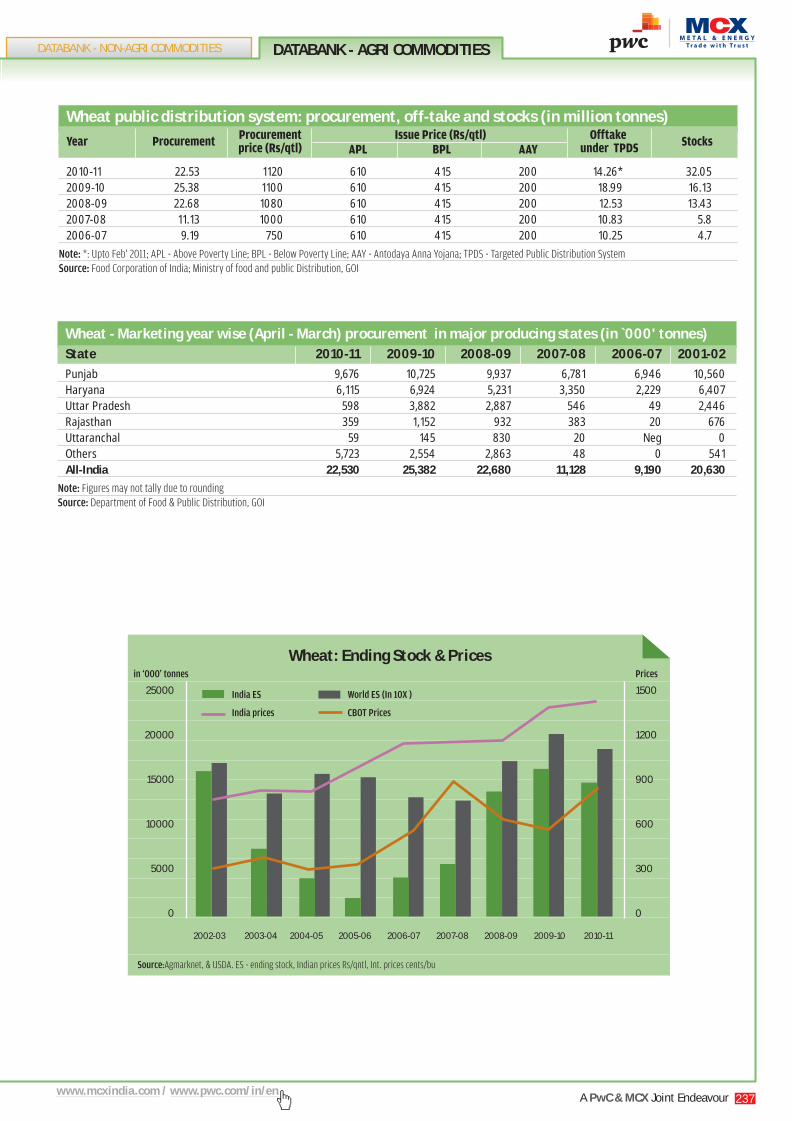
DATABANK - NON-AGRI COMMODITIES
Wheat public distribution system: procurement, off-take and stocks (in million tonnes)
Year Procurement Procurement Issue Price (Rs/qtl) Offtake Stocks price (Rs/qtl) APL BPL AAY under TPDS
2010-11 22.53 1120 610 415 200 14.26* 32.052009-10 25.38 1100 610 415 200 18.99 16.132008-09 22.68 1080 610 415 200 12.53 13.432007-08 11.13 1000 610 415 200 10.83 5.82006-07 9.19 750 610 415 200 10.25 4.7
Note: *: Upto Feb' 2011; APL - Above Poverty Line; BPL - Below Poverty Line; AAY - Antodaya Anna Yojana; TPDS - Targeted Public Distribution System Source: Food Corporation of India; Ministry of food and public Distribution, GOI
Wheat - Marketing year wise (April - March) procurement in major producing states (in `000' tonnes)State 2010-11 2009-10 2008-09 2007-08 2006-07 2001-02
Punjab 9,676 10,725 9,937 6,781 6,946 10,560Haryana 6,115 6,924 5,231 3,350 2,229 6,407Uttar Pradesh 598 3,882 2,887 546 49 2,446Rajasthan 359 1,152 932 383 20 676Uttaranchal 59 145 830 20 Neg 0Others 5,723 2,554 2,863 48 0 541All-India 22,530 25,382 22,680 11,128 9,190 20,630
Note: Figures may not tally due to roundingSource: Department of Food & Public Distribution, GOI
Wheat: Ending Stock & Prices
Source:Agmarknet, & USDA. ES - ending stock, Indian prices Rs/qntl, Int. prices cents/bu
in ‘000’ tonnes Prices
25000
20000
15000
10000
5000
0
1500
1200
900
600
300
0
2005-06 2007-08 2009-102004-05 2006-07 2008-09 2010-11
India ES World ES (In 10X )
India prices CBOT Prices
2003-042002-03
A PwC & MCX Joint Endeavour 237www.mcxindia.com / www.pwc.com/in/en
DATABANK - AGRI COMMODITIES
178_300_CYIB_2011_Agri_final.indd 237178_300_CYIB_2011_Agri_final.indd 237 1/26/2012 1:29:10 AM1/26/2012 1:29:10 AM

EDITORIALSPROLOGUE INDIAN ECONOMYEXPERTS' VIEWS
Wheat state-wise monthly arrivals (in `000' tonnes)Month Rajasthan Madhya Gujarat Uttar Punjab Haryana Bihar Pradesh Pradesh
Apr-11 714.4 1335.4 445.5 571.7 5432.7 5013.6 -Mar-11 65.6 554.6 176.1 229.6 71.6 1.3 -Feb-11 31.3 189.7 39.8 173.6 67.5 1.6 -Jan-11 33.6 198.4 52.2 310.2 0.6 3.2 -Dec-10 46.4 289.1 71.1 286.8 202.9 5.0 -Nov-10 44.9 233.1 56.3 245.2 73.7 2.3 -Oct-10 80.9 192.1 62.1 310.5 276.0 2.7 -Sep-10 88.3 179.1 44.8 340.8 1286.8 1.0 -Aug-10 68.0 147.7 51.8 334.8 1631.9 1.4 -Jul-10 77.4 145.8 42.3 319.7 1755.2 2.6 -Jun-10 142.7 259.1 102.8 391.8 1818.2 3.1 -May-10 369.4 667.0 129.3 769.3 2766.0 307.4 -Apr-10 904.9 1602.0 401.8 857.0 8855.9 8245.6 -Mar-10 82.8 843.1 192.4 145.2 1.9 1.6 -Feb-10 17.7 229.2 77.3 130.3 0.4 0.5 -Jan-10 18.2 122.3 36.4 126.0 0.2 1.3 -Dec-09 24.4 156.8 62.2 156.5 177.2 0.5 -Nov-09 36.0 179.0 82.7 156.1 682.8 0.6 -Oct-09 48.4 187.2 50.4 164.6 166.8 2.3 -Sep-09 46.0 220.0 62.9 178.2 5.9 1.9 -Aug-09 55.5 132.0 50.5 192.9 2.9 1.6 -Jul-09 52.7 88.6 54.9 237.3 0.6 57.7 -Jun-09 102.0 119.5 81.0 327.5 243.1 117.0 -May-09 415.5 441.8 141.9 482.9 3300.6 1193.2 -Apr-09 702.7 928.0 269.8 446.9 8603.0 364.8 -Mar-09 46.3 120.1 196.3 130.2 1.8 0.1 -Feb-09 26.7 73.1 78.7 113.1 1.8 2.2 -Jan-09 35.8 90.9 64.5 340.5 615.0 0.4 -Dec-08 56.6 81.0 74.7 126.5 1.0 0.6 -Nov-08 41.9 72.5 88.4 123.7 1.4 17.8 0.0Oct-08 53.7 66.2 64.3 125.4 30.8 6.7 -Sep-08 64.2 54.2 87.4 150.8 3.3 1.2 0.1Aug-08 59.7 81.2 52.9 115.9 15.2 6.2 0.1Jul-08 87.6 103.0 76.1 188.8 10.0 1.1 1.0Jun-08 150.1 101.7 153.1 367.3 13.7 11.1 4.3May-08 710.9 232.4 387.6 795.1 481.5 4702.7 13.0Apr-08 640.0 218.0 343.2 381.2 4341.4 899.0 2.6Mar-08 52.3 72.1 86.2 119.0 1.0 1.0 0.2Feb-08 41.3 79.5 36.0 119.6 1.6 0.4 0.2Jan-08 46.5 67.5 37.7 126.5 1.5 3.0 0.5Dec-07 34.0 65.0 37.1 113.5 1.5 1.1 0.5Nov-07 32.2 40.8 34.6 111.0 1.5 0.7 0.5Oct-07 42.2 50.6 37.5 122.2 5.4 2.1 0.1Sep-07 42.4 63.7 38.7 136.5 5.7 1.9 0.1Aug-07 40.6 75.8 45.2 155.6 8.3 2.3 0.6Jul-07 45.7 83.1 40.4 106.3 5.2 1.3 0.5Jun-07 74.9 117.9 46.1 196.0 49.5 16.1 0.3May-07 303.8 238.1 87.4 400.6 599.1 542.9 -Apr-07 297.3 302.8 192.8 265.3 2911.0 2266.1 0.1Mar-07 73.7 215.3 155.4 106.0 4.1 1.6 4.0Feb-07 10.5 84.4 101.2 90.2 0.5 0.5 3.9Jan-07 14.4 69.9 37.2 111.5 1.0 1.3 3.8Dec-06 13.3 59.0 37.5 91.0 1.0 0.3 -Nov-06 22.0 77.8 73.8 105.6 1.4 1.8 0.5Oct-06 16.9 62.1 50.1 452.5 30.8 2.8 0.1Sep-06 38.1 108.1 59.9 133.3 3.3 2.2 0.7Aug-06 23.8 96.9 28.8 1164.3 15.2 2.6 2.9Jul-06 20.0 88.7 27.3 135.1 10.0 3.9 4.2Jun-06 42.9 160.0 26.6 733.1 13.7 15.3 4.8May-06 413.0 319.3 89.5 690.5 481.5 129.6 4.6Apr-06 350.4 455.9 300.6 449.4 4341.4 2003.5 8.4
Source: Dept. of Agriculture, GOI
Commodity Insights Yearbook 2011238
178_300_CYIB_2011_Agri_final.indd 238178_300_CYIB_2011_Agri_final.indd 238 1/26/2012 1:29:10 AM1/26/2012 1:29:10 AM

DATABANK - NON-AGRI COMMODITIES
2006-07
2007-08
2008-09
2009-10
2010-11
2011-12e
100,000 200,000 400,000300,000 700,000500,000
0 50,000 150,000100,000
600,000
EU-27 China India United States Russia Others
Production
Note: e - source estimates; Source: USDA
2006-07
2007-08
2008-09
2009-10
2010-11
2011-12e
Egypt Brazil Indonesia Japan Algeria Other
Imports
Note: e - source estimates; Source: USDA
2006-07
2007-08
2008-09
2009-10
2010-11
2011-12e
United States EU-27 Canada Australia Argentina Other
Exports
Note: e - source estimates; Source: USDA
2006-07
2007-08
2008-09
2009-10
2010-11
2011-12e
EU-27 China India Russia United States Other
Consumption
Note: e - source estimates; Source: USDA
Data of top 5 countries (`000' tonnes)
0 50,000 150,000100,000
0 200,000 400,000 800,000600,000
A PwC & MCX Joint Endeavour 239www.mcxindia.com / www.pwc.com/in/en
DATABANK - AGRI COMMODITIES
178_300_CYIB_2011_Agri_final.indd 239178_300_CYIB_2011_Agri_final.indd 239 1/26/2012 1:29:11 AM1/26/2012 1:29:11 AM

EDITORIALSPROLOGUE INDIAN ECONOMYEXPERTS' VIEWS
Wheat prices and trading activity MCX Futures prices (Rs/qtl) MCX Spot prices - Delhi (Rs/qtl) Month Open High Low Close Volume in Open Monthly Month's Month's lots^ interest average high low in lots^^
Dec-10 1,321 1,334 1,305 1,332 0 0 1,322 1,334 1,305 Nov-10 1,278 1,342 1,271 1,322 0 0 1,306 1,342 1,272 Oct-10 1,266 1,301 1,266 1,281 0 0 1,285 1,301 1,266 Sep-10 1,243 1,268 1,234 1,261 0 0 1,255 1,268 1,234 Aug-10 1,251 1,256 1,245 1,245 6 0 1,252 1,256 1,245 Jul-10 1,249 1,260 1,243 1,246 28 3 1,253 1,260 1,243 Jun-10 1,252 1,286 1,235 1,235 48 9 1,271 1,286 1,235 May-10 1,166 1,254 1,158 1,254 182 12 1,196 1,254 1,158 Apr-10 1,167 1,188 1,138 1,175 357 77 1,158 1,187 1,138 Mar-10 1,325 1,325 1,183 1,183 1,629 85 1,254 1,356 1,183 Feb-10 1,402 1,419 1,356 1,356 754 140 1,390 1,419 1,356 Jan-10 1,421 1,488 1,390 1,395 1,672 98 1,433 1,488 1,390 Dec-09 1,421 1,480 1,402 1,416 2,920 214 1,439 1,480 1,402 Nov-09 1,443 1,456 1,393 1,421 6,951 426 1,423 1,456 1,395 Oct-09 1,218 1,435 1,215 1,435 14,111 683 1,304 1,435 1,216 Sep-09 1,150 1,228 1,149 1,215 9,703 265 1,206 1,228 1,151 Aug-09 1,097 1,161 1,090 1,149 12,157 601 1,137 1,161 1,090 Jul-09 1,058 1,111 1,052 1,092 15,758 496 1,086 1,111 1,052 Jun-09 1,060 1,060 1,045 1,056 13,198 1,011 1,053 1,060 1,045 May-09 1,105 1,114 1,057 1,071 N/T N/T N/T N/T N/T Apr-09 N/T N/T N/T N/T N/T N/T N/T N/T N/T Mar-09 N/T N/T N/T N/T N/T N/T N/T N/T N/T Feb-09 N/T N/T N/T N/T N/T N/T N/T N/T N/T Jan-09 N/T N/T N/T N/T N/T N/T N/T N/T N/T Dec-08 N/T N/T N/T N/T N/T N/T N/T N/T N/T Nov-08 N/T N/T N/T N/T N/T N/T N/T N/T N/T Oct-08 N/T N/T N/T N/T N/T N/T N/T N/T N/T Sep-08 N/T N/T N/T N/T N/T N/T N/T N/T N/T Aug-08 N/T N/T N/T N/T N/T N/T N/T N/T N/T Jul-08 N/T N/T N/T N/T N/T N/T N/T N/T N/T Jun-08 N/T N/T N/T N/T N/T N/T N/T N/T N/T May-08 N/T N/T N/T N/T N/T N/T N/T N/T N/T Apr-08 N/T N/T N/T N/T N/T N/T N/T N/T N/T Mar-08 N/T N/T N/T N/T N/T N/T N/T N/T N/T Feb-08 N/T N/T N/T N/T N/T N/T N/T N/T N/T Jan-08 N/T N/T N/T N/T N/T N/T N/T N/T N/T Dec-07 N/T N/T N/T N/T N/T N/T N/T N/T N/T Nov-07 N/T N/T N/T N/T N/T N/T N/T N/T N/T Oct-07 N/T N/T N/T N/T N/T N/T N/T N/T N/T Sep-07 N/T N/T N/T N/T N/T N/T N/T N/T N/T Aug-07 N/T N/T N/T N/T N/T N/T N/T N/T N/T Jul-07 N/T N/T N/T N/T N/T N/T N/T N/T N/T Jun-07 N/T N/T N/T N/T N/T N/T N/T N/T N/T May-07 N/T N/T N/T N/T N/T N/T N/T N/T N/T Apr-07 N/T N/T N/T N/T N/T N/T N/T N/T N/T Mar-07 N/T N/T N/T N/T N/T N/T N/T N/T N/T Feb-07 1,040 1,101 1,038 1,039 329 - 1,068 1,098 1,039 Jan-07 1,099 1,101 1,011 1,023 8 - 1,080 1,101 1,014 Dec-06 1,113 1,135 1,075 1,083 104 - 1,107 1,135 1,075 Nov-06 1,105 1,164 1,105 1,130 2 4 1,133 1,164 1,107 Oct-06 1,003 1,109 1,002 1,105 303 9 1,040 1,109 1,002 Sep-06 991 1,009 981 997 194 56 998 1,009 981 Aug-06 895 1,008 885 992 1,278 199 949 1,008 885 Jul-06 861 893 861 893 2,507 1,026 873 893 861 Jun-06 856 869 839 862 5,406 1,520 860 869 839 May-06 823 873 823 860 12,670 1,835 853 873 823 Apr-06 813 849 755 824 18,778 1,990 796 848 755
Note: Trading suspended from Feb 28, 2007 till May 21, 2009; N/T-Not traded, N/A-Not available; WPI - Wholesale Price Index; ^Aggregate volume in all contracts during the month; Source: Agmarknet, Ministry of Commerce and Industry; Exchanges' websites
Commodity Insights Yearbook 2011240
178_300_CYIB_2011_Agri_final.indd 240178_300_CYIB_2011_Agri_final.indd 240 1/26/2012 1:29:11 AM1/26/2012 1:29:11 AM

DATABANK - NON-AGRI COMMODITIES
Major markets spot prices (Rs/qtl) WPI of Wheat CBOT trading activitys Whea Futures Open
Delhi Khanna Karnal Shahjahanpur closing price Volume interest (US cents per (in lots)^ in lots^^ bushel)
1,304 1,343 1,375 1,309 173 794 1,402,949 491,5351,282 1,359 1,353 1,278 173 650 2,355,425 459,4211,266 1,330 1,351 1,283 168 717 1,527,845 531,3201,233 1,325 1,359 1,240 172 674 1,501,613 500,3601,233 1,325 1,366 1,233 173 653 3,386,788 469,2221,231 1,318 1,348 1,233 168 662 2,394,908 508,1931,243 1,255 1,251 1,242 169 465 2,547,457 456,9531,163 1,232 1,212 1,179 168 458 1,392,393 500,8071,117 1,229 1,220 1,096 169 492 2,024,980 447,458
1,234 1,272 1,317 1,259 173 451 1,289,960 450,3571,365 1,432 1,385 1,410 179 507 1,936,477 417,5881,396 1,486 1,396 1,416 182 474 1,297,988 414,8911,415 1,433 1,395 1,389 181 542 904,437 362,3411,401 1,463 1,390 1,369 174 568 1,952,629 350,7061,269 1,289 1,196 1,256 163 494 1,451,439 339,0831,183 1,193 1,133 1,183 159 458 1,040,296 333,3141,134 1,182 1,130 1,152 157 471 1,926,485 308,6861,083 N/A 1,139 1,083 158 528 1,295,811 324,4411,054 1,202 1,152 1,052 158 511 2,351,042 312,8501,088 1,204 1,182 1,066 158 637 1,296,532 333,7571,105 1,199 1,180 1,037 156 524 1,736,079 288,7551,183 1,163 1,123 1,168 151 533 1,213,933 313,8911,212 1,174 1,125 1,226 152 511 1,505,806 281,0661,186 1,150 1,118 1,178 151 568 986,983 285,9671,169 1,148 1,106 1,141 147 611 939,081 250,6041,150 1,129 1,100 1,108 146 543 1,644,604 255,9331,119 1,115 1,070 1,084 145 536 1,139,035 280,125
1,080 1,101 1,057 1,072 147 680 1,228,113 287,3611,081 1,113 1,085 1,083 147 779 2,093,613 305,5921,086 1,123 1,114 1,107 147 784 1,314,165 335,5651,100 1,121 1,124 1,101 146 844 2,185,659 341,5621,104 1,120 1,124 1,093 146 762 1,121,566 362,3561,101 1,118 1,112 1,112 147 787 1,558,648 362,2651,133 1,114 1,101 1,108 140 929 1,398,683 387,4321,125 1,089 1,082 1,100 139 1,073 2,527,668 400,3991,108 1,073 1,062 1,106 138 930 1,861,299 448,6511,058 1,042 1,038 1,034 137 885 1,281,761 426,9361,070 1,046 1,047 1,040 138 867 2,109,675 406,8611,058 1,058 1,025 1,054 136 808 1,648,353 424,3801,020 1,029 991 1,047 133 939 1,320,262 395,2311,025 1,040 1,006 1,072 133 767 2,111,348 369,9511,030 1,066 1,013 1,091 132 630 1,498,320 437,376
959 992 950 1,004 128 582 2,310,189 392,849934 955 957 967 129 517 1,170,475 378,103966 985 971 971 130 486 2,082,527 367,462
1,042 1,044 1,007 1,065 129 438 1,147,973 408,5911,070 1,068 1,023 1,086 135 475 1,505,977 417,9701,085 1,077 1,036 1,081 136 468 1,260,310 460,9241,113 1,063 1,061 1,099 137 501 761,291 446,6111,136 1,115 1,105 1,125 135 502 1,613,732 420,6561,040 1,037 1,009 1,064 127 483 1,938,085 456,287
999 991 969 1,030 126 443 1,365,891 494,862949 924 925 973 119 404 1,657,109 446,462871 818 841 890 116 398 1,056,984 409,236
860 826 848 889 116 372 1,617,060 454,904850 833 852 877 114 394 1,511,472 546,729792 783 778 835 112 346 1,305,630 380,052
^^Cumulative open interest in all contracts at the end of month; Future prices are for near month continuos futures contract.
A PwC & MCX Joint Endeavour 241www.mcxindia.com / www.pwc.com/in/en
DATABANK - AGRI COMMODITIES
178_300_CYIB_2011_Agri_final.indd 241178_300_CYIB_2011_Agri_final.indd 241 1/26/2012 1:29:11 AM1/26/2012 1:29:11 AM

EDITORIALSPROLOGUE INDIAN ECONOMYEXPERTS' VIEWS
Maize fundamentals - World and India (in `000' tonnes) 2011-12e 2010-11 2009-10 2008-09 2007-08 2006-07 2001-02WorldBeginning stocks 120,880 143,629 147,243 131,481 110,222 124,860 175,080Production 872,393 820,022 812,976 799,334 794,857 714,031 601,394Imports 91,663 91,267 90,285 82,925 98,475 90,635 71,578Consumption 874,355 843,881 809,898 782,020 773,431 725,237 622,045Exports 94,917 90,157 96,977 84,477 98,642 94,067 74,666Net Availability 1,084,936 1,054,918 1,050,504 1,013,740 1,003,554 929,526 848,052Ending Stocks 115,664 120,880 143,629 147,243 131,481 110,222 151,341Area (1000 HA) 167,017 162,723 157,714 158,800 161,163 149,945 137,697Yield (MT/HA) 5.22 5.04 5.15 5.03 4.93 4.76 4.37
India Beginning stocks 511 391 686 551 260 264 726Production 21,000 20,500 16,720 19,730 18,960 15,100 13,510Imports 10 20 24 13 4 4 1Consumption 18,700 18,000 15,100 17,000 14,200 13,900 13,050Exports 2,200 2,400 1,939 2,608 4,473 1,208 25Net Availability 21,521 20,911 17,430 20,294 19,224 15,368 14,237Ending Stocks 621 511 391 686 551 260 1,162Area (1000 Ha) 8,600 8,550 8,330 8,170 8,260 7,800 6,870Yield (MT/Ha) 2.44 2.4 2.01 2.41 2.3 1.94 1.97 Average daily volatility of - 0.87% 0.75% 1.49% 0.62% 1.50% -MCX spot prices CBOT price (Rs./qtl) - 1,227.91 617.98 816.38 901.27 649.11 388.57Indian Price (Rs. /qtl) - 1,030.83 933.53 810.24 778.48 746.36 520.63MSP (Rs/qtl) 980 880 840 840 620 540 485 Certified Seed Distribution - - - 79.4 58 57.4 27.5
Note: e - source estimates provided by USDA, Data Retrieved on July 28, 2011; Market Year (India): November to OctoberSource: USDA; Ministry of Agriculture, Govt. of India; Agmarknet; CBOT
Maize balance sheet 2011-12e - World (in `000' tonnes) Supply DemandCountry Begining stocks Production Imports Consumption Exports Ending stocksArgentina 1,002 26,000 10 18,000 7,500 1,512Brazil 8,689 55,000 1,000 8,000 50,500 6,189China 53,714 178,000 2,000 200 182,500 51,014EU 4,909 59,288 5,000 1,000 64,200 3,997India 511 21,000 10 2,200 18,700 621Mexico 1,489 24,000 9,200 100 32,100 2,489US 22,344 342,154 508 48,262 294,654 22,090Others 28,222 166,951 73,935 17,155 224,201 27,752World Total 120,880 872,393 91,663 94,917 874,355 115,664
Note: e - source estimates provided by USDA, Data Retrieved on July 28, 2011Source: USDA
Maize state-wise estimates of area and production (kharif and rabi) Area (`000' Hectares) Production ( `000' Tonnes)States/ UT 2009-10 2008-09 2007-08 2006-07 2001-02 2009-10 2008-09 2007-08 2006-07 2001-02Andhra Pradesh 863 852 786 725 428 3,558 4,152 3,621 2,462 1,457Bihar 644 641 640 642 594 1,863 1,714 1,455 1,715 1,488Gujarat 511 499 424 520 444 493 739 583 363 885Himachal Pradesh 269 298 300 299 301 332 677 863 695 768Jammu & Kashmir 314 316 302 324 327 532 633 475 487 538Jharkhand 159 216 237 241 140 206 304 358 296 209Karnataka 1,200 1,069 1,113 961 580 3,176 3,029 3,254 2,719 1,452Madhya Pradesh 811 841 880 861 854 897 1,144 1,133 840 1,681Maharashtra 754 655 672 580 326 1,478 1,560 1,790 1,150 587Punjab 132 151 153 154 165 451 514 521 481 449Rajasthan 1,096 1,053 1,051 1,028 1,017 1,146 1,828 1,955 1,116 1,481Tamil Nadu N/A 287 224 198 73 1,218 1,258 811 759 118Uttar Pradesh 710 799 838 872 931 1,021 1,198 1,209 1,164 1,516Others 814 498 497 489 402 934 981 928 849 532All India 8,277 8,174 8,117 7,894 6,582 17,304 19,731 18,955 15,097 13,160
Source: Ministry of Agriculture, GOI
Commodity Insights Yearbook 2011242
178_300_CYIB_2011_Agri_final.indd 242178_300_CYIB_2011_Agri_final.indd 242 1/26/2012 1:29:12 AM1/26/2012 1:29:12 AM

DATABANK - NON-AGRI COMMODITIES
Maize - BRICS Nations fact sheet (in `000' tonnes)World Production Import Export Consumption Net Population Per capita Per capita availability (in million) availability consumption (kg) (kg)
Brazil 55,000 1,000 8,000 50,500 64,689 206.47 313.31 244.59 Russia 5,500 50 300 5,000 5,622 137.97 40.75 36.242011-12e India 21,000 10 2,200 18,700 21,521 1,208.36 17.81 15.48 China 178,000 2,000 200 182,500 233,714 1,341.85 174.17 136.01 South Africa 12,500 25 2,000 10,800 17,119 49.83 343.57 216.75 Brazil 55,000 1,000 8,500 48,800 65,989 203.43 324.38 239.89 Russia 3,075 200 25 3,300 3,397 138.74 24.48 23.792010-11 India 20,500 20 2,400 18,000 20,911 1,189.17 17.58 15.14 China 173,000 1,500 100 172,000 225,814 1,336.72 168.93 128.67 South Africa 12,000 25 2,000 10,600 17,194 49.00 350.87 216.31 Brazil 56,100 404 11,599 47,000 68,588 201.10 341.06 233.71 Russia 3,963 32 427 3,700 4,249 139.39 30.48 26.542009-10 India 16,720 24 1,939 15,100 17,430 1,173.11 14.86 12.87 China 158,000 1,296 151 159,000 210,465 1,330.14 158.23 119.54 South Africa 13,420 0 2,064 10,300 17,533 49.11 357.02 209.74 Brazil 51,000 1,141 7,136 45,500 64,720 198.74 325.65 228.94 Russia 6,682 51 1,331 5,200 6,785 140.04 48.45 37.132008-09 India 19,730 13 2,608 17,000 20,294 1,166.08 17.40 14.58 China 165,900 47 172 153,000 204,341 1,338.61 152.65 114.30 South Africa 12,567 27 1,671 9,900 15,684 49.05 319.74 201.82 Brazil 58,600 678 7,791 42,500 62,870 196.34 320.21 216.46 Russia 3,798 341 49 4,100 4,201 140.70 29.86 29.142007-08 India 18,960 4 4,473 14,200 19,224 1,148.00 16.75 12.37 China 152,300 41 549 150,000 188,943 1,330.04 142.06 112.78 South Africa 13,164 27 2,162 9,600 14,852 48.78 304.45 196.79 Brazil 51,000 1,413 10,836 41,000 55,428 190.01 291.71 215.78 Russia 3,510 108 77 3,600 3,739 141.38 26.45 25.462006-07 India 15,100 4 1,208 13,900 15,368 1,129.87 13.60 12.30 China 151,600 16 5,269 145,000 186,871 1,321.85 141.37 109.69 South Africa 7,300 1,121 468 8,600 10,729 44.00 243.85 195.46
Note: e - source estimates provided by USDA, Data retrived on July 28, 2011, Population fi gures for 2011-12 is arrived at by calculating CAGR from 2004-05 to 2010-11; Source: USDA, World Bank, IFM, CIA World Fact Book
Castor: Seeds Prodn., Oil Exports & Prices
Source: Source: SEA of India & Agmarknet. Average Prices of India for the month of March
800
600
400
200
0
1200
900
600
300
0
2005-06 2007-082004-052002-03 2003-04 2006-07 2008-09
India ES
World ES (in 000s)
Int. prices
India prices
2009-10
Prices000 tones
2010-11
Maize (Corn): Ending Stock & Prices
Source: Agmarknet, & USDA. ES - ending stock, Indian prices Rs/Qntl, Int. prices cents/bu
A PwC & MCX Joint Endeavour 243www.mcxindia.com / www.pwc.com/in/en
DATABANK - AGRI COMMODITIES
178_300_CYIB_2011_Agri_final.indd 243178_300_CYIB_2011_Agri_final.indd 243 1/26/2012 1:29:12 AM1/26/2012 1:29:12 AM

EDITORIALSPROLOGUE INDIAN ECONOMYEXPERTS' VIEWS
Maize - All India sowing progress during kharif/rabi (in lakh ha) Date Average Area Sown reported Change vis-a visSeason area in As on % of Same prev year kharif/rabi date average period Absolute %Rabi (2010-11) 3/11/2011 9.76 12.32 126.3 12.25 0.1 0.6Rabi (2010-11) 3/4/2011 9.76 11.98 122.8 12.24 -0.3 -2.1Rabi (2010-11) 2/25/2011 9.76 11.98 122.8 12.24 -0.3 -2.1Rabi (2010-11) 2/18/2011 9.76 11.25 115.3 11.74 -0.5 -4.3Rabi (2010-11) 2/4/2011 9.76 11.25 115.3 11.74 -0.5 -4.3Rabi (2010-11) 1/28/2011 9.76 10.92 111.9 11.05 -0.1 -0.9Rabi (2010-11) 1/21/2011 9.76 10.34 106 10.8 -0.5 -4.6Rabi (2010-11) 1/7/2011 9.76 10.34 106 10.8 -0.5 -4.6Rabi (2010-11) 12/24/2010 9.76 9.17 94 9.21 0 0.0Rabi (2010-11) 12/10/2010 9.76 6.69 68.6 7.85 -1.2 -15.3Rabi (2010-11) 11/26/2010 9.76 3.23 33.1 4.3 -1.1 -25.6 Kharif (2010-11) 10/1/2010 68.65 75.84 110.5 70.97 4.9 6.9Kharif (2010-11) 9/10/2010 68.65 74.39 108.4 70.47 3.9 5.6Kharif (2010-11) 9/3/2010 68.65 73.9 107.6 69.87 4.0 5.8Kharif (2010-11) 8/20/2010 68.65 71.7 104.4 68.8 2.9 4.2Kharif (2010-11) 8/13/2010 68.65 70.58 102.8 67.58 3.0 4.4Kharif (2010-11) 8/6/2010 68.65 67.97 99 65.05 2.9 4.5Kharif (2010-11) 7/30/2010 68.65 63.91 93.1 62.93 1.0 1.6Kharif (2010-11) 7/23/2010 68.65 55.49 80.8 56.93 -1.4 -2.5Kharif (2010-11) 7/16/2010 68.65 42.92 62.5 44.96 -2.0 -4.5Kharif (2010-11) 7/9/2010 68.65 27.97 40.7 30.04 -2.1 -6.9Kharif (2010-11) 7/2/2010 68.65 12.7 18.5 16.58 -3.9 -23.4 Rabi (2009-10) 4/9/2010 8.7 11.77 135.3 11.87 -0.1 -0.8Rabi (2009-10) 3/26/2010 8.7 11.61 133.4 11.74 -0.1 -1.1Rabi (2009-10) 3/12/2010 8.7 11.61 133.4 11.74 -0.1 -1.1Rabi (2009-10) 3/5/2010 8.7 11.61 133.4 11.75 -0.1 -1.2Rabi (2009-10) 2/12/2010 8.7 11.17 128.4 11.39 -0.2 -0.5Rabi (2009-10) 2/5/2010 8.7 10.17 116.9 10.35 -0.2 -1.7Rabi (2009-10) 1/15/2010 8.7 9.94 114.3 9.8 0.1 0Rabi (2009-10) 1/8/2010 8.7 9.46 108.7 8.98 0.5 5.3Rabi (2009-10) 1/8/2010 8.15 9.22 113.2 8.83 0.4 4.4Rabi (2009-10) 12/18/2009 8.7 8.11 93.2 7.97 0.1 1.8Rabi (2009-10) 12/11/2009 8.7 7.3 83.9 7.06 0.2 3.4
Kharif (2009-10) 10/23/2009 68.04 71.13 104.5 70.53 0.6 0.9Kharif (2009-10) 10/17/2009 68.04 71.47 112.2 74.03 -2 -3.5Kharif (2009-10) 10/16/2009 68.04 71.13 104.5 70.53 0.6 0.9Kharif (2009-10) 10/9/2009 68.04 71.08 104.5 70.53 0.5 0.8Kharif (2009-10) 10/1/2009 68.04 70.97 104.3 70.43 0.5 0.8Kharif (2009-10) 9/11/2009 68.04 70.39 103.4 69.35 1 1.5Kharif (2009-10) 9/4/2009 68.04 69.87 102.7 68.09 1.8 2.6Kharif (2009-10) 8/28/2009 68.04 69.47 102.1 68.44 1 1.5Kharif (2009-10) 8/13/2009 68.04 67.55 99.3 65.87 1.7 2.6Kharif (2009-10) 7/31/2009 68.04 62.92 92.5 59.23 3.7 6.2Kharif (2009-10) 7/24/2009 68.04 55.22 81.2 53.8 1.4 2.6Kharif (2009-10) 7/17/2009 68.04 46.18 67.9 47.41 -1.2 -2.6Kharif (2009-10) 7/10/2009 68.04 33.72 49.6 39.85 -6.1 -15.4Kharif (2009-10) 6/26/2009 68.04 8.29 12.2 8.25 0 0.5Kharif (2009-10) 6/21/2009 68.04 68.8 101.1 67.11 1.7 2.5Kharif (2009-10) 6/19/2009 68.04 1.05 1.5 0.57 0.5 84.2
Contd...
Commodity Insights Yearbook 2011244
178_300_CYIB_2011_Agri_final.indd 244178_300_CYIB_2011_Agri_final.indd 244 1/26/2012 1:29:13 AM1/26/2012 1:29:13 AM

DATABANK - NON-AGRI COMMODITIES
Maize - All India sowing progress during kharif/rabi (in lakh ha) Date Average Area Sown reported Change vis-a visSeason area in As on % of Same prev year kharif/rabi date average period Absolute %Rabi (2008-09) 3/27/2009 8.15 12.22 150 10.62 1.6 15.1Rabi (2008-09) 2/27/2009 8.15 11.37 139.6 10.38 1 9.5Rabi (2008-09) 1/30/2009 8.15 11.37 139.6 10.38 1 9.5Rabi (2008-09) 1/23/2009 8.15 10.58 129.9 10.11 0.5 4.6Rabi (2008-09) 1/16/2009 8.15 10.58 129.9 10.11 0.5 4.6Rabi (2008-09) 1/9/2009 8.15 9.22 113.2 8.83 0.4 4.4Rabi (2008-09) 1/2/2009 8.15 9.22 113.2 8.83 0.4 4.4Rabi (2008-09) 12/26/2008 8.15 8.97 110.1 8.71 0.3 3Rabi (2008-09) 12/19/2008 8.15 8.18 100.4 7.55 0.6 8.3Rabi (2008-09) 12/12/2008 8.15 6.79 83.4 6.34 0.5 7.1Rabi (2008-09) 12/5/2008 8.15 5.02 61.6 4.04 1 24.3Rabi (2008-09) 11/28/2008 8.15 4.75 58.3 3.52 1.2 34.9Rabi (2008-09) 11/21/2008 8.15 3.96 48.6 2.92 1 35.6Rabi (2008-09) 11/14/2008 8.15 2.32 28.5 1.77 0.6 31.1Rabi (2008-09) 11/7/2008 8.15 1.77 21.7 1.13 0.6 56.6 Kharif (2008-09) 9/19/2008 63.71 71.2 111.8 73.51 -2.3 -3.1Kharif (2008-09) 9/12/2008 63.71 70.19 110.2 74.14 -4 -5.3Kharif (2008-09) 9/5/2008 63.71 69.93 109.8 72.85 -2.9 -4Kharif (2008-09) 8/29/2008 63.71 69.5 109.1 72.77 -3.3 -4.5Kharif (2008-09) 8/22/2008 63.71 66.64 104.6 71.78 -5.1 -7.2Kharif (2008-09) 8/8/2008 63.71 61.67 96.8 68.74 -7.1 -10.3Kharif (2008-09) 8/1/2008 63.71 58.45 91.7 66 -7.6 -11.4Kharif (2008-09) 7/25/2008 63.71 40.96 64.3 42.57 -1.6 -3.8Kharif (2008-09) 7/18/2008 63.71 40.96 64.3 42.57 -1.6 -3.8Kharif (2008-09) 7/11/2008 63.71 33.37 40.7 25.36 12 47.4Kharif (2008-09) 7/4/2008 63.71 26.47 41.5 21.57 4.9 22.7 Rabi (2007-08) 4/25/2008 7.45 10.7 143.6 9.34 1.36 14.56Rabi (2007-08) 4/11/2008 7.45 10.7 143.6 10.29 0.41 4Rabi (2007-08) 4/4/2008 7.45 10.7 143.6 10.29 0.41 4Rabi (2007-08) 3/28/2008 7.45 10.7 143.6 10.28 0.42 4.1Rabi (2007-08) 3/14/2008 7.45 10.7 143.6 10.28 0.42 4.1Rabi (2007-08) 3/7/2008 7.45 10.56 141.7 10.2 0.36 3.5Rabi (2007-08) 2/29/2008 7.45 10.55 141.6 10.2 0.35 3.4Rabi (2007-08) 2/22/2008 7.45 10.54 141.4 10.2 0.34 3.3Rabi (2007-08) 2/15/2008 7.45 10.48 140.6 10.16 0.32 3.1Rabi (2007-08) 2/1/2008 7.45 10.21 137 10.02 0.19 1.9Rabi (2007-08) 1/25/2008 7.45 10.21 137 9.97 0.24 2.4Rabi (2007-08) 1/4/2008 7.45 9.48 127.2 8.11 1.37 16.9Rabi (2007-08) 12/28/2007 7.45 9.78 131.2 7.41 2.37 32Rabi (2007-08) 12/7/2007 7.45 6.15 82.5 6.65 -0.5 -7.5Rabi (2007-08) 11/16/2007 7.45 2.41 32.3 3.1 -0.7 -22.3Rabi (2007-08) 11/16/2007 7.45 4.8 64.4 6.6 -1.8 -4.1 Kharif (2007-08) 10/26/2007 62.16 74.55 119.9 68.44 6.1 8.9Kharif (2007-08) 9/28/2007 62.16 76.76 123.5 72.45 4.3 5.9Kharif (2007-08) 9/14/2007 62.16 76.17 122.5 71.74 4.4 6.2Kharif (2007-08) 8/31/2007 62.16 73.52 118.3 69.2 4.3 6.2Kharif (2007-08) 8/17/2007 62.16 71.49 115 67.76 3.7 5.5Kharif (2007-08) 7/20/2007 62.16 54.43 61.2 47.42 10 21.1Kharif (2007-08) 7/6/2007 62.16 27.04 43.5 28.75 -1.7 -6
Source: Department of Agriculture Cooperation, GOI
A PwC & MCX Joint Endeavour 245www.mcxindia.com / www.pwc.com/in/en
DATABANK - AGRI COMMODITIES
178_300_CYIB_2011_Agri_final.indd 245178_300_CYIB_2011_Agri_final.indd 245 1/26/2012 1:29:13 AM1/26/2012 1:29:13 AM

EDITORIALSPROLOGUE INDIAN ECONOMYEXPERTS' VIEWS
Maize state-wise monthly arrivals (in `000' tonnes)Month Andhra Pradesh Rajasthan Bihar Karnataka Maharashtra
Mar-11 51.76 20.28 N/A 83.82 28.63Feb-11 13.16 32.19 N/A 199.72 50.18Jan-11 45.31 56.03 N/A 207.05 64.86Dec-10 152.53 67.41 N/A 220.56 70.03Nov-10 389.52 42.86 N/A 64.18 38.65Oct-10 407.89 39.63 N/A 108.21 22.35Sep-10 69.77 6.14 N/A 17.18 2.45Aug-10 17.51 3.96 N/A 22.01 3.68Jul-10 4.98 5.29 N/A 28.44 9.37Jun-10 9.83 7.70 N/A 122.25 12.88May-10 29.67 5.63 N/A 31.30 16.15Apr-10 75.23 5.33 N/A 72.89 25.00Mar-10 40.58 14.89 N/A 76.86 21.84Feb-10 13.87 21.74 N/A 105.76 32.04Jan-10 3.30 44.55 N/A 162.21 47.14Dec-09 9.16 73.54 N/A 154.81 68.24Nov-09 27.80 83.67 N/A 137.21 34.38Oct-09 20.34 36.33 N/A 65.32 12.53Sep-09 9.00 7.31 0.00 6.53 6.75Aug-09 1.99 3.36 N/A 3.45 8.71Jul-09 2.81 5.96 N/A 107.49 8.02Jun-09 7.62 9.66 N/A 63.29 12.47May-09 18.07 8.73 N/A 37.98 14.39Apr-09 19.00 16.44 N/A 73.53 29.60Mar-09 10.31 16.26 N/A 138.83 31.53Feb-09 3.82 21.20 N/A 133.31 40.88Jan-09 4.58 37.24 N/A 77.90 37.04Dec-08 4.26 77.20 N/A 99.09 40.65Nov-08 2.57 33.00 0.00 77.18 38.72Oct-08 6.44 22.31 N/A 39.03 9.78Sep-08 0.40 13.98 N/A 8.54 1.03Aug-08 0.01 6.32 N/A 19.83 1.04Jul-08 0.02 9.75 N/A 18.71 2.62Jun-08 0.01 10.21 N/A 39.30 8.63May-08 0.01 8.36 0.15 65.95 21.89Apr-08 0.03 9.44 0.13 83.01 19.70Mar-08 0.01 20.30 0.18 129.60 17.38Feb-08 0.02 26.38 0.15 122.56 22.30Jan-08 0.20 19.50 0.06 137.68 33.59Dec-07 9.91 20.78 0.18 118.20 52.89Nov-07 27.08 24.43 0.17 115.86 68.37Oct-07 81.10 17.05 0.17 50.79 49.42Sep-07 10.47 2.12 0.19 16.93 3.71Aug-07 0.80 1.03 0.46 21.34 6.00Jul-07 0.99 1.57 0.79 18.03 6.40Jun-07 2.88 2.49 0.38 24.17 13.15May-07 8.08 3.32 N/A 16.13 28.22Apr-07 10.70 5.42 0.12 30.73 22.45Mar-07 12.94 4.01 N/A 65.14 11.40Feb-07 1.92 7.79 N/A 42.50 20.79Jan-07 1.57 18.00 N/A 72.16 33.19Dec-06 5.04 26.70 N/A 83.05 39.41Nov-06 24.58 26.94 0.47 100.26 74.77Oct-06 48.41 9.96 N/A 47.02 23.26Sep-06 13.24 5.70 0.48 20.38 2.20Aug-06 0.96 1.82 6.61 6.42 1.10Jul-06 1.43 2.10 10.06 12.25 1.81Jun-06 3.31 3.62 7.10 19.05 4.51May-06 7.04 1.46 3.34 25.87 11.44Apr-06 0.51 2.39 1.46 35.37 9.56
Note: N/A - Not availableSource: Dept. of Agriculture, GOI
Commodity Insights Yearbook 2011246
178_300_CYIB_2011_Agri_final.indd 246178_300_CYIB_2011_Agri_final.indd 246 1/26/2012 1:29:13 AM1/26/2012 1:29:13 AM

DATABANK - NON-AGRI COMMODITIES
2006-07
2007-08
2008-09
2009-10
2010-11
2011-12e
United States China EU-27 Brazil Argentina Others
Production
Source: e—estimates of USDA ,Source: USDA
2006-07
2007-08
2008-09
2009-10
2010-11
2011-12e
Japan Mexico Korea, South Egypt Taiwan Other
Imports
2006-07
2007-08
2008-09
2009-10
2010-11
2011-12e
United States Argentina Brazil Ukraine Serbia Others
Exports
2006-07
2007-08
2008-09
2009-10
2010-11
2011-12e
United States China EU-27 Brazil Mexico Other
Consumption
200,000 400,000 600,000 800,000 1,000,0000
20,000 40,000 60,000 80,000 100,000 120,0000
20,000 40,000 60,000 80,000 100,000 120,0000
0 200,000 400,000 600,000 800,000 1,000,000
Source: e—estimates of USDA ,Source: USDA
Source: e—estimates of USDA ,Source: USDA
Source: e—estimates of USDA ,Source: USDA
Data of top 5 countries (`000' tonnes)
A PwC & MCX Joint Endeavour 247www.mcxindia.com / www.pwc.com/in/en
DATABANK - AGRI COMMODITIES
178_300_CYIB_2011_Agri_final.indd 247178_300_CYIB_2011_Agri_final.indd 247 1/26/2012 1:29:14 AM1/26/2012 1:29:14 AM

EDITORIALSPROLOGUE INDIAN ECONOMYEXPERTS' VIEWS
Maize prices and trading activity MCX Spot prices - Nizamabad Other markets monthly Maize CBOT futures (Rs. /qtl) average spot (Rs. /qtl) Closing Open Month
Average High Low Madhya Karnataka WPI of price (US Volume interest
Pradesh Maize Cents per (in lots)^ (in lots^^) bushel)
Dec-10 987.3 1031.0 951.0 876.1 885.6 171.9 629.00 4,280,996 1,549,228Nov-10 949.9 958.0 942.0 854.0 889.1 171.1 530.00 9,180,932 1,518,147Oct-10 1011.7 1145.0 958.5 859.7 883.6 167.2 582.00 7,503,539 1,611,122Sep-10 1143.3 1174.0 1098.0 955.9 975.5 168.1 495.75 7,034,387 1,451,414Aug-10 1070.9 1090.5 1054.5 1012.5 969.9 169.4 424.50 6,900,459 1,339,412Jul-10 1046.9 1091.5 999.0 1029.7 949.1 166.2 392.75 4,864,477 1,224,623Jun-10 986.7 998.0 955.0 944.1 845.4 157.8 354.25 6,208,820 1,113,550May-10 899.6 947.5 872.5 833.0 905.2 152.8 359.00 4,240,897 1,216,786Apr-10 877.3 893.0 844.0 853.6 878.8 153.1 366.25 6,428,321 1,172,018Mar-10 846.9 852.0 841.5 885.6 843.0 153.1 345.00 3,937,139 1,137,402Feb-10 868.5 882.5 852.0 879.7 820.0 153.5 378.00 5,218,922 1,112,485Jan-10 907.4 928.5 885.0 888.5 831.1 154.1 356.50 4,026,860 1,149,428Dec-09 943.8 964.5 924.5 895.4 829.9 154.3 414.50 3,135,690 1,001,603Nov-09 918.3 925.5 912.5 889.1 816.4 155.3 402.75 5,509,455 973,178Oct-09 900.9 914.0 881.5 850.9 798.5 154.5 366.00 4,374,583 957,449Sep-09 899.9 925.5 873.0 883.9 816.5 155.6 344.00 3,154,160 853,077Aug-09 934.9 953.5 913.0 912.9 1011.8 156.2 326.25 4,442,154 832,265Jul-09 908.8 928.5 888.0 874.7 831.0 153.0 339.50 4,744,209 880,910Jun-09 872.5 898.0 836.5 833.2 859.8 151.8 347.75 5,638,389 921,769May-09 847.7 874.5 840.0 795.0 900.3 150.1 436.25 4,138,872 945,840Apr-09 827.0 851.5 805.0 767.3 763.9 148.6 396.25 4,538,043 777,465Mar-09 806.2 812.0 801.0 775.6 775.1 145.3 404.75 3,685,395 808,613Feb-09 830.5 852.5 810.0 797.7 808.0 144.6 350.75 4,487,506 736,567Jan-09 835.5 914.0 809.0 768.8 820.2 142.4 379.00 3,042,100 819,228Dec-08 848.4 865.5 809.0 733.5 778.6 138.8 407.00 3,266,457 809,779Nov-08 877.3 906.5 860.0 695.2 798.1 140.5 349.50 4,448,998 869,865Oct-08 890.1 908.0 870.0 718.5 824.3 138.2 401.50 4,549,393 989,541Sep-08 1010.3 1060.0 879.0 755.7 868.1 136.9 487.50 3,934,661 1,035,263Aug-08 1026.1 1090.5 983.5 827.6 978.0 138.2 568.25 4,989,108 1,070,206Jul-08 994.8 1100.0 923.0 857.1 864.7 137.4 587.50 5,402,237 1,228,618Jun-08 888.4 952.5 815.5 793.9 779.7 137.7 724.75 7,593,798 1,321,717May-08 744.9 824.0 693.0 690.7 711.7 134.7 599.25 4,876,851 1,410,564Apr-08 733.2 764.0 700.0 677.9 695.6 134.5 600.25 6,501,066 1,413,722Mar-08 759.4 768.0 747.5 711.8 679.6 134.0 567.25 4,350,811 1,391,618Feb-08 734.4 747.5 724.5 677.6 660.5 131.1 546.00 5,808,164 1,457,997Jan-08 729.1 751.5 695.5 673.0 658.6 130.0 501.25 4,213,195 1,425,914Dec-07 701.2 714.5 693.5 635.4 620.8 125.9 455.50 3,145,918 1,291,091Nov-07 689.8 705.5 670.0 619.0 601.2 126.9 384.50 4,553,031 1,119,824Oct-07 669.3 688.0 660.0 629.8 613.9 127.3 375.50 3,306,485 1,206,085Sep-07 677.2 688.0 663.0 702.8 672.9 126.9 373.00 3,128,903 1,156,068Aug-07 712.0 745.0 672.5 704.6 712.2 130.4 324.00 4,344,211 1,076,382Jul-07 754.6 769.5 749.5 728.1 733.8 131.9 325.75 4,194,403 1,218,657Jun-07 734.6 780.0 694.5 722.2 708.6 131.6 329.50 6,014,846 1,184,697May-07 707.0 748.5 695.5 689.8 695.4 131.9 390.25 4,519,983 1,274,581Apr-07 750.0 764.5 724.0 744.7 716.2 134.9 358.00 6,239,483 1,252,177Mar-07 727.6 752.0 713.5 726.7 712.0 135.3 374.50 4,959,185 1,422,407Feb-07 745.7 756.0 728.0 762.6 703.4 133.3 425.25 5,111,676 1,477,908Jan-07 717.8 726.0 710.0 720.0 661.0 130.6 404.00 4,984,664 1,483,792Dec-06 725.0 743.0 720.0 727.5 630.8 126.5 390.25 2,774,348 1,402,433Nov-06 737.6 770.0 652.0 756.4 585.7 122.0 377.00 6,369,947 1,390,522Oct-06 637.8 656.0 614.0 635.5 553.0 117.6 320.75 5,300,239 1,374,999Sep-06 658.9 800.0 610.0 876.9 578.0 119.0 262.50 3,626,114 1,294,494Aug-06 757.3 878.0 642.0 710.9 623.1 118.8 232.00 4,226,906 1,316,964Jul-06 630.4 648.0 615.0 644.8 584.7 116.5 239.00 3,757,979 1,394,572Jun-06 596.4 627.0 550.0 634.6 558.8 118.2 235.50 4,693,780 1,335,969May-06 539.9 545.0 536.0 604.7 522.2 116.2 251.25 3,773,153 1,348,989Apr-06 539.1 561.0 523.0 605.1 510.5 115.9 238.25 3,512,898 1,182,714
Note: N/A - Not Available; WPI - Wholesale Price Index; Future prices are for near month continuos futures contract.Source: Agmarknet; Ministry of Commerce and Industry; Exchanges' websites
Commodity Insights Yearbook 2011248
178_300_CYIB_2011_Agri_final.indd 248178_300_CYIB_2011_Agri_final.indd 248 1/26/2012 1:29:14 AM1/26/2012 1:29:14 AM

DATABANK - NON-AGRI COMMODITIES
Consumption
A PwC & MCX Joint Endeavour 249www.mcxindia.com / www.pwc.com/in/en
DATABANK - AGRI COMMODITIES
2008-11
2000-03
1990-93
1980-83
1970-73
USA
Source: USDA; Others: Oats; Rye
2008-11
2000-03
1990-93
1980-83
1970-73
India
Source: USDA
0% 20% 40% 60% 80% 100%
960,692
728,648
636,121
513,994
491,511
Cumulative consumption
0% 20% 40% 60% 100%
551,479
500,487
448,385
326,082
256,866
Cumulative consumption
Corn Sorghum Wheat others
Millet Rice Milled Sorghum Wheat
80%
2008-11
2000-03
1990-93
1980-83
1970-73
1,204,535
2,144,481
953,804
740,359
450,318
0% 20% 40% 60% 80% 100%
Corn Millet Rice Milled Wheat
China
Source: USDA
Cumulative consumption
Export
2008-11
2000-03
1990-93
1980-83
1970-73
Millet Rice, Milled Sorghum Wheat Others Barley Oats Wheat others
USA
Source: USDA; Others: Oats Rye
2008-11
2000-03
1990-93
1980-83
1970-73
Barley Oats Wheats Others
Australia
Source: USDA; Others: Millet, Oats
0% 20% 40% 60% 80% 100%
253,653
242,621
254,642
315,939
149,322
59,542
53,598
36,795
34,795
28,229
Cumulative exports Cumulative exports
0% 20% 40% 60% 80% 100%
Cumulative exports
2008-11
2000-03
1990-93
1980-83
1970-73
Canada
Source: USDA; Others: Rye, Wheat (Durum)
0% 20% 40% 60% 80% 100%
63,632
50,277
86,970
77,281
54,560
Major country-wise & commodity-wise distribution of Cereals production, imports, exports and consumption in ‘000’ tonnes
178_300_CYIB_2011_Agri_final.indd 249178_300_CYIB_2011_Agri_final.indd 249 1/26/2012 1:29:15 AM1/26/2012 1:29:15 AM

EDITORIALSPROLOGUE INDIAN ECONOMYEXPERTS' VIEWS
Import
Commodity Insights Yearbook 2011250
2008-11
2000-03
1990-93
1980-83
1970-73
Mexico
Source: USDA
2008-11
2000-03
1990-93
1980-83
1970-73
Japan
Source: USDA; Others: Millet, Oats, Rye, Wheat (Durum)
0% 20% 40% 60% 80% 100%
32,682
28,820
15,531
15,812
1,793
Cumulative import
0% 20% 40% 60% 100%
74,102
77,802
83,018
73,213
48,082
Cumulative import
Corn Oats Sorghum
Barley Corn Sorghum Wheat Others
80%
2008-11
2000-03
1990-93
1980-83
1970-73
46,663
34,342
22,673
20,347
8,719
0% 20% 40% 60% 80% 100%
Corn Wheat
Egypt
Source: USDA
Cumulative import
Production
2008-11
2000-03
1990-93
1980-83
1970-73
Corn Millet Rice, Milled Wheat Millet Rice, Milled Sorghum Wheat
China
Source: USDA
2008-11
2000-03
1990-93
1980-83
1970-73
Corn Oats Sorghum Wheat
USA
Source: USDA
0% 20% 40% 60% 80% 100%
1,248,899
1,009,481
990,160
695,279
460,240
1,178,663
918,073
892,086
880,737
609,367
Cumulative production Cumulative production
0% 20% 40% 60% 80% 100%
Cumulative production
2008-11
2000-03
1990-93
1980-83
1970-73
India
Source: USDA
0% 20% 40% 60% 80% 100%
575,420
518,915
445,935
321,016
246,441
178_300_CYIB_2011_Agri_final.indd 250178_300_CYIB_2011_Agri_final.indd 250 1/26/2012 1:29:16 AM1/26/2012 1:29:16 AM

DATABANK - NON-AGRI COMMODITIES
A PwC & MCX Joint Endeavour 251www.mcxindia.com / www.pwc.com/in/en
DATABANK - AGRI COMMODITIES
Production
Note: Average production in ‘000’ tonnes. Source: USDA
0% 20% 40% 60% 80% 100%
2008-11
2000-03
1990-93
1980-83
1970-73
2,227,004
1,849,048
1,765,664
1,485,680
1,132,191
Avg. Prodn.
Corn Wheat Rice Milled Barley Sorghum
Millet Oats Mixed Grains Rye
Imports
Note: Average imports in ‘000’ tonnes. Source: USDA
0% 20% 40% 60% 80% 100%
2008-11
2000-03
1990-93
1980-83
1970-73
275,768
228,773
208,378
202,813
122,301
Avg. Imports
Wheat Corn Rice, Milled Barley Sorghum
Oats Rye Millet
Exports
Note: Average exports in ‘000’ tonnes. Source: USDA
0% 20% 40% 60% 80% 100%
2008-11
2000-03
1990-93
1980-83
1970-73
284,736
233,785
221,182
208,586
126,479
Avg. Prodn.
Wheat Corn Rice, Milled Barley Sorghum
Oats Rye Millet
Consumption
Note: Average consumption in ‘000’ tonnes. Source: USDA
0% 20% 40% 60% 80% 100%
2008-11
2000-03
1990-93
1980-83
1970-73
2,187,857
1,891,307
1,723,989
1,460,032
1,143,849
Avg. Prodn.
Corn Wheat Rice, Milled Barley Sorghum
Millet Oats Mixed Grain Rye
Type-wise world distribution of cereal production, imports, exports and consumption
178_300_CYIB_2011_Agri_final.indd 251178_300_CYIB_2011_Agri_final.indd 251 1/26/2012 1:29:16 AM1/26/2012 1:29:16 AM

EDITORIALSPROLOGUE INDIAN ECONOMYEXPERTS' VIEWS
Pulses are the edible seeds of plants in the legume
family such as pea, lentil, bean and chickpea, according
to Pulse Canada. The term “pulse” is derived from the
Latin words puls or pultis meaning “thick soup”. Due to
their high content of complex carbohydrates and dietary fi bres,
as well as their low fat and salt percentage, truly make pulses
“miracle food”. The term “pulse”, as used by the Food and
Agricultural Organization (FAO), is reserved for crops harvested
solely for the dry seed. Pulses are important food crops due to
their high protein and essential amino acid content. Like many
leguminous crops, pulses play a key role in crop rotation due to
their ability to fi x nitrogen. Pulses are 20-25% protein by weight,
which is double the protein content of wheat and three times
that of rice.
India is the world’s largest producer and consumer of pulses.
Canada, Myanmar, Australia and the US are other leading
exporters, as well as major suppliers to India. Of the numerous
types of pulses in the Leguminosae family, chickpea or chana
is the most important pulse grown in the Indian subcontinent,
accounting for around 40% of the total pulse crops produced in
India and making it the leading chickpea producing
country in the world. Besides chana, tur or pigeon
pea is consumed as a popular staple diet in India.
Tur originated in Asian continent and is said to be
a native to India for as long as 3,000 years. India
shares 85% of the world’s total tur production. Urad
or black gram is one of the most important and highly
prized pulses in India. Because of its fermenting
capability, it is used widely in fermented foods that
are the specialty of South Indian cuisine. India is the
largest producer of black gram in the world.
Chana prices opened at Rs.2,468/qntl in the
year 2010; since then the prices on MCX had under
pressure due to large-scale sowing. Anticipating
higher production, traders were eager to offl oad their
Pulses The miracle food
Commodity in 2010 Exchange (contract) Price Unit Open High Low Close Annualised
VolatilityVolume (in lots)
Chana MCX (10 tonnes) Rs/ qntl. 2,470.00 2,578.00 2,040.00 2,422.00 23.42% 66,730 Note: ^All contracts - all variants, Source: Exchanges’ websites
stocks to make way for new crop. Since late March, the prices
went up on fears of crop damage and delay in arrivals. Later, as
the arrival pressure set in, in the market, with a bumper crop, it
weighed down on the prices.
Looking at the fall in prices, farmers began holding back
their produce, expecting to sell it before the Ramadan season.
During the Ramadan the besan (chana fl our) demand increases
so does the demand for chana. With a rise in the prices since
July, farmers began releasing their produce. Once the stocks for
the Ramadan were over, chana prices dipped to a year low of
Rs.2,062 on Sept 15.
Early October, as usual, saw demand for stocking for Diwali
and, thus, provided support to chana prices. The higher prices
of imported chana also pushed up the prices, in general, in a
domestic market. Higher prices of competing pulses such as tur
and urad also provided a boost to chana prices. By the end of
November the prices hit a month high of Rs.2,546. The prices
retreated from the year high as the new sowing season set in.
Expectations that the prevailing high prices would lead to an
increase in chana acreage helped easing of prices to some
MCX Chana futures prices in 2010
Source: Metastocks Chana (Rs/qtl)
Stocking demand ahead
of Ramadan
Stocking demand ahead of Diwali
and the rising unit value of imported
varieties
Arrival pressure weighing down on the prices
Increased sowing
1-Jan
-10
29-Ja
n-10
26-F
eb-1
0
26-M
ar-1
0
23-A
pr-1
0
21-M
ay-1
0
18-Ju
n-10
16-Ju
l-10
13-A
ug-1
0
10-S
ep-1
0
8-Oc
t-10
5-No
v-10
3-De
c-10
31-D
ec-1
0
2600
2500
2400
2300
2200
2100
2000
Commodity Insights Yearbook 2011252
178_300_CYIB_2011_Agri_final.indd 252178_300_CYIB_2011_Agri_final.indd 252 1/26/2012 1:29:17 AM1/26/2012 1:29:17 AM

DATABANK - NON-AGRI COMMODITIES
A PwC & MCX Joint Endeavour 253www.mcxindia.com / www.pwc.com/in/en
DATABANK - AGRI COMMODITIES
178_300_CYIB_2011_Agri_final.indd 253178_300_CYIB_2011_Agri_final.indd 253 1/26/2012 1:29:21 AM1/26/2012 1:29:21 AM

EDITORIALSPROLOGUE INDIAN ECONOMYEXPERTS' VIEWS
Major pulses area, production and yield in India 2010-11# 2009-10 2008-09 2007-08 2006-07 2001-02
Area (in `000' ha)
Tur 4,090 3,530 3,378 3,730 3,560 3,330Urad 1,145^ 2,967 2,132 3,226 3,099 3,303Chana 9,668 8,210 7,893 7,540 7,490 6,420Total pulses* 26,280 23,350 22,093 23,630 23,190 22,010
Production (in '000' tonnes)
Tur 2,890 2,460 2,270 3,080 2,310 2,260Urad* 1,740 1,230 1,170 1,460 1,440 1,500Chana 8,250 7,480 7,060 5,750 6,330 5,470Total pulses* 18,090 14,660 14,570 14,760 14,200 13,370
Yield (in kg/ha)
Tur 799 723 671 826 650 679Urad* - 937 1084 462 473 454Chana 853 895 895 762 845 853Total pulses* 537 625 659 625 612 607
Average daily volatility of MCX spot prices
Chana 1.10% 1.43% 1.71% 1.31% 1.93% -Tur - - - - 1.76% -Urad - - - - 1.63% - Import duty on pulses in % 0 0 0 0 10 -
Note: #: 4th Advanced Estimates (2010-11), Ministry of Agriculture Govt of India; ^ data is for rabi season only; *includes Kharif and Rabi season crop; Futures trading Tur/Arhar and Urad is suspended since Feb 2007 Source: Agricultural Statistics Division, Directorate of Economics & Statistics Department of Agriculture & Cooperation GOI, MCX
Import of Pulses by India (in `000' tonnes) Year 2010-11 2009-10 2008-09 2007-08 2006-07
Qty. 2,600.00 3,509.58 2,481.10 2,835.05 2,270.98Value - 9,813.37 6,246.40 5,374.94 3,891.91Unit Value - 27.96 24.64 18.96 17.14
Note: Value: Rs. in Crore; Unit Value: Rs per kgSource : Ministry of Agriculture, Govt. of India; Compiled from various questions and answers in Lok Sabha and Rajya Sabha
Export of Pulses from India (in `000' tonnes) Year 2010-11 2009-10 2008-09 2007-08 2006-07
Qty. 10.00 49.08 136.23 164.20 250.70Value - 208.21 540.23 526.41 773.34Unit value - 42.42 39.66 32.06 30.84
Note: * Provisional; ^ April 09-Jan 10; Value: Rs. in Crore; Unit value: Rs. per kg.Source: Ministry of Agriculture, Govt. of India. DGCI&S, Ministry of Commerce and Industry, GOI
Public sector undertaking-wise import of pulses in India (in `000' tonnes) PSUs 2010-11 2009-10 2008-09 2007-08 2006-07
NCCF 15.00 6.21 - - -NAFED 27.00 14.00 22.00 264.00 49.30STC 135.00 152.50 307.00 375.00 -PEC 296.70 272.86 374.14 387.27 -MMTC 60.00 105.00 181.00 247.25 -Total 533.70 550.56 884.14 1273.52 49.30
Note: Abbr: STC: State Trading Corporation, MMTC: Metals & Minerals Trading Corporation, PEC: Project Equipment Corporation, NAFED: National Agriculture Cooperative Marketing Federation of India, NCCF : National Calamity Contingency Fund.Source: Compiled from various questions and answers in Lok Sabha and Rajya Sabha
Commodity Insights Yearbook 2011254
178_300_CYIB_2011_Agri_final.indd 254178_300_CYIB_2011_Agri_final.indd 254 1/26/2012 1:29:22 AM1/26/2012 1:29:22 AM

DATABANK - NON-AGRI COMMODITIES
State-wise Production of Total Pulses in India (in million tonnes) States/UTs 2010-11* 2009-10 2008-09 2007-08 2006-07 2001-02
Andhra Pradesh 1.48 1.43 1.45 1.70 1.35 1.14Karnataka 1.22 1.12 0.97 1.27 0.89 0.75Madhya Pradesh 3.30 4.30 3.68 2.45 3.20 3.22Maharashtra 2.79 2.37 1.71 3.13 2.30 1.88Rajasthan 2.52 0.71 1.72 1.53 1.48 1.43Uttar Pradesh 2.12 1.90 2.02 1.54 1.98 2.38Others 3.08 2.83 3.08 3.53 2.99 2.57India 16.51 14.66 14.47 15.11 14.20 13.37
Note: *2nd advance estimates released on 9 Feb'2010Source: Ministry of Agriculture, Govt of India; Compiled from various questions and answers in Lok Sabha and Rajya Sabha
Chana statewise area and production Area (`000' Hectares) Production ( `000' Tonnes)States/ UT 2009-10 2008-09 2007-08 2006-07 2009-10 2008-09 2007-08 2006-07
Madhya Pradesh 3085.50 2840.50 2438.70 2462.80 3304.10 2786.40 1735.00 2413.00Rajasthan 884.40 1259.50 1231.30 1010.80 534.60 981.20 574.20 872.60Maharashtra 1291.00 1143.00 1353.00 1308.00 1114.00 774.00 1116.00 924.00Karnataka 972.00 723.00 605.00 651.00 574.00 401.00 367.00 308.00Andhra Pradesh 647.00 607.00 630.00 602.00 846.00 857.00 912.00 653.00Uttar Pradesh 618.00 554.00 505.00 675.00 509.00 562.00 376.00 501.00Chattisgarh 252.20 239.70 235.50 213.70 221.90 199.20 205.80 180.20Others 419.10 525.80 545.20 516.60 480.70 499.40 462.60 481.90All India 8169.20 7892.50 7543.70 7439.90 7475.90 7060.20 5748.60 6333.70
Source: Ministry of Agriculture, GOI
Tur state-wise estimates of area and production Area (`000’ Hectares) Production ( `000’ Tonnes)States/ UT 2009-10 2008-09 2007-08 2006-07 2009-10 2008-09 2007-08 2006-07
Maharashtra 1093.00 1009.00 1175.00 1123.00 919.00 605.00 1083.00 815.00Karnataka 604.00 597.00 681.00 596.00 282.00 315.00 485.00 280.00Uttar Pradesh 305.00 315.00 368.00 406.00 202.00 288.00 327.90 304.00Andhra Pradesh 463.00 443.00 463.00 401.00 203.00 202.00 302.00 161.00Gujarat 266.00 266.00 265.00 289.00 254.00 263.00 294.00 217.00Madhya Pradesh 362.10 321.20 324.80 322.50 308.00 258.40 217.60 220.20Others 372.60 426.70 449.00 424.10 309.60 334.10 366.44 316.90All India 3465.70 3377.90 3725.80 3561.60 2464.60 2265.50 3075.94 2314.10
Source: Ministry of Agriculture, GOI
A PwC & MCX Joint Endeavour 255www.mcxindia.com / www.pwc.com/in/en
DATABANK - AGRI COMMODITIES
178_300_CYIB_2011_Agri_final.indd 255178_300_CYIB_2011_Agri_final.indd 255 1/26/2012 1:29:22 AM1/26/2012 1:29:22 AM

EDITORIALSPROLOGUE INDIAN ECONOMYEXPERTS' VIEWS
Gram (Chana) - All India sowing progress during rabi (in lakh ha) Average Area Sown reported Change vis-a vis prev yearDate area in As on date % of average Same period Absolute % rabi last year8-Apr-11 73.14 96.68 132.2 85.1 11.6 13.61-Apr-11 73.14 96.03 131.3 85.1 10.9 12.825-Mar-11 73.14 96.02 131.3 85.1 10.9 12.818-Mar-11 73.14 96.02 131.3 85.1 10.9 12.811-Mar-11 73.14 95.98 131.2 85.1 10.9 12.84-Mar-11 73.14 95.76 130.9 85.1 10.7 12.525-Feb-11 73.14 95.64 130.8 85.1 10.5 12.418-Feb-11 73.14 95.58 130.7 85.07 10.5 12.44-Feb-11 73.14 95.36 130.4 85.64 9.7 11.328-Jan-11 73.14 95.12 130 85.55 9.6 11.221-Jan-11 73.14 94.92 129.8 85.42 9.5 11.17-Jan-11 73.14 93.6 128 85.3 8.3 9.724-Dec-10 73.14 87.79 120 81.89 5.9 7.210-Dec-10 73.14 80.6 110.2 76.98 3.6 4.726-Nov-10 73.14 62.19 85 63.26 -1.1 -1.7 7-May-10 71.45 89.35 125.1 83.6 5.8 6.930-Apr-10 71.45 89.35 125.1 83.6 5.8 6.923-Apr-10 71.45 89.35 125.1 83.6 5.8 6.916-Apr-10 71.45 89.35 125.1 83.6 5.8 6.99-Apr-10 71.45 89.35 125.1 83.6 5.8 6.926-Mar-10 71.45 89.34 125 83.54 5.8 6.912-Mar-10 71.45 89.22 124.9 83.51 5.7 6.85-Mar-10 71.45 89.21 124.9 83.44 5.8 6.926-Feb-10 71.45 89.19 124.8 83.44 5.8 6.912-Feb-10 71.45 87.76 122.8 83.23 4.5 5.45-Feb-10 71.45 87.56 122.6 82.98 4.6 5.515-Jan-10 71.45 86.03 120.4 81.66 4.4 5.38-Jan-10 71.45 84.38 118.1 81.04 3.3 4.118-Dec-09 71.45 80.91 113.2 72.6 8.3 11.411-Dec-09 71.45 73.12 102.3 71.07 2.1 2.9 27-Mar-09 68.5 86.8 126.7 79.64 7.2 927-Feb-09 68.5 85.8 125.3 79.08 6.7 8.520-Feb-09 68.5 85.73 125.2 78.96 6.8 8.613-Feb-09 68.5 85.7 126.1 78.92 6.8 8.66-Feb-09 68.5 85.68 125.1 78.91 6.8 8.630-Jan-09 68.5 85.58 124.9 78.29 7.3 9.323-Jan-09 68.5 85.32 124.6 77.91 7.4 9.516-Jan-09 68.5 84.48 123.3 77.52 7 99-Jan-09 68.5 83.61 122.1 77.15 6.5 8.42-Jan-09 68.5 82.68 120.7 76.31 6.4 8.326-Dec-08 68.5 78.42 114.5 71.55 6.9 9.619-Dec-08 68.5 75.1 109.6 68.86 6.2 9.112-Dec-08 68.5 73.25 106.9 66.66 6.6 9.95-Dec-08 68.5 71.07 103.7 61.25 9.8 1628-Nov-08 68.5 61.96 90.5 52.45 9.5 18.121-Nov-08 68.5 58.14 84.9 47.35 10.8 22.814-Nov-08 68.5 46.57 68 40.65 5.9 14.57-Nov-08 68.5 44.56 65 29.09 15.5 53.2 25-Apr-08 66.02 74.43 112.7 74.94 -0.51 -0.6811-Apr-08 66.02 80.39 121.8 84.02 -3.63 -4.34-Apr-08 66.02 80.39 121.8 84.02 -3.63 -4.328-Mar-08 66.02 80.38 121.7 84.02 -3.64 -4.314-Mar-08 66.02 80.38 121.7 84.02 -3.64 -4.37-Mar-08 66.02 80.34 121.7 84.02 -3.68 -4.429-Feb-08 66.02 80.34 121.7 84.02 -3.68 -4.422-Feb-08 66.02 80.29 121.6 83.86 -3.57 -4.315-Feb-08 66.02 80.29 121.6 83.86 -3.57 -4.31-Feb-08 66.02 79.95 121.1 83.24 -3.29 -425-Jan-08 66.02 79.31 120.1 83.08 -3.78 -4.54-Jan-08 66.02 77.6 117.5 78.29 -0.69 -0.928-Dec-07 66.02 75.12 113.8 76.52 -1.41 -1.87-Dec-07 66.02 65.79 99.6 65.86 -0.1 -0.116-Nov-07 66.02 42.76 64.8 47.25 -4.5 -9.516-Nov-07 66.02 60.89 92.2 61.4 -0.5 -0.8
Source: Department of Agriculture Cooperation
Commodity Insights Yearbook 2011256
178_300_CYIB_2011_Agri_final.indd 256178_300_CYIB_2011_Agri_final.indd 256 1/26/2012 1:29:23 AM1/26/2012 1:29:23 AM

DATABANK - NON-AGRI COMMODITIES
Tur (Arhar) - All India sowing progress during kharif (in lakh ha) Average Area Sown reported Change vis-a vis prev yearDate area in As on date % of average Same period Absolute % rabi last year
22-Oct-10 35.53 44.86 126.3 36.48 8.38 23.015-Oct-10 35.53 44.75 125.9 36.47 8.28 22.78-Oct-10 35.53 44.42 125.0 33.75 10.67 31.61-Oct-10 35.53 43.83 123.4 32.5 11.33 34.910-Sep-10 35.53 43.56 122.6 32.26 11.3 35.03-Sep-10 35.53 43.38 122.1 32.23 11.15 34.620-Aug-10 35.53 41.71 117.4 31.91 9.8 30.713-Aug-10 35.53 40.42 113.8 30.39 10.03 33.06-Aug-10 35.53 34.13 96.1 27.62 6.51 23.630-Jul-10 35.53 33.61 94.6 27.25 6.36 23.323-Jul-10 35.53 26.56 74.8 21.76 4.8 22.116-Jul-10 35.53 20.81 58.6 16.85 3.96 23.59-Jul-10 35.53 2.85 8.0 2.51 0.34 13.52-Jul-10 35.53 1.45 4.1 1.46 -0.01 -0.7 23-Oct-09 35.8 35.92 100.3 34.47 1.5 4.216-Oct-09 35.8 35.89 100.3 34.43 1.5 4.29-Oct-09 35.8 35.57 99.3 34.09 1.5 4.31-Oct-09 35.8 34.9 97.5 33.79 1.1 3.311-Sep-09 35.8 34.05 95.1 33.49 0.6 1.74-Sep-09 35.8 32.99 92.1 31.93 1.1 3.328-Aug-09 35.8 32.78 91.6 31.76 1 3.213-Aug-09 35.8 31.65 88.4 28.37 3.3 11.67-Aug-09 35.8 28.19 78.7 22.89 5.3 23.131-Jul-09 35.8 27.22 76 21.92 5.3 24.224-Jul-09 35.8 22.7 63.4 17.5 5.2 29.717-Jul-09 35.8 16.24 45.3 12.54 3.7 29.510-Jul-09 35.8 4.02 11.2 2.45 1.6 64.226-Jun-09 35.8 1.12 3.1 0.4 0.7 184.321-Jun-09 35.8 31.65 88.4 28.37 3.3 11.619-Jun-09 35.8 0.29 0.8 0.18 0.1 58.2 3-Oct-08 34.6 34.53 99.8 38.54 -4 -10.426-Sep-08 34.6 34.34 99.3 38.54 -4.2 -10.919-Sep-08 34.6 34.29 99.1 38.54 -4.3 -1112-Sep-08 34.6 33.92 98 37.91 -4 -10.55-Sep-08 34.6 33.79 97.6 37.87 -4.1 -10.829-Aug-08 34.6 33.3 96.2 37.48 -4.2 -11.122-Aug-08 34.6 31.46 90.9 37.03 -5.6 -158-Aug-08 34.6 25.58 73.9 28.76 -3.2 -11.11-Aug-08 34.6 22.41 64.8 28.61 -6.2 -21.725-Jul-08 34.6 19.6 56.7 24.44 -4.8 -19.818-Jul-08 34.6 12.1 35 15.62 -3.5 -22.511-Jul-08 34.6 7.2 20.8 9.76 -2.6 -26.24-Jul-08 34.6 4.45 12.9 3.86 0.6 15.3 26-Oct-07 34.71 40.79 117.5 35.97 4.8 13.428-Sep-07 34.71 38.82 111.8 35.8 3 8.414-Sep-07 34.71 38.1 109.8 35.71 2.4 6.731-Aug-07 34.71 37.78 107.7 33.96 3.4 10.117-Aug-07 34.71 34.52 99.4 33.02 1.5 4.520-Jul-07 34.71 14.98 43.2 16.24 -1.3 -7.7
Source: Department of Agriculture Cooperation
A PwC & MCX Joint Endeavour 257www.mcxindia.com / www.pwc.com/in/en
DATABANK - AGRI COMMODITIES
178_300_CYIB_2011_Agri_final.indd 257178_300_CYIB_2011_Agri_final.indd 257 1/26/2012 1:29:23 AM1/26/2012 1:29:23 AM

EDITORIALSPROLOGUE INDIAN ECONOMYEXPERTS' VIEWS
Urad (Black Gram) - All India sowing progress during rabi (in lakh ha) Average Area Sown reported Change vis-a vis prev yearDate area in As on date % of average Same period Absolute % rabi last year
8-Apr-11 7.20 11.45 159.1 11.1 0.3 3.21-Apr-11 7.20 11.39 158.3 11.1 0.3 2.625-Mar-11 7.20 11.00 152.8 10.9 0.1 0.918-Mar-11 7.20 10.92 151.7 10.76 0.2 1.511-Mar-11 7.20 10.92 151.7 10.76 0.2 1.54-Mar-11 7.20 9.33 129.6 9.47 -0.1 -1.525-Feb-11 7.20 9.20 127.8 9.15 0.0 0.518-Feb-11 7.20 8.96 124.5 9.19 -0.2 -2.54-Feb-11 7.20 8.95 124.4 9.09 -0.1 -1.528-Jan-11 7.16 8.12 113.4 8.16 0.0 -0.521-Jan-11 7.16 7.91 110.5 8.13 -0.2 -2.714-Jan-11 7.16 7.35 102.7 7.67 -0.3 -4.224-Dec-10 7.16 5.49 76.7 5.24 0.3 4.810-Dec-10 7.16 4.84 67.6 4.47 0.4 8.326-Nov-10 7.16 10.85 151.6 8.92 1.9 21.6 23-Apr-10 7.16 10.85 151.6 8.92 1.9 21.616-Apr-10 7.16 9.02 126 8.92 0.1 1.19-Apr-10 7.16 9.02 126 8.92 0.1 1.126-Mar-10 7.16 8.94 124.8 8.32 0.6 7.512-Mar-10 7.16 8.8 122.9 8.36 0.4 5.35-Mar-10 7.16 8.8 122.9 8.35 0.4 5.326-Feb-10 7.16 8.44 117.9 8.23 0.2 2.612-Feb-10 7.16 7.76 108.4 6.08 1.7 27.65-Feb-10 7.16 6.97 97.3 5.43 1.5 28.315-Jan-10 7.16 6.95 97.2 5.42 1.5 28.38-Jan-10 7.16 6.76 94.3 5.11 1.6 32.218-Dec-09 7.16 3.59 50.2 3.79 -0.2 -5.111-Dec-09 7.16 2.79 39 3.11 -0.3 -10.3 24-Apr-09 7.3 10.27 140.8 10.52 -0.2 -2.327-Mar-09 7.3 10.01 137.2 10.05 0 -0.427-Feb-09 7.3 9.33 127.9 8.94 0.4 4.420-Feb-09 7.3 7.64 104.7 8.92 -1.3 -1.4413-Feb-09 7.3 7.28 99.7 8.58 -1.3 -15.26-Feb-09 7.3 7.25 99.3 8.55 -1.3 -15.330-Jan-09 7.3 7.18 98.6 8.49 -1.3 -15.223-Jan-09 7.3 7.05 96.6 8.29 -1.2 -15.116-Jan-09 7.3 6.52 89.3 8.01 -1.5 -18.79-Jan-09 7.3 6.51 89.2 8.01 -1.5 -18.82-Jan-09 7.3 5.52 75.7 6.61 -1.1 -16.426-Dec-08 7.3 4.47 61.3 6.04 -1.6 -2619-Dec-08 7.3 4.45 61 5.99 -1.5 -25.712-Dec-08 7.3 4.08 55.9 5.6 -1.5 -27.15-Dec-08 7.3 3.72 51 4.77 -1 -2228-Nov-08 7.3 2.5 34.3 2.8 -0.3 -10.521-Nov-08 7.3 2.5 34.3 2.8 -0.3 -10.514-Nov-08 7.3 0.98 13.4 1.03 0 -4.57-Nov-08 7.3 0.98 13.4 1.03 0 -4.5 11-Apr-08 7.53 8.8 116.9 8.39 0.41 4.94-Apr-08 7.53 8.62 114.5 8.39 0.23 2.828-Mar-08 7.53 8.32 110.5 8.39 -0.07 -0.814-Mar-08 7.35 8.32 110.5 8.11 0.21 2.57-Mar-08 7.53 8.32 110.5 8.11 0.21 2.529-Feb-08 7.53 8.32 110.5 8.11 0.21 2.522-Feb-08 7.53 8.27 109.8 7.69 0.58 7.515-Feb-08 7.53 8.27 109.8 7.69 0.58 7.51-Feb-08 7.53 7.89 104.9 7.56 0.34 4.425-Jan-08 7.53 7.86 104.4 7.4 0.45 6.14-Jan-08 7.53 7.02 93.3 5.84 1.19 20.328-Dec-07 7.53 6.76 89.8 5.42 1.34 24.67-Dec-07 7.53 4.39 58.3 4.35 0 0.716-Nov-07 7.53 2.64 35.1 2.4 0.2 10.1
Source: Department of Agriculture Cooperation
Commodity Insights Yearbook 2011258
178_300_CYIB_2011_Agri_final.indd 258178_300_CYIB_2011_Agri_final.indd 258 1/26/2012 1:29:23 AM1/26/2012 1:29:23 AM

DATABANK - NON-AGRI COMMODITIES
Source: Dept. of Agriculture. *Kharif & Rabi, $ fourth advance estimates
20
16
12
8
0
35
28
21
14
7
0
2005-06 2007-082004-05
In million tons in lakh tons
2006-07 2008-09 2009-10 2010-11$
India's Pulses Production & Imports
Tur Urad*
Chana Other Pulses
Pulses Import (RHS )
Statewise Pulses Production in India
Source: Ministry of Agriculture
17%
27%
11%
10%
14%20%
13%11%
25%
30%
12%10%
2007-082008-09
Madhya Pradesh
Uttar Pradesh
Rajasthan
Maharashtra
Andhra Pradesh
Others
A PwC & MCX Joint Endeavour 259www.mcxindia.com / www.pwc.com/in/en
DATABANK - AGRI COMMODITIES
178_300_CYIB_2011_Agri_final.indd 259178_300_CYIB_2011_Agri_final.indd 259 1/26/2012 1:29:23 AM1/26/2012 1:29:23 AM

EDITORIALSPROLOGUE INDIAN ECONOMYEXPERTS' VIEWS
Tur Production & MSP
4
3
2
1
3600
2800
2000
1200
2005-06 2007-08 2009-102004-05 2006-07 2008-09 2010-11^
MSP (RHS)
Production
Source: Ministry Of Agriculture ^fourth advance estimates
Urad* Production & MSP
2
1.5
1
0.5
0
3200
2400
1600
800
02005-06 2007-08 2009-102004-05 2006-07 2008-09 2010-11^
MSP (RHS)
Production
Source: Ministry Of Agriculture ^fourth advance estimates *Khari & Rabi
Chana Production & MSP
8
7
6
5
4
0
2400
2100
1800
1500
1200
02005-06 2007-08 2009-102004-05 2006-07 2008-09 2010-11^
MSP (RHS)
Production
Source: Ministry Of Agriculture ^fourth advance estimates *Khari & Rabi
in million tons
in million tons
in million tons
Rs/qtl
Rs/qtl
Rs/qtl
Commodity Insights Yearbook 2011260
178_300_CYIB_2011_Agri_final.indd 260178_300_CYIB_2011_Agri_final.indd 260 1/26/2012 1:29:23 AM1/26/2012 1:29:23 AM

DATABANK - NON-AGRI COMMODITIES
A PwC & MCX Joint Endeavour 261www.mcxindia.com / www.pwc.com/in/en
DATABANK - AGRI COMMODITIES
Cel
ebra
te
this
sea
son
wit
h
Easy
Hom
e &
Car
Loa
n
Inte
rest
C
once
ssio
n
on H
ome
Loan
- up
to 1
%on
Car
Loa
n - 1
.25%
No
Pro
cess
ing
Cha
rges
178_300_CYIB_2011_Agri_final.indd 261178_300_CYIB_2011_Agri_final.indd 261 1/26/2012 1:29:24 AM1/26/2012 1:29:24 AM

EDITORIALSPROLOGUE INDIAN ECONOMYEXPERTS' VIEWS
Pulses state-wise monthly arrivals (in tonnes) Tur Maharashtra Karnataka Madhya Pradesh Gujarat Maharashtra Andhra Pradesh Mar-11 6,704.64 6,644.00 39.08 30.45 1,334.79 7,421.21 Feb-11 6,124.40 5,609.92 107.35 19.64 1,466.93 1,077.99 Jan-11 7,810.74 6,516.95 13.31 2.60 4,854.94 338.00 Dec-10 5,344.44 4,885.12 16.94 0.20 2,799.35 402.00 Nov-10 5,699.88 1,559.00 14.92 0.80 5,525.52 1,714.11 Oct-10 4,825.02 3,701.01 2,764.44 N/A 14,242.42 7,424.49 Sep-10 4,050.40 3,452.91 180.60 N/A 20,818.91 6,842.40 Aug-10 2,166.72 5,150.04 N/A 346.70 167.82 3,198.00 Jul-10 2,189.39 4,079.13 N/A 530.00 155.81 3,304.99 Jun-10 1,509.16 4,244.86 7.50 1.00 149.36 101.98 May-10 3,663.22 5,280.97 N/A 0.81 152.30 72.00 Apr-10 6,883.72 6,265.88 N/A 5.98 169.20 295.98 Mar-10 6,544.44 6,541.04 219.29 179.90 186.43 5,167.00 Feb-10 5,314.54 5,770.15 106.30 28.61 163.80 3,510.57 Jan-10 5,506.09 4,973.08 65.11 208.02 481.12 393.65 Dec-09 3,805.38 3,407.02 23.40 1.00 958.74 371.70 Nov-09 2,987.76 2,377.05 20.30 11.30 2,553.58 14.00 Oct-09 4,242.77 5,666.83 0.10 17.15 8,831.49 7,962.88 Sep-09 2,907.45 369.00 7.19 297.26 7,692.99 44,702.10 Aug-09 2,704.46 1,413.97 10.00 380.84 885.98 531.33 Jul-09 5,948.75 4,641.05 3.00 42.99 321.65 147.29 Jun-09 8,064.74 7,576.99 3.00 5.81 253.20 N/A May-09 5,152.75 2,629.00 9.40 32.50 319.67 40.39 Apr-09 4,738.60 3,344.00 4.50 39.05 1,030.07 76.82 Mar-09 2.29 3,066.85 5.00 35.58 644.95 209.82 Feb-09 2.29 3,657.98 0.70 45.93 759.36 670.17 Jan-09 2.70 3,009.97 5.90 248.61 1,178.85 50.21 Dec-08 2.30 1,698.04 35.10 3.90 1,318.71 0.80 Nov-08 2.50 2,924.02 N/A 1.44 2,151.51 30.20 Oct-08 2.28 2,847.91 N/A 1.21 6,171.48 32.60 Sep-08 0.70 2,665.93 N/A 4.67 5,523.64 19.44 Aug-08 35.80 3,984.93 N/A 2.88 404.84 N/A Jul-08 0.39 5,204.82 1.10 11.32 618.04 2.82 Jun-08 0.10 4,917.98 0.90 12.67 867.55 0.01 May-08 0.80 3,365.89 N/A 10.40 1,821.22 240.28 Apr-08 0.10 5,370.92 N/A N/A 872.71 0.01 Mar-08 0.20 5,918.02 25.05 N/A 1,946.20 0.27 Feb-08 0.40 5,721.89 150.80 1.50 4,279.68 43.59 Jan-08 0.40 5,628.19 15.84 N/A 3,345.31 1,018.38 Dec-07 0.60 3,766.08 N/A N/A 7,083.44 187.66 Nov-07 1.01 4,340.02 N/A N/A 13,199.15 1,028.41 Oct-07 0.20 5,555.00 N/A N/A 30,544.00 1,809.40 Sep-07 1.80 4,473.07 15.00 4.86 19,732.55 620.38 Aug-07 4.16 4,302.94 77.01 4.00 1,472.19 151.11 Jul-07 2.10 6,691.00 N/A 6.30 1,246.71 9.79 Jun-07 5.90 6,099.07 3.00 9.36 669.46 599.66 May-07 1.50 4,794.86 N/A 23.28 1,567.86 1,849.71 Apr-07 0.70 4,692.11 4.30 28.75 955.93 2,224.29 Mar-07 0.58 4,953.08 68.48 35.91 741.22 2,576.18 Feb-07 0.60 2,236.92 50.80 35.19 1,157.07 2,934.79 Jan-07 1.20 4,626.99 N/A N/A 2,229.73 357.06 Dec-06 6.21 3,041.91 N/A N/A 3,222.25 95.54 Nov-06 3.80 3,981.95 N/A N/A 4,880.58 412.56 Oct-06 3.00 2,895.01 N/A N/A 12,590.68 689.18 Sep-06 9.30 5,151.99 0.10 N/A 22,789.88 1,180.77 Aug-06 2.56 5,693.00 N/A N/A 2,288.10 74.92 Jul-06 2.61 4,678.99 N/A N/A 210.91 114.20 Jun-06 0.79 3,878.07 N/A N/A 252.79 0.81 May-06 0.20 4,371.00 81.00 N/A 223.67 3.20 Apr-06 0.70 4,348.05 1,370.39 N/A 157.31 95.61
Note: N/A - Not AvailableSource: Dept.of Agriculture, GOI
Commodity Insights Yearbook 2011262
178_300_CYIB_2011_Agri_final.indd 262178_300_CYIB_2011_Agri_final.indd 262 1/26/2012 1:29:25 AM1/26/2012 1:29:25 AM

DATABANK - NON-AGRI COMMODITIES
Urad Chanah Rajasthan Orissa Andhra Pradesh Rajasthan Maharashtra Madhya Pradesh Uttar Pradesh
3,325.04 697.34 14,279.68 10,694.39 61,181.69 58,117.32 16,956.462,988.91 477.22 27,557.24 2,971.60 40,048.96 3,052.11 13,408.77
15,033.51 491.48 22,338.14 2,417.80 5,900.23 2,740.30 22,989.6315,103.14 1,331.46 3,979.84 2,429.27 6,142.46 9,403.68 21,796.0919,027.91 976.36 5,590.94 2,126.95 6,836.94 11,972.77 19,381.52
23,458.92 1,215.46 6,580.89 5,905.09 10,067.38 12,054.48 16,725.571,677.00 1,100.02 44,510.27 6,249.72 7,343.21 10,889.30 17,498.63
261.14 1,224.61 9,465.05 5,487.25 10,630.83 14,924.57 13,279.23555.12 1,186.34 9,434.93 10,071.10 13,725.52 24,273.81 16,447.61
1,881.43 1,038.97 8,908.03 5,155.94 17,845.44 32,746.46 13,402.279,706.18 589.78 7,336.17 7,630.39 30,288.91 38,332.42 23,872.04
24,507.23 877.28 13,613.94 36,297.03 55,223.25 42,685.21 22,237.04N/A 958.91 17,268.07 4,514.33 74,100.56 58,517.82 10,809.56N/A 601.31 17,921.51 1,197.10 44,150.51 13,770.36 7,984.98N/A 291.11 3,521.28 368.76 12,659.37 3,269.88 11,201.38N/A 369.11 1,002.59 724.63 7,568.23 3,228.88 12,136.36N/A 65.80 1,713.49 976.63 9,080.76 5,602.73 12,931.81N/A 86.71 5,784.02 1,345.90 10,756.67 9,684.22 16,552.09N/A 175.94 4,322.60 2,283.95 6,258.12 9,873.11 16,553.59N/A 100.99 777.49 1,312.32 9,164.78 5,143.60 11,639.87N/A 45.62 1,672.39 3,952.43 13,756.04 4,013.96 13,054.57N/A 207.62 3,501.39 6,615.99 15,448.22 3,581.21 18,669.05N/A 299.08 1,156.60 14,038.85 27,852.73 5,255.92 17,605.35N/A 690.01 1,632.08 54,569.68 37,512.87 7,325.68 21,252.36N/A 1,602.91 1,833.26 6,225.59 41,722.88 4,213.21 36,140.38N/A 1,550.57 1,089.96 1,043.05 37,922.18 973.69 7,426.43N/A 1,140.97 564.42 867.80 13,615.67 2,860.01 5,429.01
3,425.95 3,011.97 106.41 1,212.63 4,043.66 880.57 8,490.045,033.74 680.77 94.00 3,607.89 3,778.59 709.20 10,164.797,709.44 553.51 260.14 1,031.01 5,251.67 529.24 7,188.55
N/A 2,716.32 197.92 2,429.70 3,304.92 928.75 7,609.954,641.13 312.62 0.75 1,338.58 3,255.73 1,285.31 5,488.918,726.76 623.52 0.52 5,556.41 5,964.19 1,851.37 9,050.45
13,655.27 776.20 0.95 6,077.65 15,298.62 2,377.20 6,297.6016,411.21 937.91 1.08 22,199.63 23,749.90 3,681.21 8,809.48
15,362.62 812.84 0.81 30,419.13 17,312.47 5,480.34 9,503.344,418.10 1,243.41 0.97 1,808.83 35,006.80 4,958.56 8,314.653,780.60 1,068.76 2.33 616.51 50,680.81 10,591.43 3,820.104,225.97 1,026.73 2.32 678.69 11,692.31 3,857.08 3,668.243,499.44 956.59 266.46 393.16 2,190.89 1,646.03 7,910.155,559.06 936.30 426.28 521.04 2,673.87 2,872.39 3,386.668,503.83 491.80 854.07 1,901.28 4,632.76 2,550.09 4,194.582,703.09 893.80 144.38 598.28 2,134.20 9,784.60 4,754.161,164.19 704.94 11.72 1,710.98 4,870.63 1,502.59 5,312.631,865.18 664.01 56.99 2,217.22 6,475.31 1,926.36 4,956.765,152.58 2,491.80 95.47 5,069.43 11,248.73 2,840.89 6,835.38
23,185.44 511.14 391.95 20,320.10 17,179.89 3,419.77 6,205.7236,778.27 587.55 516.76 18,273.81 37,722.69 14,189.12 5,874.73
2,076.61 623.36 986.39 850.17 30,576.17 15,281.56 586,076.36130.80 685.09 861.84 243.46 39,634.72 5,456.27 4,028.14242.21 632.07 1,390.69 77.05 9,192.10 625.26 6,699.60
564.46 416.44 319.94 64.55 1,250.90 2,084.60 8,550.321,792.26 221.48 88.81 127.97 1,710.94 2,503.14 7,852.723,723.51 249.60 407.30 257.54 2,307.48 3,459.27 5,997.481,099.27 75.70 982.60 324.05 2,341.42 4,024.00 6,393.26600.82 463.89 1,677.94 525.29 2,286.42 4,403.98 6,347.27176.98 473.77 681.17 452.69 2,192.49 5,821.21 10,953.65374.68 111.34 818.17 1,415.68 6,074.45 8,782.24 22,115.67
1,254.93 864.56 1,069.60 4,592.57 12,273.62 17,274.11 25,060.282,423.76 1,892.52 328.66 11,194.51 23,591.83 25,435.29 30,183.86
A PwC & MCX Joint Endeavour 263www.mcxindia.com / www.pwc.com/in/en
DATABANK - AGRI COMMODITIES
178_300_CYIB_2011_Agri_final.indd 263178_300_CYIB_2011_Agri_final.indd 263 1/26/2012 1:29:25 AM1/26/2012 1:29:25 AM

EDITORIALSPROLOGUE INDIAN ECONOMYEXPERTS' VIEWS
Chana prices and trading activity Monthly MCX futures prices (Rs/qtl) MCX Spot - Delhi (Rs/qtl) Month Open High Low Close Volume Open Monthly Month's in lots^ interest average high in lots^^ Dec-10 2475 2491 2377 2422 511 44 2444 2490 Nov-10 2332 2479 2251 2465 1140 138 2435 2515 Oct-10 2178 2357 2080 2324 3018 688 2340 2408 Sep-10 2184 2199 2049 2173 4409 1632 2261 2343 Aug-10 2227 2258 2126 2186 6068 1619 2259 2280 Jul-10 2200 2365 2130 2219 8779 1732 2236 2299 Jun-10 2202 2212 2040 2193 10514 2586 2121 2206 May-10 2206 2235 2120 2205 7328 2324 2136 2191 Apr-10 2353 2490 2214 2237 10465 2480 2210 2340 Mar-10 2188 2425 2118 2349 5180 1445 2186 2320 Feb-10 2140 2225 2095 2188 3065 297 2225 2290 Jan-10 2470 2475 2131 2169 6253 581 2344 2425 Dec-09 2685 2690 2452 2472 4186 768 2462 2513 Nov-09 2483 2726 2448 2684 12554 1108 2504 2619 Oct-09 2312 2498 2215 2483 16981 836 2330 2472 Sep-09 2196 2364 2151 2294 19554 724 2305 2387 Aug-09 2455 2602 2033 2202 37691 1371 2347 2502 Jul-09 2219 2555 2188 2451 44322 1854 2351 2520 Jun-09 2148 2218 2086 2214 34600 1546 2145 2204 May-09 2330 2363 2115 2155 42813 1555 2204 2255 Apr-09 2188 2452 2168 2330 60235 1528 2251 2326 Mar-09 2192 2279 2175 2185 35173 813 2137 2179 Feb-09 2370 2405 2197 2207 27492 473 2190 2255 Jan-09 2082 2402 2060 2388 18928 721 2151 2301 Dec-08 2250 2262 2003 2076 9366 136 2203 2295 Nov-08 N/T N/T N/T N/T N/T N/T 2250 2340 Oct-08 N/T N/T N/T N/T N/T N/T 2307 2440 Sep-08 N/T N/T N/T N/T N/T N/T 2481 2530 Aug-08 N/T N/T N/T N/T N/T N/T 2546 2610 Jul-08 N/T N/T N/T N/T N/T N/T 2533 2635 Jun-08 N/T N/T N/T N/T N/T N/T 2415 2500 May-08 2488 2488 2395 2409 261 0 2376 2515 Apr-08 2630 2630 2498 2502 7817 420 2511 2665 Mar-08 2660 2693 2379 2630 53060 405 2733 2870 Feb-08 2900 3013 2659 2732 83144 1601 2526 2891 Jan-08 2240 2884 2240 2883 72574 1286 2199 2244 Dec-07 2118 2263 2104 2242 38003 317 2208 2301 Nov-07 2278 2278 2115 2118 21302 224 2353 2407 Oct-07 2369 2389 2264 2264 15495 283 2391 2449 Sep-07 2318 2429 2243 2370 12345 354 2307 2340 Aug-07 2255 2320 2150 2312 9755 490 2322 2368 Jul-07 2247 2355 2205 2256 11363 323 2347 2386 Jun-07 2355 2355 2245 2254 10661 436 2233 2355 May-07 2184 2216 2147 2206 14886 379 2200 2249 Apr-07 2265 2342 2079 2185 3256 273 2315 2502 Mar-07 2350 2424 2200 2254 54570 76 2301 2509 Feb-07 2102 2417 2011 2404 16235 116 2442 2605 Jan-07 2580 2595 2077 2125 16636 156 2539 2822 Dec-06 2435 2604 2255 2522 9118 171 2759 2910 Nov-06 2871 2953 2450 2471 10683 407 2955 3190 Oct-06 3255 3278 2805 2902 3390 402 3183 3270 Sep-06 3318 3362 3108 3235 6024 416 3054 3330 Aug-06 2655 3356 2635 3335 6291 701 2570 2759 Jul-06 2420 2766 2327 2664 14254 1020 2326 2432 Jun-06 2195 2476 2105 2424 25726 1284 2365 2473 May-06 2439 2630 2057 2190 36466 1647 2410 2520 Apr-06 2295 2603 2241 2447 42321 1824 2144 2206
Note: N/T - Not Traded; N/A - Not Available; ^Aggregate volume in all contracts during the month; ^^Cumulative open interest in all contracts at the end of month. Trading in chana futures were sSource: MCX, Agmarknet; Ministry of Commerce and Industry
Commodity Insights Yearbook 2011264
178_300_CYIB_2011_Agri_final.indd 264178_300_CYIB_2011_Agri_final.indd 264 1/26/2012 1:29:25 AM1/26/2012 1:29:25 AM
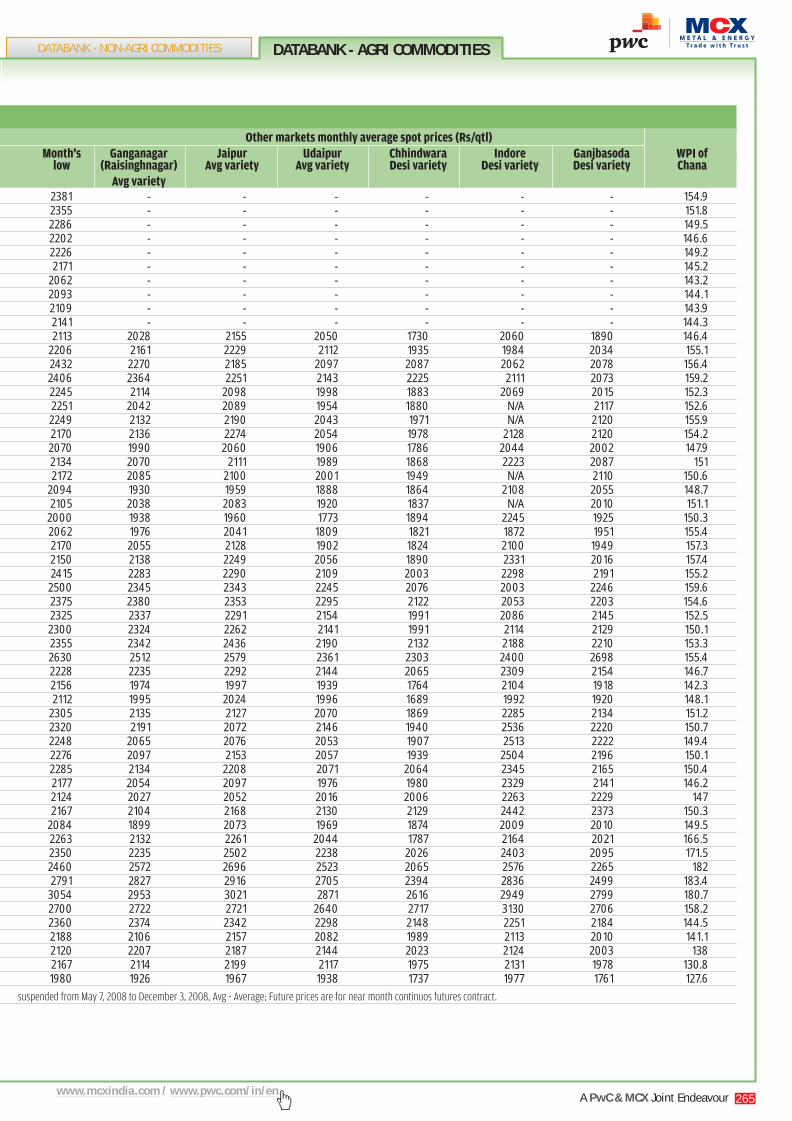
DATABANK - NON-AGRI COMMODITIES
Other markets monthly average spot prices (Rs/qtl)Month's Ganganagar Jaipur Udaipur Chhindwara Indore Ganjbasoda WPI of
low (Raisinghnagar) Avg variety Avg variety Desi variety Desi variety Desi variety Chana Avg variety
2381 - - - - - - 154.92355 - - - - - - 151.82286 - - - - - - 149.52202 - - - - - - 146.62226 - - - - - - 149.22171 - - - - - - 145.2
2062 - - - - - - 143.22093 - - - - - - 144.12109 - - - - - - 143.92141 - - - - - - 144.32113 2028 2155 2050 1730 2060 1890 146.4
2206 2161 2229 2112 1935 1984 2034 155.12432 2270 2185 2097 2087 2062 2078 156.42406 2364 2251 2143 2225 2111 2073 159.22245 2114 2098 1998 1883 2069 2015 152.32251 2042 2089 1954 1880 N/A 2117 152.62249 2132 2190 2043 1971 N/A 2120 155.92170 2136 2274 2054 1978 2128 2120 154.22070 1990 2060 1906 1786 2044 2002 147.92134 2070 2111 1989 1868 2223 2087 1512172 2085 2100 2001 1949 N/A 2110 150.6
2094 1930 1959 1888 1864 2108 2055 148.72105 2038 2083 1920 1837 N/A 2010 151.1
2000 1938 1960 1773 1894 2245 1925 150.32062 1976 2041 1809 1821 1872 1951 155.42170 2055 2128 1902 1824 2100 1949 157.32150 2138 2249 2056 1890 2331 2016 157.42415 2283 2290 2109 2003 2298 2191 155.22500 2345 2343 2245 2076 2003 2246 159.62375 2380 2353 2295 2122 2053 2203 154.62325 2337 2291 2154 1991 2086 2145 152.52300 2324 2262 2141 1991 2114 2129 150.12355 2342 2436 2190 2132 2188 2210 153.32630 2512 2579 2361 2303 2400 2698 155.42228 2235 2292 2144 2065 2309 2154 146.72156 1974 1997 1939 1764 2104 1918 142.32112 1995 2024 1996 1689 1992 1920 148.1
2305 2135 2127 2070 1869 2285 2134 151.22320 2191 2072 2146 1940 2536 2220 150.72248 2065 2076 2053 1907 2513 2222 149.42276 2097 2153 2057 1939 2504 2196 150.12285 2134 2208 2071 2064 2345 2165 150.42177 2054 2097 1976 1980 2329 2141 146.22124 2027 2052 2016 2006 2263 2229 1472167 2104 2168 2130 2129 2442 2373 150.3
2084 1899 2073 1969 1874 2009 2010 149.52263 2132 2261 2044 1787 2164 2021 166.52350 2235 2502 2238 2026 2403 2095 171.52460 2572 2696 2523 2065 2576 2265 1822791 2827 2916 2705 2394 2836 2499 183.43054 2953 3021 2871 2616 2949 2799 180.72700 2722 2721 2640 2717 3130 2706 158.22360 2374 2342 2298 2148 2251 2184 144.52188 2106 2157 2082 1989 2113 2010 141.12120 2207 2187 2144 2023 2124 2003 1382167 2114 2199 2117 1975 2131 1978 130.81980 1926 1967 1938 1737 1977 1761 127.6
were suspended from May 7, 2008 to December 3, 2008, Avg - Average; Future prices are for near month continuos futures contract.
A PwC & MCX Joint Endeavour 265www.mcxindia.com / www.pwc.com/in/en
DATABANK - AGRI COMMODITIES
178_300_CYIB_2011_Agri_final.indd 265178_300_CYIB_2011_Agri_final.indd 265 1/26/2012 1:29:25 AM1/26/2012 1:29:25 AM

EDITORIALSPROLOGUE INDIAN ECONOMYEXPERTS' VIEWS
Tur (Arhar) Tur (Arhar) prices Other market's monthly average spot prices (Rs/qtl)Month Central Delh Bhopal Indore Bidar Raichur WPI of Tur Avg variety Avg variety Avg variety (Basavakalyam) FAQ variety FAQ varietyMar-11 - - - - - 199.5Feb-11 - - - - - 202.8Jan-11 - - - - - 190.4Dec-10 - - - - - 181.7Nov-10 - - - - - 185.6Oct-10 - - - - - 196.9Sep-10 - - - - - 203.2Aug-10 - - - - - 199.4Jul-10 - - - - - 222.8Jun-10 - - - - - 225.6May-10 - - - - - 228.6Apr-10 - - - - - 224.3Mar-10 N/A N/A N/A N/A N/A 220.1Feb-10 N/A 2991 3019 N/A N/A 231Jan-10 4350 3183 3464 N/A N/A 262.7Dec-09 4350 3047 3530 N/A N/A 236.2Nov-09 4350 3185 4550 N/A N/A 237.2Oct-09 4350 N/A N/A N/A N/A 224.7Sep-09 4350 N/A N/A N/A N/A 221.3Aug-09 4424 3505 N/A N/A 3510 220.3Jul-09 4333 3960 N/A 5335 3623 206.8Jun-09 3235 3174 3405 3768 3244 181.1May-09 3235 3305 2886 4021 3131 170.1Apr-09 3235 3156 2962 3337 3271 164.9Mar-09 3235 3001 2516 3181 3069 156.4Feb-09 3307 2791 2781 3167 3119 153.8Jan-09 3115 2579 2630 3035 3141 148.7Dec-08 2697 2410 2050 2694 2801 148.4Nov-08 2863 2321 2053 2597 2298 148.4Oct-08 3256 2444 2504 2986 2524 148.9Sep-08 3207 2561 2184 2897 2167 147.1Aug-08 3166 2591 2212 3999 2232 146.3Jul-08 3074 2573 2414 2914 2397 138.3Jun-08 2858 2439 2250 2491 2033 131.8May-08 2695 2128 2103 2290 2057 129.7Apr-08 2673 2203 2253 2321 2117 133.5Mar-08 2826 2380 2169 2380 2409 136.2Feb-08 2666 2319 2359 2228 2231 128.6Jan-08 2466 2063 1997 2112 2131 130.2Dec-07 2738 2061 N/A 2350 2409 131.4Nov-07 2902 2007 2568 2315 2096 131.2Oct-07 2806 1861 2559 2280 2089 127.4Sep-07 2512 1831 1813 2230 1718 126.2Aug-07 2626 2035 1979 2271 1647 126.3Jul-07 2550 2139 2130 2242 1962 121.7Jun-07 2518 1959 2016 2050 1841 117.9May-07 2449 2019 1797 2052 1754 117.9Apr-07 2488 2096 1759 N/A 1997 118Mar-07 2410 2086 1844 N/A 2000 115.4Feb-07 2331 1986 1968 N/A 1983 118Jan-07 2244 1854 1666 N/A 1988 112Dec-06 1963 1527 1304 N/A 1782 110.6Nov-06 1923 1438 1635 1782 1445 110.3Oct-06 1980 1505 1555 1750 1544 113.2Sep-06 2157 1550 1569 1944 1514 111Aug-06 1953 1537 1535 1717 1395 102.8Jul-06 1931 1494 1477 1684 1413 100.7Jun-06 1991 1546 1581 1702 1435 103.2May-06 2053 1670 1670 1806 1516 101.4Apr-06 2028 1676 1510 1794 1611 101.1
Note: N/A - Not Available, Futures trading Tur/Arhar is suspended since Feb 2007, Avg - Average;Source: MCX, Agmarknet; Ministry of Commerce and Industry
Commodity Insights Yearbook 2011266
178_300_CYIB_2011_Agri_final.indd 266178_300_CYIB_2011_Agri_final.indd 266 1/26/2012 1:29:26 AM1/26/2012 1:29:26 AM

DATABANK - NON-AGRI COMMODITIES
Urad (Black Gram) pricesMonth Other market's monthly average spot prices (Rs/qtl) Central Delhi Ganganagar WPI of Urad average variety desi variety
Mar-11 - - 250.3Feb-11 - - 250.1Jan-11 - - 252.1Dec-10 - - 255.5Nov-10 - - 260.2Oct-10 - - 285.5Sep-10 - - 292.6Aug-10 - - 294.9Jul-10 - - 294.2Jun-10 - - 287.2May-10 - - 275.7Apr-10 - - 261.6Mar-10 N/A N/A 255.3Feb-10 N/A N/A 266.1Jan-10 4157 N/A 283.1Dec-09 4538 N/A 273.9Nov-09 5006 N/A 263.5Oct-09 4597 N/A 233.7Sep-09 4032 N/A 215.4Aug-09 4570 N/A 211.9Jul-09 3759 N/A 196.4Jun-09 3108 N/A 183.2May-09 3077 N/A 180Apr-09 3015 N/A 178.7Mar-09 3001 N/A 170.4Feb-09 2997 N/A 168.6Jan-09 2823 N/A 165.8Dec-08 2668 N/A 164.7Nov-08 2749 N/A 163.7Oct-08 2944 N/A 164Sep-08 2884 N/A 163.4Aug-08 2869 N/A 161.3Jul-08 2887 N/A 154.3Jun-08 2482 N/A 147.3May-08 2418 N/A 145.4Apr-08 2261 N/A 148.5Mar-08 2367 N/A 146.9Feb-08 2196 N/A 137.6Jan-08 1963 2027 137.9Dec-07 1997 2003 146.4Nov-07 2087 N/A 151.4Oct-07 2381 N/A 165.1Sep-07 2301 N/A 166Aug-07 2314 2169 170.5Jul-07 2291 2208 171.8Jun-07 2184 2072 170.6May-07 2269 1997 173.8Apr-07 2631 2081 179.2Mar-07 3123 2461 179.8Feb-07 3323 2031 190.5Jan-07 3343 2328 187.5Dec-06 3188 N/A 201.7Nov-06 3416 N/A 209.3Oct-06 3583 2976 217.3Sep-06 3782 2757 200Aug-06 3503 2458 187.9Jul-06 3251 2099 184.9Jun-06 3272 2135 186.1May-06 3770 2316 179.2Apr-06 3697 1935 171.8
Note: N/A - Not Available; Futures trading Urad is suspended since Feb 2007Source: MCX, Agmarknet; Ministry of Commerce and Industry
A PwC & MCX Joint Endeavour 267www.mcxindia.com / www.pwc.com/in/en
DATABANK - AGRI COMMODITIES
178_300_CYIB_2011_Agri_final.indd 267178_300_CYIB_2011_Agri_final.indd 267 1/26/2012 1:29:26 AM1/26/2012 1:29:26 AM

EDITORIALSPROLOGUE INDIAN ECONOMYEXPERTS' VIEWS
A spice is a dried seed, fruit, root, bark, or vegetative
substance. Used in nutritionally insignifi cant quantities
as a food additive for fl avor, color, or as a preservative,
spices kill harmful bacteria or prevent their growth. A
spice may be used to fl avour a dish or to hide other obnoxious
fl avours. In the kitchen, spices are distinguished from herbs,
which are leafy, green plant parts used for fl avoring or as garnish.
The word “spice” comes from the Old French word “espice”,
which became “epice” and which came from the Latin root
“spec”, the noun referring to appearance. In India, spices are
mainly used to rustle up scrumptious delicacies. Many spices
are also used for other purposes, such as medicine, religious
rituals, cosmetics, and perfumery or for eating as vegetables.
For example, turmeric is also used as a preservative; liquorice
as a medicine; garlic as a vegetable. The fl avour of a spice is
derived in part from compounds that oxidise or evaporate when
exposed to air.
India is known as the home of spices and produces a wide
variety of spices like black pepper, cardamom (small and large),
ginger, garlic, turmeric, chilli, etc. It is the largest producer,
consumer and exporter of spices and spice products.
India is the only country that produces all major
spices: 75 variants of the 109 listed with the Interna-
tional Organization for Standardization (ISO).
Spices play an important role in the Indian
economy. The country produces about 5 million
tonnes of spices every year and exports more than
10% of the produce or about 500,000 tonnes,
including value-added products. The world import of
spices is estimated at a little over 1 million tonnes,
of which India shares about 48%, according to the
Spices Board of India.
Cardamom futures on the MCX platform opened
at Rs.1,138.60 a kg in 2010 and moved up steadily
until mid-June — the fag end of the season. Strong
Spices Flavouring the dish
Commodity in 2010 Exchange (contract) Price Unit Open High Low Close Annualised
VolatilityVolume (in lots)
Cardamom MCX (100 kgs) Rs/ kg 1,118.00 2,097.00 868.00 1,581.40 56.70% 635,749 Note: ^All contracts - all variants; Source: Exchanges’ websites
export and domestic demand, in the wake of lower output in
Guatemala — India’s lone competitor in the cardamom segment
and the world’s largest producer of the small variant, buoyed
cardamom prices in the domestic market. The prices touched
an all-time high of Rs.2,097 on June 11, 2010. Thereafter, the
prices began to decline on expectations of an increase of 20%
year-on-year in production on the back of good monsoon rains.
The estimated increased output, according to trade sources,
stood at around 12,000 tonnes in 20010-11.
During the harvest season, the prices remained under
pressure because buyers were waiting for the prices to come
down before they began buying cardamom for the new season.
As a result, by October-end, futures prices of cardamom touched
a low of Rs.868 a kg.
Attracted by lower prices, traders began stocking the spice
for the forthcoming festive season. However, with the season,
especially Diwali, approaching, both spot and futures prices of
cardamom started to rise again. This was followed by the export
season of November and December. Overall, cardamom prices
increased by 38.9% year-on-year.
MCX Cardamom futures prices in 2010
Source: Metastocks Cardamom (Rs/kg)
Year low at Rs.868/kg on expectations of a rise of 20% y-o-y in production
owing to good monsoon
Higher export demand and farm-ers’ reluctance to
sell the produce at lower prices
Year high at Rs.2,097/kg on lower production in Guate-mala and robust domestic
and export demand
1-Jan
-10
29-Ja
n-10
26-F
eb-1
0
26-M
ar-1
0
23-A
pr-1
0
21-M
ay-1
0
18-Ju
n-10
16-Ju
l-10
13-A
ug-1
0
10-S
ep-1
0
8-Oc
t-10
5-No
v-10
3-De
c-10
31-D
ec-1
0
2300
2100
1900
1700
1500
1300
1100
900
700
Commodity Insights Yearbook 2011268
178_300_CYIB_2011_Agri_final.indd 268178_300_CYIB_2011_Agri_final.indd 268 1/26/2012 1:29:26 AM1/26/2012 1:29:26 AM

DATABANK - NON-AGRI COMMODITIES
A PwC & MCX Joint Endeavour 269www.mcxindia.com / www.pwc.com/in/en
DATABANK - AGRI COMMODITIES
Registered Office: Kotak Commodity Services Ltd., Nirlon house, 1st Floor, Dr. Annie Besant Road, Opp. Sasmira,Near Passport Office , Worli, Mumbai - 400025.
MCX/TCM/CORP/0479.MCX-10440. NCDEX/TCM/CORP/0479.NCDEX-00155. ACEL/TCM/CORP/0235, ACEL Trading Member Id: 6060.
Explore Trading Opportunities with Kotak CommodityKotak Commodity Services Ltd (KCSL) is one of the leading commodity broking firms in India offering high-end products and services, catering to the broad spectrum of market participants. It is a trading-cum-clearing member of the leading national level commodity exchanges, MCX, NCDEX & ACE.
Kotak Ginning & Pressing Industries, now a division of Kotak Commodity Services Ltd, trades in raw cotton globally as well as in domestic markets. KCSL also offers marketing service for products like cotton seeds, waste, all types of yarn, fabrics, made-ups & garments etc.
Variety is the spice of good returnsDiversify your portfolio by investing in the vibrant commodity market
To know more SMS KCL to 5676788
or Call: 1800 102 6776
178_300_CYIB_2011_Agri_final.indd 269178_300_CYIB_2011_Agri_final.indd 269 1/26/2012 1:29:35 AM1/26/2012 1:29:35 AM

EDITORIALSPROLOGUE INDIAN ECONOMYEXPERTS' VIEWS
Spices - Production in India (in `000' tonnes)Country 2010-11 2009-10 2008-09 2007-08 2006-07 2001-02
Turmeric 988.92 792.98 892.21 826.03 856.46 552.95Pepper 48.00 55.00 46.74 50.00 50.00 80.00Small Cardamom 10.38 10.08 10.99 9.45 11.23 11.37Red Chilli 1212.06 1202.94 1353.80 1371.25 1325.27 1116.59Cumin seed 316.91 156.33 283.00 264.86 176.51 206.41Total Spices - - 5278.85 5066.78 4664.00 -
Source: Spices Board, India, Trade Sources
Spices - Item wise exports from India (in `000' tonnes & value in Rs crores)Item 2010-11 (E) 2009-10 2008-09 2007-08 2006-07 2001-02 Qty Value Qty Value Qty Value Qty Value Qty Value Qty Value
Pepper 18.85 383.19 19.75 313.93 25.25 413.74 35.00 519.50 28.75 306.20 22.88 203.69Cardamom small 1.18 132.16 1.98 165.70 7.50 47.27 0.50 24.75 0.65 22.36 1.03 61.68Chilli 240.00 1535.54 204.00 1291.73 188.00 1080.95 209.00 1097.50 148.50 807.75 70.00 252.44Turmeric 49.25 702.85 50.75 381.23 52.50 248.58 49.25 157.00 51.50 164.80 37.78 90.74Cumin 32.50 395.98 49.75 548.25 52.55 544.00 28.00 291.50 26.00 201.50 17.25 148.18Others# 183.98 3690.99 176.53 2859.67 144.72 2965.73 122.50 2345.25 118.35 2073.14 94.27 1183.83Total 525.75 6840.71 502.75 5560.50 470.52 5300.26 444.25 4435.50 373.75 3575.75 243.20 1940.55
Note: #: Include Asafoetida, Cassia, Saffron, Tamarinda, Ajvanseed, Dill Seed, Poppy Seed, Aniseed, Ginger, vanilla, fennel, coriander oils and oleoresins Etc. Source: DGCI&S., Kolkata
Spices - Item wise imports into India (in '000' tonnes & value in Rs crores)Item 2010-11 (E) 2009-10 2008-09 2007-08 2006-07 2001-02 Qty Value Qty Value Qty Value Qty Value Qty Value Qty Value
Pepper 16.10 270.11 18.10 234.66 10.75 176.65 13.50 193.89 15.70 135.97 6.33 56.36Cardamom(small) 0.08 6.57 0.10 3.36 0.18 3.09 0.88 8.68 0.62 5.69 0.32 8.26Chilli 0.45 4.08 1.30 7.50 0.82 6.57 0.48 3.61 1.60 10.30 1.11 4.31Turmeric 3.90 42.21 4.45 20.87 2.53 8.20 4.65 12.27 7.00 25.20 0.12 0.12Cumin black/white 0.52 5.93 1.60 16.31 0.19 2.42 2.00 18.50 1.19 10.10 0.96 7.29Other spices # 65.74 846.61 81.16 817.77 69.08 568.45 68.50 403.55 100.68 601.82 Total 86.78 1175.51 106.70 1100.46 83.55 765.39 90.00 645.50 126.79 789.08 86.34 505.08Value (USD in million) 257.00 232.33 167.55 160.60 174.32
Note: # include aniseed, asafoetida, cinnamon, pepper long, cambodge, herbal spices, ginger, cardamom large, coriander, etc; E=estimates. Source: DGCI&S., Kolkata
Average daily volatility of MCX spot pricesVolatility 2010-11 2009-10 2008-09 2007-08 2006-07
Cardamom 3.39% 1.63% 1.32% 0.54% 3.11%Cumin Seed 0.91% 0.81% 1.10% 0.81% 1.10%Pepper 1.41% 1.17% 1.11% 1.24% 1.42%Red Chilli 0.63% 1.27% 1.11% 1.31% 2.00%Turmeric 1.76% 2.34% 1.31% 0.84% -
Source: MCX
Commodity Insights Yearbook 2011270
178_300_CYIB_2011_Agri_final.indd 270178_300_CYIB_2011_Agri_final.indd 270 1/26/2012 1:29:36 AM1/26/2012 1:29:36 AM

DATABANK - NON-AGRI COMMODITIES
Spices - State-wise monthly arrivals of spices (in tonnes) Small Red Chilli Cumin seed (jeera) TurmericMonth Cardamom Kerala Andhra Rajasthan Gujarat Madhya Orissa Tamil Nadu Pradesh Pradesh
Apr-11 47.46 N/A 5352.81 10664.25 17.00 N/A 1255.53Mar-11 139.08 N/A 5984.63 10587.56 52.67 N/A 1766.52Feb-11 37.68 N/A 221.20 7697.88 8.17 N/A 1007.01Jan-11 54.15 N/A 181.22 14954.52 4.94 N/A 7904.36Dec-10 3.64 240.00 54.96 5156.04 2.56 N/A 1442.10Nov-10 114.64 N/A 44.03 15136.78 7.02 N/A 2225.16Oct-10 89.80 1604.00 52.02 1684.08 5.44 N/A 1597.47Sep-10 91.66 1033.98 122.23 1755.04 10.44 N/A 1237.82Aug-10 91.55 N/A 124.65 2705.01 9.66 0.50 916.57Jul-10 69.94 N/A 316.53 7412.35 32.40 N/A 1326.38Jun-10 59.40 N/A 213.90 5580.79 30.24 1.20 1282.32May-10 2.61 N/A 466.12 8781.76 17.02 N/A 2893.75Apr-10 0.92 200.13 1555.47 17415.77 36.30 1.20 35.00Mar-10 3.03 600.48 997.45 25257.81 N/A N/A 37.67Feb-10 0.10 N/A 38.94 29766.81 3.80 N/A N/AJan-10 0.24 N/A 31.40 2310.52 N/A N/A 11.50Dec-09 0.04 N/A 106.74 4283.09 1.80 N/A 4.50Nov-09 0.06 N/A 149.19 24584.19 79.59 N/A 3.30Oct-09 0.05 N/A 157.33 18404.44 13.68 N/A 18.00Sep-09 0.05 N/A 31.74 14533.79 18.36 N/A 8.75Aug-09 0.14 N/A 63.38 19372.93 8.46 N/A 27.50Jul-09 0.08 N/A 66.56 14659.52 N/A N/A 15.83Jun-09 0.07 N/A 92.70 6429.20 N/A N/A 16.88May-09 0.08 N/A 177.85 9100.63 6.00 N/A 24.29Apr-09 0.07 N/A 834.17 18815.69 53.96 N/A 21.33Mar-09 3.60 N/A 2442.40 39108.25 72.00 N/A 90.12Feb-09 0.05 N/A 225.27 32532.66 84.00 N/A 13.00Jan-09 0.07 N/A 31.40 8312.61 104.00 N/A 10.00Dec-08 0.02 N/A 23.31 4466.09 68.00 N/A 11.00Nov-08 0.05 N/A 54.10 4296.67 48.00 N/A 16.37Oct-08 0.05 N/A 112.57 2539.60 60.00 N/A 7.00Sep-08 0.00 N/A 69.58 3566.89 40.00 N/A 8.00Aug-08 0.06 N/A 209.86 1786.28 88.00 N/A 10.00Jul-08 0.07 N/A 283.98 6573.97 72.00 N/A 17.00Jun-08 0.06 N/A 901.70 12713.17 44.00 N/A 21.80May-08 0.07 N/A 2286.44 17605.50 76.00 N/A 19.00Apr-08 0.08 N/A 4247.57 22624.62 88.00 N/A 19.38Mar-08 0.07 0.02 572.08 16754.93 84.00 N/A 6.60Feb-08 0.06 N/A 118.72 6063.85 76.00 N/A 12.57Jan-08 0.06 N/A 126.33 1569.84 40.00 N/A 11.23Dec-07 0.08 0.01 43.66 1149.65 4.00 N/A 8.08Nov-07 0.06 0.30 323.60 1240.66 4.00 N/A 21.60Oct-07 0.07 8.40 288.29 1811.38 8.00 N/A 27.67Sep-07 0.08 N/A 114.01 956.80 12.00 N/A 10.00Aug-07 0.05 18.60 65.27 1816.91 64.00 N/A 15.00Jul-07 0.07 N/A 71.00 1815.23 88.00 N/A 15.62Jun-07 0.07 N/A 134.21 2201.53 40.00 N/A 20.00May-07 0.06 N/A 181.96 2072.40 24.00 N/A 26.25Apr-07 0.07 0.40 320.34 2705.54 28.00 N/A 40.97Mar-07 0.18 33.10 1344.75 6018.61 28.00 N/A 26.50Feb-07 0.32 N/A 907.11 5591.18 16.00 N/A 21.60Jan-07 0.42 N/A 70.64 6732.58 36.00 N/A 20.00Dec-06 0.24 N/A 50.95 7925.00 20.00 0.10 24.00Nov-06 0.18 N/A 31.15 11332.39 8.00 0.08 26.00Oct-06 0.16 2.00 32.44 5390.27 12.00 0.10 24.17Sep-06 0.08 1.00 501.93 17357.07 48.00 0.10 17.00Aug-06 0.24 N/A 701.37 10669.94 20.00 0.08 20.40Jul-06 0.48 N/A 50.98 3606.34 44.00 0.09 8.12Jun-06 0.25 6.20 34.66 2111.35 12.00 0.08 11.14May-06 1.64 5.40 92.57 7672.01 24.00 0.11 23.92Apr-06 0.08 N/A 467.74 6838.41 N/A 0.08 35.62
Note: N/A: Not available, Data after Apr'10 is for Turmeric processed Source: Dept.of Agriculture, GOI
A PwC & MCX Joint Endeavour 271www.mcxindia.com / www.pwc.com/in/en
DATABANK - AGRI COMMODITIES
178_300_CYIB_2011_Agri_final.indd 271178_300_CYIB_2011_Agri_final.indd 271 1/26/2012 1:29:36 AM1/26/2012 1:29:36 AM

EDITORIALSPROLOGUE INDIAN ECONOMYEXPERTS' VIEWS
Cardamom prices & Trading activity Monthly MCX futures price (Rs/kg) MCX spot prices Vandanmedu WPI of (Rs/kg) CardamomMonth Open High Low Close Volume Open Monthly Month's Month's in lots^ Interest average high low in lots^^Dec-10 1,217.0 1,642.0 1,153.2 1,581.4 98,904.0 3,270.0 1,288.7 1,601.9 1,100.3 329.3Nov-10 909.0 1,202.6 895.0 1,202.6 41,721.0 2,342.0 980.6 1,136.5 869.3 301.3Oct-10 1,070.0 1,070.0 868.0 885.1 26,352.0 3,384.0 969.8 1,111.1 809.3 311.0Sep-10 1,382.5 1,417.0 1,021.5 1,070.5 32,526.0 2,662.0 1,217.7 1,490.2 1,084.1 380.9Aug-10 1,516.5 1,765.0 1,218.0 1,379.6 56,438.0 4,796.0 1,515.2 1,600.0 1,413.1 409.8Jul-10 1,849.0 1,888.4 1,359.1 1,472.3 46,202.0 4,544.0 1,666.4 1,770.0 1,440.0 396.3Jun-10 1,606.0 2,097.0 1,571.3 1,840.9 145,626.0 6,624.0 1,669.4 1,735.0 1,514.2 372.0May-10 1,364.0 1,644.0 1,350.5 1,587.9 78,496.0 2,471.0 1,378.4 1,484.5 1,290.3 304.6Apr-10 1,258.0 1,421.9 1,258.0 1,380.7 31,508.0 2,234.0 1,261.0 1,306.1 1,192.0 283.5Mar-10 1,143.9 1,329.0 1,101.7 1,256.9 21,133.0 1,238.0 1,130.3 1,193.0 1,060.0 274.9Feb-10 1,112.0 1,263.9 1,033.1 1,143.9 17,432.0 1,115.0 1,078.8 1,129.6 1,043.4 274.1Jan-10 1,118.0 1,388.8 1,105.0 1,123.8 39,411.0 1,210.0 1,144.5 1,272.0 1,031.0 269.6Dec-09 990.0 1,135.9 930.3 1,112.7 21,459.0 1,351.0 892.4 1,005.2 821.0 244.4Nov-09 795.0 989.3 795.0 983.3 6,916.0 903.0 757.8 808.0 732.0 206.5Oct-09 714.3 822.0 676.0 792.8 4,594.0 514.0 715.6 762.5 684.8 187.6Sep-09 850.3 921.0 709.8 717.0 4,171.0 221.0 779.9 821.5 677.5 188.2Aug-09 845.8 876.0 745.5 854.3 3,643.0 410.0 812.6 848.0 787.8 179.4Jul-09 877.5 891.3 813.0 852.0 4,614.0 350.0 806.9 823.8 790.0 175.5Jun-09 795.0 909.8 794.5 879.0 4,464.0 76.0 778.9 816.5 741.3 170.4May-09 705.5 798.0 705.5 785.8 3,875.0 290.0 709.1 733.8 667.3 162.1Apr-09 636.0 736.5 635.5 710.5 2,777.0 296.0 652.3 697.3 620.0 146.0Mar-09 606.8 653.0 595.3 639.0 4,237.0 230.0 587.3 605.8 570.8 136.7Feb-09 583.8 611.0 530.0 604.5 2,366.0 210.0 593.9 612.5 572.0 137.2Jan-09 554.5 594.8 487.0 567.8 3,198.0 207.0 561.9 599.5 538.8 129.1Dec-08 560.0 643.8 530.3 553.5 3,951.0 311.0 558.4 590.3 537.8 126.4Nov-08 617.3 668.0 540.0 565.8 3,347.0 243.0 587.6 623.0 513.5 140.1Oct-08 730.0 732.8 600.5 619.0 3,864.0 304.0 637.5 699.0 606.8 147.7Sep-08 695.0 773.0 683.0 729.8 6,392.0 370.0 693.0 721.5 671.5 146.6Aug-08 664.5 747.0 658.5 691.5 6,792.0 471.0 672.4 698.3 653.5 146.0Jul-08 635.0 740.0 621.0 662.3 10,365.0 437.0 642.4 660.0 616.0 143.4Jun-08 689.0 762.0 654.5 654.5 4,644.0 533.0 671.4 681.5 613.5 151.9May-08 627.0 698.5 604.0 692.0 4,990.0 495.0 646.3 664.5 625.0 147.1Apr-08 612.5 687.5 599.0 627.0 4,140.0 295.0 618.1 628.5 609.0 143.8Mar-08 694.0 709.5 551.0 617.5 8,971.0 421.0 626.6 647.5 593.0 143.0Feb-08 689.0 723.5 684.5 692.5 12,364.0 555.0 645.8 651.5 641.5 148.1Jan-08 639.5 718.0 629.0 688.0 18,088.0 649.0 633.8 656.5 605.0 151.6Dec-07 589.5 643.5 560.0 640.0 10,446.0 829.0 559.9 597.0 540.0 131.5Nov-07 513.5 605.5 484.5 591.0 11,718.0 662.0 509.2 541.0 490.0 121.3Oct-07 563.0 592.5 458.0 511.5 15,904.0 671.0 484.3 488.0 478.5 112.8Sep-07 516.5 575.0 492.5 563.5 13,791.0 1,527.0 478.6 485.5 474.5 115.9Aug-07 522.7 561.0 504.5 514.5 21,418.0 981.0 479.8 484.0 473.5 114.4Jul-07 486.2 573.9 463.6 523.6 39,128.0 2,275.0 478.3 491.3 466.8 116.4Jun-07 479.7 492.5 449.0 485.7 18,558.0 1,833.0 457.8 464.9 454.0 111.3May-07 467.9 514.8 466.0 478.7 43,511.0 2,619.0 464.7 474.2 454.3 111.3Apr-07 487.4 505.5 415.2 468.7 66,021.0 5,203.0 448.0 457.1 437.1 115.2Mar-07 458.6 498.0 395.8 484.0 68,358.0 6,487.0 418.9 435.7 412.2 110.2Feb-07 444.0 474.5 410.2 460.4 94,541.0 5,616.0 414.6 421.5 405.9 114.3Jan-07 406.5 449.0 362.0 444.1 103,540.0 6,294.0 384.6 399.0 373.5 104.5Dec-06 391.0 423.0 327.5 405.5 53,890.0 2,986.0 348.6 372.5 336.5 99.2Nov-06 443.0 450.0 348.0 391.0 55,818.0 1,822.0 375.3 407.5 354.0 87.1Oct-06 529.8 534.0 385.0 444.5 87,695.0 1,986.0 436.4 475.0 413.5 91.9Sep-06 481.1 638.0 465.0 527.0 192,464.0 3,440.0 469.0 500.0 409.2 98.6Aug-06 338.0 494.7 305.0 482.4 112,243.0 4,550.0 333.9 426.1 279.4 94.7Jul-06 259.7 354.0 255.0 337.1 11,166.0 1,447.0 255.5 281.6 245.9 84.6Jun-06 243.7 273.5 243.6 258.7 7,034.0 1,915.0 249.2 259.8 239.3 83.8May-06 233.1 265.0 206.1 244.4 21,569.0 1,862.0 240.4 324.1 229.4 78.0Apr-06 272.0 276.0 229.0 233.1 15,672.0 916.0 254.8 266.4 232.3 75.0
Note: ^Aggregate volume in all contracts during the month; ^^Cumulative open interest in all contracts at the end of month; Future prices are for near month continuos futures contract. Source: MCX, & Ministry of Commerce and Industry
Commodity Insights Yearbook 2011272
178_300_CYIB_2011_Agri_final.indd 272178_300_CYIB_2011_Agri_final.indd 272 1/26/2012 1:29:36 AM1/26/2012 1:29:36 AM

DATABANK - NON-AGRI COMMODITIES
Cumin seeds prices MCX Spot prices Unjha (Rs/qtl) Other market monthly WPI ofMonth average spot prices (Rs/qtl) Cumin seeds Monthly Month's high Month's low average Rajasthan Gujarat
Dec-10 N/A N/A N/A 11826 12157 170.3Nov-10 N/A N/A N/A 7044 12035 162.5Oct-10 N/A N/A N/A 11385 11051 157.5Sep-10 N/A N/A N/A 11986 11607 157.4Aug-10 N/A N/A N/A 12601 12080 161.4Jul-10 13778 14631 12800 12229 12007 157.6Jun-10 12423 12823 12271 11017 10748 154.3May-10 12627 12783 12492 10892 10188 157.6Apr-10 12066 12425 11942 10821 9860 162.8Mar-10 11806 11955 11606 10274 9551 156.6Feb-10 11967 12389 11615 10173 9642 159.2Jan-10 13370 14598 12197 12736 11313 165.1Dec-09 14279 14645 14025 12722 12049 169.4Nov-09 13351 14273 12324 11892 11694 168.2Oct-09 11745 12324 11381 11361 10008 158.4Sep-09 11418 11601 11336 10130 9106 159.2Aug-09 11745 11918 11521 10583 9318 144.5Jul-09 11402 11580 11226 10299 8899 136.1Jun-09 11228 11358 11000 6695 7376 131.4May-09 11711 12229 11091 10799 7176 132.3Apr-09 12068 12289 11745 11586 8009 123.6Mar-09 11300 11552 11086 9829 7721 123.3Feb-09 11321 11597 10968 9842 6811 125.3Jan-09 10967 11655 10592 8736 8302 126.5Dec-08 10680 10853 10556 8855 7469 127.1Nov-08 10779 11075 10531 9212 7419 127.8Oct-08 11029 11935 10591 9376 7139 128.6Sep-08 11996 12457 11624 9736 8202 127.3Aug-08 12444 12662 12192 10465 10207 134.8Jul-08 12046 12675 11417 10333 10705 127Jun-08 10750 11646 9928 9195 8898 123.7May-08 9960 10130 9710 9215 8716 116.7Apr-08 9192 9903 8770 8013 7637 105Mar-08 9333 9475 9150 7696 7823 113.8Feb-08 9693 10192 9393 8785 8424 125.8Jan-08 10084 10369 9856 9836 9306 127.1Dec-07 9835 9995 9625 8153 8933 120.5Nov-07 10195 10360 9925 8897 9426 121.2Oct-07 10265 10445 9940 7839 9269 121.5Sep-07 10301 10664 9928 8819 9270 128.8Aug-07 10880 11138 10402 9028 9925 135.7Jul-07 11306 11445 11085 9093 10007 129.9Jun-07 11590 11931 11282 9405 10109 125.4May-07 11596 12183 10985 8653 9878 128Apr-07 12146 12531 11583 10026 10980 131.4Mar-07 10660 11423 9847 8922 10187 120.5Feb-07 9177 10043 8466 7969 9150 119.7Jan-07 8576 8735 8379 7564 7910 116.5Dec-06 8503 8570 8415 7294 7528 115.6Nov-06 8514 8703 8212 7021 7245 110.5Oct-06 8546 8781 8347 7010 7323 108.2Sep-06 8756 9000 8341 7612 7775 109.6Aug-06 7821 8226 7613 7412 7125 101.9Jul-06 7061 7730 6575 6498 6513 96.1Jun-06 6556 6618 6477 5812 5942 92.7May-06 6364 6705 5748 5821 5857 96.4Apr-06 5661 5748 5560 5277 4984 100.6
Note: N/T: Not TradedSource: MCX, Agmarknet & Ministry of Commerce and Industry
A PwC & MCX Joint Endeavour 273www.mcxindia.com / www.pwc.com/in/en
DATABANK - AGRI COMMODITIES
178_300_CYIB_2011_Agri_final.indd 273178_300_CYIB_2011_Agri_final.indd 273 1/26/2012 1:29:36 AM1/26/2012 1:29:36 AM
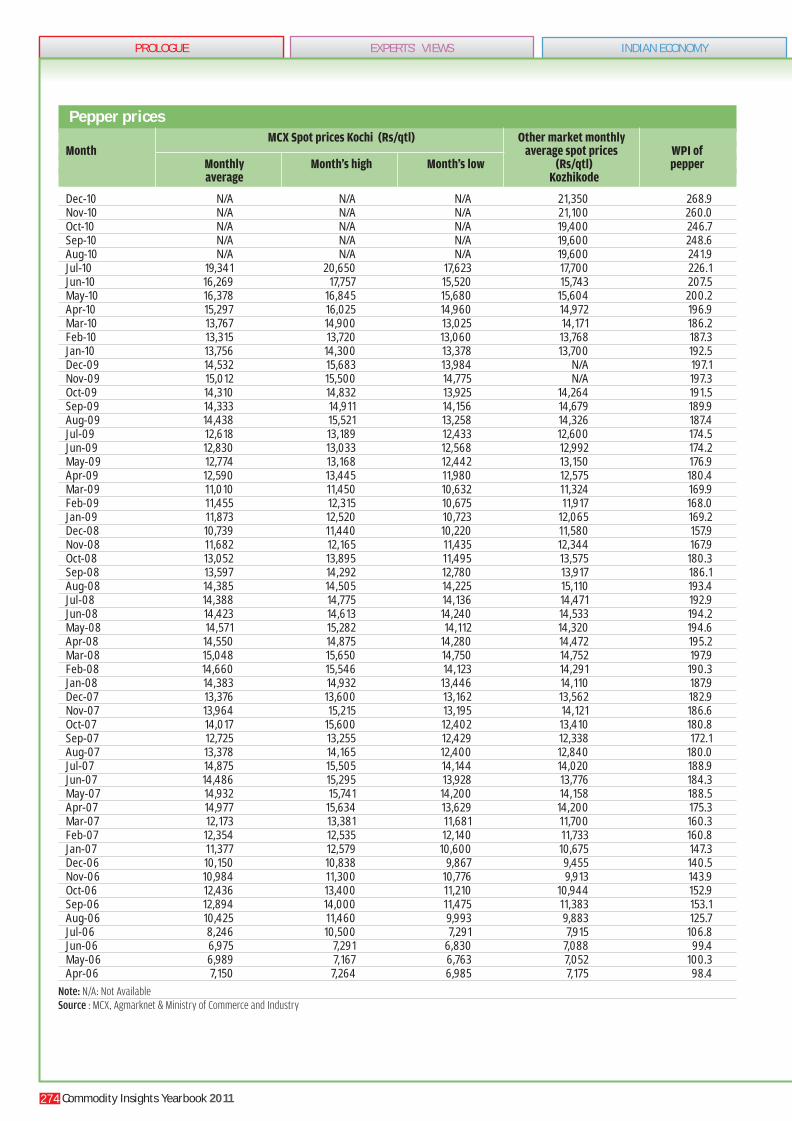
EDITORIALSPROLOGUE INDIAN ECONOMYEXPERTS' VIEWS
Pepper prices MCX Spot prices Kochi (Rs/qtl) Other market monthly Month average spot prices WPI of Monthly Month’s high Month’s low (Rs/qtl) pepper average Kozhikode
Dec-10 N/A N/A N/A 21,350 268.9Nov-10 N/A N/A N/A 21,100 260.0Oct-10 N/A N/A N/A 19,400 246.7Sep-10 N/A N/A N/A 19,600 248.6Aug-10 N/A N/A N/A 19,600 241.9Jul-10 19,341 20,650 17,623 17,700 226.1Jun-10 16,269 17,757 15,520 15,743 207.5May-10 16,378 16,845 15,680 15,604 200.2Apr-10 15,297 16,025 14,960 14,972 196.9Mar-10 13,767 14,900 13,025 14,171 186.2Feb-10 13,315 13,720 13,060 13,768 187.3Jan-10 13,756 14,300 13,378 13,700 192.5Dec-09 14,532 15,683 13,984 N/A 197.1Nov-09 15,012 15,500 14,775 N/A 197.3Oct-09 14,310 14,832 13,925 14,264 191.5Sep-09 14,333 14,911 14,156 14,679 189.9Aug-09 14,438 15,521 13,258 14,326 187.4Jul-09 12,618 13,189 12,433 12,600 174.5Jun-09 12,830 13,033 12,568 12,992 174.2May-09 12,774 13,168 12,442 13,150 176.9Apr-09 12,590 13,445 11,980 12,575 180.4Mar-09 11,010 11,450 10,632 11,324 169.9Feb-09 11,455 12,315 10,675 11,917 168.0Jan-09 11,873 12,520 10,723 12,065 169.2Dec-08 10,739 11,440 10,220 11,580 157.9Nov-08 11,682 12,165 11,435 12,344 167.9Oct-08 13,052 13,895 11,495 13,575 180.3Sep-08 13,597 14,292 12,780 13,917 186.1Aug-08 14,385 14,505 14,225 15,110 193.4Jul-08 14,388 14,775 14,136 14,471 192.9Jun-08 14,423 14,613 14,240 14,533 194.2May-08 14,571 15,282 14,112 14,320 194.6Apr-08 14,550 14,875 14,280 14,472 195.2Mar-08 15,048 15,650 14,750 14,752 197.9Feb-08 14,660 15,546 14,123 14,291 190.3Jan-08 14,383 14,932 13,446 14,110 187.9Dec-07 13,376 13,600 13,162 13,562 182.9Nov-07 13,964 15,215 13,195 14,121 186.6Oct-07 14,017 15,600 12,402 13,410 180.8Sep-07 12,725 13,255 12,429 12,338 172.1Aug-07 13,378 14,165 12,400 12,840 180.0Jul-07 14,875 15,505 14,144 14,020 188.9Jun-07 14,486 15,295 13,928 13,776 184.3May-07 14,932 15,741 14,200 14,158 188.5Apr-07 14,977 15,634 13,629 14,200 175.3Mar-07 12,173 13,381 11,681 11,700 160.3Feb-07 12,354 12,535 12,140 11,733 160.8Jan-07 11,377 12,579 10,600 10,675 147.3Dec-06 10,150 10,838 9,867 9,455 140.5Nov-06 10,984 11,300 10,776 9,913 143.9Oct-06 12,436 13,400 11,210 10,944 152.9Sep-06 12,894 14,000 11,475 11,383 153.1Aug-06 10,425 11,460 9,993 9,883 125.7Jul-06 8,246 10,500 7,291 7,915 106.8Jun-06 6,975 7,291 6,830 7,088 99.4May-06 6,989 7,167 6,763 7,052 100.3Apr-06 7,150 7,264 6,985 7,175 98.4
Note: N/A: Not AvailableSource : MCX, Agmarknet & Ministry of Commerce and Industry
Commodity Insights Yearbook 2011274
178_300_CYIB_2011_Agri_final.indd 274178_300_CYIB_2011_Agri_final.indd 274 1/26/2012 1:29:36 AM1/26/2012 1:29:36 AM

DATABANK - NON-AGRI COMMODITIES
Red chilli prices MCX Spot prices Guntur (Rs/Qtl) Other market monthly Month average spot prices WPI of Monthly Month’s high Month’s low (Rs/qtl) Chillies Dry average Karnataka
Dec-10 N/A N/A N/A 5,042 213.0Nov-10 N/A N/A N/A 5,271 199.2Oct-10 N/A N/A N/A 5,665 201.5Sep-10 N/A N/A N/A 5,342 190.6Aug-10 N/A N/A N/A 4,436 206.2Jul-10 4,969 5,037 4,846 5,390 214.4Jun-10 4,851 4,910 4,759 5,055 210.6May-10 4,746 4,759 4,637 4,463 214.0Apr-10 4,715 4,808 4,589 4,766 217.0Mar-10 4,912 5,068 4,595 5,041 219.1Feb-10 5,357 5,478 5,068 5,648 216.4Jan-10 5,853 6,133 5,512 5,673 211.8Dec-09 6,253 6,493 6,151 5,629 204.2Nov-09 6,430 6,570 6,168 5,396 205.3Oct-09 6,100 6,188 5,981 5,919 203.5Sep-09 5,955 6,002 5,900 5,531 202.4Aug-09 5,990 6,067 5,854 5,443 199.5Jul-09 5,545 5,854 5,431 5,556 197.3Jun-09 5,406 5,643 4,745 5,360 198.2May-09 4,747 4,756 4,727 5,109 200.2Apr-09 5,033 5,313 4,727 4,746 204.5Mar-09 5,430 5,549 5,287 6,096 212.7Feb-09 5,255 5,388 5,094 4,660 203.5Jan-09 6,045 6,443 5,858 4,741 197.3Dec-08 6,522 6,623 6,450 5,286 174.5Nov-08 6,592 6,692 6,446 5,925 173.2Oct-08 6,413 6,457 6,348 6,027 177.0Sep-08 6,401 6,455 6,325 4,917 176.8Aug-08 6,425 6,525 6,313 4,895 184.2Jul-08 5,930 6,378 5,257 4,569 185.2Jun-08 5,049 5,281 4,997 4,409 176.6May-08 4,766 4,997 4,517 4,324 170.1Apr-08 4,491 4,744 4,195 4,363 160.2Mar-08 4,003 4,262 3,854 4,298 152.8Feb-08 4,027 4,220 3,864 4,693 155.8Jan-08 3,924 4,113 3,783 5,036 148.5Dec-07 3,939 4,175 3,734 4,490 155.7Nov-07 4,226 4,530 3,808 4,952 159.8Oct-07 4,618 4,763 4,508 5,061 159.6Sep-07 4,666 4,763 4,588 5,297 160.4Aug-07 4,617 4,753 4,458 5,380 157.1Jul-07 4,556 4,789 4,372 5,209 160.0Jun-07 4,693 4,914 4,424 5,877 157.8May-07 4,452 4,569 4,338 4,887 156.5Apr-07 4,763 5,089 4,371 4,654 161.0Mar-07 4,491 4,832 4,209 4,418 161.3Feb-07 4,550 6,296 3,875 4,520 181.2Jan-07 6,365 6,865 5,980 4,294 192.8Dec-06 6,489 7,423 5,887 4,515 172.5Nov-06 6,902 7,415 6,546 5,224 175.1Oct-06 6,541 7,112 693 5,012 172.5Sep-06 6,391 6,942 6,003 4,906 162.5Aug-06 5,300 5,956 4,914 4,886 156.8Jul-06 4,916 5,025 4,778 4,064 152.0Jun-06 4,862 5,107 4,705 4,355 150.9May-06 4,960 5,092 4,475 4,307 143.1Apr-06 3,738 4,630 3,350 4,130 127.5
Note: N/T: Not Traded; N/A: Not Available; WPI revised from Apr 05 Source: MCX, Agmarknet & Ministry of Commerce and Industry
A PwC & MCX Joint Endeavour 275www.mcxindia.com / www.pwc.com/in/en
DATABANK - AGRI COMMODITIES
178_300_CYIB_2011_Agri_final.indd 275178_300_CYIB_2011_Agri_final.indd 275 1/26/2012 1:29:37 AM1/26/2012 1:29:37 AM

EDITORIALSPROLOGUE INDIAN ECONOMYEXPERTS' VIEWS
Turmeric prices MCX Spot prices Nizamabad (Rs/Qtl) Other market monthly Month average spot prices (Rs/qtl) WPI of Monthly Month's high Month's low Turmeric average Cuddapah Duggirala
Dec-10 16,777 17,000 16,325 15,002 14,143 458.6Nov-10 15,435 17,025 14,675 13,493 13,184 416.3Oct-10 14,525 15,174 13,950 12,596 12,161 406.4Sep-10 13,721 14,088 13,463 11,233 12,157 403.8Aug-10 14,701 15,163 14,100 11,530 12,857 402.0Jul-10 15,172 15,822 14,588 N/A 12,719 406.8Jun-10 14,850 15,125 14,650 N/A 12,308 406.8May-10 15,112 15,856 14,644 12,424 12,216 375.3Apr-10 12,447 14,650 11,344 10,811 10,963 326.9Mar-10 10,182 11,600 8,725 9,459 8,928 309.8Feb-10 9,755 10,577 8,842 N/A 8,400 299.9Jan-10 10,449 10,900 9,975 N/A 7,200 281.5Dec-09 10,493 11,244 10,150 N/A 9,007 284.1Nov-09 12,013 13,092 9,913 N/A N/A 289.3Oct-09 9,340 11,100 8,096 7,229 N/A 210.9Sep-09 8,096 8,134 7,956 7,532 N/A 180.2Aug-09 7,983 8,363 6,950 N/A N/A 160.8Jul-09 5,849 6,950 5,368 N/A N/A 141.3Jun-09 5,299 5,384 5,235 4,867 N/A 132.2May-09 5,392 5,579 5,093 N/A N/A 120.0Apr-09 5,301 5,510 5,071 N/A N/A 113.8Mar-09 4,514 4,720 4,250 N/A N/A 112.3Feb-09 4,189 4,278 4,080 3,658 N/A 110.7Jan-09 3,992 4,198 3,850 N/A N/A 110.2Dec-08 3,862 3,890 3,830 N/A N/A 109.5Nov-08 3,782 3,897 3,570 N/A 3,195 109.8Oct-08 3,762 3,955 3,570 3,570 3,095 110.7Sep-08 3,827 3,908 3,735 2,829 3,305 110.8Aug-08 4,127 4,595 3,806 2,773 3,341 112.5Jul-08 4,407 4,645 4,105 3,318 3,580 102.9Jun-08 4,051 4,161 3,989 3,264 3,075 96.5May-08 3,399 4,006 3,072 2,866 2,791 89.8Apr-08 3,077 3,116 3,043 2,517 2,656 89.4Mar-08 3,073 3,110 2,995 2,691 2,635 85.9Feb-08 2,791 2,995 2,630 2,503 2,348 82.8Jan-08 2,641 2,673 2,604 2,357 2,222 83.9Dec-07 2,437 2,685 2,297 N/A N/A 81.0Nov-07 2,117 2,298 2,040 1,750 1,860 80.8Oct-07 2,039 2,078 1,979 N/A 1,815 81.9Sep-07 2,075 2,118 2,052 1,585 1,736 82.7Aug-07 2,147 2,179 2,114 1,657 N/A 84.3Jul-07 2,148 2,189 2,117 N/A N/A 80.9Jun-07 2,108 2,135 2,081 1,709 1,812 78.0May-07 N/A N/A N/A 1,646 1,797 84.7Apr-07 N/A N/A N/A 1,781 1,821 86.4Mar-07 N/A N/A N/A 1,905 N/A 82.1Feb-07 N/A N/A N/A N/A 1,691 89.5Jan-07 N/A N/A N/A N/A 1,588 90.0Dec-06 N/A N/A N/A 1,611 1,613 84.8Nov-06 N/A N/A N/A N/A 1,705 87.7Oct-06 N/A N/A N/A 1,636 1,738 89.2Sep-06 N/A N/A N/A 1,725 1,976 90.4Aug-06 N/A N/A N/A 2,008 1,975 88.8Jul-06 N/A N/A N/A 1,792 1,880 87.9Jun-06 N/A N/A N/A N/A N/A 87.9May-06 N/A N/A N/A 1,995 1,955 90.0Apr-06 N/A N/A N/A 1,718 1,880 89.4
Note: N/T: Not Traded; N/A: Not Available; WPI revised from Apr 05; From Mar 05 Other Market Prices are for Turmeric (Bulb) Source: MCX, Agmarknet & Ministry of Commerce and Industry
Commodity Insights Yearbook 2011276
178_300_CYIB_2011_Agri_final.indd 276178_300_CYIB_2011_Agri_final.indd 276 1/26/2012 1:29:37 AM1/26/2012 1:29:37 AM

DATABANK - NON-AGRI COMMODITIES
India's Red Chilli Exports in Volume & Value
300
225
150
75
0
1800
1350
900
450
0
Qty ooo tons ( LHS )
Value (In Rs crore) RHS
Source: Spices Board, India e - source estimates
Share of Different Spices in Total Spices Exports from India (in value terms)
Note: Include Asafoetida, Cassia, Saffron, Tamarinda, Ajvanseed, Dill Seed, Poppy Seed, Aniseed, Ginger, vanilla, fennel, coriander oils and oleoresins Etc. Source: Spices Board, India, e - source estimates
23%
2%
51%
54%10%
6%
7% 10%
6%
6%
22%3%
2009-102010-11e
Pepper
Cardamom (s)
Chilli
Turmeric
Cumin
Others#
India's Pepper Exports in Volume & Value
40
32
24
16
8
0
600
480
360
240
120
02005-06 2007-08 2009-102006-07 2008-09 2010-11e
Qty 000 tons (LHS)
Value (In Rs crore RHS)
Source: Spices Board, India e - source estimates
2005-06 2007-08 2009-102006-07 2008-09 2010-11e
A PwC & MCX Joint Endeavour 277www.mcxindia.com / www.pwc.com/in/en
DATABANK - AGRI COMMODITIES
178_300_CYIB_2011_Agri_final.indd 277178_300_CYIB_2011_Agri_final.indd 277 1/26/2012 1:29:37 AM1/26/2012 1:29:37 AM

EDITORIALSPROLOGUE INDIAN ECONOMYEXPERTS' VIEWS
India's Turmeric Exports in Volume & Value
56
52
48
44
40
800
600
400
200
0
2007-08 2009-102005-06 2006-07 2008-09 2010-11e
Qty ooo tons (LHS)
Value (In Rs crore) RHS
Source: Spices Board, India e - source estimates
India's Cardamom Exports in Volume & Value
2.5
2
1.5
1
0.5
0
200
160
120
80
40
02007-08 2009-102005-06 2006-07 2008-09 2010-11e
Qty 000 tons (LHS)
Value ( In Rs crore ) RHS
Source: Spices Board, India e - source estimates
India's Cumin (Jeera) Exports in Volume & Value
60
48
36
24
12
0
600
480
360
240
120
02007-08 2009-102005-06 2006-07 2008-09 2010-11e
Qty ooo tons (LHS)
Value (In Rs crore) RHS
Source: Spices Board, India e - source estimates
Commodity Insights Yearbook 2011278
178_300_CYIB_2011_Agri_final.indd 278178_300_CYIB_2011_Agri_final.indd 278 1/26/2012 1:29:37 AM1/26/2012 1:29:37 AM

DATABANK - NON-AGRI COMMODITIES
Other Commodities
A PwC & MCX Joint Endeavour 279www.mcxindia.com / www.pwc.com/in/en
DATABANK - AGRI COMMODITIES
178_300_CYIB_2011_Agri_final.indd 279178_300_CYIB_2011_Agri_final.indd 279 1/26/2012 1:29:37 AM1/26/2012 1:29:37 AM

EDITORIALSPROLOGUE INDIAN ECONOMYEXPERTS' VIEWS
Mentha oil fundamentals - India (in `000' tonnes)India 2010-11e 2009-10e 2008-09e 2007-08e 2006-07e
Production 28 35.0 32.0 33.0 25.0Exports (Menthol & Menthol Crystal) 11.2 11.8 10.6 13.5 11.1Average daily volatility of MCX spot prices Sambhal market 1.84% 1.17% 1.71% 0.99% 3.53%
Source: Indian Spices Board, MCX & Industry sources for production
Item-wise exports of Mint products from India (in tonnes and in Rs. crores)Commodity/Item 2010-11E 2009-10E 2008-09E Quantity Value Quantity Value Quantity ValueMint products
Peppermint oil 3,651.00 292.80 2,856.20 168.04 4,493.10 290.86Spearmint oil 34.00 4.10 91.30 8.41 262.20 27.75Other mint oil 2,558.00 211.20 4,229.50 258.70 5,159.60 395.66Menthol crystal 5,457.00 579.20 4,728.00 323.40 3,973.90 271.79Menthol 5,750.00 609.50 7,095.00 431.18 6,611.30 434.19Total 17,450.00 1,696.80 19,000.00 1,189.72 20,500.00 1,420.25
Note: e - source estimates Source: Indian Spices Board
Item-wise exports of Mint products from India (in tonnes and Rs. in crores)Commodity/Item 2010-11E 2009-10E 2008-09E Quantity Value Quantity Value Quantity ValueMint products
Peppermint oil 6,117.20 316.02 2,803.40 173.49 1,341.00 35.19Spearmint oil 400.00 37.35 291.60 25.27 137.00 7.51Other mint oil 1,829.00 94.80 3,437.00 173.06 - -Menthol crystal 4,760.40 331.38 3,552.60 276.10 3,466.00 157.77Menthol 8,725.50 540.66 7,557.50 561.16 4,524.00 213.90Total 21,100.00 1,280.50 17,642.10 1,209.09 11,295.00 484.74
Note: e - source estimates Source: Indian Spices Board
Mentha Oil: Production, Exports & Prices
40000
32000
24000
16000
8000
0
1500
1200
900
600
300
0
2005-06 2007-08 2009-102004-05 2006-07 2008-09 2010-11
Production (LHS)
Exports (LHS)
Prices
in tonnes Rs/qtl
Source: Spices Board, MCX & Industry Sources. Average Spot Prices of MCX for the month of March
Commodity Insights Yearbook 2011280
178_300_CYIB_2011_Agri_final.indd 280178_300_CYIB_2011_Agri_final.indd 280 1/26/2012 1:29:44 AM1/26/2012 1:29:44 AM

DATABANK - NON-AGRI COMMODITIES
Mentha oil prices and trading activity Monthly MCX futures prices (Rs/Kg) MCX spot prices Sambhal (Rs/Kg)Month Open High Low Close Volume interest Monthly Month's Month's (in lots)^ (in lots^^) average high lowDec-10 1227.9 1289.9 1029.0 1173.4 206097 10512 1271.0 1352.8 1183.2Nov-10 1175.0 1305.8 1136.9 1218.5 181158 12856 1290.8 1407.7 1181.1Oct-10 876.2 1147.9 865.0 1125.5 278637 13406 1098.0 1245.9 974.2Sep-10 773.0 870.3 770.0 862.9 187886 11580 926.3 982.2 881.5Aug-10 717.5 784.0 710.0 760.2 129032 12239 829.1 868.6 772.1Jul-10 734.5 735.9 675.1 680.8 82660 9094 757.1 784.7 747.1Jun-10 720.8 806.3 703.5 719.2 105004 7130 793.1 852.0 755.1May-10 699.0 731.7 672.0 702.9 74791 5403 769.6 781.0 756.1Apr-10 629.8 832.1 629.5 780.1 115716 7182 747.3 840.2 681.0Mar-10 576.1 629.5 573.4 617.4 60675 6084 658.2 672.8 639.5Feb-10 589.0 590.0 553.6 582.9 54831 3783 639.8 650.6 627.7Jan-10 599.0 627.1 583.5 587.3 94606 8309 648.6 655.7 636.4Dec-09 628.5 636.0 574.9 588.3 115489 8944 637.6 661.7 627.0Nov-09 527.9 620.9 525.6 618.7 96116 8188 593.8 648.5 552.8Oct-09 517.1 544.7 505.5 516.6 40012 6508 548.7 558.3 541.6Sep-09 516.0 528.6 508.0 510.7 33862 6186 548.6 551.1 543.5Aug-09 477.7 565.8 477.7 510.6 72220 7407 542.3 555.9 506.9Jul-09 514.5 516.2 462.6 468.8 26817 4622 512.3 529.9 501.5Jun-09 546.9 548.5 498.5 503.8 20585 3020 531.6 575.7 470.7May-09 528.0 560.1 524.3 535.3 10985 2077 576.5 585.7 571.4Apr-09 558.5 617.5 540.0 575.5 14091 1937 587.9 592.0 576.8Mar-09 522.7 603.9 521.5 550.9 24443 2814 588.9 611.3 575.9Feb-09 537.0 541.0 497.2 517.0 15937 2741 563.5 572.2 550.7Jan-09 546.0 578.9 518.0 523.9 35485 3082 588.1 614.8 573.2Dec-08 521.0 619.0 506.5 537.6 55139 5352 594.6 637.1 554.7Nov-08 517.0 529.9 446.0 506.9 34368 5557 540.8 566.8 497.8Oct-08 601.4 610.0 464.0 497.7 30086 5710 591.0 619.6 562.3Sep-08 627.5 634.4 564.0 586.4 35041 5446 625.4 641.4 612.3Aug-08 700.0 700.0 608.0 621.4 44356 4922 648.7 703.6 622.6Jul-08 532.0 775.9 528.5 689.1 73301 3725 704.0 791.9 549.8Jun-08 458.5 537.2 449.8 524.0 18170 1818 525.5 564.8 497.8May-08 443.0 487.0 443.0 448.0 8173 976 513.5 520.4 501.6Apr-08 439.5 449.1 431.2 437.8 3491 1017 500.0 504.6 496.9Mar-08 423.0 459.9 414.0 435.3 32690 1726 497.4 510.5 477.1Feb-08 448.2 464.0 417.5 423.5 51737 1881 504.6 512.4 497.2Jan-08 429.2 456.8 421.1 442.2 38471 2404 493.8 511.0 481.0Dec-07 441.5 456.2 415.1 420.5 20369 3125 490.9 499.4 478.7Nov-07 488.2 491.7 422.5 448.3 22061 4520 494.2 516.9 479.7Oct-07 502.1 517.0 465.0 479.6 31074 5313 517.7 526.3 512.4Sep-07 534.5 540.7 481.0 488.9 40186 5957 525.2 539.3 506.8Aug-07 515.1 556.5 510.7 522.6 44321 3575 534.0 547.1 513.4Jul-07 510.0 520.4 482.2 504.9 30499 2361 506.5 519.1 484.2Jun-07 500.0 569.2 487.3 558.2 46059 3307 519.5 530.7 504.8May-07 584.2 601.5 480.0 487.4 41988 3185 576.9 593.9 508.0Apr-07 558.5 637.0 557.0 633.6 92450 4310 588.3 608.2 560.9Mar-07 575.0 578.8 526.0 550.3 92361 5071 580.9 603.0 554.7Feb-07 575.0 614.4 556.5 561.3 124854 4492 606.7 615.4 596.2Jan-07 584.9 586.4 516.0 571.9 230527 6403 612.7 641.1 596.1Dec-06 672.1 682.4 583.0 596.7 224832 9025 664.9 941.8 639.4Nov-06 664.0 692.3 578.6 654.1 238784 8769 646.8 695.8 593.0Oct-06 733.9 737.8 631.9 646.8 193166 8607 674.4 701.6 652.8Sep-06 571.8 743.5 571.7 706.2 320442 6784 664.1 725.7 563.6Aug-06 558.6 588.9 542.0 550.1 84591 6264 552.1 560.0 534.5Jul-06 513.0 594.9 513.0 547.9 208836 6498 547.5 570.2 505.1Jun-06 460.0 510.5 411.0 510.5 109564 5313 464.6 511.0 429.0May-06 441.4 534.4 419.0 452.2 102777 6779 488.8 510.3 465.4Apr-06 426.8 464.9 423.9 438.2 84834 9347 477.5 491.5 451.4
Note: ^Aggregate volume in all contracts during the month; ^^Cumulative open interest in all contracts at the end of month; Future prices are for near month continuos futures contract.; Source: MCX
A PwC & MCX Joint Endeavour 281www.mcxindia.com / www.pwc.com/in/en
DATABANK - AGRI COMMODITIES
178_300_CYIB_2011_Agri_final.indd 281178_300_CYIB_2011_Agri_final.indd 281 1/26/2012 1:29:44 AM1/26/2012 1:29:44 AM

EDITORIALSPROLOGUE INDIAN ECONOMYEXPERTS' VIEWS
Potato fundamentals - World and India (in million tonnes, area in million hectares, yield in tonnes) 2010-11 2009-10 2008-09 2007-08 2006-07 2001-02WorldArea under production NA 18.33 18.08 18.64 18.49 19.67Production NA 329.56 325.56 322.41 305.96 311.07Imports NA NA 10.18 10.3 9.57 8.25Exports NA NA 9.91 10.5 9.74 8.06
IndiaArea 1.89 1.86 1.81 1.55 1.48 1.21Production 40.24 35.89 29.97 28.47 22.18 23.92Yield (tonnes/Ha) 17.14 15.35 14.14 11.19 10.7 14.65Exports 0.06 0 0.02 0.01 0.01 0.008Potato price in Uttar Pradesh (Rs. /qtl) 399.54 323.88 409.08 315.44 362.79 -Certified Seed Distribution (`000' tonnes) - - 105.5 53.5 51.2 63.3
Note: World data is for calander year and data may be offi cial, semi offi cial or estimated. Area, Production and Yield on India for 2008-09 and 2009-10 are sourced from traders; NA - data not available; Source: FAOSTAT, India's imports are negligible; Indian production & exports data are sourced from National Horticulture Research & Development Foundation
Potato country-wise production (in million tonnes)Country 2009 2008 2007 2006 2001China 73.28 70.84 64.84 54.08 64.60Russia 31.13 28.87 36.78 38.57 34.97Ukraine 19.67 19.55 19.10 19.47 17.34United States 19.57 18.83 20.18 19.99 19.85Others 185.91 189.60 181.51 173.86 174.32World Total 329.56 327.68 322.41 305.96 311.07
Note: N/A: Not Available; Source: FAOSTAT
Potato state-wise estimates of area and production Area (`000' hectares) Production (`000' tonnes)States/ UT 2010 2009 2008 2007 2006 2001 2010 2009 2008 2007 2006 2001 -11 -10 -09 -08 -07 -02 -11 -10 -09 -08 -07 -02Uttar Pradesh 552 537 527 505 469 390 13991 13447 10810 11095 10538 9570West Bengal 380 370 401 401 408 300 8800 8880 9901 9901 5052 7822Bihar 316 320 310 316 151 141 5688 5387 5034 6020 5741 1432Assam NA 87 80 79 78 80 NA 590 669 515 505 621Punjab 84 83 81 79 75 71 2129 2117 2001 1477 1313 1414Karnataka 83 81 72 61 63 40 457 460 606 572 682 489Madhya Pradesh 80 73 66 50 47 35 1067 608 883 650 648 472Gujarat 59 60 57 65 44 32 1300 1657 1449 1494 1340 802Others 340 252 234 230 147 14 6807 3263 3038 2934 2781 1834India 1894 1863 1828 1786 1482 1102 40239 36410 34391 34658 28600 24456
Note: NA: Not Available; Source : National Horticulture Board
Statewise Potato Production in India
Source:NHRDF
32%
26%
25%
17%
4%
3%
22%
14%
35%22%
2009-102010-11
Uttar Pradesh
West Bengal
Bihar
Gujarat
Others
Commodity Insights Yearbook 2011282
178_300_CYIB_2011_Agri_final.indd 282178_300_CYIB_2011_Agri_final.indd 282 1/26/2012 1:29:45 AM1/26/2012 1:29:45 AM

DATABANK - NON-AGRI COMMODITIES
Potato state-wise monthly arrivals (in `000' tonnes)Month Uttar Pradesh Rajasthan West Bengal Punjab Haryana
Mar-11 396.94 24.13 155.16 65.50 61.41Feb-11 437.74 22.91 42.25 39.29 57.37Jan-11 574.85 36.66 39.43 57.48 81.80Dec-10 562.01 27.90 43.34 110.59 82.56Nov-10 325.02 21.71 41.33 31.32 52.85Oct-10 402.95 16.28 38.12 34.29 47.95Sep-10 388.37 16.32 41.43 23.51 47.30Aug-10 371.75 19.14 48.09 20.67 41.05Jul-10 257.35 21.32 45.82 38.52 75.18Jun-10 186.51 17.73 49.73 18.85 75.00May-10 188.70 14.08 46.77 19.97 62.59Apr-10 288.93 14.76 108.23 24.83 71.15Mar-10 398.72 19.05 853.54 47.92 159.98Feb-10 390.50 20.24 84.46 39.52 136.81Jan-10 316.33 23.71 38.55 57.32 81.09Dec-09 276.24 23.30 32.81 80.38 69.95Nov-09 141.40 18.92 38.09 29.34 29.55Oct-09 100.77 15.74 35.48 25.81 63.63Sep-09 114.74 13.22 40.52 27.89 82.65Aug-09 118.65 13.12 34.04 28.57 49.17Jul-09 105.57 13.43 30.20 26.32 64.37Jun-09 104.81 11.30 23.62 23.62 46.32May-09 107.08 11.68 23.91 24.20 27.04Apr-09 106.74 15.57 47.08 64.53 32.64Mar-09 182.87 22.73 109.79 186.13 28.73Feb-09 199.46 52.19 34.88 70.87 44.74Jan-09 232.65 68.36 36.28 146.93 69.95Dec-08 281.99 77.10 32.81 139.10 76.81Nov-08 147.77 68.74 38.09 47.89 61.64Oct-08 123.39 46.68 35.48 44.02 66.43Sep-08 99.48 49.21 40.52 38.03 62.93Aug-08 100.40 50.35 34.04 37.87 47.72Jul-08 130.51 48.00 30.20 34.68 46.59Jun-08 150.00 30.91 23.62 31.39 37.11May-08 242.05 18.00 23.91 46.28 38.46Apr-08 465.34 15.66 47.56 60.79 38.59Mar-08 720.72 22.72 109.31 106.73 34.40Feb-08 599.72 16.84 34.88 63.84 29.66Jan-08 791.45 18.29 36.28 64.56 29.81Dec-07 294.71 20.52 21.25 52.84 21.02Nov-07 162.63 16.42 40.67 23.31 15.06Oct-07 143.09 17.92 55.21 18.75 17.84Sep-07 189.44 19.22 194.64 22.10 15.21Aug-07 140.73 21.79 220.25 36.23 13.63Jul-07 92.95 26.73 232.62 18.78 10.87Jun-07 111.41 28.79 195.91 16.89 9.11May-07 134.51 22.88 156.87 13.21 8.80Apr-07 150.60 26.21 115.45 30.49 12.92Mar-07 545.05 20.64 449.07 21.70 19.57Feb-07 422.84 16.22 49.63 18.56 18.20Jan-07 556.39 13.27 18.32 12.34 27.26Dec-06 671.19 4.51 23.21 11.23 25.00Nov-06 257.00 2.40 44.37 8.87 13.67Oct-06 154.07 2.74 46.05 32.05 13.59Sep-06 143.37 11.32 57.98 51.95 11.67Aug-06 114.53 14.82 84.95 50.33 10.68Jul-06 131.54 12.93 55.07 49.90 17.12Jun-06 227.02 17.23 32.28 26.48 10.71May-06 245.85 17.38 36.49 13.75 4.47Apr-06 410.32 14.84 35.86 26.41 5.92
Source: Dept. of Agriculture, GOI
A PwC & MCX Joint Endeavour 283www.mcxindia.com / www.pwc.com/in/en
DATABANK - AGRI COMMODITIES
178_300_CYIB_2011_Agri_final.indd 283178_300_CYIB_2011_Agri_final.indd 283 1/26/2012 1:29:45 AM1/26/2012 1:29:45 AM

EDITORIALSPROLOGUE INDIAN ECONOMYEXPERTS' VIEWS
Potato spot prices MCX Spot Agra (Rs/qtl) MCX Spot Tarkeshwar (Rs/qtl) Other markets monthly WPI ofMonth average spot prices (Rs/qtl) Potato Monthly Month's Month's Monthly Month's Month's Uttar West Potato average high low average high low Pradesh BengalDec-10 NA NA NA 542.17 547.60 539.00 525.45 648.23 171.5Nov-10 686.95 725.80 644.80 517.46 564.20 464.60 624.92 670.06 154.7Oct-10 605.41 618.80 592.60 520.58 528.40 509.50 530.69 756.15 153.3Sep-10 475.74 622.80 404.90 NA NA NA 437.21 586.03 139.3Aug-10 370.68 415.60 354.40 NA NA NA 432.52 464.51 133.3Jul-10 419.35 461.20 373.30 NA NA NA 496.36 468.76 133.7Jun-10 466.00 470.30 461.40 NA NA NA 445.06 453.81 125.3May-10 477.78 513.50 462.00 NA NA NA 425.34 434.02 118.1Apr-10 531.51 574.50 513.50 NA NA NA 358.87 284.13 110.3Mar-10 583.63 653.20 503.30 NA NA NA 323.88 225.72 105.4Feb-10 624.90 635.90 618.40 NA NA NA 359.70 266.19 121.5Jan-10 NA NA NA NA NA NA 510.73 433.28 149.3Dec-09 NA NA NA NA NA NA 768.68 1225.48 240.1Nov-09 1252.10 1431.50 1100.20 1330.60 1511.50 1006.30 1136.09 1560.08 293.6Oct-09 1404.90 1437.60 1301.50 1428.00 1521.20 1379.00 1369.41 1675.65 303.6Sep-09 1280.10 1306.10 1153.70 1349.70 1395.30 1318.00 1124.08 1618.19 268.7Aug-09 1057.30 1149.10 993.00 1132.50 1348.30 1051.30 1004.22 1319.95 244.5Jul-09 1007.80 1029.80 993.50 1060.30 1090.00 1045.00 972.97 1240.07 232.7Jun-09 929.30 1003.50 856.10 965.60 1070.20 866.00 824.05 1100.04 199.8May-09 826.40 855.70 781.40 852.70 864.90 836.60 739.97 985.38 172.2Apr-09 725.50 783.10 676.50 805.40 847.20 767.40 629.21 875.53 143.5Mar-09 636.30 672.70 601.30 718.50 774.40 648.30 409.08 660.82 103.2Feb-09 599.60 599.60 599.60 687.80 687.80 687.80 283.61 500.26 88.5Jan-09 NA NA NA NA NA NA 230.27 391.73 92.7Dec-08 321.80 325.00 320.00 240.60 249.60 235.60 257.04 318.62 105.6Nov-08 356.60 390.50 317.00 232.50 251.60 213.50 333.42 334.40 128.5Oct-08 392.90 407.00 384.00 225.80 241.80 213.50 361.33 331.05 128.2Sep-08 399.80 409.00 386.80 225.40 228.70 222.50 360.36 317.94 127.0Aug-08 356.10 383.20 344.60 224.70 242.20 215.70 362.93 324.17 118.9Jul-08 372.50 392.90 340.70 249.50 267.50 231.00 378.50 355.17 117.3Jun-08 427.40 444.30 393.50 264.60 284.30 246.80 335.76 380.16 106.9May-08 460.90 474.20 444.50 311.30 338.90 287.30 312.02 364.07 104.0Apr-08 481.80 489.40 473.10 285.40 306.80 262.10 290.44 317.74 102.7Mar-08 557.20 643.20 489.90 379.70 454.50 340.90 315.44 283.17 109.8Feb-08 NA NA NA NA NA NA 322.08 371.30 114.1Jan-08 NA NA NA NA NA NA 303.75 527.69 131.5Dec-07 NA NA NA NA NA NA 501.75 751.21 153.3Nov-07 NA NA NA 642.70 647.90 639.10 679.04 734.68 174.2Oct-07 638.20 641.50 630.70 613.10 643.20 308.50 751.75 719.62 176.5Sep-07 623.10 630.10 619.00 625.60 636.20 621.20 712.53 738.60 169.9Aug-07 624.60 628.30 619.80 631.80 639.30 624.80 701.07 710.82 169.4Jul-07 619.80 627.00 604.20 640.00 658.80 631.40 664.18 717.58 164.1Jun-07 580.30 603.90 562.60 619.50 648.90 593.30 591.39 677.69 150.4May-07 554.80 561.20 552.70 604.10 631.00 585.90 535.34 635.36 133.7Apr-07 541.00 552.70 508.80 576.00 600.40 545.00 449.14 604.73 115.3Mar-07 597.40 651.60 516.50 603.00 626.10 577.50 362.79 485.31 102.1Feb-07 610.60 615.00 605.60 558.40 564.70 548.70 290.20 354.25 84.8Jan-07 NA NA NA NA NA NA 258.88 336.88 85.1Dec-06 NA NA NA NA NA NA 345.28 499.42 113.8Nov-06 NA NA NA 463.50 494.60 424.00 637.06 668.12 180.0Oct-06 752.00 888.90 720.20 481.80 503.70 463.80 729.53 668.37 180.4Sep-06 664.70 725.90 592.60 464.30 475.60 449.50 609.48 628.01 157.8Aug-06 560.60 576.00 541.50 N/T N/T N/T 560.49 580.13 146.6Jul-06 543.40 549.80 537.80 N/T N/T N/T 526.38 582.30 148.8Jun-06 542.60 549.20 538.00 N/T N/T N/T 518.79 590.51 146.5May-06 555.60 567.70 541.10 N/T N/T N/T 460.96 590.15 128.6Apr-06 584.50 624.00 561.50 N/T N/T N/T 387.37 551.43 116.6
Note: N/T - Not traded; N/A - Not Available; WPI - Wholesale Price IndexSource: MCX; Agmarknet & Ministry of Commerce and Industry
Commodity Insights Yearbook 2011284
178_300_CYIB_2011_Agri_final.indd 284178_300_CYIB_2011_Agri_final.indd 284 1/26/2012 1:29:45 AM1/26/2012 1:29:45 AM

DATABANK - NON-AGRI COMMODITIES
Potato futures prices and trading activity Monthly MCX Futures prices (Rs/qtl)Month Agra
Open High Low Close Volume Open Interest
in lots^ in lots^^
Dec-10 660.2 674.7 621.2 649.4 31816 4094Nov-10 595 685 595 663 22769 2839Oct-10 621.1 626.8 578 596.8 98594 2189Sep-10 438 662.8 405 626.3 95412 3123Aug-10 350 445 339 436.9 105206 3559Jul-10 481.4 483 345.9 354.4 62786 5749Jun-10 488.2 506 465.5 480.8 13284 3069May-10 528 530.3 474.5 487.5 18083 3231Apr-10 545 576.7 517.9 531.7 23924 3151Mar-10 567 674 479.4 543.7 62855 3122Feb-10 590.2 635.5 563 567 17255 2323Jan-10 645 679.4 571 592.1 9868 1542Dec-09 698.4 698.4 612 648.2 1299 345Nov-09 N/A N/A N/A N/A N/A N/AOct-09 1280 1434.6 1274 1430.2 1130 43Sep-09 1252 1455 1210.1 1282 3463 425Aug-09 953 1259.8 952.9 1237.9 4237 622Jul-09 1084.9 1088 920 967.4 9481 754Jun-09 930 1169 918 1080 12444 936May-09 868 960 842.1 929.6 6232 1225Apr-09 720 911.5 720 868 29063 1282Mar-09 642 720 618.2 718.4 16089 2175Feb-09 603.6 641 582.7 636.1 4486 1153Jan-09 512 622.4 510.1 601 2045 496Dec-08 439.7 546 432.1 511.3 654 146Nov-08 N/T N/T N/T N/T N/T N/TOct-08 N/T N/T N/T N/T N/T N/TSep-08 N/T N/T N/T N/T N/T N/TAug-08 N/T N/T N/T N/T N/T N/TJul-08 N/T N/T N/T N/T N/T N/TJun-08 N/T N/T N/T N/T N/T N/TMay-08 488.2 496.7 482.7 485.8 1071 1466Apr-08 490.1 510 472 488.2 8998 1537Mar-08 648 660.8 486.7 492.6 14421 1493Feb-08 586.2 656.5 584 650 6541 1118Jan-08 522 601.5 520 588.6 7324 922Dec-07 510 547 505.5 516.9 2503 582Nov-07 511 529 488 512.9 1424 509Oct-07 636.3 673.4 506.7 514 5176 403Sep-07 629.2 660 587.2 633.7 11990 1017Aug-07 643 659.6 617.2 628.6 28411 1893Jul-07 639 675 609 644.5 35138 2059Jun-07 592.6 639 561 638.4 19119 1533May-07 594.4 611.3 563.7 594.2 25509 2222Apr-07 564 616.5 552.1 593.8 44993 2706Mar-07 632 682 552 561.9 140509 3685Feb-07 510.6 635 488 626.5 82971 3326Jan-07 501.9 521 455.1 518.3 24980 2439Dec-06 528.2 538.5 497 500.8 11811 1420Nov-06 575 575 512.5 528.4 15484 1340Oct-06 735 756.3 546.4 580.6 9069 547Sep-06 595.5 765.3 592.5 732.1 57589 2119Aug-06 536.1 613.8 536.1 592 95004 3963Jul-06 547 556.4 522.1 539.4 40902 5619Jun-06 552.5 584 533.3 549.6 44662 4738May-06 586.1 642.8 551 553 68644 4760Apr-06 668 675 576.2 586.1 28061 2887
Note: Potato futures were launched from March 2006; Potato futures were suspended from trading between May 7, 08 to Dec 3, 08; N/A - Not Available; N/T - Not Traded ^Ag-gregate volume in all contracts during the month; ^^Cumulative open interest in all contracts at the end of month.Source: MCX
A PwC & MCX Joint Endeavour 285www.mcxindia.com / www.pwc.com/in/en
DATABANK - AGRI COMMODITIES
178_300_CYIB_2011_Agri_final.indd 285178_300_CYIB_2011_Agri_final.indd 285 1/26/2012 1:29:45 AM1/26/2012 1:29:45 AM

EDITORIALSPROLOGUE INDIAN ECONOMYEXPERTS' VIEWS
Sugar Fundamentals (in `000' tonnes) 2011-12e 2010-11 2009-10 2008-09 2007-08 2006-07 2001-02
World
Beginning stocks 29264 28,413 29,240 40,505 35,039 30,747 37,423Production 168482 1,60,948 1,53,678 1,44,144 1,63,536 1,64,458 1,30,764Imports 48777 51,828 52,365 46,656 45,721 44,305 40,381Consumption 161274 1,58,622 1,54,918 1,53,437 1,52,337 1,51,332 1,30,087Exports 55704 52,603 51,228 47,786 50,721 51,107 38,315Total supply 246523 2,41,189 2,35,283 2,31,305 2,44,296 2,39,510 2,08,568Ending stocks 28817 29,264 28,413 29,240 40,505 35,039 39,861
India
Beginning stocks 6994 4,664 3,510 9,150 9,850 4,175 10,710Production 28300 26,650 20,637 15,950 28,630 30,780 20,480Imports 100 1,200 4,247 2,786 0 0 0Consumption 26500 25,500 23,500 24,200 23,500 22,425 17,845Exports 1800 20 230 176 5,830 2,680 1,360Net availability 35394 32,514 28,394 27,886 38,480 34,955 31,190Ending stocks 7094 6,994 4,664 3,510 9,150 9,850 11,985Area under production (Sugarcane-'000 Ha) - 5,060 4,175 4,415 5,043 5,151 4411.6Sugarcane yield (tonnes/Ha) - - 70.00 64.66 68.88 69.02 67.40Average daily volatility of MCX spot prices Sugar medium - 1.02% 2.02% 0.74% 0.46% 0.67% -Sugar small - 1.43% 2.01% 0.90% 0.60% 0.77% -Indian price in Rs/qntl - 3061 2259 1508 1491 1880 -LIFFE prices in Rs/qntl - 3202 2293 2012 1351 1462 1011Sugarcane SAP Rs/qntl 145 139 130 81 81 80 62
Note: e - source estimates provided by USDA, Data extracted on July 28, 2011; SAP: State Advisory PriceSource: USDA, Indian Sugar Mills Association
Sugar balance sheet 2011-12e - World (in `000' tonnes) Supply DemandCountry Begining Production Imports Consumption Exports Ending stocks stocks
Brazil -335 39,600 0 27,300 12,550 -585China 1,514 12,000 1,850 64 13,600 1,700EU-27 1,128 15,300 3,700 1,010 17,500 1,618India 6,994 28,300 100 1,800 26,500 7,094Thailand 2,103 9,700 0 7,300 2,800 1,703Others 17,860 63,582 43,127 18,230 88,324 17,287World Total 29,264 168,482 48,777 55,704 161,274 28,817
Note: e - source estimates provided by USDA, Data extracted on July 28, 2011 Source: USDA
Commodity Insights Yearbook 2011286
178_300_CYIB_2011_Agri_final.indd 286178_300_CYIB_2011_Agri_final.indd 286 1/26/2012 1:29:46 AM1/26/2012 1:29:46 AM

DATABANK - NON-AGRI COMMODITIES
Sugar - BRICS Nations fact sheet (in `000' tonnes) Production Import Export Consumption Net Population Per capita Per capita availability (in million) availability consumption (kg) (kg)
Brazil 39,600 0 27,300 12,550 39,265 206.47 190.17 60.78 Russia 4,175 2,000 100 6,010 6,549 137.97 47.47 43.562011-12e India 28,300 100 1,800 26,500 35,394 1,208.36 29.29 21.93 China 12,000 1,850 64 13,600 15,364 1,341.85 11.45 10.14 South Africa 1,840 270 450 1,645 2,250 49.83 45.16 33.01 Brazil 38,150 0 25,650 12,000 37,315 203.43 183.43 58.99 Russia 2,980 2,950 50 5,890 6,329 138.74 45.62 42.452010-11 India 26,650 1,200 20 25,500 32,514 1,189.17 27.34 21.44 China 11,303 1,820 64 13,900 15,478 1,336.72 11.58 10.40 South Africa 1,975 220 500 1,620 2,265 49.00 46.22 33.06 Brazil 36,400 0 24,300 11,800 35,265 201.10 175.36 58.68 Russia 3,444 2,223 34 5,700 6,148 139.39 44.29 40.852009-10 India 20,637 4,247 230 23,500 28,394 1,173.11 24.00 20.03 China 11,429 1,535 93 14,300 16,748 1,330.14 12.62 11.12 South Africa 2,265 200 830 1,590 2,495 49.11 50.81 32.38 Brazil 31,850 0 21,550 11,650 32,065 198.74 161.34 58.62 Russia 3,481 2,150 200 5,500 6,181 140.04 44.14 39.272008-09 India 15,950 2,786 176 24,200 27,886 1,166.08 23.91 20.75 China 13,317 1,077 75 14,500 18,359 1,338.61 13.71 10.83 South Africa 2,350 168 1,185 1,525 2,745 49.05 55.96 31.09 Brazil 31,600 0 19,500 11,400 31,115 196.34 158.47 58.06 Russia 3,200 3,100 200 5,990 6,740 140.70 47.90 42.572007-08 India 28,630 0 5,830 23,500 38,480 1,148.00 33.52 20.47 China 15,898 972 56 14,250 18,271 1,330.04 13.74 10.71 South Africa 2,360 165 1,154 1,585 2,971 48.78 60.90 32.49 Brazil 31,450 0 20,850 10,800 31,165 190.01 164.02 56.84 Russia 3,150 2,950 180 5,950 6,570 141.38 46.47 42.092006-07 India 30,780 0 2,680 22,425 34,955 1,129.87 30.94 19.85 China 12,855 1,465 122 13,500 15,023 1,321.85 11.37 10.21 South Africa 2,313 125 1,267 1,570 3,288 44.00 74.73 35.68
Note: e - source estimates provided by USDA, Data retrived on July 28, 2011, Population fi gures for 2011-12 is arrived at by calculating CAGR from 2004-05 to 2010-11; Source: USDA, World Bank, IFM, CIA World Fact Book
Sugarcane state-wise area and production Area (`000' hectares) Production (`000' tonnes)States/ UT 2010 2009 2008 2007 2006 2001 2010 2009 2008 2007 2006 2001 -11 -10 -09 -08 -07 -02 -11 -10 -09 -08 -07 -02
Uttar Pradesh 2125 1977 2084 2179 2247 1938 125788 108735 109048 124665 133949 117982Maharashtra 964 756 768 1093 1049 595 68672 56551 60648 88437 78568 45140Tamil Nadu 326 293 309 354 391 315 34020 31807 32804 38071 41124 32620Karnataka 421 337 281 306 326 417 36828 29112 23328 26240 28670 33017Andhra Pradesh 192 158 196 247 264 218 14820 11707 15380 20296 21692 18082Gujarat 188 154 221 211 214 176 13440 13440 15380 15190 15630 12465Haryana 102 74 90 140 140 161 6955 5335 5130 8860 9580 8170Uttarakhand 107 96 107 124 121 123 6400 5842 5590 7686 6100 7555Punjab 70 60 81 110 99 121 5000 3700 4670 6690 6020 9250Bihar 300 116 112 109 130 113 5492 5000 4960 3855 5956 5211Madhya Pradesh 76 62 71 75 64 75 3259 2362 2975 3180 2806 1616Others 92 91 96 107 106 64 4239 4159 5116 5018 5425 6100All India 4962 4175 4415 5043 5151 4316 324912 277750 285029 348188 355520 297208
Source: Ministry of Agriculture, GOI
A PwC & MCX Joint Endeavour 287www.mcxindia.com / www.pwc.com/in/en
DATABANK - AGRI COMMODITIES
178_300_CYIB_2011_Agri_final.indd 287178_300_CYIB_2011_Agri_final.indd 287 1/26/2012 1:29:46 AM1/26/2012 1:29:46 AM

EDITORIALSPROLOGUE INDIAN ECONOMYEXPERTS' VIEWS
Sugar month-wise production, despatches and arrivals (in `000' tonnes) Sugar month-wise production and despatches Sugar state-wise Levy FreeMonth Sugar despatches monthly arrivals Sugar Sugar production production Maharashtra Uttar Pradesh
Dec-10 4,587.10 - 0.00 2.11 208.00 1,500.00Nov-10 1,624.40 - 0.00 1.21 215.00 1,400.00Oct-10 229.90 - 10.94 0.71 248.00 1,750.00Sep-10 145.00 - 6.67 0.48 228.00 1,672.00Aug-10 113.00 - 12,650.81 1.64 220.00 1,700.00Jul-10 46.80 - 7.84 2.26 215.00 1,450.00Jun-10 97.00 - 8.60 2.14 208.00 1,700.00May-10 392.40 - 6.66 10.25 217.00 1,900.00Apr-10 1,414.60 - 4.21 1.75 202.00 1,800.00Mar-10 2,950.60 N/A 9.46 1.91 192.00 1,608.00Feb-10 3,749.20 N/A 8.01 1.29 194.00 1,597.00Jan-10 4,110.20 1,544.00 10.16 0.60 209.00 1,430.00Dec-09 4,173.00 1,374.00 10.90 0.72 200.00 1,492.00Nov-09 1,526.30 1,047.00 9.16 0.79 214.00 1,500.00Oct-09 194.40 1,532.00 8.85 0.75 235.00 1,850.00Sep-09 97.00 1,509.00 20.88 0.58 211.00 1,834.00Aug-09 95.40 1,668.00 10.58 0.49 185.00 1,650.00Jul-09 62.00 1,553.00 6.82 1.41 190.00 1,267.00Jun-09 94.00 1,725.00 11.06 1.53 191.00 1,400.00May-09 109.30 1,898.00 1.39 4.04 191.00 1,650.00Apr-09 314.00 2,124.00 0.00 6.85 191.00 1,650.00Mar-09 1,203.20 1,702.00 0.00 1.76 191.00 1,600.00Feb-09 2,605.40 1,765.00 0.00 1.87 191.00 1,500.00Jan-09 3,909.00 2,291.00 0.00 3.85 201.00 1,500.00Dec-08 4,164.80 2,218.00 0.00 1.58 189.00 1,400.00Nov-08 1,586.60 2,132.00 0.00 2.72 180.00 1,500.00Oct-08 294.40 1,830.00 0.00 2.49 227.00 1,500.00Sep-08 110.00 2,252.00 0.00 2.83 208.00 1,200.00Aug-08 105.00 1,874.00 0.00 3.62 194.00 1,100.00Jul-08 162.20 2,377.00 - 3.90 193.00 1,200.00Jun-08 337.00 2,224.00 - 4.15 192.00 1,350.00May-08 1,323.00 2,183.00 - 5.42 186.00 1,350.00Apr-08 2,619.00 2,242.00 - 5.15 186.00 1,700.00Mar-08 4,695.00 2,872.00 - 8.14 189.00 1,600.00Feb-08 5,176.00 2,598.00 - 7.44 191.00 1,400.00Jan-08 5,391.00 2,259.00 - 6.15 195.00 1,400.00Dec-07 4,662.00 2,142.00 - 9.50 229.00 1,300.00Nov-07 1,451.00 2,296.00 - 7.91 229.00 1,300.00Oct-07 326.20 1,773.00 - 8.78 229.00 1,600.00Sep-07 253.00 1,845.00 - 9.21 189.00 1,300.00Aug-07 220.00 1,840.00 - 6.66 186.00 1,300.00Jul-07 224.20 1,762.00 - 5.49 189.00 1,000.00Jun-07 501.10 1,832.00 - 6.23 193.00 1,600.00May-07 1,762.00 1,859.00 - 7.27 184.00 1,300.00Apr-07 3,631.00 1,804.00 - 5.61 176.00 1,200.00Mar-07 4,777.00 2,025.00 - 6.70 159.00 1,500.00Feb-07 4,636.00 2,056.00 - 6.25 174.00 1,300.00Jan-07 4,977.00 1,899.00 - 7.17 184.00 1,300.00Dec-06 4,652.00 1,707.00 - 9.89 167.00 1,200.00Nov-06 2,424.00 1,692.00 - 7.97 169.00 1,300.00Oct-06 306.70 1,637.00 - 7.21 190.00 1,600.00Sep-06 206.00 1,702.00 - 8.54 177.00 1,500.00Aug-06 206.10 1,507.00 - 8.05 165.00 1,300.00Jul-06 165.90 1,343.00 0.02 6.80 153.00 1,200.00Jun-06 81.60 1,581.00 - 8.10 156.00 1,300.00May-06 418.00 1,669.00 - 9.08 150.00 1,450.00Apr-06 1,284.00 2,031.00 8.82 10.90 161.00 1,575.00
Note: e - source estimates provided by USDA, Data extracted on July 28, 2011; SAP: State Advisory Price Source: Indian Sugar Mills Association
Commodity Insights Yearbook 2011288
178_300_CYIB_2011_Agri_final.indd 288178_300_CYIB_2011_Agri_final.indd 288 1/26/2012 1:29:46 AM1/26/2012 1:29:46 AM

DATABANK - NON-AGRI COMMODITIES
State-wise Production of Sugar in India (`000' tonne) 2010-11e 2009-10p 2008-09 2007-08 2006-07 2001-02
Maharashtra 9,507 7,036 4,580 9,075 9,013 5,610Uttar Pradesh 6,385 5,167 4,060 7,320 8,352 5,260Karnataka 3,200 2,512 1,650 2,839 2,542 1,550Tamil Nadu 1,461 1,269 - 2,141 2,421 1,839Gujarat 1,456 1,191 1,010 1,366 1,390 1,060Andhra Pradesh 1,000 510 590 1,335 1,924 1,050India 24,540 18,803 26,330 26,298 28,199 18,530
Source: Compiled based on Lok Sabha Questions (2005-2011)
Number of Sugar Factories in Operation, Sugarcane Crushed /Recovered and Capacity in India 2009-10 2008-09 2007-08 2006-07 2001-02
No. of factories in operation 490 488 516 504 434Average Actual Capacity (tonne) Per 24 hrs 3,825 3,725 3,546 3,474 3,238Total Cane Crushed ('000 tonnes) 185,548 144,978 249,906 279,249 180,321Recovery of Sugarcane (%) 10.2 10.03 10.55 10.17 10.27Average Duration (Days) 108 87 149 174 140
Note: e - estimated; p: provisional Source: Indian Sugar Mills Association
Source: Source: SEA of India & Agmarknet. Average Prices of India for the month of March
12000
9600
7200
4800
2400
0
3500
2800
2100
1400
700
02005-06 2007-082004-05 2006-07 2008-09
India ES World ES (5x) Mumbai Prices Sugar London
2009-10 2010-11
Sugar: Ending Stock & Prices
Source: USDA. ES - ending stock, Indian prices Rs/Qntl, Int. prices Rs/Qntl
000 tonnes Prices
2003-042002-03
A PwC & MCX Joint Endeavour 289www.mcxindia.com / www.pwc.com/in/en
DATABANK - AGRI COMMODITIES
178_300_CYIB_2011_Agri_final.indd 289178_300_CYIB_2011_Agri_final.indd 289 1/26/2012 1:29:46 AM1/26/2012 1:29:46 AM

EDITORIALSPROLOGUE INDIAN ECONOMYEXPERTS' VIEWS
2006-07
2007-08
2008-09
2009-10
2010-11
2011-12e
50,000 100,000 150,000 200,0000
Brayil India EU+27 China Thailand Other
Production
Note: e - source estimates; Source: USDA
2006-07
2007-08
2008-09
2009-10
2010-11
2011-12e
10,000 20,000 30,000 50,000 60,0000
United States EU-27 Indonesia Russia United Arab Emirates Other
Imports
Note: e - source estimates; Source: USDA
2006-07
2007-08
2008-09
2009-10
2010-11
2011-12e
Brazil Thailand Australia Guatemala United Arab Emirates Others
Exports
Note: e - source estimates; Source: USDA
2006-07
2007-08
2008-09
2009-10
2010-11
2011-12e
India EU-27 China Brazil United States Other
Consumption
Note: e - source estimates; Source: USDA
Data of top 5 countries (`000' tonnes)
10,000 20,000 30,000 50,000 60,0000
50,000 100,000 150,000 200,0000
Commodity Insights Yearbook 2011290
178_300_CYIB_2011_Agri_final.indd 290178_300_CYIB_2011_Agri_final.indd 290 1/26/2012 1:29:46 AM1/26/2012 1:29:46 AM

DATABANK - NON-AGRI COMMODITIES
Sugar prices and trading activity Other markets MCX Spot prices (Rs/qtl) monthly average WPI White Sugar LIFFE futuresMonth spot prices of Medium (Delhi) Small (Rs/qtl) Sugar Closing Open Monthly Month’s Month’s Monthly Month’s Month’s Delhi Mumbai price Volume interest average high low average high low (USD/MT) (in lots)^ (in lots)^^Dec-10 3,085.92 3,175.00 3,018.00 2,869.96 2,935.00 2,800.00 3,057.69 2,946.62 172.80 777.50 58,206 49,018Nov-10 3,011.00 3,101.00 2,905.00 2,821.27 2,920.00 2,685.00 2,976.56 2,872.43 166.70 710.00 161,152 47,282Oct-10 2,829.68 2,885.00 2,773.00 2,630.96 2,655.00 2,587.00 2,834.21 2,689.66 161.40 722.60 108,959 63,773Sep-10 2,740.00 2,785.00 2,710.00 2,565.56 2,608.00 2,528.00 2,740.11 2,631.16 159.80 617.00 177,586 61,683Aug-10 2,736.92 2,785.00 2,700.00 2,489.08 2,547.00 2,420.00 2,725.38 2,557.95 160.80 578.70 137,867 65,950Jul-10 2,847.37 2,925.00 2,804.00 2,639.63 2,827.00 2,485.00 2,849.42 2,707.61 164.10 585.70 180,217 61,379Jun-10 2,809.23 2,942.00 2,665.00 2,550.38 2,672.00 2,430.00 2,786.63 2,636.09 155.30 528.80 166,234 68,492May-10 3,055.00 3,168.00 2,946.00 2,745.36 2,825.00 2,646.00 2,997.50 2,830.88 161.00 468.60 113,439 61,448Apr-10 3,040.52 3,159.00 2,963.00 2,738.04 3,003.00 2,605.00 3,015.87 2,864.75 165.40 470.10 140,997 53,338Mar-10 3,354.85 3,569.00 3,150.00 3,040.96 3,288.00 2,845.00 3,332.98 3,171.27 183.60 504.00 191,641 61,202Feb-10 3,852.33 4,198.00 3,548.00 3,471.00 3,924.00 3,225.00 3,759.27 3,597.59 200.30 669.90 203,154 68,854Jan-10 4,111.04 4,326.00 3,847.00 3,817.00 3,996.00 3,600.00 4,019.80 3,876.51 202.10 742.90 208,293 85,066Dec-09 3,549.50 3,847.00 3,418.00 3,299.00 3,600.00 3,144.00 3,500.87 3,386.12 185.70 710.20 171,647 75,877Nov-09 3,523.11 3,590.00 3,380.00 3,355.00 3,431.00 3,135.00 3,440.80 3,456.34 184.10 610.30 189,151 67,621Oct-09 3,100.11 3,380.00 2,822.00 2,886.00 3,135.00 2,726.00 3,086.77 3,017.85 168.80 580.50 170,813 70,781Sep-09 3,046.42 3,172.00 2,960.00 2,904.00 3,201.00 2,810.00 3,000.63 3,034.71 167.40 618.00 199,874 74,908Aug-09 2,933.12 3,085.00 2,593.00 2,808.00 2,976.00 2,367.00 2,925.10 2,892.93 157.50 573.10 139,147 84,155Jul-09 2,554.14 2,611.00 2,494.00 2,338.00 2,381.00 2,294.00 2,543.52 2,432.27 142.80 491.80 152,586 77,426Jun-09 2,522.00 2,545.00 2,475.00 2,355.00 2,392.00 2,295.00 2,501.73 2,436.34 140.00 458.70 128,525 84,198May-09 2,468.00 2,508.00 2,390.00 2,236.00 2,293.00 2,165.00 2,427.39 2,332.30 136.40 453.00 100,842 88,266Apr-09 2,493.00 2,640.00 2,389.00 2,218.00 2,367.00 2,133.00 2,449.43 2,296.76 132.80 427.30 139,985 78,310Mar-09 2,247.00 2,290.00 2,218.00 2,023.00 2,092.00 1,967.00 2,215.00 2,113.00 127.20 392.8 151,055 72,150Feb-09 2,337.00 2,351.00 2,304.00 2,102.00 2,125.00 2,084.00 2,278.00 2,147.00 127.40 401 138,964 61,168Jan-09 2,142.00 2,300.00 2,000.00 1,946.00 2,024.00 1,864.00 2,120.00 2,009.00 120.00 373.5 112,425 60,153Dec-08 1,941.00 1,990.00 1,884.00 1,833.00 1,890.00 1,770.00 1,936.00 1,885.00 109.90 318 51,330 49,159Nov-08 1,920.00 1,933.00 1,908.00 1,760.00 1,772.00 1,716.00 1,854.00 1,824.00 108.60 327.9 70,673 44,510Oct-08 1,943.00 1,976.00 1,897.00 1,709.00 1,735.00 1,683.00 1,858.00 1,778.00 108.70 334.2 120,137 47,924Sep-08 1,884.00 1,968.00 1,839.00 1,700.00 1,800.00 1,663.00 1,840.00 1,775.00 107.90 379.6 152,409 61,627Aug-08 1,935.00 1,995.00 1,790.00 1,807.00 1,901.00 1,641.00 1,918.00 1,884.00 104.50 398 104,971 70,758Jul-08 1,686.00 1,800.00 1,560.00 1,525.00 1,641.00 1,406.00 1,690.00 1,580.00 98.10 386.2 137,739 61,107Jun-08 1,570.00 1,586.00 1,558.00 1,401.00 1,404.00 1,399.00 1,559.00 1,479.00 96.40 383.7 153,428 71,539May-08 1,598.00 1,614.00 1,585.00 1,404.00 1,420.00 1,396.00 1,582.00 1,479.00 96.80 320 92,807 53,217Apr-08 1,617.00 1,662.00 1,591.00 1,417.00 1,468.00 1,394.00 1,603.00 1,500.00 97.00 337.5 139,804 56,083Mar-08 1,630.00 1,667.00 1,551.00 1,435.00 1,464.00 1,350.00 1,615.00 1,509.00 95.80 334.7 142,331 59,961Feb-08 1,562.00 1,587.00 1,539.00 1,330.00 1,358.00 1,314.00 1,537.00 1,410.00 95.00 387.2 207,453 66,707Jan-08 1,537.00 1,574.00 1,473.00 1,354.00 1,378.00 1,289.00 1,498.00 1,422.00 93.50 350.2 279,977 87,017Dec-07 1,480.00 1,497.00 1,450.00 1,274.00 1,287.00 1,260.00 1,445.00 1,356.00 92.30 315 111,053 82,420Nov-07 1,499.00 1,506.00 1,491.00 1,273.00 1,287.00 1,255.00 1,472.00 1,358.00 93.00 287.7 227,327 81,738Oct-07 1,489.00 1,499.00 1,478.00 1,292.00 1,303.00 1,281.00 1,469.00 1,379.00 92.90 283.6 205,544 105,791Sep-07 1,476.00 1,495.00 1,442.00 1,285.00 1,294.00 1,266.00 1,446.00 1,356.00 92.50 280.2 217,764 85,966Aug-07 1,432.00 1,443.00 1,419.00 1,255.00 1,272.00 1,238.00 1,410.00 1,328.00 92.10 279.5 156,009 78,309Jul-07 1,447.00 1,474.00 1,434.00 1,299.00 1,333.00 1,276.00 1,415.00 1,373.00 92.60 309.4 213,241 63,379Jun-07 1,455.00 1,475.00 1,442.00 1,252.00 1,307.00 1,233.00 1,420.00 1,334.00 92.50 320.5 185,962 77,307May-07 1,444.00 1,478.00 1,401.00 1,245.00 1,269.00 1,224.00 1,412.00 1,337.00 92.80 339 175,963 91,830Apr-07 1,492.00 1,552.00 1,432.00 1,361.00 1,456.00 1,269.00 1,452.00 1,444.00 95.80 308 166,403 82,018Mar-07 1,543.00 1,554.00 1,529.00 1,436.00 1,454.00 1,394.00 1,518.00 1,512.00 98.60 332 174,770 77,833Feb-07 1,579.00 1,621.00 1,527.00 1,396.00 1,437.00 1,335.00 1,559.00 1,476.00 100.40 332.9 128,619 60,469Jan-07 1,647.00 1,713.00 1,611.00 1,470.00 1,495.00 1,423.00 1,636.00 1,558.00 103.00 336.9 131,374 63,857Dec-06 1,739.00 1,780.00 1,700.00 1,555.00 1,630.00 1,500.00 1,731.00 1,644.00 107.20 342.8 79,346 53,621Nov-06 1,855.00 1,890.00 1,785.00 1,662.00 1,690.00 1,633.00 1,841.00 1,757.00 109.80 369.4 147,349 50,378Oct-06 1,891.00 1,916.00 1,875.00 1,707.00 1,680.00 1,658.00 1,878.00 1,780.00 110.30 400 111,884 58,778Sep-06 1,868.00 1,903.00 1,837.00 1,772.00 1,810.00 1,745.00 1,854.00 1,807.00 110.70 377.9 160,910 54,203Aug-06 1,919.00 1,955.00 1,870.00 1,833.00 1,852.00 1,809.00 1,906.00 1,870.00 113.00 380 125,948 63,148Jul-06 1,943.00 1,964.00 1,923.00 1,833.00 1,852.00 1,822.00 1,921.00 1,874.00 114.00 439.5 145,956 61,199Jun-06 1,971.00 2,016.00 1,919.00 1,871.00 1,900.00 1,830.00 1,964.00 1,901.00 115.70 465.9 135,250 71,051May-06 2,018.00 2,052.00 1,939.00 1,918.00 2,046.00 1,868.00 2,015.00 1,945.00 116.30 447 152,157 65,199Apr-06 2,017.00 2,064.00 1,982.00 1,890.00 1,930.00 1,814.00 2,004.00 1,940.00 115.80 474 162,367 63,902
Note: MCX Spot prices for sugar medium is taken from Alipur till Nov-09 and from Delhi from Dec-09 onwards, WPI - Wholesale Price Index; Future prices are for near month continuos futures contract.Source: AgmarkNet; & Ministry of Comerce and Industry; Exchanges' websites
A PwC & MCX Joint Endeavour 291www.mcxindia.com / www.pwc.com/in/en
DATABANK - AGRI COMMODITIES
178_300_CYIB_2011_Agri_final.indd 291178_300_CYIB_2011_Agri_final.indd 291 1/26/2012 1:29:47 AM1/26/2012 1:29:47 AM

EDITORIALSPROLOGUE INDIAN ECONOMYEXPERTS' VIEWS
Rubber fundamentals - World (in `000' tonnes)Natural rubber production 2010 2009 2008 2007 2006 2001World 10,291 9,662 10,042 9,833 9,706 7332Asia 9,637 9,042 9,399 9,386 9,315 -Africa 459 423 447 444 421 -Synthetic rubber production World 14,002 12,087 12,743 13,387 12,653 10483EU-27 2,607 2,210 2481 2,683 2,710 -Natural rubber world stocks 1,503 1,880 1,519 - - -Synthetic rubber world stocks 3,449 3,309 3,056 - - -
Source: International Rubber Study Group.
Rubber fundamentals - India (in tonnes) Natural rubber 2010-11 2009-10 2008-09 2007-08 2006-07 2001-02Production 8,61,950 8,31,400 8,64,500 8,25,345 8,52,895 6,31,400Imports 1,88,337 1,77,133 77,762 85,753 89,699 49,769Consumption 9,47,715 9,30,565 8,71,720 8,61,455 8,20,305 6,38,210Consumption by tyre industry - 4,79,066 5,10,469 4,95,577 4,62,081 -Exports 20,580# 25,611 47,953 61,086 52,286 5,918Ending stocks 2,77,600 2,11,290 1,96,230 1,67,120 1,63,530 1,93,070 Average daily volatility MCX spot prices 1.34% 1.15% 6.06% 1.05% 1.26% -TOCOM price (Rs/qtl) 11,009 10,259 9,527 9,702 Indian Price (Rs/qtl)* 19,014 11,501 10,103 9,089 9,202 -
Note: # - Figures released till Feb; ^Apr 2010 to Jan 2011 * - Price averaged for FY Source: AgmarkNet, Economic Survey 2008-09, 2009-10, 2010-11; The Rubber Board of India
Synthetic rubber fundamentals - India (in tonnes) 2010-11 2009-10 2008-09 2007-08 2006-07 2001-02Production 1,10,340 1,06,743 96,739 1,06,286 99,513 69,653SBR 19,994 17,997 12,523 16,879 12,285 16,182PBR 75,905 72,666 71,758 74,045 71,730 42,244Imports 3,91,184 3,31,147 2,24,193 2,50,762 2,26,786 1,14,223Consumption 4,11,830 3,47,710 2,92,950 2,97,155 2,70,830 1,74,530SBR 1,74,855 1,38,905 1,11,745 1,10,965 98,170 55,945PBR 1,25,305 1,04,465 82,740 88,205 79,900 49,995Ending stocks 35,450 34,910 25,670 26,225 26,410 32,810
Note: #April-Dec 2010; *April-Nov 2010 - Jan 2010; SBR - Styrene Butadiene Rubber; PBR - Polybutadiene Rubber; p- provisionalSource: The Rubber Board of India; Trade Sources
Reclaimed rubber fundamentals - India (in tonnes) 2010-11* 2009-10 2008-09 2007-08 2006-07 2001-02Production 75,070 93,580 86,390 83,075 78,495 63,550Consumption 74,615 92,250 86,030 83,165 78,435 63,875Ending stocks 5,735 5,280 3,995 3,635 3,725 3,005
Note: *April 2010 - Dec 2011; Source: The Rubber Board of India; Trade Sources
Tyres & tubes fundamentals - India (in '000 nos.) 2010-11 2009-10 2008-09 2007-08 2006-07 2001-02Tyre Production 1,19,196 97,608 82,107 81,103 74,034 43,496Tyre Imports - 4,767 4,064 3,334 2,587 280Tyre Sales 1,17,027 95,241 80,515 79,202 71,757 44,462Tyre Exports - 10,382 7,732 7,683 7,082 3,796
Note: The Rubber Board of India, Trade Sources, Director General of Foreign Trade Source: AgmarkNet, Economic Survey 2008-09, 2009-10, 2010-11; The Rubber Board of India
Grade-wise consumption of natural rubber in India (in tonnes) 2010-11 2009-10 2008-09 2007-08 2006-07 2001-02Ribbed Smoked Sheet (RSS) 607,455 621,435 597,440 577,635 561,580 453,465Solid Block Rubber 235,130 190,545 146,060 155,670 132,755 65,650Latex Concentrates (drc) 77,380 82,515 80,520 77,715 76,190 62,990Others 27,750 36,070 47,700 50,435 49,780 49,295Total 947,715 930,565 871,720 861,455 820,305 631,400
Source: Source: Indian Rubber Statistics, Ministry of Commerce & Industry, Govt. of India. & Rubber Board of India.
Commodity Insights Yearbook 2011292
178_300_CYIB_2011_Agri_final.indd 292178_300_CYIB_2011_Agri_final.indd 292 1/26/2012 1:29:47 AM1/26/2012 1:29:47 AM

DATABANK - NON-AGRI COMMODITIES
Rubber marketed by co-operative societies inIndia (in tonnes) Year No. of Societies Rubber Marketed
2009-10 P 263 343452008-09 P 267 385002007-08 P 270 580552006-07 P 279 730302001-02 285 103611
Note: P - Provisional.Source: Rubber Board of India.
Rubber state-wise monthly arrivals (in tonnes) Month Kerala Tamil NaduMar-11 279.16 51.38Feb-11 262.12 136.51Jan-11 267.72 113.63Dec-10 186.46 42.50Nov-10 219.06 108.48Oct-10 200.09 44.80Sep-10 254.28 120.25Aug-10 411.64 109.70Jul-10 436.87 129.78Jun-10 492.56 12.89May-10 536.86 63.20Apr-10 796.21 62.91Mar-10 782.78 104.60Feb-10 391.91 158.55Jan-10 466.49 162.18Dec-09 358.07 201.06Nov-09 322.40 185.28Oct-09 261.44 49.52Sep-09 175.51 118.68Aug-09 145.80 149.60Jul-09 195.90 138.49Jun-09 189.82 308.57May-09 180.80 217.04Apr-09 152.52 333.24Mar-09 158.89 265.65Feb-09 73.63 154.96Jan-09 57.05 339.51Dec-08 45.49 57.51Nov-08 52.58 24.00Oct-08 28.60 42.21Sep-08 45.30 40.08Aug-08 59.18 N/AJul-08 64.96 16.20Jun-08 1662.00 60.06May-08 41.37 53.06Apr-08 59.66 137.48Mar-08 1586.99 291.40Feb-08 55.06 248.17Jan-08 107.71 241.71Dec-07 92.44 139.72Nov-07 74.81 164.76Oct-07 100.22 165.10
Rubber state-wise monthly arrivals (in tonnes) Month Kerala Tamil Nadu
Sep-07 79.12 169.62Aug-07 71.28 145.26Jul-07 90.98 112.54Jun-07 65.66 N/AMay-07 122.20 N/AApr-07 70.43 132.80Mar-07 90.06 135.44Feb-07 75.08 184.87Jan-07 132.75 177.04Dec-06 145.04 151.69Nov-06 151.64 324.34Oct-06 57.05 195.97Sep-06 107.83 52.38Aug-06 107.83 302.05Jul-06 97.68 237.99Jun-06 167.16 111.57May-06 165.62 178.95Apr-06 57.75 49.64
Note: N/A - Not available Source: Dept. of Agriculture, GOI
Castor: Seeds Prodn., Oil Exports & Prices
Source: Source: SEA of India & Agmarknet. Average Prices of India for the month of March
1000000
750000
500000
250000
0
21000
16500
12000
7500
30002005-06 2007-082004-05 2006-07 2008-09
Production Consumption
Rss -4 Kottayam Prices (RHS)
2009-10 2010-11
Rubber Production, Consumption & Prices
Source: Economic Survey 2010-11, Rubber Board, Agmarknet
Price Rs/qntlin tonnes
A PwC & MCX Joint Endeavour 293www.mcxindia.com / www.pwc.com/in/en
DATABANK - AGRI COMMODITIES
178_300_CYIB_2011_Agri_final.indd 293178_300_CYIB_2011_Agri_final.indd 293 1/26/2012 1:29:47 AM1/26/2012 1:29:47 AM

EDITORIALSPROLOGUE INDIAN ECONOMYEXPERTS' VIEWS
Rubber monthly spot prices at MCX and other major physical market in IndiaMonth MCX monthly spot prices Kottayam (Rs/qtl) Spot price (RSS-4) Rs./Quintal WPI of Rubber Monthly Average Month's High Month's Low Kottayam
Dec-10 20,199 20,752 19,573 20,194 359.3Nov-10 19,952 20,493 19,260 19,873 352.0Oct-10 18,102 19,055 16,970 18,143 319.5Sep-10 16,627 16,970 16,166 16,653 298.8Aug-10 17,988 18,889 16,520 17,981 315.6Jul-10 18,403 18,566 18,126 18,217 327.4Jun-10 17,098 18,053 16,674 17,103 307.5May-10 15,995 17,110 15,074 15,983 290.2Apr-10 16,497 17,011 15,822 16,396 293.3Mar-10 14,954 15,674 14,155 14,952 268.8Feb-10 13,702 14,229 13,282 13,686 246.9Jan-10 13,773 14,061 13,140 13,795 246.2Dec-09 13,501 14,073 12,221 13,433 238.1Nov-09 11,287 12,125 10,925 11,271 200.9Oct-09 10,885 11,207 10,635 10,889 192.7Sep-09 10,646 10,835 10,510 10,653 190.2Aug-09 10,261 10,753 10,011 10,250 183.5Jul-09 9,832 9,995 9,660 9,825 177.0Jun-09 9,926 10,019 9,712 9,910 178.4May-09 9,824 10,200 9,399 9,786 177.3Apr-09 9,591 10,200 8,662 9,564 168.4Mar-09 7,627 8,533 6,996 7,566 135.6Feb-09 6,921 7,215 6,754 6,900 124.0Jan-09 7,080 7,487 6,679 7,030 127.0Dec-08 6,526 7,428 5,914 6,502 114.9Nov-08 7,691 8,900 6,000 7,689 141.0Oct-08 9,143 11,513 8,100 8,960 169.8Sep-08 13,613 14,150 11,400 13,533 250.2Aug-08 13,872 14,296 13,454 13,774 249.1Jul-08 13,373 14,114 12,971 13,349 238.6Jun-08 12,764 13,106 12,440 12,713 228.0May-08 12,287 13,600 11,573 12,260 217.3Apr-08 10,985 11,887 10,104 10,963 196.8Mar-08 10,114 10,145 10,085 10,358 186.6Feb-08 9,715 10,088 9,393 9,718 173.6Jan-08 9,466 9,584 9,308 9,441 170.7Dec-07 9,256 9,450 9,104 9,221 166.0Nov-07 9,681 10,017 9,323 9,603 174.9Oct-07 9,510 10,042 8,938 9,424 171.3Sep-07 8,882 9,096 8,696 8,856 158.6Aug-07 8,780 9,285 8,033 8,742 154.2Jul-07 7,966 8,744 7,284 7,943 144.5Jun-07 8,099 8,705 7,445 8,093 146.5May-07 8,714 9,206 8,247 8,685 157.5Apr-07 8,994 9,486 8,293 8,979 161.1Mar-07 9,037 9,440 8,668 9,071 164.3Feb-07 9,787 10,129 9,431 9,757 175.3Jan-07 9,785 10,170 9,530 9,716 169.8Dec-06 8,674 9,518 7,659 8,615 152.3Nov-06 8,278 9,153 7,600 8,225 149.7Oct-06 8,754 9,301 7,865 8,686 156.9Sep-06 8,222 8,806 7,800 8,169 147.7Aug-06 9,199 9,510 8,700 9,182 166.6Jul-06 9,807 10,685 8,870 9,821 180.4Jun-06 10,711 11,050 10,478 10,692 187.8May-06 9,911 11,419 9,010 9,841 172.2Apr-06 8,672 9,051 8,370 8,653 155.4
Note: Trading suspended from May 7, 08 to Dec 3, 08, WPI - Wholesale Price Index; Source: MCX, Agmarknet; Ministry of Comerce and Industry.
Commodity Insights Yearbook 2011294
178_300_CYIB_2011_Agri_final.indd 294178_300_CYIB_2011_Agri_final.indd 294 1/26/2012 1:29:47 AM1/26/2012 1:29:47 AM

DATABANK - NON-AGRI COMMODITIES
Rubber futures prices and trading activity Rubber monthly MCX futures prices (Rs/qtl) Rubber TOCOM futures Thailand RubberMonth Open High Low Close Volume Open Closing Volume Open Prices- (in lots)^ interest price (in lots)^ interest RSS-4 (in lots^^) (Yen/kg) (in lots^^) (Rs/qtl)
Dec-10 19,693 20,570 19,693 20,570 0 0 405.1 279,483 37,059 21318Nov-10 18,925 20,290 18,925 19,892 0 0 359.1 348,920 38,527 19571Oct-10 16,742 18,925 16,742 18,925 0 0 317.5 222,252 33,959 17258Sep-10 17,253 17,605 16,573 16,742 0 0 297.5 160,656 34,694 16114Aug-10 18,546 18,731 17,205 17,253 2 0 310.4 184,159 34,446 15406Jul-10 18,040 18,547 18,040 18,546 0 0 303.8 176,823 27,416 15668Jun-10 16,758 17,861 16,758 17,861 0 0 343.0 243,344 27,791 16863May-10 16,610 16,610 15,327 16,592 0 0 380.2 248,968 29,076 16675Apr-10 15,542 16,947 15,542 16,778 1 0 395.0 254,964 43,792 17186Mar-10 14,143 15,542 14,143 15,542 3 1 329.3 258,365 38,670 15128Feb-10 13,772 14,143 13,456 14,143 0 0 284.9 212,199 31,765 14455Jan-10 13,862 14,001 13,772 13,772 0 0 262.7 258,178 33,766 14193Dec-09 11,875 13,862 11,875 13,862 0 0 259.0 239,002 38,154 13095Nov-09 10,966 11,757 10,966 11,757 0 0 235.7 164,036 36,892 11823Oct-09 10,749 11,077 10,749 10,966 0 0 234.0 224,397 39,830 10999Sep-09 10,753 10,753 10,434 10,749 0 0 188.4 280,009 31,047 10515Aug-09 9,863 10,577 9,863 10,577 0 0 195.0 293,259 38,805 9880Jul-09 9,938 9,938 9,544 9,863 3 0 188.8 230,688 37,403 8490Jun-09 9,925 9,942 9,743 9,938 0 0 156.4 228,134 30,202 8150May-09 10,136 10,136 9,539 9,925 0 0 158.6 187,947 27,910 8404Apr-09 8,490 9,937 8,320 9,937 15 0 156.0 315,890 30,684 8064Mar-09 6,850 8,490 6,850 8,490 45 9 148.0 237,447 28,267 7433Feb-09 6,998 7,059 6,720 6,890 36 38 133.3 289,620 29,503 7336Jan-09 7,670 7,673 6,596 6,998 102 57 130.1 349,022 28,088 7409Dec-08 6,100 7,653 5,806 7,450 268 41 135.0 403,148 34,574 6117Nov-08 N/T N/T N/T N/T N/T N/T 125.8 353,015 30,824 8566Oct-08 N/T N/T N/T N/T N/T N/T 169.7 537,697 32,350 9828Sep-08 N/T N/T N/T N/T N/T N/T 262.7 363,528 41,041 13235Aug-08 N/T N/T N/T N/T N/T N/T 342.8 435,425 40,613 12688Jul-08 N/T N/T N/T N/T N/T N/T 336.4 487,494 46,373 13740Jun-08 N/T N/T N/T N/T N/T N/T 340.4 643,926 51,635 13826May-08 11,241 11,667 11,241 11,658 75 73 312.2 484,445 47,365 12738Apr-08 9,899 11,503 9,899 11,241 226 72 297.8 393,003 44,400 11286Mar-08 10,177 10,550 9,899 9,899 233 53 277.8 491,985 38,788 11320Feb-08 9,434 10,195 9,385 10,177 304 99 292.5 545,876 50,406 10970Jan-08 9,640 9,747 9,260 9,339 262 109 282.0 331,672 33,820 10297Dec-07 9,391 9,698 9,222 9,625 303 130 294.2 288,746 38,147 9792Nov-07 9,900 10,250 9,350 9,533 583 100 258.3 431,433 36,574 9837Oct-07 8,985 10,200 8,760 9,838 1,412 128 278.4 376,156 47,570 9108Sep-07 8,764 9,050 8,450 8,984 1,976 217 255.8 346,079 44,312 8689Aug-07 8,650 9,499 7,925 8,752 4,244 397 248.6 486,623 46,338 8651Jul-07 7,472 8,682 7,369 8,674 4,061 570 260.3 662,162 54,142 8382Jun-07 8,770 8,770 7,476 7,617 3,303 557 257.1 683,104 48,428 9192May-07 8,485 9,290 8,189 8,742 2,987 479 284.1 605,962 53,906 9588Apr-07 9,260 9,495 8,285 8,416 3,057 544 266.6 609,519 48,276 9802Mar-07 9,162 9,575 8,191 9,258 6,130 670 274.0 719,804 51,731 10029Feb-07 10,529 10,529 9,021 9,219 7,914 1,165 260.2 743,497 55,797 10561Jan-07 10,060 10,606 9,852 10,479 20,066 1,519 275.0 760,361 55,921 9276Dec-06 7,950 9,400 7,540 9,250 30,014 1,255 239.2 748,253 52,821 7768Nov-06 9,000 9,048 7,182 7,931 12,848 667 188.1 536,706 49,663 7358Oct-06 7,850 9,146 7,850 8,905 871 8 208.4 777,801 49,847 8410Sep-06 8,700 8,710 7,850 7,850 100 1 208.3 867,923 48,345 8431Aug-06 9,225 9,510 8,763 8,763 92 4 230.5 728,756 53,082 10263Jul-06 10,675 10,920 8,870 9,225 154 3 278.6 780,079 16,132 11665Jun-06 11,000 11,120 10,384 10,625 125 24 322.9 1,099,210 64,768 12438May-06 9,167 11,536 9,167 11,075 60 8 307.2 909,052 76,383 10887Apr-06 8,475 9,300 8,405 9,167 83 6 242.1 543,428 64,854 9661
Note: ^Aggregate volume in all contracts during the month; ^^Cumulative open interest in all contracts at the end of month; Trading suspended between May 7, '08 to Dec 3, '08; Future prices are for near month continuos futures contract.Source: Exchanges' websites
A PwC & MCX Joint Endeavour 295www.mcxindia.com / www.pwc.com/in/en
DATABANK - AGRI COMMODITIES
178_300_CYIB_2011_Agri_final.indd 295178_300_CYIB_2011_Agri_final.indd 295 1/26/2012 1:29:48 AM1/26/2012 1:29:48 AM

EDITORIALSPROLOGUE INDIAN ECONOMYEXPERTS' VIEWS
Coffee fundamentals - World and India (in `000' 60 kgs bags) 2011-12e 2010-11 2009-10 2008-09 2007-08 2006-07 2001-02
World
Beginning Stocks 25,832 24,418 35,663 28,647 33,597 31,254 20,875Production 139,084 137,908 126,781 133,403 121,753 131,819 117,521Imports 102,413 104,473 99,581 96,831 96,809 97,470 1,478Consumption 131,025 132,497 135,871 123,742 127,033 124,107 26,319Exports 104,967 107,455 101,736 99,476 96,479 102,839 90,937Total supply 267,335 266,799 262,025 258,881 252,159 260,543 139,874Ending Stocks 31,343 26,847 24,418 35,663 28,647 33,597 22,618
India
Beginning Stocks 40 140 250 65 95 255 20Production 4800 5,100 4,850 4,375 4,660 4,665 5,020Imports 500 550 725 555 490 334 0Consumption 1500 1,650 1,575 1,625 1,360 1,550 975Exports 3750 4,100 4,110 3,120 3,820 3,609 3,702Total Supply 5340 5,790 5,825 4,995 5,245 5,254 5,040Ending Stocks 90 40 140 250 65 95 363Area under Production (000 Ha) - 405P 400 394 388 382 347Average daily volatility of MCX spot prices - 2.17% 1.66% 1.96% 2.09% - -
Note: e - source estimates provided by USDA, data retrieved on July 29, 2011; P: Provisional; Market Year (India): October to September,Source: USDA; Dept. of Agriculture, GOI; MCX
Coffee balance sheet 2011-12e - World (in `000' 60 kgs bags)Country Supply Demand Beginning Production Imports Consumption Exports Ending Stocks Stocks
Brazil 2,846 54,500 0 19,500 32,000 5,846Vietnam 1,784 18,725 106 1,050 17,430 2,135Indonesia 143 9,000 200 1,900 7,400 43Colombia 284 9,000 740 1,200 8,650 174India 50 5,125 700 1,750 4,075 50Others 20,731 42,734 100,667 105,625 35,412 23,095World Total 25,838 139,084 102,413 131,025 104,967 31,343
Note: e - source estimates provided by USDA, data retrieved on July 29, 2011; Source: USDA
Commodity Insights Yearbook 2011296
178_300_CYIB_2011_Agri_final.indd 296178_300_CYIB_2011_Agri_final.indd 296 1/26/2012 1:29:48 AM1/26/2012 1:29:48 AM

DATABANK - NON-AGRI COMMODITIES
Coffee - BRICS Nations fact sheet (in `000' 60 kgs bags)World Production Import Export Consumption Total Population Per capita Per capita Supply (in million) availability consumption (kg) (kg)
Brazil 54,500 0 32,000 19,500 57,346 206.47 16.91 5.75 Russia 0 4,300 0 4,300 4,300 137.97 1.86 1.862011-12e India 5,125 700 4,075 1,750 5,875 1,208.36 0.30 0.09 China 0 450 0 450 450 1,341.85 0.02 0.02 South Africa 0 425 0 425 425 49.83 0.52 0.52 Brazil 54,500 0 32,000 19,500 57,346 203.43 16.91 5.75 Russia 0 4,300 0 4,300 4,300 138.74 1.86 1.862010-11 India 5,125 700 4,075 1,750 5,875 1,189.17 0.30 0.09 China 0 450 0 450 450 1,336.72 0.02 0.02 South Africa 0 425 0 425 425 49.00 0.52 0.52 Brazil 44,800 0 29,780 18,750 51,376 201.10 15.33 5.59 Russia 0 4,075 0 4,075 4,075 139.39 1.75 1.752009-10 India 4,825 750 3,850 1,725 5,625 1,173.11 0.29 0.09 China 0 425 0 425 425 1,330.14 0.02 0.02 South Africa 0 400 0 400 400 49.11 0.49 0.49 Brazil 53,300 0 31,475 18,030 56,081 198.74 16.93 5.44 Russia 0 3,455 0 3,455 3,455 140.04 1.48 1.482008-09 India 4,375 555 3,120 1,825 4,995 1,166.08 0.26 0.09 China 0 320 0 320 320 1,338.61 0.01 0.01 South Africa 0 330 0 330 330 49.05 0.40 0.40 Brazil 39,100 0 27,290 17,390 47,461 196.34 14.50 5.31 Russia 0 4,520 0 4,520 4,520 140.70 1.93 1.932007-08 India 4,660 490 3,820 1,360 5,245 1,148.00 0.27 0.07 China 0 300 0 300 300 1,330.04 0.01 0.01 South Africa 0 410 0 410 410 48.78 0.50 0.50 Brazil 46,700 0 29,260 16,720 54,341 190.01 17.16 5.28 Russia 0 4,410 0 4,410 4,410 141.38 1.87 1.872006-07 India 4,665 334 3,609 1,550 5,254 1,129.87 0.28 0.08 China 0 300 0 300 300 1,321.85 0.01 0.01 South Africa 0 430 0 430 430 44.00 0.59 0.59
Note: e - source estimates provided by USDA, data retrieved on July 29, 2011; In `000' 60 kgs bags unless otherwise specifi ed, Population fi gures for 2011-12 is arrived at by calculating CAGR from 2004-05 to 2010-11; Source: USDA, World Bank, IFM, CIA World Fact Book
Coffee: Ending Stock & Prices
Source:Agmarknet & USDA. ES - ending stock, Indian prices Rs/kg, Int. prices Rs/kg
500
400
300
200
100
0
3500
2800
2100
1400
700
02005-06
India ES
World ES (in 50x)
Int.Prices
Mumbai Prices
in 000 tonnes Prices
2006-07 2007-08 2008-09 2009-10 2010-112004-052003-042002-03
A PwC & MCX Joint Endeavour 297www.mcxindia.com / www.pwc.com/in/en
DATABANK - AGRI COMMODITIES
178_300_CYIB_2011_Agri_final.indd 297178_300_CYIB_2011_Agri_final.indd 297 1/26/2012 1:29:48 AM1/26/2012 1:29:48 AM

EDITORIALSPROLOGUE INDIAN ECONOMYEXPERTS' VIEWS
Coffee select state/district-wise production in India (in `000' tonnes)States/Districts 2010-11 2009-10# 2008-09# 2007-08# 2006-07#
Karnataka
Chikmagalur 74.34 70.15 71.75 63.70 72.55Kodagu* 110.02 111.20 114.37 108.70 107.50Hassan 29.43 24.35 28.05 19.18 25.98Sub Total 213.78 205.70 214.17 191.58 206.03
Kerala
Wyanad 55.28 49.95 47.51 40.33 49.00Travancore 8.15 7.43 7.82 6.68 8.15Nelliampathies 2.23 1.88 1.88 2.00 2.33Sub Total 65.65 59.25 57.20 49.00 59.48
Tamil Nadu
Pulneys 6.03 7.05 5.83 8.00 7.90Nilgiris 5.48 5.75 5.20 4.85 5.10Shevroys (Salem) 3.65 4.05 3.10 3.15 3.23Anamalais (Coimbatore) 1.50 2.50 2.50 2.10 2.00Sub Total 16.65 19.35 16.63 18.10 18.23
Non Traditional Areas
Andhra Pradesh & Orissa 5.75 5.19 4.88 3.18 4.09North Eastern Region 0.17 0.12 0.13 0.15 0.19Sub Total 5.92 5.30 5.01 3.33 4.28Non Conventional Areas - - - - -
Grand Total (India) 302.00 289.60 293.00 262.00 288.00
Note: * - Including Mysore; # : Post-Monsoon Estimates Source: Coffee Board.
Coffee state-wise monthlyarrivals (in tonnes) Month KeralaApr-11 42.5Mar-11 115.7Feb-11 71.9Jan-11 39.7Dec-10 40.9Nov-10 24.9Oct-10 13.3Sep-10 31.2Aug-10 230.5Jul-10 105.1Jun-10 169.9May-10 102.2Apr-10 276.0Mar-10 96.0Feb-10 101.0Jan-10 71.5Dec-09 25.0Nov-09 25.5Oct-09 35.6Sep-09 13.0Aug-09 3.0Jul-09 4.0Jun-09 4.0May-09 3.0Apr-09 -Mar-09 11.0Feb-09 230.0
Coffee state-wise monthlyarrivals (in tonnes) Month KeralaJan-09 -Dec-08 1.5Nov-08 -Oct-08 0.5Sep-08 4.0Aug-08 4.5Jul-08 4.5Jun-08 4.0May-08 21.5Apr-08 4.5Mar-08 97.5Feb-08 141.8Jan-08 49.0Dec-07 44.5Nov-07 69.5Oct-07 34.5Sep-07 53.0Aug-07 55.0Jul-07 48.5Jun-07 106.5May-07 36.0Apr-07 5.5Mar-07 31.5Feb-07 81.0Jan-07 177.0Dec-06 45.0Nov-06 66.2
Coffee state-wise monthlyarrivals (in tonnes) Month KeralaOct-06 99.0Sep-06 25.0Aug-06 74.0Jul-06 112.3Jun-06 203.7May-06 195.3Apr-06 223.2
Source: Dept. of Agriculture, GOI
Commodity Insights Yearbook 2011298
178_300_CYIB_2011_Agri_final.indd 298178_300_CYIB_2011_Agri_final.indd 298 1/26/2012 1:29:48 AM1/26/2012 1:29:48 AM

DATABANK - NON-AGRI COMMODITIES
2006-07
2007-08
2008-09
2009-10
2010-11
2011-12e
500000 100000 150000
Brazil Vietnam Indonesia Colombia India Other
Production
Note: e - source estimates; Source: USDA
2006-07
2007-08
2008-09
2009-10
2010-11
2011-12e
20000 40000 60000 80000 1000000 120000EU-27 United States Japan Russia Algeria Others
Imports
Note: e - source estimates; Source: USDA
2006-07
2007-08
2008-09
2009-10
2010-11
2011-12e
20000 40000 60000 80000 1000000 120000Brazil Vietnam Colombia Indonesia India Others
Exports
Note: e - source estimates; Source: USDA
2006-07
2007-08
2008-09
2009-10
2010-11
2011-12e
20000 40000 60000 80000 1000000 140000120000EU-27 United States Brazil Japan Russia Others
Consumption
Note: e - source estimates; Source: USDA
Data of top 5 countries (`000' tonnes)
A PwC & MCX Joint Endeavour 299www.mcxindia.com / www.pwc.com/in/en
DATABANK - AGRI COMMODITIES
178_300_CYIB_2011_Agri_final.indd 299178_300_CYIB_2011_Agri_final.indd 299 1/26/2012 1:29:48 AM1/26/2012 1:29:48 AM

EDITORIALSPROLOGUE INDIAN ECONOMYEXPERTS' VIEWS
Coffee prices and trading activity MCX Spot prices, Kaushal Nagar Average monthly Coffee Arabica NYBOT- Coffee Robusta NYSE- (in Rs/Kg) domestic prices WPI of ICE futures LIFFE London futuresMonth (Rs/kg) Coffee Closing Open Closing Open Monthly Month’s Month’s Arabica Robusta price Volume interest in price Volume interest in average high Low Cherry Cherry (USD/kg) in lots^ lots^^ (USD/kg) in lots^ lots^^
Dec-10 N/A N/A N/A 168.67 89.75 236.80 5.29 245,084 140,170 2.08 236,985 99,279Nov-10 N/A N/A N/A 148.50 88.00 236.80 4.42 479,216 127,596 1.76 240,130 89,049Oct-10 N/A N/A N/A 144.00 83.17 228.90 4.48 351,134 151,645 1.97 321,834 92,439Sep-10 N/A N/A N/A N/A 80.97 228.90 4.03 318,166 136,645 1.73 177,568 105,293Aug-10 N/A N/A N/A 125.25 83.33 228.90 3.89 554,163 140,836 1.60 291,040 95,397Jul-10 80.27 82.80 77.80 122.10 79.47 225.80 3.88 369,104 169,398 1.74 158,736 94,111Jun-10 69.71 78.20 62.00 110.00 72.38 224.80 3.61 728,194 165,658 1.70 343,878 85,950May-10 60.85 63.60 57.70 115.50 71.00 224.80 2.95 362,053 136,152 1.30 175,489 89,090Apr-10 59.01 61.50 56.00 112.00 67.00 231.40 2.97 526,440 135,557 1.29 232,327 87,085Mar-10 57.84 62.00 55.70 114.67 N/A 238.80 3.00 378,244 130,381 1.32 206,560 93,948Feb-10 59.48 61.90 56.40 128.00 76.50 241.30 2.84 503,189 122,640 1.24 246,096 86,223Jan-10 62.44 64.10 60.40 120.00 81.67 240.00 2.90 319,390 128,342 1.30 155,347 89,503Dec-09 62.15 64.50 59.80 N/A 80.50 237.70 3.00 275,581 125,779 1.29 250,540 82,941Nov-09 63.57 68.60 60.70 101.25 81.24 230.90 3.13 459,671 110,355 1.32 151,840 100,138Oct-09 66.41 69.00 63.20 N/A 80.83 228.60 2.99 316,712 123,488 1.39 315,633 81,798Sep-09 71.41 73.60 66.90 103.50 82.50 226.90 2.82 235,543 99,249 1.38 156,685 91,233Aug-09 68.33 72.40 64.70 102.63 80.00 229.20 2.67 365,434 94,308 1.37 257,616 88,340Jul-09 68.60 73.40 62.90 102.17 82.63 229.90 2.82 226,277 103,133 1.47 157,040 91,373Jun-09 68.72 73.70 60.40 110.00 77.83 232.70 2.59 409,010 111,402 1.30 303,912 100,564May-09 73.20 75.00 71.50 110.00 83.00 227.40 3.03 298,128 141,258 1.49 109,880 95,899Apr-09 76.16 78.70 72.30 105.25 N/A 209.40 2.54 339,934 125,107 1.42 249,928 84,093Mar-09 78.36 80.30 73.90 109.00 83.00 216.70 2.55 319,572 142,245 1.52 144,470 80,239Feb-09 79.02 81.10 76.90 109.00 96.00 214.50 2.41 402,125 124,939 1.54 239,134 76,791Jan-09 81.02 84.60 74.90 96.00 86.97 213.60 2.62 289,485 136,200 1.72 119,578 73,992Dec-08 90.08 99.70 83.30 N/A 96.00 215.40 2.47 245,826 122,856 1.52 103,124 70,433Nov-08 88.47 101.00 76.20 N/A 98.59 216.30 2.52 380,032 109,212 1.75 48,169 37,971Oct-08 83.56 93.90 76.70 118.00 100.00 216.70 2.49 379,524 126,400 1.56 37,083 20,735Sep-08 97.77 102.30 93.90 121.00 106.00 210.40 2.88 376,407 137,031 1.99 12,300 9,340Aug-08 98.74 103.00 93.10 120.00 102.17 206.70 3.13 503,521 128,405 2.28 1,851 2,140Jul-08 102.07 111.80 97.50 116.90 101.11 205.80 3.07 317,917 146,712 2.32 1,115 1,132Jun-08 97.96 104.41 93.91 109.22 95.50 205.50 3.33 642,074 146,413 2.40 413 355May-08 93.87 100.11 86.42 113.00 95.00 198.60 2.95 354,887 152,312 2.21 N/A 25Apr-08 90.19 92.90 88.17 105.53 N/A 193.50 2.97 556,004 150,031 2.22 10 25Mar-08 102.14 112.82 91.02 108.06 N/A 190.20 2.81 515,528 162,285 2.23 5 20Feb-08 92.36 106.41 82.85 117.00 99.50 180.50 3.63 676,655 194,260 2.72 16 3Jan-08 78.76 83.43 75.15 102.10 79.08 180.50 3.05 419,096 184,344 N/A N/A N/ADec-07 72.57 75.66 69.51 102.00 79.74 180.10 3.00 213,118 165,819 N/A N/A N/ANov-07 74.23 77.83 71.03 97.76 79.44 180.10 2.78 303,557 154,516 N/A N/A N/AOct-07 81.11 88.33 72.82 N/A 77.94 179.40 2.68 208,369 169,660 N/A N/A N/ASep-07 75.11 80.73 70.31 N/A 76.00 173.70 2.84 156,480 169,316 N/A N/A N/AAug-07 70.95 74.21 67.91 92.70 77.79 173.50 2.48 192,560 157,247 N/A N/A N/AJul-07 74.51 77.18 70.99 80.50 78.70 173.50 2.52 150,116 175,837 N/A N/A N/AJun-07 75.46 78.04 69.81 92.28 76.44 173.50 2.45 185,738 155,308 N/A N/A N/AMay-07 68.08 70.47 64.33 91.78 71.31 174.30 2.47 160,544 163,121 N/A N/A N/AApr-07 66.03 67.89 63.45 100.00 71.14 172.00 2.27 308,547 147,305 N/A N/A N/AMar-07 66.28 68.04 64.24 93.50 70.68 172.00 2.41 225,244 154,784 N/A N/A N/AFeb-07 69.14 71.33 66.19 102.00 72.14 173.40 2.59 462,586 129,905 N/A N/A N/AJan-07 70.06 70.17 69.95 96.82 N/A 173.90 2.59 348,992 133,332 N/A N/A N/ADec-06 N/T N/T N/T 88.00 71.07 174.40 2.78 286,833 127,610 N/A N/A N/ANov-06 N/T N/T N/T N/A 70.70 174.30 2.64 492,904 117,787 N/A N/A N/AOct-06 N/T N/T N/T 92.00 67.75 168.50 2.39 313,459 116,804 N/A N/A N/ASep-06 N/T N/T N/T N/A 71.00 152.00 2.37 257,090 107,757 N/A N/A N/AAug-06 N/T N/T N/T 88.00 62.04 151.00 2.29 481,870 100,373 N/A N/A N/AJul-06 N/T N/T N/T 87.50 59.77 151.00 2.19 297,457 121,336 N/A N/A N/AJun-06 N/T N/T N/T 82.00 56.39 151.00 2.19 476,542 118,862 N/A N/A N/AMay-06 N/T N/T N/T N/A 58.50 151.40 2.18 339,432 118,730 N/A N/A N/AApr-06 N/T N/T N/T 85.00 54.50 151.60 2.36 429,249 98,131 N/A N/A N/A
Note: N/T: Not Traded, N/A-Not Available, WPI - Wholesale Price Index; Future prices are for near month continuos futures contract. Source: Agmarknet; Ministry of Commerce and Industry; Exchanges' websites
Commodity Insights Yearbook 2011300
178_300_CYIB_2011_Agri_final.indd 300178_300_CYIB_2011_Agri_final.indd 300 1/26/2012 1:29:49 AM1/26/2012 1:29:49 AM

A PwC & MCX Joint Endeavour 301www.mcxindia.com / www.pwc.com/in/en
NOTES
A PwC & MCX Joint Endeavour 301www.mcxindia.com / www.pwc.com/in/en
178_304_CYIB_2011_Agri_final.indd 301178_304_CYIB_2011_Agri_final.indd 301 2/1/2012 7:33:28 PM2/1/2012 7:33:28 PM

NOTES
Commodity Insights Yearbook 2011302
178_304_CYIB_2011_Agri_final.indd 302178_304_CYIB_2011_Agri_final.indd 302 2/1/2012 7:33:28 PM2/1/2012 7:33:28 PM

NOTES
A PwC & MCX Joint Endeavour 303www.mcxindia.com / www.pwc.com/in/en
178_304_CYIB_2011_Agri_final.indd 303178_304_CYIB_2011_Agri_final.indd 303 2/1/2012 7:33:28 PM2/1/2012 7:33:28 PM

NOTES
Commodity Insights Yearbook 2011304
178_304_CYIB_2011_Agri_final.indd 304178_304_CYIB_2011_Agri_final.indd 304 2/1/2012 7:33:28 PM2/1/2012 7:33:28 PM


PricewaterhouseCoopers Pvt. Ltd.2nd Floor, 252, Veer Savarkar Marg, Shivaji Park, Dadar, Mumbai 400 028 (India)
Phone: +91-22-6669 1000; Fax: +91-22-6654 7800 Website: www.pwc.corn
Multi Commodity Exchange of India Ltd.Exchange Square, CTS No. 255, Suren Road, Chakala, Andheri (East), Mumbai 400 093 (India)
Tel: +91-22-6731 8888; Fax: +91-22-6649 4151Website: www.mcxindia.com
Joint EndeavourA
Joint Endeavour
A
Commodity Economy During Recession and Recovery
SponSoRS
A bAnk of exclusive knowledge And informAtion on commodities ecosystem
Yearbook 2011Commodity insights
Joint Endeavour
A
Afraid to be away from your desk
for fear of missing market’s moves?
Take your Market Watch with you.
Be a step ahead withGeojit Comtrade’s
MOBILE TRADING platformfor commodity futures.
Corporate Office : Door No. XXXVI/1567, Canal Road, Kaloor, Kochi, India-682016, Phone: +91 484 2401224/5, Fax: +91 484 2402482 Email: [email protected] Desk : 704 Dev Plaza, Opposite Irla Fire Brigade, S.V. Road, Andheri West, Mumbai – 400058, Phone : +91 22 61312100.
MCX Member code: 40220 FMC No.: MCX/TCM/CORP/1710, NCDEX Member code : 00920 FMC No.:NCDEX/TCM/CORP/0895, NMCE Member code : CL0324 FMC No.: NMCE/TCM/CORP/0245, NSEL Member Code : 12770
The Geojit Comtrade Advantages
* Member of MCX, NCDEX, NMCE, NSEL.
* Trade through desktop /web based/ mobile ap-
plications, or by calling us * Pan India presence in over 250 locations
* Trade in International markets. * Cu* Customized service * Research Team with state of the art tools like
Bloomberg, Reuters etc. * Dedicated desks for retail as well as institutional
clients * SMS updates for research, trade confirmation,
online payment etc. * Loans a* Loans against warehouse receipts
* Preferred broker for delivery.
Com
mo
dity
insig
hts YEA
rb
oo
k 20
11