indian chemical industry: exploring global demand - Exim Bank
112
-
Upload
khangminh22 -
Category
Documents
-
view
0 -
download
0
Transcript of indian chemical industry: exploring global demand - Exim Bank

1

2
EXPORT-IMPORT BANK OF INDIA
OCCASIONAL PAPER NO. 154
INDIAN CHEMICAL INDUSTRY:EXPLORING GLOBAL DEMAND
© Export-Import Bank of IndiaJune 2012
EXIM Bank’s Occasional Paper Series is an attempt to disseminate the findings of research studies carried out in the Bank. The results of research studies can interest exporters, policy makers, industrialists, export promotion agencies as well as researchers. However, views expressed do not necessarily reflect those of the Bank. While reasonable care has been taken to ensure authenticity of information and data, EXIM Bank accepts no responsibility for authenticity, accuracy or completeness of such items.

3
CONTENTS
Page No.
List of Tables 5
List of Exhibits 7
List of Boxes 9
List of Annexure 9
Executive Summary 11
1 Introduction 22
2 Global Chemical Industry: An Overview 27
3 Indian Chemical Industry 35
4 Market Expansion & Diversification: Aligning Exports with Overseas Demand 56
5 The Indian Chemical Industry: Imperatives to Realize Growth Potential 87
Project Team:
Mr. S. Prahalathan, General Manager, Research & Planning Group
Mr. Ashish Kumar, Assistant General Manager, Research & Planning Group
Mr. Rahul Mazumdar, Manager, Research & Planning Group

4

5
Table No. Title Page No.
1 Global Chemical End User Markets 29
2 Production of Major Chemicals: Recent Trends 38
3 Major Chemical Groups and Sub-Segments Produced In India 39
4 India’s Top Export Items of Organic Chemicals 44
5 India’s Top Import Items of Organic Chemicals 45
6 India’s Top Export Items of Inorganic Chemicals 46
7 India’s Top Import Items of Inorganic Chemicals 47
8 India’s Export Items of Dyeing, Tanning and Colouring Materials 49
9 India’s Import Items of Dyeing, Tanning and Colouring Materials 50
10. Chemical Products where Capacity Expansion could be Explored 89
11. Cross-Country Productivity Comparison for Chemicals (under ISIC 241) 90
12. Cross-Country Productivity Comparison for Other Chemicals (under ISIC 242) 91
LIST OF TABLES

6

7
Exhibit No. Title Page No.
1 Broad Category of Chemical Industry 22
2 Trends Driving the Growth of the Chemical Industry 24
3. Segmentation of Global Chemical Manufacturing Sector 28
4. Regionwise Comparison of Production Growth
in the Chemical Industry 29
5. Geographic breakdown of World Chemical Sales 30
6. World Chemicals Sales by Region 31
7. Global Exports of Chemicals - Recent Trends
and Regional Share in 2010 32
8. Mergers and Acquisitions 33
9. Trends in Industrial Production: Index and Growth 36
10. Production of Major Chemicals in India 38
11. India’s Chemical Trade 41
12. India’s Export Destination for Organic Chemicals 42
13. Major Export Markets of Inorganic Chemicals 45
14. India’s Major Export Markets for Dyeing, Tanning & Colouring
materials 48
15. India’s Trade in Insectitides 51
16. FDI Inflows in the Indian Chemical Sector 53
17. Prospects for Market Diversification for India’s
Exports for Inorganic Chemicals 57
LIST OF EXHIBITS

8
18. Growth Prospects of National Supply and International Demand for Export of Inorganic Chemicals from India 6019. Prospects for Market Diversification for India’s Exports for Organic Chemicals 6220. Growth Prospects for Export of Organic Chemicals from India 6421. Prospects for Market Diversification for India’s Exports in Tanning, Dyeing Extracts, Tannins, Derivatives, Pigments etc. 6722. Growth Prospects for Export of Tanning Colouring Products from India 6823. Prospects for Market Diversification for India’s Exports in Insecticides, Fungicides, Herbicides, packaged for retail sale 7024. Growth Prospects for Export of Insecticides, Fungicides, Herbicides, packaged for retail sale Products from India 7125. Product Growth Matrix – Africa 7526. Product Growth Matrix – Asia 7727. Product Growth Matrix – Europe 7928. Product Growth Matrix – Middle East 8129. Product Growth Matrix – North Americas 8330. Product Growth Matrix – Latin America 8631. R &D Intensity of Indian Chemical Industry 9432. Aspects to be considered during Innovation 9633. Collaboration at Various Levels of Chemical Industry 9734. AIChE Sustainability Index (SI) 10035. Select Voluntary Initiatives taken in the European Chemical Industry 10136. Anti-Dumping Cases in Chemical Industry Initiated by India (1995-2011) against Top 10 Countries 103

9
Annexure No. Title Page No.
1. India’s Exports of Identified Chemical Products to the World – SITC 4-digit Level 105
2. India’s Imports of Identified Chemical Products from the World – SITC 4-digit Level 107
LIST OF ANNEXURES
Box No. Title Page No.
1. Important International Conventions to which India is a signatory 252. Petroleum, Chemicals & Petrochemical Investment Regions (PCPIR) 543. Chemical Weapons Convention 554. Draft National Chemical Policy 925. Need For Consolidation of Acts And Rules 104
LIST OF BOXES

10

11
INTRODUCTION
Chemical industry is a critical component of the modern globalised world economy, converting raw materials like crude oil, natural gas, air, water, metals and minerals into diverse ready-to-use products which are essential for day-to-day activities. The industry provides products and services that improve the quality of life of customers and communities at large. The chemical industry is multifaceted with applications in diverse areas such as food, clothing, housing, communication, transport as well as entertainment. This implies that the business cycles of end user segments significantly affect the performance of the chemical industry. The positive relationship between global development and chemical industry innovation is also empirically well established.
Although the chemical industry is quite heterogeneous in character, it can broadly be classified into three major segments, viz., basic chemicals, specialty chemicals and agricultural chemicals. Strictly speaking, the chemical industry also
includes drugs and pharmaceuticals, as also fertilizers, toiletries and cosmetics. However, considering that these segments are large enough in themselves, they can be categorized as altogether separate industries and hence are beyond the scope of this study.
The global chemical industry, as categorised above, is not only important in terms of size but also in terms of its features, involving significant capital investment, high knowledge content and qualified human resources. The industry plays an important role in global economic and social development; it is a science, technology and knowledge based industry that is essential to a sustainable world economy while at the same time contributing towards improved health and nutrition. In addition, the industry is a rich source of employment generation – about 7 million people are directly employed in the chemical industry, a figure that soars to more than 20 million people worldwide if indirect employment were also to be taken into account. Today, the chemical industry acts as the basic building block for almost
EXECUTIVE SUMMARY

12
all other manufacturing industries such as textiles, pharmaceuticals, fertilizers, food processing and paints. Its products permeate the entire spectrum of daily use items and cover almost every sphere of life.
As far as the Indian chemical industry is concerned, given the level of cut throat competition, the industry needs to look beyond the domestic shores in a more proactive manner, primarily through a two pronged approach that would entail market diversification and expansion along with mapping of international demand for chemical products so as to identify a product market strategy.
GLOBAL CHEMICAL INDUSTRY: AN OVERVIEW
The world chemical industry is estimated to have reached € 2353 billion (~ US$ 3127 billion1) in 2010. The Asian region has emerged as the largest contributor to the global chemical industry, accounting for nearly half the global sales (€ 1147 billion) followed by Europe (€ 578 billion). Individually, China was the largest market for chemicals with sales aggregating to € 575 billion, followed by USA (€ 395 billion), Japan (€ 153 billion), Germany (€ 142 billion) and France (€ 76 billion). India, with sales
of € 56 billion was ranked the eighth largest market in 2010.
International trade in chemical products2 has witnessed a continuous rise with global exports of chemicals recording an average annual increase of 6.2% during 2006-2010 to amount to US$ 545 billion in 2010 as compared to US$ 451 billion in 2006. USA was the largest exporter of chemicals with exports aggregating US$ 63.9 billion, followed by China (US$ 49.3 billion), Germany (US$ 48.2 billion), Belgium (US$ 36.6 billion) and Japan (US$ 31.9 billion). However, in terms of dynamism in exports, it was led by the emerging markets of Asia-Pacific, Middle East and Africa. While the average annual increase in exports from Asia-Pacific region was 11.9% during the 2006- 2010 period, it was as high as 21.9% each in the case of Middle East and Africa. Consequently, the shares of these regions in world exports of chemicals registered a consistent increase. While Europe accounted for 51.0% of global chemical exports in 2006, its share fell to 44.9% in 2010. As against this, the share of Asia-Pacific and the Middle East increased from 26.1% to 31.3% and from 2.2% to 3.1%, respectively, during the same period. North America was able to maintain its share of 13.5% during both 2006 and 2010.
1At end December 2010 exchange rate2Comprising HS codes 28, 29, 32 and 3808

13
INDIAN CHEMICAL INDUSTRY: MOVING UP THE VALUE CHAIN
The chemical industry in India is one of the most diversified of all industrial sectors covering more than 70,000 commercial products. Given this varied range of products, the scope of analysis in this study has been confined to basic, specialty and agricultural chemicals. Thus, the analysis in the study has included organic and inorganic chemicals, tanning, dye extracts and insecticides and pesticides. As defined in this manner, the size of the Indian chemical industry is estimated to have reached around US$ 60.3 billion in 2010. In terms of total value added (at constant 2000 prices), the Indian chemical industry was the 5th largest in the world, and 2nd largest in Asia after China. The industry accounts for about 10% of the output of the Indian manufacturing sector, 13% of India’s total exports, and 9% of the country’s total imports. In terms of segmentation, basic chemicals was the largest sector with total revenues of US$ 43.3 billion, equivalent to about two-third of the industry’s overall value in 2010.
Over the last decade, the Indian chemical industry has evolved gradually moving up the value chain. With increasing investments in research and development (R&D), the industry has been registering significant growth in the knowledge
arena, including specialty and fine chemicals. The industry now produces a large number of fine and specialty chemicals which have very specific uses and are essential for increasing industrial production. These find wide usage such as food additives and pigments, polymer additives, anti-oxidants in the rubber industry, etc. With per-capita consumption of chemical products in India being only a fraction of the global average, the opportunities for the domestic industry are enormous. In dyes, for example, India’s per capita consumption is 50 grams, as against a global average of 425 grams. In case of polymers, the per capita consumption is 5.2 kilograms in India, compared to the world average of 25 kilograms. Keeping in view the size of the domestic market and the growth of end user segments, the potential for growth in for the Indian chemical industry is immense.
The volume of major chemicals produced in India amounted to 7.5 million metric tonnes (MTs) in 2009- 10. Though high in absolute terms, the growth during recent times has not been as emphatic. The production of the Indian chemical industry increased at an average annual rate of only 1.0%, from 7.1 million MT in 2003-04 to 7.5 million MT in 2009-10. This near flat performance was primary a result of stagnant growth in alkalis (which includes soda ash, caustic soda and liquid chlorine) – the segment which, by far, accounts for

14
the largest share of the output of the Indian chemical industry in volume terms. Matters were made worse by negative average annual rates of growth in organic chemicals and pesticides, both of which recorded average annual declines of (-) 2.0% and (-) 0.3%, respectively, during the 2003-04 to 2009-10 period, pulling down the overall growth of the industry. The positive and encouraging fact among the various segments of the Indian chemical industry has been the performance of specialty chemicals, primarily dyes and dyestuffs. The average annual growth in production of dyes and dyestuff amounted to a healthy 10.4%, increasing from 26,200 MT in 2003-04 to 42,390 MT in 2009- 10 and 31.3% on a year-on year basis in 2009-10. This high growth could partly be attributed to the low base and low absolute volumes of dyes and dyestuffs, but more significantly, it implies a consistent increase in market demand of such products.
MARKET EXPANSION & DIVERSIFICATION: ALIGNING EXPORTS WITH OVERSEAS DEMAND
The study has undertaken an analysis of chemical products that have potential for exports from India by outlining a market/region-specific approach. The analysis has revealed the prospects of market diversification for the various broad segments of the chemical industry, viz. organic
chemicals, inorganic chemicals, tanning and dyeing extracts, and insecticides and pesticides. The analysis reveals that for certain segments of the industry, Asian countries have emerged as major vibrant markets. Thus for instance, for inorganic chemicals, India needs to diversify its exports to more dynamic markets of China and Bangladesh while for organic chemicals, China, Indonesia, Malaysia, Singapore in addition to Brazil are the markets that Indian firms need to focus on. Similarly, for tanning and dyeing extracts, diversifying exports to Chinese Taipei and Bangladesh would be more fruitful while Argentina, Belgium, Nigeria, Indonesia, Bangladesh and Vietnam offer greater scope for insecticides and pesticides exports.
In addition, the growth prospects of chemical products have been examined at a narrower level (HS 4 digit Code) by mapping international demand with India’s export capabilities based on which the products have been categorized into four classes, viz. winners in growing sectors, winners in declining sectors, losers in growing sectors and losers in declining sectors. Winners in Growing Sectors include products that have not only shown dynamism in import demand from the world (i.e. their share in world imports has been increasing) but also where India has been able to increase its share; Winners in Declining Sectors comprises products whose

15
import demand has been lower than the world average for all the products (i.e. the product has lost share in the world market) but where India has been able to increase its share; Losers in Declining Sectors includes products whose import demand has not only been lower than the world average for all the products but also where India’s share has declined; Losers in Growing Sectors consists of products that have shown dynamism in import demand but where India has lost out share to its competitors. This category thus comprises products where India needs to put more focus on, i.e. diversify.
THE INDIAN CHEMICAL INDUSTRY: IMPERATIVES TO REALIZE GROWTH POTENTIAL
Import Substitution through Capacity Additions
While India’s export of chemicals has been gradually increasing, the country still has a deficit on the trade account in the chemical sector. India’s exports of chemicals in 2009 stood at US$ 9.7 billion whereas imports had touched US$ 14.1 billion, an indication of strong domestic demand for chemical products. However, there are chemical products which India is exporting as well as importing. Exporting a particular product in reasonable quantity corroborates that India does have the capabilities to produce the same, but for some
reasons India is unable to fulfill its domestic demand, due to which it has to rely on imports. This would imply that had appropriate capacities been in existence, the country would not have to rely on imported chemicals. The study has made an attempt to identify a list of such chemical products (at SITC 5 digit level) where India can increasingly seek capacity addition in the domestic market so as to reduce its reliance on importing. For the purpose of identification, only those chemicals have been considered for which India has production capacities as also where domestic demand has been increasing.
Cross-Country Comparisons
The Indian chemical industry needs to be internationally competitive in order to make its presence felt in the world market. This competitive edge can broadly be captured in either being cost effective (price competitiveness) or being of a better quality. In the chemical industry, a set of parameters have been examined for cross country comparison. The analysis reveals that for the manufacture of basic chemicals, India is relatively competitive in terms of labour cost but needs to drastically improve its efficiency as reflected in the value added per employee number, which is one of the lowest among the countries examined. Further, operating surplus for the basic chemical industry has declined when compared to the

16
year 2000. This has primarily been on account of the increase in the share of the cost of input materials and utilities, perhaps a reflection of India’s infrastructure bottlenecks such as uncertain power supplies, inadequate common facilities like effluent treatment plants etc. For manufacture of other chemicals including agrochemicals, paints and printing inks, while the value addition per employee is again the lowest, the growth in this parameter has been one of the fastest. A similar positive feature was evident in the case of operating surplus which exhibited a reasonable increase during the 2000-2007 period, unlike most other countries which actually recorded a decline. The key takeaway from this analysis is that Indian chemical industry has to improve efficiencies with the government creating an enabling environment by overcoming infrastructure bottlenecks and setting up common infrastructure facilities.
Setting up of Chemical Parks or Mega Chemical Estates
In order to address the issue of capacity expansion and for creation of common infrastructure facilities, the chemical industry, with support of Government and financial institutions could establish exclusive Chemical Parks. In general, due to its very nature, the chemical industry requires certain basic infrastructure facilities,
both in the process chain as also in the supply chain. In the former, the critical infrastructure requirements include a common effluent treatment plant, and an effective green belt segregating the industrial units from human settlements. In the latter, the critical requirements include an efficient port, chemical storage terminal, and adequate berthing facilities. The production and export earnings of this sector would receive a quantum jump if an industrial estate dedicated to the chemical industry could be set up. At present, each unit has to create specialized facilities on its own which leads to duplication of efforts and investment. If chemical units are clustered in close proximity the required infrastructure could be vertically integrated resulting in cost reduction. In this context, the German model of Chemical Parks, which supports the chemical sites across the country, could be suitably adapted. The industries in the German model work closely with the governments of the individual states, municipalities, universities and economic development agencies under public-private partnership model.
A Fund for SMEs in Chemical Industry
Indian chemical industry comprises many small and mid-sized companies. Contribution of SMEs to the country’s chemical industry

17
in terms of production is estimated at around 40%. However, given the limited channels for accessing funds at competitive rates, SMEs have been finding it difficult to upgrade their technology. In fact, SMEs face not just technical constraints but also manpower limitation with availability of quality manpower being a major issue. With a significant market potential abroad, these SMEs needs to move up the value chain so as to tap the opportunities in overseas markets. For this, they would need to conform to the various rules, regulations and good practices prevalent abroad. A suitable Fund could be thought of by the Government on the lines of the Technology Upgradation Fund as available to the textile industry, or other measures such as provision of accelerated depreciation as available to the wind energy sector could be implemented exclusively for SMEs in this sector. The Fund could also be utilized to access designs, patents, processes and technology. Such an initiative will go a long way in making the industry, particularly SMEs, competitive and self reliant.
R&D Intensity of Chemical Industry
R&D intensity is assuming increasing significance for many of the manufacturing segments. In order to become technically more competitive in the international market, the industry
needs to increase R&D spending substantially, maybe in the region of 10 times over to at least 5%. Since chemical industry is a knowledge based industry, the competitiveness of the units can be significantly strengthened through supply of new and innovative products. The high value-added products of the chemicals industry continuously open up new fields of application, paving the way to progress and innovation in other industries. R&D contributing to innovative products is becoming increasingly important to enhance the competitiveness of this sector. The areas for R&D in chemical industry include improvements in manufacturing process for reduction in cost of production, application development to diversify demand, new product development and research related to application/ safe use of chemicals. While R&D remains a universal imperative, its purpose and nature varies across segments. Thus, for instance, the basic chemical sector could focus on process innovation and product development and strengthen its competitiveness through improvements based on performance and quality of products; while firms in knowledge based chemical sector could focus on R&D with the objective of achieving product leadership and process innovations. However, the current R&D intensity of the chemical industry is very low, at less than 0.5%.

18
Collaborative Endeavors: Inter-Firm and Institutional
The chemical industry needs to enhance its collaborative efforts in order to improve competitiveness. Collaboration among players in the chemical industry could happen both at cluster level (for sharing of common infrastructure) as also at firm level (for sharing of knowledge and technology). Smaller players needed to cooperate in ‘clusters’ where infrastructure, resources, commercial intelligence, common trade centres and even knowledge can be shared at lower costs and improve competitiveness of producers. Collaboration with firms across borders for technology and investment would also give boost to the industry. In addition, the players should also achieve greater level of industry-institutional partnership for knowledge development and sharing. For transforming ideas into new products, partnership between industry and academia is a must. Thus, Indian chemical industry should leverage the potential of educational and research institutions to source intellectual as well as human capital. Such linkages may be effectively used for setting up of in-house R&D facility or for outsourcing R&D activities. The educational institutions could play a greater role for development of Indian chemical industry by offering courses and conducting research proactively. The research and academic in
stitutions may also open local offices within chemical clusters to facilitate greater level of interactions while also setting up business incubation centres. Such incubation centres could accelerate the successful development of entrepreneurial companies in the chemical sector through an array of business support resources and services, developed and orchestrated by incubator management and offered both in the incubator and through its network of contacts.
Exploring New Markets
Leading chemical manufacturers in the world are entering emerging markets through joint ventures or acquisitions (mainly in the West Asia to gain access to feedstocks, and in China and India to develop a local market presence). The most successful chemical producers in the near future are likely to be those that embrace the changing dynamics in the global chemical industry by effectively positioning themselves in emerging markets. It’s also important to consider regional differences – mature products in one region may be innovative products in another. At the same time, there may be a need to explore a new business model, packaging, or a particular delivery method, to successfully deploy a product line in certain region, and all these can be ascertained by enhancing customer relationships.

19
Ensuring and Maintaining Compliance
Indian chemical industry has significant prospects in countries in the EU. However, with the new set of regulations and compliances, the Indian chemical industry will find it extremely difficult to enter this market. One such strict environmental regulation that the chemical companies must comply with is the Registration, Evaluation, Authorization, and Restriction of Chemicals (REACH), which deals with the tracking and registration of regulated substances, ensuring the safe handling of substances and preparations to protect workers and the environment. It requires that the chemical firms, in order to do business in EU, should establish sophisticated new processes to be adopted by a series of deadlines in 2013, and 2018 for: volume tracking of substances in preparations; assessing the obligations for notification and information of agencies, business partners, and end consumers; and complying with safe usage conditions specified by exposure scenarios for products. The Indian chemical industry needs to be sensitized on this issue and close interactions with the industry counterparts in EU as also the Indian missions there needs
to be initiated on an ongoing basis. A series of sensitization programmes with actual practitioners from EU as resource persons could be planned across all the major chemical clusters in India.
Emerging New Segments in Chemical Business
There are new areas of chemical businesses that are emerging, ranging from specialty chemicals to high end nano-technology, to further value added chemical products. Firms therefore need to be proactive in identifying opportunities across the entire spectrum of chemical business verticals. Although, specialty chemical companies were hard hit by the recent economic downturn, many of the US and European chemical companies are still focused on this sector, as specialty products are more profitable than commodity chemicals in the longer term. In India, it has been seen that the usage of specialty chemicals has increased considerably during the past few years in construction, automotive, electronics and water treatment industries. This positive growth is expected to accelerate in the years to come given the vibrancy in these industries. Another emerging area in the chemical industry is rubber chemicals which is witnessing

20
tremendous growth. The chemical industry needs to focus and be in readiness to cater to the demands of such emerging and high value added segments.
Environmental Sustainability
Since end users of many chemical substances are largely household consumers, using daily use items such as paint, glue, insect spray, cosmetics and household cleaners, chemical producers have the responsibility in promoting safe management of substances – starting from design in production to end-use, and their final disposal (hazardous waste). To garner a greater share in the global chemical market, the Indian industry needs to address the environmental issues including sustainable chemistry, adherence to safety and health standards. The chemical industry needs to establish an environmentally sustainable strategy to fulfill and implement a holistic, centrally-led governance and management approach that focuses on developing internal, cross-functional networks and programmes in key areas like operations and supply chain and products and packaging.
Low Level of Brand Development
Indian chemical producers, except a few large producers, generally sell
their products as generic products without brand development. There is also low level of interest among small scale producers for brand development, product development as also market development. To increase their visibility, chemical firms could undertake brand building exercise, availing of suitable funds from the central and state government allocated for this purpose, wherever they have the opportunity to penetrate the market.
Dumping / Import Competition
The chemical industry has attracted the maximum number of anti-dumping actions in the world. Unlike safeguard duties, which are levied in a uniform way, anti-dumping duties vary from product to product and from country to country. Countries initiate antidumping probes to check if domestic industry has been hurt because of a surge in cheap imports. Anti-dumping measures are taken to ensure fair trade and provide a level-playing field to domestic players. According to figures from the World Trade Organization, India has initiated 275 anti-dumping cases during the period 1995-2011 in the chemicals and allied industries out of a total of 825 antidumping cases worldwide, thereby accounting for 33.3% share globally. Caustic soda
21
received the maximum number of anti-dumping cases during the period 1995-2011 followed by acetone (9 cases), PVC and oxoalcohols (8 cases). Countrywise the maximum number of cases was registered against China (68), EU (31), Taiwan (24), South Korea (21) followed by Japan (21). At the same time there are 40 anti-dumping cases that have
been filed against India worldwide in the chemical and allied sector during the same period (second highest after Base metal products). The industry needs to take cognizance of the pros and cons of filing a case of anti dumping on any overseas company while at the same time be in readiness to counter any such duties imposed on them by overseas firms.

22
Chemical industry is a critical component of the modern globalised world economy, converting raw materials like crude oil, natural gas, air, water, metals and minerals into diverse ready-to-use products which are essential for the day-to-day activities. The industry provides products and services that improve the quality of life of customers and communities at large. The chemical industry is multifaceted with applications in diverse areas such as food, clothing, housing, communication, transport as well as entertainment. This implies that the business cycles of end user segments significantly affect the performance of the chemical industry. The positive relationship between global development and chemical
industry innovation is also empirically well established. Thus, for instance:
• Synthetic dyes were pivotal to the development of textiles during the Industrial Revolution;
• Petrochemicals initiated the post-war plastics and packaging materials revolution;
• Fine and specialty chemicals offers a multitude of products, both for consumer and industrial applications or processes, active ingredients for crop protection as well as intermediates for pharmaceuticals.
Although the chemical industry is quite heterogeneous in character, it can
1. INTRODUCTION
Exhibit – 1: Broad Category of Chemical Industry

23
broadly be classified into three major segments, viz., basic chemicals, specialty chemicals and agricultural chemicals. A brief outline of these three segments is pictorially depicted in Exhibit 1. Broadly speaking, the chemical industry also includes drugs and pharmaceuticals, as also fertilizers, toiletries and cosmetics. However, considering that these segments are large enough to be categorised as altogether separate industries, they are beyond the scope of this study.
The global chemical industry, as categorised above, is not only important in terms of size but also in terms of its features, involving significant capital investment, high knowledge content and qualified human resources. The industry plays an important role in global economic and social development; it is a science, technology and knowledge-based industry that is essential to a sustainable world economy while at the same time contributes towards improved health and nutrition. In addition, the industry is a rich source of employment generation – about 7 million people are directly employed in the chemical industry, a figure that soars to more than 20 million people worldwide if indirect employment were also to be taken into account.
Today, the chemical industry acts as the basic building block for almost all other manufacturing industries
such as textiles, pharmaceuticals, fertilizers, food processing and paints. Its products permeate the entire spectrum of daily use items and cover almost every sphere of life. After having been hit hard by the global economic recession in mid 2008 and 2009, the global chemical industry treaded back to the growth trajectory in 2010 and the prospects of the industry appear to be bright in the foreseeable future.
The chemical industry, which was largely dominated by Europe and North America, over the last many decades, has been increasingly finding new companies having their base in the emerging economies who are manufacturing quality products through innovative techniques. This paradigm shift in the global chemical industry is expected to create cross border mergers and acquisitions resulting in the consolidation of the global industry. Simultaneously, leading chemical manufacturers are entering emerging markets through joint ventures or acquisitions (mainly in the Middle East to gain access to feedstock, and in China and India to develop a local market presence). The most successful chemical producers in the near future are likely to be those that embrace the changing dynamics in the global chemical industry and effectively position themselves in emerging markets. Coupled with this, are the growing trade agreements across the globe which would

24
engender creation of newer market for chemical companies. Exhibit 2 provides a visual snapshot of the key factors that are driving the growth in the chemical industry.
It must be understood that with increasing environmental consciousness, the growth of the industry needs to be in synchronization with nature through greater realization and increased attention to safety, health and environmental standards. There is a need to create awareness
about the safe use of chemicals, so as to prevent harmful fallouts on the environment and human beings. Laws regarding these aspects across the world, including India are becoming more and more stringent. This gains even more significance in light of the fact that India is a signatory to important international conventions such as the Chemical Weapon Convention, the Rotterdam Convention, the Stockholm Convention, the Montreal Protocol and the Kyoto Protocol.
Source: EXIM Bank Analysis
Exhibit 2: Trends Driving the Growth of the Chemical Industry

25
Box - 1:Important International Conventions
to which India is a Signatory
Chemical Weapons Convention: The Convention on the Prohibition of the Development, Production, Stockpiling and Use of Chemical Weapons and on Their Destruction (the Chemical Weapons Convention, or the ‘CWC’) aims to eliminate entire category of weapons of mass destruction by prohibiting the development, production, acquisition, stockpiling, retention, transfer or use of chemical weapons by States Parties. A unique feature of the CWC is its incorporation of the ‘challenge inspection’, whereby any State Party in doubt about another State Party’s compliance can request the Director-General to send an inspection team. Under the CWC’s ‘challenge inspection’ procedure, States Parties have committed themselves to the principle of ‘any time, anywhere’ inspections with no right of refusal.
Rotterdam Convention: The objectives of the Rotterdam Convention are to promote shared responsibility and cooperative efforts among Parties in the international trade of certain hazardous chemicals in order to protect human health and the environment from potential harm; and to contribute to the environmentally sound use of those hazardous chemicals, by facilitating information exchange about their characteristics, by providing for a national decision-making process on their import and export, and by disseminating these decisions to Parties. The Convention creates legally binding obligations for the implementation of the Prior Informed Consent (PIC) procedure. Currently, there are 40 chemicals listed in Annex III of the Convention and subject to the PIC procedure, including 25 pesticides, 4 severely hazardous pesticide formulations and 11 industrial chemicals.
Stockholm Convention: The Stockholm Convention is a global treaty to protect human health and the environment from persistent organic pollutants (POPs). POPs are chemicals that remain intact in the environment for long periods, become widely distributed geographically, accumulate in the fatty tissue of living organisms and are toxic to humans and wildlife.
Source: Respective websites; EXIM Bank Analysis

26
The main objective of these conventions is to protect human health and the environment from the potential hazards of different chemicals. The global chemical industry needs to come forward and take steps to implement the principles underlying these conventions. This would go a long way in rendering the world economic growth more sustainable. The chemical industry could promote sustainable development by investing in technology that protects the environment and stimulates growth. Industrial wastes also need to be managed better. New technologies are available for industrial waste management and need to be adopted on a global scale. All this would entail continuous innovation in different areas with a view to meet future demands in energy, healthcare, and climate change in a more efficient manner.
As far as the Indian chemical industry is concerned, given the level of
competition, the industry needs to look beyond the domestic shores in a more proactive manner, primarily through a two pronged approach that would entail market diversification and expansion along with mapping of international demand for chemical products so as to identify a product-market strategy.
This study is an attempt to design the broad contours of such a strategy based on mapping of import demand vis-à-vis India’s exports of chemicals so as to create a product-market matrix (Chapter 4). The study also would analyse the recent per-formance of the global chemical industry, the major players, and the performance (Chapter 2) followed by the Indian chemical industry (Chapter 3). Based on the analysis described above the last chapter (Chapter 5) seeks to identify select strategies that could be adopted by the Indian chemical industry in order to compete globaly.

27
The globalisation of the chemical industry began somewhere in the 1960s when the world market began expanding and chemical firms started investing in production facilities in foreign countries. With the gradual reduction of tariffs and other barriers, and advances in various sectors of the economy, the chemical industry flourished. There was global spread of capital resources, technology, and managerial capabilities around the world, thereby resulting in the emergence of multinational chemical companies.
The major markets for chemicals have been the triad countries of North America, Western Europe, and Japan. However, since the last decade, a few firms from the emerging economies have started challenging the traditional dominance of chemical production by the triad countries. It may be noted that factors like feedstock availability and price, labour cost, utility cost, momentum in economic growth and environmental pressures are creating such tectonic shifts in the industry. The growing participation of emerging economies has also been instrumental in changing the structure of the global chemical industry.
GLOBAL PRODUCTION
The increasing significance of emerging countries is amply borne out in the production data for chemical during the last decade. Emerging economies are outpacing industrial countries in chemicals production and have been pushing up the average growth rate of world chemicals production during the past ten years. As is evident from Exhibit 3, the average growth in chemical production has been the fastest in the Asia Pacific region. As against this, the EU chemicals industry showed only a modest growth during the period from 2005 to 2010 while the North American region actually registered a decline. The EU chemicals sector grew by 1.6%, well below the world chemicals industry average growth rate of 4.1%.
During the period from 2005-2010, the chemicals industry in the North American Free Trade Agreement Area (NAFTA) showed a negative growth rate on average. This was due to the spill-over effects of the crisis in the United States in 2008 and 2009. The Asia-Pacific region outpaced growth
2. GLOBAL CHEMICAL INDUSTRY: AN OVERVIEW

28
in EU and US markets, with average growth rates of 10.8 % in chemicals during the past five years.
It may be noted that the Asia-Pacific region was heavily influenced by the extraordinary performance of the Chinese chemicals sector and a booming economic climate in China, especially its industrial sector. The long-term trend for chemical production shows that apart from the Asia-Pacific region, chemicals production registered a negative growth rate in 2008 and 2009 in all regions. Observing the growth rates of world chemicals production since 1988, data confirms that annual chemicals production has always registered positive growth rates,
except in two instances. The first period was 1990, when production declined by 0.3 % compared with 1989. The second year was 2009 when world chemicals production declined by 4.4% compared with 2008 – the largest recorded decline in world chemicals production in 23 years. Chemicals production recovery occurred in all regions in 2010. World chemicals production recorded a year-on-year increase of 9.9% in 2010. The strong recovery was led by the Asia-Pacific region, where production grew by 15.3% in 2010.
The chemical industry across the globe is largely dependent on the performance of certain key end user industries. According to a study
Exhibit 3: World Average Growth Rate of Chemical Production (percent p.a.)
* includes Japan, China, India, Korea, Malaysia, Philippines, Singapore, Taiwan, Thailand, Pakistan, Bangladesh and AustraliaSource: ACC; Cefic Chemdata International
29
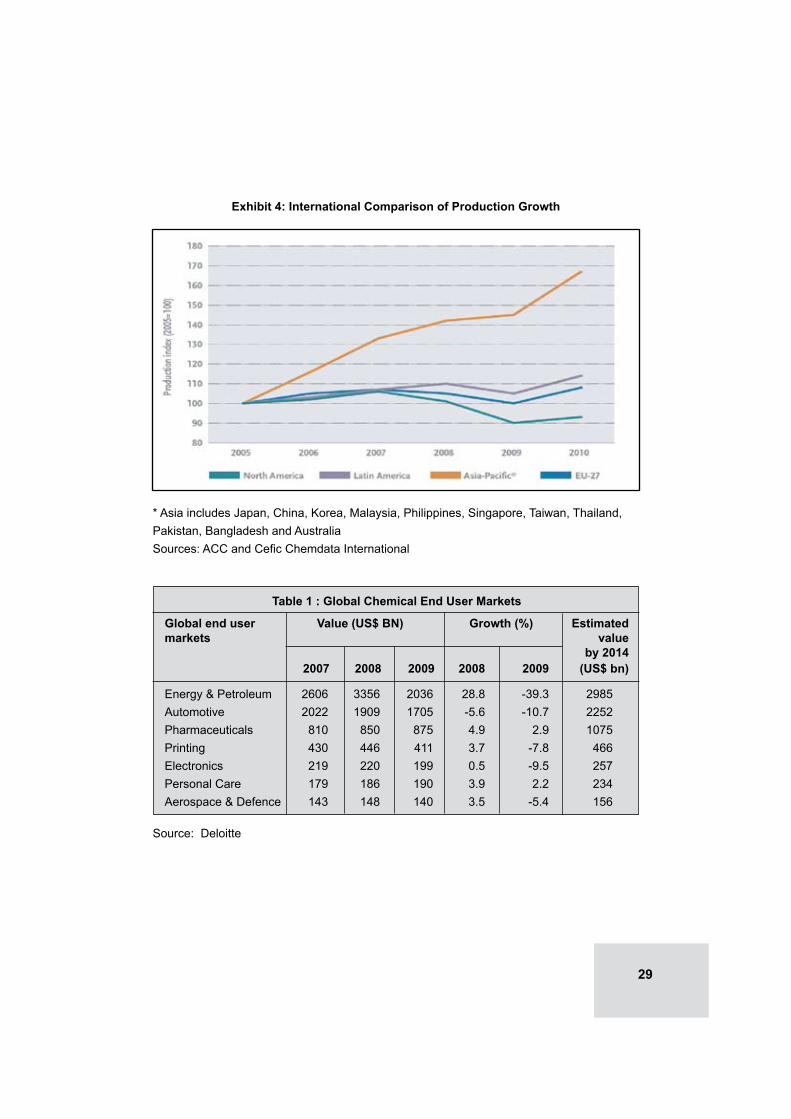
Exhibit 4: International Comparison of Production Growth
Table 1 : Global Chemical End User Markets
Global end user Value (US$ BN) Growth (%) Estimatedmarkets value by 2014 2007 2008 2009 2008 2009 (US$ bn)
Energy & Petroleum 2606 3356 2036 28.8 -39.3 2985Automotive 2022 1909 1705 -5.6 -10.7 2252Pharmaceuticals 810 850 875 4.9 2.9 1075Printing 430 446 411 3.7 -7.8 466Electronics 219 220 199 0.5 -9.5 257Personal Care 179 186 190 3.9 2.2 234Aerospace & Defence 143 148 140 3.5 -5.4 156
Source: Deloitte
* Asia includes Japan, China, Korea, Malaysia, Philippines, Singapore, Taiwan, Thailand, Pakistan, Bangladesh and AustraliaSources: ACC and Cefic Chemdata International

30
by Deloitte, by 2014, energy and petroleum along with the automotive industry will be consuming chemicals worth US$ 5.2 bn, an increase of over 40% as compared to the consumption in 2009. Demand from end user industries like printing, electronics like solvents and personal care are also expected to see reasonable growths. The automotive industry is expected to be the most crucial end user market for the global chemicals sector. This is particularly due to the high volume of chemical products that are generally used in the production process of automobiles.
GLOBAL SALES
The turnover of the world chemical industry was estimated at € 2353 billion in 2010. Data for 2010 confirms that solid recovery of the chemicals industry occurred during the year. Sales in value terms were up by 26.9% in 2010 compared with 2009, a year when the economic and financial crisis was in full swing. Here again, it was the emerging economies that were at the vanguard, helping the global sales volume to recover and contributing to the worldwide jump in sales of the sector in 2010.
* Other – Oceania and Africa** Rest of Europe – Switzerland, Norway and other Central & Eastern Europe (excl. the New EU 12 countries)Source: Cefic Chemdata International
Exhibit 5: Geographic breakdown of World Chemical Sales (2010)

31
Exhibit 6: World Chemicals Sales by Region (Percentage Share)
* Asia includes Japan and ChinaSource: ACC; Cefic Chemdata International
The Asian region has emerged as the largest contributor to the global chemical industry, accounting for as much as € 1147 billion of the global sales of € 2353 billion in 2012 (48.7% share). However, the European chemicals industry, including the European Union and the Rest of Europe, is still in a strong position, posting sales of € 578 billion in 2010, one-fourth of world chemicals sales in value terms. Worldwide competition is getting fiercer, however, witnessed by the European Union losing its top ranking in term of sales to China (€ 575 billion) for the second consecutive year. Chemicals sales in Asia are more than double that of the European Union. Taken together,
Europe, Asia and North American Free Trade Area account for 92.7% of world chemicals turnover.
Developments during the previous 10 years from 2000 to 2010 indicate that Asia has emerged as a clear leader in terms of world chemicals sales while the contribution of European Union to world chemicals sales has been on a decline, although the value of sales in the European Union has been growing continuously, but overall world chemicals sales have been growing at a faster clip. The level of world chemicals sales in value terms increased by 63.7% in 2010 compared with 2000.

32
INTERNATIONAL TRADE IN CHEMICALS
Global exports of chemicals (comprising HS codes 28, 29, 32 and 3808) recorded an average annual increase of 6.2% during 2006-2010 with the total amounting to US$ 544.9 bn in 2010 as compared to US$ 450.9 bn in 2006. USA was the largest exporter of chemicals with exports aggregating US$ 63.9 bn in 2010, followed by China (US$ 49.3 bn), Germany (US$ 48.2 bn), Belgium (US$ 36.6 bn) and Japan (US$ 31.9 bn). However, in terms of dynamism in exports, it was led by the emerging markets of Asia-Pacific, Middle East
and Africa. While the average annual increase in exports from Asia-Pacific region was 11.9% during the 2006-2010 period, it was as high as 21.9% in the case of Middle East and Africa. Consequently, the shares of these regions in world exports of chemicals registered a consistent increase. While Europe accounted for 51.0% of global chemical exports in 2006, its share fell to 44.9% in 2010. As against this, the share of Asia-Pacific and the Middle East increased from 26.1% to 31.3% and from 2.2% to 3.1%, respectively, during the same period. North America was able to maintain its share of 13.5% during both 2006 and 2010.
Exhibit 7: Global Exports of Chemicals* - Recent Trends (US$ bn)and Regional Share (%) in 2010
* Chemicals comprise HS Codes 28, 29, 32 and 3808Source: Derived from UN Comtrade

33
MERGERS & ACQUISITIONS
The global chemical industry which was hit by the recession, witnessed a major drop in 2008 and 2009 in terms of mergers and acquisitions (M&A) both domestic and cross-border. Total global deal value in the chemical industry fell from a peak of € 107.8 billion in 2007 to barely € 56.7 billion in 2008 and further to € 27.2 bn (25% of deal value in 2007) in 2009. In 2010, the year following the crisis, the number of deals and their sizes also showed a perceptible increase. During this period, the Western companies continued to struggle with the downturn in demand while, on the contrary, markets in Asia and the Middle East continued to expand incrementally. Though the global chemical industry went through a major trough during 2008 and 2009, it recuperated significantly
with a perceptible shift in M&A activity in 2010. In 2010, the total global deal values increased to € 51.4 bn nearly double than the deal level of 2009 and were just under the level of 2008.
In the immediate future, it is anticipated that there will be a significant shift eastwards in the global chemicals industry. The Middle Eastern firms are expanding their plants with the burgeoning demand in the region. China has already emerged as one of the largest producers of chemicals overtaking the United States. It may be noted that the Chinese firms are already on an M&A spree across the world. Several key chemical end markets in the West are continuing a shift to the East. For example, in 2010, the German company Dystar, one of the world’s largest producers of dyes, was bought by Kiri Dyes & Chemicals
Exhibit 8: Mergers and Acquisitions: 2006-2010
Source: Bloomberg, EXIM Bank Analysis

34
from India. These acquisitions, combined with organic growth, are poised to change the shape of the chemicals industry in the medium term. The emerging economies, namely, BICME countries (Brazil, India, China,
and Middle East) are also expected to increasingly dominate M&A activity in the chemical industry in the years ahead, supported by growth in end user markets, government policies and easier access to funds.

35
Background
Chemical industry is among the oldest industries in India, and constitutes an important segment of the Indian economy. The industry forms the backbone of industrial and agricultural development of India and provides building blocks for downstream industries, making it a significant contributor to India’s national economic growth. The chemical industry comprises both small and large-scale units. The fiscal concessions granted to the small scale sector in mid-eighties led to the establishment of a large number of units in the Small Scale Industries (SSI) sector. A large number of MNCs are also part of the industry. Major chemical producing states in India are Gujarat and Maharashtra, with moderate base in other states including Andhra Pradesh, Tamil Nadu, Karnataka and West Bengal.
The chemical industry, which includes basic chemicals and its products, petrochemicals, fertilizers, paints and varnishes, gases, soaps, perfumes and toiletries, is one of the most diversified of all industrial
sectors covering more than 70,000 commercial products. Given this varied range of products, the scope of this study has been confined to basic, specialty and agricultural chemicals. Thus, the analysis in the study would include those for organic and inorganic chemicals, tanning, dye extracts and insecticides and pesticides.
As defined above, the size of the Indian chemical industry is estimated to have reached around US$ 60.3 billion. In terms of total value added (at constant 2000 prices), the Indian chemical industry was the 5th largest in the world, and 2nd largest in Asia after China1. In terms of segmentation, basic chemicals was the largest sector with total revenues of US$ 43.3 billion, equivalent to about two-third of the industry’s overall value in 2010.
Over the last decade, the Indian chemical industry has evolved from being a basic chemical producer to becoming an innovative industry. With increasing investments in research and development (R&D), the industry is registering significant growth in the knowledge arena, including specialty
3. INDIAN CHEMICAL INDUSTRY
1UNIDO Industrial Statistics 2011

36
and fine chemicals. The industry now produces a large number of fine and specialty chemicals which have very specific uses and are essential for increasing industrial production. These find wide usage as food additives and pigments, polymer additives, anti-oxidants in the rubber industry, etc.
With per-capita consumption of chemical products in India being only a fraction of the global average, the opportunities for the domestic industry are enormous. In dyes, for example, India’s per capita consumption is 50 grams, as against a world average of 425 grams. In case of polymers, the per capita consumption is 5.2 kilograms in India, compared to the world average of 25 kilograms. Keeping in view the size of the domestic market
and the growth of end user segments, the potential for growth for the Indian chemical industry is immense.
Index of Industrial Production
The growth in the Indian chemical industry over the last few years pales out when compared with the Indian manufacturing sector or with the domestic industrial sector as a whole. This is evident from the Index of Industrial Production (IIP) computed by the Central Statistical Organization, Government of India, for the industry group ‘Chemicals and Chemical Products’. The IIP with the new base 2004-05 for April 2011 shows that while the index for the manufacturing sector for 2011-12 (annual average) stood at 197.1 (a year-on-year growth of 12.2%), the index in respect of
Exhibit 9: Trends in Industrial Production: Index and Growth
Source: Central Statistical Organisation, EXIM Bank Analysis
37
chemicals and chemical products was 122.6, representing a year-on-year negative growth of 0.4%. The General Index for the industrial sector as a whole, at 186.4, also indicated a better growth of 2.8% in 2011-12 compared to the chemical sector. A similar trend is observed even over a larger timeframe – the growth in the ‘chemicals and chemical products’ industry group has been less than both the manufacturing sector as also the general industry index in each of the years during 2004-05 (the base year of the new IIP index) to 2010-11, save for 2009-10, when the performance of the chemical industry was marginally better than the manufacturing sector (a growth of 5.0% in the case of former vis-à-vis 4.9% in the case of latter).
Production of Major Chemical Segments
The volume of major chemicals produced in India amounted to 7.5 million metric tonnes (MTs) in 2009-10. Though high in absolute terms, the growth during recent times has not been as emphatic. The production of the Indian chemical industry increased only at an average annual rate of 1.0% – from 7.1 million MT in 2003-04 to 7.5 million MT in 2009-10. This near flat performance was primary a result of stagnant growth in alkalis (which includes soda ash, caustic soda and liquid chlorine)
– the segment which, by far, accounts for the largest share of the output of the Indian chemical industry in volume terms. Matters were made worse be negative average annual rates of growth in organic chemicals and pesticides, both of which recorded average annual declines of (-) 2.0% and (-) 0.3%, respectively, during the 2003-04 to 2009-10 period, pulling down the overall growth of the industry. The positive and encouraging fact among the various segments of the Indian chemical industry has been the performance of specialty chemicals, primarily dyes and dyestuffs.
The average annual growth in production of dyes and dyestuff amounted to a healthy 10.4%, from 26000 MT in 2003-04 to 42000 MT in 2009-10 and 31.3% on a year-on year basis in 2009-10. This high growth could partly be attributed to the low base and low absolute volumes of dyes and dyestuffs, but more significantly, it implies a consistent increase in market demand of such products.
Given that specialty chemicals are knowledge oriented, the per unit price realisation is far higher than most other segments of the chemical industry. Hence, in value terms, it is likely to be far greater than what is evidenced in volume terms.

38
Overall, alkalis have continued to be the dominant segment of chemical industry in terms of sheer volumes, although their share in total chemical production of the country has declined
marginally from 74.5% in 2003-04 to 71.4% in 2009-10. This decline in share of alkalis was primarily accounted by organic chemicals, whose share increased from 17.0% to 20.8% during the same period.
Table - 2: Production of Major Chemicals: Recent Trends
Segment Production (‘000 MT) Growth (%) 2003- 2004- 2005- 2006- 2007- 2008- 2009- Apr- 2009- AAGR 04 05 06 07 08 09 10 Sep 10/ 2003- 2010- 2008- 09 11 09
Alkali 5070 5272 5475 5269 5443 5442 5602 2890 2.9 1.7
Organic 1474 1506 1545 1545 1552 1254 1280 649 -19.2 -2.0
Inorganic 441 508 544 602 609 513 518 281 -12.7 3.2
Pesticides 85 94 82 85 83 85 82 44 -3.5 -0.3
Dyes & dyestuff 26 28 30 33 44 32 42 24 31.3 10.4
Total Above 7096 7408 7676 7534 7731 7326 7524 3888 2.7 1.0
Source: Ministry of Chemicals & Fertilisers, Government of India
Exhibit - 10 : Production of Major Chemicals in India: 2003-04 vs. 2009-10
Source: Ministry of Chemicals & Fertilisers, EXIM Bank Analysis
Total Chemical Production 2003-04: 7.1 mn MT Total Chemical Production 2009-10: 7.52 mn MT

39
Shares of pesticides and dyes and dyestuff remained more or less at the same levels during the two periods of comparison.
The Indian inorganic chemical industry is highly fragmented and includes both large public and private units, as well as small scale units with the larger units dominating the industry. High-volume products, limited R&D expenditure and high cost of production characterize the organic chemical industry. Inorganic chemicals, which are largely of mineral origin and do not contain carbon, are mostly used in industrial and agricultural sectors as either processing aids or as catalysts. Due
to the nature of the segment, the inorganic chemical industry is highly regulated in terms of health, safety and environment.
The inorganic segment of the industry registered an average annual growth of 3.2% over the 2003-04 to 2008-09 period, although it witnessed a sharp decline of 12.6% during 2009-10. The only other segment of the chemical industry which fared worse in 2009-10 was organic chemicals which recorded a year-on-year decline of as much as 19.2%. Decline in organic chemicals production affected the cumulative performance of the industry in 2009-10, as it constitutes the second largest segment after alkalis.
Table 3 : Major Chemical Groups and Sub-Segments Produced In India
Group Sub – Products
Alkali Soda ash, Caustic soda, and Liquid chlorine
Inorganic chemicals Aluminum fluoride, Calcium carbide, Carbon black, Potassium chlorate, Sodium chlorate, Titanium dioxide and Red phosphorous.
Organic chemicals Acetic acid, Acetic anhydride, Acetone, Phenol, Methanol, Formaldehyde, Nitrobenzene, Citric acid, Maleic Anhydride, Penta Erithritol, Aniline, Chloro methanes, ONCB, PNCB, MEK, Acetaldehyde, Ethanolamines, Ethyl acetate and Ortho nitro toluene.
Pesticides Pesticides and insecticides registered under the Insecticide Act of 1968.
Dyes and dyestuff Azo dyes, Acid direct dyes, Basic dyes, Fast colour bases, Ingrain dyes, Oil soluble (solvent dyes), Optical whitening agents, Organic pigment colours, Pigment emulsion, Reactive dyes, Sulphur dyes, Vat dyes, Food colours and Napthols

40
India’s Trade in Chemical Products: An Analysis
The share of overall chemicals and related products (including pharmaceuticals) in the country’s total exports has been exhibiting a gradual upward trend, indicating that the growth in their exports during the recent past has outperformed India’s total exports. Growth in exports of chemicals and related products for 2009-10 stood at 1.4% as compared to a negative growth of 3.5% in the country’s overall exports. According to latest available data, exports of chemicals and related products (including pharmaceuticals) during the period April-December 2010, recorded a 34.3% growth – in line with the growth in India’s overall exports during the same period.
However, given that the products that have been considered under the chemical industry for the purpose of this study do not include pharmaceuticals, plastics, toiletries, fertilisers and petrochemicals, the analysis of trade would also exclude these items.
A list of products identified under the chemicals sector for analysis is provided at Annexure 1 and essentially comprises SITC codes 51, 52, 53 and 59). Following this assumption, exports of chemical products as identified in this study, aggregated to US$ 9.7 billion in 2009,
a decline of 15.8% over the previous year.
However, analysis over a larger time frame reveals an encouraging trend – while the compound annual average growth (CAGR) in exports during 2003-2009 amounted to 10.8%, the average annual growth (AAGR) in exports was even better at 12.2%. To the extent that calculation of AAGR captures the fluctuations in the intervening years, it could be considered as a more representative indicator of the performance of India’s exports than CAGR, which is based on the values at the beginning and end of the period. This is evident in the analysis of chemical exports during the period 2003 to 2009, wherein, CAGR is revealed to be less than AAGR, primarily because the year 2009 witnessed slump in chemical trade.
A similar trend was visible in the case of imports of identified chemical products – while imports in 2009 declined by 11.4% to US$ 14.1 billion, the average annual rate of growth during the 2003-2009 period was a healthy 14.6%. Overall, India remained a net importer of chemicals during this period, with a negative trade balance of US$ 4.4 billion in 2009.
The impact of the global economic meltdown on the exports of chemicals from India was evident without much lag – exports in 2009 recorded a sharp

41
decline of 15.8%, as against a high positive growth of 26.6% registered during the previous year. In terms of major segments, inorganic chemicals was the best performer with exports increasing at an average annual pace of 20.6%, albeit from a low base of US$ 387 million in 2005 to US$ 660 million in 2009. However, inorganic chemical segment was the worst hit segment by the recent global economic slowdown. The rate of increase dipped sharply in 2009 and entered the negative domain – from a high growth of 85.0% in 2008 to a steep decline of 22.9% in 2009.
India’s exports of chemicals have been predominately organic chemicals – export of organic chemicals increased at a healthy average annual rate of 12.0% and that too from a high
base of US$ 4114 million in 2005 to US$ 6149 million in 2009. Nonetheless, this segment was also adversely impacted by the global slowdown, recording a decline of 14.3% in 2009 as against a healthy growth of 20.0% in 2008. This was a major contributor to the negative growth recorded in overall export of the chemical sector in 2009.
The other segments of the chemical industry also exhibited similar pattern – while exports of dyes and colouring materials increased at an average annual pace of 10.9% – from US$ 825 million in 2005 to US$ 1178 million in 2009, exports of other chemicals such as insecticides, explosives etc. registered an AAGR of 13.3% increasing from US$ 1117 million to US$ 1715 million during this period.
Source: UN Comtrade, EXIM Bank Analysis
Exhibit - 11: India’s Chemical Trade

42
Even in terms of imports, it was organic chemicals which formed the largest segment with imports aggregating US$ 7760 million in 2009, recording an average annual growth of 13.7% during the 2005-09 period. India had a trade deficit in all segments of the chemical industry except for dyes and colouring agents. Overall for the industry as a whole, trade deficit amounted to US$ 4398 million in 2009, more than double the deficit value of US$ 2158 million witnessed in 2005. This indicates that growth in exports has not kept pace with the growth in imports – a clear reason for the industry to focus on exports by adopting a market-specific
and product-specific approach – contours of which this study would make an attempt to draw.
Organic chemicals(SITC Code – 51)
Organic chemicals and intermediates is the most important segment of the Indian chemical industry. Major organic chemicals produced in India include acetic acid, acetic anhydride, acetone, phenol, methanol, formaldehyde, nitro benzene, citric acid, maleicanhydride, pentaerythrytol, aniline, orthonitrochlorobenzene, acetaldehyde, ethanolamine, and ethyl acetate. Organic chemicals are
Source: UN Comtrade, EXIM Bank Analysis
Exhibit 12: India’s Export Destinations for Organic Chemicals(Total: US$ 6.1 BN IN 2009)

43
used in many household products like paints, varnishes and products of cleaning and disinfecting. This segment has been playing a significant role in providing vital chemicals and intermediates to associated sectors of the Indian chemical industry (like drugs and pharmaceuticals, dye stuffs and dye intermediates, leather chemicals, paints, and pesticides). The country is estimated to have produced 1.3 million MTs of organic chemicals in 2009-10.
In terms of export markets, USA, China, Germany and Pakistan were the top destinations for India’s organic chemical exports, together accounting for nearly one-third of the country’s total chemical exports of US$ 6149 million in 2009. These markets, except for China, have shown dynamism during the last five years, recording double digit average annual growth rates during this period. While considering, India’s exports of chemicals. A noteworthy trend has been the performance of Pakistan as a major and vibrant export destination of organic chemicals for India – exports to the country increased at a healthy average annual pace of 16.0% during 2005-2009 period. The performance would have been even better, had exports to the country not recorded a steep decline of 38.8% in 2009, as a fallout of the economic meltdown. As regards China, average annual growth in India’s exports of organic chemicals was modest primarily
because of a setback in 2008, when India’s exports to the country recorded a sharp decline of 29.1%. Among the other major markets, Saudi Arabia was the most dynamic, registering an impressive AAGR of 58.7% – from US$ 51.7 million in 2005 to US$ 218 million in 2009. In terms of products within the organic chemicals sector, other than the residual category [of organic chemicals not elsewhere specified (nes); SITC 5169], cyclic hydrocarbons (SITC 5112) was by far the biggest export item with exports aggregating to US$ 1026.8 million in 2009. In addition, exports of cyclic hydrocarbons also exhibited an impressive average annual growth of 31.1% during the 2005-2009 period; consequently, its share in India’s exports of organic chemicals increased from 13.6% in 2005 to 16.7% in 2009. Other major export items in this category included heterocyclic compounds and nucleic acids excluding heterocyclic compounds with oxygen hetero-atom(s) only, organo-sulphur compounds, lactams, and sulphonamides (SITC 5157) with a share of 8.5% in 2009 and recording an impressive AAGR of 32.0%; monocarboxylic acids and their derivatives (SITC 5137; 4.6% share; 28.1% AAGR); amine-function compounds (SITC 5145; 3.6% share; 6.7% AAGR); and nitrogen-function compounds other than amine-function

44
compounds, oxygen-function amino-compounds and carboxyamide-function compounds (SITC 5148; 2.7% share; 20.9% AAGR).
The import basket of India’s organic chemicals is also somewhat similar with cyclic hydrocarbons again being the top most item of imports, valued at US$ 1054 million in 2009 as against US$ 990 million in 2005. This product constituted 13.6% of India’s total imports of organic chemicals in 2009 (as against 20.9% share in 2005) although its imports registered only a modest average annual growth of 3.7% during the 2005-2009 period. Other major organic chemical import items in 2009 other
than the residual category (of organic chemicals nes; SITC 5169) included monocarboxylic acids and their derivatives (SITC 5137; 9.9% share; 22.2% AAGR), acyclic hydrocarbon alcohols (SITC 5129; 7.7% share; 13.2% AAGR), heterocyclic compounds and nucleic acids excluding heterocyclic compounds with oxygen hetero-atom(s) only, organo-sulphur compounds, lactams, and sulphonamides (SITC 5157; 6.9% share; 26.7% AAGR) and other acyclic alcohols (excluding SITC 5121), and the halogenated, sulphonated, nitrated or nitrosated derivatives of acyclic alcohols (SITC 5122; 6.8% share; 36.2% AAGR).
Table 4 : India’s Top Export Items of Organic Chemicals (SITC 51) - US$ mn No. SITC Product Description 2005 2006 2007 2008 2009 AAGR
Code (%)
1 5169 Organic chemicals, nes 1647.2 1841.8 1992.2 2408.1 2214.9 8.2
2 5112 Cyclic hydrocarbons 559.7 1396.1 1373.7 1458.4 1026.8 31.1
3 5157 Other hetcrocyclic compound nucleic acids 176.4 278.0 358.7 410.8 520.7 32.0
4 5137 Monocarboxylic acids, derivatives 114.5 159.8 206.2 324.1 280.9 28.1
5 5145 Amine-function compounds 192.3 207.5 230.8 317.7 222.1 6.7
6 5148 Other nitrogen-function compounds 80.1 99.1 115.2 162.9 166.4 20.9
7 5146 Oxygen-function amino-compound 94.6 123.6 141.8 208.4 160.2 17.3
8 5121 Acyclic monohydric alcohol 128.1 123.5 178.4 197.6 150.1 6.9
9 5162 Aldehyde, ketone and quinone- compounds 97.6 101.8 128.6 163.7 141.6 11.1
10 5113 Halogenated derivation of hydrocarbon 116.0 81.1 87.4 150.3 137.3 10.2
Total Organic Chemicals 4113.7 5439.9 5978.0 7174.1 6149.2 12.0
Source: UN Comtrade PC-TAS Database, EXIM Bank Analysis

45
Table - 5 : India’s Top Import Items of Organic Chemicals (SITC 51) - US$ mn
No. SITC Product Description 2005 2006 2007 2008 2009 AAGR Code (%)
1 5112 Cyclic hydrocarbons 990.4 913.2 1299.7 1232.3 1054.2 3.7
2 5137 Monocarboxylic acids, drv. 348.8 419.8 535.5 713.4 768.6 22.2
3 5169 Organic chemicals, nes 420.7 512.9 547.5 688.9 745.2 15.7
4 5121 Acyclic monohydric alcohol 382.2 338.3 475.5 560.0 594.2 13.2
5 5157 Other heterocyclic compounds nucl 219.8 263.1 345.4 541.8 535.9 26.7
6 5122 Other acyclic alcohol, derv 162.6 188.7 326.6 443.9 531.5 36.2
7 5138 Polycarboxylic acids, etc 178.7 357.5 273.7 402.3 476.2 35.5
8 5148 Other nitrogen-func. compds 243.6 342.1 384.4 505.0 440.5 17.8
9 5162 Aldehyde, etc .fnct. cmpnds 217.4 225.7 311.0 367.3 345.9 13.5
10 5145 Amine-function compounds 152.7 190.0 275.2 366.1 334.4 23.4
Total Organic Chemicals 4740.4 5238.3 6615.9 8060.6 7760.1 13.7
Source: UN Comtrade PC-TAS Database, EXIM Bank Analysis
Exhibit 13: Major Export Markets of Inorganic Chemicals in 2009
(Total US$ 659.8 mm)
Source: UN Comtrade PC-TAS Database, EXIM Bank Analysis

46
Inorganic Chemicals(SITC Code – 52)
Inorganic chemicals are substances of mineral origin that do not contain any carbon atom (e.g. nitrate, fluoride and metals). They are mostly used in detergents, soaps, and fertilizers. Major inorganic chemicals produced in India are carbon black, titanium dioxide and calcium carbide. India is estimated to have produced 518,000 MTs of inorganic chemicals during 2009-10. However, the country remains a major net importer of inorganic chemicals – while exports of inorganic chemicals were valued at a mere US$ 659.8
million in 2009, imports amounted to US$ 3121 million during the same period, thereby resulting in a trade deficit of US$ 2461.2 million.
The Asian region forms the main market for India’s inorganic chemicals exports. Of the top ten major export destinations in 2009, as many as eight were from Asia. The major export markets for inorganic chemicals included UAE with a share of 12.6%, Indonesia (6.7% share), Malaysia (6.5%), USA (5.5%) and Singapore (4.8%). The significant aspect of India’s major export destinations for inorganic chemicals is the fact that all of them except Sri Lanka, and to a
Table 6 : India’s Top Export Items of Inorganic Chemicals (SITC 52) - US$ mn
No. SITC Product Description 2005 2006 2007 2008 2009 AAGR Code (%)
1 5221 Carbon nes, carbon black 58.9 53.0 61.5 98.3 139.1 26.8
2 5232 Chloride, bromide, iodides 32.4 49.0 45.4 69.1 78.3 27.3
3 5234 Sulphides, sulphates etc. 35.9 41.4 53.0 92.1 73.2 24.1
4 5223 Inorganic acid, oxide etc 15.9 14.4 53.6 250.6 65.6 138.9
5 5226 Other inorgan. bases, oxides 34.6 41.3 47.2 80.6 57.9 19.0
6 5222 Other chemical elements 34.5 16.7 28.8 34.8 47.2 19.4
7 5225 Zinc, chrom. iron etc. oxide 49.7 47.4 61.2 69.4 46.7 1.3
8 5237 Carbonates, percarbonates 55.4 34.0 28.9 36.9 29.8 -11.3
9 5233 Hypochlorites, etc. 12.6 18.7 19.7 27.2 28.4 24.0
10 5249 Inorganic chemicals nes 13.1 12.0 13.3 21.8 20.5 15.0
Total Inorganic Chemicals 387.2 374.0 462.6 855.9 659.8 20.6
Source: UN Comtrade PC-TAS Database, EXIM Bank Analysis

47
lesser extent Indonesia, have shown great dynamism registering average annual growths of over 20% during the 2005-2009 period. Within this, UAE and Malaysia have emerged as the most dynamic markets for India’s exports of inorganic chemicals, registering average annual growths of 58.1% and 63.1%, respectively. Consequently, their shares as markets for the country exports of inorganic chemicals have increased from 4.0% and 2.4% in 2005 to 12.6% and 6.5% in 2009, respectively.
In terms of the major inorganic products being exported by India, other than the residual item of carbon (including
carbon black) nes, chlorides, chloride oxides and chloride hydroxides; bromides and bromide oxides; iodides and iodide oxides (SITC 5232); and sulphides, polysulphides, dithionites, sulphoxylates, sulphites, thiosulphates, sulphates and alums (SITC 5234) were the top export products together contributing to nearly one-fourth of India’s total exports of inorganic chemicals in 2009. Other major products included inorganic acids and inorganic oxygen compounds of non-metals (SITC 5223), other inorganic bases and metal oxides, hydroxides and peroxides (SITC 5226) and other chemical elements (SITC 5222). All
Table 7 : India’s Top Import Items of Inorganic Chemicals (SITC 52) - US$ mn
No. SITC Product Description 2005 2006 2007 2008 2009 AAGR Code (%)
1 5223 Inorganic acid, oxide etc 1138.3 1089.4 1088.7 2614.7 1450.0 22.8
2 5226 Other inorgan. bases, oxides 627.9 654.3 718.4 978.9 680.1 4.9
3 5222 Other chemical elements 147.6 137.6 180.8 261.8 203.2 11.8
4 5237 Carbonates, percarbonates 49.5 95.7 113.9 148.6 191.9 43.0
5 5249 Inorganic chemicals nes 69.5 72.3 93.5 139.7 97.4 13.1
6 5243 Metallic acid salts, etc 40.6 79.9 108.3 144.1 81.2 30.4
7 5225 Zinc, chrom. iron etc. oxide 64.4 72.9 76.2 84.5 77.2 5.0
8 5221 Carbon nes, carbon black 24.9 35.0 67.2 96.6 63.7 35.5
9 5236 Phosphites, phosphate, etc 20.0 21.4 39.0 78.5 59.7 41.6
10 5238 Metalic Salts and peroxy salts of inaoganic acids, nes 32.3 38.8 42.9 57.3 51.7 13.7
Total Inorganic Chemicals 2280.1 2379.2 2631.0 4798.5 3121.0 15.6
Source: UN Comtrade PC-TAS Database, Exim Bank Analysis

48
the top three products, excluding the residual item (SITC 5221) have exhibited significant vibrancy, increasing their shares in total exports of inorganic chemicals from India during the 2005-2009 period. Within them inorganic acids and inorganic oxygen compounds of non-metals (SITC 5223) was the most dynamic, recording an impressive average annual growth of 138.9%, thereby more than doubling its share in exports of inorganic chemicals from India, from 4.1% in 2005 to 9.9% in 2009.
Interestingly, inorganic acids and inorganic oxygen compounds of non-metals (SITC 5223) was also the single large it inorganic chemical imported
by India, with imports aggregating US$ 1450 million in 2009, representing a share of 46.5% of the country’s overall imports of inorganic chemicals in 2009. The other major item was other inorganic bases and metal oxides, hydroxides and peroxides (SITC 5226) with imports amounting to US$ 680.1 million, representing a share of 21.8% of total inorganic chemical imports in 2009.
Dyeing, Tanning and Colouring Materials (SITC 53)
The Indian dyestuff industry primarily caters to the needs of the domestic textile industry, although exports have also been occurring simultaneously. Today, India exports dyes and dye
Exhibit 14: India’s Major Export Markets for dyeing, tanning & colouring materials
(SITC 53) in 2009 Total : US$ 1178.3 Mn
Source: UN Comtrade PC-TAS Database, EXIM Bank Analysis

49
intermediates to the very same countries, on which it was dependent for imports till about a decade ago. The country produces a range of dyes, such as disperse dyes, reactive dyes, vat dyes, pigments and leather dyes. Production of dyes and dyestuffs in India was estimated to be 42,000 MTs during 2009-10. This segment forms an important link in the value chain of other industries using chemicals such as textiles, leather, plastic, paper, packaging, printing inks, paints and polymers. Textile sector is a major consumer of dyestuffs and accounts for 70% of dyestuff consumption in India.
The Government of India’s policy to promote export of cotton textiles and blending of polyester fibres
with cotton/viscose domestically is expected to result in continued high demand for various kinds of dyes. Stringent environmental laws in the western countries have resulted in discontinuance of production of certain dyes for textiles and leather, giving an opportunity to Indian chemical companies to manufacture such products and export to these countries.
India exported dyeing, tanning and colouring materials worth US$ 1178.3 million in 2009, exhibiting an average annual increase of 10.9% during the 2005-2009 period. Major destinations for export of Indian dyestuff materials include USA, Germany, Turkey, Brazil, China and Italy, which together accounted for more than one-third of
Table 8: India’s Export Items of Dyeing, Tanning and Colouring Materials (SITC 53) - US$ mn
No. SITC Product Description 2005 2006 2007 2008 2009 AAGR Code (%)
1 5311 Synthetic organic dyestuffs 586.7 694.3 857.6 1041.4 804.6 10.1
2 5332 Printing ink 87.2 86.5 119.7 131.0 113.3 8.4
3 5312 Synth. brighteners, lakes 58.5 74.3 82.8 119.1 97.0 15.9
4 5331 Other colouring matter 27.1 31.5 57.5 72.4 63.7 28.2
5 5335 Glaze, enamel, driers etc. 13.7 19.2 19.3 29.3 32.7 26.0
6 5323 Synthetic tanning substs 20.5 25.5 26.1 28.3 30.0 10.3
7 5334 Paints, varnishes etc. 23.9 24.7 20.6 25.8 24.6 1.7
8 5322 Dyes, tanning extract etc 7.3 11.4 8.9 12.9 12.3 18.5
Total Exports 825.1 967.4 1192.4 1460.1 1178.3 10.9
Source: UN Comtrade PC-TAS Database, EXIM Bank Analysis

50
India’s exports of the item in 2009. Turkey is among the major markets for dyeing, tanning and colouring materials, reflecting its dynamic textile industry, which is perhaps the major end user of such exports from India. The export of dyes from India is expected to touch US$ 2.6 billion in 2020.
In terms of products being exported in this category, the range is rather narrow with only eight products being exported under the SITC 4 digit classification. Even within these, synthetic organic colouring matter and preparations based thereon (SITC 5311) accounted for more than two-third (68.3%) of the country’s exports of dyes and colouring materials in
2009, marginally less than its share of 71.1% in 2005. The other major items being exported include printing inks (SITC 5332); and synthetic organic products of a kind used as fluorescent brightening agents or luminophores, whether or not chemically defined; colour lakes and preparations based thereon (SITC 5312). These three products together contributed 86.1% of India’s exports of dyeing and colouring materials in 2009.
Like exports, even the import basket for dyes, tanning and colouring materials is rather narrow with other colouring matter; preparations based on colouring matter; inorganic products of a kind used as luminophores, whether or not chemically defined (SITC 5331); paints and varnishes
Table 9 : India’s Import Items of Dyeing, Tanning and Colouring Materials(SITC 53) - US$ mn
No. SITC Product Description 2005 2006 2007 2008 2009 AAGR Code (%)
1 5331 Other colouring matter 127.4 140.8 171.4 216.9 236.8 17.0
2 5334 Paints, varnishes etc. 99.4 116.2 158.2 203.9 176.4 17.1
3 5311 Synthetic organic dyestuffs 99.8 118.6 129.9 164.8 169.3 14.5
4 5335 Glaze, enamel, driers etc. 53.9 71.7 72.7 85.7 78.1 10.8
5 5332 Printing ink 37.3 53.4 64.3 82.2 76.8 21.2
6 5322 Dyes, tanning extract etc 44.4 40.7 51.1 64.5 72.2 13.8
7 5312 Synthetic brighteners, lakes 21.9 24.6 25.9 27.8 26.9 5.3
8 5323 Synthetic tanning substs 11.5 15.5 15.0 18.3 12.8 5.7
Total Imports 495.9 581.5 688.6 864.0 849.2 14.9
Source: UN Comtrade PC-TAS Database, EXIM Bank Analysis

51
(SITC 5334); and synthetic organic colouring matter and preparations based thereon (SITC 5311) together accounting for 68.6% of India’s total imports in 2009, up from 65.9% cumulative share in 2005. The major sourcing countries for imports of dyes, tanning and colouring materials included China (with a share of 17.1% in 2009), Germany (9.8%), USA (9.2%), Switzerland (8.4%) and Taiwan (7.2%).
Insecticides (SITC – 591)
India is one of the most dynamic generic pesticide manufacturers in the world with more than 60 technical grade pesticides being manufactured indigenously by over 125 producers comprising large and medium scale enterprises (including about 10
multinational companies), and more than 500 pesticide formulators spread all over the country. India is the 4th largest producer of agrochemicals after USA, Japan and China. During 2009-10, production is estimated to have reached 82,000 MTs of pesticides (including fungicides, herbicides, weedicides, rodonticides).
The overall exports of insecticides (SITC 591) increased from US$ 609.5 million in 2005 to US$ 999.6 million in 2009, thereby recording an average annual growth of 14.4%. Exports of insecticides put up in forms or packings for retail sale or as preparations or articles (SITC 5911) amounted to US$ 500.2 million in 2009, a rather modest average annual increase during the period between 2005 (when exports aggregated to US$ 487.6 million)
Source: UN Comtrade PC-TAS Database, EXIM Bank Analysis
Exhibit 15 : India’s Trade in Insectitides

52
and 2009. As against this, exports of disinfectants, rodenticides and similar products, put up in forms or packings for retail sale or as preparations or articles (SITC 5914) exhibited strong dynamism, registering a significant average annual growth of 76.8% – from US$ 31.6 million in 2005 to US$ 193.8 million in 2009. Exports of herbicides, i.e. weed-killers, anti-sprouting products and plant-growth regulators, put up in forms or packings for retail sale or as preparations or articles (SITC 5913) and fungicides (SITC 5912) also exhibited vibrancy recording AAGR of 44.9% and 20.9%, increasing from US$ 24.6 million and US$ 65.6 million in 2005 to US$ 78.6 million and US$ 129.4 million in 2009, respectively. Consequently, the share of insecticides has fallen from 80% in 2005 to 50% in 2009, while the shares of other three have all gone up in this period.
In terms of markets, USA continues to be India’s major export destinations for insecticides etc. (SITC 591) with exports increasing from US$ 103.6 million in 2005 to US$ 116.2 million in 2009, thereby recording an average annual growth of 8.5%. As a result of a relatively lower AAGR, the share of USA as India’s export market declined from 17.0% to 11.6% during this period. The other major export markets for insecticides etc. included Brazil, Netherlands, China and Colombia. The last two countries, viz., China and Colombia have shown exceptional appetite for India’s exports
of insecticides, with the country increasing its exports from US$ 16.6 million to US$ 57.6 million to China and from US$ 9.2 million to US$ 48.0 million to Colombia during the 2005 to 2009 period. As a result, the share of these two countries increased significantly from 2.7% to 5.8 % and from 1.5% to 4.8%, respectively, during this period.
India has been a net exporter of insecticides with imports in 2009 at US$ 426.9 million being less than half of India’s total exports. USA was the major source of India’s imports of insecticides etc., with imports from the country aggregating to US$ 148.3 million in 2009. Other major import sources included China (US$ 86.1 million) and Japan (US$ 43.3 million). Together, these three countries accounted for nearly two-thirds of India’s total imports of insecticides etc. in 2009. India’s imports primarily comprised insecticides (SITC 5911) and disinfectants (SITC 5914) with their contribution together being 80.7% of the overall imports under the SITC – 591 category.
FOREIGN DIRECT INVESTMENTS IN CHEMICAL INDUSTRY
Chemicals industry in India is increasingly becoming a globalized industry. Foreign direct investment (FDI) in the chemical industry and trade between parent firms and their subsidiaries is increasingly becoming significant for the sector.

53
FDI has had a positive impact on growth, development, productivity and competitiveness for the Indian chemical industry. The country has benefited from the transfer and use of technology and the associated benefits of FDI inflows, which has increased over the last few years due to the several incentives that have been provided by the Government of India. The policy now allows for 100% FDI in chemicals under the automatic route.
The Indian chemical industry was among the top 10 sectors attracting the highest cumulative FDI inflows (US$ 3.3 billion) during the period April 2000 – February 2012, with a share of 2% in total FDI inflows (US $ 129.7 billion) into India. The surge in FDI inflows has been especially significant in recent times – FDI inflows in Indian
chemical industry increased by over 3.6 times between the periods 2006-07 and 2008-09. However, given the global financial crisis which started in the latter part of 2008, financial year 2009-10 witnessed a decline in FDI inflow into the sector. The FDI inflows however, bounced back in 2010-11 to touch US$ 398 million from US$ 362 million a year ago.
INITIATIVES IN THE INDIAN CHEMICAL INDUSTRY
v To promote investment in the Indian chemical industry and to make the country an important manufacturing hub for both domestic and international markets, Government of India has been taking a number of initiatives. Announcement of a transparent and investment friendly policy,
Exhibit 16 : FDI Inflows in the Indian Chemical Sector (US$ mn)
* April 2000 - February 2012Source: Department of Industrial Policy & Promotion; EXIM Bank Analysis

54
and facilitation-regime, through the integrated Petroleum, Chemicals & Petrochemical Investment Regions (PCPIRs) is one of the important initiatives of the Government of India.
v Government of India is a signatory to Chemicals Weapons Convention, which is a universal, non-discriminatory, multilateral
disarmament treaty that bans the development, production and acquisition, transfer, use and stockpile of all chemical weapons. India has passed the Chemical Weapons Convention Act, 2000, and has notified necessary rules to facilitate the implementation of the Act. The Government has also been taking steps to create awareness in the industry
Box 2:
Petroleum, Chemicals & Petrochemical Investment Regions (PCPIR)
The Petroleum, Chemicals and Petrochemicals Investment Region (PCPIR) has been envisaged to be a specifically delineated investment region with an area of around 250 square kilometres planned for the establishment of manufacturing facilities for domestic and export led production in petroleum, chemicals and petrochemicals, along with the associated services and infrastructure. Each PCPIR would have a refinery/ petrochemical feedstock company as an anchor tenant. The PCPIRs would reap the benefits of networking and greater efficiency through the use of common infrastructure and support services. They would have high-class infrastructure, and provide a competitive environment conducive for setting up businesses. They would thus provide a boost to manufacturing and result in augmentation of exports and generation of employment. The PCPIR would be a combination of production units, public utilities, logistics, environmental protection mechanisms, residential areas and administrative services. It would have a processing area, where the manufacturing facilities, along with associated logistics and other services, and required infrastructure would be located; and a non-processing area, to include residential, commercial and other social and institutional infrastructure. The minimum processing area for the PCPIR will be about 40% of the total designated area, i.e., around 100 sq km. The PCPIR may include one or more Special Economic Zones, Industrial Parks, Free Trade & Warehousing Zones, Export Oriented Units, or Growth Centres, duly notified under the relevant Central or state legislation or policy. All the benefits available under the relevant legislation or policy will continue to remain available to the said Zones or Parks, as the case may be, forming part of the PCPIR.

55
about its obligations, under the Chemicals Weapons Convention, by organizing a number of awareness programmes all over the country.
v Indian Chemical Council (ICC – also known as Indian Chemical Manufacturers Association) is the nodal point / signatory representing India under the Responsible Care initiative2. Nearly 100 companies have signed up under this initiative indicating their commitment to Responsible Care. ICC has
prepared codes, guidance notes for implementation of process safety, employee health and safety, pollution prevention, emergency response and product safety. ICC also continuously interacts with regulatory bodies on various issues like emergency preparedness, and safe transportation of hazardous chemicals. Member companies of ICC are encouraged to engage in dialogue with local communities and groups. Self-assessment reports are being obtained from Responsible Care companies.
Box 3: Chemical Weapons Convention
Chemical Weapons Convention, implemented by the Organization for the Prohibition of Chemical Weapons (OPCW), Geneva, came into force in 1997 and is a universal non-discriminatory, multilateral, disarmament treaty, which bans the development, production, acquisitions, transfer, use and stockpile of all chemical weapons. To be able to discharge the obligations under the Convention, each country is required to have a domestic legislation, which makes the filing of correct information about various activities of scheduled chemicals mandatory. According to the Directory of the World Chemicals Producers, India is a significant producer and exporter of scheduled chemicals. The convention permits commercial production of those chemicals, which are used for non-prohibited purposes. The Government arranges a number of awareness programmes in different parts of the country to create awareness in the industry about its obligations and ensuring that the activities in scheduled chemicals are in accordance with the provisions of the convention.
2Responsible Care is the chemical industry’s unique global initiative that drives continuous improvement in health, safety and environmental performance, together with open and trans-parent communication with stakeholders. Responsible Care embraces the development and application of sustainable chemistry, helping chemical industry contribute to sustainable de-velopment while allowing it to meet the world’s growing need for essential chemicals and the products those chemicals make possible.

56
4. MARKET EXPANSION & DIVERSIFICATION: ALIGNING EXPORTS WITH OVERSEAS DEMAND
This chapter seeks to analyse chemical products that have potential for exports from India by outlining a market/region-specific approach. In the first half of this chapter, a generic analysis has been attempted in order to identify current markets (countrywise) for India’s chemical exports and the prospects of market diversification to relatively dynamic markets identified based on its import demand. Simultaneously, an effort has been made to identify India’s capabilities in supplying such products and demand for such export products from India. In order to undertake such an analysis, the use of a bubble graph has been made. The graph categorizes the markets in such a way so as to gauge the prospects of market diversification (covered under country-wise market sections) as also to highlight products within each segment of chemical industry which have shown dynamism (covered under product-wise market sections). While the number of bubbles indicates the geographical dispersion (i.e. import markets) of the particular commodity being exported or product diversification of a particular segment
of chemical industry, the size of the bubble represents the absolute size of the market for that product. The market diversification analysis has been undertaken with respect to India’s top 20 export markets. Hence, while the size of the bubble indicates the top importers of a particular product, these countries may not necessarily be the top importers of that product in the world.
Set against this background, select chemical segments have been analysed, viz. inorganic chemicals, organic chemicals, dyeing and tanning materials and insecticides including disinfectants. The first part of the chapter provides an analysis at the global level while the second part focuses on specific regions.
INORGANIC CHEMICALS
Country-wise Analysis
As is evident from Exhibit 17, USA, China, Germany and Japan, were the main markets for inorganic chemicals in 2010 (as evidenced from the size of the bubble)3. The Bubble Graph is divided into four Quadrants. Q1
3The analysis is based on HS codes 28, 29, 32 and 38 unlike the previous chapter where the analysis is based on SITC codes and the data pertains to 2009. Nonetheless, the region specific analysis is based on SITC codes for 2009.
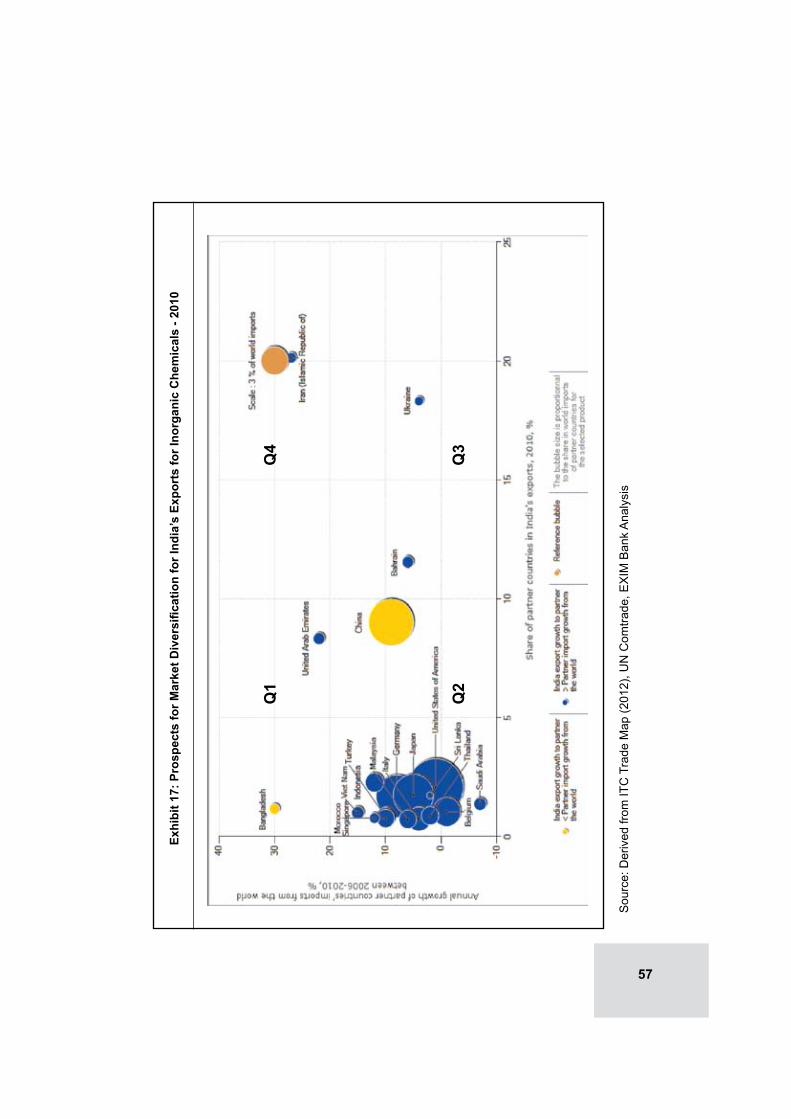
57
Exhi
bit 1
7: P
rosp
ects
for M
arke
t Div
ersi
ficat
ion
for I
ndia
’s E
xpor
ts fo
r Ino
rgan
ic C
hem
ical
s - 2
010
Sou
rce:
Der
ived
from
ITC
Tra
de M
ap (2
012)
, UN
Com
trade
, EX
IM B
ank
Ana
lysi
s
Q1
Q4
Q2
Q3
58
represents contries whose imports from the world have increased at a faster pace although their share as India’s export destination is relatively low. Q2 compress countries whose imports from the world have either recorded a decline or have grown at a fairly low pace and also whose share as India’s export market is relatively low. Q3 represents countries who are India’s major exporting destinations but are also those whose imports from the world have either recorded a decine or have grown at a slow pace. Q4 consists of countries who are not only India’s major export markets but also those who have shown increasing dynamism in terms of their import apetite. The size of the bubble provides an idea about partner country’s share in world imports of inorganic chemicals, i.e. bigger the size of the bubble, larger is that country’s share in world imports of inorganic chemicals.
From Exhibit 17, it is clear that Iran, Ukraine and Bahrain are India’s largest markets together accounting for half of India’s total exports of inorganic chemicals. Iran has not only exhibited tremendous dynamism in its import demand growing at an average of 27% during the 2006-10 period, but it has also registered an impressive growth of 50% as market for India’s exports of inorganic chemicals. Similar trend is visible in the case of UAE. However, India has not been able to keep pace with import appetite of countries
like China and Bangladesh, and in the process has been losing out its share to other competing countries. China is an important market for India considering that it is among the largest importers of inorganic chemicals (as represented by the size of the bubble). Further, the growth in import demand of China has been significantly high implying an ever increasing market in absolute values which Indian inorganic chemical exporters need to exploit. In fact, China provides an ideal market with huge scope for improvement. China’s import growth from the world is far greater than India’s export growth to China. With China’s share in world imports at 8.5% and Chinese imports of inorganic chemicals increasing at an annual pace of over 9.0%, Indian firms have a huge market opportunity to capitalize on. It may be noted here that, USA is the largest suppliers of inorganic chemicals to China, accounting for 16.1% of its import demand. However, given the geographical distance compared to India’s proximity to the country, importing from USA entails additional logistical and shipment costs. This is one aspect, ceteris paribus, which by itself could render Indian exports far more competitive.
Product-wise Analysis
Exhibit 18 provides an insight into identification of focus products for exports within the inorganic chemicals

59
segment. The horizontal red line cutting the Y-axis at 3.0% represents average world import growth of all products as a whole and divides the graph into two halves – all products placed above that line have shown a growth in imports higher than the average world import for all products. In other words, these products are dynamic products that have gained share in world imports during the 2006-2010 period. The X-axis represents the annual increase in India’s share in world exports during 2006-2010. The vertical red line that crosses the X-axis at zero divides the graph into two vertical sections – the products placed on the right side of this line indicate those products where India’s share in world market have registered a positive annual increase during 2006-2010, i.e. products whose exports from India have grown at a faster pace as compared to the growth in exports from other competing countries. Thus the entire exhibit can be divided into 4 quadrants with the following nomenclature and corresponding features:
i. Winners in Growing Sectors: Products that have not only shown dynamism in import demand from the world (i.e. their share in world imports has been increasing) but also where India has been able to increase its share
ii. Winners in Declining Sectors: Products whose import demand has been lower than the world
average for all the products (i.e. the product has lost share in the world market) but where India has been able to increase its share
iii. Losers in Declining Sectors: Products whose import demand has not only been lower than the world average for all the products but also where India’s share has declined.
iv. Losers in Growing Sectors: Products that have shown dynamism in import demand but where India has lost out share to its competitors. This category would thus comprise products where India needs to put more focus.
From Exhibit 18, it is evident that there are a number of inorganic chemical products that have a good potential for expansion in the export market. In the ‘Winners in growing sectors’ category sulphuric acid; oleum (HS 2807) is a clear case of product champion recording an impressive annual increase 48% in India’s share in world exports while at the same time registering a healthy annual growth of 12% in world import demand during 2006-2010. Carbon black (HS 2803), caustic soda and caustic potash (HS 2815) and sulphur, sublimed or precipitated; colloidal sulphur (HS 2802) are other products falling in this quadrant for which India is a net exporter. However, as regards hypochlorites, commercial calcium hypochlorite; chlorites, hypobromides

60
Exhi
bit 1
8: G
row
th P
rosp
ects
of N
atio
nal S
uppl
y an
d In
tern
atio
nal D
eman
d fo
r Exp
ort o
f Ino
rgan
ic c
hem
ical
s fr
om In
dia
- 201
0
Sou
rce:
Der
ived
from
ITC
Tra
de M
ap (2
012)
, UN
Com
trade
, EX
IM B
ank
Ana
lysi
s

61
(HS 2828), although the world imports for the product has grown on an average by 12% annual increase in India’s exports has been zero. Aluminium oxide (including artificial corundum), aluminium hydroxide (HS 2818) is among the largest export items in the inorganic chemicals category, as evidenced by the size of the bubble. While this product has witnessed a significant annual increase of India’s share in world exports by 23%, its annual imports from the world exhibited a decline of 5%, thereby being classified as ‘winner in declining sector’. Other products where India is a net exporter under this category are zinc oxide, zinc peroxide (HS 2817) whose annual increase in India’s share in world exports has been around 22% while its world imports has recorded a decline of over 11%; chlorides, bromides, iodides and their oxides, chloride hydroxides (HS 2827); sulphates, alums, peroxosulphates (persulphates) (HS 2833); silicates, commercial alkali metal silicates (HS 2839) – all these products have shown an annual increase of India’s share in world exports between the range of 17 and 20% while the annual world import growth have increased marginally by around 2%. Dithionites and sulphoxylates (HS 2831) is another product in this category which has exhibited a similar world import growth but has recorded a substantially higher annual increase
of India’s share in world exports for the products (at 29%).
There are only two sub items under inorganic chemicals where export growth from India has either lagged behind its competing counterparts or has remained stagnant, viz. fluorides; fluorosilicate, fluoraluminates and other complex fluorine salt (HS 2826) and hypochlorites; commercial calcium hypochlorite; chlorites; hypobromides (HS 2828). India is a net importer for the former while a net exporter for the latter and could do well to focus on promoting exports of these two inorganic chemicals.
ORGANIC COMPOUNDS
Countrywise Analysis
As can be seen from Exhibit 19, among India’s top export destinations for organic chemicals, USA, China, Belgium, Germany, Japan, Italy and UK are also the largest importers of organic chemicals in the world. India’s exports to all these countries, with the exception of China, have shown a higher growth than their imports of organic chemicals from the world during the 2006-2010 period, thereby indicating that India has been able to increase its market share in these countries.
An interesting point that emerges from Exhibit 19 is that India has

62
Exhi
bit 1
9: P
rosp
ects
for M
arke
t Div
ersi
ficat
ion
for I
ndia
’s E
xpor
ts fo
r O
rgan
ic C
hem
ical
s - 2
010
Sou
rce:
Der
ived
from
ITC
Tra
de M
ap (2
012)
, UN
Com
trade
, EX
IM B
ank
Ana
lysi
s
Q1
Q4
Q2
Q3

63
lost out its share in the South and East Asian market (save Japan and South Korea) to competing countries as reflected in the yellow coloured bubbles. These countries in addition to China include Singapore, Indonesia, Malaysia and Pakistan.
The strategic option that can be inferred from the analysis is that Asian countries, and in addition Brazil, offer strong incentives for Indian organic chemicals to diversify into these markets given their robust import demand and the absolute size of the market.
China, which accounted for 12.3% of the organic chemical imports from the world in 2010, witnessed an annual import growth of 9.1% during 2006-2010 – more than India’s annual export growth of 5.0% to the Chinese market. The main competitors for India (which was the 15th largest supplier of organic chemicals to China in 2010) in China are mostly Asian countries like South Korea, Chinese Taipei, Japan, Saudi Arabia, Singapore, and Thailand apart from select western countries like USA and Germany. India must therefore aggressively pursue expanding its reach in the region for organic chemicals.
On the other hand, both Indonesia and Singapore (which constituted
1.4% each of the world imports of organic chemicals in 2010) have seen higher annual import growths of 9.0% and 3.0% respectively vis-à-vis India’s export growth to these markets. In the Indonesian market (where India was the fourth largest supplier) India faces competition from Singapore, China and Malaysia, whereas in the Singapore market, Saudi Arabia, USA, and China were the top supplying countries.
India must also enhance its focus in to the Pakistan market where it is the second largest supplier of organic chemicals. Given Pakistan’s healthy annual import growth of 8.0%, India needs to tap the market potential further, especially considering that the two countries share common borders and have recently accorded MFN status and taken steps to enhance international trade between them. Incidentally, India faces competition in Pakistan from other regional exporters like China, Saudi Arabia, Kuwait and Iran.
It may be noted from Exhibit 19 that India has made some inroads into the Latin American market focussing on countries like Brazil and Mexico. Brazil, in particular has exhibited a strong import appetite registering annual growth of 13.0% during 2006-2010 while maintaining a share

64
Exhi
bit 2
0: G
row
th P
rosp
ects
for E
xpor
t of O
rgan
ic C
hem
ical
s fr
om In
dia
2010
Sou
rce:
Der
ived
from
ITC
Tra
de M
ap (2
012)
, UN
Com
trade
, EX
IM B
ank
Ana
lysi
s

65
of 2.2% in the world import market. India needs to effectively tap into this vibrant market of organic chemicals, more so given that China, India’s neighbouring country, was the second largest supplier of organic chemicals to the country in 2010 accounting for 15.2% of the country’s imports - nearly thrice that of India’s share of 5.2%.
Productwise Analysis
The following analysis emerges from Exhibit 20, which depicts the market potential for organic chemicals under HS-4 digit code.
There are 7 products which have recorded strong import demand during 2006-2010, higher than the world average import growth of 3.0% for all products, implying that these products have increased their market share in the world. Within these 7 products, India has been able to increase its share in the world market for five products, during 2006-2010 – as reflected in the ‘winners in growing sectors’ quadrant. These include: antibiotics (HS 2941), carboxylic acids and their derivatives (HS 2918), acyclic hydrocarbons (HS 2901), oxygen-function amino acids (HS 2922) and hydrocarbons derivatives, sulfonated, nitrated (HS 2904).
In addition, vegetable alkaloids, natural or reproduced by synthesis, and their salts, ethers, esters and other derivatives (HS 2939) is among the items that has been exhibiting a significant increase of 42% in terms of India’s share in world exports although its annual growth of import from world during the 2006-2010 period was rather modest – at par with the world average for all products (3%).
Two other items, viz. heterocyclic compounds with nitrogen hetero- atoms only (HS 2933); and carboxyamide-function compounds; amide-function compounds of carbonic acid acyclic amides and their derivatives (HS 2924) have also exhibited a significant increase of India’s share in world exports between 2006 and 2010, of 20% and 17%, respectively, while world annual import growth remained at 3%.
Almost all products that fall under the ‘winners in declining sector’ category are products where India is a net importer – reflected in the yellow-colouring of the bubbles. These are items where India has increased market share but whose world demand have either been modest or has actually registered a decline during the 2006-2010 period.

66
TANNING, DYEING EXTRACTS, TANNINS, DERIVATIVES, PIGMENTS ETC
Countrywise Analysis
As can be seen from Exhibit 21 the main markets for India’s exports of tanning and dyeing extracts are largely the western countries like USA, Germany, Italy and the emerging markets of China, Turkey and Brazil. While India has been catering to most of the major importers of tanning and dyeing extracts, France is among the major markets where India is not exporting much, although France was the third largest importer in 2010 with a share of 5.5% of global imports.
Russia is another country which India needs to focus on, not only because it was the tenth largest importer in 2010 but also because its average import growth from the world during 2006-2010 at 8.0% was far higher than India’s export growth of 3.0% to Russia during the same period, indicating that India has lost out market share in this dynamic market for tanning and dyeing extracts.
Other countries where India needs to diversify include Chinese Taipei and Bangladesh. The former is the thirteenth largest importer in the world with a share of 2.4% in world imports, and its demand has been increasing
at a faster pace than India’s export growth, during the analysed period
Productwise Analysis
From Exhibit 22, of all the fifteen products at HS 4 digit level under tanning, dyeing extracts, tannins, derivative and pigments (HS Code 32), only pigments, opacifiers, colours; enamels and glazes; engobes; liquid lustre (HS 3207) figures in the ‘winners in growing sectors’ quadrant for which even India’s share in world exports has increased during this period, although India in a net importer as indicated by the yellow colour of the bubble. While synthetic organic colouring matter and preparations (HS 3204) is the largest not just in terms of its exports from India but also in terms of world demand, its annual growth in world imports during the period 2006-10 has been close to zero, reflecting a rather stagnant demand. This is also mirrored in the annual increase of India’s share in world exports for this product by a healthy 9%.
Prepared driers (HS 3211), pigments nonaqueous media (liquid, paste) for paints and dyes (HS 3212), colour lakes and preparations thereon (HS 3205) and synthetic organic or inorganic tanning substances, tanning preparations, enzymes (HS 3202) are other products for which India’s share

67
Exhi
bit 2
1 : P
rosp
ects
for M
arke
t Div
ersi
ficat
ion
for I
ndia
’s E
xpor
ts in
Tan
ning
, Dye
ing
Extr
acts
, Tan
nins
, Der
ivat
ives
, Pig
men
ts e
tc -
2010
Sou
rce:
Der
ived
from
ITC
Tra
de M
ap (2
012)
, UN
Com
trade
, EX
IM B
ank
Ana
lysi
s
Q1
Q4
Q2
Q3

68
Exhi
bit 2
2: G
row
th P
rosp
ects
for E
xpor
t of T
anni
ng C
olou
ring
Prod
ucts
from
Indi
a - 2
010
Sou
rce:
Der
ived
from
ITC
Tra
de M
ap (2
012)
, UN
Com
trade
, EX
IM B
ank
Ana
lysi
s

69
in world exports has been increasing at a healthy pace although these products have lost out share in world demand, thereby relegating these products in the ‘winners in declining sectors’ category.
India needs to focus on the products that fall under the ‘losers in growing sectors’. These include four products, viz. colouring matter of vegetable/animal origin (HS 3203), aqueous solution of paint and varnish (HS 3209), vegetable tanning extracts; tannins & their salts (HS 3201), and printing, writing or drawing inks HS (3215). In all these four products India is a net importer. Colouring matter of vegetable/animal origin (HS 3203) is one product which has shown exceptional world demand, with its imports increasing at an average rate of 15.0% during the 2006-2010 period, as against decline of 3.0% with regard to its exports from India, resulting in the country losing out its market share and thus the need to focus on this product group.
INSECTICIDES, FUNGICIDES, HERBICIDES, PACKAGED FOR RETAIL SALE
Countrywise Anlysis
The market for insecticides, fungi-cides, herbicides, packaged for retail sale has been showing an encouraging growth in most countries
with the growth in import from India’s partner countries averaging 10.0% during the 2006-2010 period. As is evident from Exhibit 23, the growth in import demand in India’s major export destinations has been on the higher side, which is reflected in the graph as most of the bubbles are positioned in the upper periphery than the lower.
One country whose imports of insecticides, fungicides and herbicides has shown a phenomenal growth and is also among India’s largest export destinations is Brazil, which recorded an average increase in imports of 27.0 per cent during the 2006-2010 period. Incidentally, Brazil is also the second largest importer of this product in the world, as reflected in the size of its bubble, accounting for a share of 6.3% of global imports in 2010. The encouraging aspect is the fact that India’s exports growth to Brazil has grown at an even faster pace (at 38.0%) than the growth in its import from the world during the 2006-2010 period implying that India has managed to increase its market share in the country. Similar was the case with other major export markets like China, Netherlands, Japan, UK and Germany – India gained markets share in all these markets during the 2006-2010 period.
Two countries which merit a special mention are Colombia and Pakistan. Both these countries accounted for

70
Exhi
bit 2
3: P
rosp
ects
for M
arke
t Div
ersi
ficat
ion
for I
ndia
’s E
xpor
ts in
Inse
ctic
ides
, Fun
gici
des,
Her
bici
des,
pac
kage
d fo
r ret
ail s
ale
- 201
0
Sou
rce:
Der
ived
from
ITC
Tra
de M
ap, U
N C
omtra
de (2
012)
, EX
IM B
ank
Ana
lysi
s
Q1
Q4
Q2
Q3

71
Exhi
bit 2
4: G
row
th P
rosp
ects
for E
xpor
t of I
nsec
ticid
es, F
ungi
cide
s, H
erbi
cide
s, p
acka
ged
for r
etai
l sal
e Pr
oduc
ts fr
om In
dia
- 201
0
Sou
rce:
Der
ived
from
ITC
Tra
de M
ap, U
N C
omtra
de (2
012)
, EX
IM B
ank
Ana
lysi
s

72
0.7% of world imports of insecticides, fungicides and herbicides in 2010. The significant point to note is the fact that in these two economies, the average increase in India’s exports during 2006-2010 was 64.0% and 211.05%, respectively. In addition, the Pakistan market witnessed a dynamic import appetite registering a healthy growth of 17.0% during this period. Another point that merits attention is the fact that while India has been catering to the world’s largest importers, it has missed out serving the Canadian market which was the fourth largest market in 2010, but Canada accounted for only 0.6% of India’s total exports of insecticides, fungicides and herbicides.
There are major markets where India lost out share to competing countries, reflected in the yellow coloured bubbles. These include the world’s seventh largest market and India’s top export destination, viz. USA as also other emerging economies like Argentina, Vietnam, Indonesia, Bangladesh and Nigeria.
Productwise Analysis
As is evident from Exhibit 24, in all the 5 identified products under insecticides, fungicides, herbicides packaged for retails sale (HS Code 3808), India is a net exporter with as many as four products falling under the category of ‘winners in growing sectors’. Pesticides including
rodenticides, packaged for retail sale/formulated (HS 380890) experienced the maximum exports in terms of value. The product has not only shown an exceptional annual increase in terms of India’s share in world exports (to the tune of 59%) but has also witnessed dynamic import demand (the annual growth of world imports stood at 12% during 2006-2010).
Fungicides, packaged for retail sale or formulated (HS 380820) also showed a good potential for exports from India as the annual increase of India’s exports to the world registered a 16% growth, while the world annual import growth was 12%. Another product with a modest volume experiencing growth in India’s exports (at 10%) and growth in world import (at 7%) was herbicides, anti-sprouting product and plant growth regulators packed for retail (HS 380830).
However, insecticides, packaged for retails sale or formulated (HS 380810), have been showing a decline in terms of India’s share in world exports by over (-) 10%, while the world imports during the same period has shown a dynamic growth of 11%. India must enhance its exports under this product category.
REGIONWISE EXPORT POTENTIAL AND PRODUCT IDENTIFICATION
The second section of this chapter analyses the regionwise exports

73
potential of chemicals from India. Although India largely remains a net importer for many chemical products, its exports of certain products have been gradually rising. An analysis of the top importers of chemicals under SITC - 4 digit code, (inorganic-SITC 51, organic - SITC 52, dye/tanning - SITC 53, and insecticides - SITC 59) across select regions – Africa, Middle East, Latin America, and Asia – has been undertaken while simultaneously considering India’s top export destinations for these products in these regions. The analysis reveals that India is already catering to the top importers, albeit on a relatively smaller scale, which can suitably be increased given the tremendous potential these markets chemical products offer.
While India needs to further consolidate its share in the major import markets, there are regions where India already has an exposure but at relatively modest levels. These markets are the potential growth drivers for India’s chemical exports and need to be suitable targeted.
India’s capacity to serve abroad gets further strengthened given the shift in the manufacturing activity from western countries to the Asia Pacific region. With Indian firms gradually developing capability in serving the overseas end user industries, there is a need to diversify the country’s
chemical export manufacturing so as to enhance its share in global chemical exports.
The Methodology
Against this background, an attempt has been made to identify specific products which have been exhibiting strong import propensity in select regions and products for which India has reasonable capability in export. The idea is to construct a product-market matrix for chemical exports. The following methodology has been used:
• Trend (average annual growth) in chemical import demand of the region (4-digit SITC Codes – 51, 52, 53 and 59)
• Trend in India’s exports of chemicals to the world (i.e. India’s capacity to export)
• Trend in region’s imports from India
• Identification of chemical products with export potential from India to the region:-
- Identification of threshold demand: Products with a share equal to or more than 0.5% of the total chemical imports of the region from the world during 2009 are considered.
- Identification of India’s export capability: Of the

74
products shortlisted with the above mentioned process, only in those where India’s exports was at least US$ 100 mn in 2009 have been considered.
- Identification of export potential: An analysis of these products in terms of annual average growth rates during the period 2005-09 is undertaken to identify products with export potential and products that could be diversified to more lucrative markets.
- Product classification: The products so identified are classified into 4 categories:
• (a) Product Champions; (b) Underachievers; (c) Growth Products in Declining Markets; and (d) Losers in Declining Markets.
• The first two (Product Champions and Underachievers) are the Focus Products, whereas the other two (Growth Products in Declining Markets; and Losers in Declining Markets) are Diversifiable Products (i.e. products which need to be diversified away from these markets to newer geographies).
Focus Products
Product Champions: have maximum potential (efforts could aim at broadening supply capacities)
• Import of the product from the world by the region has been increasing at a faster pace than the region’s total chemical imports.
• Import of the product by the region from India are increasing at faster pace than its imports from the world (i.e. India has increased its share for that product in the region’s imports)
Underachievers: India needs to recover losing ground from competing suppliers
• Import of the product from the world increasing at a faster pace than total chemical imports of the region.
• Import of the product by the region from India are increasing at slower pace than its imports from the world (i.e. India’s share of that product in the region’s imports has declined)
Diversifiable Products
Losers in declining/stagnant markets:
• Import of the product from the world has been decreasing (or increasing at a pace lower than that of total chemical imports of the region).
• Import of the product by the region from India are decreasing (or increasing at slower pace than that of imports from the world, i.e.

75
India’s share for that product in the region’s imports has decreased)
Growth in declining/stagnant markets:
• Import of the product from the world has been decreasing (or increasing at a pace lower than total chemical imports of the region).
• Import of the product by the region from India are either decreasing at a slower pace than its imports from the world or are increasing at faster pace than that of the world (i.e. India’s share for that product in the region’s imports has increased)
PROSPECTS OF INDIA’S EXPORTS OF CHEMICAL PRODUCTS IN AFRICAN REGION
Based on the above methodology, 19 chemical products have been shortlisted and categorized under one of the four heads as stated above. The selected products constitute a substantial share (41.1%) of Africa’s chemical imports which stood at around US$ 4.16 bn in 2009. The overall chemical imports by Africa increased by 10.3% during 2005-09 and touched US$ 10.1 bn in 2009 as compared to US$ 7.6 bn in 2005.
Exhibit 25: Product Growth Matrix – Africa
UNDER ACHIEVERS
LOSERS IN DECLINING /STAGNANT MARKETS
Organic(Nitrogen-function
compounds)
Organic (largelyhydrocarbon),Insecticides
Organic,Tanning/Dye
extracts
Insecticides (largely
Insecticides rodenticides, fungicides,
herbicides, and plant-growth regulations)
PRODUCT CHAMPION
GROWTH IN DECLINING/STAGNANT MARKETS
VALUE -US$ 0.3 bn
VALUE -US$ 1.5 bn
VALUE -US$ 0.3 bn
VALUE -US$ 2.0 bn
SITC CODE5148
SITC CODE5162, 5169, 5137, 53115911, 5157, 5111, 5113
SITC CODE5912, 5914
SITC CODE5984, 5146, 5114, 51215922, 5112, 5989, 5332
Source: Derived from PC TAS, UN Comtrade (2011), EXIM Bank Analysis

76
Focus Products
Product Champions:
Based on the analysis, 8 products have been identified as ‘Product Champions’. These include mixed alkylbenzs etc.nes (SITC 5984), oxygen-function amino-comp. (SITC 5146), sulphur etc. derivative hydrocarbon (SITC 5114), acyclic monohydric alcohol (SITC 5121), albuminoidal substance etc (SITC 5922), cyclic hydrocarbons (SITC 5112), chemical products etc.nes (SITC 5989), and printing ink (SITC 5332). These Product Champions constituted 24.3% of the total chemical imports of Africa from the world valued at US$ 2.0 bn in 2009.
Underachievers:
Only one product which has been losing out share during the period 2005 and 2009, is classified in the ‘Underachievers’ category, in spite of India having a considerable share for this product in international markets, reflecting India’s potential to enhance its market share in the African continent. The identified product is an organic chemical – other nitrogeneous function compounds (SITC 5148).
Diversifiable Products
Losers in Declining/Stagnant Markets:
There are 8 products in this quadrant with a combined share of 14.7% of Africa’s total chemical imports and an absolute value of US$ 1.5 bn. These products are, aldehyde, ketone and quinone function compounds (SITC 5162), monocarboxylic acids and their anhydrides, halides, peroxides and peroxyacids; their halogenated, sulfonated, nitrated or nitrosated derivatives (SITC 5137), organic chemicals, nes (SITC 5169), synthetic organic coloring matter and preparations based thereon (SITC 5311), heterocyclic compounds, nucleic acids (SITC 5157), acyclic hydrocarbons (SITC 5111), halogen derivative hydrocarbon (SITC 5113), and insecticides, retail sale (SITC 5911).
Growth Products in declining markets:
There are 2 items that have been witnessing growth in imports from India in Africa, while Africa’s imports from the world for these products are on a decline. These 2 products are fungicides, put up or packed for retail sale or as preparations or articles

77
(SITC 5912), and disinfectants, put up or packed for retail sale or as preparations or articles (SITC 5914). The combined import value of these two products is around US$ 0.3 bn with a share of 2.63% in Africa’s chemical imports from the world in 2009. India needs to diversify its exports of these products to other regions like Europe and North America which are exhibiting high growth in their imports, rather than focusing on declining African market.
PROSPECTS OF INDIA’S EXPORTS OF CHEMICAL PRODUCTS IN ASIAN REGION
There are 15 products shortlisted based on the methodology as outlined earlier. The products constitute a share of 47.6% of Asia’s total chemical
imports with the absolute value of imports amounting to US$ 80.6 bn in 2009. The overall chemical imports by Asia increased at an AAGR of 5.1% during 2005-09 and touched US$ 169.3 bn in 2009 as compared to US$ 145.4 bn in 2005. At the same time, India’s exports of the identified products to the world has exhibited an increase in share, from 40.5% in 2005 to 44.3% in 2009, with the value of these products increasing from US$ 2.6 bn to US$ 4.3 bn during the same period.
Focus Products
Product Champions:
Of 15 products identified, 5 products have been shortlisted that have shown an increase in India’s share in
Exhibit 26: Product Growth Matrix – Asia
UNDER ACHIEVERS
LOSERS IN DECLINING /STAGNANT MARKETS
Organic(largely
hydrocarbon) Organic (largelyNitroen function
compounds), Insecticides
Organic,Tanning/Dye
extracts Organic,Insecticides
PRODUCT CHAMPION
GROWTH IN DECLINING/STAGNANT MARKETS
VALUE -US$ 5.7 bn
VALUE -US$ 10.1 bn
VALUE -US$ 39.8 bn
VALUE -US$ 24.9 bn
SITC CODE5111
SITC CODE5137, 53325113, 5162
SITC CODE5112, 5989, 5148,
5124, 5311
SITC CODE5157, 5922, 5146,
5145, 5121
Source: Derived from PC TAS, UN Comtrade (2011), EXIM Bank Analysis

78
the imports of the Asian region. The cumulative value of the imports of these 5 products by the Asian region is around US$ 25 bn. The products include heterocyclic compounds n.e.s.; nucleic acids (SITC 5157); albuminoidal substances, modified starches and glues (SITC 5922); oxygen-function amino-compounds (SITC 5146); amine-function compounds (SITC 5145); and acyclic monohydric alcohols (SITC 5121).
Underachievers:
Acyclic hydrocarbons (SITC 5111) is the only underachiever in this category and has been found to be lagging behind (in terms of AAGR during the period 2005-09) as far as Asia’s imports from India is concerned vis-a-vis Asia’s imports from the world. Incidentally, acyclic hydrocarbons are the fastest growing chemical product imported in the Asia region, and where India has fallen behind its competitors. The country thus needs to increasingly focus on this product for enhancing its market share in the Asian region.
Diversifiable Products:
Losers in declining/stagnant markets:
Although Asia is a huge market for chemicals, there are certain products which have not shown dynamism in
this market, and also where India has lost out share. The products identified under this category are: monocarboxylic acids and their anhydrides, halides, peroxides and peroxyacids; their halogenated, sulphonated, nitrated or nitrosated derivatives (SITC 5137); halogenated derivatives of hydrocarbons (SITC 5113); aldehyde-, ketone- and quinone-function compounds (SITC 5162); and printing ink (SITC 5332). The share of these 4 identified products in total chemical imports of Asia from the world has declined from 7.91 per cent in 2005 to 5.99% in 2009. Asia’s imports of these products from India also declined during the same period from 7.28% in 2005 to 6.29% in 2009. India must envisage diversifying its exports of these products away from Asia to other dynamic regions of the world like Europe and North America.
Growth Products in declining/stagnant markets:
Under this category there exist 5 products with a combined import value of US$ 39.8 bn in 2009. These products have exhibited decline in growth in the region’s imports from the world, while India continues to enhance its market share in this region. These products include cyclic hydrocarbons (SITC 5112); chemical products and preparations, n.e.s. (SITC 5989); other nitrogen-function

79
compounds (SITC 5148); phenols and phenol-alcohols, and their halogenated, sulphonated, nitrated or nitrosated derivatives (SITC 5124); and synthetic organic colouring matter and preparations based thereon (SITC 5311). Increasing exports of such products into a declining/stagnant market would not be as fruitful given the potential of these products in other regions of the world where demand of these products is more forthcoming.
PROSPECTS OF INDIA’S EXPORTS OF CHEMICAL PRODUCTS IN THE EUROPEAN REGION
There are 18 chemical products that have been shortlisted based on the methodology as outlined earlier. The cumulative value of the imports of these products by the European region stands at US$ 124.3 bn (a
share of over 52% of the region’s total chemical import in 2009). India’s market share of exports to the world of these 17 products too have increased significantly from US$ 4.8 bn in 2005 to US$ 7.2 bn in 2009, implying that the country possesses ample export capacities in these products.
Focus Products
Product Champions:
There are 6 shortlisted products under this category with aggregate imports of US$ 74.0 bn by Europe in 2009. The share of these products in total chemical imports of Europe from the world has increased from 27.8% in 2005 to 30.8% in 2009, corroborating the increasing demand of these products in this region. Some of the product champions
Exhibit 27: Product Growth Matrix – Europe
UNDER ACHIEVERS
LOSERS IN DECLINING /STAGNANT MARKETS
OrganicOrganic
Insecticides
Organic,Tanning/DyeInsecticides
Organic,(largely
hydrocarbons)
PRODUCT CHAMPION
GROWTH IN DECLINING/STAGNANT MARKETS
VALUE -US$ 8.0 bn
VALUE -US$ 24.8 bn
VALUE -US$ 18.9 bn
VALUE -US$ 72.4 bn
SITC CODE5121, 5911
SITC CODE5922, 5111, 5137
5332, 5124
SITC CODE5162, 5112,
5311, 5145, 5113
SITC CODE5989, 5157, 5912, 5146,
5148, 5169
Source: Derived from PC TAS, UN Comtrade (2011), EXIM Bank Analysis

80
identified are chemical products and preparations, n.e.s (SITC 5989); other heterocyclic compounds; nucleic acids (SITC 5157); fungicides put up in forms or packings for retail sale or as preparations or articles (SITC 5912); and oxygen-function amino-compounds (SITC 5146).
Underachievers:
In this category, 2 products totalling an import value of US$ 8.0 bn in 2009 have been identified. Both these products fall under the organic product category. However, it may be noted that acyclic monohydric alcohol (SITC 5121) exhibited the maximum annual average growth rate (AAGR) in imports of over 11% during the period 2005 and 2009, amongst all the identified products. Another product under this category is insecticides, retail sale (SITC 5911) which showed the growth rate (AAGR of 4.8%). Europe’s imports of these products from the India have declined from 3.6% in 2005 to 2.1% in 2009, thereby necessitating the need for India to increase its exports of these products to the region.
Diversifiable Products:
Losers in declining/stagnant markets:
This segment constitutes a significant chunk of Europe’s imports,
aggregating to US$ 24.8 bn in 2009. There are 5 products that have been identified. The share of these products in Europe’s imports from the world has declined from 12.5% in 2005 to 10.6% in 2009. These products are: albuminoidal substances (SITC 5922); acyclic hydrocarbons (SITC 5111); monocarboxylic acids and their anhydrides, halides, peroxides and peroxyacids; their halogenated, sulphonated, nitrated or nitrosated derivatives (SITC 5137); printing ink (SITC 5332); and phenols and phenol-alcohols, and their halogenated, sulphonated, nitrated or nitrosated derivatives (SITC 5124).
Growth Product in declining/stagnant markets:
Under this category, 5 products have been identified with a combined import value of US$ 18.9 bn in 2009. These products have exhibited decline in growth or stagnation in the region’s imports from the world, while India’s growth of these products has been positive. These products include; aldehyde etc. function compounds (SITC 5162); cyclic hydrocarbons (SITC 5112); and synthetic organic colouring matter and preparations based thereon (SITC 5311); amine function compounds (SITC 5145); and halogenated derivatives of hydrocarbons (SITC 5113). India could diversify some of these

81
products to other more remunerating markets like Asia and North America.
PROSPECTS OF INDIA’S EXPORTS OF CHEMICAL PRODUCTS IN MIDDLE EAST REGION
The Middle East region is an emerging chemical hub of the world. Based on the methodology mentioned earlier in this chapter, 16 chemical products have been shortlisted. The import of these products from the region amounted to US$ 2.8 bn in 2009 with a share of 38.5% in Middle East’s total chemical imports from the world (US$ 7.3 bn). India’s exports to the world of the identified products have seen a significant increase from US$ 4.1 bn in 2005 to US$ 6.3 bn in 2009, while Middle East’s imports from India have
also moved upwards from US$ 222.2 mn to US$ 422.9 mn during the same period. Given the relative proximity of the Middle East market to India, the region offers attractive proposition for Indian chemical manufacturers.
Focus Products
Product Champions:
Based on the analysis, 4 products have been identified as ‘Product Champions’, i.e. products which have shown a higher average annual growth in imports than the overall growth of chemical imports of Middle East from the world (which stood at 3.3% for the period 2005-09). In these products, India has increased its share not only in Middle East’s imports but also the
Exhibit 28: Product Growth Matrix – Middle East
UNDER ACHIEVERS
LOSERS IN DECLINING /STAGNANT MARKETS
InsecticidesOrganic
Organic,Tanning/DyeInsecticides
Organic,Insecticides
PRODUCT CHAMPION
GROWTH IN DECLINING/STAGNANT MARKETS
VALUE -US$ 0.08 bn
VALUE -US$ 0.7 bn
VALUE -US$ 1.0 bn
VALUE -US$ 1.0 bn
SITC CODE5984
SITC CODE5148, 5914, 5137, 5332
5911, 5169, 5113
SITC CODE5989, 5162, 5145, 5922
SITC CODE5112, 5121, 5157, 5146
Source: Derived from PC TAS, UN Comtrade (2011), EXIM Bank Analysis

82
share of these products in India’s total chemical exports has undergone considerable rise. The products are: acyclic monohydric alcohol (SITC 5121), cyclic hydrocarbons (SITC 5112), heterocyclic compounds n.e.s., nucleic acids (SITC 5157); and oxygen-Function amino-compounds (SITC 5146). These Product Champions constituted 12.6% of the total chemical imports of the region from the world.
Underachievers:
Only one product has been identified under the ‘Underachievers’ category. India is found to be losing out to its competitors during the period 2005 and 2009, in spite of India having a considerable share in international market and potential for enhancing its market share in Middle East. The identified product is an insecticide – mixed alkyl benzenes and mixed alkylnaphthalenes, other than those of subgroups 3352 and 5112 (SITC 5984). Given India’s proximity to the region, the country needs to focus in enhancing its exports of this product to the dynamic import market of Middle East.
Diversifiable Products:
Losers in declining/stagnant Markets:
There are 7 products that have been identified under this segment whose
import growth of Middle East, both from the world as also from India, is declining, with imports from the latter declining at a faster pace than that of the former. The products identified under this category are: nitrogen-function compounds n.e.s (SITC 5148); disinfectants, put up or packed for retail sale or as preparations or articles (SITC 5914); monocarboxylic acids and their anhydrides, halides, peroxides and peroxyacids; their halogenated, sulfonated, nitrated or nitrosated derivatives (SITC 5137); printing ink (SITC 5332); organic chemicals, n.e.s. (SITC 5169), halogenated derivatives of hydrocarbons (SITC 5113); and insecticides, put up or packed for retail sale or as preparations or articles (SITC 5911). The share of these 7 identified products in total chemical imports of the region from the world has declined from 7.91% in 2005 to 5.99% in 2009. The region’s imports of these products from India also declined during the same period, from 7.28% in 2005 to 6.29% in 2009. Since these 7 products have a modest share of 6.45 per cent in India’s export of chemicals to the world, India must envisage diversifying its exports of these products to other regions of the world where the import demand for such products is more vibrant.

83
Growth Product in declining/stagnant markets:
Under this category there exist 4 products with a combined import value of US$ 1 bn in 2009. These products have exhibited a decrease in the region’s imports from the world, while India continues to increase its exports to the region. These products are: chemical products and preparations, n.e.s (SITC 5989); aldehyde-, ketone- and quinone-function compounds (SITC 5162); amine-function compounds (SITC 5145); and albuminoidal substances, modified starches and glues (SITC 5922). India needs to explore newer and more dynamic markets for these products.
PROSPECTS OF INDIA’S EXPORTS OF CHEMICAL PRODUCTS IN THE NORTH AMERICA
A set of 16 chemical products have been shortlisted which constitute more than half the share (54.5%) of North America’s imports of chemicals from the world (which stood at US$ 159.52 bn in 2009). North America’s imports share from India of the selected chemical products has also witnessed an increase from 0.5% in 2005 to 0.7% in 2009. It may be noted that India’s contribution to North America’s imports of chemicals have seen a gradual increase during the period 2005-09. The share of India’s exports of these identified 16 chemcial products to the world has
Exhibit 29: Product Growth Matrix – North Americas
UNDER ACHIEVERS
LOSERS IN DECLINING /STAGNANT MARKETS
Organic(largely
hydrocarbons)Organic
Tanning/DyeInsecticides
Organic,Tanning/DyeInsecticides
Organic,Insecticides
PRODUCT CHAMPION
GROWTH IN DECLINING/STAGNANT MARKETS
VALUE -US$ 4.0 bn
VALUE -US$ 1.3 bn
VALUE -US$ 17.0 bn
VALUE -US$ 63.7 bn
SITC CODE5111
SITC CODE5311
SITC CODE5112, 5137, 5162, 51135148, 5145, 5922, 5912
SITC CODE5146, 5989, 5169, 5121, 5332, 5157
Source: Derived from PC TAS, UN Comtrade (2011), EXIM Bank Analysis

84
seen an increase from 2.8% to 4.1% during the same time period thereby corroborating India’s potential to penetrate the market further.
Focus Products
Product Champions:
From the list of 16 products, 5 products have been shortlisted that have shown an increase in India’s contribution to the North American region. The cumulative value of imports of these products is around US$ 63.7 bn, which signifies the potential for India in the North American market for these products. Some of the products are: oxygen-function amino-compounds (SITC 5146); chemical products and preparations, n.e.s (SITC 5989); organic chemicals, n.e.s (SITC 5169); printing ink (SITC 5332); heterocyclic compounds n.e.s.; nucleic acids (SITC 5157). In fact, the share of imports of these products by North America from the world have increased from 37.3% in 2005 to 42.5% in 2009, while North America’s imports from India have also shown a significant increase from 31% in 2005 to 43.7% in 2009. India must increasingly accelerate its focus for these products into the region, especially given the huge (US$ 63.7 bn) import demand.
Underachievers:
Acyclic hydrocarbons (SITC 5111) is the only product falling under this category. Though the share of imports of North America from the world for this product has increased from 1.9% in 2005 to 2.6% in 2009, the region’s imports from India for this product has remained constant (a marginal share of 0.01%). This is despite the fact that India’s export share of these products to the world has increased (albeit modestly) from 1.25% in 2005 to 1.37% in 2009.
Diversifiable Products:
Losers in declining/stagnant Markets:
North America is a huge market where India has been able to increase its share for select chemical products. However, there are certain chemical products for which the import demand in the region has been waning while at the same time India’s share in the imports of these products by the region has also been declining. The only product under this category is synthetic organic colouring matter and preparations based thereon (SITC 5311); The share of it in total imports of North America from the world has declined from 1.3% in 2005

85
to 0.9% in 2009. The share of North America’s imports of these products from India has also declined during the same period from 11.7% in 2005 to 6% in 2009. India must strive to diversify its exports of this products to other regions of the world where demand is more dynamic.
Growth Products in declining/stagnant markets:
Under this category there exist 8 products with a combined value of US$ 17.0 bn in 2009. These products have exhibited decline in the region’s imports from the world, while India continues to enhance its market share in this region. In fact, the share of these products in North America’s imports from the world have declined from 13.4% in 2005 to 10.7% in 2009.
PROSPECTS OF INDIA’S EXPORTS OF CHEMICAL PRODUCTS IN LATIN AMERICA
There are 19 chemical products that have been identified under the various categories. The cumulative value of imports of these products stood at US$ 20.7 bn with a share of over 49% in total chemical imports of Latin America in 2009. While the share of these products in India’s exports of
chemical products to the world has increased marginally from 76% (US$ 4.8 bn) in 2005 to 76.6% (US$ 7.4 bn) in 2009, share of these products in India’s exports of chemical products to LAC declined from 72.4% (US$ 378 mn) in 2005 to 67.6% (US$ 741.3 mn) in 2009. This signifies that though India has the capacity to explore the LAC market more aggressively, it has lagged behind.
Focus Products
Product Champions:
There are 12 identified products under this category with total imports of US$ 16 bn in 2009. The share of imports of these products in Latin America’s total chemical imports from the world has almost remained the same at 40%, corroborating a sustained demand for these products in the region. However, the share of LAC in India’s exports of those products has been witnessing a decline from 68.1% in 2005 to 65.1% in 2009, while the share of these 12 products with India’s total chemical exports have increased from around 40.6 % to 43.3% during the same time period. The product champions identified are namely: insecticides, retail sale (SITC 5911); other heterocyclic compounds; nucleic acids (SITC 5157); and acylic monohydric alcohol (SITC 5121).

86
Underachievers:
In this category, 6 products totalling imports of US$ 3.3 bn in 2009 by LAC region have been identified. India’s exports of these products to the world amounted to over US$ 3 bn, while India’s exports of the same products to LAC remained low at US$ 11.8 mn in 2009. The low market share of India in LAC for these products call for aggressive marketing strategies. Among the identified products, particularly organic chemicals (SITC 5169) and disinfectant retail (SITC 5914) have both exhibited a double digit AAGR of imports by LAC from the world, while India maintained significant AAGR of exports of
these products to the world during 2005-09.
Diversifiable Products:
Growth Products in declining/stagnant markets:
Under this category only 1 product exists – Halogen derivative hydrocarbon (SITC 5113) with import value of US$ 727.9 mn by LAC from the world in 2009. However, India’s exports to the LAC region of the product have been witnessing an increase. India needs to diversify export of this product to more remunerate markets where demand has been showing a consistent increase.
Exhibit 30: Product Growth Matrix – Latin America
UNDER ACHIEVERS
LOSERS IN DECLINING /STAGNANT MARKETS
OrganicTanning,
Insecticides/pesticides
OrganicInsecticides/pesticides
Organic
PRODUCT CHAMPION
GROWTH IN DECLINING/STAGNANT MARKETS
VALUE -US$ 3.3 bn
VALUE -US$ 728 bn
VALUE -US$ 16 bn
SITC CODE5169, 5914, 53325984, 5111, 5922
SITC CODE5113
—
SITC CODE5911, 5157, 5121, 5148,5912, 5989, 5146, 5137,5112, 5311, 5162, 5145
Source: Derived from PC TAS, UN Comtrade (2011), EXIM Bank Analysis

87
Import Substitution through Capacity Additions
The analysis undertaken in the previous chapter indicates that while India’s export of chemicals has been gradually increasing, the country still has a deficit in chemical sector4 on the trade account. India’s exports of chemicals in 2009 stood at US$ 9.7 bn whereas imports had touched US$ 14.1 bn, an indication of strong domestic demand for chemical products. However, there are chemical products which India is exporting as well as importing. Exporting a particular product in reasonable quantity corroborates that India does have the capabilities to produce the same, but for some reasons India is unable to fulfill its domestic demand, for which it has to rely on imports. This would imply that had appropriate capacities been in existence, the country would not have to rely on imported chemicals. A list of chemical products (at SITC 5 digit level), where India can increasingly seek capacity addition to cater to the growing
domestic market so as to reduce its reliance on importing the same, has been presented in Table-11. For the purpose of identification, only those chemicals have been considered for which India has production capacities as also where domestic demand has been increasing. To arrive at a list of such products, export value of at least US$ 10 million in 2009 has been used as a proxy for indicating ample production capacities while domestic demand has been represented for those products by a minimum import value of US$ 5 million in 2009. The dynamism in domestic demand is reflected in only those chemical products being considered for which CAGR during the 2005-2009 period has been positive.
Cross-Country Comparisons
The Indian chemical industry needs to be internationally competitive in order to make its presence felt in the world market. This competitive edge can broadly be captured in either being cost effective (price competitiveness)
5. THE INDIAN CHEMICAL INDUSTRY: IMPERATIVES TO REALIZE GROWTH POTENTIAL
4As defined earlier the chemical sector for the purpose of this study includes organic chemi-cals, inorganic chemicals, alkalis, insecticides and pesticides.

88
Table - 10: Chemical Products where Capacity Expansion could be Explored
SITC Product Name Application / Uses Code
1 51122 Benzene, pure Intermediate product to make other chemicals 2 51129 Cyclic hydrocarbons, nes Intermediate product to make other chemicals 3 51213 Butanols Ingredient in perfumes and as a solvent for the
extraction of essential oils 4 51217 Fatty alcohols, industrial Production of detergents / surfactants 5 51219 Other monohydric alcohols PVC plasticizers 6 51371 Acetic acid and its salt Vinegar; Ester production; intermediates; used as a
solvent 7 51372 Esters of acetic acid solvents for inks, paints and coatings 8 51376 Palmitic acids, etc. Produce soaps/ cosmetics, etc. 9 51377 Saturated monocarboxy acid,etc Food preparations 10 51379 Other unsat.monocarb.acids Food preparations 11 51481 Quaternary ammonium salts etc Used in Cosmetics/ Laundry / others use 12 51482 Carboxyimide-function compounds Coolant in medicinal preparations /oral care products
/ confectionery products 13 51484 Other nitrile-function compounds Latex free laboratory, medical gloves 14 51486 Organic dry hydrazine etc Chemical applications; Fuel cells; Rocket fuel; Gun
propellant 15 51489 Other nitrogen function compound Intermediate product to make other chemicals 16 51571 Heterocyclic compound pyrazite Intermediate product to make other chemicals17 51573 Other heterocycl.compounds Intermediate product to make other chemicals18 51574 Heterocyclic compound pyridine Intermediate product to make other chemicals19 51576 Heterocyclic compound pyr.azin Intermediate product to make other chemicals20 51577 Other heterocyclic comp. nitr Intermediate product to make other chemicals21 51579 Heterocyclic compound nes Intermediate product to make other chemicals22 51691 Enzymes nes Food Processing; Brewing; Dairy; Baby Foods;
Paper; Rubber 23 51699 Other organic compounds Intermediate product to make other chemicals24 52222 Selenium, phosphorus, etc. Medical use25 52232 Sulphuric acid; oleum Chemical agent26 52234 Phosphoric acid etc. Processed Food; Medical Use27 52251 Zinc oxide; - Plastics, ceramics, glass, cement, rubber (e.g., Zinc peroxide car tires), lubricants, paints, ointments, adhesives,
sealants, pigments, foods (source of Zn nutrient), batteries, ferrites, fire retardants, and first aid tapes
- Bleaching; Medicinal (Antiseptic)28 52256 Titanium oxides Pigment; Sunscreen/UV absorber; provide whiteness
and opacity (paints, plastics, food, toothpaste)29 52266 Aluminium hydroxide Fire retardant; Medicinal (as an antacid, etc.)30 53115 Vat dyes, etc. Application involves oxidation, reduction, pH control31 53116 Reactive dyes, etc. used in wool / nylon32 53117 Pigments, etc. Application and intermediary purposes33 53119 Synthetic Organic Colouring Matter Used in rubber, etc34 53121 Synthetic organic brighteners Gives colouring effects
Source: Data derived from PC-TAS, UN Comtrade, EXIM Bank Analysis

89
or being of a better quality. In the chemical industry, these set of parameters have been analysed for two select categories of chemicals classified under the International Standard Industrial Classification (ISIC) of United Nations - i.e. ISIC - 241 and ISIC 242.
Manufacture of Basic Chemicals - ISIC 2415
This category includes basic chemicals, fertilizers and nitrogen compounds and plastics in primary forms and synthetic rubber. A cross country comparison with competing economies on key parameters is presented in Table 12. As is evident, of the eight countries analysed, only UK and Germany ranked below India in terms of operating surplus for this category in 2007. A more important concern has been the fact that this operating surplus for the basic chemical industry has marginally declined for India when compared to the year 2000. This may probably due to the increase in the share of the cost of input materials and utilities, perhaps a reflection of inadequate common
infrastructure facilities like effluent treatment plants etc. A parameter where India is relatively competitive is in the case of its labour costs, reflected in typically lower wages and salaries per employee. Countries which were more competitive on this parameter were China and Indonesia. Another key area for improvement is the value added per employee, which, in the case of basic chemicals, is the second lowest for India (at US$ 35,100, it is marginally above that of China’s US$ 26,300 in 2007 but much lower than that of countries like Brazil and Malaysia). However, the encouraging aspect has been that the growth in value added per employee has outstripped the growth in wages per employee – while the former has more than doubled during the 2000-2007 period (average annual growth of about 15%), the latter has increased at an average annual pace of about 12%.
Manufacture of Other Chemicals: ISIC 2426
This classification includes among others, pesticides, paints and printing
5ISIC Code 2411: Manufacture of basic chemicals, except fertilizers and nitrogen compounds ISIC Code 2412: Manufacture of fertilizers and nitrogen compounds ISIC Code 2413: Manufacture of plastics in primary forms and of synthetic rubber 6ISIC Code 2421: Manufacture of pesticides and other agro-chemical products ISIC Code 2422: Manufacture of paints, varnishes and similar coatings, printing ink and mastics ISIC Code 2423: Manufacture of pharmaceuticals, medicinal chemicals and botanical products ISIC Code 2424: Manufacture of soap and detergents, cleaning and polishing preparations, perfumes and toilet preparations ISIC Code 2429: Manufacture of other chemical products n.e.c

90
inks. In this sub-segment too, the competitiveness of Indian chemical industry is relatively lower. In fact, the country is ranked at the bottom in terms of value added per employee, at US$ 15,100 in 2007, as against US$ 26,000 for Malaysia, US$ 72,200 for Brazil and as high as US$ 180,800 for UK (Table 13). However, as in the case of basic chemicals, the encouraging part has been that the growth in value addition per employee has been strong and faster than the growth in wages and salaries per employee. Of the countries analysed, only Indonesia had a faster growth in value addition. A similar positive feature was evident in the case of operating surplus which exhibited a reasonable increase during the 2000-2007 period, unlike
decline in operating surplus witnessed by countries such as Brazil, China, Malaysia and Russia. Exploring New Markets
Leading chemical manufacturers in the world are entering emerging markets through joint ventures or acquisitions (mainly in the West Asia to gain access to feedstocks, and in China and India to develop a local market presence). The most successful chemical producers in the near future are likely to be those that embrace the changing dynamics in the global chemical industry and effectively positioning themselves in emerging markets. It’s also important to consider regional differences - mature products in one region may
Table 11: Cross-Country Productivity Comparison for Chemicals (under ISIC 241)
Country Value added Wages & Cost of input Costs of Operating per employee Salaries per materials & Labour Surplus (USD ‘000) employee utilities (% in output) (% in (USD ‘000) (% in output) output) 2000 2007 2000 2007 2000 2007 2000 2007 2000 2007Brazil 82.0 128.5 13.4 20.7 68.6 71.5 5.1 4.6 26.3 23.9
China -- 26.3 -- 3.0 74.6# 75.0 3.3# 2.8 22.1# 22.2
Germany 83.8 167.9 43.4 76.0 68.4 72.0 16.4 12.7 15.2 15.3
India 17.0 35.1 2.5 4.7 78.2 79.3 3.2 2.8 18.6 18.0
Indonesia 22.8 57.2 2.5 3.5 62.9 60.7 4.1 2.4 33.0 36.9
Malaysia 79.7 120.3 9.1 14.6 68.2 71.8 3.6 3.4 28.2 24.8
Russia 14.1^ 71.9* 1.3 9.2* 67.7# 62.4* 5.6# 4.8* 26.7# 32.8*
UK 82.5 185.9 44.5 66.8 74.9 82.7 13.5 6.2 11.6 11.1
^ 2003 data; # 2004 data; * 2008 data
Source: UNIDO 2011

91
be innovative products in another. At the same time, there may be a need to explore a new business model, packaging, or a particular delivery method, to successfully deploy a product line in certain region, and all these can be ascertained by enhancing customer relationships.
Firms in the Indian chemical industry which are largely concentrating in the domestic market need to explore the tremendous opportunities abroad. This can either be undertaken by acquiring companies abroad or through greenfield projects (which will however have a certain gestation). The other option is exploring markets through better networks, through channel sales force, business associates, or assignment based
agents, and enhanced marketing in the various regions.
Ensuring and Maintaining Compliance
Indian chemical industry has tremendous prospects in countries in the EU. However, with the new set of regulations and compliances, the Indian chemical industry will find it extremely difficult to enter this market. One such strict environmental regulation that the chemical companies must comply with is the Registration, Evaluation, Authorization, and Restriction of Chemicals (REACH). REACH deals with the tracking and registration of regulated substances and ensuring the safe handling of substances and
Table 12: Cross-Country Productivity Comparison for Other Chemicals (under ISIC 242)
Country Value added Wages & Cost of input Costs of Operating per employee Salaries per materials & Labour Surplus (USD ‘000) employee utilities (% in output) (% in (USD ‘000) (% in output) output) 2000 2007 2000 2007 2000 2007 2000 2007 2000 2007Brazil 44.0 72.2 10.7 16.7 51.5 52.7 11.8 10.9 36.7 36.3
China -- 23.5 -- 3.4 67.0# 67.7 4.7# 4.6 28.3# 27.6
Germany 66.3 139.5 37.5 65.2 65.8 65.0 19.4 16.4 14.9 18.6
India 6.7 15.1 1.5 2.8 75.2 71.9 5.4 5.3 19.4 22.8
Indonesia 8.6 33.2 1.6 2.3 60.2 44.4 7.3 3.8 32.5 51.8
Malaysia 22.5 26.0 6.2 7.9 70.6 74.3 8.1 7.8 21.3 17.9
Russia 66.7 26.3* 1.0 8.4* 66.7# 71.4* 10.5# 9.1* 22.7# 19.5*
UK 95.8^ 180.8 40.4^ 70.0 57.6^ 57.0 17.9^ 16.7 24.6^ 26.3
^2002 data; # 2004 data; * 2008 data
Source: UNIDO 2011

92
Box – 4:
Draft National Chemical Policy
The draft National Chemical Policy (NCP) 2012 envisages transforming the existing scenario through accelerated economic growth. The thrust of this policy is to underscore the imperative that sustained adoption of technology up-gradation would offer viable options in overcoming developmental challenges across multiple sectors. NCP-2012 is an initiative to create a conducive policy framework to address these issues and to touch lives of all citizens and transform the country. By formulating a clear policy regime, NCP-2012 visualize creating an investor friendly environment for attracting additional investments in the sector apart from generating manifold employment opportunities in various segments of the sector. NCP-2012 also provides a roadmap for India to play an important role in cutting-edge, state-of-the art technologies through R&D and creation and incorporation of Indian IPRs in global standards. This will require measures for boosting entrepreneurship and creating a major global manufacturing hub for chemicals to achieve self-sufficiency while squarely addressing strategic concerns. At the same time, establishment of processes and standards for protection of the environment will also be required. NCP-2012 recognizes that the rapid growth in the chemical sector requires to be supported by an enhanced pace of human capital formation and capacity building. It becomes imperative to put in place an integrated skill development strategy so that there is continuous up-gradation of skills in tune with the technological developments. According to this draft, the cornerstone of this strategy is to derive maximal dividend from the young population and their creative abilities.
Source: National Chemical Policy 2012, Ministry of Chemicals, Government of India

93
preparations to protect workers and the environment. It requires that the chemical firms, in order to do business in EU, should establish sophisticated new processes with deadlines in 2013, and 2018 for: volume tracking of substances in preparations; assessing the obligations for notification and information of agencies, business partners, and end consumers; and complying with safe usage conditions specified by exposure scenarios for products.
In order for the Indian companies to be better equipped and achieve full transparency for all relevant regulations and facilitate ongoing compliance in an efficient way, firms require to put in place a robust mechanism which will help the right processes and enabling technologies. This will help them to adopt better business practices, result in improved performance, and provide a competitive advantage. This entails chemical firms to understand the challenges associated with substance and product related regulations; evaluate the compliance situation on a regular basis; develop a sustainable, affordable and compliance strategy to minimize compliance costs by leveraging IT processes; and finally turn compliance into a business opportunity by serving new markets.
A Fund for SMEs in Chemical Industry
Indian chemical industry is one of the largest and most diversified industries in the country and it consists of several small segments that cover hundreds of sub-segments. Contribution of SMEs in India’s chemical industry in terms of production is estimated at around 40%. However, given the paucity of funds available with the SMEs they are finding it difficult to upgrade themselves. The SMEs face not only technical constraints, but also limited availability of quality manpower. With a significant market potential abroad, these SMEs need to move up the value chain so as to tap the opportunities in overseas markets. The SMEs also need to conform by the various rules, regulations and good practices prevalent abroad. A suitable Fund may be constituted by the Government on the lines of the Technology Upgradation Fund as available to the textile industry, or other measures such as provision of accelerated depreciation as available to the wind energy sector. The Fund can also be utilized to access designs, patents, processes and technology. Such an initiative will make the industry, particularly the SMEs more robust and self reliant.

94
A similar idea has been mooted in the Draft National Chemical Policy to establish a “Technology Up-gradation & Innovative Fund (TUIF) that can address specific technology issues, faced by the industry.
R&D Intensity of Chemical Industry
Research and development (R&D) intensity is assuming greater significance for many of the manufacturing segments. The draft National Chemical Policy anticipates that the industry would need to increase R & D spending substantially to atleast 5-6% of their turnover. Since, chemical industry is a knowledge-based industry, the competitiveness of the units can be
significantly strengthened through supply of new and innovative products. The high value-added products of the chemicals industry continuously open up new fields of application, paving the way to progress and innovation in other industries. Typical examples are health, food, consumer goods, aerospace and car manufacturing, telecommunications, electrical engineering and electronics.
R&D contributing to innovative products is becoming increasingly important to balance the competitiveness of this sector. The areas for R&D in chemical industry include improvements in manufacturing process for reduction in cost of production, application development to diversify demand, new product development and
Exhibit 31: R&D Intensity of Indian Chemical Industry
Source: Derived from CMIE Prowess database, EXIM Bank Analysis
7Ministry of MSME; Ministry of Commerce and Industry, Govt. of India, 2008

95
research related to application/ safe use of chemicals. While R&D remains a universal imperative, its purpose and nature varies across segments. The basic chemical sector should focus on process innovation and product development and strengthen their competitiveness through improvements based on performance and quality of products. Firms in knowledge based chemical sector should focus on R&D with the objective of achieving product leadership and process innovations.
Although, wide variations in R&D efforts are observed across the chemical industry, the level of R&D investments in the Indian chemical sector remains low. India’s R&D intensity ratio of R & D expenditure to sales though has seen an increase from 0.04% in 2000-01 to 0.46% in 2010-11, the figures are far below the global average - annual R&D intensity in the EU for the chemical sector was, on an average, 2% during the years 1991 to 2008, while for the United States it was 2.8%, and for Japan it was 5.1%.
The chemical industry in India should strive for continually improving its production processes and products by investing resources in technology development. Technological development may be achieved by the chemical industry at two levels.
In the bulk products segment, the chemical industry should undertake process innovation with the objective of reduction in cost of production. In addition, the industry needs to invest in technological resources that would lead to specialized product development. Liberalization process has already increased the possibility of intra-firm transfer of technology and management practices in the form of consolidation within the economy as also from developed countries through foreign direct investment.
The Draft National Chemical Policy rightly envisages to make India as the R&D hub and in the process, design schemes towards this direction. These schemes could cater to the needs of several major technoogies like bio-technology, green technologies, renewable energy including bio-fuels, efficient water management technology to enable to manufacture chemicals at low affordable costs.
Innovative Practices in Product Market
In spite of the recent recessionary pressures, declining yields, and reduced budgets, innovation remains an essential strategic pillar and a key aspect of a company’s growth strategy. Innovation is not only confined to R&D but to the entire business spectrum. While penetrating new geographies

96
the possible use of technology in innovation plays an important role because the formulations are specific for select geographies. This also entails employing innovative business models that will allow expanding in a particular region through innovative practices. In the above context, it is important for the Indian chemical manufacturers to focus on select business segments where competitive advantage exists. To get better returns, it is important to be selective and choose those innovation areas where India is going to get high returns and have the larger impact on the company. Such strategies would help Indian chemical manufacturers to establish relationship with their customers in profitable segments and exit non-competitive segments.
Collaboration
The chemical industry needs to enhance their collaborative efforts in order to improve competitiveness. Collaboration amongst players in the chemical industry could happen both at cluster level (for sharing of common infrastructure) as also at firm level (for sharing of knowledge and technology). Smaller players needed to cooperate in ‘clusters’ where infrastructure, resources, commercial intelligence, common trade centres and even knowledge can be shared at lower costs and improve competitiveness of the producers. Collaboration with firms across borders for technology and investment would also give a boost to the industry. In addition, the players
Exhibit 32: Aspects to be considered during Innovation
Source: EXIM Bank Analysis

97
should also achieve greater level of industry-institutional partnership for knowledge development and sharing. The Draft National Chemical Policy has suggested that qualified scientists could undertake research, which would be expected to be initially funded, primarily by the state, and individual companies could invest at a later stage. To further this proposed policy initiative, the areas of research could be divided by the firm and the state, thereby yielding results in the derived direction.
Emerging New Segments in Chemical Business
As the chemical industry progresses, there are new areas of chemical businesses that are emerging. This ranges from specialty chemicals to high end nano-technology, to further value added chemical products. Firms therefore should be proactive in identifying opportunities in the various areas of chemical business. Although specialty chemical companies were hard hit by the recent
Exhibit 33: Collaboration at Various Levels of Chemical Industry
Source: EXIM Bank Analysis

98
economic downturn, many of the US and European chemical companies are still focused on this sector, as specialty products are more profitable than commodity chemicals in the longer term. In India, it has been seen that the usage of specialty chemicals has increased considerably during the past few years in construction, automotive, electronics and water treatment industries. This positive growth is expected to accelerate in the years to come given the expected dynamism in these industries.
Another emerging area in the chemical industry is rubber chemicals which are showing tremendous signs of growth. The boom in the automobile industry and rising demand for industrial products like belts, hoses, etc are expected to trigger the requirements for rubber chemicals. The need for high performance tyres is on the rise and that augurs well for the specialty rubber chemicals industry. Infact, innovation in rubber chemicals is adding immense value to tyres. Today, radial tyres are in great demand, as these offers higher mileage and lower rolling resistance as compared to normal tyres. This in turns lowers the fuel consumption significantly, thereby reducing carbon footprint, and hence gives greater return on investment for transporters in the long run. While the tyre industry is a major demand driver, the non-tyre components like window
profiles, seals, belts, hoses and various other moulded products also form a sizeable chunk of speciality rubber chemicals.
Setting up of Chemical Parks or Mega Chemical Estates
In order to address the issue of capacity expansion and for creation of common infrastructure, the chemical industry, with support of Government could establish exclusive Chemical Parks – a concept similar to the one set up in Germany. Each of the German chemical parks and sites has its particular strengths which are reflected in its individual portfolio of services. The object of these initiatives is to support the chemical sites in their respective regions and to make them better known internationally. To this end, the industries work closely with the governments of the individual states, municipalities, universities and economic development agencies under public-private partnership model.
In such Parks the industry may be encouraged to set up mega chemical plants that could contribute to increased production as well as employment generation while simultaneously contributing to the development of common infrastructure in the region, on similar lines developed in Germany. The Government has
99
already initiated policies for setting up of integrated Petroleum, Chemicals and Petrochemicals Investment Regions (PCPIR). The chemical park model, where producers share a site and become vertically integrated with other companies, sharing infrastructure, services and facilities, is becoming increasingly relevant against the backdrop of the current recession, fluctuating energy prices and wayward margins. Through such synergies, significant efficiencies could be achieved that are far more economical than running a standalone plant.
The draft National Chemical Policy also suggests to set up dedicated clusters for chemical industry in regions with large share of chemial firms (e.g. in Gujarat, Maharashtra, Tamil Nadu, Andhra Pradesh).
Environmental Sustainability
Since end users of many chemical substances are household con-sumers using items such as paint, glue, insect spray, cosmetics and household cleaners), chemical producers have the responsibility in promoting safe management of substances – starting from design in production to end-use, and their final disposal (hazardous waste).
Many chemical consuming countries are working towards development of inherently safer chemical products (such as less polluting solvents) and processes (such as use of renewable feed-stocks).
To garner a greater share in world chemicals market, Indian chemical industry needs to address developmental issues such as sustainable chemistry, adherence safety and health and risk management. Organizations in India should increasingly establish an environmental sustainability strategy to fulfill and implement a holistic, centrally-led governance and management approach that focuses on developing internal, cross-functional networks and programs in key areas like operations and supply chain and products & packaging, for both the internal and external stakeholders. Exhibit 34, portrays a sound sustainable index prepared by American Institute of Chemical Engineers (AIChE),
Improving Basic Management Capabilities
Indian chemical industry has a good record of management expertise. This could be further leveraged with techniques such as Good Manufacturing Practices, Good

100
Exhibit 34: AIChE SUSTAINABILITY INDEX (SI)
Source: American Institute of Chemical Engineers (AIChE), EXIM Bank Analysis
Laboratory Practices, Total Quality Management, Total Production Management and Risk Management. The Principles of Good Laboratory Practices have been developed to promote the quality and validity of test data used for determining the safety of chemicals and chemical products.
Such practices would result in quality improvement and lower cost, thereby improving competitiveness. The chemical associations and industry bodies must also focus more on the SMEs to help them understand the requirements of the industry.

101
High prices of basic feed stock
Basic raw materials constitute major portion of cost of production (30% to 60%) in the chemical industry. Indian chemical industry either uses natural gas or crude oil as feedstock for manufacturing process. The fluctuations in oil prices therefore affect the growth projections of the firms. At times, the manufacturers are unable to pass-on the cost escalation (occurring due to sudden increase in oil prices) to end consumers. Cost optimization is thus critical for the chemical units, as their margins may go under pressure during oil crisis.
Low Level of Brand Development
Indian chemical producers, except a few large producers, generally sell their products as generic products without brand development. There is also low level of interest amongst small scale producers for brand development, product development as also market development. To increase their visibility, chemical firms may undertake brand building exercise across the globe wherever they have the opportunity to penetrate the market.
Exhibit 35: Select Voluntary Initiatives taken in the European Chemical Industry
Source: EXIM Bank Analysis

102
Low Level of Common Infrastructure
In general, due to its very nature, the chemical industry requires certain basic infrastructure facilities, both in the process chain as also in the supply chain. In the process chain, the critical infrastructure requirements include a common effluent treatment plant, and an effective green belt segregating the industrial units from human settlements. In the supply chain, the critical infrastructure requirements include a good port, chemical storage terminal, and adequate berthing facilities. In the above context, it is being felt that the production and export earnings of this sector would receive a quantum jump if an industrial estate dedicated to the chemical industry could be set up. At present, each unit has to create specialized facilities on its own which leads to duplication of efforts and investment. If chemical units are clustered in close proximity the required infrastructure could be vertically integrated resulting in cost reduction.
The draft National Chemical Policy envisages that Government could encourage companies to seek “Responsible Care Certificate” and empanel reputable auditors for the same. To facilitate Government efforts
to set up Common Effluent Treatment Plants (CETPS), financial institutions like Exim Bank of India could partner Government towards such initiatives.
Dumping / Import Competition
The chemical industry has attracted the maximum number of anti-dumping actions in the world. Unlike safeguard duties, which are levied in a uniform way, anti-dumping duties vary from product to product and from country to country. Countries initiate anti-dumping probes to check if domestic industry has been hurt because of a surge in cheap imports. Anti-dumping measures are taken to ensure fair trade and provide a level-playing field to domestic players. According to figures from the World Trade Organization, India has initiated 275 anti-dumping cases during the period 1995-2011 in the chemicals and allied industries out of a total of 825 anti-dumping cases worldwide, thereby accounting for 33.3% share globally. Caustic soda received the maximum number of anti-dumping cases during the period 1995-2011 followed by acetone (9 cases), PVC and oxo-alcohols (8 cases). Countrywise, the maximum number of cases was registered against China (68), EU (31), Taiwan (24), South Korea (21) followed by Japan (21). At the same

103
time, there are 40 anti-dumping cases that have been filed against India worldwide in the chemical and allied sector during the same period (second highest after Base metal products).
Industry - Academia Linkages
For transforming ideas into new products, partnership between industry and academia is a must. Thus, Indian chemical industry should leverage the potential of educational
and research institutions to source intellectual as well as human capital. Such linkages may be effectively used for setting up of in-house R&D facility or for outsourcing R&D activities. The educational institutions could play a greater role for development of Indian chemical industry by offering courses and conducting research proactively. The research and academic institutions may also open local offices within chemical clusters to facilitate greater level of interactions.
Exhibit 36: Anti-Dumping Cases in Chemical Industry Initiated by India (1995-2011) against Top 10 Countries
Source: World Bank Database, EXIM Bank Analysis

104
Box – 5:Need For Consolidation of Acts and Rules
The draft National Chemical Policy 2012 has suggested the need for consolidation of Acts and Rules currently in India. At present, there are multiple legislations in India governing the chemicals industry that fall under the purview of different Ministries as given below:
Ministry Act
Ministry of Environment & Forests Environment Protection Act, 1986 Ministry of Labour Factories Act, 1948 Ministry of Road Transport & Highways The Motor Vehicles Act, 1988 Ministry of Commerce & Industry The Explosives Act, 1884 Ministry of Home Affairs The Disaster Management Act, 2005 Dept. of Chemicals & Petrochemicals The CWC Act, 2000 Ministry of Rural Development Land Acquisition. Act, 1894
The REACH (Registration, Evaluation, Authorization and Restriction of Chemicals) legisla-tion, enacted by the European Union with the main aim of protecting human health and environment from the hazardous effects of chemicals and to have a sustainable chemical policy replaces around 40 different environment related legislations. Several other coun-tries such as Australia, Canada, Japan, China, etc. are also adopting a similar policy to retain their position in the global market. India may also have to pursue similar measures.
Apart from multiplicity of regulations, there are no specific Indian legislations pertaining to:- • Registration of substances • Preparation of a national inventory • Restrictions on hazardous substances • Banning of certain substances • Detailed classification and labeling criteria and • Transport classification
Though some of these issues have been briefly considered under certain legislations; they are yet to be addressed adequately in a comprehensive scientific and coherent manner. There is a need for adopting a holistic approach towards chemical legislations.
A centralized, nodal body, titled – ‘National Chemical Centre’, to be established by DCPC, will be responsible, inter-alia, for working on legislations as well as for monitoring their implementation. The multiple legislations governing chemicals may be consolidated into one coherent and comprehensive piece of legislation, which will simplify its implementation and monitoring. This will also facilitate the creation of a chemicals inventory in the country. There is a need to create REACH like legislation in India for safe use of chemicals for pro-tection of human health & environment.
Source: National Chemical Policy 2012, Ministry of Chemicals, Government of India

105
S. No. SITC Product Description 2005 2006 2007 2008 2009 Code 1 5169 Organic chemicals, nes 1647 1842 1992 2408 2215 2 5112 Cyclic hydrocarbons 560 1396 1374 1458 1027 3 5311 Synth. organic dyestuffs 587 694 858 1041 805 4 5157 Oth. heterocycl. comp. nucl 176 278 359 411 521 5 5911 Insecticides, retail sale 488 457 496 617 500 6 5914 Disinfectant, etc. retail 32 56 85 194 291 7 5137 Monocarboxylic acids, drv 114 160 206 324 281 8 5145 Amine-function compounds 192 207 231 318 222 9 5989 Chem. products etc.nes 111 120 143 231 180 10 5148 Oth. Nitrogen-func. compds 80 99 115 163 166 11 5146 Oxygen-funct. amino-comp. 95 124 142 208 160 12 5121 Acyclic monohydric alchl 128 124 178 198 150 13 5922 Albuminoidal substs. etc 125 112 201 212 149 14 5162 Aldehyde,etc.fnct.cmpnds 98 102 129 164 142 15 5221 Carbon nes,carbon black 59 53 62 98 139 16 5113 Halogen.derv.hydrocarbon 116 81 87 150 137 17 5123 Cyclic alcohols,derivats 118 141 215 176 134 18 5111 Acyclic hydrocarbons 80 131 142 244 133 19 5912 Fungicides, retail sale 66 61 66 106 129 20 5332 Printing ink 87 86 120 131 113 21 5124 Phenols,phenol-alch.derv 58 99 101 90 112 22 5114 Sulph.etc.derv.hydrocarb 90 97 115 142 110 23 5984 Mixed alkylbenzs.etc.nes 113 124 173 199 105 24 5312 Synth.brighteners,lakes 59 74 83 119 97 25 5138 Polycarboxylic acids,etc 100 131 159 190 94 26 5986 Organic chem.prodcts,nes 51 53 74 102 93 27 5161 Ether,alchl peroxide,etc 65 67 65 88 84 28 5913 Herbicides, retail sale 25 57 63 101 79 29 5232 Chloride,bromide,iodides 32 49 45 69 78 30 5155 Othr.organo-inorgan.comp 24 33 40 50 76
ANNEXURE 1: INDIA’S EXPORTS OF IDENTIFIED CHEMICAL PRODUCTS TO THE WORLD – SITC 4-DIGIT LEVEL (US$ MN)
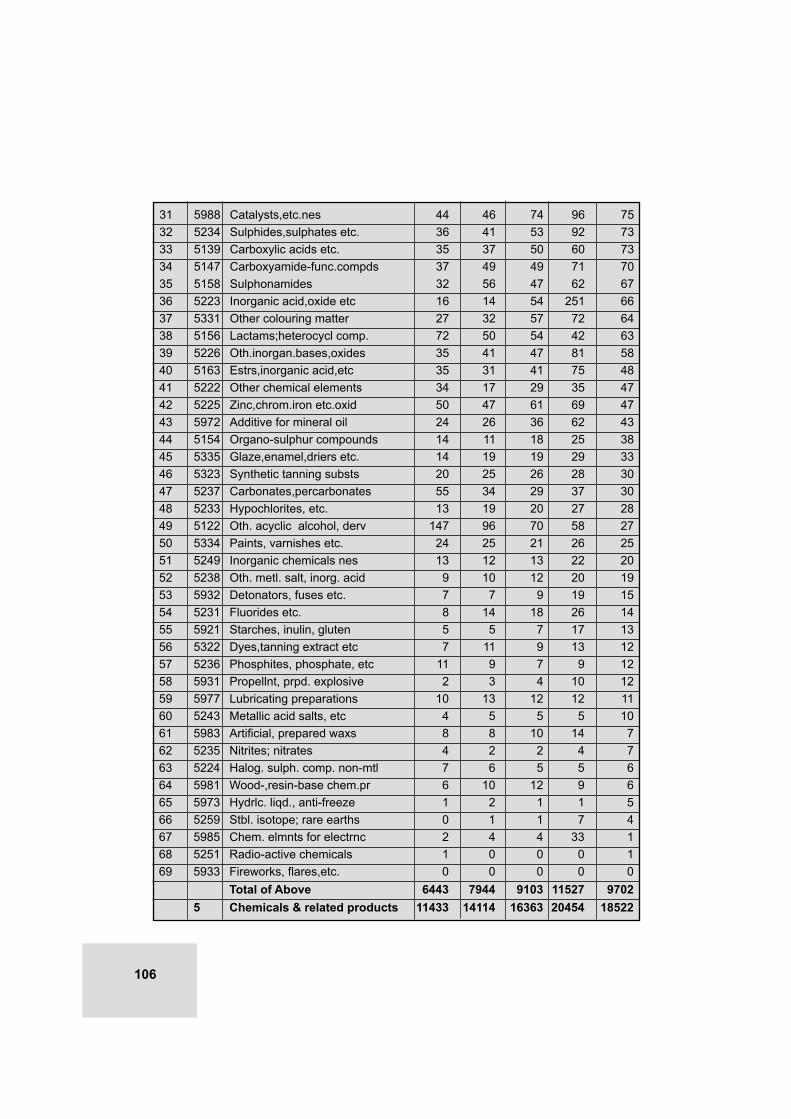
106
31 5988 Catalysts,etc.nes 44 46 74 96 75 32 5234 Sulphides,sulphates etc. 36 41 53 92 73 33 5139 Carboxylic acids etc. 35 37 50 60 73 34 5147 Carboxyamide-func.compds 37 49 49 71 70 35 5158 Sulphonamides 32 56 47 62 67 36 5223 Inorganic acid,oxide etc 16 14 54 251 66 37 5331 Other colouring matter 27 32 57 72 64 38 5156 Lactams;heterocycl comp. 72 50 54 42 63 39 5226 Oth.inorgan.bases,oxides 35 41 47 81 58 40 5163 Estrs,inorganic acid,etc 35 31 41 75 48 41 5222 Other chemical elements 34 17 29 35 47 42 5225 Zinc,chrom.iron etc.oxid 50 47 61 69 47 43 5972 Additive for mineral oil 24 26 36 62 43 44 5154 Organo-sulphur compounds 14 11 18 25 38 45 5335 Glaze,enamel,driers etc. 14 19 19 29 33 46 5323 Synthetic tanning substs 20 25 26 28 30 47 5237 Carbonates,percarbonates 55 34 29 37 30 48 5233 Hypochlorites, etc. 13 19 20 27 28 49 5122 Oth. acyclic alcohol, derv 147 96 70 58 27 50 5334 Paints, varnishes etc. 24 25 21 26 25 51 5249 Inorganic chemicals nes 13 12 13 22 20 52 5238 Oth. metl. salt, inorg. acid 9 10 12 20 19 53 5932 Detonators, fuses etc. 7 7 9 19 15 54 5231 Fluorides etc. 8 14 18 26 14 55 5921 Starches, inulin, gluten 5 5 7 17 13 56 5322 Dyes,tanning extract etc 7 11 9 13 12 57 5236 Phosphites, phosphate, etc 11 9 7 9 12 58 5931 Propellnt, prpd. explosive 2 3 4 10 12 59 5977 Lubricating preparations 10 13 12 12 11 60 5243 Metallic acid salts, etc 4 5 5 5 10 61 5983 Artificial, prepared waxs 8 8 10 14 7 62 5235 Nitrites; nitrates 4 2 2 4 7 63 5224 Halog. sulph. comp. non-mtl 7 6 5 5 6 64 5981 Wood-,resin-base chem.pr 6 10 12 9 6 65 5973 Hydrlc. liqd., anti-freeze 1 2 1 1 5 66 5259 Stbl. isotope; rare earths 0 1 1 7 4 67 5985 Chem. elmnts for electrnc 2 4 4 33 1 68 5251 Radio-active chemicals 1 0 0 0 1 69 5933 Fireworks, flares,etc. 0 0 0 0 0 Total of Above 6443 7944 9103 11527 9702 5 Chemicals & related products 11433 14114 16363 20454 18522

107
S. No. SITC Product Description 2005 2006 2007 2008 2009 Code 1 5223 Inorganic acid,oxide etc 1138 1089 1089 2615 1450 2 5112 Cyclic hydrocarbons 990 913 1300 1232 1054 3 5137 Monocarboxylic acids,drv 349 420 536 713 769 4 5169 Organic chemicals, nes 421 513 548 689 745 5 5226 Oth.inorgan.bases,oxides 628 654 718 979 680 6 5121 Acyclic monohydric alchl 382 338 476 560 594 7 5157 Oth.heterocycl.comp.nucl 220 263 345 542 536 8 5122 Oth.acyclic alcohol,derv 163 189 327 444 532 9 5988 Catalysts,etc.nes 238 282 237 318 508 10 5989 Chem.products etc.nes 240 313 439 547 488 11 5138 Polycarboxylic acids,etc 179 358 274 402 476 12 5148 Oth.nitrogen-func.compds 244 342 384 505 440 13 5162 Aldehyde,etc.fnct.cmpnds 217 226 311 367 346 14 5145 Amine-function compounds 153 190 275 366 334 15 5146 Oxygen-funct.amino-comp. 186 214 254 336 329 16 5124 Phenols,phenol-alch.derv 210 247 350 307 264 17 5113 Halogen.derv.hydrocarbon 276 287 331 358 263 18 5911 Insecticides,retail sale 100 72 20 166 240 19 5331 Other colouring matter 127 141 171 217 237 20 5986 Organic chem.prodcts,nes 133 155 188 251 227 21 5139 Carboxylic acids etc. 96 130 163 185 204 22 5222 Other chemical elements 148 138 181 262 203 23 5237 Carbonates,percarbonates 50 96 114 149 192 24 5111 Acyclic hydrocarbons 119 131 156 203 191 25 5334 Paints,varnishes etc. 99 116 158 204 176 26 5311 Synth.organic dyestuffs 100 119 130 165 169 27 5972 Additive for mineral oil 65 91 93 148 130 28 5154 Organo-sulphur compounds 62 70 74 113 129 29 5156 Lactams;heterocycl comp. 113 110 157 189 127 30 5984 Mixed alkylbenzs.etc.nes 3 25 50 82 121
ANNEXURE 2: INDIA’S IMPORTS OF IDENTIFIED CHEMICAL PRODUCTS FROM THE WORLD- SITC 4-DIGIT LEVEL (US$ MN)

108
31 5161 Ether,alchl peroxide,etc 153 85 97 124 121 32 5977 Lubricating preparations 67 84 99 130 117 33 5922 Albuminoidal substs. etc 59 68 81 107 116 34 5914 Disinfectant,etc.retail 47 37 162 117 104 35 5985 Chem.elmnts for electrnc 35 63 88 149 100 36 5249 Inorganic chemicals nes 69 72 94 140 97 37 5147 Carboxyamide-func.compds 40 46 69 96 83 38 5243 Metallic acid salts, etc 41 80 108 144 81 39 5335 Glaze,enamel,driers etc. 54 72 73 86 78 40 5225 Zinc,chrom.iron etc.oxid 64 73 76 84 77 41 5332 Printing ink 37 53 64 82 77 42 5981 Wood-,resin-base chem.pr 34 54 61 67 74 43 5322 Dyes,tanning extract etc 44 41 51 64 72 44 5163 Estrs,inorganic acid,etc 48 43 51 127 65 45 5155 Othr.organo-inorgan.comp 49 53 52 82 65 46 5221 Carbon nes,carbon black 25 35 67 97 64 47 5913 Herbicides, retail sale 20 42 10 43 61 48 5236 Phosphites,phosphate,etc 20 21 39 78 60 49 5238 Oth.metl.salt,inorg.acid 32 39 43 57 52 50 5234 Sulphides,sulphates etc. 16 21 33 55 42 51 5231 Fluorides etc. 13 18 17 44 38 52 5114 Sulph.etc.derv.hydrocarb 27 28 33 61 37 53 5224 Halog.sulph.comp.non-mtl 10 13 13 38 30 54 5123 Cyclic alcohols,derivats 30 22 36 31 28 55 5158 Sulphonamides 14 21 18 28 27 56 5983 Artificial,prepared waxs 18 21 26 29 27 57 5312 Synth.brighteners,lakes 22 25 26 28 27 58 5232 Chloride,bromide,iodides 11 11 18 21 21 59 5912 Fungicides, retail sale 12 18 2 15 21 60 5233 Hypochlorites, etc. 5 7 11 18 20 61 5323 Synthetic tanning substs 12 16 15 18 13 62 5921 Starches,inulin,gluten 5 8 8 9 12 63 5932 Detonators,fuses etc. 3 3 3 3 8 64 5235 Nitrites; nitrates 5 6 6 13 8 65 5973 Hydrlc.liqd.,anti-freeze 4 6 7 9 8 66 5931 Propellnt,prpd.explosive 3 4 4 4 6 67 5259 Stbl.isotope;rare earths 5 6 5 4 5 68 5933 Fireworks,flares,etc. 0 0 0 1 0 Total of Above 8602 9546 11512 15918 14100 5 Chemicals & related products 13561 16093 20643 34383 27232

109
90. Indian Silk Industry: A Sector Study91. Select COMESA Countries: A Study of India’s Trade and Investment
Potential92. Sri Lanka: A Study of India’s Trade and Investment Potential93. Potential for Export of IT Enabled Services from North Eastern Region
of India94. Potential for Export of Horticulture Products from Bihar and Jharkhand95. Increasing Wage Inequality in Developed Countries: Role of Changing
Trade, Technology and Factor Endowments96. Essays on Trade in Goods and Factor Movements Under Increasing
Returns to Scales97. Export of Organic Products from India: Prospects and Challenges98. Export Potential of Indian Medicinal Plants and Products99. Select Southern African Countries: A Study of India’s Trade and Investment
Potential100. BIMST-EC Initiative: A Study of India’s Trade and Investment Potential
with Select Asian Countries101. Some Aspects of Productivity Growth and Trade in Indian Industry102. Intra-Industry Trade In India’s Manufacturing Sector103. Export Potential of Indian Plantation Sector: Prospects and Challenges104. Fresh Fruits, Vegetables and Dairy Products: India’s Potential For Exports
to Other Asian Countries105. Biotechnology: Emerging Opportunities for India106. ASEAN Countries: A Study of India’s Trade and Investment Potential107. Essays on Globalisation and Wages in Developing Countries108. Select West African Countries: A Study of India’s Trade and Investment
Potential109. Indian Leather Industry: Perspective and Export Potential110. GCC Countries: A Study of India’s Trade and Export Potential111. Indian Petroleum Products Industry : Opportunities and Challenges112. Floriculture : A Sector Study113. Japanese & U.S. Foreign Direct Investments in Indian Manufacturing :
An Analysis114. Maghreb Region: A Study of India’s Trade and Investment Potential115. Strengthening R & D Capabilities in India116. CIS Region: A Study of India’s Trade and Investment Potential117. Indian Chemical Industry: A Sector Study118. Trade and Environment: A Theoretical and Empirical Analysis119. Indian Pharmaceutical Industry : Surging Globally120. Regional Trade Agreements: Gateway to Global Trade
RECENT OCCASIONAL PAPERSOP. No. Title

110
121. Knowledge Process Outsourcing: Emerging Opportunities for India122. Indian Mineral Sector and its Export Potential123. SAARC: An Emerging Trade Bloc124. Indian Capital Goods Industry - A Sector Study125. Financial Liberalization and Its Distributional Consequences126. ECOWAS: A Study of India’s Trade and Investment Potential127. Indian Textile and Clothing Industry in Global Context: Salient Features
and Issues128. Fair Trade : Fair Way of Enhancing Export Value129. Indian Automotive Industry: At The Crossroads130. CARICOM : A Gateway to the America131. IBSA : Enhancing Economic Cooperation Across Continents132. MSMEs and Globalisation: Analysis of Institutional Support System in
India and In Select Countries133. International Trade, Finance and Money: Essays in Uneven
Development134. Sikkim: Export Potential and Prospects135. Mizoram: Export Potential and Prospects136. Floriculture: A Sector Study137. Biotechnology Industry in India: Opportunities for Growth138. Indian Gems and Jewellery: A Sector Study139. SADC: A Study of India’s Trade and Investment Potential140. Innovation, Imitation and North South Trade: Economic Theory and
Policy141. COMESA (Common Market for Eastern and Southern Africa): A Study of India’s Trade and Investment Potential142. Indian Shipping Industry: A Catalyst for Growth143. New Renewable Energy in India: Harnessing the Potential144. Caribbean Community (CARICOM): A Study of India’s Trade and Investment Potential 145. West African Region: A Study of India’s Trade and Investment Potential 146. India’s Trade and Investment Relations with LDCs (Least Developed Countries): Harnessing Synergies147. Indian Electronic Industry : Perspectives and Strategies 148. Export Potential of Indian Plantation Sector: Prospects and Challenges149 Mercosur : A Study of India’s Trade and Investment Potential150. Openness and Growth of the Indian Economy: An Empirical Analysis151. The Commonwealth: Promoting a Shared Vision on Trade and
Investment152. Southern African Development Community (SADC): A Study of India’s Trade & Investment Potential153. Strategic Development of MSMEs: Comparison of Policy Framework and Institutional Support Systems in India and Select Countries

111
EXIM BANK’S MAJOR PROGRAMMES
Bank’s Major Programmes

112
AHMEDABADSakar II, Floor 1 ,Next to Ellisbridge Shopping Centre,Ellisbridge P. O., Ahmedabad 380 006.Phone : (91 79) 26576852/26576843 Fax : (91 79) 26577696E-mail : [email protected]
BANGALORERamanashree Arcade, Floor 4,18, M. G. Road, Bangalore 560 001.Phone: (91 80) 25585755/25589101-04 Fax: (91 80) 25589107E-mail : [email protected]
CHANDIGARHPHD House, Floor 1, Sector 31-A,Dakshin Marg, Chandigarh 160 031Phone : (91 172) 2641910/12/39/49 Fax : (91 172) 2641915E-mail : [email protected]
CHENNAI UTI House, Floor 1, 29, Rajaji Salai, Chennai 600 001.Phone : (91 44) 25224714/25224749 Fax : (91 44) 25224082E-mail : [email protected]
GUWAHATISanmati Plaza, Floor 4, Near Sentinel Building,G. S. Road, Guwahati 781 005.Phone : (91 361) 2462951/6013053 Fax : (91 361) 2462925E-mail : [email protected]
HYDERABADGolden Edifice, Floor 2, 6-3-639/640, Raj Bhavan Road,Khairatabad Circle, Hyderabad 500 004.Phone : (91 40) 23307816-21 Fax : (91 40) 23317843E-mail : [email protected]
KOLKATAVanijya Bhawan, Floor 4, (International Trade Facilitation Centre), 1/1 Wood Street, Kolkata - 700 016.Phone : (91 33) 22833419/22833420 Fax : (91 33) 22891727E-mail : [email protected]
MUMBAIMaker Chambers IV, Floor 8, 222, Nariman Point, Mumbai 400 021.Phone : (91 22) 22823320 / 92 / 94 Fax : (91 22) 22022132E-mail : [email protected]
NEW DELHIGround Floor, Statesman House, 148, Barakhamba Road, New Delhi 110 001.Phone : (91 11) 23474800Fax : (91 11) 23322758/23321719E-mail : [email protected]
PUNE44, Shankarseth Road, Pune 411 037. Phone : (91 20) 26403000 Fax : (91 20) 26458846E-mail : [email protected]
EXPORT-IMPORT BANK OF INDIAHEAD OFFICE
Centre One Building, Floor 21, World Trade Centre Complex, Cuffe Parade, Mumbai 400 005.Phone : (91 22) 22172600 Fax : (91 22) 22182572 E-mail : [email protected]
Website : www.eximbankindia.in
LONDON BRANCH88/90, Temple Chambers, 3-7, Temple Avenue, London EC4Y OHP, United Kingdom.
Phone : (44) 20 73538830 Fax : (44) 20 73538831 E-mail : [email protected]
Indian Offices Overseas Offices
ADDIS ABABA
Bole Kifle KetemaKebele - 19, (03/05), House No. 015-BAddis Ababa, Ethiopia,Phone : (251 116) 630079Fax : (251 116) 610170E-mail : [email protected]
DAKAR
Floor 1, 7, rue Félix Faure,B.P. 50666, Dakar, Senegal Phone : (221 33) 8232849Fax : (221 33) 8232853E-mail : [email protected]
DUBAI
Level 5, Tenancy 1B,Gate Precinct Building No. 3,Dubai International Financial Centre,PO Box No. 506541, Dubai, UAE.Phone : (971 4) 3637462Fax : (971 4) 3637461E-mail : [email protected]
JOHANNESBURG
Floor 2, Sandton City Twin Towers East,Sandhurst Ext. 3, Sandton 2196,Johannesburg, South Africa.Phone : (27 11) 3265103 / 13 Fax: (27 11) 7844511E-mail : [email protected]
SINGAPORE
20, Collyer Quay,# 10-02, Tung Centre,Singapore 049319.Phone : (65) 65326464Fax : (65) 65352131E-mail : [email protected]
WASHINGTON D.C.
1750 Pennsylvania Avenue NW,Suite 1202, Washington D.C. 20006,United States of America.Phone : (1 202) 223 3238Fax : (1 202) 785 8487E-mail : [email protected]