Open Automated Demand Response Communications in Demand Response for Wholesale Ancillary Services
13
LBNL-2945E Open Automated Demand Response Communications in Demand Response for Wholesale Ancillary Services S. Kiliccote, M.A. Piette, G. Ghatikar Lawrence Berkeley National Laboratory E. Koch, D. Hennage Akuacom J. Hernandez, A. Chiu, O. Sezgen Pacific Gas and Electric Company J. Goodin California Independent Systems Operator November 2009 Presented at the Grid-Interop Forum 2009, Denver, CO, November 17-19, 2009 and published in the Proceedings
-
Upload
independent -
Category
Documents
-
view
5 -
download
0
Transcript of Open Automated Demand Response Communications in Demand Response for Wholesale Ancillary Services

LBNL-2945E
Open Automated Demand Response Communications in Demand Response for Wholesale Ancillary Services
S. Kiliccote, M.A. Piette, G. Ghatikar
Lawrence Berkeley National Laboratory
E. Koch, D. Hennage
Akuacom
J. Hernandez, A. Chiu, O. Sezgen
Pacific Gas and Electric Company
J. Goodin
California Independent Systems Operator
November 2009
Presented at the Grid-Interop Forum 2009, Denver, CO, November 17-19, 2009 and published in the Proceedings
DISCLAIMER
This document was prepared as an account of work sponsored by the United States Government. While this document is believed to contain correct information, neither the United States Government nor any agency thereof, nor The Regents of the University of California, nor any of their employees, makes any warranty, express or implied, or assumes any legal responsibility for the accuracy, completeness, or usefulness of any information, apparatus, product, or process disclosed, or represents that its use would not infringe privately owned rights. Reference herein to any specific commercial product, process, or service by its trade name, trademark, manufacturer, or otherwise, does not necessarily constitute or imply its endorsement, recommendation, or favoring by the United States Government or any agency thereof, or The Regents of the University of California. The views and opinions of authors expressed herein do not necessarily state or reflect those of the United States Government or any agency thereof or The Regents of the University of California.
Open Automated Demand Response Communications in Demand Response for
Wholesale Ancillary Services
Sila Kiliccote
Mary Ann Piette
Girish Ghatikar
Lawrence Berkeley
National Laboratory
Ed Koch
Dan Hennage
Akuacom
John Hernandez
Albert Chiu
Osman Sezgen
Pacific Gas and Electric
Company
John Goodin
California
Independent Systems
Operator
1 Cyclotron Rd. 90-3111
Berkeley CA 94720
25 Bellam Blvd. St 215
San Rafael CA 94903
245 Market St.
San Francisco CA 94105
P.O. Box 639014
Folsom, CA 95763
Keywords: demand response, automated demand response,
OpenADR, ancillary services
Abstract
The Pacific Gas and Electric Company (PG&E) is
conducting a pilot program to investigate the technical
feasibility of bidding certain demand response (DR)
resources into the California Independent System Operator’s
(CAISO) day-ahead market for ancillary services non-
spinning reserve. Three facilities, a retail store, a local
government office building, and a bakery, are recruited into
the pilot program. For each facility, hourly demand, and
load curtailment potential are forecasted two days ahead and
submitted to the CAISO the day before the operation as an
available resource. These DR resources are optimized
against all other generation resources in the CAISO
ancillary service. Each facility is equipped with four-second
real time telemetry equipment to ensure resource
accountability and visibility to CAISO operators. When
CAISO requests DR resources, PG&E’s OpenADR (Open
Automated DR) communications infrastructure is utilized to
deliver DR signals to the facilities’ energy management and
control systems (EMCS). The pre-programmed DR
strategies are triggered without a human in the loop. This
paper describes the automated system architecture and the
flow of information to trigger and monitor the performance
of the DR events. We outline the DR strategies at each of
the participating facilities. At one site a real time electric
measurement feedback loop is implemented to assure the
delivery of CAISO dispatched demand reductions. Finally,
we present results from each of the facilities and discuss
findings.
1. INTRODUCTION
The Participating Load Pilots (PLP) were authorized by the
California Public Utilities Commission (CPUC) as a first
step towards allowing DR programs to participate in the
CAISO markets as Participating Loads (PL). The objective
of these pilots was to assess the technical and financial
feasibility of using retail loads for PL. Various retail load
classes and technologies participated in the pilots. The key
requirements under the PLP is that the PL resources have to
meet the non-spinning reserve requirements, which means
the resources have to deliver energy within 10 minutes, be
available for two hours, and provide real-time telemetry to
the CAISO. All three investor-owned utilities in California
conducted PLPs with various customer segments. Southern
California Edison utilized small aggregated loads,
leveraging real-time telemetry at the feeder with two-way
communicating switches and air conditioning loads. This
was an extension of the prior work done on spinning reserve
demonstration [1] [2]. San Diego Gas and Electric Company
worked with aggregators with small commercial and
industrial customers. CPUC allowed a portion of the PL to
be dispatched manually, granted it still met the dispatch
criteria.
The PG&E’s pilot program investigates the technical
feasibility of bidding large commercial and industrial DR
resources into the CAISO's day-ahead market for ancillary
services non-spinning reserve. Ancillary services are
support services in the power system and are essential in
maintaining power quality, reliability and security. Non-
spinning reserve is the extra generating capacity that is not
currently connected to the power system but can be brought
online after a short delay. Participating load resources
provide demand that can be curtailed at the direction of the

CAISO in the real-time dispatch of the CAISO controlled
grid. Participating load program relies on a simple price-
sensitive demand curve submitted in the day-ahead market,
and an accompanying pseudo-generator supply curve for use
in the Real-Time Market that represents the demand
response resource’s real-time energy dispatch capability [3].
PG&E’s additional goals for the pilot is to identify and
investigate potential barriers such as forecasting load and
demand reduction, bidding and settlements, locational
resource management and testing telemetry technologies.
This research is significant because three individual sites
that participated in price-responsive automated DR (Auto-
DR) programs, such as critical peak pricing and demand
bidding programs, utilized the same technologies, DR
strategies and infrastructures, and with no additional costs to
each facility, participated successfully in the wholesale non-
spinning ancillary services. While there is a clearly defined
application and certification process that outlines the
agreements as well as PL implementation plan approval,
metering and telemetry requirements and ancillary service
testing, this paper concentrates on the operational process
with additional interoperability details.
The project team includes PG&E, Itron, Akuacom, Metrum
Technologies, Bow Networks, Lawrence Berkeley National
Laboratory (LBNL) and the CAISO. LBNL developed a set
of site selection criteria. Responsibilities of the team
members are:
• PG&E – Project management
• LBNL – Pre- and post- event analysis, recruitment
of sites, evaluation of building controls issues and
DR control strategies
• ITRON – Forecasting of loads and load reductions
• Metrum Technologies – Four-second telemetry
technology provider
• Bow Networks – Four-second telemetry
communications provider
• Akuacom – Automation of PLP dispatch signals,
conversion from ADS specific format to OpenADR
• CAISO - Dispatch of PLP event signals.
This paper is organized as follows. The next section
describes the PLP system architecture. This is followed by
the Methodology section, in which we describe the site
selection criteria, development of forecasts, data and data
collection methods as well as the DR strategies at each
facility that participated in the pilot. In the Results section
we present a comparison of forecasts with actual loads, the
findings from test and actual events as well as the cost for
telemetry and enablement. Finally in the Discussion and
Conclusion section, we point out issues that had come up
during the pilot, resolution of these issues and identify next
steps.
2. PARTICIPATING LOAD PILOT (PLP)
ARCHITECTURE
In the Day-Ahead Market, PG&E submits two bids through
the CAISO’s Scheduling Infrastructure Business Rules
(SIBR) web-based user interface for each of the PL: a load
bid (an offer to buy or self-schedule demand) and a
generating (pseudo generating resource) bid (an offer to sell
demand reductions). Load bid consists of hourly loads of the
resource. Pseudo generating bid represents the demand
reduction portion of the non-spinning reserve provided by
the PL. Both Load and Pseudo Generating bids are hourly
bids generated by PG&E by averaging 5-minute forecasts
submitted by Itron’s MetrixIDR™1. Any operational
changes within the facilities are communicated to PG&E
either directly by the facility operator or through LBNL
1 Metrix IDR is a load forecasting software tool.
Figure 1 Load and pseudo generation schedule submission process

before 5 am one day before the trading day. Between 5 am
and 9 am, there is a second window of opportunity for the
facilities to announce changes to their bids. Bids and prices
are submitted to CAISO by 9 am. The day-ahead market
closes at 10 am one day before the trading day. The CAISO
publishes schedules and award results no earlier than 1 pm
on the same day. Figure 1 outlines the pre-analysis process
flow starting two days prior to the operation date for each
day. The real-time market closes 75 minutes before the trade
hour and the PL resources are settled based on 5 minute
dispatches that are based on the PL’s day-ahead schedule. A
typical settlement time for PL resources takes 38 to 56 days
after the resource request date. At the time this paper was
written no settlements were completed for the PLP
dispatches. Therefore, in this paper, no site specific earnings
or losses are reported for the facilities that participated in
the PLP.
Three facilities, a retail store (IKEA), a local government
office building (Contra Costa County) and a bakery
(Svenhard’s Swedish Bakery) participated in Auto-DR
programs with PG&E in previous years, were recruited into
the pilot program [4]. CAISO’s Automated Dispatch System
(ADS) linked the ISO operators dispatching DR resources to
DRAS. When CAISO dispatched awards for the participants
(Figure 2, ) PG&E’s OpenADR (Open Automated DR)
messaging infrastructure was utilized (Figure 2, ) to
deliver DR signals to the facilities’ energy management and
control systems (Piette et al. 2009). This is the same
infrastructure that is currently being used for PG&E’s price-
based Auto-DR programs such as Automated Critical Peak
Pricing and Demand Bidding programs. Pre-programmed
DR strategies were triggered without a human in the loop at
each facility utilizing the Client Logic with Integrated Relay
(CLIR) box2. This device communicates price and reliability
signals with facility EMCS by mapping DR program
information to dry contact relay closures. On the metering
side, dual meter socket installations allowed the facilities to
keep their revenue meter (RM) and facilitated the
installation of another meter with a Code Division Multiple
Access (CDMA) chip provided by Metrum Technologies to
transfer four-second electric load data for this pilot (Figure
2, ). CDMA technology transmits radio signals over a
cellular-based wireless network. This four-second telemetry
infrastructure was installed at each of the participating
facilities and data were communicated by Bow Networks to
CAISO (Figure 2, ), PG&E (Figure 2, ) and Akuacom
(Figure 2, ).
CAISO uses the telemetry data to have visibility to the
operating reserves on the grid and to ensure that it is
meeting its minimum operating reliability criteria at all
2 Technical guide is available at
http://drrc.lbl.gov/pubs/CLIR-UserGuide_6-R3.pdf
times. PG&E stored these data in a secure shared folder for
access by the team. Itron used the data for the load and shed
forecasting. Akuacom used the four-second data for real-
time feedback to dispatch various pre-programmed control
strategies at the government office building to sustain the
shed amount dispatched by the CAISO. Figure 2 displays
the architecture of the participating load pilot. The dashed
arrows represent meter data communications, while solid
arrows represent communication of the resource request
parameters. In Figure 2, the entities to the right grouped
with dashed lines are involved in pre- and post-analysis.
Others to the left, including PG&E, are involved in the
actual resource request and/or delivery.
Interoperability among all the entities was a major challenge
for this project. At the center, DRAS had to establish
communication with all the entities. This was done in the
form of using XML (eXtensible Mark-up Language)
document. Security was also an important component. All
the communication between the DRAS and other
components of the system were secured using Secure
Sockets Layer (SSL) technology. SLL provided both
authentication and encryption. The CAISO automated
dispatch system (ADS) and Bow Networks communications
were mutually authenticated using SSL. In the case of ADS
where the DRAS was a client, the CAISO supplied
Akuacom with a client certificate as well as a root certificate
for their server. For Bow Networks and for the DRAS
clients, the DRAS was the server and the Akuacom server
certificate was available via a well known Certificate
Authority (CA). Akuacom provided Bow Networks with a
client certificate issued by a well known CA. The DRAS
clients used HTTP basic authentication.
Figure 2 Participating load pilot system architecture
3. METHODOLOGY
LBNL worked with PG&E to develop pre- and post analysis
methods as well as electrical data sharing methods for this
pilot. Pre-analysis methods include development of site
selection criteria, analysis of loads for sites in the AutoDR
[5] programs as compared to the criteria, DR shed strategies
as well as forecasting loads for recruited facilities.
Forecasting of individual building loads were done by
MetrixIDR™ and is out of the scope for this paper. Post-
analysis methods include the development of ramp time and
shed calculations methods as well as evaluation of accuracy
of forecasts. Finally, timely and secure communication and
data sharing by all the team members is a major
undertaking. However, this discussion is not included in this
paper.
3. 1. Site Selection
Sites that participated in PG&E’s AutoDR programs in
previous years were considered for this pilot. Selection
criteria were as follows:
• Low load variability – enhances load forecasting
accuracy
• Ability to deliver resource in 10 minutes –
preferably a site with both fast (lighting) and slow
(Heating Ventilation Air Conditioning) response
• Low shed variability – enhances shed forecasting
accuracy
• Minimum of 10 kW of load shed
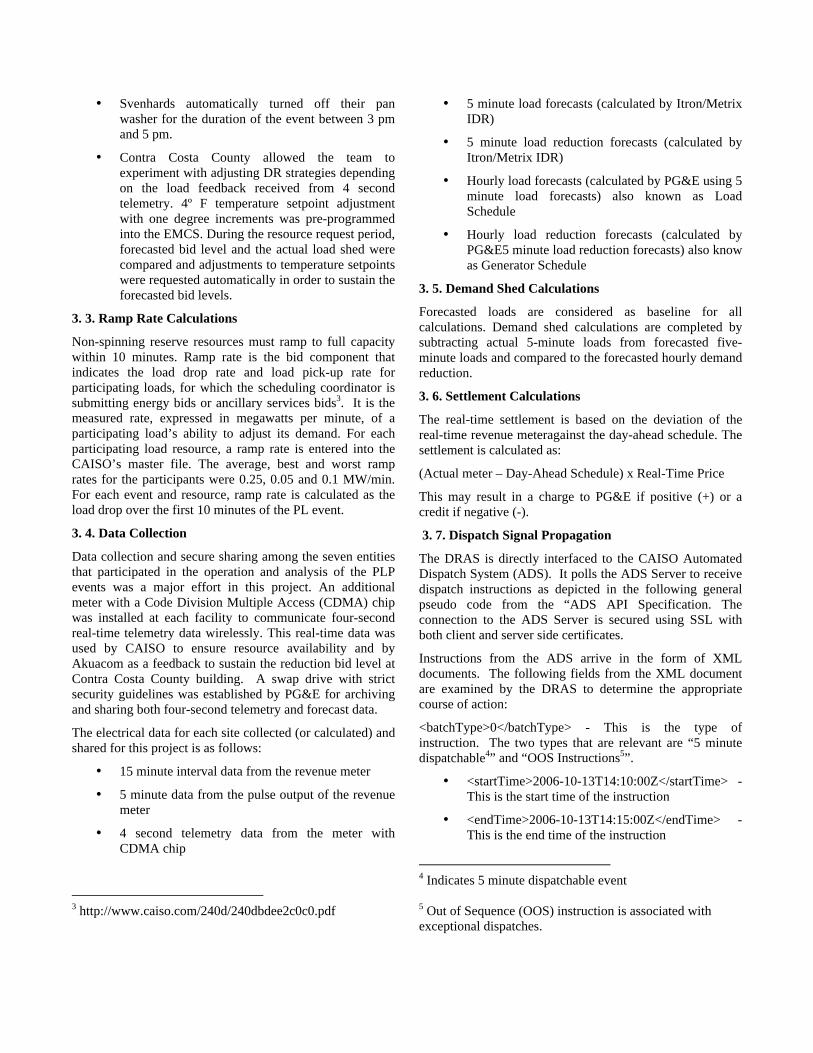
Historical electrical 15-minute interval meter data is
available for all the AutoDR sites. Due to the low resolution
of the meter data, it was difficult to determine the response
time of the sites. However we grouped the sites that yielded
the initial shed within the first 15 minutes and those that
yielded additional shed within the second 15 minute period.
If a site continued to shed after the first 15 minutes, we
considered these sites as having “slower” response.
All sites met the minimum demand shed requirement. Only
three of the sites in Auto-DR consistently shed lighting
loads. However, these sites are recently equipped with solar
panels. Therefore their load shape and load variability
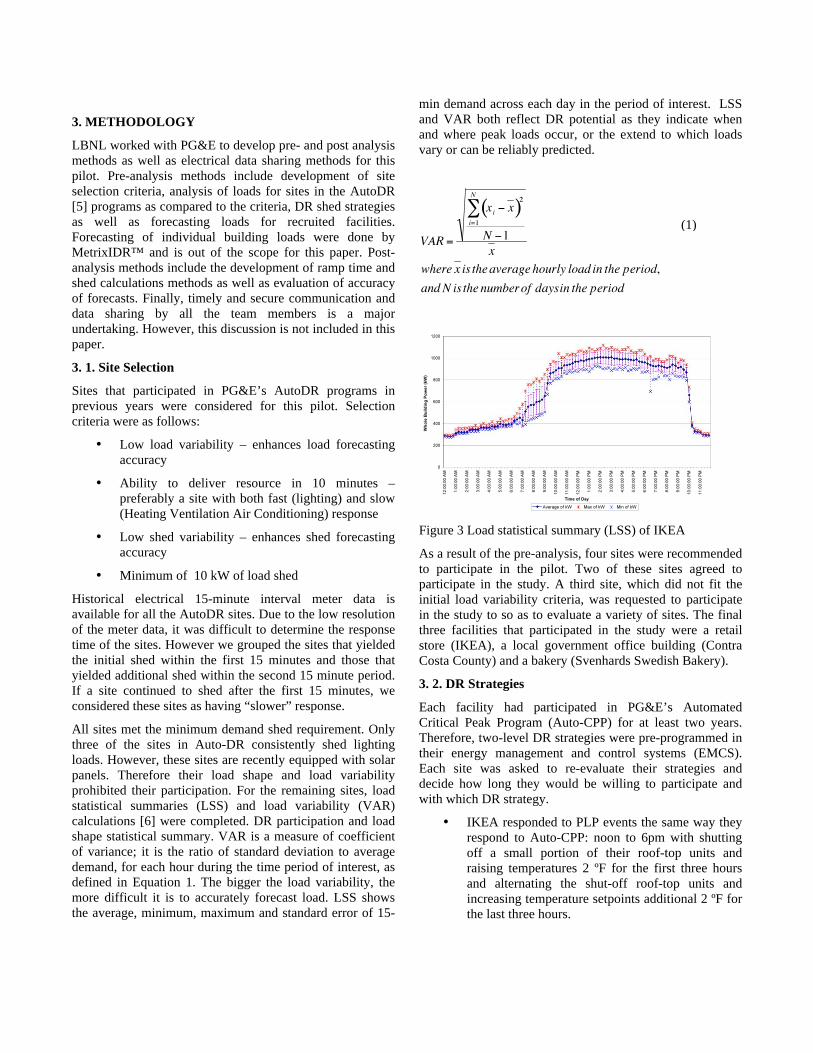
prohibited their participation. For the remaining sites, load
statistical summaries (LSS) and load variability (VAR)
calculations [6] were completed. DR participation and load
shape statistical summary. VAR is a measure of coefficient
of variance; it is the ratio of standard deviation to average
demand, for each hour during the time period of interest, as
defined in Equation 1. The bigger the load variability, the
more difficult it is to accurately forecast load. LSS shows
the average, minimum, maximum and standard error of 15-
min demand across each day in the period of interest. LSS
and VAR both reflect DR potential as they indicate when
and where peak loads occur, or the extend to which loads
vary or can be reliably predicted.
Figure 3 Load statistical summary (LSS) of IKEA
As a result of the pre-analysis, four sites were recommended
to participate in the pilot. Two of these sites agreed to
participate in the study. A third site, which did not fit the
initial load variability criteria, was requested to participate
in the study to so as to evaluate a variety of sites. The final
three facilities that participated in the study were a retail
store (IKEA), a local government office building (Contra
Costa County) and a bakery (Svenhards Swedish Bakery).
3. 2. DR Strategies
Each facility had participated in PG&E’s Automated
Critical Peak Program (Auto-CPP) for at least two years.
Therefore, two-level DR strategies were pre-programmed in
their energy management and control systems (EMCS).
Each site was asked to re-evaluate their strategies and
decide how long they would be willing to participate and
with which DR strategy.
• IKEA responded to PLP events the same way they
respond to Auto-CPP: noon to 6pm with shutting
off a small portion of their roof-top units and
raising temperatures 2 ºF for the first three hours
and alternating the shut-off roof-top units and
increasing temperature setpoints additional 2 ºF for
the last three hours.
(1)
• Svenhards automatically turned off their pan
washer for the duration of the event between 3 pm
and 5 pm.
• Contra Costa County allowed the team to
experiment with adjusting DR strategies depending
on the load feedback received from 4 second
telemetry. 4º F temperature setpoint adjustment
with one degree increments was pre-programmed
into the EMCS. During the resource request period,
forecasted bid level and the actual load shed were
compared and adjustments to temperature setpoints
were requested automatically in order to sustain the
forecasted bid levels.
3. 3. Ramp Rate Calculations
Non-spinning reserve resources must ramp to full capacity
within 10 minutes. Ramp rate is the bid component that
indicates the load drop rate and load pick-up rate for
participating loads, for which the scheduling coordinator is
submitting energy bids or ancillary services bids3. It is the
measured rate, expressed in megawatts per minute, of a
participating load’s ability to adjust its demand. For each
participating load resource, a ramp rate is entered into the
CAISO’s master file. The average, best and worst ramp
rates for the participants were 0.25, 0.05 and 0.1 MW/min.
For each event and resource, ramp rate is calculated as the
load drop over the first 10 minutes of the PL event.
3. 4. Data Collection
Data collection and secure sharing among the seven entities
that participated in the operation and analysis of the PLP
events was a major effort in this project. An additional
meter with a Code Division Multiple Access (CDMA) chip
was installed at each facility to communicate four-second
real-time telemetry data wirelessly. This real-time data was
used by CAISO to ensure resource availability and by
Akuacom as a feedback to sustain the reduction bid level at
Contra Costa County building. A swap drive with strict
security guidelines was established by PG&E for archiving
and sharing both four-second telemetry and forecast data.
The electrical data for each site collected (or calculated) and
shared for this project is as follows:
• 15 minute interval data from the revenue meter
• 5 minute data from the pulse output of the revenue
meter
• 4 second telemetry data from the meter with
CDMA chip
3 http://www.caiso.com/240d/240dbdee2c0c0.pdf
• 5 minute load forecasts (calculated by Itron/Metrix
IDR)
• 5 minute load reduction forecasts (calculated by
Itron/Metrix IDR)
• Hourly load forecasts (calculated by PG&E using 5
minute load forecasts) also known as Load
Schedule
• Hourly load reduction forecasts (calculated by
PG&E5 minute load reduction forecasts) also know
as Generator Schedule
3. 5. Demand Shed Calculations
Forecasted loads are considered as baseline for all
calculations. Demand shed calculations are completed by
subtracting actual 5-minute loads from forecasted five-
minute loads and compared to the forecasted hourly demand
reduction.
3. 6. Settlement Calculations
The real-time settlement is based on the deviation of the
real-time revenue meteragainst the day-ahead schedule. The
settlement is calculated as:
(Actual meter – Day-Ahead Schedule) x Real-Time Price
This may result in a charge to PG&E if positive (+) or a
credit if negative (-).
3. 7. Dispatch Signal Propagation
The DRAS is directly interfaced to the CAISO Automated
Dispatch System (ADS). It polls the ADS Server to receive
dispatch instructions as depicted in the following general
pseudo code from the “ADS API Specification. The
connection to the ADS Server is secured using SSL with
both client and server side certificates.
Instructions from the ADS arrive in the form of XML
documents. The following fields from the XML document
are examined by the DRAS to determine the appropriate
course of action:
<batchType>0</batchType> - This is the type of
instruction. The two types that are relevant are “5 minute
dispatchable4” and “OOS Instructions5”.
• <startTime>2006-10-13T14:10:00Z</startTime> -
This is the start time of the instruction
• <endTime>2006-10-13T14:15:00Z</endTime> -
This is the end time of the instruction
4 Indicates 5 minute dispatchable event
5 Out of Sequence (OOS) instruction is associated with
exceptional dispatches.

• <dot>12.0</dot> - This is the level in MW that the
resource is being instructed to go to.
When a valid instruction is received an OpenADR event is
created that has the same start time and end time as that in
the instruction. Note that for 5 minute dispatchable
instructions, an end time is not explicitly given and it is
assumed to be 5 minutes after the start time. The
notification time for DR event is the same as the start time
and the event is immediately published to all the DRAS
Clients so they can achieve their instructed levels within the
required 10 minute ramp period.
Figure 4 display the Auto-CPP mapping on OpenADR
specification. Issue Time is either day ahead of two hours
before the DR event time on the day of the Auto-CPP event.
The implicated Ramp Time is either before or at the Start
Time and is determined by the facility operator. During the
Active Period, DR event contains simple price levels
(NORMAL, MODERATE or HIGH).
Figure 4 PLP event mapping on OpenADR specification
Figure 5 displays the PLP Event mapping on OpenADR
messaging model. In this application, Issue Time field and
PENDING signal is not being utilized. The implicated
Ramp Time is within the PLP Event Active period. The DR
event also contains a simple price level (NORMAL,
MODERATE, or HIGH). In addition the DR event also
contains an enumerated load level (0-3) that is used for
doing closed-loop monitoring.
For Contra Costa County Building, which is using closed
loop monitoring, if the facility is not achieving its instructed
level then a higher shed level is sent to that facility.
Likewise if the facility is shedding more than the instructed
level, a lower shed level may be sent.
4. RESULTS
By the time this paper was written, a total of eight PLP
events were dispatched. The first event in July was a test
event and was dispatched to ensure that the automation
worked and that sample messages from CAISO’s ADS were
received and processed. All the buildings were “live” in the
wholesale market on the CAISO’s production systems on
July 29, 2009. The remaining PLP events were actual
dispatches called by the CAISO’s ADS. Table 2 shows the
dates of each event and the duration of participation for each
facility. Some of the dispatched events did not meet the
initial PLP rules such as one event per day and minimum
event duration of one hour.
Table 1 PLP events and duration of participation for
each facility
For each of the sites, a representative event is selected and
presented in this paper. For each event, the load shape is
presented in two ways: 1) Actual 5 minute electrical load
data is displayed with the hourly load forecast for the event
day, and 2) The difference between the actual 5 minute
electrical load data and the forecasted 5 minute load data
with the hourly forecasted bids. The first graphic
representation shows how the actual load profile follows the
hourly bids averaged and submitted by PG&E. The second
representation shows a comparison of actual versus
forecasted 5 minute load data and how the sheds compare to
the difference between forecasted and actual data. A table
Figure 5 Automated critical peak pricing (Auto-CPP)
mapping on OpenADR specification
that summarizes the ramp time and average load shed is also
presented for each facility.
4.1. Contra Costa County Office Building
Load variability and weather sensitivity calculations
indicate that this is a highly weather sensitive building with
low hourly load variability. As a result, LBNL
recommended the use of outside air temperature data in
forecasting algorithms. While this site participated in all
PLP events that were dispatched by the CAISO for this
resource, the test on September 21st was the only one where
the PLP event was long enough to test the feedback
algorithm for this facility. Figure 6 displays the actual 5
minute load data with the hourly forecasts. The PLP event
was dispatched between 2 pm and 6 pm. The DR strategy
for this facility is programmed such that four load levels are
mapped onto four 1ºF incremental temperature adjustment
strategies. At the PLP event start, a 2ºF adjustment is
dispatched. The 4-second data is used to monitor the
performance of the strategy and evaluate if it meets the bid
requirements. If the initial strategy did not meet the bid
requirements, than the strategy is adjusted by the DRAS by
sending another load level information that adjusts the
temperature setpoints up or down within the initial
parameters set and programmed by the participant. On
September 21, the initial adjustment for the first hour
exceeded the bid. This is partly because there was a problem
with the algorithm and instead of calling for the strategy
with 2 ºF, the system called for 4 ºF strategy that was
carried out for 1 minute before it was adjusted. Part of
reason why the shed is so deep is because of the nature of
response by the heating, ventilation and air conditioning
(HVAC) systems. When initial adjustments are made, the
fans go to their minimum setting and the chillers unload
resulting in transient savings resulting in high ramp rate.
Therefore, the bids for the first hour for this facility have to
be increased to match the response.
Figure 6 Contra Costa County hourly load forecasts and
actual load data on September 21, 2009
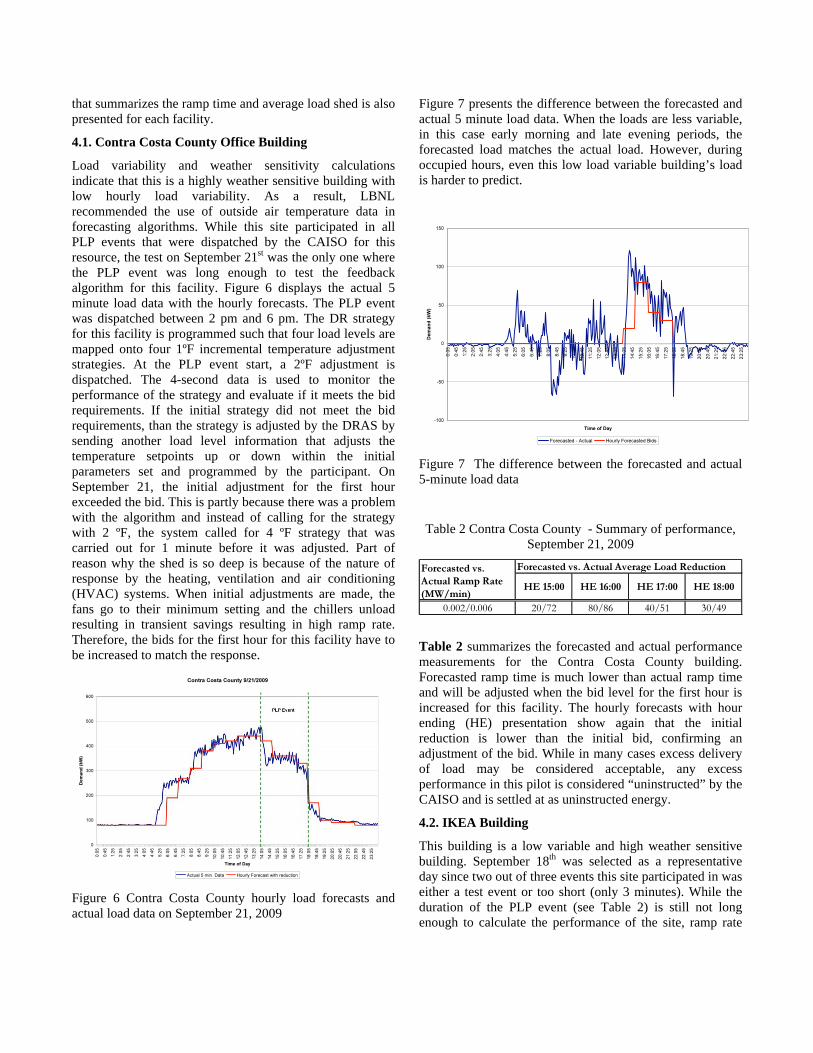
Figure 7 presents the difference between the forecasted and
actual 5 minute load data. When the loads are less variable,
in this case early morning and late evening periods, the
forecasted load matches the actual load. However, during
occupied hours, even this low load variable building’s load
is harder to predict.
Figure 7 The difference between the forecasted and actual
5-minute load data
Table 2 Contra Costa County - Summary of performance,
September 21, 2009
Table 2 summarizes the forecasted and actual performance
measurements for the Contra Costa County building.
Forecasted ramp time is much lower than actual ramp time
and will be adjusted when the bid level for the first hour is
increased for this facility. The hourly forecasts with hour
ending (HE) presentation show again that the initial
reduction is lower than the initial bid, confirming an
adjustment of the bid. While in many cases excess delivery
of load may be considered acceptable, any excess
performance in this pilot is considered “uninstructed” by the
CAISO and is settled at as uninstructed energy.
4.2. IKEA Building
This building is a low variable and high weather sensitive
building. September 18th was selected as a representative
day since two out of three events this site participated in was
either a test event or too short (only 3 minutes). While the
duration of the PLP event (see Table 2) is still not long
enough to calculate the performance of the site, ramp rate

calculations were completed using the 4 second telemetry
data. Also, the 5-minute load data obtained from this site’s
meter indicates low resolution readings which complicates
the forecasted and actual load comparison for the event
period (Figure 8).
Figure 8 Actual and forecasted load shape for IKEA on
September 18, 2009
The forecasted load data for this site on this date (Figure 9)
is higher especially before store opening and after store
closing suggesting there may be change in the store hours or
operations during these periods that is not considered in the
forecasting algorithm.
Figure 9 The difference between forecasted and actual loads
on September 18, 2009
The actual ramp rate for this PLP event is ten times higher
than the forecasted ramp rate and the average load shed is
less than half of the forecasted reduction (Table 3). One PLP
event does not provide enough data to evaluate the
performance of this site. Poor resolution of the electric load
data is also complicates the analysis.
Table 3 IKEA's summary of performance on September 18,
2009
4.3. Svenhards Facility
Svenhards was not one of the facilities that was initially
recommended by LBNL for this study since this facility has
high load variability and low weather sensitivity indicating
that the loads are dominated by the process loads.
September 18th is selected as a representative date for this
site since the rest of the events were test events, their
duration was short, or the pan washer was not operational at
the time the event was dispatched. Due to the high
variability of the loads, the actual loads do not closely
follow the forecasted hourly loads for the event date (Figure
10) and the difference between the forecasted loads and
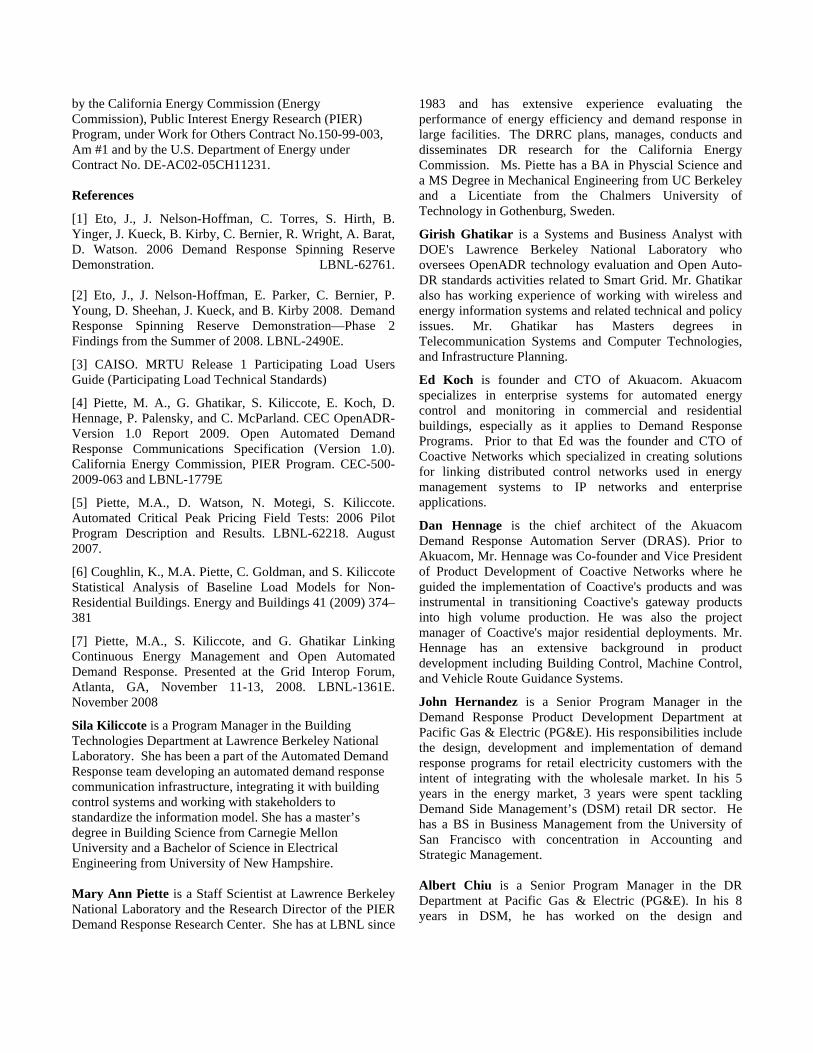
actual loads vary as much as the actual bid (Figure 11).
Figure 10 Svenhard's actual load and forecasted hourly load
on September 18, 2009
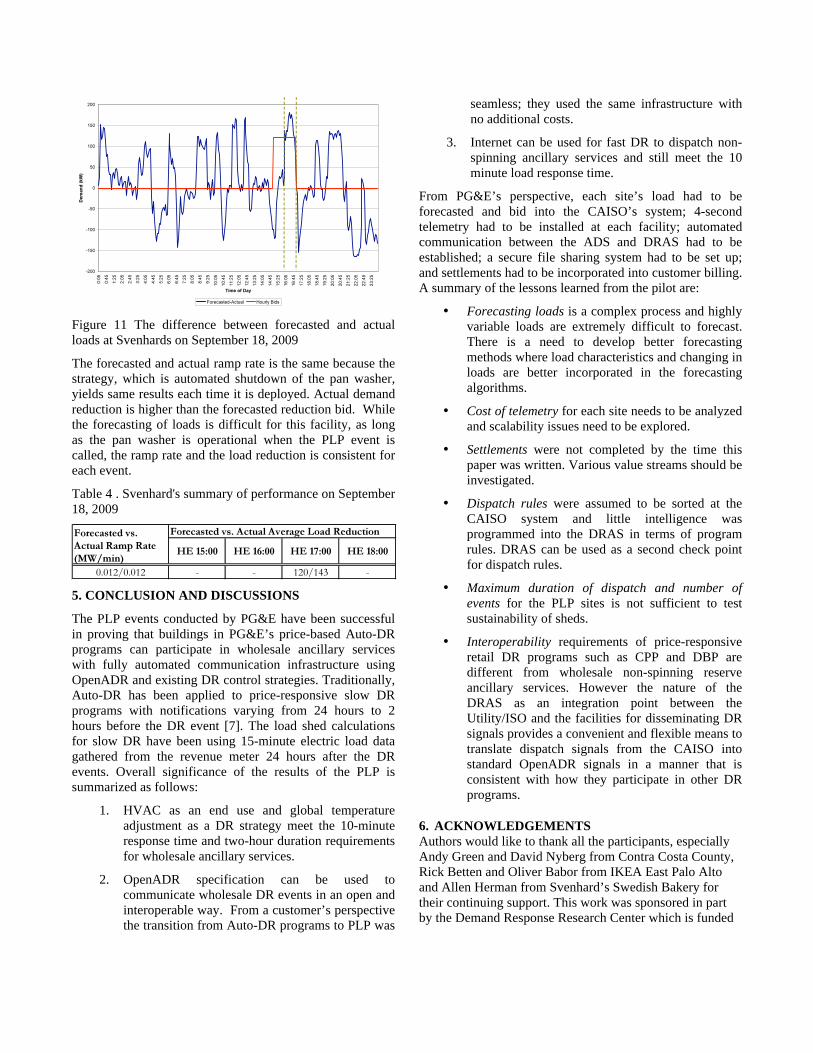
Figure 11 The difference between forecasted and actual
loads at Svenhards on September 18, 2009
The forecasted and actual ramp rate is the same because the
strategy, which is automated shutdown of the pan washer,
yields same results each time it is deployed. Actual demand
reduction is higher than the forecasted reduction bid. While
the forecasting of loads is difficult for this facility, as long
as the pan washer is operational when the PLP event is
called, the ramp rate and the load reduction is consistent for
each event.
Table 4 . Svenhard's summary of performance on September
18, 2009
5. CONCLUSION AND DISCUSSIONS
The PLP events conducted by PG&E have been successful
in proving that buildings in PG&E’s price-based Auto-DR
programs can participate in wholesale ancillary services
with fully automated communication infrastructure using
OpenADR and existing DR control strategies. Traditionally,
Auto-DR has been applied to price-responsive slow DR
programs with notifications varying from 24 hours to 2
hours before the DR event [7]. The load shed calculations
for slow DR have been using 15-minute electric load data
gathered from the revenue meter 24 hours after the DR
events. Overall significance of the results of the PLP is
summarized as follows:
1. HVAC as an end use and global temperature
adjustment as a DR strategy meet the 10-minute
response time and two-hour duration requirements
for wholesale ancillary services.
2. OpenADR specification can be used to
communicate wholesale DR events in an open and
interoperable way. From a customer’s perspective
the transition from Auto-DR programs to PLP was
seamless; they used the same infrastructure with
no additional costs.
3. Internet can be used for fast DR to dispatch non-
spinning ancillary services and still meet the 10
minute load response time.
From PG&E’s perspective, each site’s load had to be
forecasted and bid into the CAISO’s system; 4-second
telemetry had to be installed at each facility; automated
communication between the ADS and DRAS had to be
established; a secure file sharing system had to be set up;
and settlements had to be incorporated into customer billing.
A summary of the lessons learned from the pilot are:
• Forecasting loads is a complex process and highly
variable loads are extremely difficult to forecast.
There is a need to develop better forecasting
methods where load characteristics and changing in
loads are better incorporated in the forecasting
algorithms.
• Cost of telemetry for each site needs to be analyzed
and scalability issues need to be explored.
• Settlements were not completed by the time this
paper was written. Various value streams should be
investigated.
• Dispatch rules were assumed to be sorted at the
CAISO system and little intelligence was
programmed into the DRAS in terms of program
rules. DRAS can be used as a second check point
for dispatch rules.
• Maximum duration of dispatch and number of
events for the PLP sites is not sufficient to test
sustainability of sheds.
• Interoperability requirements of price-responsive
retail DR programs such as CPP and DBP are
different from wholesale non-spinning reserve
ancillary services. However the nature of the
DRAS as an integration point between the
Utility/ISO and the facilities for disseminating DR
signals provides a convenient and flexible means to
translate dispatch signals from the CAISO into
standard OpenADR signals in a manner that is
consistent with how they participate in other DR
programs.
6. ACKNOWLEDGEMENTS
Authors would like to thank all the participants, especially
Andy Green and David Nyberg from Contra Costa County,
Rick Betten and Oliver Babor from IKEA East Palo Alto
and Allen Herman from Svenhard’s Swedish Bakery for
their continuing support. This work was sponsored in part
by the Demand Response Research Center which is funded
by the California Energy Commission (Energy
Commission), Public Interest Energy Research (PIER)
Program, under Work for Others Contract No.150-99-003,
Am #1 and by the U.S. Department of Energy under
Contract No. DE-AC02-05CH11231.
References
[1] Eto, J., J. Nelson-Hoffman, C. Torres, S. Hirth, B.
Yinger, J. Kueck, B. Kirby, C. Bernier, R. Wright, A. Barat,
D. Watson. 2006 Demand Response Spinning Reserve
Demonstration. LBNL-62761.
[2] Eto, J., J. Nelson-Hoffman, E. Parker, C. Bernier, P.
Young, D. Sheehan, J. Kueck, and B. Kirby 2008. Demand
Response Spinning Reserve Demonstration—Phase 2
Findings from the Summer of 2008. LBNL-2490E.
[3] CAISO. MRTU Release 1 Participating Load Users
Guide (Participating Load Technical Standards)
[4] Piette, M. A., G. Ghatikar, S. Kiliccote, E. Koch, D.
Hennage, P. Palensky, and C. McParland. CEC OpenADR-
Version 1.0 Report 2009. Open Automated Demand
Response Communications Specification (Version 1.0).
California Energy Commission, PIER Program. CEC-500-
2009-063 and LBNL-1779E
[5] Piette, M.A., D. Watson, N. Motegi, S. Kiliccote.
Automated Critical Peak Pricing Field Tests: 2006 Pilot
Program Description and Results. LBNL-62218. August
2007.
[6] Coughlin, K., M.A. Piette, C. Goldman, and S. Kiliccote
Statistical Analysis of Baseline Load Models for Non-
Residential Buildings. Energy and Buildings 41 (2009) 374–
381
[7] Piette, M.A., S. Kiliccote, and G. Ghatikar Linking
Continuous Energy Management and Open Automated
Demand Response. Presented at the Grid Interop Forum,
Atlanta, GA, November 11-13, 2008. LBNL-1361E.
November 2008
Sila Kiliccote is a Program Manager in the Building
Technologies Department at Lawrence Berkeley National
Laboratory. She has been a part of the Automated Demand
Response team developing an automated demand response
communication infrastructure, integrating it with building
control systems and working with stakeholders to
standardize the information model. She has a master’s
degree in Building Science from Carnegie Mellon
University and a Bachelor of Science in Electrical
Engineering from University of New Hampshire.
Mary Ann Piette is a Staff Scientist at Lawrence Berkeley
National Laboratory and the Research Director of the PIER
Demand Response Research Center. She has at LBNL since
1983 and has extensive experience evaluating the
performance of energy efficiency and demand response in
large facilities. The DRRC plans, manages, conducts and
disseminates DR research for the California Energy
Commission. Ms. Piette has a BA in Physcial Science and
a MS Degree in Mechanical Engineering from UC Berkeley
and a Licentiate from the Chalmers University of
Technology in Gothenburg, Sweden.
Girish Ghatikar is a Systems and Business Analyst with
DOE's Lawrence Berkeley National Laboratory who
oversees OpenADR technology evaluation and Open Auto-
DR standards activities related to Smart Grid. Mr. Ghatikar
also has working experience of working with wireless and
energy information systems and related technical and policy
issues. Mr. Ghatikar has Masters degrees in
Telecommunication Systems and Computer Technologies,
and Infrastructure Planning.
Ed Koch is founder and CTO of Akuacom. Akuacom
specializes in enterprise systems for automated energy
control and monitoring in commercial and residential
buildings, especially as it applies to Demand Response
Programs. Prior to that Ed was the founder and CTO of
Coactive Networks which specialized in creating solutions
for linking distributed control networks used in energy
management systems to IP networks and enterprise
applications.
Dan Hennage is the chief architect of the Akuacom
Demand Response Automation Server (DRAS). Prior to
Akuacom, Mr. Hennage was Co-founder and Vice President
of Product Development of Coactive Networks where he
guided the implementation of Coactive's products and was
instrumental in transitioning Coactive's gateway products
into high volume production. He was also the project
manager of Coactive's major residential deployments. Mr.
Hennage has an extensive background in product
development including Building Control, Machine Control,
and Vehicle Route Guidance Systems.
John Hernandez is a Senior Program Manager in the
Demand Response Product Development Department at
Pacific Gas & Electric (PG&E). His responsibilities include
the design, development and implementation of demand
response programs for retail electricity customers with the
intent of integrating with the wholesale market. In his 5
years in the energy market, 3 years were spent tackling
Demand Side Management’s (DSM) retail DR sector. He
has a BS in Business Management from the University of
San Francisco with concentration in Accounting and
Strategic Management.
Albert Chiu is a Senior Program Manager in the DR
Department at Pacific Gas & Electric (PG&E). In his 8
years in DSM, he has worked on the design and
implementation of residential, low income, commercial and
local government DSM programs for utility customers. He
is the lead of the Emerging Technology Team in the
Demand Response Operation Department at PG&E and is
also responsible for the implementation of the Auto DR
Program. He has a BS in Environmental Study from San
Jose State University and concentrated in Energy Efficiency
and Renewable Energy.
Osman Sezgen is a Manager in the Demand Response
Department at PG&E. His responsibilities include
evaluation of emerging DR technologies and administration
of technical incentive programs that enable customers for
DR. He also manages the development of DR programs and
contracts from regulatory applications, through pilots, to full
scale implementation. Before joining PG&E in 2004, Mr.
Sezgen was with Lawrence Berkeley National Laboratory
working in several departments/groups including Building
Energy Analysis, End-use Forecasting, Building
Technologies, and Electricity Markets and Policy. He holds
a BS Degree and a MS Degree in Mechanical Engineering
from University of Manchester (UK) and a MS Degree in
Industrial Engineering and Operations Research from UC
Berkeley.
John Goodin is the California Independent System
Operator Corporation’s (“CAISO”) lead for demand
response. John’s current responsibilities lie in development
of demand response policy and products for the CAISO.
Prior to joining the CAISO’s Market and Product
Development department, John was part of the External
Affairs team where he served as an Account Manager for
the CAISO for seven years, developing key corporate
relationships and learning and explaining the many aspects
of “ISO” business and markets. John has a B.S. degree in
Mechanical Engineering from the California Polytechnic
State University, San Luis Obispo.