
Increasing vegetation and climate gradient in Western Europe over the Last Glacial Inception...
20
0012-821X/$ - see front matter D 2004 Elsevier B.V. All rights reserved. doi:10.1016/j.epsl.2004.12.010 * Corresponding author. Tel.: +33 540002628; fax: + 33 556488408. E-mail addresses: [email protected] (M.F. Sa ´nchez Gon ˜i)8 [email protected] (M.F. Loutre)8 [email protected] (M. Crucifix)8 [email protected] (O. Peyron)8 [email protected] (L. Santos)8 [email protected] (J. Duprat)8 [email protected] (B. Malaize ´)8 [email protected] (J.-L. Turon)8 [email protected] (J.-P. Peypouquet). 1 Tel.: +32 10473299; fax: +32 10474722. 2 Tel.: +44 1392884105; fax: +44 1392885681. 3 Tel.: +33 381666669; fax: +33 381666568. 4 Tel.: +34 981167000; fax: +34 981167065. 5 Tel.: +33 540008865; fax: + 33 556488408. 6 Tel.: +33 540008794; fax: + 33 556488408. 7 Tel.: +33 540008384; fax: +33 556488408. 8 Tel.: +33 540008857; fax: +33 556488408. Increasing vegetation and climate gradient in Western Europe over the Last Glacial Inception (122–110 ka): data-model comparison M.F. Sa ´nchez Gon ˜i a, * , M.F. Loutre b,1 , M. Crucifix c,2 , O. Peyron d,3 , L. Santos e,4 , J. Duprat f,5 , B. Malaize ´ f,6 , J.-L. Turon f,7 , J.-P. Peypouquet a,8 a EPHE, DGO, UMR-CNRS 5805, Universite ´ Bordeaux 1, Avenue des Faculte ´s, 33405 Talence, France b Universite ´ catholique de Louvain, Chemin du Cyclotron, 2, B-1348 Louvain-la-Neuve Belgium c Hadley Centre for Climate Prediction and Research, Met Office, FitzRoy Road, Exeter, EXI 3PB, U.K. d Laboratoire de Chrono-Ecologie, UMR-CNRS 6565, Universite ´ de Besanc ¸on, 16 rte de Gray, 25030 Besanc ¸on, France e Universidade da Corun ˜a, Facultade de Ciencias, Campus da Zapateira s/n15071 A Corun ˜a, Spain f DGO, UMR-CNRS 5805, Universite ´ Bordeaux 1, Avenue des Faculte ´s, 33405 Talence, France Received 18 June 2004; received in revised form 10 December 2004; accepted 16 December 2004 Editor: E. Bard Abstract High-resolution terrestrial (pollen) and marine (planktic and benthic isotopes, coarse fraction, and N. pachyderma (s)) analyses have been performed in the Marine Isotope Stage (MIS) 5 interval of IMAGES core MD99-2331 retrieved in the northwestern Iberian margin. This study shows the occurrence of a Zeifen Interstadial/Stadial succession on land and in the ocean during the first part of MIS 5e. In northwestern Iberia, the Eemian is marked from 126 to 122 ka by the development of deciduous Quercus forest at the same time as Mediterranean forest colonised southern Iberia, and deciduous Quercus-Corylus forest occupied northernmost European regions. From 121 to 115 ka Carpinus betulus forest developed in NW Iberia indicating a winter cooling by 2 8C on land and an increase in annual precipitation by 100–200 mm along with a Sea Surface Temperature Earth and Planetary Science Letters 231 (2005) 111 – 130 www.elsevier.com/locate/epsl
Transcript of Increasing vegetation and climate gradient in Western Europe over the Last Glacial Inception...

www.elsevier.com/locate/epsl
Earth and Planetary Science Le
Increasing vegetation and climate gradient in Western Europe over
the Last Glacial Inception (122–110 ka): data-model comparison
M.F. Sanchez Gonia,*, M.F. Loutreb,1, M. Crucifixc,2, O. Peyrond,3, L. Santose,4,
J. Dupratf,5, B. Malaizef,6, J.-L. Turonf,7, J.-P. Peypouqueta,8
aEPHE, DGO, UMR-CNRS 5805, Universite Bordeaux 1, Avenue des Facultes, 33405 Talence, FrancebUniversite catholique de Louvain, Chemin du Cyclotron, 2, B-1348 Louvain-la-Neuve Belgium
cHadley Centre for Climate Prediction and Research, Met Office, FitzRoy Road, Exeter, EXI 3PB, U.K.dLaboratoire de Chrono-Ecologie, UMR-CNRS 6565, Universite de Besancon, 16 rte de Gray, 25030 Besancon, France
eUniversidade da Coruna, Facultade de Ciencias, Campus da Zapateira s/n15071 A Coruna, SpainfDGO, UMR-CNRS 5805, Universite Bordeaux 1, Avenue des Facultes, 33405 Talence, France
Received 18 June 2004; received in revised form 10 December 2004; accepted 16 December 2004
Editor: E. Bard
Abstract
High-resolution terrestrial (pollen) and marine (planktic and benthic isotopes, coarse fraction, and N. pachyderma (s))
analyses have been performed in the Marine Isotope Stage (MIS) 5 interval of IMAGES core MD99-2331 retrieved in the
northwestern Iberian margin. This study shows the occurrence of a Zeifen Interstadial/Stadial succession on land and in the
ocean during the first part of MIS 5e. In northwestern Iberia, the Eemian is marked from 126 to 122 ka by the development of
deciduous Quercus forest at the same time as Mediterranean forest colonised southern Iberia, and deciduous Quercus-Corylus
forest occupied northernmost European regions. From 121 to 115 ka Carpinus betulus forest developed in NW Iberia indicating
a winter cooling by 2 8C on land and an increase in annual precipitation by 100–200 mm along with a Sea Surface Temperature
0012-821X/$ - s
doi:10.1016/j.ep
* Correspon
E-mail addr
michel.crucifix@
jp.peypouquet@1 Tel.: +322 Tel.: +443 Tel.: +334 Tel.: +345 Tel.: +336 Tel.: +337 Tel.: +338 Tel.: +33
tters 231 (2005) 111–130
ee front matter D 2004 Elsevier B.V. All rights reserved.
sl.2004.12.010
ding author. Tel.: +33 540002628; fax: + 33 556488408.
esses: [email protected] (M.F. Sanchez Goni)8 [email protected] (M.F. Loutre)8
metoffice.gov.uk (M. Crucifix)8 [email protected] (O. Peyron)8 [email protected] (L. Santos)8
-bordeaux1.fr (J. Duprat)8 [email protected] (B. Malaize)8 [email protected] (J.-L. Turon)8
epoc.u-bordeaux1.fr (J.-P. Peypouquet).
10473299; fax: +32 10474722.
1392884105; fax: +44 1392885681.
381666669; fax: +33 381666568.
981167000; fax: +34 981167065.
540008865; fax: + 33 556488408.
540008794; fax: + 33 556488408.
540008384; fax: +33 556488408.
540008857; fax: +33 556488408.

M.F. Sanchez Goni et al. / Earth and Planetary Science Letters 231 (2005) 111–130112
(SST) decreasing trend off Iberia. A similar cooling has been documented at the same time in northern Germany (528 N) by the
replacement of deciduous forest by coniferous (Abies-Picea) formations, implying a southward displacement of the deciduous
tree line between ~608 N and 508 N as early as 120 ka. The southward migration of the tree line between 728 N and 588 Nsimulated by the Earth Model of Intermediate Complexity MoBidiC from 122 and 120 ka and considered as a major process to
initiate the last glaciation is, therefore, compatible with data. Between 115 and 110 ka, the substantial ice accumulation in
northern high latitudes (MIS 5e/5d transition) was synchronous with successive drops, C26 and C25, in northeastern Atlantic
SST. In northwestern Iberia Abies-Pinus trees developed at the expense of Quercus-Carpinus forest. A tundra-like environment
occupied northern Germany, marking the end of the interglacial in northwestern Europe at 115 ka, and boreal forest likely
colonised northeastern France. The first displacement of the vegetation belts at 121 ka was enhanced at 115 ka indicating an
amplification of the vegetation and climate gradients in northeastern Atlantic and European borderlands probably related with
the well-developed ice caps at that time. The comparison between the general trend in the estimated and simulated MoBidiC
winter and summer temperatures for latitudes between 35 and 458 N, shows that both follow quite straightforwardly the
precession signal although the simulated and reconstructed temperatures agree better in the South than North of 408 N. Annualprecipitation is exhibiting opposite trend in the data and in the model. This contradiction is likely the fact that the zonal climate
simulated by the model may not accurately represent the regional climate features, as reconstructed from the pollen.
D 2004 Elsevier B.V. All rights reserved.
Keywords: Eemian; MIS 5; Last Glacial Inception; western Europe; northwestern Iberia; EMIC; climate simulation; pollen; vegetation; climate
reconstruction
1. Introduction
The last interglacial/glacial transition (122 to 110
ka BP) has been in the past the focus of a number
of studies with models of different complexity [1,2].
These studies have put forward the role of land
processes, and specifically changes in vegetation,
for entering in the last glaciation. The replacement
of taiga by tundra acts as positive feedback on
accumulation of perennial snow because snow
covered tundra has a larger albedo than snow
covered taiga. In particular, the Earth Model of
Intermediate Complexity (EMIC), MoBidiC, has
simulated between 122 and 120 ka a southward
migration of the tree line by 148 in latitude, from
728 to 588 N, and decrease in summer temperatures
by 2–38C in the midlatitudes (30–508 N) of Eurasia
[3]. Detailed comparison between these simulations
and palaeoenvironmental data is required to assess
the ability of such models to simulate the observed
climatic variability and to discuss the mechanisms
responsible for it. However, this comparison is
generally impaired by the lack of a reliable
chronology of terrestrial records for that time period
[4]. Pollen sequences from the continental realm
covering the last interglacial period have often a time
scale dependent on the marine stratigraphy [5] which
is based either on the assumption that the whole MIS
5e interval coincides with the Eemian period on land
[6,7] or that Eemian not only encompasses MIS 5e but
much of MIS 5d as well [8] giving different time
spans, from 12,000 to 23,000 yr, for the duration of
the Eemian.
The Eemian Interglacial is recognised by a
succession of tree-dominant pollen assemblage bio-
zones, bracketed between open vegetations of the
previous and succeeded glacial periods, which have a
remarkable consistency right across temperate areas of
western and northern Europe [9,10]. Further, palyno-
logical investigations of the maar lakes in central Italy,
of the Greek long sequences of Ioannina and Tenagi–
Philippon and of the southwestern Iberian margin core
MD95-2042 show that the Eemian in the Mediterra-
nean region can be brought into the same perspective
as northwestern European sequences [11,12]. It has
been shown recently, on the basis of the direct
correlation between pollen and marine proxy records
from deep sea core MD95-2042 [13,14] that the onset
of the Eemian lagged the beginning of MIS 5e by
6000 yr and the accumulation of substantial ice
volume (MIS 5e/5d, ~115–110 ka) was synchronous
with a 5000 yr long lasting deciduous forest in
southern Iberia. The U/Th-derived chronology of this
Portuguese core and the varve-dated German sequen-
ces has allowed the reassessment of the chronology of
the vegetational succession over the Eemian for these
M.F. Sanchez Goni et al. / Earth and Planetary Science Letters 231 (2005) 111–130 113
two western European regions [15–18]. These works
suggest that the Eemian in southern Iberia lasted
16,000 yr, from 126 ka to 110 ka, while it was shorter
north of the Alps and Pyrenees, i.e. between 11,000
and 13,000 yr, from 126 ka to ~115 ka. Tundra
vegetation colonised latitudes north of 508 N between
115 and 110 ka. However, between southern (378 N)and northern (528 N) western European regions the
timing of the vegetational succession is a subject of
debate [16,19]. Consequently, the spatial distribution
of the vegetation belts in western Europe related with
ice growth and north eastern Atlantic SST changes
remains poorly known. For this reason, it is important
to examine additional MIS 5 records off western
Europe.
The purpose of this paper is to compare the western
European vegetation as inferred from a north–south
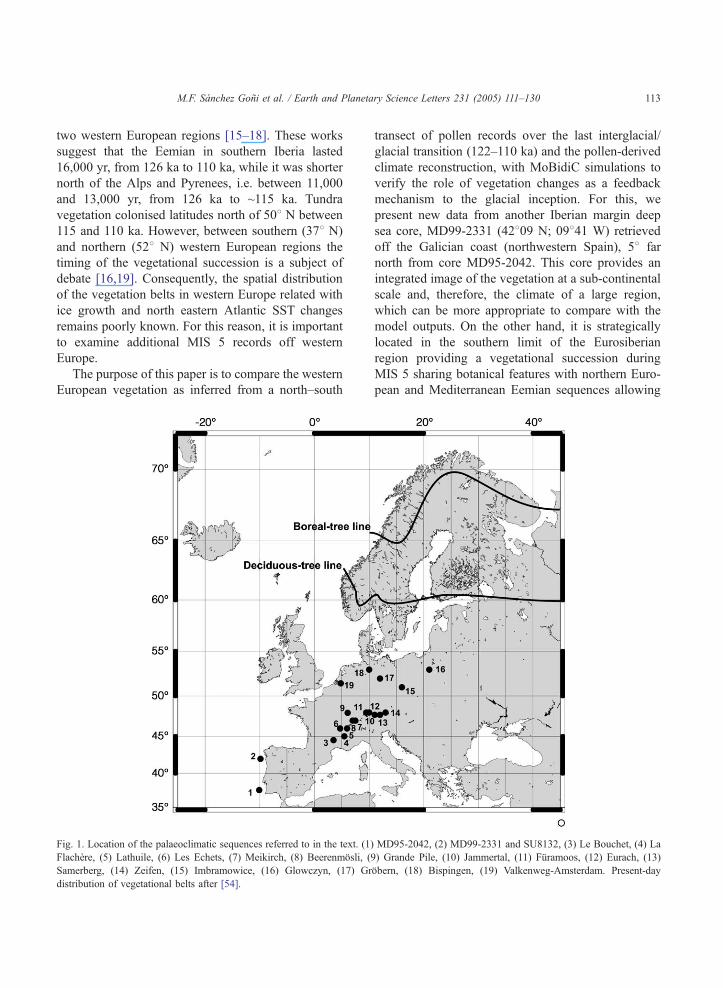
Fig. 1. Location of the palaeoclimatic sequences referred to in the text. (1)
Flachere, (5) Lathuile, (6) Les Echets, (7) Meikirch, (8) Beerenmfsli, (9Samerberg, (14) Zeifen, (15) Imbramowice, (16) Glowczyn, (17) Gr
distribution of vegetational belts after [54].
transect of pollen records over the last interglacial/
glacial transition (122–110 ka) and the pollen-derived
climate reconstruction, with MoBidiC simulations to
verify the role of vegetation changes as a feedback
mechanism to the glacial inception. For this, we
present new data from another Iberian margin deep
sea core, MD99-2331 (42809 N; 09841 W) retrieved
off the Galician coast (northwestern Spain), 58 far
north from core MD95-2042. This core provides an
integrated image of the vegetation at a sub-continental
scale and, therefore, the climate of a large region,
which can be more appropriate to compare with the
model outputs. On the other hand, it is strategically
located in the southern limit of the Eurosiberian
region providing a vegetational succession during
MIS 5 sharing botanical features with northern Euro-
pean and Mediterranean Eemian sequences allowing
MD95-2042, (2) MD99-2331 and SU8132, (3) Le Bouchet, (4) La
) Grande Pile, (10) Jammertal, (11) Fqramoos, (12) Eurach, (13)
fbern, (18) Bispingen, (19) Valkenweg-Amsterdam. Present-day
M.F. Sanchez Goni et al. / Earth and Planetary Science Letters 231 (2005) 111–130114
us to improve the north–south correlation of the major
chronostratigraphic units of the last interglacial com-
plex (Fig. 1). By doing this and through a detailed
direct correlation between marine and terrestrial
(pollen) stratigraphies from core MD99-2331 we will
give a consistent description of the timing and nature
of the vegetation and climate changes in western
Europe and in the middle latitudes of the eastern
North Atlantic directly related with ice volume growth
during the last interglacial/glacial transition. Further,
the floristic diversity of marine pollen spectra from
both MD99-2331 and MD95-2042 sequences has
made possible a first quantitative reconstruction of the
temperature and precipitation of western Iberia for
that period.
2. Present-day environmental setting and pollen
deposition
Core MD99-2331 was retrieved 100–200 km off
the Cape Finisterre on the slope of the continental
shelf at 2120 m water depth, close to the site of core
SU 8132 [6] (Fig. 1). This location is at present
influenced by the North Atlantic Deep Water [20,21].
The upper 500 m is driven by the Canary Current, the
Portuguese branch of the North Atlantic Drift. These
surface waters are submitted in summer to an
upwelling due to intense and persistent winds from
the north [22]. The influence of dominant Atlantic
winds over the year results in a temperate and humid
climate in northwestern Iberia with mean annual
temperature of 12.5 8C (Mean Temperature of the
Coldest Month, MTCO=6 8C; Mean Temperature of
the Warmest Month, MTWA=21 8C over the period
1956–1985) and mean annual precipitation between
1000 and 2000 mm [23,24]. This region, incised by
the Rias Baixas valleys (Galician coast basin) and the
Mino-Sil and Douro rivers (Sil and Douro basins)
[25], is at present dominated by deciduous oak
woodlands (Quercus robur, Q. pyrenaica, and Q.
petraea), heaths (Ericaceae including Calluna),
brooms (Genista) and gorses (Ulex) [26].
Experimental studies in marine sediments located
close to river mouths, as it is the case of core MD99-
2331, show that the pollen preserved in these sedi-
ments is mainly of fluvial origin [27]. This appears
particularly true in the Galician margin where the
dominant winds come from the northwestern Atlantic
Ocean [23]. Pollen grains belong to the fine-particle
fraction and consequently it is expected that pollen
and fine sediments behave similarly during the
sedimentary processes [28]. Studies on the present-
day sedimentary processes and budgets indicate that
sediments on the northwestern Iberian margin are
mainly provided by the northwestern Iberian rivers
Douro and Mino [29] and in small amounts by the
Rias. In fact, our work in progress on the present-day
pollen signature of marine sediments off northwestern
Iberia shows that the pollen content in the top
sediment samples from the Ria de Vigo, the Douro
estuary, and the north Portuguese continental shelf is
similar to that found in the top sample of MD99-2331
deep-sea core. Therefore, this suggests that the pollen
preserved in this core mainly comes from the Galician
and Douro fluvial basins. It represents the vegetation
and, therefore, the climate of northwestern Iberia.
3. Material and methods
Deep sea core MD99-2331 was retrieved by the
Marion Dufresne oceanographic ship using the
CALYPSO corer. This core is mainly composed by
hemipelagic clay. It is 37 m long and covers MIS 8 to
1 without any corebreak. Sedimentological descrip-
tion and SCOPIX radioscopic analysis of this core
indicate that no turbidite layers are present in this
sequence. Further, the interval covering the end of
Termination II does not show any bioturbated level.
MIS 5 is clearly identified in the planktic and benthic
oxygen isotopic records of the upper 22 m [30].
3.1. Chronology
The most straightforward approach to obtain a
chronological model of MD99-2331 would be to
match the benthic isotopic curve of this core with that
of the astronomically-independent record of MD95-
2042 [10]. However, the benthic data from MD99-
2331 core are too noisy when compared to those from
MD95-2042 to establish reliable stratigraphic pin
points. For this reason, we consider an alternative
age model for MD99-2331, based on the correlation
of the major climatic zones detected from its pollen
record with those dated in core MD95-2042. This
Table 1
Control points for the establishment of the age model of the
palaeoclimatic record from MD99-2331
Control points MD99-2331 MD95-2042
(Shackleton et al., 2003)
Top stadial II 1495 cm 65 ka
Top Ognon Is 1545 cm 73 ka
Top stadial I 1565 cm 74 ka
Top St Germain II 1585 cm 75.5 ka
Top Melisey II 1625 cm 81.5 ka
Top St Germain Ic 1665 cm 87 ka
Top Montaigu 1732 cm 101.5 ka
Top St Germain Ia 1742 cm 104 ka
Top Melisey I 1765 cm 107 ka
Top Eemian 1777 cm 109.7 ka
Base Eemian 1885 cm 126.1 ka
Base Stadial 1905 cm 127.5 ka
M.F. Sanchez Goni et al. / Earth and Planetary Science Letters 231 (2005) 111–130 115
assumes synchroneity of major climatic phases in
Iberia (Table 1). For example, the warming allowing
the re-expansion of temperate forest at the onset of the
Eemian must have started at the same time in the two
regions. Further, pollen, dinocysts, and planktic
foraminifera assemblages from both cores detect a
short cooling just before the Eemian. Such an abrupt
cold event was certainly correlated to southwards
incursions of polar waters in the North Atlantic Ocean
and must have also occurred simultaneously in the
two records. This pollen-based age model transferred
from the y18O MD95-2042 chronology assigns the
onset of the Eemian in core MD99-2331, 126 ka, at
level 1885 cm, and its end, 109.7 ka, at level 1777 cm.
Since the temporal resolution between samples
oscillates between 0.4 and 2 ka, we may expect such
a range in the dating uncertainty over the sequence.
3.2. Marine and terrestrial proxy analyses
Planktic (Globigerina bulloides) and benthic
isotopic measurements were performed in core
MD99-2331 over the interval from the 6/5 transition
to the present. The interval encompassing MIS 5 was
analysed every 5 cm or less [30]. Cibicides
wuellestorfi was picked up for benthic analysis.
However, the scarcity of this species in the glacial
substages of MIS 5 and its absence over the
penultimate deglaciation, obliged to analyse the
y18O on Melonis barleeanum and Bulimina exilis
species. Correcting factors used to make a continu-
ous stack are presented in [30]. The measurements,
done against NBS19 standard and then calibrated to
PDB, were made at the Department of Geology and
Oceanography of Bordeaux 1 University using an
Optima Micromass mass spectrometer.
N. pachyderma (s) foraminifers and coarse grain
fraction were counted at every 10 cm on the sand-
size fraction (N150 Am). In some key intervals such
as the deglaciation period the analysis was performed
every 5 cm.
Most of the MIS 5 interval was analysed for pollen
analysis every 10 cm. However, a 5 cm-sampling was
performed from 1860 to 1730 cm encompassing the
Last Glacial Inception interval (MIS 5e/5d transition).
The pollen preparation follows the same technique
explained in previous works for core MD95-2042
(e.g. [12]). After chemical treatment (cold HCl and
cold HF) the samples were sieved through 10 Amnylon mesh screens. The final residue for pollen
analysis was mounted unstained in double distilled
glycerine. Pollen grains were counted using a Zeiss
Axioskop light microscope at �400 and �1000 (oil
immersion) magnifications. A minimum of 100 pollen
grains excluding Pinus, due to its overrepresentation
in marine sediments [31], was counted at each of the
55 samples analysed. We estimate to twenty the
number of taxa needed in each level to have an
accurate image of the vegetation composition [32].
However, one third of the samples have a number of
taxa between 12 and 15. These poor-pollen diversified
levels, mainly concentrated in the upper part of the
MIS 5 interval, are not the focus of this paper. The
main pollen sums, including Pinus, range from 222 to
3301 per sample and a total of 73 taxa (69 pollen and
4 spore morphotypes) were identified. The pollen
percentages for the terrestrial taxa are based on a main
pollen sum which excludes Pinus, aquatics, spores,
indeterminables, and unknowns. Percentages of Iso-
etes fern have been calculated, to keep the same
criteria used for MD95-2042 record, based on the total
sum (Pollen (including Pinus) + spores + indetermin-
ables + unkowns).
3.3. Pollen-derived quantitative climatic
reconstruction
The Modern Analogue Technique (MAT) devel-
oped for continental pollen sequences [33–36], has
M.F. Sanchez Goni et al. / Earth and Planetary Science Letters 231 (2005) 111–130116
been used first on core MD95-2042 to estimate annual
precipitations and winter and summer temperatures in
southwestern Iberia during the last interglacial period.
This technique is based on a modern pollen database
including 1328 modern pollen spectra from Europe,
Eurasia, and the Mediterranean basin [37]. The
climatic parameters – mean temperature of the coldest
and the warmest months, annual precipitation – have
been calculated at each modern pollen site from
meteorological data, using an interpolation based on
an Artificial Neural Network technique (ANN). The
bioclimatic parameters selected seem to play a
determinant role on the distribution of the vegetation
and related pollen assemblages [38]. Since Pinus is
overrepresented in marine sediments, this pollen type
has been removed from the marine pollen counting as
well as from the continental pollen database. In the
standard modern analogues technique [34], similarity
between fossil and modern pollen assemblages is
evaluated by a chord distance. Usually, 5–10 modern
spectra which have the smallest chord distance are
considered as the best modern analogues of the given
pollen spectrum, and used for the reconstruction.
Their climatic parameters estimated are averaged by a
weighting inverse to the chord distance. The error is
computed as lower and upper limits of positive and
negative deviation of extreme analogues compared to
the mean value. Such method does not imply a direct
analogy between modern and fossil assemblages,
although the quality of the results depends on the
size and diversification of the modern data set. The
application of the MAT to the northernmost core
MD99-2331, out of the Mediterranean region, recon-
structs cold temperatures that are too cold in the
middle of the Eemian in contrast to the temperate
forest biome recorded by the pollen spectra. For this
reason, and to reduce uncertainties such as human
disturbance or the lack of perfect modern analogues in
the reconstruction, the MAT has been constrained by
the standardized and objective biomisation procedure
[35]. Based on the bplant functional typesQ concept,the biomisation technique attributes to each of the
modern and fossil pollen spectra a type of biome such
as tundra, taiga, temperate deciduous forest, warm
mixed forest, or steppes. The MAT cannot, therefore,
choose all the modern pollen analogues close to our
fossil spectra but only those similar corresponding to
the same biome. To reduce the bias induced by human
disturbance, we have compared the biomes obtained
from the modern pollen samples with the potential
vegetation simulated by the global vegetation model
BIOME1 [39]. Those pollen samples for which there
is no exact match between the calculated and the
potential biomes are not reliable and have been
excluded from the modern database. As the result,
the biomisation of the MD99-2331 pollen record is
based on a very recently improved modern pollen
database from Europe, Eurasia, Scandes Mountains,
Tibetan Plateau, and northern Africa composed by
868 pollen spectra [40]. The final climate estimates
are based on the modern analogues assigned to the
same biome as the fossil assemblage.
4. Vegetation and climate evolution in and off
northwestern Iberia during MIS 5
In core MD99-2331, fifteen pollen zones have
been recognised over MIS 5 (Fig. 2). Pollen zones
dominated by the percentages of tree taxa such as
deciduous Quercus, Corylus, and Carpinus betulus
reflect warm-temperate conditions in northwestern
Iberia. Among these tree-dominant zones, zones
MD31-4, MD31-8, MD31-10, and MD31-13, are also
characterised by the maximum values of Mediterra-
nean trees and shrubs, mainly evergreen Quercus.
Inversely, pollen zones marked by the development of
herbaceous taxa such as Ericaceae, Poaceae, Artemi-
sia, Chenopodiaceae, Ephedra, Taraxacum-type, and
Caryophyllaceae indicate cold conditions in this
region. Pollen zones MD31-1 and MD31-15, com-
posed by percentages of arboreal pollen between 20
and 40%, indicate open forest developed during
interstadial periods. Comparison of the MD99-2331
pollen sequence with those from western Europe [41–
43] and that off Portugal (MD95-2042) [12] allows
correlation with the major chronostratigrahic units of
the last interglacial complex: Eemian, St-Germain Ia,
St-Germain Ic, and St-Germain II warm periods as
well as the Zeifen and Ognon Interstadials. These
events alternated with the short post-Zeifen Stadial,
Melisey I, Montaigu, and Melisey II cold events, as
well as with the stadial I and II cold phases of the
Lanterne Glacial period. The Montaigu event in
northwestern Iberia appears, as everywhere in western
Europe, dominated by steppe and Pinus formations.
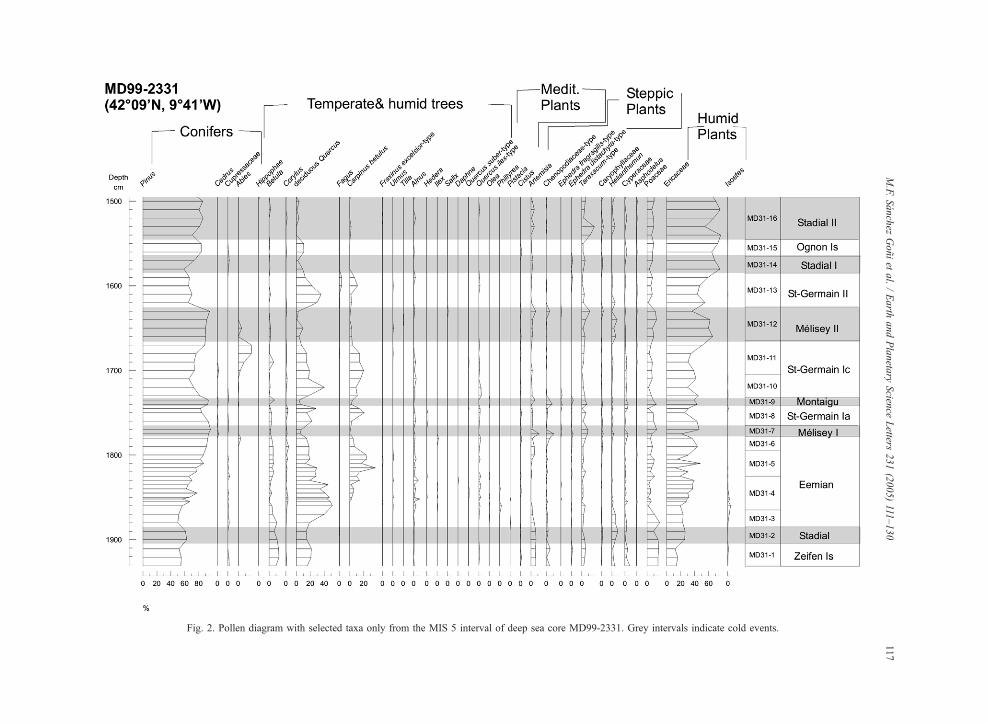
Fig. 2. Pollen diagram with selected taxa only from the MIS 5 interval of deep sea core MD99-2331. Grey intervals indicate cold events.
M.F.Sanchez
Goniet
al./Earth
andPlaneta
ryScien
ceLetters
231(2005)111
–130
117
M.F. Sanchez Goni et al. / Earth and Planetary Science Letters 231 (2005) 111–130118
The comparison of the MD99-2331 pollen record with
that off Portugal (MD95-2042) reflects the same
climatic variability in south and north Iberia over
MIS 5. However, a different vegetational succession is
observed between both regions. Semi-desert vegeta-
tion dominated by Artemisia-Chenopodiaceae-Ephe-
dra alternated with Mediterranean forest in the south
while in northwestern Iberia more humid open
vegetation with Ericaceae, Poaceae, and other steppe
elements alternated with deciduous oak (deciduous
Quercus)-hornbeam (C. betulus) forest. This vegeta-
tional succession in northern Iberia is rather similar to
that documented in northernmost western European
sequences.
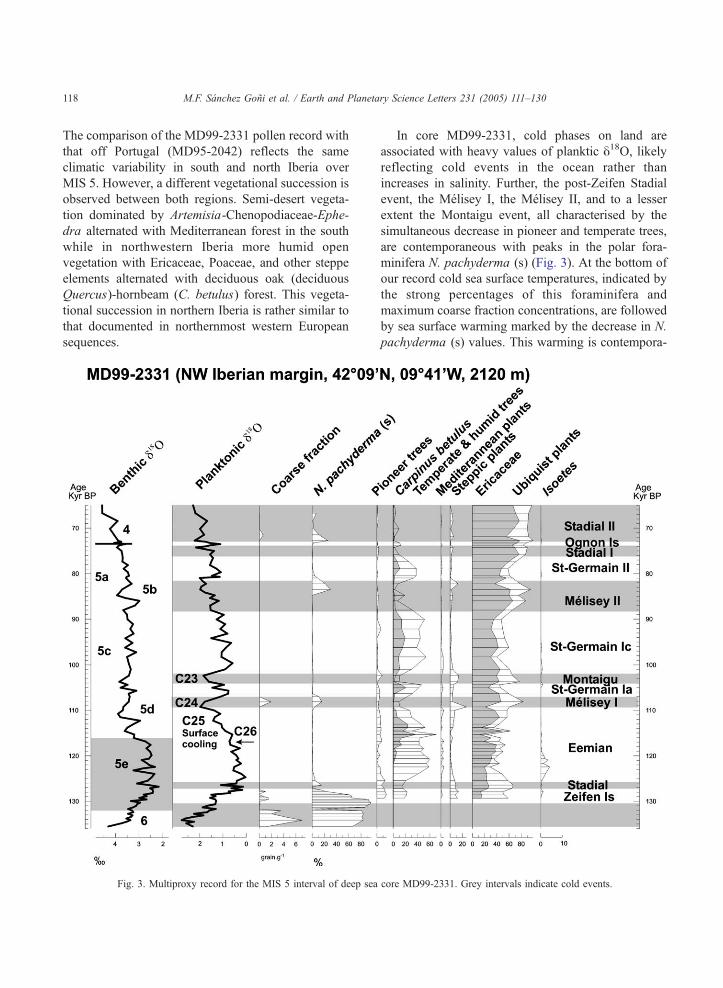
Fig. 3. Multiproxy record for the MIS 5 interval of deep sea
In core MD99-2331, cold phases on land are
associated with heavy values of planktic y18O, likelyreflecting cold events in the ocean rather than
increases in salinity. Further, the post-Zeifen Stadial
event, the Melisey I, the Melisey II, and to a lesser
extent the Montaigu event, all characterised by the
simultaneous decrease in pioneer and temperate trees,
are contemporaneous with peaks in the polar fora-
minifera N. pachyderma (s) (Fig. 3). At the bottom of
our record cold sea surface temperatures, indicated by
the strong percentages of this foraminifera and
maximum coarse fraction concentrations, are followed
by sea surface warming marked by the decrease in N.
pachyderma (s) values. This warming is contempora-
core MD99-2331. Grey intervals indicate cold events.
M.F. Sanchez Goni et al. / Earth and Planetary Science Letters 231 (2005) 111–130 119
neous with the Zeifen interstadial which precedes the
Stadial event. Within the MIS 5, only the Melisey I
cold event and, paradoxically, the temperate Zeifen
Interstadial are associated with peaks in the coarse
grain fraction. The peak in Melisey I event is, as
previously shown by core MD95-2042 [13], related
with iceberg discharges at the time of marine cold
event C24 [30,44]. The following terrestrial cooling,
Montaigu event, is synchronous with cold event C23
[30,44]. The MD99-2331 palaeoclimatic record
detects, therefore, a climatic variability in and off
northwestern Iberia very similar to that previously
shown by European and North Atlantic records and by
the southern core MD95-2042 [12,45]. A warm-cold
succession on land and ocean preceding the Eemian,
the Zeifen Interstadial, and Stadial events, occurred at
the beginning of MIS 5e. This climatic succession has
been previously identified in core MD95-2042. The
substantial accumulation of ice in northern high
latitudes (MIS 5e/5d transition, 115–110 ka) is
contemporaneous with terrestrial and marine cooling.
In northwestern Iberia this cooling is marked by the
decline of deciduous oak-hornbeam forest. The direct
correlation between terrestrial and marine proxies
shows that the Eemian in Iberia does not correspond
with the entire MIS 5e, confirming the previous
conclusion reached from the study of the southwestern
Iberian margin core [12,14].
5. A focus on the Eemian and the Last Glacial
Inception in and off western Europe
5.1. Vegetation and sea surface temperatures
The vegetational succession during the Eemian is
similar to that already recorded from the low
resolution analysis of the twin core SU 8132 [6].
At the onset of this interglacial both cores reveal the
development of pioneer trees and, in particular,
Betula in northwestern Iberia from 126 to 125 ka
associated with the increase of deciduous Quercus.
Pioneer tree expansion at the beginning of the
Eemian is also detected in French, Alpine, German,
Dutch, and Poland sequences (pollen zones E1 and
E2) [36,41,46–48]. The varve-dated German pollen
sequences estimate the duration of this interval to
1000 yr [13] (Table 2). Southern Iberia experienced
the abrupt increase of Mediterranean plants at that
time (Fig. 4). According to our record, Mediterra-
nean plants developed ~1000 yr (subject to dating
uncertainties) later in northwestern Iberia than in the
south, i.e., roughly at the same time as the temperate
forest expanded in Europe further north and east
(pollen zones E3, E4 and first part of E5). This
scenario is compatible with the distance of the
Mediterranean refugia. The varve-dated German
sequences suggest a 2000 yr-long lasting climatic
optimum from 125 to 123 ka. SSTs from the Iberian
margin [49] and other north Atlantic cores [50,51]
exhibit the highest values during this interval related
with minimum ice volume. At ~123 ka, a first
winter cooling by 2–3 8C is documented for
northern Germany on the basis of the development
of Carpinus betulus [18]. In Iberia, the first decrease
in winter temperatures appears to be later as
revealed by the C. betulus expansion from 121 to
115 ka detected in the north and at the latitude of
core MD95-2042. This terrestrial cooling is also
recorded in northern Germany (528 N), on the basis
of the expansion of Abies-Picea coniferous forest
(second part of E5 and E6, 121–118 ka) followed by
a Pinus-Betula taiga formation (E7, 117–115 ka)
(Fig. 5). Off Iberia and in other northernmost
Atlantic regions a decrease in SST is suggested by
the increase in the planktic y18O values from ~118
ka to 108 ka although alkenone derived SSTs from
core MD95-2042 show the beginning of the
decrease earlier, at around 123 ka (Fig. 4). Chapman
and Shackleton pointed out from core NEAP18K
(52846VN, 30821VW) [52] that the most prominent
cooling of surface waters occurred at the latitudes of
Britain at around 115 ka. This event, C26, charac-
terised by temperatures as cold as those of the C24
event may imply the end of the interglacial in this
region. At similar latitudes the German pollen
sequence of Grfbern reflects the replacement of
taiga by tundra at 115 ka and confirms the end of
the interglacial in northwestern European regions at
that time (Fig. 5). Later on, Carpinus-deciduous
Quercus forest declined in northwestern Iberia
leading to the development of Abies and Pinus
between 112 and 110 ka at the same time as SST
continue to decrease off Iberia. This ocean cooling
recorded by MD99-2331 is certainly related with the
C25 cold event detected in central North Atlantic

Table 2
Vegetational succession of the Eemian interglacial at different sites located on a north–southwestern European transect
Age ka Grobern, 52ºN; 12ºE * (Kühl & Litt, 2003)
111112113 Tundra114115116117 E7 Pinus-Betula expansion118119120 E6 Picea-Abies forest with Carpinus121122 E5 Carpinus-forest123124 E4 Quercus-Corylus 125 E3 Quercetum mixtum
MD95-2042, 37ºN; 10ºW (Sanchez Goñi et al., 1999; Shackleton et al. 2003)
Deciduous Quercus-Carpinus forest
Deciduous and evergreen Quercus and Mediterranean trees with Carpinus
Deciduous and evergreen Quercus and Mediterranean trees126 E1/E2 Pioneer trees (Betula, Pinus)
MD99-2331, 42ºN; 9ºW (this work)
Pinus-Abies expansion
Carpinus-deciduous Quercus forest
Quercus-Corylus forest with Carpinus
deciduous Quercus-Corylus
Betula-deciduous Quercus
Pinus-Picea-Betula expansion
Picea-Abies forest with Carpinus
Carpinus-forest
Quercus-CorylusQuercetum mixtumPioneer trees (Betula, Pinus)
52ºN-42ºN ** (Cheddadi et al., 1998; Turner, 2002; Klotz et al., 2003; Müller et al. 2003)
Shaded interval corresponds to the timing of the first major southward migration of vegetation belts. * This scheme can be applied to Dutch sequences [47]. ** All the sequences
located between 528 and 428 N are indicated in Fig. 1.
M.F.Sanchez
Goniet
al./Earth
andPlaneta
ryScien
ceLetters
231(2005)111
–130
120

Fig. 4. Comparison of palaeoclimatic records from the interval 136–100 ka of MD95-2042 (southwestern Iberian margin) and MD99-2331
(northwestern Iberian margin) deep sea cores. Grey intervals indicate cold events.
M.F. Sanchez Goni et al. / Earth and Planetary Science Letters 231 (2005) 111–130 121
[52,44] and that off south Portugal dated at ~112 ka
[13]. The C25 cooling appears to be more subtle in
the eastern North Atlantic than far north and western
subpolar Atlantic [51]. Nevertheless, it could have
contributed to the replacement of hornbeam forest
by conifers in northwestern Iberia from 112 to 110
ka and, this is more so in the Vosges region
considering that it is 58 further north. Therefore,
the replacement of Carpinus-forest by boreal for-
mations in the latter region, recorded by Grande Pile
pollen sequence at the end of the Lure interglacial
(zone E7) [41], is likely to have occurred before 112
ka. This contradicts the hypothesis by Kukla and
collaborators [19] who propose, on the basis of
counting the putative annual laminations over the
Lure interglacial, the persistence of a well-developed
Carpinus-forest between 115 and 110 ka and the
following coniferous forest expansion leading to a
20,000-year-long interglacial. The integrity of these
laminated sequences has been questioned by Turner
[17] and, therefore, casts doubts about Kukla’s
timing of the Eemian vegetational succession in
northeastern France.
The late development of Abies in northwestern
Iberia relative to the early development in high
altitudes of the Alps (pollen zone E4) and into the
central European lowlands (pollen zone E5) would be
related to the late low summer temperature threshold
and higher precipitation [47] reached in northwestern
Iberia favouring the development of this tree. This
hypothesis is compatible with the decrease in summer
temperatures and increase of precipitation estimated
from the same pollen assemblages (Fig. 6). The record
of Abies in the southern core is later than in
northwestern Iberia and coincides with the onset of
the Melisey I cold period [12]. In this case,
quantitative estimates indicate, however, a strong
seasonality with increasing temperatures during sum-
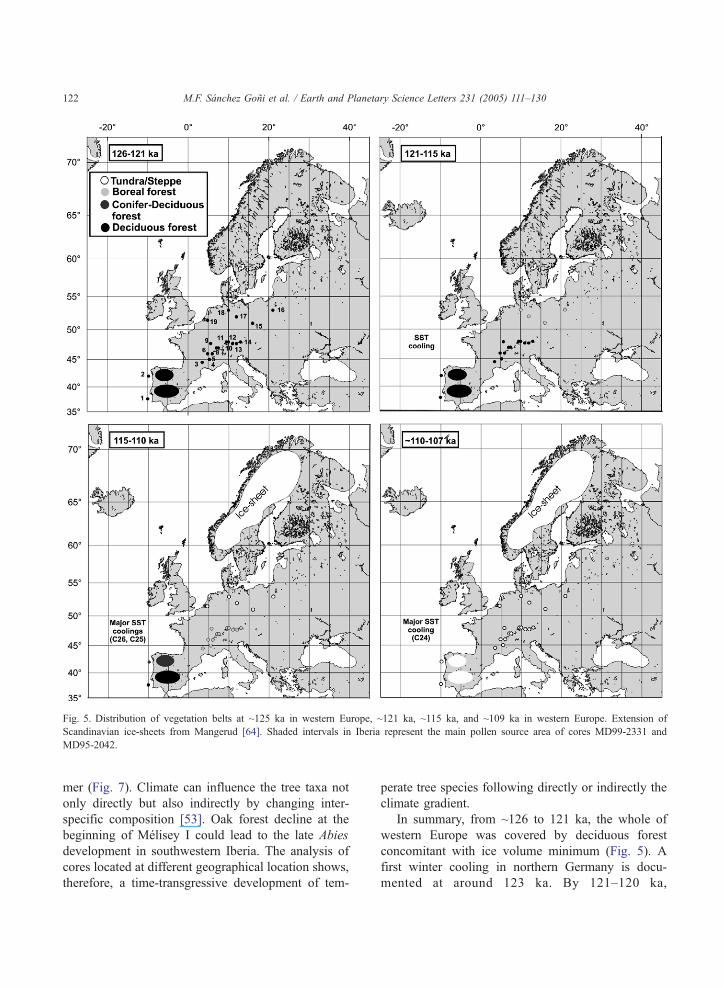
Fig. 5. Distribution of vegetation belts at ~125 ka in western Europe, ~121 ka, ~115 ka, and ~109 ka in western Europe. Extension of
Scandinavian ice-sheets from Mangerud [64]. Shaded intervals in Iberia represent the main pollen source area of cores MD99-2331 and
MD95-2042.
M.F. Sanchez Goni et al. / Earth and Planetary Science Letters 231 (2005) 111–130122
mer (Fig. 7). Climate can influence the tree taxa not
only directly but also indirectly by changing inter-
specific composition [53]. Oak forest decline at the
beginning of Melisey I could lead to the late Abies
development in southwestern Iberia. The analysis of
cores located at different geographical location shows,
therefore, a time-transgressive development of tem-
perate tree species following directly or indirectly the
climate gradient.
In summary, from ~126 to 121 ka, the whole of
western Europe was covered by deciduous forest
concomitant with ice volume minimum (Fig. 5). A
first winter cooling in northern Germany is docu-
mented at around 123 ka. By 121–120 ka,
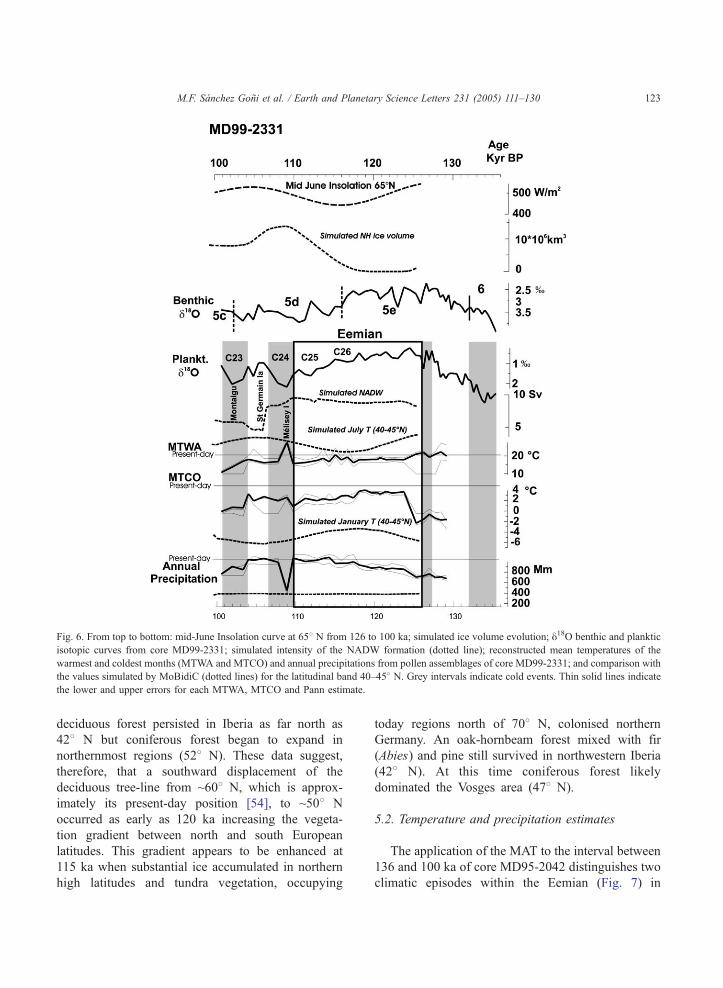
Fig. 6. From top to bottom: mid-June Insolation curve at 658 N from 126 to 100 ka; simulated ice volume evolution; y18O benthic and planktic
isotopic curves from core MD99-2331; simulated intensity of the NADW formation (dotted line); reconstructed mean temperatures of the
warmest and coldest months (MTWA and MTCO) and annual precipitations from pollen assemblages of core MD99-2331; and comparison with
the values simulated by MoBidiC (dotted lines) for the latitudinal band 40–458 N. Grey intervals indicate cold events. Thin solid lines indicate
the lower and upper errors for each MTWA, MTCO and Pann estimate.
M.F. Sanchez Goni et al. / Earth and Planetary Science Letters 231 (2005) 111–130 123
deciduous forest persisted in Iberia as far north as
428 N but coniferous forest began to expand in
northernmost regions (528 N). These data suggest,
therefore, that a southward displacement of the
deciduous tree-line from ~608 N, which is approx-
imately its present-day position [54], to ~508 N
occurred as early as 120 ka increasing the vegeta-
tion gradient between north and south European
latitudes. This gradient appears to be enhanced at
115 ka when substantial ice accumulated in northern
high latitudes and tundra vegetation, occupying
today regions north of 708 N, colonised northern
Germany. An oak-hornbeam forest mixed with fir
(Abies) and pine still survived in northwestern Iberia
(428 N). At this time coniferous forest likely
dominated the Vosges area (478 N).
5.2. Temperature and precipitation estimates
The application of the MAT to the interval between
136 and 100 ka of core MD95-2042 distinguishes two
climatic episodes within the Eemian (Fig. 7) in

Fig. 7. From top to bottom: mid-June Insolation curve at 658 N from 126 to 100 ka; simulated ice volume evolution; y18O benthic and planktic
isotopic curves from core MD95-2042; simulated intensity of the NADW formation (dotted line); reconstructed mean temperatures of the
warmest and coldest months (MTWA and MTCO) and annual precipitations from pollen assemblages of core MD95-2042; and comparison with
the values simulated by MoBidiC (dotted lines) for the latitudinal band 35–408 N. Grey intervals indicate cold events. Thin solid lines indicate
the lower and upper errors for each MTWA, MTCO and Pann estimate.
M.F. Sanchez Goni et al. / Earth and Planetary Science Letters 231 (2005) 111–130124
contrast with the four climatic phases suggested by the
previous qualitative climatic interpretation of the
pollen assemblage succession [12,45]. The warmest
and driest phase occurred between 126 and 117 ka
with annual precipitation around 800 mm and mean
temperature of the coldest month (MTCO) around 5
8C. These figures are similar to those observed at
present day in southwestern Iberia. In the second
phase, from 117 to 110 ka, we observe an increase of
annual precipitation by 100–200 mm and a decrease
of mean temperatures of the coldest and warmest
month (MTCO and MTWA) by 2–3 8C relative to the
early phase of the Eemian.
When we apply the same technique to the northern
core MD99-2331, winter and summer temperatures of
the middle of the Eemian (not shown) are too low,
�15 8C and �10 8C, respectively, to be associated
with the development of the C. betulus-Quercus
temperate forest biome [39] reflected by the pollen
assemblage. As explained before, we have constrained
M.F. Sanchez Goni et al. / Earth and Planetary Science Letters 231 (2005) 111–130 125
the MAT by biomisation. The new reconstruction
shows (Fig. 6) that, as in the southern core, the
warmest and driest period occurred in the first part of
the Eemian, between 126 and 118 ka. The first
cooling starts around 118 ka and is associated with
a gradual increase in annual precipitation. A 2–3000
yr lag exists between the timing of the cooling, at
~121 ka, suggested by vegetation changes in south
and north Iberia, and that estimated with the MAT.
This can be explained by the lack of sensitivity of this
technique to reconstruct climatic changes from small
shifts in vegetation composition. Between 118 and
110 ka, the annual precipitation is 200 mm higher than
that of the first part of the Eemian and the MTCO 2–3
8C lower as showed before by core MD95-2042. In
contrast, summer temperatures slightly decrease in
northwestern Iberia while an increasing trend is
suggested for the south. Both cores revealed, as
already pointed out by several authors for northern
and easternmost European regions [33,47], that
climate was drier and more continental during the
early part of the Eemian than in its latter part. A
summer cooling associated with a precipitation
increase is physically sound because it implies a
southward shift of the atmospheric fronts.
6. Data-model comparison for the western
European vegetation and climate at the Last
Glacial Inception
The 2D Earth Model of Intermediate Complexity
(EMIC), MoBidiC, is used to simulate the climate
changes between 126 and 100 ka. The model is first
initialised by performing a 15,000-yr long equili-
brium experiment, where orbital parameters are
computed for 126 ka and CO2 concentration is fixed
to 261 ppmv. The topography of the Antarctic ice
sheet is as today and Greenland is reduced to half its
present day volume. Then the transient simulation is
performed by forcing the model by the transient
variations in the seasonal and latitudinal distribution
of insolation [55] and in CO2 concentration [56]
from 126 to 100 ka. MoBidiC links a zonally
averaged atmosphere to a sectorial representation of
the surface. Each zonal band, with a 58 resolution in
latitude, is divided into sectors representing the main
continents (Eurasia and America) and the oceans
(Atlantic, Pacific, and Indian). The ocean component
is described through a primitive-equation ocean
model in which the variables are sectorially averaged
over each of the three oceans. A simple thermody-
namical–dynamical sea-ice component is coupled to
the ocean model. The dynamical terrestrial vegeta-
tion model, VECODE [57] provides the distributions
of forest, grass and desert over each continent.
MoBidiC also includes a vertically integrated model
of the three main Northern Hemisphere ice sheets
(Greenland, North America, and Eurasia) [58] and
Antarctica. This model is fully described in [59]
except that in addition, it is here synchronously
coupled to a model of the ice sheets and underlying
bedrock [60]. MoBidiC simulates the time evolution
of several variables representative of the long-term
evolution of climate, e.g. continental ice volume,
temperature, precipitation, sea-ice and snow-field
extent, energy balance at the surface, and latitudinal
heat transport. MoBidiC simulates full interglacial
conditions with no continental ice in the Northern
Hemisphere from 124 to 119 ka. Then, ice sheets
grow until 109 ka (14�106 km3). It is followed by a
partial melting of 6�106 km3 over the next 5000 yr.
The Northern Hemisphere annual mean temperature
starts to decrease 2000 yr before the re-growth of the
ice sheets. The minimum summer temperature
(14.28C at 116 ka) and maximum Arctic sea-ice
extent (117 ka) are reached well before the con-
tinental ice volume maximum. The amplitude of the
subsequent warming is smaller. At mid-latitudes,
winter temperature is almost out of phase with
summer temperature: it is maximum at 117 ka and
minimum at 106 ka. North of 758 N, the response of
the system is characterised by a cooling trend both in
winter and in summer by 4 8C. The cooling trend
characterises the whole interval but it is the more
intense before 115 ka, such that the winter temper-
ature gradient between mid- and high latitudes is
gradually enhanced during the early phase of
continental ice sheet build up (Figs. 6 and 7).
As regards the vegetation, MoBidiC simulates a
southward migration of the tree line by 178 in latitude
(from 70 to 538 N) between 126 and 116 ka. It results
from the drop in the GDD0 (growing degree days)
index north of 608 N, which is explained by the
summer cooling and a 1-month delay of the start of
the growing season at 116 ka [3]. Most of the
M.F. Sanchez Goni et al. / Earth and Planetary Science Letters 231 (2005) 111–130126
replacement of taiga by tundra northward of 608 N
takes place between 122 and 120 ka. It is associated
with the rapid increase of sea ice and land snow cover.
Southward shift of the tree line continues at the
beginning of the build-up of the ice sheets. However,
forest in the high northern latitudes (60–908 N)
recovers as soon as continental temperature starts to
increase at ~116 ka. Previous sensitivity experiments
with the same model showed that these environmental
changes were mainly controlled by precession and
that they cause an increase of surface albedo which
nearly quadruples the direct effect of astronomical
forcing [3].
In the following tentative comparison between
model and data it must be taken into account that
climate and vegetation in western Europe, as
reconstructed from the data, may not be representa-
tive for the mean climate and mean vegetation over
the whole zonal belt, as simulated by the model.
Botanical data document a major ~108 southward
displacement of vegetation belts in western Europe
from 121 ka to 115 ka rather synchronous with the
replacement of taiga by tundra simulated by MoBi-
diC from 122 to 120 ka for regions northern than
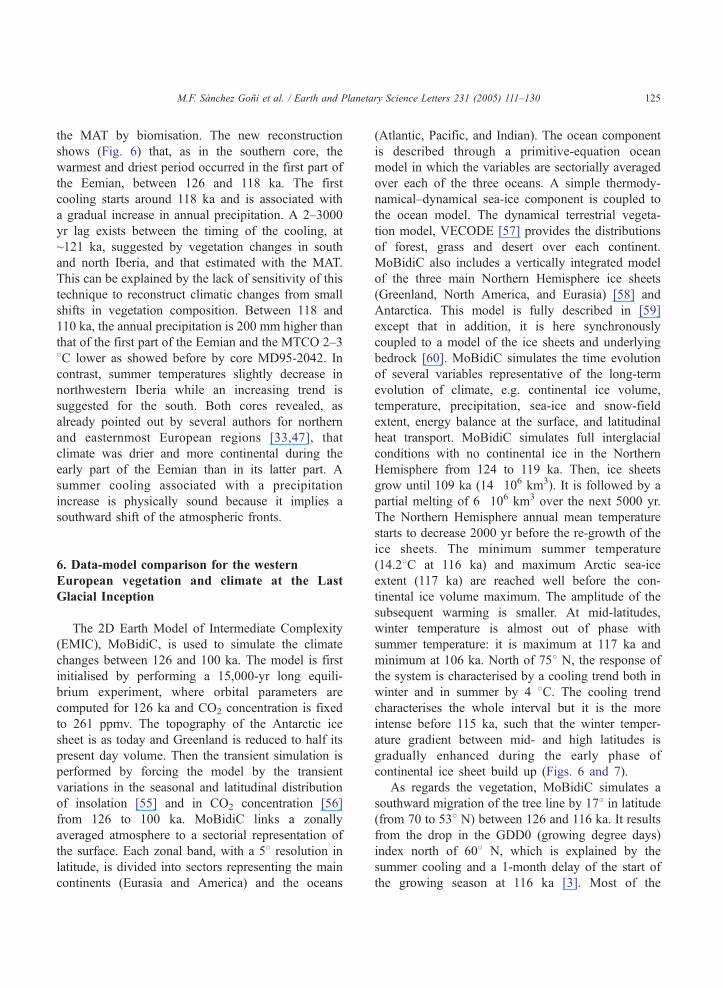
Fig. 8. MoBidiC simulation over the period 126–100 ka: (A) January Atlan
over Eurasia between 50 and 558 N. (C) Eurasia tree fraction between 50
608 N. Consequently, data support the hypothesis
that early Eemian vegetation changes in northern
high latitudes played a major role for the glacial
inception. This is in contrast with the hypothesis that
the increased SST gradient between polar and
equatorial zones and related feedbacks at 115 ka
are the major triggers for ice nucleation, as put
forward by the 3D-IPSL-CM2 model [61]. However,
MoBidiC likely underestimates the feedbacks asso-
ciated to SST cooling. After 115 ka, a gradual
opening of the oak-hornbeam forest occurred in
northwestern Iberia. At the same time, tundra
environments settled in northern Germany (Fig. 5)
agreeing with the forest decline and the decrease in
January temperatures on land simulated by MoBidiC
for mid-latitudes between 508 N and 558 N (Fig. 8).
However, this model does not simulate the drop in
SST documented for this latitudinal band.
The general trend in the estimated and simulated
winter and summer temperatures for latitudes between
35 and 408 N, follows quite straightforwardly the
precession signal. Summer temperature decreases
from 126 ka until 117 ka and then increases up to a
maximum value at 105 ka. Winter temperature is
tic SST between 50 and 558 N. (B) January land surface temperatures
and 558 N.
M.F. Sanchez Goni et al. / Earth and Planetary Science Letters 231 (2005) 111–130 127
experiencing the reverse general trend. Although the
amplitude of the signal is smaller in the data than in
the model, the good agreement between model and
data in terms of phase relationships certainly argues in
favour of the stratigraphic scale of the record. By
contrast, annual precipitation is exhibiting opposite
trend in the data and in the model.
Data from core MD99-2331 show that the warmest
winter and driest period also occurred in northwestern
Iberia between 126 and 118 ka. Temperature and
precipitation variability from the northern core are
very small in comparison with that observed from the
southern core but this may be an artefact linked to the
biomisation procedure. The agreement between
model and data for the northern core is less good
probably because it is more under regional Atlantic
influence, an aspect for which MoBidiC is not
suitably designed. Further north, from 118 to 115
ka, the January cooling derived from the Grfbernsequence (528 N) is 8–10 8C [18]. Even if ill-dated,
European pollen sequences located between 448 N
and 528 N reveal a winter cooling by 5 to10 8Crelated with the expansion of Carpinus forest in the
second part of the Eemian [36,62]. This winter
cooling in the north, associated with an increase in
precipitation, is more than twice the winter cooling,
2–3 8C, experienced in Iberia at the same time. These
temperature amplitudes, estimated from different kind
of transfer functions, indicate an enhancement of the
climate gradient between north and southwestern
European regions during the ice growth period,
which is also in agreement with the model. In
MoBidiC, this enhanced temperature gradient is
essentially due to a combination of increased winter
insolation at mid-latitudes, and increased albedo at
higher latitudes (development of ice sheets and
southward shift of tree line). In the real world, more
complex dynamical phenomena may have played a
role. For example, Felis et al. [63] recently emphas-
ised the relationship between the NAO/AO and the
insolation seasonal cycle. Their results can be
interpreted in the sense that the gradual reduction in
insolation seasonal cycle during the period 126–115
ka could have caused a gradual shift from a NAO+
like mean state towards a NAO� like mean state,
thereby explaining the gradual increase in precipita-
tion inferred from the data, but not reproduced with
MoBidiC.
Annual precipitation over land and ocean surface
temperature show several rapid shifts (110–100 ka)
that are not reproduced by MoBidiC (Figs. 6 and 7).
This concerns the succession of Melisey I (semi-desert
biome, cold SST), St. Germain Ia (forest biome, warm
SST), and Montaigu (semi-desert biome, cold SST)
events detected by terrestrial and oceanic proxies
between 110 and 100 ka. However, MoBidiC is able
to simulate rapid climate changes related to rapid
decrease in the NADW strength although the timing
of these events is not well constrained. The first
climatic change is simulated at 106 ka and, therefore
3000 yr later than the C24 cooling. After the model,
the increase in summer insolation caused the melting
of the ice sheets that grew up during isotopic stage 5d,
and consequently a change in the density of the water
column and an abrupt decrease in the strength of the
North Atlantic overturning cell, associated with shifts
in convection sites. This has little consequences on
temperatures around 408 N but it suggests that the
cold events C24 and C25 may reasonably be
explained by temporary disruptions of the convective
activity in the North Atlantic.
7. Conclusions
We have compared palaeoclimatic records from
deep sea cores MD99-2331 and MD95-2042 with
western European pollen sequences to have a better
picture of the timing and nature of vegetation changes
along a north–south transect over the last interglacial/
glacial transition. The inferred qualitative and quanti-
tative reconstructions have been compared with
MoBidiC simulations in spite of the approximations
of the climate model, uncertainties in pollen-based
climatic estimations, and the problem of establishing a
common chronology between fossil archives and
models. Remarkably, MoBidiC and data display the
maximum ice volume at the same time (110–108 ka).
Besides, quantitative climatic reconstruction (MTCO,
MTWA, and annual precipitation) for Iberia between
136 and 100 ka have been compared with those
simulated by MoBidiC for the latitudinal bands 35–
408 N and 40–458 N. This comparison shows that
simulated and reconstructed temperatures agree better
in the South than North of 408 N likely due to the fact
that northern regions are more under regional Atlantic
M.F. Sanchez Goni et al. / Earth and Planetary Science Letters 231 (2005) 111–130128
influence, an aspect for which MoBidiC is not
suitably designed. Both data and MoBidiC simula-
tions show a ~108 southward displacement of
vegetation belts in western Europe as early as ~121
ka and support the crucial role of vegetation shift in
the northernmost latitudes for triggering the last
glaciation. Further, the enhancement of vegetation
and climate gradients in western Europe related with
substantial ice growth was also synchronous with the
reconstructed and simulated settlement of perennial
snow at northern high latitudes, from ~122 to 108 ka.
Acknowledgements
IPEV and PNEDC French programs provided
financial support. We thank logistics and coring teams
on board of the R/V Marion Dufresne II during the
Geosciences oceanographic cruise and Marie-Helene
Castera, Karine Charlier, Olivier Ther, and Francoise
Vincon for invaluable technical assistance. We are
also grateful to Elsa Cortijo, Chronis Tzedakis, and an
anonymous referee for valuable suggestions which
improved the manuscript as well as to Nick Shackle-
ton, Jean-Claude Duplessy, and Sebastian Zaragosi for
discussions. Modelling results were obtained under
BIOCLIM EU project (FIKW-CT-2000-00024). We
thank the coordinator (ANDRA), the technical secre-
tary (Quantisci), and all the BIOCLIM participants.
This paper is Bordeaux 1 University, UMR-CNRS
5805 EPOC Contribution no. 1544.
References
[1] M. Yoshimori, M.C. Reader, A.J. Weaver, N.A. McFarlane,
On the causes of glacial inception at 116 ka BP, Clim. Dyn. 18
(2002) 383–402.
[2] G. Vetoretti, W.R. Peltier, Post-Eemian glacial inception, Part
I: Impact Summer Seasonal Temp. Bias J. Clim. 16 (2003)
889–911.
[3] M. Crucifix, M.F. Loutre, Transient simulations over the last
interglacial period (126–115 kyr BP): feedback and forcing
analysis, Clim. Dyn. 19 (2002) 417–433.
[4] LIGA members, Report of 1st discussion group: the last
interglacial in high latitudes of the northern hemisphere:
terrestrial and marine evidence, Quat. Int. 10–12 (1991) 9–28.
[5] J. Guiot, Back at the last interglacial, Nature 388 (1997)
25–27.
[6] J.-L. Turon, Direct land/sea correlations in the last interglacial
complex, Nature 309 (1984) 673–676.
[7] J.-L. de Beaulieu, M. Reille, The last climatic cycle at La
Grande Pile (Vosges, France). A new pollen profile, Quat. Sci.
Rev. 11 (1992) 431–438.
[8] G. Kukla, J.F. McManus, D.-D. Rousseau, I. Chuine, How
long and how stable was the last interglacial? Quat. Sci. Rev.
16 (1997) 605–612.
[9] C. Turner, R.G. West, The subdivision and zonation of
interglacial periods, Eiszeitalt. Ggw. 19 (1968) 93–101.
[10] C. Turner, Formal status and vegetational development of the
Eemian interglacial in northwestern and southern Europe,
Quat. Res. 58 (2002) 41–44.
[11] C. Turner, Volcanic maars, long quaternary sequences and the
work of the INQUA subcommission on European Quaternary
stratigraphy, Quat. Int. 47/48 (1998) 41–49.
[12] M.F. Sanchez Goni, J.-L. Turon, F. Eynaud, N.J. Shackleton,
High resolution palynological record off the Iberian margin:
direct land–sea correlation for the Last Interglacial complex,
Earth Planet. Sci. Lett. 171 (1999) 123–137.
[13] N.J. Shackleton, M. Chapman, M.F. Sanchez-Goni, D. Pailler,
Y. Lancelot, The classic marine isotope substage 5e, Quat.
Res. 58 (2002) 14–16.
[14] N.J. Shackleton, M.F. Sanchez Goni, D. Pailler, Y. Lancelot,
Marine isotope substage 5e and the Eemian interglacial, Glob.
Planet. Change 757 (2003) 1–5.
[15] G.J. Kukla, M.L. Bender, J.-L. de Beaulieu, G. Bond, W.S.
Broecker, P. Cleveringa, J.E. Gavin, T.D. Herbert, J. Imbrie, J.
Jouzel, L.D. Keigwin, K.-L. Knudsen, J.F. McManus, J.
Merkt, D.R. Muhs, H. Mqller, R.Z. Poore, S.C. Porter, G.Seret, N.J. Shackleton, C. Turner, P.C. Tzedakis, I.S. Wino-
grad, Last interglacial climates, Quat. Res. 58 (2002) 3–13.
[16] P.C. Tzedakis, Timing and duration of last interglacial
conditions in Europe: a chronicle of a changing chronology,
Quat. Sci. Rev. 22 (2003) 763–768.
[17] C. Turner, Problems of the duration of the Eemian interglacial
in Europe north of the Alps, Quat. Res. 58 (2002) 45–48.
[18] N. Kqhl, T. Litt, Quantitative time series reconstruction of
Eemian temperature at three European sites using pollen data,
Veg. Hist. Archaeobot. 13 (2003) 205–214.
[19] G.J. Kukla, J.-L. de Beaulieu, H. Svobodova, V. Andrieu-Ponel,
N. Thouveny, H. Stockhausen, Tentative correlation of pollen
records of the Last Interglacial at Grande Pile and Ribains with
Marien isotope stages, Quat. Res. 58 (2002) 32–35.
[20] H.M. Van Aken, The hydrography of the mid-latitude north-
east Atlantic Ocean: I. The deep water masses, Deep-Sea Res.
I 47 (2000) 757–788.
[21] H.M. Van Aken, The hydrography of the mid-latitudes
Northeast Atlantic Ocean: II. The intermediate water masses,
Deep-Sea Res. I 47 (2000) 789–824.
[22] W.S. Wooster, A. Bakun, D.R. McLain, The seasonal upwell-
ing cycle along the eastern boundary of the North Atlantic, J.
Mar. Res. 34 (1976) 131–141.
[23] Atlas Nacional de Espana, Climatologıa, Madrid, Ministerio
de Obras Publicas y Transportes, Direccion General del
Instituto Geografico Nacional, 1992, 24 pp.
[24] J.J. Loureiro, M.L. Machado, M.E. Macedo, M.N. Nunes, O.F.
Botelho, M.L. Sousa, M.C. Almeida, J.C. Martins, Monogra-
fias hidrologicas dos principais cursos de agua de Portugal

M.F. Sanchez Goni et al. / Earth and Planetary Science Letters 231 (2005) 111–130 129
continental. Lisboa, Direccao Geral dos Servicos Hidraulicos,
1986, 569 pp.
[25] Atlas Nacional de Espana, Hidrologıa, Madrid, Ministerio de
Obras Publicas, Transportes y Medio Ambiente, Direccion
General del Instituto Geografico Nacional, 1993, 32 pp.
[26] J. Izco, Galicia, in: M. Peinado Lorca, S. Rivas Martinez
(Eds.), La vegetacion de Espana, Universidad de Alcala de
Henares, Alcala de Henares, 1987, pp. 385–419.
[27] L. Heusser, Quaternary palynology of marine sediments in the
northeast Pacific, northwest Atlantic, and Gulf of Mexico,
Pollen records of Late-Quaternary North American sediments,
AASP Foundation, 1985, pp. 385–403.
[28] G.L. Chmura, A. Smirnov, I.D. Campbell, Pollen transport
through distributaries and depositional patterns in coastal
waters, Palaeogeogr. Palaeoclimatol. Palaeoecol. 149 (1999)
257–270.
[29] J.M.A. Dias, R. Gonzalez, C. Garcia, V. Diaz del Rio,
Sediment distribution patterns on the Galicia-Minho continen-
tal shelf, Prog. Oceanogr. 52 (2002) 215–231.
[30] A. Gouzy, B. Malaize, C. Pujol, K. Charlier, Climatic bpauseQduring termination II identified in shallow and intermediate
waters off the Iberian margin, Quat. Sci. Rev. 23 (2004)
1523–1528.
[31] J.-L. Turon, Pollen et spores dans la sedimentation actuelle le
long de la ride Rekjanes et dans la fracture de Gibbs. Interet
dans la determination des apports sedimentaires, Comptes
Rendus-Academie Des Sciences., Paris D291 (1980) 453–456.
[32] J.H. McAndrew, J.E. King, Pollen of the North American
Quaternary: the top twenty, Geosci. Man 15 (1976) 41–49.
[33] J. Guiot, A. Pons, J.L. de Beaulieu, M. Reille, A 140.000 years
continental climate reconstruction from two European pollen
records, Nature 338 (1989) 309–313.
[34] J. Guiot, Methodology of the last climatic cycle reconstruction
from pollen data, Palaeogeogr. Palaeoclimatol. Palaeoecol. 80
(1990) 49–69.
[35] J. Guiot, J.-L. de Beaulieu, R. Cheddadi, F. David, P. Ponel,
M. Reille, The climate in Western Europe during the last
glacial/interglacial cycle derived from pollen and insect
remains, Palaeogeogr. Palaeoclimatol. Palaeoecol. 103
(1993) 73–93.
[36] R. Cheddadi, K. Mamakowa, J. Guiot, J.-L. de Beaulieu, M.
Reille, V. Andrieu, W. Granoszewski, O. Peyron, Was the
climate of the Eemian stable? A quantitative climate recon-
struction from seven European pollen records, Palaeogeogr.
Palaeoclimatol. Palaeoecol. 143 (1998) 73–85.
[37] O. Peyron, J. Guiot, R. Cheddadi, P. Tarasov, M. Reille, J.-L.
de Beaulieu, S. Bottema, V. Andrieu, Climatic reconstruction
in Europe for 18,000 yr BP from pollen data, Quat. Res. 49
(1998) 183–196.
[38] I.C. Prentice, M.T. Sykes, M. Lautenschlager, S.P. Harrison,
O. Denissenko, P. Bartlein, Modelling global vegetation
patterns and terrestrial carbon storage at the last glacial
maximum, Glob. Ecol. Biogeogr. 3 (1993) 67–76.
[39] I.C. Prentice, W. Cramer, S.P. Harrison, R. Leemans, R.A.
Monserud, A.M. Solomon, A global biome model based on
plant physiology and dominance, soil properties and climate, J.
Biogeogr. 19 (1992) 117–134.
[40] O. Peyron, C. Begeot, S. Brewer, O. Heiri, M. Magny,
L. Millet, P. Ruffaldi, E. Van Campo, G. Yu, Lateglacial
climatic changes in Eastern France (Lake Lautrey) from
pollen, lake-levels, and chironomids, Quat. Res. (in
press).
[41] G.M. Woillard, Grande Pile Peat Bog: a continuous pollen
record for the last 140.000 years, Quat. Res. 9 (1978) 1–21.
[42] A. Pons, J.L. Guiot, J.L. de Beaulieu, M. Reille, Recent
contribution to the climatology of the last glacial–interglacial
cycle based on French pollen sequences, Quat. Sci. Rev. 11
(1992) 439–448.
[43] J.L. de Beaulieu, M. Reille, A long upper Pleistocene pollen
record from Les Echets, near Lyon, France, Boreas 13 (1984)
111–132.
[44] J.F. McManus, G.C. Bond, W.S. Broecker, S. Johnsen, L.
Labeyrie, S. Higgins, High-resolution climate records from the
North Atlantic during the last interglacial, Nature 371 (1994)
326–329.
[45] M.F. Sanchez Goni, F. Eynaud, J.-L. Turon, N.J. Shackleton,
O. Cayre, Direct land–sea correlation for the Eemian and its
comparison with the Holocene: a high resolution palyno-
logical record off the Iberian margin, Neth. J. Geosci. 79
(2000) 345–354.
[46] J.-L. de Beaulieu, V. Andrieu-Ponel, M. Reille, E. Grqger, P.C.Tzedakis, H. Svobodova, An attempt at correlation between
the Velay pollen sequence and the middle Pleistocene
stratigraphy from central Europe, Quat. Sci. Rev. 20 (2002)
1592–1603.
[47] W.H. Zagwijn, An analysis of Eemian climate in western and
central Europe, Quat. Sci. Rev. 15 (1996) 451–469.
[48] U.C. Mqller, J. Pross, E. Bibus, Vegetation response to rapid
climate change in central Europe during the past 140,000 yr
based on evidence from the Fqramos pollen record, Quat. Res.
59 (2003) 235–245.
[49] D. Pailler, E. Bard, High frequency palaeoceanographic
changes during the past 140 000 yr recorded by the organic
matter in sediments of the Iberian margin, Palaeogeogr.
Palaeoclimatol. Palaeoecol. 181 (2002) 431–452.
[50] E. Cortijo, J.-C. Duplessy, L. Labeyrie, H. Leclaire, J. Duprat,
T.C.E. van Weering, Eemian cooling in the Norwegian Sea and
North Atlantic Ocean preceding continental ice-sheet growth,
Nature 372 (1994) 446–449.
[51] J.F. McManus, D.W. Oppo, J.L. Cullen, G.C. Bond, Thermo-
haline circulation and prolonged interglacial warmth in the
north Atlantic, Quat. Res. 58 (2002) 17–21.
[52] M.R. Chapman, N.J. Shackleton, Global ice-volume fluctua-
tions, North Atlantic ice-rafted events, and deep-ocean
circulation changes between 130 and 70 ka, Geology 27
(1999) 795–798.
[53] H. Lischke, A.F. Lotter, A. Fischlin, Untangling a Holocene
pollen record with forest model simulations and independent
climate data, Ecol. Model. 150 (2002) 1–21.
[54] P. Ozenda, Les vegetaux dans la biosphere, Doin, Paris, 1982,
431 pp.
[55] A. Berger, Long-term variations of daily insolation and
Quaternary climatic changes, J. Atmos. Sci. 35 (1978)
2362–2367.
M.F. Sanchez Goni et al. / Earth and Planetary Science Letters 231 (2005) 111–130130
[56] J.R. Petit, J. Jouzel, D. Raynaud, N.I. Barkov, J.-M. Barnola,
I. Basile, M. Bender, J. Chappellaz, M. Davis, G. Delaygue,
M. Delmotte, V.M. Kotlyakov, M. Legrand, V.Y. Lipenkov,
C. Lorius, L. Pepin, C. Ritz, E. Saltzman, M. Stievenard,
Climate and atmospheric history of the past 420,000 years
from the Vostok ice core, Antarctica, Nature 399 (1999)
429–436.
[57] V. Brovkin, A. Ganopolski, Y. Svirezhev, A continuous
climate-vegetation classification for use in climate-biosphere
studies, Ecol. Model. 101 (1997) 251–261.
[58] H. Gallee, J.P. van Ypersele, T. Fichefet, I. Marsiat, C. Tricot,
A. Berger, Simulation of the last glacial cycle by a coupled,
sectorially averaged climate-ice sheet model: Part II. Response
to insolation and CO2 variation, J. Geophys. Res. 97 (1992)
15713–15739.
[59] M. Crucifix, M.F. Loutre, P. Tulkens, T. Fichefet, A. Berger,
Climate evolution during the Holocene: a study with an earth
system model of intermediate complexity, Clim. Dyn. 19
(2002) 43–60.
[60] M. Crucifix, A. Berger, Simulation of ocean–ice sheet
interactions during the last deglaciation, Paleoceanography
17 (2002) 1054.
[61] M. Khodri, Y. Leclainche, G. Ramstein, P. Braconnot, O.
Marti, E. Cortijo, Simulating the amplification of orbital
forcing by ocean feedbacks in the last glaciation, Nature 410
(2001) 570–574.
[62] S. Klotz, J. Guiot, V. Mosbrugger, Continental European
Eemian and early Wqrmian climate evolution: comparing
signals using different quantitative reconstruction approaches
based on pollen, Glob. Planet. Change 789 (2003) 1–18.
[63] T. Felis, G. Lohmann, H. Kunhert, S.J. Lorenz, D. Scholz, J.
P7tzold, S.A. Al-Rousan, S.M. Al-Moghrabi, Increased
seasonality in Middle East temperatures during the last
interglacial period, Nature 429 (2004) 164–168.
[64] J. Mangerud, Ice sheet limits on Norway and the Norwegian
continental shelf., in: J.G. Ehlers, P. Gibbard (Eds.), Quater-
nary glaciations—extent and chronology, Elsevier, Amster-
dam, 2004, pp. 271–294.