Increasing Energy Efficiency of Processor Caches via Line ...
116
UNIVERSIDADE FEDERAL DO RIO GRANDE DO SUL INSTITUTO DE INFORMÁTICA PROGRAMA DE PÓS-GRADUAÇÃO EM COMPUTAÇÃO MARCO ANTONIO ZANATA ALVES Increasing Energy Efficiency of Processor Caches via Line Usage Predictors Thesis presented in partial fulfillment of the requirements for the degree of Doctor of Computer Science Prof. Dr. Philippe O. A. Navaux Advisor Porto Alegre, 2014
-
Upload
khangminh22 -
Category
Documents
-
view
0 -
download
0
Transcript of Increasing Energy Efficiency of Processor Caches via Line ...

UNIVERSIDADE FEDERAL DO RIO GRANDE DO SULINSTITUTO DE INFORMÁTICA
PROGRAMA DE PÓS-GRADUAÇÃO EM COMPUTAÇÃO
MARCO ANTONIO ZANATA ALVES
Increasing Energy Efficiency ofProcessor Caches via Line Usage Predictors
Thesis presented in partial fulfillmentof the requirements for the degree ofDoctor of Computer Science
Prof. Dr. Philippe O. A. NavauxAdvisor
Porto Alegre, 2014

CIP – CATALOGING-IN-PUBLICATION
Alves, Marco Antonio Zanata
Increasing Energy Efficiency ofProcessor Caches via Line Usage Predictors / Marco AntonioZanata Alves. – Porto Alegre: PPGC da UFRGS, 2014.
116 f.: il.
Thesis (Ph.D.) – Universidade Federal do Rio Grande do Sul.Programa de Pós-Graduação em Computação, Porto Alegre, BR–RS, 2014. Advisor: Philippe O. A. Navaux.
1. Line Usage Predictors. 2. Sub-block Usage Predictors.3. Replacement Policy. 4. Early Write-Back. 5. Cache Memo-ries. 6. Energy Efficient. I. Navaux, Philippe O. A.. II. Título.
UNIVERSIDADE FEDERAL DO RIO GRANDE DO SULReitor: Prof. Carlos Alexandre NettoPró-Reitor de Coordenação Acadêmica: Prof. Pedro Cezar Dutra FonsecaPró-Reitor de Pós-Graduação: Prof. Vladimir Pinheiro do NascimentoDiretor do Instituto de Informática: Prof. Luís da Cunha LambCoordenador do PPGC: Prof. Luigi CarroBibliotecária-Chefe do Instituto de Informática: Beatriz Regina Bastos Haro

Dedicated to my parents and my beloved wife.

ACKNOWLEDGEMENTS
To all my family, friends, collaborators and advisors a sincere thank you.


LIST OF FIGURES
Figure 1.1: Breakdown of Core 2 Duo energy consumption. . . . . . . . . . . . . 24Figure 1.2: Breakdown of Sandy Bridge energy consumption. . . . . . . . . . . 24
Figure 2.1: Opportunities for increasing the cache memory efficiency. . . . . . . 30Figure 2.2: Overall cache energy consumption for the oracle line usage and ora-
cle sub-block usage predictors. . . . . . . . . . . . . . . . . . . . . . 31
Figure 3.1: SiNUCA architecture with its main components and interconnections. 41Figure 3.2: Results for the single-threaded microbenchmarks. . . . . . . . . . . . 54Figure 3.3: Results for the SPEC-CPU2006 suite. . . . . . . . . . . . . . . . . . 57Figure 3.4: Results for the SPEC-OMP2001 suite. . . . . . . . . . . . . . . . . . 58Figure 3.5: Results for the NAS-NPB suite. . . . . . . . . . . . . . . . . . . . . 58Figure 3.6: Sandy Bridge simulation performance for the SPEC-CPU2006 suite. . 60Figure 3.7: Sandy Bridge simulation performance for the SPEC-OMP2001 suite. 61
Figure 4.1: Scenario with low cache sub-block usage. . . . . . . . . . . . . . . . 64Figure 4.2: Number of sub-blocks accessed per cache line. . . . . . . . . . . . . 65Figure 4.3: Number of sub-block accesses before cache line eviction. . . . . . . . 66Figure 4.4: Potential for L1 cache energy savings for two oracle predictors. . . . 67Figure 4.5: DSBP: Mechanism architecture including cache metadata and PHT. . 68Figure 4.6: DSBP: Working example. . . . . . . . . . . . . . . . . . . . . . . . 70Figure 4.7: DSBP: Mechanism accuracy results. . . . . . . . . . . . . . . . . . . 73Figure 4.8: DSBP: Total energy consumption of the cache sub-system. . . . . . . 74Figure 4.9: DSBP: Normalized extra cache misses. . . . . . . . . . . . . . . . . 76Figure 4.10: DSBP: Normalized execution time. . . . . . . . . . . . . . . . . . . 76Figure 4.11: DSBP: Pattern History Table (PHT) design space exploration. . . . . 77
Figure 5.1: Potential of speedup for a perfect early write-back predictor. . . . . . 80Figure 5.2: Memory requests and write-back operations over time for libquantum. 81Figure 5.3: Memory requests and write-back operations over time for gcc. . . . . 81Figure 5.4: Potential for LLC energy savings for an oracle line usage predictor. . 82Figure 5.5: DEWP: Mechanism architecture including cache metadata and AHT. 83Figure 5.6: DEWP: Mechanism accuracy results. . . . . . . . . . . . . . . . . . 87Figure 5.7: DEWP: Total energy consumption of the cache sub-system. . . . . . 88Figure 5.8: DEWP: Normalized extra cache misses. . . . . . . . . . . . . . . . . 88Figure 5.9: DEWP: Normalized execution time. . . . . . . . . . . . . . . . . . . 88Figure 5.10: DEWP: Impact of varying the LLC size on energy and performance. . 90Figure 5.11: Average number of cycles between the OS context-switch. . . . . . . 91
Figure 6.1: MIXED: Total energy consumption of the cache sub-system. . . . . . 94Figure 6.2: MIXED: Normalized cache misses. . . . . . . . . . . . . . . . . . . 94Figure 6.3: MIXED: Normalized execution time. . . . . . . . . . . . . . . . . . 96
LIST OF TABLES
Table 2.1: State-of-the-art last access predictors. . . . . . . . . . . . . . . . . . 34Table 2.2: State-of-the-art last write predictors. . . . . . . . . . . . . . . . . . . 35
Table 3.1: Comparison of state-of-the-art simulators. . . . . . . . . . . . . . . . 40Table 3.2: Source code example written in C and Assembly. . . . . . . . . . . . 45Table 3.3: SiNUCA traces for a simple source code. . . . . . . . . . . . . . . . 45Table 3.4: Average number of instructions (millions) per thread. . . . . . . . . . 49Table 3.5: Memory footprint of the benchmarks. . . . . . . . . . . . . . . . . . 50Table 3.6: Parameters to model the Core 2 Duo and Sandy Bridge processors. . . 51Table 3.7: Single-threaded microbenchmarks results for Core 2 Duo. . . . . . . 52Table 3.8: Single-threaded microbenchmarks results for Sandy Bridge. . . . . . 53Table 3.9: Multi-threaded microbenchmarks results for Core 2 Duo. . . . . . . . 55Table 3.10: Multi-threaded microbenchmarks results for Sandy Bridge. . . . . . . 55
Table 4.1: DSBP: Total energy consumption of the cache sub-system. . . . . . . 75
Table 5.1: DEWP: Total energy consumption of the cache sub-system. . . . . . 89
Table 6.1: MIXED: Total energy consumption of the cache sub-system. . . . . . 95


LIST OF ABBREVIATIONS AND ACRONYMS
AHT Access History Table
AIP Access Interval Predictor
AL Added Latency for column accesses
BBV Basic Block Vector
BTB Branch Target Buffer
CAS Column Address Strobe
CCD Column to Column Delay
CMP Chip Multiprocessor
CMT Chip Multithreading
CWD Column Write Delay
DBI Dynamic Binary Instrumentation
DDR Double Data Rate
DEWP Dead Line and Early Write-Back Predictor
DRAM Dynamic Random Access Memory
DSBP Dead Sub-Block Predictor
FAW Four row Activation Window
FCFS First-Come First-Serve
GAg Global Adaptive branch prediction using one Global PHT
GAs Global Adaptive branch prediction using per-Set PHT
GCC GNU Compiler Collection
GEMS General Execution-driven Multiprocessor Simulator
ILP Instruction Level Parallelism
IPC Instructions per Cycle
ISA Instruction Set Architecture
KIPS Kilo Instructions per Second
LFSR Linear Feedback Shift Register
LLC Last-Level Cache
LRU Least Recently Used
LTP Last-Touch Predictor
LvP Live-time Predictor
LWP Last Write Predictor
McPAT Multi-core Power, Area, and Timing
MOB Memory Order Buffer
MPKI Misses per Kilo Instructions
MSHR Miss-Status Handling Registers
NAS Numerical Aerodynamic Simulation
NoC Network-on-Chip
NUCA Non-Uniform Cache Architecture
NUMA Non-Uniform Memory Access
OoO Out-of-Order
OpenMP Open Multi-Processing
OS Operating System
PAg Per-address Adaptive branch prediction using one Global PHT
PAs Per-address Adaptive branch prediction using per-Set PHT
PC Program Counter
PCM Performance Counter Monitor
PHT Pattern History Table
RAPL Running Average Power Limit
RAS Row Address Strobe

RAT Registers Alias Table
RC Row Cycle
RCD RAS to CAS Delay
ROB Reorder Buffer
RP Row Precharge
RRD Row to Row activation Delay
RTP Read To Precharge
SDP Skewed Dead-Block Predictor
SFP Spatial Footprint Predictor
SiNUCA Simulator of Non-Uniform Cache Architectures
SMT Simultaneous Multi-Threading
SPP Spatial Pattern Predictor
SSV Search Set Vector
TLB Translation Look-aside Buffer
TLP Thread Level Parallelism
VWQ Virtual Write Queue
WR Write To Read delay time
WTR Write Recovery time

CONTENTS
ABSTRACT . . . . . . . . . . . . . . . . . . . . . . . . . . . . . . . . . . . 19
RESUMO . . . . . . . . . . . . . . . . . . . . . . . . . . . . . . . . . . . . . 21
1 INTRODUCTION . . . . . . . . . . . . . . . . . . . . . . . . . . . . . . 231.1 The Problem . . . . . . . . . . . . . . . . . . . . . . . . . . . . . . . . . 231.2 Motivation . . . . . . . . . . . . . . . . . . . . . . . . . . . . . . . . . . 251.3 Hypotheses and Objectives . . . . . . . . . . . . . . . . . . . . . . . . . 261.4 Contributions . . . . . . . . . . . . . . . . . . . . . . . . . . . . . . . . . 271.5 Document Organization . . . . . . . . . . . . . . . . . . . . . . . . . . . 27
2 ENERGY EFFICIENCY IN CACHE MEMORIES . . . . . . . . . . . . . 292.1 Sources of Inefficiency in Cache Memories . . . . . . . . . . . . . . . . . 292.2 Related work . . . . . . . . . . . . . . . . . . . . . . . . . . . . . . . . . 322.2.1 Line Usage Predictors . . . . . . . . . . . . . . . . . . . . . . . . . . . . 322.2.2 Counter Based Dead Line Predictor . . . . . . . . . . . . . . . . . . . . . 332.2.3 Trace Based Dead Line Predictors . . . . . . . . . . . . . . . . . . . . . 332.2.4 Time Based Dead Line Predictors . . . . . . . . . . . . . . . . . . . . . . 332.2.5 Last Write Predictors . . . . . . . . . . . . . . . . . . . . . . . . . . . . 342.2.6 Overall Comparison . . . . . . . . . . . . . . . . . . . . . . . . . . . . . 34
3 SIMULATOR OF NON-UNIFORM CACHE ARCHITECTURE (SINUCA) 373.1 Related Work . . . . . . . . . . . . . . . . . . . . . . . . . . . . . . . . . 383.2 SiNUCA . . . . . . . . . . . . . . . . . . . . . . . . . . . . . . . . . . . . 403.2.1 System Model . . . . . . . . . . . . . . . . . . . . . . . . . . . . . . . . 413.2.2 Processor Description . . . . . . . . . . . . . . . . . . . . . . . . . . . . 433.2.3 Simulator Traces . . . . . . . . . . . . . . . . . . . . . . . . . . . . . . 443.2.4 Energy Modeling . . . . . . . . . . . . . . . . . . . . . . . . . . . . . . 463.3 Microbenchmarks . . . . . . . . . . . . . . . . . . . . . . . . . . . . . . 473.3.1 Single-Threaded Microbenchmarks . . . . . . . . . . . . . . . . . . . . . 473.3.2 Multi-Threaded Microbenchmarks . . . . . . . . . . . . . . . . . . . . . 483.4 Evaluation . . . . . . . . . . . . . . . . . . . . . . . . . . . . . . . . . . . 493.4.1 Methodology . . . . . . . . . . . . . . . . . . . . . . . . . . . . . . . . 493.4.2 Results . . . . . . . . . . . . . . . . . . . . . . . . . . . . . . . . . . . . 523.4.3 Sources of Difference . . . . . . . . . . . . . . . . . . . . . . . . . . . . 573.4.4 Simulator Performance . . . . . . . . . . . . . . . . . . . . . . . . . . . 603.5 Summary . . . . . . . . . . . . . . . . . . . . . . . . . . . . . . . . . . . 61

4 DEAD SUB-BLOCK PREDICTOR (DSBP) . . . . . . . . . . . . . . . . 634.1 Motivation . . . . . . . . . . . . . . . . . . . . . . . . . . . . . . . . . . 644.1.1 Cache Line Usage on the Sub-Block Level . . . . . . . . . . . . . . . . . 644.1.2 Potential for Energy Savings in L1 Cache . . . . . . . . . . . . . . . . . 674.2 The Dead Sub-Block Predictor (DSBP) . . . . . . . . . . . . . . . . . . . 674.2.1 Usage Example . . . . . . . . . . . . . . . . . . . . . . . . . . . . . . . 694.2.2 Improving the Cache Replacement Policy . . . . . . . . . . . . . . . . . 704.2.3 Prefetching Adaptations . . . . . . . . . . . . . . . . . . . . . . . . . . . 704.2.4 Implementation on Multiple Cache Levels . . . . . . . . . . . . . . . . . 714.3 Methodology . . . . . . . . . . . . . . . . . . . . . . . . . . . . . . . . . 714.4 Evaluation . . . . . . . . . . . . . . . . . . . . . . . . . . . . . . . . . . . 724.4.1 Mechanism Accuracy . . . . . . . . . . . . . . . . . . . . . . . . . . . . 724.4.2 Energy Savings . . . . . . . . . . . . . . . . . . . . . . . . . . . . . . . 734.4.3 Performance Impact . . . . . . . . . . . . . . . . . . . . . . . . . . . . . 744.5 Design Space Exploration . . . . . . . . . . . . . . . . . . . . . . . . . . 764.6 Summary . . . . . . . . . . . . . . . . . . . . . . . . . . . . . . . . . . . 77
5 DEAD LINE AND EARLY WRITE-BACK PREDICTOR (DEWP) . . . . 795.1 Motivation . . . . . . . . . . . . . . . . . . . . . . . . . . . . . . . . . . 805.1.1 Sensitivity to Early Write-Back . . . . . . . . . . . . . . . . . . . . . . . 805.1.2 Potential for Energy Savings in LLC . . . . . . . . . . . . . . . . . . . . 815.1.3 Overall Potential Benefits . . . . . . . . . . . . . . . . . . . . . . . . . . 825.2 The Dead Line and Early Write-Back Predictor (DEWP) . . . . . . . . 825.2.1 Overview of the Mechanism . . . . . . . . . . . . . . . . . . . . . . . . 825.2.2 Mechanism Operations . . . . . . . . . . . . . . . . . . . . . . . . . . . 835.2.3 Improving the Cache Replacement Policy . . . . . . . . . . . . . . . . . 845.3 Methodology . . . . . . . . . . . . . . . . . . . . . . . . . . . . . . . . . 855.4 Evaluation . . . . . . . . . . . . . . . . . . . . . . . . . . . . . . . . . . . 855.4.1 Mechanism Accuracy . . . . . . . . . . . . . . . . . . . . . . . . . . . . 865.4.2 Energy Savings . . . . . . . . . . . . . . . . . . . . . . . . . . . . . . . 865.4.3 Performance Impact . . . . . . . . . . . . . . . . . . . . . . . . . . . . . 875.5 Design Space Exploration . . . . . . . . . . . . . . . . . . . . . . . . . . 895.6 Summary . . . . . . . . . . . . . . . . . . . . . . . . . . . . . . . . . . . 90
6 COMBINING DSBP AND DEWP . . . . . . . . . . . . . . . . . . . . . 936.1 Introduction . . . . . . . . . . . . . . . . . . . . . . . . . . . . . . . . . . 936.2 Evaluation . . . . . . . . . . . . . . . . . . . . . . . . . . . . . . . . . . . 936.2.1 Energy Savings . . . . . . . . . . . . . . . . . . . . . . . . . . . . . . . 946.2.2 Performance Impact . . . . . . . . . . . . . . . . . . . . . . . . . . . . . 946.3 Summary . . . . . . . . . . . . . . . . . . . . . . . . . . . . . . . . . . . 96
7 CONCLUSIONS AND FUTURE WORK . . . . . . . . . . . . . . . . . . 977.1 Future Work . . . . . . . . . . . . . . . . . . . . . . . . . . . . . . . . . 977.2 Published Papers . . . . . . . . . . . . . . . . . . . . . . . . . . . . . . . 98
REFERENCES . . . . . . . . . . . . . . . . . . . . . . . . . . . . . . . . . . 101

APPENDIX A ADDITIONAL VALIDATION RESULTS . . . . . . . . . . . 107A.1 SPEC-CPU2006 Results . . . . . . . . . . . . . . . . . . . . . . . . . . . 107A.2 SPEC-OMP2001 Results . . . . . . . . . . . . . . . . . . . . . . . . . . . 109A.3 NAS-NPB Results . . . . . . . . . . . . . . . . . . . . . . . . . . . . . . . 110
APPENDIX B RESUMO EXPANDIDO EM PORTUGUÊS . . . . . . . . . 111B.1 Simulator of Non-Uniform Cache Architecture (SiNUCA) . . . . . . . . 112B.2 Dead Sub-Block Predictor (DSBP) . . . . . . . . . . . . . . . . . . . . . 114B.3 Dead Line and Early Write-Back Predictor (DEWP) . . . . . . . . . . . 115B.4 Combinando os mecanismos DSBP e DEWP . . . . . . . . . . . . . . . . 116B.5 Conclusões . . . . . . . . . . . . . . . . . . . . . . . . . . . . . . . . . . 116

ABSTRACT
Increasing Energy Efficiency of Processor Caches via Line Usage Predictors
Energy consumption is becoming more important for processor architectures, wherethe number of cores inside the chip is increasing and the total power budget is kept at thesame level or even reduced. Thus, energy saving techniques such as frequency scalingoptions and automatic shutdown of sub-systems are being used to maintain the trade-offbetween power and performance. To deliver high performance, current Chip Multiproces-sors (CMPs) integrate large caches in order to reduce the average memory access latencyby allocating the applications’ working set on-chip. These cache memories have tradi-tionally been designed to exploit temporal locality by using smart replacement policies,and spatial locality by fetching entire cache lines from memory on a cache miss.
However, recent studies have shown that the number of sub-blocks within a line thatare actually used is often low, and those sub-blocks that are used are accessed only a fewtimes before becoming dead (that is, never accessed again). Additionally, many of thecache lines remain powered for a long period of time even if the data is not used again,or is invalid. For modified cache lines, the cache memory waits until the line is evictedto perform the write-back to next memory level. These write-backs compete with readrequests (processor demand and cache prefetch), increasing the pressure on the memorycontroller. For these reasons, the energy efficiency and performance of cache memoriesare not ideal.
This thesis introduces cache line usage predictors to increase the energy efficiencyof cache memories. We propose the Dead Sub-Block Predictor (DSBP) and Dead Lineand Early Write-Back Predictor (DEWP) mechanisms to enable energy savings withoutperformance degradation. DSBP is used to predict which sub-blocks of a cache line willbe actually accessed and how many times they will be used in order to bring into the cacheonly those sub-blocks that are necessary, and power them off after they are accessedthe predicted number of times. DEWP predicts dead lines as soon as they receive thelast access, and turns off these lines. Dirty lines are scheduled for write-back after thelast write operation occurs, increasing the energy savings potential and also reducing thepressure on the memory controller. Both proposed mechanisms also reduce pollution incache memories by prioritizing dead lines for eviction in the existing replacement policy.
Although each introduced mechanism is capable of performing separately inside asystem, both mechanisms can also be mixed in the same cache hierarchy. This mixedimplementation is interesting because the sub-block granularity is more suitable for cachelevels closer to the processor, where the cache lines are quickly evicted, while the Last-Level Cache (LLC) tends to use the whole cache line before its eviction.
In order to evaluate our proposed mechanisms, we introduce the Simulator of Non-Uniform Cache Architectures (SiNUCA). This cycle-accurate microarchitecture simula-tor is validated in terms of performance and energy consumption by comparing it to a real

processor. Our performance results were obtained executing single-threaded applicationsfrom SPEC-CPU2006 and multi-threaded applications from SPEC-OMP2001 and NAS-NPB benchmark suites. The energy related results were obtained by integrating SiNUCAwith the Multi-core Power, Area, and Timing (McPAT) framework and the CACTI powermodeling tool.
When applying our mechanisms on all the cache levels, we observe on average a 36%energy reduction for DSBP, 25% energy reduction using DEWP and an average reductionof 37% in the energy consumption applying DSBP on L1 and L2 and DEWP on the LLC.All these reductions caused a negligible performance loss of less than 4% on average.
Keywords: Line Usage Predictors, Sub-block Usage Predictors, Replacement Policy,Early Write-Back, Cache Memories, Energy Efficient.

RESUMO
Aumentando a Eficiência Energética da Memória Cache de Processadoresatravés de Preditores de Uso de Linhas da Cache
O consumo de energia se torna cada vez mais importante para a arquitetura de pro-cessadores, onde o número de cores dentro de um mesmo chip está aumentando mas ototal de energia disponível se mantém no mesmo nível ou até mesmo se reduz. Assim,técnicas para economizar energia, tais como opções de escala de frequência e desliga-mento automático de subsistemas, estão sendo usadas para manter a troca entre energia edesempenho. Para se obter alto desempenho, os atuais Chip Multiprocessors (CMPs) in-tegram grandes memórias cache a fim de reduzir a latência média para acesso a memóriaprincipal, através da alocação do conjunto de dados da aplicação dentro do chip. Essasmemórias cache tem sido projetadas tradicionalmente para explorar a localidade tempo-ral usando políticas de substituição inteligentes e localidade espacial buscando todos osdados da linha da cache após uma falta de dados.
Entretanto, estudos recentes mostraram que o número de sub-blocos dentro da linha damemória cache, que são realmente usados, costuma ser baixo, sendo que, os sub-blocosque são usados recebem poucos acessos antes de se tornarem mortos (isto é, nunca maissão acessados). Além disso, muitas da linhas da memória cache permanecem ligadaspor longos períodos de tempo, mesmo que os dados não sejam usados novamente ou sãoinválidos. Para linhas de cache modificadas, a memória cache aguarda até que a linha sejaexpulsa para que esta seja gravada (write-back) de volta no próximo nível de memória.Essas escritas competem com as requisições de leitura (demanda do processador e pré-busca da cache), aumentando a pressão no controlador de memória. Por essas razões, aeficiência energética e o desempenho das memórias cache não são ideais.
Essa tese propõe a aplicação de preditores de uso de linhas da cache para aumentar aeficiência energética das memórias cache. São propostos os mecanismos Dead Sub-BlockPredictor (DSBP) e Dead Line and Early Write-Back Predictor (DEWP) para permitireconomia de energia sem que haja degradação do desempenho. DSBP é usado para pre-ver quais sub-blocos da linha da cache serão usados e quantas vezes eles serão acessadosde forma a trazer para a cache apenas os sub-blocos úteis e desliga-los após eles seremacessados pelo número de vezes previsto. DEWP prevê linhas de cache mortas assim queelas recebem o último acesso, desligando essas linhas. As linhas sujas são escalonadaspara sofrerem write-back após a última operação de escrita, aumentando o potencial desalvar energia, reduzindo também a pressão no controlador de memória. Ambos os me-canismos propostos também reduzem a poluição nas memórias cache, dando prioridadepara a expulsão de linhas mortas, melhorando as atuais políticas de substituição.
Embora cada mecanismo apresentado seja capaz de funcionar separadamente dentrodo sistema, ambos os mecanismos podem também ser misturados em uma mesma hierar-quia de cache. Essa implementação mista é interessante pois a granularidade de sub-blocoé preferível para níveis de cache próximos do processador, onde as linhas de memória ca-

che são expulsas rapidamente, enquanto o último nível de cache tende a usar toda a linhaantes da sua expulsão.
Com o intuito de avaliar os mecanismos propostos, é apresentado o Simulator of Non-Uniform Cache Architectures (SiNUCA). Esse simulador de microarquitetura com pre-cisão de ciclos é validado em termos de desempenho e consumo de energia através dacomparação com um processador real.
Os resultados de desempenho foram obtidos executando aplicações das cargas de tra-balho single-threaded do conjunto SPEC-CPU2006 e aplicações multi-threaded dos con-juntos SPEC-OMP2001 e NAS-NPB. Os resultados relativos a energia foram obtidos inte-grando o SiNUCA com as ferramentas de modelagem Multi-core Power, Area, and Timing(McPAT) e CACTI.
Quando aplicados os mecanismos em todos os níveis de memória cache, observou-seem média uma redução de 36% no consumo de energia usando o DSBP, 25% usando oDEWP e 37% quando usou-se o DSBP nos níveis L1 e L2 e o DEWP no último nível.Todas essas reduções causaram uma perda desprezível de desempenho de menos de 4%em média.
Palavras-chave: Preditores de Linha da Cache, Memórias Cache, Eficiência Energética.
23
1 INTRODUCTION
High performance computing uses aggressive techniques to obtain parallelism in mul-tiple levels: at the instruction level using superscalar pipelines with Out-of-Order (OoO)execution (SMITH; SOHI, 1995), larger OoO execution windows, frequency increase,and others (HENNESSY; PATTERSON, 2007) such as better branch predictors and dataprefetchers; at the thread and process level using Chip Multithreading (CMT) techniqueswith Chip Multiprocessor (CMP).
However, Instruction Level Parallelism (ILP) techniques have less room for improve-ments due to limits imposed by wire-delay problems (clock wall), power consumptionlimit (power wall) (BORKAR, 1999), and ILP extraction problems (ILP wall) (AGAR-WAL et al., 2000). Thus, Thread Level Parallelism (TLP) techniques such as CMP withincreasing number of cores have become the most likely way for the industry to continuedelivering more powerful processors on each new generation.
Most of the multi-core processors are built with cores simpler than traditional singlecores, with shorter pipelines and simpler control structures (OLUKOTUN et al., 1996).This leads to the possibility of integrating more cores on the same physical silicon area.This complexity reduction on the cores is also beneficial for the power constraints insidethe chip. For these reasons, the focus has changed to also explore the thread and processparallelism (UNGERER; ROBIC; SILC, 2002).
Recently, energy efficiency has become a key design parameter in computer architec-tures. While the number of transistors on a chip has been increasing rapidly, the totalpower budget remains at the same level or even decreases. In this context, each tech-nique that leads to reduction of power consumption has a great impact on the total energyconsumption of the system. Thus, new processors begin to present frequency scaling op-tions, automatic shutdown of sub-systems and other techniques to ensure that machineswill reduce the unnecessary energy consumption, and will consume full power only whendemanded.
1.1 The Problem
Cache memories, while key to high performance, consume a significant fraction oftotal chip power (LI et al., 2009), varying from 15% to 23% of the total chip power. Assuch, designing energy efficient processors starts with efficient design of such power-hungry components.
In order to evaluate the cache energy consumption inside the chip, we executed theSPEC-CPU2006 single threaded benchmark suite and the SPEC-OMP2001 and NAS-NPB parallel benchmark suites modeling two different processors using the McPAT frame-

24
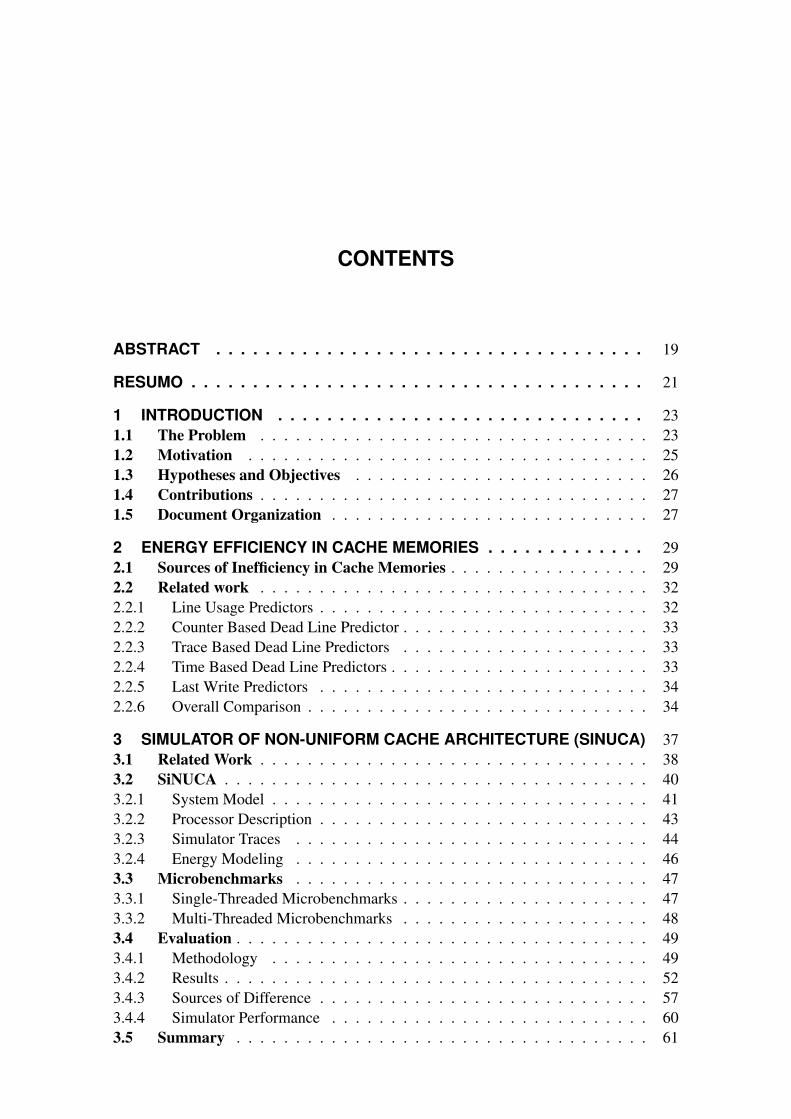
Figure 1.1: Breakdown of Core 2 Duo energy consumption, executing SPEC-CPU2006,SPEC-OMP2001 and NAS-NPB benchmark suites.
Cores62%
I-L18%
D-L117%
LLC11%
Buses2%
(a) Total chip energy consumption.
I-L1 Dynamic15%
I-L1 Static7%
D-L1 Dynamic26%
D-L1 Static20%
LLC Dynamic
2%
LLC Static30%
(b) Cache memory energy consumption.
Figure 1.2: Breakdown of Sandy Bridge energy consumption, executing SPEC-CPU2006,SPEC-OMP2001 and NAS-NPB benchmark suites.
Cores50%
I-L15%
D-L127%
L2 3%
LLC8%
Buses3%
Mem. Ctrl.4%
(a) Total chip energy consumption.
I-L1 Dynamic7%
I-L1 Static4%
D-L1 Dynamic
45%
D-L1 Static17%
L2 Dynamic
1%
L2 Static6%
LLC Dynamic
1%
LLC Static19%
(b) Cache memory energy consumption.
work (LI et al., 2009). The parallel benchmarks execute with the same number of threadsas the number of cores available in the processor.
Figure 1.1 shows the Intel Core 2 Duo (Conroe microarchitecture (BOJAN et al.,2007)) energy consumption. The average power consumed by the chip corresponds to22 W according to our energy model. It can be observed that 36% of energy consumedinside the chip is consumed by the cache memories, while each core (2 cores in total) isresponsible for 31% of the energy consumed by the chip (62% in total).
Figure 1.2 shows the Intel Xeon (Sandy Bridge microarchitecture (YUFFE et al.,2011)) energy consumption. The average power consumed by the chip corresponds to37 W. It can be observed that 43% of energy consumed inside the chip is consumed bythe cache memories, while each core (8 cores in total) is responsible for 6% of the energyconsumed by the chip (50% in total).
Due to the reduced power budget, and the increasing portion of energy being con-sumed by the cache memories, mechanisms to improve the cache efficiency are becoming
25
more important. Moreover, as we can see in Figures 1.2(b),1.3(b) the major sources ofenergy consumption inside the cache sub-system are related to the L1 dynamic and staticenergy, and the Last-Level Cache (LLC) static energy, which can be explained by to thehigh number of L1 operations and to the large area occupied by the LLC.
For today’s processors with a fixed cache line size, energy inefficiency can occur ontwo levels: 1) on a cache line level where a line is kept alive much longer than necessary,and 2) on a sub-block level, when parts of a cache line that will never be used are broughtinto the cache, and also when active sub-blocks become dead after a few accesses but arekept alive until the line is evicted.
Besides the energy consumption problem, keeping cache lines that will not be usedanymore (dead lines) inside the cache, increases cache pollution and memory contention.Cache pollution increases when the replacement policy takes wrong decisions by remov-ing alive blocks instead of already dead blocks. Pollution can also increase the numberof cache misses, thus generating negative impact on the performance of the system. Theimpact on memory contention happens when the cache keeps dirty lines which alreadyreceived the last write. By doing so, these lines will only suffer write-back to the mainmemory whenever the cache line is evicted. However, considering that memory accessesoccur in bursts (WANG; KHAN; JIMÉNEZ, 2012a), the write-back operation can in-crease the memory pressure in those moments when lots of data are being requested (burstof operations).
1.2 Motivation
In order to evaluate the inefficiency of current cache memories, we measured theaverage usage of L1 cache lines in the sub-block granularity. Figure 4.2 using SPEC-CPU2006, SPEC-OMP2001 and NAS-NPB shows that on average only 57% of a line isused by the single threaded benchmarks and 81% for multi-threaded benchmarks. Similarresults were observed in (KUMAR; WILKERSON, 1998; CHEN et al., 2004; KHAR-BUTLI; SOLIHIN, 2008). We make the new observation (Figure 4.3) that 83% of sub-blocks become dead after less than four accesses.
Measuring the average time between the last access to a cache line and the line evictionfrom the cache memory, we can evaluate the inefficiency in the cache line granularity. Onaverage the time between the last access to a cache line and its eviction is 40% of thelifetime of the line (KAXIRAS; HU; MARTONOSI, 2001).
These results show that there are several opportunities for energy savings in traditionalcache designs. Cache lines are unused for long periods of time while still consumingenergy. Furthermore, the L1 and L2 caches present more inefficiency on the sub-blocklevel, while the LLC uses the whole line more consistently, but the line is still poweredon for a long time without accesses.
Based on the Sandy Bridge processor, we show in Section 4.1 that an oracle mecha-nism that perfectly predicts the dead sub-blocks inside the L1 cache and turns-off thosesub-blocks can save on average 51% of the L1 cache energy consumption, that representssavings of 34% for the entire cache sub-system energy consumption.
Another oracle mechanism, presented in Section 5.1, that turns off LLC lines aftertheir last access or when the cache line becomes invalid, generates LLC energy savingsof 65% on average, that represents savings of 11% for the entire cache sub-system energyconsumption.

26
Considering the high theoretical energy savings achieved by cache line usage predic-tors, at the sub-block or cache line granularities, the benefits of such mechanisms insidethe cache memory to increase its energy efficiency are clear.
1.3 Hypotheses and Objectives
In order to increase the energy efficiency of cache memories, we formulate the fol-lowing hypotheses:
• By studying the historic memory access behavior of the application, it is possibleto predict the cache line usage.
• Using the predicted cache line usage, dead lines can be identified and turned off inorder to save energy and reduce the cache pollution and memory pressure.
• Looking at the sub-block granularity allows to further increase the energy savings.
Based on these hypotheses, the main goal of this thesis is to introduce mechanisms toincrease the energy efficiency of the cache memories. This objective will be achieved bythe following steps:
• We propose a Dead Sub-Block Predictor (DSBP) to predict at run-time the cacheline usage at the sub-block granularity. This mechanism will be used to store onlythe useful sub-blocks inside the cache line and to turn-off the sub-blocks when theybecome dead.
• We propose a Dead Line and Early Write-Back Predictor (DEWP) to detect whena cache line receives its last read and last write. This predictor will be used to earlywrite-back dirty lines as soon as they receive their last access and to turn-off theline as it receives its last read.
• To evaluate the new mechanisms, we developed the Simulator of Non-UniformCache Architectures (SiNUCA), a new cycle accurate, trace-driven simulator com-posed of the following main components: processor, cache memories, interconnec-tions and memory system. This simulator is able to simulate multi-core systems,with multi-banked caches and Network-on-Chip (NoC) interconnections. This sim-ulator is validated with a real machine in terms of performance and energy con-sumption.
DSBP and DEWP overlap in functionalities, however, the sub-block granularity fitsbetter for small caches that are closer to the processor while the line granularity fits betterfor big LLC memories. The smaller caches have a lower sub-block usage compared to thecache levels closer to the main memory. The reason for this low usage is that the smallercaches tend to evict the cache lines sooner, reducing the chances for full cache line usage.
The dead line predictors should also be used to improve the cache replacement policyin order to reduce cache pollution. For the cases where the cache lines are dirty, the lastwrite predictor will help to reduce the memory pressure in the memory controller.
The general goal of this thesis is to design mechanisms that enable energy savingsin the cache memory, maintaining the performance of the system. The overhead of suchmechanisms will also be evaluated in order to show their benefits and possible drawbacks.

27
The simulator used for the evaluations will be mainly developed to verify our mech-anisms, by providing a controlled environment capable to simulate the microarchitectureinside the cores, the cache memory sub-system with multi-banked caches, including theNoC interconnection and a detailed memory controller.
1.4 Contributions
The main contributions of this thesis are:
• DSBP – Dead Sub-Block Predictor (ALVES et al., 2012)
Sub-block usage predictor: A mechanism to predict and turn on only the usefulsub-blocks of each cache line.Dead sub-block predictor: A mechanism to predict when each sub-block inside acache line becomes dead and turn off these dead sub-blocks.Earlier eviction of dead lines: A mechanism to improve the cache replacement al-gorithm. The sub-block predictor gives feedback to the replacement algorithm afterall the sub-blocks become dead, marking dead lines as future victims for eviction.
• DEWP – Dead Line and Early Write-Back Predictor (ALVES et al., 2013)
Last line read predictor: A mechanism that aims to save energy by turning offdead or invalid cache lines when the cache line receives a write in another cache.Last line write predictor: A mechanism to perform early write-back of dirty cachelines to main memory, since these lines will not be modified anymore.Earlier eviction of dead lines: A predictor to detect whenever a cache line receivesits last access, prioritizing those lines for early eviction.
• SiNUCA – Simulator of Non-Uniform Cache Architectures
Performance and energy validated simulator: Our simulator is validated in termsof performance and energy compared to real processor. It will be used to implementand evaluate our proposed mechanisms.
Compared to the related work, our mechanisms produce more accurate predictionsachieving higher energy savings, with a negligible overhead that keeps the performanceon the same level. DSBP is the first mechanism that is capable of predicting and turningoff cache lines on the sub-block granularity, enabling dynamic and static cache energysavings. DEWP predicts last writes, saving static energy whenever the cache line be-comes dead. Both mechanisms do not require broadcast signals for all the cache lines norcomplex internal simulators to predict the cache line usage.
1.5 Document Organization
The remainder of this text is organized as follows. Background and related work arepresented in Chapter 2. Chapter 3 gives a detailed overview of the new simulator, togetherwith the workloads used in our evaluations. Chapter 4 presents the Dead Sub-BlockPredictor. Chapter 5 introduces the Dead Line and Early Write-Back Predictor. Chapter 6presents the analysis of a system implementing both predictors. Chapter 7 discuss themain conclusions of this thesis. Appendix A shows additional SiNUCA validation results.

28
29
2 ENERGY EFFICIENCY IN CACHE MEMORIES
This chapter introduces the concepts and the sources of inefficiency in cache memo-ries. We also discuss the related work on cache usage predictors. The prior work relatedto the simulator is discussed in the next chapter.
2.1 Sources of Inefficiency in Cache Memories
Cache memories are energy and performance inefficient in cache line and sub-blockgranularity. In order to understand the sources of inefficiency some terms must be ex-plained first:
Dead line: A cache line is considered being dead on the period of time between its lastaccess (read or write) and its eviction from the cache memory.
Dead sub-block: In the same way as the dead line, a sub-block is dead after its last access.However, a sub-block may become dead before the line is declared dead. This is becausesome sub-block can be accessed separately from the others.
Cache pollution: The fact of having multiple cache lines, that the program will not use ina close future, residing inside the cache, causing other still useful lines to be prematurelyevicted from the cache, is considered a cache pollution problem. This cache pollutionproblem is also called as cache noise by some authors.
Memory pressure: Considering that memory operations tends to occur in bursts of ac-cesses (see Figure 5.2), the high number of requests into the main memory causes a mem-ory pressure, which is even higher considering that dirty cache lines need to be written-back to the main memory before its complete eviction to make room for a new cache line.These write-back operations competing with the read requests into the memory controlleris a source of a high memory pressure.
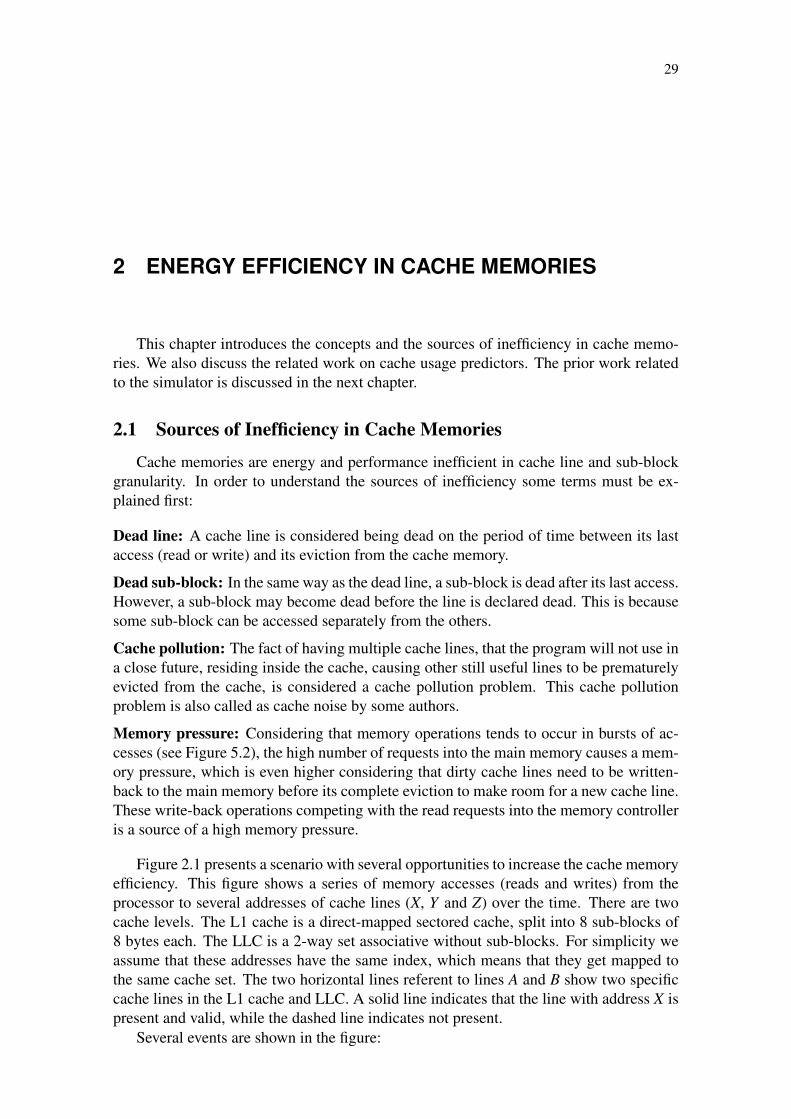
Figure 2.1 presents a scenario with several opportunities to increase the cache memoryefficiency. This figure shows a series of memory accesses (reads and writes) from theprocessor to several addresses of cache lines (X, Y and Z) over the time. There are twocache levels. The L1 cache is a direct-mapped sectored cache, split into 8 sub-blocks of8 bytes each. The LLC is a 2-way set associative without sub-blocks. For simplicity weassume that these addresses have the same index, which means that they get mapped tothe same cache set. The two horizontal lines referent to lines A and B show two specificcache lines in the L1 cache and LLC. A solid line indicates that the line with address X ispresent and valid, while the dashed line indicates not present.
Several events are shown in the figure:

30
Figure 2.1: Opportunities for increasing the cache memory efficiency, modeling a direct-mapped L1 cache and 2-way set associative LLC.
Proc
esso
r Rea
dX[
1]L1
Rea
dX
LLC
Rea
dX
DR
AM A
nswe
rXLL
C A
nswe
rXL1
Ans
werX
[1]
Proc
esso
r Rea
dX[
3]L1
Ans
werX
[3]
Proc
esso
r Writ
e X[
5]
L1 W
rite-
Back
X
L1 In
valid
atio
nX
Proc
esso
r Rea
dX[
1]L1
Rea
dX
LLC
Ans
werX
L1 A
nswe
rX[1
]
Proc
esso
r Rea
dX[
3]L1
Ans
werX
[3]
Proc
esso
r Writ
e X[
5]L1
Inva
lidat
ion
X
L1 W
rite-
Back
X
LLC
Writ
e-Ba
ck X
Address X Not Present
Address X Present
Unused Sub-Block
Used Sub-Block
L1Cache
LLCCache
Sect
ored
Cac
he L
ine
Processor
MemoryController
Energy Savings
Less Memory Pressure
Less Cache Pollution
Opportunities for:
X Ev
ictio
n
X Ev
ictio
n
X Ev
ictio
n
Event 1 Event 2 Event 3
Event 1: The processor reads the address X, requesting the sub-block 1. As the line is notpresent in the L1 cache and LLC, it needs to be requested from the memory controller.After one more read and write operations all the sub-blocks inside the cache line becomedead due to the read of another line. Due to another cache accesses the address X iswritten-back to the LLC and then evicted from the L1 cache.
On the sub-block level (L1 cache), we can observe two opportunities to save staticenergy. First, when a never used sub-block is brought to the cache line, it could be turnedoff. Second, when a sub-block receives its last access and it becomes dead, it could also beturned off. Cache pollution could also be reduced by early evicting the cache line X afterit receives its last access (all the sub-blocks are dead). Notice that the sub-block numberX[5] needs to be turned on until the write operation, considering that the processor iscapable of writing only one part within the sub-block.
On the cache line granularity (LLC), we have the opportunity to save energy by turningoff the cache line during the time the line is invalid.

31
Event 2: Once again, the processor requests the address X, bringing a copy of this linefrom the LLC. We can observe the same opportunities to save energy and reduce cachepollution.
Event 3: At this point, the cache address X is evicted from the L1 cache and written-backto the LLC. After a certain period of time, this line X is evicted from the LLC, performingthus a write-back to the main memory of the dirty cache line X. Energy savings can beobtained by turning off the line X in the LLC when it is invalid and after it receives thewrite-back. We can also observe opportunities to reduce the memory pressure betweenthe moment when the LLC receives the last write-back of the address X and it writes-backthis line to the main memory. The opportunity to reduce cache pollution happens in thesame time, when the line becomes dead and it could be marked for early eviction to makeroom for a new line.
During a L1 cache miss, the first operation performed by the cache is to access thewhole cache line at the same time as the tag is obtained. The second operation is tocompare the tag to the target memory address and forward the requested bytes in thesame cycle (HUANG et al., 2001). The parallel access to the data and the tag arraysguarantees a low cache latency.
Besides the static energy on the sub-block level, we could also save dynamic energyduring cache reads. If several sub-blocks are turned off, less bytes need to be accessed,which requires less dynamic energy.
The gains in terms of cache energy savings using an oracle line predictor can be easymodeled by computing the time when the line is invalid, as well as between the lastaccess and the line eviction, subtracting the static energy spent on those cycles from thetotal energy consumption of the cache sub-system. For the oracle sub-block predictor, thestatic energy savings can be easily extended from the line predictor. The dynamic energysavings can be computed by analyzing the number of alive sub-blocks on every cache lineaccess. Further modeling details are presented in Sections 4.3 and 5.3.
Figure 2.2: Overall cache energy consumption for the oracle line usage and oracle sub-block usage predictors.
86% 89%97% 98%
91%84% 87%
96% 98%89%
63% 67% 70% 65% 66%
0%10%20%30%40%50%60%70%80%90%
100%
SPEC-CPU2006CINT
SPEC-CPU2006CFP
SPEC OMP2001 NAS-NPB Overall
Ener
gy C
onsu
mpt
ion
L1 Oracle Line Usage LLC Oracle Line Usage L1 Oracle Sub-block Usage
Figure 2.2 presents the overall energy consumption for the entire cache sub-systemconsidering two different oracles (line usage and sub-block usage) applied to differentcache levels (L1 and LLC), modeling a Sandy Bridge machine.
We can observe that energy savings are achievable on both the line and sub-blockgranularities. However, working on the sub-block basis, more opportunities for energysavings are present. The reason is that the applications tend to access the sub-blocksof line unevenly during the lifetime of the line, such that waiting for the whole line tobecome dead loses energy savings opportunities. The oracle mechanisms can also reduce

32
the energy consumption of never used prefetched cache lines, reducing the impact of theselines on the total static energy consumption.
The possible gains in terms of performance are hard to be modeled, because any smalldifference in the replacement policy leads the cache to have a completely different lineallocation.
To exploit these energy savings opportunities, it is necessary to create an accurate andlow overhead mechanism capable of predicting line and sub-block usage. We proposetwo mechanisms to work in both sub-block and cache line granularity, in order to re-duce the energy consumption, while using the performance opportunities to keep the finalexecution time at the same level.
2.2 Related work
Previous work has introduced line usage predictors, dead line predictors and last writepredictors, which are applied to problems such as reducing static energy consumption,prefetching, cache pollution, memory controller contention among others.
This section discusses these mechanisms and compares them to our approaches. Wealso introduce the mechanism based on related work that will be compared to our predic-tors.
2.2.1 Line Usage Predictors
KUMAR; WILKERSON (1998) proposed a Spatial Footprint Predictor (SFP) whichpredicts the neighboring words to be prefetched on a cache miss. The goal is to reducethe L1 miss ratio while keeping the cache pollution at a minimum. Based on run-timehistory tables, the predictor explores spatial locality by using a cache with small lines butfetching multiple neighboring lines that are likely to be used in the near future.
CHEN et al. (2004) proposed a Spatial Pattern Predictor (SPP) to predict cache lineusage patterns. The mechanism uses the Program Counter (PC) and the first data offsetrequested to correlate historical data about line usage to predict future usage patterns ofL1 cache lines. The goal of this technique is to reduce static energy by bringing into thecache just those sub-blocks that were predicted to be accessed. The authors also introducea prefetching technique to bring only the predicted spatial patterns for contiguous groupsof up to 512 bytes.
PUJARA; AGGARWAL (2008) studied three types of mechanisms to predict the use-less data in a cache block (cache noise), guided by the usage history of words in a cacheline. Their results motivate the use of PC and offset as the index of a history table. Inorder to couple their mechanism with any prefetcher, the authors proposed an implemen-tation considering that the pattern of the line being prefetched will be the same as the linewhich triggered the prefetcher.
Line usage predictors like SPP (CHEN et al., 2004) could be easily extended in orderto start predicting dead sub-blocks. We extended SPP to predict useful and dead sub-blocks. However, our results show that DSBP performs on average 10% better in termsof energy reduction than the adapted SPP. Moreover, the adapted SPP increased the totalcache misses on all the cache levels by 20% on average compared to the baseline withoutany predictor. This increase on total cache misses caused a 9% increase in the executiontime.
The reason adapted SPP achieves poor results is that it uses an algorithm that resets theold pattern and starts a new one every time a new cache line comes into the cache so that
33
new patterns can be learned quickly. However, this allows multiple Pattern History Table(PHT) pointers to the same PHT entry to simultaneously co-exist and therefore incorrectpatterns are recorded more frequently.
2.2.2 Counter Based Dead Line Predictor
KHARBUTLI; SOLIHIN (2008) presented two counter-based mechanisms (AIP andLvP). Access Interval Predictor (AIP) counts the number of accesses to the set that hasthe line during the line’s current access interval and identifies it as dead when the eventcount reaches the threshold. Live-time Predictor (LvP) records the number of accessesto a cache line and predicts the line as dead when the access counter reaches a certainthreshold. The results show that LvP delivers higher accuracy with less complexity. Themechanism uses a hash of the PC which caused the cache miss to index into a table thatstores the history of the number of accesses from previously evicted lines. The mechanismis used to identify dead lines and to evict them early, and also to bypass never re-accessedcache lines.
2.2.3 Trace Based Dead Line Predictors
LAI; FIDE; FALSAFI (2001) introduced the Last-Touch Predictor (LTP) which usesan execution trace to predict the last touch to a cache line. The key intuition behind LTPis that memory evictions are triggered by program instructions and that program behaviortends to repeat. The mechanism generates a signature based on a trace of instructions thataccess a cache line. By matching current signatures with previously stored signatures thatlead to dead cache lines, the mechanism can predict when a given line becomes dead. Thegoal of this work is to allow the lines to self-invalidate when their last access is detected.
KHAN et al. (2010) proposed a Skewed Dead-Block Predictor (SDP) to predict deadlines and use these lines as a virtual victim cache. This skewed predictor is similar tothe LTP mechanism, but uses two global tables. Each one of the tables is indexed by adifferent hash function to reduce the impact of conflicts between them. They also proposea more complex mechanism (KHAN et al., 2010), which uses three tables to implementthe skewed predictor. This mechanism also introduces a sampling cache structure whichuses only some of the cache lines to build the prediction table’s information.
2.2.4 Time Based Dead Line Predictors
KAXIRAS; HU; MARTONOSI (2001) presented a cache decay mechanism whichuses theories from competitive algorithms to create a time-based strategy. They exploitlong dead periods by turning off cache lines during such periods. This approach aims toreduce static power dissipated by the cache. Each line contains a counter with a numberof cycles since the last access and each line is turned off after a certain interval. A hi-erarchical counter mechanism is adopted to reduce the bits required per cache line. Thishierarchical counter is formed by a global counter which broadcasts an increment sig-nal to the smaller counters every time it overflows. The authors also explore an adaptivemechanism to automatically choose the best decay interval on a cache line granularity.
ABELLA et al. (2005) introduced the Inter-Access Time per Access Count (IATAC)mechanism to predict and turn off dead lines with the objective of reducing L2 cachestatic energy. This mechanism predicts a cache line to be dead when it detects that the linehas not received any access for a period greater than the average time between differentaccesses. The mechanism keeps track of the average time between accesses in a global

34
table with a separate entry for each access count (i.e., there is a different average timestored for the difference between the 1st and 2nd access and the difference between the2nd and 3rd access and so on).
2.2.5 Last Write Predictors
LEE; TYSON; FARRENS (2000) proposed the Eager Write-back mechanism whichperforms early write-back of dirty lines from the L1 cache whenever the line achievesthe Least Recently Used (LRU) position. The objective of this work is to speculatively“clean” the dirty cache lines prior to their eviction, in order to avoid the performancedegradation during clustering bus traffic in a write-back approach.
STUECHELI et al. (2010) presented the Virtual Write Queue (VWQ) technique,which exposes to the memory controller the dirty blocks near to the LRU position inthe LLC. The mechanism issues scheduled write-backs to improve the write-back effi-ciency when the memory rank is idle, considering that a bank can be formed by morethan one rank. This technique uses a Search Set Vector (SSV) which gathers informationfrom all the sets, in order to keep track of the dirty lines and how close they are from theLRU position. As a cache line becomes close to the LRU position, that line is marked ascritical blocks to write-back.
WANG; KHAN; JIMÉNEZ (2012a) proposed a Last Write Predictor (LWP) to predictwhenever the cache line receives its last write. The prediction mechanism uses threetables with a skewed organization similar to SDP mechanism to detect the last-writtenblocks and store pointers of these blocks into a last-write buffer. The objective of thismechanism is to make the last-write blocks available for the main memory schedulingbefore the line gets evicted. This predictor issues a write-back request to the memorywhen no read request targets the same rank.
WANG; KHAN; JIMÉNEZ (2012b) presents a two level rank idle predictor to sched-ule the write-back to the memory only when long phases of idle rank cycles are predicted.Together with the rank idle predictor, this paper uses the SSV in order to keep track ofdirty lines and send the blocks close to the LRU position to write-back.
2.2.6 Overall Comparison
Table 2.1: State-of-the-art last access predictors.Mechanism Saves Predicts Sub-blockDescription Energy Dead Lines LevelSPP: Line usage predictor.(CHEN et al., 2004). Yes No Yes
LvP: Counter based dead line predictor.(KHARBUTLI; SOLIHIN, 2008). No Yes No
LTP: Trace based dead line predictor.(LAI; FIDE; FALSAFI, 2001). No Yes No
SDP: Trace based dead line predictor.(KHAN et al., 2010). No Yes No
IATAC: Time based dead line predictor.(ABELLA et al., 2005). Yes Yes No
DSBP: Dead Sub-Block Predictor.(ALVES et al., 2012). Yes Yes Yes
Table 2.1 presents a comparison between DSBP and its related work. DSBP performsbetter than previous work by treating the energy consumption problem at all the levels

35
of the cache hierarchy, and not only predict which sub-blocks should be brought into thecache, but also when active sub-blocks become dead. Additionally, DSBP reduces thenumber of accesses to the pattern history table by updating it only when a new pattern isdetected.
Table 2.2: State-of-the-art last write predictors.Mechanism Saves Predicts EarlyDescription Energy Dead Lines Write-BackEager Write-Back.(LEE; TYSON; FARRENS, 2000). No No Yes
VWQ: Virtual Write Queue.(STUECHELI et al., 2010). No No Yes
SSV: Search Set Vector.(LAI; FIDE; FALSAFI, 2001). No No Yes
LWP: Last Write Predictor.(WANG; KHAN; JIMÉNEZ, 2012a). No No Yes
Two Level Rank Idle Predictor.(WANG; KHAN; JIMÉNEZ, 2012b). Yes No Yes
DEWP: Dead Line and Early Write-Back Predictor.(ALVES et al., 2013). Yes Yes Yes
Table 2.2 shows a comparison between DEWP and its related work. Regarding theDEWP mechanism, none of the previous approaches have taken into account that dirtylines remain turned on for long periods of time, wasting energy while these lines could beevicted early. Thereby, energy can be saved and memory contention reduced. This thesisintroduces a mechanism that performs the prediction of last read, last write and last accesson a cache line basis, exploring the energy savings achievable by turning off invalid anddead lines, and performing early write-backs.
To evaluate DSBP and DEWP, we implemented a mechanism similar to those presentin LTP (LAI; FALSAFI, 2000; LAI; FIDE; FALSAFI, 2001), SDP (KHAN et al., 2010)and LWP (WANG; KHAN; JIMÉNEZ, 2012a). These previous predictors represent thestate-of-the-art and they were proposed to be used for bypassing dead lines or prioritizingthem for eviction or perform early write-back after the cache line receives its last write.In our evaluations, we implemented the basis of these previous mechanisms, the skewedpredictor, to power off the cache lines predicted to be dead and prioritizing them foreviction, also performing early write-back of dirty cache lines when predicted to be dead.This implementation is called SKEWED in the thesis.

36
37
3 SIMULATOR OF NON-UNIFORM CACHE ARCHITEC-TURE (SINUCA)
Some existing open source academia simulators have been verified for single threadedapplications (DESIKAN; BURGER; KECKLER, 2001). However, with the latest ad-vances in CMP, Simultaneous Multi-Threading (SMT), branch prediction, memory dis-ambiguation prediction (DOWECK, 2006), Non-Uniform Cache Architecture (NUCA)(KIM; BURGER; KECKLER, 2003, 2002), NoC (BJERREGAARD; MAHADEVAN,2006; BERTOZZI et al., 2005) and other mechanisms, academia does not continue theprocess of validating its microarchitecture simulators. For parallel architectures, mecha-nisms such as cache coherence, locks and synchronization between threads, interconnec-tion networks and memory controllers affect application performance. The correct use ofthese shared resources can be very different depending on their implementation.
Another problem that academia researchers suffer when validating their simulatorsis the lack of a suite of microbenchmarks that stresses different hardware componentsindependently to correlate their implementation with real processors. Each developerusually creates his own microbenchmarks and seldom shares them. The reason why thecommunity accepts this is because there is no better option currently available. Moreover,the operation of specific components in the processor is not published for intellectualproperty reasons. For this reason, the processor must be seen as a black box, whosebehavior can only be measured on a high level. As a possible way to observe the behaviorat a finer granularity, microbenchmarks should be used. An emerging issue is the energyconsumption modeling of the processor components, which is another feature missingfrom current simulators.
For these reasons, writing an accurate and validated simulator for modern microar-chitectures is a difficult task, and no publicly available simulator is validated for modernparallel architectures.
With these problems in mind, we developed SiNUCA, a performance and energy val-idated, trace-driven, cycle accurate simulator for the x86 architecture. The simulator iscapable of running single and multi-threaded applications and multiple workloads witha high level of detail of all the pipeline components. Additionally, we implemented alarge set of microbenchmarks to correlate the simulator results (performance and otherstatistics) with two existing x86 platforms.
SiNUCA has the following main features:
High Accuracy: SiNUCA implements architectural components with a high level of de-tail, not only in the execution pipeline, but also in the memory and interconnection com-ponents. We also accurately model parallel architectures such as multi-core and multi-processor systems. We used publicly available information for the implementation of the

38
simulator. Where this information was not available, we used microbenchmarks in orderto observe the behavior of a real machine.
SiNUCA was validated with single-threaded and multi-threaded applications usingmicrobenchmarks and larger workloads. The simulation statistics are compared to realmachines. The microbenchmarks had an average difference of 7% while the SPEC-CPU2006 achieved a difference of 12% comparing the Instructions per Cycle (IPC) whensimulating machines with the x86 Sandy Bridge architecture.
Energy Model: Energy consumption is becoming more important for current and futureprocessor architectures. However, most current simulators do not model energy con-sumption, only performance. To evaluate the energy consumption, we integrated theMulti-core Power, Area, and Timing (McPAT) (LI et al., 2009, 2013) tool, which usescomponent statistics generated by SiNUCA. These results were validated using energyhardware counters in the real machine. Our results show a difference of 18% comparingthe average energy consumption when simulating the microbenchmarks.
Support for Emerging Techniques: SiNUCA is able to model several state-of-the-arttechnologies, such as NUCA, Non-Uniform Memory Access (NUMA), NoC and DoubleData Rate (DDR) 3 memory controllers. Besides the traditional techniques such as cacheprefetchers, branch predictors and others, the support for new technologies is importantfor accurate simulation of new systems.
Flexibility: Another important feature to support computer architecture research is theease of implementing or extending features. This is provided by SiNUCA with a modulararchitecture, written in C++, which provides a direct access to the operational details ofall the components. Other simulators are limited by metalanguages that do not exposeall the functionalities of the microarchitecture, making it more difficult to model newmechanisms and modify the existing ones.
The rest of this chapter is organized as follows: We begin with an overview of thestate-of-the-art in computer architecture simulation. SiNUCA is presented in Section 3.2.The microbenchmarks are introduced in Section 3.3. The evaluation methodology andresults are presented in Section 3.4. We summarize SiNUCA in Section 3.5.
3.1 Related Work
In this section, we analyze related computer architecture simulators and compare themto our proposed simulator.
The work of (DESIKAN; BURGER; KECKLER, 2001) validates sim-alpha, a simu-lator based on the sim-out-order version of SimpleScalar (AUSTIN; LARSON; ERNST,2002). In this work, the authors aim to simulate the Alpha 21264 processor, using allavailable documentation. They use microbenchmarks in order to scrutinize every aspectof the architecture, being able to achieve an average error of 2% for a set of microbench-marks, and an error of 18% for the SPEC-CPU2000 applications. The authors identify thememory model as the main source of errors. They show that often used simulators, suchas SimpleScalar, might contain modeling errors and become less reliable to test certainnew features.
We use a similar validation process for SiNUCA, making separate evaluations for spe-cific components inside the processor by using microbenchmarks. We extend the controland memory microbenchmarks and include parallel applications.
39
Virtutech SimICS (MAGNUSSON et al., 2002) is a full-system, functional simulatorwhich measures execution time based on the number of instructions executed multipliedby a fixed IPC, and the number of stall cycles caused by the latency of all components.
WEAVER; MCKEE (2008) compared the SESC simulator (RENAU et al., 2005) tothe Dynamic Binary Instrumentation (DBI) using QEMU (BELLARD, 2005). The au-thors show that in general, cycle-accurate simulators generate inaccurate results over along execution time, due to lack of correctness in architectural details. They are able toobtain similar results in an order of magnitude shorter time with DBI. The paper alsolists the flaws in cycle-accurate simulators. They cite speed, obscurity, source code forks,generalization, validation, documentation and lack of operating system influence as themajor factors when considering the use of a simulator. Regarding these issues, SiNUCAsolves several issues with code modularity, use of traced instructions and validation.
Gem5 (BINKERT et al., 2011) is a combination of two simulators: M5 (BINKERTet al., 2006) and General Execution-driven Multiprocessor Simulator (GEMS) (MARTYet al., 2005). Within Gem5, M5 simulates the cores, whereas GEMS simulates the mem-ory hierarchy. The validation of the Gem5 simulator, modeling a simple embedded system(BUTKO et al., 2012), shows that errors can vary from 0.5% to 16% for the applicationsfrom the SPLASH-2 and ALPBench suites. However, for small synthetic benchmarkswith tiny input sizes, the error varies from 3.7% to 35.9%. The authors conclude that theDynamic Random Access Memory (DRAM) model is inaccurate.
PTLsim (YOURST, 2007) is a cycle accurate, full-system x86-64 microprocessor sim-ulator and virtual machine. It is integrated with the Xen hypervisor in order to providefull-system capabilities.
Multi2Sim (UBAL et al., 2007) is an event-driven simulator based on the premise ofsimulating multi-threaded systems. It was extended to simulate heterogeneous CPU-GPUsystems in (UBAL et al., 2012).
COTSon is a simulator framework jointly developed by HP Labs and AMD (AR-GOLLO et al., 2009) to provide fast and accurate evaluation of current and future com-puting systems, covering the full software stack and complete hardware models. As Sim-ICS, COTSon also abstracts processor microarchitecture details, prohibiting developmentof novelty at this level.
MARSSx86 (PATEL et al., 2011) is a cycle-accurate simulator based on PTLSim.Although it simulates all architectural details, it does not ensure accuracy, as can be seenin their comparison to the SPEC-CPU2006 workload, getting errors of up to 60% with anaverage error of 21%.
Table 3.1 summarizes the main characteristics for computer architecture simulators.Full-system simulation enables processor designers to evaluate OS improvements or itsimpact on the final performance. However, the OS simulation can introduce noise duringthe evaluations, requiring several simulation repetitions (higher simulation time) in orderto obtain reliable results with a reduced Operating System (OS) influence.
Microarchitectural and multi-core simulation are required to evaluate most of thestate-of-the-art component proposals.
We consider SimICS, GEMS, Gem5 and COTSon as not easy to extend because thesesimulators have private source code, need metalanguages to modify the architecture orrequire modifications of multiple simulation levels in order to perform microarchitecturalchanges.

40
Table 3.1: Comparison of state-of-the-art simulators.Full- Micro- Memory
Simulator System Architecture Multi-Core Extension NoC NUCA ControllerName Simulation Simulation Simulation Flexibility Modeling Support ModelingSimAlpha No Yes No High No No NoSimICS Yes No Yes Low No No NoSESC No Yes Yes High Detailed Yes ExtensionGEMS No Yes Yes Low Simple Yes NoM5 Yes Yes Yes High Simple Yes NoGem5 Yes Yes Yes Low Simple Yes NoPTLsim Yes Yes No High No No ExtensionMulti2Sim No Yes Yes High Detailed Yes NoCOTSon Yes No Yes Low Detailed Yes NoMARSSx86 Yes Yes Yes High Detailed No NoSiNUCA No Yes Yes High Detailed Yes Detailed
Regarding NoC modeling, different detail levels can be observed among the simula-tors. SimAlpha, SimICS and PTLsim do not natively support it. GEMS, M5 and Gem5model only the interconnection latency without modeling traffic contention.
Considering NUCA, we classified the simulators as having support if they model atleast multi-banked caches, also known as static NUCA (KIM; BURGER; KECKLER,2003).
The memory controller is becoming more important in modern processors, becauseof its integration inside the processor chip. If a simulator only simulates a fixed latencyfor every DRAM request, it is classified as not capable of modeling a memory controller.Although SESC and PTLsim do not support memory controller modeling natively, exten-sions were proposed in order to overcome this deficiency.
We can observe that SiNUCA offers all the features required to evaluate cache mem-ory mechanisms, simulating in detail the cache memories and memory controllers, whileoffering a highly detailed model of the OoO processor microarchitecture.
3.2 SiNUCA
We developed SiNUCA, a trace-driven simulator, which executes traces generated ona real machine with a real workload without the influence from the OS or other processes.The traces are simulated in a cycle-accurate way, where each component is modeled toexecute its operations on a clock cycle basis. SiNUCA currently focuses on the x86_32and x86_64 architectures.
SiNUCA was developed in C++ to make use of object-oriented principles and generatemodular components. Such characteristics are preferable for simulators in order to easethe implementation of new features or components.
The ideal simulator should be as flexible as possible. Considering this, multiple pa-rameters are available to be set through the SiNUCA configuration file. The configurationfile is split into modules, such that each module contains the internal parameters to beused by the simulator. The simulator uses a component called SiNUCA configurator. Ituses the libconfig (LINDNER, 2013) library internally to read the configuration file and toinstantiate all the components inside SiNUCA. Libconfig is a fully reentrant parser and itsupports include directives. In this way, SiNUCA components can be defined separatelyand included multiple times inside the main configuration file, facilitating the descriptionof multi-core and many-core systems.

41
3.2.1 System Model
Figure 3.1: SiNUCA architecture with its main components and interconnections, mod-eling an Intel Core 2 Duo architecture.
Router
D-Cache
TokensMSHRPrefetcher
Memory Controller (DRAM)
Memory Channel
Memory Channel
NetworkController
Directory
NetworkController
Directory
Processor (Core 0)
Branch Predictor
Rename
RAT
ROB
Dispatch
Uop
Execution
ALU MUL DIV
FALU FMUL FDIV
Load Store
CommitDecode
Uop
Fetch
Op
MOB
Op
MemMem
Mem
BTB
Mem
MemoryPackage
Op
OpcodePackage
Uop
MicroOpPackage
Connections without latency
Connectionswith latency
<Name>
Localcomponent
<Name>
Globalcomponent
I-Cache
TokensMSHRPrefetcher
NetworkController
Directory
L2-Cache
TokensMSHRPrefetcher
Router
NetworkController
MemMem
Mem
D-CacheI-Cache
Processor (Core 1)
Memory Disambiguation
Tokens
The main components of SiNUCA are illustrated in Figure 3.1. The description ofthe components is presented below:
Memory Package: Every memory operation inside the simulator is encapsulated withinthis component.
Opcode Package: The instructions inside the simulator trace and front-end are encapsu-lated within this component.
MicroOp Package: After decoding the Opcode Package, the micro-operations are en-capsulated within this component.
Token: Every communication between two memory components, such as cache memo-ries and memory controllers, needs to request a token from the final package destination

42
before the communication starts. Tokens avoid deadlocks during package transfers thatrequire more than one hop to reach their final destination.
Processor: This component is responsible for executing the Opcodes. It consists of thefetch, decode, rename, dispatch, execute and commit stages. Currently, only an OoOprocessor is modeled, implementing a Reorder Buffer (ROB) to handle the OoO exe-cution. Further details about the processor’s internal components will be presented inSection 3.2.2.
Cache Memory: This component is responsible for modeling instruction and data caches,both single and multi-banked models (static NUCA), implementing a Miss-Status Han-dling Registers (MSHR) internally per bank. This component keeps only the tag array ofthe cache, reducing the memory usage and the trace size.
Miss-Status Handling Register (MSHR): This buffer keeps information about the cachemisses which arrive at each cache bank. The requests wait to be serviced and are then sentback to the requester in the case of a cache hit, or replicated to the next memory level inthe case of a cache miss.
Prefetcher: The memory packages serviced by the cache memory are sent to the prefetcher,so that the memory addresses required by the application in the future can be predictedand fetched. This component is responsible for implementing several prefetch policiesand to provide the cache memory with the generated requests as soon the cache has spacein its MSHR. Currently, a stride prefetcher (BAER; CHEN, 1991) and a stream prefetcher(JOUPPI, 1990) are available to be simulated.
Memory Controller: This component implements the memory controller, formed bymultiple channels, each channel with multiple banks. All memory requests that miss inall the cache levels will be sent to this component, which will schedule the requests to thememory banks. The memory controllers can support NUMA modeling as well.
Memory Channel: Inside the memory controller, multiple memory channels can be in-stantiated. Each channel may be connected to one or more banks, each bank with its ownread and write buffers.
Router: This component was developed to model the contention and delays imposedby the interconnections. It implements a general NoC router that automatically deliverspackages using the routing information inside each package.
Network Controller: This controller is used to generate a communication graph with theroutes available in the modeled architecture. All packages that need to be transmitted havea pointer to the routing information contained in the routing table. The routing informa-tion describes which path to take for each intermediary component (routing input/outputports).
Directory: This component models the MOESI cache coherence protocol, which is ac-cessed directly by the caches for every memory operation. It is responsible for creatinglocks on cache lines in order to control concurrent operations, to change the cache linestatus (for example, after writes or when propagating invalidations), to generate write-backs and to inform the caches about hits or misses. During read requests, the directorycreates a read lock to that memory address, thus only read accesses can be provided tothat address in any cache in the system. During write operations, the directory locks thecache line for the write operation. In this way, no other operation can be performed byother caches on the same address until the lock is released.

43
The network controller and the directory are virtual components, which model lookuptables and do not generate latency on accesses to them. All other components are realcomponents and the connection between them always generates latency.
3.2.2 Processor Description
Figure 3.1 presents the details of the processor architecture. The processor consists of6 main stages, each stage can be configured to take multiple cycles to complete. Althoughthe processor could be simulated with less stages, we chose to implement these mainstages separately in order to increase the flexibility and ease simulator extensions. Theimplementation details for the main components and stages inside the processor are givenbelow:
Fetch Stage: This stage is responsible for fetching new opcodes from the trace reader.Internally, it handles the next two opcodes from the trace in order to send them to thebranch predictor. In case of a branch instruction, the branch predictor can inform if it wascorrectly predicted or not, and update the prediction mechanism. In case of a non-branchinstruction or a correctly predicted branch, it sends the next instruction to the fetch buffer,so the instruction address can be requested from the instruction cache.
In the case of a mispredicted branch, the fetch stage will be stalled until the branch issolved. The fetch stage is also responsible for controlling the synchronization of multiplethreads according to the Open Multi-Processing (OpenMP) primitives inside the trace.For instance, during an OpenMP barrier, the fetch stage of each processor will controlwhen all processors reach the same barrier, so the simulation can continue. During thisstall period, no new instruction is fetched from the trace for the processors waiting in thebarrier.
Decode Stage: This stage takes the opcodes ready in the fetch buffer, and decodes theminto multiple microOps. The microOps are inserted into the decode buffer. For everybranch decoded, an in-flight branch counter is incremented, and then decremented afterthe branch is retired. This stage stalls when the maximum number of branches inside thepipeline is reached.
Rename Stage: This stage obtains available microOps from the decode buffer and insertsthem into the ROB. If the microOp contains a register operation, the Registers Alias Table(RAT) solves false dependencies, and stores information about real dependencies. If themicroOp contains a memory operation, the related memory operation will be inserted intothe Memory Order Buffer (MOB) read or write buffer. In case of a full ROB or MOB,this stage will stall.
Dispatch Stage: MicroOps are sent to the reservation stations, even if they still havemissing dependencies. This stage stalls if all the reservation stations are full.
Execution Stage: Once the microOp is ready for execution, with all the dependenciessolved, the microOp is executed. In this stage, the constraints on the number of func-tional units (such as integer and floating-point ALU) and cycles between microOps arerespected. In the end of this stage, data forwarding is performed, and the real dependentmicroOps are marked as resolved. For memory operations, the memory package insidethe MOB relative to this operation will be marked as ready.
Commit Stage: This stage is responsible for retiring the opcodes in-order from the ROB.
Branch Predictor: The predictor receives the current and next instruction in the trace. Itis responsible for implementing any branch predictor mechanism with its Branch Target
44
Buffer (BTB) and other structures. It returns to the processor if the branch was predictedcorrectly or not, together with the information about the stage in which the branch will besolved. Thus, the fetch stage will stall until the mispredicted branch reaches the informedstage. During each prediction, the prediction correctness information is also updated in-side the predictor structures. Currently, the Per-address Adaptive branch prediction usingper-Set PHT (PAs), Global Adaptive branch prediction using per-Set PHT (GAs), Per-address Adaptive branch prediction using one Global PHT (PAg) and Global Adaptivebranch prediction using one Global PHT (GAg) (YEH; PATT, 1991, 1992) branch pre-dictor mechanisms are available inside the simulator.
Reorder Buffer (ROB): This circular buffer stores the microOps after the decode stage.It also handles information about the dependencies and the current stage of the microOps.
Register Alias Table (RAT): This table stores the information of the last microOps towrite every register. Every time a register is going to be re-written by a microOp or themicroOp is executed, this table is updated. Every time a register is being read, this table isconsulted in order to gather information about the true dependencies between microOps.
Memory Order Buffer (MOB): Whenever a memory operation is executed, that is, itsaddress is generated, the memory package inside the load or store buffer located insidethe MOB is marked as ready. The package waits in one of these buffers until the memoryservices the request. After the memory operation is serviced, the data dependencies aresolved and the memory operation can be committed.
Memory Disambiguation: This component contains the table that stores the last memorywrite addresses and their sizes. This table works in a similar manner as the RAT, but inthis case, it can solve false dependencies between memory operations depending on thedisambiguation policy.
3.2.3 Simulator Traces
The SiNUCA input traces are split into three different files:
Static trace: This file contains the trace of the assembly code divided in basic blocks.This file is completely loaded into the main memory at the beginning of the simulation.
Dynamic trace: This file contains the calls to the basic blocks generated during theprogram execution. For each basic block call, the instructions are obtained from the statictrace.
Memory trace: This file contains information about the memory operations generatedduring the program execution. For each memory operation, a new trace line is read so thememory address and memory size can be retrieved.
3.2.3.1 Trace Format
In order to show a simple example from the SiNUCA traces, Table 3.2 presents a shortsynthetic code, consisting of a loop that executes two iterations, adding the loop index toa variable.
Table 3.3 shows the static, dynamic and memory traces for SiNUCA, generated fromthe synthetic code presented in Table 3.2.
The static trace is divided into basic blocks, which are presented after @. The instruc-tions inside the basic block consist of the following fields: assembler instruction, Opcode

45
Table 3.2: Source code example written in C and Assembly.C source code Assembly code (AT&T syntax)
for (i = 0; i < 2; i++) {sum += i;
}
movl $0x0,-0x8(%rbp)loop: mov -0x8(%rbp),%eax
add %eax,-0x4(%rbp)addl $0x1,-0x8(%rbp)cmpl $0x1,-0x8(%rbp)jbe loop
Table 3.3: SiNUCA traces for a simple source code.Static Memory DynamicTrace Trace Trace
#main@1MOV 1 0x95727 4 1 14 1 34 14 0 1 0 0 0 0 0#main@2MOV 8 0x95717 3 1 14 1 65 14 0 1 0 0 0 0 0ADD 1 0x95720 3 2 14 65 1 34 14 0 1 0 1 0 0 0ADD 1 0x95723 4 1 14 1 34 14 0 1 0 1 0 0 0CMP 1 0x95727 4 1 14 1 34 14 0 1 0 0 0 0 0JBE 7 0x95731 2 2 35 34 1 35 0 0 0 0 0 1 0 0
R 4 0x1701448 1#R 4 0x1701448 2R 4 0x1701452 2W 4 0x1701452 2R 4 0x1701448 2W 4 0x1701448 2R 4 0x1701448 2#R 4 0x1701448 2R 4 0x1701452 2W 4 0x1701452 2R 4 0x1701448 2W 4 0x1701448 2R 4 0x1701448 2
122
type, instruction address, instruction size, number of read registers, read registers, num-ber of write registers, write registers, base register, index register, is-read flag, is-read2flag, is-write flag, is-branch flag, is-predicated flag, is-prefetch flag.
The assembler instruction is only saved in order to ease the trace debug, but it is notused inside the simulator. The registers inside SiNUCA are represented by the registernumber given by Pin, instead of the register name. This transformation facilitates thedependency analysis.
The base register and index register fields are needed to differentiate the registersused to access the memory from the other registers used inside the instruction. This isnecessary to keep the correct dependencies inside each microOp.
The flags is-read, is-read2, is-write and is-branch are used in order to decode theopcode into multiple microOps. The is-predicated and is-prefetch flags are not currentlyused, but they are kept so the simulator can be easily extended.
The memory trace is formed by the following fields: R/W indicator, memory operationsize, memory address, basic block number. The R/W indicator and the basic block numberare only used to guarantee that the memory trace is correct, that is, these fields are matchedwith the static instruction which fetched the memory operation.
The dynamic trace only contains the basic block number. In order to read the trace, theprocessor reads this file fetching the basic block number, then it fetches the instructionsinside the static trace for that specific basic block. The basic blocks present in the dynamictrace correspond only to the actual execution flow, that is, no wrong path (such as amispredicted branch) is traced. If the instruction in the basic block performs a memory

46
operation, the memory trace is fetched in order to get the memory address and the size ofthe memory access.
3.2.3.2 Trace Generation
Considering that some applications can take a very long time to run on a real ma-chine, it is impractical to execute them completely in a cycle accurate simulator such asSiNUCA. Our trace generator uses the PinPoints (PATIL et al., 2004) tool to find andtrace only the representative portions of the applications.
PinPoints uses the SimPoint methodology (SHERWOOD et al., 2002) to profile andidentify representative portions (slices) of an application, in order to trace only the mostsignificant slice of single-threaded applications.
SimPoints uses basic block distribution analysis (SHERWOOD; PERELMAN; CALDER,2001) in order to determine cyclic behavior of an application. This analysis correlatesclusters of basic blocks called Basic Block Vectors (BBVs) to the entire execution, inorder to identify the initialization phase and phases with periodic behavior inside the pro-gram. The final goal of this analysis is to find the preferred simulation points in theapplication in order to achieve a representative sample of its execution. According to theauthors, using the basic block distribution analysis, it is possible to find small representa-tive slices of the program, which result in an IPC error of 6% or less.
Considering that PinPoints does not work well for parallel applications, we used itonly to generate traces from the SPEC-CPU2006 applications. For the parallel applica-tions, we instrumented the trace generator to trace only given parallel regions. For themicrobenchmarks, the full execution traces were used.
For multi-threaded applications, the waiting time in a OpenMP spin-lock during thetrace generation can represent a large portion of the execution time. This occurs becausethreads need to wait for others to write their traces. This spin-lock waiting time can behigher if the number of threads being traced is bigger than the number of cores of themachine that is generating the traces.
In order to avoid the spin-lock stalls, the basic blocks that contain OpenMP locks areremoved from the traces. However, in order to correctly simulate the barriers and thewaiting time lost during synchronization, the traces still contain the OpenMP primitivesthat are used to synchronize the threads internally during the simulation.
During the simulation of multi-threaded applications, the simulated processors treatthe OpenMP primitives as they appear in the dynamic trace. This means that during pro-gram barriers, each processor that reaches the barrier stops fetching instructions and waitsuntil all the processors reach the same barrier. When all processors reach the barrier, thelock is released and the execution continues. The OpenMP atomic and critical primitivesare preserved inside the dynamic trace, and the processors also guarantee that only oneprocessor will enter a critical section at a time.
3.2.4 Energy Modeling
In order to obtain estimations regarding the energy and power consumption, we in-strumented the simulator to generate all the statistics required by McPAT, version 1.0 (LIet al., 2009, 2013).
The McPAT framework is a validated and widely used tool which supports proces-sor configurations ranging from 90 nm to 22 nm and beyond, modeling timing, area andpower for the device types forecast in the ITRS roadmap (Semiconductor Industry Asso-

47
ciation, 2007). It supports splitting energy results into dynamic and static energy, with thestatic energy formed by subthreshold and gate leakage.
The power, area and timing models are organized into three levels: The Architecturallevel, where a multi-core model is decomposed into major components such as cores,interconnections, caches and memory controllers; The Circuit level, which maps the ar-chitectural blocks to hierarchical wires, arrays, logic and clocking networks; The Tech-nology level, which uses data from the ITRS roadmap to calculate the physical parametersof devices and wires.
3.3 Microbenchmarks
As mentioned before, many architectural details of modern processors are not public.For this reason, a set of microbenchmarks was developed in order to evaluate and estimatethe behavior of processor components. We developed a suite of single and multi-threadedmicrobenchmarks to isolate and validate specific aspects of SiNUCA. These benchmarkswill be presented in this section.
3.3.1 Single-Threaded Microbenchmarks
The single-threaded microbenchmarks were inspired by the SimAlpha validation (DE-SIKAN; BURGER; KECKLER, 2001). Five categories of benchmarks were defined.These are Control, Dependency, Execution, Memory and Multi-thread. These categoriesstress different stages of the pipeline and evaluate different components separately.
3.3.1.1 Control Benchmarks
Five Control benchmarks were designed to stress different situations commonly foundin programs: Complex, Conditional, Random, Small BBL, and Switch.
Control Complex mixes if-else and switch constructs in order to create a hard to predictbranch behavior.
Control Conditional implements a simple if-then-else construct in a loop that is repeat-edly executed, and alternates between taking and not taking the conditional branch.
Control Random implements an if-then-else construct in a loop that is repeatedly exe-cuted. For every iteration, a Linear Feedback Shift Register (LFSR) function decides be-tween taking and not taking the conditional branch. The LFSR function is a well knownfast pseudo-random number generator, which was implemented with 16 bits in order toget a period length of 65535 iterations.
Control Small BBL evaluates the number of in-flight branches at the same time insidethe processor by executing a loop with only the control variable incrementing inside theloop.
Control Switch tests indirect jumps with a switch construct formed by 10 case statementswithin a loop. Each case statement is taken n/10 times on consecutive loop iterationsbefore moving to the next case statement, where n is the total number of repetitions of theloop.
3.3.1.2 Dependency Benchmarks
Six Dependency Chain benchmarks were used to stress the forwarding of dependen-cies between instructions. These evaluate dependency chains every 1, 2, 3, 4, 5 and 6

48
instructions. In this way, every instruction needs to wait for the execution of the previousone with a real dependency, evaluating thus the data forwarding time.
3.3.1.3 Execution Benchmarks
Six Execution benchmarks were defined to stress the integer and floating point func-tional units: integer-add, integer-multiply, integer-division, floating-point-add, floating-point-multiply, floating-point-division.
All the Execution benchmarks execute 32 independent operations inside a loop, witha reduced amount of memory operations, control hazards and data dependences, allowinga close-to-ideal throughput.
3.3.1.4 Memory Benchmarks
Three Memory benchmarks were created: load-dependent, load-independent, store-independent.
Load Dependent executes a loop which walks a linked list, waiting for each load tocomplete before starting the next. Different linked list sizes (16 KB, 32 KB, 64 KB,128 KB, 256 KB, 512 KB, 1024 KB, 2048 KB, 4096 KB, 8192 KB, 16384 KB and32768 KB) are used in the evaluation.
Load Independent repeatedly executes 32 parallel independent loads from an array andadds its values in a scalar variable. Different array sizes were used in the evaluation.Twelve array sizes were evaluated (16 KB, 32 KB, 64 KB, 128 KB, 256 KB, 512 KB,1024 KB, 2048 KB, 4096 KB, 8192 KB, 16384 KB and 32768 KB) in order to stressdifferent cache levels.
Store Independent repeatedly performs 32 parallel independent stores of a fixed scalariterating over all the positions of an array, evaluating multiple array sizes as well. Thesame twelve array sizes as for the load independent were evaluated.
3.3.2 Multi-Threaded Microbenchmarks
Four multi-threaded microbenchmarks were designed to reproduce different scenariosfrom real multi-threaded applications. The applications consist basically of two loops, iand j, where the loop j executes a single iteration per thread. Every thread accumulatesthe multiplication of i per j.
Barrier All Together: all threads have the same amount of work, waiting for a barrierafter every new iteration in the loop i.
Barrier Master Slow: in this case, only the thread master iterates over an inner loop,forcing all other threads to wait at the barrier to synchronize.
Critical: for this application, the accumulator used by all the threads is a shared variable,thus, all the increments requires the thread to enter in a critical section, creating greatcontention.
False Sharing: to stress the coherence protocol, an array is shared by different threadsto store the sum being calculated. However, since the multiple array elements (8 byteseach) will share the same cache line, a false sharing effect occurs. In order to evaluatethe influence of different amounts of threads suffering from false sharing, different padsof 0, 8, 24 and 56 bytes were evaluated. These pad sizes were chosen to keep the same
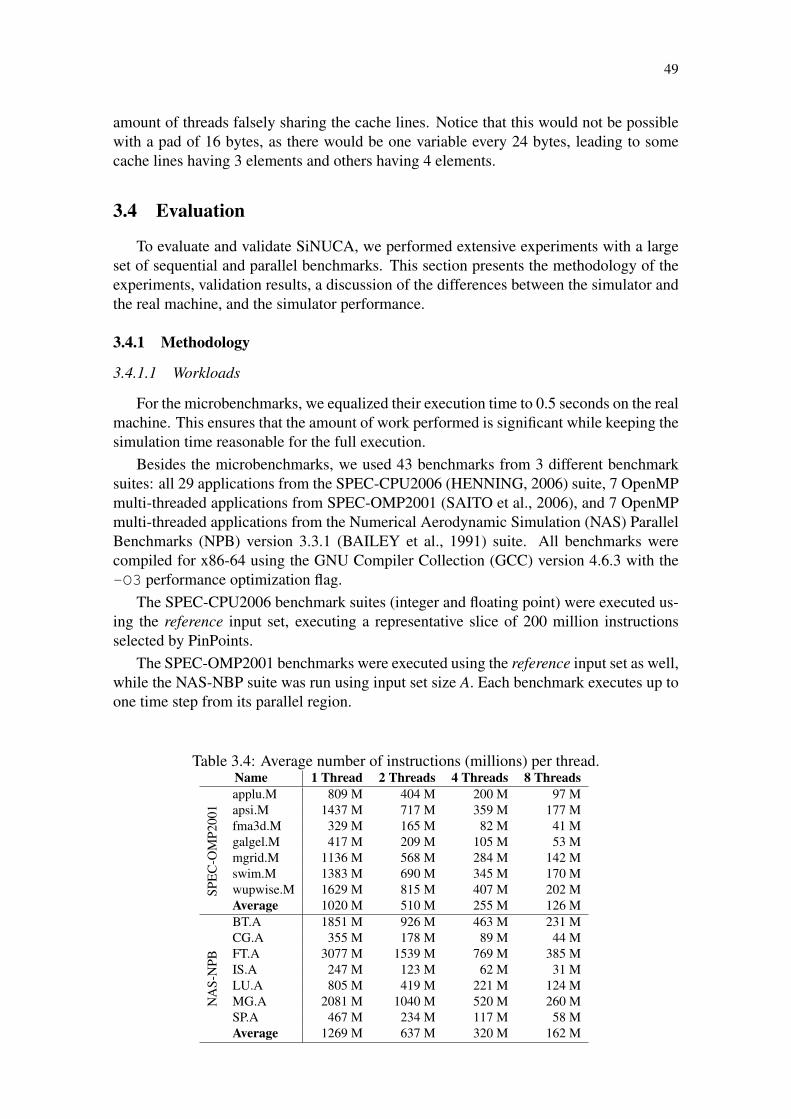
49
amount of threads falsely sharing the cache lines. Notice that this would not be possiblewith a pad of 16 bytes, as there would be one variable every 24 bytes, leading to somecache lines having 3 elements and others having 4 elements.
3.4 Evaluation
To evaluate and validate SiNUCA, we performed extensive experiments with a largeset of sequential and parallel benchmarks. This section presents the methodology of theexperiments, validation results, a discussion of the differences between the simulator andthe real machine, and the simulator performance.
3.4.1 Methodology
3.4.1.1 Workloads
For the microbenchmarks, we equalized their execution time to 0.5 seconds on the realmachine. This ensures that the amount of work performed is significant while keeping thesimulation time reasonable for the full execution.
Besides the microbenchmarks, we used 43 benchmarks from 3 different benchmarksuites: all 29 applications from the SPEC-CPU2006 (HENNING, 2006) suite, 7 OpenMPmulti-threaded applications from SPEC-OMP2001 (SAITO et al., 2006), and 7 OpenMPmulti-threaded applications from the Numerical Aerodynamic Simulation (NAS) ParallelBenchmarks (NPB) version 3.3.1 (BAILEY et al., 1991) suite. All benchmarks werecompiled for x86-64 using the GNU Compiler Collection (GCC) version 4.6.3 with the-O3 performance optimization flag.
The SPEC-CPU2006 benchmark suites (integer and floating point) were executed us-ing the reference input set, executing a representative slice of 200 million instructionsselected by PinPoints.
The SPEC-OMP2001 benchmarks were executed using the reference input set as well,while the NAS-NBP suite was run using input set size A. Each benchmark executes up toone time step from its parallel region.
Table 3.4: Average number of instructions (millions) per thread.Name 1 Thread 2 Threads 4 Threads 8 Threadsapplu.M 809 M 404 M 200 M 97 Mapsi.M 1437 M 717 M 359 M 177 Mfma3d.M 329 M 165 M 82 M 41 Mgalgel.M 417 M 209 M 105 M 53 Mmgrid.M 1136 M 568 M 284 M 142 Mswim.M 1383 M 690 M 345 M 170 Mwupwise.M 1629 M 815 M 407 M 202 MSPE
C-O
MP2
001
Average 1020 M 510 M 255 M 126 MBT.A 1851 M 926 M 463 M 231 MCG.A 355 M 178 M 89 M 44 MFT.A 3077 M 1539 M 769 M 385 MIS.A 247 M 123 M 62 M 31 MLU.A 805 M 419 M 221 M 124 MMG.A 2081 M 1040 M 520 M 260 MSP.A 467 M 234 M 117 M 58 M
NA
S-N
PB
Average 1269 M 637 M 320 M 162 M
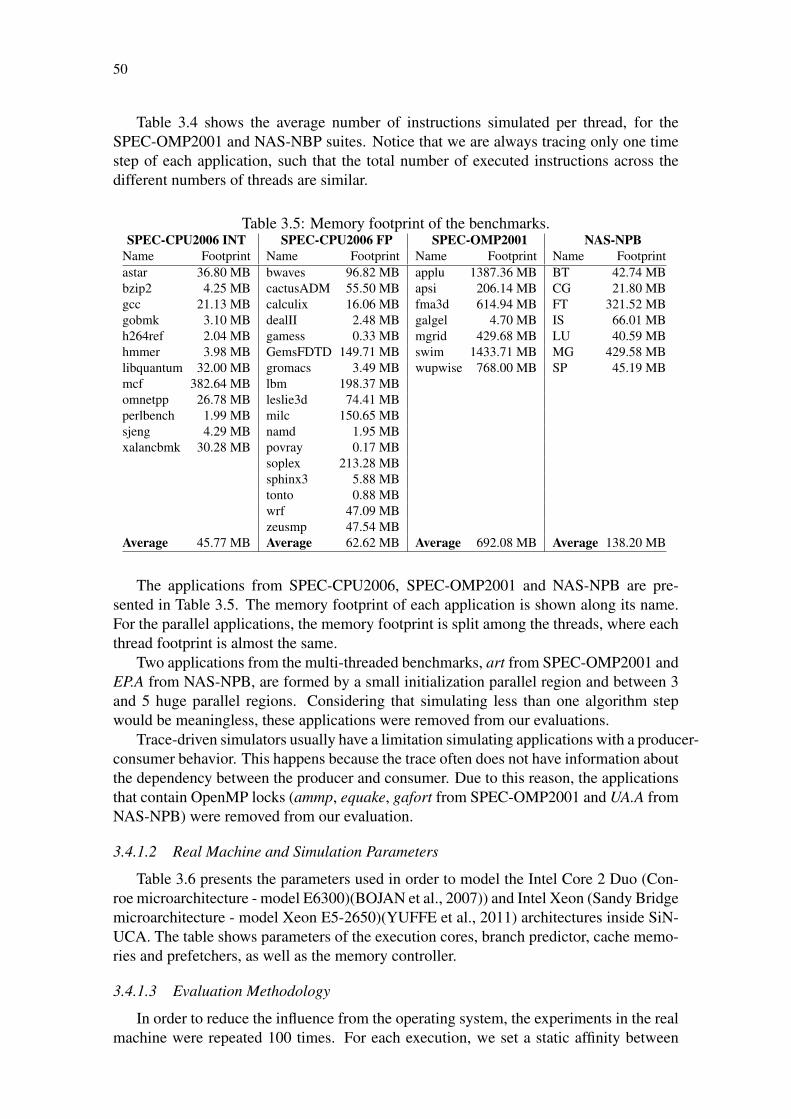
50
Table 3.4 shows the average number of instructions simulated per thread, for theSPEC-OMP2001 and NAS-NBP suites. Notice that we are always tracing only one timestep of each application, such that the total number of executed instructions across thedifferent numbers of threads are similar.
Table 3.5: Memory footprint of the benchmarks.SPEC-CPU2006 INT SPEC-CPU2006 FP SPEC-OMP2001 NAS-NPB
Name Footprint Name Footprint Name Footprint Name Footprintastar 36.80 MB bwaves 96.82 MB applu 1387.36 MB BT 42.74 MBbzip2 4.25 MB cactusADM 55.50 MB apsi 206.14 MB CG 21.80 MBgcc 21.13 MB calculix 16.06 MB fma3d 614.94 MB FT 321.52 MBgobmk 3.10 MB dealII 2.48 MB galgel 4.70 MB IS 66.01 MBh264ref 2.04 MB gamess 0.33 MB mgrid 429.68 MB LU 40.59 MBhmmer 3.98 MB GemsFDTD 149.71 MB swim 1433.71 MB MG 429.58 MBlibquantum 32.00 MB gromacs 3.49 MB wupwise 768.00 MB SP 45.19 MBmcf 382.64 MB lbm 198.37 MBomnetpp 26.78 MB leslie3d 74.41 MBperlbench 1.99 MB milc 150.65 MBsjeng 4.29 MB namd 1.95 MBxalancbmk 30.28 MB povray 0.17 MB
soplex 213.28 MBsphinx3 5.88 MBtonto 0.88 MBwrf 47.09 MBzeusmp 47.54 MB
Average 45.77 MB Average 62.62 MB Average 692.08 MB Average 138.20 MB
The applications from SPEC-CPU2006, SPEC-OMP2001 and NAS-NPB are pre-sented in Table 3.5. The memory footprint of each application is shown along its name.For the parallel applications, the memory footprint is split among the threads, where eachthread footprint is almost the same.
Two applications from the multi-threaded benchmarks, art from SPEC-OMP2001 andEP.A from NAS-NPB, are formed by a small initialization parallel region and between 3and 5 huge parallel regions. Considering that simulating less than one algorithm stepwould be meaningless, these applications were removed from our evaluations.
Trace-driven simulators usually have a limitation simulating applications with a producer-consumer behavior. This happens because the trace often does not have information aboutthe dependency between the producer and consumer. Due to this reason, the applicationsthat contain OpenMP locks (ammp, equake, gafort from SPEC-OMP2001 and UA.A fromNAS-NPB) were removed from our evaluation.
3.4.1.2 Real Machine and Simulation Parameters
Table 3.6 presents the parameters used in order to model the Intel Core 2 Duo (Con-roe microarchitecture - model E6300)(BOJAN et al., 2007)) and Intel Xeon (Sandy Bridgemicroarchitecture - model Xeon E5-2650)(YUFFE et al., 2011) architectures inside SiN-UCA. The table shows parameters of the execution cores, branch predictor, cache memo-ries and prefetchers, as well as the memory controller.
3.4.1.3 Evaluation Methodology
In order to reduce the influence from the operating system, the experiments in the realmachine were repeated 100 times. For each execution, we set a static affinity between

51
Table 3.6: Parameters to model the Core 2 Duo and Sandy Bridge processors.Parameter Core 2 Duo Configuration Sandy Bridge Configuration
OoOExecutionCores
2 cores @ 1.8 GHz, 65 nm; 8 cores @ 2.0 GHz, 32 nm;in-order front-end and commit; in-order front-end and commit;12 stages (2-fetch, 2-decode, 2-rename, 16 stages (3-fetch, 3-decode, 3-rename,2-dispatch, 2-commit stages); 2-dispatch, 3-commit stages);16 B fetch block size, fetch up to 6 instructions 16 B fetch block size, fetch up to 6 instructionsDecode and commit up to 4 instructions; Decode and commit up to 5 instructions;Rename/dispatch/execute up to 4 micro instructions; Rename/dispatch/execute up to 5 micro instructions;18-entry fetch buffer, 24-entry decode buffer; 18-entry fetch buffer, 28-entry decode buffer;3-alu, 1-mul. and 1-div. int. units (1-4-26 cycle); 3-alu, 1-mul. and 1-div. int. units (1-3-32 cycle);1-alu, 1-mul. and 1-div. fp. units (3-5-5 cycle); 1-alu, 1-mul. and 1-div. fp. units (3-5-10 cycle);1-load and 1-store functional units (1-1 cycle); 1-load and 1-store functional units (1-1 cycle);MOB entries: 24-read and 16-write; 96-entry ROB; MOB entries: 64-read and 36-write; 168-entry ROB;1 branch per fetch; 8 parallel in-flight branches; 1 branch per fetch; 8 parallel in-flight branches;
Branch 4 K-entry 4-way set-associative, LRU policy BTB; 4 K-entry 4-way set-associative, LRU policy BTB;Predictor Two-Level PAs 2-bits predictor; 16 K-entry PBHT; Two-Level GAs 2-bits predictor; 16 K-entry PBHT;
128 lines and 1024 sets SPHT; 256 lines and 2048 sets SPHT;L1 32 KB, 8-way, 64 B line size; LRU policy; 1-cycle; 32 KB, 8-way, 64 B line size; LRU policy; 2-cycle;Data MSHR: 8-request, 10-write-back, 1-prefetch; MSHR: 8-request, 10-write-back, 1-prefetch;Cache Stride prefetch: 1-degree, 16-strides table; Stride prefetch: 1-degree, 16-strides table;L1 32 KB, 8-way, 64 B line size; LRU policy; 1-cycle; 32 KB, 8-way, 64 B line size; LRU policy; 2-cycle;Inst. MSHR: 8-request, 1-prefetch; MSHR: 8-request, 1-prefetch;Cache Stride prefetch: 1-degree, 16-strides table; Stride prefetch: 1-degree, 16-strides table;
Shared 2 MB, 8-way, 64 B line size; LRU policy; Private 256 KB, 8-way, 64 B line size; LRU policy;L2 Inclusive Cache; MOESI coherence protocol; 4-cycle; MSHR: 4-request, 6-write-back, 2-prefetch; 4-cycle;Cache MSHR: 2-request, 6-write-back, 2-prefetch; Stream prefetch: 2-degree, 32-distance, 256-streams;
Stream prefetch: 2-degree, 16-distance, 64-streams;
L3 Cache
Shared 16 MB (8-banks), 2 MB per bank;16-way, 64 B line size; LRU policy; 6-cycle;
None Inclusive LLC; MOESI coherence protocol;MSHR: 8-request, 12-write-back;Bi-directional ring interconnection;
Off-chip DRAM controller, 8 DRAM banks/channel; On-chip DRAM controller, 8 DRAM banks/channel;DRAM 2-channels, 4 burst length; 4-channels, 8 burst length;Controller 8 KB row buffer per bank, Open-row first; 8 KB row buffer per bank, Open-row first;and Bus DDR2 667 MHz; 2.8 core-to-bus frequency ratio; DDR3 1333 MHz; 1.5 core-to-bus frequency ratio;
4-CAS, 4-RP, 4-RCD and 30-RAS DRAM cycles; 9-CAS, 9-RP, 9-RCD and 28-RAS DRAM cycles;
the threads and the processor cores, in order to reduce the overhead of migration. TheOS priority for the benchmark applications was set to 10 using nice − 10, reducing theinfluence of the background tasks.
To obtain the performance counters (cycles, instructions, branch mispredictions andcache misses) we used the perf tool (Linux Kernel Developers, 2013). To measure theenergy consumption, the Intel Performance Counter Monitor (PCM) tool (INTEL, 2012)was used to measure the Running Average Power Limit (RAPL) counters (INTEL, 2013).Core 2 Duo architecture does not provide energy related hardware counter, thus, onlyperformance wide evaluations are performed for this architecture.
Our evaluation shows information regarding the difference between the real machineand the simulator. This difference represents the absolute accuracy of SiNUCA, it de-termines if the individual components and total performance and power are correctlymodeled. However, the standard deviations of the differences are also presented in or-der to evaluate the relative accuracy of SiNUCA. A low standard deviation indicates thatsimulation and real machine are behaving similarly.
In order to summarize the results, the arithmetic mean was used for raw numbers whilethe geometric mean was used for normalized results. Geometric mean is considered theonly correct mean when averaging normalized results (FLEMING; WALLACE, 1986),that is results that are presented as ratios to reference values, this is because using thearithmetic or harmonic mean could change the conclusions depending on what number isused as a reference for the normalization (JAIN, 1991).
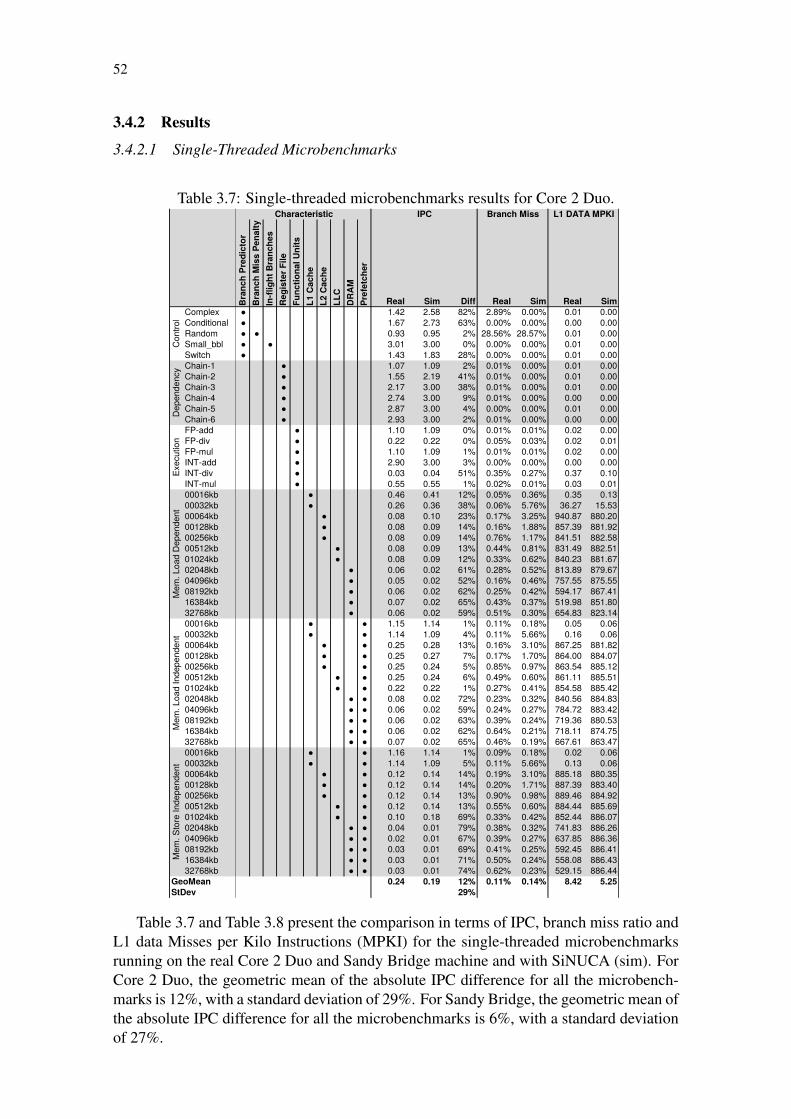
52
3.4.2 Results
3.4.2.1 Single-Threaded Microbenchmarks
Table 3.7: Single-threaded microbenchmarks results for Core 2 Duo.
Bra
nch
Pred
icto
rB
ranc
h M
iss
Pena
ltyIn
-flig
ht B
ranc
hes
Reg
iste
r File
Func
tiona
l Uni
tsL1
Cac
heL2
Cac
heLL
CD
RA
MPr
efet
cher
Real Sim Diff Real Sim Real SimComplex ● 1.42 2.58 82% 2.89% 0.00% 0.01 0.00Conditional ● 1.67 2.73 63% 0.00% 0.00% 0.00 0.00Random ● ● 0.93 0.95 2% 28.56% 28.57% 0.01 0.00Small_bbl ● ● 3.01 3.00 0% 0.00% 0.00% 0.01 0.00Switch ● 1.43 1.83 28% 0.00% 0.00% 0.01 0.00Chain-1 ● 1.07 1.09 2% 0.01% 0.00% 0.01 0.00Chain-2 ● 1.55 2.19 41% 0.01% 0.00% 0.01 0.00Chain-3 ● 2.17 3.00 38% 0.01% 0.00% 0.01 0.00Chain-4 ● 2.74 3.00 9% 0.01% 0.00% 0.00 0.00Chain-5 ● 2.87 3.00 4% 0.00% 0.00% 0.01 0.00Chain-6 ● 2.93 3.00 2% 0.01% 0.00% 0.00 0.00FP-add ● 1.10 1.09 0% 0.01% 0.01% 0.02 0.00FP-div ● 0.22 0.22 0% 0.05% 0.03% 0.02 0.01FP-mul ● 1.10 1.09 1% 0.01% 0.01% 0.02 0.00INT-add ● 2.90 3.00 3% 0.00% 0.00% 0.00 0.00INT-div ● 0.03 0.04 51% 0.35% 0.27% 0.37 0.10INT-mul ● 0.55 0.55 1% 0.02% 0.01% 0.03 0.0100016kb ● 0.46 0.41 12% 0.05% 0.36% 0.35 0.1300032kb ● 0.26 0.36 38% 0.06% 5.76% 36.27 15.5300064kb ● 0.08 0.10 23% 0.17% 3.25% 940.87 880.2000128kb ● 0.08 0.09 14% 0.16% 1.88% 857.39 881.9200256kb ● 0.08 0.09 14% 0.76% 1.17% 841.51 882.5800512kb ● 0.08 0.09 13% 0.44% 0.81% 831.49 882.5101024kb ● 0.08 0.09 12% 0.33% 0.62% 840.23 881.6702048kb ● 0.06 0.02 61% 0.28% 0.52% 813.89 879.6704096kb ● 0.05 0.02 52% 0.16% 0.46% 757.55 875.5508192kb ● 0.06 0.02 62% 0.25% 0.42% 594.17 867.4116384kb ● 0.07 0.02 65% 0.43% 0.37% 519.98 851.8032768kb ● 0.06 0.02 59% 0.51% 0.30% 654.83 823.1400016kb ● ● 1.15 1.14 1% 0.11% 0.18% 0.05 0.0600032kb ● ● 1.14 1.09 4% 0.11% 5.66% 0.16 0.0600064kb ● ● 0.25 0.28 13% 0.16% 3.10% 867.25 881.8200128kb ● ● 0.25 0.27 7% 0.17% 1.70% 864.00 884.0700256kb ● ● 0.25 0.24 5% 0.85% 0.97% 863.54 885.1200512kb ● ● 0.25 0.24 6% 0.49% 0.60% 861.11 885.5101024kb ● ● 0.22 0.22 1% 0.27% 0.41% 854.58 885.4202048kb ● ● 0.08 0.02 72% 0.23% 0.32% 840.56 884.8304096kb ● ● 0.06 0.02 59% 0.24% 0.27% 784.72 883.4208192kb ● ● 0.06 0.02 63% 0.39% 0.24% 719.36 880.5316384kb ● ● 0.06 0.02 62% 0.64% 0.21% 718.11 874.7532768kb ● ● 0.07 0.02 65% 0.46% 0.19% 667.61 863.4700016kb ● ● 1.16 1.14 1% 0.09% 0.18% 0.02 0.0600032kb ● ● 1.14 1.09 5% 0.11% 5.66% 0.13 0.0600064kb ● ● 0.12 0.14 14% 0.19% 3.10% 885.18 880.3500128kb ● ● 0.12 0.14 14% 0.20% 1.71% 887.39 883.4000256kb ● ● 0.12 0.14 13% 0.90% 0.98% 889.46 884.9200512kb ● ● 0.12 0.14 13% 0.55% 0.60% 884.44 885.6901024kb ● ● 0.10 0.18 69% 0.33% 0.42% 852.44 886.0702048kb ● ● 0.04 0.01 79% 0.38% 0.32% 741.83 886.2604096kb ● ● 0.02 0.01 67% 0.39% 0.27% 637.85 886.3608192kb ● ● 0.03 0.01 69% 0.41% 0.25% 592.45 886.4116384kb ● ● 0.03 0.01 71% 0.50% 0.24% 558.08 886.4332768kb ● ● 0.03 0.01 74% 0.62% 0.23% 529.15 886.44
0.24 0.19 12% 0.11% 0.14% 8.42 5.2529%
GeoMeanStDev
Mem
. Sto
re In
depe
nden
t
Characteristic
Exec
utio
nM
em. L
oad
Dep
ende
ntM
em. L
oad
Inde
pend
ent
IPC Branch Miss L1 DATA MPKI
Con
trol
Dep
ende
ncy
Table 3.7 and Table 3.8 present the comparison in terms of IPC, branch miss ratio andL1 data Misses per Kilo Instructions (MPKI) for the single-threaded microbenchmarksrunning on the real Core 2 Duo and Sandy Bridge machine and with SiNUCA (sim). ForCore 2 Duo, the geometric mean of the absolute IPC difference for all the microbench-marks is 12%, with a standard deviation of 29%. For Sandy Bridge, the geometric mean ofthe absolute IPC difference for all the microbenchmarks is 6%, with a standard deviationof 27%.

53
Table 3.8: Single-threaded microbenchmarks results for Sandy Bridge.
Bra
nch
Pre
dic
tor
Bra
nch
Mis
s P
ena
lty
In-f
ligh
t B
ran
che
s
Reg
iste
r F
ile
Fu
nct
ion
al U
nit
s
L1
Cac
he
L2
Cac
he
LL
C
DR
AM
Pre
fetc
her
Real Sim Diff Real Sim Real Sim Real SimComplex ● 1.81 2.61 44% 0.00% 0.00% 0.00 0.00 13.34 17.15Conditional ● 3.00 3.00 0% 0.00% 0.00% 0.00 0.00 10.82 9.16Random ● ● 0.96 0.97 1% 28.54% 28.57% 0.01 0.00 13.11 13.75Small_bbl ● ● 3.00 3.00 0% 0.00% 0.00% 0.00 0.00 4.17 17.77Switch ● 2.75 1.83 33% 0.00% 0.00% 0.00 0.00 4.45 10.92Chain-1 ● 1.09 1.09 0% 0.00% 0.00% 0.00 0.00 4.78 21.16Chain-2 ● 2.14 2.19 2% 0.00% 0.00% 0.00 0.00 1.77 11.37Chain-3 ● 3.00 3.00 0% 0.00% 0.00% 0.00 0.00 3.94 8.23Chain-4 ● 3.09 3.00 3% 0.00% 0.00% 0.00 0.00 3.48 8.72Chain-5 ● 3.09 3.00 3% 0.00% 0.00% 0.00 0.00 5.56 8.23Chain-6 ● 3.09 3.00 3% 0.00% 0.00% 0.00 0.00 8.74 8.23FP-add ● 1.08 1.09 1% 0.01% 0.01% 0.01 0.00 10.82 10.93FP-div ● 0.11 0.11 0% 0.04% 0.03% 0.03 0.02 26.52 24.76FP-mul ● 1.08 1.09 1% 0.01% 0.01% 0.01 0.00 10.85 11.28INT-add ● 3.09 3.00 3% 0.00% 0.00% 0.00 0.00 9.38 10.90INT-div ● 0.03 0.03 19% 0.24% 0.28% 0.26 0.19 10.74 7.85INT-mul ● 1.08 1.09 1% 0.01% 0.01% 0.01 0.01 5.38 5.3100016kb ● 0.32 0.35 10% 2.64% 0.36% 0.28 0.22 1.03 0.9100032kb ● 0.28 0.29 4% 0.18% 5.76% 15.89 15.62 1.15 1.0600064kb ● 0.10 0.09 5% 0.21% 3.25% 874.63 880.29 3.45 3.2900128kb ● 0.09 0.09 5% 1.83% 1.89% 875.07 882.01 3.55 3.3700256kb ● 0.08 0.09 8% 0.91% 1.18% 873.41 882.66 4.19 3.4400512kb ● 0.07 0.06 17% 0.57% 0.81% 868.48 882.60 4.81 5.1201024kb ● 0.07 0.06 17% 0.39% 0.63% 859.70 881.76 4.84 5.1402048kb ● 0.07 0.06 19% 0.32% 0.53% 842.57 879.76 4.85 5.1404096kb ● 0.07 0.06 20% 0.28% 0.47% 810.86 875.64 4.90 5.1508192kb ● 0.08 0.06 25% 0.26% 0.42% 752.75 867.50 4.93 5.1616384kb ● 0.08 0.06 21% 0.24% 0.37% 658.64 851.88 5.55 5.2132768kb ● 0.06 0.02 65% 0.23% 0.31% 528.70 823.22 7.91 14.9800016kb ● ● 1.14 1.15 0% 0.08% 0.18% 0.12 0.10 0.61 0.7100032kb ● ● 1.13 1.13 0% 0.09% 5.66% 0.19 0.11 0.61 0.7100064kb ● ● 0.56 0.50 10% 0.10% 3.10% 880.57 881.87 1.25 1.4900128kb ● ● 0.54 0.50 8% 0.10% 1.71% 882.16 884.11 1.27 1.4900256kb ● ● 0.35 0.45 26% 0.85% 0.98% 881.68 885.16 1.97 1.6700512kb ● ● 0.19 0.18 6% 0.48% 0.61% 879.48 885.55 3.69 4.0001024kb ● ● 0.19 0.18 7% 0.30% 0.42% 875.49 885.47 3.73 4.0602048kb ● ● 0.20 0.18 8% 0.22% 0.32% 867.18 884.87 3.74 4.0504096kb ● ● 0.20 0.18 9% 0.19% 0.27% 852.45 883.47 3.77 4.0608192kb ● ● 0.20 0.18 10% 0.18% 0.24% 821.45 880.57 3.80 4.0216384kb ● ● 0.17 0.18 6% 0.19% 0.21% 765.52 874.80 4.60 4.0432768kb ● ● 0.10 0.07 28% 0.19% 0.19% 674.21 863.52 8.68 10.4300016kb ● ● 1.13 1.14 1% 0.08% 0.19% 0.12 0.10 0.61 0.6600032kb ● ● 1.12 1.13 1% 0.09% 5.66% 0.26 0.11 0.61 0.9900064kb ● ● 0.17 0.28 62% 0.11% 3.10% 1754.80 880.40 3.91 2.5100128kb ● ● 0.17 0.28 65% 0.11% 1.71% 1759.56 883.44 3.99 2.5100256kb ● ● 0.16 0.41 150% 0.85% 0.98% 1760.56 884.97 4.27 1.8000512kb ● ● 0.12 0.18 45% 0.49% 0.61% 1756.31 885.73 5.78 3.7901024kb ● ● 0.12 0.18 46% 0.31% 0.42% 1749.05 886.12 5.93 3.8102048kb ● ● 0.12 0.18 44% 0.23% 0.32% 1733.53 886.31 5.94 3.8304096kb ● ● 0.12 0.18 42% 0.19% 0.28% 1704.49 886.40 5.96 3.8408192kb ● ● 0.13 0.18 38% 0.19% 0.25% 1645.38 886.45 5.98 3.8416384kb ● ● 0.11 0.18 57% 0.20% 0.24% 1537.79 886.48 7.30 3.8532768kb ● ● 0.08 0.02 72% 0.21% 0.23% 1357.70 886.49 17.11 28.56
0.34 0.34 6% 0.07% 0.14% 8.68 6.77 4.24 4.7027%
GeoMeanStDev
Energy (Joules)
Mem
. Sto
re In
dep
ende
nt
Characteristic IPC Branch Miss L1 Data MPKI
Con
trol
Dep
ende
ncy
Exe
cutio
nM
em. L
oad
Dep
ende
ntM
em. L
oad
Ind
epen
dent
Figure 3.2 depicts the IPC results for the real machines and the simulation.
Control benchmarks: Evaluating the control benchmark Small_ bbl, we conclude thatthe maximum number of parallel predicted branches in execution inside the pipeline isequal to 8. With the Random benchmark, we calculate the misprediction penalty as 20cycles. For the other control benchmarks, we can observe the different behavior from ourPAs branch predictor to the real machine implementation.
Dependency benchmarks: Observing the behavior of dependency benchmarks, we cannotice that for Chain-1 and Chain-6 the simulation obtains very close results to the realmachines. Inside the simulator, all the dependencies are solved one cycle after the resultis available. For Chain-1, we can observe that the latency for data forwarding is modeledcorrectly. However, the results from Chain-2 to Chain-5 show that the real machines have
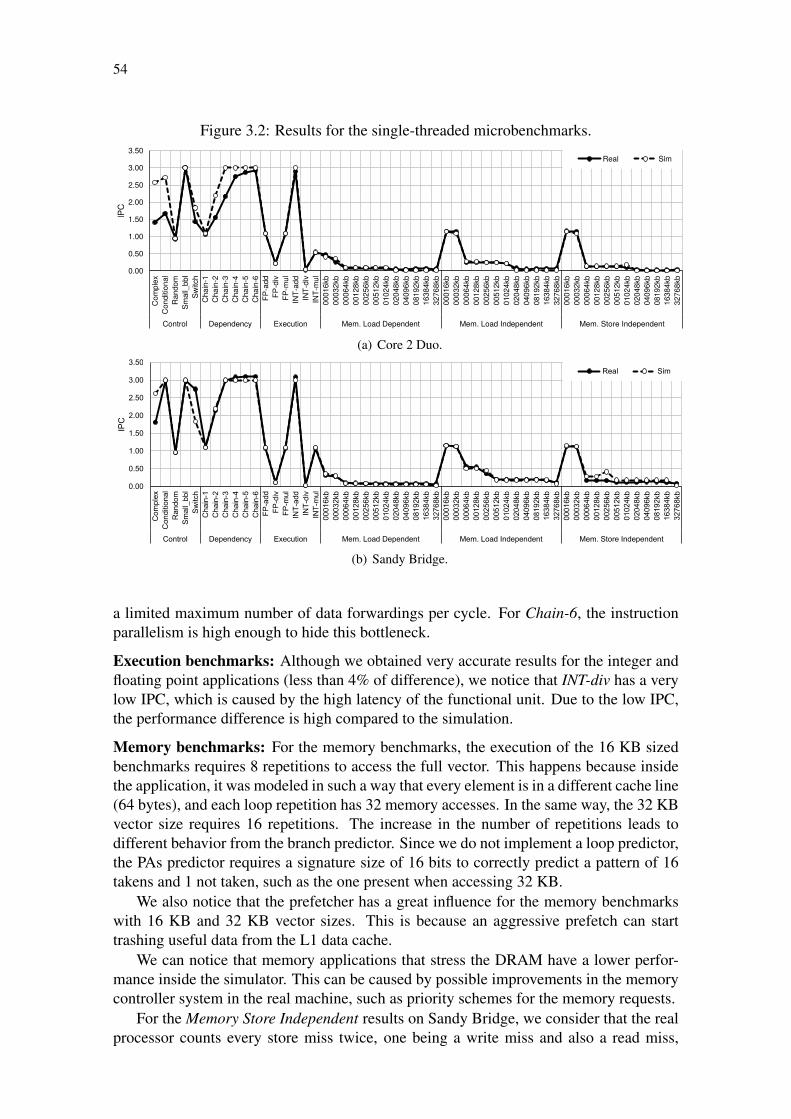
54
Figure 3.2: Results for the single-threaded microbenchmarks.
0.00
0.50
1.00
1.50
2.00
2.50
3.00
3.50C
ompl
exC
ondi
tiona
lR
ando
mSm
all_
bbl
Switc
hC
hain
-1C
hain
-2C
hain
-3C
hain
-4C
hain
-5C
hain
-6FP
-add
FP-d
ivFP
-mul
INT-
add
INT-
div
INT-
mul
0001
6kb
0003
2kb
0006
4kb
0012
8kb
0025
6kb
0051
2kb
0102
4kb
0204
8kb
0409
6kb
0819
2kb
1638
4kb
3276
8kb
0001
6kb
0003
2kb
0006
4kb
0012
8kb
0025
6kb
0051
2kb
0102
4kb
0204
8kb
0409
6kb
0819
2kb
1638
4kb
3276
8kb
0001
6kb
0003
2kb
0006
4kb
0012
8kb
0025
6kb
0051
2kb
0102
4kb
0204
8kb
0409
6kb
0819
2kb
1638
4kb
3276
8kb
Control Dependency Execution Mem. Load Dependent Mem. Load Independent Mem. Store Independent
IPC
Real Sim
(a) Core 2 Duo.
0.00
0.50
1.00
1.50
2.00
2.50
3.00
3.50
Co
mp
lex
Co
ndi
tion
al
Ran
dom
Sm
all_
bbl
Sw
itch
Cha
in-1
Cha
in-2
Cha
in-3
Cha
in-4
Cha
in-5
Cha
in-6
FP
-add
FP
-div
FP
-mul
INT
-add
INT
-div
INT
-mu
l00
016k
b00
032k
b00
064k
b00
128k
b00
256k
b00
512k
b01
024k
b02
048k
b04
096k
b08
192k
b16
384k
b32
768k
b00
016k
b00
032k
b00
064k
b00
128k
b00
256k
b00
512k
b01
024k
b02
048k
b04
096k
b08
192k
b16
384k
b32
768k
b00
016k
b00
032k
b00
064k
b00
128k
b00
256k
b00
512k
b01
024k
b02
048k
b04
096k
b08
192k
b16
384k
b32
768k
b
Control Dependency Execution Mem. Load Dependent Mem. Load Independent Mem. Store Independent
IPC
Real Sim
(b) Sandy Bridge.
a limited maximum number of data forwardings per cycle. For Chain-6, the instructionparallelism is high enough to hide this bottleneck.
Execution benchmarks: Although we obtained very accurate results for the integer andfloating point applications (less than 4% of difference), we notice that INT-div has a verylow IPC, which is caused by the high latency of the functional unit. Due to the low IPC,the performance difference is high compared to the simulation.
Memory benchmarks: For the memory benchmarks, the execution of the 16 KB sizedbenchmarks requires 8 repetitions to access the full vector. This happens because insidethe application, it was modeled in such a way that every element is in a different cache line(64 bytes), and each loop repetition has 32 memory accesses. In the same way, the 32 KBvector size requires 16 repetitions. The increase in the number of repetitions leads todifferent behavior from the branch predictor. Since we do not implement a loop predictor,the PAs predictor requires a signature size of 16 bits to correctly predict a pattern of 16takens and 1 not taken, such as the one present when accessing 32 KB.
We also notice that the prefetcher has a great influence for the memory benchmarkswith 16 KB and 32 KB vector sizes. This is because an aggressive prefetch can starttrashing useful data from the L1 data cache.
We can notice that memory applications that stress the DRAM have a lower perfor-mance inside the simulator. This can be caused by possible improvements in the memorycontroller system in the real machine, such as priority schemes for the memory requests.
For the Memory Store Independent results on Sandy Bridge, we consider that the realprocessor counts every store miss twice, one being a write miss and also a read miss,
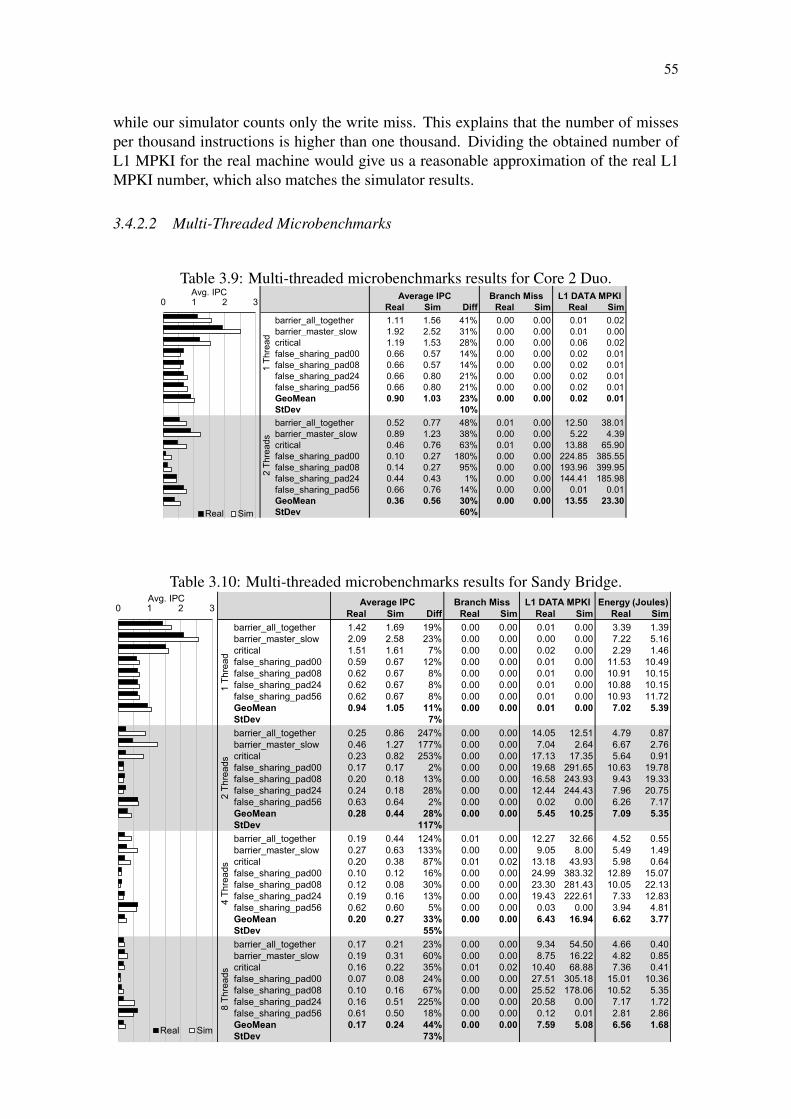
55
while our simulator counts only the write miss. This explains that the number of missesper thousand instructions is higher than one thousand. Dividing the obtained number ofL1 MPKI for the real machine would give us a reasonable approximation of the real L1MPKI number, which also matches the simulator results.
3.4.2.2 Multi-Threaded Microbenchmarks
Table 3.9: Multi-threaded microbenchmarks results for Core 2 Duo.
Real Sim Diff Real Sim Real Sim
barrier_all_together 1.11 1.56 41% 0.00 0.00 0.01 0.02barrier_master_slow 1.92 2.52 31% 0.00 0.00 0.01 0.00critical 1.19 1.53 28% 0.00 0.00 0.06 0.02false_sharing_pad00 0.66 0.57 14% 0.00 0.00 0.02 0.01false_sharing_pad08 0.66 0.57 14% 0.00 0.00 0.02 0.01false_sharing_pad24 0.66 0.80 21% 0.00 0.00 0.02 0.01false_sharing_pad56 0.66 0.80 21% 0.00 0.00 0.02 0.01GeoMean 0.90 1.03 23% 0.00 0.00 0.02 0.01StDev 10%
barrier_all_together 0.52 0.77 48% 0.01 0.00 12.50 38.01barrier_master_slow 0.89 1.23 38% 0.00 0.00 5.22 4.39critical 0.46 0.76 63% 0.01 0.00 13.88 65.90false_sharing_pad00 0.10 0.27 180% 0.00 0.00 224.85 385.55false_sharing_pad08 0.14 0.27 95% 0.00 0.00 193.96 399.95false_sharing_pad24 0.44 0.43 1% 0.00 0.00 144.41 185.98false_sharing_pad56 0.66 0.76 14% 0.00 0.00 0.01 0.01GeoMean 0.36 0.56 30% 0.00 0.00 13.55 23.30StDev 60%
1 T
hrea
d2
Thr
eads
Average IPC Branch Miss L1 DATA MPKI
0 1 2 3Avg. IPC
Real Sim
Table 3.10: Multi-threaded microbenchmarks results for Sandy Bridge.
Real Sim Diff Real Sim Real Sim Real Sim
barrier_all_together 1.42 1.69 19% 0.00 0.00 0.01 0.00 3.39 1.39barrier_master_slow 2.09 2.58 23% 0.00 0.00 0.00 0.00 7.22 5.16critical 1.51 1.61 7% 0.00 0.00 0.02 0.00 2.29 1.46false_sharing_pad00 0.59 0.67 12% 0.00 0.00 0.01 0.00 11.53 10.49false_sharing_pad08 0.62 0.67 8% 0.00 0.00 0.01 0.00 10.91 10.15false_sharing_pad24 0.62 0.67 8% 0.00 0.00 0.01 0.00 10.88 10.15false_sharing_pad56 0.62 0.67 8% 0.00 0.00 0.01 0.00 10.93 11.72GeoMean 0.94 1.05 11% 0.00 0.00 0.01 0.00 7.02 5.39StDev 7%
barrier_all_together 0.25 0.86 247% 0.00 0.00 14.05 12.51 4.79 0.87barrier_master_slow 0.46 1.27 177% 0.00 0.00 7.04 2.64 6.67 2.76critical 0.23 0.82 253% 0.00 0.00 17.13 17.35 5.64 0.91false_sharing_pad00 0.17 0.17 2% 0.00 0.00 19.68 291.65 10.63 19.78false_sharing_pad08 0.20 0.18 13% 0.00 0.00 16.58 243.93 9.43 19.33false_sharing_pad24 0.24 0.18 28% 0.00 0.00 12.44 244.43 7.96 20.75false_sharing_pad56 0.63 0.64 2% 0.00 0.00 0.02 0.00 6.26 7.17GeoMean 0.28 0.44 28% 0.00 0.00 5.45 10.25 7.09 5.35StDev 117%
barrier_all_together 0.19 0.44 124% 0.01 0.00 12.27 32.66 4.52 0.55barrier_master_slow 0.27 0.63 133% 0.00 0.00 9.05 8.00 5.49 1.49critical 0.20 0.38 87% 0.01 0.02 13.18 43.93 5.98 0.64false_sharing_pad00 0.10 0.12 16% 0.00 0.00 24.99 383.32 12.89 15.07false_sharing_pad08 0.12 0.08 30% 0.00 0.00 23.30 281.43 10.05 22.13false_sharing_pad24 0.19 0.16 13% 0.00 0.00 19.43 222.61 7.33 12.83false_sharing_pad56 0.62 0.60 5% 0.00 0.00 0.03 0.00 3.94 4.81GeoMean 0.20 0.27 33% 0.00 0.00 6.43 16.94 6.62 3.77StDev 55%
barrier_all_together 0.17 0.21 23% 0.00 0.00 9.34 54.50 4.66 0.40barrier_master_slow 0.19 0.31 60% 0.00 0.00 8.75 16.22 4.82 0.85critical 0.16 0.22 35% 0.01 0.02 10.40 68.88 7.36 0.41false_sharing_pad00 0.07 0.08 24% 0.00 0.00 27.51 305.18 15.01 10.36false_sharing_pad08 0.10 0.16 67% 0.00 0.00 25.52 178.06 10.52 5.35false_sharing_pad24 0.16 0.51 225% 0.00 0.00 20.58 0.00 7.17 1.72false_sharing_pad56 0.61 0.50 18% 0.00 0.00 0.12 0.01 2.81 2.86GeoMean 0.17 0.24 44% 0.00 0.00 7.59 5.08 6.56 1.68StDev 73%
2 T
hre
ad
s4
Th
rea
ds
8 T
hre
ad
s
Average IPC Energy (Joules)Branch Miss L1 DATA MPKI
1 T
hre
ad
0 1 2 3Avg. IPC
Real Sim

56
Table 3.9 presents the comparison for the multi-threaded microbenchmarks runningon the real Core 2 Duo machine and with SiNUCA. The table shows the average IPCbetween the cores, the branch miss ratio and L1 data MPKI. The geometric mean of theabsolute IPC difference for 1 thread execution is 23%, with a standard deviation of 10%,the difference for 2 threads execution is 30% with a standard deviation of 60%.
Table 3.10 presents the comparison for the multi-threaded microbenchmarks runningon the real Sandy Bridge machine and with SiNUCA. The table shows the average IPCbetween the cores, the branch miss ratio, L1 data MPKI and also the energy consumption.The geometric mean of the absolute IPC difference for 1, 2, 4 and 8 threads are 11%,28%, 33%, 44%, with standard deviations of 7%, 117%, 55 % and 73% respectively.
The parallel benchmarks have a simple code, formed by easy to predict loops, makingthe number of branch mispredictions close to zero.
The False Sharing application presents the higher numbers of L1 MPKI, where ourevaluations changing the pad size, reduces the L1 MPKI as less threads falsely share thesame cache line. The L1 MPKI difference between the real processor and SiNUCA ispartially explained by the possible differences in the directory line lock policy, where thereal machine could give the control of the cache line for a single core for a longer period oftime, in order to reduce the successive cache line invalidations. Considering that for thisapplication multiple cache-to-cache operations can occur during cache misses, the realmachine can account those misses in a different manner, however no detailed informationabout the implementation of the hardware counters is available.
During the execution on the simulator of the 8 threaded False Sharing application witha 24 bytes padding, the first L1 caches to request the shared cache line obtained the lockon the directory for most of the time until these threads finish executing. Only then, theother threads can continue their execution, leading to a higher average IPC and a reducedL1 MPKI on the simulator.
3.4.2.3 Commercial Workloads
Figure 3.3 presents the IPC for the SPEC-CPU2006 benchmark suite running on theCore 2 Duo and Sandy Bridge machines. For the Core 2 Duo, the geometric mean of IPCdifference is 19% for all suite, with a standard deviation of 27%. For Sandy Bridge ma-chine, the geometric mean of IPC difference is 12% for all suite, with a standard deviationof 16%.
For the SPEC-CPU2006 benchmarks, the major source of difference was the branchpredictor (see Appendix A). We could see that applications behave differently whenswitching between PAs and GAs branch predictors, in such way that a hybrid predictor isbeing considered to reduce the gap between the real and simulator difference.
Figure 3.4 presents the speed-up for the SPEC-OMP2001 benchmark suite runningon Core 2 Duo and Sandy Bridge machines. For the Core 2 Duo, the geometric mean ofspeed-up difference is 6% for these applications executing with 2 threads, with a standarddeviation of 10% for all suite applications. For the Sandy Bridge, the geometric mean ofspeed-up difference for 2, 4 and 8 threads are 10%, 27%, 41%, with standard deviationsof 17%, 55%, 70% respectively.
Figure 3.5 presents the speed-up for the NAS-NPB benchmark suite running on theCore 2 Duo and Sandy Bridge machine. For Core 2 Duo, the geometric mean of speed-updifference is 7% for these applications using 2 threads, with a standard deviation of 8%for all suite applications. For Sandy Bridge, the geometric mean of speed-up difference

57
Figure 3.3: Results for the SPEC-CPU2006 suite.
0.00
0.50
1.00
1.50
2.00
2.50
asta
r
bzip
2
gcc
gobm
k
h264
ref
hmm
er
libqu
antu
m
mcf
omne
tpp
perlb
ench
sjen
g
xala
ncbm
k
Geo
Mea
n
bwav
es
cact
usAD
M
calc
ulix
deal
II
gam
ess
Gem
sFD
TD
grom
acs
lbm
lesl
ie3d milc
nam
d
povr
ay
sopl
ex
sphi
nx3
tont
o
wrf
zeus
mp
Geo
Mea
n
Geo
Mea
n
SPEC-CPU2006 - CINT SPEC-CPU2006 - CFP *
IPC
Real Sim
(a) Core 2 Duo.
0.00
0.50
1.00
1.50
2.00
2.50
asta
r
bzip
2
gcc
gobm
k
h264
ref
hmm
er
libqu
antu
m
mcf
omne
tpp
perlb
ench
sjen
g
xala
ncbm
k
Geo
Mea
n
bwav
es
cact
usAD
M
calc
ulix
deal
II
gam
ess
Gem
sFD
TD
grom
acs
lbm
lesl
ie3d milc
nam
d
povr
ay
sopl
ex
sphi
nx3
tont
o
wrf
zeus
mp
Geo
Mea
n
Geo
Mea
n
SPEC-CPU2006 - CINT SPEC-CPU2006 - CFP *
IPC
Real Sim
(b) Sandy Bridge.
for 2, 4 and 8 threads are 6%, 19%, 23% with standard deviations of 5%, 23% and 58%,respectively.
It is possible to observe that the speedup and IPC results for 2 threads have a lowerdifference between the real and simulated processor, compared to an increasing number ofthreads. As the number of threads increases, the synchronization has an increased effecton the execution time. This difference can change the threads lock priority, the cachemisses that each thread causes, and others.
3.4.3 Sources of Difference
There are multiple sources of difference between SiNUCA and the real processor,because commercial processors have undisclosed details which we tried to approximate.However, we believe that the main differences were caused by the following components:
Branch Predictor: The first source of differences regarding the two-level branch predic-tor implemented inside SiNUCA is that this well known mechanism is not guaranteed tobe exactly the same as the one implemented in a real machine. Since this mechanism’sprediction is sensitive to its implementation, small implementation differences can leadto different predictions.
During branch mispredictions, the simulator stops fetching new instructions until thebranch is solved. However, in a real machine, the processor would continue fetching andexecuting instructions until detection of a misprediction causes a rollback. In such cases,

58
Figure 3.4: Results for the SPEC-OMP2001 suite.
0.000.200.400.600.801.001.201.401.601.802.00
appl
u.M
apsi
.Mfm
a3d.
Mga
lgel
.Mm
grid
.Msw
im.M
wup
wis
e.M
Geo
Mea
n
2 Threads
Spee
dup
Real Sim
(a) Core 2 Duo.
0.00
1.00
2.00
3.00
4.00
5.00
6.00
7.00
8.00
appl
u.M
apsi
.Mfm
a3d.
Mga
lgel
.Mm
grid
.Msw
im.M
wup
wis
e.M
Geo
Mea
nap
plu.
Map
si.M
fma3
d.M
galg
el.M
mgr
id.M
swim
.Mw
upw
ise.
MG
eoM
ean
appl
u.M
apsi
.Mfm
a3d.
Mga
lgel
.Mm
grid
.Msw
im.M
wup
wis
e.M
Geo
Mea
n
2 Threads 4 Threads 8 Threads
Spee
dup
Real Sim
(b) Sandy Bridge.
Figure 3.5: Results for the NAS-NPB suite.
0.000.200.400.600.801.001.201.401.601.802.00
bt.A
cg.A ft.A
is.A
lu.A
mg.
Asp
.AG
eoM
ean
2 Threads
Spee
dup
Real Sim
(a) Core 2 Duo.
0.00
1.00
2.00
3.00
4.00
5.00
6.00
7.00
8.00
bt.A
cg.A ft.A
is.A
lu.A
mg.
Asp
.AG
eoM
ean
bt.A
cg.A ft.A
is.A
lu.A
mg.
Asp
.AG
eoM
ean
bt.A
cg.A ft.A
is.A
lu.A
mg.
Asp
.AG
eoM
ean
2 Threads 4 Threads 8 Threads
Spee
dup
Real Sim
(b) Sandy Bridge.
the cache memory can be in a different state, since the wrong path may perform memoryloads. These operations will change the cache state.
Functional Units: The real machine contention in the number of ports connecting thereservation station and functional units is not modeled inside SiNUCA, thus representinga source of inaccuracy.
Additionally, the latencies for instructions that use the same functional unit can varyin a real machine depending on the type of the operands and their precisions. However,inside SiNUCA, the execution latencies are defined by the functional unit used, and not bythe instruction itself. Such modification in the simulator would be impractical since thereare hundreds of instructions inside the x86-64 Instruction Set Architecture (ISA). Thus,latencies for single precision and double precision floating point are the same. The laten-cies configured for our evaluations were chosen to take into account that most benchmarksuse double precision floating point.
Memory Disambiguation: A real processor memory disambiguation unit can cause dif-ferences in the performance. However, the implementation details for this unit are un-known for commercial processors, and this could cause performance differences when

59
comparing the simulator to the real machine (DOWECK, 2006). During our experiments,perfect disambiguation was modeled, enabling reads to be scheduled before writes, aslong as the operation addresses do not overlap.
Translation Lookaside Buffer: Although the Translation Look-aside Buffer (TLB) ispresent in most real processors, SiNUCA does not implement this component. This sim-plification was made because we consider that for most of the benchmarks this componentwould not influence performance. However the energy consumption of this componentwas fully modeled, considering the number of L1 accesses.
A second source of difference that can be caused by the address translation, is thedifferent virtual to physical address mapping present in the real and simulated processor.Any different address mapping can cause different cache statistics. However, it is ex-pected that the general behavior of the cache system would be the same, even for differentaddress mappings.
Cache Prefetcher: The memory prefetching algorithms implemented in SiNUCA arewell known techniques presented in multiple papers. However, the information about thereal processor prefetcher is missing some details. Thus, it is not guaranteed that the simu-lated prefetchers would perform exactly the same as the real machine. This difference alsohappens because small changes in the prefetcher parameters, such as number of strides,can cause a high impact on the final MPKI.
Trace Cache: The real machine used in our experiments has a trace instruction cache,which reduces the fetch and decode latency when executing loops. Such mechanismis also able to reduce the energy consumption. However, it is not yet implemented inSiNUCA.
Cache Memories: Different MSHR scheduling policies can lead to different performanceresults. If the policy gives priority to processor load requests over the prefetches or overwrite transactions, this can generate different performance results. The actual policy im-plemented in SiNUCA is based on First-Come First-Serve (FCFS). This policy is only notrespected when the request corresponds to a cache line that is locked in the directory byanother cache, in this case the cache serves the next oldest request.
Memory Controller: The memory controller details in a real hardware were simplifiedin the SiNUCA implementation, in such a way that the main operations would perform inthe same way, but some corner cases can perform differently. However, most of the DDRlatencies are being simulated, such as Added Latency for column accesses (AL), ColumnAddress Strobe (CAS), Column to Column Delay (CCD), Column Write Delay (CWD),Four row Activation Window (FAW), Row Address Strobe (RAS), Row Cycle (RC), RASto CAS Delay (RCD), Row Precharge (RP), Row to Row activation Delay (RRD), ReadTo Precharge (RTP), Write To Read delay time (WR) and Write Recovery time (WTR).
The memory scheduling policy can also cause performance differences, depending onthe real hardware implementation. For our experiments, the simple open-row first policywas used.
General Parameters: Parameters, such as the size of internal buffers, size of tables andnumber of bits used for branch predictors and prefetchers may affect the final performanceof a system in different ways. Considering that most of the processor internals are intel-lectual property, the internal parameters are not public. Such unknown parameters weremodeled considering a balanced design and also considering the parameters commonlyused in papers from main conferences.

60
Operating System Interference: The traces generated to feed the simulator are alwaysgenerated considering only the application instructions. No operating system instructionsare tracked. The lack of operating system in our traces guarantee that only the applicationbehavior will interfere in the final performance, without external noise.
Multi-Thread synchronization: OpenMP offers three thread wait policies (active, pas-sive and hybrid wait). For the active wait, it uses a spin lock to keep the threads runningwaiting in the barrier. The passive wait automatically puts the thread to sleep when itreaches any barrier. The hybrid wait policy offers a balanced design which makes thethreads wait actively for a period of time before the thread is sent to sleep.
For multi-threaded benchmarks, the simulator respects the synchronization barriersand atomic points. However, it does not simulate active wait nor the sleep and wake-up in-structions from the OS. We observed in our experiments that when using the passive waitpolicy, the fact of not simulating the sleep/wakeup instructions could cause differencesin our multi-threaded microbenchmarks. In order to reduce this source of difference, thehybrid OpenMP wait policy was used during our evaluations.
3.4.4 Simulator Performance
The results regarding the simulator performance refer to how fast the traces can besimulated. For this evaluation, all the benchmarks from SPEC-CPU2006 and SPEC-OMP2001 suites were simulated with SiNUCA modeling a Sandy Bridge processor, exe-cuting on a real Intel Sandy Bridge machine.
Figure 3.6: Sandy Bridge simulation performance for the SPEC-CPU2006 suite.
0
100
200
300
400
500
600
asta
rbz
ip2
gcc
gobm
kh2
64re
fhm
mer
libqu
antu
mm
cfom
netp
ppe
rlben
chsj
eng
xala
ncbm
kAv
erag
ebw
aves
cact
usAD
Mca
lcul
ixde
alII
gam
ess
Gem
sFD
TDgr
omac
slb
mle
slie
3d milc
nam
dpo
vray
sopl
exsp
hinx
3to
nto
wrf
zeus
mp
Aver
age
Aver
age
SPEC-CPU2006 - CINT SPEC-CPU2006 - CFP *
Rel
ative
Per
form
ance
KHz KIPS
Figure 3.6 presents the simulator performance when executing the SPEC-CPU2006applications. It is possible to see that SiNUCA varies from 100 to 400 Kilo Instructionsper Second (KIPS), with an average of 250 KIPS. Considering the number of cycles be-ing simulated and the simulation time, we obtain the maximum frequency at which oursimulator simulates the processor clock, which varies from 170 kHz to 530 kHz, with anaverage of 270 kHz.
To evaluate the performance when simulating multi-threaded benchmarks, Figure 3.7presents the SPEC-OMP2001 simulation performance results for different numbers ofthreads. The KIPS varies from 75 to 330, and the simulation frequency varies from 25 to420 kHz.

61
Figure 3.7: Sandy Bridge simulation performance for the SPEC-OMP2001 suite.
0
50
100
150
200
250
300
350
400
app
lu
aps
i
fma3
d
gal
gel
mg
rid
swim
wup
wis
e
Ave
rag
e
KIP
S
1 Thread 2 Threads
4 Threads 8 Threads
0
50
100
150
200
250
300
350
400
450
app
lu
aps
i
fma
3d
galg
el
mg
rid
swim
wup
wis
e
Ave
rag
e
KH
z
1 Thread 2 Threads4 Threads 8 Threads
Although the increase on number of threads reduces the cycles simulated per second,SiNUCA keeps the number of instructions simulated at the same level (200 KIPS).
To give one example of the simulator performance, to execute a single threaded bench-mark with 200 million instructions with SiNUCA takes on average only 14 minutes. Tosimulate 8 threads executing 200 million instructions each, takes on average 19 minutes.Such performance enables the user to perform multiple experiments in a reasonable time,eliminating a very common problem in computer architecture evaluations.
3.5 Summary
We presented SiNUCA, a performance and energy validated simulator, which is in-tegrated with McPAT to enable energy modeling. It supports simulation of emergingtechniques and it is easy to extend.
Our validation process shows an average difference on performance of 12% for single-threaded and 26% for multi-threaded microbenchmarks when simulating the Core-2Duomachine. An average difference on performance of 6% for single-threaded and 29% formulti-threaded benchmarks when simulating a Sandy Bridge architecture.
Considering the energy modeling using McPAT together with our simulator, we ob-tain an average difference of 18% for single-threaded and 46 % for multi-threaded mi-crobenchmarks related to energy consumption when modeling the Sandy Bridge architec-ture.
The results regarding the simulator performance show that SiNUCA enables com-puter architects to evaluate new techniques in a reasonable time, simulating at 270 kHz(250 KIPS) on average.

62

63
4 DEAD SUB-BLOCK PREDICTOR (DSBP)
As explained in Section 2.1, energy inefficiency occurs on two levels: 1) on the cacheline level, where a line is kept alive in the cache for much longer than it is needed, and 2)on the sub-block level, when parts of a cache line which will never be used are broughtinto the cache, and also when active sub-blocks become dead after a few accesses but arekept alive until the line is evicted.
Prior work has made attempts at achieving these benefits by, for example, predictingwhen a line is last accessed, and then powering it off (KAXIRAS; HU; MARTONOSI,2001; ABELLA et al., 2005). On the sub-block level a prior work presented a mechanism(CHEN et al., 2004) that only brings into the cache the useful sub-blocks. In this chapter,we show that turning off dead sub-blocks can significantly improve energy savings inthe cache hierarchy. In fact, by considering sub-block usage patterns, our mechanismincreases the potential for energy savings compared to a perfect hypothetical mechanismthat turns off an entire cache line immediately after it is last accessed.
We propose the Dead Sub-Block Predictor (DSBP) (ALVES et al., 2012) to improveenergy efficiency of cache memories. DSBP uses recent history information to predictwhich sub-block(s) will be useful and how many accesses each sub-block will receivebefore it becomes dead. DSBP’s main goal is to reduce dynamic and static energy con-sumption by bringing only useful sub-blocks into the cache, and also by turning off activesub-blocks after their predicted number of accesses. We also use DSBP to improve theexisting cache replacement policy by prioritizing dead lines (that is, cache lines with allsub-blocks turned off) for eviction. We find that this policy effectively offsets the addi-tional cache misses DSBP may cause when it mispredicts the usage pattern of a cacheline.
The main contributions of the DSBP mechanism are:
Sub-block usage predictor: We present a mechanism to predict and allocate only theuseful sub-blocks of each cache line. Unlike prior work, which requires an access to theprediction table after each cache line access, we access the predictor structure only whenthe mechanism is training a new usage pattern. On average, our mechanism accesses itsglobal structure on only 60% of the cache memory accesses.
Dead sub-block predictor: Our mechanism also predicts when each sub-block inside acache line becomes dead. To our knowledge, this is the first usage predictor that acts on asub-block level, turning off dead sub-blocks and saving 36% energy on average comparedto a traditional cache design.
Earlier eviction of dead lines: Our mechanism improves the cache replacement algo-rithm. The sub-block predictor gives feedback to the replacement algorithm by markingdead lines as future victim lines as soon as they become dead.
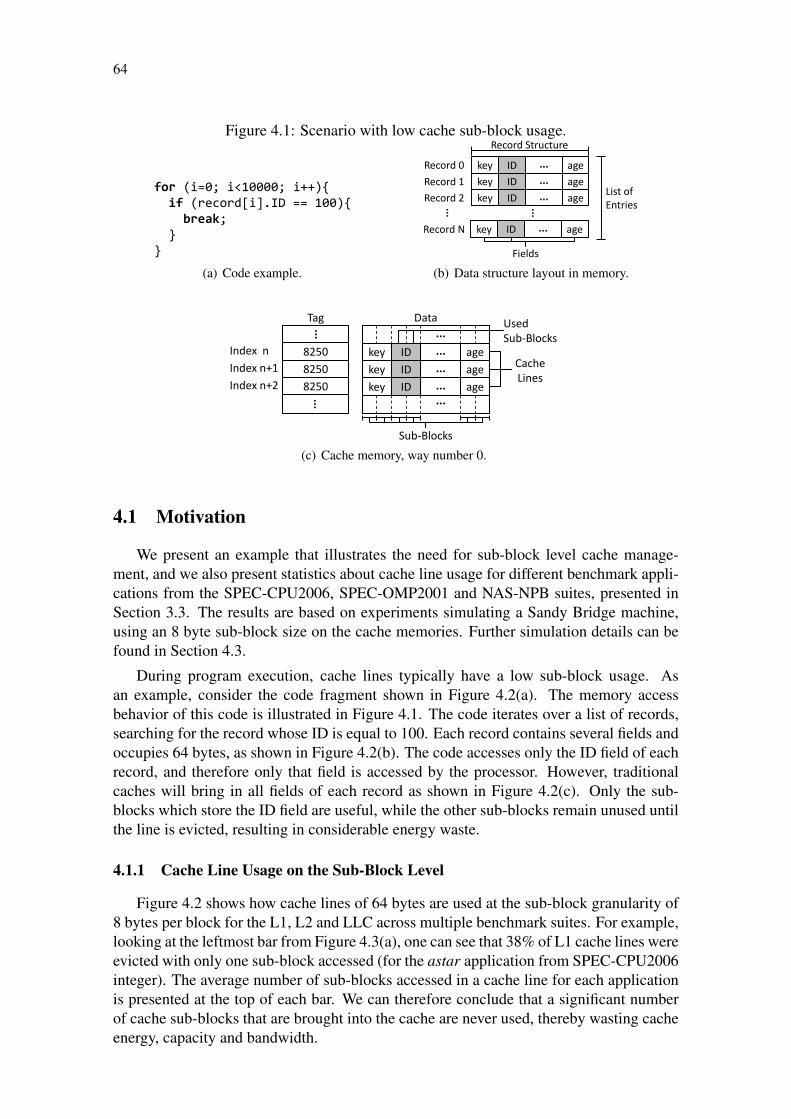
64
Figure 4.1: Scenario with low cache sub-block usage.
for (i=0; i<10000; i++){if (record[i].ID == 100){
break;}
}
(a) Code example.
... key age ID
... key age ID
... key age ID
...
key age ID
Record Structure
Fields
...
List of Entries
Record 0
Record 1
Record 2
Record N
...
(b) Data structure layout in memory.
... key age ID
Tag Data
... key age ID
... key age ID
...
Sub-Blocks
Used Sub-Blocks
CacheLines
8250
8250
8250
...
...
Index n
Index n+1
Index n+2
...
(c) Cache memory, way number 0.
4.1 Motivation
We present an example that illustrates the need for sub-block level cache manage-ment, and we also present statistics about cache line usage for different benchmark appli-cations from the SPEC-CPU2006, SPEC-OMP2001 and NAS-NPB suites, presented inSection 3.3. The results are based on experiments simulating a Sandy Bridge machine,using an 8 byte sub-block size on the cache memories. Further simulation details can befound in Section 4.3.
During program execution, cache lines typically have a low sub-block usage. Asan example, consider the code fragment shown in Figure 4.2(a). The memory accessbehavior of this code is illustrated in Figure 4.1. The code iterates over a list of records,searching for the record whose ID is equal to 100. Each record contains several fields andoccupies 64 bytes, as shown in Figure 4.2(b). The code accesses only the ID field of eachrecord, and therefore only that field is accessed by the processor. However, traditionalcaches will bring in all fields of each record as shown in Figure 4.2(c). Only the sub-blocks which store the ID field are useful, while the other sub-blocks remain unused untilthe line is evicted, resulting in considerable energy waste.
4.1.1 Cache Line Usage on the Sub-Block Level
Figure 4.2 shows how cache lines of 64 bytes are used at the sub-block granularity of8 bytes per block for the L1, L2 and LLC across multiple benchmark suites. For example,looking at the leftmost bar from Figure 4.3(a), one can see that 38% of L1 cache lines wereevicted with only one sub-block accessed (for the astar application from SPEC-CPU2006integer). The average number of sub-blocks accessed in a cache line for each applicationis presented at the top of each bar. We can therefore conclude that a significant numberof cache sub-blocks that are brought into the cache are never used, thereby wasting cacheenergy, capacity and bandwidth.
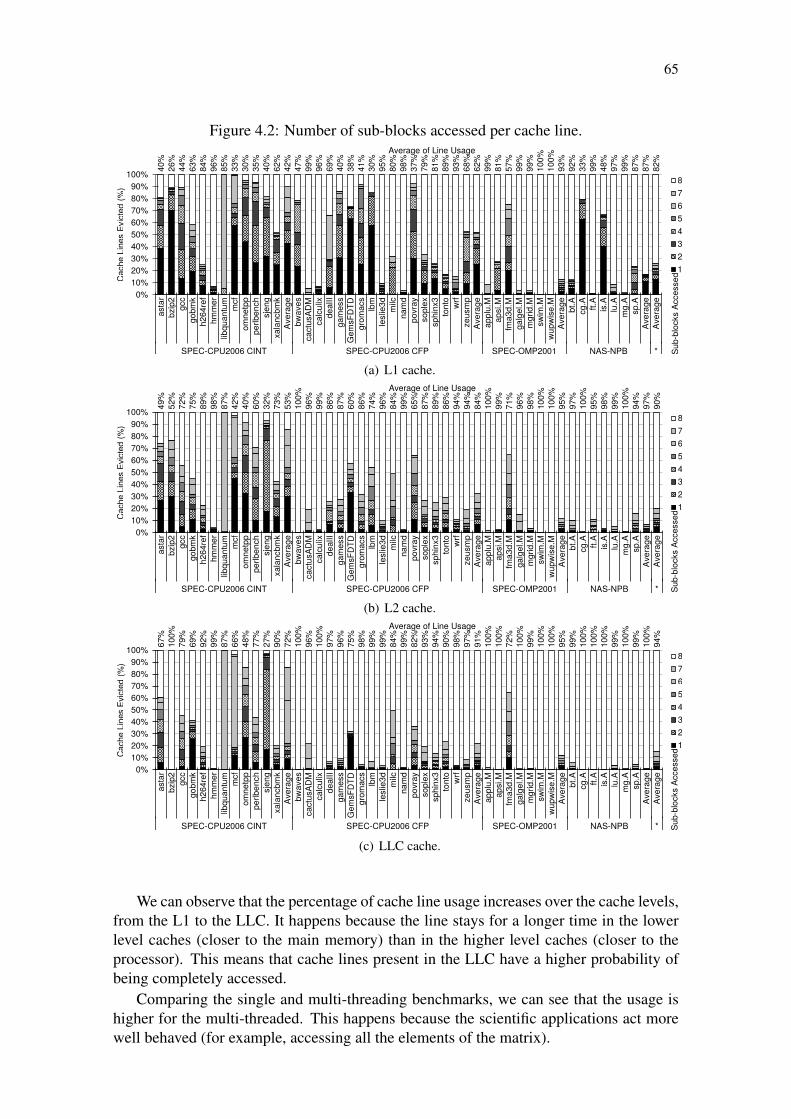
65
Figure 4.2: Number of sub-blocks accessed per cache line.
40%
26%
44%
63%
84%
96%
85%
33%
30%
35%
40%
62%
42%
47%
99%
96%
69%
40%
38%
41%
30%
95%
80%
98%
37%
79%
81%
89%
93%
68%
62%
99%
81%
57%
99%
99%
100%
100%
93%
92%
33%
99%
48%
97%
99%
87%
87%
82%
0%10%20%30%40%50%60%70%80%90%
100%
asta
rbz
ip2
gcc
gobm
kh2
64re
fhm
mer
libqu
antu
mm
cfom
netp
ppe
rlben
chsj
eng
xala
ncbm
kAv
erag
ebw
aves
cact
usAD
Mca
lcul
ixde
alII
gam
ess
Gem
sFD
TDgr
omac
slb
mle
slie
3d milc
nam
dpo
vray
sopl
exsp
hinx
3to
nto
wrf
zeus
mp
Aver
age
appl
u.M
apsi
.Mfm
a3d.
Mga
lgel
.Mm
grid
.Msw
im.M
wup
wis
e.M
Aver
age
bt.A
cg.A ft.A
is.A
lu.A
mg.
Asp
.AAv
erag
eAv
erag
e
SPEC-CPU2006 CINT SPEC-CPU2006 CFP SPEC-OMP2001 NAS-NPB *
Cac
he L
ines
Evic
ted
(%)
Average of Line Usage
87654321
Sub-
bloc
ks A
cces
sed
(a) L1 cache.
49%
52%
72%
75%
89%
98%
87%
42%
40%
60%
32%
73%
53%
100%
96%
99%
86%
87%
60%
86%
74%
96%
84%
99%
65%
87%
89%
86%
94%
94%
84%
100%
99%
71%
96%
98%
100%
100%
95%
97%
100%
95%
98%
99%
100%
94%
97%
90%
0%10%20%30%40%50%60%70%80%90%
100%
asta
rbz
ip2
gcc
gobm
kh2
64re
fhm
mer
libqu
antu
mm
cfom
netp
ppe
rlben
chsj
eng
xala
ncbm
kAv
erag
ebw
aves
cact
usAD
Mca
lcul
ixde
alII
gam
ess
Gem
sFD
TDgr
omac
slb
mle
slie
3d milc
nam
dpo
vray
sopl
exsp
hinx
3to
nto
wrf
zeus
mp
Aver
age
appl
u.M
apsi
.Mfm
a3d.
Mga
lgel
.Mm
grid
.Msw
im.M
wup
wis
e.M
Aver
age
bt.A
cg.A ft.A
is.A
lu.A
mg.
Asp
.AAv
erag
eAv
erag
e
SPEC-CPU2006 CINT SPEC-CPU2006 CFP SPEC-OMP2001 NAS-NPB *
Cac
he L
ines
Evic
ted
(%)
Average of Line Usage
87654321
Sub-
bloc
ks A
cces
sed
(b) L2 cache.
67%
100%
79%
69%
92%
99%
87%
66%
48%
77%
27%
90%
72%
100%
96%
100%
97%
96%
75%
98%
99%
99%
84%
99%
82%
93%
94%
90%
98%
97%
91%
100%
100%
72%
100%
99%
100%
100%
95%
99%
100%
100%
100%
99%
100%
99%
100%
94%
0%10%20%30%40%50%60%70%80%90%
100%
asta
rbz
ip2
gcc
gobm
kh2
64re
fhm
mer
libqu
antu
mm
cfom
netp
ppe
rlben
chsj
eng
xala
ncbm
kAv
erag
ebw
aves
cact
usAD
Mca
lcul
ixde
alII
gam
ess
Gem
sFD
TDgr
omac
slb
mle
slie
3d milc
nam
dpo
vray
sopl
exsp
hinx
3to
nto
wrf
zeus
mp
Aver
age
appl
u.M
apsi
.Mfm
a3d.
Mga
lgel
.Mm
grid
.Msw
im.M
wup
wis
e.M
Aver
age
bt.A
cg.A ft.A
is.A
lu.A
mg.
Asp
.AAv
erag
eAv
erag
e
SPEC-CPU2006 CINT SPEC-CPU2006 CFP SPEC-OMP2001 NAS-NPB *
Cac
he L
ines
Evic
ted
(%)
Average of Line Usage
87654321
Sub-
bloc
ks A
cces
sed
(c) LLC cache.
We can observe that the percentage of cache line usage increases over the cache levels,from the L1 to the LLC. It happens because the line stays for a longer time in the lowerlevel caches (closer to the main memory) than in the higher level caches (closer to theprocessor). This means that cache lines present in the LLC have a higher probability ofbeing completely accessed.
Comparing the single and multi-threading benchmarks, we can see that the usage ishigher for the multi-threaded. This happens because the scientific applications act morewell behaved (for example, accessing all the elements of the matrix).
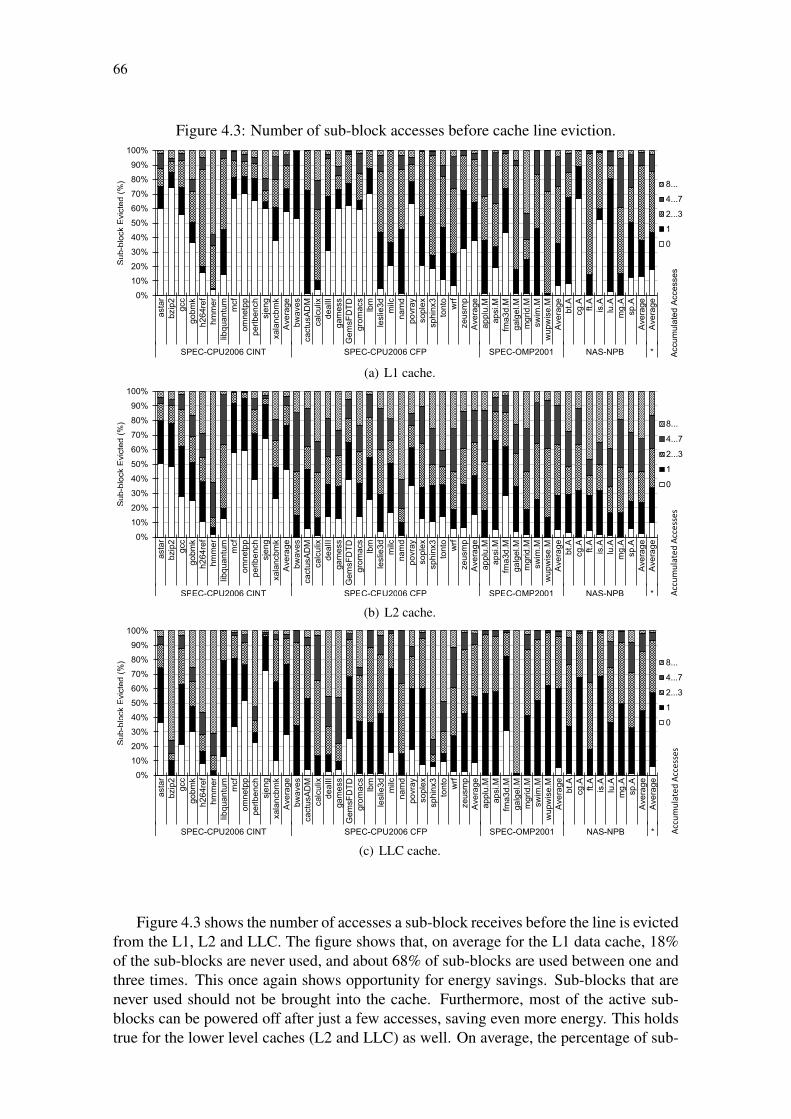
66
Figure 4.3: Number of sub-block accesses before cache line eviction.
0%
10%
20%
30%
40%
50%
60%
70%
80%
90%
100%as
tar
bzip
2gc
cgo
bmk
h264
ref
hmm
er
libq
uan
tum
mcf
omne
tpp
perlb
enc
hsj
eng
xala
ncbm
kA
vera
gebw
aves
cact
usA
DM
calc
ulix
deal
IIga
mes
sG
emsF
DT
Dgr
omac
slb
mle
slie
3dm
ilcna
md
povr
ayso
plex
sphi
nx3
tont
ow
rfze
usm
pA
vera
geap
plu.
Map
si.M
fma3
d.M
galg
el.M
mg
rid.M
swim
.Mw
upw
ise
.MA
vera
gebt
.Acg
.Aft.
Ais
.Alu
.Am
g.A
sp.A
Ave
rage
Ave
rage
SPEC-CPU2006 CINT SPEC-CPU2006 CFP SPEC-OMP2001 NAS-NPB *
Sub
-blo
ck E
vict
ed (
%) 8...
4...7
2...3
1
0
Acc
umul
ated
Acc
esse
s
(a) L1 cache.
0%
10%
20%
30%
40%
50%
60%
70%
80%
90%
100%
asta
rbz
ip2
gcc
gobm
kh2
64re
fhm
me
rlib
qua
ntu
mm
cfom
netp
ppe
rlbe
nch
sje
ngxa
lanc
bmk
Ave
rage
bwav
esca
ctus
AD
Mca
lcu
lixde
alII
gam
ess
Gem
sFD
TD
grom
acs
lbm
lesl
ie3d
milc
nam
dpo
vray
sopl
exsp
hinx
3to
nto
wrf
zeus
mp
Ave
rage
appl
u.M
apsi
.Mfm
a3d
.Mga
lgel
.Mm
grid
.Msw
im.M
wu
pwis
e.M
Ave
rage
bt.A
cg.A
ft.A
is.A
lu.A
mg
.Asp
.AA
vera
geA
vera
ge
SPEC-CPU2006 CINT SPEC-CPU2006 CFP SPEC-OMP2001 NAS-NPB *
Sub
-blo
ck E
vict
ed (
%) 8...
4...7
2...3
1
0
Accumulated Accesses
(b) L2 cache.
0%
10%
20%
30%
40%
50%
60%
70%
80%
90%
100%
asta
rbz
ip2
gcc
gobm
kh2
64re
fhm
me
rlib
qua
ntu
mm
cfom
netp
ppe
rlbe
nch
sje
ngxa
lanc
bmk
Ave
rage
bwav
esca
ctus
AD
Mca
lcu
lixde
alII
gam
ess
Gem
sFD
TD
grom
acs
lbm
lesl
ie3d
milc
nam
dpo
vray
sopl
exsp
hinx
3to
nto
wrf
zeus
mp
Ave
rage
appl
u.M
apsi
.Mfm
a3d
.Mga
lgel
.Mm
grid
.Msw
im.M
wu
pwis
e.M
Ave
rage
bt.A
cg.A
ft.A
is.A
lu.A
mg
.Asp
.AA
vera
geA
vera
ge
SPEC-CPU2006 CINT SPEC-CPU2006 CFP SPEC-OMP2001 NAS-NPB *
Sub
-blo
ck E
vict
ed (
%) 8...
4...7
2...3
1
0
Accumulated Accesses
(c) LLC cache.
Figure 4.3 shows the number of accesses a sub-block receives before the line is evictedfrom the L1, L2 and LLC. The figure shows that, on average for the L1 data cache, 18%of the sub-blocks are never used, and about 68% of sub-blocks are used between one andthree times. This once again shows opportunity for energy savings. Sub-blocks that arenever used should not be brought into the cache. Furthermore, most of the active sub-blocks can be powered off after just a few accesses, saving even more energy. This holdstrue for the lower level caches (L2 and LLC) as well. On average, the percentage of sub-

67
blocks that receive less than 4 accesses before their eviction on the L1, L2 and LLC is85%, 61% and 93% respectively.
Although the LLC cache holds the cache lines for a longer period of time, the L1cache filters most of the processor requests. For this reason, the number of accessesper sub-block on the L1 tends to be higher than on lower level caches. Similar to thenumber of sub-blocks used per line, the single-threaded benchmarks have a lower numberof accesses per sub-block than the multi-threaded benchmarks.
4.1.2 Potential for Energy Savings in L1 Cache
Figure 4.4: Potential for L1 cache energy savings for two oracle predictors.
0%10%20%30%40%50%60%70%80%90%
100%
asta
rbz
ip2
gcc
gobm
kh2
64re
fhm
mer
libqu
antu
mm
cfom
netp
ppe
rlben
chsj
eng
xala
ncbm
kG
eoM
ean
bwav
esca
ctus
ADM
calc
ulix
deal
IIga
mes
sG
emsF
DTD
grom
acs
lbm
lesl
ie3d milc
nam
dpo
vray
sopl
exsp
hinx
3to
nto
wrf
zeus
mp
Geo
Mea
nap
plu.
Map
si.M
fma3
d.M
galg
el.M
mgr
id.M
swim
.Mw
upw
ise.
MG
eoM
ean
bt.A
cg.A ft.A
is.A
lu.A
mg.
Asp
.AG
eoM
ean
Geo
Mea
n
SPEC-CPU2006 CINT SPEC-CPU2006 CFP SPEC-OMP2001 NAS-NPB *
L1 E
nerg
y C
onsu
mpt
ion
L1 Oracle Line Usage L1 Oracle Sub-block Usage
Figure 4.4 shows the potential for L1 static and dynamic energy savings by presentingresults for two oracles implemented on the L1 cache: 1) An oracle dead line predictorthat saves static power by turning off cache lines as soon as they receive their last access.2) An oracle dead sub-block predictor that saves both static and dynamic power by neverbringing and never turning on unused sub-blocks in the cache and in addition powers offactive sub-blocks as soon as they are last accessed.
The results are normalized to a baseline without any dead line predictor. Note thatthese oracles operate without the use of any additional prediction structures (for example,they consume no additional energy and can only save energy) and therefore truly representideal scenarios.
The oracle dead line predictor reduces L1 cache energy (17% on average) by turningoff dead lines as soon as possible. However, its effectiveness is limited by the fact thatit operates only at the cache line level. The oracle dead sub-block predictor, which doesnot bring unused sub-blocks into the cache and in addition turns off active sub-blocksonce they are dead, reduces cache energy by 51% on average. For most benchmarks, theenergy savings correlate with the cache line usage. These results show that significantenergy reduction can be achieved by operating at the sub-block level.
4.2 The Dead Sub-Block Predictor (DSBP)
This chapter proposes the Dead Sub-Block Predictor (DSBP) for detecting when agiven cache line sub-block is dead (that is, it will not be accessed again). We use recenthistory information stored in a pattern history table to predict usage patterns. Traditionalgated VDD circuit techniques (POWELL et al., 2000) are used to power off sub-blocksonce they are predicted to be dead to save energy.

68
Figure 4.5: DSBP: Mechanism architecture including cache metadata and PHT.
Data Sub-Blocks
…
StatusTag
……
Usage Counters
…
Overflow
…
PHT Pointer
…
Usage Counters
…
Overflow
…Pattern History Table
PC Offset
………
…
Sectored Data Cache Cache Metadata
Train
Pointer
Figure 4.5 shows a traditional sector cache architecture (IBM, 1974), and the addi-tional cache metadata and PHT required by our mechanism. The sector cache containingtag and data arrays in the left part of the figure shows how cache lines are divided intosub-blocks. The cache metadata contains information to guide our predictor. Each cachemetadata line includes the following fields:
• A train flag to indicate if accesses on that specific cache line should update thepattern in the PHT.
• Sub-block usage counters to store the number of accesses the sub-block is predictedto receive before it becomes dead,
• A set of overflow bits to indicate if the predicted number of sub-block accessesexceeds the maximum value the usage counters can hold. If set, the sub-block willremain powered on until the line is evicted.
• A PHT Pointer linking a cache line to its respective entry in the PHT.
The PHT is used to store previous sub-block usage patterns. It is indexed by the PCof the load/store instruction that caused the cache miss and the requested cache line offset(byte within the line) of the miss address. The key observation behind using the PC alongwith the line offset as the index is that a given sequence of memory instructions oftenaccesses the same fields of a record (see the example in Figure 4.1). Although differentinstances of a record may have different offsets within the cache line, the number ofdifferent offsets of an instance is bounded (CHEN et al., 2004; KUMAR; WILKERSON,1998; PUJARA; AGGARWAL, 2008). Therefore, the PC+offset combination provides ahigh coverage of patterns even with moderately sized Pattern History Tables.
Each entry in the PHT includes: 1) a Pointer flag indicating that some cache line hasa pointer to that specific PHT entry, 2) a set of usage counters and 3) Overflow bits. Theusage counters and overflow bits are identical to those in the cache metadata and will becopied from the PHT to the metadata as our mechanism operates.
The main operations performed by the mechanism during cache accesses are:

69
Cache Line Miss: The PHT is searched for an entry matching the PC and offset of theinstruction that caused the miss. For a PHT hit, the mechanism will copy the PHT’s usagecounter and overflow bits into the cache metadata and only the sub-blocks predicted to beused are fetched and stored into the cache line. The pattern in the PHT is kept intact. Ifthe PHT entry indicates that no other pointer exists to that entry (pointer flag field zero),the new cache line is linked to the PHT pattern. In the case of a PHT miss, the train flagis set, and all usage counter and overflow bits are reset in the cache metadata. The PHTwill reset all the usage counter and overflow bits and evict the LRU entry to make roomfor a new pattern. A PHT pointer is created to link the cache metadata and the new entry.Since the train flag is set, subsequent accesses to this line will update the usage countersin the PHT.
Cache Line Hit and Sub-Block Hit: If the train flag is disabled, the sub-block usagecounter in the metadata is decremented and the sub-block is turned off if its usage counterand overflow bit are zero. The PHT will be updated only when the train flag is enabled. Incase our mechanism predicts a dead sub-block in a dirty cache line, the sub-blocks remainpowered on until all the sub-blocks inside that line are predicted to be dead. Afterwards, awrite-back operation will be issue for this cache line, and all the sub-blocks will be turnedoff.
Cache Line Hit and Sub-Block Miss:1 The requested sub-block will be brought into thecache line and its overflow bit will be set. If the cache metadata has a valid pointer toa PHT entry, then the mechanism will increment the corresponding usage counter in thePHT entry.
Cache Line Eviction: If the cache line contains a valid link to a PHT entry, the flag thatindicates that a valid pointer exists must be disabled in the PHT. Also, if any of the usagecounters in the metadata are non-zero (indicating that the corresponding sub-block wasaccessed fewer than the predicted number of times), the corresponding usage counters inthe PHT entry are updated by decrementing each counter by the non-zero value. For thisreason, we avoid using saturated counters.
Cache Line Invalidation: All the prediction information is kept intact. However, all thesub-blocks inside the cache line are turned off until the line receives valid data.
4.2.1 Usage Example
Figure 4.6 illustrates how DSBP learns and predicts access patterns based on previoususage. In the piece of code present in Figure 4.6(a), the program is iterating over a listof records of 64 bytes each, but is accessing only a single field of the record (similar tothe example shown in Figure 4.1). Therefore, just the sub-block starting from the offsetvalue 16 is being loaded into a register. For this example, the cache and PHT are initiallyempty.
Figure 4.6(b) presents the state of the cache, metadata, and PHT after the first iterationof the loop. Since there was no matching entry in the PHT, a new PHT entry is allocated,all the usage counters and overflow bits are reset, and since no other pointer exists tothat PHT entry, a new pointer will be stored in the cache metadata and the pointer flagin the PHT entry is set. Because no previous pattern was available for the prediction(that is, PHT miss), all sub-blocks are brought into the cache line. The train flag is also
1The term “sub-block miss” applies to the situation where the cache line is present in the cache (that is,a matching tag is found), but the requested sub-block is not. This is in contrast to a “cache line miss” whereno matching tag is found (that is, the entire line is not in the cache)

70
Figure 4.6: DSBP: Working example.LOOP: PC=A: ld [%r1], %r5
PC=B: add %r1, 64, %r1PC=C: cmp %r5, %r6PC=D: jz LOOP
Itera
tion
0
12
PC
8250
Memory Address
000 16Iteration 0:
Tag Index Offset
12 8250 001 16Iteration 1:Itera
tions
(a)
(b)
Data Sub-BlocksD D D D D D D D
…
StatusTag
…
8250
…
Usage Counters0
…
0 0 0 0 0 0 0Overflow
0
…
0 00 0 0 0 0PHT Pointer
12 / 16
…
Usage Counters
0 …0 1 0 0 0 0 0
Overflow
0 …0 00 0 0 0 0
Pattern History Table
112 16
PC Offset………
Sectored Data Cache Cache Metadata
Pointer
Itera
tion
1
(c)
Data Sub-BlocksD D D D D D D D- - D - - - - -…
StatusTag
…
82508250…
Usage Counters00 …
00
01
00
00
00
00
00
Overflow00 …
00
00
00
00
00
00
00
PHT Pointer12 / 16
-…Usage Counters
0 …0 1 0 0 0 0 0
Overflow
0 …0 00 0 0 0 0
Pattern History Table
112 16
PC Offset
………
Sectored Data Cache Cache Metadata
Pointer
1
…
Train
1-…
Train
set in order to capture all the subsequent access to that line and learn the usage pattern.Assuming that a single access was made to the 3rd sub-block, the corresponding usagecounter in the PHT entry is incremented to one.
Figure 4.6(c) shows a cache miss on the second iteration. This time, the predictoraccesses the PHT and finds a matching entry. The usage bits indicate that only the 3rdsub-block will be used, and therefore only a single sub-block will be brought into thecache. Since the PHT pointer flag is already set, no new pointer will be generated. Afterthe mechanism copies the usage counters and overflow bits to the metadata, the data canbe used. Once the sub-block is used, the usage counter will be decremented to zero andthe sub-block will be turned off. Subsequent loop iterations would operate in exactly thesame way.
4.2.2 Improving the Cache Replacement Policy
We also use our mechanism to improve the traditional LRU cache replacement policyby prioritizing lines with all sub-blocks powered off for eviction. If a line has all sub-blocks powered off, that means our predictor has identified this line as dead (that is, itwill not be accessed again). Evicting dead lines early, before they actually become avictim (being at the LRU position), can reduce the cache miss ratio by letting the not-dead lines stay longer in the cache. This also offsets the additional sub-block misses ourpredictor may cause when it underpredicts the usage pattern of a cache line.
4.2.3 Prefetching Adaptations
In order to obtain correct predictions with our mechanism, it is essential to have theinstruction address (PC) that caused the cache miss, together with the offset requested onthis cache miss. For the processor requests, this correlation information is easily obtained.However, in a presence of a prefetcher, this information may not be available for the cachemisses caused when prefetching data. Different approaches can be planned to include theinformation required to the predictor inside the prefetcher structure.

71
The stride prefetch (BAER; CHEN, 1991) already stores the instruction address fromthe memory request which started a new prefetch pattern. We adapted this mechanism toalso store the first memory address for each pattern. Thus, all the prefetched lines includethe instruction address and an offset used to index the PHT inside our mechanism, inorder to generate predictions. For the stream prefetch (JOUPPI, 1990), we included theinstruction address and the offset which started a new stream. This enables the prefetchto send this extra information together to the prefetched lines in order to generate usageinformation for these lines.
4.2.4 Implementation on Multiple Cache Levels
Our mechanism operates at the sub-block level and therefore implementing our pre-dictor on first level caches is straightforward since requests from the processor are alsomade at the sub-block level. However, next level caches receive requests from the pre-vious level at a cache line granularity. Therefore, in order to implement our mechanismon systems with multi-level cache hierarchies, miss requests must be forwarded from onelevel to the next on a sub-block granularity. This also implies that our mechanism can beapplied to a cache level only if applied to all previous levels. For example, in a 3-levelcache hierarchy, we could apply our mechanism to just the L1, both the L1 and L2 but notthe LLC, or all three levels.
4.3 Methodology
The baseline configuration for the processor is based on the Intel Sandy Bridge asshown in Table 3.6. The single-threaded applications from SPEC-CPU2006 and multi-threaded (8 threads) applications from SPEC-OMP2001 and NAS-NPB suites were usedas workloads to evaluate DSBP. All the results are normalized to a baseline system with-out any predictor.
In order to improve the energy consumption at a finer granularity than current cachememories, we turn off sub-blocks from the cache line using gated VDD circuit techniquesas in (POWELL et al., 2000). Gated VDD techniques use a transistor to gate the supplyvoltage (VDD) of the cache SRAM cells. Previous work reports that the transition delay ofturning on a gated-ground transistor shared by a 16 byte sub-block is only 0.20 ns (that is,one clock cycle in a 5 GHz microprocessor) (CHEN et al., 2004). Therefore, we assumeour 8-byte sub-blocks can be powered on in a single cycle. Furthermore, this single-cyclelatency can be hidden during a cache miss, since a sub-block can be powered on while thedata being requested are fetched from the next level in the cache hierarchy.
In order to model the dynamic and static energy savings due to dead sub-block pre-diction, we model both the baseline cache architecture and our proposed mechanism withCACTI 6.5++ (MURALIMANOHAR; BALASUBRAMONIAN; JOUPPI, 2008) whichis available inside McPAT version 1.0 (LI et al., 2009, 2013). To take into account a sectorcache memory, we model a cache with 8 sectors (that is, sub-blocks) and the additionalbits required to control the sub-blocks. Since our proposed mechanism requires extrametadata, the cache lines were also modeled with the extra bits necessary to support theusage counters, the overflow bits, the learn flag and the PHT pointer. After modeling the8 sub-blocked cache with all the metadata, the CACTI power model was used to computethe dynamic energy and static when all sub-blocks are enabled. We also modeled the PHTtable as a cache memory of the same size.

72
To compute the energy when just a part of the cache line is turned on, we modeledcache architectures with the same number of lines but fewer 8-byte sub-blocks (from 1 to7 sub-blocks). The energy consumed by these smaller cache lines is used to model theenergy consumption when just a few sub-blocks in the cache line are enabled.
Gated VDD techniques require a 3% area overhead on the data array (POWELL et al.,2000). In order to model this overhead, two extra bytes (3.1% of line size) were added tothe cache line in our mechanism’s cache tag as the VDD technique overhead.
4.4 Evaluation
The DSBP evaluated in this chapter uses 2-bit usage counters per sub-block and a512-entry PHT organized as an 8-way set associative cache. To maintain the metadatainformation, 34 bits per cache line were added, which represents an overhead of 6.25% ofthe total cache size, assuming a tag size of 32 bits.
For the PHT, using only 16 bits to store the least significant part of the PC demon-strated to be enough to obtain accurate results. Moreover, since most of the accesses arealigned inside the cache line in sub-blocks of 8 bytes, only 3 bits are necessary to store thesub-block accessed inside the cache line (instead of using the full offset). The total sizeof the PHT used in our experiments is 2.75 KB per cache bank, which represents 8.60 %of the L1, 1.10% of the L2 and less than 0.30% of the total LLC size.
In order to evaluate our proposed mechanism, we compare it with the SKEWEDmechanism, explained in Section 2.2.6. We implemented SKEWED using three tableswith 8192 entries each, with a 2 bit counter per entry to perform the prediction. Eachtable is indexed using a different hash function, in order to obtain three different sub-predictions, which are combined to form the final prediction.
4.4.1 Mechanism Accuracy
Figure 4.7 presents the accuracy results for our mechanism applied on L1, L2 andLLC. The figure is divided into correct prediction, correct overflow, over prediction, underprediction, and train. Each percentage corresponds to the fraction of evicted sub-blocksthat fall into the corresponding category. A correct prediction occurs if a sub-block isevicted with its usage counter and overflow bit (in the metadata) equal to zero. This meansthat the sub-block was accessed exactly as many times as we predicted. Correct overflowoccurs when a sub-block is evicted with its usage counter at zero but the overflow bit is set.Over prediction happens when a sub-block is evicted with its usage counter greater thanzero. This implies that the sub-block was accessed fewer times than what we predicted.Under prediction occurs when a request is made to a sub-block that is powered off (thatis, a sub-block miss). We keep track of such sub-blocks, and upon eviction, count them asan under predicted. Train means that no information about cache line usage was availablein the PHT (that is, PHT miss). In this case, all 8 sub-blocks within the line are classifiedunder this category. To generate complete statistics, we force an eviction of all the cachelines at the end of the execution.
These results show that our mechanism achieves a good coverage of 61% correctpredictions on average. Note that the percentage of sub-blocks that are classified as correctoverflow reduces for the LLC to the L1. This is because the L1 receives the most sub-block accesses and serves as a filter for the next level caches. Therefore, it is unlikely forsub-blocks in the LLC to receive enough accesses during training to have their overflowbits ever set. The opposite is true for over predictions. Recall that our mechanism corrects

73
Figure 4.7: DSBP: Mechanism accuracy results.
0%10%20%30%40%50%60%70%80%90%
100%as
tar
bzip
2gc
cgo
bmk
h264
ref
hmm
erlib
quan
tum
mcf
omne
tpp
perlb
ench
sjen
gxa
lanc
bmk
Aver
age
bwav
esca
ctus
ADM
calc
ulix
deal
IIga
mes
sG
emsF
DTD
grom
acs
lbm
lesl
ie3d milc
nam
dpo
vray
sopl
exsp
hinx
3to
nto
wrf
zeus
mp
Aver
age
appl
u.M
apsi
.Mfm
a3d.
Mga
lgel
.Mm
grid
.Msw
im.M
wup
wis
e.M
Aver
age
bt.A
cg.A ft.A
is.A
lu.A
mg.
Asp
.AAv
erag
eAv
erag
e
SPEC-CPU2006 CINT SPEC-CPU2006 CFP SPEC-OMP2001 NAS-NPB *
Evic
ted
Sub-
bloc
ks
Train Over Prediction Correct Overflow Correct Prediction Under prediction
(a) L1 cache.
0%10%20%30%40%50%60%70%80%90%
100%
asta
rbz
ip2
gcc
gobm
kh2
64re
fhm
mer
libqu
antu
mm
cfom
netp
ppe
rlben
chsj
eng
xala
ncbm
kAv
erag
ebw
aves
cact
usAD
Mca
lcul
ixde
alII
gam
ess
Gem
sFD
TDgr
omac
slb
mle
slie
3d milc
nam
dpo
vray
sopl
exsp
hinx
3to
nto
wrf
zeus
mp
Aver
age
appl
u.M
apsi
.Mfm
a3d.
Mga
lgel
.Mm
grid
.Msw
im.M
wup
wis
e.M
Aver
age
bt.A
cg.A ft.A
is.A
lu.A
mg.
Asp
.AAv
erag
eAv
erag
e
SPEC-CPU2006 CINT SPEC-CPU2006 CFP SPEC-OMP2001 NAS-NPB *
Evic
ted
Sub-
bloc
ks
Train Over Prediction Correct Overflow Correct Prediction Under prediction
(b) L2 cache.
0%10%20%30%40%50%60%70%80%90%
100%
asta
rbz
ip2
gcc
gobm
kh2
64re
fhm
mer
libqu
antu
mm
cfom
netp
ppe
rlben
chsj
eng
xala
ncbm
kAv
erag
ebw
aves
cact
usAD
Mca
lcul
ixde
alII
gam
ess
Gem
sFD
TDgr
omac
slb
mle
slie
3d milc
nam
dpo
vray
sopl
exsp
hinx
3to
nto
wrf
zeus
mp
Aver
age
appl
u.M
apsi
.Mfm
a3d.
Mga
lgel
.Mm
grid
.Msw
im.M
wup
wise
.MAv
erag
ebt
.Acg
.A ft.A
is.A
lu.A
mg.
Asp
.AAv
erag
eAv
erag
e
SPEC-CPU2006 CINT SPEC-CPU2006 CFP SPEC-OMP2001 NAS-NPB *
Evic
ted
Sub-
bloc
ks
Train Over Prediction Correct Overflow Correct Prediction Under prediction
(c) LLC cache.
over prediction by updating the PHT only when the line containing the over predicted sub-block(s) is evicted. Since evictions are much less frequent for the L2 and LLC than the L1,it takes longer for the L2 and LLC to adapt to a new usage pattern, resulting in a greaterpercentage of over predictions. The under predictions account for 10% of the sub-blocksevicted on average, this avoids high performance degradation due to sub-block misses.
4.4.2 Energy Savings
Figure 4.8 presents total energy consumption for each predictor. The results are shownapplying each mechanism in all the cache levels. DSBP achieves energy savings of 36%on average considering all the cache levels, it outperforms the previous proposal in terms

74
Figure 4.8: DSBP: Total energy consumption of the cache sub-system.
0%10%20%30%40%50%60%70%80%90%
100%110%
asta
rbz
ip2
gcc
gobm
kh2
64re
fhm
me
rlib
qua
ntu
mm
cfom
netp
ppe
rlbe
nch
sje
ngxa
lanc
bmk
Geo
Mea
nbw
aves
cact
usA
DM
calc
ulix
deal
IIga
mes
sG
emsF
DT
Dgr
omac
slb
mle
slie
3dm
ilcna
md
povr
ayso
plex
sphi
nx3
tont
ow
rfze
usm
pG
eoM
ean
appl
u.M
apsi
.Mfm
a3d
.Mga
lgel
.Mm
grid
.Msw
im.M
wu
pwis
e.M
Geo
Mea
nbt
.Acg
.Aft.
Ais
.Alu
.Am
g.A
sp.A
Geo
Mea
nG
eoM
ean
SPEC-CPU2006 CINT SPEC-CPU2006 CFP SPEC-OMP2001 NAS-NPB *
Ene
rgy
Con
sum
ptio
n
DSBP-L1-L2-LLC SKEWED-L1-L2-LLC
of energy savings. It improves by 12% even the best result obtained with SKEWED.DSBP has higher gains because 1) it powers off data stored in the cache at the sub-blocklevel, and 2) it does so with relatively few updates to the PHT.
Table 4.1 presents the results for the DSBP and SKEWED mechanisms when the pre-dictors are applied to each cache level in isolation (if applicable), and also when appliedto multiple levels, also comparing with the oracle mechanisms applied on the L1 cache.Notice that the table shows the energy consumption considering the overall cache system.
It is possible to see that both mechanisms obtain the best results when applied in allthe cache levels. Comparing DSBP L1 to the oracle dead sub-block predictor L1, we canobserve that our mechanism could achieve 84% of the energy savings achievable with aperfect mechanism. Comparing SKEWED with the oracle dead line predictor L1, we seethat this related work outperformed its oracle, this is because SKEWED improved the re-placement policy and performs early write-back, what changes the operations performedinside the cache, leading to a different critical path of the application execution.
4.4.3 Performance Impact
As shown in the previous section, successfully predicting dead sub-blocks can signif-icantly reduce cache energy consumption. However, incorrect predictions may introducea negative impact on cache performance and actually increase energy consumption due toextra cache sub-block misses. Figure 4.9 shows the total number of extra cache missesnormalized to the number of cache misses from the baseline cache architecture.
The result bars shown in Figure 4.9 present the percentage of extra sub-block missescaused by under predictions. Cache line misses are accesses where no matching tag entrywas found in the cache (that is, the entire line is not present in the cache). Sub-blockmisses occur when the requested tag is present in the cache, but the requested sub-blockis not available. Note that these sub-block misses only happened because the mechanismincorrectly identified a sub-block as dead and powered it off prematurely.
Figure 4.9 shows that DSBP increased on average the number of cache line misses dueto sub-block misses by 10%, 19% and 12% for the L1, L2 and LLC respectively. However,a part of these extra cache misses are offset by the improved cache line replacement policy,preserving the level of performance that the baseline provides while significantly reducingcache energy.
Figure 4.10 shows a comparison of normalized execution time for the simulated mech-anisms. The execution time correlates well with the number of misses in the last level

75
Table 4.1: DSBP: Total energy consumption of the cache sub-system.
L1 L1-L
2
L1-L
2-LL
C
L1 L2 LLC
L1-L
2
L1-L
2-LL
C
L1 L
ine
Usa
geL1
Sub
-B
lock
Usa
ge
astar 76% 68% 63% 85% 93% 93% 78% 70% 86% 58%bzip2 80% 73% 56% 85% 94% 84% 79% 62% 86% 63%gcc 76% 68% 59% 84% 93% 90% 77% 68% 85% 65%gobmk 80% 72% 52% 85% 93% 80% 78% 58% 86% 66%h264ref 81% 76% 63% 90% 95% 88% 85% 73% 90% 71%hmmer 88% 83% 73% 92% 96% 89% 88% 77% 92% 79%libquantum 59% 50% 43% 76% 90% 76% 67% 47% 82% 56%mcf 61% 51% 39% 80% 91% 86% 71% 61% 81% 58%omnetpp 71% 63% 63% 87% 93% 99% 80% 78% 86% 58%perlbench 79% 73% 57% 88% 94% 85% 82% 66% 88% 57%sjeng 79% 71% 52% 85% 93% 80% 78% 58% 87% 67%xalancbmk 76% 71% 62% 89% 95% 88% 83% 76% 89% 66%GeoMean 75% 68% 56% 85% 93% 86% 79% 65% 86% 63%bwaves 78% 72% 60% 89% 95% 86% 84% 75% 90% 72%cactusADM 82% 77% 70% 89% 95% 93% 84% 79% 90% 79%calculix 80% 72% 58% 84% 93% 82% 76% 58% 86% 74%dealII 77% 72% 55% 88% 95% 84% 82% 66% 89% 68%gamess 79% 74% 59% 90% 95% 85% 85% 70% 90% 65%GemsFDTD 72% 66% 63% 87% 95% 89% 82% 75% 89% 61%gromacs 82% 76% 59% 87% 94% 85% 81% 66% 88% 71%lbm 61% 56% 51% 88% 98% 96% 84% 82% 89% 60%leslie3d 79% 74% 71% 88% 96% 96% 83% 80% 90% 73%milc 72% 65% 53% 87% 94% 84% 81% 68% 89% 65%namd 86% 81% 66% 90% 95% 85% 84% 70% 91% 61%povray 77% 71% 52% 88% 94% 83% 82% 65% 88% 60%soplex 73% 66% 60% 85% 95% 87% 80% 75% 87% 53%sphinx3 75% 70% 61% 88% 95% 92% 83% 75% 89% 63%tonto 84% 79% 64% 89% 95% 85% 84% 70% 90% 76%wrf 81% 75% 70% 88% 95% 94% 83% 77% 89% 70%zeusmp 79% 73% 65% 86% 94% 92% 80% 77% 88% 69%GeoMean 77% 71% 61% 88% 95% 88% 82% 72% 89% 67%applu.M 78% 76% 70% 92% 98% 90% 88% 81% 95% 65%apsi.M 88% 88% 86% 101% 99% 100% 100% 98% 100% 77%fma3d.M 58% 56% 49% 90% 98% 85% 88% 77% 93% 52%galgel.M 93% 92% 87% 99% 99% 95% 98% 93% 97% 85%mgrid.M 90% 90% 89% 99% 100% 101% 99% 99% 99% 76%swim.M 75% 75% 71% 94% 99% 98% 94% 93% 97% 66%wupwise.M 80% 78% 72% 95% 97% 88% 93% 87% 96% 73%GeoMean 80% 78% 74% 96% 99% 94% 94% 89% 97% 70%bt.A 91% 91% 90% 100% 100% 99% 100% 100% 99% 79%cg.A 62% 63% 61% 98% 100% 95% 98% 97% 96% 43%ft.A 93% 92% 92% 92% 100% 99% 92% 90% 99% 80%is.A 81% 83% 85% 101% 100% 97% 101% 102% 99% 57%lu.A 79% 79% 79% 100% 99% 99% 99% 99% 98% 63%mg.A 87% 87% 86% 100% 100% 102% 100% 100% 99% 78%sp.A 79% 79% 79% 99% 100% 99% 99% 99% 99% 63%GeoMean 81% 82% 81% 99% 100% 99% 98% 98% 98% 65%
* GeoMean 78% 73% 64% 90% 96% 90% 86% 76% 91% 66%
DSBP SKEWED ORACLE
SPEC
OM
P200
1N
AS-N
PBSP
EC-C
PU20
06 -
CIN
TSP
EC-C
PU20
06 -
CFP
cache since these misses are the most costly in terms of latency. Sub-block extra missesintroduced by the L1 and L2 predictors can be serviced by the last level cache with aminimal impact on execution time.
As mentioned before, DSBP has a negligible impact on system performance (equal to2.25% on average). This is because the additional sub-block misses DSBP may cause arelargely offset by the improved replacement policy DSBP offers. Our mechanism impactedthe performance less than the evaluated related work.
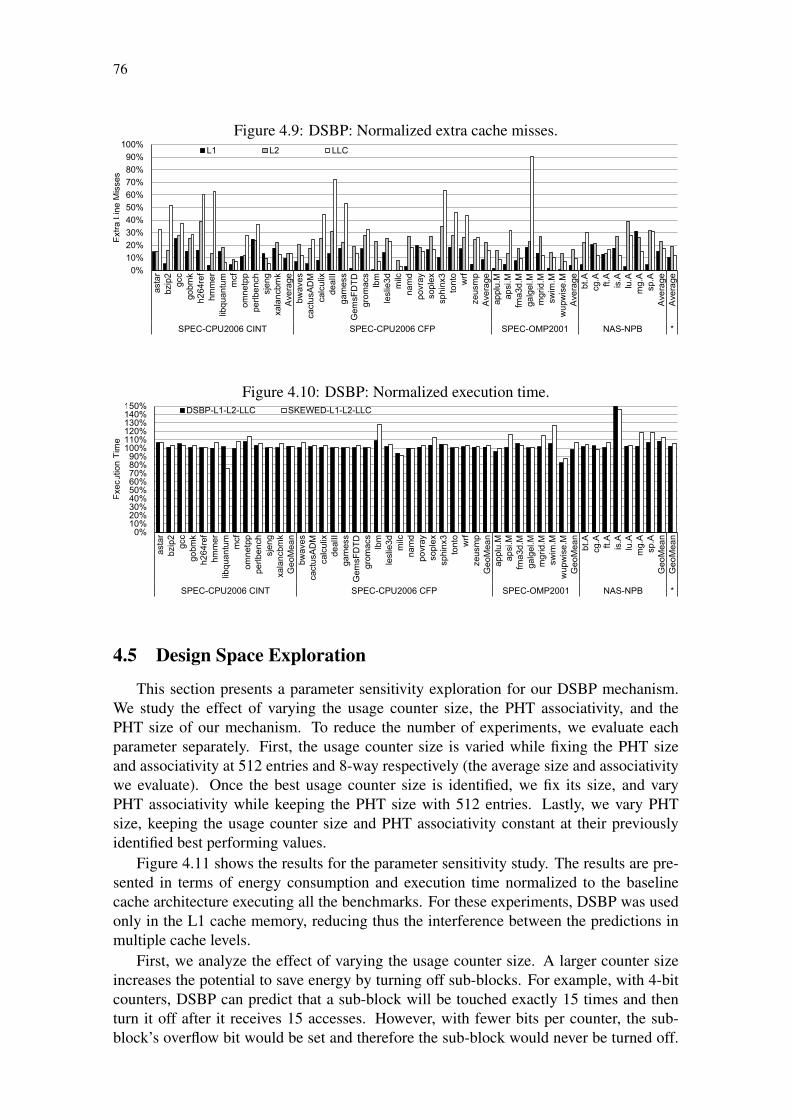
76
Figure 4.9: DSBP: Normalized extra cache misses.
0%
10%
20%
30%
40%
50%
60%
70%
80%
90%
100%as
tar
bzip
2gc
cgo
bmk
h264
ref
hmm
er
libq
uan
tum
mcf
omne
tpp
perlb
enc
hsj
eng
xala
ncbm
kA
vera
gebw
aves
cact
usA
DM
calc
ulix
deal
IIga
mes
sG
emsF
DT
Dgr
omac
slb
mle
slie
3dm
ilcna
md
povr
ayso
plex
sphi
nx3
tont
ow
rfze
usm
pA
vera
geap
plu.
Map
si.M
fma3
d.M
galg
el.M
mg
rid.M
swim
.Mw
upw
ise
.MA
vera
gebt
.Acg
.A ft.A
is.A
lu.A
mg
.Asp
.AA
vera
geA
vera
ge
SPEC-CPU2006 CINT SPEC-CPU2006 CFP SPEC-OMP2001 NAS-NPB *
Ext
ra L
ine
Mis
ses
L1 L2 LLC
Figure 4.10: DSBP: Normalized execution time.
0%10%20%30%40%50%60%70%80%90%
100%110%120%130%140%150%
asta
rbz
ip2
gcc
gobm
kh2
64re
fhm
me
rlib
qua
ntu
mm
cfom
netp
ppe
rlbe
nch
sje
ngxa
lanc
bmk
Geo
Mea
nbw
aves
cact
usA
DM
calc
ulix
deal
IIga
mes
sG
emsF
DT
Dgr
omac
slb
mle
slie
3dm
ilcna
md
povr
ayso
plex
sphi
nx3
tont
ow
rfze
usm
pG
eoM
ean
appl
u.M
apsi
.Mfm
a3d
.Mga
lgel
.Mm
grid
.Msw
im.M
wu
pwis
e.M
Geo
Mea
nbt
.Acg
.A ft.A
is.A
lu.A
mg
.Asp
.AG
eoM
ean
Geo
Mea
n
SPEC-CPU2006 CINT SPEC-CPU2006 CFP SPEC-OMP2001 NAS-NPB *
Exe
cutio
n T
ime
DSBP-L1-L2-LLC SKEWED-L1-L2-LLC
4.5 Design Space Exploration
This section presents a parameter sensitivity exploration for our DSBP mechanism.We study the effect of varying the usage counter size, the PHT associativity, and thePHT size of our mechanism. To reduce the number of experiments, we evaluate eachparameter separately. First, the usage counter size is varied while fixing the PHT sizeand associativity at 512 entries and 8-way respectively (the average size and associativitywe evaluate). Once the best usage counter size is identified, we fix its size, and varyPHT associativity while keeping the PHT size with 512 entries. Lastly, we vary PHTsize, keeping the usage counter size and PHT associativity constant at their previouslyidentified best performing values.
Figure 4.11 shows the results for the parameter sensitivity study. The results are pre-sented in terms of energy consumption and execution time normalized to the baselinecache architecture executing all the benchmarks. For these experiments, DSBP was usedonly in the L1 cache memory, reducing thus the interference between the predictions inmultiple cache levels.
First, we analyze the effect of varying the usage counter size. A larger counter sizeincreases the potential to save energy by turning off sub-blocks. For example, with 4-bitcounters, DSBP can predict that a sub-block will be touched exactly 15 times and thenturn it off after it receives 15 accesses. However, with fewer bits per counter, the sub-block’s overflow bit would be set and therefore the sub-block would never be turned off.

77
Figure 4.11: DSBP: PHT design space exploration.10
0.30
%
100.
32%
100.
34%
100.
32%
100.
33%
100.
20%
100.
22%
100.
34%
100.
18%
100.
14%
100.
20%
100.
22%
100.
34%
100.
18%
100.
14%
79.8
1%
78.7
0%
77.6
3%
77.2
9%
77.6
9%
79.8
1%
78.7
0%
77.6
3%
77.2
9%
77.6
9%
79.4
4%
78.5
1%
77.6
3%
77.1
5%
76.9
2%
0%10%20%30%40%50%60%70%80%90%
100%110%
1bit
2bits
3bits
4bits
5bits
2ways
4ways
8ways
16ways
32ways
128entries
256entries
512entries
1024entries
2048entries
Usage Counter Size PHT Associativity PHT Size
Execution Time Energy Consumption
On the other hand, increasing the usage counter size increases the energy overhead of thecache metadata. From the cache miss perspective, with smaller counters, the overflow bitis more likely to be set. As such, DSBP’s replacement policy will not be able to identifylines as dead and therefore will not be as effective in reducing line misses compared tolarger counter sizes. For the same reason, the number of sub-block misses increases asusage counter size increases. Overall, the total number of misses does not vary much.The results show that using 2 bits per usage counter balances these trade-offs well andachieves the best results in terms of energy reduction and performance.
Next, we evaluate the associativity of the PHT. A large number of ways reduces theconflicts inside the table. However, it also increases PHT energy consumption. Our resultsshow the best results are obtained using an 8-way set-associative PHT.
Finally, we analyze the effect of varying the number of entries in the PHT. Increasingthe number of entries in the PHT allows it to store more usage patterns and therefore fewerpatterns will have to be re-learned. This again provides more opportunities to save energyby turning off dead sub-blocks. However, a larger PHT also consumes more energy eachtime it is accessed. We find a PHT size of 512 entries is best in terms of energy reductionand performance.
In summary, the sensitivity studies shows that DSBP does not require large PHTs ora large number of bits in the usage counter to provide benefits. Moderately sized PatternHistory Tables provide good results since PC and offset are used to index the table asexplained in Section 4.2. Furthermore, as shown in Section 4.1, less than 10% of thesub-blocks receive more than 3 accesses before their eviction, which justifies our resultthat 2-bit usage counters work best in terms of energy savings and performance.
4.6 Summary
To our knowledge, DSBP is the first proposal to exploit dead cache line prediction atthe sub-block granularity. DSBP is used to reduce energy consumption in the cache sub-system by loading into the cache only those sub-blocks predicted to be useful, and turningoff active sub-blocks as they are predicted dead. In addition, the LRU replacement policyis improved by prioritizing dead lines for eviction. This modification reduces the numberof dead lines that remain inside the cache which leads to better utilization of cache space.
Our evaluations found that DSBP reduces energy consumption of the cache hierarchyby 36% on average compared to the baseline (without any dead line predictor in any

78
cache level), and by 12% compared to a technique that turns off dead lines as predictedby a state-of-the-art predictors similar to those present in the LTP (LAI; FALSAFI, 2000;LAI; FIDE; FALSAFI, 2001), SDP (KHAN et al., 2010) and LWP (WANG; KHAN;JIMÉNEZ, 2012a).
79
5 DEAD LINE AND EARLY WRITE-BACK PREDICTOR(DEWP)
Several prediction mechanisms to keep only useful information in the cache have beenproposed (ABELLA et al., 2005; WANG; KHAN; JIMÉNEZ, 2012a). However, previousapproaches do not take into account that modified or dirty cache lines remain turned onfor long periods of time, wasting energy while they could be evicted earlier. The gains canbe increased even for dirty cache lines, by performing an early write-back to the memorybefore turning off the line. In this way, energy consumption, as well as pressure on thememory controller, can be reduced. Lee et al. (LEE; TYSON; FARRENS, 2000) proposedto early write-back dirty lines at the LRU position, but their proposal loses opportunitiesfor energy savings by not evicting the line when the last write operation occurs. Using aperfect mechanism, we show that turning off invalid lines and dead lines can save 65% ofenergy from the LLC on average (see Section 5.1).
This chapter presents the Dead Line and Early Write-Back Predictor (DEWP) mech-anism (ALVES et al., 2013), which consists of a last read/write predictor operating at thecache line granularity. The last read prediction aims to save energy by turning off deador invalid cache lines. The last write prediction performs early write-backs of dirty cachelines to the lower memory level, since these lines will not be modified anymore. Both lastread and last write predictions detect whenever a line receives its last access, prioritizingthose lines for early eviction.
The last read predictor uses the access history to predict when a cache line becomesdead and can be turned off. The line is considered dead whenever the cache line receivesits last read before it gets evicted or invalidated.
The last write predictor allows dirty cache lines to be early written back when it detectsthe last write operation, reducing the pressure on the memory controller between readsand writes during bursts of requests. Furthermore, performing the early write-back ofdirty lines also enables those lines to be turned off whenever a last read is predicted.
Both predictors reduce cache pollution, prioritizing the eviction of dead lines. All thecache lines that would normally be evicted from the cache memory by the replacementpolicy are considered dead since their last access. By early evicting these lines, othercache lines that are still alive can stay longer inside the cache.
The main contributions of this Dead Line and Early Write-Back Predictor (DEWP)mechanism are:
Last read predictor: We turn-off cache lines after they receive the last read before theline gets evicted. This translates into 25% of cache energy savings.

80
Last write predictor: Our mechanism can write-back the dirty cache lines after theyreceive the last write (before they are evicted). Therefore, we increase the time windowto write-back the cache line to memory and reduce the pressure in the memory controller.
Last access predictor: Combining both prediction results, our mechanism detects thelast access to a cache line, prioritizing it for early eviction, thus, improving the cacheutilization. The predictor achieves 73% of correct predictions with 14% of false positiveson average for all the cache levels.
5.1 Motivation
This section presents motivation results in order to evaluate the possible gains in termsof performance and energy consumption when using DEWP. Our mechanism aims toearly write-back lines after its last update in order to reduce the memory pressure, alsoreduce the cache pollution, increasing the virtual cache size. The final goal is to reducethe static energy consumption by turning off the cache lines after their last access.
5.1.1 Sensitivity to Early Write-Back
Dirty cache lines remain in the cache until they are evicted by another line request.However, they can be sent to write-back earlier when the last write operation is de-tected (WANG; KHAN; JIMÉNEZ, 2012a). When predicting the last write operation,a dirty cache line is available for write-back earlier. Thus, the time window to write itback to memory becomes longer, creating an opportunity to reduce pressure to the mem-ory controller. Additionally, by using a last write predictor, dirty lines can be evictedearlier, thereby increasing the potential cache capacity.
Figure 5.1: Potential of speedup for a perfect early write-back predictor.
0%10%20%30%40%50%60%70%80%90%
100%
asta
rbz
ip2
gcc
gobm
kh2
64re
fhm
me
rlib
qua
ntu
mm
cfom
netp
ppe
rlbe
nch
sje
ngxa
lanc
bmk
Geo
Mea
nbw
aves
cact
usA
DM
calc
ulix
deal
IIga
mes
sG
emsF
DT
Dgr
omac
slb
mle
slie
3dm
ilcna
md
povr
ayso
plex
sphi
nx3
tont
ow
rfze
usm
pG
eoM
ean
appl
u.M
apsi
.Mfm
a3d
.Mga
lgel
.Mm
grid
.Msw
im.M
wu
pwis
e.M
Geo
Mea
nbt
.Acg
.A ft.A
is.A
lu.A
mg
.Asp
.AG
eoM
ean
Geo
Mea
n
SPEC-CPU2006 CINT SPEC-CPU2006 CFP SPEC-OMP2001 NAS-NPB *
Exe
cutio
n T
ime
In order to show the potential benefit of a perfect last write predictor, Figure 5.1 showsthe performance improvement of a system with instant LLC write-back to memory nor-malized to a conventional CMP with write-back. This shows the potential of performingwrite-back operations without interfering with read requests in the memory controller.Since most data accesses tend to occur in bursts (WANG; KHAN; JIMÉNEZ, 2012a),reducing memory pressure during those bursts is a key for memory performance.
Figure 5.1 shows an average 4% performance improvement for single threaded bench-marks (SPEC-CPU2006) and 21% for multi-threaded benchmarks (SPEC-OMP2001 andNAS-NPB). As expected, multi-threaded applications present higher performance gainsdue to their higher memory pressure.

81
Figure 5.2: Memory requests and write-back operations over time for libquantum.
020406080
100120140160180200220240
0 10 20 30 40 50 60 70 80 90 100
110
120
130
140
150
160
170
180
190
200
210
220
230
240
250
260
270
280
290
300
Num
ber o
f Ope
ratio
ns
Execution Cycles (Millions)
Read Request Write-Back
Figure 5.3: Memory requests and write-back operations over time for gcc.
0
20
40
60
80
100
120
140
160
180
200
0 10 20 30 40 50 60 70 80 90 100
110
120
130
140
150
160
170
180
190
200
210
220
230
240
250
260
270
Num
ber o
f Ope
ratio
ns
Execution Cycles (Millions)
Read Request Write-Back
Figures 5.2 and 5.3 show the concentration of write-back operations on the main mem-ory controller during the application execution for two benchmarks libquantum and gccfrom SPEC-CPU2006. Each dot shows the number of memory operations on the memorycontroller (read requests and write-backs) for 10,000 cycles.
For instance, we can observe bursts of read requests from cycle 90 M to cycle 110 Mfor libquantum, where the number of memory operations spikes multiple times from lessthan 50 operations to 200 operations per 10,000 cycles. In the same period, the write-backs also increase from almost 0 to 80 operations per 10,000 cycles.
We can observe that libquantum achieves more bursts of operations compared to gcc.This difference reflects the potential of each application to benefit from the early write-back, libquantum achieved 27% of performance improvement while gcc achieved only3%.
5.1.2 Potential for Energy Savings in LLC
The LLC static energy usage can account for more than 90% of the total energy con-sumption of the LLC (LI et al., 2013) (see also Chapter 1). Figure 5.4 shows the maximumtheoretical energy savings in the LLC, considering that cache lines could be turned off af-ter their last access or whenever the cache line becomes invalid. For this experiment, we
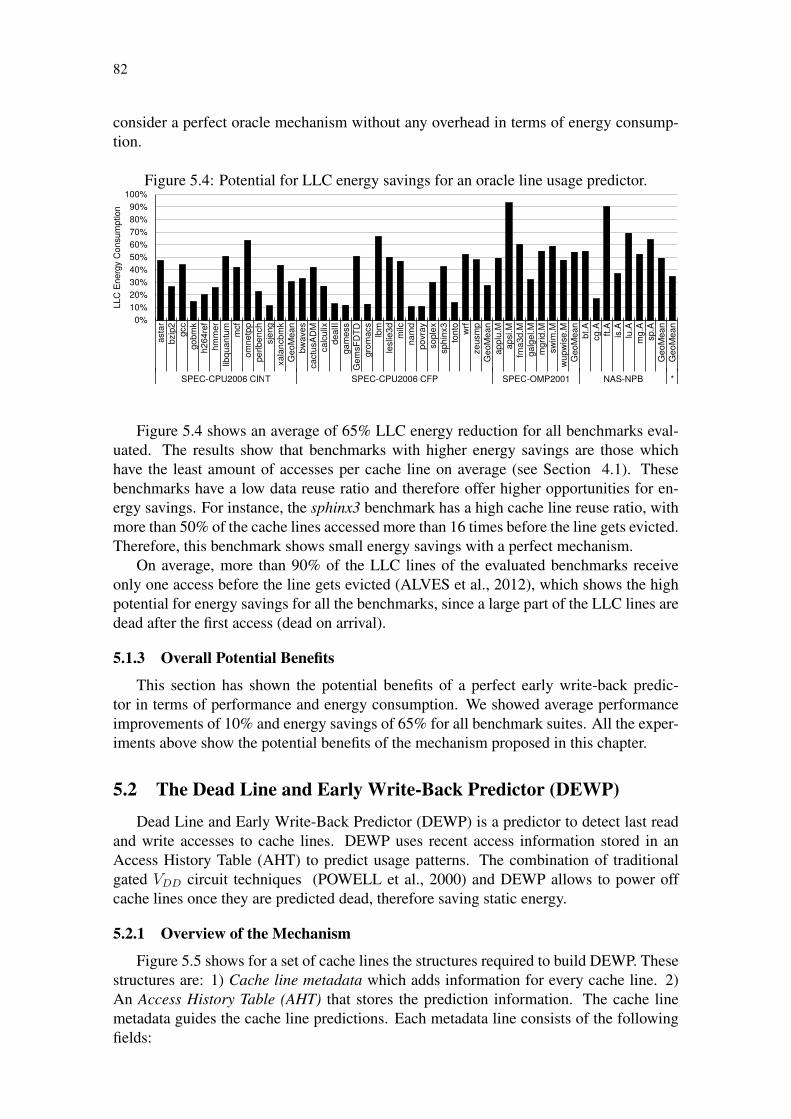
82
consider a perfect oracle mechanism without any overhead in terms of energy consump-tion.
Figure 5.4: Potential for LLC energy savings for an oracle line usage predictor.
0%10%20%30%40%50%60%70%80%90%
100%
asta
rbz
ip2
gcc
gobm
kh2
64re
fhm
mer
libqu
antu
mm
cfom
netp
ppe
rlben
chsj
eng
xala
ncbm
kG
eoM
ean
bwav
esca
ctus
ADM
calc
ulix
deal
IIga
mes
sG
emsF
DTD
grom
acs
lbm
lesl
ie3d milc
nam
dpo
vray
sopl
exsp
hinx
3to
nto
wrf
zeus
mp
Geo
Mea
nap
plu.
Map
si.M
fma3
d.M
galg
el.M
mgr
id.M
swim
.Mw
upw
ise.
MG
eoM
ean
bt.A
cg.A ft.A
is.A
lu.A
mg.
Asp
.AG
eoM
ean
Geo
Mea
n
SPEC-CPU2006 CINT SPEC-CPU2006 CFP SPEC-OMP2001 NAS-NPB *
LLC
Ene
rgy
Con
sum
ptio
n
Figure 5.4 shows an average of 65% LLC energy reduction for all benchmarks eval-uated. The results show that benchmarks with higher energy savings are those whichhave the least amount of accesses per cache line on average (see Section 4.1). Thesebenchmarks have a low data reuse ratio and therefore offer higher opportunities for en-ergy savings. For instance, the sphinx3 benchmark has a high cache line reuse ratio, withmore than 50% of the cache lines accessed more than 16 times before the line gets evicted.Therefore, this benchmark shows small energy savings with a perfect mechanism.
On average, more than 90% of the LLC lines of the evaluated benchmarks receiveonly one access before the line gets evicted (ALVES et al., 2012), which shows the highpotential for energy savings for all the benchmarks, since a large part of the LLC lines aredead after the first access (dead on arrival).
5.1.3 Overall Potential Benefits
This section has shown the potential benefits of a perfect early write-back predic-tor in terms of performance and energy consumption. We showed average performanceimprovements of 10% and energy savings of 65% for all benchmark suites. All the exper-iments above show the potential benefits of the mechanism proposed in this chapter.
5.2 The Dead Line and Early Write-Back Predictor (DEWP)
Dead Line and Early Write-Back Predictor (DEWP) is a predictor to detect last readand write accesses to cache lines. DEWP uses recent access information stored in anAccess History Table (AHT) to predict usage patterns. The combination of traditionalgated VDD circuit techniques (POWELL et al., 2000) and DEWP allows to power offcache lines once they are predicted dead, therefore saving static energy.
5.2.1 Overview of the Mechanism
Figure 5.5 shows for a set of cache lines the structures required to build DEWP. Thesestructures are: 1) Cache line metadata which adds information for every cache line. 2)An Access History Table (AHT) that stores the prediction information. The cache linemetadata guides the cache line predictions. Each metadata line consists of the followingfields:

83
Figure 5.5: DEWP: Mechanism architecture including cache metadata and AHT.
AHTPointer
…
Access History Table
PC Offset
……
…
Cache Line Metadata
TrainRead
Counter
…
ReadOverflow
…
WriteCounter
…
WriteOverflow
…
ReadCounter
…
ReadOverflow
…
WriteCounter
…Write
Overflow
……
Pointer
Data Sub-Blocks
…
StatusTag
……
Data Cache
• A Train flag to indicate if accesses to the cache line should update the pattern in theAHT.
• A Read Counter to store the number of read accesses the cache line is predicted toreceive before it becomes dead.
• A Read Overflow bit to indicate if the predicted number of read accesses exceedsthe maximum value the Read Usage counter can hold. If set, the cache line remainspowered on until the line is evicted.
• A Write Counter to store the number of write accesses the cache line is predicted toreceive before it gets evicted.
• A Write Overflow bit to indicate if the predicted number of write accesses exceedsthe maximum value the Write Counter can hold. If set, the cache line will not besent to early write-back.
• An AHT Pointer linking a cache line to its respective entry in the AHT.
The AHT is indexed by the program counter (PC) of the memory instruction thatcaused the cache miss and the requested cache line offset (byte within the line) of theaddress. The PC+offset combination has been shown to provide high accuracy and highcoverage of patterns even with moderately sized AHTs (CHEN et al., 2004; KUMAR;WILKERSON, 1998; PUJARA; AGGARWAL, 2008). Each entry in the AHT consists ofa Pointer flag, which indicates that a cache line has a pointer to that specific AHT entry, aswell the read and write counters and their respective overflow bits, which have the samesemantics as in the cache line metadata.
5.2.2 Mechanism Operations
The main operations performed by DEWP are triggered by the following cache oper-ations:

84
Cache Line Miss: We search for an entry matching the PC and offset of the instructionthat caused the miss. On an AHT hit, the mechanism copies the AHT’s read/write countersand overflow bits into the cache metadata and resets the train flag. In the case of an AHTmiss, a new entry is created. The train flag is set, and all usage counters and overflow bitsare reset in the cache metadata. The Access History Table (AHT) resets the read/writecounters and overflow bits and evicts the LRU entry to make room for the new pattern(AHT line). An AHT pointer is created linking the cache metadata and the new entry.Because the train flag is set, future accesses to this line update the counters only in theAHT. In order to avoid multiple lines updating the same AHT entry, the Pointer flag isused to inform if another cache line is already linked to that entry. In this case, the newlink is not created.
Tag Hit and Data Cache Line On: If the train flag is disabled, the read counter in themetadata is decremented and the cache line is turned off if its read counter and overflowbit are zero. The AHT will only be updated when the train flag is enabled. The AHT tobe updated is determined by the pointer in the metadata.
Tag Hit and Data Cache Line Off: The requested cache line is brought into the cacheand its read overflow bit is set. If the cache metadata has a valid pointer to an AHT entry,the train flag is enabled and the mechanism increments the corresponding usage counterin the AHT entry.
Cache Line Eviction: If the read/write counters in the metadata is non-zero (indicat-ing that the cache line was accessed less than the predicted number of times), the usagecounter in the AHT entry is updated by decrementing the counter by the non-zero value.Also, if the cache line contains a valid link to an AHT pointer, the pointer flag must bedisabled in the corresponding AHT.
Cache Line Invalidation: If the write counter is zero, it means that the last write wasmispredicted. In this case, similar to the tag hit and data turned off case, the write overflowbit is set. If the cache metadata has a valid pointer to an AHT entry, the train flag isenabled, so future writes increment the write counter. Moreover, the cache line is turnedoff until it receives valid data.
Cache Line write-back: Similar to what happens during a tag hit and data turned oncase, the write counter is decremented and the cache line is sent to early eviction in thecase its write counter and overflow bit are zero. The AHT is only updated when the trainflag is enabled. The AHT to be updated is determined by the pointer in the metadata. Ifthe cache line was turned off, it is turned on again.
The proposed mechanism does not modify the coherence protocol at all. The protocolstates are kept untouched even when the cache line is turned off. The tag store is alwayskept turned on.
Although DEWP is proposed to be used in the LLC, it can also be used at any cachelevel. In order to predict prefetched cache lines, DEWP requires small modifications intothe prefetch structures to store the instruction address and the memory address whichtriggered the prefetcher as explained in Section 4.2.3.
5.2.3 Improving the Cache Replacement Policy
We also use our mechanism to improve the traditional LRU cache replacement policyby prioritizing lines that are turned off. Evicting dead lines early before they are at theLRU position can reduce the cache miss ratio by letting the alive lines stay longer in the

85
cache (ALVES et al., 2012). Although we use DEWP with the LRU replacement policy,other policies could also be easily modified to take advantage of our mechanism.
5.3 Methodology
The baseline configuration for the processor is based on the Intel Sandy Bridge asshown in Table 3.6. The single-threaded applications from SPEC-CPU2006 and multi-threaded (8 threads) applications from SPEC-OMP2001 and NAS-NPB suites were usedas workloads to evaluate DEWP. All the results are normalized to a baseline system with-out any predictor.
In order to increase the static energy efficiency of the cache memories, we turn offthe data array part of the cache line using gated VDD circuit techniques, as in (POWELLet al., 2000). Gated VDD techniques use a transistor to gate the supply voltage (VDD) ofthe cache SRAM cells.
Gated VDD techniques require an extra latency (1 cycle) to turn on and off the cacheline. The latency to turn off the cache line does not impact the performance, it onlyreduces the energy savings slightly. When turning on the cache line, it is important tonote that such latency would appear only during read misses and when receiving a cacheline write-back. However, during read misses, the high latency imposed by the mainmemory hides all the latency to turn the cache line on. On the other hand, cache linewrite-backs do not represent a critical path for the program execution and only cause astall when all the write-back buffers are full, which occurs for less than 0.01% of cacheaccesses for all benchmarks that we evaluated.
In order to model the static energy savings using the DEWP predictor, we model boththe baseline cache architecture and our proposed mechanism with CACTI 6.5++ (MU-RALIMANOHAR; BALASUBRAMONIAN; JOUPPI, 2008) which is available insideMcPAT version 1.0 (LI et al., 2009, 2013). We model tag and data power consumption.We also modeled the AHT table as a cache memory of the same size.
Since our proposed mechanism requires extra metadata, the cache lines were alsomodeled with the extra bits necessary. We also consider that the metadata and the tag arrayare always turned on, because they are used by DEWP during the Cache Line Evictionoperation to fix possible mispredictions. The additional energy consumption of the AHTsis also modeled and added together with the overall energy consumption.
5.4 Evaluation
For our mechanism, experimental evaluation showed that using 2 bits in the read andwrite counter covers more than 98% of the LLC lines. This means that those lines receiveless than 4 accesses before their eviction. In our experiments, we used 512 entries perAHT which proved to be enough to generate accurate results. To maintain the metadatainformation, 16 bits per cache line were added, which represents an overhead of 3.00% ofthe total cache size, assuming a tag size of 32 bits.
For the AHT, using only 16 bits to store the least significant part of the PC demon-strated to be enough to obtain accurate results. Moreover, since most of the accesses arealigned inside the cache line in sub-blocks of 8 bytes, only 3 bits are necessary to main-tain the sub-block accessed inside the cache line (instead of using the full offset). Thetotal size of the AHT used in our experiments is 1.6 KB per cache bank, which represents5.10% of the L1, 0.65% of the L2 and less than 0.15% of the total LLC size. Each AHT is
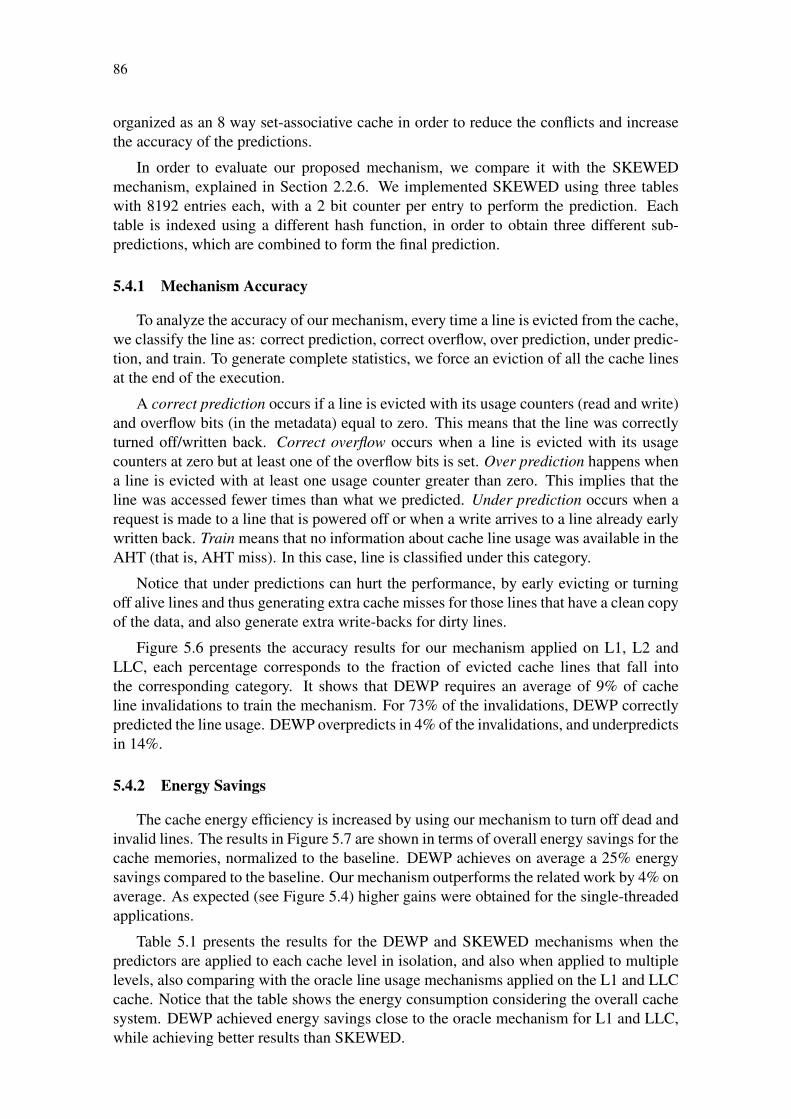
86
organized as an 8 way set-associative cache in order to reduce the conflicts and increasethe accuracy of the predictions.
In order to evaluate our proposed mechanism, we compare it with the SKEWEDmechanism, explained in Section 2.2.6. We implemented SKEWED using three tableswith 8192 entries each, with a 2 bit counter per entry to perform the prediction. Eachtable is indexed using a different hash function, in order to obtain three different sub-predictions, which are combined to form the final prediction.
5.4.1 Mechanism Accuracy
To analyze the accuracy of our mechanism, every time a line is evicted from the cache,we classify the line as: correct prediction, correct overflow, over prediction, under predic-tion, and train. To generate complete statistics, we force an eviction of all the cache linesat the end of the execution.
A correct prediction occurs if a line is evicted with its usage counters (read and write)and overflow bits (in the metadata) equal to zero. This means that the line was correctlyturned off/written back. Correct overflow occurs when a line is evicted with its usagecounters at zero but at least one of the overflow bits is set. Over prediction happens whena line is evicted with at least one usage counter greater than zero. This implies that theline was accessed fewer times than what we predicted. Under prediction occurs when arequest is made to a line that is powered off or when a write arrives to a line already earlywritten back. Train means that no information about cache line usage was available in theAHT (that is, AHT miss). In this case, line is classified under this category.
Notice that under predictions can hurt the performance, by early evicting or turningoff alive lines and thus generating extra cache misses for those lines that have a clean copyof the data, and also generate extra write-backs for dirty lines.
Figure 5.6 presents the accuracy results for our mechanism applied on L1, L2 andLLC, each percentage corresponds to the fraction of evicted cache lines that fall intothe corresponding category. It shows that DEWP requires an average of 9% of cacheline invalidations to train the mechanism. For 73% of the invalidations, DEWP correctlypredicted the line usage. DEWP overpredicts in 4% of the invalidations, and underpredictsin 14%.
5.4.2 Energy Savings
The cache energy efficiency is increased by using our mechanism to turn off dead andinvalid lines. The results in Figure 5.7 are shown in terms of overall energy savings for thecache memories, normalized to the baseline. DEWP achieves on average a 25% energysavings compared to the baseline. Our mechanism outperforms the related work by 4% onaverage. As expected (see Figure 5.4) higher gains were obtained for the single-threadedapplications.
Table 5.1 presents the results for the DEWP and SKEWED mechanisms when thepredictors are applied to each cache level in isolation, and also when applied to multiplelevels, also comparing with the oracle line usage mechanisms applied on the L1 and LLCcache. Notice that the table shows the energy consumption considering the overall cachesystem. DEWP achieved energy savings close to the oracle mechanism for L1 and LLC,while achieving better results than SKEWED.
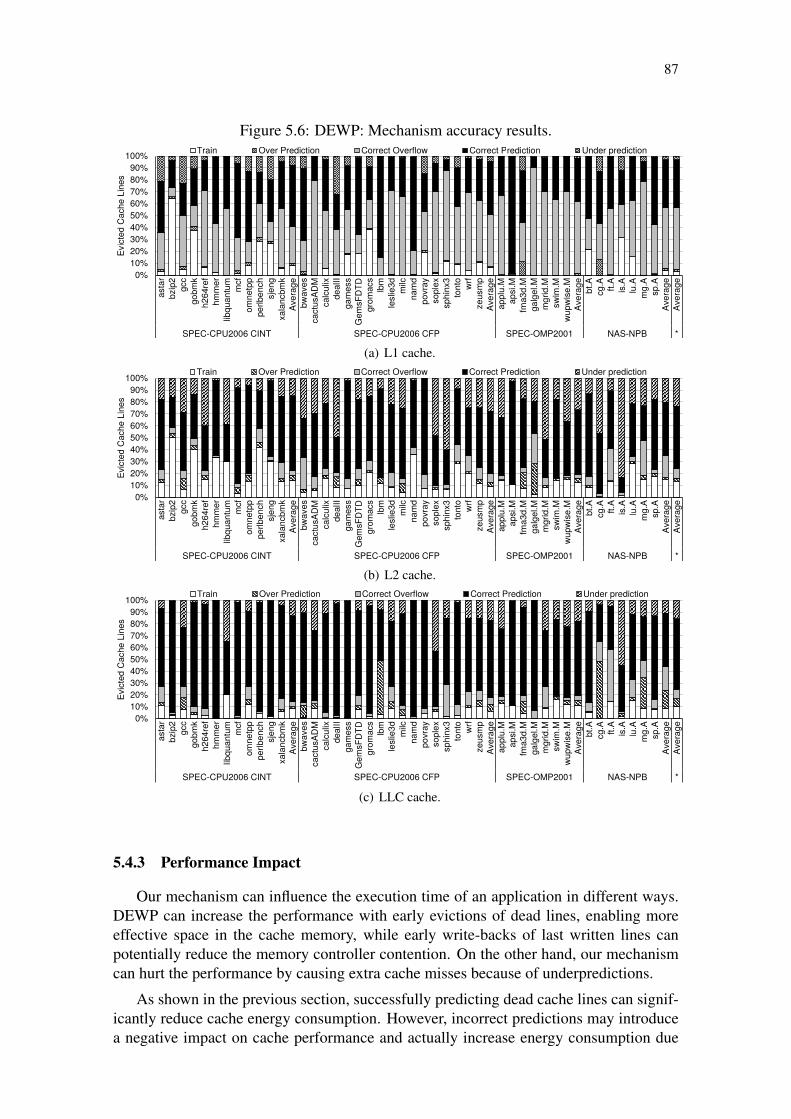
87
Figure 5.6: DEWP: Mechanism accuracy results.
0%10%20%30%40%50%60%70%80%90%
100%as
tar
bzip
2gc
cgo
bmk
h264
ref
hmm
erlib
quan
tum
mcf
omne
tpp
perlb
ench
sjen
gxa
lanc
bmk
Aver
age
bwav
esca
ctus
ADM
calc
ulix
deal
IIga
mes
sG
emsF
DTD
grom
acs
lbm
lesl
ie3d milc
nam
dpo
vray
sopl
exsp
hinx
3to
nto
wrf
zeus
mp
Aver
age
appl
u.M
apsi
.Mfm
a3d.
Mga
lgel
.Mm
grid
.Msw
im.M
wup
wis
e.M
Aver
age
bt.A
cg.A ft.A
is.A
lu.A
mg.
Asp
.AAv
erag
eAv
erag
e
SPEC-CPU2006 CINT SPEC-CPU2006 CFP SPEC-OMP2001 NAS-NPB *
Evic
ted
Cac
he L
ines
Train Over Prediction Correct Overflow Correct Prediction Under prediction
(a) L1 cache.
0%10%20%30%40%50%60%70%80%90%
100%
asta
rbz
ip2
gcc
gobm
kh2
64re
fhm
mer
libqu
antu
mm
cfom
netp
ppe
rlben
chsj
eng
xala
ncbm
kAv
erag
ebw
aves
cact
usAD
Mca
lcul
ixde
alII
gam
ess
Gem
sFD
TDgr
omac
slb
mle
slie
3d milc
nam
dpo
vray
sopl
exsp
hinx
3to
nto
wrf
zeus
mp
Aver
age
appl
u.M
apsi
.Mfm
a3d.
Mga
lgel
.Mm
grid
.Msw
im.M
wup
wis
e.M
Aver
age
bt.A
cg.A ft.A
is.A
lu.A
mg.
Asp
.AAv
erag
eAv
erag
e
SPEC-CPU2006 CINT SPEC-CPU2006 CFP SPEC-OMP2001 NAS-NPB *
Evic
ted
Cac
he L
ines
Train Over Prediction Correct Overflow Correct Prediction Under prediction
(b) L2 cache.
0%10%20%30%40%50%60%70%80%90%
100%
asta
rbz
ip2
gcc
gobm
kh2
64re
fhm
mer
libqu
antu
mm
cfom
netp
ppe
rlben
chsj
eng
xala
ncbm
kAv
erag
ebw
aves
cact
usAD
Mca
lcul
ixde
alII
gam
ess
Gem
sFD
TDgr
omac
slb
mle
slie
3d milc
nam
dpo
vray
sopl
exsp
hinx
3to
nto
wrf
zeus
mp
Aver
age
appl
u.M
apsi.
Mfm
a3d.
Mga
lgel
.Mm
grid
.Msw
im.M
wup
wis
e.M
Aver
age
bt.A
cg.A ft.A
is.A
lu.A
mg.
Asp
.AAv
erag
eAv
erag
e
SPEC-CPU2006 CINT SPEC-CPU2006 CFP SPEC-OMP2001 NAS-NPB *
Evic
ted
Cac
he L
ines
Train Over Prediction Correct Overflow Correct Prediction Under prediction
(c) LLC cache.
5.4.3 Performance Impact
Our mechanism can influence the execution time of an application in different ways.DEWP can increase the performance with early evictions of dead lines, enabling moreeffective space in the cache memory, while early write-backs of last written lines canpotentially reduce the memory controller contention. On the other hand, our mechanismcan hurt the performance by causing extra cache misses because of underpredictions.
As shown in the previous section, successfully predicting dead cache lines can signif-icantly reduce cache energy consumption. However, incorrect predictions may introducea negative impact on cache performance and actually increase energy consumption due

88
Figure 5.7: DEWP: Total energy consumption of the cache sub-system.
0%10%20%30%40%50%60%70%80%90%
100%110%
asta
rbz
ip2
gcc
gobm
kh2
64re
fhm
me
rlib
qua
ntu
mm
cfom
netp
ppe
rlbe
nch
sje
ngxa
lanc
bmk
Geo
Mea
nbw
aves
cact
usA
DM
calc
ulix
deal
IIga
mes
sG
emsF
DT
Dgr
omac
slb
mle
slie
3dm
ilcna
md
povr
ayso
plex
sphi
nx3
tont
ow
rfze
usm
pG
eoM
ean
appl
u.M
apsi
.Mfm
a3d
.Mga
lgel
.Mm
grid
.Msw
im.M
wu
pwis
e.M
Geo
Mea
nbt
.Acg
.A ft.A
is.A
lu.A
mg
.Asp
.AG
eoM
ean
Geo
Mea
n
SPEC-CPU2006 CINT SPEC-CPU2006 CFP SPEC-OMP2001 NAS-NPB *
Ene
rgy
Con
sum
ptio
n
DEWP-L1-L2-LLC SKEWED-L1-L2-LLC
Figure 5.8: DEWP: Normalized extra cache misses.
0%
10%
20%
30%
40%
50%
60%
70%
80%
90%
100%
asta
rbz
ip2
gcc
gobm
kh2
64re
fhm
me
rlib
qua
ntu
mm
cfom
netp
ppe
rlbe
nch
sje
ngxa
lanc
bmk
Ave
rage
bwav
esca
ctus
AD
Mca
lcu
lixde
alII
gam
ess
Gem
sFD
TD
grom
acs
lbm
lesl
ie3d
milc
nam
dpo
vray
sopl
exsp
hinx
3to
nto
wrf
zeus
mp
Ave
rage
appl
u.M
apsi
.Mfm
a3d
.Mga
lgel
.Mm
grid
.Msw
im.M
wu
pwis
e.M
Ave
rage
bt.A
cg.A ft.A
is.A
lu.A
mg
.Asp
.AA
vera
geA
vera
ge
SPEC-CPU2006 CINT SPEC-CPU2006 CFP SPEC-OMP2001 NAS-NPB *
Ext
ra L
ine
Mis
ses
L1 L2 LLC
to extra cache line misses. Figure 5.8 shows the total number of extra cache missesnormalized to the number of cache misses from the baseline cache architecture.
Figure 5.9: DEWP: Normalized execution time.
0%10%20%30%40%50%60%70%80%90%
100%110%120%130%140%150%
asta
rbz
ip2
gcc
gobm
kh2
64re
fhm
me
rlib
qua
ntu
mm
cfom
netp
ppe
rlbe
nch
sje
ngxa
lanc
bmk
Geo
Mea
nbw
aves
cact
usA
DM
calc
ulix
deal
IIga
mes
sG
emsF
DT
Dgr
omac
slb
mle
slie
3dm
ilcna
md
povr
ayso
plex
sphi
nx3
tont
ow
rfze
usm
pG
eoM
ean
appl
u.M
apsi
.Mfm
a3d
.Mga
lgel
.Mm
grid
.Msw
im.M
wu
pwis
e.M
Geo
Mea
nbt
.Acg
.Aft.
Ais
.Alu
.Am
g.A
sp.A
Geo
Mea
nG
eoM
ean
SPEC-CPU2006 CINT SPEC-CPU2006 CFP SPEC-OMP2001 NAS-NPB *
Exe
cutio
n T
ime
DEWP-L1-L2-LLC SKEWED-L1-L2-LLC
Figure 5.9 shows the execution time of our mechanism normalized to the baseline. Wecan observe that in most of the cases, the performance gains correlate with the sensitivitystudy presented in Section 5.1 and the prediction accuracy results. However, some bench-marks, such as libquatum and is.A, had a performance degradation, because our predictorfailed to recognize some cache access patterns.

89
Table 5.1: DEWP: Total energy consumption of the cache sub-system.
L1 L2 LLC
L1-L
2
L1-L
2-LL
C
L1 L2 LLC
L1-L
2
L1-L
2-LL
C
L1 L
ine
Usa
ge
LLC
Lin
eU
sage
astar 83% 92% 92% 75% 67% 85% 93% 93% 78% 70% 86% 87%bzip2 83% 93% 83% 76% 58% 85% 94% 84% 79% 62% 86% 82%gcc 82% 92% 88% 74% 63% 84% 93% 90% 77% 68% 85% 85%gobmk 82% 92% 80% 75% 54% 85% 93% 80% 78% 58% 86% 78%h264ref 88% 95% 87% 83% 70% 90% 95% 88% 85% 73% 90% 86%hmmer 89% 95% 89% 85% 74% 92% 96% 89% 88% 77% 92% 89%libquantum 78% 93% 93% 70% 77% 76% 90% 76% 67% 47% 82% 85%mcf 76% 90% 84% 65% 52% 80% 91% 86% 71% 61% 81% 81%omnetpp 83% 92% 99% 76% 74% 87% 93% 99% 80% 78% 86% 91%perlbench 85% 94% 84% 79% 62% 88% 94% 85% 82% 66% 88% 83%sjeng 83% 92% 79% 75% 55% 85% 93% 80% 78% 58% 87% 78%xalancbmk 86% 94% 89% 80% 71% 89% 95% 88% 83% 76% 89% 89%GeoMean 83% 93% 87% 76% 64% 85% 93% 86% 79% 65% 86% 84%bwaves 90% 94% 86% 86% 73% 89% 95% 86% 84% 75% 90% 88%cactusADM 89% 95% 93% 83% 76% 89% 95% 93% 84% 79% 90% 90%calculix 81% 92% 81% 73% 58% 84% 93% 82% 76% 58% 86% 81%dealII 86% 94% 83% 80% 63% 88% 95% 84% 82% 66% 89% 83%gamess 88% 95% 85% 83% 68% 90% 95% 85% 85% 70% 90% 85%GemsFDTD 86% 94% 87% 80% 71% 87% 95% 89% 82% 75% 89% 90%gromacs 85% 94% 83% 79% 63% 87% 94% 85% 81% 66% 88% 82%lbm 85% 94% 89% 79% 77% 88% 98% 96% 84% 82% 89% 93%leslie3d 88% 95% 92% 83% 79% 88% 96% 96% 83% 80% 90% 91%milc 85% 94% 81% 79% 66% 87% 94% 84% 81% 68% 89% 89%namd 88% 95% 85% 82% 68% 90% 95% 85% 84% 70% 91% 85%povray 86% 94% 82% 80% 61% 88% 94% 83% 82% 65% 88% 81%soplex 84% 95% 84% 78% 75% 85% 95% 87% 80% 75% 87% 84%sphinx3 87% 95% 91% 81% 72% 88% 95% 92% 83% 75% 89% 89%tonto 87% 94% 85% 82% 67% 89% 95% 85% 84% 70% 90% 84%wrf 87% 95% 92% 82% 75% 88% 95% 94% 83% 77% 89% 91%zeusmp 85% 93% 88% 78% 71% 86% 94% 92% 80% 77% 88% 89%GeoMean 86% 94% 86% 80% 69% 88% 95% 88% 82% 72% 89% 87%applu.M 97% 98% 90% 96% 92% 92% 98% 90% 88% 81% 95% 94%apsi.M 100% 99% 97% 99% 98% 101% 99% 100% 100% 98% 100% 100%fma3d.M 92% 97% 83% 89% 77% 90% 98% 85% 88% 77% 93% 92%galgel.M 99% 99% 95% 98% 93% 99% 99% 95% 98% 93% 97% 95%mgrid.M 99% 100% 98% 99% 99% 99% 100% 101% 99% 99% 99% 98%swim.M 98% 99% 95% 97% 95% 94% 99% 98% 94% 93% 97% 96%wupwise.M 98% 99% 88% 97% 93% 95% 97% 88% 93% 87% 96% 94%GeoMean 98% 99% 92% 96% 92% 96% 99% 94% 94% 89% 97% 96%bt.A 100% 100% 98% 99% 98% 100% 100% 99% 100% 100% 99% 98%cg.A 97% 100% 99% 97% 96% 98% 100% 95% 98% 97% 96% 94%ft.A 99% 100% 98% 99% 98% 92% 100% 99% 92% 90% 99% 100%is.A 100% 100% 98% 100% 100% 101% 100% 97% 101% 102% 99% 97%lu.A 100% 99% 99% 99% 99% 100% 99% 99% 99% 99% 98% 99%mg.A 99% 100% 98% 100% 100% 100% 100% 102% 100% 100% 99% 98%sp.A 99% 100% 98% 99% 98% 99% 100% 99% 99% 99% 99% 98%GeoMean 99% 100% 98% 99% 99% 99% 100% 99% 98% 98% 98% 98%
* GeoMean 89% 95% 89% 84% 75% 90% 96% 90% 86% 76% 91% 89%
DEWP SKEWED ORACLESP
EC-O
MP2
001
NAS
-NPB
SPEC
-CPU
2006
- C
INT
SPEC
-CPU
2006
- C
FP
On average, the performance was harmed by less than 4%, while saving on average25% of total cache energy.
5.5 Design Space Exploration
This section presents a parameter sensitivity exploration for our DEWP mechanism.We study the effect of varying the LLC size when using our mechanism. For these exper-iments, DEWP was only enabled on the LLC.
Figure 5.10 shows the results presented in terms of energy consumption and executiontime for each LLC size normalized to the same LLC sized baseline without our mecha-nism.
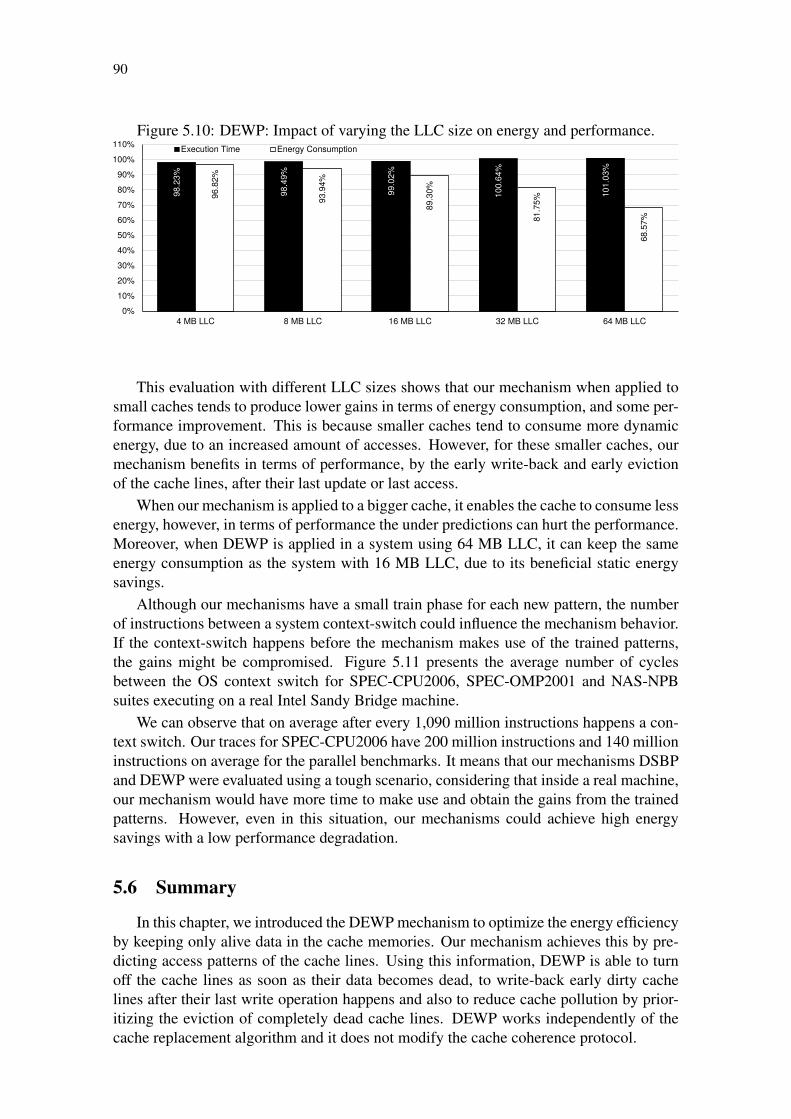
90
Figure 5.10: DEWP: Impact of varying the LLC size on energy and performance.
98.2
3%
98.4
9%
99.0
2%
100.
64%
101.
03%
96.8
2%
93.9
4%
89.3
0%
81.7
5%
68.5
7%
0%10%20%30%40%50%60%70%80%90%
100%110%
4 MB LLC 8 MB LLC 16 MB LLC 32 MB LLC 64 MB LLC
Execution Time Energy Consumption
This evaluation with different LLC sizes shows that our mechanism when applied tosmall caches tends to produce lower gains in terms of energy consumption, and some per-formance improvement. This is because smaller caches tend to consume more dynamicenergy, due to an increased amount of accesses. However, for these smaller caches, ourmechanism benefits in terms of performance, by the early write-back and early evictionof the cache lines, after their last update or last access.
When our mechanism is applied to a bigger cache, it enables the cache to consume lessenergy, however, in terms of performance the under predictions can hurt the performance.Moreover, when DEWP is applied in a system using 64 MB LLC, it can keep the sameenergy consumption as the system with 16 MB LLC, due to its beneficial static energysavings.
Although our mechanisms have a small train phase for each new pattern, the numberof instructions between a system context-switch could influence the mechanism behavior.If the context-switch happens before the mechanism makes use of the trained patterns,the gains might be compromised. Figure 5.11 presents the average number of cyclesbetween the OS context switch for SPEC-CPU2006, SPEC-OMP2001 and NAS-NPBsuites executing on a real Intel Sandy Bridge machine.
We can observe that on average after every 1,090 million instructions happens a con-text switch. Our traces for SPEC-CPU2006 have 200 million instructions and 140 millioninstructions on average for the parallel benchmarks. It means that our mechanisms DSBPand DEWP were evaluated using a tough scenario, considering that inside a real machine,our mechanism would have more time to make use and obtain the gains from the trainedpatterns. However, even in this situation, our mechanisms could achieve high energysavings with a low performance degradation.
5.6 Summary
In this chapter, we introduced the DEWP mechanism to optimize the energy efficiencyby keeping only alive data in the cache memories. Our mechanism achieves this by pre-dicting access patterns of the cache lines. Using this information, DEWP is able to turnoff the cache lines as soon as their data becomes dead, to write-back early dirty cachelines after their last write operation happens and also to reduce cache pollution by prior-itizing the eviction of completely dead cache lines. DEWP works independently of thecache replacement algorithm and it does not modify the cache coherence protocol.

91
Figure 5.11: Average number of cycles between the OS context-switch.
0
500
1000
1500
2000
2500
3000
3500
4000as
tar
bzip
2gc
cgo
bmk
h264
ref
hmm
er
libq
uan
tum
mcf
omne
tpp
perlb
enc
hsj
eng
xala
ncbm
kG
eoM
ean
bwav
esca
ctus
AD
Mca
lcu
lixde
alII
gam
ess
Gem
sFD
TD
grom
acs
lbm
lesl
ie3d
milc
nam
dpo
vray
sopl
exsp
hinx
3to
nto
wrf
zeus
mp
Geo
Mea
nap
plu
apsi
fma3
dga
lgel
mg
ridsw
imw
upw
ise
Geo
Mea
n bt cg ft is lum
g spG
eoM
ean
Geo
Mea
n
SPEC-CPU2006 - CINT SPEC-CPU2006 - CFP SPEC-OMP2001 NAS-NPB *
Mill
ion
of In
stru
ctio
ns
The DEWP mechanism requires a low storage size overhead to achieve accurate pre-dictions (73% correct predictions and 14% of underpredictions). DEWP achieves a 25%energy reduction on average compared to the baseline. The execution time was increasedby 4% on average for single-threaded and multi-threaded applications. DEWP achievesclose to 100% of the potential savings that a perfect (oracle) mechanism would achieve.

92

93
6 COMBINING DSBP AND DEWP
In the previous chapters, DSBP and DEWP were used separately in all the cache lev-els. This chapter presents the evaluation results for the integration of our two mechanismsDSBP and DEWP, executing together in a system. This integrated mechanism will becalled MIXED.
6.1 Introduction
In order to choose the best integration between the predictors, we first consider theresults presented in Section 1.2. It is possible to see that the three major sources of energyconsumption inside the cache sub-system are the dynamic (45%) and static (17%) energyfrom the L1 data cache and the static energy from the LLC (19%). It means that DSBP,which saves static and dynamic energy, is suitable for the L1 cache, while the DEWPmechanism would reduce the main energy consumption from the LLC.
The second aspect to be considered is presented in Section 4.1, in which we can ob-serve that cache levels closer to the processor (L1 and L2) tend to access less sub-blocksbefore the line is evicted. It means that DSBP has more potential to save energy on L1and L2 caches because it works on the sub-block granularity. The cache lines in the LLCtend to be used completely, which is an access behavior that is suitable for DEWP. Forthese reasons, MIXED implements the DSBP mechanism on the L1 and L2 cache levels,while DEWP is used on the LLC.
6.2 Evaluation
The baseline configuration for the processor is based on the Intel Sandy Bridge asshown in Table 3.6. The single-threaded applications from SPEC-CPU2006 and multi-threaded (8 threads) applications from SPEC-OMP2001 and NAS-NPB suites were usedas workloads to evaluate MIXED.
In order to evaluate our proposed mechanism, we compare it with the SKEWEDmechanism, explained in Section 2.2.6. We implemented SKEWED using three tableswith 8192 entries each, with a 2 bit counter per entry to perform the prediction. Eachtable is indexed using a different hash function, in order to obtain three different sub-predictions, which are combined to form the final prediction.
A similar energy modeling methodology as presented in Sections 4.3 and 5.3 was usedto evaluate our combination of the DSBP and DEWP mechanisms.

94
Figure 6.1: MIXED: Total energy consumption of the cache sub-system.
0%10%20%30%40%50%60%70%80%90%
100%110%
asta
rbz
ip2
gcc
gobm
kh2
64re
fhm
me
rlib
qua
ntu
mm
cfom
netp
ppe
rlbe
nch
sje
ngxa
lanc
bmk
Geo
Mea
nbw
aves
cact
usA
DM
calc
ulix
deal
IIga
mes
sG
emsF
DT
Dgr
omac
slb
mle
slie
3dm
ilcna
md
povr
ayso
plex
sphi
nx3
tont
ow
rfze
usm
pG
eoM
ean
appl
u.M
apsi
.Mfm
a3d
.Mga
lgel
.Mm
grid
.Msw
im.M
wu
pwis
e.M
Geo
Mea
nbt
.Acg
.A ft.A
is.A
lu.A
mg
.Asp
.AG
eoM
ean
Geo
Mea
n
SPEC-CPU2006 CINT SPEC-CPU2006 CFP SPEC-OMP2001 NAS-NPB *
Ene
rgy
Con
sum
ptio
n
MIXED-L1-L2-LLC SKEWED-L1-L2-LLC
6.2.1 Energy Savings
The cache energy efficiency is increased by using our two mechanisms DSBP andDEWP together. The results in Figure 6.1 are shown in terms of energy consumption forthe cache memory sub-system, normalized to the baseline. MIXED achieves on average37% of energy savings compared to the baseline, outperforming the related work by 13%.
Table 6.1 presents the results for the MIXED, DSBP, DEWP and SKEWED mech-anisms when the predictors are applied to all the cache levels, also comparing with theoracle mechanisms applied on the L1 and LLC. Notice that the table shows the energyconsumption considering the overall cache system.
6.2.2 Performance Impact
Our mechanism can influence the execution time of an application in different ways.MIXED can increase the performance with early evictions of dead lines, enabling moreeffective space in the cache memory, while early write-backs of last written lines canpotentially reduce the memory controller contention. On the other hand, our mechanismcan hurt the performance by causing extra cache misses because of under predictions.
Figure 6.2: MIXED: Normalized cache misses.
0%
10%
20%
30%
40%
50%
60%
70%
80%
90%
100%
asta
rbz
ip2
gcc
gobm
kh2
64re
fhm
me
rlib
qua
ntu
mm
cfom
netp
ppe
rlbe
nch
sje
ngxa
lanc
bmk
Ave
rage
bwav
esca
ctus
AD
Mca
lcu
lixde
alII
gam
ess
Gem
sFD
TD
grom
acs
lbm
lesl
ie3d
milc
nam
dpo
vray
sopl
exsp
hinx
3to
nto
wrf
zeus
mp
Ave
rage
appl
u.M
apsi
.Mfm
a3d
.Mga
lgel
.Mm
grid
.Msw
im.M
wu
pwis
e.M
Ave
rage
bt.A
cg.A ft.A
is.A
lu.A
mg
.Asp
.AA
vera
geA
vera
ge
SPEC-CPU2006 CINT SPEC-CPU2006 CFP SPEC-OMP2001 NAS-NPB *
Ext
ra L
ine
Mis
ses
L1 L2 LLC
As shown in the previous section, successfully predicting dead cache lines can signif-icantly reduce cache energy consumption. However, incorrect predictions may introducea negative impact on cache performance and actually increase energy consumption due to

95
Table 6.1: MIXED: Total energy consumption of the cache sub-system.
MIX
ED
L1-
L2-
LL
C
DE
WP
L1-
L2-
LL
C
DS
BP
L1-
L2-
LL
C
SK
EW
ED
L1-
L2-
LL
C
L1
Ora
cle
Lin
e U
sag
e
LL
C O
racl
eL
ine
Usa
ge
L1
Ora
cle
Su
b-b
lock
Usa
ge
astar 59% 67% 63% 70% 86% 87% 58%bzip2 56% 58% 56% 62% 86% 82% 63%gcc 58% 63% 59% 68% 85% 85% 65%gobmk 52% 54% 52% 58% 86% 78% 66%h264ref 63% 70% 63% 73% 90% 86% 71%hmmer 73% 74% 73% 77% 92% 89% 79%libquantum 44% 77% 43% 47% 82% 85% 56%mcf 38% 52% 39% 61% 81% 81% 58%omnetpp 61% 74% 63% 78% 86% 91% 58%perlbench 56% 62% 57% 66% 88% 83% 57%sjeng 51% 55% 52% 58% 87% 78% 67%xalancbmk 62% 71% 62% 76% 89% 89% 66%GeoMean 55% 64% 56% 65% 86% 84% 63%bwaves 61% 73% 60% 75% 90% 88% 72%cactusADM 70% 76% 70% 79% 90% 90% 79%calculix 57% 58% 58% 58% 86% 81% 74%dealII 55% 63% 55% 66% 89% 83% 68%gamess 59% 68% 59% 70% 90% 85% 65%GemsFDTD 58% 71% 63% 75% 89% 90% 61%gromacs 59% 63% 59% 66% 88% 82% 71%lbm 50% 77% 51% 82% 89% 93% 60%leslie3d 69% 79% 71% 80% 90% 91% 73%milc 52% 66% 53% 68% 89% 89% 65%namd 66% 68% 66% 70% 91% 85% 61%povray 52% 61% 52% 65% 88% 81% 60%soplex 59% 75% 60% 75% 87% 84% 53%sphinx3 60% 72% 61% 75% 89% 89% 63%tonto 63% 67% 64% 70% 90% 84% 76%wrf 68% 75% 70% 77% 89% 91% 70%zeusmp 65% 71% 65% 77% 88% 89% 69%GeoMean 60% 69% 61% 72% 89% 87% 67%applu.M 69% 92% 70% 81% 95% 94% 65%apsi.M 86% 98% 86% 98% 100% 100% 77%fma3d.M 44% 77% 49% 77% 93% 92% 52%galgel.M 87% 93% 87% 93% 97% 95% 85%mgrid.M 89% 99% 89% 99% 99% 98% 76%swim.M 71% 95% 71% 93% 97% 96% 66%wupwise.M 73% 93% 72% 87% 96% 94% 73%GeoMean 72% 92% 74% 89% 97% 96% 70%bt.A 90% 98% 90% 100% 99% 98% 79%cg.A 62% 96% 61% 97% 96% 94% 43%ft.A 91% 98% 92% 90% 99% 100% 80%is.A 86% 100% 85% 102% 99% 97% 57%lu.A 79% 99% 79% 99% 98% 99% 63%mg.A 86% 100% 86% 100% 99% 98% 78%sp.A 78% 98% 79% 99% 99% 98% 63%GeoMean 81% 99% 81% 98% 98% 98% 65%
* GeoMean 63% 75% 64% 76% 91% 89% 66%
SP
EC
OM
P20
01N
AS
-NP
BS
PE
C-C
PU
2006
- C
INT
SP
EC
-CP
U20
06 -
CF
P
extra cache sub-block misses. Figure 6.2 shows the total number of extra cache missesnormalized to the number of cache misses from the baseline cache architecture.
Figure 6.3 shows the execution time of our mechanism normalized to the baseline. Onaverage, the performance was degraded by less than 2%, while saving on average 37% ofcache energy.
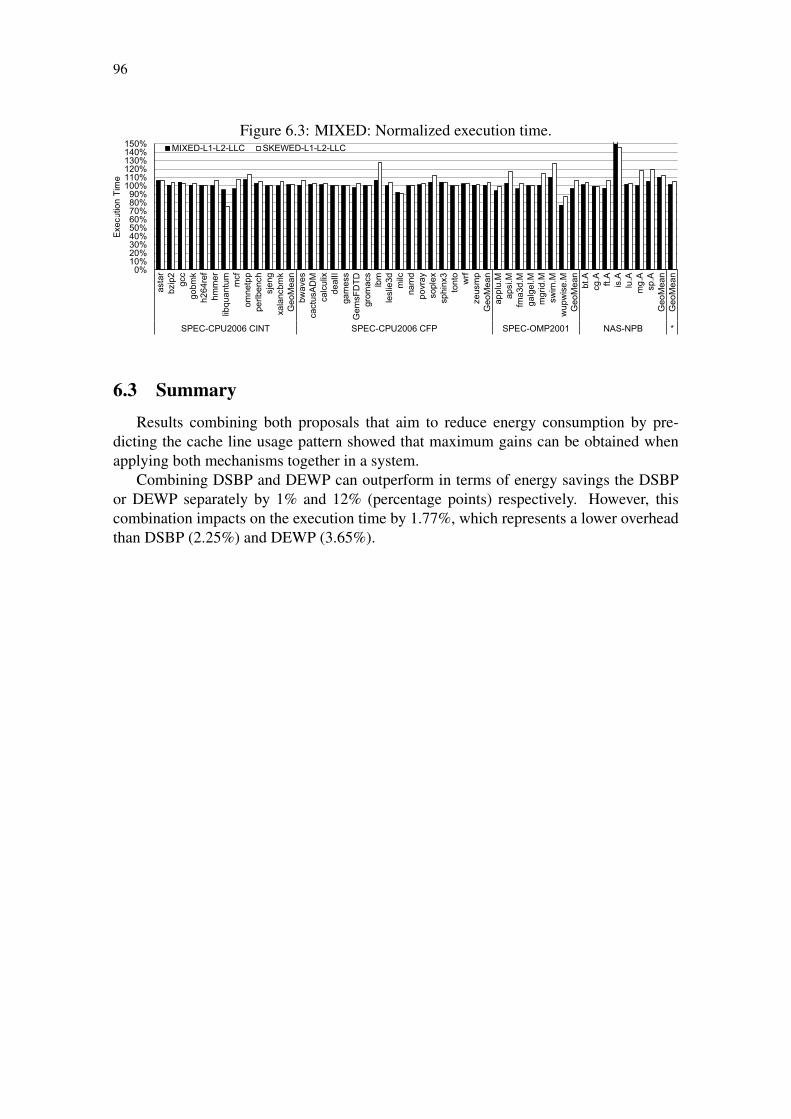
96
Figure 6.3: MIXED: Normalized execution time.
0%10%20%30%40%50%60%70%80%90%
100%110%120%130%140%150%
asta
rbz
ip2
gcc
gobm
kh2
64re
fhm
me
rlib
qua
ntu
mm
cfom
netp
ppe
rlbe
nch
sje
ngxa
lanc
bmk
Geo
Mea
nbw
aves
cact
usA
DM
calc
ulix
deal
IIga
mes
sG
emsF
DT
Dgr
omac
slb
mle
slie
3dm
ilcna
md
povr
ayso
plex
sphi
nx3
tont
ow
rfze
usm
pG
eoM
ean
appl
u.M
apsi
.Mfm
a3d
.Mga
lgel
.Mm
grid
.Msw
im.M
wu
pwis
e.M
Geo
Mea
nbt
.Acg
.Aft.
Ais
.Alu
.Am
g.A
sp.A
Geo
Mea
nG
eoM
ean
SPEC-CPU2006 CINT SPEC-CPU2006 CFP SPEC-OMP2001 NAS-NPB *
Exe
cutio
n T
ime
MIXED-L1-L2-LLC SKEWED-L1-L2-LLC
6.3 Summary
Results combining both proposals that aim to reduce energy consumption by pre-dicting the cache line usage pattern showed that maximum gains can be obtained whenapplying both mechanisms together in a system.
Combining DSBP and DEWP can outperform in terms of energy savings the DSBPor DEWP separately by 1% and 12% (percentage points) respectively. However, thiscombination impacts on the execution time by 1.77%, which represents a lower overheadthan DSBP (2.25%) and DEWP (3.65%).
97
7 CONCLUSIONS AND FUTURE WORK
Energy consumption has become an important factor in multi-core designs. Thus,mechanisms that enable energy savings while maintaining the performance are essentialfor keeping the power budget and an efficient operation.
Considering that cache memories consume a great portion of energy inside the chip,this thesis proposed two mechanisms, Dead Sub-Block Predictor (DSBP) and Dead Lineand Early Write-Back Predictor (DEWP), to increase the energy efficiency of cache mem-ories.
To our knowledge, the DSBP mechanism is the first proposal to exploit dead cacheline prediction at the sub-block granularity. DSBP is used to reduce energy consumptionin the cache sub-system by loading into the cache only those sub-blocks predicted to beuseful, and turning off active sub-blocks when they become dead. In addition, the LRUreplacement policy is improved by prioritizing dead lines for eviction. This modifica-tion reduces the number of dead lines that are kept in the cache, which leads to a betterutilization of the cache space.
DSBP results in terms of energy consumption show significant improvements on allcache levels, with average savings of 22%, 27% and 36% when applied to the L1, L1-L2and L1-L2-LLC respectively, compared to the baseline.
We introduced the DEWP mechanism to optimize the energy efficiency and perfor-mance of last level caches by reducing cache pollution and memory pressure. Our mech-anism achieves this by predicting access patterns of the cache lines. Using this infor-mation, DEWP is able to turn off the cache lines as soon as their data becomes dead,to write-back early dirty cache lines after their last write operation happens and also toreduce cache pollution by prioritizing the eviction of completely dead cache lines.
DEWP achieves energy savings on all cache levels, with average savings of 11%, 16%and 25% when applied to the L1, L1-L2 and L1-L2-LLC respectively, compared to thebaseline.
Additionally, integrating DSBP and DEWP, using DSBP on the L1 and L2 and DEWPon the LLC, produces 37% of energy savings for all the cache levels.
7.1 Future Work
Multiple future work opportunities can be explored, in order to reduce the overheadand improve the mechanism accuracy, enabling higher energy savings.
Enabling the power gating on the sub-block or cache line level can impact the designof cache memories by requiring a higher number of power lines. Moreover, the powergating operation can also generate some peak energy when turning on the cache lines.

98
These impacts can be evaluated in order to propose ways to reduce this impact in termsof area and energy consumption.
The prediction accuracy for the prefetched lines can be improved by including an extrabit in the cache line to indicate that a particular line was prefetched. Thus, mispredictionscaused by unnecessary prefetches would not modify the prediction pattern, increasing theaccuracy of our mechanisms.
Turning off sub-blocks inside the cache line can help reduce the heat from the cachememory sub-system, which in turn reduces static energy (LIU et al., 2007). However, theheat reduction benefits of our mechanism are not modeled in this work.
Dead-on-arrival lines can be filtered with bypassing algorithms using the informationavailable from our predictor. Also, our mechanism can be used to design prefetchersthat bring into the cache only those sub-blocks that are predicted to be useful, therebydecreasing the bandwidth demand of systems that employ aggressive prefetching.
Mechanisms, such as the one presented by Kim and Gratz (KIM; GRATZ, 2010),could be used together with DSBP to reduce the energy consumption on networks-on-chipby transferring only the useful data between caches. In addition, off-chip mechanisms aspresented by Yoon et al. (YOON; JEONG; EREZ, 2011) can also be adopted to reducethe overall off-chip communication during accesses to the main memory, fetching only thesub-blocks predicted to be useful. This evaluation of on-chip and off-chip traffic couldshow the benefits of our mechanism for the interconnection system.
7.2 Published Papers
The list with published papers since 2010 (second year as PhD student) are presentbelow:
1. CRUZ, E. H. M., DIENER, M., ALVES, M. A. Z., NAVAUX, P. O. A. Dynamicthread mapping of shared memory applications by exploiting cache coherenceprotocols. Journal of Parallel and Distributed Computing (JPDC), 2014
2. 1 ALVES, M. A. Z., VILLAVIEJA, C., DIENER, M., NAVAUX, P. O. A. EnergyEfficient Last Level Caches via Last Read/Write Prediction. Int. Symp. on Com-puter Architecture and High Performance Computing (SBAC-PAD), 2013, Porto deGalinhas, PE.
3. MOREIRA, F. B., ALVES, M. A. Z., DIENER, M., NAVAUX, P. O. A. Influênciadas Características de Processadores e Aplicações no Nível de Blocos Básicos.Symp. on Computing Systems (WSCAD-SSC), 2013, Porto de Galinhas, PE.
4. 2 ALVES, M. A. Z., KHUBAIB, EBRAHIMI, E., NARASIMAN, V., VILLAVIEJA,C., NAVAUX, P. O. A., PATT, Y. N. Energy Savings via Dead Sub-Block Predic-tion. Int. Symp. on Computer Architecture and High Performance Computing(SBAC-PAD), 2012, New York, United States.
5. CRUZ, E. H. M., ALVES, M. A. Z., CARISSIMI, A. S., NAVAUX, P. O. A.,RIBEIRO, C. P., MEHAUT, J. Using Memory Access Traces to Map Threads andData on Hierarchical Multi-core Platforms. Workshop on Advances in Parallel
1Represents the one of the most important publications related to this thesis mechanism DEWP.2Represents the one of the most important publications related to this thesis mechanism DSBP.

99
and Distributed Computing Models. (IPDPS-APDCM), 2011, Anchorage, UnitedStates.
6. MOREIRA, F. B., MOLINA DA CRUZ, E. H., ALVES, M. A. Z., NAVAUX, P.O. A. Scratchpad Memories for Parallel Applications in Multi-core Architectures.(Best paper award) Symp. on Computing Systems (WSCAD-SSC), 2011, Vitória,ES.
7. FREITAS, H. C., ALVES, M. A. Z., SCHNORR, L. M., NAVAUX, P. O. A. Impactof Parallel Workloads on NoC Architecture Design. Euromicro Int. Conference onParallel, Distributed and Network-Based Computing. 2010, Pisa, Italy. p. 551-555.
8. RUTZIG, M. B., MADRUGA, F. L., ALVES, M. A. Z., FREITAS, H. C., BECKFILHO, A. C. S., MAILLARD, N., NAVAUX, P. O. A., CARRO, L. TLP and ILPexploitation through a Reconfigurable Multiprocessor System. IEEE Int. ParallelAnd Distributed Processing Symp. (IPDPS), 2010, Atlanta, United States, p. 1-8.
9. DIENER, M., MADRUGA, F. L., RODRIGUES, E. R., ALVES, M. A. Z., SCHNEI-DER, J., NAVAUX, P. O. A., HEIß, H. Evaluating Thread Placement Based onMemory Access Patterns for Shared Cache Multi-core Processors. Int. Symp. OnAdvances Of High Performance Computing And Networking (AHPCN), 2010 Mel-bourne, Australia.
10. MOR, S. D. K., ALVES, M. A. Z., LIMA, J. V. F., MAILLARD, N., NAVAUX,P. O. A. Eficiência Energética em Computação de Alto Desempenho: Uma Abor-dagem em Arquitetura e Programação para Green Computing. Seminário Inte-grado de Software e Hardware (SEMISH), 2010, Belo Horizonte, MG.
11. ALVES, M. A. Z., CERA, M. C., LIMA, J. V. F., MAILLARD, N., NAVAUX,P. O. A. Enhancing Energy Efficiency using Efficient Parallel Programming Tech-niques. Latin-American Conference on High Performance Computing (CLCAR),2010, Gramado, RS.
12. ALVES, M. A. Z., NAVAUX, P. O. A. Intermediary Cache Memory Level for DataExchange and Interactions of Parallel Scientific Applications. Latin-American Con-ference on High Performance Computing (CLCAR), 2010, Gramado, RS.
13. CRUZ, E. H. M., ALVES, M. A. Z., NAVAUX, P. O. A. Process Mapping Basedon Memory Access Traces. Symp. on Computing Systems (WSCAD-SCC), 2010,Petrópolis, RJ, p. 72-79

100

101
REFERENCES
ABELLA, J. et al. IATAC: a smart predictor to turn-off l 2 cache lines. ACM Transac-tions on Architecture and Code Optimization (TACO), [S.l.], v.2, n.1, p.55–77, 2005.
AGARWAL, V. et al. Clock rate versus IPC: the end of the road for conventional microar-chitectures. ACM SIGARCH Computer Architecture News, [S.l.], v.28, n.2, p.248–259, 2000.
ALVES, M. et al. Energy Savings via Dead Sub-Block Prediction. In: IEEE INT. SYMP.ON COMPUTER ARCHITECTURE AND HIGH PERFORMANCE COMPUTING.Proceedings. . . IEEE, 2012. p.51–58. (SBAC-PAD’12).
ALVES, M. et al. Energy Efficient Last Level Caches via Last Read/Write Prediction. In:IEEE INT. SYMP. ON COMPUTER ARCHITECTURE AND HIGH PERFORMANCECOMPUTING. Proceedings. . . IEEE, 2013. p.73–80. (SBAC-PAD’13).
ARGOLLO, E. et al. COTSon: infrastructure for full system simulation. ACM SIGOPSOperating Systems Review, [S.l.], v.43, n.1, p.52–61, 2009.
AUSTIN, T.; LARSON, E.; ERNST, D. SimpleScalar: an infrastructure for computersystem modeling. IEEE Micro, [S.l.], v.35, n.2, p.59–67, 2002.
BAER, J.-L.; CHEN, T.-F. An effective on-chip preloading scheme to reduce data accesspenalty. In: ACM/IEEE CONF. ON SUPERCOMPUTING. Proceedings. . . ACM, 1991.p.176–186. (SC’91).
BAILEY, D. H. et al. The nas parallel benchmarks. [S.l.]: The International Journal ofSupercomputer Applications, 1991.
BELLARD, F. QEMU, a Fast and Portable Dynamic Translator. In: USENIX ANNUALTECHNICAL CONFERENCE, FREENIX TRACK. Anais. . . [S.l.: s.n.], 2005. p.41–46.
BERTOZZI, D. et al. NoC synthesis flow for customized domain specific multiprocessorsystems-on-chip. IEEE Transactions on Parallel and Distributed Systems, [S.l.], v.16,n.2, p.113–129, 2005.
BINKERT, N. et al. The M5 simulator: modeling networked systems. IEEE Micro, [S.l.],v.26, n.4, p.52–60, 2006.
BINKERT, N. et al. The gem5 simulator. ACM SIGARCH Computer ArchitectureNews, [S.l.], v.39, n.2, p.1–7, 2011.

102
BJERREGAARD, T.; MAHADEVAN, S. A survey of research and practices of network-on-chip. ACM Computing Surveys (CSUR), [S.l.], v.38, n.1, p.1, 2006.
BOJAN, T. et al. Functional coverage measurements and results in post-Silicon valida-tion of Core 2 duo family. In: INT. HIGH LEVEL DESIGN VALIDATION AND TESTWORKSHOP. Anais. . . IEEE, 2007. p.145–150. (HLVDT’07).
BORKAR, S. Design challenges of technology scaling. IEEE Micro, [S.l.], v.19, n.4,p.23–29, 1999.
BUTKO, A. et al. Accuracy evaluation of GEM5 simulator system. In: RECONFIG-URABLE COMMUNICATION-CENTRIC SYSTEMS-ON-CHIP (RECOSOC), 20127TH INTERNATIONAL WORKSHOP ON. Anais. . . [S.l.: s.n.], 2012. p.1–7.
CHEN, C. F. et al. Accurate and complexity-effective spatial pattern prediction. In: IEEEINT. SYMP. ON HIGH PERFORMANCE COMPUTER ARCHITECTURE. Proceed-ings. . . IEEE, 2004. p.276–287. (HPCA’04).
DESIKAN, R.; BURGER, D.; KECKLER, S. Measuring experimental error in micro-processor simulation. In: IEEE/ACM INT. SYMP. ON COMPUTER ARCHITECTURE.Proceedings. . . IEEE, 2001. p.266–277. (ISCA’01).
DOWECK, J. White Paper Inside Intel R� Core R� Microarchitecture and Smart MemoryAccess. Intel Corporation, [S.l.], 2006.
FLEMING, P. J.; WALLACE, J. J. How Not to Lie with Statistics: the correct way tosummarize benchmark results. Commun. ACM, New York, NY, USA, v.29, n.3, p.218–221, Mar. 1986.
HENNESSY, J. L.; PATTERSON, D. A. Computer Architecture: a quantitative ap-proach. 4th.ed. USA: Elsevier, 2007.
HENNING, J. L. SPEC CPU2006 benchmark descriptions. ACM SIGARCH ComputerArchitecture News, [S.l.], v.34, n.4, p.1–17, 2006.
HUANG, M. et al. L1 data cache decomposition for energy efficiency. In: ACM INT.SYMP. ON LOW POWER ELECTRONICS AND DESIGN. Proceedings. . . [S.l.: s.n.],2001. p.10–15. (ISPLED’01).
IBM. System/370 model 155 theory of operation/diagrams manual v. 5: buffer controlunit. Poughkeepsie, N.Y.: IBM System Products Division, 1974.
INTEL. Intel Performance Counter Monitor - A better way to measure CPU utiliza-tion. 2012.
INTEL. Intel 64 and IA-32 Architectures Software Developer’s Manual. 2013.n.September.
JAIN, R. The art of computer systems performance analysis: techniques for experi-mental design, measurement, simulation, and modeling. USA: J. Wiley, 1991.
JOUPPI, N. P. Improving direct-mapped cache performance by the addition of a smallfully-associative cache and prefetch buffers. In: ACM SIGARCH COMPUTER ARCHI-TECTURE NEWS. Proceedings. . . ACM, 1990. n.3a, p.364–373. (SIGARCH’90, v.18).

103
KAXIRAS, S.; HU, Z.; MARTONOSI, M. Cache decay: exploiting generational behaviorto reduce cache leakage power. In: IEEE/ACM INT. SYMP. ON COMPUTER ARCHI-TECTURE. Proceedings. . . IEEE, 2001. p.240–251. (ISCA’01).
KHAN, S. et al. Using dead blocks as a virtual victim cache. In: IEEE/ACM INT. CONF.ON PARALLEL ARCHITECTURES AND COMPILATION TECHNIQUES. Proceed-ings. . . ACM, 2010. p.489–500. (PACT’10).
KHARBUTLI, M.; SOLIHIN, Y. Counter-based cache replacement and bypassing algo-rithms. IEEE Transactions on Computers (TC), [S.l.], v.57, n.4, p.433–447, 2008.
KIM, C.; BURGER, D.; KECKLER, S. Q. An adaptive, non-uniform cache structure forwire-delay dominated on-chip-caches. In: INT. CONF. ON ARCHITECTURAL SUP-PORT FOR PROGRAMMING LANGUAGES AND OPERATING SYSTEMS. Pro-ceedings. . . IEEE, 2002. p.211–222.
KIM, C.; BURGER, D.; KECKLER, S. W. Non-Uniform Cache Architetures for Wire-Delay Dominated On-Chip Caches. IEEE Computer, [S.l.], 2003.
KIM, H.; GRATZ, P. V. Leveraging Unused Cache Block Words to Reduce Power inCMP Interconnect. IEEE Computer Architecture Letters (CAL), [S.l.], v.9, n.1, p.33–36, 2010.
KUMAR, S.; WILKERSON, C. Exploiting spatial locality in data caches using spa-tial footprints. In: ACM SIGARCH COMPUTER ARCHITECTURE NEWS. Proceed-ings. . . ACM, 1998. v.26, p.357–368.
LAI, A.-C.; FALSAFI, B. Selective, accurate, and timely self-invalidation using last-touch prediction. In: IEEE/ACM INT. SYMP. ON COMPUTER ARCHITECTURE. Pro-ceedings. . . IEEE, 2000. p.139–148. (ISCA’00).
LAI, A.-C.; FIDE, C.; FALSAFI, B. Dead-block prediction & dead-block correlatingprefetchers. In: IEEE/ACM INT. SYMP. ON COMPUTER ARCHITECTURE. Proceed-ings. . . IEEE, 2001. p.144–154. (ISCA’01).
LEE, H.; TYSON, G.; FARRENS, M. Eager writeback-a technique for improving band-width utilization. In: IEEE/ACM INT. SYMP. ON MICROARCHITECTURE. Proceed-ings. . . IEEE, 2000. p.11–21. (MICRO’00).
LI, S. et al. McPAT: an integrated power, area, and timing modeling framework for multi-core and manycore architectures. In: IEEE/ACM INT. SYMP. ON MICROARCHITEC-TURE. Proceedings. . . IEEE, 2009. p.469–480. (MICRO’09).
LI, S. et al. The McPAT Framework for Multicore and Manycore Architectures: simul-taneously modeling power, area, and timing. ACM Transactions on Architecture andCode Optimization (TACO), [S.l.], v.10, n.1, p.5, 2013.
LINDNER, M. A. libconfig - C/C++ configuration file library. Available at:http://www.hyperrealm.com/libconfig/. Accessed on: 14-January-2013.
Linux Kernel Developers. Performance analysis tools for Linux. Available at:https://perf.wiki.kernel.org. Accessed on: 14-January-2013.

104
LIU, Y. et al. Accurate temperature-dependent integrated circuit leakage power estima-tion is easy. In: EDA CONF. ON DESIGN, AUTOMATION AND TEST IN EUROPE.Proceedings. . . EDA Consortium, 2007. p.1526–1531. (DATE’07).
MAGNUSSON, P. et al. Simics: a full system simulation platform. IEEE Micro, [S.l.],v.35, n.2, p.50–58, Feb 2002.
MARTY, M. et al. General Execution-driven Multiprocessor Simulator. In: ISCA TUTO-RIAL. Proceedings. . . IEEE, 2005. (ISCA’05).
MURALIMANOHAR, N.; BALASUBRAMONIAN, R.; JOUPPI, N. Architecting ef-ficient interconnects for large caches with CACTI 6.0. IEEE Micro, [S.l.], v.28, n.1,p.69–79, 2008.
OLUKOTUN, K. et al. The Case for a Single-Chip Multiprocessor. In: IEEE INT. SYMP.ON ARCHITECTURAL SUPPORT FOR PROGRAMMING LANGUAGES AND OP-ERATING SYSTEMS. Proceedings. . . IEEE, 1996. p.2–11. (ASPLOS’96).
PATEL, A. et al. MARSSx86: a full system simulator for x86 cpus. In: DESIGN AU-TOMATION CONFERENCE. Proceedings. . . ACM, 2011. p.261–305. (DAC’11).
PATIL, H. et al. Pinpointing Representative Portions of Large Intel R� Itanium R� Programswith Dynamic Instrumentation. In: IEEE/ACM INT. SYMP. ON MICROARCHITEC-TURE. Proceedings. . . IEEE, 2004. p.81–92. (MICRO’04).
POWELL, M. et al. Gated-VDD: a circuit technique to reduce leakage in deep-submicroncache memories. In: ACM INT. SYMP. ON LOW POWER ELECTRONICS AND DE-SIGN. Proceedings. . . ACM, 2000. p.90–95. (ISPLED’00).
PUJARA, P.; AGGARWAL, A. Cache noise prediction. IEEE Transactions on Comput-ers (TC), [S.l.], v.57, n.10, p.1372–1386, 2008.
RENAU, J. et al. SESC simulator. Available at: http://sesc.sourceforge.net. Accessed on:10-January-2013.
SAITO, H. et al. Large system performance of SPEC OMP2001 benchmarks. In: INT.SYMP. ON HIGH PERFORMANCE COMPUTING. Anais. . . [S.l.: s.n.], 2006. p.370–379. (ISHPC’06).
Semiconductor Industry Association. Model for assessment of CMOS technologies androadmaps (MASTAR). Semiconductor Industry Association, [S.l.], 2007.
SHERWOOD, T. et al. Automatically characterizing large scale program behavior. In:ACM SIGARCH COMPUTER ARCHITECTURE NEWS. Proceedings. . . ACM, 2002.n.5, p.45–57. (SIGARCH’02, v.30).
SHERWOOD, T.; PERELMAN, E.; CALDER, B. Basic block distribution analysis tofind periodic behavior and simulation points in applications. In: PARALLEL ARCHI-TECTURES AND COMPILATION TECHNIQUES, 2001. PROCEEDINGS. 2001 IN-TERNATIONAL CONFERENCE ON. Anais. . . [S.l.: s.n.], 2001. p.3–14.
SMITH, J. E.; SOHI, G. S. The Microarchitecture of Superscalar Processors. IEEE Mi-cro, [S.l.], v.83, n.12, p.1609–1624, 1995.
105
STUECHELI, J. et al. The virtual write queue: coordinating dram and last-level cachepolicies. In: IEEE/ACM INT. SYMP. ON COMPUTER ARCHITECTURE. Proceed-ings. . . IEEE, 2010. p.72–82. (ISCA’10).
UBAL, R. et al. Multi2Sim: a simulation framework to evaluate multicore-multithreadprocessors. In: IEEE 19TH INTERNATIONAL SYMPOSIUM ON COMPUTER AR-CHITECTURE AND HIGH PERFORMANCE COMPUTING, PAGE (S). Anais. . .[S.l.: s.n.], 2007. p.62–68.
UBAL, R. et al. Multi2Sim: a simulation framework for cpu-gpu computing. In: INT.CONFERENCE ON PARALLEL ARCHITECTURES AND COMPILATION TECH-NIQUES. Proceedings. . . [S.l.: s.n.], 2012. p.335–344.
UNGERER, T.; ROBIC, B.; SILC, J. Multithreaded Processors. The Computer Journal,[S.l.], v.45, n.3, p.320–348, 2002.
WANG, Z.; KHAN, S. M.; JIMÉNEZ, D. A. Improving writeback efficiency with decou-pled last-write prediction. In: IEEE/ACM INT. SYMP. ON COMPUTER ARCHITEC-TURE. Proceedings. . . IEEE, 2012. p.309–320. (ISCA’12).
WANG, Z.; KHAN, S. M.; JIMÉNEZ, D. A. Rank idle time prediction drivenlast-level cache writeback. In: ACM SIGPLAN WORKSHOP ON MEMORY SYS-TEMS PERFORMANCE AND CORRECTNESS. Proceedings. . . ACM, 2012. p.21–29.(MSPC’12).
WEAVER, V.; MCKEE, S. Are cycle accurate simulations a waste of time. In: WORK-SHOP ON DUPLICATING, DECONSTRUCTING, AND DEBUNKING. Proceed-ings. . . [S.l.: s.n.], 2008. p.40–53.
YEH, T.-Y.; PATT, Y. N. Two-level adaptive training branch prediction. In: IEEE/ACMINT. SYMP. ON MICROARCHITECTURE. Proceedings. . . [S.l.: s.n.], 1991. p.51–61.(MICRO’91).
YEH, T.-Y.; PATT, Y. N. Alternative implementations of two-level adaptive branch pre-diction. In: ACM SIGARCH COMPUTER ARCHITECTURE NEWS. Proceedings. . .[S.l.: s.n.], 1992. n.2, p.124–134. (SIGARCH’92, v.20).
YOON, D. H.; JEONG, M. K.; EREZ, M. Adaptive granularity memory systems: a trade-off between storage efficiency and throughput. In: IEEE/ACM INT. SYMP. ON COM-PUTER ARCHITECTURE. Proceedings. . . IEEE, 2011. p.295–306. (ISCA’11).
YOURST, M. PTLsim: a cycle accurate full system x86-64 microarchitectural simula-tor. In: IEEE INT. SYMP. ON PERFORMANCE ANALYSIS OF SYSTEMS & SOFT-WARE. Proceedings. . . IEEE, 2007. p.23–34. (ISPASS’07).
YUFFE, M. et al. A fully integrated multi-CPU, GPU and memory controller 32nm pro-cessor. In: INT. SOLID-STATE CIRCUITS CONFERENCE DIGEST OF TECHNICALPAPERS. Anais. . . IEEE, 2011. p.264–266. (ISSCC’11).

106
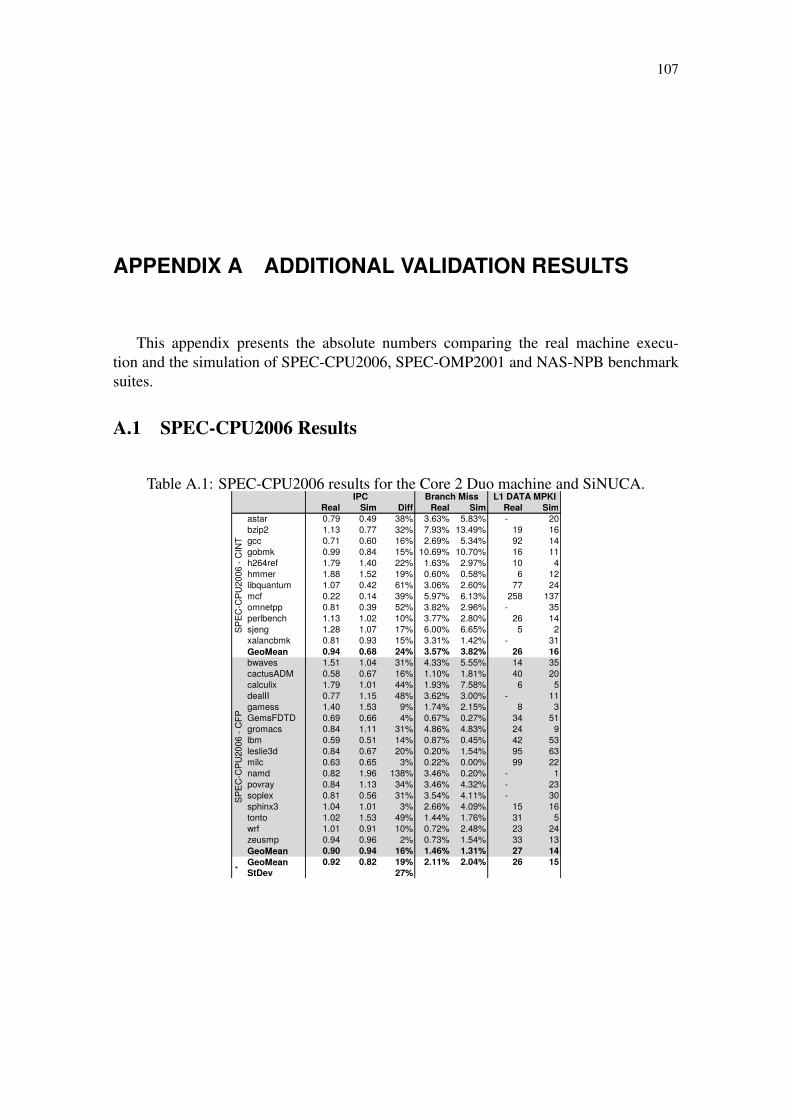
107
APPENDIX A ADDITIONAL VALIDATION RESULTS
This appendix presents the absolute numbers comparing the real machine execu-tion and the simulation of SPEC-CPU2006, SPEC-OMP2001 and NAS-NPB benchmarksuites.
A.1 SPEC-CPU2006 Results
Table A.1: SPEC-CPU2006 results for the Core 2 Duo machine and SiNUCA.Real Sim Diff Real Sim Real Sim
astar 0.79 0.49 38% 3.63% 5.83% - 20bzip2 1.13 0.77 32% 7.93% 13.49% 19 16gcc 0.71 0.60 16% 2.69% 5.34% 92 14gobmk 0.99 0.84 15% 10.69% 10.70% 16 11h264ref 1.79 1.40 22% 1.63% 2.97% 10 4hmmer 1.88 1.52 19% 0.60% 0.58% 6 12libquantum 1.07 0.42 61% 3.06% 2.60% 77 24mcf 0.22 0.14 39% 5.97% 6.13% 258 137omnetpp 0.81 0.39 52% 3.82% 2.96% - 35perlbench 1.13 1.02 10% 3.77% 2.80% 26 14sjeng 1.28 1.07 17% 6.00% 6.65% 5 2xalancbmk 0.81 0.93 15% 3.31% 1.42% - 31GeoMean 0.94 0.68 24% 3.57% 3.82% 26 16bwaves 1.51 1.04 31% 4.33% 5.55% 14 35cactusADM 0.58 0.67 16% 1.10% 1.81% 40 20calculix 1.79 1.01 44% 1.93% 7.58% 6 5dealII 0.77 1.15 48% 3.62% 3.00% - 11gamess 1.40 1.53 9% 1.74% 2.15% 8 3GemsFDTD 0.69 0.66 4% 0.67% 0.27% 34 51gromacs 0.84 1.11 31% 4.86% 4.83% 24 9lbm 0.59 0.51 14% 0.87% 0.45% 42 53leslie3d 0.84 0.67 20% 0.20% 1.54% 95 63milc 0.63 0.65 3% 0.22% 0.00% 99 22namd 0.82 1.96 138% 3.46% 0.20% - 1povray 0.84 1.13 34% 3.46% 4.32% - 23soplex 0.81 0.56 31% 3.54% 4.11% - 30sphinx3 1.04 1.01 3% 2.66% 4.09% 15 16tonto 1.02 1.53 49% 1.44% 1.76% 31 5wrf 1.01 0.91 10% 0.72% 2.48% 23 24zeusmp 0.94 0.96 2% 0.73% 1.54% 33 13GeoMean 0.90 0.94 16% 1.46% 1.31% 27 14GeoMean 0.92 0.82 19% 2.11% 2.04% 26 15StDev 27%
*
IPC Branch Miss L1 DATA MPKI
SPEC
-CPU
2006
- C
INT
SPEC
-CPU
2006
- C
FP

108
Table A.2: SPEC-CPU2006 results for the Sandy Bridge machine and SiNUCA.
Real Sim Diff Real Sim Real Simastar 0.85 0.84 1% 8.21% 5.42% 46 22bzip2 1.34 0.89 33% 7.05% 13.50% 18 17gcc 1.27 0.79 38% 0.78% 4.96% 49 19gobmk 1.17 0.86 26% 7.70% 10.35% 9 12h264ref 2.38 1.55 35% 1.35% 2.72% 5 7hmmer 1.92 1.54 20% 0.45% 0.59% 10 13libquantum 1.86 0.70 62% 0.19% 2.11% 33 90mcf 0.32 0.33 5% 5.16% 5.96% 201 201omnetpp 0.73 0.81 12% 1.51% 2.99% 50 40perlbench 1.34 1.06 21% 2.56% 2.60% 18 16sjeng 1.47 1.14 23% 3.96% 6.37% 4 2xalancbmk 1.52 1.24 19% 0.49% 1.34% 33 64GeoMean 1.21 0.92 17% 1.85% 3.62% 22 22bwaves 2.09 1.41 33% 1.48% 5.40% 16 35cactusADM 1.04 1.03 1% 1.00% 1.76% 33 18calculix 1.91 1.11 42% 1.51% 7.62% 7 6dealII 1.94 1.13 42% 1.07% 2.95% 18 20gamess 2.07 1.59 23% 1.12% 1.95% 7 4GemsFDTD 1.17 1.11 5% 0.60% 0.27% 55 55gromacs 1.29 1.09 15% 3.76% 4.87% 15 12lbm 1.41 1.44 2% 0.28% 0.45% 96 71leslie3d 1.49 1.44 4% 1.21% 1.54% 55 109milc 0.87 1.28 46% 0.08% 0.00% 36 60namd 1.81 1.94 7% 3.44% 0.19% 12 1povray 1.75 1.08 38% 1.65% 3.81% 24 30soplex 1.24 0.97 22% 2.68% 3.84% 36 73sphinx3 1.91 2.10 10% 2.24% 4.03% 19 22tonto 1.74 1.55 11% 0.56% 1.71% 18 11wrf 1.48 1.55 5% 0.45% 2.47% 25 37zeusmp 1.30 1.29 1% 0.64% 1.41% 39 14GeoMean 1.51 1.33 10% 0.99% 1.27% 24 20GeoMean 1.38 1.14 12% 1.29% 1.96% 23 21StDev 16%
*
IPC Branch Miss L1 DATA MPKI
SPEC
-CPU
2006
- C
INT
SPEC
-CPU
2006
- C
FP

109
A.2 SPEC-OMP2001 Results
Table A.3: SPEC-OMP2001 results for the Core 2 Duo machine and SiNUCA.Real Sim Diff Real Sim Real Sim Real Sim Diff
applu.M 0.88 0.29 67% 0.00 0.00 73.92 86.82 1.00 1.00 0%apsi.M 1.12 0.94 16% 0.01 0.01 25.08 5.63 1.00 1.00 0%fma3d.M 0.64 0.15 77% 0.01 0.00 12.98 125.93 1.00 1.00 0%galgel.M 1.44 1.16 20% 0.00 0.01 73.27 20.38 1.00 1.00 0%mgrid.M 0.90 0.94 5% 0.00 0.01 11.01 18.85 1.00 1.00 0%swim.M 0.74 0.52 29% 0.00 0.00 56.21 51.73 1.00 1.00 0%wupwise.M 1.96 0.47 76% 0.01 0.00 16.44 28.35 1.00 1.00 0%GeoMean 1.02 0.52 29% 0.00 0.00 29.16 32.04 1.00 1.00 0%StDev 31% 0%applu.M 0.59 0.20 66% 0.00 0.00 75.65 165.36 1.34 1.39 4%apsi.M 1.05 0.91 14% 0.01 0.01 25.83 10.68 1.88 1.93 3%fma3d.M 0.58 0.10 83% 0.01 0.00 13.94 244.41 1.78 1.36 24%galgel.M 1.04 0.89 15% 0.00 0.01 87.62 48.45 1.42 1.53 7%mgrid.M 0.81 0.75 7% 0.00 0.01 14.39 36.46 1.82 1.61 11%swim.M 0.37 0.33 12% 0.00 0.00 72.26 103.90 1.00 1.25 25%wupwise.M 1.78 0.42 76% 0.01 0.00 17.49 53.84 1.81 1.82 0%GeoMean 0.79 0.40 26% 0.00 0.00 33.09 63.72 1.55 1.54 6%StDev 34% 10%
2 Th
read
sAverage IPC Branch Miss L1 DATA MPKI Speedup
1 Th
read
Table A.4: SPEC-OMP2001 results for the Sandy Bridge machine and SiNUCA.
Real Sim Diff Real Sim Real Sim Real Sim Diffapplu.M 1.40 0.78 44% 0.00 0.00 43.57 301.62 1.00 1.00 0%apsi.M 1.53 1.09 29% 0.00 0.01 19.68 12.30 1.00 1.00 0%fma3d.M 0.96 0.40 58% 0.01 0.00 10.68 221.38 1.00 1.00 0%galgel.M 1.95 2.10 8% 0.00 0.01 29.67 51.74 1.00 1.00 0%mgrid.M 1.35 1.20 11% 0.01 0.01 20.36 28.34 1.00 1.00 0%swim.M 1.26 1.16 8% 0.00 0.00 64.57 110.90 1.00 1.00 0%wupwise.M 2.49 0.89 64% 0.00 0.00 5.25 166.81 1.00 1.00 0%GeoMean 1.50 0.98 23% 0.00 0.00 21.12 80.70 1.00 1.00 0%StDev 24% 0%applu.M 1.10 0.66 40% 0.00 0.00 43.54 295.52 1.57 1.69 8%apsi.M 1.48 1.08 27% 0.00 0.01 19.54 12.26 1.93 1.99 3%fma3d.M 0.87 0.33 62% 0.01 0.00 10.53 219.40 1.81 1.63 10%galgel.M 1.88 1.62 14% 0.00 0.01 28.47 51.40 1.91 1.54 19%mgrid.M 1.30 1.17 10% 0.01 0.01 20.33 28.40 1.92 1.95 1%swim.M 0.68 0.94 38% 0.00 0.00 64.39 108.82 1.07 1.63 51%wupwise.M 2.36 0.66 72% 0.00 0.00 5.26 161.37 1.89 1.49 21%GeoMean 1.28 0.83 31% 0.00 0.00 20.92 79.67 1.70 1.69 10%StDev 23% 17%applu.M 0.63 0.48 23% 0.00 0.00 43.52 291.94 1.79 2.51 40%apsi.M 1.31 1.07 19% 0.00 0.01 19.94 12.32 3.42 3.93 15%fma3d.M 0.73 0.24 67% 0.01 0.00 10.26 217.66 3.03 2.40 21%galgel.M 1.58 1.10 30% 0.00 0.01 25.92 50.74 3.16 2.09 34%mgrid.M 1.14 1.12 2% 0.01 0.01 20.30 28.55 3.39 3.74 10%swim.M 0.34 0.81 141% 0.00 0.00 64.07 107.58 1.06 2.81 165%wupwise.M 2.09 0.64 69% 0.00 0.00 5.24 164.48 3.35 2.85 15%GeoMean 0.96 0.70 28% 0.00 0.00 20.60 79.50 2.55 2.84 27%StDev 47% 55%applu.M 0.33 0.31 4% 0.00 0.00 42.46 288.66 1.84 3.27 78%apsi.M 1.05 1.04 0% 0.00 0.01 19.91 11.95 5.46 7.75 42%fma3d.M 0.55 0.15 73% 0.01 0.00 9.70 215.34 4.55 2.97 35%galgel.M 0.67 0.72 6% 0.00 0.01 21.74 51.28 2.62 2.46 6%mgrid.M 0.59 0.89 50% 0.00 0.01 20.28 30.15 3.45 5.88 70%swim.M 0.17 0.47 175% 0.00 0.00 61.29 107.42 1.04 3.27 215%wupwise.M 1.63 0.47 71% 0.00 0.00 5.22 163.32 5.22 4.20 20%GeoMean 0.57 0.49 17% 0.00 0.00 19.71 79.55 3.01 3.95 41%StDev 62% 70%
8 Th
read
s
Average IPC Branch Miss L1 DATA MPKI Speedup
1 Th
read
2 Th
read
s
4 Th
read
s

110
A.3 NAS-NPB Results
Table A.5: NAS-NPB results for the Core 2 Duo machine and SiNUCA.Real Sim Diff Real Sim Real Sim Real Sim Diff
bt.A 1.63 1.03 37% 0.00 0.02 28.46 27.96 1.00 1.00 0%cg.A 1.57 0.84 46% 0.01 0.01 121.01 129.95 1.00 1.00 0%ft.A 1.53 1.25 18% 0.00 0.03 148.41 87.31 1.00 1.00 0%is.A 0.70 1.58 127% 0.00 0.00 28.22 20.52 1.00 1.00 0%lu.A 0.90 0.65 28% 0.00 0.01 55.66 55.00 1.00 1.00 0%mg.A 1.41 0.89 37% 0.00 0.01 35.74 20.28 1.00 1.00 0%sp.A 1.24 0.81 35% 0.00 0.01 46.79 36.67 1.00 1.00 0%GeoMean 1.23 0.97 39% 0.00 0.01 54.02 42.87 1.00 1.00 0%StDev 36% 0%bt.A 1.44 0.98 32% 0.00 0.02 30.54 55.69 1.76 1.90 8%cg.A 1.14 0.48 58% 0.01 0.01 125.92 227.65 1.44 1.13 21%ft.A 1.21 1.15 5% 0.00 0.03 147.86 165.43 1.59 1.84 16%is.A 0.65 1.27 96% 0.00 0.00 30.55 37.33 1.89 1.61 15%lu.A 0.67 0.51 24% 0.00 0.01 58.02 102.25 1.48 1.49 1%mg.A 0.92 0.60 35% 0.00 0.01 64.41 41.70 1.33 1.36 2%sp.A 0.82 0.61 26% 0.00 0.01 57.51 71.88 1.33 1.52 14%GeoMean 0.94 0.75 30% 0.00 0.01 62.52 81.55 1.53 1.53 7%StDev 29% 8%
2 Th
read
sAverage IPC Branch Miss L1 DATA MPKI Speedup
1 Th
read
Table A.6: NAS-NPB results for the Sandy Bridge machine and SiNUCA.
Real Sim Diff Real Sim Real Sim Real Sim Diffbt.A 2.16 1.27 41% 0.00 0.02 28.81 35.20 1.00 1.00 0%cg.A 1.89 1.54 19% 0.01 0.01 71.23 216.59 1.00 1.00 0%ft.A 2.33 1.96 16% 0.00 0.03 54.02 153.26 1.00 1.00 0%is.A 0.82 1.94 135% 0.00 0.00 35.87 22.76 1.00 1.00 0%lu.A 1.69 1.57 7% 0.01 0.01 33.83 55.69 1.00 1.00 0%mg.A 2.29 1.40 39% 0.00 0.01 28.08 29.53 1.00 1.00 0%sp.A 1.76 1.45 18% 0.00 0.01 43.57 58.96 1.00 1.00 0%GeoMean 1.77 1.57 26% 0.00 0.01 40.03 59.30 1.00 1.00 0%StDev 44% 0%bt.A 2.11 1.26 40% 0.00 0.02 28.83 35.08 1.95 1.98 2%cg.A 2.11 1.45 31% 0.01 0.01 70.94 216.31 2.22 1.89 15%ft.A 2.13 1.93 9% 0.00 0.03 53.84 153.17 1.82 1.97 8%is.A 0.79 1.62 105% 0.00 0.00 36.90 26.42 1.92 1.67 13%lu.A 1.63 1.47 9% 0.01 0.01 33.77 53.77 1.93 1.80 6%mg.A 1.97 1.30 34% 0.00 0.01 27.92 31.28 1.71 1.86 8%sp.A 1.60 1.33 17% 0.00 0.01 43.57 59.57 1.81 1.83 1%GeoMean 1.68 1.47 25% 0.00 0.01 40.11 60.81 1.90 1.86 6%StDev 33% 5%bt.A 1.89 1.20 37% 0.00 0.02 27.92 35.11 3.49 3.77 8%cg.A 1.78 1.11 38% 0.01 0.01 70.49 217.95 3.74 2.89 23%ft.A 1.82 1.78 2% 0.00 0.03 53.58 153.61 3.11 3.63 17%is.A 0.77 1.64 113% 0.00 0.00 36.78 24.36 3.73 3.38 9%lu.A 1.47 1.28 13% 0.01 0.00 32.57 51.14 3.44 2.96 14%mg.A 1.17 1.24 6% 0.00 0.01 27.54 34.27 2.04 3.54 74%sp.A 1.16 1.21 4% 0.00 0.01 42.18 59.87 2.60 3.33 28%GeoMean 1.38 1.33 14% 0.00 0.01 39.37 60.61 3.10 3.34 19%StDev 39% 23%bt.A 1.59 1.00 37% 0.00 0.02 27.85 35.08 5.84 6.28 7%cg.A 1.08 0.78 28% 0.01 0.01 69.62 218.73 4.48 4.05 10%ft.A 1.29 1.37 6% 0.00 0.03 53.01 154.30 4.41 5.60 27%is.A 0.63 1.36 116% 0.00 0.00 36.07 25.40 6.07 5.61 8%lu.A 1.24 1.13 9% 0.00 0.00 32.23 45.74 5.79 4.68 19%mg.A 0.51 0.83 62% 0.00 0.01 26.71 49.54 1.77 4.74 167%sp.A 0.71 0.93 31% 0.00 0.01 41.69 60.90 3.15 5.13 63%GeoMean 0.94 1.03 28% 0.00 0.00 38.83 63.47 4.19 5.11 23%StDev 38% 58%
8 Th
read
s
Average IPC Branch Miss L1 DATA MPKI Speedup
1 Th
read
2 Th
read
s4
Thre
ads
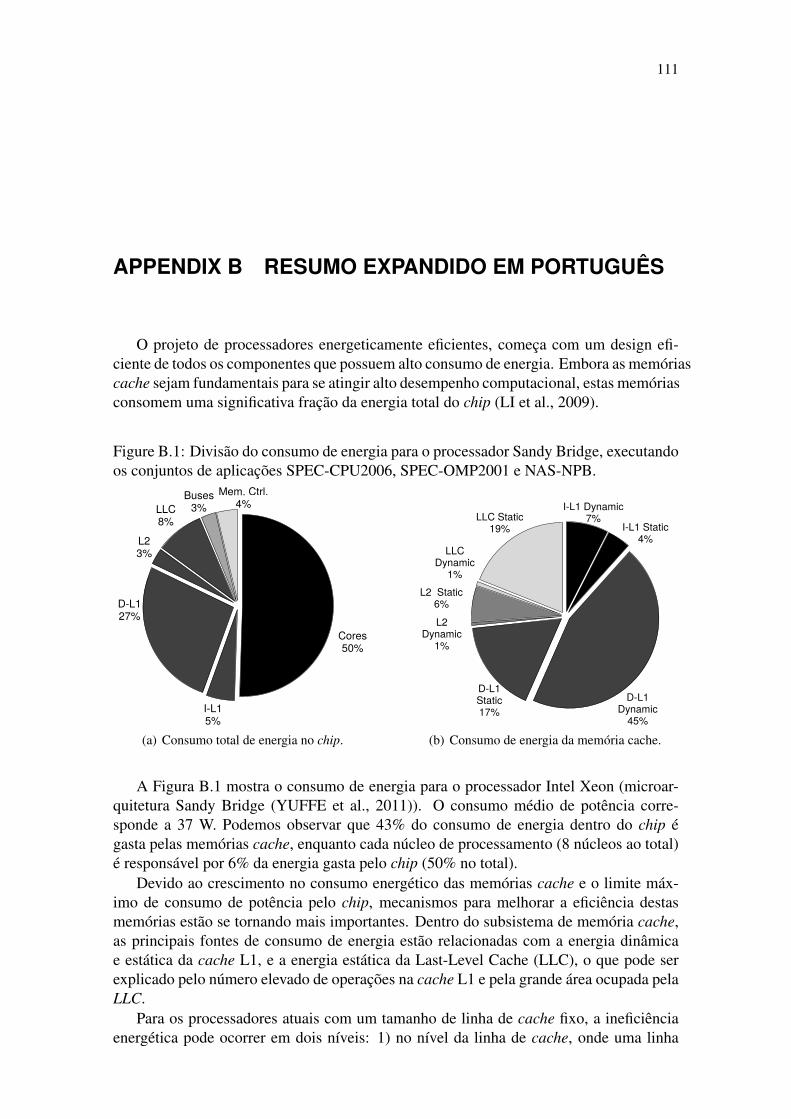
111
APPENDIX B RESUMO EXPANDIDO EM PORTUGUÊS
O projeto de processadores energeticamente eficientes, começa com um design efi-ciente de todos os componentes que possuem alto consumo de energia. Embora as memóriascache sejam fundamentais para se atingir alto desempenho computacional, estas memóriasconsomem uma significativa fração da energia total do chip (LI et al., 2009).
Figure B.1: Divisão do consumo de energia para o processador Sandy Bridge, executandoos conjuntos de aplicações SPEC-CPU2006, SPEC-OMP2001 e NAS-NPB.
Cores50%
I-L15%
D-L127%
L2 3%
LLC8%
Buses3%
Mem. Ctrl.4%
(a) Consumo total de energia no chip.
I-L1 Dynamic7%
I-L1 Static4%
D-L1 Dynamic
45%
D-L1 Static17%
L2 Dynamic
1%
L2 Static6%
LLC Dynamic
1%
LLC Static19%
(b) Consumo de energia da memória cache.
A Figura B.1 mostra o consumo de energia para o processador Intel Xeon (microar-quitetura Sandy Bridge (YUFFE et al., 2011)). O consumo médio de potência corre-sponde a 37 W. Podemos observar que 43% do consumo de energia dentro do chip égasta pelas memórias cache, enquanto cada núcleo de processamento (8 núcleos ao total)é responsável por 6% da energia gasta pelo chip (50% no total).
Devido ao crescimento no consumo energético das memórias cache e o limite máx-imo de consumo de potência pelo chip, mecanismos para melhorar a eficiência destasmemórias estão se tornando mais importantes. Dentro do subsistema de memória cache,as principais fontes de consumo de energia estão relacionadas com a energia dinâmicae estática da cache L1, e a energia estática da Last-Level Cache (LLC), o que pode serexplicado pelo número elevado de operações na cache L1 e pela grande área ocupada pelaLLC.
Para os processadores atuais com um tamanho de linha de cache fixo, a ineficiênciaenergética pode ocorrer em dois níveis: 1) no nível da linha de cache, onde uma linha

112
é mantida ligada (ativa) por muito mais tempo do que o necessário, e 2) no nível desub-bloco, quando partes de uma linha de cache que não serão usadas são trazidas paraa cache, e também quando sub-blocos vivos (isto é, ainda serão acessados) tornam-semortos (ou seja, não serão mais acessados) depois de alguns acessos, mas são mantidosativos até a linha ser removida da memória cache.
Além do impacto no consumo de energia, ao manter linhas que não serão mais us-adas (linhas mortas) dentro da cache, aumenta-se a poluição da cache e a contenção nocontrolador de memória. A poluição da cache aumenta quando a política de substituiçãotoma decisões erradas, removendo linhas vivas em vez de linhas já mortas. Esta poluiçãotambém pode aumentar o número de faltas de dados na cache, gerando assim impactonegativo sobre o desempenho do sistema. O problema de contenção no controlador dememória acontece quando a cache mantém linhas modificadas que já receberam a úl-tima escrita (não serão mais modificadas). Ao fazer isso, estas linhas sofrerão write-backpara o próximo nível de memória apenas quando a linha for removida da cache. No en-tanto, considerando que os acessos a memória ocorrerem em rajadas (WANG; KHAN;JIMÉNEZ, 2012a), as operações de write-back podem aumentar a pressão na memórianos momentos em que um grande conjunto de dados está sendo solicitados em um curtoespaço de tempo (rajadas de acessos).
O objetivo principal desta tese é introduzir mecanismos que possibilitem o aumentoda eficiência energética das memórias cache. Este objetivo será alcançado através dosseguintes passos:
• Propomos o Dead Sub-Block Predictor (DSBP) para prever em tempo de execução autilização da linha de cache em granularidade de sub-blocos. Este mecanismo seráusado para armazenar apenas o sub-blocos úteis dentro da linha de cache, desli-gando os sub-blocos ao se tornarem mortos.
• Propomos o Dead Line and Early Write-Back Predictor (DEWP) para detectarquando uma linha de cache recebe a sua última leitura e última escrita. Este pred-itor será utilizado para adiantar o write-back de linhas modificadas para assim queelas recebem sua última escrita, desligando também as linhas assim que receberemsua última leitura.
• Para avaliar os novos mecanismos propostos, desenvolvemos o Simulator of Non-Uniform Cache Architectures (SiNUCA), um novo simulador com precisão de ci-clos, orientado a traço de execução, composto pelos principais componentes: pro-cessador, memórias cache, interconexões e sistema de memória. Este simuladoré capaz de simular sistemas multi-core, com multi-banked cache e interconexõesNetwork-on-Chip (NoC). Este simulador é validado comparando com uma máquinareal em termos de desempenho e consumo de energia.
O objetivo geral desta tese é a concepção de mecanismos que permitam a economiade energia na memória cache, mantendo o desempenho do sistema no mesmo nível. Oscustos adicionais de tais mecanismos também serão avaliados, a fim de mostrar seus bene-fícios e possíveis desvantagens.
B.1 Simulator of Non-Uniform Cache Architecture (SiNUCA)
O simulador SiNUCA foi desenvolvido e validado em termos de desempenho e en-ergia. Alimentado por traços de execução e com precisão de ciclos, o simulador é capaz

113
de executar aplicações single-threaded e multi-threaded com alto nível de detalhes detodos os componentes do pipeline. Além disso, foi proposto um grande conjunto de mi-crobenchmarks a fim de correlacionar os resultados do simulador (desempenho e outrasestatísticas), com dados reais de duas plataformas x86.
O SiNUCA tem as seguintes características principais:
Alta precisão: O SiNUCA implementa componentes de arquitetura com um elevado grauprecisão, não apenas no pipeline de execução, mas também na hierarquia de memória einterconexão. O simulador também modela com precisão arquiteturas paralelas, tais comosistemas multi-core e sistemas multi-processados. A implementação foi feita utilizandoinformações disponíveis publicamente. Para as informações não disponíveis, microbench-marks foram utilizados para observar o comportamento dos componentes de uma máquinareal.
O SiNUCA foi validado com aplicações single-threaded e multi-threaded de nossosmicrobenchmarks e também de cargas de trabalho comerciais. Os resultados da simulaçãoforam comparados com as estatísticas obtidas de máquinas reais.
Modelo energético: O consumo de energia está se tornando cada vez mais importantepara arquiteturas de processadores. No entanto, a maioria dos simuladores atuais nãomodelam o consumo de energia, apenas o desempenho. Para avaliar o consumo de en-ergia, integramos a ferramenta Multi-core Power, Area, and Timing (McPAT) (LI et al.,2009, 2013), que utiliza as estatísticas geradas pelo SiNUCA. Estes resultados foram val-idados utilizando contadores de hardware de energia existentes na máquina real.
Suporte a técnicas emergentes: O SiNUCA é capaz de modelar várias tecnologias deponta, como Non-Uniform Cache Architecture (NUCA), Non-Uniform Memory Access(NUMA), NoC e controladores de memória Double Data Rate (DDR) 3. Além das técni-cas tradicionais, tais como prefetchers de cache, preditores de desvio e outros. O suportepara novas tecnologias é importante para a simulação de novo sistemas com precisão.
Flexibilidade: Outra característica importante para apoiar a pesquisa em arquitetura decomputadores é a facilidade de implementação ou extensão de funcionalidades no simu-lador. Este aspecto é fornecido pelo SiNUCA com uma arquitetura modular, escrita emC++, que fornece um acesso direto aos detalhes de funcionamento de todos os compo-nentes simulados. Outros simuladores são limitados por metalinguagens que não expõemtodas as funcionalidades da microarquitetura, tornando-se mais difícil para modelar novosmecanismos ou modificar os já existentes.
A validação do simulador mostrou uma diferença média no desempenho de 12%usando os microbenchmarks single-threaded e 26% para os multi-threaded ao simularuma máquina Core 2 Duo. Uma diferença média no desempenho de 6% para single-threaded e 29% para cargas de trabalho multi-threaded, quando simulando uma arquite-tura Sandy Bridge.
Considerando a modelagem de energia usando McPAT utilizando as estatísticas deexecução fornecidas pelo SiNUCA, obtemos uma diferença média de 18% para os mi-crobenchmarks single-threaded e 46% para multi-threaded ao modelar a arquitetura Sandy Bridge.
Os resultados referentes ao desempenho do simulador mostram que o SiNUCA per-mite arquitetos de computador avaliarem novas técnicas em um tempo razoável, simu-lando em média 270 kHz, equivalente a 250 Kilo Instructions per Second (KIPS).
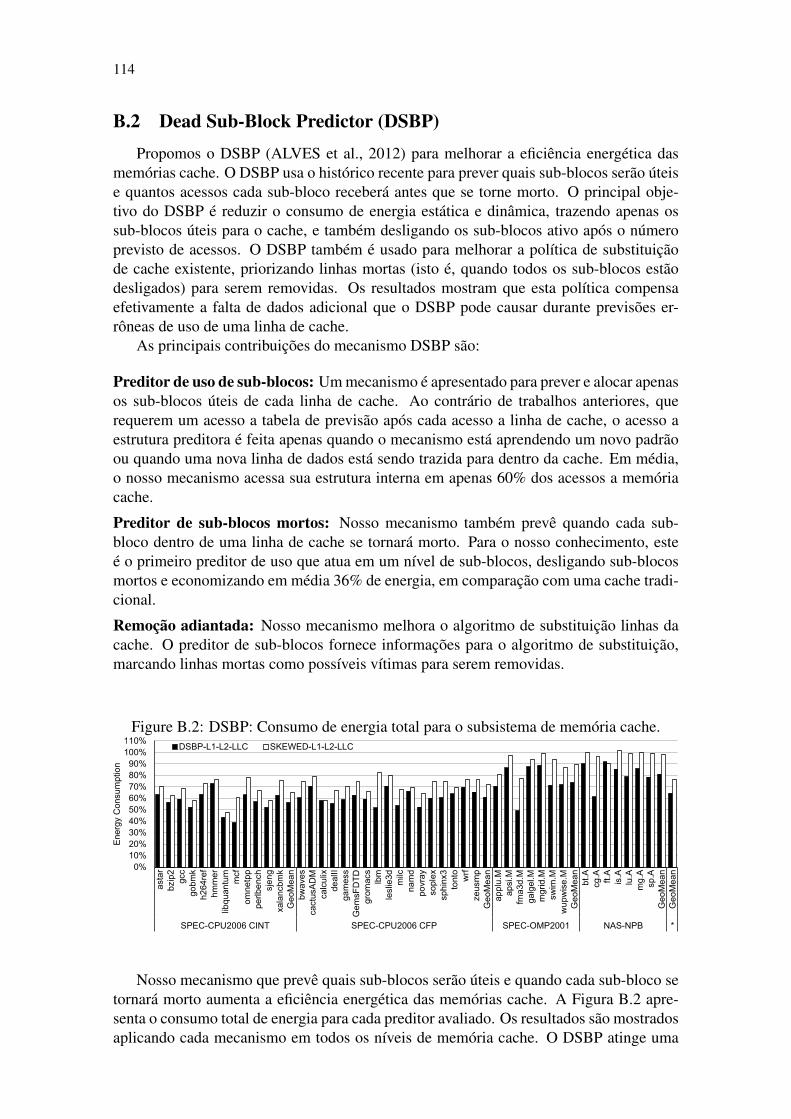
114
B.2 Dead Sub-Block Predictor (DSBP)
Propomos o DSBP (ALVES et al., 2012) para melhorar a eficiência energética dasmemórias cache. O DSBP usa o histórico recente para prever quais sub-blocos serão úteise quantos acessos cada sub-bloco receberá antes que se torne morto. O principal obje-tivo do DSBP é reduzir o consumo de energia estática e dinâmica, trazendo apenas ossub-blocos úteis para o cache, e também desligando os sub-blocos ativo após o númeroprevisto de acessos. O DSBP também é usado para melhorar a política de substituiçãode cache existente, priorizando linhas mortas (isto é, quando todos os sub-blocos estãodesligados) para serem removidas. Os resultados mostram que esta política compensaefetivamente a falta de dados adicional que o DSBP pode causar durante previsões er-rôneas de uso de uma linha de cache.
As principais contribuições do mecanismo DSBP são:
Preditor de uso de sub-blocos: Um mecanismo é apresentado para prever e alocar apenasos sub-blocos úteis de cada linha de cache. Ao contrário de trabalhos anteriores, querequerem um acesso a tabela de previsão após cada acesso a linha de cache, o acesso aestrutura preditora é feita apenas quando o mecanismo está aprendendo um novo padrãoou quando uma nova linha de dados está sendo trazida para dentro da cache. Em média,o nosso mecanismo acessa sua estrutura interna em apenas 60% dos acessos a memóriacache.
Preditor de sub-blocos mortos: Nosso mecanismo também prevê quando cada sub-bloco dentro de uma linha de cache se tornará morto. Para o nosso conhecimento, esteé o primeiro preditor de uso que atua em um nível de sub-blocos, desligando sub-blocosmortos e economizando em média 36% de energia, em comparação com uma cache tradi-cional.
Remoção adiantada: Nosso mecanismo melhora o algoritmo de substituição linhas dacache. O preditor de sub-blocos fornece informações para o algoritmo de substituição,marcando linhas mortas como possíveis vítimas para serem removidas.
Figure B.2: DSBP: Consumo de energia total para o subsistema de memória cache.
0%10%20%30%40%50%60%70%80%90%
100%110%
asta
rbz
ip2
gcc
gobm
kh2
64re
fhm
me
rlib
qua
ntu
mm
cfom
netp
ppe
rlbe
nch
sje
ngxa
lanc
bmk
Geo
Mea
nbw
aves
cact
usA
DM
calc
ulix
deal
IIga
mes
sG
emsF
DT
Dgr
omac
slb
mle
slie
3dm
ilcna
md
povr
ayso
plex
sphi
nx3
tont
ow
rfze
usm
pG
eoM
ean
appl
u.M
apsi
.Mfm
a3d
.Mga
lgel
.Mm
grid
.Msw
im.M
wu
pwis
e.M
Geo
Mea
nbt
.Acg
.Aft.
Ais
.Alu
.Am
g.A
sp.A
Geo
Mea
nG
eoM
ean
SPEC-CPU2006 CINT SPEC-CPU2006 CFP SPEC-OMP2001 NAS-NPB *
Ene
rgy
Con
sum
ptio
n
DSBP-L1-L2-LLC SKEWED-L1-L2-LLC
Nosso mecanismo que prevê quais sub-blocos serão úteis e quando cada sub-bloco setornará morto aumenta a eficiência energética das memórias cache. A Figura B.2 apre-senta o consumo total de energia para cada preditor avaliado. Os resultados são mostradosaplicando cada mecanismo em todos os níveis de memória cache. O DSBP atinge uma

115
economia média de energia de 36% para todos os níveis de memória cache, superando em27% os melhores resultados do trabalho correlato SKEWED.
Em geral, o DSBP requer um baixo tamanho de armazenamento para alcançar pre-visões precisas (61% previsões corretas e 10% dos previsões subestimadas). O DSBPconsegue uma redução média no consumo de energia de 36%, em comparação com a ar-quitetura base. O tempo de execução foi aumentado em 2,25% em média para aplicaçõessingle-threaded e multi-threaded. O DSBP alcança 64% do potencial de economia queum mecanismo perfeito (oráculo) é capaz de alcançar.
B.3 Dead Line and Early Write-Back Predictor (DEWP)
O mecanismo proposto DEWP (ALVES et al., 2013) é composto por um preditor deúltima leitura/escrita que trabalha na granularidade de linha de cache. O preditor de últimaleitura que visa economizar energia desligando linhas de cache mortas ou inválidas. Opreditor de última escrita que visa adiantar as operações de write-back em linhas de cachemodificadas, uma vez que estas linhas não serão mais modificadas. Utilizando ambospreditores de última leitura e última escrita o mecanismo é capaz de detectar quando umalinha recebe o seu último acesso, priorizando essas linhas para serem removidas da cache.
O preditor de última leitura usa o histórico de acessos para prever quando uma linhade cache se tornará morta, podendo assim ser desligada. A linha de cache é consideradamorta sempre que ela receber a sua última leitura antes de ser removida ou invalidada.
A previsão de última escrita permite adiantar o write-back das linhas de cache mod-ificadas, reduzindo a pressão sobre o controlador de memória entre leituras e escritasdurante rajadas de acessos. Além disso, a realização adiantada do write-back tambémpermite que essas linhas possam ser desligadas quando a última leitura for prevista.
Ambos preditores reduzem a poluição da cache, priorizando a remoção de linhas mor-tas. Todas as linhas de cache que normalmente seriam expulsas da memória cache pelapolítica de substituição são considerados mortas desde seu último acesso. Ao expulsarestas linhas, outras linhas de cache que ainda estão vivas podem permanecer por maistempo dentro da memória cache.
As principais contribuições do mecanismo DEWP são:
Preditor de última leitura: Capaz de desligar linhas de cache depois de receberem aúltima leitura antes que sejam removidas da cache. Isto se traduz em 25% de economiade energia da cache.
Preditor de última escrita: Nosso mecanismo pode adiantar as operações de write-backde linhas modificadas depois de receberem a última escrita. Aumentando a janela detempo para o write-back das linhas de cache, reduzindo assim a pressão no controladorde memória.
Preditor de último acesso: Combinando os resultados das duas previsões, o nosso mecan-ismo detecta o último acesso para cada linha, priorizando as linhas mortas para seremremovidas da cache, melhorando assim a utilização da cache. O preditor atinge 73% deprevisões de corretas com 14 % de falsos positivos em média para toda os níveis de cache.
A eficiência energética é aumentada usando nosso mecanismo que desliga linhas decache mortas ou invalidas. Os resultados da Figura B.3 apresenta o consumo total deenergia para cada preditor avaliado. Os resultados são obtidos ao aplicar cada mecanismoem todos os níveis de memória cache. O DEWP atinge uma economia média de energia
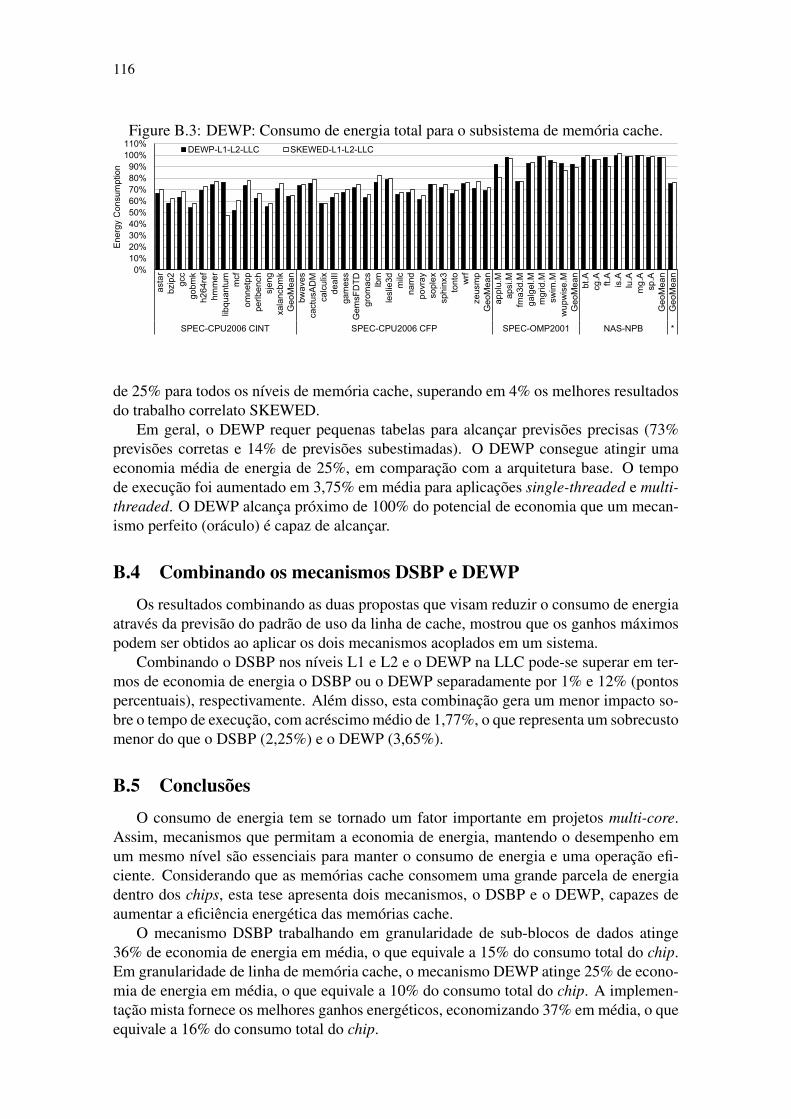
116
Figure B.3: DEWP: Consumo de energia total para o subsistema de memória cache.
0%10%20%30%40%50%60%70%80%90%
100%110%
asta
rbz
ip2
gcc
gobm
kh2
64re
fhm
me
rlib
qua
ntu
mm
cfom
netp
ppe
rlbe
nch
sje
ngxa
lanc
bmk
Geo
Mea
nbw
aves
cact
usA
DM
calc
ulix
deal
IIga
mes
sG
emsF
DT
Dgr
omac
slb
mle
slie
3dm
ilcna
md
povr
ayso
plex
sphi
nx3
tont
ow
rfze
usm
pG
eoM
ean
appl
u.M
apsi
.Mfm
a3d
.Mga
lgel
.Mm
grid
.Msw
im.M
wu
pwis
e.M
Geo
Mea
nbt
.Acg
.A ft.A
is.A
lu.A
mg
.Asp
.AG
eoM
ean
Geo
Mea
n
SPEC-CPU2006 CINT SPEC-CPU2006 CFP SPEC-OMP2001 NAS-NPB *
Ene
rgy
Con
sum
ptio
n
DEWP-L1-L2-LLC SKEWED-L1-L2-LLC
de 25% para todos os níveis de memória cache, superando em 4% os melhores resultadosdo trabalho correlato SKEWED.
Em geral, o DEWP requer pequenas tabelas para alcançar previsões precisas (73%previsões corretas e 14% de previsões subestimadas). O DEWP consegue atingir umaeconomia média de energia de 25%, em comparação com a arquitetura base. O tempode execução foi aumentado em 3,75% em média para aplicações single-threaded e multi-threaded. O DEWP alcança próximo de 100% do potencial de economia que um mecan-ismo perfeito (oráculo) é capaz de alcançar.
B.4 Combinando os mecanismos DSBP e DEWP
Os resultados combinando as duas propostas que visam reduzir o consumo de energiaatravés da previsão do padrão de uso da linha de cache, mostrou que os ganhos máximospodem ser obtidos ao aplicar os dois mecanismos acoplados em um sistema.
Combinando o DSBP nos níveis L1 e L2 e o DEWP na LLC pode-se superar em ter-mos de economia de energia o DSBP ou o DEWP separadamente por 1% e 12% (pontospercentuais), respectivamente. Além disso, esta combinação gera um menor impacto so-bre o tempo de execução, com acréscimo médio de 1,77%, o que representa um sobrecustomenor do que o DSBP (2,25%) e o DEWP (3,65%).
B.5 Conclusões
O consumo de energia tem se tornado um fator importante em projetos multi-core.Assim, mecanismos que permitam a economia de energia, mantendo o desempenho emum mesmo nível são essenciais para manter o consumo de energia e uma operação efi-ciente. Considerando que as memórias cache consomem uma grande parcela de energiadentro dos chips, esta tese apresenta dois mecanismos, o DSBP e o DEWP, capazes deaumentar a eficiência energética das memórias cache.
O mecanismo DSBP trabalhando em granularidade de sub-blocos de dados atinge36% de economia de energia em média, o que equivale a 15% do consumo total do chip.Em granularidade de linha de memória cache, o mecanismo DEWP atinge 25% de econo-mia de energia em média, o que equivale a 10% do consumo total do chip. A implemen-tação mista fornece os melhores ganhos energéticos, economizando 37% em média, o queequivale a 16% do consumo total do chip.