
Increased frequency of flash floods in Dire Dawa, Ethiopia: Change in rainfall intensity or human...
22
ORIGINAL PAPER Increased frequency of flash floods in Dire Dawa, Ethiopia: Change in rainfall intensity or human impact? Paolo Billi • Yonas Tadesse Alemu • Rossano Ciampalini Received: 3 July 2014 / Accepted: 8 December 2014 / Published online: 14 December 2014 Ó Springer Science+Business Media Dordrecht 2014 Abstract In the first decade of the twenty-first century, Ethiopia has been subjected to an increased frequency of flash floods, especially in the town of Dire Dawa. The results of international organizations studies point to no evidence of a climate-driven change in the magnitude/frequency of floods, though increases in runoff and risk of floods in East Africa are expected. Flash floods are posing constraints to the economic growth and the devel- opment process of a low-income country such as Ethiopia, and, in order to mitigate such hazard, it is crucial to understand the relative roles of two main factors: rainfall intensity and land use change. This study analyses the recent trends of rainfall intensity across Ethiopia and investigates the relative role of rainfall intensity and land use change in augmenting the frequency of flash flooding of the town of Dire Dawa by the Dechatu River. Results indicate that the increase in rainfall intensity is a more important factor than land use change in controlling the increased frequency of flash flood in Dire Dawa. Keywords Flash flood Rainfall intensity Climate change Land use change Ethiopia 1 Introduction Ethiopia is a country with great geographic diversity. Much of its land consists of a large plateau at an elevation higher than 2,500 m a.s.l. with high mountains and deep gorges, P. Billi (&) Dipartimento di Fisica e Scienze della Terra, Universita ` di Ferrara, Via G. Saragat 1, 44122 Ferrara, Italy e-mail: [email protected] Y. T. Alemu Department of Geography, University of Dire Dawa, P.O. Box 1362, Dire Dawa, Ethiopia R. Ciampalini School of Earth and Ocean Sciences, University of Cardiff, Park Place, Cardiff CF10 3AT, UK 123 Nat Hazards (2015) 76:1373–1394 DOI 10.1007/s11069-014-1554-0
-
Upload
eduter-recherche -
Category
Documents
-
view
0 -
download
0
Transcript of Increased frequency of flash floods in Dire Dawa, Ethiopia: Change in rainfall intensity or human...

ORI GIN AL PA PER
Increased frequency of flash floods in Dire Dawa,Ethiopia: Change in rainfall intensity or human impact?
Paolo Billi • Yonas Tadesse Alemu • Rossano Ciampalini
Received: 3 July 2014 / Accepted: 8 December 2014 / Published online: 14 December 2014� Springer Science+Business Media Dordrecht 2014
Abstract In the first decade of the twenty-first century, Ethiopia has been subjected to an
increased frequency of flash floods, especially in the town of Dire Dawa. The results of
international organizations studies point to no evidence of a climate-driven change in the
magnitude/frequency of floods, though increases in runoff and risk of floods in East Africa
are expected. Flash floods are posing constraints to the economic growth and the devel-
opment process of a low-income country such as Ethiopia, and, in order to mitigate such
hazard, it is crucial to understand the relative roles of two main factors: rainfall intensity
and land use change. This study analyses the recent trends of rainfall intensity across
Ethiopia and investigates the relative role of rainfall intensity and land use change in
augmenting the frequency of flash flooding of the town of Dire Dawa by the Dechatu
River. Results indicate that the increase in rainfall intensity is a more important factor than
land use change in controlling the increased frequency of flash flood in Dire Dawa.
Keywords Flash flood � Rainfall intensity � Climate change � Land use change � Ethiopia
1 Introduction
Ethiopia is a country with great geographic diversity. Much of its land consists of a large
plateau at an elevation higher than 2,500 m a.s.l. with high mountains and deep gorges,
P. Billi (&)Dipartimento di Fisica e Scienze della Terra, Universita di Ferrara, Via G. Saragat 1,44122 Ferrara, Italye-mail: [email protected]
Y. T. AlemuDepartment of Geography, University of Dire Dawa, P.O. Box 1362, Dire Dawa, Ethiopia
R. CiampaliniSchool of Earth and Ocean Sciences, University of Cardiff, Park Place, Cardiff CF10 3AT, UK
123
Nat Hazards (2015) 76:1373–1394DOI 10.1007/s11069-014-1554-0

river valleys, and lowland plains. The rainy season in Ethiopia is concentrated in the
4 months between mid-June and mid-October when about 80 % of the annual precipitation
is received as torrential downpours. Ethiopia’s topographic and climatic characteristics
have made the country vulnerable to high floods that resulted in destruction, casualties and
damages to economic, livelihoods, infrastructure, services, and health systems.
In Ethiopia, flood disasters and the toll paid in terms of human lives and property
damage show an increasing trend (Fig. 1) (Alemu 2009; Adhikari et al. 2010).
Flash floods are formed from excess rain falling on upstream watersheds, flow down-
stream with massive concentration, high speed, and typically occur suddenly (Lin 1999).
Heavy downpours in mountainous highlands can lead to surges of water that turn dry river
beds or flood plains into raging torrents in minutes. Therefore, the damages of such floods
become particularly pronounced and devastating when they pass across or along human
settlements and infrastructures.
According to IPCC (2012), the second half of the twentieth century is dominated by
inter-annual to inter-decadal rainfall variations and many statistics indicate that trend
estimates are spatially incoherent (Manton et al. 2001; Peterson et al. 2002; Griffiths et al.
2003; Herath and Ratnayake 2004). Moreover, Alexander et al. (2006) highlighted that,
though statistically significant trends toward stronger precipitation extremes were generally
found, the observed changes in precipitation extremes are much less spatially coherent and
statistically significant compared with observed changes in temperature extremes. Recent
studies (IPCC 2012) show rather an increase than a decrease in extreme precipitation, but
there are also wide regional and seasonal variations and trends in many regions that are not
statistically significant.
If for East Africa, this is due to a lack of the literature on changes in heavy precipitation
(IPCC 2012), the same is patent in Ethiopia for the same reason, though Easterling et al.
(2000) and Seleshi and Camberlin (2006) report decreasing trends in heavy precipitation
over parts of Ethiopia during the period 1965–2002.
The literature on the impact of climate change on river floods (including also flash
floods) is scarce, even though the changes in heavy precipitation discussed above may
imply flood changes in some regions (IPCC 2012).
0
20
40
60
80
100
120
140
0
100
200
300
400
500
600
700
1981
1983
1985
1987
1989
1991
1993
1995
1997
1999
2001
2003
2006
2010
Affec
red
peop
le (x
103 )
Fata
li�es
Fatali�es Affected people
Fig. 1 Fatalities and people affected by floods in Ethiopia between 1981 and 2010 (Alemu 2009; EM-DAT2014)
1374 Nat Hazards (2015) 76:1373–1394
123

IPCC Technical Paper VI (IPCC 2008) concluded that no evidence, based on instru-
mental records, has been found for a climate-driven globally widespread change in the
magnitude/frequency of floods during the last decades (Rosenzweig and Tubiello 2007),
though increases in runoff and increased risk of flood events in East Africa are expected. Di
Baldassarre et al. (2010) found no evidence that the magnitude of African floods has
increased during the twentieth century, whereas Conway et al. (2009) concluded that
robust identification of hydrologic change was severely constrained by data limitations for
sub-Saharan Africa. The reason of that stands in the limited number of flow gauge data in
space and time and the confounding effects of land use changes and engineering inter-
ventions (Di Baldassarre et al. 2010; IPCC 2012). In fact, while the primary cause of
flooding is abnormally high rainfall, there are many human-induced contributory causes
such as land degradation, deforestation of catchment areas, increased population density
along riverbanks, poor land use planning, zoning and control of flood plain development,
inadequate drainage, particularly in cities, and inadequate management of discharges from
river reservoirs (Mulugeta et al. 2007; Di Baldassarre et al. 2010). In Ethiopia, a research in
Awash River basin by Terefe et al. (2006) indicates that human factor plays a crucial role
in causing frequent flood disasters in upper, middle, and lower Awash.
Moreover, projections of flood changes at river basin scale are scarce in the scientific
literature. These same limitations and uncertainties are presently effective also in Ethiopia.
In the last decade, an increasing occurrence of floods is reported for Africa in general,
sub-Saharan Africa, and several arid and semiarid areas of Ethiopia. In fact, according to
Conway and Schipper (2011), whereas historically floods have never been a major eco-
nomic hazard in Ethiopia, recent years have seen significant socio-economic disruption due
to flooding.
According to Mulugeta et al. (2007), the accuracy and lead times of flood forecasts in
sub-Saharan Africa are limited or questionable, thus, new research and collaborative efforts
are needed to advance flood management in the future.
In developing countries, studies on ephemeral streams flash floods are uncommon and
very few data are available to design appropriate risk mitigation countermeasures and
warning systems. In 2006, the town of Dire Dawa experienced a typical flash flood that,
following the heavy rain on the upland areas of eastern Harerge highlands, within a few
hours turned the dry bed of the Dechatu River into a swelling and devastating river that
caused several casualties and property damage for millions of Euros. The problem of flash
floods in the semiarid area of Dire Dawa is not new, but their frequency has significantly
increased in the last decades (Alemu 2009; DDAEPA 2011).
In response to the fact that few studies in African climate have considered temporal
variations in the frequency and distribution of daily rainfall events of different magnitude
(Hulme 2003) and to the lack of information about the relationship between rainfall
intensity, land use change, and flash floods in Ethiopia, this study aim was threefold: (1) to
analyze the recent trends of rainfall intensity across Ethiopia in order to ascertain whether
the increased frequency of flash floods can be associated with an increase in daily pre-
cipitation amounts; (2) to estimate peak discharges for the Dechatu River and assess the
evidence for changing flood behavior; (3) to compare the general rainfall intensity trend
with the variation in the Dechatu River catchment in an attempt to investigate the causes of
such flash flood hazard worsening in this area and to discern the role of climate change
compared with that of land use change and human impact in general, i.e., a situation that is
common in many dry lands of developing countries.
Nat Hazards (2015) 76:1373–1394 1375
123

2 Study area
2.1 The climate of Ethiopia
According to the National Meteorological Agency of Ethiopia (NMA 1989), Ethiopia
shows a variety of climatic conditions. This is mainly due to its rugged physiography
characterized by large contrasts in altitude and vicinity to the Indian Ocean.
The NMA (1989), through the analysis of the rainfall pattern of a large number of
meteo-stations, demonstrated that in Ethiopia, there are different rainfall regimes. They can
be summarized in the following main categories:
1. Mono-modal (single maximum)
2. Bimodal (double maxima)
3. Diffused pattern.
The mono-modal regime is dominated by a single rainfall maximum with the wet
season running from February/March or April/May to October/November and from June/
July to August/September. The wet season decreases from ten months in the SW to only
two months in the NE. A good example is given by the rainfall pattern at Gore (Fig. 2).
The bimodal regimes is characterized by three seasons: (1) the dry season (bega in the
local language) from mid-October to January (occasional rains are recorded in places);
(2) the small rainy season (belg), from mid-February to mid-June, affected by a large inter-
annual variability; (3) the main, big rain season (kiremt), from mid-June to mid-October
that, on average, accounts for about 70 % of the annual precipitation. An example of this
regime is given by Alamata (Fig. 2). In some areas, the two peaks may be almost
equivalent as in Dire Dawa (Fig. 2).
In the diffused pattern regime, the rainfall pattern is irregular without a well-defined
rainy season as it is observed in the Danakil depression. Aseb in Eritrea is a good example
of that (Fig. 2).
0
50
100
150
200
250
300
350
J F M A M J J A S O N D
P (m
m)
Gore Alamata Dire Dawa Aseb
Fig. 2 Typical monthly rain patterns in Ethiopia as illustrated by four representative meteo-stations: Gore,mono-modal; Alamata, bimodal with a smaller peak in March/May and a more prominent peak in July/August; Dire Dawa, bimodal with two peaks almost equivalent; Aseb, diffused pattern
1376 Nat Hazards (2015) 76:1373–1394
123

The annual rainfall is also spatially highly variable with the deepest amounts in the
southwestern plateau between the Baro and Omo rivers with about 2,400 mm year-1 to the
eastern hyper-arid lowlands of Afar and Danakil where annual rainfall is commonly close
to zero.
According to NMA (1989) data, the largest proportion of the highlands is characterized
by a low (\30 %) variation coefficient of annual precipitation, whereas the low lands and
those areas with less annual rainfall such as eastern Tigray, central Ogaden, and Afar/
Danakil show a higher coefficient of variation as high as 70 % and above.
In Ethiopia, mean monthly maximum temperature (Tmax) varies at both space and time
scale. The highest temperatures (45 �C) occur in the Danakil depression with the secondary
maxima observed in the western and southern lowlands (NMA 1989), whereas the lowest
daily temperatures are recorded mostly on the highlands with values as low as 0 �C from
November to January. In coincidence with the main rainfall season, Tmax decreases all over
the country with the exception of the Danakil depression.
The annual temperature range is rather moderate all across the country, whereas the
daily temperature excursion is rather pronounced during the dry seasons reaching values as
large as 30 �C on the highlands and it is very much reduced during the rainy seasons with a
daily temperature range of even less than 10 �C.
2.2 The Dechatu River catchment
The Dechatu River drains the northern escarpment of the Harerge plateau, has a watershed
of about 660 km2 with the shape of an elongate triangle the apex of which points to N–NW
Fig. 3 Location map of the Dechatu River catchment
Nat Hazards (2015) 76:1373–1394 1377
123

(Fig. 3). Its highest point is 2,337 m a.s.l., whereas the lowest one coincides with the
confluence with the Lege Hare River at an elevation of about 1,100 m a.s.l., at the
downstream end of Dire Dawa. The flow gauge is located in a narrow reach, incised in the
bedrock, downstream of the confluence of the main tributaries that originate the Dechatu
River, and a couple of kilometers upstream of the town (Fig. 3). Only four rain gauges are
within or close to the river catchment; they are located in Dire Dawa, Kulubi, Dengego and
Alemaya (Fig. 3; Table 1).
The main stratigraphic units outcropping in the catchment are: (1) Precambrian meta-
morphic basement rocks, consisting mainly of gneiss with a variable density of thin granite
injections; (2) Triassic to lower Jurassic Adigrat sandstones: reddish, medium to coarse
sandstones and quartz conglomerates resting on the crystalline basement; (3) Antalo
limestone (Lower Cretaceous) including neritic, fossiliferous limestones and marls, rep-
resenting the most extensively outcropping formation in the catchment; (4) Cretaceous
Amba Aradam sandstones, consisting of patchy outcrops of fine to medium grained, friable
sandstone; (5) Quaternary alluvial and colluvial deposits (Merla et al. 1979).
The mean annual precipitation ranges from 1,022 mm at Kulubi, on the plateau margin,
down to 634 mm at Dire Dawa in the lowland, with both stations characterized by a
Table 1 Main characteristics of the meteo-stations considered in this study
No. Meteo-station Elevation (m a.s.l.) Annual rain (mm) Ip (mm/24 h)
1 Alamata 1,520 750.4 96.0
2 Alemayaa 2,047 764.1 118.0
3 Dengegoa 1,650 763.4 98.8
4 Dese 2,460 1,207.1 94.0
5 Dire Dawaa 1,260 638.7 122.3
6 Fitche 2,820 1,125.2 90.9
7 Gina Ager 3,160 1,693.2 170.8
8 Gode 295 239.9 174.0
9 Gonder 1,967 1,117.2 99.1
10 Gore 2,002 2,101.3 107.7
11 Hayk 2,030 1,174.0 132.8
12 Jimma 1,725 1,563.6 105.7
13 Kebri Dehar 550 325.3 128.0
14 Kobo 1,610 752.8 101.5
15 Konso 1,053 805.6 96.9
16 Kulubia 2,410 1,022.3 100.5
17 Mekele 2,070 598.7 95.5
18 Metahara 947 549.2 96.0
19 Moyale 1,097 685.0 167.6
20 Negelle 1,544 726.6 137.0
21 Nekemte 2,080 2,037.7 137.5
22 Robe Bale 2,480 876.3 112.3
23 Zikwala 2,980 1,124.8 132.6
Ip is the highest intensity ever recorded during the working time of the stationa Rain gauges within or near the Dechatu River catchment
1378 Nat Hazards (2015) 76:1373–1394
123
bimodal rainfall regime (see Sect. 2.1). In Dire Dawa, pan evaporation is about 3,140 mm
and in every month, potential evapotranspiration is greater than the average monthly
precipitation.
Dire Dawa is the second largest town of Ethiopia with 330,000 inhabitants, whereas
few, very small settlements are scattered within the Dechatu River catchment. The
physiography of the catchment is rather rugged, especially in the headwaters which are
located on the main escarpment of the Ethiopian Rift. Land cover consists for three
quarters of scrubland, open wood, and bare soil.
The Dechatu River is incised into the bedrock and no flood plain is found as far as the
town of Dire Dawa. Here, the channel is about 60–70 m wide and the streambed gradient
varies from 0.035 to 0.02. Upstream of Dire Dawa, the river channel is totally untouched,
whereas flood retaining walls are present in the urban area. They were constructed after the
2006 flood.
The Dechatu streambed is mainly sandy (70 % sand and 30 % gravel), and it is dry for
the most part of the year. Very large flows occur mainly during the summer rainy season in
response to short and intense downpours which sometimes cause flash flooding.
2.3 The Dechatu River flood of 2006
After a sequence of floods that occurred in 1981, 1994, 2004, and 2005 (Demessie 2007;
Alemu 2009; DDAEPA 2011) that caused significant fatalities and damages to property, on
August 6, 2006, the city of Dire Dawa experienced one of the largest and the most
devastating flood ever. The area inundated during the 2006 flood was about 1 km2 and
86 % of this area was covered by 1–2 m of water (Alemu 2009). Since all of the dwellings
in the inundated area are one story houses, this depth of inundation was big enough to
cause several casualties and property damage. This flood affected more than 117,000
people (i.e., one-third of the town population) and officially resulted in the loss of 256
human lives and 244 missing. It caused also the worst property damages to housing and
infrastructures in the town history with an estimated total damage of 10 million USD
(Alemu 2009).
Almost 90 % of the rainfall that generated the flood occurred in the day before (August
5) and the following rainfall depths in 24 h were recorded in the meteo-stations within or
close to the catchment perimeter: Kulubi, 100 mm; Kersa, 159 mm; Alemaya, 118 mm;
Dire Dawa, 37 mm (Fig. 3).
3 Data and methods
3.1 Rainfall intensity
Though Ethiopia has presently a modern and dense network of meteo-stations, daily rain
time series show commonly large gaps ranging from months to entire years and, unfor-
tunately, no station has a long (more than 50 years) and uninterrupted data records.
Moreover, given the vastness of the country and the variety of elevation, landscapes and
climate, data gap filling through correlation with neighboring meteo-stations is commonly
unreliable and poorly significant. The paper of Jury and Funk (2013) reports about spatial
variability of rainfall over Ethiopia, but no information is given about rainfall intensity.
These authors base their research on gridded data and interpolation. Given the low density
of meteo-stations in Ethiopia and its rugged topography, this procedure does not seem to
Nat Hazards (2015) 76:1373–1394 1379
123

provide a realistic pattern of rainfall distribution. Moreover, the procedure used by these
authors includes a five-station correlation to fill data gaps and a correlation coefficient as
low as 0.2 is accepted as significant. In the worst case, the data gap is filled with the mean
values of the time series. This method is considered here as questionable, as it does not
overtake the data limitations and introduces arbitrary conditions that are not necessarily
making the data analysis stronger or more reliable than the simple use of row data. Spatial
distribution of rainfall, considering 14 climate zones is investigated also by Viste et al.
(2013). These authors have used raw data obtained by the Ethiopian Meteorological
Agency, like in the present study, but their study focuses mainly on monthly precipitation.
Finally, a consistent study by Seleshi and Camberlin (2006), dealing with spatial and
seasonal (bega, belg, and kiremt) rainfall extremes, is available, but this paper is focused
on 5-day consecutive rain and no data on daily rainfall is reported.
Notwithstanding the awareness of the data limitations, the approach of this paper
attempts to fill an existing gap of knowledge about rainfall intensity in Ethiopia and in the
Dechatu River catchment and complement the analysis of seasonal and spatial variability
reported by previous papers (e.g., Segele and Lamb 2005; Seleshi and Camberlin 2006;
Korecha and Barnston 2007; Viste et al. 2013).
For this study, 19 meteo-stations with relatively long and as much as possible contin-
uous records were selected to investigate the variability of rainfall intensity in 24 h across
Ethiopia. These 19 meteo-stations are evenly distributed across the country (Fig. 4), but
their daily records encompass different time spans ranging from 1953 to 2010. For these
stations, the 1964–2009 time interval was selected as it has a higher degree of uniformity.
In the area of the Dechatu River, there are only four rain gauges. Three of them have a
daily data record spanning from 1981 to 2009, whereas the longest time series is recorded
at Dire Dawa and the 1964–2009 time interval was considered in accordance with the other
19 meteo-stations (Table 1).
Though the rainfall time series selected are more continuous as possible, data gaps are
still present and only in a few cases, it was possible to fill them by linear correlation with
the nearest station/s. We are well aware about such a limitation, but, in the alternative of
neglecting this part of the world and preventing it from any investigation on rainfall
intensity variation, we believe that the data processing of these time series, though affected
by the bias due to some gaps, can provide an insight into the medium- to long-term rainfall
intensity trend in Ethiopia and some indications to account for the role of climate change in
increasing frequency of flash flood in the Dechatu River and the town of Dire Dawa can be
detected anyway.
Fig. 4 Distribution acrossEthiopia of the study rainfallgauges. The numbers indicate themeteo-station name as reported inTable 1
1380 Nat Hazards (2015) 76:1373–1394
123

For each meteo-station, the following data were sorted: annual precipitation, mean
monthly precipitation, the highest rainfall intensity in 24 h (I24) recorded in each year and
the month in which it occurred, the mean values of I24 (Im) averaged on the entire time
series, the highest value of I24 ever recorded (Ip), and the return time for an intensity
I24 = 100 mm/24 h was calculated by the Gumbel method.
Floods are generated by a number of factors, the most important of which are rainfall
amount, catchment geomorphology (namely slope steepness), land use, and antecedent soil
moisture.
These conditions vary widely across Ethiopia, and, unfortunately, no information is
available about any average daily rainfall intensity threshold value capable to trigger a
flash flood.
In the USA, the River Forecast Centers produce rainfall–runoff curves on a regular basis
for each modeled basin. Changes in soil moisture due to recent rain or snowmelt are
included as well in the models to produce these curves. Therefore, when soil conditions
change, the rainfall–runoff relationship will also change.
In their study on flash floods in Europe, Marchi et al. (2010) have studied 25 extreme
events which were generated by storms with duration ranging from 7 to 22 h and rainfall
amounts between 100 and 300 mm. Rainfall intensities from 100 to 250 mm are reported by
Rusjan et al. (2009) to be responsible for flash floods in Slovenia and similar values were
measured also by Tantanee and Prakarnrat (2006) for flash floods in northern Thailand.
About 100 mm/24 h is the mean rainfall intensity recorded in the Dechatu River
catchment the day before the devastating flood of Dire Dawa in 2006. Moreover, all the 23
meteo-stations considered in this study have recorded a peak intensity of almost 100 mm/
24 h or more. Since no factual information about rainfall intensities capable to initiate
flooding in other regions of Ethiopia is available, this value was taken as a possible
reference threshold associated with potential conditions of flash flood risk generation,
especially on steep catchment across Ethiopia.
3.2 Flow discharge of the Dechatu River
Unfortunately, there is no information about the Dechatu River discharge since only flow
level data are available from March 2003 to September 2010 and no rating curve has ever
been constructed. In order to reconstruct the flood history and to calculate the peak dis-
charge of the main floods occurred in such interval, field measurements of cross section,
streambed gradient and bed material grain size were made in the reach with the flow gauge
in order to introduce these data into a simple uniform flow equation such as the Chezy
equation. The river bed at the flow gauge site is rather regular as it is straight, has a
rectangular cross-sectional geometry and is confined between bedrock slope sides (only on
the right banks there is a small alluvial accumulation). Given the reach geomorphology, the
variability through time of the monitoring site cross-section width can be considered as
negligible. As regards the variation of the streambed elevation, very scarce information is
reported in the literature, especially for ephemeral streams with a sand bed and hyper-
concentrated flow. Billi (2011), in his study on field measurement of bedload transport of
the Gereb Oda, a sand bed ephemeral stream in Tigray, Ethiopia, found that in case of
hyperconcentrated flow, streambed scouring is limited. This finding is supported also by
Powell et al. (2005) in their study using scour chains in Arizona. These latter authors
conclude that the streambeds experience little, if any, bed activity during an event. Fol-
lowing these considerations, the streambed elevation at the Dechatu flow gauge site was
considered as stable.
Nat Hazards (2015) 76:1373–1394 1381
123

The cross-sectional and streambed gradient were measured by a theodolite, whereas the
grain size frequency curve of bed material (Fig. 5) was obtained by the transect line,
frequency by number sampling method (Leopold 1970). Since bed material includes also a
non-negligible proportion of sand, the size of the sandy particles was identified by means
of a visual comparator with specimens of all the sand fractions, arranged on � phi scale,
stuck on a wooden tablet. The modal class grain of the sand in a 1 9 1 cm area near the
meter dent is considered and visually compared to the reference sieve specimens to assign
it to a specific phi class (Billi, unpublished).
Mean flow velocity (v) was calculated by the Chezy uniform flow equation
v ¼ CðRSÞ0:5 ð1Þ
in which R is the hydraulic radius, S the streambed gradient, and C the roughness
coefficient.
C ¼ ð8gÞ0:5=f 0:5 ð2Þ
in which g is gravity and 1/f 0.5 is the Darcy–Weisbach friction factor.
To calculate 1/f 0.5, the following equations were used: Leopold and Wolman (1957)
1=f 0:5 ¼ 1þ 2� log (h=D84Þ ð3Þ
in which h is mean depth and D84 is the grain size for which 84 % of the distribution is
finer, Limerinos (1970) and Knighton (1998), respectively:
1=f 0:5 ¼ 1:16þ 2� log(R=D84Þ ð4Þ
1=f 0:5 ¼ 0:82� ln(4:35� R=D84Þ ð5Þ
Equations (3) and (4) were selected because they are among the most used in the
literature and were found to be suitable for sandy gravel rivers. Equation (5) was derived
by Knighton (1998) from a very large set of field data measured on fine gravel to sandy
rivers and reported in the literature.
In addition, the regime theory equation of Lacey (1946) was used to calculate flow
velocity as:
0
20
40
60
80
100
-7.0 -6.0 -5.0 -4.0 -3.0 -2.0 -1.0 0.0 1.0 2.0 3.0
% fi
ner
D (Φ units)
Fig. 5 Grain size frequency distribution of bed material at the flow gauge reach
1382 Nat Hazards (2015) 76:1373–1394
123

v ¼ 10:8R2=3S1=3 ð6Þ
and was derived for fine-grained mobile bed rivers.
Finally, Grant’s equation (1997) was selected as well since it was developed on the base
of critical flow condition considerations for mainly sand bed streams as:
v ¼ ðghSÞ0:54:8ðh=D50Þ0:11 ð7Þ
in which D50 is the grain size for which 50 % of the distribution is finer.
No specific equation developed for fine-grained, ephemeral streams is available in the
literature; however, Eqs. (3) to (7) that result from different approaches are based on a
rather large set of field data and proved to work satisfactorily for gravelly sand rivers;
hence, they represent the best alternative to be used on a dryland river such as the Dechatu.
The river discharge was calculated for a wide range of flow levels recorded by the flow
gauge using all the criteria described above and the results averaged. By these results, a
stage/discharge rating curve was constructed (R2 = 0.95) and the discharge associated with
all the flow level data recorded was calculated. This enabled to reconstruct the flood history
of the Dechatu from March 2003 to September 2010 that is summarized in Fig. 6, in which
only the discharges higher than 300 m3 s-1 are reported. Though August 6, 2006 flood was
the most destructive, Fig. 6 shows that it was not the largest. The reasons of that will be
discussed later in the paper.
3.3 Land use/cover change
The following Landsat images were used to identify the soil use in the Dechatu River
catchment in the years 1985 and 2006: TM-09/03/1985 and ETM? 12/04/2006. Though
both images were taken during the belg (small rains) interval, they correspond to a phase of
little vegetative response following 30 days of negligible or no rainfall at all.
To identify the land use/cover, we adopted the NDVI index (Rouse et al. 1974), an
index widely used to evaluate vegetation and soil cover changes (e.g., Sohl 1999; Kindu
et al. 2013). Positive NDVI values indicate increasing amounts of green vegetation, NDVI
values near zero and negative values represent non-vegetated surfaces such as bare rock
and soil, water, snow, ice, and clouds.
Vegetation typically ranges between 0.2 and 0.8 with higher index values associated
with higher levels of healthy vegetation cover.
Fig. 6 Occurrence of floods with a discharge higher than 300 m3 s-1 observed after 2003
Nat Hazards (2015) 76:1373–1394 1383
123

The NDVI index is calculated following different phases: (1) Landsat 5 TM data are
converted to the equivalent Landsat 7 ETM ? data (DN) (Vogelmann et al. 2001), (2) DN
data (digital number 0–255) are converted to true radiance, then to reflectance (Chander
et al. 2009), (3) the NDVI index is calculated as NDVI = ((IR - R)/(IR ? R)) in which
IR and R are band 4 and 3, that is, near infrared and red band, respectively.
The NDVI maps were classified by using a supervised classification (MLC—maximum
likelihood classification). Four land use types were identified on the base of Google Earth�
high-definition images of the same period and the analysis of false color of the same
Landsat images: (1) bare soil, (2) scrubland, (3) open wood and (4) cultivated lands/mix
scrubland. The result of the classification, after considering the overlaps in spectral sig-
nature between the four soil uses, is reported in Fig. 7. The different land uses, expressed
as percentage of the Dechatu catchment area, and their variation between 1985 and 2006
are reported in Table 2.
Fig. 7 Land use/cover in the Dechatu catchment in a 1985 and b 2006
1384 Nat Hazards (2015) 76:1373–1394
123

4 Results
4.1 Rainfall intensity
The values of the highest rainfall intensity in 24 h ever recorded in the study meteo-
stations (Ip) is highly variable and range between 90.9 and 174.0 mm/24 h at Fitche and
Gore, respectively (Table 1). The highest annual rainfall intensity in 24 h (I24) may occur
in every month, but the frequency of both I24 and Ip follow a bimodal distribution with the
two modal classes coinciding with the belg and kiremt rain seasons (Fig. 8). This is not
surprising since the majority of Ethiopia is subjected to the bimodal rainfall regime.
The variability of both I24 and Ip is not affected by either elevation or annual rainfall as
no significant correlation was found between these parameters. On the other hand, the areas
with the higher values of average rainfall intensity (Im) experience also the highest peak
intensities as shown by the good correlation (R2 = 0.79) between Im and Ip (Fig. 9).
The return time interval for a rainfall intensity I24 = 100 mm/24 h was calculated using
the Gumbel method for the meteo-stations with at least 30 years of data record. The results
of this analysis show that for 50 % of the meteo-stations, the probability of a rainfall
intensity of 100 mm/24 h is less than one in 20 years and only at five stations the return
time is higher than 40 years (Fig. 10).
In order to investigate the rainfall intensity variability across Ethiopia during the last
three–five decades, 14 meteo-stations with the most uniform time series were selected and
the angular coefficient, m, of the trend lines was calculated for the 1964–2009 and
1981–2009 intervals (Table 3). The latter interval was included for a comparison with the
data of the Dechatu River watershed which, with the exception of Dire Dawa, cover only
the last three decades (Fig. 11). The data in Table 3 show a very irregular pattern of trends,
especially for the 1981–2009 interval, with m values ranging from -1.3 to 1.5. Though
Table 2 Land use/cover varia-tion between 1985 and 2006 inthe Dechatu River catchment
Land use/cover % in 1985 % in 2006 % variation
Bare soil 9.5 11.2 1.7
Scrubland 36.3 44.0 7.7
Open wood 25.9 20.3 -5.6
Cultivated/mix scrub 28.3 24.5 -3.9
0
5
10
15
20
25
J F M A M J J A S O N D
Freq
uenc
y (%
)
All sta�ons
I24 Ip
Fig. 8 Histogram of thefrequency of the months inwhich the yearly maximaand the absolute maximumof rainfall intensity wererecorded at each meteo-station
Nat Hazards (2015) 76:1373–1394 1385
123

more than one-third of the stations considered show a change of sign from negative to
positive (i.e., from decreasing to increasing trend), the mean value of m for the two
intervals remains close to zero, indicating no spatial correlation and no detectable change
at country scale. By contrast, the trend lines obtained for all the meteo-stations in the
Dechatu catchment show an increase in rainfall intensity in this area.
y = 0.6014x1.2951
R² = 0.79
0
50
100
150
200
250
0 20 40 60 80 100
I p(m
m/2
4h)
Im (mm/24h)
All sta�ons
Fig. 9 Correlation between the mean yearly maximum and the absolute maximum rainfall intensity foreach meteo-station
0 10 20 30 40 50 60
ZikwalaRobe BaleNekemte
NegelleMoyale
MeteharaMekele
KulubiKonsoKobo
Kebri DeharJimma
HaykGore
GonderGode
Gina AgerFitche
Dire DawaDese
DengecoAlemayaAlamata
Return Time (years)
I24 = 100 mmFig. 10 Return time of a rainfallintensity of 100 mm/24 h for thestudy meteo-stations
1386 Nat Hazards (2015) 76:1373–1394
123

These results indicate that (1) conditions of intense rainfall are ubiquitous all across
Ethiopia; (2) in the Dechatu River, rainfall intensities of the same order of magnitude of
those that generated the devastating flood of August 2006 have a high probability to occur
given the short return time ranging from 14 to 21 years calculated for Dire Dawa and the
neighboring station; (3) no significant change in rainfall intensity occurred across Ethiopia
Table 3 Angular coefficient, m,of the I
24trend lines
a Dechatu River catchmentmeteo-stations
Meteo-station 1964–2009 1981–2009
Fitche -0.081
Gina Ager 0.369 -0.977
Gode 0.520 1.514
Gonder -0.079 0.123
Gore -0.498 0.085
Hayk -0.037 0.371
Jimma 0.026 -0.104
Kebri Dehar 0.407 1.463
Mekele -0.023 0.493
Metehara -0.488 0.354
Moyale 0.511 0.564
Megelle -0.614 -1.310
Nekemte 0.072 -0.241
Robe Bale 0.386 0.115
Mean 0.048 0.048
Standard deviation 0.390 0.785
Dire Dawaa 0.296 0.302
Alemayaa 0.660
Dengegoa 0.201
Kulubia 0.777
Meana 0.486
0
20
40
60
80
100
120
140
1960 1970 1980 1990 2000 2010
I 24(m
m/2
4h)
Dire Dawa 1953-1980
Dire Dawa 1981-2009
Kulubi 1981-2009
Dengego 1982-2009Alemaya 1981-2009
Fig. 11 Time variation ofrainfall intensity in 24 h recordedby the Dechatu River meteo-stations
Nat Hazards (2015) 76:1373–1394 1387
123
during the last four decades, whereas the data of all the Dechatu stations show a marked
increase becoming more prominent after the mid-1990s.
As introduced in Sect. 3.1, whether or not a rainfall intensity of 100 mm in 24 h is
capable to generate a flash flood in the study area may depend on many factors, with the
three most important being: (1) the pattern of rainfall distribution, (2) the spatial distri-
bution, and (3) the initial soil moisture conditions. Since of these three main parameters
only the third one can be inferred from the available data for the Dechatu River, in order to
point out the role of and land use/cover change in the increased frequency of flash floods in
Dire Dawa during the last decades, the runoff generated by a rainfall of 100 mm in 24 h
was calculated by the curve number method for the land use/cover referred to 1985 and
2006. According to this method, the change in land use/cover observed in 2006 is
responsible for a runoff increase of about 4.5 %.
4.2 Flood flows
The floods larger than 300 m3 s-1, calculated by the methods described in Sect. 3.2, are
reported in Fig. 6. The flood of August 6, 2006 was the most devastating and killed 256
people. Its peak discharge was calculated to be around 1,508 m3 s-1 (2.28 m3 s-1 km-2).
Alemu (2009), using the Soil Conservation Service Curve Number method (USDA 1986),
obtained a peak discharge of 1,400 m3 s-1, i.e., a value very close to that calculated by the
simple uniform flow equation. Though the SCS-CN method is empirical and developed for
small catchments in the mid-western USA, it was found to be particularly suited for
streams with negligible base flow, i.e., rivers for which the ratio of direct runoff to total
runoff is close to one, as it is commonly observed in ephemeral streams of arid and
semiarid regions (Ponce and Hawkins 1996). This is also the case of the Dechatu that is dry
for most of the time and has some water flowing only in response to individual, intense
rainstorms. Therefore, it is not surprising that the hydraulic and hydrologic approaches
used, though conceptually different, produced a very similar result.
In the last decade, the largest flood had a peak discharge of about 2,338 m3 s-1
(3.54 m3 s-1 km-2) and occurred on May 20, 2005. Other six large floods, with peak
discharge (Qp) higher than 1,000 m3 s-1 occurred on April 14, 2004 (Qp = 1,095 m3 s-1),
March 20, 2005 (Qp = 1,456 m3 s-1), March 25, 2006 (Qp = 1,269 m3 s-1), April 6,
2006 (Qp = 1,080 m3 s-1), April 12, 2007 (Qp = 1,508 m3 s-1), and March 8, 2010
(Qp = 1,118 m3 s-1).
The August 6, 2006 flood was by far the worst in terms of human lives lost because it
was a typical, very flashy flood and occurred in the night, before dawn, when most of the
people were sleeping. According to eyewitness reports, in fact, the flood wave had a high
velocity of propagation and peak discharge followed shortly after the flood onset. The
largest flood of May 20, 2005 instead occurred during the day and people had time to move
to safe places. After the August 6, 2006 flood, retaining walls were constructed throughout
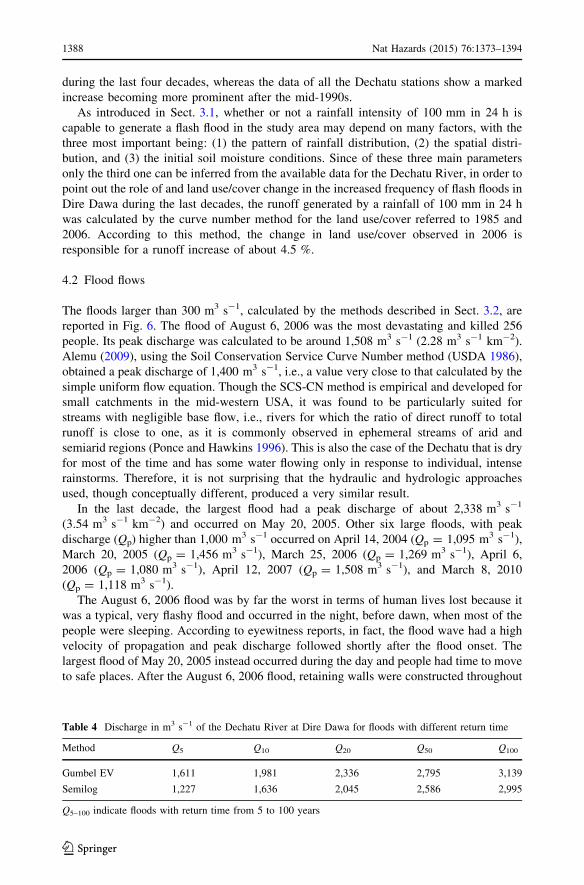
Table 4 Discharge in m3 s-1 of the Dechatu River at Dire Dawa for floods with different return time
Method Q5 Q10 Q20 Q50 Q100
Gumbel EV 1,611 1,981 2,336 2,795 3,139
Semilog 1,227 1,636 2,045 2,586 2,995
Q5–100 indicate floods with return time from 5 to 100 years
1388 Nat Hazards (2015) 76:1373–1394
123

the river reach within the town of Dire Dawa and the subsequent floods, though a couple of
them were of the same order of magnitude as the previous ones, had limited impact.
In order to quantify the magnitude of the August 6, 2006 flood and the largest flood of
May 20, 2005 (Demessie 2007; Alemu 2009), a flood frequency curve was constructed
with the discharge data calculated on the basis of the water level measured by the flow
gauge. The discharges with the return times of 5, 10, 20, 50, and 100 years were calculated
using the Gumbel EV method and by a simple semilog interpolation (Table 4). The results
in Table 4 indicate that the return interval of the largest flood of May 20, 2005 is 20 years,
whereas that of August 6, 2006 flood is about 4.5 years. The data used to calculate the
flood frequency curve, though from one side may reflect the most recent flood trend, from
the other cover a very short time interval (March 2003 to September 2010) that can make
the results obtained questionable. Given the limitation of the data available, in an attempt
to, at least, indirectly confirm the results obtained, the most renown empirical equations to
calculate the maximum flood (i.e., Q100) reported in the literature were applied to the
Dechatu. They are the equations of Pagliaro (1936, in Maione 1977); Rodier and Roche
(1984); and Griffiths and McKerchar (2008) which returned the following discharges for
Q100, 2,552, 8,154 and 4,536 m3 s-1, respectively. None of these criteria were specifically
developed for ephemeral streams of arid and semiarid regions. In fact, the data of Pagliaro
refers to Italian rivers data of the early twentieth century, that is, with less human impact
and less forest cover than the present day; Rodier and Roche’s equation is very general
since it was derived from data of the world catalog of very large floods including rivers
from all over the world; and Griffiths and McKerchar data refer to rivers in the Westland of
New Zealand South Island, where a temperate climate with high rainfall prevails. A subset
of data of maximum flood recorded in rivers of arid and semiarid environments, with
catchment area less than 2,500 km2, was extracted from Rodier and Roche (1984) and data
of catchment area (A) were plotted versus maximum recorded discharge (Qp).
The best fitting curve (R2 = 0.70) is the following:
Qp ¼ 92:625A0:5902 ð8Þ
with Qp in m3 s-1 and A in km2, and explains 70 % of the maximum discharge variability.
According to Rodier and Roche, Qp is very close to Q100. By applying Eq. (8) to the
Dechatu, we obtain Q100 = 4,257 m3 s-1. This value is about 25 % larger than that cal-
culated by Gumbel EV method with the flow data recordings available but, given the
brevity of the time series, which may result in an approximation for defect, a discharge
between 3,100 and 4,200 m3 s-1 can be considered as a possible actual value for the
Dechatu’s Q100. Following this result, the return time intervals of the largest flood of May
20, 2005 and of the devastating flood of August 6, 2006 are expected to be larger. The
return intervals of I24 = 100 mm/24 h calculated for the four meteo-stations within or
close to the Dechatu catchment (Dengego, Dire Dawa, Alemaya and Kulubi—Fig. 3) range
from 14 to 21 years and seem to confirm a larger return time for these high floods.
5 Discussion
A large number of studies have examined potential trends of river discharge during the
twentieth century. Many of them, however, have found no trends or have been unable to
separate the effects of variations in temperature and precipitation from the effects of human
interventions in the catchment (Di Baldassarre et al. 2010). In the case of the Dechatu
Nat Hazards (2015) 76:1373–1394 1389
123

River, though flow data have been recorded only during the last decade, local authorities
(DDAEPA 2011) and local witnesses have confirmed the increased frequency of high flash
floods. In the recent past, in fact, only four, minor floods affected Dire Dawa in 1945, 1977,
1981, and 1994 (Alemu 2009). No flow data are available for these floods and are classified
as ‘‘minor’’ because they are not reported to have caused fatalities and property damage.
The comparison between the flood frequency in the 1945–1994 and the 2003–2010 (Fig. 6)
intervals confirms that the flood hazard in Dire Dawa has markedly increased in the second
interval.
The analysis of I24 time series produced contrasting results for the 14 meteo-stations
selected to represent the variability of extreme rainfall at country scale. Eight out of 14
stations are characterized by an increasing trend over the 1964–2009 interval, whereas the
proportion of decreasing trend lines is 8 out of 15 stations for the 1981–2009 period.
Though the number of data with negative values of m is a little higher in the last three
decades, it is worth noticing that only two stations maintain the same sign and the change
from positive to negative is observed only in three stations. At country scale, it can be
concluded that there is a high variability of extreme rainfalls in time and space, but no clear
overall trend can be recognized (mean m = 0.048—Table 3). By contrast, in the Dechatu
stations, the trend lines are all positive (mean m = 0.486—Table 3) and indicate an
average rainfall intensity increase of 32 % from 1981 to 2009 (Fig. 11).
In his 2009 paper, Morin investigated the minimal detectable absolute trends in annual
precipitation and concluded that similar analyses may be applied to other related variables.
The daily rainfall intensity trends calculated in this study show rates of change that are
within the limits reported by this author for the study areas to be considered as minimal
detectable absolute trend. The reasons why different areas of Ethiopia are experiencing
different patterns of extreme rainfall variability are complex and beyond the scope of this
paper; however, it is rather evident that the Dechatu River has been subjected to a marked
increase in extreme rains throughout the last three decades (Fig. 11). Furthermore, if the
data of Dire Dawa are considered, it appears that rainfall intensities start to increase in
1970 and proceed at an almost constant rate as far as 2009 (Fig. 11); therefore, this factor
alone cannot be invoked to account for the concentration of high floods observed in the last
decade (Fig. 6) and other factors are to be considered.
Land use/cover changed significantly from 1985 to 2006 and a nick point can be
identified in the first years following the change of Government in Ethiopia that formally
occurred in 1992. Some problems were encountered in defining with accuracy the
boundaries between some cultivated areas and the neighboring scrubland. In the study area,
traditionally, people were not used to cultivate perennial crops and that resulted in very
serious soil erosion problems. From the late period of the DERG government up to the
present, construction of terraces and planting eucalyptus trees have been the physical and
biological measures implemented in the Dechatu catchment, particularly in the down-
stream portion, to contrast erosion. Late land management plans of the DERG forced the
farmers to set up cultivations also on the steep slopes of the Dechatu headwater and,
though soil countermeasures such as terracing and eucalyptus tree plantations were
implemented through the food for work program, the local farmers considered the natural
constraints and limitations too hard to cope with and making such cultivations scarcely
remunerative and rewarding. After the fall of the DERG regime in 1991, these cultivations
were abandoned and grown trees were cut and sold for daily consumption. The abandoned
cultivations, though partly obliterated by the spontaneous re-growth of scrub vegetation,
still maintain traces of their original structure, and for these reasons, they are not easily
1390 Nat Hazards (2015) 76:1373–1394
123

distinguished by the NDVI analysis. Presently, only little cultivation is taking place due to
the limitations of soil degradation severity.
This important land management transformation, consisting substantially in crop and
conservation practices abandonment, which occurred after 1991, has left the slopes,
especially in the river headwaters, devoid of any efficient soil maintenance and water
conservations practices, de facto giving rise to conditions that favor higher than before
overland flow volumes
In order to assess the relative influence of land use/cover change, the runoff generated
by a rainfall of 100 mm in 24 h was calculated by the curve number method and an
increase of about 4.5 % was found for the land use/cover conditions of 2006 with respect to
1985.
The average rainfall intensity calculated from the data of the Dechatu meteo-stations is
52.8 mm/24 h for the 1981–1991 interval and becomes 60.1 mm/24 h for the period
1992–2009, i.e., after agriculture abandonment, with an increment of 14 %.
These results suggest that in the Dechatu catchment, notwithstanding the marked
change in land use/cover and conservation practices that occurred in the last three decades,
the recent increase in rainfall intensity seems to be a key concurrent factor, presumably
more important than poor land management in contributing to rise the risk level of flash
floods in the town of Dire Dawa. In the very recent years, however, the local adminis-
trations have constructed high flood retaining walls that have contained the last large floods
of 2010 with peak discharges around 1,000 m3 s-1 (Fig. 6), preventing the town from
further inundation, and started a new program of flash flood risk reduction by expanding
and renovating the old soil and water conservation measures on the slopes of the Dechatu
catchment headwater.
6 Conclusions
The analysis of daily rainfall data over a time span ranging from 50 to 30 years from 19
meteo-stations scattered across Ethiopia has shown that almost all the country is subjected
to high rainfall intensities ranging from 90 to 170 mm/24 h. Though the highest values of
daily rainfall may be recorded in every month, i.e., also in the dry interval, their distri-
butions follow the typical monthly rainfall pattern characterized by two almost equivalent
modal classes in April and August.
On the base of the rainfall data associated with the devastating flood of Dire Dawa on
August 6, 2006, a rainfall intensity of 100 mm/24 h was taken as a reference value capable
to set conditions for a flash flood. In about 60 % of the meteo-stations considered, a rainfall
intensity of 100 mm/24 h has a probability to occur as once in less than 20 years, and in all
but five meteo-stations such intensity has a return time \40 years.
The Dechatu River is an ephemeral stream which is dry for most of the time. During the
last decade (2003–2010), however, 23 flash floods were recorded. These floods range from
335 to 2,338 m3 s-1, equivalent to 0.51 and 3.54 m3 s-1 km-2, respectively, and seven of
them had a discharge higher than 1,000 m3 s-1 (1.52 m3 s-1 km-1). The return time of the
largest flood recorded on May 20, 2005 and of the most devastating flood of August 6,
2006 is calculated as 20 and 4.5 years, respectively. These values were obtained from a
very short time series and a comparison with the maximum possible flood (Q100), derived
by regression analysis between measured maximum flood and catchment area of rivers in
arid and semiarid areas (subset of data from Rodier and Roche 1984), and the maximum
rainfall intensity in 24 h, recorded at the Dechatu catchment meteo-stations, indicates that
Nat Hazards (2015) 76:1373–1394 1391
123

the higher floods return interval is likely longer than that calculated by the Gumbel flood
frequency analysis.
The maximum rainfall intensity (I24) recorded in the study meteo-stations shows a
contrasting pattern of decrease and increase trends for different stations across Ethiopia,
but the long-term mean of the trend lines angular coefficient does not show any evidence of
change. By contrast, a marked increase is observed in the Dechatu catchment. Here, in the
last decades after 1991 (i.e., after the general abandonment of agriculture and land man-
agement practices, following the fall of the DERG Government, especially in the Dechatu
River headwaters), extreme rainfall intensity has increased by 14 %.
The land use/cover change in the Dechatu catchment was analyzed by means of 1985
and 2006 satellite images interpretation. This analysis indicates that the land transforma-
tions occurred between 1985 and 2006 resulted in an increase in all the factors that favor
larger volumes of overland flow. The use of the curve number method, refereed to the 1985
and 2006 land use/cover situations shows a runoff increase of 4.5 %. This value, however,
is modest if compared with the three times larger increase in rainfall intensity observed
after 1991. The increase in extreme rains, paired by a marked change in land use/cover and
management practices, is considered the main factor responsible for the increased fre-
quency of high flash floods in the town of Dire Dawa during the last decade, though the
increase in rainfall intensity is likely playing a more relevant role.
Acknowledgments The authors are indebted to two anonymous referees who posed key points, stimulateddiscussion, and greatly improved the general quality of the manuscript. This paper was funded by theNational Geography Grant 8400-08, University of Ferrara and University of Dire Dawa funds. The authorsare indebted to Girma Moges and to the technical staff of the Geography Department of Dire DawaUniversity for their assistance during the field measurements on the Dechatu River. The Department ofHydrology of the Ethiopian Ministry of Water Resources is acknowledged for providing the flow level dataof the Dechatu River.
References
Adhikari P, Hong Y, Douglas KR, Kirschbaum DB, Gourley J, Adler R, Brakenridge GR (2010) A digitizedglobal flood inventory (1998–2008): compilation and preliminary results. Nat Hazards 55:405–422.doi:10.1007/s11069-010-9537-2
Alemu YT (2009) Socio-economic impact of flooding in Dire Dawa, Ethiopia. Unpublished MSc. Thesis,International Center for Water Hazard and Risk Management, Tsukuba, Japan
Alexander LV, Zhang X, Peterson TC, Caesar J, Gleason B, Klein Tank AMG, Haylock M, Collins D,Trewin B, Rahimzadeh F, Tagipour A, Kumar KR, Revadekar J, Griffiths G, Vincent L, StephensonDB, Burn J, Aguilar E, Brunet M, Taylor M, New M, Zhai P, Rusticucci M, Vazquez-Aguirre JL(2006) Global observed changes in daily climate extremes of temperature and precipitation. J GeophysRes Atmos 111:D05109
Billi P (2011) Flash flood sediment transport in a steep sand-bed ephemeral stream. Int Jour. Sediment Res26(2):193–209
Chander G, Markham BL, Helder DL (2009) Summary of current radiometric calibration coefficients forLandsat MSS, TM, ETM?, and EO-1 ALI sensors. Remote Sens Environ 113:893–903
Conway D, Schipper ELF (2011) Adaptation to climate change in Africa: Challenges and opportunitiesidentified from Ethiopia. Glob Environ Change 21:227–237
Conway D, Persechino A, Ardoin-Bardin S, Hamandawana H, Dieulin C, Mahe G (2009) Rainfall and waterresources variability in sub-Saharan Africa during the twentieth century. J Hydrometeorol 10(1):41–59
DDAEPA (Dire Dawa Administration Environmental Protection Authority) (2011) Dire Dawa Adminis-tration, program of adaptation to climate change. DDEPA, Dire Dawa
Demessie DA (2007) Assessment of flood risk in Dire Dawa town, eastern Ethiopia, using gis. MSc Thesis,Addis Ababa University
1392 Nat Hazards (2015) 76:1373–1394
123

Di Baldassarre G, Montanari A, Lins H, Koutsoyiannis D, Brandimarte L, Bloschl G (2010) Flood fatalitiesin Africa: from diagnosis to mitigation. Geophys Res Lett 37:L22402
Easterling DR, Evans JL, Groisman PY, Karl TR, Kunkel KE, Ambenje P (2000) Observed variability andtrends in extreme climate events. Bull Am Meteorol Soc 81:417–425
EM-DAT (2014) The OFDA/CRED International Disaster Database—www.emdat.be, Universite Catho-lique de Louvain, Brussels (Belgium)
Grant GE (1997) Critical flow constraints flow hydraulic in mobile-bed streams: a new hypothesis. WaterResour Res 33(2):349–358
Griffiths GA, McKerchar AI (2008) Dependence of flood peak magnitude on catchment area. J Hydrol (N Z)47(2):123–131
Griffiths GM, Salinger MJ, Leleu I (2003) Trends in extreme daily rainfall across the South Pacific andrelationship to the South Pacific Convergence Zone. Int J Clim 23(8):847–869
Herath S, Ratnayake U (2004) Monitoring rainfall trends to predict adverse impacts—a case study from SriLanka (1964–1993). Glob Environ Change 14(1):71–79
Hulme M (2003) Climate change within the period of meteorological records. In: Adams WM, Goudie WS,Orme AR (eds) The physical geography of Africa. Oxford University Press, Oxford, pp 88–102
IPCC (2008) Technical Paper VI. In: Bates BC, Kundzewicz ZW, Wu S, Palutikof JP (eds) IPCC Secre-tariat, Geneva, 210 pp
IPCC (2012) Managing the risks of extreme events and disasters to advance climate change adaptation.Cambridge University Press, Cambridge
Jury MR, Funk C (2013) Climatic trends over Ethiopia: regional signals and drivers. Int J Clim33(8):1924–1935
Kindu M, Schneider T, Teketay D, Knoke T (2013) Land use/land cover change analysis using object-basedclassification approach in Munessa-Shashemene Landscape of the Ethiopian Highlands. Remote Sens5:2411–2435
Knighton AD (1998) Fluvial forms and processes: a new perspective. Arnold, LondonKorecha D, Barnston AG (2007) Predictability of June–September rainfall in Ethiopia. Mon Weather Rev
135(2):628–650Lacey G (1946) A theory of flow in alluvium. J Inst. Civil Eng 57, Paper No. 5518, 16-47Leopold LB (1970) An improved method for size distribution of stream bed gravel. Water Resour Res
6(5):1357–1366Leopold LB, Wolman MG (1957) River channel pattern: braided meandering and straight. U.S. Geol. Surv.
Prof. Paper 282B:39–85Limerinos JT (1970) Determination of the Manning coefficient from measured bed roughness in natural
channels. U.S. Geol. Surv., Water Supply Pap 1898-B, 47 ppLin X (ed.) (1999) Flash floods in arid and semi-arid zones. IHP-V Technical Documents in Hydrology, No.
23, UNESCO, Paris, 65 ppMaione U (1977) Appunti di idrologia. Le piene fluviali. Ed. La Goliardica Pavese, Pavia, 224 ppManton MJ, Della-Marta PM, Haylock MR, Hennessy KJ, Nicholls N, Chambers LE, Collins DA, Daw G,
Finet A, Gunawan D, Inape K, Isobe H, Kestin TS, Lefale P, Leyu CH, Lwin T, Maitrepierre L,Ouprasitwong N, Page CM, Pahalad J, Plummer N, Salinger MJ, Suppiah R, Tran VL, Trewin B, TibigI, Yee D (2001) Trends in extreme daily rainfall and temperature in Southeast Asia and the SouthPacific: 1961–1998. Int Jour Clim 21(3):269–284
Marchi L, Borga M, Preciso E, Gaume E (2010) Characterisation of selected extreme flash floods in Europeand implications for flood risk management. J Hydrol 394(1–2):118–133
Merla G, Abbate E, Azzaroli A, Bruni P Canuti P, Mazzuoli M, Sagri M, Tacconi P (1979) A geologicalmap of Ethiopia and Somalia 1:2.000.000 and comment. Consiglio Nazionale delle Ricerche, Uni-versity of Florence, Italy
Mulugeta G, Ayonghe S, Daby D, Dube PO, Gudyanga F, Lucio F, Durrheim R (2007) Natural and human-induced hazards and disasters in sub-Saharan Africa. ICSU (International Council For Science)Regional Office for Africa, Pretoria
NMA (1989) Climatic and agroclimatic resources of Ethiopia. National Meteorological Agency, AddisAbaba
Peterson TC, Taylor MA, Demeritte R, Duncombe DL, Burton S, Thompson F, Porter A, Mercedes M,Villegas E, Fils RS, Klein Tank A, Martis A, Warner R, Joyette A, Mills W, Alexander L, Gleason B(2002) Recent changes in climate extremes in the Caribbean region. J Geophys Res Atmos 107:4601
Ponce VM, Hawkins RH (1996) Runoff Curve Number: has it reached maturity? ASCE J Hydrol Eng1(1):11–19
Powell DM, Brazier RE, Wainwright J, Parsons AJ, Kaduk J (2005) Stream-bed scour and fill in low-orderdryland channels. Water Resour Res 41:W05019. doi:10.1029/2004WR003662
Nat Hazards (2015) 76:1373–1394 1393
123

Rodier JA, Roche MJ (1984) World catalogue of maximum observed floods. IAHS Publ No 143Rosenzweig C, Tubiello FN (2007) Adaptation and mitigation strategies in agriculture: an analysis of
potential synergies. Mitig Adapt Strateg Glob Change 12:855–873Rouse JW, Haas RH, Schell JA, Deering DW (1974) Monitoring vegetation systems in the Great Plains with
ERTS. In: Fraden SC, Marcanti EP, Becker MA (eds) Third ERTS-1 symposium, NASA SP-351.NASA, Washington, DC, pp 309–317
Rusjan S, Kobold M, Mikos M (2009) Characteristics of the extreme rainfall event and consequent flashfloods in W Slovenia in September 2007. Nat Hazards Earth Syst Sci 9:947–956
Segele ZT, Lamb PJ (2005) Characterization and variability of Kiremt rainy season over Ethiopia. MeteorolAtmos Phys 89(1):153–180
Seleshi Y, Camberlin P (2006) Recent changes in dry spell and extreme rainfall events in Ethiopia. TheorAppl Clim 83(1–4):181–191
Sohl TL (1999) Change Analysis in the United Arab Emirates: an Investigation of Techniques. PhotogrammEng Remote Sens 65(4):475–484
Tantanee S, Prakarnrat S (2006) Post flash flood hydrological investigation. Adv Geosci 11:265–282Terefe A, Tsige G, Wondafrash G, Alemu YT (2006) Causes, consequences and management aspects of the
2006 flooding hazards in Awash river basin. In: Kelbessa E (ed) Ethiopia between the sharp scissors:climate change and environmental degradation (Forum for Environment, December 2006), pp 41–42
United States Department of Agriculture (1986) Urban hydrology for small watersheds. Technical Release55 (TR-55) (Second Ed.), Natural Resources Conservation Service, Conservation Engineering Division
Viste E, Korecha D, Sorteberg A (2013) Recent drought and precipitation tendencies in Ethiopia. TheorAppl Climatol. doi:10.1007/s00704-012-0746-3
Vogelmann JE, Howard SM, Yang L, Larson CR, Wylie BK, Van Driel JN (2001) Completion of the 1990’sNational land cover data set for the conterminous United States. Photogramm Eng Remote Sens67:650–662
1394 Nat Hazards (2015) 76:1373–1394
123


![0 [Type the document subtitle] [Pick the date] Dasar-Dasar Membuat Media Pembelajaran Dengan Dengan Dengan Dengan Flash Flash Flash Flash](https://static.fdokumen.com/doc/165x107/632259f164690856e109202b/0-type-the-document-subtitle-pick-the-date-dasar-dasar-membuat-media-pembelajaran.jpg)