Design of diffractive lenses that generate optical nulls without phase singularities

arX
iv:h
ep-e
x/95
0301
4v1
27
Mar
199
5
Inclusive transverse momentum distributions
of charged particles in diffractive and
non–diffractive photoproduction at HERA
ZEUS Collaboration
Abstract
Inclusive transverse momentum spectra of charged particles in photoproduction eventsin the laboratory pseudorapidity range −1.2 < η < 1.4 have been measured up to pT =8 GeV using the ZEUS detector. Diffractive and non–diffractive reactions have beenselected with an average γp centre of mass (c.m.) energy of 〈W 〉 = 180GeV. For diffractivereactions, the pT spectra of the photon dissociation events have been measured in twointervals of the dissociated photon mass with mean values 〈MX〉 = 5 GeV and 10 GeV.The inclusive transverse momentum spectra fall exponentially in the low pT region. Thenon–diffractive data show a pronounced high pT tail departing from the exponential shape.The pT distributions are compared to lower energy photoproduction data and to hadron–hadron collisions at a similar c.m. energy. The data are also compared to the results of anext–to–leading order QCD calculation.
DESY 95-050
March 1995

The ZEUS Collaboration
M. Derrick, D. Krakauer, S. Magill, D. Mikunas, B. Musgrave, J. Repond, R. Stanek, R.L. Talaga, H. ZhangArgonne National Laboratory, Argonne, IL, USA p
R. Ayad1, G. Bari, M. Basile, L. Bellagamba, D. Boscherini, A. Bruni, G. Bruni, P. Bruni, G. Cara Romeo,G. Castellini2, M. Chiarini, L. Cifarelli3, F. Cindolo, A. Contin, M. Corradi, I. Gialas4, P. Giusti, G. Iacobucci,G. Laurenti, G. Levi, A. Margotti, T. Massam, R. Nania, C. Nemoz,F. Palmonari, A. Polini, G. Sartorelli, R. Timellini, Y. Zamora Garcia1, A. ZichichiUniversity and INFN Bologna, Bologna, Italy f
A. Bargende, J. Crittenden, K. Desch, B. Diekmann5, T. Doeker, M. Eckert, L. Feld, A. Frey, M. Geerts,G. Geitz6, M. Grothe, T. Haas, H. Hartmann, D. Haun5, K. Heinloth, E. Hilger,H.-P. Jakob, U.F. Katz, S.M. Mari4, A. Mass7, S. Mengel, J. Mollen, E. Paul, Ch. Rembser, R. Schattevoy8,D. Schramm, J. Stamm, R. WedemeyerPhysikalisches Institut der Universitat Bonn, Bonn, Federal Republic of Germany c
S. Campbell-Robson, A. Cassidy, N. Dyce, B. Foster, S. George, R. Gilmore, G.P. Heath, H.F. Heath, T.J. Llewellyn,C.J.S. Morgado, D.J.P. Norman, J.A. O’Mara, R.J. Tapper, S.S. Wilson, R. YoshidaH.H. Wills Physics Laboratory, University of Bristol, Bristol, U.K. o
R.R. RauBrookhaven National Laboratory, Upton, L.I., USA p
M. Arneodo9, L. Iannotti, M. Schioppa, G. SusinnoCalabria University, Physics Dept.and INFN, Cosenza, Italy f
A. Bernstein, A. Caldwell, N. Cartiglia, J.A. Parsons, S. Ritz10, F. Sciulli, P.B. Straub, L. Wai, S. Yang, Q. ZhuColumbia University, Nevis Labs., Irvington on Hudson, N.Y., USA q
P. Borzemski, J. Chwastowski, A. Eskreys, K. Piotrzkowski, M. Zachara, L. ZawiejskiInst. of Nuclear Physics, Cracow, Poland j
L. Adamczyk, B. Bednarek, K. Jelen, D. Kisielewska, T. Kowalski, E. Rulikowska-Zarebska,L. Suszycki, J. ZajacFaculty of Physics and Nuclear Techniques, Academy of Mining and Metallurgy, Cracow, Poland j
A. Kotanski, M. PrzybycienJagellonian Univ., Dept. of Physics, Cracow, Poland k
L.A.T. Bauerdick, U. Behrens, H. Beier11, J.K. Bienlein, C. Coldewey, O. Deppe, K. Desler, G. Drews,M. Flasinski12, D.J. Gilkinson, C. Glasman, P. Gottlicher, J. Große-Knetter, B. Gutjahr, W. Hain, D. Hasell,H. Heßling, Y. Iga, P. Joos, M. Kasemann, R. Klanner, W. Koch, L. Kopke13, U. Kotz, H. Kowalski, J. Labs,A. Ladage, B. Lohr, M. Lowe, D. Luke, O. Manczak, T. Monteiro14, J.S.T. Ng, S. Nickel, D. Notz, K. Ohren-berg, M. Roco, M. Rohde, J. Roldan, U. Schneekloth, W. Schulz, F. Selonke, E. Stiliaris15, B. Surrow, T. Voß,D. Westphal, G. Wolf, C. Youngman, J.F. ZhouDeutsches Elektronen-Synchrotron DESY, Hamburg, Federal Republic of Germany
H.J. Grabosch, A. Kharchilava, A. Leich, M.C.K. Mattingly, A. Meyer, S. Schlenstedt, N. WulffDESY-Zeuthen, Inst. fur Hochenergiephysik, Zeuthen, Federal Republic of Germany
G. Barbagli, P. PelferUniversity and INFN, Florence, Italy f
G. Anzivino, G. Maccarrone, S. De Pasquale, L. VotanoINFN, Laboratori Nazionali di Frascati, Frascati, Italy f
A. Bamberger, S. Eisenhardt, A. Freidhof, S. Soldner-Rembold16, J. Schroeder17, T. TrefzgerFakultat fur Physik der Universitat Freiburg i.Br., Freiburg i.Br., Federal Republic of Germany c
I

N.H. Brook, P.J. Bussey, A.T. Doyle18, J.I. Fleck4, D.H. Saxon, M.L. Utley, A.S. WilsonDept. of Physics and Astronomy, University of Glasgow, Glasgow, U.K. o
A. Dannemann, U. Holm, D. Horstmann, T. Neumann, R. Sinkus, K. WickHamburg University, I. Institute of Exp. Physics, Hamburg, Federal Republic of Germany c
E. Badura19, B.D. Burow20, L. Hagge, E. Lohrmann, J. Mainusch, J. Milewski, M. Nakahata21, N. Pavel,G. Poelz, W. Schott, F. ZetscheHamburg University, II. Institute of Exp. Physics, Hamburg, Federal Republic of Germany c
T.C. Bacon, I. Butterworth, E. Gallo, V.L. Harris, B.Y.H. Hung, K.R. Long, D.B. Miller, P.P.O. Morawitz,A. Prinias, J.K. Sedgbeer, A.F. WhitfieldImperial College London, High Energy Nuclear Physics Group, London, U.K. o
U. Mallik, E. McCliment, M.Z. Wang, S.M. Wang, J.T. Wu, Y. ZhangUniversity of Iowa, Physics and Astronomy Dept., Iowa City, USA p
P. Cloth, D. FilgesForschungszentrum Julich, Institut fur Kernphysik, Julich, Federal Republic of Germany
S.H. An, S.M. Hong, S.W. Nam, S.K. Park, M.H. Suh, S.H. YonKorea University, Seoul, Korea h
R. Imlay, S. Kartik, H.-J. Kim, R.R. McNeil, W. Metcalf, V.K. NadendlaLouisiana State University, Dept. of Physics and Astronomy, Baton Rouge, LA, USA p
F. Barreiro22, G. Cases, R. Graciani, J.M. Hernandez, L. Hervas22, L. Labarga22, J. del Peso, J. Puga, J. Terron,J.F. de TroconizUniver. Autonoma Madrid, Depto de Fısica Teorıca, Madrid, Spain n
G.R. SmithUniversity of Manitoba, Dept. of Physics, Winnipeg, Manitoba, Canada a
F. Corriveau, D.S. Hanna, J. Hartmann, L.W. Hung, J.N. Lim, C.G. Matthews, P.M. Patel,L.E. Sinclair, D.G. Stairs, M. St.Laurent, R. Ullmann, G. ZacekMcGill University, Dept. of Physics, Montreal, Quebec, Canada a, b
V. Bashkirov, B.A. Dolgoshein, A. StifutkinMoscow Engineering Physics Institute, Mosocw, Russia l
G.L. Bashindzhagyan, P.F. Ermolov, L.K. Gladilin, Y.A. Golubkov, V.D. Kobrin, V.A. Kuzmin, A.S. Proskuryakov,A.A. Savin, L.M. Shcheglova, A.N. Solomin, N.P. ZotovMoscow State University, Institute of Nuclear Physics, Moscow, Russia m
M. Botje, F. Chlebana, A. Dake, J. Engelen, M. de Kamps, P. Kooijman, A. Kruse, H. Tiecke, W. Verkerke,M. Vreeswijk, L. Wiggers, E. de Wolf, R. van WoudenbergNIKHEF and University of Amsterdam, Netherlands i
D. Acosta, B. Bylsma, L.S. Durkin, K. Honscheid, C. Li, T.Y. Ling, K.W. McLean23, W.N. Murray, I.H. Park,T.A. Romanowski24, R. Seidlein25
Ohio State University, Physics Department, Columbus, Ohio, USA p
D.S. Bailey, G.A. Blair26, A. Byrne, R.J. Cashmore, A.M. Cooper-Sarkar, D. Daniels27,R.C.E. Devenish, N. Harnew, M. Lancaster, P.E. Luffman28, L. Lindemann4, J.D. McFall, C. Nath, V.A. Noyes,A. Quadt, H. Uijterwaal, R. Walczak, F.F. Wilson, T. YipDepartment of Physics, University of Oxford, Oxford, U.K. o
G. Abbiendi, A. Bertolin, R. Brugnera, R. Carlin, F. Dal Corso, M. De Giorgi, U. Dosselli,S. Limentani, M. Morandin, M. Posocco, L. Stanco, R. Stroili, C. VociDipartimento di Fisica dell’ Universita and INFN, Padova, Italy f
II

J. Bulmahn, J.M. Butterworth, R.G. Feild, B.Y. Oh, J.J. Whitmore29
Pennsylvania State University, Dept. of Physics, University Park, PA, USA q
G. D’Agostini, G. Marini, A. Nigro, E. TassiDipartimento di Fisica, Univ. ’La Sapienza’ and INFN, Rome, Italy f
J.C. Hart, N.A. McCubbin, K. Prytz, T.P. Shah, T.L. ShortRutherford Appleton Laboratory, Chilton, Didcot, Oxon, U.K. o
E. Barberis, T. Dubbs, C. Heusch, M. Van Hook, B. Hubbard, W. Lockman, J.T. Rahn,H.F.-W. Sadrozinski, A. SeidenUniversity of California, Santa Cruz, CA, USA p
J. Biltzinger, R.J. Seifert, A.H. Walenta, G. ZechFachbereich Physik der Universitat-Gesamthochschule Siegen, Federal Republic of Germany c
H. Abramowicz, G. Briskin, S. Dagan30, A. Levy31
School of Physics,Tel-Aviv University, Tel Aviv, Israel e
T. Hasegawa, M. Hazumi, T. Ishii, M. Kuze, S. Mine, Y. Nagasawa, M. Nakao, I. Suzuki, K. Tokushuku, S. Ya-mada, Y. YamazakiInstitute for Nuclear Study, University of Tokyo, Tokyo, Japan g
M. Chiba, R. Hamatsu, T. Hirose, K. Homma, S. Kitamura, Y. Nakamitsu, K. YamauchiTokyo Metropolitan University, Dept. of Physics, Tokyo, Japan g
R. Cirio, M. Costa, M.I. Ferrero, L. Lamberti, S. Maselli, C. Peroni, R. Sacchi, A. Solano, A. StaianoUniversita di Torino, Dipartimento di Fisica Sperimentale and INFN, Torino, Italy f
M. DardoII Faculty of Sciences, Torino University and INFN - Alessandria, Italy f
D.C. Bailey, D. Bandyopadhyay, F. Benard, M. Brkic, M.B. Crombie, D.M. Gingrich32, G.F. Hartner, K.K. Joo,G.M. Levman, J.F. Martin, R.S. Orr, C.R. Sampson, R.J. TeuscherUniversity of Toronto, Dept. of Physics, Toronto, Ont., Canada a
C.D. Catterall, T.W. Jones, P.B. Kaziewicz, J.B. Lane, R.L. Saunders, J. ShulmanUniversity College London, Physics and Astronomy Dept., London, U.K. o
K. Blankenship, B. Lu, L.W. MoVirginia Polytechnic Inst. and State University, Physics Dept., Blacksburg, VA, USA q
W. Bogusz, K. Charchu la, J. Ciborowski, J. Gajewski, G. Grzelak, M. Kasprzak, M. Krzyzanowski,K. Muchorowski, R.J. Nowak, J.M. Pawlak, T. Tymieniecka, A.K. Wroblewski, J.A. Zakrzewski, A.F. ZarneckiWarsaw University, Institute of Experimental Physics, Warsaw, Poland j
M. AdamusInstitute for Nuclear Studies, Warsaw, Poland j
Y. Eisenberg30, U. Karshon30, D. Revel30, D. Zer-ZionWeizmann Institute, Nuclear Physics Dept., Rehovot, Israel d
I. Ali, W.F. Badgett, B. Behrens, S. Dasu, C. Fordham, C. Foudas, A. Goussiou, R.J. Loveless, D.D. Reeder,S. Silverstein, W.H. Smith, A. Vaiciulis, M. WodarczykUniversity of Wisconsin, Dept. of Physics, Madison, WI, USA p
T. TsurugaiMeiji Gakuin University, Faculty of General Education, Yokohama, Japan
S. Bhadra, M.L. Cardy, C.-P. Fagerstroem, W.R. Frisken, K.M. Furutani, M. Khakzad, W.B. SchmidkeYork University, Dept. of Physics, North York, Ont., Canada a
III

1 supported by Worldlab, Lausanne, Switzerland2 also at IROE Florence, Italy3 now at Univ. of Salerno and INFN Napoli, Italy4 supported by EU HCM contract ERB-CHRX-CT93-03765 now a self-employed consultant6 on leave of absence7 now at Institut fur Hochenergiephysik, Univ. Heidelberg8 now at MPI Berlin9 now also at University of Torino
10 Alfred P. Sloan Foundation Fellow11 presently at Columbia Univ., supported by DAAD/HSPII-AUFE12 now at Inst. of Computer Science, Jagellonian Univ., Cracow13 now at Univ. of Mainz14 supported by DAAD and European Community Program PRAXIS XXI15 supported by the European Community16 now with OPAL Collaboration, Faculty of Physics at Univ. of Freiburg17 now at SAS-Institut GmbH, Heidelberg18 also supported by DESY19 now at GSI Darmstadt20 also supported by NSERC21 now at Institute for Cosmic Ray Research, University of Tokyo22 on leave of absence at DESY, supported by DGICYT23 now at Carleton University, Ottawa, Canada24 now at Department of Energy, Washington25 now at HEP Div., Argonne National Lab., Argonne, IL, USA26 now at RHBNC, Univ. of London, England27 Fulbright Scholar 1993-199428 now at Cambridge Consultants, Cambridge, U.K.29 on leave and partially supported by DESY 1993-9530 supported by a MINERVA Fellowship31 partially supported by DESY32 now at Centre for Subatomic Research, Univ.of Alberta, Canada and TRIUMF, Vancouver, Canada
a supported by the Natural Sciences and Engineering Research Council of Canada (NSERC)b supported by the FCAR of Quebec, Canadac supported by the German Federal Ministry for Research and Technology (BMFT)d supported by the MINERVA Gesellschaft fur Forschung GmbH, and by the Israel Academy of
Sciencee supported by the German Israeli Foundation, and by the Israel Academy of Sciencef supported by the Italian National Institute for Nuclear Physics (INFN)g supported by the Japanese Ministry of Education, Science and Culture (the Monbusho) and its
grants for Scientific Researchh supported by the Korean Ministry of Education and Korea Science and Engineering Foundationi supported by the Netherlands Foundation for Research on Matter (FOM)j supported by the Polish State Committee for Scientific Research (grant No. SPB/P3/202/93) and
the Foundation for Polish- German Collaboration (proj. No. 506/92)k supported by the Polish State Committee for Scientific Research (grant No. PB 861/2/91 and No.
2 2372 9102, grant No. PB 2 2376 9102 and No. PB 2 0092 9101)l partially supported by the German Federal Ministry for Research and Technology (BMFT)m supported by the German Federal Ministry for Research and Technology (BMFT), the Volkswagen
Foundation, and the Deutsche Forschungsgemeinschaftn supported by the Spanish Ministry of Education and Science through funds provided by CICYTo supported by the Particle Physics and Astronomy Research Councilp supported by the US Department of Energyq supported by the US National Science Foundation
IV

1 Introduction
HERA is a prodigious source of quasi–real photons from reactions where the electron is scatteredat very small angles. This permits the study of photoproduction reactions at photon–protoncentre of mass (c.m.) energies an order of magnitude larger than in previous fixed targetexperiments.The majority of the γp collisions are due to interactions of the proton with the hadronicstructure of the photon, a process that has been successfully described by the vector mesondominance model (VDM)[1]. Here, the photon is pictured to fluctuate into a virtual vectormeson that subsequently collides with the proton. Such collisions exhibit the phenomenologicalcharacteristics of hadron–hadron interactions. In particular they can proceed via diffractiveor non–diffractive channels. The diffractive interactions are characterized by very small fourmomentum transfers and no colour exchange between the colliding particles leading to finalstates where the colliding particles appear either intact or as more massive dissociated states.However, it has been previously demonstrated that photoproduction collisions at high transversemomentum cannot be described solely in terms of the fluctuation of the photon into a hadron–like state [2, 3]. The deviations come from contributions of two additional processes called directand anomalous. In the former process the photon couples directly to the charged partons insidethe proton. The anomalous component corresponds to the process where the photon couplesto a qq pair without forming a bound state. The interactions of the photon via the hadron–likestate and the anomalous component are referred to as resolved photoproduction, since both ofthem can be described in terms of the partonic structure of the photon [4].In this paper we present the measurement of the transverse momentum spectra of chargedparticles produced in photoproduction reactions at an average c.m. energy of 〈W 〉 = 180 GeVand in the laboratory pseudorapidity range −1.2 < η < 1.4 1. This range approximatelycorresponds to the c.m. pseudorapidity interval of 0.8 < ηc.m. < 3.4, where the direction isdefined such that positive ηc.m. values correspond to the photon fragmentation region. Thetransverse momentum distributions of charged particles are studied for non–diffractive anddiffractive reactions separately. The pT spectrum from non–diffractive events is compared tolow energy photoproduction data and to hadron–hadron collisions at a similar c.m. energy. Inthe region of high transverse momenta we compare the data to the predictions of a next–to–leading order QCD calculation.The diffractive reaction (γp → Xp), where X results from the dissociation of the photon, waspreviously measured by the E612 Fermilab experiment at much lower c.m. energies, 11.8 <W < 16.6 GeV [5]. It was demonstrated that the properties of the diffractive excitation of thephoton resemble diffraction of hadrons in terms of the distribution of the dissociated mass, thedistribution of the four-momentum transfer between the colliding objects [5] and the ratio ofthe diffractive cross section to the total cross section [6]. The hadronization of diffractivelydissociated photons has not yet been systematically studied. In this analysis we present themeasurement of inclusive pT spectra in two intervals of the dissociated photon mass with meanvalues of 〈MX〉 = 5 GeV and 〈MX〉 = 10 GeV.
1Pseudorapidity η is calculated from the relation η = −ln(tan(θ/2)), where θ is a polar angle calculatedwith respect to the proton beam direction.
1

2 Experimental setup
The analysis is based on data collected with the ZEUS detector in 1993, corresponding to anintegrated luminosity of 0.40 pb−1. The HERA machine was operating at an electron energy of26.7 GeV and a proton energy of 820 GeV, with 84 colliding bunches. In addition 10 electronand 6 proton bunches were left unpaired for background studies (pilot bunches).A detailed description of the ZEUS detector may be found elsewhere [7, 8]. Here, only a briefdescription of the detector components used for this analysis is given. Throughout this paperthe standard ZEUS right–handed coordinate system is used, which has its origin at the nominalinteraction point. The positive Z–axis points in the direction of the proton beam, called theforward direction, and X points towards the centre of the HERA ring.Charged particles created in ep collisions are tracked by the inner tracking detectors whichoperate in a magnetic field of 1.43 T provided by a thin superconducting solenoid. Immediatelysurrounding the beampipe is the vertex detector (VXD), a cylindrical drift chamber whichconsists of 120 radial cells, each with 12 sense wires running parallel to the beam axis [9].The achieved resolution is 50 µm in the central region of a cell and 150 µm near the edges.Surrounding the VXD is the central tracking detector (CTD) which consists of 72 cylindricaldrift chamber layers organized in 9 superlayers [10]. These superlayers alternate between thosewith wires parallel to the collision axis and those with wires inclined at a small angle to providea stereo view. The magnetic field is significantly inhomogeneous towards the ends of the CTDthus complicating the electron drift. With the present understanding of the chamber, a spatialresolution of ≈ 260 µm has been achieved. The hit efficiency of the chamber is greater than95%.In events with charged particle tracks, using the combined data from both chambers, theposition resolution of the reconstructed primary vertex are 0.6 cm in the Z direction and 0.1 cmin the XY plane. The resolution in transverse momentum for full length tracks is σpT
/pT ≤0.005 · pT ⊕ 0.016 (pT in GeV). The description of the track and the vertex reconstructionalgorithms may be found in [11] and references therein.The solenoid is surrounded by the high resolution uranium–scintillator calorimeter (CAL) di-vided into the forward (FCAL), barrel (BCAL) and rear (RCAL) parts [12]. Holes of 20×20 cm2
in the centre of FCAL and RCAL are required to accommodate the HERA beam pipe. Eachof the calorimeter parts is subdivided into towers which in turn are segmented longitudinallyinto electromagnetic (EMC) and hadronic (HAC) sections. These sections are further subdi-vided into cells, which are read out by two photomultiplier tubes. Under test beam condi-
tions, an energy resolution of the calorimeter of σE/E = 0.18/√
E( GeV) for electrons and
σE/E = 0.35/√
E( GeV) for hadrons was measured. In the analysis presented here CAL cells
with an EMC (HAC) energy below 60 MeV (110 MeV) are excluded to minimize the effect ofcalorimeter noise. This noise is dominated by uranium activity and has an r.m.s. value below19 MeV for EMC cells and below 30 MeV for HAC cells.The luminosity detector (LUMI) measures the rate of the Bethe–Heitler process ep → eγp. Thedetector consists of two lead–scintillator sandwich calorimeters installed in the HERA tunneland is designed to detect electrons scattered at very small angles and photons emitted along theelectron beam direction [13]. Signals in the LUMI electron calorimeter are used to tag eventsand to measure the energy of the interacting photon, Eγ, from Eγ = Ee −E ′
e = 26.7 GeV−E′
e,where E ′
e is the energy measured in the LUMI.
2

3 Trigger
The events used in the following analysis were collected using a trigger requiring a coincidenceof the signals in the LUMI electron calorimeter and in the central calorimeter. The smallangular acceptance of the LUMI electron calorimeter implied that in all the triggered eventsthe virtuality of the exchanged photon was between 4 · 10−8 < Q2 < 0.02 GeV2.The central calorimeter trigger required an energy deposit in the RCAL EMC section of morethan 464 MeV (excluding the towers immediately adjacent to the beam pipe) or 1250 MeV(including those towers). In addition we also used the events triggered by an energy in theBCAL EMC section exceeding 3400 MeV. At the trigger level the energy was calculated usingonly towers with more than 464 MeV of deposited energy.
4 Event selection
In the offline analysis the energy of the scattered electron detected in the LUMI calorimeterwas required to satisfy 15.2 < E′
e < 18.2 GeV, limiting the γp c.m. energy to the interval167 < W < 194 GeV. The longitudinal vertex position determined from tracks was requiredto be −35 cm < Zvertex < 25 cm. The vertex cut removed a substantial part of the beam gasbackground and limited the data sample to the region of uniform detector acceptance. Thecosmic ray background was suppressed by requiring the transverse momentum imbalance of thedeposits in the main calorimeter, Pmissing, relative to the square root of the total transverseenergy,
√ET , to be small: Pmissing/
√ET < 2
√GeV.
The data sample was divided into a diffractive and a non–diffractive subset according to thepseudorapidity, ηmax, of the most forward energy deposit in the FCAL with energy above400 MeV. The requirement of ηmax < 2 selects events with a pronounced rapidity gap that arepredominantly due to diffractive processes (≈ 96% according to Monte Carlo (MC) simulation,see section 6). The events with ηmax > 2 are almost exclusively (≈ 95%) due to non-diffractivereactions. The final non–diffractive data sample consisted of 149500 events.For the diffractive data sample (ηmax < 2) an additional cut ηmax > −2 was applied to suppressthe production of light vector mesons V in the diffractive reactions γp → V p and γp →V N , where N denotes a nucleonic system resulting from the dissociation of the proton. Theremaining sample was analyzed as a function of the mass of the dissociated system reconstructedfrom the empirical relationship
MXrec ≈ A ·√
E2 − P 2Z + B = A ·
√
(E + PZ) · Eγ + B.
The above formula exploits the fact that in tagged photoproduction the diffractively excitedphoton state has a relatively small transverse momentum. The total hadronic energy, E,and longitudinal momentum PZ = E · cosθ were measured with the uranium calorimeter bysumming over all the energy deposits of at least 160 MeV. The correction factors A = 1.7and B = 1.0 GeV compensate for the effects of energy loss in the inactive material, beam pipeholes, and calorimeter cells that failed the energy threshold cuts. The formula was optimized togive the best approximation of the true invariant mass in diffractive photon dissociation eventsobtained from MC simulations, while being insensitive to the calorimeter noise. The diffractivedata were analyzed in two intervals of the reconstructed mass, namely 4 < MX rec < 7GeV and8 < MX rec < 13 GeV. According to the MC simulation the first cut selects events generatedwith a mass having a mean value and spread of 〈MX GEN〉 = 5 GeV and r.m.s. = 1.8GeV. The
3

second cut results in 〈MXGEN〉 = 10 GeV and r.m.s. = 2.3 GeV. Details of the MC simulationare given in section 6. The final data sample consisted of 5123 events in the lower MX intervaland of 2870 events in the upper interval.The contamination of the final data samples from e–gas background ranges from < 0.1% (non-diffractive sample) to ≈ 10% (diffractive sample, 〈MX〉 = 5 GeV). The p–gas contribution isbetween 1% (non-diffractive sample) and 2% (diffractive sample, 〈MX〉 = 5 GeV). The e–gasbackground was statistically subtracted using the electron pilot bunches. A similar methodwas used to correct for the p–gas background that survived the selection cuts because of anaccidental coincidence with an electron bremsstrahlung (ep → γep). A large fraction of thesebackground events were identified using the LUMI detector, since the energy deposits in theelectron and photon calorimeters summed up to the electron beam energy. The identifiedbackground events were included with negative weights into all of the distributions in order tocompensate for the unidentified part of the coincidence background. A detailed description ofthe statistical background subtraction method may be found in [6, 14].
5 Track selection
The charged tracks used for this analysis were selected with the following criteria:
• only tracks accepted by an event vertex fit were selected. This eliminated most of thetracks that came from secondary interactions and decays of short lived particles;
• tracks must have hits in each of the first 5 superlayers of the CTD. This requirementensures that only long, well reconstructed tracks are used for the analysis;
• −1.2 < η < 1.4 and pT > 0.3 GeV. These two cuts select the region of high acceptanceof the CTD where the detector response and systematics are best understood.
Using Monte Carlo events, we estimated that the efficiency of the charged track reconstructionconvoluted with the acceptance of the selection cuts is about 90% and is uniform in pT . Thecontamination of the final sample from secondary interaction tracks, products of decays of shortlived particles, and from spurious tracks (artifacts of the reconstruction algorithm) ranges from5% at pT = 0.3 GeV to 3% for pT > 1 GeV. The inefficiency and remaining contamination ofthe final track sample is accounted for by the acceptance correction described in the followingsection.The transverse momenta of the measured tracks displayed no correlation with η over the con-sidered interval and were symmetric with respect to the charge assigned to the track.
6 Monte Carlo models
For the acceptance correction and selection cut validation we used Monte Carlo events gen-erated with a variety of programs. Soft, non-diffractive collisions of the proton with a VDMtype photon were generated using HERWIG 5.7 with the minimum bias option [15]. The gen-erator was tuned to fit the ZEUS data on charged particle multiplicity and transverse energydistributions. For the evaluation of the model dependence of our measurements we also usedevents from the PYTHIA generator with the soft hadronic interaction option [16]. Hard re-solved and direct subprocesses were simulated using the standard HERWIG 5.7 generator withthe lower cut-off on the transverse momentum of the final–state partons, pTmin, chosen to be
4

2.5 GeV. For the parton densities of the colliding particles, the GRV–LO [17] (for the photon)and MRSD′ [18] (for the proton) parametrisations were used. As a cross–check we also usedhard γp scattering events generated by PYTHIA with pTmin = 5 GeV. The soft and hard MCcomponents were combined in a ratio that gave the best description of the transverse momen-tum distribution of the track with the largest pT in each event. For pTmin = 2.5 GeV, the hardcomponent comprises 11% of the non-diffractive sample and for pTmin = 5GeV only about 3%.Each diffractive subprocess was generated separately. The diffractive production of vectormesons (ρ, ω, φ) was simulated with PYTHIA. The same program was used to simulate the dou-ble diffractive dissociation (γp → XN). The diffractive excitation of the photon (γp → Xp) wasgenerated with the EPDIF program which models the diffractive system as a quark–antiquarkpair produced along the collision axis [19]. Final state QCD radiation and hadronization weresimulated using JETSET [16]. For the study of systematic uncertainties, a similar sample ofevents was obtained by enriching the standard PYTHIA diffractive events with the hard com-ponent simulated using the POMPYT Monte Carlo program (hard, gluonic pomeron with thedirect photon option) [20].The MC samples corresponding to the diffractive subprocesses were combined with the non-diffractive component in the proportions given by the ZEUS measurement of the partial pho-toproduction cross sections [6]. The MC events were generated without electroweak radiativecorrections. In the considered W range, the QED radiation effects result in ≈ 2% change in thenumber of measured events so that the effect on the results of this analysis are negligible. Thegenerated events were processed through the detector and trigger simulation programs and runthrough the standard ZEUS reconstruction chain.
7 Acceptance correction
The acceptance corrected transverse momentum spectrum was derived from the reconstructedspectrum of charged tracks, by means of a multiplicative correction factor, calculated usingMonte Carlo techniques:
C(pT ) = (1
Ngen ev
· dNgen
dpTgen
)/(1
Nrec ev
· dNrec
dpTrec
).
Ngen denotes the number of primary charged particles generated with a transverse momentumpTgen in the considered pseudorapidity interval and Ngen ev is the number of generated events.Only the events corresponding to the appropriate type of interaction were included, e.g. for thelower invariant mass interval of the diffractive sample only the Monte Carlo events correspond-ing to diffractive photon dissociation with the generated invariant mass 4 < MXgen < 7 GeVwere used. Nrec is the number of reconstructed tracks passing the experimental cuts with areconstructed transverse momentum of pTrec, while Nrec ev denotes the number of events used.Only the events passing the trigger simulation and the experimental event selection criteriawere included in the calculation. To account for the contribution of all the subprocesses, thecombination of the MC samples described in section 6 was used.This method corrects for the following effects in the data:
• the limited trigger acceptance;
• the inefficiencies of the event selection cuts, in particular the contamination of the diffrac-tive spectra from non–diffractive processes and the events with a dissociated mass that
5

was incorrectly reconstructed. Also the non-diffractive sample is corrected for the con-tamination from diffractive events with high dissociated mass;
• limited track finding efficiency and acceptance of the track selection cuts, as well as thelimited resolution in momentum and angle;
• loss of tracks due to secondary interactions and contamination from secondary tracks;
• decays of charged pions and kaons, photon conversions and decays of lambdas and neutralkaons. Thus, in the final spectra the charged kaons appear, while the decay products ofneutral kaons and lambdas do not. For all the other strange and charmed states, thedecay products were included.
The validity of our acceptance correction method relies on the correct simulation of the de-scribed effects in the Monte Carlo program. The possible discrepancies between reality andMonte Carlo simulation were analyzed and the estimation of the effect on the final distribu-tions was included in the systematic uncertainty, as described in the following section.
8 Systematic effects
One of the potential sources of systematic inaccuracy is the tracking system and its simulationin the Monte Carlo events used for the acceptance correction. Using an alternative simulationcode with artificially degraded tracking performance we verified that the efficiency to find atrack which fulfills all the selection cuts is known with an accuracy of about 10%. The errordue to an imprecise description of the momentum resolution at high pT is negligible comparedto the statistical precision of the data. We also verified that the final spectra would not changesignificantly if the tracking resolution at high pT had non–gaussian tails at the level of 10% orif the measured momentum was systematically shifted from the true value by the momentumresolution.Another source of systematic uncertainty is the Monte Carlo simulation of the trigger response.We verified that even a very large (20%) inaccuracy of the BCAL energy threshold would notproduce a statistically significant effect. An incorrect RCAL trigger simulation would changethe number of events observed, but would not affect the final pT spectra since it is normalizedto the number of events. The correlation between the RCAL energy and the pT of tracks isvery small.To evaluate the model dependence we repeated the calculation of the correction factors usingan alternative set of Monte Carlo programs (see section 6) and compared the results with theoriginal ones. The differences between the obtained factors varied between 5% for the highmass diffractive sample and 11% for the non–diffractive one. The sensitivity of the result to theassumed relative cross sections of the physics processes was checked by varying the subprocessratios within the error limits given in [6]. The effect was at most 3%.All the above effects were combined in quadrature, resulting in an overall systematic uncertaintyof the charged particle rates as follows: 15% in the non-diffractive sample, 15% in the 〈MX〉 =5GeV diffractive sample and 9% in the 〈MX〉 = 10GeV diffractive sample. All these systematicerrors are independent of pT .
6

9 Results
The double differential rate of charged particle production in an event of a given type is calcu-lated as the number of charged particles ∆N produced within ∆η and ∆pT in Nev events as afunction of pT :
1
Nev
· d2N
dp2T dη
=1
Nev
· 1
2pT ∆η· ∆N
∆pT
.
The charged particle transverse momentum spectrum was derived from the transverse momen-tum distribution of observed tracks normalized to the number of data events by means of thecorrection factor described in section 7. The resulting charged particle production rates indiffractive and non-diffractive events are presented in Fig. 1 and listed in Tables 1, 2 and 3.In the figure the inner error bars indicate the statistical error. Quadratically combined sta-tistical and systematic uncertainties are shown as the outer error bars. The 〈MX〉 = 5 GeVdiffractive spectrum extends to pT = 1.75GeV and the 〈MX〉 = 10GeV distribution extends topT = 2.5GeV. The non–diffractive distribution falls steeply in the low pT region but lies abovethe exponential fit at higher pT values. The measurements extend to pT = 8 GeV.The soft interactions of hadrons can be successfully described by thermodynamic models thatpredict a steep fall of the transverse momentum spectra that can be approximated with theexponential form [21]:
1
Nev
· d2N
dp2T dη
= exp(a − b ·√
p2T + m2
π) (1)
where mπ is the pion mass. The results of the fits of this function to ZEUS data in the interval0.3 < pT < 1.2 GeV are also shown as the full line in Fig. 1. The resulting values of theexponential slope b are listed in Table 4. The systematic errors were estimated by varying therelative inclusive cross sections within the systematic error limits (see section 8) and by varyingthe upper boundary of the fitted interval from pT = 1.0 GeV to 1.4 GeV.In Fig. 2 we present a comparison of the b parameter resulting from the fits of (1) to proton-proton and proton-antiproton data as a function of the c.m. energy. The slope of the ZEUSnon-diffractive spectrum agrees with the data from hadron–hadron scattering at an energy closeto the ZEUS photon–proton c.m. energy. The diffractive slopes agree better with the hadronicdata corresponding to a lower energy. In Fig. 2 the ZEUS diffractive points are plotted at 5GeVand 10 GeV, the values of the invariant mass of the dissociated photon. A similar behaviourhas been observed for the diffractive dissociation of protons, i.e. the scale of the fragmentationof the excited system is related to the invariant mass rather than to the total c.m. energy [22].The dashed line in Fig. 2 is a parabola in log(s) and was fitted to all the hadron–hadron pointsto indicate the trend of the data. As one can see, our photoproduction results are consistentwith the hadronic data.The non–diffractive spectrum in Fig. 1 clearly departs from the exponential shape at high pT
values. Such a behaviour is expected from the contribution of the hard scattering of partonicconstituents of the colliding particles, a process that can be described in the framework ofperturbative QCD. It results in a high pT behaviour of the inclusive spectrum that can beapproximated by a power law formula:
1
Nev
· d2N
dp2Tdη
= A · (1 +pT
pT 0
)−n (2)
where A, pT 0 and n are parameters determined from the data. The fit to the ZEUS points inthe region of pT > 1.2 GeV gives a good description of the data and results in the parameter
7

values pT 0 = 0.54 GeV, n = 7.25 and A = 394 GeV−2. The statistical precision of thesenumbers is described by the covariance matrix shown in Table 5. The fitted function is shownin Fig. 1 as the dotted line.In Fig. 3 the ZEUS data are presented together with the results of a similar measurement fromthe H1 collaboration at 〈W 〉 = 200 GeV [29] and the data from the WA69 photoproductionexperiment at a c.m. energy of 〈W 〉 = 18 GeV [2]. For the purpose of this comparison, theinclusive cross sections published by those experiments were divided by the corresponding totalphotoproduction cross sections [30, 31]. Our results are in agreement with the H1 data. Thecomparison with the WA69 data shows that the transverse momentum spectrum becomes harderas the energy of the γp collision increases. Figure 3 also shows the functional fits of the form(2) to pp data from UA1 and CDF at various c.m. energies [27, 28]. Since the fits correspondto inclusive cross sections published by these experiments, they have been divided by the crosssection values used by these experiments for the absolute normalization of their data. Theinclusive pT distribution from our photoproduction data is clearly harder than the distributionfor pp interactions at a similar c.m. energy and in fact is similar to pp at
√s = 900 GeV.
This comparison indicates that in spite of the apparent similarity in the low pT region betweenphotoproduction and proton–antiproton collisions at a similar c.m. energy, the two reactions aredifferent in the hard regime. There are many possible reasons for this behaviour. Firstly, bothof the pp experiments used for the comparison measured the central rapidity region (|η| < 2.5for UA1 and |η| < 1 for CDF), while our data correspond to 0.8 < ηc.m. < 3.4. Secondly,according to VDM, the bulk of the γp collisions can be approximated as an interaction of avector meson V with the proton. The pT spectrum of V p collisions may be harder than pp at asimilar c.m. energy, since the parton momenta of quarks in mesons are on average larger than inbaryons. Thirdly, in the picture where the photon consists of a resolved part and a direct part,both the anomalous component of the resolved photon and the direct photon become significantat high pT and make the observed spectrum harder compared to that of V p reactions.Figure 4 shows the comparison of our non–diffractive data with the theoretical predictionobtained recently from NLO QCD calculations [32]. The charged particle production rates in anon–diffractive event were converted to inclusive non-diffractive cross sections by multiplyingby the non–diffractive photoproduction cross section of σnd(γp → X) = 91 ± 11 µb [6]. Thetheoretical calculations relied on the GRV parametrisation of the parton densities in the photonand on the CTEQ2M parametrisation for partons in the proton[33]. The NLO fragmentationfunctions describing the relation between the hadronic final state and the partonic level werederived from the e+e− data [34]. The calculation depends strongly on the parton densities inthe proton and in the photon, yielding a spread in the predictions of up to 30% due to theformer and 20% due to the latter. The factorization scales of the incoming and outgoing partonlines, as well as the renormalization scale, were set to pT . The uncertainty due to the ambiguityof this choice was estimated by changing all three scales up and down by a factor of 2. Theestimates of the theoretical errors were added in quadrature and indicated in Fig. 4 as a shadedband. The theoretical calculation is in good agreement with the ZEUS data.
10 Conclusions
We have measured the inclusive transverse momentum spectra of charged particles in diffractiveand non–diffractive photoproduction events with the ZEUS detector. The inclusive transversemomentum spectra fall exponentially in the low pT region, with a slope that increases slightlygoing from the non–diffractive to the diffractive collisions with the lowest MX . The diffractive
8

slopes are consistent with hadronic data at a c.m. energy equal to the invariant mass of thediffractive system. The non–diffractive low pT slope is consistent with the result from ppat a similar c.m. energy but displays a high pT tail clearly departing from the exponentialshape. Compared to photoproduction data at a lower c.m. energy we observe a hardeningof the transverse momentum spectrum as the collision energy increases. The shape of our pT
distribution is comparable to that of pp interactions at√
s = 900 GeV. The results from aNLO QCD calculation agree with the measured cross sections for inclusive charged particleproduction.
11 Acknowledgments
We thank the DESY Directorate for their strong support and encouragement. The remarkableachievements of the HERA machine group were essential for the successful completion of thiswork and are gratefully appreciated. We gratefully acknowledge the support of the DESYcomputing and network services. We would like to thank B.A. Kniehl and G. Kramer for usefuldiscussions and for providing the NLO QCD calculation results.
9

References
[1] T.H.Bauer et al., Rev. Mod. Phys. 50 (1978) 261.
[2] OMEGA Photon Collab., R.J. Apsimon et al., Z. Phys. C43 (1989) 63.
[3] NA14 Collab., E.Auge et al., Phys. Lett. 169B (1986) 163;NA14 Collab., R.Barate et al., Phys. Lett. 174B (1986) 458.
[4] J.K.Storrow, J. Phys. G: Nucl. Part. Phys. 19 (1993) 1641.
[5] T.J.Chapin et al., Phys. Rev. D31 (1985) 17.
[6] ZEUS Collab., M. Derrick et al., Z. Phys. C63 (1994) 391.
[7] The ZEUS Detector, Status Report, DESY(1993).
[8] ZEUS Collab., M. Derrick et al., Phys. Lett. B293 (1992) 465.
[9] C. Alvisi et al., Nucl. Instr. Meth. A305 (1991) 30.
[10] N. Harnew et al., Nucl. Instr. Meth. A279 (1989) 290;C.B. Brooks et al., Nucl. Instr. Meth. A283 (1989) 477;B. Foster et al., Nucl. Phys. B, Proc. Suppl. B32 (1993) 181.
[11] ZEUS Collab., M. Derrick et al., DESY 95–007, accepted by Z. Phys. C.
[12] M. Derrick et al., Nucl. Instr. Meth. A309 (1991) 77;A. Andresen et al., Nucl. Instr. Meth. A309 (1991) 101;A. Bernstein et al., Nucl. Instr. Meth. A336 (1993) 23.
[13] D. Kisielewska et al., DESY-HERA report 85-25 (1985);J. Andruszkow et al., DESY 92-066 (1992);K. Piotrzkowski, PhD Thesis (Cracow, INP-Exp), 1993, DESY F35D-93-06.
[14] B. Burow, PhD Thesis (University of Toronto), 1993, DESY F35D-94-01.
[15] B.R. Webber, Ann. Rev. Nucl. Part. Sci. 36 (1986) 253;G. Marchesini et al., Comput. Phys. Comm. 67 (1992) 465.
[16] T. Sjostrand, Z. Phys. C42 (1989) 301;H-U. Bengtsson and T. Sjostrand, Comput. Phys. Commun. 46 (1987) 43;T. Sjostrand, CERN-TH. 6488/92 (1992).
[17] M. Gluck, E. Reya and A. Vogt, Phys. Rev. D45 (1992) 3986.
[18] A. D. Martin, W. J. Stirling and R. G. Roberts, Phys. Lett. B306 (1993) 145.
[19] N.N. Nikolaev and B.G. Zakharov, Z. Phys. C53 (1992) 331;P. Bruni et al., Proc. Workshop on Physics at HERA, DESY (1991) 363;A. Solano, PhD Thesis (University of Torino), 1993.
[20] P. Bruni and G. Ingelman, DESY 93-187, proceedings of the Europhysics Conf. on HEP,Marseille 1993.
10

[21] R. Hagedorn, Riv. Nouvo Cim. 6 (1983) 1.
[22] K. Goulianos, Phys. Rep. 101 (1983) 169;C. Geich-Gimbel, Int. Jour. Mod. Phys. A4 (1989) 1527;G. Giacomelli, Int. Jour. Mod. Phys. A5 (1990) 223.
[23] J.V.Allaby et al., Fourth International Conference on High Energy Collisions, Oxford(April 1972).
[24] E.W.Anderson et al., Phys. Rev. Lett. 19 (1967) 198.
[25] C.W.Akerlof et al., Phys. Rev. D3 (1971) 645.
[26] P. Capiluppi et al., Nucl. Phys. B70 (1974) 1.
[27] UA1 Collab., C.Albajar et al., Nucl. Phys. B335 (1990) 261.
[28] CDF Collab., F.Abe et al., Phys. Rev. Lett. 61 (1988) 1819.
[29] H1 Collab., I.Abt et al., Phys. Lett. B328 (1994) 176.
[30] H1 Collab., T.Ahmed et al., Phys. Lett. B297 (1992) 205.
[31] H.Abramowicz, E.M.Levin, A.Levy and U.Maor, Phys. Lett. B269 (1991) 465.
[32] F.M. Borzumati, B.A. Kniehl and G. Kramer, Z. Phys. C59 (1993) 341;B.A. Kniehl and G. Kramer, Z. Phys. C62 (1994) 53.
[33] J.F. Botts et al., Michigan State University Report, MSUHEP-93/28.
[34] J. Binnewies, B.A. Kniehl and G. Kramer, DESY 94–124.
11

pT [ GeV] 1
Nev· d2N
dp2
Tdη
[ GeV−2] σstat[ GeV−2] σsyst[ GeV−2]
0.30– 0.40 4.98 0.05 0.740.40– 0.50 2.99 0.03 0.440.50– 0.60 1.78 0.02 0.260.60– 0.70 1.09 0.01 0.160.70– 0.80 0.641 0.012 0.0960.80– 0.90 0.420 0.010 0.0630.90– 1.00 0.259 0.007 0.0381.00– 1.10 0.164 0.005 0.0241.10– 1.20 0.107 0.004 0.0161.20– 1.30 0.0764 0.0034 0.01141.30– 1.40 0.0513 0.0017 0.00771.40– 1.50 0.0329 0.0012 0.00491.50– 1.60 0.0242 0.0010 0.00361.60– 1.70 0.0175 0.0008 0.00261.70– 1.80 0.0133 0.0006 0.00201.80– 1.90 0.0082 0.0005 0.00121.90– 2.00 0.00615 0.00038 0.000922.00– 2.14 0.00454 0.00028 0.000682.14– 2.29 0.00360 0.00024 0.000542.29– 2.43 0.00215 0.00017 0.000322.43– 2.57 0.00166 0.00013 0.000252.57– 2.71 0.00126 0.00012 0.000182.71– 2.86 0.00098 0.00010 0.000152.86– 3.00 0.000625 0.000071 0.0000933.00– 3.25 0.000456 0.000048 0.0000683.25– 3.50 0.000252 0.000031 0.0000373.50– 3.75 0.000147 0.000020 0.0000223.75– 4.00 0.000094 0.000012 0.0000144.00– 4.50 0.000067 0.000008 0.0000104.50– 5.00 0.0000301 0.0000045 0.00000455.00– 5.50 0.0000151 0.0000029 0.00000235.50– 6.00 0.0000082 0.0000021 0.00000126.00– 7.00 0.0000038 0.0000009 0.00000067.00– 8.00 0.0000014 0.0000005 0.0000002
Table 1: The rate of charged particle production in an average non–diffractive event. The datacorrespond to −1.2 < η < 1.4. The σstat and σsyst denote the statistical and systematic errors.
12

pT [ GeV] 1
Nev· d2N
dp2
Tdη
[ GeV−2] σstat[ GeV−2] σsyst[ GeV−2]
0.30– 0.40 1.63 0.06 0.240.40– 0.50 1.02 0.04 0.150.50– 0.60 0.559 0.028 0.0830.60– 0.70 0.308 0.019 0.0460.70– 0.80 0.165 0.013 0.0240.80– 0.90 0.088 0.011 0.0130.90– 1.00 0.0479 0.0059 0.00711.00– 1.10 0.0312 0.0052 0.00461.10– 1.20 0.0196 0.0042 0.00291.20– 1.35 0.0100 0.0018 0.00151.35– 1.50 0.00304 0.00087 0.000451.50– 1.75 0.00153 0.00052 0.00023
Table 2: The rate of charged particle production in an average event with a diffractively disso-ciated photon state of a mass 〈MX〉 = 5 GeV. The data correspond to −1.2 < η < 1.4. Theσstat and σsyst denote the statistical and systematic errors.
pT [ GeV] 1
Nev
· d2Ndp2
Tdη
[ GeV−2] σstat[ GeV−2] σsyst[ GeV−2]
0.30– 0.40 3.87 0.10 0.340.40– 0.50 2.32 0.06 0.200.50– 0.60 1.46 0.04 0.130.60– 0.70 0.803 0.033 0.0720.70– 0.80 0.485 0.023 0.0430.80– 0.90 0.288 0.017 0.0250.90– 1.00 0.176 0.012 0.0151.00– 1.10 0.109 0.009 0.0091.10– 1.20 0.0732 0.0075 0.00651.20– 1.35 0.0294 0.0035 0.00261.35– 1.50 0.0186 0.0028 0.00161.50– 1.75 0.0086 0.0014 0.00081.75– 2.00 0.00260 0.00066 0.000232.00– 2.50 0.00076 0.00023 0.00007
Table 3: The rate of charged particle production in an average event with a diffractively disso-ciated photon state of a mass 〈MX〉 = 10 GeV. The data correspond to −1.2 < η < 1.4. Theσstat and σsyst denote the statistical and systematic errors.
13

sample b[ GeV−1] σstat(b) σsyst(b) a σstat(a) cov(a, b)
non-diffractive 4.94 0.09 0.19 3.39 0.09 -0.011diff 〈MX〉 = 5 GeV 5.91 0.17 0.19 2.78 0.10 -0.016diff 〈MX〉 = 10 GeV 5.28 0.10 0.17 3.34 0.06 -0.006
Table 4: The values of the parameters resulting from the fits of equation (1) to ZEUS data inthe interval 0.3 < pT < 1.2 GeV. The σstat and σsyst indicate the statistical and systematicerrors.
pT 0 n A
pT 0 0.32 · 10−3 0.48 · 10−3 −0.10 · 101
n 0.12 · 10−2 −0.12 · 101
A 0.32 · 104
Table 5: The covariance matrix corresponding to the fit of equation (2) to the non–diffractivedata for pT > 1.2 GeV.
14
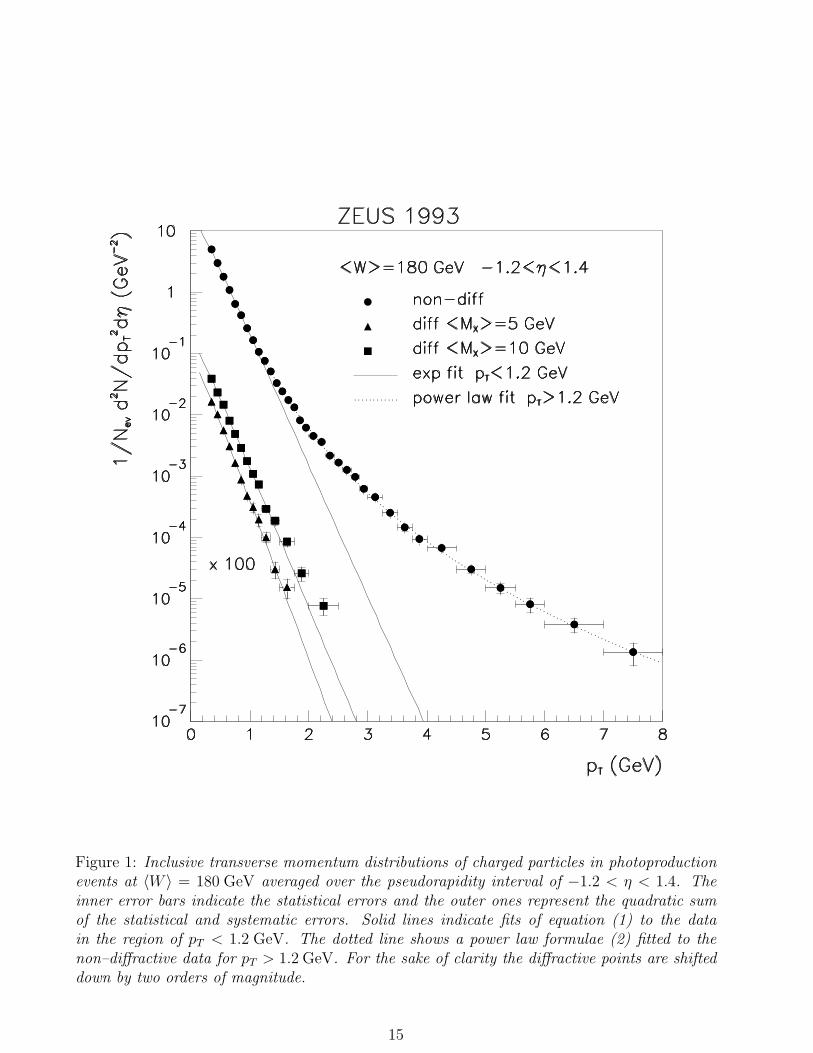
Figure 1: Inclusive transverse momentum distributions of charged particles in photoproductionevents at 〈W 〉 = 180 GeV averaged over the pseudorapidity interval of −1.2 < η < 1.4. Theinner error bars indicate the statistical errors and the outer ones represent the quadratic sumof the statistical and systematic errors. Solid lines indicate fits of equation (1) to the datain the region of pT < 1.2 GeV. The dotted line shows a power law formulae (2) fitted to thenon–diffractive data for pT > 1.2 GeV. For the sake of clarity the diffractive points are shifteddown by two orders of magnitude.
15

Figure 2: Inverse slope of the exponential fit of the form (1) vs. the c.m. energy for differentexperiments. The fixed target data were taken from [23] [24] [25], ISR – [26], UA1– [27]. TheZEUS non–diffractive point is placed at the photon–proton c.m. energy. The diffractive pointsare plotted at the energies corresponding to the mean value of the invariant mass 〈MX〉. Theerror bars indicate the quadratic sum of the statistical and systematic errors. The dashed lineis a parabola in log(s) and was fitted to all the hadron–hadron points to indicate the trend ofthe data.
16

Figure 3: Comparison of ZEUS non–diffractive transverse momentum spectrum with the datafrom H1 [29], OMEGA [2], UA1 [27] and CDF [28]. The inner error bars indicate the statisticalerrors and the outer ones represent the quadratic sum of the statistical and systematic errors.
17
Figure 4: Comparison of the ZEUS inclusive cross sections for non–diffractive photoproductionat 〈Wγp〉 = 180 GeV with the NLO QCD calculation results from [32]. The inner error bars onthe data points indicate the statistical errors and the outer ones represent the quadratic sumof the statistical and systematic errors. The shaded band corresponds to the uncertainty of thetheoretical calculation.
18
Copyright © 2022 FDOKUMEN