Incidents, Deaths, and In-Depth Investigations Associated with Non-Fire Carbon Monoxide from...
30
-
Upload
independent -
Category
Documents
-
view
2 -
download
0
Transcript of Incidents, Deaths, and In-Depth Investigations Associated with Non-Fire Carbon Monoxide from...

Incidents, Deaths, and In-Depth Investigations Associated with Non-Fire Carbon Monoxide from Engine-Driven Generators and Other Engine-Driven
Tools, 1999-2008 Matthew V. Hnatov U.S. Consumer Product Safety Commission Directorate for Epidemiology Division of Hazard Analysis 4330 East West Highway Bethesda, MD 20814 December, 2009
This analysis was prepared by the CPSC staff, has not been reviewed or approved by, and may not necessarily reflect the views of, the Commission.
Page 1

Contents Executive Summary .................................................................................................................................... 4
Introduction ................................................................................................................................................. 6
I. Reported Numbers of Fatalities by EDT Product Type .................................................................. 8
Table 1: Number of Fatal Non-Fire Carbon Monoxide Exposure Incidents and Deaths Reported to CPSC Staff Associated with Engine-Driven Tools, 1999-2008 ............................................................... 9
Table 2: Number of Fatal Non-Fire Carbon Monoxide Poisoning Incidents Reported to CPSC Staff by Number of Deaths per Incident, 1999-2008 ............................................................................................ 10
Table 3: Number of Non-Fire Carbon Monoxide Poisoning Deaths Reported to CPSC Staff Associated with Engine-Driven Tools by Year, 1999-2008 ...................................................................................... 11
Figure 1: Number of Non-Fire Carbon Monoxide Poisoning Deaths Reported to CPSC Staff Associated with Engine-Driven Tools, 1999-2008 ................................................................................. 12
II. Socio-demographics of Victims and EDT Use Patterns ............................................................. 13
Table 4: Non-Fire Carbon Monoxide Poisoning Deaths Reported to CPSC Staff and Associated with Engine-Driven Tools by Age of Victim, 1999-2008 .............................................................................. 13
Table 5: Non-Fire Carbon Monoxide Poisoning Deaths Reported to CPSC Staff and Associated with Engine-Driven Tools by Gender of Victim, 1999-2008 ......................................................................... 13
Table 6: Number of Non-Fire Carbon Monoxide Poisoning Deaths Reported to CPSC Staff and Associated with Engine-Driven Tools by Season, 1999-2008 ................................................................ 15
Table 7: Number of Non-Fire Carbon Monoxide Poisoning Deaths Reported to CPSC Staff and Associated with Engine-Driven Tools by Location, 1999-2008 ............................................................. 15
Table 8: Number of Non-Fire Carbon Monoxide Poisoning Deaths Reported to CPSC Staff and Associated with Engine-Driven Tools by Population Density of Place of Death, 1999-2008 ............... 16
III. Alarm Usage .................................................................................................................................. 17
Table 9: Carbon Monoxide Alarm Usage Associated with Engine-Driven Tools Non-Fire Carbon Monoxide Poisoning Deaths, 1999-2008 ................................................................................................ 17
IV. Hazard Patterns Associated with Generators ............................................................................ 18
Table 10: Non-Fire Carbon Monoxide Poisoning Deaths Reported to CPSC Staff and Associated with Generators by Reason for Use, 1999-2008 ............................................................................................. 19
Table 11: Non-Fire Carbon Monoxide Poisoning Deaths Reported to CPSC Staff and Associated with Generators by Reason for Power Outage, 1999-2008 ............................................................................. 20
Figure 2: Non-Fire Carbon Monoxide Poisoning Deaths Reported to CPSC Staff and Associated with Generators During Power Outages ......................................................................................................... 21
Table 12: Non-Fire Carbon Monoxide Poisoning Deaths in the Home by Location of the Generator, 1999-2008 ............................................................................................................................................... 22
Table 13: Non-Fire CO Fatalities Associated with Generators in the Home Categorized by Status of Ventilation, 1999-2008 ........................................................................................................................... 23
Page 2

Table 14: Non-Fire CO Fatalities Associated with Generators in the Home Categorized by Size of Home, 1999-2008 ................................................................................................................................... 24
Table 15: Non-Fire CO Fatalities Associated with Generators Categorized by Generator Wattage Rating, 1999-2008 ................................................................................................................................... 25
Conclusion ................................................................................................................................................. 26
References .................................................................................................................................................. 27
Appendix A: Epidemiology Data Retrieval Specifics ........................................................................... 28
Appendix B: Carboxyhemoglobin Levels Present In CO Fatalities .................................................... 29
Table B-1: Carboxyhemoglobin Levels Associated with Engine-Driven Tools Non-Fire Carbon Monoxide Poisoning Deaths, 1999-2008 ................................................................................................ 29
Page 3

Executive Summary This report summarizes non-fire carbon monoxide (CO) incidents associated with engine-driven generators and other engine-driven tools that occurred between 1999 and 2008 and were reported to the U.S. Consumer Product Safety Commission (CPSC) staff. Throughout this report, the number of deaths represents a count of the fatalities reported to CPSC staff associated with generators and other engine-driven tools such as power lawn mowers, garden tractors, portable pumps, power sprayers and washers, snow blowers, and concrete saws. New to this report are summaries of fatal non-fire CO incidents where an engine-driven tool (EDT) and one or more other fuel-burning, CO generating consumer products1 may have also been involved and the EDT was believed to be, at least, a contributing factor. These fatalities are characterized in the newly added “Multiple Product” category. This report also provides a more detailed summary of fatal non-fire CO poisoning incidents associated with engine-driven tools found in CPSC’s In-depth Investigation (INDP) File. Some of the findings of this report are provided below. CO Fatalities Associated with All EDTs and by EDT Product Type
• The total fatalities for 1999 through 2008 increased by 118 from the 474 fatalities summarized in the October 2008 report. Eighty-three of these fatalities were reported to CPSC staff since the 2008 report was prepared. The remaining 35 fatalities are newly added with the ‘Multiple Product’ category.
• There were 77 non-fire CO fatalities in 2008 from 52 reported incidents. Seventy of these deaths (46 incidents) were associated with a generator, 3 deaths (3 incidents) were associated with a non-generator EDT, and 4 deaths (3 incidents) were associated with multiple fuel-burning consumer products, one of which was an EDT.
• Five hundred ninety-two fatalities from 458 fatal incidents were associated with the use of engine-driven tools, or engine-driven tools used in conjunction with another potentially CO emitting consumer product from 1999 through 2008.
• Four hundred eighty-one (81%) of these 592 fatalities from 355 incidents were associated with generators, 76 (13%) fatalities from 75 incidents were associated with other engine-driven tools, and 35 fatalities (6%) from 28 incidents involved multiple fuel-burning consumer products, one of which was a generator or other engine-driven tool (OEDT).
• Of the 28 incidents that involved multiple consumer products, all but one incident involved a heating or cooking product, most commonly a portable LP- or kerosene- fueled portable heater. One incident involved a generator and another EDT (a lawnmower).
• Twenty-six percent of generator-related non-fire CO incidents caused multiple fatalities, while all but one of the other engine-driven tool-related incidents (99%) involved a single fatality. Twenty-one percent of multiple product-related non-fire CO incidents caused multiple fatalities.
• Sixty-two percent (298 of 481) of generator-related fatalities occurred between 2005 and 2008.
Socio-demographics of Victims and EDT Use Patterns • Seventy-nine percent of generator-related victims were 25 years old or older, while 100% of other
engine-driven tool-related victims were 25 years old or older. • Nearly three-quarters of the generator-related non-fire CO victims were male, while all but two of
the other engine-driven tool-related fatalities were male (97%).
1 It should be noted that any fuel-burning consumer product has the potential to be CO producing since CO is a by-product of incomplete combustion.
Page 4

• Nearly half of generator-related non-fire CO fatalities (226 of 481) occurred in the four colder months of the year (November through February), while CO fatalities associated with OEDT were only slightly more prevalent in the colder months (39%) than the transitional and warm months (33% and 29%, respectively).
• Over 80% of the generator-related fatalities occurred in the home while over 90% of OEDT fatalities occurred in the home.
• Eighty-eight percent of the generator-related fatalities are known to have occurred in urban or large rural areas and another 11% in small rural and isolated areas.
CO Alarm Usage • A CO alarm was reported to have been present in only 14 of 592 EDT-related CO fatalities. In
nine of the incidents, the alarm was inoperable due to either no batteries or no electric current. The alarm sounded in four incidents, and in one incident the alarm was powered but did not sound. Eight of the nine fatality cases with inoperable alarms were associated with generator usage.
Hazard Patterns Associated with Generators • About one-third of all generator-related non-fire CO deaths (169) were associated with power
outages. Of these 169 fatalities, 50 (30%) occurred in 2005. Twenty-eight of the 2005 fatalities were related to hurricanes or tropical storms and another 20 were related to ice or snow storms (additionally, one fatality was associated with a thunderstorm and for one fatality it could not be determined what caused the power outage).
• Four hundred twenty-two non-fire CO fatalities which occurred at homes were associated with a generator or a generator in use with another CO generating consumer product. Nearly two-thirds (274 of 422 or 65%) occurred when the generator was placed inside the living area of the home including the basement, closets, and doorways, but excluding the garage, enclosed carport, or attached barn.
• In recent years, the most common location of generators associated with CO fatalities has shifted from the basement to the living space of the home. From 2004 through 2008, 33% of CO fatalities in the home occurred with a generator placed in the living space of the home compared to only 15% from 1999 through 2003.
• Two-thirds (170 of 257 or 66%) of generator-related non-fire CO fatalities at home locations (in which information on ventilation of the generator was available) occurred when no ventilation of the generator was attempted.
• Nearly two-thirds (147 of 229 or 64%) of generator-related non-fire CO fatalities at home locations, where the size of the home was known, occurred in houses less than 1,500 square feet in size; 84% (192 of 229) occurred in houses less than 2,000 square feet in size.
• Nearly two-thirds (66%) of CO fatalities were associated with generators in the 3500 to 6499 watts range, and nearly half (47%) were associated with generators in the 5000 to 6499 watts range.
Carboxyhemoglobin Levels in CO Fatality Victims • Over 80% of the engine-driven tools-related CO fatality victims had carboxyhemoglobin (COHb)
levels above the 50% level. Note: Throughout this report the year 2008 is italicized in table headings indicating that incident and death counts may change as additional information is received.
Page 5

Introduction The following CPSC databases were searched to prepare the statistics recorded in this report: the In-depth Investigation (INDP) File, the Injury or Potential Injury Incident (IPII) File, and the Death Certificate (DTHS) File. See Appendix A for the codes and keywords used in the database searches. The data records were combined and correlated to develop the most complete records possible in a single database. At this stage, each record was reviewed to determine if the incident was in scope for this report and to correct any discrepancies between information from the different sources. It should be noted that reporting may not be complete, and this report reflects only those incidents reported and entered into CPSC databases on or before May 29, 2009. All fatal non-fire carbon monoxide (CO) incidents associated with engine-driven tools found during the database search that were determined to be in scope were included.
CPSC records contain information on 592 in scope CO fatalities associated with EDTs. This is an increase of 118 fatalities from the 474 fatalities reported in the October 2008 report on CO fatalities associated with EDTs2. Eighty-three of these 118 fatalities were associated with generators or other engine-driven tools (OEDT) as the only known source of the CO gas. However, this report adds a new category of fatal incidents previously not reported. CPSC staff is aware of 35 non-fire CO fatalities from 28 incidents from 1999 through 2008 which were associated with both an engine-driven tool and another fuel burning, CO producing product (such as a gas space heater, or water heater). One case involved two different engine-driven tools. These incidents were included in this analysis, but, since the exact source of the CO could not be determined, categorized separately in the ‘Multiple Products’ category. In previous reports, since it could not be determined if an EDT alone was the source of the CO, these multiple product-related CO fatalities had not been included. Incidents associated with generators that were specifically reported as integral parts of recreational vehicles (RVs), motor homes, or boats are not within the jurisdiction of the CPSC and thus were considered out of scope and were not included. For example, generators that were reported as mounted to the bottom of an RV were not included, nor were boat generators that were installed by the boat manufacturer. Since incidents in recreational vehicles and boats can be associated with either a portable generator or an integral generator, those incidents in which the type of generator could not be determined were excluded from the analysis. Any incident that was determined to be other than accidental in nature was considered to be out of scope, as were work-related incidents which are not within the jurisdiction of the CPSC. The report is divided into four sections:
I. Reported Numbers of Fatalities by Product Type presents an overall picture of CO fatalities associated with engine-driven tools,
II. Socio-demographics of Victims and EDT Use Patterns presents various socio-demographic summaries helpful in identifying specific characteristics of CO fatality victims and usage patterns such as when and where fatalities occurred,
III. Alarm Usage presents information on CO alarm usage during fatal CO events, and IV. Hazard Patterns Associated with Generators presents data specific to generator usage patterns
which may lead to fatal CO poisoning events.
2 Hnatov, M. V. Incidents, Deaths, and In-Depth Investigations Associated with Non-Fire Carbon Monoxide from Engine-Driven Generators and Other Engine-Driven Tools, 1999-2006. U.S. Consumer Product Safety Commission. October 2008.
Page 6

Additionally, Appendix B presents summary findings on carboxyhemoglobin levels in the blood of victims of CO poisoning, which are helpful in assessing the lethality of the product and the speed of onset of harm.
Page 7

I. Reported Numbers of Fatalities by EDT Product Type As of May 29, 2009, CPSC staff has records indicating that there were 77 fatal non-fire carbon monoxide (CO) exposure incidents involving engine-driven tools between January 1, 2008 and December 31, 2008. Table 1 presents the number of fatal incidents and the number of deaths in 2008 along with a summary of CO incidents and fatalities associated with engine-driven tools for the ten year period from 1999 through 2008. The table reports the number of incidents and deaths by the broad categories of ‘Generators’, ‘Other Engine-Driven Tools’ (OEDTs), and ‘Multiple Products’. New to this report is the reporting of fatal incidents classified as ‘Multiple Products’. These multiple product incidents are fatal CO poisonings which involved multiple fuel-burning consumer products that generate CO, at least one being an EDT, or in which investigating authorities could not determine which of multiple products in use at the time of the incident was the source of the CO. CPSC staff is aware of 35 fatalities associated with multiple consumer products occurring between 1999 and 2008; four of these fatalities occurred in 2008. Incidents involving an EDT and a product that generates CO but is not under CPSC’s jurisdiction such as automobiles, boats, or recreational vehicles were determined to be out of scope and are not included in this report since the source of the fatal CO could not be determined. Within each broad category, the frequency of reports is summarized by product type. Staff is aware of 458 incidents with a total of 592 deaths due to non-fire CO exposure that occurred between 1999 and 2008 involving engine-driven tools. In Table 1, the product type ‘welder’ appears in both the ‘Generator’ and ‘Other Engine-Driven Tool’ categories. Some welding equipment is designed to be used as either a welder or as a generator alone. One of the fatal non-fire CO incidents which occurred between 1999 and 2008 involved the use of a welder as a generator during a power outage. There were three other fatal non-fire CO incidents involving a welder. In one incident the welder was being used as a welder and, in the other two incidents, the reason for usage could not be ascertained. One of the three incidents had two fatalities. These three cases were included in the ‘Other Engine-Driven Tools’ category since there was no evidence that indicated that the welders were being used as generators. All but one of the 35 non-fire CO fatalities in the ‘Multiple Products’ category involved a heating- or cooking-related consumer product other than an EDT. The other case involved the simultaneous running of a generator and a lawn tractor in a closed garage.
Page 8
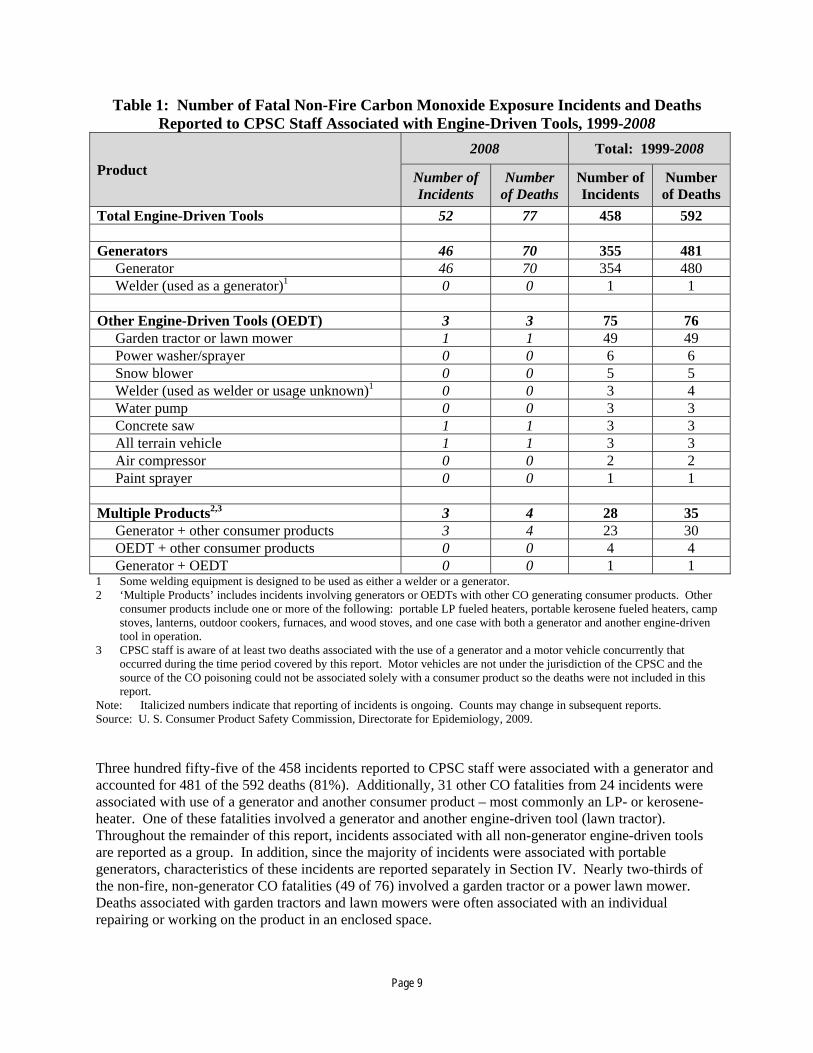
Table 1: Number of Fatal Non-Fire Carbon Monoxide Exposure Incidents and Deaths Reported to CPSC Staff Associated with Engine-Driven Tools, 1999-2008
Product 2008 Total: 1999-2008
Number of Incidents
Number of Deaths
Number of Incidents
Number of Deaths
Total Engine-Driven Tools 52 77 458 592 Generators 46 70 355 481 Generator 46 70 354 480 Welder (used as a generator)1 0 0 1 1 Other Engine-Driven Tools (OEDT) 3 3 75 76 Garden tractor or lawn mower 1 1 49 49 Power washer/sprayer 0 0 6 6 Snow blower 0 0 5 5 Welder (used as welder or usage unknown)1 0 0 3 4 Water pump 0 0 3 3 Concrete saw 1 1 3 3 All terrain vehicle 1 1 3 3 Air compressor 0 0 2 2 Paint sprayer 0 0 1 1 Multiple Products2,3 3 4 28 35 Generator + other consumer products 3 4 23 30 OEDT + other consumer products 0 0 4 4 Generator + OEDT 0 0 1 1 1 Some welding equipment is designed to be used as either a welder or a generator. 2 ‘Multiple Products’ includes incidents involving generators or OEDTs with other CO generating consumer products. Other
consumer products include one or more of the following: portable LP fueled heaters, portable kerosene fueled heaters, camp stoves, lanterns, outdoor cookers, furnaces, and wood stoves, and one case with both a generator and another engine-driven tool in operation.
3 CPSC staff is aware of at least two deaths associated with the use of a generator and a motor vehicle concurrently that occurred during the time period covered by this report. Motor vehicles are not under the jurisdiction of the CPSC and the source of the CO poisoning could not be associated solely with a consumer product so the deaths were not included in this report.
Note: Italicized numbers indicate that reporting of incidents is ongoing. Counts may change in subsequent reports. Source: U. S. Consumer Product Safety Commission, Directorate for Epidemiology, 2009. Three hundred fifty-five of the 458 incidents reported to CPSC staff were associated with a generator and accounted for 481 of the 592 deaths (81%). Additionally, 31 other CO fatalities from 24 incidents were associated with use of a generator and another consumer product – most commonly an LP- or kerosene- heater. One of these fatalities involved a generator and another engine-driven tool (lawn tractor). Throughout the remainder of this report, incidents associated with all non-generator engine-driven tools are reported as a group. In addition, since the majority of incidents were associated with portable generators, characteristics of these incidents are reported separately in Section IV. Nearly two-thirds of the non-fire, non-generator CO fatalities (49 of 76) involved a garden tractor or a power lawn mower. Deaths associated with garden tractors and lawn mowers were often associated with an individual repairing or working on the product in an enclosed space.
Page 9

CPSC staff examined the number of deaths associated with each fatal incident (Table 2). Of the 458 fatal incidents, 78% involved a single fatality. Seventy-four percent (263 of 355) of fatal generator-related incidents involved a single fatality. One incident involving a generator resulted in the deaths of six individuals and another incident involved five fatalities. Of the 75 fatal incidents in the ‘Other Engine-Driven Tools’ category, only one incident resulted in more than one fatality. Twenty-one percent of multiple product fatal CO incidents resulted in multiple fatalities.
Table 2: Number of Fatal Non-Fire Carbon Monoxide Poisoning Incidents Reported to CPSC Staff by Number of Deaths per Incident, 1999-2008
Number of Deaths
Reported in Incident
Total Generator Other Engine-Driven Tools Multiple Products1
All Incidents 458 100% 355 100% 75 100% 28 100% 1 359 78% 263 74% 74 99% 22 79% 2 73 16% 67 19% 1 1% 5 18% 3 20 4% 19 5% 0 0% 1 4% 4 4 1% 4 1% 0 0% 0 0% 5 1 < 1% 1 < 1% 0 0% 0 0% 6 1 < 1% 1 < 1% 0 0% 0 0%
1 ‘Multiple Products’ includes incidents involving generators or OEDTs with other CO generating consumer products. Other consumer products include one or more of the following: portable LP fueled heaters, portable kerosene fueled heaters, camp stoves, lanterns, outdoor cookers, furnaces, and wood stoves, and one case with both a generator and another engine-driven tool in operation.
Notes: Totals may not add to 100% due to rounding. Italicized numbers indicate that reporting of incidents is ongoing. Counts may change in subsequent reports. Source: U. S. Consumer Product Safety Commission, Directorate for Epidemiology, 2009.
CPSC staff summarized the number of reported deaths associated with engine-driven tools by year of death (Table 3). It should be noted that the values in Table 3 represent the number of deaths reported to CPSC staff as of May 29, 2009. Some deaths are reported to CPSC staff shortly after an incident occurs, while other deaths are reported to CPSC staff months or even years after an incident occurs. Therefore, counts for more recent years may not be as complete as counts for earlier years and may change in the future. In recent years, generator-related CO fatalities have been on the rise. For the ten years covered by this report, 62% (298 of 481) of the deaths occurred in the most recent four years (2005 through 2008). The average number of non-fire CO fatalities associated with both generators and other engine-driven tools for years 2004 through 2006 is also presented in Table 3. These three years represent the most recent years for which CPSC staff believes reporting to be substantially complete. Due to reporting delays, these averages may change in the future when data are complete. Figure 1 illustrates the trend in generator-related non-fire CO fatalities since 1999.
Page 10

Table 3: Number of Non-Fire Carbon Monoxide Poisoning Deaths Reported to CPSC Staff Associated with Engine-Driven Tools by Year, 1999-2008
Year Total Generators Other Engine-Driven Tools
Multiple Products1
Total 592 481 76 35 1999 11 6 5 0 2000 26 20 6 0 2001 20 172 2 1 2002 52 42 5 5 2003 66 52 8 6 2004 62 46 13 3 2005 116 923 15 9 2006 101 86 12 3 2007 61 50 7 4 2008 77 70 3 4
Average: 2004-2006 93 75 13 5
1 ‘Multiple Products’ includes incidents involving generators or OEDTs with other CO generating consumer products. Other consumer products include one or more of the following: portable LP fueled heaters, portable kerosene fueled heaters, camp stoves, lanterns, outdoor cookers, furnaces, and wood stoves, and one case with both a generator and another engine-driven tool in operation.
2 This report identifies one less generator-related CO fatality in 2001 than previous reports. A further review of the records identified one case as a work-related incident which is not in scope.
3 This report identifies two less generator-related CO fatalities in 2005 than the previous reports. Additional information obtained by CPSC staff not available at the time the previous report was written indentified two incidents as duplicate reports of incidents already identified in the report.
Notes: Detail averages may not sum to total average due to rounding. Italicized numbers indicate that reporting of incidents is ongoing. Counts may change in subsequent reports. Source: U. S. Consumer Product Safety Commission, Directorate for Epidemiology, 2009
Page 11
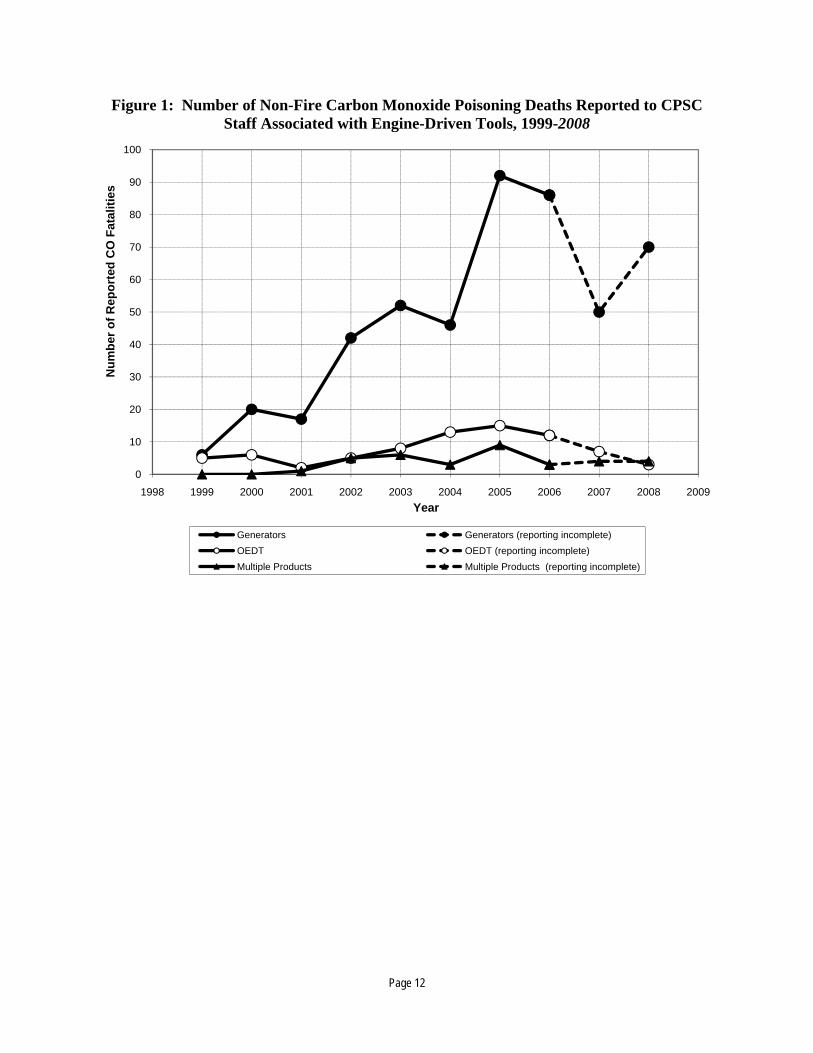
Figure 1: Number of Non-Fire Carbon Monoxide Poisoning Deaths Reported to CPSC Staff Associated with Engine-Driven Tools, 1999-2008
0
10
20
30
40
50
60
70
80
90
100
1998 1999 2000 2001 2002 2003 2004 2005 2006 2007 2008 2009
Num
ber o
f Rep
orte
d C
O F
atal
ities
Year
Generators Generators (reporting incomplete)OEDT OEDT (reporting incomplete)Multiple Products Multiple Products (reporting incomplete)
Page 12

II. Socio-demographics of Victims and EDT Use Patterns This section presents socio-demographic information about the victims of fatal CO poisoning. Tables 4 and 5 present the distribution of age and gender of the victims, respectively. Table 4 shows that victims aged 25 years or older accounted for about 82% (488 of 592) of reported non-fire CO poisoning deaths associated with all engine-driven tools. Victims with a reported age of 25 years or older accounted for about 79% (382 of 481) of non-fire CO poisoning deaths associated with generators and accounted for all deaths associated with other engine-driven tools. Eighty-two percent of the non-fire CO fatalities associated with non-generator engine-driven tools (62 of 76) were aged 45 or older with no reported fatalities of individuals younger than 25. Male victims accounted for 78% of the deaths associated with all engine-driven tools. Male victims comprised 74% of the deaths associated with generators and 97% of non-generator engine-driven tool fatalities (Table 5).
Table 4: Non-Fire Carbon Monoxide Poisoning Deaths Reported to CPSC Staff and
Associated with Engine-Driven Tools by Age of Victim, 1999-2008
Age Number of Deaths Reported to CPSC
All Engine-Driven Tools Generators Other Engine-Driven
Tools Multiple Products1
Total 592 100% 481 100% 76 100% 35 100% Under 5 12 2% 12 2% 0 0% 0 0% 5 – 14 22 4% 22 5% 0 0% 0 0%
15 – 24 58 10% 53 11% 0 0% 5 14% 25 – 44 179 30% 157 33% 14 18% 8 23% 45 – 64 213 36% 154 32% 41 54% 18 51%
65 and over 96 16% 71 15% 21 28% 4 11% Adult, age unknown 12 2% 12 2% 0 0% 0 0% 1 ‘Multiple Products’ includes incidents involving generators or OEDTs with other CO generating consumer products. Other
consumer products include one or more of the following: portable LP fueled heaters, portable kerosene fueled heaters, camp stoves, lanterns, outdoor cookers, furnaces, and wood stoves, and one case with both a generator and another engine-driven tool in operation.
Notes: Totals may not add to 100% due to rounding. Italicized numbers indicate that reporting of incidents is ongoing. Counts may change in subsequent reports. Source: U. S. Consumer Product Safety Commission, Directorate for Epidemiology, 2009
Table 5: Non-Fire Carbon Monoxide Poisoning Deaths Reported to CPSC Staff and
Associated with Engine-Driven Tools by Gender of Victim, 1999-2008
Gender
Number of Deaths Reported to CPSC All Engine-Driven
Tools Generators All Other Engine-Driven Tools Multiple Products1
Total 592 100% 481 100% 76 100% 35 100% Male 463 78% 358 74% 74 97% 31 89%
Female 127 21% 121 25% 2 3% 4 11% Unknown 2 < 1% 2 < 1% 0 0% 0 0% 1 ‘Multiple Products’ includes incidents involving generators or OEDTs with other CO generating consumer products. Other
consumer products include one or more of the following: portable LP fueled heaters, portable kerosene fueled heaters, camp stoves, lanterns, outdoor cookers, furnaces, and wood stoves, and one case with both a generator and another engine-driven tool in operation.
Notes: Totals may not add to 100% due to rounding. Italicized numbers indicate that reporting of incidents is ongoing. Counts may change in subsequent reports. Source: U. S. Consumer Product Safety Commission, Directorate for Epidemiology, 2009
Page 13
Staff examined reported deaths associated with engine-driven tools by the time of year that the incident occurred (Table 6). The non-fire CO fatalities were classified into one of three categories depending on the month in which the victim died: Cold months, Warm months, and Transitional months. ‘Cold months’ are defined as November, December, January, and February; ‘Warm months’ as May, June, July, and August; and ‘Transitional months’ as March, April, September, and October.
Forty-eight percent of the non-fire CO deaths associated with an engine-driven tool occurred in the cold months of November through February. Many of the fatalities can be directly associated with the use of generators during power outages due to weather conditions such as ice or snow storms. Thirty percent of the non-fire CO deaths occurred in the transitional months of March, April, September, and October. A large portion of the non-fire CO fatalities in the transitional months can be directly associated with the use of generators during power outages due to hurricanes and tropical storms, many of which occurred in September and, to a lesser extent, October. Further details on this issue are presented later in the analysis of reasons for generator usage during the fatal incidents in Section IV: Hazard Patterns Associated with Generators. For OEDTs, CO fatalities were only slightly more prevalent in the cold months (39%) than the transitional months (33%) and warm months (29%). The Multiple Products category had a very large proportion of fatalities in the cold months (83%) with the remaining 17% in the transitional months and no fatalities occurring in the warm months. This large percentage of fatalities in the cold months can be explained by examining the other fuel burning consumer products in use at the time of the deaths. Of the 35 CO fatalities that involved multiple consumer products, all but one involved a heating or cooking product, most commonly a portable LP- or kerosene-fueled portable heater. Heaters are used almost exclusively in the cold and transitional months.
Page 14

Table 6: Number of Non-Fire Carbon Monoxide Poisoning Deaths Reported to CPSC Staff and Associated with Engine-Driven Tools by Season, 1999-2008
Season Incident Occurred
Number of Deaths Reported to CPSC All Engine-
Driven Tools Generators Other Engine-Driven Tools
Multiple Products1
Total 592 100% 481 100% 76 100% 35 100% Cold months 284 48% 226 47% 29 39% 29 83% Transitional months 176 30% 144 30% 26 33% 6 17% Warm months 132 22% 111 23% 21 29% 0 0% 1 ‘Multiple Products’ includes incidents involving generators or OEDTs with other CO generating consumer products. Other
consumer products include one or more of the following: portable LP fueled heaters, portable kerosene fueled heaters, camp stoves, lanterns, outdoor cookers, furnaces, and wood stoves, and one case with both a generator and another engine-driven tool in operation.
Notes: Totals may not add to 100% due to rounding. Italicized numbers indicate that reporting of incidents is ongoing. Counts may change in subsequent reports. Source: U. S. Consumer Product Safety Commission, Directorate for Epidemiology, 2009 Incidents involving deaths are further summarized in Table 7 by the location where the death occurred. The majority of non-fire CO poisoning deaths (84%) reported to CPSC staff that are associated with engine-driven tools occurred at a home, which included single-family homes, apartments, townhouses, and mobile homes. The home location also includes garages or sheds at homes or residences. The ‘Temporary shelter’ category includes incidents in which victims died from CO poisoning from portable generators or other engine-driven tools while the victims were occupying trailers, horse trailers, recreational vehicles (RVs), cabins, tents, and campers. Incidents that occurred in a temporary shelter where the generator was an integral part of the temporary shelter, such as built-in generators or generators built specifically for use in an RV, were determined to be out of scope for this report and were excluded. The ‘Boat/Vehicle’ category only includes incidents in which a generator or other engine-driven tool was not an integral part of the boat but was brought onto the boat and incidents where an EDT was brought into a vehicle such as a van. As with temporary shelters, incidents involving generators that were built-in or specifically designed for a boat are not considered in scope and are not included in this report. The ‘Other’ category includes incidents that occurred in the following locations: office buildings, utility buildings, and storage sheds (offsite from home).
Table 7: Number of Non-Fire Carbon Monoxide Poisoning Deaths Reported to CPSC Staff
and Associated with Engine-Driven Tools by Location, 1999-2008
Location Number of Deaths Reported to CPSC
All Engine-Driven Tools Generators Other Engine-
Driven Tools Multiple Products1
Total 592 100% 481 100% 76 100% 35 100% Home 496 84% 395 82% 70 92% 31 89% Temporary shelter 66 11% 61 13% 2 3% 3 9% Boat/Vehicle 8 1% 7 1% 0 0% 1 3% Other 16 3% 13 3% 3 4% 0 0% Not reported 6 1% 5 1% 1 1% 0 0%
1 ‘Multiple Products’ includes incidents involving generators or OEDTs with other CO generating consumer products. Other consumer products include one or more of the following: portable LP fueled heaters, portable kerosene fueled heaters, camp stoves, lanterns, outdoor cookers, furnaces, and wood stoves, and one case with both a generator and another engine-driven tool in operation.
Notes: Totals may not add to 100% due to rounding. Italicized numbers indicate that reporting of incidents is ongoing. Counts may change in subsequent reports. Source: U. S. Consumer Product Safety Commission, Directorate for Epidemiology, 2009
Page 15

Table 8 presents the number of non-fire CO poisoning deaths reported to CPSC staff associated with EDTs categorized by the population density of the place of death. All fatal incidents were assigned to one of four rural/urban categories based on the Rural-Urban Commuting Area (RUCA) codes developed by the Economic Research Service (ERS) of the United States Department of Agriculture (USDA). The four broad categories are Urban, Large Rural, Small Rural, and Isolated. Details on the process of determining population density, or rurality, can be found at the U.S. Department of Agriculture website at the following URL: http://www.ers.usda.gov/briefing/Rurality/. Additional information regarding the cross referencing of zip codes to RUCA codes can be obtained from the University of Washington, WWAMI3 Rural Health Research Center website at the following URL: http://depts.washington.edu/uwruca/. Eighty-eight percent of CO fatalities associated with the use of generators and reported to CPSC staff occurred in urban and large rural areas. The estimated proportion of the U.S. population living in urban and large rural areas is 91%. Although the number of CO fatalities associated with Other Engine-Driven Tools is small compared to generators, there appeared to be an unusually high proportion of fatalities in small rural and isolated areas. Twenty percent of the CO fatalities known to CPSC staff associated with OEDTs occurred in small rural and isolated areas where only an estimated 9% of the U.S. population live.
Table 8: Number of Non-Fire Carbon Monoxide Poisoning Deaths Reported to CPSC Staff
and Associated with Engine-Driven Tools by Population Density of Place of Death, 1999-2008
Population Density
Estimated Percentage
of U.S. Population1
Number of Deaths Reported to CPSC
All Engine-Driven Tools Generators Other Engine-
Driven Tools Multiple Products2
Total 100% 592 100% 481 100% 76 100% 35 100% Urban 81% 440 74% 369 77% 48 63% 23 66% Large Rural 10% 68 11% 51 11% 13 17% 4 11% Small Rural 5% 55 9% 37 8% 13 17% 5 14% Isolated 4% 18 3% 13 3% 2 3% 3 9% Not reported or Not Applicable - - 11 2% 11 2% 0 0% 0 0% 1 Estimated 2006 U.S. population categorized by RUCA designation. 2 ‘Multiple Products’ includes incidents involving generators or OEDTs with other CO generating consumer products. Other
consumer products include one or more of the following: portable LP fueled heaters, portable kerosene fueled heaters, camp stoves, lanterns, outdoor cookers, furnaces, and wood stoves, and one case with both a generator and another engine-driven tool in operation.
Notes: Totals may not add to 100% due to rounding. Italicized numbers indicate that reporting of incidents is ongoing. Counts may change in subsequent reports. Source: U. S. Consumer Product Safety Commission, Directorate for Epidemiology, 2009. WWAMI Rural Research Center at the University of Washington Economic Research Group, USDA.
3 The WWAMI name is derived from the first letter of each of the five cooperating states in a partnership between the University of Washington School of Medicine and the states of Wyoming, Alaska, Montana, and Idaho.
Page 16
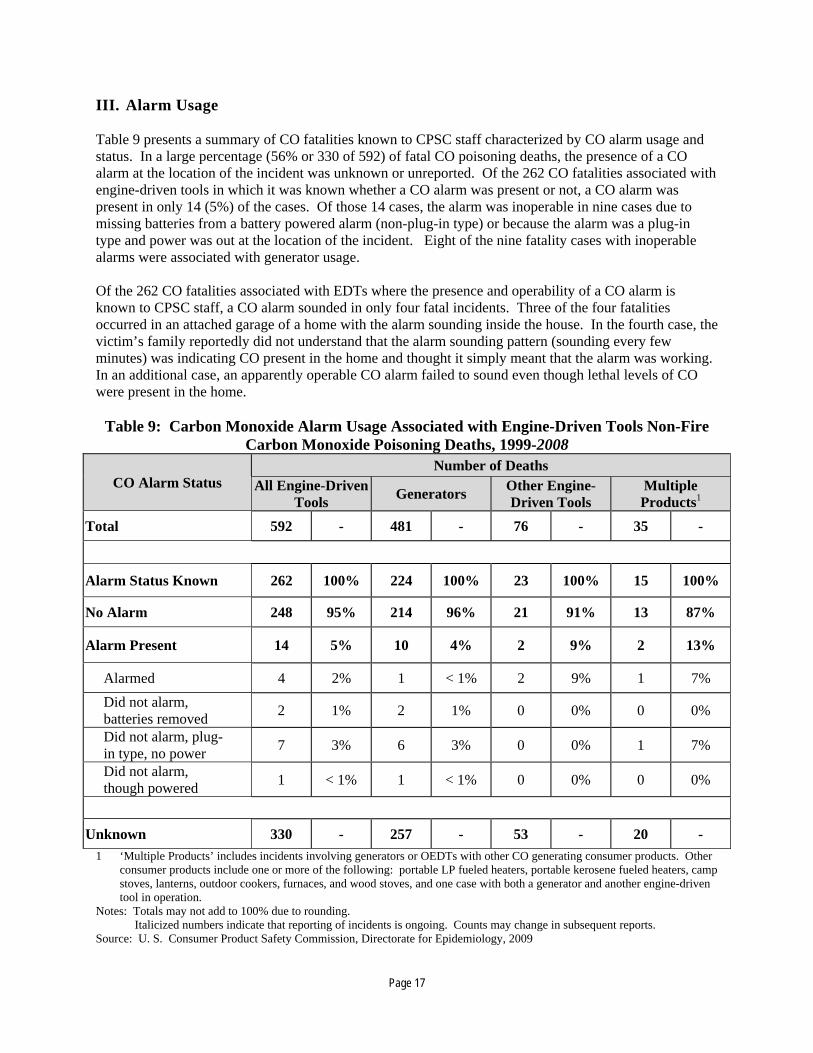
III. Alarm Usage Table 9 presents a summary of CO fatalities known to CPSC staff characterized by CO alarm usage and status. In a large percentage (56% or 330 of 592) of fatal CO poisoning deaths, the presence of a CO alarm at the location of the incident was unknown or unreported. Of the 262 CO fatalities associated with engine-driven tools in which it was known whether a CO alarm was present or not, a CO alarm was present in only 14 (5%) of the cases. Of those 14 cases, the alarm was inoperable in nine cases due to missing batteries from a battery powered alarm (non-plug-in type) or because the alarm was a plug-in type and power was out at the location of the incident. Eight of the nine fatality cases with inoperable alarms were associated with generator usage. Of the 262 CO fatalities associated with EDTs where the presence and operability of a CO alarm is known to CPSC staff, a CO alarm sounded in only four fatal incidents. Three of the four fatalities occurred in an attached garage of a home with the alarm sounding inside the house. In the fourth case, the victim’s family reportedly did not understand that the alarm sounding pattern (sounding every few minutes) was indicating CO present in the home and thought it simply meant that the alarm was working. In an additional case, an apparently operable CO alarm failed to sound even though lethal levels of CO were present in the home.
Table 9: Carbon Monoxide Alarm Usage Associated with Engine-Driven Tools Non-Fire Carbon Monoxide Poisoning Deaths, 1999-2008
CO Alarm Status Number of Deaths
All Engine-Driven Tools Generators Other Engine-
Driven Tools Multiple Products1
Total 592 - 481 - 76 - 35 -
Alarm Status Known 262 100% 224 100% 23 100% 15 100%
No Alarm 248 95% 214 96% 21 91% 13 87%
Alarm Present 14 5% 10 4% 2 9% 2 13%
Alarmed 4 2% 1 < 1% 2 9% 1 7% Did not alarm, batteries removed 2 1% 2 1% 0 0% 0 0%
Did not alarm, plug- in type, no power 7 3% 6 3% 0 0% 1 7%
Did not alarm, though powered 1 < 1% 1 < 1% 0 0% 0 0%
Unknown 330 - 257 - 53 - 20 - 1 ‘Multiple Products’ includes incidents involving generators or OEDTs with other CO generating consumer products. Other
consumer products include one or more of the following: portable LP fueled heaters, portable kerosene fueled heaters, camp stoves, lanterns, outdoor cookers, furnaces, and wood stoves, and one case with both a generator and another engine-driven tool in operation.
Notes: Totals may not add to 100% due to rounding. Italicized numbers indicate that reporting of incidents is ongoing. Counts may change in subsequent reports. Source: U. S. Consumer Product Safety Commission, Directorate for Epidemiology, 2009
Page 17

IV. Hazard Patterns Associated with Generators This section presents information about the usage patterns associated with fatal CO poisoning specific to generators as well as information about the homes where fatal generator incidents occurred. CPSC staff conducted 435 In-depth Investigations (IDIs) related to non-fire CO incidents associated with engine-driven tools. In cases where the investigations did not provide all of the requested information or the incident was not investigated, attempts were made to augment the data from the Injury and Potential Injury Incidents (IPII) records or from death certificate information. Summaries of generator-related incidents in this section also include incidents where multiple fuel-burning consumer products were involved with one being a generator. A review of records for the 512 generator-related non-fire CO deaths reported to CPSC staff, which includes 481 fatalities involving a generator alone and 31involving a generator and another CO producing consumer product, suggests two main reasons reported for using a generator. One was to provide electricity to a location that did not have electricity due to a temporary situation (e.g., a power outage), and the other was to provide power to a temporary location. Table 10 provides a breakdown by year of the reasons why a generator was in use at the time of the incident. One-third (33%) of the 512 generator-related non-fire CO fatalities involved the use of generators during a temporary power outage stemming from a weather problem or a problem with power distribution. Nearly one-fifth (18%) of the fatalities were associated with the use of generators after power was shut off to the residence by the utility company. In 71 fatality cases (14%) it could not be determined why the generator was in use or why there was no electricity at the location of the incident.
Page 18

Table 10: Non-Fire Carbon Monoxide Poisoning Deaths Reported to CPSC Staff and Associated with Generators1 by Reason for Use, 1999-2008
Reason for Use Total 1999 2000 2001 2002 2003 2004 2005 2006 2007 2008
Total 512 6 20 18 46 57 47 101 89 54 74
Power outage due to weather or problem with power distribution
169 3 1 3 16 19 12 50 16 24 25
Electricity turned off by power company due to bill dispute or nonpayment
91 0 0 1 13 5 6 13 24 15 14
Provide power to storage shed, trailer, boat, camper, cabin, campsite
82 0 12 8 6 10 4 11 19 6 6
New home or homeowner and power not yet turned on, home under construction or renovation
53 0 1 0 1 9 13 7 9 1 12
Provide power to home or mobile home which normally does not have electricity
28 0 1 5 1 1 4 6 5 2 3
Working on or preparing a home for predicted storm 6 1 0 0 0 1 0 0 1 0 3
Other (previous fire in house, power shut off by owners, servicing power supply)
12 1 4 1 4 0 0 1 1 0 0
Unknown why electricity off 71 1 1 0 5 12 8 13 14 6 11 1 Number of deaths associated with generators includes incidents where other consumer products may also have been
involved. Other products include one or more of the following: lawn mowers, portable LP fueled heaters, portable kerosene fueled heaters, camp stoves, lanterns, outdoor cookers, furnaces and wood stoves.
Notes: Totals may not add to 100% due to rounding. Italicized numbers indicate that reporting of incidents is ongoing. Counts may change in subsequent reports. Source: U. S. Consumer Product Safety Commission, Directorate for Epidemiology, 2009 For the 169 fatalities associated with a power outage due to weather or a problem with power distribution, Table 11 provides a further breakdown by year and cause of the power outage. More than 91% (154 of 169) of the fatalities associated with power outages were due to outages caused by specific weather conditions. The spike in fatalities in 2005, from 47 in 2004 to 101 in 2005, appears to be due primarily to unusually severe weather. In 2004 there were 12 power outage-related CO fatalities, 11 of these were known to be weather-related. In 2005, the number of power outage-related fatalities jumped to 50, with 49 known to be weather-related. The 49 power outage weather-related fatalities in 2005 were due primarily to hurricanes in September in the Gulf states, ice/snow storms in January in the Midwest, and ice storms in December in the Carolinas. CPSC staff is aware of 28 hurricane- or tropical storm-related non-fire CO fatalities in 2005, more CO deaths than for any other year in this report for all weather-related outages combined. An additional 20 fatalities were associated with the use of generators during ice- or snow-related power outages in 2005. Both the hurricane- and ice/snow-related fatality counts in 2005 are higher than any other year in this report. Over the ten-year period covered by this report, 30% (50 of 169) of the power outage-related non-fire CO fatalities occurred in 2005. Figure 2 illustrates the impact of the power outages in 2005 relative to other years. Ice or snow storms are associated with the largest percentage of weather-related CO fatalities (43%). Hurricanes are also associated with a large percentage of CO fatalities (32%).
Page 19

It is not clear why the 2006 total (89) also appears to be elevated since a review of the incidents shows that the number of fatalities associated with weather induced power outages (16) in 2006 is similar to the three years prior to 2005 with 16, 19, and 12 CO deaths associated with weather caused power outages for the years 2002 through 2004, respectively. A partial explanation may be the increased number of fatalities associated with power company shut-off - increasing from 6 in 2004 and 13 in 2005 to 24 in 2006. Also an increase in the number of fatalities associated with the use of generators at temporary locations (storage sheds, trailers, cabin, etc.) was observed in 2006 (19; 4 in 2004 and 11 in 2005).
Table 11: Non-Fire Carbon Monoxide Poisoning Deaths Reported to CPSC Staff and
Associated with Generators1 by Reason for Power Outage, 1999-2008 Reason for Power
Outage Total 1999 2000 2001 2002 2003 2004 2005 2006 2007 2008
Total 169 3 1 3 16 19 12 50 16 24 25
Ice or snow storm 73 0 0 0 14 7 2 20 8 13 9 Hurricane or tropical
storm 54 0 0 0 1 8 9 28 1 0 7
Wind storm 10 0 0 1 0 0 0 0 5 3 1
Thunderstorm 9 0 0 1 0 2 0 1 2 1 2
Tornado 3 0 0 0 0 0 0 0 0 0 3
Storm, unspecified 5 0 0 0 0 0 0 0 0 4 1 Unknown or other reason for outage 15 3 1 1 1 2 1 1 0 3 2 1 Number of deaths associated with generators includes incidents where other consumer products may also have been
involved. Other products include one or more of the following: lawn mowers, portable LP fueled heaters, portable kerosene fueled heaters, camp stoves, lanterns, outdoor cookers, furnaces and wood stoves.
Note: Italicized numbers indicate that reporting of incidents is ongoing. Counts may change in subsequent reports. Source: U.S. Consumer Product Safety Commission, Directorate for Epidemiology, 2009
Page 20

Figure 2: Non-Fire Carbon Monoxide Poisoning Deaths Reported to CPSC Staff and Associated with Generators During Power Outages
05
101520253035404550
1999 2000 2001 2002 2003 2004 2005 2006 2007 2008Year Incomplete Data
For the 512 generator-related non-fire CO fatalities (481 associated with a generator alone and 31 associated with a generator and another CO producing consumer product), information was available for 441 deaths (86%) regarding the victim’s location in relation to the generator. One hundred thirty-two of these 441 fatalities (30%) occurred in the same room or space as the generator. For the 441 CO fatalities in which the victim’s location in relation to the generator was known, 422 of the deaths (from 315 incidents) are known to have occurred in the home (395 associated with a generator alone and another 27 associated with a generator and another CO producing consumer product). These 422 deaths were further classified by the specific location of the generator (Table 12) within the home. The category ‘Living space’ includes rooms reported as bedrooms, bathrooms, dens, living rooms, landings, offices, rear rooms, enclosed porches, and converted garages. The category ‘Outside home’ includes incidents where the generator was placed outside a home but near an open window, door, or vent of the home. Sixty-four percent (272 of 422) of the CO deaths at home locations occurred when a generator was placed inside the home including the living space, a basement, closet, or doorway, but excluding the garage. Another 25% (105 of 422) occurred when the generator was placed in a garage, enclosed carport, or attached barn. Almost half of the CO fatalities (209 of 422) occurred when the generator was placed in an attached structure or in the basement or crawlspace. Most IDIs do not identify the reason for placing the generator where it was located though many of the IDIs specifically identify a fear of theft or inclement weather as the reason for using the generator inside the garage, basement or crawlspace. Review of the yearly fatal incident data indicates a shift with an increased placement of generators in the living space of the home. CPSC staff has location information for 119 generator associated fatalities between 1999 and 2003. The basement was the predominant location of the generator in fatal CO poisoning incidents (38%) followed by attached garages and other attached structures (22%) and living spaces (15%). From 2004 onward there have been 303 reported CO fatalities in the home associated with the use of generators. More CO fatalities have occurred with the generators being placed in the living space of the home (33%) followed by an attached structure (26%) and then the basement (19%). It is unclear why there has been a shift from the basement to the living space, but, this may indicate a lack of
Page 21

knowledge by consumers about the severity of the CO dangers associated with the use of generators inside the home.
Table 12: Non-Fire Carbon Monoxide Poisoning Deaths in the Home by Location of the Generator1, 1999-2008
Generator Location Total 1999 2000 2001 2002 2003 2004 2005 2006 2007 2008 Total 422 6 10 11 43 49 40 83 65 49 66
Living space 117 2 2 2 5 7 18 27 17 14 23 Garage / enclosed
carport / attached barn 105 0 3 3 10 10 10 19 20 18 12
Basement / crawlspace 104 2 3 1 18 21 6 15 11 10 17 Inside house, no further
information reported 33 1 0 1 4 7 2 4 4 4 6
Shed / detached garage / detached workshop 25 1 1 3 2 1 0 5 8 1 3
Closet in home 12 0 0 0 2 0 0 6 3 1 0
Outside home 11 0 0 1 0 1 3 5 0 1 0
Doorway to home 6 0 0 0 2 2 0 0 2 0 0 Unknown location, but
at home 9 0 1 0 0 0 1 2 0 0 5 1 Number of deaths associated with generators includes incidents where other consumer products may also have been
involved. Other products include one or more of the following: lawn mowers, portable LP fueled heaters, portable kerosene fueled heaters, camp stoves, lanterns, outdoor cookers, furnaces and wood stoves.
Notes: Totals may not add to 100% due to rounding. Italicized numbers indicate that reporting of incidents is ongoing. Counts may change in subsequent reports. Source: U. S. Consumer Product Safety Commission, Directorate for Epidemiology, 2009 Table 13 presents a summary of non-fire CO fatalities that occurred in the home characterized by ventilation status. Many of the incidents of generator-associated fatalities in the home (165 of the 422 deaths) did not contain information about the ventilation of the generator. In 170 of the 257 deaths (66%) in which information on ventilation of the generator was available, the generators were not vented at the time of the incident. There were 87 deaths associated with generators that reported that some type of ventilation was employed. Sixty-seven non-fire CO deaths were associated with incidents which reported an open window, an open door, an open garage door, or a combination of these. In six deaths, a window or door was open during some period of use but later closed. Eleven deaths were associated with generators that were placed outside the home near open windows, doors, or vents. In nine deaths, the generator exhaust was directly vented to the outside through a window or door or through the use of a fan but these measures failed to adequately vent the CO from the victims’ location.
Page 22

Table 13: Non-Fire CO Fatalities Associated with Generators1 in the Home Categorized by Status of Ventilation, 1999-2008
Ventilation Status Number of Incidents
Number of Deaths
Percentage of Deaths
Percentage of Deaths Where Ventilation is
Known Non-fire CO fatalities in the home 316 422 100% 100% Some ventilation attempted 67 87 21% 34% Open window(s), open door(s), an open
garage door, or a combination of these 53 67 16% 26%
Actively trying to vent either by fans or by directing exhaust out a window or door
4 9 2% 4%
Placed outside, but near a window, door or A/C unit 10 11 3% 4%
No ventilation 129 170 40% 66% Open windows or doors closed
sometime later 5 6 1% 2%
No ventilation attempted 124 164* 39% 64% Unknown ventilation 120 165 39% -
1 Number of deaths associated with generators includes incidents where other consumer products may also have been involved. Other products include one or more of the following: lawn mowers, portable LP fueled heaters, portable kerosene fueled heaters, camp stoves, lanterns, outdoor cookers, furnaces and wood stoves.
Source: U. S. Consumer Product Safety Commission, Directorate for Epidemiology, 2009 Note: Italicized numbers indicate that reporting of incidents is ongoing. Counts may change in subsequent reports. * One death occurred when a generator was placed outside an apartment in an unvented hallway. Table 14 presents a summary of the fatal CO incidents and fatalities characterized by the size of the home in which the fatalities occurred. A large percentage (39%) of the deaths occurred in incidents in which CPSC staff could not ascertain the size of the home. Additionally, another 7% of the CO fatalities occurred in a detached structure on the residential property such as a detached garage or shed. Information regarding the size of the home reported in this document is from one of two sources. The first source is the CPSC IDIs which include information gathered from police, fire department, or public records. The second source is one of two internet databases of real estate information which contains public record data: Cyberhomes.com and Zillow.com. The majority of the time these two databases agree on the size of the home since both are based on public records from the county, state, or municipality. Occasionally, the records in the databases do not agree. In these cases, the average of the two size figures was used since it could not be determined which database had the more accurate figure. Sixty-four percent of the reported CO fatalities associated with generators that occurred in the home, in which the size of the structure was known, occurred in homes less than 1,500 square feet in size. This portion of the fatal incident locations includes most incidents which occurred in apartments and mobile homes. Fatal incidents that occurred in a detached structure are not included in this figure. The median home size involved in fatal CO poisoning deaths, where home size information is known, was 1,330 square feet. As a point of reference, according to the U.S. Census Bureau’s American Housing Survey for the United States: 2007, the median housing unit in 2007 was 1,769 square feet. Comparing the percentages of deaths by home size to the U.S. Census figures, it appears that the CO fatalities are skewed toward smaller homes. Whether this is due to economic reasons or that smaller volume structures are
Page 23

more quickly filled by deadly carbon monoxide is unclear. Perhaps it is a combination of the two factors or some yet unidentified reason. Table 14: Non-Fire CO Fatalities Associated with Generators1 in the Home Categorized by
Size of Home, 1999-2008
Home Size (in sq. feet)2
Number of Incidents
Number of Deaths
Percentage of Deaths
Percentage of Deaths Where Size is Known
Estimated Percentage of U.S. Housing Units (2007)
Total 316 422 100% 100% 100% Under 500 4 5 1% 2% 1% 500-999 45 56 13% 24% 11%
1,000-1,499 56 86 20% 38% 25% 1,500-1,999 36 45 11% 20% 24% 2,000-2,499 18 28 7% 12% 17% 2,500-2,999 5 6 1% 3% 9%
3,000 or Larger 3 3 1% 1% 13% Unknown 124 165 39% - -
Detached Structure 25 28 7% - - 1 Number of deaths associated with generators includes incidents where other consumer products may also have been
involved. Other products include one or more of the following: lawn mowers, portable LP fueled heaters, portable kerosene fueled heaters, camp stoves, lanterns, outdoor cookers, furnaces and wood stoves.
2 Home Size based on CPSC IDIs or from the internet real estate databases Cyberhomes.com and Zillow.com. Source: U. S. Consumer Product Safety Commission, Directorate for Epidemiology, 2009. U.S. Census Bureau, American Housing Survey for the United States: 2007, Sept. 2008. Note: Italicized numbers indicate that reporting of incidents is ongoing. Counts may change in subsequent reports The size of the generator and the fuel used with the generator were both examined. The size of the generator was examined by the wattage rating (Table 15). In most cases, the running wattage rating was used to categorize a case. In some instances, however, a wattage rating was obtained but it could not be determined whether this rating was the rated running wattage or maximum/surge wattage. When the wattage rating of the generator was known or could be determined (256 investigated deaths), 170 deaths (66%) were associated with a generator in the 3500 to 6499 watt rating range. Nearly half (47%) of all CO fatalities were associated with generators in the 5000 to 6499 watt range. Generator sales data available to CPSC staff4 indicate that during the time period 2003 through 2005, 56% of portable generators sold to consumers were in the 3500 to 6499 watt range, 23% of units sold had outputs below 3500 watts, and 21% had outputs of 6500 watts or greater. During this same period, generator size is available for incidents associated with 92 fatalities. Seventy-eight percent of the CO fatalities were associated with generators in the 3500 to 6499 watts range, 20% were associated with units with outputs below 3500 watts, and 2% were associated with units with outputs of 6500 watts or greater. From 2006 through 2008, 60% of CO fatalities were associated with generators in the 3500 to 6499 watt range, 33% were associated with units with outputs below 3500 watts, and 7% were associated with units with outputs of 6500 watts or greater. Assessments of trends or patterns using direct comparisons of sales data and CO fatality data should be made with caution. Sales figures only reflect the proportion of newly purchased generators in each category and do not reflect the proportions of existing generators in the
4 Smith, Charles L. Portable Electric Generator Sets for Consumer Use: Additional Data on Annual Sales, Number in Use, and Societal Costs. Memorandum to Janet Buyer, Project Manager, ESFS. August 24, 2006.
Page 24

consumer population. Though many CO fatalities are associated with first-time users of newly purchased generators, many are also associated with older generators originally purchased for other uses or borrowed when a need for power presented itself. Almost all of the generators that were involved in the CO poisoning incidents identified in this report were referred to as gas or gasoline-fueled generators. One generator was identified as a propane-fueled generator, and one was identified as a natural gas-fueled generator.
Table 15: Non-Fire CO Fatalities Associated with Generators1 Categorized by Generator
Wattage Rating, 1999-2008 Wattage Rating
(in Watts) Total 1999 2000 2001 2002 2003 2004 2005 2006 2007 2008
Total 512 6 20 18 46 57 47 101 89 54 75 Under 2000 18 0 3 0 3 0 2 3 1 5 1 2000 – 3499 57 0 5 3 7 3 2 8 16 6 7 3500 – 4999 50 0 2 3 1 5 2 13 11 5 8 5000 – 6499 120 1 3 4 19 14 18 20 20 7 14 6500 – 7999 7 0 0 0 0 0 0 1 0 2 4
8000 and larger 4 0 0 0 1 0 1 0 1 0 1 Not reported 256 5 7 8 15 35 22 56 40 29 39
1 Number of deaths associated with generators includes incidents where other consumer products may also have been involved. Other products include one or more of the following: lawn mowers, portable LP fueled heaters, portable kerosene fueled heaters, camp stoves, lanterns, outdoor cookers, furnaces and wood stoves.
Source: U. S. Consumer Product Safety Commission, Directorate for Epidemiology, 2009 Note: Italicized numbers indicate that reporting of incidents is ongoing. Counts may change in subsequent reports.
Page 25

Conclusion Between 1999 and 2008, there were 592 non-fire CO poisoning deaths reported to CPSC staff that were associated with engine-driven tools. The majority of these deaths (481) involved generators. Another 31 fatalities were associated with both a generator and another consumer product (one involved both a generator and another engine drive tool – a lawn tractor). Other engine-driven tools, including garden tractors, lawn mowers, power washers or sprayers, and others, were associated with a much smaller number of deaths. The majority of fatal incidents reported to CPSC staff involved a single fatality. Most reported deaths occurred while an individual was at home. Victims aged 25 years and older accounted for about 79% of non-fire CO poisoning deaths reported to CPSC staff that were associated with generators, and the majority (74%) were male. Eighty-two percent of the reported deaths associated with generators occurred at home. Nearly two-thirds (65%) of the fatalities known to have occurred in the home involving generators occurred when a generator was placed in the living area or basement of the home. Another 25% occurred when a generator was used inside an attached garage or shed. Generators were often used as alternative sources of electricity due to temporary power outages or as power sources for temporary shelters. Weather-related outages were the single most common reason for generator usage which resulted in a non-fire CO fatality, accounting for at least 169 of the 512 fatalities (33%). Generators were often used with little or no ventilation. In only about 5% of the fatalities was it known that there was a CO alarm installed – and most of these were inoperable at the time of the fatal incident. Conclusions about why consumers used generators indoors or determinations about whether users were aware of the potential non-fire CO poisoning hazard are difficult to make with the available information. Victims aged 25 years and older accounted for all of the non-fire CO poisoning deaths reported to CPSC staff that were associated with other engine-driven tools. Males accounted for all but two of the 76 deaths associated with other engine-driven tools. Deaths associated with garden tractors and lawn mowers were often associated with an individual repairing or working on the product in an enclosed space.
Page 26

References Hnatov, M. V. Incidents, Deaths, and In-Depth Investigations Associated with Non-Fire Carbon Monoxide from Engine-Driven Generators and Other Engine-Driven Tools, 1999-2006. U.S. Consumer Product Safety Commission. Oct. 2008. Hnatov, M. V. Non-Fire Carbon Monoxide Deaths Associated with the Use of Consumer Products: 2006 Annual Estimates. U.S. Consumer Product Safety Commission. May 2009. Inkster, S.E. Health hazard assessment of CO poisoning associated with emissions from a portable, 5.5 kilowatt, gasoline-powered generator. U.S. Consumer Product Safety Commission. 2004. Marcy, N.E., Ascone, D.S. Incidents, Deaths, and In-Depth Investigations Associated with Carbon Monoxide and Engine-Driven Tools, 1990-2003. U.S. Consumer Product Safety Commission. March 2004. Smith, Charles L. Portable Electric Generator Sets for Consumer Use: Additional Data on Annual Sales, Number in Use, and Societal Costs. Memorandum to Janet Buyer, Project Manager, ESFS. August 24, 2006. U.S. Census Bureau. Statistical Abstract of the United States: 2009. U.S. Census Bureau. American Housing Survey for the United States: 2007. Sept. 2008
U.S. Department of Agriculture. Briefing Rooms: Measuring Rurality. 7 Nov. 2008 <http://www.ers.usda.gov/briefing/Rurality/> University of Washington, WWAMI Rural Health Research Center. Rural-Urban Commuting Area Codes (version 2.0). 5 Jan. 2009 <http://depts.washington.edu/uwruca/>
Page 27
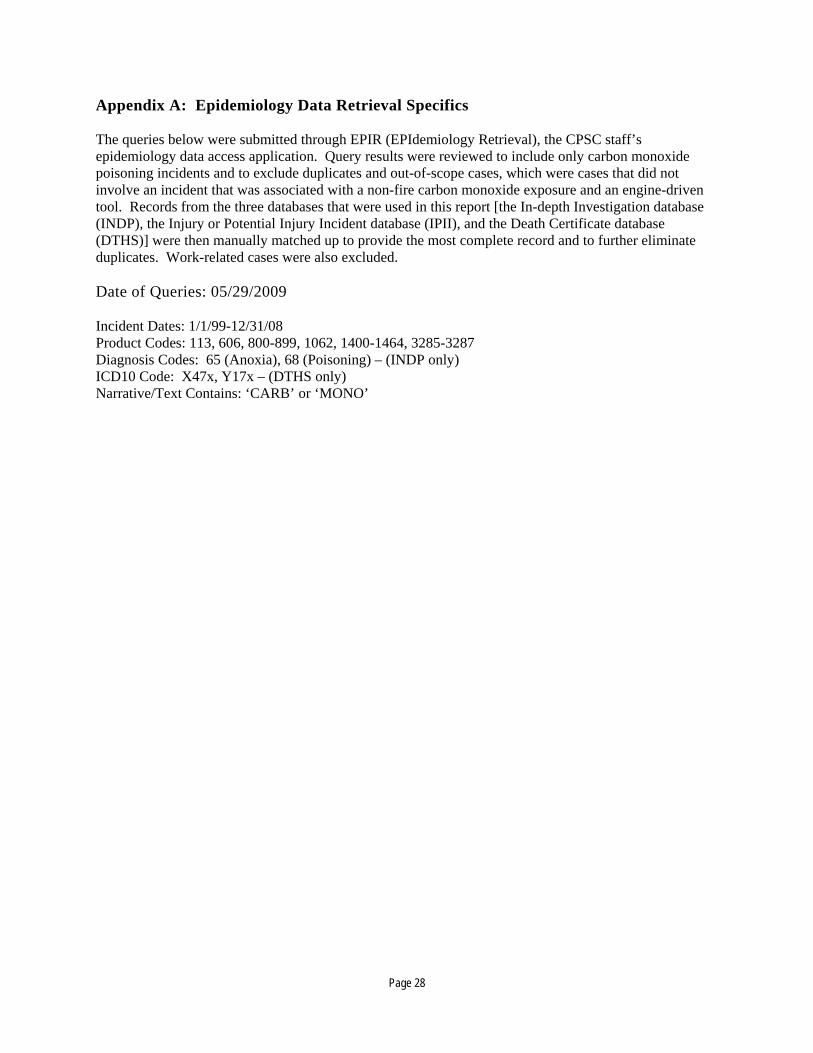
Appendix A: Epidemiology Data Retrieval Specifics The queries below were submitted through EPIR (EPIdemiology Retrieval), the CPSC staff’s epidemiology data access application. Query results were reviewed to include only carbon monoxide poisoning incidents and to exclude duplicates and out-of-scope cases, which were cases that did not involve an incident that was associated with a non-fire carbon monoxide exposure and an engine-driven tool. Records from the three databases that were used in this report [the In-depth Investigation database (INDP), the Injury or Potential Injury Incident database (IPII), and the Death Certificate database (DTHS)] were then manually matched up to provide the most complete record and to further eliminate duplicates. Work-related cases were also excluded. Date of Queries: 05/29/2009 Incident Dates: 1/1/99-12/31/08 Product Codes: 113, 606, 800-899, 1062, 1400-1464, 3285-3287 Diagnosis Codes: 65 (Anoxia), 68 (Poisoning) – (INDP only) ICD10 Code: X47x, Y17x – (DTHS only) Narrative/Text Contains: ‘CARB’ or ‘MONO’
Page 28

Page 29
Appendix B: Carboxyhemoglobin Levels Present In CO Fatalities Carboxyhemoglobin (COHb) is a complex of carbon monoxide and hemoglobin that forms in red blood cells when carbon monoxide is inhaled. COHb poisoning can be fatal in large doses as it hinders delivery of oxygen to the body. Carboxyhemoglobin data is helpful in estimating the concentration of CO in the product exhaust and the lethality of the product which affects the speed of onset of harm. This information may be used by CPSC staff to assist in determining how best to address the CO hazard presented by generators and other engine-driven tools. In healthy adults, a COHb level of 40 to 50% in the blood approximately correlates with symptoms of confusion, unconsciousness, coma, and possible death; a level of 50 to 70% approximately correlates with symptoms of coma, brain damage, seizure, and death; and a level greater than 70% is typically fatal5. COHb levels were available for 352 of the 592 fatalities (59% of the CO fatalities). Table B-1 shows the frequency of reports by COHb level categories. Percentages in the table are the category proportions of reported COHb levels. The majority of fatalities with reported COHb levels (288 of the 352) had levels of 50% or greater.
Table B-1: Carboxyhemoglobin Levels Associated with Engine-Driven Tools Non-Fire Carbon Monoxide Poisoning Deaths, 1999-2008
COHb Level Number of Deaths1
All Engine-Driven Tools Generators Other Engine-
Driven Tools Multiple Products2
Total 592 - 481 - 76 - 35 -
Reported Levels 352 100% 274 100% 51 100% 27 100%
Less than 30% 12 3% 10 4% 1 2% 1 4% 30-39.9% 19 5% 15 5% 3 6% 1 4% 40-49.9% 33 9% 26 9% 7 14% 0 0% 50-59.9% 67 19% 54 20% 7 14% 6 22% 60-69.9% 93 26% 77 28% 10 20% 6 22% 70-79.9% 97 28% 71 26% 14 27% 12 44% 80-89.9% 28 8% 18 7% 9 18% 1 4% 90-99.9% 3 1% 3 1% 0 0% 0 0%
Not reported 240 - 207 - 25 - 8 - 1 Percentages shown are the percentage of reported COHb levels per category. 2 ‘Multiple Products’ includes incidents involving generators or OEDTs with other CO generating consumer products. Other
consumer products include one or more of the following: portable LP fueled heaters, portable kerosene fueled heaters, camp stoves, lanterns, outdoor cookers, furnaces, and wood stoves, and one case with both a generator and another engine-driven tool in operation.
Notes: Totals may not add to 100% due to rounding. Italicized numbers indicate that reporting of incidents is ongoing. Counts may change in subsequent reports. Source: U. S. Consumer Product Safety Commission, Directorate for Epidemiology, 2009
5 Inkster S.E. Health hazard assessment of CO poisoning associated with emissions from a portable, 5.5 kilowatt, gasoline-powered generator. Washington, D.C.: U.S. Consumer Product Safety Commission. 2004.