In Vivo 1H Magnetic Resonance Spectroscopy of Lactate in Patients With Stage IV Head and Neck...
17
In vivo 1 H Magnetic Resonant Spectroscopy of Lactate in Patients with Stage IV Head and Neck Squamous Cell Carcinomas Quynh-Thu Le, MD 1* , Albert Koong, MD-PhD 1 , Yee Yie Lieskovsky, MD 1 , Balasubramanian Narasimhan, PhD 2 , Edward Graves, PhD 1 , Harlan Pinto, MD 3 , Martin J. Brown, PhD 1 , and Daniel Spielman, PhD 4 1Department of Radiation Oncology, Stanford University Medical Center, Stanford, CA 94305 2Department of Health Research and Policy – Biostatistics, Stanford University Medical Center, Stanford, CA 94305 3Department of Medicine, Stanford University Medical Center, Stanford, CA 94305 4Department of Radiology, Stanford University Medical Center, Stanford, CA 94305 Abstract PURPOSE—To investigate in vivo 1 H magnetic resonance spectroscopy imaging of lactate for assessing tumor hypoxia in head and neck (HN) cancers and to determine its utility in predicting response and outcomes. METHODS—Volume-localized Lactate-edited 1 H MRS at 1.5 T was performed in vivo on involved neck nodes and control subcutaneous tissues in 36 patients with Stage IV HN cancers. Signal intensities (SI) of Lactate, Choline (Cho), Creatine (Cr) and the Cho/Cr ratios were measured. Tumor pO 2 was obtained in the same lymph node prior to MRS. Patients were treated with either 2 cycles of induction chemotherapy (Tirapazamine, cisplatin, 5-Fluorouracil) followed by simultaneous chemoradiotherapy or the same regimen without Tirapazamine. Lactate SI and Cho/Cr were correlated with tumor pO 2 , nodal response and locoregional control. RESULTS—Lactate SI was higher for the involved nodes (median: 0.25) than for the subcutaneous tissue (median: 0.04, p = 0.07). There was no significant correlation between Lactate SI and tumor pO 2 (mean: 0.46 ± 0.10 for hypoxic nodes [pO 2 ≤10mmHg, n = 15] versus 0.36 ± 0.07 for non-hypoxic nodes [pO 2 >10mmHg, n = 21], p = 0.44). There was a significant correlation between Cho/Cr ratios and tumor pO 2 (mean: 2.74 ± 0.34 for hypoxic nodes versus 1.78 ± 0.31 for non-hypoxic nodes, p = 0.02). There was no correlation between Lactate SI and complete nodal response (p = 0.52) or locoregional control rates. CONCLUSIONS—Lac SI did not correlate with tumor pO 2 , treatment response or locoregional control. Further research is needed to refine this technique. *Corresponding Author, Quynh-Thu Le, MD, Department of Radiation Oncology, 875 Blake Wilbur Dr, MC 5847, Stanford, CA 94305-5847; Tel: 650-498-5032; Fax: 650-725-8231; Email: [email protected]. Publisher's Disclaimer: This is a PDF file of an unedited manuscript that has been accepted for publication. As a service to our customers we are providing this early version of the manuscript. The manuscript will undergo copyediting, typesetting, and review of the resulting proof before it is published in its final citable form. Please note that during the production process errors may be discovered which could affect the content, and all legal disclaimers that apply to the journal pertain. Poster discussion presentation at the American Society of Therapeutic Radiology and Oncology, Nov 2007, Los Angeles, CA. Conflicts of Interest Notification: No actual or potential conflicts of interest exist. NIH Public Access Author Manuscript Int J Radiat Oncol Biol Phys. Author manuscript; available in PMC 2009 July 15. Published in final edited form as: Int J Radiat Oncol Biol Phys. 2008 July 15; 71(4): 1151–1157. doi:10.1016/j.ijrobp.2007.11.030. NIH-PA Author Manuscript NIH-PA Author Manuscript NIH-PA Author Manuscript
-
Upload
independent -
Category
Documents
-
view
3 -
download
0
Transcript of In Vivo 1H Magnetic Resonance Spectroscopy of Lactate in Patients With Stage IV Head and Neck...

In vivo1H Magnetic Resonant Spectroscopy of Lactate in Patientswith Stage IV Head and Neck Squamous Cell Carcinomas
Quynh-Thu Le, MD1*, Albert Koong, MD-PhD1, Yee Yie Lieskovsky, MD1, BalasubramanianNarasimhan, PhD2, Edward Graves, PhD1, Harlan Pinto, MD3, Martin J. Brown, PhD1, andDaniel Spielman, PhD4
1Department of Radiation Oncology, Stanford University Medical Center, Stanford, CA 94305
2Department of Health Research and Policy – Biostatistics, Stanford University Medical Center, Stanford,CA 94305
3Department of Medicine, Stanford University Medical Center, Stanford, CA 94305
4Department of Radiology, Stanford University Medical Center, Stanford, CA 94305
AbstractPURPOSE—To investigate in vivo 1H magnetic resonance spectroscopy imaging of lactate forassessing tumor hypoxia in head and neck (HN) cancers and to determine its utility in predictingresponse and outcomes.
METHODS—Volume-localized Lactate-edited 1H MRS at 1.5 T was performed in vivo on involvedneck nodes and control subcutaneous tissues in 36 patients with Stage IV HN cancers. Signalintensities (SI) of Lactate, Choline (Cho), Creatine (Cr) and the Cho/Cr ratios were measured. TumorpO2 was obtained in the same lymph node prior to MRS. Patients were treated with either 2 cyclesof induction chemotherapy (Tirapazamine, cisplatin, 5-Fluorouracil) followed by simultaneouschemoradiotherapy or the same regimen without Tirapazamine. Lactate SI and Cho/Cr werecorrelated with tumor pO2, nodal response and locoregional control.
RESULTS—Lactate SI was higher for the involved nodes (median: 0.25) than for the subcutaneoustissue (median: 0.04, p = 0.07). There was no significant correlation between Lactate SI and tumorpO2 (mean: 0.46 ± 0.10 for hypoxic nodes [pO2≤10mmHg, n = 15] versus 0.36 ± 0.07 for non-hypoxicnodes [pO2>10mmHg, n = 21], p = 0.44). There was a significant correlation between Cho/Cr ratiosand tumor pO2 (mean: 2.74 ± 0.34 for hypoxic nodes versus 1.78 ± 0.31 for non-hypoxic nodes, p =0.02). There was no correlation between Lactate SI and complete nodal response (p = 0.52) orlocoregional control rates.
CONCLUSIONS—Lac SI did not correlate with tumor pO2, treatment response or locoregionalcontrol. Further research is needed to refine this technique.
*Corresponding Author, Quynh-Thu Le, MD, Department of Radiation Oncology, 875 Blake Wilbur Dr, MC 5847, Stanford, CA94305-5847; Tel: 650-498-5032; Fax: 650-725-8231; Email: [email protected]'s Disclaimer: This is a PDF file of an unedited manuscript that has been accepted for publication. As a service to our customerswe are providing this early version of the manuscript. The manuscript will undergo copyediting, typesetting, and review of the resultingproof before it is published in its final citable form. Please note that during the production process errors may be discovered which couldaffect the content, and all legal disclaimers that apply to the journal pertain.Poster discussion presentation at the American Society of Therapeutic Radiology and Oncology, Nov 2007, Los Angeles, CA.Conflicts of Interest Notification: No actual or potential conflicts of interest exist.
NIH Public AccessAuthor ManuscriptInt J Radiat Oncol Biol Phys. Author manuscript; available in PMC 2009 July 15.
Published in final edited form as:Int J Radiat Oncol Biol Phys. 2008 July 15; 71(4): 1151–1157. doi:10.1016/j.ijrobp.2007.11.030.
NIH
-PA Author Manuscript
NIH
-PA Author Manuscript
NIH
-PA Author Manuscript

KeywordsLactate; MRS; hypoxia; head and neck cancer; prognosis
IntroductionTumor hypoxia is a common phenomenon in solid tumors and has been shown to adverselyaffect treatment outcomes in patients with head and neck (HN) squamous cell carcinoma (SCC)treated with conventional therapy.1–4 There has been a strong interest in targeting hypoxiaover the years; however, it is unclear which is the best method for detecting hypoxia. Recently,imaging hypoxia has become an active area of investigation that yields promising results.5,6 Most of the imaging studies have focused on the use of specialized hypoxia-specific tracerssuch as 18F-Misonidazole or Cu-ATSM coupled with PET (Position Emission Tomography)or SPECT (single photon emission computed tomography) imaging. 5–7 However, thesetechnologies require expensive dedicated equipment for both imaging and tracer generation.We theorize that a different approach to image hypoxia using magnetic resonance imagingwithout the requirement of exogenous tracers would allow for a non-invasive and lessexpensive means of detecting hypoxia and for treatment monitoring.
In-vivo 1H MR spectroscopy (1H MRS) has been shown to offer a non-invasive means ofdetecting the presence of active tumor. The most common metabolites that have been studiedand validated are choline and creatine. The choline: creatine ratio (Cho/Cr) has been shown tobe helpful in the discrimination between regions of normal tissue, tumor and necrosis in severalsolid tumors, specifically gliomas and prostate cancers.8, 9 More recently, it has also beenapplied to head and neck (HN) cancers with promising preliminary results.10 Aside fromcholine and creatinine, very little has been published regarding the role of other metabolites intumor detection or prognostication in HN cancers.
Lactate is a metabolite that is found at high levels under tumor hypoxia. The lack of intracellularoxygen shifts the balance of cellular energy production from oxidative phosphorylation toglycolysis, whose end product is lactate. Poor circulation in the hypoxic tumormicroenvironment results in lactate accumulation, which theoretically can be detectedwith 1H MRS. Ex vivo measurements of lactate levels using a luciferase bioluminescencetechnique revealed that elevated tumor lactate concentration was associated with a higher riskof nodal and distant metastasis, local recurrence and poorer treatment outcomes in patientswith HN and cervical cancers.11–14 In vitro lactate 1H-MRS showed that high lactate signalwas associated with more failure and poorer survival in patients with HN and lung cancers.15, 16 To date, very little is known about in vivo lactate 1H MRS, its relationship to tumoroxygenation and its prognostic significance. We have therefore conducted a prospective studyto evaluate the relationship between lactate signal intensity (SI) in the proven metastatic nodeto tumor pO2 and treatment outcomes defined as nodal response and locoregional control inpatients with stage IV HN squamous cell carcinoma. In a preliminary report of the first 14patients, we noted that hypoxic nodes, defined as those with median pO2 < 10 mmHg hadhigher lactate levels than non-hypoxic nodes.17 Here we report mature results of a larger groupof 36 patients, in whom we correlated lac SI with tumor pO2 and treatment outcomes.
Materials and MethodsPatient population
Between 7/1996 and 6/2001, 62 patients with node positive, resectable stage IV HN SCC wereenrolled on an IRB approved institutional phase II study, in which patients were randomizedto receive either 2 cycles of induction chemotherapy (cisplatin and 5-Fluorouracil [5-FU])
Le et al. Page 2
Int J Radiat Oncol Biol Phys. Author manuscript; available in PMC 2009 July 15.
NIH
-PA Author Manuscript
NIH
-PA Author Manuscript
NIH
-PA Author Manuscript

followed by simultaneous chemoradiotherapy (cisplatin and 5-FU) or the same regimen withTirapazamine, a hypoxic cell cytotoxin. The details of the treatment regimens and long-termtreatment results of this study have been previously published.18 All patients underwentoxygen tension (pO2) measurements in the pathologically proven involved neck nodes withthe Eppendorf microelectrode (“pO2 Histograph”, Eppendorf, Hamburg, Germany) aspreviously published.19 Forty-one patients also had in vivo 1H MRS of total choline (Cho),creatine (Cr), lipid and lactate (Lac) in the same node prior to therapy; of these 5 had un-interpretable spectra due to significant motion artifact, leaving 36 with analyzable data.
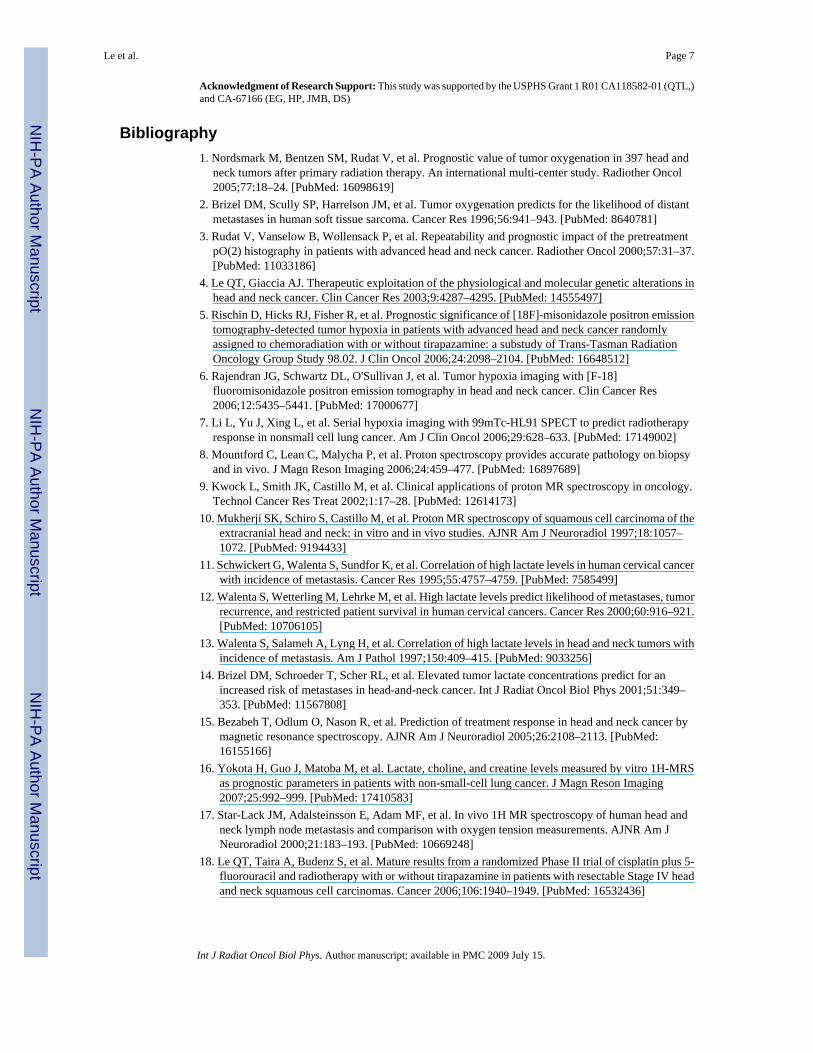
MRS Measurements and processingThe details of the 1H MRS measurement technique and processing algorithms have beenpreviously published.17 Briefly, data were collected at 1.5T using a General Electric Echo-Speed system (GE Medical System, Milwaukee, WI). Acquisition was performed with a four-element head, neck and cervical phased-array coil (MRI Devices Corp., Waukesha, WI)operating in receive-only mode. To help localize the lesion for MRS acquisition, T1-weightedspin-echo (500 ms / 8 ms / 2 [TR/TE/excitations]; field of view, 21cm; matrix 256X160) anddual spin-echo proton density-T2 weighted (3000 ms / 14 ms / 84 ms / 2 [TR/first TE/secondTE/excitations]) images were first acquired. The point-resolved spectroscopy (PRESS) volumewas prescribed to encompass as much T2-hyperintense lesion as possible. The averageprescribed volume was 5.0 cc (range: 0.73 to 20.6 cc). The MRS data (2000 / 144 ms [TE/TR])were acquired with a receiver bandwidth of 1250 Hz (512 points). Three minimum-phaseCHESS pulses of 60 Hz bandwidth were used for water suppression. On the average, 256excitations were acquired, yielding an MRS study time of 8.5 minutes. In patients with smallnodes (press volume < 1cc), the MRS acquisition time was doubled. In 5 patients, an additionalMRS data set was acquired from a region that comprise of contralateral neck muscle andsubcutaneous tissue for comparison. Normal appearing nodes were not used for comparisonas they were too small. Volume localized spectral editing was achieved using a J-differenttechnique that incorporates two inversion (BASING) pulses into the PRESS excitationsequence as previously described.17 Briefly, separation of Lac from overlapping singlets wasachieved by placing the Lac methyl quartet (4.1 ppm) within the BASING inversion band forCycle 1 of the 2-cycle scheme. For Cycle 2, the BASING inversion band was shifted downfieldof the Lac quartet. With the time separation (ΔtBAS) between the 2 BASING pulses set toΔtBAS = 1/(2J) and for TE = 1/J, addition of Cycle 1 and Cycle 2 excitations yielded the singlets,including Cho and Cr, whereas subtraction (Cycle 1– Cycle 2) yielded the Lac methyl doublet.The bandwith of the maximum phase BASING pulses was sufficiently narrow to allow forsimultaneous acquisition of the Lac doublet (1.3 ppm) and edited singlets upfield, includingCho (3.2 ppm). Figure 1 shows an example of the edited spectra in a patient.
For MRS processing, the accumulated free induction decays were processed and displayedusing software written by the authors for the Matlab (The Mathworks Inc., Natick, MA) andIDL (Research Systems Inc., Boulder, CO) platforms. To allow for comparison of absolutespectral intensity (SI), the phase-array data from each patient were normalized by the PRESSvolume and receiver gain and combined in a manner designed to maximize the final signal/noise (S/N) ratio. To reduce errors resulting from motion, a phase regularization algorithm wasdeveloped to lessen the deleterious effects of shot-to-shot phase variations. Care was also takento quantify lipid cancellation errors that remain after processing. Peak areas assigned to Choand Cr were calculated by numerically integrating the uncoupled (summed) spectra within the13 Hz windows of 3.3 to 3.1 ppm and 3.1 to 2.9 ppm, respectively. Lac and lipid peak areaswere calculated by numerically integrating the respective edited and unedited spectra from1.5-1.1 ppm (26 Hz).
Le et al. Page 3
Int J Radiat Oncol Biol Phys. Author manuscript; available in PMC 2009 July 15.
NIH
-PA Author Manuscript
NIH
-PA Author Manuscript
NIH
-PA Author Manuscript

Statistical analysisStatistical analysis was performed using Statview (SAS Institute Inc, Carey, NY) statisticalsoftware. Mann Whitney U and ANOVA tests were use to compare the average Lac SI andCho/Cr ratio between different patient groups. Locoregional control (LRC), freedom fromdistant metastasis (FFDM), freedom from relapse (FFR) and overall survival (OS) rates werecalculated using the Kaplan-Meier product-limit method.20,21 Significance levels amongcurves were determined using the log-rank test on univariate analysis. Only relapses above theclavicles were considered locoregional failures and relapses below the clavicle or brain or anybony metastases were considered distant failures. All sites of recurrence were coded as failuresfor FFR and all deaths, regardless of causes, were recorded for OS.
ResultsBetween 7/1996 and 6/2001, 62 patients with resectable stage IV HN SCC were randomizedto 2 cycles of induction chemotherapy (TPZ, cisplatin and 5-Fluorouracil [5-FU]) followed bysimultaneous chemoradiotherapy (TPZ, cisplatin and 5-FU) or the same regimen without TPZ.The results of this phase II randomized study has been previously published and showed nodifference in outcome with the addition of TPZ.18 Of these 62 patients, 41 patients underwentlactate and Cho/Cr MRS in the involved nodes as part of the correlative study to assess the roleof MRS in detecting tumor hypoxia. Five patients had uninterpretable data due to significantmotion artifact and 36 patients formed the cohort of this study. Figure 1 shows an example ofthe MRS data and pO2 histogram in a patient with a hypoxic node. Table 1 shows the patientcharacteristics for the MRS patients and all randomized patients. There were no significantdifferences among any of the characteristics between the two populations.
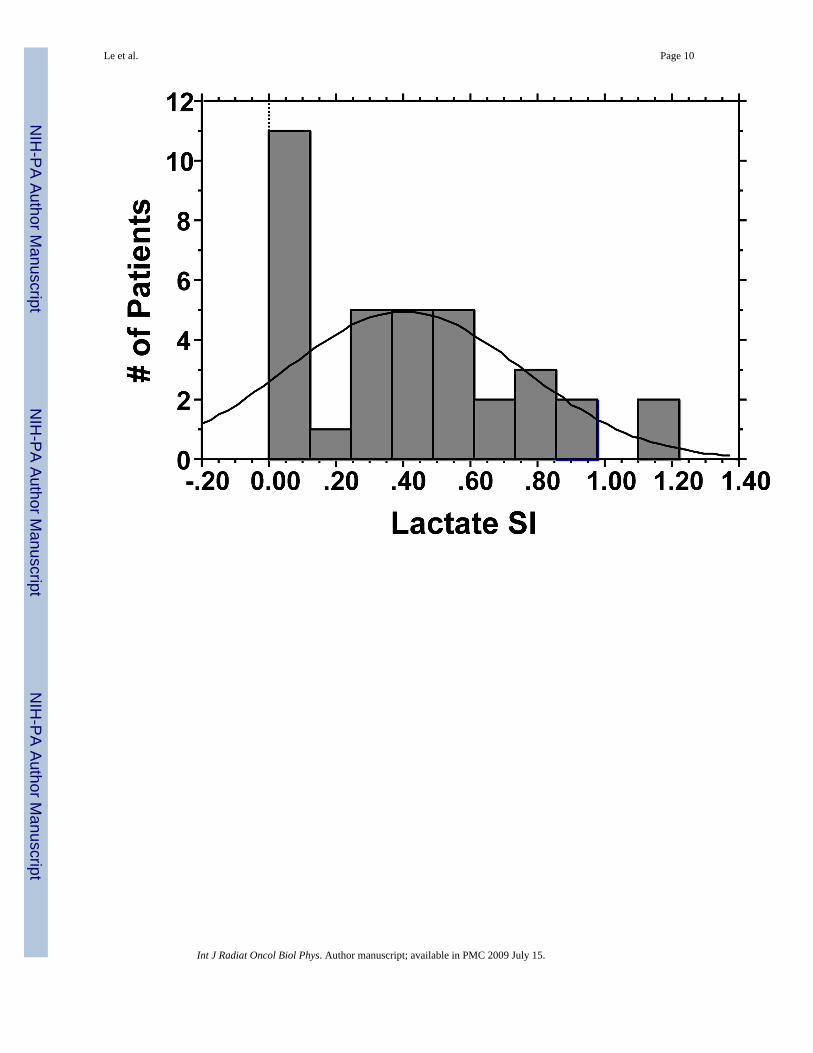
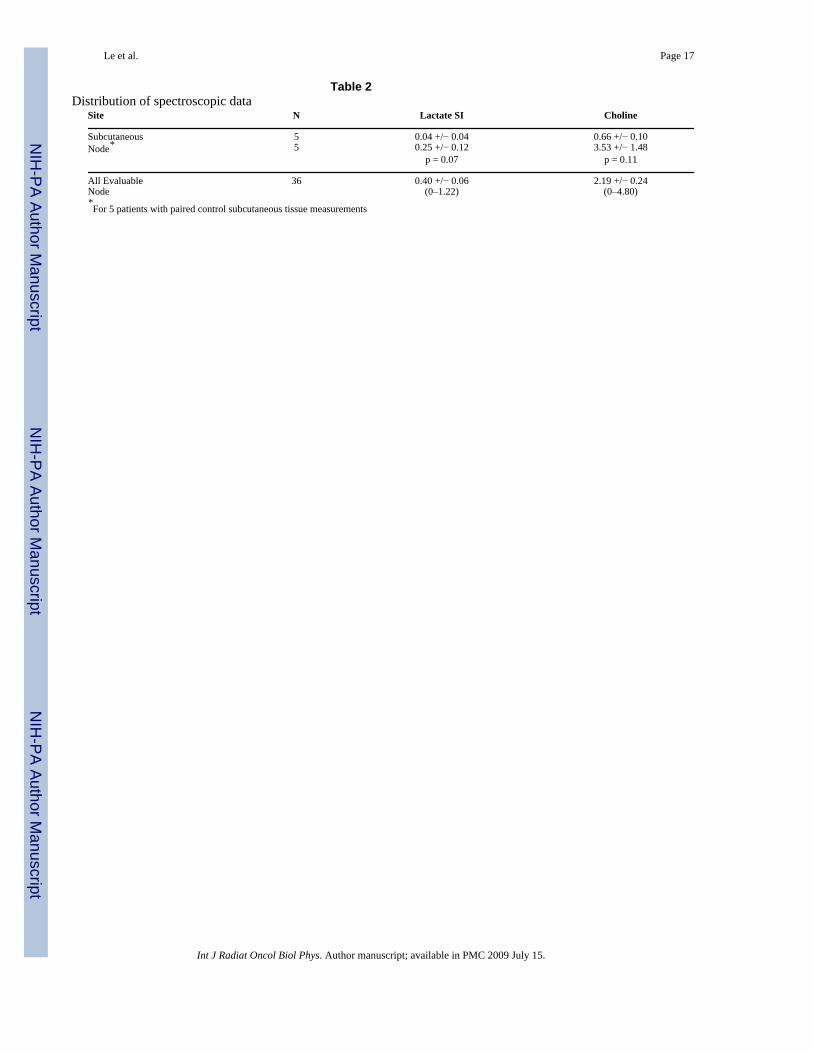
Of 36 patients with Lactate MRS, 8 patients had lactate signals at or below the baseline noiselevels, all of which were interpreted as yielding as SI of 0. Figure 2a shows the histogram forlactate SI. The median Lac SI was 0.38 and the mean was 0.40 (range 0–1.22, Table 2). TheCho/Cr was available for 35 patients and missing in 1 patient due to zero creatine reading.Figure 2b shows the histogram for Cho/Cr ratios. The median value was 1.88 and the meanwas 2.19 (range 0–4.8, Table 2). The first 5 patients also had lactate and Cho/Cr MRSassessments of their contralateral subcutaneous tissues. Table 2 shows that normalsubcutaneous tissues had lower Lac and Cho/Cr values than the involved nodes.
All patients had tumor pO2 assessment of the same cervical nodes with the Eppendorfhistograph. Figure 3 shows no significant correlation between tumor pO2 and Lac SI. The meanLac SI for hypoxic nodes (pO2≤10mmHg, n = 15) was 0.46 ± 0.10 [standard error] and it was0.36 ± 0.07 for non-hypoxic nodes (pO2>10mmHg, n = 21, p = 0.44). There was, however, asignificant correlation between Cho/Cr ratios and tumor pO2 (Figure 4a, p = 0.019) but thecorrelation coefficient was relatively low (R = 0.39). The mean Cho/Cr was 2.74 ± 0.34 forhypoxic nodes and 1.78 ± 0.31 for non-hypoxic nodes (p = 0.02).
There was no correlation between Lac SI and nodal stage. In addition, there was no correlationbetween Lac SI and nodal response that was assessed both clinically and pathologically. Asspecified in the prospective study, patients who had a clinical complete response (N= 24) asevaluated by both physical examination and imaging studies (CT or MRI) at 50 Gy of radiationwere followed clinically. One patient dropped out of the study after induction chemotherapyand was not assessable for nodal response. Eleven patients had less than a complete nodalresponse at 50 Gy and underwent a planned neck dissection as specified in the study; of these,5 had residual nodal cancer and classified as incomplete pathologic responders and 6 had noresidual cancer and classified as complete pathologic responders. Figure 4 shows therelationship between cervical nodal response and Lac SI. Although pathologic non-responders
Le et al. Page 4
Int J Radiat Oncol Biol Phys. Author manuscript; available in PMC 2009 July 15.
NIH
-PA Author Manuscript
NIH
-PA Author Manuscript
NIH
-PA Author Manuscript

had higher Lac SI than pathologic responders, the clinical complete responders had the highestLac SI; though none of these differences were significant.
At a median follow up of 61 months, a total of 4 patients have either uncontrolled locoregionaldisease or locoregional failures. There was no correlation between Lac SI and locoregionalfailure in either the control group or the TPZ treated group. The results are shown in Figure5a. Similarly, there was no difference in the freedom from metastasis in the high and low LacSI group when stratified for treatment (Figure 5b). A non-correlation was also noted for overallsurvival (data not shown).
DiscussionThe prognostic significance of lactate was first described by Schwickert et al who showed thatelevated tumoral lactate levels, as measured by bioluminescence imaging from tumor biopsies,correlated with the presence of nodal metastasis in 11 patients with cervical tumors.11 Sincethen, the same group has reported similar findings for HN cancers and for a larger group ofcervical cancer patients.12, 13 Brizel et al, using the same technologies, showed that elevatedtumoral lactate concentration from tumor biopsies were associated with the subsequentdevelopment of nodal and/or distant metastasis in HN cancer patients.14 This approach, thoughpromising, requires fresh frozen tumor tissues for analysis as well as technical expertise andspecialized equipments. In addition, it does not provide in vivo spatial distribution of lactaterich regions.
In addition to bioluminescent approach, MR spectroscopy has also been used to quantify lactatelevels in solid tumors. In most reported studies for tumor sites outside of the brain, lactate MRSwas mainly performed on fresh frozen tumor specimens that had previously been removedsurgically from the patients. Yokota et al reported that elevated lactate levels by ex-vivo MRScorrelated with a higher risk of recurrence and a poorer overall survival in 21 non-small celllung cancer patients treated surgically.16 Similarly, Bezabeh et al found that the ex vivo tumorspectral intensity ratio of 1.3/0.9 ppm, which corresponded to either lipid or lactate signal,significantly correlated with treatment failures in HN cancers.15 However, none of thesestudies have attempted to measure lactate levels in vivo, while the tumors were still in thepatients. The only reported in vivo studies have focused on central nervous system tumorswhere motion could be minimized and specialized head coils could be used.22
To our knowledge, this is the first prospective study to perform in vivo lactate MRS in HNcancers and to correlate the signal intensities to tumor pO2 and treatment outcomes. Ourpatients were different from the previously reported populations in several aspects. All patientshad to have nodal metastasis for lactate and pO2 assessment; therefore, we could not determinethe relationship between Lac SI and nodal metastasis as previously reported for thebioluminescent technique. In addition, all patients were treated in a uniform manner on aprospective study with chemoradiation +/− TPZ, using an aggressive regimen with inductionand concurrent chemotherapy, which may have affected the results of the study. Similar toother studies, we found lactate signals to be much higher in the involved nodes than in thecontrol subcutaneous tissues in the first 10 patients. In the first 14 patients, we also noted anencouraging direct correlation between Lac SI and tumor pO2.17 However, with more patientaccrual, the correlation disappeared. This discrepancy could be explained by the substantialtechnical difficulties associated with in vivo lactate MRS measurements in human HN cancers.These include motion artifacts from respiration, swallowing and carotid pulsation, which leadsto poor magnetic field homogeneity and compromised localization. This is compounded bymagnetic susceptibility problems arising from tissue-bone-air interfaces. Such technicaldifficulties can be surmounted for metabolites that exist at high concentration and whosespectra can be easily resolved from noise. However, for low-level metabolites such as lactate,
Le et al. Page 5
Int J Radiat Oncol Biol Phys. Author manuscript; available in PMC 2009 July 15.
NIH
-PA Author Manuscript
NIH
-PA Author Manuscript
NIH
-PA Author Manuscript
these technical difficulties can become formidable, especially with the 1.5T magnet. A higherstrength magnet such as a 3T magnet may help to improve the signal to noise ratio.
For our studies, lactate and lipid peak areas were calculated by numerically integrating therespective spectra from 1.5-1.1 ppm (26 Hz) based on known chemical shifts of lactate.However, we did not perform independent validation studies in xenograft models to confirmthat these peaks are indeed unrelated. The close vicinity of the lactate peak and the very largeoverlapping lipid peak can easily corrupt the lactate signal, causing zero or negative lactatereadings. As a result, 8 of 36 patients had Lac SI of zero, which significantly affected thesensitivity of the method. Another source of error in Lac measurements may be due tocontamination by the neighboring alanine resonance (1.5 ppm), which has been detected in invitro extracts of HN cancers. Finally, the presence of tumor necrosis, which is common in HNcancers, can also confound both Lac and tumor pO2 readings. While tumor necrosis can causespuriously low pO2 measurements, Lac levels have been shown to be low in necrotic areas inthe bioluminescent studies.11, 12 Hence, a tumor with large amount of necrosis may appearhypoxic on Eppendorf measurements but have low Lac SI on MRS.
Interestingly, we noted a correlation between Cho:Cr ratio and tumor pO2. Choline signal,which includes contributions from choline, phosphocholine, glycerol-phosphocholine andother trimethylamines, reflects cell membrane synthesis and breakdown and ischaracteristically elevated in tumors, including HN cancers.10 It has also been correlated withincreased cell density, tumor grade and proliferation in gliomas.23, 24 Creatine signal, whichincludes creatine and phosphocreatine, reflects energy metabolism and the levels can be lowin hypoxic and necrotic regions.17, 25 The increased Cho:Cr ratios in our series was more areflection of a declining creatine signal rather than of an increasing choline signal. Thissuggested that the correlation between Cho:Cr and tumor pO2 may be due to the presence ofnecrosis in the involved nodes since necrosis can result in low pO2 readings and elevatedCho:Cr ratio due to decreased creatine signal. However, we cannot directly rule out a potentialreal correlation between Cho:Cr signal and tumor oxygenation.
Lactate SI, as measured with this approach, did not correlate with treatment response or long-term outcomes as measured by locoregional control and freedom from distant metastasis. Thelow sensitivity of the method is probably the major reason for this lack of correlation. Inaddition, the small number of patients and the low number of events may be another explanationfor this lack of correlation. Interestingly, patients with high Lac SI who receivedchemoradiation alone had the highest risk of distant metastasis compared to the other groups,though the difference was small and not statistically significant. Another reason for lack ofcorrelation could be due to potential contamination of the resolved peaks by other metabolitessuch as alanine and lipids.
In summary, we have attempted to perform in vivo lactate MRS on the involved cervical nodesof patients with stage IV HN cancers. Our results suggest that the measurements as theycurrently stand, do not correlate with tumor pO2 or treatment outcomes. Further technicalimprovements in in vivo Lac SI measurements in HN cancer patients are warranted. Futureinvestigations will focus on improved acquisition and processing strategies, implementinghigher order shimming techniques and imaging at higher fields (>= 3T) to achieve finerchemical resolutions and measurement of both water and metabolite relaxation time to improveabsolute metabolite quantification.
AcknowledgementThe authors would like to thank Derek Huang for his assistance in submitting the manuscript.
Le et al. Page 6
Int J Radiat Oncol Biol Phys. Author manuscript; available in PMC 2009 July 15.
NIH
-PA Author Manuscript
NIH
-PA Author Manuscript
NIH
-PA Author Manuscript
Acknowledgment of Research Support: This study was supported by the USPHS Grant 1 R01 CA118582-01 (QTL,)and CA-67166 (EG, HP, JMB, DS)
Bibliography1. Nordsmark M, Bentzen SM, Rudat V, et al. Prognostic value of tumor oxygenation in 397 head and
neck tumors after primary radiation therapy. An international multi-center study. Radiother Oncol2005;77:18–24. [PubMed: 16098619]
2. Brizel DM, Scully SP, Harrelson JM, et al. Tumor oxygenation predicts for the likelihood of distantmetastases in human soft tissue sarcoma. Cancer Res 1996;56:941–943. [PubMed: 8640781]
3. Rudat V, Vanselow B, Wollensack P, et al. Repeatability and prognostic impact of the pretreatmentpO(2) histography in patients with advanced head and neck cancer. Radiother Oncol 2000;57:31–37.[PubMed: 11033186]
4. Le QT, Giaccia AJ. Therapeutic exploitation of the physiological and molecular genetic alterations inhead and neck cancer. Clin Cancer Res 2003;9:4287–4295. [PubMed: 14555497]
5. Rischin D, Hicks RJ, Fisher R, et al. Prognostic significance of [18F]-misonidazole positron emissiontomography-detected tumor hypoxia in patients with advanced head and neck cancer randomlyassigned to chemoradiation with or without tirapazamine: a substudy of Trans-Tasman RadiationOncology Group Study 98.02. J Clin Oncol 2006;24:2098–2104. [PubMed: 16648512]
6. Rajendran JG, Schwartz DL, O'Sullivan J, et al. Tumor hypoxia imaging with [F-18]fluoromisonidazole positron emission tomography in head and neck cancer. Clin Cancer Res2006;12:5435–5441. [PubMed: 17000677]
7. Li L, Yu J, Xing L, et al. Serial hypoxia imaging with 99mTc-HL91 SPECT to predict radiotherapyresponse in nonsmall cell lung cancer. Am J Clin Oncol 2006;29:628–633. [PubMed: 17149002]
8. Mountford C, Lean C, Malycha P, et al. Proton spectroscopy provides accurate pathology on biopsyand in vivo. J Magn Reson Imaging 2006;24:459–477. [PubMed: 16897689]
9. Kwock L, Smith JK, Castillo M, et al. Clinical applications of proton MR spectroscopy in oncology.Technol Cancer Res Treat 2002;1:17–28. [PubMed: 12614173]
10. Mukherji SK, Schiro S, Castillo M, et al. Proton MR spectroscopy of squamous cell carcinoma of theextracranial head and neck: in vitro and in vivo studies. AJNR Am J Neuroradiol 1997;18:1057–1072. [PubMed: 9194433]
11. Schwickert G, Walenta S, Sundfor K, et al. Correlation of high lactate levels in human cervical cancerwith incidence of metastasis. Cancer Res 1995;55:4757–4759. [PubMed: 7585499]
12. Walenta S, Wetterling M, Lehrke M, et al. High lactate levels predict likelihood of metastases, tumorrecurrence, and restricted patient survival in human cervical cancers. Cancer Res 2000;60:916–921.[PubMed: 10706105]
13. Walenta S, Salameh A, Lyng H, et al. Correlation of high lactate levels in head and neck tumors withincidence of metastasis. Am J Pathol 1997;150:409–415. [PubMed: 9033256]
14. Brizel DM, Schroeder T, Scher RL, et al. Elevated tumor lactate concentrations predict for anincreased risk of metastases in head-and-neck cancer. Int J Radiat Oncol Biol Phys 2001;51:349–353. [PubMed: 11567808]
15. Bezabeh T, Odlum O, Nason R, et al. Prediction of treatment response in head and neck cancer bymagnetic resonance spectroscopy. AJNR Am J Neuroradiol 2005;26:2108–2113. [PubMed:16155166]
16. Yokota H, Guo J, Matoba M, et al. Lactate, choline, and creatine levels measured by vitro 1H-MRSas prognostic parameters in patients with non-small-cell lung cancer. J Magn Reson Imaging2007;25:992–999. [PubMed: 17410583]
17. Star-Lack JM, Adalsteinsson E, Adam MF, et al. In vivo 1H MR spectroscopy of human head andneck lymph node metastasis and comparison with oxygen tension measurements. AJNR Am JNeuroradiol 2000;21:183–193. [PubMed: 10669248]
18. Le QT, Taira A, Budenz S, et al. Mature results from a randomized Phase II trial of cisplatin plus 5-fluorouracil and radiotherapy with or without tirapazamine in patients with resectable Stage IV headand neck squamous cell carcinomas. Cancer 2006;106:1940–1949. [PubMed: 16532436]
Le et al. Page 7
Int J Radiat Oncol Biol Phys. Author manuscript; available in PMC 2009 July 15.
NIH
-PA Author Manuscript
NIH
-PA Author Manuscript
NIH
-PA Author Manuscript

19. Terris DJ, Dunphy EP. Oxygen tension measurements of head and neck cancers. Arch OtolaryngolHead Neck Surg 1994;120:283–287. [PubMed: 8123237]
20. Kaplan ES, Meier P. Non-parametric estimations from incomplete observations. J Am Stat Assoc1958;53:457–481.
21. Cox DR. Regression models and life tables. J Royal Stat Soc 1972;34:187–229.22. Tarnawski R, Sokol M, Pieniazek P, et al. 1H-MRS in vivo predicts the early treatment outcome of
postoperative radiotherapy for malignant gliomas. Int J Radiat Oncol Biol Phys 2002;52:1271–1276.[PubMed: 11955739]
23. Girard N, Wang ZJ, Erbetta A, et al. Prognostic value of proton MR spectroscopy of cerebralhemisphere tumors in children. Neuroradiology 1998;40:121–125. [PubMed: 9541923]
24. Tamiya T, Kinoshita K, Ono Y, et al. Proton magnetic resonance spectroscopy reflects cellularproliferative activity in astrocytomas. Neuroradiology 2000;42:333–338. [PubMed: 10872152]
25. Payne GS, Leach MO. Applications of magnetic resonance spectroscopy in radiotherapy treatmentplanning. Br J Radiol 2006;79(Spec No 1):S16–S26. [PubMed: 16980681]
Le et al. Page 8
Int J Radiat Oncol Biol Phys. Author manuscript; available in PMC 2009 July 15.
NIH
-PA Author Manuscript
NIH
-PA Author Manuscript
NIH
-PA Author Manuscript
Figure 1.An example of the MRS data and pO2 histogram in a patient with a hypoxic node. A. T2weighted image (3000/85/2) showing the location of the PRESS (spectroscopic) volume forspectroscopic imaging; B. Histogram pf pO2 measurement. The median pO2 is 1.4 mm Hg. C.Uncoupled spectra (cycle 1 + cycle 2) for resolution of Choline and Creatine signals. D.Coupled spectrum (cycle 1 − cycle 2) for resolution of lactate signal. The end result Choline,Creatine and Lactate SI is shown.
Le et al. Page 9
Int J Radiat Oncol Biol Phys. Author manuscript; available in PMC 2009 July 15.
NIH
-PA Author Manuscript
NIH
-PA Author Manuscript
NIH
-PA Author Manuscript
Le et al. Page 10
Int J Radiat Oncol Biol Phys. Author manuscript; available in PMC 2009 July 15.
NIH
-PA Author Manuscript
NIH
-PA Author Manuscript
NIH
-PA Author Manuscript
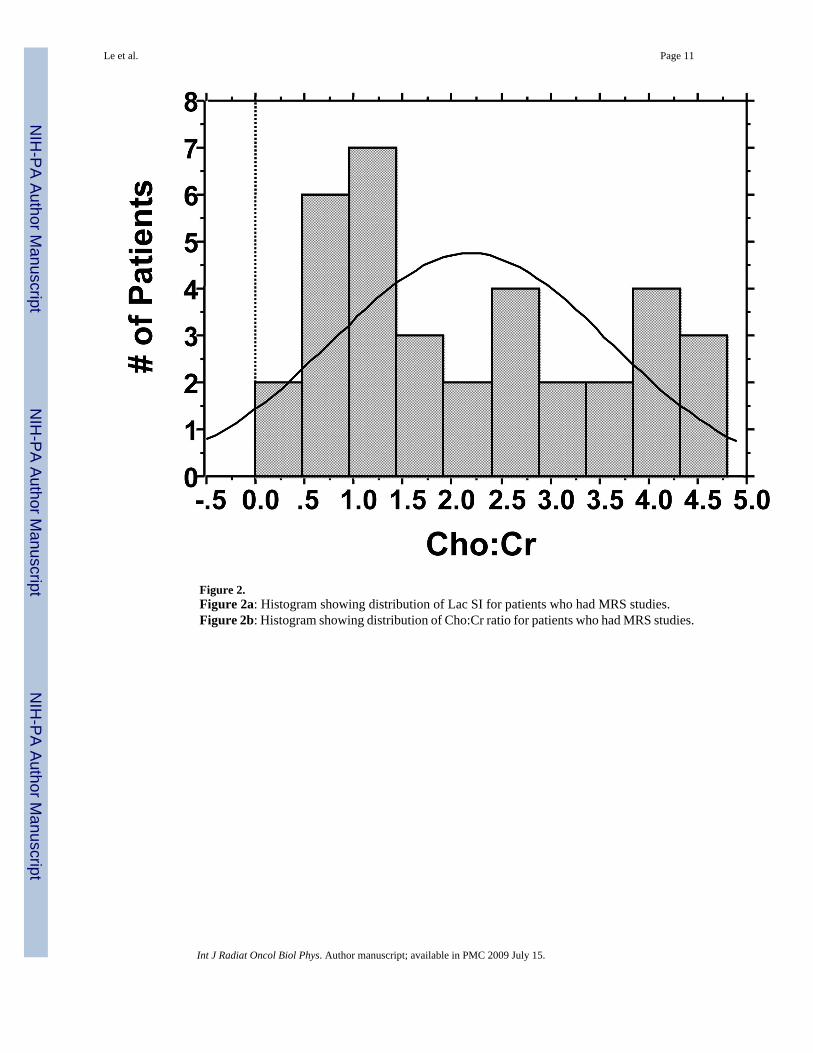
Figure 2.Figure 2a: Histogram showing distribution of Lac SI for patients who had MRS studies.Figure 2b: Histogram showing distribution of Cho:Cr ratio for patients who had MRS studies.
Le et al. Page 11
Int J Radiat Oncol Biol Phys. Author manuscript; available in PMC 2009 July 15.
NIH
-PA Author Manuscript
NIH
-PA Author Manuscript
NIH
-PA Author Manuscript
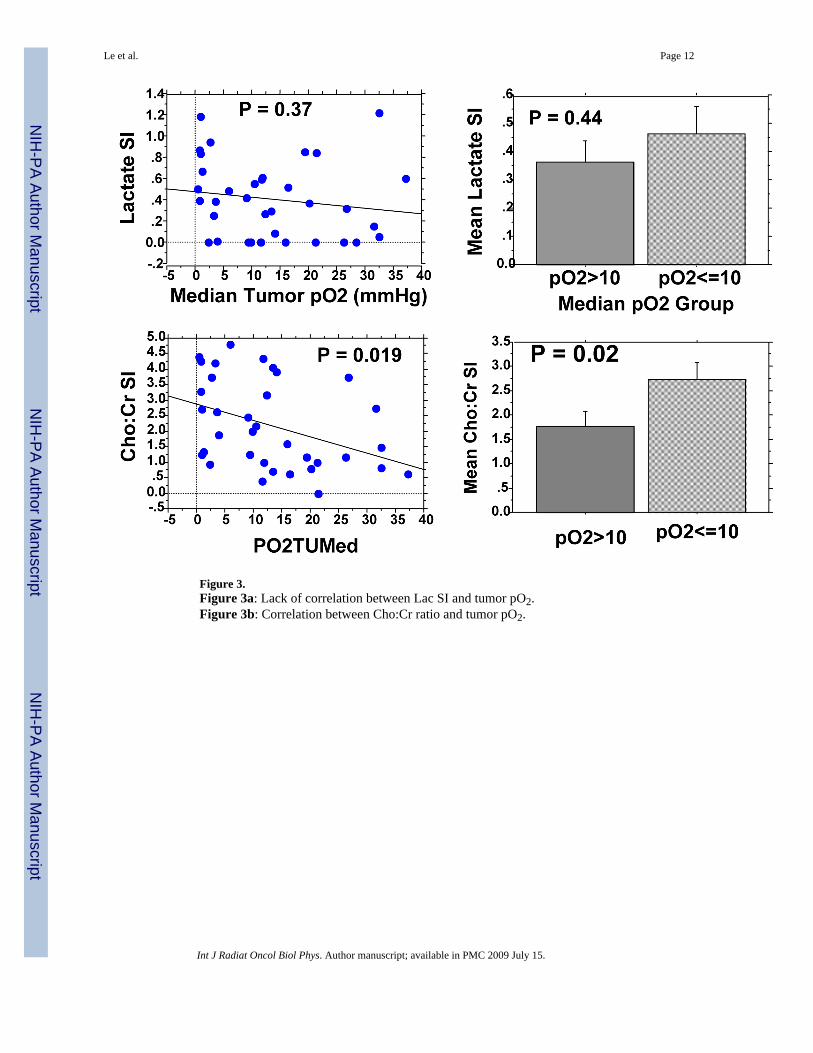
Figure 3.Figure 3a: Lack of correlation between Lac SI and tumor pO2.Figure 3b: Correlation between Cho:Cr ratio and tumor pO2.
Le et al. Page 12
Int J Radiat Oncol Biol Phys. Author manuscript; available in PMC 2009 July 15.
NIH
-PA Author Manuscript
NIH
-PA Author Manuscript
NIH
-PA Author Manuscript
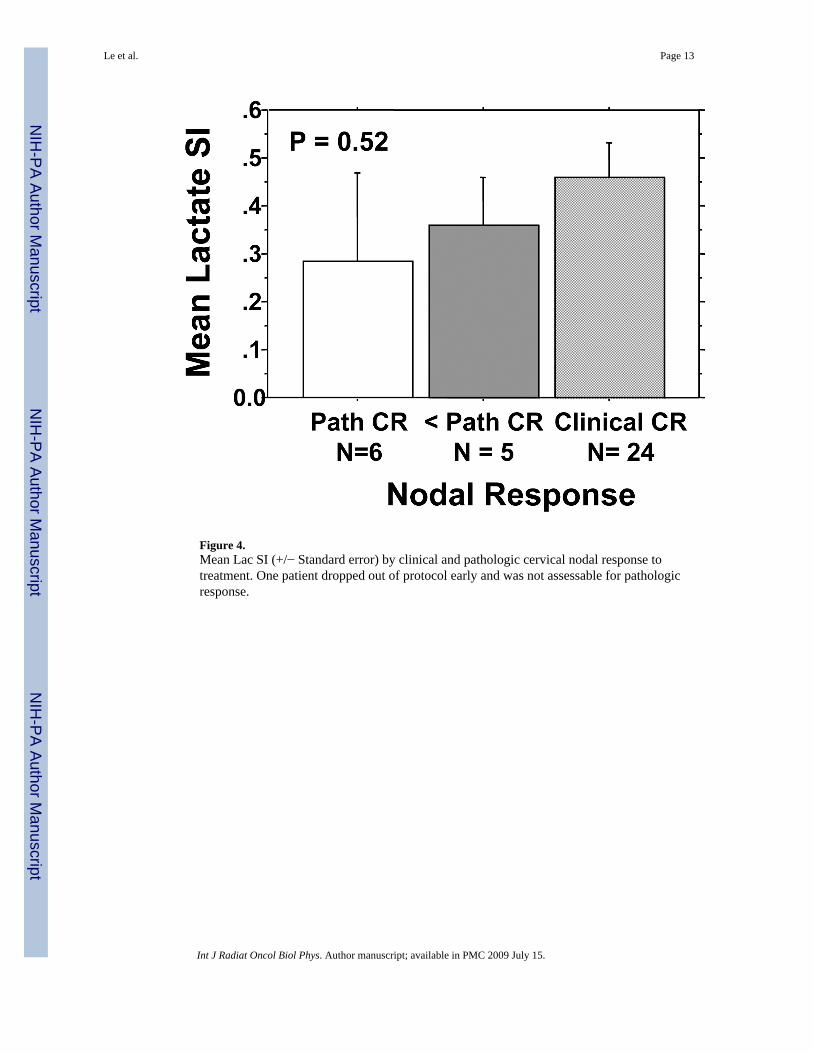
Figure 4.Mean Lac SI (+/− Standard error) by clinical and pathologic cervical nodal response totreatment. One patient dropped out of protocol early and was not assessable for pathologicresponse.
Le et al. Page 13
Int J Radiat Oncol Biol Phys. Author manuscript; available in PMC 2009 July 15.
NIH
-PA Author Manuscript
NIH
-PA Author Manuscript
NIH
-PA Author Manuscript

Le et al. Page 14
Int J Radiat Oncol Biol Phys. Author manuscript; available in PMC 2009 July 15.
NIH
-PA Author Manuscript
NIH
-PA Author Manuscript
NIH
-PA Author Manuscript
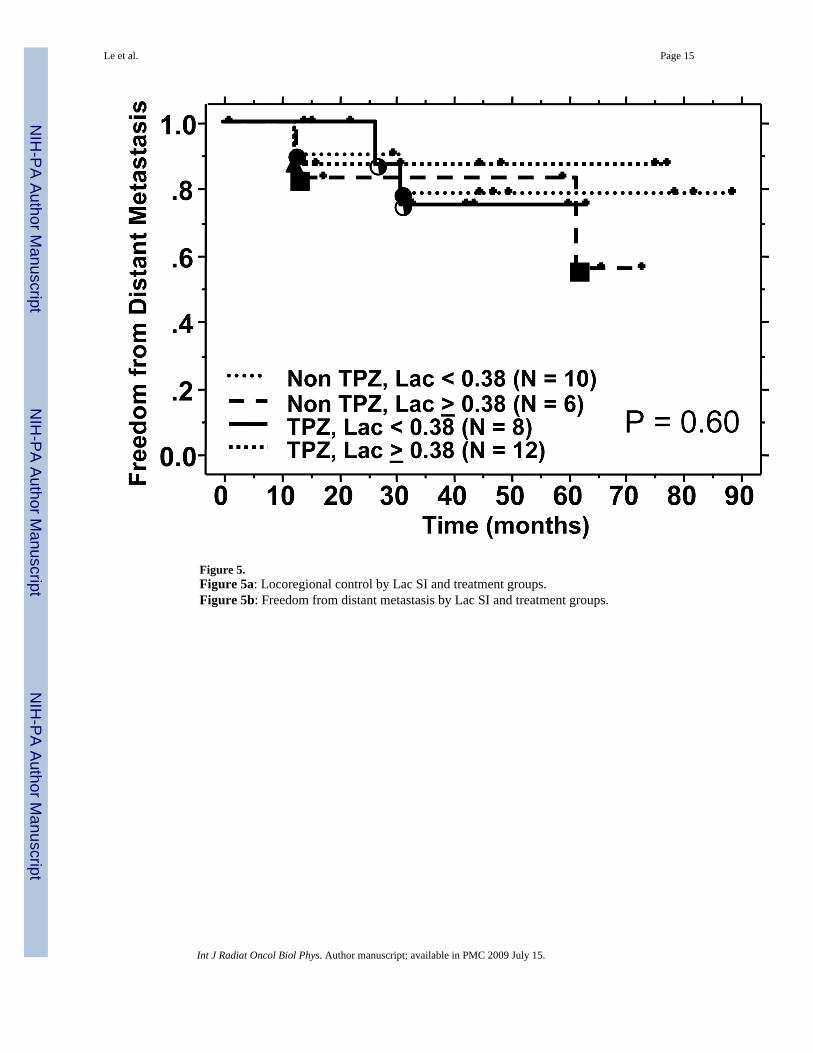
Figure 5.Figure 5a: Locoregional control by Lac SI and treatment groups.Figure 5b: Freedom from distant metastasis by Lac SI and treatment groups.
Le et al. Page 15
Int J Radiat Oncol Biol Phys. Author manuscript; available in PMC 2009 July 15.
NIH
-PA Author Manuscript
NIH
-PA Author Manuscript
NIH
-PA Author Manuscript

NIH
-PA Author Manuscript
NIH
-PA Author Manuscript
NIH
-PA Author Manuscript
Le et al. Page 16
Table1Comparison of patient, tumor and treatment characteristics between the randomized patients and patients with LactateMRS
Characteristics All Patients (N = 62) MRS Patients (n = 36) P - value
Median age (range) 58 (39–81) 57 (41–75) NS
Male: Female (%) 54:8 35:1
Primary Tumor SiteOropharynx 39 25 NSOral cavity 4* 1Larynx 6 2Hypopharynx 11* 8Others 3 0
T-stage NS0 2 01 8 72 16 103 12 54 24 14
N-stage NS1 5 52 43 (2a:7, 2b:23, 2c:13) 22 (2a:4, 2b:10; 2c:8)3 14 9
Median Tumor pO2 12.13 (0.35–45.17) 11.82 (0.43–37.20)≤ 10 mm Hg 25 15 NS>10 mm Hg 37 21
Treatment NSCRT alone 29 16CRT + TPZ 33 20
Neck dissection NSNo 40 25Yes 22 11NS: not statistically significant (p > 0.05) by χ2, Fisher’s exact or T-test.
*One patient with 2 primary tumor sites (1 in the hypopharynx and 1 in the oral cavity)
Int J Radiat Oncol Biol Phys. Author manuscript; available in PMC 2009 July 15.
NIH
-PA Author Manuscript
NIH
-PA Author Manuscript
NIH
-PA Author Manuscript
Le et al. Page 17
Table 2Distribution of spectroscopic data
Site N Lactate SI Choline
Subcutaneous 5 0.04 +/− 0.04 0.66 +/− 0.10Node* 5 0.25 +/− 0.12 3.53 +/− 1.48
p = 0.07 p = 0.11
All Evaluable 36 0.40 +/− 0.06 2.19 +/− 0.24Node (0–1.22) (0–4.80)*For 5 patients with paired control subcutaneous tissue measurements
Int J Radiat Oncol Biol Phys. Author manuscript; available in PMC 2009 July 15.