Soil clay influences Acacia encroachment in a South African grassland

If
AD
a
ARR2AA
KABAA�I
1
iippsddourolbimdbb
h0
International Journal of Biological Macromolecules 75 (2015) 81–89
Contents lists available at ScienceDirect
International Journal of Biological Macromolecules
j ourna l h o mepa ge: www.elsev ier .com/ locate / i jb iomac
n vitro antioxidant and antidiabetic activities of biomodified ligninrom Acacia nilotica wood
nand Barapatre, Keshaw Ram Aadil, Bhupendra Nath Tiwary, Harit Jha ∗
epartment of Biotechnology, Guru Ghasidas Vishwavidyalaya (A Central University), Bilaspur, Chhattisgarh 495009, India
r t i c l e i n f o
rticle history:eceived 5 June 2014eceived in revised form6 November 2014ccepted 8 January 2015vailable online 16 January 2015
eywords:
a b s t r a c t
The antioxidant and antidiabetic activity of biomodified alkali lignin extracted from a deciduous plantAcacia nilotica, was evaluated in vitro. The extracted alkali lignin was subjected to microbial biotransfor-mation by ligninolytic fungus Aspergillus flavus and Emericella nidulans. These modifications were doneunder varying concentration of carbon to nitrogen sources. The structural feature of the lignin sampleswere compared by FTIR, functional group analysis and 13C solid state NMR. All lignin samples were testedfor antioxidant efficiency, reducing power and H2O2 scavenging power. Modifications in all lignin samplesshowed correlation with their antioxidant scavenging activity and reducing power. Antidiabetic prop-
cacia ligniniotransformationntioxidantntidiabetic-Amylase
n vitro glucose movement
erties were evaluated in terms of in vitro glucose movement inhibition and �-amylase inhibition assay.Modified samples exhibited increased glucose binding efficiency as demonstrated by the decreased glu-cose diffusion (55.5–76.3%) and 1.16–1.18-fold enhanced �-amylase inhibition in comparison to theircontrol samples. The results obtained demonstrate that the structure and functional modifications inlignin significantly affects its bioefficacy in term of antioxidant and antidiabetic activities.
© 2015 Elsevier B.V. All rights reserved.
. Introduction
Plant phenolics and polyphenols have been increasingly entic-ng the attraction due to their beneficial therapeutic valuesncluding antioxidant, antimicrobial, anti-inflammatory, cardio-rotective, anticancerous, chemo-preventive and neuro-protectiveroperties. Polyphenols have been considered, a health foodupplement and are claimed to possess health promoting orisease-preventing properties [1]. Lignin, the second most abun-ant natural macromolecule (polyphenolic in nature and 10–35%f dry wt. of lignocellulosic biomass), is a natural polymerized prod-ct of optically active p-hydroxycinnamyl alcohol monomers andelated monolignols (p-coumaryl, coniferyl, and sinapyl) formed byxidative reactions. This polymer is the result of various inter unitinkages in the monomer and monolignols (e.g. �-O-4, �-5, �-�,iphenyl (5-5), 4-O-5) [2]. The precise chemical structure of lignin
s not known because of its complex polymeric nature and due toany random coupling. Alkali lignin is currently the largest pro-
uced among all lignin classes and a less valuable co-product of
iofuel and paper pulp industries, which is separated from fibersy a chemical pulping (mainly soda and sulphite) process [3].∗ Corresponding author. Tel.: +91 9826630805.E-mail address: [email protected] (H. Jha).
ttp://dx.doi.org/10.1016/j.ijbiomac.2015.01.012141-8130/© 2015 Elsevier B.V. All rights reserved.
Acacia nilotica, locally known as “Babul”, is a multipurposedeciduous tree of Mimosaseae family predominantly found in cen-tral India. This plant contains a variety of bioactive componentssuch as ellagic acid, isoquercitin, leucocyanadin, kaempferol-7-diglucoside, derivatives of (+)-catechin, apigenin derivatives etc.[4]. Traditionally in the central region of India leaves, pod, barkand root of A. nilotica is used for the treatment of various dis-eases related to oral, bone and skin, like cold, bronchitis, diarrhoea,dysentery, biliousness, bleeding piles and Leucoderma [5].
Oxidative damages creates by free radicals, play a substantialrole in the evolution of human diseases. Toxicity of free radicalscontributes to proteins and DNA damage, inflammation, tissueinjury and subsequent cellular apoptosis, which finally leads tocancer, emphysema, cirrhosis, arteriosclerosis and arthritis [6].Oxidative stress is created in the body due to a disruption in theequilibrium between the production of reactive oxygen/nitrogenspecies (ROS/RNS) and the removal via the antioxidant defence sys-tem [7]. Antioxidants can interfere with the oxidative processesby reacting with free radicals, chelating catalytic metals and alsoby acting as oxygen scavengers thus helping the human body toreduce oxidative damage. From various epidemiological studies,it is proved that polyphenolic compounds possess an excellent
antioxidant properties [6,8]. Previous studies also reported thatthe polyphenols found in Acacia sp. plants having good antioxi-dant power [4,5,9,10]. As a complex phenolic polymer, lignin alsopossess a respectable medicinal properties [2,3,11].
8 of Bio
hwlTteomadAdflpat
cihea
2
2
p(Iapep
2
dflTrs6ppraaff
2
2
wwVdIigA
2 A. Barapatre et al. / International Journal
Over the last century changes in human behavior and life styleave resulted in a dramatic increase in the incidence of diabetesorld over. Presently, it is estimated that more than 220 mil-
ion suffer from diabetes in which 90% is from type 2 diabetesype 2 diabetes is the results of ineffectiveness of insulin andhe primary cause of complications linked to cardiovascular dis-ase, renal failure, blindness, neurological complications, and son [12]. Currently available conventional therapies for the treat-ent of diabetes include insulin and oral antidiabetic agents such
s sulfonylurea, biguanides, and alpha-glucosidase inhibitors. Tra-itionally, many active compounds of plant origin including severalcacia sp. plants, have been also employed in the treatment ofiabetes, mostly the secondary metabolites including alkaloids,avonoids, phenolics, steroids, carbohydrates, glycopeptides, ter-enoids etc. [13]. The inhibition of enzyme like �-amylase as wells the delay in glucose absorption to be an important strategy inhe management of blood glucose level in type 2 diabetic [14].
Based on the fact that structural heterogeneity will affect thehemical properties of lignin, we report the bioefficacy of biolog-cally modified lignin in terms of the antioxidant, antiradical andydrogen peroxidase scavenging property and also evaluate theffectiveness of modified lignin as an inhibitor of �-amylase activitynd in vitro glucose movement.
. Materials and methods
.1. Chemical and reagents
Gallic acid, d-glucose, �-amylase (EC 3.2.1.1), 1,1-diphenyl-2-icrylhydrazyl (DPPH), neocuproine (Nc), catalase from bovine liver966 U mg−1) were purchased from Sigma–Aldrich Inc. (Mumbai,ndia). All other chemicals and reagents used were of high puritynalytical grade and purchased from Merck Pvt. Ltd. (India). Ultra-ure water (Elix, Merck Milipore, India) was used throughout thexperiment. Wood dust (18 mesh size) of A. nilotica hardwood wasrocured locally from the saw mill of Bilaspur, Chhattisgarh, India.
.2. Extraction and characterization of alkali lignin
Alkali extraction of lignin was achieved by treatment of woodust with an aqueous solution of NaOH (1.2%, w/v) in a 1 L glassask for 1 h at 120 ◦C, using a solid/liquid ratio of 1:10 (g/mL).he solution was filtered through Whatman filter paper No. 4 toemove wood dust. The filtrate (black liquor) was concentrated bylow heating at 60 ◦C in an oven and acidified up to pH 5.5 with
M HCl. The water-soluble hemicellulosic fraction was removed byrecipitation, after adding two volumes of 95% ethanol (v/v). Therecipitated hemicellulosic were removed by gravity filtration. Theemaining filtrate was concentrated to 20–30 mL, and the pH wasdjusted to 1.5–2.0 with 6 M HCl. The alkali lignin was precipitatednd sediments by centrifugation at 10,000 rpm (Remi R-24, India)or 10 min. The pellet was dried and stored at room temperatureor further study [15].
.3. Biodegradation and characterization of alkali lignin
.3.1. Microorganism (fungus)The two potent ligninolytic fungus A. flavus and E. nidulans
ere used for the biotransformation of alkali lignin. The strainsere isolated from soil samples collected from Guru Ghasidasishwavidyalaya campus, Bilaspur (C.G.) and near the effluentischarge site of the Orient paper mill situated in Amalai (M.P.),
ndia. Two potentially ligninolytic strains were characterized anddentified based on morphological characterization and partialene sequencing of Internal Transcribed Spacer (ITS) regions as. flavus (F10, NCBI accession no. KC911631.1) and E. nidulans
logical Macromolecules 75 (2015) 81–89
(APF4, NCBI accession no. KC911632.1) respectively. The strainswere maintained on malt agar slants for further use.
2.3.2. Basal culture mediumBiodegradation of lignin was performed under different carbon
to nitrogen ratio i.e. low and high in Basal Salt Medium (BSM).The BSM contained gL−1 of KH2PO4, 0.2 g; MgSO4·7H2O, 0.05 g;CaC12, 0.01 g supplemented with a 1 mL mineral solution. The min-eral solution contained (in gL−1) nitrilotriacetate, 1.5; MgSO4·7H2O,3.0; MnSO4·H2O, 0.5; NaCl, 1.0; FeSO4.7H2O, 0.1; CoSO4, 0.1;CaC12, 0.082; ZnSO4, 0.1; CuSO4·5H2O, 0.01; AlK(SO4)2, 0.01;H3BO3, 0.010; NaMoO4, 0.01. The high carbon low nitrogen (HCLN)medium contained 56 mM d-glucose as a carbon source and 2.4 mMnitrogen (0.6 mM NH4NO3 and 0.6 mM l-asparagine) whereas thelow carbon high nitrogen (HNLC) medium contained 8.8 mM d-glucose was and 24 mM nitrogen (NH4NO3 and l-asparagine, 6 mMeach). The pH of BSM was maintained at 5.6–5.8 for biomodificationof alkali lignin [16].
2.3.3. Biomodification and characterization of alkali ligninTwo hundred mililiter of HCLN and HNLC BSM medium main-
tained at pH 5.6–5.8 were transferred to 500 mL erlenmeyer flasks.The autoclaved media were aseptically inoculated with 3 bores(6 mm diameter) of 7 days old culture of the strains F10 and APF4and incubated at 28 ◦C for 21 days under static condition. The fungalmat was separated from the medium by filtration through sterilizedWhatman filter paper No 4. The modified lignin was recovered fromfiltrate by the same method as described in Section 2.2. Uninocu-lated media were used as negative control.
Biotransformed alkali lignin was characterized by FTIR. Asmall fraction of the sample was ground properly with equalamount of KBr. The FTIR spectrum was obtained in the range of400–4000 cm−1 using FTIR spectrophotometer Affinity A1, (Shi-madzu, Japan).
A high-resolution 1D solid-state 13C NMR spectra were obtainedwith the Cross-Polarization Magic-Angle Spinning (CPMAS)technique on a Bruker spectrometer (Sophisticated AnalyticalInstrument Facility (SAIF), Indian Institute of Science, Bangalore,India) operating at 100.525 MHz frequency for the 13C carbonnuclei. A total of 300 mg solid sample was used for the NMR spectraat 294 K. The 2000–6000 scan was performed to obtain a 1D spectrawith a 29.10 ms acquisition time and 5 s relaxation delay.
2.4. Total polyphenol content (TPC)
Total polyphenol content (TPC) was determined by reactionwith Folin-Denis reagent [17]. One mL of each lignin sample(50 �g/mL) was added to 0.5 mL of Folin-Denis reagent. After 30 s,1 mL of 20% (w/v) sodium carbonate was added and the volume wasmade up to 5 mL with distilled water. The mixture was allowed tostand at room temperature for 10 min. The absorbance of result-ing blue complex was measured at 765 nm against blank usingUV–visible double beam spectrophotometer (Shimatzu UV-1800,Japan). A calibration curve of gallic acid was prepared, and pheno-lic contents were determined from the linear regression equation ofthis curve. The results were expressed as �g gallic acid equivalents(GAE) per milligram of dry material.
2.5. Functional group analysis
2.5.1. Phenolic hydroxyl groups by ultraviolet-spectroscopyThe content of hydroxyl phenolic units in lignin fractions was
determined by UV spectroscopy as described Aadil et al. [9]. Thismethod is based on the difference in absorption of lignin samplesat pH 6 (495 mL of 0.2 N potassium dihydrogen phosphate solutionmixed with 113 mL of 0.1 N NaOH and diluted to 2 L with distilled
of Bio
w0ttl�
%
2m
ipt
2
ts6o5escmwrc
2
or(aDai
D
wa
2
iIes(wtbCfwots
A. Barapatre et al. / International Journal
ater) and at alkaline buffer solution pH 12 (0.1 N of boric acid in.1 N NaOH solution). The difference in spectra was obtained byaking the absorbance of the alkaline solution relative to that ofhe neutralized solution in the range of 200–400 nm. The pheno-ic hydroxyl group content of lignin samples was calculated using
amax.
phenolic hydroxyl = �amax × 1741
.5.2. Carboxyl groups determination by aqueous titrationethod
An amount of 25 mg of recovered lignin samples was suspendedn 25 mL of an alkaline 0.1 N NaOH solution and stirring for 3 h. TheH was adjusted to 12 with 0.1 N NaOH. Followed by potentiometricitration with 0.1 N HCl, as described Aadil et al. [9].
.6. Total reducing power assay
Reducing the power of all samples was determined according tohe method of Oyaizu [18]. Briefly, different concentrations of ligninamples were prepared in sodium phosphate buffer (200 mM, pH.6) and 2.5 mL of each sample was separately mixed with 2.5 mLf 1% (w/v) potassium ferricyanide. The mixture was incubated at0 ◦C for 20 min. A mixture containing all the reaction reagentsxcept the test material serves as the control. The reaction wastopped by adding 2.5 mL of 10% (w/v) TCA and the mixture wasentrifuged at 1750 rpm for 10 min. The upper layer (2 mL) wasixed with 1 mL of 0.1% (w/v) of ferric chloride and made up to 8 mLith deionized water. The perl’s prussian blue color formed due to
eduction in Fe3+ was measured at A700. The EC50 of extracts werealculated from the graph of A700 versus extracts concentration.
.7. DPPH free radical scavenging activity
The antiradical activity of lignin samples was measured basedn their reaction with stable free radical DPPH* and subsequenteduction in �max of DPPH* [19]. In this reaction 1.5 mL sample,100 �g/mL, prepared in 50 mM phosphate buffer, pH 7.5) wasllowed to react with 1.5 mL of 100 �M methanolic solution ofPPH* for 30 min in darkness at room temperature. The decrease inbsorbance was measured at A515. DPPH* radical scavenging capac-ty was calculated using the following equation
PPH ∗ scavenging (%) =[
(A0 − A1)A0
× 100]
here A0 and A1 are absorbance of DPPH* radical at 515 nm in thebsence and presence of the samples.
.8. Hydrogen peroxide scavenging (HPS) assay
HPS capacity of lignin samples was estimated by cupric reduc-ng antioxidant capacity method according to Ozyurek et al. [20].n this method, hydrogen peroxide incubation solution and scav-nger solutions were prepared. The hydrogen peroxide incubationolution (used as a reference) contained 0.7 mL of phosphate buffer0.2 M, pH 7.4), 0.4 mL of 1 mM H2O2, 0.4 mL of 0.1 mM CuCl2.2H2O,hereas scavenger solutions (I and II) were prepared in two
est tubes containing 0.2 mL of test samples, 0.5 mL of phosphateuffer (0.2 M, pH 7.4), 0.4 mL of 1 mM H2O2 and 0.4 mL of 0.1 mMuCl2.2H2O (identical up to this step). The mixtures were incubated
or 30 min at 37 ◦C in water bath. After incubation 0.4 mL of H2O
as added to the reference and scavenger solution-I and 0.4 mLf catalase solution (268 U mL−1) in scavenger solution-II. The mix-ure was vortexes for 30 s. From the above incubated mixtures, 1 mLolution was mixed with 1 mL of Nc (0.0075 M, freshly prepared
logical Macromolecules 75 (2015) 81–89 83
in ethanol), 1 mL of 0.1 mM CuCl2·2H2O and 2 mL of ammoniumacetate buffer (1 M, pH 7). After 30 min, the absorbance of the finalsolution was taken at 450 nm against the reagent blank. The HPSactivity (%) of samples was calculated using the following formula:
HPS(%) = [A0 − {A1 − A2}]A0
× 100
where A0 is the absorbance of reference hydrogen peroxide incuba-tion solution, A1 and A2 are the absorbance of scavenger solution-Iand -II, respectively.
2.9. Antidiabetic assay by in vitro glucose movement
To evaluate the effects of biotransformed lignin on glucosemovement an in vitro model system was used according to Büyük-balci and Nehir [21] with slight modification. The dialysis tube(6 cm × 14.3 mm) (HiMedia, Mumbai, India; pore size 2.4 nm) wasfilled with a total volume of 6 mL test sample mixtures containing1 mg/mL biotransformed lignin and 1.65 mM d-glucose (preparedin 0.15 M NaCl) in the ratio of 2:1 (v/v). The dialysis tube was sealedat both ends and placed in a flask containing 45 mL 0.15 M NaCl.Dialysis experiment was performed on an orbital shaker water bath(100 rpm) at 37 ◦C for 3 h to induce the movement of glucose intothe external solution. Concentration of glucose outside the dialy-sis tubing was measured by DNS (dinitrosaliacylic acid) reagent.The control experiment was conducted in the absence of the testsample.
2.10. In vitro ˛-amylase inhibition assay
The �-amylase inhibitory activity was determined by themethod of Quesille-Villalobos et al. [22]. A total of 500 �L of dif-ferent concentrations of each sample (0.1, 0.5, 1 and 5 mg/mL) and500 �L of 0.02 M sodium phosphate buffer (pH 6.9 with 0.006 MNaCl) containing �-amylase (0.5 mg/mL) was incubated for 10 minat 25 ◦C. After preincubation, 500 �L of 1% (w/v) starch solution in0.02 M sodium phosphate buffer (pH 6.9 with 0.006 M NaCl) wasadded to each of the pre-incubated tubes. The reaction mixtureswere then incubated at 25 ◦C for 10 min and stopped with 1 mLof DNS reagent. The test tubes were further incubated in a boilingwater bath for 10 min and cooled to room temperature. The reactionmixture was diluted with 10 mL distilled water and the absorbancewas measured at 540 nm. The absorbance of blank samples (bufferinstead of enzyme solution) and a control (buffer in place of thesample extract) was also recorded for comparison. The final activityof �-amylase was calculated by subtracting the final A540 of samplewith its corresponding A540 blank.
2.11. Statistical analysis
Unless otherwise stated experiments were performed in tripli-cate and statistical analysis was done in term of mean ± standarddeviation (SD). Significance levels were calculated using Graph PadPrism 5.0 by one way analysis of variance (ANOVA) followed byTukey’s multiple comparison test.
3. Results and discussion
The biotransformation and biodegradation of lignin occurin a multistep process involving Lignin Peroxidase (LiP),Manganese–dependent Peroxidase (MnP), Laccase, Versatile
Peroxidases (VPs) and dioxygenases enzymes, working in asso-ciation with small molecules and radicals [23]. The productionof these enzymes is associated with nutrient stress conditions.White rot basidiomycetes and brown rot ligninolytic fungi display
8 of Bio
atp[allvmMas
cmMtseoiito�
3
3
iFtabatWtpalcpgitds
rutasmrtTo
3
lno
4 A. Barapatre et al. / International Journal
broad diversity in response to carbon and nitrogen source andheir C/N ratio. In most of the ligninolytic fungi LiP, MnP and laccaseroduction is primarily regulated by the nitrogen concentration24,25]. Biodegradation of lignin starts with depolymerizingctivity of LiP and MnP followed by demethylation activity ofaccase. It is reported that the side chain and aromatic rings ofignin model compounds and synthetic lignin (DHPs) were cleavedia aryl cation radical and phenoxy radical intermediates which isediated by LiP/H2O2 and laccase/O2/mediator system. WhereasnP catalyze demethylation, C�-C� cleavage, alkyl-aryl cleavage
nd C� oxidation of phenolic syringyl type �-1 and �-O-4 lignintructures [26].
In present study biomodified lignin was obtained by biomodifi-ation of lignin using two ligninolytic fungi F10 and APF4. Duringicrobial transformation of lignin by F10 and APF4, the onset ofnP and LiP activity in HCLN medium starts from 3rd day and con-
inuously increase up to the 21st day, whereas in HNLC medium ittarts from 3rd in F10 and 12th day and APF4. The activity of bothnzymes is minimal in HNLC as compared to HCLN medium. On thether hand, the laccase activity was high in HCLN medium, whereasn HNLC medium it was very low (unpublished data). After biomod-fication recovered biomodified lignin samples were evaluated forheir TPC, functional group analysis, reducing power, hydrogen per-xide scavenging capacity, DPPH free-radical scavenging capacity,-amylase and in vitro glucose movement inhibition activity.
.1. Characterization of modified lignin
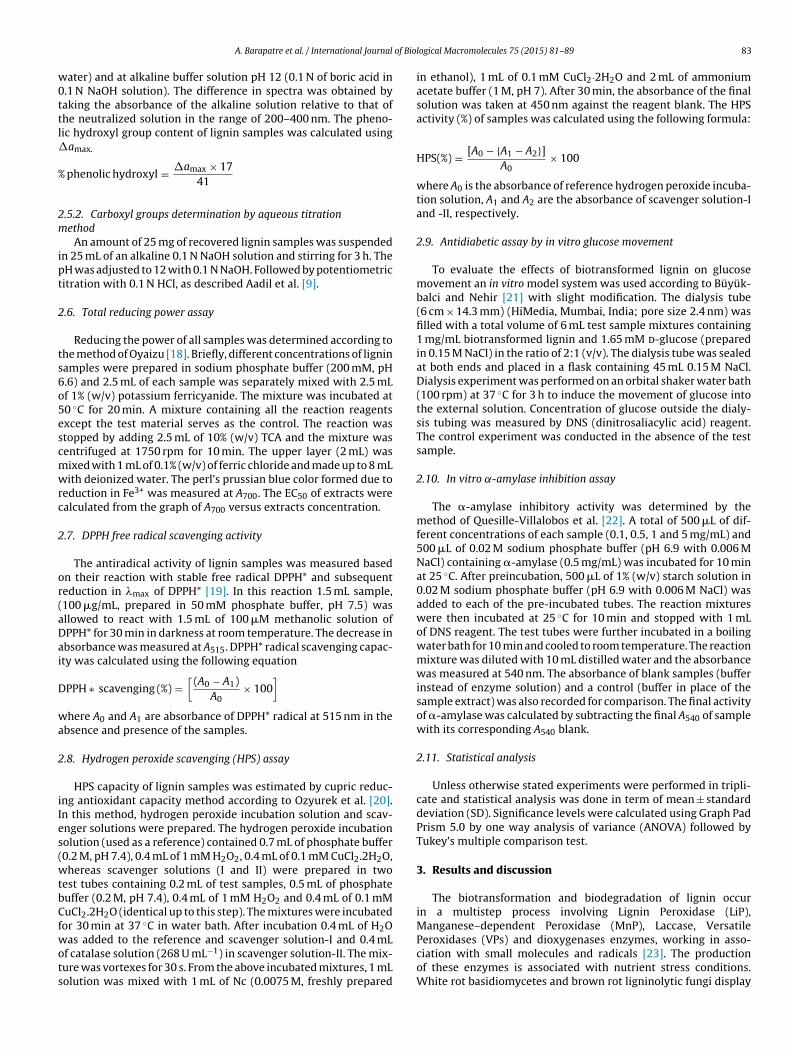
.1.1. FTIR of lignin samplesThe FTIR spectrum of the control and biomodified lining samples
s presented in Fig. 1a and b. All modified lignin samples (B, C, E and) showed a broad absorption band at 3410–3460 cm−1, attributedo the O–H groups stretching in phenolic and aliphatic structuresnd oscillation of the hydroxyl group. The relative intensity of thisand stretching was more in the treated sample (both HCLN F10nd HCLN APF4) as compared to control sample, which indicatedhe phenolic ring modification by addition of a hydroxyl group.
hereas in modified HNLC samples (HNLC F10 and HNLC APF4),he intensity of O–H groups stretching was almost same in com-arison to modified HCLN samples. A strong bands at 2847 cm−1
rising from C–H stretching in the aliphatic methylene group wasess intense in treated sample (B, C, E and F) as compared to theirontrol samples (A and D). Bands centered on 2938 and 2842 cm−1,redominantly arising from C–H stretching in aromatic methoxylroups and in methyl and methylene groups of side chains. Thentensity of both peaks is reduced in treated samples as comparedo control samples. The increase in the intensity of –OH group andecrease in C–H stretching also an outcome of laccase activity asuggested in the literature [27,28].
All samples displayed weak bands in the carbonyl/carboxylegion 1705–1720 cm−1, assigned for unconjugated ketone ornconjugated carbonyl stretching. The intensity of aromatic skele-on vibrations at 1600, 1515 and 1426 cm−1 characteristic of theromatic ring in alkali lignin showed significant decrease in treatedamples as compared to controls, indicating the cleavage of the aro-atic ring structure. The C–H deformation combined with aromatic
ing vibration at 1462 cm−1 was observed in the untreated con-rol samples, however, these peaks were absent in treated samples.hese results suggested that the structural and functional groupsf alkali lignin were altered by both the fungal strains [29].
.1.2. 13C NMR
A comparison of the 13C NMR spectra of an untreated controlignin samples with biodegraded lignin sample under two differentutritional conditions is presented in Fig. 2. In all three NMR spectraf lignin, there was an absence of signals between 90 and 102 ppm
logical Macromolecules 75 (2015) 81–89
which indicates that the samples were free of carbohydratecontamination. The signals for unconjugated carboxylic acids–COOH (178.0–167.5 ppm) were high in HNLC sample in compar-ison to control while low in HCLN sample. The relative increase inthis signal could be attributed to the formation of aldehydes, acidsand aroxiacetic structures probably because of the oxidation of theside-chains. These results suggest oxidative attack on the lignin bythe microbial enzymatic system of fungus [30].
The signal for the aliphatic (171–168.5 ppm) and phenolic(168.5–167 ppm) hydroxyl groups were observed in the ligninsamples treated with fungus (HCLN and HNLC) whereas they areabsent in control lignin. The three aromatic region signals for pro-tonated aromatic specially unsubstituted aromatic carbons ortho orpara to the substituted carbon (125–103 ppm), the condensed aro-matic mainly C-substituted aromatic carbon (141–125 ppm), andthe oxygenated aromatic mainly O-substituted aromatic carbon ofguaiacol (160–141 ppm) were higher in control lignin as comparedto treated lignin [31].
The region between 162 to 103 ppm belongs to aromatic carbon,a syringal units produce strong signal at 153–151 ppm (C-3 ester-ified) whereas the guaicyl unit signals at 119 ppm (C-6), 115 ppm(C-5) and 111 ppm (C-2) were also observed in control and treatedsamples. The changes in the aromatic-C region was observed,notably the decrease in the syringyl and guaiacyl amount (signalsat 153 ppm and 148 ppm respectively) after the fungal degradationof the alkali-lignin. The relative decrease in syringyl units reflectsan easier accessibility of the microorganisms to the less condensedsyringyl units of the polymer [30,31].
The signals at 90–57.5 ppm display aliphatic C–O bonds and�, �, � carbons on the lignin side chain. In which C�, C�, andC� in �-O-4 can be identified in the regions 79.0–67.0, 90.0–78.0,and 61.5–57.5 ppm, respectively [31]. A significant decrease wasobserved in C� in �-O-4 (61.8 ppm) both treated samples as com-pare to control, while the other two signals for C� and C� in�-O-4 increased in HNLC sample as compared to control. Somenew signal intensity (30.5, 28.98 and 26.08) were also observedin the 46–10 ppm spectral region, mainly in the case of HNLClignin sample, suggesting accumulation of saturated alkyl struc-tures (Aliphatic CH2, 35.9 ppm) in the biomodified lignin. One ofthe signal at 35.9 corresponding to C� in arylpropanol unit wasdecreased in HCLN sample in comparison to control while it wasunaffected in HNLC lignin sample [30].
3.2. Total phenolic content and functional group analysis
All treated samples exhibited significantly lower TPC as com-pared to their respective controls (Table 1). It was detected that inF10 and APF4 modified lignin samples, the quantity of TPC was lowunder HCLN than HNLC condition. In lignin degradation when ligninis exposed to peroxidases, it undergoes decomposition into lowermolecular weight fragments containing methoxyl groups. Laccasedemethylates these fragments and peroxidases further degradethem into smaller fragments. These smaller fragments reduce intotheir respective phenols by MnP, LiP and VPs which undergoes ringcleavage and form keto acids. The keto acids enter through kreb’scycle and are metabolized by the fungus [32]. Variations in TPC wereobserved possibly due to difference in the activity of ligninolyticenzymes under varying nutrient conditions. The results obtainedrevealed that the TPC of samples was influenced by lignin degra-dation under carbon and nitrogen surplus/stress conditions. UnderHCLN condition enzymatic activity was high due to which lignindepolymerized into smaller fragments and subsequently metabo-
lized by the fungus. Previous results also supported our contentionthat the ligninolytic enzymes activities of different fungi werelow/diminished in nitrogen rich medium as compare to nitrogendeficient medium [16,23].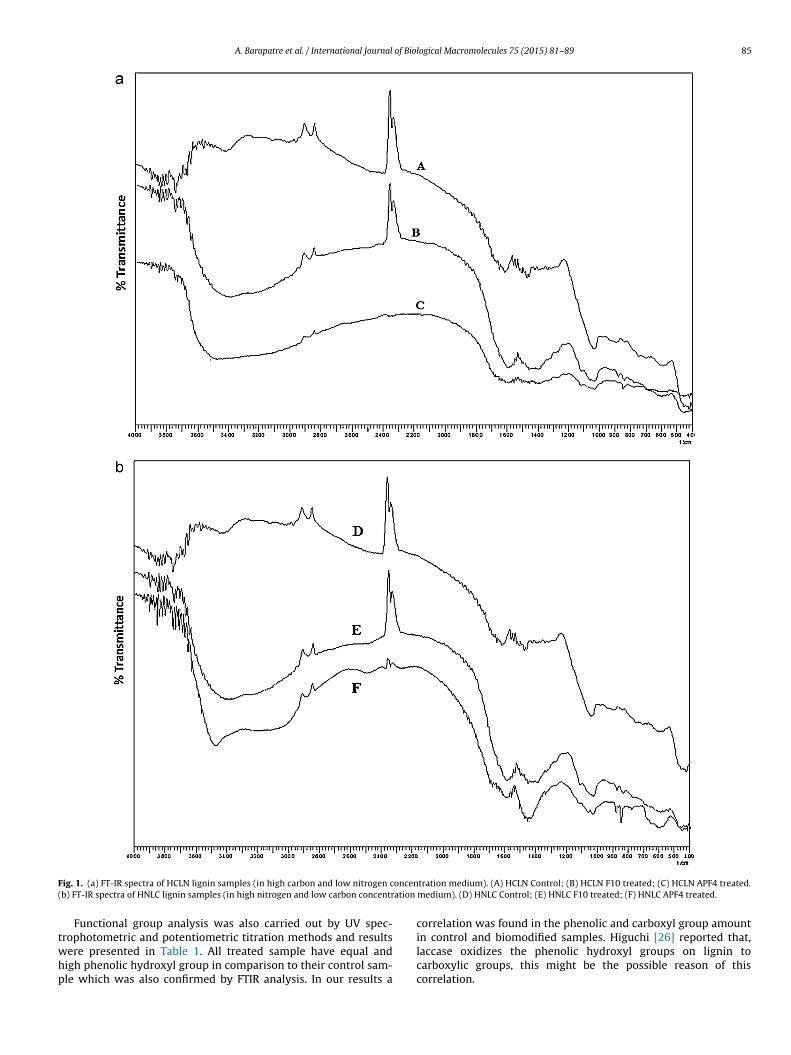
A. Barapatre et al. / International Journal of Biological Macromolecules 75 (2015) 81–89 85
F oncen( ation
twhp
ig. 1. (a) FT-IR spectra of HCLN lignin samples (in high carbon and low nitrogen cb) FT-IR spectra of HNLC lignin samples (in high nitrogen and low carbon concentr
Functional group analysis was also carried out by UV spec-
rophotometric and potentiometric titration methods and resultsere presented in Table 1. All treated sample have equal andigh phenolic hydroxyl group in comparison to their control sam-le which was also confirmed by FTIR analysis. In our results atration medium). (A) HCLN Control; (B) HCLN F10 treated; (C) HCLN APF4 treated.medium). (D) HNLC Control; (E) HNLC F10 treated; (F) HNLC APF4 treated.
correlation was found in the phenolic and carboxyl group amount
in control and biomodified samples. Higuchi [26] reported that,laccase oxidizes the phenolic hydroxyl groups on lignin tocarboxylic groups, this might be the possible reason of thiscorrelation.
86 A. Barapatre et al. / International Journal of Biological Macromolecules 75 (2015) 81–89
les. (A
3
it
Fig. 2. 13C CPMAS NMR spectra of the lignin samp
.3. Reducing power assay
A reducing agent contributes to antioxidant activity by donat-ng its electron to free radicals, which result in neutralization ofhe reactivity of the radical, and the reduced species subsequently
) Control lignin; (B) HCLN lignin; (C) HNLC lignin.
acquire a proton from the solution. It was previously reported
that the Acacia species contain a number of active phenol andpolyphenolic contents which were implied in the reducing reac-tions [9,10,33,34]. Reducing power of all samples was expressedin the form of EC50 value (Table 1), which ranged from 405.41 to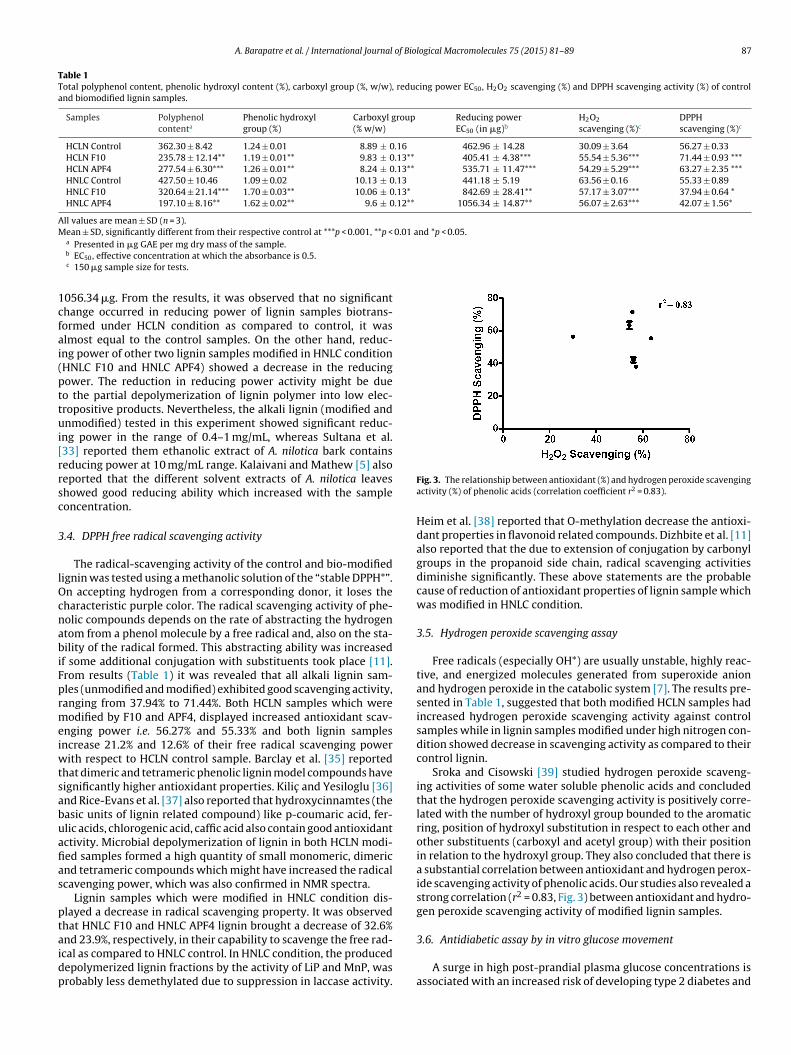
A. Barapatre et al. / International Journal of Biological Macromolecules 75 (2015) 81–89 87
Table 1Total polyphenol content, phenolic hydroxyl content (%), carboxyl group (%, w/w), reducing power EC50, H2O2 scavenging (%) and DPPH scavenging activity (%) of controland biomodified lignin samples.
Samples Polyphenolcontenta
Phenolic hydroxylgroup (%)
Carboxyl group(% w/w)
Reducing powerEC50 (in �g)b
H2O2
scavenging (%)cDPPHscavenging (%)c
HCLN Control 362.30 ± 8.42 1.24 ± 0.01 8.89 ± 0.16 462.96 ± 14.28 30.09 ± 3.64 56.27 ± 0.33HCLN F10 235.78 ± 12.14** 1.19 ± 0.01** 9.83 ± 0.13** 405.41 ± 4.38*** 55.54 ± 5.36*** 71.44 ± 0.93 ***HCLN APF4 277.54 ± 6.30*** 1.26 ± 0.01** 8.24 ± 0.13** 535.71 ± 11.47*** 54.29 ± 5.29*** 63.27 ± 2.35 ***HNLC Control 427.50 ± 10.46 1.09 ± 0.02 10.13 ± 0.13 441.18 ± 5.19 63.56 ± 0.16 55.33 ± 0.89HNLC F10 320.64 ± 21.14*** 1.70 ± 0.03** 10.06 ± 0.13* 842.69 ± 28.41** 57.17 ± 3.07*** 37.94 ± 0.64 *HNLC APF4 197.10 ± 8.16** 1.62 ± 0.02** 9.6 ± 0.12** 1056.34 ± 14.87** 56.07 ± 2.63*** 42.07 ± 1.56*
All values are mean ± SD (n = 3).Mean ± SD, significantly different from their respective control at ***p < 0.001, **p < 0.01 and *p < 0.05.
1cfai(pttui[rrsc
3
lOcnabiFprmeiwtsabuafias
ptaidp
a Presented in �g GAE per mg dry mass of the sample.b EC50, effective concentration at which the absorbance is 0.5.c 150 �g sample size for tests.
056.34 �g. From the results, it was observed that no significanthange occurred in reducing power of lignin samples biotrans-ormed under HCLN condition as compared to control, it waslmost equal to the control samples. On the other hand, reduc-ng power of other two lignin samples modified in HNLC conditionHNLC F10 and HNLC APF4) showed a decrease in the reducingower. The reduction in reducing power activity might be dueo the partial depolymerization of lignin polymer into low elec-ropositive products. Nevertheless, the alkali lignin (modified andnmodified) tested in this experiment showed significant reduc-
ng power in the range of 0.4–1 mg/mL, whereas Sultana et al.33] reported them ethanolic extract of A. nilotica bark containseducing power at 10 mg/mL range. Kalaivani and Mathew [5] alsoeported that the different solvent extracts of A. nilotica leaveshowed good reducing ability which increased with the sampleoncentration.
.4. DPPH free radical scavenging activity
The radical-scavenging activity of the control and bio-modifiedignin was tested using a methanolic solution of the “stable DPPH*”.n accepting hydrogen from a corresponding donor, it loses theharacteristic purple color. The radical scavenging activity of phe-olic compounds depends on the rate of abstracting the hydrogentom from a phenol molecule by a free radical and, also on the sta-ility of the radical formed. This abstracting ability was increased
f some additional conjugation with substituents took place [11].rom results (Table 1) it was revealed that all alkali lignin sam-les (unmodified and modified) exhibited good scavenging activity,anging from 37.94% to 71.44%. Both HCLN samples which wereodified by F10 and APF4, displayed increased antioxidant scav-
nging power i.e. 56.27% and 55.33% and both lignin samplesncrease 21.2% and 12.6% of their free radical scavenging power
ith respect to HCLN control sample. Barclay et al. [35] reportedhat dimeric and tetrameric phenolic lignin model compounds haveignificantly higher antioxidant properties. Kilic and Yesiloglu [36]nd Rice-Evans et al. [37] also reported that hydroxycinnamtes (theasic units of lignin related compound) like p-coumaric acid, fer-lic acids, chlorogenic acid, caffic acid also contain good antioxidantctivity. Microbial depolymerization of lignin in both HCLN modi-ed samples formed a high quantity of small monomeric, dimericnd tetrameric compounds which might have increased the radicalcavenging power, which was also confirmed in NMR spectra.
Lignin samples which were modified in HNLC condition dis-layed a decrease in radical scavenging property. It was observedhat HNLC F10 and HNLC APF4 lignin brought a decrease of 32.6%
nd 23.9%, respectively, in their capability to scavenge the free rad-cal as compared to HNLC control. In HNLC condition, the producedepolymerized lignin fractions by the activity of LiP and MnP, wasrobably less demethylated due to suppression in laccase activity.Fig. 3. The relationship between antioxidant (%) and hydrogen peroxide scavengingactivity (%) of phenolic acids (correlation coefficient r2 = 0.83).
Heim et al. [38] reported that O-methylation decrease the antioxi-dant properties in flavonoid related compounds. Dizhbite et al. [11]also reported that the due to extension of conjugation by carbonylgroups in the propanoid side chain, radical scavenging activitiesdiminishe significantly. These above statements are the probablecause of reduction of antioxidant properties of lignin sample whichwas modified in HNLC condition.
3.5. Hydrogen peroxide scavenging assay
Free radicals (especially OH*) are usually unstable, highly reac-tive, and energized molecules generated from superoxide anionand hydrogen peroxide in the catabolic system [7]. The results pre-sented in Table 1, suggested that both modified HCLN samples hadincreased hydrogen peroxide scavenging activity against controlsamples while in lignin samples modified under high nitrogen con-dition showed decrease in scavenging activity as compared to theircontrol lignin.
Sroka and Cisowski [39] studied hydrogen peroxide scaveng-ing activities of some water soluble phenolic acids and concludedthat the hydrogen peroxide scavenging activity is positively corre-lated with the number of hydroxyl group bounded to the aromaticring, position of hydroxyl substitution in respect to each other andother substituents (carboxyl and acetyl group) with their positionin relation to the hydroxyl group. They also concluded that there isa substantial correlation between antioxidant and hydrogen perox-ide scavenging activity of phenolic acids. Our studies also revealed astrong correlation (r2 = 0.83, Fig. 3) between antioxidant and hydro-gen peroxide scavenging activity of modified lignin samples.
3.6. Antidiabetic assay by in vitro glucose movement
A surge in high post-prandial plasma glucose concentrations isassociated with an increased risk of developing type 2 diabetes and

88 A. Barapatre et al. / International Journal of Bio
Table 2Concentration of d-glucose (in �g) outside the dialysis tube after 3 h in vitro glucosemovement test.
Samples Concentration ofd-glucose (in �g/mL)
Decrease ofmovement (%)a
Blank (in absence of sample) 72.77 ± 2.25 –HCLN Control 71.19 ± 8.47 NDHCLN F10 17.26 ± 9.10* 76.3%*
HCLN APF4 32.39 ± 15.39* 55.5%*
HNLC Control 67.43 ± 1.96 NDHNLC F10 23.21 ± 11.26* 68.1%*
HNLC APF4 32.22 ± 9.49* 55.7%*
All values are mean ± SD (n = 3).ND – not detectable.
* Significantly different, p < 0.001 compared to blank.
c
atdittteati
ttbBmdtH5ebs
otobliata
leads to diminished enzyme activity (upto 78.2%). The dimin-
T%
R
a Percentage decrease in the movement of glucose into the external solution inomparison to control.
ny reduction in the postprandial glucose rush is potentially advan-ageous in avoiding diabetes. Gallagher et al. [40] studied glucoseiffusion inhibition activity of 10 traditional antidiabetic plants by
n vitro diffusion method. They reported agrimony and avocado ashe most potent (>60% inhibition) inhibitor, whereas others inhibithe glucose diffusion in the range of 6–48%. They also reported thathe plant extracts exhibited a concentration dependent inhibitoryffect on glucose movement. While in another study Büyükbalcind Nehir [21] found that there was no significant effect of herbaleas and infusions (traditionally used in the treatment of diabetesn Turkey) on in vitro glucose diffusion.
In the present study, control and modified lignin samples wereested for inhibitory effects on glucose movementout of dialysisube. No significant inhibition in glucose movement was observedy both control lignin samples as compared to blank (Table 2).ut HCLN F10 and HNLC F10 lignin samples appeared to be theost potent inhibitor in glucose movement out of the dialysis tube,
ecreasing movement upto 76.3% and 68.1% (p < 0.001) respec-ively, in comparison to the blank. The other two lignin samples,CLN APF4 and HNLC APF4, inhibited glucose movement nearly5% (p < 0.001, as compared to blank). Our results provide amplevidence that functional groups modification might be the possi-le cause of increased glucose movement inhibiting properties ofamples.
To date, no systematic scientific studies on the inhibitory effectf lignin on in vitro glucose movement is available. We hypothesizehat the inhibition of glucose movement might occur by formationf lignin-glucose complex. This complex formation may be causedy hydrogen bond formation between the hydrophilic groups of
ignin and hydroxyl groups of glucose molecules. An increase in thentensity of hydrophilic functional group (like –OH) in phenolic and
liphatic structure (as observed in the FTIR spectrum) may increasehe chance to form hydrogen bonding between glucose moleculend modified lignin samples.able 3 inhibition activity of �-amylase enzyme by control and modified lignin samples at diffe
Samples % Inhibition
0.1 mg/mL 0.5 mg/m
HCLN Control 14.95 ± 2.49 58.24 ± 1HCLN F10 23.14 ± 1.92*** 54.58 ± 1HCLN APF4 14.89 ± 1.62* 57.37 ± 0HNLC Control 15.87 ± 1.44 56.77 ± 1HNLC F10 19.70 ± 1.99*** 56.53± 0.HNLC APF4 17.46 ± 0.20** 57.17 ± 2
esults were presented in mean ± SD (n = 3). Mean ± SD, significantly different from their
logical Macromolecules 75 (2015) 81–89
3.7. In vitro ˛-amylase inhibition assay
Alpha-amylase is responsible for the breakdown of complex car-bohydrate like starch to more simple sugars like glucose. Thus, theinhibition of this enzyme can delay the carbohydrate digestion andreduce the rate of glucose absorption [12]. Adisakwattana et al.[41] found that the lignin model compounds, including 11 cinnamicacid derivatives, caffeic acid, ferulic acid, and isoferulic acid did notexhibit any inhibitory action on �-amylase.
The �-amylase inhibitory activity (expressed in percent) ofthe unmodified and biomodified lignin was investigated at rangesconcentrations of 0.1, 0.5, 1 and 5 mg/mL (Table 3). All lignin sam-ples significantly inhibited �-amylase activity, but the modifiedlignin samples showed much higher inhibition than unmodi-fied ones. At the lower concentration, i.e. 0.1 and 0.5 mg/mL, alllignin samples showed a similar inhibition activity, but in higherconcentration, i.e. 5 mg/mL, all modified lignin samples showedhigher inhibition than their respective unmodified lignin samples.At 5 mg/mL concentration, HNLC F10 exhibited the highest inhi-bition (78.2 ± 0.97%) from all other samples followed by HNLCAPF4, HCLN APF4 and HCLN F10.The inhibition (%) of �-amylaseactivity was approximately four times higher in the presence of5 mg/mL than 0.1 mg/mL sample concentration. The inhibition of�-amylase activity was high in HNLC modified possibly be due tothe presence of high amount of methylated lignin fragments ascompared HCLN samples. Xiao et al. [42] have reported that themethylation of the hydroxyl group enhances the affinity of thepolyphenols for �-amylase. Based on the finding they have opinedthat the increase in the number of hydrogen atom donor/acceptorin the polyphenol might have decreased the affinity for towards�-amylase.
Our finding also suggests that the biomodification in ligninenhances its inhibitory effect on �-amylase. Some of the otherworkers reported that inactivation of this enzyme could be due toprecipitation by formation of inactive enzyme–inhibitor complexor enzyme–inhibitor–substrate complex [43]. The main drivingforces in the complex formation are hydrophobic interactionsand hydrogen bonding. In hydrophobic interaction, aromatic ringof phenolic compound and a hydrophobic part of proteins areinvolved, whereas hydrogen bonding occurs between hydroxylgroups of polyphenol and H-acceptor groups (NH, OH and COOH)of proteins [42,44]. Appearance of new aromatic ring conjugatedhydrophilic group in biomodified samples as observed in the FTIRanalysis supports our contention that chemically modified ligninis capable to hydrophobic and hydrogen bonding with enzymesthus inhibiting its activity. With the increase in concentration oftest samples, the chance of interaction is also increased, which
ished in enzyme activity are most likely by the formation ofenzymes–lignin–substrate or enzyme–lignin type complex forma-tion.
rent concentration.
L 1 mg/mL 5 mg/mL
.74 63.27 ± 1.57 62.69 ± 1.70
.63* 60.20 ± 1.22* 71.33 ± 1.52***
.92* 61.96 ± 3.08* 72.59 ± 2.12***
.38 61.50 ± 1.67 66.41 ± 3.7298* 60.52 ± 0.63* 78.20 ± 0.97***.61* 60.00 ± 1.57* 75.30 ± 1.75***
respective control at ***p < 0.001, **p < 0.01 and *p < 0.05.

of Bio
4
hebrstIihimiagos
R
[[
[[
[
[[
[[[[
[[[[
[[[
[[
[
[
[
[[
[[
[[[[
[
[42] J. Xiao, G. Kai, X. Ni, F. Yanga, X. Chen, Mol. BioSyst. 7 (2011) 1883–1890.
A. Barapatre et al. / International Journal
. Conclusion
Our result reveals that the alkali lignin, extracted from A. nilotica,as free radical scavenging activity which is a structure depend-nt property, and was significantly altered when subjected toimodification. The DPPH and H2O2 scavenging assay showedemarkable potential of biomodified lignin as antioxidant. In thistudy the degree of biomodification was influenced by the nutri-ional variations which were provided during biomodification.n addition, the modified alkali lignin also showed a significantn vitro �-amylase inhibitory activity indicating its potential anti-yperglycemic properties. Functional and structural modifications
n alkali lignin altered its binding efficiency towards glucoseolecule, which affected its movement across the membrane and
mproving glycemic control by limiting the postprandial glucosebsorptions. In conclusion the antioxidant, �-amylase and in vitrolucose movement inhibition properties of A. nilotica lignin mayffer a potential therapeutic source for the treatment of oxidativetress and diabetes.
eferences
[1] J.M. Landete, Crit. Rev. Food Sci. Nutr. 52 (2012) 936–948.[2] Z. Sroka, Z. Naturforsch. C 60 (2005) 833–843.[3] M.P. Vinardell, V. Ugartondo, M. Mitjans, Ind. Crop Prod. 27 (2008) 220–223.[4] B.N. Singh, B.R. Singh, R.L. Singh, D. Prakash, B.K. Sharma, H.B. Singh, Food Chem.
Toxicol. 47 (2009) 778–786.[5] T. Kalaivani, L. Mathew, Food Chem. Toxicol. 48 (2010) 298–305.[6] B. Uttara, A.V. Singh, P. Zamboni, R.T. Mahajan, Curr. Neuropharmacol. 7 (2009)
65–74.[7] J. Lee, N. Koo, D.B. Min, Compr. Rev. Food Sci. Food Saf. 3 (2004) 21–33.[8] A. Scalbert, C. Manach, C. Morand, C. Rémésy, L. Jiménez, Crit. Rev. Food Sci.
Nutr. 45 (2005) 287–306.[9] K.R. Aadil, A. Barapatre, S. Sahu, H. Jha, B.N. Tiwary, Int. J. Biol. Macromol. 67
(2014) 220–227.10] R. Singh, R. Singh, S. Kumar, S. Arora, Food Chem. Toxicol. 45 (2007) 1216–1223.
11] T. Dizhbite, G. Telysheva, V. Jurkjane, U. Viesturs, Bioresour. Technol. 95 (2004)309–317.12] M.A. Asgar, Int. J. Food Prop. 16 (2013) 91–103.13] G. Thakur, K. Pal, A. Mitra, S. Mukherjee, A. Basak, D. Rousseau, Food Rev. Int.
26 (2010) 364–385.
[
[
logical Macromolecules 75 (2015) 81–89 89
14] R. Tundis, M.R. Loizzo, F. Menichini, Mini-Rev. Med. Chem. 10 (2010)315–331.
15] S.N. Sun, M.F. Li, T.Q. Yuan, F. Xu, R.C. Sun, Ind. Crop Prod. 37 (2012) 51–60.16] T.K. Kirk, E. Schultz, W.J. Connors, L.F. Lorenz, J.G. Zeikus, Arch. Microbiol. 117
(1978) 277–285.17] V.F. Singleton, R. Orthofer, Meth. Enzymol. 299 (1999) 152–178.18] M. Oyaizu, Jpn. J. Nutr. 44 (1986) 307–315.19] K. Mishra, H. Ojha, N.K. Chaudhury, Food Chem. 130 (2012) 1036–1043.20] M. Ozyurek, B. Bektasoglu, K. Guclu, N. Gungor, R. Apak, J. Food Comp. Anal. 23
(2010) 689–698.21] A. Büyükbalci, E.S. Nehir, Plant Food Hum. Nutr. 63 (2008) 27–33.22] A.M. Quesille-Villalobos, J.S. Torrico, L.G. Ranilla, CyTA J. Food 11 (2013) 60–67.23] K.T. Kirk, R.L. Farrell, Annu. Rev. Microbiol. 41 (1987) 465–505.24] T.D.H. Bugg, M. Ahmad, E.M. Hardiman, R. Rahmanpour, Nat. Prod. Rep. 28
(2011) 1883–1896.25] V. Elisashvili, V. Kachlishvili, J. Biotechnol. 144 (2009) 37–42.26] T. Higuchi, Proc. Jpn. Acad. Ser. B (2004) 204–214.27] C.G. Boeriu, D. Bravol, R.J.A. Gosselink, J.E.A. Vandam, Ind. Crop Prod. 20 (2004)
205–218.28] C. Crestini, D.S. Argyropoulos, Bioorg. Med. Chem. 6 (1998) 2161–2169.29] Z. Xiong, X. Zhang, H. Wang, F. Ma, L. Li, W. Li, J. Biosci. Bioeng. 104 (2007)
446–450.30] M. Hernández, J. Rodriguez, M.I. Perez, A.S. Ball, M.E. Arias, Appl. Microbiol.
Biotechnol. 47 (1997) 272–278.31] A. Abdulkhani, A. Karimi, A. Mirshokraie, Y. Hamzeh, N. Marlin, G. Mortha, J.
Appl. Polym. Sci. 118 (2010) 469–479.32] A. Leonowicz, N.S. Cho, J. Luterek, A. Wilkolazka, M. Wojtas-Wasilewska, A.
Matuszewska, M. Hofrichter, D. Wesenberg, J. Rogalski, J. Basic Microbiol. 41(2001) 185–227.
33] B. Sultana, F. Anwar, R. Przybylski, Food Chem. 104 (2007) 1106–1114.34] Y.T. Tung, J.H. Wu, Y.H. Kuo, S.T. Chang, Bioresour. Technol. 98 (2007)
1120–1123.35] L.R.C. Barclay, F. Xi, J.Q. Norris, J. Wood Chem. Technol. 17 (1997) 73–90.36] I. Kilic , Y. Yesiloglu, Spectrochim. Acta Mol. Biomol. Spectrosc. 115 (2013)
719–724.37] C.A. Rice-Evans, N.J. Miller, G. Paganga, Trends Plant Sci. 2 (1997) 152–159.38] K.E. Heim, A.R. Tagliaferro, D.J. Bobilya, J. Nutr. Biochem. 13 (2002) 572–584.39] Z. Sroka, W. Cisowski, Food Chem. Toxicol. 41 (2003) 753–758.40] A.M. Gallagher, P.R. Flatt, G. Duffy, Y.H.A. Abdel-Wahab, Nutr. Res. 23 (2003)
413–424.41] S. Adisakwattana, P. Chantarasinlapin, H. Thammarat, S. Yibchok-Anun, J.
Enzyme Inhib. Med. Chem. 24 (2009) 1194–1200.
43] A. Zajácz, G. Gyémént, N. Vittorib, L.A. Kandraa, Carbohydr. Res. 342 (2007)717–723.
44] C.L. Bourvellec, C.M.G.C. Renard, Crit. Rev. Food Sci. Nutr. 52 (2012)213–248.
Copyright © 2022 FDOKUMEN